Attached files
| file | filename |
|---|---|
| EX-3.2 - EXHIBIT 3.2 - STRATUS PROPERTIES INC | q415exhibit32.htm |
| EX-21.1 - EXHIBIT 21.1 - STRATUS PROPERTIES INC | q415exhibit211.htm |
| EX-24.1 - EXHIBIT 24.1 - STRATUS PROPERTIES INC | q415exhibit241.htm |
| EX-10.9 - EXHIBIT 10.9 - STRATUS PROPERTIES INC | q415exhibit109.htm |
| EX-23.1 - EXHIBIT 23.1 - STRATUS PROPERTIES INC | q415exhibit231.htm |
| EX-10.10 - EXHIBIT 10.10 - STRATUS PROPERTIES INC | q415exhibit1010.htm |
| EX-10.11 - EXHIBIT 10.11 - STRATUS PROPERTIES INC | q415exhibit1011.htm |
| EX-31.2 - EXHIBIT 31.2 - STRATUS PROPERTIES INC | q415exhibit312.htm |
| EX-24.2 - EXHIBIT 24.2 - STRATUS PROPERTIES INC | q415exhibit242.htm |
| EX-32.2 - EXHIBIT 32.2 - STRATUS PROPERTIES INC | q415exhibit322.htm |
| EX-32.1 - EXHIBIT 32.1 - STRATUS PROPERTIES INC | q415exhibit321.htm |
| EX-31.1 - EXHIBIT 31.1 - STRATUS PROPERTIES INC | q415exhibit311.htm |
UNITED STATES | ||
SECURITIES AND EXCHANGE COMMISSION | ||
Washington, D.C. 20549 | ||
FORM 10-K | ||
(Mark One) | ||
[X] ANNUAL REPORT PURSUANT TO SECTION 13 OR 15(d) OF THE SECURITIES EXCHANGE ACT OF 1934 | ||
For the fiscal year ended December 31, 2015 | ||
OR | ||
[ ] TRANSITION REPORT PURSUANT TO SECTION 13 OR 15(d) OF THE SECURITIES EXCHANGE ACT OF 1934 | ||
For the transition period from | to | |
Commission File Number: 000-19989 | ||

Stratus Properties Inc.
(Exact name of registrant as specified in its charter)
Delaware | 72-1211572 |
(State or other jurisdiction of incorporation or organization) | (I.R.S. Employer Identification No.) |
212 Lavaca St., Suite 300 | |
Austin, Texas | 78701 |
(Address of principal executive offices) | (Zip Code) |
(512) 478-5788 | |
(Registrant's telephone number, including area code) | |
Securities registered pursuant to Section 12(b) of the Act:
Title of each class | Name of each exchange on which registered | |
Common Stock, par value $0.01 per share | The NASDAQ Stock Market | |
Preferred Stock Purchase Rights | The NASDAQ Stock Market | |
Securities registered pursuant to Section 12(g) of the Act: None
Indicate by check mark if the registrant is a well-known seasoned issuer, as defined in Rule 405 of the Securities Act. o Yes þ No
Indicate by check mark if the registrant is not required to file reports pursuant to Section 13 or Section 15(d) of the Act. o Yes þ No
Indicate by check mark whether the registrant (1) has filed all reports required to be filed by Section 13 or 15(d) of the Securities Exchange Act of 1934 during the preceding 12 months (or for such shorter period that the registrant was required to file such reports), and (2) has been subject to such filing requirements for the past 90 days. þ Yes o No
Indicate by check mark whether the registrant has submitted electronically and posted on its corporate Web site, if any, every Interactive Data File required to be submitted and posted pursuant to Rule 405 of Regulation S-T (§ 232.405 of this chapter) during the preceding 12 months (or for such shorter period that the registrant was required to submit and post such files). þ Yes o No
Indicate by check mark if disclosure of delinquent filers pursuant to Item 405 of Regulation S-K (§229.405 of this chapter) is not contained herein, and will not be contained, to the best of the registrant’s knowledge, in definitive proxy or information statements incorporated by reference in Part III of this Form 10-K or any amendment to this Form 10-K. o
Indicate by check mark whether the registrant is a large accelerated filer, an accelerated filer, a non-accelerated filer or a smaller reporting company. See the definitions of “large accelerated filer,” “accelerated filer” and “smaller reporting company” in Rule 12b-2 of the Exchange Act. o Large accelerated filer þ Accelerated filer o Non-accelerated filer o Smaller reporting company
Indicate by check mark whether the registrant is a shell company (as defined in Rule 12b-2 of the Act). o Yes þ No
The aggregate market value of common stock held by non-affiliates of the registrant was approximately $109.9 million on February 29, 2016, and approximately $68.6 million on June 30, 2015.
Common stock issued and outstanding was 8,067,356 shares on February 29, 2016, and 8,061,106 shares on June 30, 2015.
DOCUMENTS INCORPORATED BY REFERENCE
Portions of our proxy statement for our 2016 annual meeting of stockholders are incorporated by reference into Part III (Items 10, 11, 12, 13 and 14) of this report.
STRATUS PROPERTIES INC. | |
TABLE OF CONTENTS | |
Page | |
PART I
Items 1. and 2. Business and Properties
Except as otherwise described herein or the context otherwise requires, all references to “Stratus,” “we,” “us” and “our” in this Form 10-K refer to Stratus Properties Inc. and all entities owned or controlled by Stratus Properties Inc. All of our periodic reports filed with or furnished to the United States (U.S.) Securities and Exchange Commission (SEC) pursuant to Section 13(a) or 15(d) of the Securities Exchange Act of 1934, as amended, including our annual report on Form 10-K, quarterly reports on Form 10-Q, current reports on Form 8-K and any amendments to those reports are available, free of charge, through our website, www.stratusproperties.com, or by submitting a written request via mail to Stratus Investor Relations, 212 Lavaca St., Suite 300, Austin, Texas, 78701. These reports and amendments are available through our website or by request as soon as reasonably practicable after we electronically file or furnish such material with or to the SEC.
All references to “Notes” herein refer to the Notes to Consolidated Financial Statements located in Part II, Item 8. of this Form 10-K.
Overview
We are a diversified real estate company engaged primarily in the acquisition, entitlement, development, management, operation and sale of commercial, hotel, entertainment, and multi- and single-family residential real estate properties, primarily located in the Austin, Texas area, but including projects in certain other select markets in Texas.
We generate revenues from sales of developed properties, from our hotel and entertainment operations and from rental income from our commercial properties. Developed property sales can include an individual tract of land that has been developed and permitted for residential use, a developed lot with a home already built on it or condominium units at the W Austin Hotel & Residences. We may sell properties under development, undeveloped properties or commercial properties, if opportunities arise that we believe will maximize overall asset values as part of our business plan. See Note 11 for further discussion of our operating segments.
Our principal executive offices are located in Austin, Texas, and our company was incorporated under the laws of the state of Delaware on March 11, 1992. Stratus Properties Inc. was formed to hold, operate and develop the domestic real estate and oil and gas properties of our former parent company. We sold all of our oil and gas properties during the 1990s and have since focused solely on our real estate properties. Our overall strategy has been to enhance the value of our properties by securing and maintaining development entitlements and developing and building real estate projects on these properties for sale or investment. We have also pursued opportunities for new projects that offer the possibility of acceptable returns and risks. See "Business Strategy and Related Risks" in Part II, Items 7. and 7A. for further discussion.
Operations
A description of our operating segments follows.
Hotel. The W Austin Hotel includes 251 luxury rooms and suites, a full service spa, gym, rooftop pool and 9,750 square feet of meeting space. We have an agreement with Starwood Hotels & Resorts Worldwide, Inc. (Starwood) for the management of hotel operations at our W Austin Hotel & Residences. Revenue per available room for the W Austin Hotel, which is calculated by dividing total room revenue by the average total rooms available during the year, was $279 for 2015, $291 for 2014, and $260 for 2013.
Revenue from our hotel segment accounted for 51 percent of our total revenue for 2015, 45 percent for 2014 and 31 percent for 2013.
Entertainment. The entertainment space at the W Austin Hotel & Residences is occupied by Austin City Limits Live at the Moody Theater (ACL Live) and includes a live music and entertainment venue and production studio with a maximum capacity of approximately 3,000 people. In addition to hosting concerts and private events, ACL Live is the home of Austin City Limits, a television program showcasing popular music legends. ACL Live hosted 210 events in 2015 with an estimated attendance of 245,000, 207 events in 2014 with an estimated attendance of
1
231,200 and 186 events in 2013 with an estimated attendance of 217,100. As of February 29, 2016, ACL Live has events booked through May 2017.
Our entertainment business also includes events hosted at other venues through our joint ventures (see "Properties - Unconsolidated Affiliates" below and Note 6).
Revenue from our entertainment segment accounted for 24 percent of our total revenue for 2015, 20 percent for 2014 and 12 percent for 2013.
Real Estate Operations. The number of developed lots/units, acreage under development and undeveloped acreage as of December 31, 2015, that comprise our real estate operations are presented in the following table.
A developed lot or unit is an individual tract of land or residential unit that has been developed and permitted for residential use. Acreage under development includes real estate for which infrastructure work over the entire property has been completed, is currently being completed or is able to be completed and for which necessary permits have been obtained. The undeveloped acreage shown in the table below is presented according to anticipated uses for multi- and single-family lots and commercial development based upon our understanding of the properties’ existing entitlements. However, because of the nature and cost of the approval and development process and uncertainty regarding market demand for a particular use, there is no assurance that the undeveloped acreage will ever be developed. Undeveloped acreage includes real estate that can be sold “as is” (i.e., no infrastructure or development work has begun on such property).
Acreage | ||||||||||||||||||||||||||
Under Development | Undeveloped | |||||||||||||||||||||||||
Developed Lots/Units | Multi- family | Commercial | Total | Single Family | Multi- family | Commercial | Total | Total Acreage | ||||||||||||||||||
Austin: | ||||||||||||||||||||||||||
Barton Creek | 68 | 18 | — | 18 | 512 | 308 | 398 | 1,218 | 1,236 | |||||||||||||||||
Circle C | 31 | — | — | — | — | 36 | 216 | 252 | 252 | |||||||||||||||||
Lantana | — | — | — | — | — | — | 56 | 56 | 56 | |||||||||||||||||
W Austin Residences | 2 | — | — | — | — | — | — | — | — | |||||||||||||||||
The Oaks at Lakeway | — | — | 87 | 87 | — | — | — | — | 87 | |||||||||||||||||
Magnolia | — | — | — | — | — | — | 124 | 124 | 124 | |||||||||||||||||
West Killeen Market | — | — | — | — | — | — | 9 | 9 | 9 | |||||||||||||||||
San Antonio: | ||||||||||||||||||||||||||
Camino Real | — | — | — | — | — | — | 2 | 2 | 2 | |||||||||||||||||
Total | 101 | 18 | 87 | 105 | 512 | 344 | 805 | 1,661 | 1,766 | |||||||||||||||||
Revenue from our real estate operations segment accounted for 18 percent of our total revenue for 2015, 28 percent for 2014 and 53 percent for 2013.
The following table summarizes the estimated development potential, including 236 multi-family lots and 52,349 square feet of commercial space currently under development, of our acreage as of December 31, 2015:
Single Family | Multi-family | Commercial | ||||||
(lots) | (units) | (gross square feet) | ||||||
Barton Creek | 156 | 2,050 | 1,604,081 | |||||
Lantana | — | — | 485,000 | |||||
Circle C | — | 296 | 692,857 | |||||
Magnolia | — | — | 351,000 | |||||
West Kileen Market | — | — | 44,000 | |||||
Flores Street | — | 6 | — | |||||
Total | 156 | 2,352 | 3,176,938 | |||||
Commercial Leasing. Our principal commercial leasing holdings at December 31, 2015, consisted of (1) 38,316 square feet of office space, including 9,000 square feet occupied by our corporate office, and 18,327 square feet of retail space at the W Austin Hotel & Residences and (2) a 22,366-square-foot retail complex and a 3,085-square-foot bank building representing the first phase of Barton Creek Village and (3) 231,436 square feet of planned commercial space for The Oaks at Lakeway, a HEB Grocery Company, L.P. (HEB) anchored retail project, of which
2
179,087 square feet was open at December 31, 2015. During 2015, we completed the sales of Parkside Village, a retail project consisting of 90,184 square feet, and 5700 Slaughter, a retail project consisting of two retail buildings totaling 21,248 square feet in the aggregate and a 4,450 square-foot bank building on an existing ground lease, both located in the Circle C community. See Note 12 for further discussion.
Revenue from our commercial leasing segment accounted for 7 percent of our total revenue for 2015 and 2014 and 4 percent for 2013.
For further information about our operating segments see “Results of Operations” in Part II, Items 7. and 7A. See Note 11 for a summary of our revenues, operating income and total assets by operating segment.
Properties
Our Austin-area properties include the following:
The W Austin Hotel & Residences
In December 2006, we acquired a two-acre city block in downtown Austin for $15.1 million to develop a multi-use project. In 2008, we entered into a joint venture with Canyon-Johnson Urban Fund II, L.P. (Canyon-Johnson) for the development of the W Austin Hotel & Residences. On September 28, 2015, we completed the purchase of Canyon-Johnson's approximate 58 percent interest in the joint venture that owned the W Austin Hotel & Residences. See Note 2 for further discussion.
The W Austin Hotel & Residences contains a 251-room luxury hotel, 159 residential condominium units, 38,316 square feet of leasable office space, including 9,000 square feet occupied by our corporate office, 18,327 square feet of retail space and entertainment space occupied by Austin City Limits Live at the Moody Theater (ACL Live) which includes a live music and entertainment venue and production studio. In December 2010, the hotel at the W Austin Hotel & Residences opened, and in January 2011, we began closing on sales of condominium units. We sold 32 condominium units during 2013 and 7 condominium units during 2014. There were no sales during 2015 and as of December 31, 2015, only two condominium units remained unsold. The two unsold units are being marketed.
Barton Creek
Calera. Calera is a residential subdivision with plat approval for 155 lots. The initial 16-acre phase of the Calera subdivision included 16 courtyard homes at Calera Court, the last of which were sold in 2012.
The second phase of Calera, Calera Drive, consisted of 53 single-family lots, many of which adjoin the Fazio Canyons Golf Course. During 2013, we sold the remaining six Calera Drive lots.
Construction of the final phase of Calera, known as Verano Drive, was completed in July 2008 and included 71 single-family lots. During 2014, we sold the remaining nine Verano Drive lots.
Mirador Estate. The Mirador subdivision consisted of 34 estate lots, with each lot averaging approximately 3.5 acres in size. During 2013, we sold the final Mirador lot.
Amarra Drive. Amarra Drive Phase I, which was the initial phase of the Amarra Drive subdivision, was completed in 2007 and included six lots with sizes ranging from approximately one to four acres. During 2013, we sold the remaining two Phase I lots.
In 2008, we developed Amarra Drive Phase II, which consisted of 35 lots on 51 acres. During 2014, we sold 16 Phase II lots. We did not sell any Phase II lots in 2015, and as of December 31, 2015, 14 Phase II lots remain unsold. During early 2016, we sold one Phase II lot.
In first-quarter 2015, we completed the development of Amarra Drive Phase III, which consists of 64 lots on 166 acres. During 2015, we sold ten Phase III lots and as of December 31, 2015, 54 Phase III lots remained unsold. As of February 29, 2016, one Phase III lot was under contract.
The Amarra Villas, the last phase of the Amarra Drive subdivision, is a 20-unit townhome development. We completed site work in late 2015 and construction began in early 2016.
3
The Santal (formerly Tecoma). The Santal multi-family project is a garden-style apartment complex consisting of 236 units. Construction commenced in January 2015 and pre-leasing began in November 2015. The first units were completed in January 2016, and the project is expected to be completed in June 2016.
Barton Creek Village. The first phase of Barton Creek Village consists of a 22,366-square-foot retail complex and a 3,085-square-foot bank building. As of December 31, 2015, occupancy was 100 percent for the retail complex and the bank building was leased through January 2023.
Circle C Community
Effective August 2002, the City of Austin (the City) granted final approval of a development agreement (the Circle C settlement), which firmly established all essential municipal development regulations applicable to our Circle C properties until 2032. The City also provided us $15.0 million of cash incentives in connection with the future development of our Circle C and other Austin-area properties. These incentives, which are in the form of credit bank capacity, can be used for City fees and for reimbursement of certain infrastructure costs. Annually, we may elect to sell up to $1.5 million of the incentives to other developers for their use in paying City fees related to their projects as long as the projects are within the desired development zone, as defined within the Circle C settlement. As of December 31, 2015, we have permanently used $11.7 million of the $15.0 million of cash incentives provided by the City, including cumulative sales of $5.1 million to other developers. We also have $1.4 million in credit bank capacity in use as temporary fiscal deposits. At December 31, 2015, available credit bank capacity was $1.9 million.
We are developing the Circle C community based on the entitlements secured in our Circle C settlement with the City. Our Circle C settlement, as amended in 2004, permits development of 1.16 million square feet of commercial space, 504 multi-family units and 830 single-family residential lots. Meridian is an 800-lot residential development at the Circle C community. Development of the final phase of Meridian, which consisted of 57 one-acre lots, was completed in first-quarter 2014. We sold 7 Meridian lots during 2014, 19 Meridian lots during 2015, and as of December 31, 2015, 31 Meridian lots remained unsold. As of February 29, 2016, ten Meridian lots were under contract.
On July 2, 2015, we completed the sales of our Austin-area Parkside Village and 5700 Slaughter commercial properties, both located in the Circle C community. The Parkside Village retail project, which we owned in a joint venture with LCHM Holdings, LLC, consisted of 90,184 leasable square feet and was sold for $32.5 million. The project included a 33,650-square-foot full-service movie theater and restaurant, a 13,890-square-foot medical clinic and five other retail buildings, including a 14,926-square-foot building, a 10,175-square-foot building, a 8,043-square-foot building, a 4,500-square-foot building and a stand-alone 5,000-square-foot building. The 5700 Slaughter retail project, which we wholly owned, consisted of 25,698 leasable square feet and was sold for $12.5 million. See Note 12 for further discussion.
During 2013, we sold entitlements for 20,000 square feet of office space in Circle C for $1.2 million. As of December 31, 2015, our Circle C community had remaining entitlements for 692,857 square feet of commercial space and 296 multi-family units.
Lantana
Lantana is a partially developed, mixed-use real-estate development project. During 2013, we sold a 16-acre tract with entitlements for approximately 70,000 square feet of office space for $2.1 million. As of December 31, 2015, we had remaining entitlements for approximately 485,000 square feet of office and retail use on 56 acres. Regional utility and road infrastructure is in place with capacity to serve Lantana at full build-out as permitted under our existing entitlements.
The Oaks at Lakeway
In 2013, we acquired 87 acres in the greater Austin area to develop The Oaks at Lakeway project, a HEB anchored retail project planned for 231,436 square feet of commercial space. As of December 31, 2015, leases for 78 percent of the space, including the HEB store lease, have been executed and leasing for the remaining space is under way. The HEB store opened in October 2015, and leases for 45,492 square feet of additional space commenced in November 2015. Construction of the remainder of the project is ongoing.
4
Our other Texas properties and development projects include:
Magnolia
In 2014, we acquired 124 acres in the greater Houston area to develop the Magnolia project, a HEB-anchored retail project planned for 351,000 square feet of commercial space. Planning and infrastructure work by the city of Magnolia and road expansion by the Texas Department of Transportation are in progress and construction is expected to be completed in 2017.
West Killeen Market
In 2015, we acquired approximately 21 acres in Killeen, Texas, to develop the West Killeen Market project, a HEB-anchored retail project planned for 44,000 square feet of commercial space and three pad sites adjacent to a 90,000 square-foot HEB grocery store. Construction is expected to begin in third-quarter 2016, and the HEB store is expected to open in March 2017.
Unconsolidated Affiliates
Crestview Station. In 2005, we formed a joint venture with Trammell Crow Central Texas Development, Inc. to acquire an approximate 74-acre tract at the intersection of Airport Boulevard and Lamar Boulevard in Austin, Texas, for $7.7 million. The property, known as Crestview Station (the Crestview Station Joint Venture) is a single-family, multi-family, retail and office development, located on the site of a commuter rail line. As of December 31, 2015, the Crestview Station Joint Venture has sold all of its properties except for one commercial site. We account for our 50 percent interest in the Crestview Station Joint Venture under the equity method.
Stump Fluff. In April 2013, we formed a joint venture, Stump Fluff LLC (Stump Fluff), with Transmission Entertainment, LLC (Transmission) to own, operate, manage and sell live music and entertainment promotion, booking, production, merchandising, venue services and other related products and services. As of December 31, 2015, Stratus' capital contributions to Stump Fluff totaled $1.5 million. Stratus will contribute additional capital to Stump Fluff as necessary to fund its working capital needs. Stratus and Transmission each have a 50 percent voting interest in Stump Fluff. After Stratus is repaid its original capital contributions and a preferred return (10 percent annually) on those contributions, Stratus will receive 33 percent of any distributions from Stump Fluff. We account for our investment in Stump Fluff under the equity method.
Guapo Enterprises. In May 2013, Stratus and Austin Pachanga Partners, LLC (Pachanga Partners) formed a joint venture, Guapo Enterprises LLC (Guapo) to own, operate, manage and sell the products and services of the Pachanga music festival business. As of December 31, 2015, Stratus' capital contributions to Guapo totaled $0.3 million. Stratus will contribute additional capital to Guapo as necessary to fund its working capital needs. Stratus and Pachanga Partners each have a 50 percent voting interest in Guapo. After Stratus is repaid its original capital contributions and a preferred return (10 percent annually) on those contributions, Stratus will receive 33 percent of any distributions from Guapo. We account for our investment in Guapo under the equity method.
See Note 6 for further discussion of our unconsolidated affiliates.
Competition
We operate in highly competitive industries, namely the real estate development, hotel, entertainment and commercial leasing industries. In the real estate development industry, we compete with numerous public and private developers of varying sizes, ranging from local to national in scope. As a result, we may be competing for investment opportunities, financing and potential buyers with developers that may possess greater financial, marketing or other resources than we have. Our prospective customers generally have a variety of choices of new and existing homes and homesites when considering a purchase. We attempt to differentiate our properties primarily on the basis of community design, quality, uniqueness, amenities, location and developer reputation.
In the hotel industry, competition is generally based on quality and consistency of rooms, restaurant and meeting facilities and services, attractiveness of location, price and other factors. Management believes that we compete favorably in these areas. Our W Austin Hotel competes with other hotels and resorts in our geographic market, including facilities owned locally and facilities owned by national and international chains.
5
In the entertainment industry, we compete with other venues in Austin, Texas, and venues in other markets for artists likely to perform in the Austin, Texas region. Consequently, touring artists have several alternatives to our venue in scheduling tours. Some of our competitors in venue management have a greater number of venues in certain markets and may have greater financial resources in those markets. We differentiate our entertainment businesses by providing a quality live music experience and promoting our entertainment space through KLRU's broadcast of Austin City Limits.
The commercial leasing industry is highly fragmented among individuals, partnerships and public and private entities, with no dominant single entity or person. Although we may compete against large sophisticated owners and operators, owners and operators of any size can provide effective competition for prospective tenants. We compete for tenants primarily on the basis of property location, rent charged, and the design and condition of improvements.
See Part I, Item 1A. "Risk Factors" for further discussion.
Discontinued Operations
In 2012, we sold 7500 Rialto, an office building in Lantana. In connection with the sale, we recognized a gain of $5.1 million and deferred a gain of $5.0 million because of a guaranty provided to the lender in connection with the buyer's assumption of the loan related to 7500 Rialto. The guaranty was released in January 2015, and we recognized the deferred gain totaling $5.0 million ($3.2 million to net income attributable to common stock) in first-quarter 2015.
Credit Facility and Other Financing Arrangements
Obtaining and maintaining adequate financing is a critical component of our business. For information about our credit facility and other financing arrangements, see “Capital Resources and Liquidity - Credit Facility and Other Financing Arrangements” in Part II, Items 7. and 7A. and Note 7.
Regulation and Environmental Matters
Our real estate investments are subject to extensive local, city, county and state rules and regulations regarding permitting, zoning, subdivision, utilities and water quality as well as federal rules and regulations regarding air and water quality and protection of endangered species and their habitats. Such regulation has delayed and may continue to delay development of our properties and may result in higher development and administrative costs. See Part I, Item 1A. "Risk Factors" for further discussion.
We have made, and will continue to make, expenditures for the protection of the environment with respect to our real estate development activities. Emphasis on environmental matters will result in additional costs in the future. Based on an analysis of our operations in relation to current and presently anticipated environmental requirements, we currently do not anticipate that these costs will have a material adverse effect on our future operations or financial condition.
Employees
At December 31, 2015, we had a total of 114 employees, 39 of which were full-time employees, located at our Austin, Texas headquarters. We believe we have a good relationship with our employees, none of whom are represented by a union. Since January 1, 1996, certain services necessary for our business and operations, including certain administrative, financial reporting and other services, have been performed by FM Services Company (FM Services) pursuant to a services agreement. FM Services is a wholly owned subsidiary of Freeport-McMoRan Inc. Either party may terminate the services agreement at any time upon 60 days notice or earlier upon mutual written agreement.
6
Item 1A. Risk Factors
This report contains "forward-looking statements" within the meaning of U.S. federal securities laws. Forward-looking statements are all statements other than statements of historical facts, such as statements regarding the implementation and potential results of our five-year plan, projections or expectations related to operational and financial performance or liquidity, reimbursements for infrastructure costs, financing and regulatory matters, development plans and sales of properties, commercial leasing activities, timeframes for development, construction and completion of our projects, capital expenditures, liquidity and capital resources and other plans and objectives of management for future operations and activities. We undertake no obligation to update any forward-looking statements. We caution readers that forward-looking statements are not guarantees of future performance and our actual results may differ materially from those anticipated, projected or assumed in the forward-looking statements. Important factors that can cause our actual results to differ materially from those anticipated in the forward-looking statements include the following:
Risks Relating to our Business and Industries
We need significant amounts of cash to service our debt. If we are unable to generate sufficient cash to service our debt, our liquidity, financial condition and results of operations could be negatively affected.
Our business strategy requires us to rely on cash flow from operations and our debt agreements as our primary sources of funding for our liquidity needs. As of December 31, 2015, our outstanding debt totaled $263.1 million and our cash and cash equivalents totaled $17.0 million. Our level of indebtedness could have significant consequences. For example, it could:
• | Increase our vulnerability to adverse changes in economic and industry conditions; |
• | Require us to dedicate a substantial portion of our cash flow from operations and proceeds from asset sales to pay or provide for our indebtedness, thus reducing the availability of cash flows to fund working capital, capital expenditures, acquisitions, investments and other general corporate purposes; |
• | Limit our flexibility to plan for, or react to, changes in our business and the market in which we operate; |
• | Place us at a competitive disadvantage to our competitors that have less debt; and |
• | Limit our ability to borrow money to fund our working capital, capital expenditures, debt service requirements and other financing needs. |
As of December 31, 2015, we had approximately $28.8 million of debt scheduled to become due during 2016. In January 2016, we refinanced the debt secured by the W Austin Hotel & Residences, which reduced our 2016 debt maturities to $13.7 million. Refer to Note 13 for further discussion. Historically, much of our debt has been renewed or refinanced in the ordinary course of business. Current economic conditions in our areas of operations could deteriorate, which may impact our ability to refinance our debt and obtain renewals or replacement of credit enhancement devices on favorable terms or at all. As a result, in the future we may not be able to obtain sufficient external sources of liquidity on attractive terms, if at all, or otherwise renew, extend or refinance a significant portion of our outstanding debt scheduled to become due in the near future. In addition, there can be no assurance that we will maintain cash reserves and generate sufficient cash flow from operations in an amount sufficient to enable us to service our debt or to fund our other liquidity needs. Any of these occurrences may have a material adverse effect on our liquidity, financial condition and results of operations. For example, our inability to extend, repay or refinance our debt when it becomes due, including upon a default or acceleration event, could force us to sell properties on unfavorable terms or ultimately result in foreclosure on properties pledged as collateral, which could result in a loss of our investment and harm our reputation.
The terms of the agreements governing our indebtedness include restrictive covenants and require that certain financial ratios be maintained. For example, the minimum stockholders' equity covenant contained in several of our debt agreements requires us to maintain total stockholders’ equity of no less than $110.0 million. At December 31, 2015, our total stockholders’ equity was $136.6 million and, as a result, we were in compliance with this covenant. Failure to comply with any of these covenants could result in a default that may, if not cured, accelerate the payment under our debt obligations which would likely have a material adverse effect on our liquidity, financial condition and results of operations. Our ability to comply with our covenants will depend upon our future economic
7
performance. These covenants may adversely affect our ability to finance our future operations or capital needs or to engage in other business activities that may be desirable or advantageous to us.
In order to maintain compliance with the covenants in our debt agreements and carry out our business plan, we may need to raise additional capital through equity transactions or obtain waivers or modifications of covenants from our lenders. Such additional funding may not be available on acceptable terms, if at all, when needed. We also may need to incur additional indebtedness in the future in the ordinary course of business to fund our development projects and our operations. There can be no assurance that such additional financing would be available when needed or, if available, offered on acceptable terms. If new debt is added to current debt levels, the risks described above could intensify.
We are periodically rated by nationally recognized credit rating agencies. Any downgrades in our credit rating could impact our ability to borrow by increasing borrowing costs as well as limiting our access to capital. In addition, a downgrade could require us to post cash collateral and/or letters of credit, which would adversely affect our cash flow and liquidity.
Additionally, a significant amount of our outstanding debt bears interest at variable rates. See “Disclosures About Market Risks” in Part II, Items 7. and 7A. for more information.
We are vulnerable to concentration risks because our operations are almost exclusive to the Austin, Texas market.
Our real estate operations are primarily, and our hotel and entertainment venue operations are entirely, located in Austin, Texas. Because of our geographic concentration and limited number of projects, our operations are more vulnerable to local economic downturns and adverse project-specific risks than those of larger, more diversified companies. The performance of the Austin economy greatly affects our sales and consequently the underlying values of our properties. Our geographic concentration may create increased vulnerability during regional economic downturns, which can significantly affect our financial condition and results of operations. See "Overview - Real Estate Market Conditions" in Part II, Items 7. and 7A. for more information.
The success of our business is significantly related to general economic conditions and, accordingly, our business could be harmed by any slowdown or deterioration in the economy.
Periods of economic weakness or recession; significantly rising interest rates; declining employment levels; declining demand for real estate; declining real estate values; conditions which negatively shape public perception of travel, including travel-related accidents, the financial condition of the airline, automotive and other transportation-related industries; or the public perception that any of these events or conditions may occur or be present, may negatively affect our business. These economic conditions can result in a general decline in acquisition, disposition and leasing activity, demand for hotel rooms and related lodging services, a general decline in the value of real estate and in rents, which in turn reduces revenue derived from property sales and leases and hotel operations as well as revenues associated with development activities. These conditions also can lead to a decline in property sales prices as well as a decline in funds invested in existing commercial real estate and related assets and properties planned for development. In addition, during periods of economic slowdown and recession, many consumers have historically reduced their discretionary spending, and our entertainment businesses depend on discretionary consumer and corporate spending. A reduction in consumer spending historically is accompanied by a decrease in attendance at live entertainment, sporting and leisure events, which may result in reductions in ticket sales, sponsorship opportunities and our ability to generate revenue with our entertainment businesses.
During an economic downturn, investment capital is usually constrained and it may take longer for us to dispose of real estate investments. As a result, the value of our real estate investments may be reduced and we could realize losses or diminished profitability. If economic and market conditions decline, our business performance and profitability could deteriorate. If this were to occur, we could fail to comply with certain financial covenants in our debt agreements, which would force us to seek amendments with our lenders. No assurance can be given that we would be able to obtain any necessary waivers or amendments on satisfactory terms, if at all.
8
Our business and the market price of our common stock could be negatively affected as a result of the actions of activist shareholders.
Carl E. Berg has delivered notice to us that he plans to nominate two director candidates for election to our board of directors at our 2016 annual meeting of stockholders. In addition, Mr. Berg has submitted a stockholder proposal to be included in our proxy statement requesting that our board of directors immediately engage a nationally-recognized investment banking firm to explore a prompt sale, merger or other business combination. Our business, operating results or financial condition could be harmed by this potential proxy contest because, among other things:
• | Responding to the proxy contest is costly and time-consuming, is a significant distraction for our board of directors, management and employees, and diverts the attention of our board of directors and senior management from the pursuit of our business strategy, which could adversely affect our results of operations and financial condition; |
• | Perceived uncertainties as to our future direction, our ability to execute on our strategy, or changes to the composition of our board of directors or senior management team, including our chief executive officer, may lead to the perception of a change in the direction of our business, instability or lack of continuity which may be exploited by our competitors, and may result in the loss of potential business opportunities and make it more difficult to attract and retain qualified personnel and business partners; |
• | The expenses for legal and advisory fees and administrative and associated costs incurred in connection with responding to proxy contests and any related litigation may be substantial; and |
• | We may choose to initiate, or may become subject to, litigation as a result of the proxy contest or matters arising from the proxy contest, which would serve as a further distraction to our board of directors, management and employees and would require us to incur significant additional costs. |
In addition, the market price of our common stock could be subject to significant fluctuation or otherwise be adversely affected by the uncertainties described above or the outcome of the proxy contest.
Changes in weather conditions or natural disasters could adversely affect our business, financial condition and results of operations.
Our performance may be adversely affected by weather conditions. For our real estate operations, adverse weather may delay development or damage property, resulting in substantial repair or replacement costs to the extent not covered by insurance, a reduction in property values, or a loss of revenue, each of which could have a material adverse effect on our business, financial condition and results of operations. Our competitors may be affected differently by such changes in weather conditions or natural disasters depending on the location of their supplies or operations. Adverse weather conditions also may affect our live music events. Due to weather conditions, we may be required to reschedule an event to another available day, which would increase our costs for the event and could negatively affect the attendance at the event, as well as concession and merchandise sales, which could adversely affect our financial condition and results of operations.
Our insurance coverage on our properties may be inadequate to cover any losses we may incur.
We maintain insurance on our properties, including property, liability, fire and extended coverage. However, there are certain types of losses, generally of a catastrophic nature, such as hurricanes and floods or acts of war or terrorism that may be uninsurable or not economical to insure. We use our discretion when determining amounts, coverage limits and deductibles for insurance. These terms are determined based on retaining an acceptable level of risk at a reasonable cost. This may result in insurance coverage that in the event of a substantial loss would not be sufficient to pay the full current market value or current replacement cost of our lost investment. Inflation, changes in building codes and ordinances, environmental considerations and other factors also may make it unfeasible to use insurance proceeds to replace a building or other facility after it has been damaged or destroyed. Under such circumstances, the insurance proceeds we receive may be inadequate to restore our economic position in a property. In addition, we may become liable for injuries and accidents occurring during the construction process that are underinsured.
9
Risks Relating to Real Estate Operations
The real estate business is highly competitive and many of our competitors are larger and financially stronger than we are.
The real estate business is highly competitive. We compete with a large number of companies and individuals that have significantly greater financial, sales, marketing and other resources than we have. Our competitors include local developers who are committed primarily to particular markets and also national developers who acquire properties throughout the U.S. A downturn in the real estate industry could significantly increase competition among developers. Increased competition could cause us to increase our selling incentives and/or reduce our prices. An oversupply of real estate properties available for sale or lease, as well as the potential significant discounting of prices by some of our competitors, may adversely affect our results of operations.
Our results of operations, cash flows and financial condition are greatly affected by the performance of the real estate industry.
Revenue from our real estate operations segment accounted for 18 percent of our total revenue for the fiscal year ended December 31, 2015. The U.S. real estate industry is highly cyclical and is affected by changes in global, national and local economic conditions and events such as general employment and income levels, availability of financing, interest rates, consumer confidence and overbuilding of or decrease in demand for residential and commercial real estate. Our real estate activities are subject to numerous factors beyond our control, including local real estate market conditions (both where our properties are located and in areas where our potential customers reside), substantial existing and potential competition, general national, regional and local economic conditions, fluctuations in interest rates and mortgage availability, changes in demographic conditions and changes in government regulations or requirements. Any of the foregoing factors could result in a reduction or cancellation of sales and/or lower gross margins for sales. Lower than expected sales could have a material adverse effect on the level of our profits and the timing and amounts of our cash flows.
Real estate investments often cannot easily be converted into cash and market values may be adversely affected by these economic circumstances, market fundamentals, and competitive and demographic conditions. Because of the effect these factors have on real estate values, it is difficult to predict the level of future sales or sales prices that will be realized for individual assets.
Our operations are subject to an intensive regulatory approval process and opposition from environmental groups, either or both of which could cause delays and increase the costs of our development efforts or preclude such developments entirely.
Before we can develop a property, we must obtain a variety of approvals from local and state governments with respect to such matters as zoning and other land use issues, and subdivision, site planning and environmental issues under applicable regulations. Some of these approvals are discretionary. Because government agencies and special interest groups have in the past expressed concerns about our development plans in or near Austin, our ability to develop these properties and realize future income from our properties could be delayed, reduced, prevented or made more expensive.
Several special interest groups have in the past opposed our plans in the Austin area and have taken various actions to partially or completely restrict development in some areas, including areas where some of our most valuable properties are located. We have actively opposed these actions. However, because of the regulatory environment that has existed in the Austin area and the opposition of these special interest groups, there can be no assurance that an unfavorable ruling would not have a significant long-term adverse effect on the overall value of our property holdings.
Our operations are subject to environmental regulation, which can change at any time and could increase our costs.
Real estate development is subject to state and federal environmental regulations and to possible interruption or termination because of environmental considerations, including, without limitation, air and water quality and protection of endangered species and their habitats.
10
Certain of the Barton Creek and Lantana properties include nesting territories for the Golden-cheeked Warbler, a federally listed endangered species. In 1995, we received a permit from the U.S. Wildlife Service pursuant to the Endangered Species Act, which to date has allowed the development of the Barton Creek and Lantana properties free of restrictions under the Endangered Species Act related to the maintenance of habitat for the Golden-cheeked Warbler.
Additionally, in April 1997, the U.S. Department of Interior listed the Barton Springs Salamander as an endangered species after a federal court overturned a March 1997 decision by the Department of Interior not to list the Barton Springs Salamander based on a conservation agreement between the State of Texas and federal agencies. The listing of the Barton Springs Salamander has not affected, nor do we anticipate it will affect, our Barton Creek and Lantana properties for several reasons, including the results of technical studies and the U.S. Fish and Wildlife Service 10(a) permit obtained by us in 1995. The development permitted by the 2002 Circle C settlement with the City has been reviewed and approved by the U.S. Fish and Wildlife Service and, as a result, we also do not anticipate that the 1997 listing of the Barton Springs Salamander will affect our Circle C properties.
In January 2013, the U.S. Department of the Interior announced that it had conducted an economic assessment of the potential designation of critical habitat for four species of Central Texas salamanders. Although this potential designation of habitat has not affected, nor do we anticipate that it will affect, our Barton Creek, Lantana or Circle C properties for several reasons, including prior studies and approvals, and our existing U.S. Fish and Wildlife Service 10(a) permit obtained in 1995, future endangered species listings or habitat designations could impact development of our properties.
We are making, and will continue to make, expenditures with respect to our real estate development for the protection of the environment. Emphasis on environmental matters will result in additional costs in the future. New environmental regulations or changes in existing regulations or their enforcement may be enacted and such new regulations or changes may require significant expenditures by us. The recent trend toward stricter standards in environmental legislation and regulations is likely to continue and could have a material adverse effect on our operating costs.
Risks Relating to Hotel Operations
We are subject to the business, financial and operating risks common to the hotel industry, any of which could reduce our revenues.
Revenue from our hotel segment accounted for 51 percent of our total revenue for the fiscal year ended December 31, 2015. Business, financial and operating risks common to the hotel industry include:
• | Changes in desirability of geographic regions and geographic concentration of our operations and customers; |
• | Decreases in the demand for hotel rooms and related lodging services, including a reduction in business travel as a result of alternatives to in-person meetings (including virtual meetings hosted online or over private teleconferencing networks) or due to general economic conditions; |
• | Decreased corporate or governmental travel-related budgets and spending, as well as cancellations, deferrals or renegotiations of group business such as industry conventions; |
• | Negative public perception of corporate travel-related activities; |
• | The effect of internet intermediaries and other new industry entrants on pricing and our increasing reliance on technology; |
• | The costs and administrative burdens associated with complying with applicable laws and regulations in the U.S., including health, safety and environmental laws, rules and regulations and other governmental and regulatory action; |
• | Changes in operating costs including, but not limited to, energy, water, labor costs (including the effect of labor shortages and unionization), food costs, workers’ compensation and health-care related costs, insurance and unanticipated costs such as acts of nature and their consequences; and |
11
• | Cyclical over-building in the hotel industry. |
External perception of the W Austin Hotel could negatively affect our results of operations.
Starwood manages hotel operations at the W Austin Hotel. Our ability to attract and retain guests depends, in part, upon the external perceptions of Starwood and the quality of the W Austin Hotel and its services and we have to spend money periodically to keep the properties well maintained, modernized and refurbished. The reputation of the W Austin Hotel may be negatively affected if Starwood fails to act responsibly or comply with regulatory requirements in a number of areas, such as safety and security, sustainability, responsible tourism, environmental management, human rights and support for the local communities where Starwood manages and/or owns properties. The considerable increase in the use of social media over recent years has greatly expanded the potential scope and scale, and increased the rapidity of the dissemination of negative publicity that could be generated by any adverse incident or failure on the part of hotel operators. An adverse incident involving associates or guests and any media coverage resulting therefrom may cause a loss of consumer confidence in the Starwood brand which could negatively affect our results of operations. Additionally, the Starwood brand could be adversely affected by the late 2015 announcement of Marriott International, Inc.'s plans to acquire Starwood.
Our revenues, profits or market share could be harmed if we are unable to compete effectively in the hotel industry in Austin.
The hotel industry in Austin is highly competitive. The W Austin Hotel competes for customers with other hotel and resort properties in Austin, ranging from national and international hotel brands to independent, local and regional hotel operators. We compete based on a number of factors, primarily including quality and consistency of rooms, restaurant and meeting facilities and services, attractiveness of location and price. Some of our competitors may have substantially greater marketing and financial resources than we do, and if we are unable to successfully compete in these areas, our operating results could be adversely affected.
Historically, the Austin market has had a limited number of high-end hotel accommodations. However, hotel capacity is being expanded by other hotel operators in Austin, including several properties in close proximity to the W Austin Hotel & Residences. As new rooms come on-line, increased competition could lead to an excess supply of hotel rooms in the Austin market, thereby causing Starwood to increase promotional incentives for hotel guests and/or reduce rates. Increased competition in the Austin market from new hotels or hotels that have recently undergone substantial renovation could have an adverse effect on occupancy, average daily rate and room revenue per available room.
Additionally, some of our hotel rooms are booked through third-party internet travel intermediaries as well as lesser-known online travel service providers. In addition, travelers can book stays on websites that facilitate the short-term rental of homes and apartments from owners, thereby providing an alternative to hotel rooms. Increased internet bookings could have an adverse effect on occupancy, average daily rate and room revenue per available room.
Risks Relating to Entertainment Businesses
We face intense competition in the live music industry, and we may not be able to maintain or increase our current revenue, which could adversely affect our business, financial condition and results of operations.
Revenue from our entertainment businesses accounted for 24 percent of our total revenue for the fiscal year ended December 31, 2015. Our entertainment businesses compete in a highly competitive industry, and we may not be able to maintain or increase our current revenue as a result of such competition. The live music industry competes with other forms of entertainment for consumers’ discretionary spending and within this industry we compete with other venues to book artists. Our competitors compete with us for key employees who have relationships with popular music artists and that have a history of being able to book such artists for concerts and tours. These competitors may engage in more extensive development efforts, undertake more far-reaching marketing campaigns, adopt more aggressive pricing policies and make more attractive offers to existing and potential artists. Our competitors may develop services, advertising options or music venues that are equal or superior to those we provide or that achieve greater market acceptance and brand recognition than we achieve. It is possible that new competitors may emerge and rapidly acquire significant market share.
12
Other variables related to our entertainment businesses that could adversely affect our financial performance by, among other things, leading to decreases in overall revenue, the number of sponsors, event attendance, ticket prices and fees or profit margins include:
• | An increased level of competition for advertising dollars, which may lead to lower sponsorships as we attempt to retain advertisers or which may cause us to lose advertisers to our competitors offering better programs that we are unable or unwilling to match; |
• | Unfavorable fluctuations in operating costs, which we may be unwilling or unable to pass through to our customers via ticket prices; |
• | Competitors’ offerings that may include more favorable terms than we do in order to obtain events for the venues they operate; |
• | Technological changes and innovations that we are unable to adopt or are late in adopting that offer more attractive entertainment alternatives than we or other live entertainment providers currently offer, which may lead to a reduction in attendance at live events, a loss of ticket sales or lower ticket fees; |
• | Other entertainment options available to our audiences that we do not offer; |
• | General economic conditions which could cause our consumers to reduce discretionary spending; |
• | Unfavorable changes in labor conditions which may require us to spend more to retain and attract key employees; |
• | Interruptions in our ticketing systems and infrastructures and data loss or other breaches of our network security; and |
• | Changes in consumer preferences. |
Additionally, our entertainment operations are seasonal. The results of operations from our entertainment segment vary from quarter to quarter and year over year, and the financial performance in certain quarters or years may not be indicative of, or comparable to, our financial performance in subsequent quarters or years.
Personal injuries and accidents may occur in connection with our live music events, which could subject us to personal injury or other claims and increase our expenses, as well as reduce attendance at our live music events, causing a decrease in our revenue.
There are inherent risks involved with producing live music events. As a result, personal injuries and accidents have, and may, occur from time to time, which could subject us to claims and liabilities for personal injuries. Incidents in connection with our live music events at the Moody Theater or festival sites that we rent through our joint ventures could also result in claims or reduce attendance at our events, which could cause a decrease in our revenue or reduce our operating income. We maintain insurance policies that provide coverage for personal injuries sustained by persons at our venues or events or accidents in the ordinary course of business, and there can be no assurance that such insurance will be adequate at all times and in all circumstances.
Risks Relating to Commercial Leasing
Unfavorable changes in market and economic conditions could negatively affect occupancy or rental rates, which could negatively affect our financial condition and results of operations.
Another decline in the real estate market and economic conditions could significantly affect rental rates. Occupancy and rental rates in our market, in turn, could significantly affect our profitability and our ability to satisfy our financial obligations. The risks that could affect conditions in our market include the following:
• | Local conditions, such as oversupply of office space, a decline in the demand for office space or increased competition from other available office buildings; |
• | The inability or unwillingness of tenants to pay their current rent or rent increases; and |
13
• | Declines in market rental rates. |
Additionally, tenants at our retail properties face continual competition in attracting customers from various on-line and other competitors. Our competitors and those of our tenants could have a material adverse effect on our ability to lease space in our retail properties and on the rents we can charge or the concessions we can grant. Further, as new technologies emerge, the relationship among customers, retailers, and shopping centers are evolving on a rapid basis. If we are unable to adapt to such new technologies and relationships on a timely basis, our financial performance will be adversely impacted.
We cannot predict with certainty whether any of these conditions will occur or whether, and to what extent, they will have an adverse effect on our operations.
Risks Relating to Ownership of Shares of Our Common Stock
Our common stock is thinly traded; therefore, our stock price may fluctuate more than the stock market as a whole.
As a result of the thin trading market for shares of our common stock, our stock price may fluctuate significantly more than the stock market as a whole or the stock prices of similar companies. Without a larger public float, shares of our common stock will be less liquid than the shares of common stock of companies with broader public ownership, and as a result, the trading prices for shares of our common stock may be more volatile. Among other things, trading of a relatively small volume of shares of our common stock may have a greater effect on the trading price than would be the case if our public float were larger.
Item 1B. Unresolved Staff Comments
None.
Item 3. Legal Proceedings
We are from time to time involved in legal proceedings that arise in the ordinary course of our business. We do not believe, based on currently available information, that the outcome of any legal proceeding will have a material adverse effect on our financial condition or results of operations. We maintain liability insurance to cover some, but not all, potential liabilities normally incident to the ordinary course of our business as well as other insurance coverage customary in our business, with such coverage limits as management deems prudent.
Item 4. Mine Safety Disclosures
Not applicable.
Executive Officers of the Registrant
Certain information as of February 29, 2016, regarding our executive officers is set forth in the following table and accompanying text. Each of our executive officers serves at the discretion of our board of directors.
Name | Age | Position or Office | ||
William H. Armstrong III | 51 | Chairman of the Board, President and Chief Executive Officer | ||
Erin D. Pickens | 54 | Senior Vice President and Chief Financial Officer | ||
Mr. Armstrong has been employed by us since our inception in 1992. Mr. Armstrong has served as President since August 1996, Chief Executive Officer since May 1998 and Chairman of the Board since August 1998.
Ms. Pickens has served as our Senior Vice President since May 2009 and as our Chief Financial Officer since June 2009. Ms. Pickens previously served as Executive Vice President and Chief Financial Officer of Tarragon Corporation from November 1998 until April 2009, and as Vice President and Chief Accounting Officer from September 1996 until November 1998 and Accounting Manager from June 1995 until August 1996 for Tarragon and its predecessors. Tarragon Corporation filed for voluntary reorganization under Chapter 11 of the U.S. Bankruptcy Code on January 12, 2009, and emerged from bankruptcy on July 6, 2010.
14
PART II
Item 5. Market for Registrant’s Common Equity, Related Stockholder Matters and Issuer Purchases of Equity Securities
Performance Graph
The following graph compares the change in the cumulative total stockholder return on our common stock from December 31, 2010, through December 31, 2015, with the cumulative total return of (a) the Standard & Poor's (S&P) 500 Stock Index, (b) the Dow Jones U.S. Real Estate Index and (c) the below custom peer group of real estate related companies:
Alexander & Baldwin, Inc. (ALEX)
Consolidated-Tomoka Land Co. (CTO)
Forestar Group Inc. (FOR)
The Howard Hughes Corporation (HHC)
Maui Land & Pineapple Company, Inc. (MLP)
The St. Joe Company (JOE)
Tejon Ranch Co. (TRC)
This comparison assumes $100 invested on December 31, 2010, in (a) our common stock, (b) the S&P 500 Stock Index, (c) the Dow Jones U.S. Real Estate Index and (d) the custom peer group.
The total returns shown assume that dividends are reinvested. The stock price performance shown below is not necessarily indicative of future price performance.
Comparison of Cumulative Total Return
Stratus Properties Inc., S&P 500 Stock Index,
Dow Jones U.S. Real Estate Index and Custom Peer Group
December 31, | |||||||||||||||||||||||
2010 | 2011 | 2012 | 2013 | 2014 | 2015 | ||||||||||||||||||
Stratus Properties Inc. | $ | 100 | $ | 86 | $ | 94 | $ | 188 | $ | 152 | $ | 224 | |||||||||||
S&P 500 Stock Index | 100 | 102 | 118 | 157 | 178 | 181 | |||||||||||||||||
Dow Jones U.S. Real Estate Index | 100 | 106 | 126 | 128 | 163 | 167 | |||||||||||||||||
Custom Peer Group | 100 | 77 | 114 | 149 | 149 | 131 | |||||||||||||||||
15
Common Stock
Our common stock trades on The Nasdaq Stock Market (NASDAQ) under the symbol "STRS". The following table sets forth, for the periods indicated, the range of high and low sales prices of our common stock, as reported by NASDAQ.
2015 | 2014 | ||||||||||||||
High | Low | High | Low | ||||||||||||
First Quarter | $ | 13.95 | $ | 11.01 | $ | 17.93 | $ | 16.35 | |||||||
Second Quarter | 15.11 | 12.56 | 17.55 | 15.53 | |||||||||||
Third Quarter | 16.50 | 13.60 | 16.50 | 13.75 | |||||||||||
Fourth Quarter | 20.98 | 14.91 | 14.74 | 13.25 | |||||||||||
As of February 29, 2016, there were 400 holders of record of our common stock. We have not in the past paid, and do not anticipate in the future paying, cash dividends on shares of our common stock. The declaration of dividends is at the discretion of our board of directors; however, our ability to pay dividends is restricted by the terms of our credit facility. See Part III, Item 12. for information on our equity compensation plans.
Unregistered Sales of Equity Securities
None.
Issuer Purchases of Equity Securities
The following table sets forth information with respect to shares of our common stock that we repurchased under the board-approved open market share purchase program during the three-month period ended December 31, 2015.
Period | Total Number of Shares Purchased | Average Price Paid Per Share | Total Number of Shares Purchased as Part of Publicly Announced Plans or Programsa | Maximum Number of Shares That May Yet Be Purchased Under the Plans or Programsa | |||||||||
October 1 to 31, 2015 | — | $ | — | — | 991,695 | ||||||||
November 1 to 30, 2015 | — | — | — | 991,695 | |||||||||
December 1 to 31, 2015 | — | — | — | 991,695 | |||||||||
Total | — | $ | — | — | 991,695 | ||||||||
a. | In November 2013, the board of directors approved an increase in our open-market share purchase program, initially authorized in 2001, for up to 1.7 million shares of our common stock. The program does not have an expiration date. |
Stratus' loan agreements with Comerica Bank and Diversified Real Asset Income Fund require lender approval of any common stock repurchases.
16
Item 6. Selected Financial Data
The selected consolidated financial data shown below is derived from our audited consolidated financial statements. These historical results are not necessarily indicative of results that you can expect for any future period. You should read this data in conjunction with Items 7. and 7A. "Management’s Discussion and Analysis of Financial Condition and Results of Operations and Quantitative and Qualitative Disclosures About Market Risk" and Item 8. "Financial Statements and Supplementary Data".
2015 | 2014 | 2013 | 2012 | 2011 | ||||||||||||||||
(In Thousands, Except Per Share Amounts) | ||||||||||||||||||||
Years Ended December 31: | ||||||||||||||||||||
Revenues | $ | 80,871 | $ | 94,111 | $ | 127,710 | $ | 115,737 | $ | 137,036 | ||||||||||
Operating income | 25,732 | a,b | 10,364 | c,d | 14,151 | b,d | 2,781 | 1,681 | ||||||||||||
Equity in unconsolidated affiliates' (loss)income | (1,299 | ) | 1,112 | (76 | ) | (29 | ) | (337 | ) | |||||||||||
Income (loss) from continuing operations, net of taxes | 14,377 | a,b | 18,157 | c,d,e | 5,894 | b,d | (9,118 | ) | (5,424 | ) | ||||||||||
Income from discontinued operations, net of taxes | 3,218 | f | — | — | 4,805 | f | 191 | f | ||||||||||||
Net income (loss) | 17,595 | a,b | 18,157 | c,d,e | 5,894 | b,d | (4,313 | ) | (5,233 | ) | ||||||||||
Net income (loss) attributable to common stock | 12,177 | a,b | 13,403 | c,d,e | 2,585 | b,d | (1,586 | ) | (10,388 | ) | ||||||||||
Basic net income (loss) per share: | ||||||||||||||||||||
Continuing operations | $ | 1.11 | $ | 1.67 | $ | 0.32 | $ | (0.80 | ) | $ | (1.41 | ) | ||||||||
Discontinued operations | 0.40 | — | — | 0.60 | 0.02 | |||||||||||||||
Basic net income (loss) per share | $ | 1.51 | $ | 1.67 | $ | 0.32 | $ | (0.20 | ) | $ | (1.39 | ) | ||||||||
Diluted net income (loss) per share: | ||||||||||||||||||||
Continuing operations | $ | 1.11 | a,b | $ | 1.66 | c,d,e | $ | 0.32 | b,d | $ | (0.80 | ) | $ | (1.41 | ) | |||||
Discontinued operations | 0.40 | f | — | — | 0.60 | f | 0.02 | f | ||||||||||||
Diluted net income (loss) per share | $ | 1.51 | a,b | $ | 1.66 | c,d,e | $ | 0.32 | b,d | $ | (0.20 | ) | $ | (1.39 | ) | |||||
Average shares outstanding: | ||||||||||||||||||||
Basic | 8,058 | 8,037 | 8,077 | 7,966 | 7,482 | |||||||||||||||
Diluted | 8,091 | 8,078 | 8,111 | 7,966 | 7,482 | |||||||||||||||
At December 31: | ||||||||||||||||||||
Real estate held for sale | $ | 25,944 | $ | 12,245 | $ | 18,133 | $ | 60,244 | $ | 74,003 | ||||||||||
Real estate held for investment, net | 186,626 | 178,065 | 182,530 | 189,331 | 185,221 | |||||||||||||||
Real estate under development | 139,171 | 123,921 | 76,891 | 31,596 | 54,956 | |||||||||||||||
Land available for development | 23,397 | 21,368 | 21,404 | 49,569 | 60,936 | |||||||||||||||
Total assets | 432,627 | 402,687 | 346,943 | 379,128 | 421,605 | |||||||||||||||
Debt | 263,114 | 196,477 | 151,332 | 137,035 | 158,451 | |||||||||||||||
Stockholders' equity | 136,599 | 136,443 | 123,621 | 121,687 | 118,189 | |||||||||||||||
Noncontrolling interests in subsidiaries | 75 | 38,643 | 45,695 | 87,208 | 99,493 | |||||||||||||||
a. | Includes a total gain of $20.7 million ($10.8 million to net income attributable to common stock or $1.34 per share) associated with the sales of Parkside Village and 5700 Slaughter (see Note 12 for further discussion). |
b. | Includes a pre-tax gain of $0.6 million ($0.08 per share) in 2015 associated with the sale of a tract of undeveloped land and $2.1 million ($0.26 per share) in 2013 associated with undeveloped land sales. |
c. | Includes a gain of $1.5 million ($0.19 per share) associated with a litigation settlement. Also includes lease termination charges of $0.3 million ($0.04 per share) recorded by the commercial leasing segment. |
d. | Includes income of $0.6 million ($0.07 per share) in 2014 and $1.8 million ($0.22 per share) in 2013, related to insurance settlements and $0.4 million ($0.05 per share) in 2014 and $1.1 million ($0.13 per share) in 2013, for the recovery of building repair costs. |
e. | Includes a credit to provision for income taxes of $12.1 million, $1.50 per share, for the reversal of valuation allowances on deferred tax assets. |
f. | Includes the results of 7500 Rialto Boulevard, which was sold in February 2012, including a gain on the sale of $5.1 million ($0.65 per share) in 2012 and a deferred gain of $5.0 million ($3.2 million attributable to common stock or $0.40 per share) in 2015. |
17
Items 7. and 7A. Management’s Discussion and Analysis of Financial Condition and Results of Operations and Quantitative and Qualitative Disclosures About Market Risk
OVERVIEW
In Management’s Discussion and Analysis of Financial Condition and Results of Operations, “we,” “us,” “our” and "Stratus" refer to Stratus Properties Inc. and all entities owned or controlled by Stratus Properties Inc. You should read the following discussion in conjunction with our consolidated financial statements and the related discussion of “Business and Properties” and “Risk Factors” included elsewhere in this Form 10-K. The results of operations reported and summarized below are not necessarily indicative of future operating results, and future results could differ materially from those anticipated in forward-looking statements (refer to "Cautionary Statement" for further discussion). All subsequent references to “Notes” refer to Notes to Consolidated Financial Statements located in Part II, Item 8. “Financial Statements and Supplementary Data.”
We are a diversified real estate company engaged primarily in the acquisition, entitlement, development, management, operation and sale of commercial, hotel, entertainment, and multi- and single-family residential real estate properties, primarily located in the Austin area, but including projects in certain other select markets in Texas. We generate revenues from sales of developed properties, from our hotel and entertainment operations and from rental income from our commercial properties. Developed property sales can include an individual tract of land that has been developed and permitted for residential use, a developed lot with a home already built on it or condominium units at the W Austin Hotel & Residences. We may sell properties under development, undeveloped properties or commercial properties, if opportunities arise that we believe will maximize overall asset values as part of our business plan. See "Business Strategy and Related Risks" below. See Note 11 for further discussion of our operating segments and "Business Strategy and Related Risks" for a discussion of our business strategy.
The principal holdings in our Real Estate Operations segment are in southwest Austin, Texas. The number of developed lots/units, acreage under development and undeveloped acreage as of December 31, 2015, that comprise our real estate operations are presented in the following table.
Acreage | ||||||||||||||||||||||||||
Under Development | Undeveloped | |||||||||||||||||||||||||
Developed Lots/Units | Multi-Family | Commercial | Total | Single Family | Multi- family | Commercial | Total | Total Acreage | ||||||||||||||||||
Austin: | ||||||||||||||||||||||||||
Barton Creek | 68 | 18 | — | 18 | 512 | 308 | 398 | 1,218 | 1,236 | |||||||||||||||||
Circle C | 31 | — | — | — | — | 36 | 216 | 252 | 252 | |||||||||||||||||
Lantana | — | — | — | — | — | — | 56 | 56 | 56 | |||||||||||||||||
W Austin Residences | 2 | — | — | — | — | — | — | — | — | |||||||||||||||||
The Oaks at Lakeway | — | — | 87 | 87 | — | — | — | — | 87 | |||||||||||||||||
Magnolia | — | — | — | — | — | — | 124 | 124 | 124 | |||||||||||||||||
West Killeen Market | — | — | — | — | — | — | 9 | 9 | 9 | |||||||||||||||||
San Antonio: | ||||||||||||||||||||||||||
Camino Real | — | — | — | — | — | — | 2 | 2 | 2 | |||||||||||||||||
Total | 101 | 18 | 87 | 105 | 512 | 344 | 805 | 1,661 | 1,766 | |||||||||||||||||
Our residential holdings at December 31, 2015, included developed lots at Barton Creek and the Circle C community, and condominium units at the W Austin Hotel & Residences. See "Development Activities - Residential" for further discussion. Our commercial leasing holdings at December 31, 2015, consisted of the office and retail space at the W Austin Hotel & Residences, the first phase of Barton Creek Village and The Oaks at Lakeway. See "Development Activities - Commercial" for further discussion.
The W Austin Hotel & Residences is located on a two-acre city block in downtown Austin and contains a 251-room luxury hotel, 159 residential condominium units (of which the remaining two unsold units were being marketed as of December 31, 2015), and office, retail and entertainment space. The hotel is managed by Starwood Hotels & Resorts Worldwide, Inc. The entertainment space, occupied by Austin City Limits Live at the Moody Theater (ACL Live), includes a live music and entertainment venue and production studio.
18
In 2015, we purchased the noncontrolling interest in the CJUF II Stratus Block 21, LLC joint venture (the Block 21 Joint Venture) which owned the W Austin Hotel & Residences and we now own 100 percent of the entity (see "Business Strategy and Related Risks" below).
In 2015, our revenues totaled $80.9 million and our net income attributable to common stock totaled $12.2 million, compared with revenues of $94.1 million and net income attributable to common stock of $13.4 million for 2014 and revenues of $127.7 million and net income attributable to common stock of $2.6 million for 2013. The decrease in revenues in 2015, compared with 2014, primarily relates to fewer condominium unit sales at the W Austin Residences and fewer lot sales at Verano Drive and Amarra Drive Phase II as inventory has declined as a result of previous sales activity. The decrease in revenues in 2014, compared with 2013, primarily relates to fewer condominium unit sales at the W Austin Residences and fewer lot sales at Verano Drive, partly offset by an increase in entertainment revenue.
Our results for 2015 included a gain of $20.7 million ($10.8 million to net income attributable to common stock) on the sales of our Parkside Village and 5700 Slaughter commercial developments and the recognition of a deferred gain associated with the 2012 sale of 7500 Rialto totaling $5.0 million ($3.2 million to net income attributable to common stock) (see Note 12 for further discussion). The results for 2015 also include a pre-tax gain of $0.6 million associated with an undeveloped land sale. The results for 2014 included pre-tax income of $1.5 million associated with a litigation settlement, $0.6 million associated with an insurance settlement and $0.4 million associated with the recovery of building repair costs associated with damage caused by the June 2011 balcony glass breakage incidents at the W Austin Hotel & Residences. The results for 2014 also included credits to the provision for income taxes of $12.1 million primarily associated with the reversal of the valuation allowance on our deferred tax assets. The results for 2013 included pre-tax income of $2.1 million associated with undeveloped land sales, an insurance settlement of $1.8 million and $1.1 million associated with the recovery of building repair costs, partly offset by a pre-tax loss on early extinguishment of debt of $1.4 million.
At December 31, 2015, we had total debt of $263.1 million. For discussion of operating cash flows and debt transactions see "Capital Resources and Liquidity" below.
Real Estate Market Conditions
Because of the concentration of our assets primarily in the Austin, Texas area, market conditions in this region significantly affect our business. Our future operating cash flows and our ability to develop and sell our properties will be dependent on the level and profitability of our real estate sales. In turn, these sales will be significantly affected by future real estate market conditions in and around Austin, Texas, including development costs, interest rate levels, the availability of credit to finance real estate transactions, demand for residential and commercial real estate, and regulatory factors including our use and development entitlements. These market conditions historically move in periodic cycles, and can be volatile.
In addition to the traditional influence of state and federal government employment levels on the local economy, the Austin area has been influenced by growth in the technology sector. The Austin-area population increased by 17 percent from 2009 through 2015, largely because of an influx of technology companies and related businesses. Median family income levels in Austin also increased during the period from 2009 through 2014, rising 12 percent. The expanding economy resulted in rising demands for residential housing, commercial office space and retail services. From 2009 through 2014, sales tax receipts in Austin rose by 36 percent, an indication of the increase in business activity during the period.
19
The following chart compares Austin's five-county metro area population and median family income for 1999, 2009 and the most current information available for 2014 and 2015, based on United States (U.S.) Census Bureau data and City of Austin (the City) data.
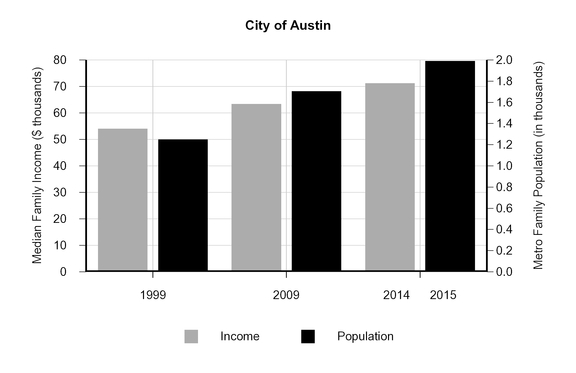
Based on the City’s fiscal year of October 1st through September 30th, the chart below compares Austin’s sales tax revenues for 1999, 2009 and 2014 (the latest period for which data is available).
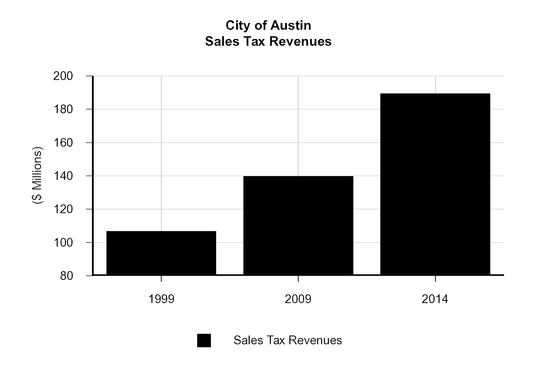
Source: Comprehensive Annual Financial Report for the City of Austin, Texas
Real estate development in southwest Austin, where most of the property in our real estate operations segment is located, has historically been constrained as a result of various restrictions imposed by the City. Additionally, several special interest groups have traditionally opposed development in southwest Austin. During 2008 and 2009, economic conditions resulted in a general decline in leasing activity across the U.S. and caused vacancy rates to
20
increase in most markets, including Austin, Texas. Vacancy rates for various types of developed properties in Austin have improved since 2009, and the vacancy rates as of December 31, 2015 and 2014, are noted below.
Vacancy Rates | |||||||
Building Type | 2015 | 2014 | |||||
Office Buildings (Class A) | 10 | % | a | 10 | % | a | |
Multi-Family Buildings | 4 | % | b | 5 | % | b | |
Retail Buildings | 5 | % | b | 5 | % | b | |
a. | CB Richard Ellis: Austin MarketView |
b. | Marcus & Millichap Research Services, CoStar Group, Inc. |
BUSINESS STRATEGY AND RELATED RISKS
Stratus Properties Inc. was formed in 1992 to hold, operate and develop the domestic real estate and oil and gas properties of our former parent company. We sold all of our oil and gas properties during the 1990s and have since focused solely on our real estate properties. Our overall strategy has been to enhance the value of our properties by securing and maintaining development entitlements and developing and building real estate projects on these properties for sale or investment. We have also pursued opportunities for new projects that offer the possibility of acceptable returns and risks.
As previously announced, our board of directors unanimously approved a five-year plan to create value for stockholders by methodically developing certain existing assets and strategically marketing other assets for sale at appropriate values. Under the plan, any future new projects will be complementary to existing operations and will be projected to be developed and sold within a five-year time frame. Consistent with our five-year plan, on July 2, 2015, we completed the sales of our Austin-area Parkside Village and 5700 Slaughter commercial properties, both located in the Circle C community, for $32.5 million and $12.5 million, respectively. We have engaged an adviser to market other properties for sale in accordance with the five-year plan .
Additionally, on September 28, 2015, we completed the purchase of Canyon-Johnson Urban Fund II, L.P.'s (Canyon-Johnson’s) approximate 58 percent interest in the Block 21 Joint Venture, for approximately $62 million. See Note 2 for further discussion. In connection with our acquisition of Canyon-Johnson's interest in the Block 21 Joint Venture, we completed the refinancing of the W Austin Hotel & Residences. See "Capital Resources and Liquidity - Credit Facility and Other Financing Arrangements."
We believe that the Austin and surrounding sub-markets continue to be desirable. Many of our developments are in locations where development approvals have historically been subject to regulatory constraints, which has made it difficult to obtain entitlements. Our Austin assets, which are located in desirable areas with significant regulatory constraints, are highly entitled and now have utility capacity for full buildout. As a result, we believe that through strategic planning, development and marketing, as provided in our five-year plan, we can maximize and fully realize their value. Our development plans require significant additional capital, and may be pursued through joint ventures or other means. In addition, our strategy is subject to continued review by our board of directors and may change as a result of market conditions or other factors deemed relevant by our board of directors.
In years past, economic conditions, including the constrained capital and credit markets, negatively affected the execution of our business plan, primarily by decreasing our pace of development to match economic and market conditions. We responded to these conditions by successfully restructuring our existing debt, including reducing interest rates and extending maturities, which enabled us to preserve our development opportunities until market conditions improved. Economic conditions have improved and we believe we have the financial flexibility to fully exploit our development opportunities and resources in accordance with our five-year plan. During 2015, our operating cash flows reflect purchases and development of real estate properties totaling $26.2 million, funded primarily from construction and terms loans, to invest in new development opportunities to be executed over the next 24 months. As of December 31, 2015, we had $11.9 million of availability under our revolving line of credit with Comerica Bank, which matures in August 2017.
Although as of January 31, 2016, we have scheduled debt maturities of $13.7 million in 2016 and significant recurring costs, including property taxes, maintenance and marketing, we believe we will have sufficient sources of debt financing and cash from operations to address our cash requirements. See “Capital Resources and Liquidity” below regarding recent debt repayments and refinancing and Part 1, Item 1A. “Risk Factors” for further discussion.
21
CRITICAL ACCOUNTING POLICIES
Management’s discussion and analysis of our financial condition and results of operations are based on our consolidated financial statements, which have been prepared in conformity with accounting principles generally accepted in the U.S. The preparation of these financial statements requires that we make estimates and assumptions that affect the reported amounts of assets, liabilities, revenues and expenses. We base these estimates on historical experience and on assumptions that we consider reasonable under the circumstances; however, reported results could differ from those based on the current estimates under different assumptions and/or conditions. The areas requiring the use of management’s estimates are discussed in Note 1 under the heading “Use of Estimates.” We believe that our most critical accounting policies relate to our real estate and commercial leasing assets and deferred tax assets.
Management has reviewed the following discussion of its development and selection of critical accounting estimates with the audit committee of our board of directors.
Real Estate, Hotel, Entertainment Venue and Commercial Leasing Assets. Real estate held for sale is stated at the lower of cost or fair value less costs to sell. The cost of real estate sold includes acquisition, development, construction and carrying costs and other related costs through the development stage. Real estate under development and land available for development are stated at cost. Real estate held for investment, which includes the hotel and entertainment venue at the W Austin Hotel & Residences and our commercial leasing assets, is also stated at cost. When events or circumstances indicate that an asset’s carrying amount may not be recoverable, an impairment test is performed. For real estate held for sale, if estimated fair value less costs to sell is less than the related carrying amount, then a reduction of the asset’s carrying value to fair value less costs to sell is required. For real estate under development, land available for development and real estate held for investment, if the projected undiscounted cash flow from the asset is less than the related carrying amount, then a reduction of the carrying amount of the asset to fair value is required. Measurement of an impairment loss is based on the fair value of the asset. Generally, we determine fair value using valuation techniques such as discounted expected future cash flows.
In developing estimated future cash flows for impairment testing for our real estate assets, we have incorporated our own market assumptions including those regarding real estate prices, sales pace, sales and marketing costs, and infrastructure costs. Our assumptions are based, in part, on general economic conditions, the current state of the real estate industry, expectations about the short- and long-term outlook for the real estate market, and competition from other developers in the area in which we develop our properties. These assumptions can significantly affect our estimates of future cash flows. For those properties held for sale and deemed to be impaired, we determine fair value based on appraised values, adjusted for estimated costs to sell, as we believe this is the value for which the property could be sold. We recorded no impairment losses during the three-year period ended December 31, 2015 (see Note 1).
The estimate of our future revenues is also important because it is the basis of our development plans and also a factor in our ability to obtain the financing necessary to complete such plans. If our estimates of future cash flows from our properties differ from expectations, then our financial position and liquidity may be impacted, which could result in our default under certain debt instruments or result in our suspending some or all of our development activities.
Deferred Tax Assets. The carrying amounts of deferred tax assets are required to be reduced by a valuation allowance if, based on the available evidence, it is more likely than not that such assets will not be realized. Accordingly, we assess the need to establish valuation allowances for deferred tax assets periodically based on the more-likely-than-not realization threshold criterion. In the assessment for a valuation allowance, appropriate consideration is given to all positive and negative evidence related to the realization of the deferred tax assets. This assessment considers, among other matters, the nature, frequency and severity of current and cumulative losses, forecasts of future profitability, the duration of statutory carryforward periods, our experience with operating loss and tax credit carryforwards not expiring unused, and tax planning alternatives. This process involves significant management judgment about assumptions that are subject to change based on variances between projected and actual operating performance and changes in our business environment or operating or financing plans.
In fourth-quarter 2014, we evaluated the recoverability of our deferred tax assets, considering available positive and negative evidence, including recent earnings history and the current forecast of future taxable income. As a result, we concluded that there was sufficient positive evidence that our $11.8 million of deferred tax assets (net of
22
deferred tax liabilities) will be realized. Accordingly, we reversed the valuation allowance against our deferred tax assets during 2014 (see Note 8). Stratus had deferred tax assets (net of deferred tax liabilities) totaling $15.3 million at December 31, 2015.
Our future results of operations may be negatively impacted by our inability to realize a tax benefit for future tax losses or for items that will generate additional deferred tax assets that are more likely than not to not be realized.
DEVELOPMENT ACTIVITIES
Residential. As of December 31, 2015, the number of our residential developed lots/units, lots under development and lots for potential development by area are shown below:
Residential Lots/Units | |||||||||||
Developed | Under Development | Potential Developmenta | Total | ||||||||
Barton Creek: | |||||||||||
Amarra Drive: | |||||||||||
Phase II lots | 14 | — | — | 14 | |||||||
Phase III lots | 54 | — | — | 54 | |||||||
Amarra Villas | — | — | 190 | 190 | |||||||
Section N: | |||||||||||
Santal multi-family | — | 236 | — | 236 | |||||||
Other Section N | — | — | 1,624 | 1,624 | |||||||
Other Barton Creek sections | — | — | 156 | 156 | |||||||
Circle C: | |||||||||||
Meridian | 31 | — | — | 31 | |||||||
Tract 101 multi-family | — | — | 240 | 240 | |||||||
Tract 102 multi-family | — | — | 56 | 56 | |||||||
Flores Street | — | — | 6 | 6 | |||||||
W Austin Hotel & Residences: | |||||||||||
Condominium units | 2 | — | — | 2 | |||||||
Total Residential Lots/Units | 101 | 236 | 2,272 | 2,609 | |||||||
a. | Our development of the properties identified under the heading “Potential Development” is dependent upon the approval of our development plans and permits by governmental agencies, including the City. Those governmental agencies may not approve one or more development plans and permit applications related to such properties or may require us to modify our development plans. Accordingly, our development strategy with respect to those properties may change in the future. While we may be proceeding with approved infrastructure projects on some of these properties, they are not considered to be “under development” for disclosure in this table unless other development activities necessary to fully realize the properties’ intended final use are in progress or scheduled to commence in the near term. |
Calera. Calera is a residential subdivision with plat approval for 155 lots. The initial 16-acre phase of the Calera subdivision included 16 courtyard homes at Calera Court. The second phase of the Calera subdivision, Calera Drive, consisted of 53 single-family lots. Construction of the final phase, known as Verano Drive, was completed in July 2008 and included 71 single-family lots. During 2013, we sold 39 Verano Drive lots for $12.1 million and the remaining 6 Calera Drive lots for $1.4 million, and during 2014, we sold the remaining 9 Verano Drive lots for $3.5 million.
Mirador Estate. The Mirador subdivision consisted of 34 estate lots, with each lot averaging approximately 3.5 acres in size. During 2013, we sold the final Mirador lot for $0.4 million.
Amarra Drive. Amarra Drive Phase I, which was the initial phase of the Amarra Drive subdivision, was completed in 2007 and included six lots with sizes ranging from approximately one to four acres. Amarra Drive Phase II, which consisted of 35 lots on 51 acres, was substantially completed in October 2008. During 2013, we sold the remaining two Phase I lots for $0.7 million and three Phase II lots for $1.5 million. During 2014, we sold 16 Phase II lots for $8.2 million. We did not sell any Phase II lots in 2015, and as of December 31, 2015, 14 Phase II lots remained unsold. During early 2016, we sold one Phase II lot.
23
In first-quarter 2015, we completed the development of Amarra Drive Phase III, which consists of 64 lots on 166 acres. During 2015, we sold ten Phase III lots for $7.0 million and as of December 31, 2015, 54 lots remain unsold. As of February 29, 2016, one Phase III lot was under contract.
The Amarra Villas, the last phase of the Amarra Drive subdivision, is a 20-unit townhome development. We completed site work in late 2015 and construction began in early 2016.
Santal (formerly Tecoma). The Santal multi-family project is a garden-style apartment complex consisting of 236 units. Construction commenced in January 2015 and pre-leasing began in November 2015. The first units were completed in January 2016, and the project is expected to be completed in June 2016.
Circle C. We are developing the Circle C community based on the entitlements secured in our Circle C settlement with the City. Our Circle C settlement, as amended in 2004, permits development of 1.16 million square feet of commercial space, 504 multi-family units and 830 single-family residential lots. See "Properties" under Part 1, Items 1. and 2. for further discussion of our Circle C settlement with the City. Meridian is an 800-lot residential development at the Circle C community. Development of the final phase of Meridian, which consisted of 57 one-acre lots, was completed in first-quarter 2014. During 2014, we sold seven Meridian lots for $2.0 million. During 2015, we sold 19 Meridian lots for $5.4 million and as of December 31, 2015, 31 Meridian lots remained unsold. As of February 29, 2016, ten Meridian lots were under contract.
W Austin Hotel & Residences. During 2013, we sold 32 condominium units for $47.6 million, and during 2014, we sold 7 condominium units for $11.9 million. There were no sales during 2015 and as of December 31, 2015, two condominium units remained unsold. The two unsold units are being marketed.
Commercial. As of December 31, 2015, the number of square feet of our commercial property developed, under development and our remaining entitlements for potential development (excluding property associated with our unconsolidated joint venture with Trammell Crow Central Texas Development, Inc. relating to Crestview Station in Austin (the Crestview Station Joint Venture)) are shown below:
Commercial Property | |||||||||||
Developed | Under Development | Potential Development a | Total | ||||||||
Barton Creek: | |||||||||||
Treaty Oak Bank | 3,085 | — | — | 3,085 | |||||||
Barton Creek Village Phase I | 22,366 | — | — | 22,366 | |||||||
Barton Creek Village Phase II | — | — | 16,000 | 16,000 | |||||||
Entry corner | — | — | 5,000 | 5,000 | |||||||
Amarra retail/office | — | — | 83,081 | 83,081 | |||||||
Section N | — | — | 1,500,000 | 1,500,000 | |||||||
Circle C: | |||||||||||
Tract 110 | — | — | 614,500 | 614,500 | |||||||
Tract 114 | — | — | 78,357 | 78,357 | |||||||
Lantana: | |||||||||||
Tract GR1 | — | — | 325,000 | 325,000 | |||||||
Tract G07 | — | — | 160,000 | 160,000 | |||||||
W Austin Hotel & Residences: | |||||||||||
Office | 38,316 | — | — | 38,316 | |||||||
Retail | 18,327 | — | — | 18,327 | |||||||
The Oaks at Lakeway | 179,087 | 52,349 | — | 231,436 | |||||||
Magnolia | — | — | 351,000 | 351,000 | |||||||
West Killeen Market | — | — | 44,000 | 44,000 | |||||||
Total Square Feet | 261,181 | 52,349 | 3,176,938 | 3,490,468 | |||||||
a. | Our development of the properties identified under the heading “Potential Development” is dependent upon the approval of our development plans and permits by governmental agencies, including the City. Those governmental agencies may not approve one or more development plans and permit applications related to such properties or may require us to modify our development plans. Accordingly, our development strategy with respect to those properties may change in the future. While we may be proceeding with approved infrastructure projects on some of these properties, they are not considered to be “under development” for disclosure in this table unless other development activities necessary to fully realize the properties’ intended final use are in progress or scheduled to commence in the near term. |
24
Barton Creek. The first phase of Barton Creek Village consists of a 22,366-square-foot retail complex and a 3,085-square-foot bank building. As of December 31, 2015, occupancy was 100 percent for the retail complex, and the bank building is leased through January 2023.
Circle C. On July 2, 2015, we completed the sales of our Austin-area Parkside Village and 5700 Slaughter commercial properties, both located in the Circle C community. The Parkside Village retail project, which we owned in a joint venture with LCHM Holdings, LLC, consisted of 90,184 leasable square feet and was sold for $32.5 million. The project included a 33,650-square-foot full-service movie theater and restaurant, a 13,890-square-foot medical clinic and five other retail buildings, including a 14,926-square-foot building, a 10,175-square-foot building, a 8,043-square-foot building, a 4,500-square-foot building and a stand-alone 5,000-square-foot building. The 5700 Slaughter retail project, which we previously wholly owned, consisted of 25,698 leasable square feet and was sold for $12.5 million. See Note 12 for further discussion.
Lantana. Lantana is a partially developed, mixed-use real-estate development project. During 2013, we sold a 16-acre tract with entitlements for approximately 70,000 square feet of office space for $2.1 million. As of December 31, 2015, we had entitlements for approximately 485,000 square feet of office and retail space on the remaining 56 acres. Regional utility and road infrastructure is in place with capacity to serve Lantana at full build-out as permitted under our existing entitlements.
W Austin Hotel & Residences. The W Austin Hotel & Residences has 38,316 square feet of leasable office space, including 9,000 square feet occupied by our corporate office, and 18,327 square feet of retail space. As of December 31, 2015, occupancy for the office space was 100 percent and occupancy for the retail space was 74 percent. Leasing is ongoing for the remaining retail space. See "Business Strategy and Related Risks" for information on our acquisition of the interest of our joint venture partner.
The Oaks at Lakeway. The Oaks at Lakeway is a HEB Grocery Company, L.P. (HEB) anchored retail project planned for 231,436 square feet of commercial space. As of December 31, 2015, leases for 78 percent of the space, including the HEB lease, have been executed and leasing for the remaining space is under way. The HEB store opened in October 2015, and leases for 45,492 square feet of additional space commenced in November 2015. Construction of the remainder of the project is ongoing.
Magnolia. The Magnolia project is a HEB-anchored retail project planned for 351,000 square feet of commercial space. Planning and infrastructure work by the city of Magnolia and road expansion by the Texas Department of Transportation are in progress and construction is expected to be completed in 2017.
West Killeen Market. In 2015, we acquired approximately 21 acres in Killeen, Texas, to develop the West Killeen Market project, a HEB-anchored retail project planned for 44,000 square feet of commercial space and three pad sites adjacent to a 90,000 square-foot HEB grocery store. Construction is expected to begin in third-quarter 2016, and the HEB store is expected to open in March 2017.
Crestview Station. Crestview Station is a single-family, multi-family, retail and office development, located on the site of a commuter rail line. The Crestview Station Joint Venture sold substantially all of its multi-family and commercial properties in 2007 and one commercial site in 2008. In 2014, the Crestview Station Joint Venture sold the remaining residential land to DR Horton. See the table below for more information (in millions, except lots closed).
Closing Date | Lots Closed | Sale Price | Gross Profit | ||||||||
April 2012 | 74 | $ | 3.8 | $ | 0.4 | ||||||
May 2013 | 59 | 3.4 | 0.7 | ||||||||
March 2014 | 59 | 3.5 | 0.8 | ||||||||
November 2014 | 111 | 6.8 | 1.8 | ||||||||
303 | $ | 17.5 | $ | 3.7 | |||||||
As of December 31, 2015, the Crestview Station Joint Venture has sold all of its properties except for one commercial site. We account for our 50 percent interest in the Crestview Station Joint Venture under the equity method. See Note 6 for further discussion of Crestview Station.
25
RESULTS OF OPERATIONS
We are continually evaluating the development and sale potential of our properties and will continue to consider opportunities to enter into transactions involving our properties. As a result, and because of numerous other factors affecting our business activities as described herein, our past operating results are not necessarily indicative of our future results.
The following table summarizes our operating results for the years ended December 31 (in thousands):
2015 | 2014 | 2013 | |||||||||
Operating income (loss): | |||||||||||
Hotel | $ | 4,352 | $ | 5,854 | $ | 3,706 | |||||
Entertainment | 2,829 | 2,937 | 1,119 | ||||||||
Real estate operations | (2,278 | ) | 1,186 | 9,000 | |||||||
Commercial leasing | 20,731 | a | 238 | 277 | |||||||
Eliminations and other | 98 | 149 | 49 | ||||||||
Operating income | $ | 25,732 | $ | 10,364 | $ | 14,151 | |||||
Interest expense, net | $ | (4,065 | ) | $ | (3,751 | ) | $ | (7,093 | ) | ||
Income from discontinued operations, net of taxes | $ | 3,218 | $ | — | $ | — | |||||
Net income | $ | 17,595 | $ | 18,157 | $ | 5,894 | |||||
Net income attributable to noncontrolling interests in subsidiaries | $ | (5,418 | ) | $ | (4,754 | ) | $ | (3,309 | ) | ||
Net income attributable to common stock | $ | 12,177 | $ | 13,403 | $ | 2,585 | |||||
a. | Includes a gain of $20.7 million on the sales of our Parkside Village and 5700 Slaughter commercial developments. |
We have four operating segments: Hotel, Entertainment, Real Estate Operations and Commercial Leasing (see Note 11). The following is a discussion of our operating results by segment.
Hotel
The following table summarizes our Hotel operating results for the years ended December 31 (in thousands):
2015 | 2014 | 2013 | |||||||||
Hotel revenue | $ | 41,651 | $ | 42,860 | $ | 39,544 | |||||
Hotel cost of sales, excluding depreciation | 30,789 | 30,753 | 29,483 | ||||||||
Depreciation | 5,797 | 5,851 | 6,033 | ||||||||
General and administrative expenses | 713 | 402 | 322 | ||||||||
Operating income | $ | 4,352 | $ | 5,854 | $ | 3,706 | |||||
Hotel Revenue. Hotel revenue primarily includes revenue from W Austin Hotel room reservations and food and beverage sales. Revenue per available room (REVPAR), which is calculated by dividing total room revenue by the average total rooms available during the year, was $279 in 2015, compared with $291 in 2014 and $260 in 2013. Lower hotel revenues in 2015, compared with 2014, primarily reflects decreased room revenue and food and beverage sales. Hotel revenues increased in 2014, compared with 2013, primarily as a result of higher room rates and increased food and beverage sales.
Hotel Cost of Sales. Hotel operating costs totaled $30.8 million in each of 2015 and 2014 and $29.5 million in 2013. Higher costs in 2015 and 2014, compared with 2013, primarily reflects increased variable costs, including labor and marketing.
General and Administrative Expenses. Consolidated general and administrative expenses primarily consist of employee salaries, wages and other costs and totaled $8.1 million in 2015, compared with $7.9 million in 2014 and $7.1 million in 2013. Higher 2015 costs, compared with 2014, primarily reflect higher legal fees associated with debt modifications, the purchase of Canyon-Johnson's interest in the Block 21 Joint Venture and the sales of 5700 Slaughter and Parkside Village. The increase in general and administrative expenses for 2014, compared with 2013, primarily reflects increased employee costs and consulting fees.
We allocate parent company general and administrative expenses that do not directly relate to a particular operating segment between the Real Estate Operations and Commercial Leasing segments based on projected annual revenues for each segment. General and administrative expenses related to the W Austin Hotel &
26
Residences are allocated to the Hotel, Entertainment, Real Estate Operations and Commercial Leasing segments based on the respective projected annual revenues for the W Austin Hotel & Residences. For information about the allocation of general and administrative expenses to our operating segments, see Note 11.
Entertainment
The following table summarizes our Entertainment operating results for the years ended December 31 (in thousands):
2015 | 2014 | 2013 | |||||||||
Entertainment revenue | $ | 19,800 | $ | 19,108 | $ | 15,559 | |||||
Entertainment cost of sales, excluding depreciation | 15,426 | 14,763 | 13,076 | ||||||||
Depreciation | 1,288 | 1,260 | 1,239 | ||||||||
General and administrative expenses | 257 | 148 | 125 | ||||||||
Operating income | $ | 2,829 | $ | 2,937 | $ | 1,119 | |||||
Entertainment Revenue. Entertainment revenue primarily reflects the results of operations for ACL Live, including ticket sales, revenue from private events, sponsorships, personal seat license sales and suite sales, and sales of concessions and merchandise. Entertainment revenue also reflects revenues associated with outside events hosted at venues other than ACL Live and production of recorded content for artists performing at ACL Live, as well as the results of the joint venture with Pedernales Entertainment LLC relating to Stageside Productions. Revenues from the Entertainment segment will vary from period to period as a result of factors such as the price of tickets and number of tickets sold, as well as the number and type of events. Entertainment revenue increased in 2015, compared with 2014, primarily as a result of an increase in ticket sales and higher ancillary revenue per attendee. Entertainment revenue increased in 2014, compared with 2013, primarily reflecting higher private event revenue and higher ancillary revenue per attendee.
Certain key operating statistics specific to the concert and event hosting industry are included below to provide additional information regarding our ACL Live operating performance, for the years ended December 31.
2015 | 2014 | 2013 | |||||||||
Events: | |||||||||||
Events hosted | 210 | 207 | 186 | ||||||||
Estimated attendance | 245,000 | 231,200 | 217,100 | ||||||||
Ancillary net revenue per attendee | $ | 44.89 | $ | 41.91 | $ | 35.31 | |||||
Ticketing: | |||||||||||
Number of tickets sold | 168,506 | 166,603 | 148,400 | ||||||||
Gross value of tickets sold (in thousands) | $ | 11,191 | $ | 10,270 | $ | 9,397 | |||||
Entertainment Cost of Sales. Entertainment operating costs totaled $15.4 million in 2015, compared with $14.8 million in 2014 and $13.1 million in 2013. Entertainment costs increased in 2015 and 2014, compared with 2014 and 2013, respectively, primarily reflecting higher costs associated with increases in the number of events hosted.
Real Estate Operations
The following table summarizes our Real Estate Operations operating results for the years ended December 31 (in thousands):
2015 | 2014 | 2013 | |||||||||
Revenues: | |||||||||||
Developed property sales | $ | 12,320 | $ | 25,674 | $ | 63,676 | |||||
Undeveloped property sales | 1,175 | — | 3,266 | ||||||||
Commissions and other | 848 | 507 | 719 | ||||||||
Total revenues | 14,343 | 26,181 | 67,661 | ||||||||
Cost of sales, including depreciation | 10,672 | 20,972 | 54,422 | ||||||||
Litigation and insurance settlements | — | (2,082 | ) | (1,785 | ) | ||||||
General and administrative expenses | 5,949 | 6,105 | 6,024 | ||||||||
Operating (loss) income | $ | (2,278 | ) | $ | 1,186 | $ | 9,000 | ||||
27
Developed Property Sales. The following table summarizes our developed property sales for the years ended December 31 (in thousands):
2015 | 2014 | 2013 | ||||||||||||||||||||||||||||||
Lots/Units | Revenues | Average Cost per Lot/Unit | Lots/Units | Revenues | Average Cost per Lot/Unit | Lots/Units | Revenues | Average Cost per Lot/Unit | ||||||||||||||||||||||||
Barton Creek | ||||||||||||||||||||||||||||||||
Calera: | ||||||||||||||||||||||||||||||||
Verano Drive | — | $ | — | $ | — | 9 | $ | 3,523 | $ | 181 | 39 | $ | 12,143 | $ | 163 | |||||||||||||||||
Calera Drive | — | — | — | — | — | — | 6 | 1,371 | 142 | |||||||||||||||||||||||
Amarra Drive: | ||||||||||||||||||||||||||||||||
Phase I lots | — | — | — | — | — | — | 2 | 650 | 279 | |||||||||||||||||||||||
Phase II lots | — | — | — | 16 | 8,216 | 194 | 3 | 1,525 | 217 | |||||||||||||||||||||||
Phase III lots | 10 | 6,955 | 334 | — | — | — | — | — | — | |||||||||||||||||||||||
Mirador Estate | — | — | — | — | — | — | 1 | 405 | 264 | |||||||||||||||||||||||
Circle C | ||||||||||||||||||||||||||||||||
Meridian | 19 | 5,365 | 160 | 7 | 2,007 | 160 | — | — | — | |||||||||||||||||||||||
W Austin Hotel & Residences: | ||||||||||||||||||||||||||||||||
Condominium units | — | — | — | 7 | 11,928 | 1,517 | 32 | 47,582 | 1,251 | |||||||||||||||||||||||
Total Residential | 29 | $ | 12,320 | 39 | $ | 25,674 | 83 | $ | 63,676 | |||||||||||||||||||||||
The decreases in developed property sales and revenues in 2015, compared with 2014, and 2014 compared with 2013, primarily resulted from fewer sales of condominium units at the W Austin Residences and fewer lot sales at Verano Drive as inventories have declined, partly offset by increased lot sales at Meridian and at Amarra Drive Phase III, which was completed in first-quarter 2015.
Undeveloped Property Sales. During October 2015, we sold a nine-acre tract of land in Austin, Texas, with entitlements for approximately 20,000 square feet of commercial space for $1.2 million. During March 2013, we sold a 16-acre tract of land with entitlements for approximately 70,000 square feet of office space in Lantana for $2.1 million, and entitlements for 20,000 square feet of office space in Circle C for $1.2 million.
Commissions and Other. Commissions and other primarily include design fees and sales of our development fee credits to third parties, and totaled $0.8 million in 2015, $0.5 million in 2014 and $0.7 million in 2013. We received the development fee credits as part of the Circle C settlement (see Note 10).
Cost of Sales. Cost of sales includes cost of property sold, project operating and marketing expenses and allocated overhead costs, partly offset by reductions for certain municipal utility district (MUD) reimbursements. Cost of sales totaled $10.7 million in 2015, $21.0 million in 2014 and $54.4 million in 2013. The decrease in cost of sales over the past three years primarily reflects lower sales of condominium units that have higher average costs.
Cost of sales for our real estate operations also includes significant recurring costs (including property taxes, maintenance and marketing), which totaled $3.5 million in 2015 and 2014, and $5.4 million in 2013. The decrease in these recurring costs for 2015 and 2014 primarily reflects lower property taxes as a result of lower condominium unit inventory at the W Austin Residences. Cost of sales for 2015 included Barton Creek MUD reimbursements totaling less than $0.1 million. We received no MUD reimbursements credited to cost of sales in 2014 or 2013. Cost of sales also included credits of $0.4 million in 2014 and $1.1 million in 2013 related to the recovery of building repair costs associated with damage caused by the June 2011 balcony glass breakage incidents at the W Austin Hotel & Residences.
Litigation and Insurance Settlements. We recorded a gain on a litigation settlement totaling $1.5 million in 2014 related to the termination of a lease. We also recorded gains of $0.6 million in 2014 and $1.8 million in 2013 related to insurance settlements.
28
Commercial Leasing
The following table summarizes our Commercial Leasing operating results for the years ended December 31 (in thousands):
2015a | 2014 | 2013 | |||||||||
Rental revenue | $ | 6,179 | $ | 7,128 | $ | 5,923 | |||||
Rental cost of sales, excluding depreciation | 2,838 | 3,236 | b | 2,755 | |||||||
Depreciation | 1,556 | 1,785 | 1,687 | ||||||||
General and administrative expenses | 1,783 | 1,869 | 1,204 | ||||||||
Gain on sales of assets | (20,729 | ) | — | — | |||||||
Operating income | $ | 20,731 | $ | 238 | $ | 277 | |||||
a. | Includes the results of the Parkside Village and 5700 Slaughter commercial properties through July 2, 2015 (see Note 12). |
b. | Includes $0.3 million of lease termination charges. |
Rental Revenue. Rental revenue primarily reflects revenue from the office and retail space at the W Austin Hotel & Residences, Barton Creek Village, and Parkside Village and 5700 Slaughter, which are both in the Circle C community. The decrease in rental revenue in 2015, compared with 2014, primarily reflects the impact of the sales of Parkside Village and 5700 Slaughter, which we completed on July 2, 2015. The increase in rental revenue in 2014, compared with 2013, primarily reflects increased occupancy at the W Austin Hotel & Residences office and retail space.
Rental Cost of Sales. Rental operating costs totaled $2.8 million in 2015, compared with $3.2 million in 2014 and $2.8 million in 2013. The decrease in rental costs in 2015, compared with 2014, primarily reflects the sales of Parkside Village and 5700 Slaughter. Rental costs increased in 2014, compared with 2013, primarily reflecting higher operating costs from the increased occupancy at the W Austin Hotel & Residences office and retail space.
Gain on Sales of Assets. During 2015, Stratus recorded a $13.6 million gain on the sale of Parkside Village and a $7.1 million gain on the sale of 5700 Slaughter.
Non-Operating Results
Interest Expense, Net. Interest expense (before capitalized interest) totaled $9.5 million in 2015, $7.9 million in 2014 and $10.7 million in 2013. The increase in interest expense in 2015, compared with 2014, primarily reflects higher average debt balances. The decrease in interest expense in 2014, compared with 2013, primarily reflects lower average interest rates following refinancing transactions.
Capitalized interest totaled $5.5 million in 2015, $4.1 million in 2014 and $3.6 million in 2013 and is primarily related to development activities at certain properties in Barton Creek and The Oaks at Lakeway.
Loss on Interest Rate Derivative Instruments. We recorded a loss of $0.7 million in 2015 associated with changes in the fair value of our interest rate cap agreement and the recognition of cumulative changes in the fair value of our interest rate swap agreement because it no longer qualified for hedge accounting treatment. We recorded a loss of $0.3 million in 2014 and $0.1 million in 2013, each associated with changes in the fair value of our interest rate cap agreement. See Note 5 for further discussion.
Loss on Early Extinguishment of Debt. We recorded losses on early extinguishment of debt of less than $0.1 million in 2014 associated with the refinancing of the term loan secured by 5700 Slaughter in July 2014 and $1.4 million in 2013 associated with the prepayment of the loan related to the W Austin Hotel & Residences. See Note 7 for further discussion.
Other Income, Net. We recorded other income of $0.3 million in 2015, less than $0.1 million in 2014 and $1.4 million in 2013. Other income in 2013 included interest received in connection with a Barton Creek MUD reimbursement and a gain on the recovery of land previously sold.
Equity in Unconsolidated Affiliates' (Loss) Income. We account for our interests in our unconsolidated affiliates, Crestview Station, Stump Fluff and Guapo Enterprises, using the equity method. Our equity in the net (loss) income of these entities totaled $(1.3) million in 2015, $1.1 million in 2014 and $(0.1) million in 2013. The loss in 2015 primarily reflects operating losses at Stump Fluff and Guapo. The income in 2014 reflects the third closing in the
29
take-down agreement between Crestview Station and DR Horton and income from events hosted by Stump Fluff during the South by Southwest festival, both of which occurred during 2014. See Note 6 for further discussion.
(Provision for) benefit from Income Taxes. We recorded a (provision for) benefit from income taxes of $(5.6) million in 2015, $10.7 million in 2014 and $(0.9) million in 2013. Our taxes also include the Texas state margin tax. The difference between our consolidated effective income tax rate for 2015 and the U.S. federal statutory income tax rate of 35 percent was primarily attributable to state income taxes partially offset by the tax effect of income attributable to non-controlling interests. The difference between our consolidated effective income tax rate for 2014 and the U.S. federal statutory income tax rate of 35 percent was primarily attributable to the reversal of the valuation allowance on our deferred tax assets. The difference between our consolidated effective income tax rate for 2013 and the U.S. federal statutory income tax rate of 35 percent was primarily attributable to the realization of deferred tax assets (see Note 8 for further discussion).
Net Income Attributable to Noncontrolling Interests in Subsidiaries. Net income attributable to noncontrolling interests in subsidiaries totaled $5.4 million in 2015, $4.8 million in 2014 and $3.3 million in 2013. The increase in 2015, compared with 2014, primarily relates to the gain on the sale of Parkside Village. The increase in 2014, compared with 2013, primarily relates to income from the W Austin Hotel & Residences.
DISCONTINUED OPERATIONS
In 2012, we sold 7500 Rialto, an office building in Lantana. In connection with the sale, we recognized a gain of $5.1 million and deferred a gain of $5.0 million because of a guaranty provided to the lender in connection with the buyer's assumption of the loan related to 7500 Rialto. The guaranty was released in January 2015, and we recognized the deferred gain totaling $5.0 million ($3.2 million to net income attributable to common stock) in first-quarter 2015.
CAPITAL RESOURCES AND LIQUIDITY
Volatility in the real estate market, including the markets in which we operate, can impact sales of our properties from period to period. However, we believe that the unique nature and location of our assets will provide us positive cash flows over time. See "Business Strategy and Related Risks" for further discussion of our liquidity.
Comparison of Year-to-Year Cash Flows
Operating Activities. Cash (used in) provided by operating activities totaled $(1.8) million in 2015, $(21.6) million in 2014 and $55.9 million in 2013. Expenditures for purchases and development of real estate properties included in operating activities totaled $26.2 million in 2015, $54.9 million in 2014 and $16.6 million in 2013 and primarily included development costs for our Barton Creek properties, The Oaks at Lakeway and the West Killeen Market project.
Operating cash flows for 2015, compared with 2014, increased by $19.8 million, primarily as a result of lower expenditures for purchases and development of real estate properties as discussed above. Operating cash flows for 2014, compared with 2013, decreased by $77.5 million primarily as a result of fewer developed property sales, principally resulting from decreases in condominium unit sales at the W Austin Residences and lot sales at Verano Drive as inventories have declined. Additionally, expenditures for purchases and development of real estate properties increased during 2014, compared with 2013, primarily reflecting increased development costs for The Oaks at Lakeway and our Barton Creek properties, and the purchase of land in Magnolia, Texas.
Investing Activities. Cash used in investing activities totaled $12.6 million in 2015, $2.7 million in 2014 and $3.5 million in 2013. Development of commercial leasing properties increased during 2015 to $54.0 million, compared with $6.0 million in 2014, primarily for the Oaks at Lakeway and Santal multi-family projects. The year 2015 also included $43.3 million in proceeds from the sales of the Parkside Village and 5700 Slaughter commercial properties.
Capital expenditures in 2014 totaled $6.8 million, primarily for The Oaks at Lakeway, compared with $2.4 million in 2013, primarily for the hotel and office portions of the W Austin Hotel & Residences and Parkside Village. During 2014, Stratus received distributions from Crestview Station totaling $4.7 million and during 2013 Stratus made capital contributions of $1.1 million to certain of its unconsolidated affiliates.
30
Financing Activities. Cash provided by financing activities totaled $1.8 million in 2015, compared with $32.6 million in 2014. During 2015, net borrowings on the Comerica credit facility totaled $10.1 million, compared with net payments of $23.1 million for 2014. Net borrowings on other project and term loans totaled $56.6 million for 2015, compared with $22.1 million for 2014. The increase in borrowings for 2015 primarily reflects the financing of our purchase of Canyon-Johnson’s approximate 58 percent interest in the Block 21 Joint Venture for approximately $62 million (see Note 7). Noncontrolling interest distributions for the Parkside Village Joint Venture and the Block 21 Joint Venture totaled $4.2 million for 2015, compared with $11.6 million for 2014.
Cash provided by (used in) financing activities totaled $32.6 million in 2014, compared with $(43.9) million in 2013. During 2014, net borrowings on the Comerica credit facility totaled $23.1 million, compared with net payments of $26.6 million for 2013. Net borrowings on the BoA loan, the Lakeway Construction loan, the Barton Creek Village term loan and other project and term loans totaled $22.1 million for 2014, compared with net borrowings of $40.2 million for 2013. Noncontrolling interest distributions for the Block 21 Joint Venture and the Parkside Village Joint Venture totaled $11.6 million for 2014, compared with distributions primarily for the Block 21 Joint Venture of $54.7 million for 2013.
For a description of our outstanding debt, see Note 7. See also “Credit Facility and Other Financing Arrangements” for a discussion of our outstanding debt at December 31, 2015.
In November 2013, our board of directors approved an increase in the open market share purchase program from 0.7 million shares to 1.7 million shares of our common stock. There were no purchases under this program during 2015. As of December 31, 2015, a total of 991,695 shares of our common stock remain available under this program. There have not been any additional purchases through February 29, 2016. Our loan agreements with Comerica Bank and Diversified Real Asset Income Fund (DRAIF) require lender approval of any stock repurchases.
Credit Facility and Other Financing Arrangements
At December 31, 2015, we had total debt of $263.1 million, compared with $196.5 million at December 31, 2014. The increase in debt since year-end 2014 is primarily related to increased borrowings under our Comerica revolving credit facility to fund the purchase of Canyon-Johnson's interest in the Block 21 Joint Venture and the construction loan agreement with PlainsCapital Bank to fund the construction, development and leasing of The Oaks at Lakeway (the Lakeway Construction loan). Our debt outstanding at December 31, 2015, consisted of the following:
• | $129.5 million outstanding under the BoA loan related to the W Austin Hotel & Residences. |
• | $53.1 million outstanding under the $72.5 million Comerica credit facility, which is comprised of a $45.0 million revolving loan, $11.9 million of which was available at December 31, 2015; a $7.5 million letters of credit tranche, with $2.3 million of letters of credit committed and $5.2 million available at December 31, 2015; and a $20.0 million construction loan, none of which was available at December 31, 2015. The Comerica credit facility is secured by substantially all of our assets except for properties that are encumbered by separate loan financing. |
• | $46.7 million outstanding under the construction loan agreement to fund the construction, development and leasing of The Oaks at Lakeway in Lakeway, Texas (the Lakeway Construction loan). |
• | $16.2 million outstanding under the construction loan agreement to fund the development and construction of the first phase of a multi-family development in Section N of Barton Creek (the Santal Construction loan). |
• | $8.0 million outstanding under one unsecured term loan with DRAIF, formerly American Strategic Income Portfolio or ASIP. |
• | $5.8 million outstanding under the term loan agreement with PlainsCapital Bank secured by assets at Barton Creek Village (the Barton Creek Village term loan). |
• | $3.8 million outstanding under the term loan agreement with Holliday Fenoglio Fowler, L.P., the proceeds of which were used to purchase approximately 142 acres of land in Magnolia, Texas (the Magnolia loan). |
31
In January 2016 we completed the refinancing of the W Austin Hotel & Residences. In connection with the refinancing we borrowed $150.0 million and fully repaid our existing obligations under the BoA loan and the $20.0 million Comerica construction loan. See Note 13 for more information.
Several of our financing instruments contain customary financial covenants. The Comerica credit facility and our DRAIF unsecured term loan include a requirement that we maintain a minimum total stockholders’ equity balance of $110.0 million. As of December 31, 2015, Stratus' total stockholders' equity was $136.6 million. See Note 7 for further discussion of our outstanding debt.
DEBT MATURITIES AND OTHER CONTRACTUAL OBLIGATIONS
The following table summarizes our contractual cash obligations as of December 31, 2015 (in thousands):
Total | 2016 | 2017 - 2018 | 2019 - 2020 | Thereafter | ||||||||||||||||
Debt maturitiesa | $ | 263,114 | $ | 28,838 | $ | 60,461 | b | $ | 168,823 | b | $ | 4,992 | ||||||||
Scheduled interest payment obligationsc | 37,531 | 17,201 | 12,094 | 7,407 | 829 | |||||||||||||||
Construction contracts | 14,123 | 14,123 | — | — | — | |||||||||||||||
Operating lease obligations | 282 | 123 | 138 | 21 | — | |||||||||||||||
Total | $ | 315,050 | $ | 60,285 | $ | 72,693 | $ | 176,251 | $ | 5,821 | ||||||||||
a. | Debt maturities represent scheduled maturities based on outstanding debt balances at December 31, 2015. |
b. | In January 2016, the proceeds from the $150.0 million term loan from Goldman Sachs were used to fully repay our existing obligations under the BoA loan, which was scheduled to mature in 2020, and the $20.0 million Comerica term loan which was scheduled to mature $15.0 million in 2017 and $5.0 million in 2020. Refer to Note 13 for information regarding revised maturities associated with refinancing transactions subsequent to December 31, 2015. |
c. | Scheduled interest payments were calculated using stated coupon rates for fixed-rate debt and interest rates applicable at December 31, 2015, for variable-rate debt. |
We had commitments under noncancelable contracts totaling $14.1 million at December 31, 2015. These commitments primarily included contracts for construction of improvements for the Santal multi-family project at Barton Creek.
We also had guarantees related to the W Austin Hotel & Residences at December 31, 2015 (see Note 7).
DISCLOSURES ABOUT MARKET RISKS
We derive our revenues from the acquisition, entitlement, development, management, operation and sale of our commercial, hotel, entertainment, and multi- and single-family residential real estate properties. Our results of operations can vary significantly with fluctuations in the market prices of real estate, which are influenced by numerous factors, including interest rate levels. Changes in interest rates also affect interest expense on our debt.
At December 31, 2015, we had an interest rate cap agreement, which capped the one-month London Interbank Offered Rate (LIBOR), the variable rate in the BoA loan, at 1 percent for the first year the BoA loan was outstanding, 1.5 percent for the second year and 2 percent for the third year. We use an interest rate pricing model that relies on market observable inputs such as LIBOR to measure the fair value of the interest rate cap agreement. We recognized losses totaling $0.1 million in 2015, $0.3 million in 2014 and $0.1 million in 2013 associated with this interest rate cap agreement. See Note 7 for further discussion of the BoA loan and Note 13 for discussion of refinancing transactions subsequent to December 31, 2015.
We also have an interest rate swap agreement with Comerica Bank that was previously designated as a cash flow hedge with changes in fair value recorded in other comprehensive income. The instrument effectively converted the variable rate portion of Parkside Village's loan from Comerica Bank (the Parkside Village loan) from one-month LIBOR to a fixed rate of 2.3 percent. On July 2, 2015, we completed the sale of the Parkside Village property. In connection with the sale, we fully repaid the amount outstanding under the Parkside Village loan. We assumed the interest rate swap agreement and, as a result, the instrument no longer qualifies for hedge accounting. Accordingly, the liability balance of $0.6 million on July 2, 2015, was reclassified to the statement of income as a loss on interest rate derivative instruments and future changes in the fair value of the instrument are being recorded in the statement of income, including a loss of $0.1 million in 2015.
32
At December 31, 2015, $245.6 million of our total outstanding debt of $263.1 million bears interest at variable rates. An increase of 100 basis points in annual interest rates for this variable-rate debt would increase our annual interest costs by $2.5 million.
NEW ACCOUNTING STANDARDS
In February 2016, a new accounting standard, Accounting Standards Codification Topic 842, “Leases,” was issued by the Financial Accounting Standards Board to increase the transparency and comparability among organizations by recognizing lease assets and lease liabilities on the balance sheet and disclosing key information about leasing arrangements. In order to meet this objective, the new standard requires recognition of the assets and liabilities relating to leases. Accordingly, a lessee will recognize a right-of-use (ROU) asset for its right to use the underlying asset and a lease liability for the corresponding lease obligation. Both the ROU asset and lease liability will initially be measured at the present value of the future minimum lease payments over the lease term. Subsequent measurement, including the presentation of expenses and cash flows, will depend on the classification of the lease as either a finance or an operating lease. Accounting by lessors will remain largely unchanged from current U.S. generally accepted accounting principles. In transition, lessees and lessors are required to recognize and measure leases at the beginning of the earliest period presented using a modified retrospective approach. The modified retrospective approach includes a number of optional practical expedients that companies may elect to apply. The new standard is effective for public companies for fiscal years beginning after December 15, 2018, and interim periods within those years, with early adoption permitted. We are currently evaluating the effect that adopting this standard will have on our financial statements and related disclosures.
OFF-BALANCE SHEET ARRANGEMENTS
Refer to Note 10 for discussion of our off-balance sheet arrangements.
33
CAUTIONARY STATEMENT
Management’s Discussion and Analysis of Financial Condition and Results of Operations contains forward-looking statements in which we discuss factors we believe may affect our future performance. Forward-looking statements are all statements other than statements of historical facts, such as statements regarding the implementation and potential results of our five-year plan, projections or expectations related to operational and financial performance or liquidity, reimbursements for infrastructure costs, financing and regulatory matters, development plans and sales of properties, commercial leasing activities, timeframes for development, construction and completion of our projects, capital expenditures, liquidity and capital resources, and other plans and objectives of management for future operations and activities. The words “anticipates,” “may,” “can,” “plans,” “believes,” “potential,” “estimates,” “expects,” “projects,” “intends,” “likely,” “will,” “should,” “to be” and any similar expressions and/or statements that are not historical facts are intended to identify those assertions as forward-looking statements.
We caution readers that forward-looking statements are not guarantees of future performance and actual results may differ materially from those anticipated, projected or assumed in the forward-looking statements. Important factors that can cause our actual results to differ materially from those anticipated in the forward-looking statements include, but are not limited to, our ability to refinance and service our debt and the availability of financing for development projects and other corporate purposes, our ability to sell properties at prices our board considers acceptable, a decrease in the demand for real estate in the Austin, Texas market, changes in economic and business conditions, reductions in discretionary spending by consumers and corporations, competition from other real estate developers, hotel operators and/or entertainment venue operators and promoters, business opportunities that may be presented to and/or pursued by us, the failure of third parties to satisfy debt service obligations, the failure to complete agreements with strategic partners and/or appropriately manage relationships with strategic partners, the termination of sales contracts or letters of intent due to, among other factors, the failure of one or more closing conditions or market changes, the failure to attract customers for our developments or such customers' failure to satisfy their purchase commitments, increases in interest rates, declines in the market value of our assets, increases in operating costs, including real estate taxes and the cost of construction materials, changes in external perception of the W Austin Hotel, changes in consumer preferences, changes in laws, regulations or the regulatory environment affecting the development of real estate, opposition from special interest groups with respect to development projects, weather-related risks and other factors described in more detail under the heading “Risk Factors” in Part I, Item 1A. of this Form 10-K, as updated by our subsequent filings with the U.S. Securities and Exchange Commission.
Investors are cautioned that many of the assumptions upon which our forward-looking statements are based are likely to change after the forward-looking statements are made. Further, we may make changes to our business plans that could affect our results. We caution investors that we do not intend to update our forward-looking statements notwithstanding any changes in our assumptions, business plans, actual experience, or other changes, and we undertake no obligation to update any forward-looking statements.
34
Item 8. Financial Statements and Supplementary Data
MANAGEMENT’S ANNUAL REPORT ON INTERNAL CONTROL OVER FINANCIAL REPORTING
Stratus Properties Inc.’s (the Company’s) management is responsible for establishing and maintaining adequate internal control over financial reporting for the Company. Internal control over financial reporting is defined in Rule 13a-15(f) or 15d-15(f) under the Securities Exchange Act of 1934 as a process designed by, or under the supervision of, the Company’s principal executive and principal financial officers and effected by the Company’s Board of Directors, management and other personnel, to provide reasonable assurance regarding the reliability of financial reporting and the preparation of financial statements for external purposes in accordance with generally accepted accounting principles and includes those policies and procedures that:
• | Pertain to the maintenance of records that in reasonable detail accurately and fairly reflect the transactions and dispositions of the Company’s assets; |
• | Provide reasonable assurance that transactions are recorded as necessary to permit preparation of financial statements in accordance with generally accepted accounting principles, and that receipts and expenditures of the Company are being made only in accordance with authorizations of management and directors of the Company; and |
• | Provide reasonable assurance regarding prevention or timely detection of unauthorized acquisition, use or disposition of the Company’s assets that could have a material effect on the Company's financial statements. |
Because of its inherent limitations, internal control over financial reporting may not prevent or detect misstatements. Projections of any evaluation of effectiveness to future periods are subject to the risk that controls may become inadequate because of changes in conditions, or that the degree of compliance with the policies or procedures may deteriorate.
The Company's management, including its principal executive officer and principal financial officer, assessed the effectiveness of its internal control over financial reporting as of the end of the fiscal year covered by this annual report on Form 10-K. In making this assessment, the Company's management used the criteria set forth in Internal Control-Integrated Framework issued by the Committee of Sponsoring Organizations of the Treadway Commission (2013 framework) (the COSO criteria). Based on management’s assessment, management concluded that, as of December 31, 2015, the Company’s internal control over financial reporting is effective based on the COSO criteria.
BKM Sowan Horan, LLP, an independent registered public accounting firm who audited the Company’s consolidated financial statements included in this Form 10-K, has issued an attestation report on the Company’s internal control over financial reporting, which is included herein.
/s/ William H. Armstrong III | /s/ Erin D. Pickens |
William H. Armstrong III | Erin D. Pickens |
Chairman of the Board, President | Senior Vice President |
and Chief Executive Officer | and Chief Financial Officer |
35
REPORT OF INDEPENDENT REGISTERED PUBLIC ACCOUNTING FIRM
The Board of Directors and Stockholders
Stratus Properties Inc.
We have audited Stratus Properties Inc.'s (the Company) internal control over financial reporting as of December 31, 2015, based on criteria established in Internal Control - Integrated Framework (2013) issued by the Committee of Sponsoring Organizations of the Treadway Commission (COSO criteria). Stratus Properties Inc.'s management is responsible for maintaining effective internal control over financial reporting and for its assessment of the effectiveness of internal control over financial reporting included in the accompanying Management's Report on Internal Control Over Financial Reporting. Our responsibility is to express an opinion on the Company's internal control over financial reporting based on our audit.
We conducted our audit in accordance with the standards of the Public Company Accounting Oversight Board (United States). Those standards require that we plan and perform the audit to obtain reasonable assurance about whether effective internal control over financial reporting was maintained in all material respects. Our audit of internal control over financial reporting included obtaining an understanding of internal control over financial reporting, assessing the risk that a material weakness exists, and testing and evaluating the design and operating effectiveness of internal control based on the assessed risk. Our audit also included performing such other procedures as we considered necessary in the circumstances. We believe that our audit provides a reasonable basis for our opinion.
A company's internal control over financial reporting is a process designed to provide reasonable assurance regarding the reliability of financial reporting and the preparation of financial statements for external purposes in accordance with generally accepted accounting principles. A company's internal control over financial reporting includes those policies and procedures that (1) pertain to the maintenance of records that, in reasonable detail, accurately and fairly reflect the transactions and dispositions of the Company; (2) provide reasonable assurance that transactions are recorded as necessary to permit preparation of financial statements in accordance with generally accepted accounting principles, and that receipts and expenditures of the Company are being made only in accordance with authorizations of management and directors of the Company; and (3) provide reasonable assurance regarding prevention or timely detection of unauthorized acquisition, use, or disposition of the Company's assets that could have a material effect on the financial statements.
Because of its inherent limitations, internal control over financial reporting may not prevent or detect misstatements. Also, projections of any evaluation of effectiveness to future periods are subject to the risk that controls may become inadequate because of changes in conditions, or that the degree of compliance with the policies or procedures may deteriorate.
In our opinion, Stratus Properties Inc. maintained, in all material respects, effective internal control over financial reporting as of December 31, 2015, based on the COSO criteria.
We have also audited, in accordance with the standards of the Public Company Accounting Oversight Board (United States), the consolidated balance sheets of Stratus Properties Inc. and subsidiaries as of December 31, 2015 and 2014, and the related consolidated statements of income, comprehensive income, equity and cash flows for each of the years in the three-year period ended December 31, 2015, and our report dated March 15, 2016, expressed an unqualified opinion on these consolidated financial statements.
/s/ BKM Sowan Horan, LLP
Austin, Texas
March 15, 2016
36
REPORT OF INDEPENDENT REGISTERED PUBLIC ACCOUNTING FIRM
The Board of Directors and Stockholders
Stratus Properties Inc.
We have audited the accompanying consolidated balance sheets of Stratus Properties Inc. and subsidiaries (the Company) as of December 31, 2015, and 2014 and the related consolidated statements of income, comprehensive income, equity and cash flows for each of the years in the three-year period ended December 31, 2015. Our audit also includes the financial statement schedule listed in the accompanying index. Stratus Properties Inc.'s management is responsible for these financial statements and the schedule. Our responsibility is to express an opinion on these consolidated financial statements and schedule based on our audits.
We conducted our audits in accordance with the standards of the Public Company Accounting Oversight Board (United States). Those standards require that we plan and perform the audit to obtain reasonable assurance about whether the financial statements are free of material misstatement. An audit includes examining, on a test basis, evidence supporting the amounts and disclosures in the financial statements. An audit also includes assessing the accounting principles used and significant estimates made by management, as well as evaluating the overall financial statement presentation. We believe that our audits provide a reasonable basis for our opinion.
In our opinion, the consolidated financial statements referred to above present fairly, in all material respects, the financial position of Stratus Properties Inc. as of December 31, 2015, and 2014, and the results of their operations and their cash flows for each of the years in the three-year period ended December 31, 2015 in conformity with U.S. generally accepted accounting principles. Also, in our opinion, the related financial statement schedule, when considered in relation to the basic financial statements taken as a whole, presents fairly, in all material respects, the information set forth therein.
We also have audited, in accordance with the standards of the Public Company Accounting Oversight Board (United States), Stratus Properties Inc.'s internal control over financial reporting as of December 31, 2015, based on criteria established in Internal Control - Integrated Framework (2013) issued by the Committee of Sponsoring Organizations of the Treadway Commission (COSO), and our report dated March 15, 2016 expressed an unqualified opinion on the effectiveness of the Company's internal control over financial reporting.
/s/ BKM Sowan Horan, LLP
Austin, Texas
March 15, 2016
37
STRATUS PROPERTIES INC.
CONSOLIDATED BALANCE SHEETS
(In Thousands, Except Par Value)
December 31, | |||||||
2015 | 2014 | ||||||
ASSETS | |||||||
Cash and cash equivalents | $ | 17,036 | $ | 29,645 | |||
Restricted cash | 8,731 | 7,615 | |||||
Real estate held for sale | 25,944 | 12,245 | |||||
Real estate under development | 139,171 | 123,921 | |||||
Land available for development | 23,397 | 21,368 | |||||
Real estate held for investment, net | 186,626 | 178,065 | |||||
Deferred tax assets | 15,329 | 11,759 | |||||
Other assets | 16,393 | 18,069 | |||||
Total assets | $ | 432,627 | $ | 402,687 | |||
LIABILITIES AND EQUITY | |||||||
Liabilities: | |||||||
Accounts payable | $ | 14,182 | $ | 8,076 | |||
Accrued liabilities | 10,356 | 9,670 | |||||
Debt | 263,114 | 196,477 | |||||
Other liabilities and deferred gain | 8,301 | 13,378 | |||||
Total liabilities | 295,953 | 227,601 | |||||
Commitments and contingencies (Notes 7,10 and 12) | |||||||
Equity: | |||||||
Stratus stockholders’ equity: | |||||||
Common stock, par value of $0.01 per share, 150,000 shares authorized, | |||||||
9,160 and 9,116 shares issued, respectively and | |||||||
8,067 and 8,035 shares outstanding, respectively | 91 | 91 | |||||
Capital in excess of par value of common stock | 192,122 | 204,269 | |||||
Accumulated deficit | (35,144 | ) | (47,321 | ) | |||
Accumulated other comprehensive loss | — | (279 | ) | ||||
Common stock held in treasury, 1,093 shares and 1,081 shares | |||||||
at cost, respectively | (20,470 | ) | (20,317 | ) | |||
Total stockholders’ equity | 136,599 | 136,443 | |||||
Noncontrolling interests in subsidiaries | 75 | 38,643 | |||||
Total equity | 136,674 | 175,086 | |||||
Total liabilities and equity | $ | 432,627 | $ | 402,687 | |||
The accompanying Notes to Consolidated Financial Statements are an integral part of these consolidated financial statements.
38
STRATUS PROPERTIES INC.
CONSOLIDATED STATEMENTS OF INCOME
(In Thousands, Except Per Share Amounts)
Years Ended December 31, | |||||||||||
2015 | 2014 | 2013 | |||||||||
Revenues: | |||||||||||
Hotel | $ | 41,346 | $ | 42,354 | $ | 39,234 | |||||
Entertainment | 19,607 | 19,048 | 15,481 | ||||||||
Real estate operations | 14,277 | 26,084 | 67,589 | ||||||||
Commercial leasing | 5,641 | 6,625 | 5,406 | ||||||||
Total revenues | 80,871 | 94,111 | 127,710 | ||||||||
Cost of sales: | |||||||||||
Hotel | 30,702 | 30,746 | 29,483 | ||||||||
Entertainment | 15,169 | 14,431 | 12,922 | ||||||||
Real estate operations | 10,425 | 20,650 | 54,129 | ||||||||
Commercial leasing | 2,772 | 3,138 | 2,670 | ||||||||
Depreciation | 8,743 | 8,977 | 9,053 | ||||||||
Total cost of sales | 67,811 | 77,942 | 108,257 | ||||||||
General and administrative expenses | 8,057 | 7,887 | 7,087 | ||||||||
Gain on sales of assets | (20,729 | ) | — | — | |||||||
Litigation and insurance settlements | — | (2,082 | ) | (1,785 | ) | ||||||
Total costs and expenses | 55,139 | 83,747 | 113,559 | ||||||||
Operating income | 25,732 | 10,364 | 14,151 | ||||||||
Interest expense, net | (4,065 | ) | (3,751 | ) | (7,093 | ) | |||||
Loss on interest rate derivative instruments | (724 | ) | (272 | ) | (136 | ) | |||||
Loss on early extinguishment of debt | — | (19 | ) | (1,379 | ) | ||||||
Other income, net | 309 | 29 | 1,356 | ||||||||
Income before income taxes and equity in unconsolidated affiliates' (loss) income | 21,252 | 6,351 | 6,899 | ||||||||
Equity in unconsolidated affiliates' (loss) income | (1,299 | ) | 1,112 | (76 | ) | ||||||
(Provision for) benefit from income taxes | (5,576 | ) | 10,694 | (929 | ) | ||||||
Income from continuing operations | 14,377 | 18,157 | 5,894 | ||||||||
Income from discontinued operations, net of taxes | 3,218 | — | — | ||||||||
Net income | 17,595 | 18,157 | 5,894 | ||||||||
Net income attributable to noncontrolling interests in subsidiaries | (5,418 | ) | (4,754 | ) | (3,309 | ) | |||||
Net income attributable to common stockholders | $ | 12,177 | $ | 13,403 | $ | 2,585 | |||||
Basic net income per share attributable to common stockholders: | |||||||||||
Continuing operations | $ | 1.11 | $ | 1.67 | $ | 0.32 | |||||
Discontinued operations | 0.40 | — | — | ||||||||
Basic net income per share attributable to common stockholders | $ | 1.51 | $ | 1.67 | $ | 0.32 | |||||
Diluted net income per share attributable to common stockholders: | |||||||||||
Continuing operations | $ | 1.11 | $ | 1.66 | $ | 0.32 | |||||
Discontinued operations | 0.40 | — | — | ||||||||
Diluted net income per share attributable to common stockholders | $ | 1.51 | $ | 1.66 | $ | 0.32 | |||||
Weighted-average shares of common stock outstanding: | |||||||||||
Basic | 8,058 | 8,037 | 8,077 | ||||||||
Diluted | 8,091 | 8,078 | 8,111 | ||||||||
The accompanying Notes to Consolidated Financial Statements are an integral part of these consolidated financial statements.
39
STRATUS PROPERTIES INC.
CONSOLIDATED STATEMENTS OF COMPREHENSIVE INCOME
(In Thousands)
Years Ended December 31, | |||||||||||
2015 | 2014 | 2013 | |||||||||
Net income | $ | 17,595 | $ | 18,157 | $ | 5,894 | |||||
Other comprehensive income (loss), net of taxes: | |||||||||||
Income (loss) on interest rate swap agreement | 458 | (427 | ) | (32 | ) | ||||||
Other comprehensive income (loss) | 458 | (427 | ) | (32 | ) | ||||||
Total comprehensive income | 18,053 | 17,730 | 5,862 | ||||||||
Total comprehensive income attributable to noncontrolling interests | (5,597 | ) | (4,584 | ) | (3,299 | ) | |||||
Total comprehensive income attributable to common stock | $ | 12,456 | $ | 13,146 | $ | 2,563 | |||||
The accompanying Notes to Consolidated Financial Statements are an integral part of these consolidated financial statements.
40
STRATUS PROPERTIES INC.
CONSOLIDATED STATEMENTS OF CASH FLOWS
(In Thousands)
Years Ended December 31, | ||||||||||||
2015 | 2014 | 2013 | ||||||||||
Cash flow from operating activities: | ||||||||||||
Net income | $ | 17,595 | $ | 18,157 | $ | 5,894 | ||||||
Adjustments to reconcile net income to net cash (used in) provided by | ||||||||||||
operating activities: | ||||||||||||
Depreciation | 8,743 | 8,977 | 9,053 | |||||||||
Cost of real estate sold | 6,465 | 15,725 | 42,944 | |||||||||
Deferred gain on sale of 7500 Rialto, net of tax | (3,218 | ) | — | — | ||||||||
Gain on sales of assets | (20,729 | ) | — | — | ||||||||
Loss on interest rate derivative contracts | 724 | 272 | 136 | |||||||||
Loss on early extinguishment of debt | — | 19 | 1,379 | |||||||||
Stock-based compensation | 528 | 480 | 338 | |||||||||
Equity in unconsolidated affiliates' loss (income) | 1,299 | (1,112 | ) | 76 | ||||||||
Return on investment in unconsolidated affiliate | — | 675 | — | |||||||||
Deposits | 450 | (425 | ) | — | ||||||||
Deferred income taxes | 2,118 | (11,358 | ) | 30 | ||||||||
Purchases and development of real estate properties | (26,237 | ) | (54,928 | ) | (16,595 | ) | ||||||
Recovery of land previously sold | — | — | (485 | ) | ||||||||
Municipal utility districts reimbursements | 5,307 | — | 208 | |||||||||
(Increase) decrease in other assets | (2,075 | ) | (2,433 | ) | 11,100 | |||||||
Increase in accounts payable, accrued liabilities and other | 7,240 | 4,389 | 1,863 | |||||||||
Net cash (used in) provided by operating activities | (1,790 | ) | (21,562 | ) | 55,941 | |||||||
Cash flow from investing activities: | ||||||||||||
Capital expenditures | (55,178 | ) | (6,804 | ) | (2,386 | ) | ||||||
Net proceeds from sales of assets | 43,266 | — | — | |||||||||
Investment in unconsolidated affiliates | (678 | ) | 4,069 | (1,100 | ) | |||||||
Net cash used in investing activities | (12,590 | ) | (2,735 | ) | (3,486 | ) | ||||||
Cash flow from financing activities: | ||||||||||||
Borrowings from credit facility | 42,326 | 36,000 | 18,000 | |||||||||
Payments on credit facility | (32,263 | ) | (12,915 | ) | (44,612 | ) | ||||||
Borrowings from project loans | 99,670 | 34,588 | 109,042 | |||||||||
Payments on project and term loans | (43,096 | ) | (12,528 | ) | (68,806 | ) | ||||||
Purchase of noncontrolling interest | (61,991 | ) | — | — | ||||||||
Stock-based awards net proceeds (payments), including excess tax benefit | 1,634 | (125 | ) | (9 | ) | |||||||
Noncontrolling interests distributions | (4,244 | ) | (11,637 | ) | (54,721 | ) | ||||||
Repurchases of treasury stock | — | (679 | ) | (957 | ) | |||||||
Financing costs | (265 | ) | (69 | ) | (1,869 | ) | ||||||
Net cash provided by (used in) financing activities | 1,771 | 32,635 | (43,932 | ) | ||||||||
Net (decrease) increase in cash and cash equivalents | (12,609 | ) | 8,338 | 8,523 | ||||||||
Cash and cash equivalents at beginning of year | 29,645 | 21,307 | 12,784 | |||||||||
Cash and cash equivalents at end of year | $ | 17,036 | $ | 29,645 | $ | 21,307 | ||||||
The accompanying Notes to Consolidated Financial Statements, which include information regarding noncash transactions, are an integral part of these consolidated financial statements.
41
STRATUS PROPERTIES INC.
CONSOLIDATED STATEMENTS OF EQUITY
(In Thousands)
Stratus Stockholders’ Equity | |||||||||||||||||||||||||||||||||||||
Common Stock | Common Stock Held in Treasury | ||||||||||||||||||||||||||||||||||||
Number of Shares | At Par Value | Capital in Excess of Par Value | Accum- ulated Deficit | Accum- ulated Other Compre-hensive Loss | Number of Shares | At Cost | Total Stratus Stockholders’ Equity | Noncontrolling Interests in Subsidiaries | Total Equity | ||||||||||||||||||||||||||||
Balance at December 31, 2012 | 9,037 | $ | 90 | $ | 203,298 | $ | (63,309 | ) | $ | — | 940 | $ | (18,392 | ) | $ | 121,687 | $ | 87,208 | $ | 208,895 | |||||||||||||||||
Common stock repurchases | — | — | — | — | — | 82 | (957 | ) | (957 | ) | — | (957 | ) | ||||||||||||||||||||||||
Exercised and issued stock-based awards | 39 | 1 | 88 | — | — | — | — | 89 | — | 89 | |||||||||||||||||||||||||||
Stock-based compensation | — | — | 338 | — | — | — | — | 338 | — | 338 | |||||||||||||||||||||||||||
Tender of shares for stock-based awards | — | — | — | — | — | 8 | (99 | ) | (99 | ) | — | (99 | ) | ||||||||||||||||||||||||
Noncontrolling interests distributions | — | — | — | — | — | — | — | — | (44,812 | ) | (44,812 | ) | |||||||||||||||||||||||||
Total comprehensive income (loss) | — | — | — | 2,585 | (22 | ) | — | — | 2,563 | 3,299 | 5,862 | ||||||||||||||||||||||||||
Balance at December 31, 2013 | 9,076 | 91 | 203,724 | (60,724 | ) | (22 | ) | 1,030 | (19,448 | ) | 123,621 | 45,695 | 169,316 | ||||||||||||||||||||||||
Common stock repurchases | — | — | — | — | — | 40 | (679 | ) | (679 | ) | — | (679 | ) | ||||||||||||||||||||||||
Exercised and issued stock-based awards | 40 | — | 65 | — | — | — | — | 65 | — | 65 | |||||||||||||||||||||||||||
Stock-based compensation | — | — | 480 | — | — | — | — | 480 | — | 480 | |||||||||||||||||||||||||||
Tender of shares for stock-based awards | — | — | — | — | — | 11 | (190 | ) | (190 | ) | — | (190 | ) | ||||||||||||||||||||||||
Noncontrolling interests distributions | — | — | — | — | — | — | — | — | (11,636 | ) | (11,636 | ) | |||||||||||||||||||||||||
Total comprehensive income (loss) | — | — | — | 13,403 | (257 | ) | — | — | 13,146 | 4,584 | 17,730 | ||||||||||||||||||||||||||
Balance at December 31, 2014 | 9,116 | 91 | 204,269 | (47,321 | ) | (279 | ) | 1,081 | (20,317 | ) | 136,443 | 38,643 | 175,086 | ||||||||||||||||||||||||
Exercised and issued stock-based awards | 44 | — | 32 | — | — | — | — | 32 | — | 32 | |||||||||||||||||||||||||||
Stock-based compensation | — | — | 528 | — | — | — | — | 528 | — | 528 | |||||||||||||||||||||||||||
Tax benefit for stock-based awards | — | — | 1,746 | — | — | — | — | 1,746 | — | 1,746 | |||||||||||||||||||||||||||
Tender of shares for stock-based awards | — | — | — | — | — | 12 | (153 | ) | (153 | ) | — | (153 | ) | ||||||||||||||||||||||||
Noncontrolling interests distributions | — | — | — | — | — | — | — | — | (4,244 | ) | (4,244 | ) | |||||||||||||||||||||||||
Purchase of noncontrolling interest in consolidated subsidiary, net of taxes | — | — | (14,453 | ) | — | — | — | — | (14,453 | ) | (39,921 | ) | (54,374 | ) | |||||||||||||||||||||||
Total comprehensive income | — | — | — | 12,177 | 279 | — | — | 12,456 | 5,597 | 18,053 | |||||||||||||||||||||||||||
Balance at December 31, 2015 | 9,160 | $ | 91 | $ | 192,122 | $ | (35,144 | ) | $ | — | 1,093 | $ | (20,470 | ) | $ | 136,599 | $ | 75 | $ | 136,674 | |||||||||||||||||
The accompanying Notes to Consolidated Financial Statements are an integral part of these consolidated financial statements.
42
STRATUS PROPERTIES INC.
NOTES TO CONSOLIDATED FINANCIAL STATEMENTS
1. Summary of Significant Accounting Policies
Business and Principles of Consolidation. Stratus Properties Inc. (Stratus), a Delaware corporation, is engaged primarily in the acquisition, entitlement, development, management, operation and sale of commercial, hotel, entertainment, and multi- and single-family residential real estate properties, primarily located in the Austin area, but including projects in certain other select markets in Texas. The real estate development and marketing operations of Stratus are conducted through its wholly owned subsidiaries and through unconsolidated joint ventures (see Note 6). Stratus consolidates its wholly owned subsidiaries, subsidiaries in which Stratus has a controlling interest and variable interest entities (VIEs) in which Stratus is deemed the primary beneficiary. All significant intercompany transactions have been eliminated in consolidation.
Concentration of Risks. Stratus primarily conducts its operations in Austin, Texas. Consequently, any significant economic downturn in the Austin market could potentially have an effect on Stratus’ business, results of operations and financial condition.
Use of Estimates. The preparation of financial statements in conformity with accounting principles generally accepted in the United States (U.S.) requires management to make estimates and assumptions that affect the amounts reported in these financial statements and accompanying notes. The more significant estimates include the (1) estimates of future cash flow from development and sale of real estate properties used in the assessment of impairments, (2) valuation allowances for deferred tax assets, (3) allocation of certain indirect costs and (4) useful lives for depreciation. Actual results could differ from those estimates.
Real Estate and Commercial Leasing Assets. Real estate held for sale is stated at the lower of cost or fair value less costs to sell. The cost of real estate held for sale includes acquisition, development, construction and carrying costs, and other related costs incurred through the development stage. Real estate under development and land available for development are stated at cost. Real estate held for investment, which includes the hotel and entertainment venue at the W Austin Hotel & Residences and Stratus' commercial leasing assets, is stated at cost, less accumulated depreciation. Stratus capitalizes interest on funds used in developing properties from the date of initiation of development activities through the date the property is substantially complete and ready for sale or lease. Common costs are allocated based on the relative fair value of individual land parcels. Certain carrying costs are capitalized on properties currently under active development. Stratus capitalizes improvements that increase the value of commercial leasing properties and have useful lives greater than one year. Costs related to repairs and maintenance are charged to expense as incurred.
Stratus performs an impairment test when events or circumstances indicate that an asset’s carrying amount may not be recoverable. Events or circumstances that Stratus considers indicators of impairment include significant decreases in market values, adverse changes in regulatory requirements (including environmental laws), significant budget overruns for properties under development, and current period or projected operating cash flow losses from rental properties. Impairment tests for properties to be held and used, including properties under development, involve the use of estimated future net undiscounted cash flows expected to be generated from the use of the property and its eventual disposition. If projected undiscounted cash flow from properties to be held and used is less than the related carrying amount, then a reduction of the carrying amount of the long-lived asset to fair value is required. Measurement of the impairment loss is based on the fair value of the asset. Generally, Stratus determines fair value using valuation techniques such as discounted expected future cash flows. Impairment tests for properties held for sale involve management estimates of fair value based on estimated market values for similar properties in similar locations and management estimates of costs to sell. If estimated fair value less costs to sell is less than the related carrying amount, then a reduction of the carrying amount of the asset to fair value less costs to sell is required.
Stratus recorded no impairment charges for the three-year period ended December 31, 2015. Should market conditions deteriorate in the future or other events occur that indicate the carrying amount of Stratus’ real estate assets may not be recoverable, Stratus will reevaluate the expected cash flows from each property to determine whether any impairment exists.
43
Depreciation. Commercial leasing properties are depreciated on a straight-line basis over their estimated life of between 30 and 40 years. The hotel and entertainment venue properties are depreciated on a straight-line basis over their estimated life of 35 years. Furniture, fixtures and equipment are depreciated on a straight-line basis over a three to five-year period. Tenant improvements are depreciated over the related lease terms.
Investments in Unconsolidated Affiliates. Stratus has interests in three unconsolidated affiliates, which it accounts for under the equity method (see Note 6).
Other Assets. Other assets primarily consist of deferred financing and leasing costs, prepaid insurance, tenant and other accounts receivable, and notes and interest receivable. Deferred financing costs are amortized using the straight-line method over the term of the related debt, which approximates the effective interest method, to interest expense. Deferred leasing costs are amortized to cost of sales using the straight-line method over the related lease terms.
Accrued Property Taxes. Stratus estimates its property taxes based on prior year property tax payments and other current events that may impact the amount. Upon receipt of the property tax bill, Stratus adjusts its accrued property tax balance at year-end to the actual amount of taxes due for such year. Accrued property taxes included in accrued liabilities totaled $6.2 million at December 31, 2015, and $5.0 million at December 31, 2014.
Revenue Recognition. Revenues from property sales are recognized when the risks and rewards of ownership are transferred to the buyer, when the consideration received can be reasonably determined and when Stratus has completed its obligations to perform certain supplementary development activities, if any exist, at the time of the sale. Consideration is reasonably determined and considered likely of collection when Stratus has signed sales agreements and has determined that the buyer has demonstrated a commitment to pay. The buyer’s commitment to pay is supported by the level of its initial investment, Stratus’ assessment of the buyer’s credit standing and Stratus’ assessment of whether the buyer’s stake in the property is sufficient to motivate the buyer to honor its obligation to pay.
Stratus' revenues from hotel operations are primarily derived from room reservations and food and beverage sales. Revenue is recognized when rooms are occupied and services have been rendered. Taxes collected from customers and submitted to taxing authorities are not recorded in revenue.
Stratus' revenues from entertainment operations are primarily derived from ticket sales, revenue from private events, sponsorships, personal seat license sales and suite sales, and sales of concessions and merchandise. Revenues from ticket sales are recognized after the corresponding performance occurs. Revenues from sponsorships and other revenue not related to a single event are classified as deferred revenue and generally amortized over the operating season or term of the contract. Revenues from concessions and merchandise sales are recognized at the time of sale.
Stratus recognizes its rental income on a straight-line basis based on the terms of its signed leases with tenants. Recoveries from tenants for taxes, insurance and other commercial property operating expenses are recognized as revenues in the period the related costs are incurred. Stratus recognizes sales commissions and management and development fees when earned, as properties are sold or when the services are performed.
A summary of Stratus’ revenues follows (in thousands):
Years Ended December 31, | |||||||||||
2015 | 2014 | 2013 | |||||||||
Hotel | $ | 41,346 | $ | 42,354 | $ | 39,234 | |||||
Entertainment | 19,607 | 19,048 | 15,481 | ||||||||
Developed property sales | 12,320 | 25,674 | 63,676 | ||||||||
Undeveloped property sales | 1,175 | — | 3,266 | ||||||||
Commercial leasing | 5,641 | 6,625 | 5,406 | ||||||||
Commissions and other | 782 | 410 | 647 | ||||||||
Total revenues | $ | 80,871 | $ | 94,111 | $ | 127,710 | |||||
44
Cost of Sales. Cost of sales includes the cost of real estate sold as well as costs directly attributable to the properties sold such as marketing, maintenance and property taxes. Cost of sales also includes operating costs and depreciation for properties held for investment and municipal utility district reimbursements. A summary of Stratus’ cost of sales follows (in thousands):
Years Ended December 31, | ||||||||||||
2015 | 2014 | 2013 | ||||||||||
Hotel | $ | 30,702 | $ | 30,746 | $ | 29,483 | ||||||
Entertainment | 15,169 | 14,431 | 12,922 | |||||||||
Cost of developed property sales | 6,386 | 16,466 | 48,732 | |||||||||
Cost of undeveloped property sales | 564 | 43 | 1,122 | |||||||||
Commercial leasing | 2,772 | 3,138 | 2,670 | |||||||||
Project expenses and allocation of overhead costs (see below) | 3,546 | 3,543 | 5,423 | |||||||||
Depreciation | 8,743 | 8,977 | 9,053 | |||||||||
Other, net | (71 | ) | 598 | a | (1,148 | ) | a | |||||
Total cost of sales | $ | 67,811 | $ | 77,942 | $ | 108,257 | ||||||
a. | Includes a credit of $0.4 million in 2014 and $1.1 million in 2013 related to the recovery of building repair costs associated with damage caused by the June 2011 balcony glass breakage incidents at the W Austin Hotel & Residences. |
Allocation of Overhead Costs. Stratus allocates a portion of its overhead costs to both capitalized real estate costs and cost of sales based on the percentage of time certain employees worked in the related areas (i.e. construction and development for capital assets and sales and marketing for cost of sales). Stratus capitalizes only direct and certain indirect project costs associated with the acquisition, development and construction of a real estate project. Indirect costs include allocated costs associated with certain pooled resources (such as office supplies, telephone and postage) which are used to support Stratus’ development projects, as well as general and administrative functions. Allocations of pooled resources are based only on those employees directly responsible for development (i.e., project managers and subordinates). Stratus charges to expense indirect costs that do not clearly relate to a real estate project, such as all salaries and costs related to its Chief Executive Officer and Chief Financial Officer.
Municipal Utility District Reimbursements. Stratus receives Barton Creek municipal utility district (MUD) reimbursements for certain infrastructure costs incurred in the Barton Creek area. Prior to 1996, Stratus capitalized infrastructure costs to its properties as those costs were incurred. Subsequently, those costs were charged to cost of sales as properties were sold. In 1996, following the 1995 creation of MUDs, Stratus began capitalizing the infrastructure costs to a separate MUD property category. MUD reimbursements received for infrastructure costs incurred prior to 1996 are reflected as a reduction of cost of sales, while other MUD reimbursements represent a reimbursement of the cost of MUD properties and are recorded as a reduction of the related asset’s carrying amount or cost of sales if the property has been sold. Stratus has long-term agreements with seven independent MUDs in Barton Creek to build the MUDs’ utility systems and to be eligible for future reimbursements for the related costs. The amount and timing of MUD reimbursements depends upon the respective MUD having a sufficient tax base within its district to issue bonds and obtain the necessary state approval for the sale of the bonds. Because the timing of the issuance and approval of the bonds is subject to considerable uncertainty, coupled with the fact that interest rates on such bonds cannot be fixed until they are approved, the amounts associated with MUD reimbursements are not known until approximately one month before the MUD reimbursements are received. To the extent the reimbursements are less than the costs capitalized, Stratus records a loss when such determination is made. MUD reimbursements represent the actual amounts received.
Advertising Costs. Advertising costs are expensed as incurred and are included as a component of cost of sales. Advertising costs totaled $0.9 million in 2015, $0.8 million in 2014 and $0.9 million in 2013.
Income Taxes. Stratus accounts for deferred income taxes under an asset and liability method, whereby deferred tax assets and liabilities are recognized based on the tax effects of temporary differences between the financial statements and the tax basis of assets and liabilities, as measured by current enacted tax rates. The effect on deferred income tax assets and liabilities of a change in tax rates or laws is recognized in income in the period in which such changes are enacted. Stratus periodically evaluates the need for a valuation allowance to reduce deferred tax assets to estimated recoverable amounts. Stratus establishes a valuation allowance to reduce its deferred tax assets and records a corresponding charge to earnings if it is determined, based on available evidence at the time, that it is more likely than not that any portion of the deferred tax assets will not be realized. In evaluating the need for a valuation allowance, Stratus estimates future taxable income based on projections and ongoing tax strategies. This process involves significant management judgment about assumptions that are subject to change
45
based on variances between projected and actual operating performance and changes in Stratus’ business environment or operating or financial plans. See Note 8 for further discussion.
Earnings Per Share. Stratus’ basic net income per share of common stock was calculated by dividing the net income attributable to common stock by the weighted-average shares of common stock outstanding during the period. A reconciliation of net income and weighted-average shares of common stock outstanding for purposes of calculating diluted net income per share (in thousands, except per share amounts) follows:
Years Ended December 31, | ||||||||||||
2015 | 2014 | 2013 | ||||||||||
Net income | $ | 17,595 | $ | 18,157 | $ | 5,894 | ||||||
Net income attributable to noncontrolling interests | (5,418 | ) | (4,754 | ) | (3,309 | ) | ||||||
Net income attributable to common stock | $ | 12,177 | $ | 13,403 | $ | 2,585 | ||||||
Weighted-average shares of common stock outstanding | 8,058 | 8,037 | 8,077 | |||||||||
Add shares issuable upon exercise or vesting of: | ||||||||||||
Dilutive stock options | 6 | 11 | 7 | a | ||||||||
Restricted stock units (RSUs) | 27 | b | 30 | b | 27 | |||||||
Weighted-average shares of common stock outstanding for purposes of calculating diluted net income per share | 8,091 | 8,078 | 8,111 | |||||||||
Diluted net income per share attributable to common stock | $ | 1.51 | $ | 1.66 | $ | 0.32 | ||||||
a. | Excludes 1,000 shares of Stratus common stock associated with outstanding stock options with exercise prices less than the average market price of Stratus' common stock that were anti-dilutive based on the treasury stock for the year ended December 31, 2013. |
b. | Excludes shares of common stock totaling approximately 26,000 shares of common stock for 2015 and 36,000 for 2014 associated with anti-dilutive RSU's. |
Outstanding stock options with exercise prices greater than the average market price for Stratus' common stock during the period are excluded from the computation of diluted net income per share of common stock. Excluded stock options totaled approximately 15 thousand for 2015, 42 thousand for 2014 and 64 thousand for 2013.
Stock-Based Compensation. Compensation costs for share-based payments to employees, including stock options, are measured at fair value and charged to expense over the requisite service period for awards that are expected to vest. The fair value of stock options is determined using the Black-Scholes option valuation model. In addition, for restricted stock units, compensation costs are recognized based on the fair value on the date of grant. Stratus estimates forfeitures at the time of grant and revises those estimates in subsequent periods if actual forfeitures differ from those estimates through the final vesting date of the awards. See Note 9 for further discussion.
New Accounting Standards. In May 2014, the Financial Accounting Standards Board (FASB) issued an Accounting Standard Update (ASU) that provides a single comprehensive revenue recognition model, which will replace most existing revenue recognition guidance, and also requires expanded disclosures. The core principle of the model is that revenue is recognized when control of goods or services has been transferred to customers at an amount that reflects the consideration to which an entity expects to be entitled in exchange for those goods or services. For public entities, this ASU is effective for annual reporting periods beginning after December 15, 2017 (following FASB’s August 2015 ASU of a one-year deferral of the effective date), and interim reporting periods within that reporting period. Early adoption is permitted for annual reporting periods beginning after December 15, 2016, and interim reporting periods within that reporting period. This ASU may be applied either retrospectively to each period presented or prospectively as a cumulative-effect adjustment as of the date of adoption. Stratus is currently evaluating the impact of the new guidance on its financial reporting and disclosures, but at this time does not expect the adoption of this ASU to have a material impact on its financial statements.
In April 2015, FASB issued an ASU to simplify the presentation of debt issuance costs. This ASU requires that debt issuance costs related to a recognized debt liability be presented on the balance sheet as a direct deduction from the carrying amount of that debt liability, consistent with debt discounts. For public entities, this ASU is effective for annual periods beginning after December 15, 2015, and interim periods within those fiscal years. Early adoption is permitted for financial statements that have not been previously issued. Retrospective application of the ASU is required upon adoption and the impact of adopting this ASU on the Consolidated Balance Sheets would be a
46
decrease in other assets and debt of $3.1 million at December 31, 2015, and $2.6 million at December 31, 2014. Stratus adopted this ASU on January 1, 2016.
2. Joint Venture with Canyon-Johnson Urban Fund II, L.P.
On September 28, 2015, Stratus completed the purchase of Canyon-Johnson Urban Fund II, L.P.'s (Canyon-Johnson) approximate 58 percent interest in the CJUF II Stratus Block 21, LLC joint venture (the Block 21 Joint Venture), which owns a 36-story mixed-use development in downtown Austin, Texas, anchored by a W Austin Hotel & Residences (the W Austin Hotel & Residences), for approximately $62 million. Stratus’ purchase of Canyon-Johnson’s interest was based on a total project gross price of approximately $210 million, before considering approximately $22.8 million of cash and cash equivalents held by the Block 21 Joint Venture and acquired by Stratus in its purchase of Canyon-Johnson’s interest.
The Block 21 Joint Venture, which was previously a VIE consolidated by Stratus, is now a wholly owned consolidated subsidiary of Stratus. The change in ownership was reflected in stockholder's equity on the Consolidated Balance Sheet, primarily as a reduction in noncontrolling interests in subsidiaries and capital in excess of par value, and an increase in deferred tax assets.
Stratus funded its acquisition of Canyon-Johnson’s interest in the Block 21 Joint Venture with (1) $32.3 million from its non-recourse term loan with Bank of America, (2) a $20.0 million term loan under Stratus’ credit facility with Comerica Bank and (3) $9.7 million in cash. See Note 13 for discussion of refinancing transactions subsequent to December 31, 2015.
Prior to Stratus' purchase of Canyon-Johnson's interest on September 28, 2015, cumulative capital contributions totaled $71.9 million for Stratus and $94.0 million for Canyon-Johnson, and the inception-to-date distributions totaled $53.4 million to Stratus and $62.6 million to Canyon-Johnson.
Prior to the purchase transaction, the Block 21 Joint Venture's cumulative profits were allocated based on a hypothetical liquidation of the Block 21 Joint Venture’s net assets as of each balance sheet date. As of September 28, 2015, the allocation was 42 percent for Stratus and 58 percent for Canyon-Johnson.
On October 3, 2012, the Block 21 Joint Venture and Pedernales Entertainment LLC (Pedernales) formed Stageside Productions (Stageside) to promote, market and commercialize the production, sale, distribution and general oversight of audio and video recordings of events or performances occurring at Austin City Limits Live at the Moody Theater (ACL Live). The Block 21 Joint Venture's initial capital contributions to Stageside totaled $0.3 million, and Stratus' wholly owned Block 21 subsidiary will contribute additional capital as necessary to fund the working capital needs of Stageside. In conjunction with the purchase of Canyon-Johnson's interest in the Block 21 Joint Venture, Stratus acquired Canyon-Johnson's interest in Stageside effective September 28, 2015. Stratus has a 100 percent capital funding interest and a 40 percent residual and voting interest in Stageside. Stratus performed an evaluation and concluded Stageside is a VIE and that Stratus is the primary beneficiary. Accordingly, the results of Stageside are consolidated in Stratus' financial statements.
3. Joint Venture with LCHM Holdings, LLC
In 2011, Stratus entered into a joint venture (the Parkside Village Joint Venture) with Moffett Holdings, LLC (Moffett Holdings) for the development of Parkside Village, a retail project in the Circle C community in southwest Austin, Texas. On March 3, 2014, Moffett Holdings redeemed and purchased the membership interest in Moffett Holdings held by LCHM Holdings, LLC (LCHM Holdings). Stratus’ capital contributions to the Parkside Village Joint Venture totaled $3.1 million, which consisted of a 23.03 acre tract of land located in Austin, Texas, the related property and development agreements for the land and other project costs incurred by Stratus before February 28, 2011. Moffett Holdings made cash capital contributions to the Parkside Village Joint Venture totaling $3.8 million, the rights of which were subsequently assigned to LCHM Holdings, to fund the development of the project. On July 2, 2015, Stratus completed the sale of Parkside Village (see Note 12 for further discussion). Stratus used proceeds from this transaction to fully repay the Parkside Village construction loan with Comerica Bank (see Note 7 for further discussion) and received $12.1 million in net cash proceeds. Stratus recognized a pre-tax gain on the sale of Parkside Village of $13.5 million.
Prior to the sale of Parkside Village on July 2, 2015, cumulative distributions of $13.4 million were made to Stratus ($9.4 million in 2015, $0.5 million in 2014 and $3.5 million in 2013) and $8.0 million to LCHM Holdings ($3.2 million in 2015, $0.7 million in 2014 and $4.1 million in 2013).
47
4. Real Estate, net
Stratus' consolidated balance sheets include the following net real estate assets (in thousands):
December 31, | ||||||||
2015 | 2014 | |||||||
Real estate held for sale: | ||||||||
Developed lots and condominium units | $ | 25,944 | $ | 12,245 | ||||
Real estate under development: | ||||||||
Acreage, commercial square footage and lots | 139,171 | 123,921 | ||||||
Land available for development: | ||||||||
Undeveloped acreage | 23,397 | 21,368 | ||||||
Real estate held for investment: | ||||||||
W Austin Hotel & Residences | ||||||||
Hotel | 111,426 | 123,474 | ||||||
Entertainment venue | 41,391 | 41,344 | ||||||
Office and retail | 17,627 | 16,647 | ||||||
Barton Creek Village | 6,120 | 6,120 | ||||||
The Oaks at Lakeway | 36,010 | — | ||||||
Parkside Villagea | — | 18,680 | ||||||
5700 Slaughtera | — | 5,741 | ||||||
Furniture, fixtures and equipment | 1,523 | 1,443 | ||||||
Total | 214,097 | 213,449 | ||||||
Accumulated depreciation | (27,471 | ) | (35,384 | ) | ||||
Total real estate held for investment, net | 186,626 | 178,065 | ||||||
Total real estate, net | $ | 375,138 | $ | 335,599 | ||||
a. | On July 2, 2015, Stratus completed the sales of Parkside Village and 5700 Slaughter. See Note 12 for further discussion. |
Real estate held for sale. Developed lots and condominium units include an individual tract of land that has been developed and permitted for residential use, a developed lot with a home already built on it, or condominium units at the W Austin Hotel & Residences. As of December 31, 2015, Stratus owned 99 developed lots and two completed condominium units at the W Austin Hotel & Residences.
Real estate under development. Acreage under development includes real estate for which infrastructure work over the entire property has been completed, is currently being completed or is able to be completed and for which necessary permits have been obtained. Acreage under development at December 31, 2015, totaled 105 acres.
Land available for development. Undeveloped acreage includes real estate that can be sold “as is” (i.e., infrastructure or development work may have begun but is not currently in progress on such property). Stratus’ undeveloped acreage as of December 31, 2015, included approximately 1,661 acres of land primarily in Austin, Texas, permitted for residential and commercial development.
Real estate held for investment. The W Austin Hotel & Residences includes a 251-room hotel, 38,316 square feet of office space and 18,327 square feet of retail space. As of December 31, 2015, occupancy was 100 percent for the office space and 74 percent for the retail space. The W Austin Hotel & Residences also includes ACL Live, an entertainment venue and production studio with a maximum capacity of 3,000 people. Barton Creek Village includes a 22,366-square-foot retail complex, which was 100 percent leased at December 31, 2015, and a 3,085-square-foot bank building, which is leased through January 2023. The Oaks at Lakeway includes 231,436 square feet of commercial space, of which 179,087 square feet were completed and 78 percent leased, 38,649 square feet were under development and 13,700 square feet were planned at December 31, 2015.
Capitalized interest. Stratus recorded capitalized interest of $5.477 million in 2015, $4.1 million in 2014 and $3.6 million in 2013.
48
5. Fair Value Measurements
Fair value accounting guidance includes a hierarchy that prioritizes the inputs to valuation techniques used to measure fair value. The hierarchy gives the highest priority to unadjusted quoted prices in active markets for identical assets or liabilities (Level 1 inputs) and the lowest priority to unobservable inputs (Level 3 inputs).
The carrying value for certain Stratus financial instruments (i.e., cash and cash equivalents, restricted cash, accounts payable and accrued liabilities) approximates fair value because of their short-term nature and generally negligible credit losses. A summary of the carrying amount and fair value of Stratus' other financial instruments follows (in thousands):
December 31, 2015 | December 31, 2014 | ||||||||||||||
Carrying Value | Fair Value | Carrying Value | Fair Value | ||||||||||||
Assets: | |||||||||||||||
Interest rate cap agreement | $ | 1 | $ | 1 | $ | 79 | $ | 79 | |||||||
Liabilities: | |||||||||||||||
Interest rate swap agreement | 646 | 646 | 596 | 596 | |||||||||||
Debt | 263,114 | 263,303 | 196,477 | 196,856 | |||||||||||
Interest Rate Cap Agreement. On September 30, 2013, the Block 21 Joint Venture paid $0.5 million to enter into an interest rate cap agreement, which capped the one-month London Interbank Offered Rate (LIBOR), the variable rate on the Bank of America loan agreement relating to the W Austin Hotel & Residences (the BoA loan), at 1 percent until October 5, 2014, 1.5 percent from October 6, 2014, to October 4, 2015, and caps the one-month LIBOR at 2 percent from October 5, 2015, to September 29, 2016. Stratus uses an interest rate pricing model that relies on market observable inputs such as LIBOR to measure the fair value of the interest rate cap agreement. Stratus also evaluated the counterparty credit risk associated with the interest rate cap agreement, which is considered a Level 3 input, but did not consider such risk to be significant. Therefore, the interest rate cap agreement is classified within Level 2 of the fair value hierarchy. See Note 7 for further discussion of the BoA loan and Note 13 for discussion of refinancing transactions subsequent to December 31, 2015.
Interest Rate Swap Agreement. On December 13, 2013, the Parkside Village Joint Venture entered into an interest rate swap agreement with Comerica Bank that Stratus had designated as a cash flow hedge with changes in fair value of the instrument recorded in other comprehensive income (loss). The instrument effectively converted the variable rate portion of Parkside Village's loan from Comerica Bank (the Parkside Village loan) from one-month LIBOR to a fixed rate of 2.3 percent. On July 2, 2015, Stratus completed the sale of the Parkside Village property (see Note 12). In connection with the sale, Stratus fully repaid the amount outstanding under the Parkside Village loan. Stratus assumed the interest rate swap agreement and as a result, the instrument no longer qualifies for hedge accounting. Accordingly, the accumulated other comprehensive loss balance of $0.6 million on July 2, 2015, was reclassified to the Consolidated Statement of Income as a loss on interest rate derivative instruments, and future changes in the fair value of the instrument will be recorded in the Consolidated Statement of Income (including a loss of $0.1 million in 2015). Stratus also evaluated the counterparty credit risk associated with the interest rate swap agreement, which is considered a Level 3 input, but did not consider such risk to be significant. Therefore, the interest rate swap agreement is classified within Level 2 of the fair value hierarchy.
Debt. Stratus' debt is recorded at cost and is not actively traded. Fair value is estimated based on discounted future expected cash flows at estimated current market interest rates. Accordingly, Stratus' debt is classified within Level 2 of the fair value hierarchy. The fair value of debt does not represent the amounts that will ultimately be paid upon the maturities of the loans.
49
6. Investment in Unconsolidated Affiliates
Crestview Station. In 2005, Stratus formed a joint venture with Trammell Crow Central Texas Development, Inc. to acquire an approximate 74-acre tract of land at the intersection of Airport Boulevard and Lamar Boulevard in Austin, Texas, for $7.7 million. The property, known as Crestview Station (the Crestview Station Joint Venture), is a single-family, multi-family, retail and office development located on the site of a commuter rail line. The Crestview Station Joint Venture sold substantially all of its multi-family and commercial properties in 2007 and one commercial site in 2008. The Crestview Station Joint Venture sold the remaining residential land to DR Horton, as follows (in millions, except lots closed):
Closing Date | Lots Closed | Sale Price | Gross Profit | ||||||||
April 2012 | 74 | $ | 3.8 | $ | 0.4 | ||||||
May 2013 | 59 | 3.4 | 0.7 | ||||||||
March 2014 | 59 | 3.5 | 0.8 | ||||||||
November 2014 | 111 | 6.8 | 1.8 | ||||||||
303 | $ | 17.5 | $ | 3.7 | |||||||
At December 31, 2015, the Crestview Station Joint Venture has sold all of its properties except for one commercial site. Stratus accounts for its 50 percent interest in the Crestview Station Joint Venture under the equity method.
Stump Fluff. In April 2013, Stratus formed a joint venture, Stump Fluff LLC (Stump Fluff), with Transmission Entertainment, LLC (Transmission) to own, operate, manage and sell live music and entertainment promotion, booking, production, merchandising, venue services and other related products and services. As of December 31, 2015, Stratus' capital contributions to Stump Fluff totaled $1.5 million. Stratus will contribute additional capital to Stump Fluff as necessary to fund its working capital needs. Transmission contributed its existing assets to Stump Fluff. In addition, Stump Fluff assumed specified liabilities of Transmission totaling $0.2 million. Transmission is not required to make any future capital contributions to Stump Fluff. Stratus and Transmission each have a 50 percent voting interest in Stump Fluff. After Stratus is repaid its original capital contributions and a preferred return (10 percent annually) on those contributions, Stratus will receive 33 percent of any distributions from Stump Fluff.
Guapo Enterprises. In May 2013, Stratus and Austin Pachanga Partners, LLC (Pachanga Partners) formed a joint venture, Guapo Enterprises LLC (Guapo) to own, operate, manage and sell the products and services of the Pachanga music festival business. As of December 31, 2015, Stratus' capital contributions to Guapo totaled $0.3 million. Stratus will contribute additional capital to Guapo as necessary to fund its working capital needs. Pachanga Partners contributed its existing assets to Guapo and is not required to make any future capital contributions. Stratus and Pachanga Partners each have a 50 percent voting interest in Guapo. After Stratus is repaid its original capital contributions and a preferred return (10 percent annually) on those contributions, Stratus will receive 33 percent of any distributions from Guapo.
Stratus has concluded that both Stump Fluff and Guapo are VIEs and that no partner in either joint venture is the primary beneficiary because decision-making regarding the activities that most significantly impact the VIEs' economic performance is shared equally between the partners. Stratus accounts for its investments in Stump Fluff and Guapo using the equity method.
Stratus’ equity in unconsolidated affiliates' (loss) income totaled $(1.3) million in 2015, $1.1 million in 2014 and less than $(0.1) million in 2013.
Summarized unaudited financial information for Stratus' unconsolidated affiliates follows (in thousands):
2015 | 2014 | 2013 | |||||||||
Years Ended December 31: | |||||||||||
Revenues | $ | 10,408 | $ | 19,451 | $ | 8,334 | |||||
Gross profit | 459 | 3,716 | 716 | ||||||||
Net (loss) income | (1,343 | ) | 2,357 | 115 | |||||||
At December 31: | |||||||||||
Total assets | $ | 1,325 | $ | 1,546 | $ | 9,610 | |||||
Total liabilities | 998 | 558 | 1,587 | ||||||||
Total equity | 327 | 988 | 8,023 | ||||||||
50
7. Debt
Stratus' debt follows (in thousands):
December 31, | |||||||
2015 | 2014 | ||||||
BoA loan, | |||||||
average interest rate of 2.65% in 2015 and 2.66% in 2014 | $ | 129,521 | $ | 98,267 | |||
Comerica credit facility, | |||||||
average interest rate of 6.00% in 2015 and 2014 | 53,149 | 23,085 | |||||
Lakeway Construction loan, | |||||||
average interest rate of 2.94% in 2015 and 2.91% in 2014 | 46,691 | 16,588 | |||||
Santal Construction loan, | |||||||
average interest rate of 2.69% in 2015 | 16,212 | — | |||||
Diversified Real Asset Income Fund (DRAIF) term loans, | |||||||
average interest rate of 7.25% in 2015 and 2014 | 8,000 | 23,000 | |||||
Barton Creek Village term loan, | |||||||
average interest rate of 4.19% in 2015 and 2014 | 5,791 | 5,932 | |||||
Magnolia term loan | |||||||
average interest rate of 7.00% in 2015 and 2014 | 3,750 | 3,750 | |||||
Parkside Village loan, | |||||||
average interest rate of 2.66% in 2014 | — | 18,923 | |||||
United/Slaughter term loan, | |||||||
average interest rate of 4.50% in 2014 | — | 6,932 | |||||
Total debt | $ | 263,114 | $ | 196,477 | |||
BoA loan. In connection with its acquisition of Canyon-Johnson's interest in the Block 21 Joint Venture, on September 28, 2015, Stratus amended its term loan with Bank of America, N.A. (the BoA loan). Pursuant to the BoA loan amendment, (1) the $100.0 million non-recourse term loan previously made available to the Block 21 Joint Venture on September 30, 2013, was increased to $130.0 million, (2) the interest rate was reduced to the LIBOR daily floating rate plus 2.35 percent and (3) the maturity date was extended from September 29, 2016, to September 28, 2020. In addition, Canyon-Johnson was released as a guarantor. Accordingly, certain obligations of Stratus' wholly owned Block 21 subsidiary, including environmental indemnification and other customary carve-out obligations, are guaranteed by Stratus. Stratus' obligations under the BoA loan are secured by certain property and assets related to the W Austin Hotel & Residences, excluding the remaining unsold condominium units. The BoA loan contains customary financial covenants and other restrictions. Refer to Note 13 for information regarding refinancing transactions subsequent to December 31, 2015.
Comerica credit facility. On August 21, 2015, Stratus amended its $48.0 million credit facility with Comerica (the Comerica credit facility) that was scheduled to mature on August 31, 2015. The amendment increases the borrowing capacity under the Comerica credit facility to $72.5 million, comprised of a $45.0 million revolving line of credit, a $7.5 million tranche for letters of credit and a $20.0 million term loan. The interest rate applicable to amounts borrowed under the Comerica credit facility is LIBOR plus 4.0 percent, with a minimum interest rate of 6.0 percent. The Comerica credit facility matures on August 31, 2017, and is secured by substantially all of Stratus' assets except for properties that are encumbered by separate loan financing. The Comerica credit facility contains customary financial covenants including a requirement that Stratus maintain a minimum total stockholders' equity balance of $110.0 million. As of December 31, 2015, Stratus had $33.1 million outstanding under the revolving line of credit and $20.0 million outstanding under the term loan. Refer to Note 13 for information regarding refinancing transactions subsequent to December 31, 2015.
Lakeway Construction loan. On September 29, 2014, a Stratus subsidiary entered into a $62.9 million construction loan agreement with PlainsCapital Bank (the Lakeway Construction loan) to fund the construction, development and leasing of The Oaks at Lakeway in Lakeway, Texas. On November 7, 2014, the Stratus subsidiary and PlainsCapital Bank entered into an amendment to the loan agreement to effect the syndication of a portion of the aggregate principal amount of the Lakeway Construction loan with Southside Bank. Pursuant to the amendment, PlainsCapital Bank has committed $37.9 million and Southside Bank has committed $25.0 million under the Lakeway Construction loan. The Lakeway Construction loan contains a debt service coverage ratio covenant.
The variable interest rate is one-month LIBOR plus 2.75 percent. The Lakeway Construction loan is guaranteed by Stratus subject to the guarantee decreasing as certain milestones set forth in the loan agreement are met. The loan
51
is secured by the related assets, which had a net book value of $64.7 million at December 31, 2015. The Lakeway Construction loan matures on September 29, 2019.
Santal Construction loan. On January 8, 2015, a Stratus subsidiary entered into a $34.1 million construction loan agreement with Comerica Bank (the Santal Construction loan) to fund the development and construction of the first phase of a multi-family development in Section N of Barton Creek, which is referred to as the Santal Barton Creek multi-family project. The Santal Construction loan matures on January 8, 2018, and Stratus has the option to extend the maturity date for two additional twelve-month periods, subject to certain debt service coverage conditions. The Santal Construction loan is fully guaranteed by Stratus until certain operational milestones (as defined in the loan agreement) are met. The interest rate on the Santal Construction loan is a LIBOR-based rate (as defined in the loan agreement) plus 2.5 percent. The Santal Construction loan is secured by assets at Stratus' Santal multi-family project, which had an aggregate net book value of $29.1 million at December 31, 2015.
DRAIF term loan. Stratus has an unsecured term loan with DRAIF (the DRAIF term loan). The DRAIF term loan has a fixed interest rate of 7.25 percent, and a maturity date of December 31, 2016. The DRAIF term loan contains a debt service coverage ratio covenant and an alternative covenant that requires Stratus to maintain total stockholders' equity of no less than $110.0 million.
Barton Creek Village term loan. On June 27, 2014, Stratus entered into a $6.0 million term loan agreement with PlainsCapital Bank (the Barton Creek Village term loan), that matures on June 27, 2024. The interest rate is fixed at 4.19 percent and payments of principal and interest are due monthly. The Barton Creek Village term loan is secured by assets at Stratus' Barton Creek Village project, which had an aggregate net book value of $4.6 million at December 31, 2015.
Magnolia term loan. On September 15, 2014, Stratus entered into a $3.8 million term loan agreement with Holliday Fenoglio Fowler, L.P. (the Magnolia loan). The proceeds of the Magnolia loan were used to purchase approximately 142 acres of land located in Magnolia, Texas (approximately 18 acres of which were subsequently sold to HEB Grocery Stores). The interest rate is fixed at 7 percent and the Magnolia loan matures on October 1, 2016. Stratus has the option to extend the maturity date on the Magnolia loan to October 1, 2017, upon prior written notice to the lender no later than July 1, 2016. The Magnolia loan is secured by assets at Stratus' Magnolia project, which had a net book value of $4.2 million at December 31, 2015.
Parkside Village loan. On May 17, 2011, the Parkside Village Joint Venture entered into a construction loan agreement and promissory note with Comerica Bank to finance the development of Parkside Village. On July 2, 2015, Stratus completed the sale of Parkside Village. Stratus used proceeds from this transaction to fully repay the Parkside Village loan.
United/Slaughter term loan. On July 18, 2014, Stratus entered into a $7.0 million term loan agreement with United Heritage Credit Union secured by assets at 5700 Slaughter (the United/Slaughter term loan). On July 2, 2015, Stratus completed the sale of the 5700 Slaughter commercial property. Stratus used proceeds from this transaction to fully repay the United/Slaughter term loan.
Maturities. The following table summarizes Stratus' debt maturities as of December 31, 2015 (in thousands):
2016 | 2017 | 2018 | 2019 | 2020 | Thereafter | Total | |||||||||||||||||||||
BoA loana | $ | 1,942 | $ | 2,042 | $ | 2,146 | $ | 2,256 | $ | 121,135 | $ | — | $ | 129,521 | |||||||||||||
Comerica credit facilitya | 15,000 | 38,149 | — | — | — | — | 53,149 | ||||||||||||||||||||
Lakeway Construction loan | — | 315 | 1,284 | 45,092 | — | — | 46,691 | ||||||||||||||||||||
Santal Construction loan | — | — | 16,212 | — | — | — | 16,212 | ||||||||||||||||||||
DRAIF term loan | 8,000 | — | — | — | — | — | 8,000 | ||||||||||||||||||||
Barton Creek Village term loan | 146 | 153 | 160 | 167 | 173 | 4,992 | 5,791 | ||||||||||||||||||||
Magnolia term loan | 3,750 | — | — | — | — | — | 3,750 | ||||||||||||||||||||
Total | $ | 28,838 | $ | 40,659 | $ | 19,802 | $ | 47,515 | $ | 121,308 | $ | 4,992 | $ | 263,114 | |||||||||||||
a. | In January 2016, the proceeds from the $150.0 million term loan from Goldman Sachs were used to fully repay our existing obligations under the BoA loan, which was scheduled to mature in 2020, and the $20.0 million Comerica term loan which was scheduled to mature $15.0 million in 2016 and $5.0 million in 2017. Refer to Note 13 for information regarding revised maturities associated with refinancing transactions subsequent to December 31, 2015. |
52
8. Income Taxes
The components of deferred income taxes follow (in thousands):
December 31, | |||||||
2015 | 2014 | ||||||
Deferred tax assets and liabilities: | |||||||
Real estate, commercial leasing assets and facilities | $ | 12,930 | $ | 6,069 | |||
Alternative minimum tax credits (no expiration) | — | 908 | |||||
Employee benefit accruals | 549 | 550 | |||||
Accrued liabilities | 73 | 164 | |||||
Deferred income | 1,349 | 3,137 | |||||
Charitable contribution carryforward | — | 519 | |||||
Other assets | 544 | 494 | |||||
Net operating loss credit carryforwards | 14 | 39 | |||||
Other liabilities | (130 | ) | (121 | ) | |||
Deferred tax assets, net | $ | 15,329 | $ | 11,759 | |||
Stratus recorded a deferred tax asset of $7.6 million for additional tax basis resulting from the purchase of Canyon-Johnson’s interest in the Block 21 Joint Venture.
During fourth-quarter 2014, Stratus evaluated the recoverability of its deferred tax assets, considering available positive and negative evidence, including recent earnings history and forecasts of future taxable income. As a result, Stratus concluded that there was sufficient positive evidence that its $11.8 million of deferred tax assets (net of deferred tax liabilities) will be realized. Accordingly, Stratus reversed the valuation allowance on its deferred tax assets during 2014 and had no valuation allowance as of December 31, 2015 and 2014.
Stratus’ future results of operations may be negatively impacted by an inability to realize a tax benefit for future tax losses or for items that will generate additional deferred tax assets. The realization of the deferred tax assets recorded as of December 31, 2015, is primarily dependent upon Stratus' ability to generate future taxable income.
Stratus’ income tax provision consists of the following (in thousands):
Years Ended December 31, | |||||||||||
2015 | 2014 | 2013 | |||||||||
Current | $ | (3,458 | ) | $ | (664 | ) | $ | (899 | ) | ||
Deferred | (2,118 | ) | 11,358 | (30 | ) | ||||||
(Provision for) benefit from income taxes | $ | (5,576 | ) | $ | 10,694 | $ | (929 | ) | |||
Excess tax benefits related to option exercises and vesting of restricted stock units cannot be recognized until realization through a reduction of current taxes payable. During 2015, Stratus realized tax benefits of $1.7 million related to U.S. net operating loss carryforwards associated with excess tax benefits on stock option exercises and restricted stock units vested. At December 31, 2015, Stratus had no remaining operating loss carryforwards.
During the three-year period ended December 31, 2015, Stratus recorded unrecognized tax benefits related to state income tax filing positions. A summary of the changes in unrecognized tax benefits follows (in thousands):
2015 | 2014 | 2013 | |||||||||
Balance at January 1 | $ | 1,160 | $ | 854 | $ | 562 | |||||
Additions for tax positions related to the current year | — | 221 | 274 | ||||||||
(Subtractions) additions for tax positions related to prior years | (55 | ) | 85 | 18 | |||||||
Balance at December 31 | $ | 1,105 | $ | 1,160 | $ | 854 | |||||
As of December 31, 2015, there was $1.1 million of unrecognized tax benefits that if recognized would affect Stratus' annual effective tax rate. During 2016, approximately $0.3 million of unrecognized tax benefits could be recognized due to the expiration of statutes of limitations.
Stratus records liabilities offsetting the tax provision benefits of uncertain tax positions to the extent it estimates that a tax position is more likely than not to not be sustained upon examination by the taxing authorities. Stratus has elected to classify any interest and penalties related to income taxes within income tax expense in its
53
Consolidated Statements of Income. As of December 31, 2015, less than $0.1 million of interest costs have been accrued.
Stratus files both U.S. federal and state income tax returns. With limited exceptions, Stratus is no longer subject to U.S. federal income tax examinations by tax authorities for the years prior to 2009, and state income tax examinations for the years prior to 2011.
A reconciliation of the U.S. federal statutory tax rate to Stratus' effective income tax rate for the years ended December 31 follows (dollars in thousands):
Years Ended December 31, | |||||||||||||||||||||
2015 | 2014 | 2013 | |||||||||||||||||||
Amount | Percent | Amount | Percent | Amount | Percent | ||||||||||||||||
Income tax expense computed at the | |||||||||||||||||||||
federal statutory income tax rate | $ | (6,983 | ) | (35 | )% | $ | (2,612 | ) | (35 | )% | $ | (2,388 | ) | (35 | )% | ||||||
Adjustments attributable to: | |||||||||||||||||||||
Change in valuation allowance | — | — | 12,096 | 162 | 1,395 | 20 | |||||||||||||||
Noncontrolling interests | 1,896 | 9 | 1,664 | 22 | 1,158 | 17 | |||||||||||||||
State taxes and other, net | (489 | ) | (2 | ) | (454 | ) | (6 | ) | (1,094 | ) | (16 | ) | |||||||||
(Provision for) benefit from income taxes | $ | (5,576 | ) | (28 | ) | $ | 10,694 | 143 | $ | (929 | ) | (14 | ) | ||||||||
Stratus paid federal and state income taxes totaling $2.0 million in 2015, and $0.5 million in 2014 and 2013. Stratus received income tax refunds of less than $0.1 million in each of 2015 and 2014. Stratus did not receive any income tax refunds in 2013.
9. Stock-Based Compensation, Equity Transactions and Employee Benefits
Stock-Based Compensation Plans. Stratus currently has three stock-based compensation plans, all of which have awards available for grant. In May 2013, Stratus' stockholders approved the 2013 Stock Incentive Plan, which provides for the issuance of stock-based compensation awards, including stock options and restricted stock units, relating to 180,000 shares of Stratus common stock that are issuable to Stratus employees and non-employee directors. Stratus’ 2010 Stock Incentive Plan provides for the issuance of stock-based compensation awards, including stock options and restricted stock units, relating to 140,000 shares of Stratus common stock that are issuable to Stratus employees and non-employee directors. Stratus’ 1996 Stock Option Plan for Non-Employee Directors provides for the issuance of stock options only. Stratus common stock issued upon option exercises or restricted stock unit vestings represent newly issued shares of common stock. Awards with respect to 98,000 shares under the 2013 Stock Incentive Plan, 4,375 shares under the 2010 Stock Incentive Plan and 2,500 shares under the 1996 Stock Option Plan for Non-Employee Directors were available for new grants as of December 31, 2015.
Stock-Based Compensation Costs. Compensation costs charged against earnings for stock-based awards are shown below (in thousands). Stock-based compensation costs are capitalized when appropriate. Stratus’ estimated forfeiture rate used in estimating stock-based compensation costs was 2.8 percent for stock options and zero percent for restricted stock units for the years presented below.
Years Ended December 31, | |||||||||||
2015 | 2014 | 2013 | |||||||||
Stock options awarded to directors | $ | — | $ | 6 | $ | 14 | |||||
Restricted stock units awarded to employees and directors | 528 | 474 | 324 | ||||||||
Impact on net income before income taxes | $ | 528 | $ | 480 | $ | 338 | |||||
54
Options. Stock options granted under the plans generally expire 10 years after the date of grant and vest in 25 percent annual increments beginning one year from the date of grant. The plans and award agreements provide that participants will receive the following year’s vesting after retirement and provide for accelerated vesting if there is a change of control (as defined in the plans). Stratus has not granted stock options since 2011. A summary of stock options outstanding as of December 31, 2015, and changes during the year ended December 31, 2015, follow:
Number of Options | Weighted Average Option Price | Weighted Average Remaining Contractual Term (years) | Aggregate Intrinsic Value ($000) | |||||||||
Balance at January 1 | 43,125 | $ | 20.65 | |||||||||
Expired | (13,125 | ) | 24.63 | |||||||||
Balance at December 31 | 30,000 | 18.91 | 3.17 | $ | 181 | |||||||
Vested and exercisable at December 31 | 30,000 | 18.91 | 3.17 | $ | 181 | |||||||
There were no stock option exercises during 2015. The total intrinsic value of options exercised was less than $0.1 million during each of 2014 and 2013. No stock options vested during 2015, 2,500 stock options vested during 2014 and 3,750 stock options vested during 2013, with weighted-average grant-date fair values of $6.63 per option in 2014 and $5.91 per option in 2013.
Restricted Stock Units. Restricted stock units granted under the plans provide for the issuance of common stock to the non-employee directors and certain officers of Stratus at no cost to the directors and officers. The restricted stock units are converted into shares of Stratus common stock ratably and generally vest in one-quarter increments over the four years following the grant date. For officers, the awards will fully vest upon retirement, death and disability, and upon a change of control. For directors, the awards will fully vest upon a change of control and there will be a partial acceleration of vesting due to retirement, death and disability.
A summary of outstanding unvested restricted stock units as of December 31, 2015, and activity during the year ended December 31, 2015, is presented below:
Number of Restricted Stock Units | Aggregate Intrinsic Value ($000) | |||||
Balance at January 1 | 113,500 | |||||
Granted | 43,000 | |||||
Vested | (41,875 | ) | ||||
Forfeited | (4,500 | ) | ||||
Balance at December 31 | 110,125 | $ | 2,153 | |||
The total grant date fair value of restricted stock units granted during 2015 was $0.6 million. The total intrinsic value of restricted stock units vesting during 2015 was $0.6 million. As of December 31, 2015, Stratus had $1.1 million of total unrecognized compensation cost related to unvested restricted stock units expected to be recognized over a weighted-average period of 1.7 years.
The following table includes amounts related to exercises of stock options and vesting of restricted stock units (in thousands, except shares of Stratus common stock tendered):
Years Ended December 31, | |||||||||||
2015 | 2014 | 2013 | |||||||||
Stratus shares tendered to pay the exercise | |||||||||||
price and/or the minimum required taxesa | 11,562 | 10,917 | 8,132 | ||||||||
Cash received from stock option exercises | $ | — | $ | 65 | $ | 91 | |||||
Amounts Stratus paid for employee taxes | $ | 153 | $ | 125 | $ | 9 | |||||
a. | Under terms of the related plans and agreements, upon exercise of stock options and vesting of restricted stock units, employees may tender shares of Stratus common stock to Stratus to pay the exercise price and/or the minimum required taxes. |
55
Share Purchase Program. In November 2013, Stratus' board of directors approved an increase in the open market share purchase program from 0.7 million shares to 1.7 million shares of Stratus common stock. The purchases may occur over time depending on many factors, including the market price of Stratus common stock; Stratus’ operating results, cash flow and financial position; and general economic and market conditions. There were no purchases under this program during 2015. Purchases included 39,960 shares for $0.7 million (an average of $17.00 per share) during 2014 and 81,990 shares for $1.0 million (an average of $11.68 per share) during 2013, all of which Stratus purchased in private transactions. As of December 31, 2015, 991,695 shares remain available under this program.
Employee Benefits. Stratus maintains 401(k) defined contribution plans subject to the provisions of the Employee Retirement Income Security Act of 1974 (ERISA). The 401(k) plans provide for an employer matching contribution equal to 100 percent of the participant’s contribution, subject to a limit of 5 percent of the participant’s annual salary. Stratus’ policy is to make an additional safe harbor contribution equal to 3 percent of each participant’s total compensation for corporate employees and 4 percent for ACL Live employees. The 401(k) plans also provide for discretionary contributions. Stratus’ contributions to the 401(k) plans totaled $0.4 million in each of 2015, 2014 and 2013.
10. Commitments and Contingencies
Construction Contracts. Stratus had commitments under noncancelable construction contracts totaling $14.1 million at December 31, 2015. These commitments primarily included contracts for construction of improvements for the Santal Barton Creek multi-family project.
Letters of Credit. As of December 31, 2015, Stratus had letters of credit committed totaling $2.3 million under its credit facility with Comerica (see Note 7).
Rental Income. As of December 31, 2015, Stratus’ minimum rental income, including scheduled rent increases under noncancelable long-term leases which extend through 2035, totaled $4.5 million in 2016, $4.9 million in 2017, $4.7 million in 2018, $4.2 million in 2019, $4.1 million in 2020 and $33.6 million thereafter.
Operating Lease. As of December 31, 2015, Stratus’ minimum annual contractual payments under its noncancelable long-term operating leases totaled $0.1 million for 2016 and 2017, and less than $0.1 million in 2018 and 2019. Total expense under Stratus’ operating leases totaled $0.1 million in each of 2015, 2014 and 2013.
Circle C Settlement. On August 1, 2002, the City of Austin (the City) granted final approval of a development agreement (the Circle C settlement) and permanent zoning for Stratus’ real estate located within the Circle C community in southwest Austin. The Circle C settlement firmly established all essential municipal development regulations applicable to Stratus’ Circle C properties until 2032. The City also provided Stratus $15.0 million of development fee credits, which are in the form of credit bank capacity, in connection with its future development of its Circle C and other Austin-area properties for waivers of fees and reimbursement for certain infrastructure costs. In addition, Stratus can elect to sell up to $1.5 million of the incentives per year to other developers for their use in paying City fees related to their projects as long as the projects are within the desired development zone, as defined within the Circle C settlement. To the extent Stratus sells the incentives to other developers, Stratus recognizes the income from the sale when title is transferred and compensation is received. As of December 31, 2015, Stratus had permanently used $11.7 million of its City-based development fee credits, including cumulative amounts sold to third parties totaling $5.1 million. Fee credits used for the development of Stratus’ properties effectively reduce the basis of the related properties and defer recognition of any gain associated with the use of the fees until the affected properties are sold. Stratus also had $1.4 million in credit bank capacity in use as temporary fiscal deposits as of December 31, 2015. Available credit bank capacity was $1.9 million at December 31, 2015.
Environmental Regulations. Stratus has made, and will continue to make, expenditures for protection of the environment. Increasing emphasis on environmental matters can be expected to result in additional costs, which will be charged against Stratus’ operations in future periods. Present and future environmental laws and regulations applicable to Stratus’ operations may require substantial capital expenditures that could adversely affect the development of its real estate interests or may affect its operations in other ways that cannot be accurately predicted at this time.
56
Litigation. Stratus may from time to time be involved in various legal proceedings of a character normally incident to the ordinary course of its business. Stratus believes that potential liability from any of these pending or threatened proceedings will not have a material adverse effect on Stratus’ financial condition or results of operations.
11. Business Segments
Stratus has four operating segments: Hotel, Entertainment, Real Estate Operations and Commercial Leasing.
The Hotel segment includes the W Austin Hotel located at the W Austin Hotel & Residences.
The Entertainment segment includes ACL Live, a live music and entertainment venue and production studio at the W Austin Hotel & Residences. In addition to hosting concerts and private events, this venue is the home of Austin City Limits, a television program showcasing popular music legends. The Entertainment segment also includes revenues and costs associated with events hosted at other venues, and the results of the Stageside Productions joint venture with Pedernales Entertainment LLC (see Note 2).
The Real Estate Operations segment is comprised of Stratus’ real estate assets (developed, under development and available for development), which consists of its properties in Austin, Texas (the Barton Creek community, the Circle C community, Lantana and the condominium units at the W Austin Hotel & Residences); in Lakeway, Texas (The Oaks at Lakeway) located in the greater Austin area; in Magnolia, Texas, located in the greater Houston area (Magnolia); and in Killeen, Texas (The West Killeen Market).
The Commercial Leasing segment includes the office and retail space at the W Austin Hotel & Residences, a retail building and a bank building in Barton Creek Village and a retail building at The Oaks at Lakeway. On July 2, 2015, Stratus completed the sales of the Parkside Village and 5700 Slaughter properties, which were included in the Commercial Leasing segment. See Note 12 for further discussion.
Stratus uses operating income or loss to measure the performance of each segment. Stratus allocates parent company general and administrative expenses that do not directly relate to a particular operating segment between the Real Estate Operations and Commercial Leasing segments based on projected annual revenues for each segment. General and administrative expenses related to the W Austin Hotel & Residences are allocated to the Real Estate Operations, Hotel, Entertainment and Commercial Leasing segments based on projected annual revenues for the W Austin Hotel & Residences. The following segment information reflects management determinations that may not be indicative of what actual financial performance of each segment would be if it were an independent entity.
Segment data presented below was prepared on the same basis as Stratus’ consolidated financial statements (in thousands).
Hotel | Entertainment | Real Estate Operationsa | Commercial Leasingb | Eliminations and Otherc | Total | ||||||||||||||||||
Year Ended December 31, 2015: | |||||||||||||||||||||||
Revenues: | |||||||||||||||||||||||
Unaffiliated customers | $ | 41,346 | $ | 19,607 | $ | 14,277 | $ | 5,641 | $ | — | $ | 80,871 | |||||||||||
Intersegment | 305 | 193 | 66 | 538 | (1,102 | ) | — | ||||||||||||||||
Cost of sales, excluding depreciation | 30,789 | 15,426 | 10,426 | 2,838 | (411 | ) | 59,068 | ||||||||||||||||
Depreciation | 5,797 | 1,288 | 246 | 1,556 | (144 | ) | 8,743 | ||||||||||||||||
General and administrative expenses | 713 | 257 | 5,949 | 1,783 | (645 | ) | 8,057 | ||||||||||||||||
Gain on sales of assets | — | — | — | (20,729 | ) | — | (20,729 | ) | |||||||||||||||
Operating income (loss) | $ | 4,352 | $ | 2,829 | $ | (2,278 | ) | $ | 20,731 | $ | 98 | $ | 25,732 | ||||||||||
Income from discontinued operationsd | $ | — | $ | — | $ | — | $ | 3,218 | $ | — | $ | 3,218 | |||||||||||
Capital expenditurese | $ | 1,023 | $ | 128 | $ | 26,237 | $ | 54,027 | $ | — | $ | 81,415 | |||||||||||
Total assets at December 31, 2015 | $ | 109,562 | $ | 42,125 | $ | 207,394 | $ | 62,234 | $ | 11,312 | $ | 432,627 | |||||||||||
57
Hotel | Entertainment | Real Estate Operationsa | Commercial Leasingb | Eliminations and Otherc | Total | ||||||||||||||||||
Year Ended December 31, 2014: | |||||||||||||||||||||||
Revenues: | |||||||||||||||||||||||
Unaffiliated customers | $ | 42,354 | $ | 19,048 | $ | 26,084 | $ | 6,625 | $ | — | $ | 94,111 | |||||||||||
Intersegment | 506 | 60 | 97 | 503 | (1,166 | ) | — | ||||||||||||||||
Cost of sales, excluding depreciation | 30,753 | 14,763 | 20,743 | 3,236 | (530 | ) | 68,965 | ||||||||||||||||
Depreciation | 5,851 | 1,260 | 229 | 1,785 | (148 | ) | 8,977 | ||||||||||||||||
Litigation settlement | — | — | (2,082 | ) | — | — | (2,082 | ) | |||||||||||||||
General and administrative expenses | 402 | 148 | 6,105 | 1,869 | (637 | ) | 7,887 | ||||||||||||||||
Operating income | $ | 5,854 | $ | 2,937 | $ | 1,186 | $ | 238 | $ | 149 | $ | 10,364 | |||||||||||
Capital expenditurese | $ | 704 | $ | 123 | $ | 54,928 | $ | 5,977 | $ | — | $ | 61,732 | |||||||||||
Total assets at December 31, 2014 | $ | 111,671 | $ | 50,486 | $ | 183,856 | $ | 50,510 | $ | 6,164 | $ | 402,687 | |||||||||||
Year Ended December 31, 2013: | |||||||||||||||||||||||
Revenues: | |||||||||||||||||||||||
Unaffiliated customers | $ | 39,234 | $ | 15,481 | $ | 67,589 | $ | 5,406 | $ | — | $ | 127,710 | |||||||||||
Intersegment | 310 | 78 | 72 | 517 | (977 | ) | — | ||||||||||||||||
Cost of sales, excluding depreciation | 29,483 | 13,076 | 54,180 | 2,755 | (290 | ) | 99,204 | ||||||||||||||||
Depreciation | 6,033 | 1,239 | 242 | 1,687 | (148 | ) | 9,053 | ||||||||||||||||
Insurance Settlement | — | — | (1,785 | ) | — | — | (1,785 | ) | |||||||||||||||
General and administrative expenses | 322 | 125 | 6,024 | 1,204 | (588 | ) | 7,087 | ||||||||||||||||
Operating income | $ | 3,706 | $ | 1,119 | $ | 9,000 | $ | 277 | $ | 49 | $ | 14,151 | |||||||||||
Capital expenditurese | $ | 759 | $ | 280 | $ | 16,595 | $ | 1,347 | $ | — | $ | 18,981 | |||||||||||
Total assets at December 31, 2013 | $ | 115,510 | $ | 47,802 | $ | 140,890 | $ | 48,617 | $ | (5,876 | ) | $ | 346,943 | ||||||||||
a. | Includes sales commissions and other revenues together with related expenses. |
b. | Includes the results of the Parkside Village and 5700 Slaughter commercial properties through July 2, 2015 (see Note 12). |
c. | Includes eliminations of intersegment amounts. |
d. | Represents a deferred gain, net of taxes, associated with the 2012 sale of 7500 Rialto that was recognized in first-quarter 2015 (see Note 12). |
e. | Also includes purchases and development of residential real estate held for sale. |
12. Asset Sales and Discontinued Operations
Parkside Village and 5700 Slaughter. On June 30, 2015, Stratus' balance sheet had approximately $24.3 million of assets and $26.0 million of liabilities associated with the Parkside Village and 5700 Slaughter commercial properties. On July 2, 2015, Stratus completed the sales of its Austin-area Parkside Village and 5700 Slaughter commercial properties, both located in the Circle C community, to Whitestone REIT. The Parkside Village retail project, which was owned in a joint venture with LCHM Holdings, LLC, consisted of 90,184 leasable square feet and was sold for $32.5 million. The 5700 Slaughter retail project, which was wholly owned by Stratus, consisted of 25,698 leasable square feet and was sold for $12.5 million. Stratus used proceeds from these transactions to repay the total $26.0 million outstanding under the Parkside Village loan and the United/Slaughter term loan, with the remainder being held in escrow while Stratus assessed potential tax free like-kind exchange transactions. In September 2015, Stratus used $2.6 million of the escrow funds to purchase an undeveloped tract of land for the West Killeen Market project and withdrew $12.1 million to fund distributions to Stratus and LCHM Holdings of $9.4 million and $3.2 million respectively. After debt repayments and closing costs, cash proceeds from these transactions approximated $17 million, and Stratus recorded a pre-tax gain in 2015 of $20.7 million, of which the noncontrolling interest share was $3.9 million. Stratus has determined that the sales of the Parkside Village and 5700 Slaughter commercial properties do not meet the criteria for classification as discontinued operations.
Net (loss) income before income taxes and net (loss) income attributable to common stock associated with Parkside Village and 5700 Slaughter follow (in thousands):
January 1, 2015, to July 2, 2015 | Year Ended December 31, 2014 | Year Ended December 31, 2013 | ||||||||||
Net (loss) income before income taxes | $ | (46 | ) | $ | 441 | $ | 373 | |||||
Net (loss) income attributable to common stock | (47 | ) | 305 | 235 | ||||||||
58
7500 Rialto. In 2012, Stratus sold 7500 Rialto, an office building in Lantana. In connection with the sale, Stratus recognized a gain of $5.1 million and deferred a gain of $5.0 million because of a guaranty provided to the lender in connection with the buyer's assumption of the loan related to 7500 Rialto. The guaranty was released in January 2015, and Stratus recognized the deferred gain totaling $5.0 million ($3.2 million to net income attributable to common stock) in 2015.
13. Subsequent Events
On January 5, 2016, Stratus completed the refinancing of the W Austin Hotel & Residences. Goldman Sachs Mortgage Company provided a $150.0 million, ten-year, non-recourse term loan (the Goldman Sachs loan) with a fixed interest rate of 5.58 percent annually and payable monthly based on a 30-year amortization. Stratus used the proceeds from the Goldman Sachs loan to fully repay its existing obligations under the BoA loan and the $20.0 million Comerica term loan. As a result of this refinancing transaction, revised debt maturities as of January 31, 2016, total $13.7 million in 2016, $35.7 million in 2017, $19.9 million in 2018, $47.6 million in 2019, $2.7 million in 2020 and $144.0 million thereafter.
Stratus evaluated events after December 31, 2015, and through the date the financial statements were issued, and determined any events or transactions occurring during this period that would require recognition or disclosure are appropriately addressed in these financial statements.
14. Quarterly Financial Information (Unaudited)
First Quarter | Second Quarter | Third Quarter | Fourth Quarter | Year | ||||||||||||||||
2015 | ||||||||||||||||||||
Revenues | $ | 20,225 | $ | 19,986 | $ | 19,677 | $ | 20,983 | $ | 80,871 | ||||||||||
Operating income | 1,609 | 542 | 20,976 | a | 2,605 | b | 25,732 | a,b | ||||||||||||
Income from discontinued operations, | ||||||||||||||||||||
net of taxes | 3,218 | c | — | — | — | 3,218 | c | |||||||||||||
Net income (loss) | 3,784 | (240 | ) | 13,741 | a | 310 | b | 17,595 | a,b | |||||||||||
Net income attributable to noncontrolling | ||||||||||||||||||||
interests | 1,042 | 879 | 3,493 | a | 4 | 5,418 | a | |||||||||||||
Net income (loss) attributable to | ||||||||||||||||||||
common stockholders | 2,742 | c | (1,119 | ) | 10,248 | a | 306 | b | 12,177 | a,b,c | ||||||||||
Basic and diluted net income (loss) per share share | ||||||||||||||||||||
attributable to common stockholders | 0.34 | c | (0.14 | ) | 1.27 | a | 0.04 | b | 1.51 | a,b,c | ||||||||||
2014 | ||||||||||||||||||||
Revenues | $ | 23,299 | $ | 22,521 | $ | 21,630 | $ | 26,661 | $ | 94,111 | ||||||||||
Operating income | 3,348 | d,e | 2,842 | e | 2,086 | e,f | 2,088 | 10,364 | d,e,f | |||||||||||
Net income | 2,892 | d,e | 1,264 | e | 778 | e,f | 13,223 | g | 18,157 | d,e,f,g | ||||||||||
Net income attributable to noncontrolling | ||||||||||||||||||||
interests | 1,795 | d,e | 1,045 | e | 181 | 1,733 | 4,754 | d,e | ||||||||||||
Net income attributable to common stock | ||||||||||||||||||||
stockholders | 1,097 | d,e | 219 | e | 597 | e,f | 11,490 | g | 13,403 | d,e,f,g | ||||||||||
Basic net income per share attributable | ||||||||||||||||||||
to common stockholders | 0.14 | d,e | 0.03 | e | 0.07 | e,f | 1.43 | g | 1.67 | d,e,f,g | ||||||||||
Diluted net income per share | ||||||||||||||||||||
attributable to common stockholders | 0.14 | d,e | 0.03 | e | 0.07 | e,f | 1.42 | g | 1.66 | d,e,f,g | ||||||||||
a. | Includes a total gain of $20.7 million ($10.8 million to net income attributable to common stock or $1.34 per share) in third-quarter and for the year 2015 associated with the sales of Parkside Village and 5700 Slaughter (see Note 12). |
b. | Includes a pre-tax gain of $0.6 million ($0.08 per share) in fourth-quarter and for the year 2015 associated with the sale of a tract of undeveloped land. |
c. | Includes recognition of a deferred gain of $5.0 million ($3.2 million attributable to common stock or $0.40 per share) in first-quarter and for the year 2015 associated with the sale of 7500 Rialto Boulevard in February 2012 (see Note 12). |
d. | Includes income of $0.5 million ($0.07 per share) in first-quarter 2014, $0.1 million (less than $0.01 per share) in second-quarter 2014 and $0.6 million ($0.07 per share) for the year 2014 related to an insurance settlement. |
e. | Includes income (expense) of $0.1 million ($0.01 per share) in first-quarter 2014, $0.4 million ($0.05 per share) in second-quarter 2014, $(0.1) million (less than $(0.01) per share) in third-quarter 2014 and $0.4 million ($0.05 per share) for the year 2014 related to the recovery of building costs associated with damage caused by the June 2011 balcony glass breakage incidents at the W Austin Hotel & Residences. |
59
f. | Includes a gain of $1.5 million ($0.19 per share) in third-quarter and for the year 2014 associated with a litigation settlement. Also includes lease termination charges of $0.3 million ($0.04 per share) recorded for the commercial leasing segment. |
g. | Includes a credit to provision for income taxes of $12.1 million ($1.50 per share) in the fourth quarter and for the year 2014 for the reversal of valuation allowances on deferred tax assets. |
Item 9. Changes in and Disagreements with Accountants on Accounting and Financial Disclosure
Not applicable.
Item 9A. Controls and Procedures
(a) Evaluation of disclosure controls and procedures. Our Chief Executive Officer and Chief Financial Officer, with the participation of management, have evaluated the effectiveness of our “disclosure controls and procedures” (as defined in Rules 13a-15(e) and 15d-15(e) under the Securities Exchange Act of 1934) to allow timely decisions regarding required disclosure as of the end of the period covered by this annual report on Form 10-K. Based on their evaluation, they have concluded that our disclosure controls and procedures were effective as of the end of the period covered by this report.
(b) Changes in internal control over financial reporting. There has been no change in our internal control over financial reporting that occurred during the fiscal quarter ended December 31, 2015, that has materially affected, or is reasonably likely to materially affect, our internal control over financial reporting.
(c) Management's annual report on internal control over financial reporting is included in Part II, Item 8. “Financial Statements and Supplementary Data.”
Item 9B. Other Information
Amendment to By-laws. On March 9, 2016, our board of directors adopted the Amended and Restated By-laws (the By-laws) of Stratus. The amendment and restatement of the By-laws was effective immediately and included, among other things, the following changes:
• | Provide our board of directors with explicit authority to cancel, postpone or reschedule a stockholder meeting upon prior notice. |
• | Enhance the powers of the chairman of the stockholder meeting (including the authority to adjourn or recess a stockholder meeting). |
• | Establish the Court of Chancery of the State of Delaware as the exclusive forum for certain actions and proceedings. |
• | Provide an explicit confidentiality obligation for directors. |
The foregoing summary of the terms of the By-laws does not purport to be complete and is subject to, and qualified in its entirety by, reference to the full text of the By-laws, which are filed as Exhibit 3.2 to this Form 10-K and incorporated by reference herein.
Severance and Change of Control Agreements.
On March 10, 2016, our board of directors approved new Severance and Change of Control Agreements (collectively, the “Agreements”) with each of William H. Armstrong III, Chairman of the Board, President and Chief Executive Officer, and Erin D. Pickens, Senior Vice President and Chief Financial Officer (collectively, the “Executives”). The Agreements take effect April 1, 2016, following the expiration of the current change of control agreements entered into between Stratus and the Executives dated April 1, 2013, which agreements expire on March 31, 2016. The Agreements shall continue in effect through March 31, 2019 and entitle the Executives to receive benefits in the event of a termination of employment under certain circumstances prior to or following a change of control of Stratus during the term of the Agreements.
Under each Agreement, if Stratus terminates the Executive without cause or the Executive voluntarily terminates his or her employment for good reason (as such terms are defined in the Agreement) during the term of the Agreement and prior to a change of control, the Executive will receive a lump-sum cash payment equal to the sum of his or her prorated bonus for the year of termination plus the sum of (a) the Executive's base salary in effect at the time of termination and (b) the average annual bonus awarded to the Executive for the three fiscal years immediately
60
preceding the termination date. In addition, (a) Stratus shall continue to provide insurance and welfare benefits to the Executive until the earlier of (1) December 31 of the first calendar year following the calendar year of the termination or (2) the date the Executive accepts new employment.
Additionally, if Stratus or its successor terminates the Executive during the three-year period following a change of control, other than by reason of death, disability or cause, or the Executive voluntarily terminates his or her employment for good reason (as such terms are defined in the Agreement), the Executive will receive a lump-sum cash payment equal to the sum of his or her prorated bonus for the year of termination plus 2.99 times the sum of (a) the Executive's base salary in effect at the time of termination and (b) the highest annual bonus awarded to the Executive for the three fiscal years immediately preceding the termination date. In addition, Stratus shall continue to provide insurance and welfare benefits to the Executive until the earlier of (a) December 31 of the first calendar year following the calendar year of the termination or (b) the date the Executive accepts new employment. If any part of the payments or benefits received by the Executive in connection with a termination following a change of control constitutes an excess parachute payment under Section 4999 of the Internal Revenue Code, the Executive will receive the greater of (1) the amount of such payments and benefits reduced so that none of the amount constitutes an excess parachute payment, net of income taxes, or (2) the amount of such payments and benefits, net of income taxes and net of excise taxes under Section 4999 of the Internal Revenue Code.
PART III
Item 10. Directors, Executive Officers and Corporate Governance
Information required by this item will be contained in our definitive proxy statement to be filed with the SEC pursuant to Regulation 14A relating to our 2016 annual meeting of stockholders and is incorporated herein by reference. The information required by Item 10. regarding our executive officers appears under "Executive Officers of the Registrant" after Part I, Item 4. "Mine Safety Disclosures."
Item 11. Executive Compensation
Information required by this item will be contained in our definitive proxy statement to be filed with the SEC pursuant to Regulation 14A relating to our 2016 annual meeting of stockholders and is incorporated herein by reference.
Item 12. Security Ownership of Certain Beneficial Owners and Management and Related Stockholder Matters
Information required by this item will be contained in our definitive proxy statement to be filed with the SEC pursuant to Regulation 14A relating to our 2016 annual meeting of stockholders and is incorporated herein by reference.
Equity Compensation Plan Information as of December 31, 2015
We have equity compensation plans pursuant to which our common stock may be issued to employees and non-employees as compensation. All of our outstanding equity compensation plans were previously approved by our stockholders, and the following plans had shares available for grant as of December 31, 2015: the 2013 Stock Incentive Plan, the 2010 Stock Incentive Plan and the 1996 Stock Option Plan for Non-Employee Directors.
61
The following table presents information regarding these equity compensation plans as of December 31, 2015:
Number of Securities To be Issued Upon Exercise of Outstanding Options, Warrants and Rights (a) | Weighted-Average Exercise Price of Outstanding Options, Warrants and Rights (b) | Number of Securities Remaining Available for Future Issuance Under Equity Compensation Plans (Excluding Securities Reflected in Column (a)) (c) | ||||||||
Equity compensation plans | ||||||||||
approved by security holders | 140,125 | a | $ | 18.91 | 104,875 | b | ||||
Equity compensation plans not | ||||||||||
approved by security holders | N/A | N/A | N/A | |||||||
Total | 140,125 | a | $ | 18.91 | 104,875 | b | ||||
a. The number of securities to be issued upon the exercise of outstanding options, warrants and rights includes shares issuable upon the vesting of 110,125 restricted stock units. These awards are not reflected in column (b) as they do not have an exercise price.
b. As of December 31, 2015, there were 98,000 shares remaining available for future issuance to Stratus employees and non-employee directors under the 2013 Stock Incentive Plan, all of which could be issued pursuant to awards of stock options, stock appreciation rights, restricted stock, restricted stock units or "other stock-based awards." There were 4,375 shares remaining available for future issuance to Stratus employees and non-employee directors under the 2010 Stock Incentive Plan, all of which could be issued pursuant to awards of stock options, stock appreciation rights, restricted stock, restricted stock units or "other stock-based awards." There were 2,500 shares remaining available for future issuance of stock options to our non-employee directors under the 1996 Stock Option Plan for Non-Employee Directors.
Item 13. Certain Relationships and Related Transactions, and Director Independence
Information required by this item will be contained in our definitive proxy statement to be filed with the SEC pursuant to Regulation 14A relating to our 2016 annual meeting of stockholders and is incorporated herein by reference.
Item 14. Principal Accounting Fees and Services
Information required by this item will be contained in our definitive proxy statement to be filed with the SEC pursuant to Regulation 14A relating to our 2016 annual meeting of stockholders and is incorporated herein by reference.
PART IV
Item 15. Exhibits, Financial Statement Schedules
(a)(1). | Financial Statements. |
The consolidated statements of income, comprehensive income, cash flows and equity, and the consolidated balance sheets are included as part of Part II, Item 8. "Financial Statements and Supplementary Data."
(a)(2). | Financial Statement Schedules. |
Reference is made to Schedule III-Real Estate, Commercial Leasing Assets and Facilities and Accumulated Depreciation, beginning on page F-2 hereof.
(a)(3). | Exhibits. |
Reference is made to the Exhibit Index beginning on page E-1 hereof.
62
SIGNATURES
Pursuant to the requirements of Section 13 or 15(d) of the Securities Exchange Act of 1934, the registrant has duly caused this report to be signed on its behalf by the undersigned, thereunto duly authorized.
STRATUS PROPERTIES INC.
By: /s/ William H. Armstrong III
William H. Armstrong III
Chairman of the Board, President
and Chief Executive Officer
Date: March 15, 2016
Pursuant to the requirements of the Securities Exchange Act of 1934, this report has been signed below by the following persons on behalf of the registrant and in the capacities and on the date indicated.
/s/ William H. Armstrong III | Chairman of the Board, President | |
William H. Armstrong III | and Chief Executive Officer (Principal Executive Officer) | |
* | Senior Vice President | |
Erin D. Pickens | and Chief Financial Officer (Principal Financial Officer) | |
* | Vice President and Controller | |
C. Donald Whitmire, Jr. | (Principal Accounting Officer) | |
* | Director | |
James E. Joseph | ||
* | Director | |
James C. Leslie | ||
* | Director | |
Michael D. Madden | ||
* | Director | |
Charles W. Porter | ||
Director | ||
John G. Wenker | ||
*By: /s/ William H. Armstrong III
William H. Armstrong III
Attorney-in-Fact
Date: March 15, 2016
S-1
STRATUS PROPERTIES INC.
INDEX TO FINANCIAL STATEMENTS
The schedule listed below should be read in conjunction with the financial statements of Stratus Properties Inc. contained elsewhere in this Annual Report on Form 10-K.
Page | |
Schedule III-Real Estate, Commercial Leasing Assets | |
and Facilities and Accumulated Depreciation | F-2 |
Schedules other than the one listed above have been omitted since they are either not required, not applicable or the required information is included in the financial statements or notes thereto.
F-1
STRATUS PROPERTIES INC.
REAL ESTATE, COMMERCIAL LEASING ASSETS AND FACILITIES AND ACCUMULATED DEPRECIATION
December 31, 2015
(In Thousands, except Number of Lots and Acres)
SCHEDULE III
Initial Cost | Cost Capitalized | Gross Amounts at December 31, 2015 | Number of Lots/Units and Acres | ||||||||||||||||||||||||||||||||
Bldg. and | Subsequent to | Bldg. and | Lots/ Units | Acres | Accumulated | Year | |||||||||||||||||||||||||||||
Land | Improvements | Acquisitions | Land | Improvements | Total | Depreciation | Acquired | ||||||||||||||||||||||||||||
Real Estate Held for Salea | |||||||||||||||||||||||||||||||||||
Barton Creek, Austin, TX | $ | 9,406 | $ | — | $ | 9,690 | $ | 19,096 | $ | — | $ | 19,096 | 68 | — | $ | — | 1988 | ||||||||||||||||||
Circle C, Austin, TX | 515 | — | 4,090 | 4,605 | — | 4,605 | 31 | — | — | 1992 | |||||||||||||||||||||||||
W Austin Hotel & Residences, Austin, TX | — | 2,243 | — | — | 2,243 | 2,243 | 2 | — | — | 2014 | |||||||||||||||||||||||||
Real Estate Under Developmentb,c | |||||||||||||||||||||||||||||||||||
Barton Creek, Austin, TX | 4,591 | — | 90,172 | 94,763 | — | 94,763 | — | 659 | — | 1988 | |||||||||||||||||||||||||
Lakeway, TX | 22,552 | — | 6,286 | 28,838 | — | 28,838 | — | 87 | — | 2013 | |||||||||||||||||||||||||
Circle C, Austin, TX | 753 | — | 2,043 | 2,796 | — | 2,796 | — | 200 | — | 1992 | |||||||||||||||||||||||||
Magnolia, TX | 3,237 | — | 973 | 4,210 | — | 4,210 | — | 124 | — | 2014 | |||||||||||||||||||||||||
Lantana, Austin, TX | 255 | — | 5,113 | 5,368 | — | 5,368 | — | 36 | — | 1994 | |||||||||||||||||||||||||
West Killeen Market, Killeen, TX | 2,583 | — | 613 | 3,196 | — | 3,196 | — | 9 | — | 2015 | |||||||||||||||||||||||||
Land Available for Developmentc,d | |||||||||||||||||||||||||||||||||||
Camino Real, San Antonio, TX | 16 | — | (16 | ) | — | — | — | — | 2 | — | 1990 | ||||||||||||||||||||||||
Barton Creek, Austin, TX | 7,924 | — | 8,828 | 16,752 | — | 16,752 | — | 577 | — | 1988 | |||||||||||||||||||||||||
Circle C, Austin, TX | 2,704 | — | 2,488 | 5,192 | — | 5,192 | — | 52 | — | 1992 | |||||||||||||||||||||||||
Flores Street, Austin, TX | 1,000 | — | 42 | 1,042 | — | 1,042 | — | — | — | 2015 | |||||||||||||||||||||||||
Lantana, Austin, TX | 157 | — | 254 | 411 | — | 411 | — | 20 | — | 1994 | |||||||||||||||||||||||||
Real Estate Held for Investmentb,c | |||||||||||||||||||||||||||||||||||
W Austin Hotel & Residences, Austin, TXe | 8,075 | 162,561 | — | 8,075 | 162,561 | 170,636 | — | — | 25,141 | 2006 | |||||||||||||||||||||||||
Barton Creek Village, Austin, TXf | 55 | 6,065 | — | 55 | 6,065 | 6,120 | — | — | 1,511 | 2007 | |||||||||||||||||||||||||
Lakeway, TXg | 9,040 | 26,970 | — | 9,040 | 26,970 | 36,010 | — | — | 145 | 2013 | |||||||||||||||||||||||||
Corporate offices, Austin,TX | — | 1,331 | — | — | 1,331 | 1,331 | — | — | 674 | N/A | |||||||||||||||||||||||||
Total | $ | 72,863 | $ | 199,170 | $ | 130,576 | $ | 203,439 | $ | 199,170 | $ | 402,609 | 101 | 1,766 | $ | 27,471 | |||||||||||||||||||
a. | Includes individual tracts of land that have been developed and permitted for residential use, developed lots with homes already built on it, or condominium units at our W Austin Hotel & Residences. |
b. | Includes real estate for which infrastructure work over the entire property has been completed, is currently being completed or is able to be completed and for which necessary permits have been obtained. |
c. | See Note 7 included in Part II, Item 8. of this Annual Report on Form 10-K for a description of assets securing debt. |
d. | Includes undeveloped real estate that can be sold “as is” (i.e., infrastructure or development work may have begun but is not currently in progress on such property). |
e. | Consists of a 251-room hotel, entertainment venue, and office and retail space at the W Austin Hotel & Residences. |
f. | Consists of a 22,366-square-foot retail complex representing the first phase of Barton Creek Village and a 3,085-square-foot bank building. |
g. | Consists of a HEB anchored retail project planned for 231,436 square feet of commercial space. |
F-2
STRATUS PROPERTIES INC.
Notes to Schedule III
(1) Reconciliation of Real Estate, Commercial Leasing Assets and Facilities:
The changes in real estate, commercial leasing assets and facilities for the years ended December 31, are as follows (in thousands):
2015 | 2014 | 2013 | |||||||||
Balance, beginning of year | $ | 370,983 | $ | 325,967 | $ | 349,120 | |||||
Improvements and other | 38,091 | 60,741 | 19,791 | ||||||||
Cost of real estate sold | (6,465 | ) | (15,725 | ) | (42,944 | ) | |||||
Balance, end of year | $ | 402,609 | $ | 370,983 | $ | 325,967 | |||||
The aggregate net book value for federal income tax purposes as of December 31, 2015 was $402.6 million.
(2) Reconciliation of Accumulated Depreciation:
The changes in accumulated depreciation for the years ended December 31, are as follows (in thousands):
2015 | 2014 | 2013 | |||||||||
Balance, beginning of year | $ | 35,384 | $ | 27,009 | $ | 18,380 | |||||
Retirement and sales of assets | (16,656 | ) | (602 | ) | (424 | ) | |||||
Depreciation expense | 8,743 | 8,977 | 9,053 | ||||||||
Balance, end of year | $ | 27,471 | $ | 35,384 | $ | 27,009 | |||||
Depreciation of buildings and improvements is calculated over estimated lives of 30 to 40 years.
F-3
STRATUS PROPERTIES INC.
EXHIBIT INDEX
Incorporated by Reference | ||||||||||
Exhibit Number | Exhibit Title | Filed with this Form 10-K | Form | File No. | Date Filed | |||||
3.1 | Composite Certificate of Incorporation of Stratus Properties Inc. | 8-A/A | 000-19989 | 8/26/2010 | ||||||
Amended and Restated By-Laws of Stratus Properties Inc., as amended effective March 9, 2016. | X | |||||||||
4.1 | Second Amended and Restated Rights Agreement dated as of March 9, 2016 between Stratus Properties Inc. and Computershare Inc., as Rights Agent. | 8-K | 000-19989 | 3/10/2016 | ||||||
4.2 | Investor Rights Agreement by and between Stratus Properties Inc. and Moffett Holdings, LLC dated as of March 15, 2012. | 8-K | 000-19989 | 3/20/2012 | ||||||
4.3 | Assignment and Assumption Agreement by and among Moffett Holdings, LLC, LCHM Holdings, LLC and Stratus Properties Inc., dated as of March 3, 2014. | 13D | 000-19989 | 3/5/2014 | ||||||
10.1 | Amended and Restated Loan Agreement by and between Stratus Properties Inc., Stratus Properties Operating Co., L.P., Circle C Land, L.P., Austin 290 Properties, Inc., Overlook at Amarra, L.L.C. and Comerica Bank dated as of August 21, 2015. | 8-K | 000-19989 | 8/26/2015 | ||||||
10.2 | Amended and Restated Revolving Promissory Note by and between Stratus Properties Inc., Stratus Properties Operating Co., L.P., Circle C Land, L.P., Austin 290 Properties, Inc., Overlook at Amarra, L.L.C. and Comerica Bank dated as of August 21, 2015 ($45.0 million revolving line of credit). | 8-K | 000-19989 | 8/26/2015 | ||||||
10.3 | Amended and Restated Promissory Note by and between Stratus Properties Inc., Stratus Properties Operating Co., L.P., Circle C Land, L.P., Austin 290 Properties, Inc., Overlook at Amarra, L.L.C. and Comerica Bank dated as of August 21, 2015 ($7.5 million letters of credit). | 8-K | 000-19989 | 8/26/2015 | ||||||
10.4 | Installment Note by and between Stratus Properties Inc., Stratus Properties Operating Co., L.P., Circle C Land, L.P., Austin 290 Properties, Inc., Overlook at Amarra, L.L.C. and Comerica Bank dated as of August 21, 2015 ($20.0 million term loan). | 8-K | 000-19989 | 8/26/2015 | ||||||
10.5 | Term Loan Agreement by and among CJUF II Stratus Block 21 LLC, Bank of America, N.A., and the lenders party thereto from time to time, dated September 30, 2013. | 8-K | 000-19989 | 10/3/2013 | ||||||
10.6 | Agreement Regarding Sale and Purchase by and between CJUF II Block 21 Member, LLC, Canyon-Johnson Urban Fund II, L.P., Stratus Block 21 Investments, L.P., Stratus Block 21 Holdings, Inc., and Stratus Properties Inc., effective as of September 28, 2015. | 8-K | 000-19989 | 10/1/2015 | ||||||
E-1
Incorporated by Reference | ||||||||||
Exhibit Number | Exhibit Title | Filed with this Form 10-K | Form | File No. | Date Filed | |||||
10.7 | First Amendment to Loan Documents by and among CJUF II Stratus Block 21 LLC, as borrower, Stratus Properties Inc., as guarantor, and Bank of America, N.A., as administrative agent on behalf of the lenders from time to time party thereto, effective as of September 28, 2015. | 8-K | 000-19989 | 10/1/2015 | ||||||
10.8 | Amended and Restated Promissory Note by and among CJUF II Stratus Block 21 LLC, Stratus Properties Inc., and Bank of America, N.A., dated September 28, 2015. | 8-K | 000-19989 | 10/1/2015 | ||||||
Loan Agreement, dated January 5, 2016, between Stratus Block 21, LLC, as borrower, and Goldman Sachs Mortgage Company, as lender, as amended through January 27, 2016. | X | |||||||||
Promissory Note A-1, dated February 1, 2016, between Stratus Block 21, LLC and Goldman Sachs Mortgage Company. | X | |||||||||
Promissory Note A-2, dated February 1, 2016, between Stratus Block 21, LLC and Goldman Sachs Mortgage Company. | X | |||||||||
10.12 | Loan Modification Agreement by and between Stratus Properties Inc. and American Strategic Income Portfolio Inc.-II effective as of April 1, 2013 ($8.0 million loan). | 10-Q | 000-19989 | 5/15/2013 | ||||||
10.13 | Loan Modification Agreement by and between Stratus Properties Inc. and American Strategic Income Portfolio Inc.-II effective as of September 1, 2012 ($8.0 million loan). | 8-K | 000-19989 | 9/12/2012 | ||||||
10.14 | Loan Agreement between Stratus Properties Inc. and Holliday Fenoglio Fowler, L.P. dated as of December 12, 2006, subsequently assigned to American Strategic Income Portfolio Inc.-II ($8.0 million loan). | 10-K | 000-19989 | 3/16/2007 | ||||||
10.15 | Development Agreement effective as of August 15, 2002, between Circle C Land Corp. and City of Austin. | 10-Q | 000-19989 | 11/14/2002 | ||||||
10.16 | First Amendment dated June 21, 2004, Second Amendment dated November 9, 2004, and Third Amendment dated March 2, 2005, to Development Agreement effective as of August 15, 2002, between Circle C Land Corp. and City of Austin. | 10-K | 000-19989 | 3/16/2015 | ||||||
10.17 | Construction Loan Agreement among Stratus Lakeway Center L.L.C., as Borrower and PlainsCapital Bank, as Administrative Agent and the Other Financial Institutions party thereto as Lenders dated as of September 29, 2014. | 8-K | 000-19989 | 10/3/2014 | ||||||
10.18 | First Amendment to Construction Loan Agreement among Stratus Lakeway Center L.L.C., as Borrower, PlainsCapital Bank, as Administrative Agent and the Other Financial Institutions party thereto as Existing Lender and New Lender dated as of November 7, 2014. | 10-Q | 000-19989 | 11/13/2014 | ||||||
E-2
Incorporated by Reference | ||||||||||
Exhibit Number | Exhibit Title | Filed with this Form 10-K | Form | File No. | Date Filed | |||||
10.19 | Second Amendment to Construction Loan Agreement among Stratus Lakeway Center L.L.C., as Borrower, PlainsCapital Bank, as Administrative Agent and the Other Financial Institutions party thereto as Lenders dated as of February 5, 2015. | 10-Q | 000-19989 | 8/10/2015 | ||||||
10.20 | Third Amendment to Construction Loan Agreement among Stratus Lakeway Center L.L.C., as Borrower, PlainsCapital Bank, as Administrative Agent and the Other Financial Institutions party thereto as Lenders dated as of May 22, 2015. | 10-Q | 000-19989 | 8/10/2015 | ||||||
10.21 | Fourth Amendment to Construction Loan Agreement among Stratus Lakeway Center L.L.C., as Borrower, PlainsCapital Bank, as Administrative Agent and the Other Financial Institutions party thereto as Lenders dated as of June 3, 2015. | 10-Q | 000-19989 | 8/10/2015 | ||||||
10.22 | Fifth Amendment to Construction Loan Agreement among Stratus Lakeway Center L.L.C., as Borrower, PlainsCapital Bank, as Administrative Agent and the Other Financial Institutions party thereto, as Lenders dated as of October 29, 2015. | 10-Q | 000-19989 | 11/9/2015 | ||||||
10.23 | Promissory Note dated September 29, 2014 executed by and among Stratus Lakeway Center L.L.C. and PlainsCapital Bank. | 10-K | 000-19989 | 3/16/2015 | ||||||
10.24 | Promissory Note dated September 29, 2014 executed by and among Stratus Lakeway Center L.L.C. and Southside Bank. | 10-K | 000-19989 | 3/16/2015 | ||||||
10.25 | Construction Loan Agreement by and between Barton Creek Tecoma I, L.L.C. and Comerica Bank effective as of January 8, 2015. | 10-K | 000-19989 | 3/16/2015 | ||||||
10.26 | Promissory Note by and between Barton Creek Tecoma I, L.L.C. and Comerica Bank dated as of January 8, 2015. | 10-K | 000-19989 | 3/16/2015 | ||||||
10.27* | Stratus Properties Inc. 2013 Stock Incentive Plan, as amended and restated. | 10-K | 000-19989 | 3/16/2015 | ||||||
10.28* | Stratus Properties Inc. 2010 Stock Incentive Plan, as amended and restated. | 10-K | 000-19989 | 3/16/2015 | ||||||
10.29* | Form of Notice of Grant of Nonqualified Stock Options under the Stratus Properties Inc. stock incentive plans (adopted January 2011). | 10-K | 000-19989 | 3/31/2011 | ||||||
10.30* | Form of Notice of Grant of Restricted Stock Units under the Stratus Properties Inc. stock incentive plans (adopted January 2011). | 10-K | 000-19989 | 3/31/2011 | ||||||
10.31* | Form of Notice of Grant of Restricted Stock Units under the 2010 Stock Incentive Plan for Non-Employee Director Grants (adopted August 2012). | 10-K | 000-19989 | 3/29/2013 | ||||||
E-3
Incorporated by Reference | ||||||||||
Exhibit Number | Exhibit Title | Filed with this Form 10-K | Form | File No. | Date Filed | |||||
10.32* | Form of Notice of Grant of Restricted Stock Units under the Stratus Properties Inc. Stock Incentive Plan for Non-Employee Director Grants (adopted August 2014). | 10-K | 000-19989 | 3/16/2015 | ||||||
10.33* | Form of Notice of Grant of Restricted Stock Units under the Stratus Properties Inc. 2013 Stock Incentive Plan (adopted August 2015). | 10-Q | 000-19989 | 11/9/2015 | ||||||
10.34* | Stratus Properties Inc. Performance Incentive Awards Program, as amended, effective December 30, 2008. | 10-Q | 000-19989 | 5/5/2009 | ||||||
10.35* | Stratus Properties Inc. 1996 Stock Option Plan for Non-Employee Directors, as amended and restated. | 10-Q | 000-19989 | 5/10/2007 | ||||||
10.36* | Stratus Properties Inc. Director Compensation. | 10-K | 000-19989 | 3/31/2014 | ||||||
10.37* | Change of Control Agreement between Stratus Properties Inc. and William H. Armstrong III, effective as of April 1, 2013. | 8-K | 000-19989 | 4/5/2013 | ||||||
10.38* | Change of Control Agreement between Stratus Properties Inc. and Erin D. Pickens, effective as of April 1, 2013. | 8-K | 000-19989 | 4/5/2013 | ||||||
List of subsidiaries. | X | |||||||||
Consent of BKM Sowan Horan, LLP. | X | |||||||||
Certified resolution of the Board of Directors of Stratus Properties Inc. authorizing this report to be signed on behalf of any officer or director pursuant to a Power of Attorney. | X | |||||||||
Powers of Attorney pursuant to which this report has been signed on behalf of certain officers and directors of Stratus Properties Inc. | X | |||||||||
Certification of Principal Executive Officer pursuant to Rule 13a-14(a)/15d-14(a). | X | |||||||||
Certification of Principal Financial Officer pursuant to Rule 13a-14(a)/15d-14(a). | X | |||||||||
Certification of Principal Executive Officer pursuant to 18 U.S.C. Section 1350. | X | |||||||||
Certification of Principal Financial Officer pursuant to 18 U.S.C. Section 1350. | X | |||||||||
101.INS | XBRL Instance Document. | X | ||||||||
101.SCH | XBRL Taxonomy Extension Schema. | X | ||||||||
101.CAL | XBRL Taxonomy Extension Calculation Linkbase. | X | ||||||||
101.DEF | XBRL Taxonomy Extension Definition Linkbase. | X | ||||||||
101.LAB | XBRL Taxonomy Extension Label Linkbase. | X | ||||||||
101.PRE | XBRL Taxonomy Extension Presentation Linkbase. | X | ||||||||
_______________________
* Indicates management contract or compensatory plan or arrangement.
E-4