Attached files
| file | filename |
|---|---|
| 8-K - FORM 8-K DATED FEBRUARY 18, 2016 - VALSPAR CORP | valspar160566_8k.htm |
Exhibit 99.1

Information current as of February 18, 2016 First Quarter F2016 Financial Results
Safe Harbor This presentation contains forward - looking statements within the meaning of the Private Securities Litigation Reform Act of 1995 (PSL RA). The PSLRA provides a safe harbor for forward - looking statements. Forward - looking statements are based on management’s current expectations , estimates, assumptions and beliefs about future events, conditions and financial performance. Forward - looking statements are subject to ris ks, uncertainties and other factors, many of which are outside our control and could cause actual results to differ materially from such statements . A ny statement that is not historical in nature is a forward - looking statement. We may identify forward - looking statements with words and phrases such as “ expect,” “project,” “forecast,” “outlook,” “estimate,” “anticipate,” “believe,” “could,” “may,” “will,” “plan to,” “intend,” “should” and similar wo rds or expressions. These risks, uncertainties and other factors include, but are not limited to, deterioration in general economic conditions, both do mes tic and international, that may adversely affect our business; fluctuations in availability and prices of raw materials, including raw material shor tag es and other supply chain disruptions, and the inability to pass along or delays in passing along raw material cost increases to our customers; depende nce of internal sales and earnings growth on business cycles affecting our customers and growth in the domestic and international coatings industry; ma rke t share loss to, and pricing or margin pressure from, larger competitors with greater financial resources; significant indebtedness that restricts th e use of cash flow from operations for acquisitions and other investments; dependence on acquisitions for growth, and risks related to future acquisi tio ns, including adverse changes in the results of acquired businesses, the assumption of unforeseen liabilities and disruptions resulting from the in teg ration of acquisitions; risks and uncertainties associated with operating in foreign markets, including achievement of profitable growth in developing mark ets ; impact of fluctuations in foreign currency exchange rates on our financial results; loss of business with key customers; damage to our reputation and b usi ness resulting from product claims or recalls, litigation, customer perception and other matters; our ability to respond to technology changes an d t o protect our technology; possible interruption, failure or compromise of the information systems we use to operate our business; changes in governmental regulation, including more stringent environmental, health and safety regulations; our reliance on the efforts of vendors, government agencies, uti lit ies and other third parties to achieve adequate compliance and avoid disruption of our business; unusual weather conditions adversely affecting sales; ch ang es in accounting policies and standards and taxation requirements such as new tax laws or revised tax law interpretations; the nature, cost an d o utcome of pending and future litigation and other legal proceedings; civil unrest and the outbreak of war and other significant national and intern ati onal events; and other factors set forth in the risk factors section of our Annual Report on Form 10 - K filed with the Securities and Exchange Commission. We caution investors not to place undue reliance on any such forward - looking statements, which speak only as of the date on which s uch statements were made. We undertake no obligation to subsequently revise any forward - looking statement to reflect new information, events or circumstances after the date of such statement, except as required by law. Investor Contact: Bill Seymour, VP Finance and Investor Relations william.seymour@valspar.com 612 - 656 - 1328 Additional Information: More about Valspar and copies of recent SEC filings can be found at: www.valspar.com 2 February 18, 2016
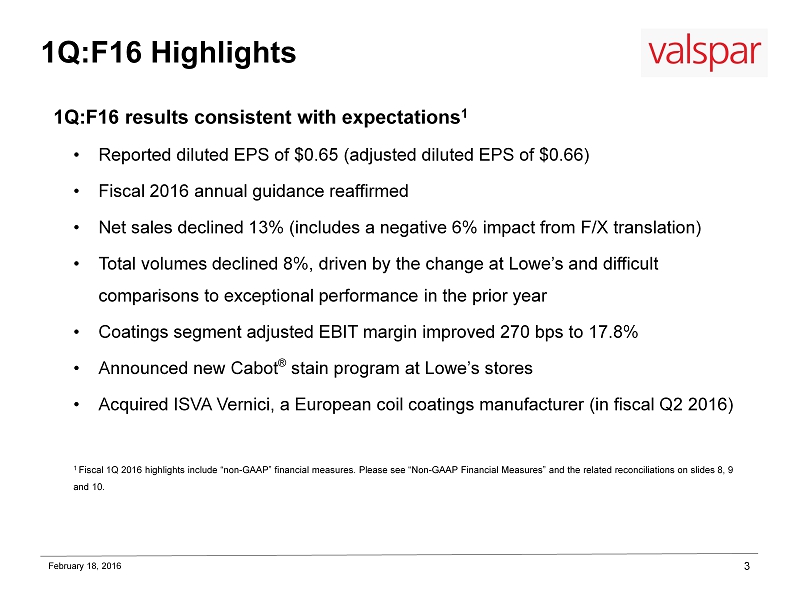
1Q:F16 Highlights 1Q:F16 results consistent with expectations 1 • Reported diluted EPS of $0.65 (adjusted diluted EPS of $0.66) • Fiscal 2016 annual guidance reaffirmed • Net sales declined 13% (includes a negative 6% impact from F/X translation) • Total volumes declined 8%, driven by the change at Lowe’s and difficult comparisons to exceptional performance in the prior year • Coatings segment adjusted EBIT margin improved 270 bps to 17.8% • Announced new Cabot ® stain program at Lowe’s stores • Acquired ISVA Vernici , a European coil coatings manufacturer (in fiscal Q2 2016) 1 Fiscal 1Q 2016 highlights include “non - GAAP” financial measures. Please see “Non - GAAP Financial Measures” and the related reconciliations on slides 8, 9 and 10. 3 February 18, 2016
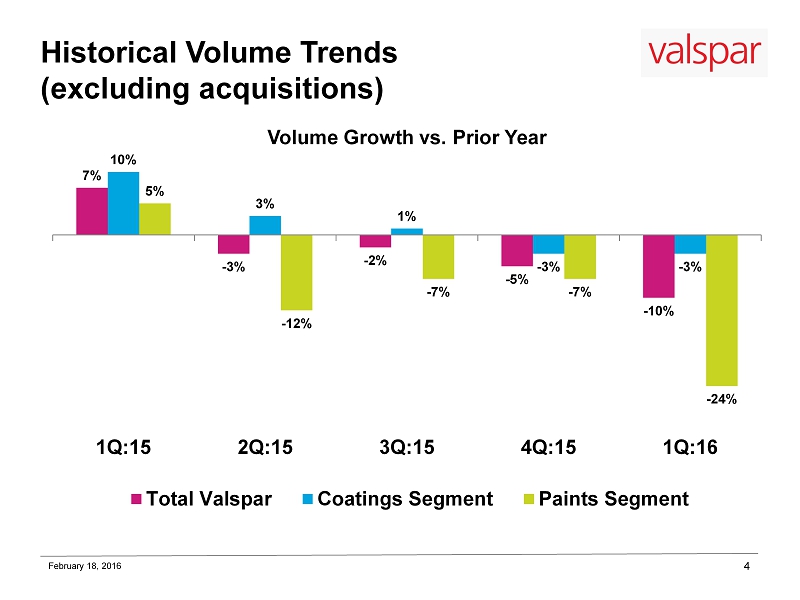
Historical Volume Trends (excluding acquisitions) 4 7% - 3% - 2% - 5% - 10% 10% 3% 1% - 3% - 3% 5% - 12% - 7% - 7% - 24% 1Q:15 2Q:15 3Q:15 4Q:15 1Q:16 Volume Growth vs. Prior Year Total Valspar Coatings Segment Paints Segment February 18, 2016
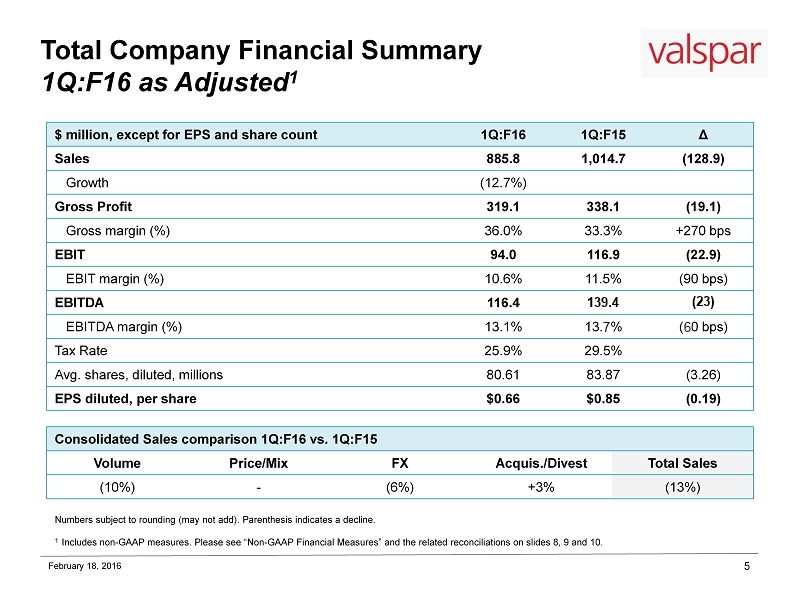
Total Company Financial Summary 1Q:F16 as Adjusted 1 5 $ million, except for EPS and share count 1Q:F16 1Q:F15 Δ Sales 885.8 1,014.7 (128.9) Growth (12.7%) Gross Profit 319.1 338.1 (19.1) Gross margin (%) 36.0% 33.3% +270 bps EBIT 94.0 116.9 (22.9) EBIT margin (%) 10.6% 11.5% (90 bps) EBITDA 116.4 139.4 (23) EBITDA margin (%) 13.1% 13.7% (60 bps) Tax Rate 25.9% 29.5% Avg. shares, diluted, millions 80.61 83.87 (3.26) EPS diluted, per share $0.66 $0.85 (0.19) Numbers subject to rounding (may not add ). Parenthesis indicates a decline. 1 Includes non - GAAP measures. Please see “Non - GAAP Financial Measures” and the related reconciliations on slides 8, 9 and 10. Consolidated Sales comparison 1Q:F16 vs. 1Q:F15 Volume Price/Mix FX Acquis./Divest Total Sales (10%) - (6%) +3% (13%) February 18, 2016
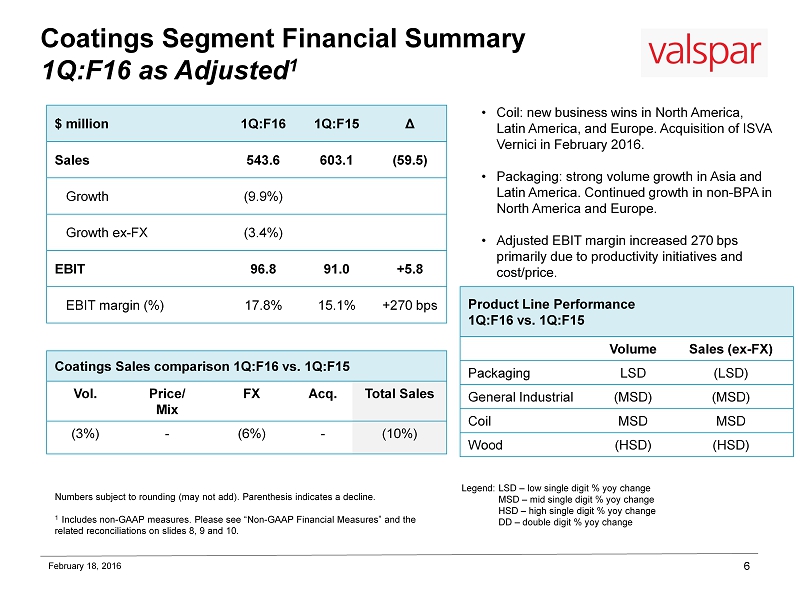
Coatings Segment Financial Summary 1Q:F16 as Adjusted 1 6 $ million 1Q:F16 1Q:F15 Δ Sales 543.6 603.1 (59.5) Growth (9.9%) Growth ex - FX (3.4%) EBIT 96.8 91.0 +5.8 EBIT margin (%) 17.8% 15.1% +270 bps • Coil: new business wins in North America, Latin America, and Europe. Acquisition of ISVA Vernici in February 2016. • Packaging: strong volume growth in Asia and Latin America . Continued growth in non - BPA in North America and Europe. • Adjusted EBIT margin increased 270 bps primarily due to productivity initiatives and cost/price. Legend: LSD – low single digit % yoy change MSD – mid single digit % yoy change HSD – high single digit % yoy change DD – double digit % yoy change Coatings Sales comparison 1Q:F16 vs. 1Q:F15 Vol. Price/ Mix FX Acq . Total Sales (3%) - (6%) - (10%) Product Line Performance 1Q:F16 vs. 1Q:F15 Volume Sales (ex - FX) Packaging LSD (LSD) General Industrial (MSD) (MSD) Coil MSD MSD Wood (HSD) (HSD) February 18, 2016 Numbers subject to rounding (may not add ). Parenthesis indicates a decline. 1 Includes non - GAAP measures. Please see “Non - GAAP Financial Measures” and the related reconciliations on slides 8, 9 and 10.
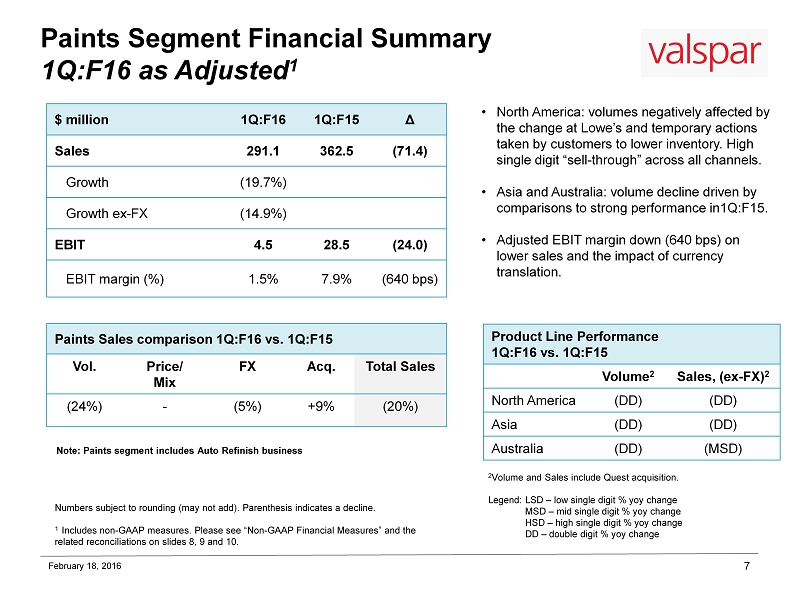
Paints Segment Financial Summary 1Q:F16 as Adjusted 1 7 $ million 1Q:F16 1Q:F15 Δ Sales 291.1 362.5 (71.4) Growth (19.7%) Growth ex - FX (14.9%) EBIT 4.5 28.5 (24.0) EBIT margin (%) 1.5% 7.9% (640 bps) • North America: volumes negatively affected by the change at Lowe’s and temporary actions taken by customers to lower inventory. High single digit “sell - through” across all channels. • Asia and Australia: volume decline driven by comparisons to strong performance in1Q:F15. • Adjusted EBIT margin down (640 bps) on lower sales and the impact of currency translation. Product Line Performance 1Q:F16 vs. 1Q:F15 Volume 2 Sales, (ex - FX) 2 North America (DD) (DD) Asia (DD) (DD) Australia (DD) (MSD) Note: Paints segment includes Auto Refinish business 2 Volume and Sales include Quest acquisition. Legend : LSD – low single digit % yoy change MSD – mid single digit % yoy change HSD – high single digit % yoy change DD – double digit % yoy change February 18, 2016 Paints Sales comparison 1Q:F16 vs. 1Q:F15 Vol. Price/ Mix FX Acq . Total Sales (24%) - (5%) +9% (20%) Numbers subject to rounding (may not add ). Parenthesis indicates a decline. 1 Includes non - GAAP measures. Please see “Non - GAAP Financial Measures” and the related reconciliations on slides 8, 9 and 10.

Non - GAAP Financial Measures 8 The following information provides reconciliations of non - GAAP financial measures from operations, which are presented in this presentation and may be discussed on the earnings conference call today, to the most comparable financial measures calculated and presented in accordance with accounting principles generally accepted in the U . S . (“GAAP”) . The company has provided non - GAAP financial measures, which are not calculated or presented in accordance with GAAP, as information supplemental and in addition to the financial measures presented in the accompanying news release that are calculated and presented in accordance with GAAP . The company uses these non - GAAP measures internally to evaluate our performance and in making financial and operational decisions . The company believes that these measures are useful to an investor for period - to - period comparisons of our operating results . Such non - GAAP financial measures should not be considered superior to, as a substitute for, or as an alternative to, and should be considered in conjunction with, the GAAP financial measures presented . The non - GAAP financial measures may differ from similar measures used by other companies . The following tables reconcile gross profit, operating expense, net income, net income per common share - diluted, diluted earnings per share (EPS) guidance (GAAP financial measures) and earnings before interest and taxes (EBIT) for the periods presented to adjusted gross profit, adjusted operating expense, adjusted net income and adjusted earnings before interest, taxes, depreciation and amortization (adjusted EBITDA), adjusted net income per common share – diluted, adjusted diluted earnings per share (EPS) guidance and adjusted earnings before interest and taxes (EBIT) (non - GAAP financial measures) for the periods presented . February 18, 2016
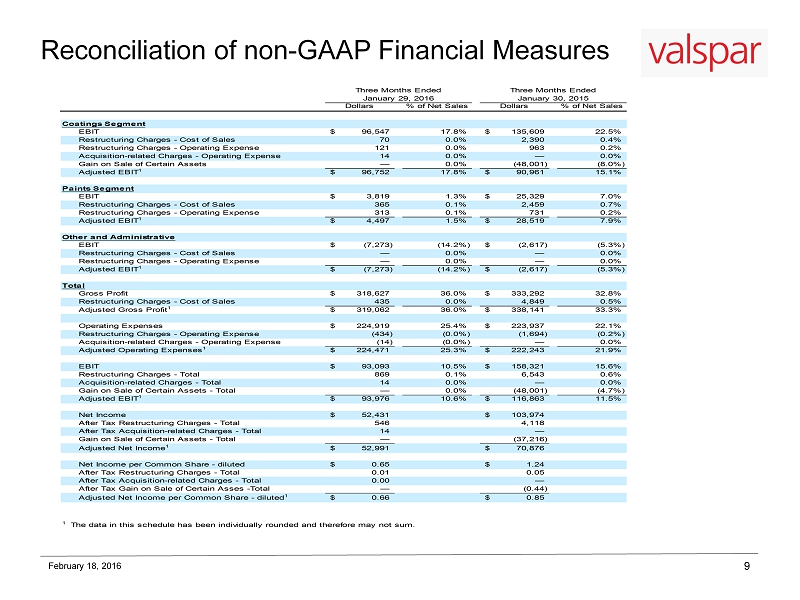
Reconciliation of non - GAAP Financial Measures 9 February 18, 2016 Dollars % of Net Sales Dollars % of Net Sales EBIT 96,547$ 17.8% 135,609$ 22.5% Restructuring Charges - Cost of Sales 70 0.0% 2,390 0.4% Restructuring Charges - Operating Expense 121 0.0% 963 0.2% Acquisition-related Charges - Operating Expense 14 0.0% — 0.0% Gain on Sale of Certain Assets — 0.0% (48,001) (8.0%) Adjusted EBIT 1 96,752$ 17.8% 90,961$ 15.1% EBIT 3,819$ 1.3% 25,329$ 7.0% Restructuring Charges - Cost of Sales 365 0.1% 2,459 0.7% Restructuring Charges - Operating Expense 313 0.1% 731 0.2% Adjusted EBIT 1 4,497$ 1.5% 28,519$ 7.9% EBIT (7,273)$ (14.2%) (2,617)$ (5.3%) Restructuring Charges - Cost of Sales — 0.0% — 0.0% Restructuring Charges - Operating Expense — 0.0% — 0.0% Adjusted EBIT 1 (7,273)$ (14.2%) (2,617)$ (5.3%) Gross Profit 318,627$ 36.0% 333,292$ 32.8% Restructuring Charges - Cost of Sales 435 0.0% 4,849 0.5% Adjusted Gross Profit 1 319,062$ 36.0% 338,141$ 33.3% Operating Expenses 224,919$ 25.4% 223,937$ 22.1% Restructuring Charges - Operating Expense (434) (0.0%) (1,694) (0.2%) Acquisition-related Charges - Operating Expense (14) (0.0%) — 0.0% Adjusted Operating Expenses 1 224,471$ 25.3% 222,243$ 21.9% EBIT 93,093$ 10.5% 158,321$ 15.6% Restructuring Charges - Total 869 0.1% 6,543 0.6% Acquisition-related Charges - Total 14 0.0% — 0.0% Gain on Sale of Certain Assets - Total — 0.0% (48,001) (4.7%) Adjusted EBIT 1 93,976$ 10.6% 116,863$ 11.5% Net Income 52,431$ 103,974$ After Tax Restructuring Charges - Total 546 4,118 After Tax Acquisition-related Charges - Total 14 — Gain on Sale of Certain Assets - Total — (37,216) Adjusted Net Income 1 52,991$ 70,876$ Net Income per Common Share - diluted 0.65$ 1.24$ After Tax Restructuring Charges - Total 0.01 0.05 After Tax Acquisition-related Charges - Total 0.00 — After Tax Gain on Sale of Certain Asses -Total — (0.44) Adjusted Net Income per Common Share - diluted 1 0.66$ 0.85$ January 29, 2016 January 30, 2015 Three Months Ended Three Months Ended 1 The data in this schedule has been individually rounded and therefore may not sum. Coatings Segment Paints Segment Other and Administrative Total

Reconciliation of non - GAAP Financial Measures 10 February 18, 2016 January 29, January 30, 2016 2015 Reconciliation of Adjusted EBITDA Adjusted Net Income 52,991$ 70,876$ Adjusted Income Taxes 18,570 29,672 Interest Expense 22,415 16,315 Adjusted Depreciation and Amortization 2 22,450 22,511 Adjusted EBITDA 1 116,426$ 139,374 $ Reconciliation of Fiscal 2016 Annual Adjusted Diluted EPS Guidance Diluted EPS Guidance $4.70 - $4.85 After Tax Restructuring Charges 0.10 - 0.15 Adjusted Diluted EPS Guidance 1 $4.80 - $5.00 2 Adjusted depreciation excludes $571 and $1,390 of asset related restructuring charges in the first quarter of 2016 and 2015, respectively. Three Months Ended 1 The data in this schedule has been individually rounded and therefore may not sum.