Attached files
| file | filename |
|---|---|
| EX-31.2 - EX-31.2 - GRAHAM CORP | d107138dex312.htm |
| EX-31.1 - EX-31.1 - GRAHAM CORP | d107138dex311.htm |
| EX-32.1 - EX-32.1 - GRAHAM CORP | d107138dex321.htm |
| EX-10.2 - EX-10.2 - GRAHAM CORP | d107138dex102.htm |
| EX-10.1 - EX-10.1 - GRAHAM CORP | d107138dex101.htm |
| EX-10.3 - EX-10.3 - GRAHAM CORP | d107138dex103.htm |
| EX-10.4 - EX-10.4 - GRAHAM CORP | d107138dex104.htm |
| EX-10.5 - EX-10.5 - GRAHAM CORP | d107138dex105.htm |
Table of Contents
UNITED STATES
SECURITIES AND EXCHANGE COMMISSION
WASHINGTON, D.C. 20549
FORM 10-Q
(Mark One)
| x | QUARTERLY REPORT PURSUANT TO SECTION 13 OR 15(d) OF THE SECURITIES EXCHANGE ACT OF 1934 |
For the quarterly period ended December 31, 2015
or
| ¨ | TRANSITION REPORT PURSUANT TO SECTION 13 OR 15(d) OF THE SECURITIES EXCHANGE ACT OF 1934 |
For the transition period from to
Commission File Number 1-8462
GRAHAM CORPORATION
(Exact name of registrant as specified in its charter)
| Delaware |
16-1194720 | |
| (State or other jurisdiction of incorporation or organization) |
(I.R.S. Employer Identification No.) | |
| 20 Florence Avenue, Batavia, New York |
14020 | |
| (Address of principal executive offices) |
(Zip Code) | |
585-343-2216
(Registrant’s telephone number, including area code)
Indicate by check mark whether the registrant: (1) has filed all reports required to be filed by Section 13 or 15(d) of the Securities Exchange Act of 1934 during the preceding 12 months (or for such shorter period that the registrant was required to file such reports), and (2) has been subject to such filing requirements for the past 90 days.
Yes x No ¨
Indicate by check mark whether the registrant has submitted electronically and posted on its corporate Web site, if any, every Interactive Data File required to be submitted and posted pursuant to Rule 405 of Regulation S-T during the preceding 12 months (or for such shorter period that the registrant was required to submit and post such files).
Yes x No ¨
Indicate by check mark whether the registrant is a large accelerated filer, an accelerated filer, a non-accelerated filer or a smaller reporting company. See the definitions of “large accelerated filer,” “accelerated filer” and “smaller reporting company” in Rule 12b-2 of the Exchange Act.
| Large accelerated filer |
¨ |
Accelerated filer |
x | |||
| Non-accelerated filer |
¨ |
Smaller reporting company |
¨ | |||
| (Do not check if a smaller reporting company) |
||||||
Indicate by check mark whether the registrant is a shell company (as defined in Rule 12b-2 of the Exchange Act).
Yes ¨ No x
As of January 26, 2016, there were outstanding 9,808,004 shares of the registrant’s common stock, par value $.10 per share.
Table of Contents
Graham Corporation and Subsidiaries
As of December 31, 2015 and March 31, 2015 and for the Three and Nine-Month Periods
Ended December 31, 2015 and 2014
| Page | ||||||
| FINANCIAL INFORMATION |
||||||
| Unaudited Condensed Consolidated Financial Statements | 4 | |||||
| Management’s Discussion and Analysis of Financial Condition and Results of Operations | 19 | |||||
| Quantitative and Qualitative Disclosures About Market Risk | 29 | |||||
| Controls and Procedures | 30 | |||||
| OTHER INFORMATION | ||||||
| Unregistered Sales of Equity Securities and Use of Proceeds | 31 | |||||
| Exhibits | 31 | |||||
| 32 | ||||||
| 33 | ||||||
2
Table of Contents
GRAHAM CORPORATION AND SUBSIDIARIES
FORM 10-Q
December 31, 2015
3
Table of Contents
| Item 1. | Unaudited Condensed Consolidated Financial Statements |
GRAHAM CORPORATION AND SUBSIDIARIES
CONDENSED CONSOLIDATED STATEMENTS OF OPERATIONS AND RETAINED EARNINGS
(Unaudited)
| Three Months Ended December 31, |
Nine Months Ended December 31, |
|||||||||||||||
| 2015 |
2014 |
2015 |
2014 |
|||||||||||||
| (Amounts in thousands, except per share data) | ||||||||||||||||
| Net sales |
$ | 17,323 | $ | 33,646 | $ | 67,738 | $ | 97,714 | ||||||||
| Cost of products sold |
13,799 | 23,543 | 49,042 | 68,695 | ||||||||||||
|
|
|
|
|
|
|
|
|
|||||||||
| Gross profit |
3,524 | 10,103 | 18,696 | 29,019 | ||||||||||||
|
|
|
|
|
|
|
|
|
|||||||||
| Other expenses and income: |
||||||||||||||||
| Selling, general and administrative |
3,680 | 4,424 | 12,447 | 13,413 | ||||||||||||
| Selling, general and administrative - amortization |
58 | 59 | 175 | 171 | ||||||||||||
| Interest income |
(72 | ) | (50 | ) | (177 | ) | (139 | ) | ||||||||
| Interest expense |
4 | 2 | 8 | 8 | ||||||||||||
| Other income |
(1,784 | ) | - | (1,784 | ) | - | ||||||||||
|
|
|
|
|
|
|
|
|
|||||||||
| Total other expenses and income |
1,886 | 4,435 | 10,669 | 13,453 | ||||||||||||
|
|
|
|
|
|
|
|
|
|||||||||
| Income before provision for income taxes |
1,638 | 5,668 | 8,027 | 15,566 | ||||||||||||
| Provision for income taxes |
364 | 1,676 | 2,416 | 4,996 | ||||||||||||
|
|
|
|
|
|
|
|
|
|||||||||
| Net income |
1,274 | 3,992 | 5,611 | 10,570 | ||||||||||||
| Retained earnings at beginning of period |
108,895 | 99,237 | 106,178 | 93,469 | ||||||||||||
| Dividends |
(795 | ) | (405 | ) | (2,415 | ) | (1,215 | ) | ||||||||
|
|
|
|
|
|
|
|
|
|||||||||
| Retained earnings at end of period |
$ | 109,374 | $ | 102,824 | $ | 109,374 | $ | 102,824 | ||||||||
|
|
|
|
|
|
|
|
|
|||||||||
| Per share data: |
||||||||||||||||
| Basic: |
||||||||||||||||
| Net income |
$ | .13 | $ | .39 | $ | .56 | $ | 1.04 | ||||||||
|
|
|
|
|
|
|
|
|
|||||||||
| Diluted: |
||||||||||||||||
| Net income |
$ | .13 | $ | .39 | $ | .56 | $ | 1.04 | ||||||||
|
|
|
|
|
|
|
|
|
|||||||||
| Weighted average common shares outstanding: |
||||||||||||||||
| Basic: |
9,922 | 10,127 | 10,051 | 10,119 | ||||||||||||
| Diluted: |
9,927 | 10,149 | 10,059 | 10,142 | ||||||||||||
| Dividends declared per share |
$ | .08 | $ | .04 | $ | .24 | $ | .12 | ||||||||
|
|
|
|
|
|
|
|
|
|||||||||
See Notes to Condensed Consolidated Financial Statements.
4
Table of Contents
GRAHAM CORPORATION AND SUBSIDIARIES
CONDENSED CONSOLIDATED STATEMENTS OF COMPREHENSIVE INCOME
(Unaudited)
| Three Months Ended December 31, |
Nine Months Ended December 31, |
|||||||||||||||
| 2015 |
2014 |
2015 |
2014 |
|||||||||||||
| (Amounts in thousands) | ||||||||||||||||
| Net income |
$ | 1,274 | $ | 3,992 | $ | 5,611 | $ | 10,570 | ||||||||
|
|
|
|
|
|
|
|
|
|||||||||
| Other comprehensive income: |
||||||||||||||||
| Foreign currency translation adjustment |
(73 | ) | (40 | ) | (184 | ) | 4 | |||||||||
| Defined benefit pension and other postretirement plans, net of income tax of $107 and $46 for the three months ended December 31, 2015 and 2014, respectively, and $322 and $137 for the nine months ended December 31, 2015 and 2014, respectively |
197 | 84 | 589 | 252 | ||||||||||||
|
|
|
|
|
|
|
|
|
|||||||||
| Total other comprehensive income |
124 | 44 | 405 | 256 | ||||||||||||
|
|
|
|
|
|
|
|
|
|||||||||
| Total comprehensive income |
$ | 1,398 | $ | 4,036 | $ | 6,016 | $ | 10,826 | ||||||||
|
|
|
|
|
|
|
|
|
|||||||||
See Notes to Condensed Consolidated Financial Statements.
5
Table of Contents
GRAHAM CORPORATION AND SUBSIDIARIES
CONDENSED CONSOLIDATED BALANCE SHEETS
(Unaudited)
| December 31, 2015 |
March 31, 2015 |
|||||||
| (Amounts in thousands, except per share data) |
||||||||
| Assets |
||||||||
| Current assets: |
||||||||
| Cash and cash equivalents |
$ | 31,215 | $ | 27,271 | ||||
| Investments |
42,000 | 33,000 | ||||||
| Trade accounts receivable, net of allowances ($76 and $62 at December 31 and March 31, 2015, respectively) |
10,860 | 17,249 | ||||||
| Unbilled revenue |
8,454 | 18,665 | ||||||
| Inventories |
11,803 | 13,994 | ||||||
| Prepaid expenses and other current assets |
866 | 529 | ||||||
| Income taxes receivable |
2,871 | 339 | ||||||
|
|
|
|
|
|||||
| Total current assets |
108,069 | 111,047 | ||||||
| Property, plant and equipment, net |
18,975 | 19,812 | ||||||
| Prepaid pension asset |
2,248 | 1,332 | ||||||
| Goodwill |
6,938 | 6,938 | ||||||
| Permits |
10,300 | 10,300 | ||||||
| Other intangible assets, net |
4,293 | 4,428 | ||||||
| Other assets |
186 | 146 | ||||||
|
|
|
|
|
|||||
| Total assets |
$ | 151,009 | $ | 154,003 | ||||
|
|
|
|
|
|||||
| Liabilities and stockholders’ equity |
||||||||
| Current liabilities: |
||||||||
| Current portion of capital lease obligations |
$ | 55 | $ | 60 | ||||
| Accounts payable |
10,909 | 13,334 | ||||||
| Accrued compensation |
5,500 | 9,343 | ||||||
| Accrued expenses and other current liabilities |
3,153 | 3,247 | ||||||
| Customer deposits |
8,120 | 4,179 | ||||||
|
|
|
|
|
|||||
| Total current liabilities |
27,737 | 30,163 | ||||||
| Capital lease obligations |
174 | 98 | ||||||
| Accrued compensation |
- | 124 | ||||||
| Deferred income tax liability |
6,784 | 5,876 | ||||||
| Accrued pension liability |
353 | 315 | ||||||
| Accrued postretirement benefits |
895 | 876 | ||||||
|
|
|
|
|
|||||
| Total liabilities |
35,943 | 37,452 | ||||||
|
|
|
|
|
|||||
| Commitments and contingencies (Note 11) |
||||||||
| Stockholders’ equity: |
||||||||
| Preferred stock, $1.00 par value, 500 shares authorized |
||||||||
| Common stock, $.10 par value, 25,500 shares authorized |
1,047 | 1,043 | ||||||
| Capital in excess of par value |
22,101 | 21,398 | ||||||
| Retained earnings |
109,374 | 106,178 | ||||||
| Accumulated other comprehensive loss |
(8,651 | ) | (9,056 | ) | ||||
| Treasury stock (620 and 299 shares) |
(8,805 | ) | (3,012 | ) | ||||
|
|
|
|
|
|||||
| Total stockholders’ equity |
115,066 | 116,551 | ||||||
|
|
|
|
|
|||||
| Total liabilities and stockholders’ equity |
$ | 151,009 | $ | 154,003 | ||||
|
|
|
|
|
|||||
See Notes to Condensed Consolidated Financial Statements.
6
Table of Contents
GRAHAM CORPORATION AND SUBSIDIARIES
CONDENSED CONSOLIDATED STATEMENTS OF CASH FLOWS
(Unaudited)
| Nine Months Ended December 31, |
||||||||
| 2015 | 2014 | |||||||
| (Amounts in thousands) | ||||||||
| Operating activities: |
||||||||
| Net income |
$ | 5,611 | $ | 10,570 | ||||
| Adjustments to reconcile net income to net cash provided by operating activities: |
||||||||
| Depreciation |
1,675 | 1,561 | ||||||
| Amortization |
175 | 171 | ||||||
| Amortization of unrecognized prior service cost and actuarial losses |
911 | 389 | ||||||
| Stock-based compensation expense |
540 | 481 | ||||||
| (Gain) loss on disposal of property, plant and equipment |
(1 | ) | 3 | |||||
| Deferred income taxes |
596 | (281 | ) | |||||
| (Increase) decrease in operating assets: |
||||||||
| Accounts receivable |
6,329 | (4,938 | ) | |||||
| Unbilled revenue |
10,152 | (5,463 | ) | |||||
| Inventories |
2,186 | 1,887 | ||||||
| Prepaid expenses and other current and non-current assets |
(420 | ) | (430 | ) | ||||
| Prepaid pension asset |
(917 | ) | (845 | ) | ||||
| Increase (decrease) in operating liabilities: |
||||||||
| Accounts payable |
(2,216 | ) | 2,584 | |||||
| Accrued compensation, accrued expenses and other current and non-current liabilities |
(3,795 | ) | 2,138 | |||||
| Customer deposits |
3,944 | (964 | ) | |||||
| Income taxes payable/receivable |
(2,531 | ) | 743 | |||||
| Long-term portion of accrued compensation, accrued pension liability and accrued postretirement benefits |
(68 | ) | (101 | ) | ||||
|
|
|
|
|
|||||
| Net cash provided by operating activities |
22,171 | 7,505 | ||||||
|
|
|
|
|
|||||
| Investing activities: |
||||||||
| Purchase of property, plant and equipment |
(883 | ) | (4,965 | ) | ||||
| Proceeds from disposal of property, plant and equipment |
4 | 1 | ||||||
| Purchase of investments |
(36,000 | ) | (41,000 | ) | ||||
| Redemption of investments at maturity |
27,000 | 37,000 | ||||||
|
|
|
|
|
|||||
| Net cash used by investing activities |
(9,879 | ) | (8,964 | ) | ||||
|
|
|
|
|
|||||
| Financing activities: |
||||||||
| Principal repayments on capital lease obligations |
(42 | ) | (64 | ) | ||||
| Issuance of common stock |
97 | 48 | ||||||
| Dividends paid |
(2,415 | ) | (1,215 | ) | ||||
| Purchase of treasury stock |
(5,852 | ) | - | |||||
| Excess tax benefit on stock awards |
5 | 37 | ||||||
|
|
|
|
|
|||||
| Net cash used by financing activities |
(8,207 | ) | (1,194 | ) | ||||
|
|
|
|
|
|||||
| Effect of exchange rate changes on cash |
(141 | ) | 3 | |||||
|
|
|
|
|
|||||
| Net increase (decrease) in cash and cash equivalents |
3,944 | (2,650 | ) | |||||
| Cash and cash equivalents at beginning of period |
27,271 | 32,146 | ||||||
|
|
|
|
|
|||||
| Cash and cash equivalents at end of period |
$ | 31,215 | $ | 29,496 | ||||
|
|
|
|
|
|||||
See Notes to Condensed Consolidated Financial Statements.
7
Table of Contents
GRAHAM CORPORATION AND SUBSIDIARIES
NOTES TO CONDENSED CONSOLIDATED FINANCIAL STATEMENTS
(Unaudited)
(Amounts in thousands, except per share data)
NOTE 1 – BASIS OF PRESENTATION:
Graham Corporation’s (the “Company’s”) Condensed Consolidated Financial Statements include its: (i) wholly-owned foreign subsidiary located in Suzhou, China; and (ii) wholly-owned domestic subsidiary located in Lapeer, Michigan. The Condensed Consolidated Financial Statements have been prepared in accordance with accounting principles generally accepted in the U.S. (“GAAP”) for interim financial information and the instructions to Form 10-Q and Rule 10-01 of Regulation S-X, each as promulgated by the Securities and Exchange Commission. The Company’s Condensed Consolidated Financial Statements do not include all information and notes required by GAAP for complete financial statements. The unaudited Condensed Consolidated Balance Sheet as of March 31, 2015 presented herein was derived from the Company’s audited Consolidated Balance Sheet as of March 31, 2015. For additional information, please refer to the consolidated financial statements and notes included in the Company’s Annual Report on Form 10-K for the fiscal year ended March 31, 2015 (“fiscal 2015”). In the opinion of management, all adjustments, including normal recurring accruals considered necessary for a fair presentation, have been included in the Company’s Condensed Consolidated Financial Statements.
The Company’s results of operations and cash flows for the three and nine months ended December 31, 2015 are not necessarily indicative of the results that may be expected for the current fiscal year, which ends March 31, 2016 (“fiscal 2016”).
NOTE 2 – REVENUE RECOGNITION:
The Company recognizes revenue on all contracts with a planned manufacturing process in excess of four weeks (which approximates 575 direct labor hours) using the percentage-of-completion method. The majority of the Company’s revenue is recognized under this methodology. The Company has established the systems and procedures essential to developing the estimates required to account for contracts using the percentage-of-completion method. The percentage-of-completion method is determined by comparing actual labor incurred to a specific date to management’s estimate of the total labor to be incurred on each contract or completion of operational milestones assigned to each contract. Contracts in progress are reviewed monthly by management, and sales and earnings are adjusted in current accounting periods based on revisions in the contract value and estimated costs at completion. Losses on contracts are recognized immediately when evident to management.
Revenue on contracts not accounted for using the percentage-of-completion method is recognized utilizing the completed contract method. The majority of the Company’s contracts (as opposed to revenue) have a planned manufacturing process of less than four weeks and the results reported under this method do not vary materially from the percentage-of-completion method. The Company recognizes revenue and all related costs on these contracts upon substantial completion or shipment to the customer. Substantial completion is consistently defined as at least 95% complete with regard to direct labor hours. Customer acceptance is generally required throughout the construction process and the Company has no further material obligations under its contracts after the revenue is recognized.
Receivables billed but not paid under retainage provisions in the Company’s customer contracts were $1,863 and $1,751 at December 31, 2015 and March 31, 2015, respectively.
8
Table of Contents
NOTE 3 – INVESTMENTS:
Investments consist solely of certificates of deposit with financial institutions. All investments have original maturities of greater than three months and less than one year and are classified as held-to-maturity, as the Company believes it has the intent and ability to hold the securities to maturity. The investments are stated at amortized cost which approximates fair value. All investments held by the Company at December 31, 2015 are scheduled to mature on or before November 10, 2016.
NOTE 4 – INVENTORIES:
Inventories are stated at the lower of cost or market, using the average cost method. For contracts accounted for on the completed contract method, progress payments received are netted against inventory to the extent the payment is less than the inventory balance relating to the applicable contract. Progress payments that are in excess of the corresponding inventory balance are presented as customer deposits in the Condensed Consolidated Balance Sheets. Unbilled revenue in the Condensed Consolidated Balance Sheets represents revenue recognized that has not been billed to customers on contracts accounted for on the percentage-of-completion method. For contracts accounted for on the percentage–of–completion method, progress payments are netted against unbilled revenue to the extent the payment is less than the unbilled revenue for the applicable contract. Progress payments exceeding unbilled revenue are netted against inventory to the extent the payment is less than or equal to the inventory balance relating to the applicable contract, and the excess is presented as customer deposits in the Condensed Consolidated Balance Sheets.
Major classifications of inventories are as follows:
| December 31, 2015 |
March 31, 2015 |
|||||||||
| Raw materials and supplies |
$ | 2,775 | $ | 2,763 | ||||||
| Work in process |
13,277 | 13,685 | ||||||||
| Finished products |
666 | 689 | ||||||||
|
|
|
|
|
|||||||
| 16,718 | 17,137 | |||||||||
| Less - progress payments |
4,915 | 3,143 | ||||||||
|
|
|
|
|
|||||||
| Total |
$ | 11,803 | $ | 13,994 | ||||||
|
|
|
|
|
|||||||
9
Table of Contents
NOTE 5 – INTANGIBLE ASSETS:
Intangible assets are comprised of the following:
| Gross Carrying Amount |
Accumulated Amortization |
Net Carrying Amount |
||||||||||||||
| At December 31, 2015 |
||||||||||||||||
| Intangibles subject to amortization: |
||||||||||||||||
| Customer relationships |
$ | 2,700 | $ | 907 | $ | 1,793 | ||||||||||
|
|
|
|
|
|
|
|||||||||||
| Intangibles not subject to amortization: |
||||||||||||||||
| Permits |
$ | 10,300 | $ | - | $ | 10,300 | ||||||||||
| Tradename |
2,500 | - | 2,500 | |||||||||||||
|
|
|
|
|
|
|
|||||||||||
| $ | 12,800 | $ | - | $ | 12,800 | |||||||||||
|
|
|
|
|
|
|
|||||||||||
| At March 31, 2015 |
||||||||||||||||
| Intangibles subject to amortization: |
||||||||||||||||
| Customer relationships |
$ | 2,700 | $ | 772 | $ | 1,928 | ||||||||||
|
|
|
|
|
|
|
|||||||||||
| Intangibles not subject to amortization: |
||||||||||||||||
| Permits |
$ | 10,300 | $ | - | $ | 10,300 | ||||||||||
| Tradename |
2,500 | - | 2,500 | |||||||||||||
|
|
|
|
|
|
|
|||||||||||
| $ | 12,800 | $ | - | $ | 12,800 | |||||||||||
|
|
|
|
|
|
|
|||||||||||
Intangible assets are amortized on a straight line basis over their estimated useful lives. Intangible amortization expense for each of the three-month periods ended December 31, 2015 and 2014 was $45. Intangible amortization expense for each of the nine months ended December 31, 2015 and 2014 was $135. As of December 31, 2015, amortization expense is estimated to be $45 for the remainder of fiscal 2016 and $180 in each of the fiscal years ending March 31, 2017, 2018, 2019 and 2020.
NOTE 6 – STOCK-BASED COMPENSATION:
The Amended and Restated 2000 Graham Corporation Incentive Plan to Increase Shareholder Value provides for the issuance of up to 1,375 shares of common stock in connection with grants of incentive stock options, non-qualified stock options, stock awards and performance awards to officers, key employees and outside directors; provided, however, that no more than 250 shares of common stock may be used for awards other than stock options. Stock options may be granted at prices not less than the fair market value at the date of grant and expire no later than ten years after the date of grant.
10
Table of Contents
There were no restricted stock awards granted in the three-month periods ended December 31, 2015 and 2014. Restricted stock awards granted in the nine-month periods ended December 31, 2015 and 2014 were 34 and 30, respectively. Restricted shares of 15 and 12 granted to officers in fiscal 2016 and fiscal 2015, respectively, vest 100% on the third anniversary of the grant date subject to the satisfaction of the performance metrics for the applicable three-year period. Restricted shares of 12 and 11 granted to officers and key employees in fiscal 2016 and fiscal 2015, respectively, vest 33 1⁄3% per year over a three-year term. Restricted shares of 7 and 7 granted to directors in fiscal 2016 and fiscal 2015, respectively, vest 100% on the first year anniversary of the grant date. There were no stock option awards granted in the three-month or nine-month periods ended December 31, 2015 and 2014.
During the three months ended December 31, 2015 and 2014, the Company recognized stock-based compensation costs related to stock option and restricted stock awards of $148 and $166, respectively. The income tax benefit recognized related to stock-based compensation was $52 and $59 for the three months ended December 31, 2015 and 2014, respectively. During the nine months ended December 31, 2015 and 2014, the Company recognized stock-based compensation costs related to stock option and restricted stock awards of $505 and $435, respectively. The income tax benefit recognized related to stock-based compensation was $178 and $153 for the nine months ended December 31, 2015 and 2014, respectively.
The Company has an Employee Stock Purchase Plan (the “ESPP”), which allows eligible employees to purchase shares of the Company’s common stock on the last day of a six-month offering period at a purchase price equal to the lesser of 85% of the fair market value of the common stock on either the first day or the last day of the offering period. A total of 200 shares of common stock may be purchased under the ESPP. During the three months ended December 31, 2015 and 2014, the Company recognized stock-based compensation costs of $14 and $16, respectively, related to the ESPP and $5 and $6, respectively, of related tax benefits. During the nine months ended December 31, 2015 and 2014, the Company recognized stock-based compensation costs of $35 and $46, respectively, related to the ESPP and $13 and $16, respectively, of related tax benefits.
11
Table of Contents
NOTE 7 – INCOME PER SHARE:
Basic income per share is computed by dividing net income by the weighted average number of common shares outstanding for the period. Diluted income per share is calculated by dividing net income by the weighted average number of common shares outstanding and, when applicable, potential common shares outstanding during the period. A reconciliation of the numerators and denominators of basic and diluted income per share is presented below:
| Three Months Ended December 31, |
Nine Months Ended December 31, |
|||||||||||||||
| 2015 |
2014 |
2015 |
2014 |
|||||||||||||
| Basic income per share |
||||||||||||||||
| Numerator: |
||||||||||||||||
| Net income |
$ | 1,274 | $ | 3,992 | $ | 5,611 | $ | 10,570 | ||||||||
|
|
|
|
|
|
|
|
|
|||||||||
| Denominator: |
||||||||||||||||
| Weighted average common shares outstanding |
9,922 | 10,127 | 10,051 | 10,119 | ||||||||||||
|
|
|
|
|
|
|
|
|
|||||||||
| Basic income per share |
$ | .13 | $ | .39 | $ | .56 | $ | 1.04 | ||||||||
|
|
|
|
|
|
|
|
|
|||||||||
| Diluted income per share |
||||||||||||||||
| Numerator: |
||||||||||||||||
| Net income |
$ | 1,274 | $ | 3,992 | $ | 5,611 | $ | 10,570 | ||||||||
|
|
|
|
|
|
|
|
|
|||||||||
| Denominator: |
||||||||||||||||
| Weighted average common shares outstanding |
9,922 | 10,127 | 10,051 | 10,119 | ||||||||||||
| Stock options outstanding |
5 | 22 | 8 | 23 | ||||||||||||
|
|
|
|
|
|
|
|
|
|||||||||
| Weighted average common and potential common shares outstanding |
9,927 | 10,149 | 10,059 | 10,142 | ||||||||||||
|
|
|
|
|
|
|
|
|
|||||||||
| Diluted income per share |
$ | .13 | $ | .39 | $ | .56 | $ | 1.04 | ||||||||
|
|
|
|
|
|
|
|
|
|||||||||
Options to purchase a total of 54 and 12 shares of common stock were outstanding at December 31, 2015 and 2014, respectively, but were not included in the above computation of diluted income per share given their exercise prices as they would not be dilutive upon issuance.
NOTE 8 – PRODUCT WARRANTY LIABILITY:
The reconciliation of the changes in the product warranty liability is as follows:
| Three Months Ended December 31, |
Nine Months Ended December 31, |
|||||||||||||||||||
| 2015 |
2014 |
2015 |
2014 |
|||||||||||||||||
| Balance at beginning of period |
$ | 504 | $ | 347 | $ | 653 | $ | 308 | ||||||||||||
| (Income) expense for product warranties |
(158 | ) | 436 | (45 | ) | 573 | ||||||||||||||
| Product warranty claims paid |
(11 | ) | (63 | ) | (273 | ) | (161 | ) | ||||||||||||
|
|
|
|
|
|
|
|
|
|||||||||||||
| Balance at end of period |
$ | 335 | $ | 720 | $ | 335 | $ | 720 | ||||||||||||
|
|
|
|
|
|
|
|
|
|||||||||||||
The income of $158 and $45 for product warranties in the three and nine months ended December 31, 2015, respectively, resulted from the reversal of provisions made that were no longer required due to lower claim experience.
The product warranty liability is included in the line item “Accrued expenses and other current liabilities” in the Condensed Consolidated Balance Sheets.
12
Table of Contents
NOTE 9 – CASH FLOW STATEMENT:
Interest paid was $8 for each of the nine-month periods ended December 31, 2015 and 2014. In addition, income taxes paid for the nine months ended December 31, 2015 and 2014 were $4,348 and $4,497, respectively.
During the nine months ended December 31, 2015 and 2014, respectively, stock option awards were exercised and restricted stock awards vested. In connection with such stock option exercises and vesting, the related income tax benefit realized exceeded the tax benefit that had been recorded pertaining to the compensation cost recognized by $5 and $37, respectively, for such periods. This excess tax benefit has been separately reported under “Financing activities” in the Condensed Consolidated Statements of Cash Flows.
At December 31, 2015 and 2014, there were $20 and $35, respectively, of capital purchases that were recorded in accounts payable and are not included in the caption “Purchase of property, plant and equipment” in the Condensed Consolidated Statements of Cash Flows. During the nine months ended December 31, 2015 and 2014, capital expenditures totaling $113 and $0, respectively, were financed through the issuance of capital leases.
NOTE 10 – EMPLOYEE BENEFIT PLANS:
The components of pension benefit income are as follows:
| Three Months Ended December 31, |
Nine Months Ended December 31, |
|||||||||||||||||||
| 2015 |
2014 |
2015 |
2014 |
|||||||||||||||||
| Service cost |
$ | 130 | $ | 136 | $ | 391 | $ | 409 | ||||||||||||
| Interest cost |
360 | 359 | 1,078 | 1,076 | ||||||||||||||||
| Expected return on assets |
(795 | ) | (758 | ) | (2,385 | ) | (2,275 | ) | ||||||||||||
| Amortization of: |
||||||||||||||||||||
| Unrecognized prior service cost |
- | 1 | - | 3 | ||||||||||||||||
| Actuarial loss |
293 | 145 | 880 | 435 | ||||||||||||||||
|
|
|
|
|
|
|
|
|
|||||||||||||
| Net pension benefit income |
$ | (12 | ) | $ | (117 | ) | $ | (36 | ) | $ | (352 | ) | ||||||||
|
|
|
|
|
|
|
|
|
|||||||||||||
The Company made no contributions to its defined benefit pension plan during the nine months ended December 31, 2015 and does not expect to make any contributions to the plan for the balance of fiscal 2016.
The components of the postretirement benefit cost (income) are as follows:
| Three Months Ended December 31, |
Nine Months Ended December 31, |
|||||||||||||||||||
| 2015 |
2014 |
2015 |
2014 |
|||||||||||||||||
| Service cost |
$ | - | $ | - | $ | - | $ | - | ||||||||||||
| Interest cost |
7 | 8 | 20 | 24 | ||||||||||||||||
| Amortization of prior service benefit |
- | (26 | ) | - | (79 | ) | ||||||||||||||
| Amortization of actuarial loss |
10 | 10 | 30 | 30 | ||||||||||||||||
|
|
|
|
|
|
|
|
|
|||||||||||||
| Net postretirement benefit cost (income) |
$ | 17 | $ | (8 | ) | $ | 50 | $ | (25 | ) | ||||||||||
|
|
|
|
|
|
|
|
|
|||||||||||||
13
Table of Contents
The Company paid benefits of $1 related to its postretirement benefit plan during the nine months ended December 31, 2015. The Company expects to pay benefits of approximately $91 for the balance of fiscal 2016.
The Company self-funds the medical insurance coverage it provides to its U.S. based employees. The Company has obtained a stop loss insurance policy in an effort to limit its exposure to claims. The liability of $273 and $446 on December 31, 2015 and March 31, 2015, respectively, related to the self-insured medical plan is primarily based upon claim history and is included in the caption “Accrued compensation” in the Condensed Consolidated Balance Sheets.
NOTE 11 – COMMITMENTS AND CONTINGENCIES:
The Company has been named as a defendant in lawsuits alleging personal injury from exposure to asbestos allegedly contained in or accompanying products made by the Company. The Company is a co-defendant with numerous other defendants in these lawsuits and intends to vigorously defend itself against these claims. The claims in the Company’s current lawsuits are similar to those made in previous asbestos suits that named the Company as defendant, which either were dismissed when it was shown that the Company had not supplied products to the plaintiffs’ places of work or were settled for immaterial amounts.
As of December 31, 2015, the Company was subject to the claims noted above, as well as other legal proceedings and potential claims that have arisen in the ordinary course of business.
Although the outcome of the lawsuits, legal proceedings or potential claims to which the Company is or may become a party cannot be determined and an estimate of the reasonably possible loss or range of loss cannot be made, management does not believe that the outcomes, either individually or in the aggregate, will have a material effect on the Company’s results of operations, financial position or cash flows.
NOTE 12 – INCOME TAXES:
The Company files federal and state income tax returns in several domestic and international jurisdictions. In most tax jurisdictions, returns are subject to examination by the relevant tax authorities for a number of years after the returns have been filed. The Company is subject to U.S. federal examination for the tax years 2013 through 2015 and examination in state tax jurisdictions for the tax years 2011 through 2015. The Company is subject to examination in the People’s Republic of China for tax years 2012 through 2015.
There was no liability for unrecognized tax benefits at each of December 31, 2015 and March 31, 2015.
14
Table of Contents
NOTE 13 – CHANGES IN ACCUMULATED OTHER COMPREHENSIVE LOSS:
The changes in accumulated other comprehensive loss by component for the nine months ended December 31, 2015 and 2014 are as follows:
| Pension and Other Postretirement Benefit Items |
Foreign Currency Items |
Total | ||||||||||||||
| Balance at April 1, 2015 |
$ | (9,462) | $ | 406 | $ | (9,056) | ||||||||||
| Other comprehensive income before reclassifications |
- | (184) | (184) | |||||||||||||
| Amounts reclassified from accumulated other comprehensive loss |
589 | - | 589 | |||||||||||||
|
|
|
|
|
|
|
|||||||||||
| Net current-period other comprehensive income |
589 | (184) | 405 | |||||||||||||
|
|
|
|
|
|
|
|||||||||||
| Balance at December 31, 2015 |
$ | (8,873) | $ | 222 | $ | (8,651) | ||||||||||
|
|
|
|
|
|
|
|||||||||||
| Pension and Other Postretirement Benefit Items |
Foreign Currency Items |
Total | ||||||||||||||
| Balance at April 1, 2014 |
$ | (6,168) | $ | 403 | $ | (5,765) | ||||||||||
| Other comprehensive income before reclassifications |
- | 4 | 4 | |||||||||||||
| Amounts reclassified from accumulated other comprehensive loss |
252 | - | 252 | |||||||||||||
|
|
|
|
|
|
|
|||||||||||
| Net current-period other comprehensive income |
252 | 4 | 256 | |||||||||||||
|
|
|
|
|
|
|
|||||||||||
| Balance at December 31, 2014 |
$ | (5,916) | $ | (407) | $ | (5,509) | ||||||||||
|
|
|
|
|
|
|
|||||||||||
15
Table of Contents
The reclassifications out of accumulated other comprehensive loss by component for the three and nine months ended December 31, 2015 and 2014 are as follows:
| Details about Accumulated Other Comprehensive Loss Components |
Amount Reclassified from Accumulated Other Comprehensive Loss |
Affected Line Item in the Condensed Consolidated Statements of Operations and Retained Earnings | ||||||||
| Three Months December 31, 2015 |
Three Months December 31, 2014 |
|||||||||
| Pension and other postretirement benefit items: |
||||||||||
| Amortization of unrecognized prior service benefit |
$ | - | (1) | $ | 25 | (1) | ||||
| Amortization of actuarial loss |
(304 | )(1) | (155 | )(1) | ||||||
|
|
|
|
|
|||||||
| (304 | ) | (130 | ) | Income before provision for income taxes | ||||||
| (107 | ) | (46 | ) | Provision for income taxes | ||||||
|
|
|
|
|
|||||||
| $ | (197 | ) | $ | (84 | ) | Net income | ||||
|
|
|
|
|
|||||||
| Details about Accumulated Other Comprehensive Loss Components |
Amount Reclassified from Accumulated Other Comprehensive Loss |
Affected Line Item in the Condensed Consolidated Statements of Operations and Retained Earnings | ||||||||
|
|
Nine Months Ended December 31, 2015 |
|
|
Nine Months Ended December 31, 2014 |
|
|||||
| Pension and other postretirement benefit items: |
||||||||||
| Amortization of unrecognized prior service benefit |
$ | - | (1) | $ | 76 | (1) | ||||
| Amortization of actuarial loss |
(911 | )(1) | (465 | )(1) | ||||||
|
|
|
|
|
|||||||
| (911 | ) | (389 | ) | Income before provision for income taxes | ||||||
| (322 | ) | (137 | ) | Provision for income taxes | ||||||
|
|
|
|
|
|||||||
| $ | (589 | ) | $ | (252 | ) | Net income | ||||
|
|
|
|
|
|||||||
| (1) | These accumulated other comprehensive loss components are included within the computation of net pension and other postretirement benefit costs. See Note 10. |
NOTE 14 – PURCHASE OF TREASURY STOCK:
On January 29, 2015, the Company’s Board of Directors authorized a stock repurchase program. Under the stock repurchase program the Company is permitted to repurchase up to $18,000 of its common stock either in the open market or through privately negotiated transactions. Cash on hand has been used to fund all stock repurchases under the program. At December 31, 2015, the Company had purchased 328 shares at an aggregate cost of $5,852 under this program.
16
Table of Contents
NOTE 15 – DEBT:
On December 2, 2015, the Company entered into a new revolving credit facility agreement with JPMorgan Chase Bank, N.A. that provides a $25,000 line of credit, including letters of credit and bank guarantees, expandable at the Company’s option at any time up to $50,000. The agreement has a five year term. This facility replaced a similar facility with Bank of America, N.A.
At the Company’s option, amounts outstanding under the agreement will bear interest at either: (i) a rate equal to the bank’s prime rate; or (ii) a rate equal to LIBOR plus a margin. The margin is based on the Company’s funded debt to earnings before interest expense, income taxes, depreciation and amortization (“EBITDA”) and may range from 1.75% to .95%. Amounts available for borrowing under the agreement are subject to an unused commitment fee of between 0.30% and 0.20%, depending on the above ratio.
Outstanding letters of credit under the agreement are subject to a fee of between 1.20% and 0.70%, depending on the Company’s ratio of funded debt to EBITDA. The agreement allows the Company to reduce the fee on outstanding letters of credit to a fixed rate of .40% by securing outstanding letters of credit with cash and cash equivalents. At December 31, 2015, there were no letters of credit outstanding on the new revolving credit facility and $10,042 outstanding with Bank of America, N.A., which were secured by cash and cash equivalents.
Under the new revolving credit facility, the Company covenants to maintain a maximum funded debt to EBITDA ratio of 3.5 to 1.0 and a minimum earnings before interest expense and income taxes to interest ratio of 4.0 to 1.0. The agreement also provides that the Company is permitted to pay dividends without limitation if it maintains a maximum funded debt to EBITDA ratio equal to or less than 2.0 to 1.0 and permits the Company to pay dividends in an amount equal to 25% of net income if it maintains a maximum funded debt to EBITDA ratio of greater than 2.0 to 1.0.
NOTE 16 – OTHER INCOME:
During the three and nine months ended December 31, 2015, certain orders from customers were cancelled. The contracts for the cancelled orders included provisions that entitled the Company to cancellation charges. The amount of the cancellation charges were negotiated and settled with the customers. This income, net of costs incurred on the contracts, of $1,784 is presented in the caption “Other Income” in the Condensed Consolidated Statements of Operations and Retained Earnings for the three and nine months ended December 31, 2015.
17
Table of Contents
NOTE 17 – ACCOUNTING AND REPORTING CHANGES:
In the normal course of business, Company management evaluates all new accounting pronouncements issued by the Financial Accounting Standards Board (“FASB”), the Securities and Exchange Commission, the Emerging Issues Task Force, the American Institute of Certified Public Accountants or any other authoritative accounting body to determine the potential impact they may have on the Company’s consolidated financial statements.
In May 2014, the FASB issued guidance related to the accounting for revenue from contracts with customers. This guidance establishes principles for reporting information about the nature, amount, timing and uncertainty of revenue and cash flows arising from a company’s contracts with customers. The guidance requires companies to apply a five-step model when recognizing revenue to depict the transfer of promised goods or services to customers in an amount that reflects the consideration to which the company expects to be entitled in exchange for those goods and services. The guidance also includes a comprehensive set of disclosure requirements regarding revenue recognition. The provisions of the guidance are effective for fiscal years, and interim periods within those fiscal years, beginning after December 15, 2017. The Company is currently evaluating the impact this guidance will have on its financial position, results of operations and cash flows. See Note 2 for a description of the Company’s current revenue recognition policy.
In June 2015, the FASB issued guidance covering a wide range of topics in the FASB Accounting Standards Codifications (the “Codification”). This guidance included changes to clarify the Codification, correct unintended application of guidance, or make minor improvements to the Codification that are not expected to have a significant effect on current accounting practice or create a significant administrative cost on most entities. The provisions of the guidance are effective for fiscal years, and interim periods within those fiscal years, beginning after December 15, 2015 and early adoption is permitted. The Company is currently assessing the impact this guidance will have on its financial position, results of operations, cash flows and disclosures.
In November 2015, the FASB issued guidance related to the balance sheet classification of deferred income taxes. This guidance simplifies the presentation of deferred income taxes and requires deferred tax liabilities and assets be offset and presented as a single noncurrent amount for all tax-paying components of an entity within a particular tax jurisdiction. The provisions of the guidance are effective for fiscal years, and interim periods within those fiscal years, beginning after December 15, 2016. Earlier application of the guidance is permitted as of the beginning of any interim or annual reporting period and may be applied prospectively or retrospectively to all periods presented. The provisions of the guidance were adopted by the Company during the third quarter of fiscal 2016, and the Company elected to apply the provisions retrospectively to all periods presented. The following table presents the impact of applying the provisions retrospectively on individual line items in the Company’s Condensed Consolidated Balance Sheet at March 31, 2015:
| Balance Sheet Caption |
Before Application of Guidance |
Reclassification | After Application of Guidance |
|||||||||||||
| Current deferred income tax asset |
$ | 647 | $ | (647 | ) | $ | - | |||||||||
| Other assets |
$ | 150 | $ | (4 | ) | $ | 146 | |||||||||
| Current deferred income tax liability |
$ | (164 | ) | $ | 164 | $ | - | |||||||||
| Long-term deferred income tax liability |
$ | (6,363 | ) | $ | 487 | $ | (5,876 | ) | ||||||||
Management does not expect any other recently issued accounting pronouncements, which have not already been adopted, to have a material impact on the Company’s consolidated financial statements.
18
Table of Contents
| Item 2. | Management’s Discussion and Analysis of Financial Condition and Results of Operations |
(Amounts in thousands, except per share data)
Overview
We are a global business that designs, manufactures and sells critical equipment for the energy, defense and chemical/petrochemical industries. Our energy markets include oil refining, cogeneration, nuclear and alternative power. For the defense industry, our equipment is used in nuclear propulsion power systems for the U.S. Navy. For the chemical and petrochemical industries, our equipment is used in fertilizer, ethylene, methanol and downstream chemical facilities.
Graham’s global brand is built upon our world-renowned engineering expertise in vacuum and heat transfer technology, responsive and flexible service and high quality standards. We design and manufacture custom-engineered ejectors, vacuum pumping systems, surface condensers and vacuum systems. We are also a leading nuclear code accredited fabrication and specialty machining company. We supply components used inside reactor vessels and outside containment vessels of nuclear power facilities. Our equipment can also be found in other diverse applications such as metal refining, pulp and paper processing, water heating, refrigeration, desalination, food processing, pharmaceutical, heating, ventilating and air conditioning.
Our corporate headquarters are located in Batavia, New York. We have production facilities co-located with our headquarters in Batavia and also at our wholly-owned subsidiary, Energy Steel & Supply Co. (“Energy Steel”), located in Lapeer, Michigan. We also have a wholly-owned foreign subsidiary, Graham Vacuum and Heat Transfer Technology (Suzhou) Co., Ltd. (“GVHTT”), located in Suzhou, China. GVHTT provides sales and engineering support for us in the People’s Republic of China and management oversight throughout Southeast Asia.
Our current fiscal year (which we refer to as “fiscal 2016”) ends March 31, 2016.
Highlights
Highlights for the three and nine months ended December 31, 2015 include:
| • | Net sales for the third quarter of fiscal 2016 were $17,323, a decrease of 49% compared with $33,646 for the third quarter of the fiscal year ended March 31, 2015, referred to as “fiscal 2015.” Net sales for the first nine months of fiscal 2016 were $67,738, down 31% compared with net sales of $97,714 for the first nine months of fiscal 2015. |
| • | Net income and income per diluted share for the third quarter of fiscal 2016 were $1,274 and $0.13, compared with net income of $ 3,992 and income per diluted share of $0.39 for the third quarter of fiscal 2015. Net income and income per diluted share for the first nine months of fiscal 2016 were $5,611 and $0.56, respectively, compared with net income of $10,570 and income per diluted share of $1.04 for the first nine months of fiscal 2015. Net income in the three and nine-month periods of fiscal 2016 was positively impacted by income from cancellation fees. |
| • | Orders booked in the third quarter of fiscal 2016 were $22,263, net of a $3,313 cancellation from backlog (gross orders were $25,576), down 1% compared with the third quarter of fiscal 2015, when orders were $22,558. Orders booked in the first nine months of fiscal 2016 were $66,840, net of two cancellations totaling $7,168 from backlog (gross orders were $74,008), down 25% compared with the first nine months of fiscal 2015, when orders were $89,069. |
19
Table of Contents
| • | Backlog was $113,150 on December 31, 2015, compared with $108,139 on September 30, 2015 and $113,811 on March 31, 2015. |
| • | Gross profit margin and operating margin for the third quarter of fiscal 2016 were 20% and 9%, compared with 30% and 17%, respectively, for the third quarter of fiscal 2015. Gross profit margin and operating margin for the first nine months of fiscal 2016 were 28% and 12% compared with 30% and 16%, respectively, for the first nine months of fiscal 2015. |
| • | We repurchased 141 shares of common stock at a cost of $2,453 in the third quarter of fiscal 2016. We repurchased 328 shares of common stock, at an aggregate cost of $5,852 in the first nine months of fiscal 2016. No shares were repurchased in the third quarter or in the first nine months of fiscal 2015. |
| • | Cash and cash equivalents and investments at December 31, 2015 were $73,215, compared with $62,416 on September 30, 2015 and $60,271 at March 31, 2015. |
Forward-Looking Statements
This report and other documents we file with the Securities and Exchange Commission include “forward-looking statements” within the meaning of Section 27A of the Securities Act of 1933, as amended, and Section 21E of the Securities Exchange Act of 1934, as amended.
These statements involve known and unknown risks, uncertainties and other factors that may cause actual results to be materially different from any future results implied by the forward-looking statements. Such factors include, but are not limited to, the risks and uncertainties identified by us under the heading “Risk Factors” in Item 1A of our Annual Report on Form 10-K for fiscal 2015.
Forward-looking statements may also include, but are not limited to, statements about:
| • | the current and future economic environments affecting us and the markets we serve; |
| • | expectations regarding investments in new projects by our customers; |
| • | sources of revenue and anticipated revenue, including the contribution from the growth of new products, services and markets; |
| • | expectations regarding achievement of revenue and profitability expectations; |
| • | plans for future products and services and for enhancements to existing products and services; |
| • | our operations in foreign countries; |
| • | political instability in regions in which our customers are located; |
| • | our ability to affect our growth and acquisition strategy; |
| • | our ability to expand nuclear power work into new markets; |
| • | our ability to maintain or expand nuclear power work for the U.S. Navy; |
| • | our ability to successfully execute our existing contracts; |
| • | estimates regarding our liquidity and capital requirements; |
20
Table of Contents
| • | timing of conversion of backlog to sales; |
| • | our ability to attract or retain customers; |
| • | the outcome of any existing or future litigation; and |
| • | our ability to increase our productivity and capacity. |
Forward-looking statements are usually accompanied by words such as “anticipate,” “believe,” “estimate,” “may,” “might,” “intend,” “interest,” “appear,” “expect,” “suggest,” “plan,” “encourage,” “potential” and similar expressions. Actual results could differ materially from historical results or those implied by the forward-looking statements contained in this report.
Undue reliance should not be placed on our forward-looking statements. Except as required by law, we undertake no obligation to update or announce any revisions to forward-looking statements contained in this report, whether as a result of new information, future events or otherwise.
Current Market Conditions
Demand for our products and services to the oil refining and chemical industries depends on capital investment for new capacity, retrofit and debottlenecking projects and for planned or unplanned maintenance activity. Uncertainty persists in the oil refining and chemical industries due to the significant reduction and increased volatility in global crude oil prices. This has and is expected to continue to impact industry investment in new capacity and in retrofit and debottlenecking projects. The dramatic reduction and volatility in global crude oil prices has caused a significant slowdown in investment by our oil refining and chemical industry customers. These markets have altered their investment timing over the past year due to this sustained lower price and volatility of crude oil. Capital investment within global refining and chemical industries is projected to be down during the next twelve months and timing of the investment recovery is uncertain. In the near term, we believe that the catalyst for increased investment would likely be higher or more stable crude oil prices. However, if crude oil prices remain low for a sustained period, we expect increased global energy demand would eventually drive additional investment regardless of crude oil prices.
Demand for our products and services, in the nuclear utility market, is affected by investment in maintenance, repair, life extension and nuclear regulatory mandated investment along with global investment in new capacity. We continue to believe the nuclear market provides an important opportunity for growth.
Our naval nuclear propulsion market has demand tied to surface and submarine vessel construction schedules of the primary shipyards who service the U.S. Navy. We expect growth in our naval nuclear propulsion business based on our strategic actions and expected demand.
Our long-term perspective for oil refining and chemical markets remains cautiously optimistic notwithstanding the severity of the current downturn in these markets. We believe that long-term demand drivers are unchanged and have not been affected by the price of crude oil. We believe that the demand which is driven by population growth and an expanding middle class in emerging markets requires an increase in global energy capacity and therefore, investment. Our strategy is to continue to leverage our investments and expand our capabilities and execution capacity to grow market share in the oil refining, chemical and nuclear markets, as well as our business with the U.S. Navy. For more information, refer to the heading “Our Strategy” within Item 1 of our Annual Report on Form 10-K for fiscal 2015.
We believe the long-term outlook in our key markets supports our strategy to grow our revenue to over $200,000 across the next business cycle in our markets. In the near term, new order levels are expected to remain volatile, resulting in both relatively strong and weak periods.
21
Table of Contents
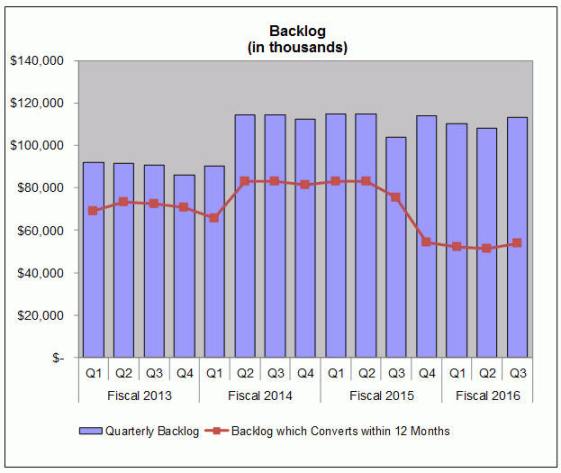
The chart below shows our total backlog for the past 15 quarters, as well as the portion expected to convert within the next 12 months. In recent quarters, the percent of backlog that converts within 12 months has declined due to the increase in the proportion of our backlog that is for the naval nuclear propulsion business and the weakened refining and chemical market fundamentals.
Results of Operations
For an understanding of the significant factors that influenced our performance in the three and nine month periods ended December 31, 2015, the following discussion should be read in conjunction with our condensed consolidated financial statements and the notes to our condensed consolidated financial statements included in Part I, Item 1, of this Quarterly Report on Form 10-Q.
22
Table of Contents
The following table summarizes our results of operations for the periods indicated:
| Three Months Ended December 31, |
Nine Months Ended December 31, |
|||||||||||||||
| 2015 | 2014 | 2015 | 2014 | |||||||||||||
| Net sales |
$ | 17,323 | $ | 33,646 | $ | 67,738 | $ | 97,714 | ||||||||
| Gross profit |
$ | 3,524 | $ | 10,103 | $ | 18,696 | $ | 29,019 | ||||||||
| Gross profit margin |
20 | % | 30 | % | 28 | % | 30 | % | ||||||||
| SG&A (1) |
$ | 3,738 | $ | 4,483 | $ | 12,622 | $ | 13,584 | ||||||||
| SG&A, as a percent of sales |
22 | % | 13 | % | 19 | % | 14 | % | ||||||||
| Net income |
$ | 1,274 | $ | 3,992 | $ | 5,611 | $ | 10,570 | ||||||||
| Diluted income per share |
$ | 0.13 | $ | 0.39 | $ | 0.56 | $ | 1.04 | ||||||||
| Total assets |
$ | 151,009 | $ | 154,883 | $ | 151,009 | $ | 154,883 | ||||||||
| Total assets, excluding cash, cash equivalents and investments |
$ | 77,794 | $ | 92,387 | $ | 77,794 | $ | 92,387 | ||||||||
| (1) | Selling, general and administrative expense is referred to as “SG&A” |
The Third Quarter and First Nine Months of Fiscal 2016 Compared With the Third Quarter and First Nine Months of Fiscal 2015
Sales for the third quarter of fiscal 2016 were $17,323, a 49% decrease as compared with sales of $33,646 for the third quarter of fiscal 2015. These decreased sales were a result of the lower commercial order levels due to the weaker refining and chemical markets which began in the second half of fiscal 2015 and continued during the first nine months of fiscal 2016 compared with a very strong order environment in the previous eighteen months. In addition, we encountered short-term delays caused by customers which impacted sales volume in the third quarter of fiscal 2016. Our domestic sales, as a percentage of aggregate product sales, were 62% in the third quarter of fiscal 2016 compared with 55% in the third quarter of fiscal 2015. Domestic sales year-over-year decreased $7,518, or 41%, reflective of lower sales in all market segments. International sales decreased $8,805, or 58%, in the third quarter of fiscal 2016 compared with the third quarter of fiscal 2015, also driven by decreases across all geographies. Sales in the three months ended December 31, 2015 were 36% to the refining industry, 28% to the chemical and petrochemical industries, 16% to the power industry, including the nuclear market, and 20% to other commercial and industrial applications, including the U.S. Navy. Sales in the three months ended December 31, 2014 were 38% to the refining industry, 28% to the chemical and petrochemical industries, 16% to the power industry, including the nuclear market, and 18% to other commercial and industrial applications, including the U.S. Navy. Fluctuations in sales among markets, products and geographic locations can vary measurably from quarter-to-quarter based on timing and magnitude of projects. See also “Current Market Conditions,” above. For additional information on anticipated future sales and our markets, see “Orders and Backlog” below.
Sales for the first nine months of fiscal 2016 were $67,738, a decrease of $29,976, or 31% compared with sales of $97,714 for the first nine months of fiscal 2015. The decrease in year-to-date sales was due to weaker sales across all geographies and market segments, except the Middle East. Our domestic sales, as a percentage of aggregate product sales, were 65% in the first nine months of fiscal 2016 compared with 64% in the same period in fiscal 2015. Domestic sales decreased $18,720, or 30%, while international sales decreased by $11,256, or 32%, driven by lower sales in all regions, except in the Middle East. International sales accounted for 35% and 36% of total sales for the first nine months of fiscal 2016 and fiscal 2015, respectively. Sales in the first nine months of fiscal 2016 were 31% to the refining industry, 35% to the chemical and petrochemical industries, 14% to the power industry, including the nuclear market, and 20% to other commercial and industrial applications, including the U.S. Navy. Sales in the first nine months of fiscal 2015 were 32% to the refining industry, 35% to the chemical and petrochemical industries, 17% to the power industry, including the nuclear market, and 16% to other commercial and industrial applications, including the U.S. Navy.
23
Table of Contents
Our gross profit margin for the third quarter of fiscal 2016 was 20%, compared with 30% in the third quarter of fiscal 2015. The lower gross margin in the third quarter of fiscal 2016 was due to the low level of revenue achieved and the under absorption of fixed costs related to the sales level. Gross profit for the third quarter of fiscal 2016 decreased to $3,524 from $10,103, or 65%, compared with the same period in fiscal 2015. Gross profit dollars decreased due to lower volume and the related absorption of fixed costs.
Our gross profit margin for the first nine months of fiscal 2016 was 28%, down from 30% in the first nine months of fiscal 2015. Gross profit for the first nine months of fiscal 2016 decreased 36%, to $18,696, compared with the same period in fiscal 2015, which had gross profit of $29,019. The decrease in gross profit dollars was due to lower volume and absorption of fixed costs.
SG&A expense in the three and nine-month periods ended December 31, 2015 decreased $745, or 17%, and $962, or 7%, respectively, compared with the same periods of the prior year, due to lower volume driven expenses and the cost reductions related to the restructuring activity that occurred at the end of fiscal 2015.
SG&A expense as a percent of sales for the three and nine-month periods ended December 31, 2015 was 22 % and 19%, respectively. This compared with 13% and 14%, respectively, for the same periods of the prior year, where volume was higher.
Other income in the three and nine-month periods ended December 31, 2015 was $1,784. This amount was due to cancellation charges received from customers for the $3,313 order cancelled in the current quarter, as well for a $3,855 order cancelled in the second quarter of fiscal 2016. There was no other income in the three and nine-month periods ended December 31, 2014.
Interest income was $72 and $177 for the three and nine-month periods ended December 31, 2015, compared with $50 and $139 for the same periods ended December 31, 2014. The low level of interest income relative to the amount of cash invested reflects the persistent low level of interest rates earned on funds invested in short term U.S. government securities, certificates of deposit and money market accounts.
Interest expense was $4 and $8 for the three and nine-month periods ended December 31, 2015, compared with $2 and $8 for the same periods ended December 31, 2014.
The effective tax rate in the current quarter was 22%, and was 30% in the first nine months of fiscal 2016. The effective tax rates for the comparable three and nine-month periods of fiscal 2015 were 30% and 32%, respectively. The tax rate in the third quarter in both fiscal years was favorably impacted by the calendar year end retroactive reinstatement of the federal research and development tax credit.
Net income for the three and nine months ended December 31, 2015 was $1,274 and $5,611, respectively, compared with $3,992 and $10,570, respectively, for the same periods in the prior fiscal year. Income per diluted share in fiscal 2016 was $0.13 and $0.56 for the three and nine-month periods, compared with $0.39 and $1.04 for the same three and nine-month periods of fiscal 2015.
24
Table of Contents
Liquidity and Capital Resources
The following discussion should be read in conjunction with our Condensed Consolidated Balance Sheets and Consolidated Statements of Cash Flows included in Item 1 of this Quarterly Report on Form 10Q:
| December 31 2015 |
March 31, 2015 |
|||||||
| Cash and cash equivalents and investments |
$ | 73,215 | $ | 60,271 | ||||
| Working capital |
$ | 80,332 | $ | 80,884 | ||||
| Working capital ratio(1) |
3.9 | 3.7 | ||||||
(1) Working capital ratio equals current assets divided by current liabilities.
Net cash generated by operating activities for the first nine months of fiscal 2016 was $22,171, compared with $7,505 generated by operating activities for the first nine months of fiscal 2015. Compared with the first nine months of fiscal 2015, the increase in cash generated was due to strong customer collections and lower unbilled revenue. These were partly offset by lower net income, decreases in accrued compensation, accounts payable and income taxes.
Dividend payments and capital expenditures in the first nine months of fiscal 2016 were $2,415 and $883, respectively, compared with $1,215 and $4,965, respectively, for the first nine months of fiscal 2015. The higher dividend payments were due to a 100% increase in the quarterly dividend which was announced in January 2015. The lower capital expenditures were due to the higher level spent in fiscal 2015 related to the expansion of our Batavia facility.
Capital expenditures for fiscal 2016 are expected to be between approximately $1,500 and $2,000. Approximately 80% of our fiscal 2016 capital expenditures are expected to be for machinery and equipment, with the remaining amounts expected to be used for information technology improvements and other items.
Cash and cash equivalents and investments were $73,215 on December 31, 2015 compared with $60,271 on March 31, 2015, up $12,944, or 21%. In addition, $5,852 of cash was used in the first nine months of fiscal 2016 to repurchase common stock under our previously disclosed stock repurchase program. In total, $8,267 has been returned to shareholders between the share buyback and dividend payments.
We invest net cash generated from operations in excess of cash held for near-term needs in short-term, less than 365 days, certificates of deposit, money market accounts or U.S. government instruments, generally with maturity periods of up to 360 days. Our money market account is used to securitize our outstanding letters of credit, which reduces our cost on those letters of credit. Approximately 95% of our cash and investments is held in the U.S. The remaining 5% is invested by our China operations.
25
Table of Contents
On December 2, 2015, we entered into a new revolving credit facility agreement with JP Morgan Chase Bank, N.A. This revolving credit facility replaced our previous facility, which was with Bank of America, N.A. The new facility is of equivalent size as the one it replaced, providing us with a line of credit of $25,000, including letters of credit and bank guarantees. In addition, our JP Morgan Chase agreement allows us to increase the line of credit, at our discretion, up to another $25,000, for total availability of $50,000. Borrowings under our credit facility are secured by all of our assets. We also have a $5,000 unsecured line of credit with HSBC, N.A. Letters of credit outstanding on December 31, 2015 and March 31, 2015 were $10,042 and $10,903, respectively. The outstanding letters of credit as of December 31, 2015 were issued by Bank of America, under our previous credit facility as well as by HSBC. Bank of America letters of credit of $8,785 as of December 31, 2015 were cash secured and do not reduce the availability on our new credit facility with JP Morgan Chase. HSBC letters of credit were $1,257 as of December 31, 2015. There were no other amounts outstanding on our credit facilities at December 31, 2015 and March 31, 2015. The borrowing rate under our JP Morgan Chase facility as of December 31, 2015 was the bank’s prime rate, or 3.50%. Availability under the JP Morgan Chase and HSBC lines of credit was $28,743 at December 31, 2015. The availability under the Bank of America and HSBC lines, which were in place, on March 31, 2015, was $19,097. We believe that cash generated from operations, combined with our investments and available financing capacity under our credit facility, will be adequate both to meet our cash needs for the immediate future and to support our growth strategies.
Orders and Backlog
Orders for the three-month period ended December 31, 2015 were $22,263, net of a $3,313 cancellation from backlog (gross orders were $25,576), compared with $22,558 for the same period last year, a decrease of $295, or 1%. For the three months ended December 31, 2015, orders were higher in chemical and petrochemical market by $1,289 and power by $5,286. Orders were lower in refining by $3,124 and other commercial and industrial applications, including the U.S. Navy, by $3,746. The refining market orders included the cancellation of $3,313. Excluding the cancellation, orders in the refining market would have been up 2%. Orders represent communications received from customers requesting us to supply products and services.
During the first nine months of fiscal 2016, orders were $66,840, net of two refining market cancellations totaling $7,168 from backlog (gross orders were $74,008), down 25% compared with the first nine months of fiscal 2015, when orders were $89,069. For the first nine months of fiscal 2016, refining orders decreased by $18,800, chemical and petrochemical by $2,735 and other commercial and industrial applications, including the U.S. Navy, by $6,478. These decreases were partially offset by higher Power orders, which were up by $5,783. See “Current Market Conditions” for additional information.
Domestic orders were 42%, or $9,442, while international orders were 58%, or $12,821, of total orders in the current quarter compared with the same period in the prior fiscal year, when domestic orders were 55%, or $12,426, and international orders were 45% of total orders, or $10,132.
26
Table of Contents
For the first nine months of fiscal 2016, domestic orders were 55% of total orders, or $36,674, while international orders were 45%, or $30,166. During the first nine months of fiscal 2015, domestic orders were 51% of total orders, or $45,531, and international orders were 49 %, or $43,538.
Backlog was $113,150 at December 31, 2015, compared with $108,139 on September 30, 2015, an increase of 5% and $113,811 at March 31, 2015, a 1% decrease. Backlog is defined as the total dollar value of orders received for which revenue has not yet been recognized. Approximately 45% to 50% of orders currently in our backlog are expected to be converted to sales within one year, 5% to 10% are expected to be recognized between 12 and 24 months, and 40% to 45% beyond two years. The majority of these orders that convert beyond twelve months are for the U.S. Navy. At December 31, 2015, 24% of our backlog was attributable to equipment for refinery project work 13% for chemical and petrochemical projects, 15% for power projects, including nuclear, 44% for U.S. Navy projects and 4% for other industrial or commercial applications. At December 31, 2014, 37% of our backlog was attributed to equipment for refinery project work, 23% for chemical and petrochemical projects, 11% for power projects, 21% for U.S. Navy projects and 8% for other industrial or commercial applications.
In the third quarter of fiscal 2016, as previously noted, one project totaling $3,313 was cancelled. In the first nine months of fiscal 2016, there were two projects totaling $7,168 which were cancelled. At December 31, 2015, we had one order on hold for $10,084.
Strategy and Outlook
The dramatic drop in oil prices which began during the second half of calendar 2014 has continued to affect investment activity in the refinery and petrochemical markets. The U.S. petrochemical market was very strong in fiscal 2014 and the broader global refining and petrochemical markets began to improve at the start of fiscal 2015. Our pipeline abruptly slowed in the second half of fiscal 2015 as our customers began to decrease their planned capital spending in reaction to lower oil prices. As a result, the first nine months of fiscal 2016 has been weaker than fiscal 2015. We expect this to continue during the last three months of fiscal 2016. While the current slowdown shows no signs of abating, we continue to believe in the long-term strength of the energy markets.
We believe that our diversification strategy in the power market and with the U.S. Navy, coupled with an anticipated recovery in the energy markets, will support our strategy to grow our revenue to over $200,000 across the next business cycle in our markets. We have invested to gain capacity to serve our commercial customers as well as to expand the work we do for the U.S. Navy. We intend to continue to aggressively seek organic growth opportunities. We continue to search for acquisition opportunities that we believe will allow us to expand our presence in both our existing and adjacent markets. We are focused on reducing our earnings volatility, growing our business and diversifying our business and product lines.
27
Table of Contents
We expect revenue to be between $90,000 and $95,000 in fiscal 2016, a decrease when compared with fiscal 2015. We expect gross profit margin in fiscal 2016 to be in the 27% to 28% range. The gross margin in the first nine months of fiscal 2016 was 28%. With the lower revenue expectations in fiscal 2016 compared with fiscal 2015, our production facility utilization and production overhead absorption is likewise expected to decrease, which in turn is expected to put pressure on gross profit margins. Given this environment, while we have reduced our costs, primarily through a voluntary early retirement program, we have intentionally kept our workforce at a level in excess of our needs at the expected fiscal 2016 revenue level. We intend to keep our highly trained and knowledgeable workforce intact to focus on increasing service to our long-term customers during this period of lower demand and to be poised to take full advantage of what we believe will be an eventual energy segment upturn. We intend to continue to invest in organizational capabilities and personnel to prepare for this anticipated future growth. We believe this strategy further enhances the value that our customers receive from Graham and will ultimately drive improved performance. We will continue to review the market situation and if the markets materially deteriorate further or are projected to remain weak for an extended duration, may re-consider how we manage our costs.
SG&A spending during fiscal 2016 is expected to be between 17% and 18% of sales. Our effective tax rate during fiscal 2016 is expected to be between 30% and 31%.
Cash flow in fiscal 2016 has been quite strong as the build-up of accounts receivable and unbilled revenue which occurred in the latter portion of fiscal 2015 has been converted to cash. We expect the sum of our year end cash, cash equivalents and investments position to be similar to the December 31, 2015 level; between $70,000 and $75,000.
We will continue to look toward future growth while being mindful of near-term profitability, given short-term challenges.
Commitments and Contingencies
We have been named as a defendant in lawsuits alleging personal injury from exposure to asbestos allegedly contained in or accompanying our products. We are a co-defendant with numerous other defendants in these lawsuits and intend to vigorously defend ourselves against these claims. The claims in our current lawsuits are similar to those made in previous asbestos lawsuits that named us as a defendant. Such previous lawsuits either were dismissed when it was shown that we had not supplied products to the plaintiffs’ places of work or were settled by us for immaterial amounts.
As of December 31, 2015, we are subject to the claims noted above, as well as other legal proceedings and potential claims that have arisen in the ordinary course of business. Although the outcome of the lawsuits, legal proceedings or potential claims to which we are or may become a party cannot be determined and an estimate of the reasonably possible loss or range of loss cannot be made, we do not believe that the outcomes, either individually or in the aggregate, will have a material effect on our results of operations, financial position or cash flows.
Critical Accounting Policies, Estimates, and Judgments
Our unaudited condensed consolidated financial statements are based on the selection of accounting policies and the application of significant accounting estimates, some of which require management to make significant assumptions. We believe that the most critical accounting estimates used in the preparation of our condensed consolidated financial statements relate to labor hour estimates and establishment of operational milestones which are used to recognize revenue under the percentage-of-completion method, fair value estimates of identifiable tangible and intangible assets acquired in business combinations, accounting for contingencies, under which we accrue a loss when it is probable that a liability has been incurred and the amount can be reasonably estimated, and accounting for pensions and other postretirement benefits. For further information, refer to Item 7 “Management’s Discussion and Analysis of Financial Condition and Results of Operations” and Item 8 “Financial Statements and Supplementary Data” included in our Annual Report on Form 10-K for the year ended March 31, 2015.
28
Table of Contents
Off Balance Sheet Arrangements
We did not have any off balance sheet arrangements as of December 31, 2015 or March 31, 2015, other than operating leases and letters of credit.
| Item 3. | Quantitative and Qualitative Disclosures About Market Risk |
The principal market risks (i.e., the risk of loss arising from market changes) to which we are exposed are foreign currency exchange rates, price risk and project cancellation risk.
The assumptions applied in preparing the following qualitative and quantitative disclosures regarding foreign currency exchange rate, price risk and project cancellation risk are based upon volatility ranges experienced by us in relevant historical periods, our current knowledge of the marketplace, and our judgment of the probability of future volatility based upon the historical trends and economic conditions of the markets in which we operate.
Foreign Currency
International consolidated sales for the three and nine months ended December 31, 2015 were 38% and 35%, respectively, of total sales compared with 45% and 36%, respectively, for the same periods of fiscal 2015. Operating in markets throughout the world exposes us to movements in currency exchange rates. Currency movements can affect sales in several ways, the foremost being our ability to compete for orders against foreign competitors that base their prices on relatively weaker currencies. In addition, cash can be adversely impacted by the conversion of sales made by us in a foreign currency to U.S. dollars. In the first nine months of each of fiscal 2016 and fiscal 2015, all sales by us and our wholly-owned subsidiaries, for which we were paid, were denominated in the local currency of the respective subsidiary (U.S. dollars or Chinese RMB).
We have limited exposure to foreign currency purchases. In each of the first nine months of fiscal 2016 and 2015, our purchases in foreign currencies represented 1% of the cost of products sold. At certain times, we may enter into forward foreign currency exchange agreements to hedge our exposure against potential unfavorable changes in foreign currency values on significant sales and purchase contracts negotiated in foreign currencies. Forward foreign currency exchange contracts were not used in the periods being reported on in this Quarterly Report on Form 10-Q and as of December 31, 2015 and March 31, 2015, we held no forward foreign currency contracts.
Price Risk
Operating in a global marketplace requires us to compete with other global manufacturers which, in some instances, benefit from lower production costs and more favorable economic conditions. Although we believe that our customers differentiate our products on the basis of our manufacturing quality and engineering experience and excellence, among other things, such lower production costs and more favorable economic conditions mean that certain of our competitors are able to offer products similar to ours at lower prices. In severe market downturns, such as we are currently experiencing, we typically see depressed price levels. Moreover, the cost of metals and other materials used in our products have experienced significant volatility. Such factors, in addition to the global effects of the recent volatility and disruption of the capital and credit markets, have resulted in downward demand and pricing pressure on our products.
29
Table of Contents
Project Cancellation and Project Continuation Risk
Adverse economic or specific project conditions can lead to projects being placed on hold or cancelled by our customers. In the third quarter of fiscal 2016, one project totaling $3,313 was cancelled. In the first nine months of fiscal 2016, we have had two projects totaling $7,168 cancelled. We attempt to mitigate the risk of cancellation by structuring contracts with our customers to maximize the likelihood that progress payments made to us for individual projects cover the costs we have incurred. As a result, we do not believe we have a significant cash exposure to projects which may be cancelled.
Open orders are reviewed continuously through communications with customers. If it becomes evident to us that a project is delayed well beyond its original shipment date, management will move the project into “placed on hold” (i.e., suspended) category. Furthermore, if a project is cancelled by our customer, it is removed from our backlog. At December 31, 2015, we had one order on hold for $10,084.
| Item 4. | Controls and Procedures |
Conclusion regarding the effectiveness of disclosure controls and procedures
Our President and Chief Executive Officer (principal executive officer) and Vice President-Finance & Administration and Chief Financial Officer (principal financial officer) each have evaluated the effectiveness of our disclosure controls and procedures (as defined in Exchange Act Rules 13a-15(e) and 15d-15(e)) as of the end of the period covered by this Quarterly Report on Form 10-Q. Based on such evaluation, and as of such date, our President and Chief Executive Officer and Vice President-Finance & Administration and Chief Financial Officer concluded that our disclosure controls and procedures were effective in all material respects.
Changes in internal control over financial reporting
There has been no change to our internal control over financial reporting during the quarter covered by this Quarterly Report on Form 10-Q that has materially affected, or that is reasonably likely to materially affect, our internal control over financial reporting.
30
Table of Contents
GRAHAM CORPORATION AND SUBSIDIARIES
FORM 10-Q
December 31, 2015
| Item 2. | Unregistered Sales of Equity Securities and Use of Proceeds |
Purchase of Equity Securities by the Issuer
On January 29, 2015, our Board of Directors authorized a stock repurchase program. Under the stock repurchase program, up to $18,000 of our common stock may be repurchased by us from time to time either in the open market or through privately negotiated transactions. Common stock repurchases in the quarter ended December 31, 2015 were as follows:
| Period |
Total Number of Shares Purchased |
Average Price Paid Per Share |
Approximate Dollar Value of Shares That May Yet Be Purchased Under the Program |
|||||||||
| 10/01/2015 – 10/31/2015 |
47 | $ | 17.76 | $ | 13,767 | |||||||
| 11/01/2015 – 11/30/2015 |
35 | $ | 17.68 | $ | 13,144 | |||||||
| 12/01/2015 – 12/31/2015 |
59 | $ | 16.94 | $ | 12,148 | |||||||
|
|
|
|||||||||||
| Total |
141 | $ | 17.39 | $ | 12,148 | |||||||
|
|
|
|
|
|
|
|||||||
| Item 6. | Exhibits |
See index to exhibits on page 33 of this report.
31
Table of Contents
Pursuant to the requirements of the Securities Exchange Act of 1934, the Registrant has duly caused this report to be signed on its behalf by the undersigned thereunto duly authorized.
GRAHAM CORPORATION
| By: |
/s/ JEFFREY GLAJCH | |||
| Jeffrey Glajch | ||||
| Vice President-Finance & Administration and | ||||
| Chief Financial Officer |
Date: February 2, 2016
32
Table of Contents
| (10) | Material Contracts | |||
| + | 10.1 | Credit Agreement between the Company and JPMorgan Chase Bank, N.A., dated December 2, 2015. | ||
| + | 10.2 | Revolving Credit Note between the Company and JPMorgan Chase Bank, N.A., dated December 2, 2015. | ||
| + | 10.3 | Pledge and Security Agreement between the Company and JPMorgan Chase Bank, N.A., dated December 2, 2015. | ||
| + | 10.4 | Trademark Security Agreement between the Company and JPMorgan Chase Bank, N.A., dated December 2, 2015. | ||
| + | 10.5 | Patent Security Agreement between the Company and JPMorgan Chase Bank, N.A., dated December 2, 2015. | ||
| (31) | Rule 13a-14(a)/15d-14(a) Certifications | |||
| + | 31.1 | Certification of Principal Executive Officer | ||
| + | 31.2 | Certification of Principal Financial Officer | ||
| (32) | Section 1350 Certification | |||
| + | 32.1 | Section 1350 Certifications | ||
| (101) | Interactive Date File | |||
| + | 101.INS | XBRL Instance Document | ||
| + | 101.SCH | XBRL Taxonomy Extension Schema Document | ||
| + | 101.CAL | XBRL Taxonomy Extension Calculation Linkbase Document | ||
| + | 101.DEF | XBRL Taxonomy Extension Definition Linkbase Document | ||
| + | 101.LAB | XBRL Taxonomy Extension Label Linkbase Document | ||
| + | 101.PRE | XBRL Taxonomy Extension Presentation Linkbase Document | ||
| + Exhibit filed with this report. | ||||
33