Attached files
| file | filename |
|---|---|
| 8-K - FORM 8-K - Simulations Plus, Inc. | simulations_8k-111815.htm |
| EX-99.1 - PRESS RELEASE - Simulations Plus, Inc. | simulations_ex9901.htm |
Exhibit 99.2

( NASDAQ:SLP ) Investor Conference Call November 18, 2015

2 With the exception of historical information, the matters discussed in this presentation are forward - looking statements that involve a number of risks and uncertainties . The actual results of the Company could differ significantly from those statements . Factors that could cause or contribute to such differences include, but are not limited to : continuing demand for the Company’s products, competitive factors, the Company’s ability to finance future growth, the Company’s ability to produce and market new products in a timely fashion, the Company’s ability to continue to attract and retain skilled personnel, and the Company’s ability to sustain or improve current levels of productivity . Further information on the Company’s risk factors is contained in the Company’s quarterly and annual reports and filed with the Securities and Exchange Commission . Safe Harbor Statement

3 Highlights Walt Woltosz Chairman and Chief Executive Officer

4 • Major provider of software and consulting services for pharma R&D • Earliest drug discovery – when a chemist first draws a molecule • Preclinical development (lab and animals) through first - in - human trials • Phase 2 and 3 clinical trials • Beyond patent life to supporting generic companies • Developing new applications in aerospace and general healthcare based on its machine - learning technologies • FY15 revenues up $6.85 million (59.8%) to $18.3 million. • $5.22 million of the increase was revenues from our Buffalo division. • $1.63 million was from growth in our California division. • 4QFY15 revenues were up by $1.7 million (85.8%) to $3.71 million • $1.4 million were from our Buffalo division, bolstering 4 th quarter revenues and income in what has historically been the weakest quarter for the California division. • Diluted EPS for FY15 increased 22.4% to $0.23 per share compared to $0.18 in FY14. Overview

5 • Software renewal rates 99%(fees) • 21 new software client sites added • Product releases • GastroPlus 9.0: • Biologics Module • Dermal Module • Enhanced oral cavity dosing • Enhanced ADMET Predictor integration • ADMET Predictor 7.2: • New property predictions • Retrained metabolism models • Greater GastroPlus integration • KIWI 1.3: • Faster • Enhanced exporting and comparison of models • Consulting services continue to grow 4QFY15 Highlights
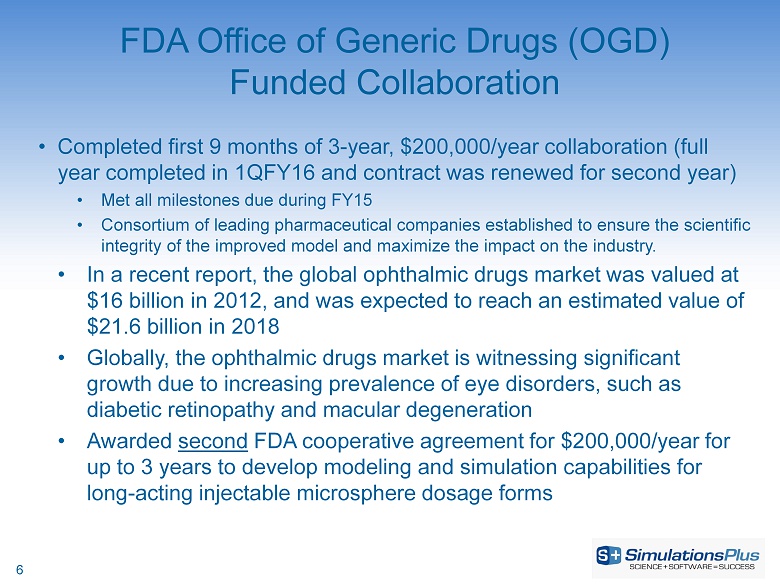
6 • Completed first 9 months of 3 - year, $200,000/year collaboration (full year completed in 1QFY16 and contract was renewed for second year) • Met all milestones due during FY15 • Consortium of leading pharmaceutical companies established to ensure the scientific integrity of the improved model and maximize the impact on the industry. • In a recent report, the global ophthalmic drugs market was valued at $16 billion in 2012, and was expected to reach an estimated value of $21.6 billion in 2018 • Globally, the ophthalmic drugs market is witnessing significant growth due to increasing prevalence of eye disorders, such as diabetic retinopathy and macular degeneration • Awarded second FDA cooperative agreement for $200,000/year for up to 3 years to develop modeling and simulation capabilities for long - acting injectable microsphere dosage forms FDA Office of Generic Drugs (OGD) Funded Collaboration

7 • AEROModeler™ • Application of our artificial neural network ensemble (ANNE) technology to: • Predict aerodynamic force coefficients for missiles at arbitrary Mach number and angle of attack • Classify missiles from radar tracking data • Discriminate between warheads and decoys from sensor data • Presented at 3 aerospace conferences so far in 2015 • MRIModeler™ • Application of our ANNE technology to analysis of magnetic resonance imaging (MRI) data to classify patients as healthy or likely to experience various disease states Exploring Business Opportunities Outside of Pharmaceutical Industry
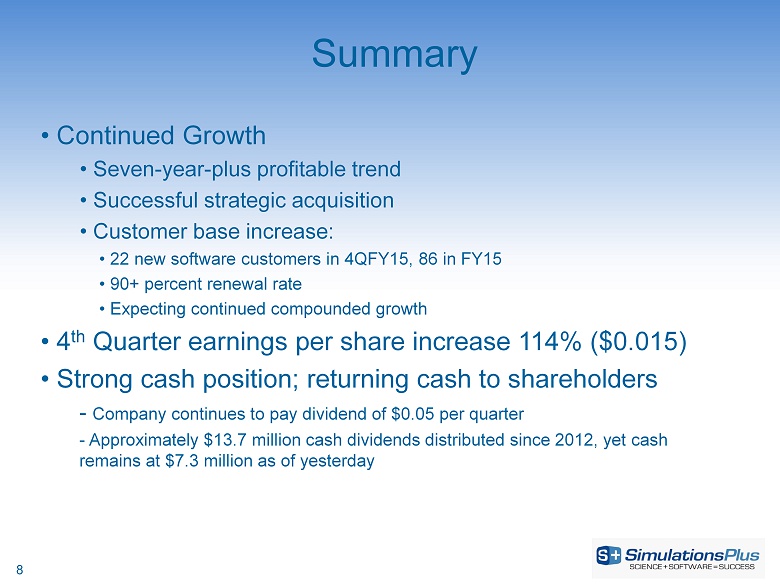
8 • Continued Growth • Seven - year - plus profitable trend • Successful strategic acquisition • Customer base increase: • 22 new software customers in 4QFY15, 86 in FY15 • 90 + percent renewal rate • Expecting continued compounded growth • 4 th Quarter earnings per share increase 114% ($0.015) • Strong cash position; returning cash to shareholders - Company continues to pay dividend of $0.05 per quarter - Approximately $13.7 million cash dividends distributed since 2012, yet cash remains at $7.3 million as of yesterday Summary

9 Financial Overview John Kneisel Chief Financial Officer
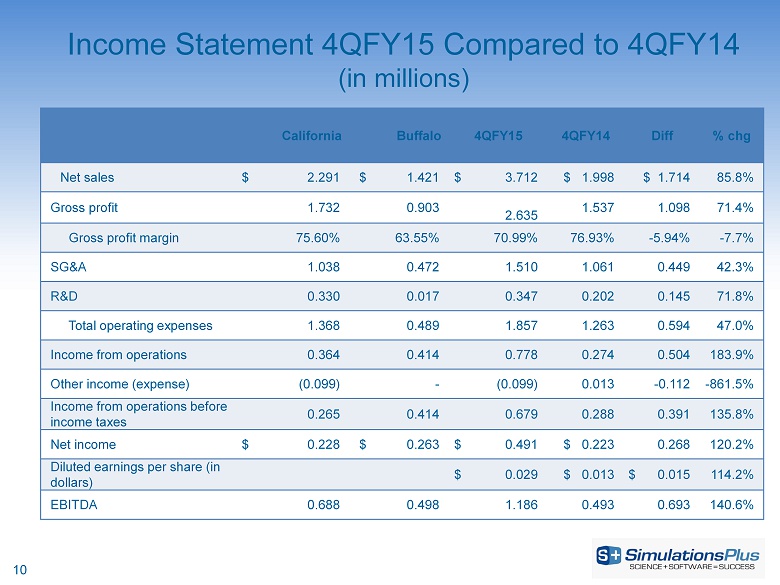
10 Income Statement 4QFY15 Compared to 4QFY14 (in millions) California Buffalo 4QFY15 4QFY14 Diff % chg Net sales $ 2.291 $ 1.421 $ 3.712 $ 1.998 $ 1.714 85.8% Gross profit 1.732 0.903 2.635 1.537 1.098 71.4% Gross profit margin 75.60% 63.55% 70.99% 76.93% - 5.94% - 7.7% SG&A 1.038 0.472 1.510 1.061 0.449 42.3% R&D 0.330 0.017 0.347 0.202 0.145 71.8% Total operating expenses 1.368 0.489 1.857 1.263 0.594 47.0% Income from operations 0.364 0.414 0.778 0.274 0.504 183.9% Other income (expense) ( 0.099) - ( 0.099) 0.013 - 0.112 - 861.5% Income from operations before income taxes 0.265 0.414 0.679 0.288 0.391 135.8% Net income $ 0.228 $ 0.263 $ 0.491 $ 0.223 0.268 120.2% Diluted earnings per share (in dollars) $ 0.029 $ 0.013 $ 0.015 114.2% EBITDA 0.688 0.498 1.186 0.493 0.693 140.6%
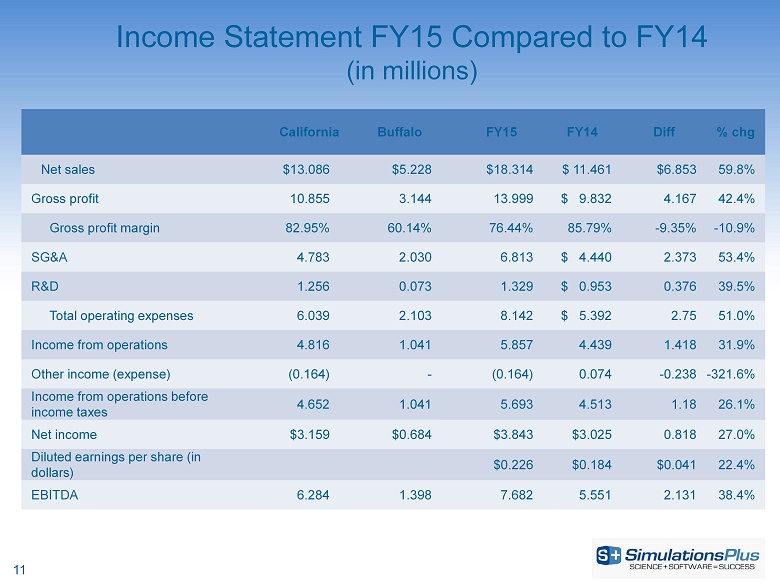
11 Income Statement FY15 Compared to FY14 (in millions) California Buffalo FY15 FY14 Diff % chg Net sales $13.086 $5.228 $18.314 $ 11.461 $6.853 59.8% Gross profit 10.855 3.144 13.999 $ 9.832 4.167 42.4% Gross profit margin 82.95% 60.14% 76.44% 85.79% - 9.35% - 10.9% SG&A 4.783 2.030 6.813 $ 4.440 2.373 53.4% R&D 1.256 0.073 1.329 $ 0.953 0.376 39.5% Total operating expenses 6.039 2.103 8.142 $ 5.392 2.75 51.0% Income from operations 4.816 1.041 5.857 4.439 1.418 31.9% Other income (expense) ( 0.164) - ( 0.164) 0.074 - 0.238 - 321.6% Income from operations before income taxes 4.652 1.041 5.693 4.513 1.18 26.1% Net income $3.159 $0.684 $3.843 $3.025 0.818 27.0% Diluted earnings per share (in dollars) $0.226 $0.184 $0.041 22.4% EBITDA 6.284 1.398 7.682 5.551 2.131 38.4%

12 Consolidated Revenues, by Fiscal Quarter and YTD (pro forma prior to 2012; in millions) 4.01 4.57 5.99 3.71 $0 $1 $2 $3 $4 $5 $6 $7 Q1 Q2 Q3 Q4 2009 2010 2011 2012 2013 2014 2015 18.31 $0 $5 $10 $15 $20 2009 2010 2011 2012 2013 2014 2015

13 Consolidated Gross Profit, by Fiscal Quarter & YTD (pro forma prior to 2012; in millions) 3.09 3.45 4.83 2.64 $0 $1 $2 $3 $4 $5 $6 Q1 Q2 Q3 Q4 2009 2010 2011 2012 2013 2014 2015 14.00 $0 $5 $10 $15 Year end 2009 2010 2011 2012 2013 2014 2015
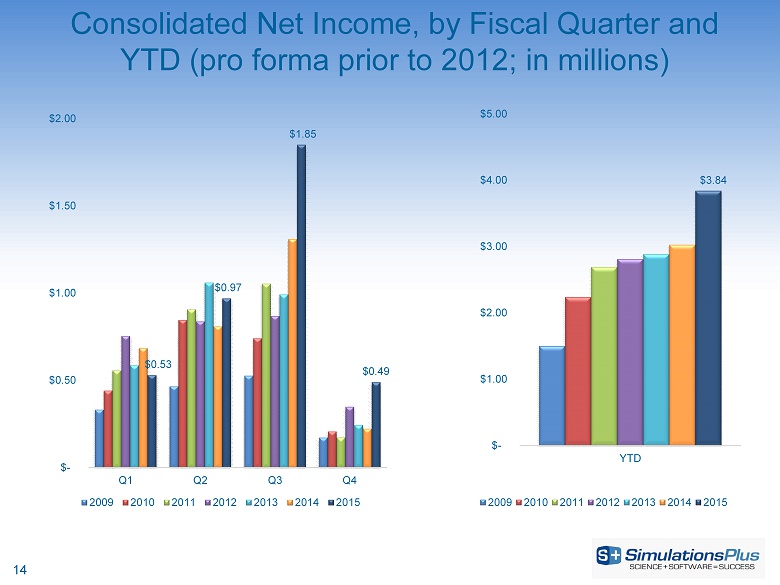
14 Consolidated Net Income, by Fiscal Quarter and YTD (pro forma prior to 2012; in millions) $0.53 $0.97 $1.85 $0.49 $- $0.50 $1.00 $1.50 $2.00 Q1 Q2 Q3 Q4 2009 2010 2011 2012 2013 2014 2015 $3.84 $- $1.00 $2.00 $3.00 $4.00 $5.00 YTD 2009 2010 2011 2012 2013 2014 2015
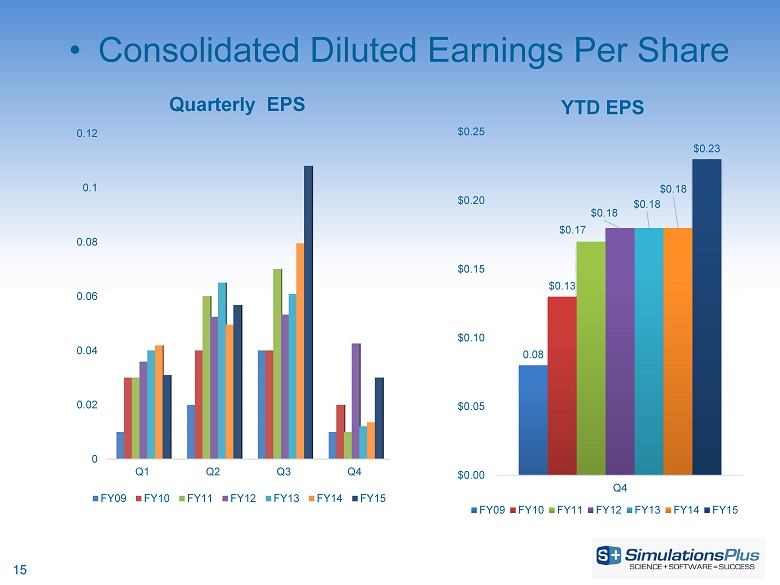
15 • Consolidated Diluted Earnings Per Share 0 0.02 0.04 0.06 0.08 0.1 0.12 Q1 Q2 Q3 Q4 Quarterly EPS FY09 FY10 FY11 FY12 FY13 FY14 FY15 0.08 $0.13 $0.17 $0.18 $0.18 $0.18 $0.23 $0.00 $0.05 $0.10 $0.15 $0.20 $0.25 Q4 YTD EPS FY09 FY10 FY11 FY12 FY13 FY14 FY15

16 Consolidated EBITDA, by Fiscal Quarter & YTD (in millions) 7.68 $0 $1 $2 $3 $4 $5 $6 $7 $8 $9 YTD 2009 2010 2011 2012 2013 2014 2015 1.45 1.97 3.33 1.19 $0 $1 $2 $3 $4 Q1 Q2 Q3 Q4 2009 2010 2011 2012 2013 2014 2015

17 Returning Cash to Shareholders (in millions) 1.6 0.8 0.8 2.2 0 0.5 0.5 0.6 0.81 0.81 0.81 0.84 0.84 0.84 0.85 0.85 13.2 12.9 12.7 11.4 9.3 9.8 10 10.1 10.6 11 7.8 8.6 5.8 6.1 6.4 8.6 7.3 $0 $1 $1 $2 $2 $3 $0 $2 $4 $6 $8 $10 $12 $14 Dividend Paid Cash on Hand Cash paid $2.5M TSRL Cash paid $2.1M for Cognigen

18 Selected Balance Sheet Items (in millions) August 31, 2015 August 31, 2014 Cash and cash equivalents $8.551* $8.614 Cash per share 0.50 0.52 Total current assets 11.533 11.533 Total assets 27.344 20.981 Total current liabilities 3.613 1.391 Total liabilities 7.812 5.545 Current ratio 3.19 8.29 Shareholders’ equity 19.532 15.435 Total liabilities and shareholders’ equity 27.344 20.981 Shareholders’ equity per diluted share 1.147 0.94 * Cash as of November 17, 2015 was ~$7.6 million

19 Marketing and Sales John DiBella VP of Marketing and Sales

20 Overview of Products and Services N H O OH O CH 3 CH 3 CH 3 ADMET Predictor™ GastroPlus ™ Population PK/PD Modeling & Simulations Regulatory Submission MedChem Studio™ MedChem Designer™ DDDPlus ™ MembranePlus™ Consulting Services and Collaborations Discovery Preclinical C linical COMING SOON: PKPlus™

21 • Version 9.5 scheduled for spring 2016 ‒ Intramuscular dosing model – optional add - on model ‒ Antibody - drug conjugate (ADC) models for biologics • Version 8.0 scheduled for early 2016 ‒ Significant refresh of the graphical user interface ‒ New ‘Chemistry’ module – optional add - on incorporating items from MedChem Studio™ • Version 5.0 scheduled for spring 2016 ‒ Significant refresh of graphical user interface Software Product News • Version 5.0 scheduled for early 2016 ‒ Integration of models from ADMET Predictor™ – optional add - on ‒ New dosage form options for immediate & controlled release formulations • Version 1.5 scheduled for 2016 ‒ Ability to model multiple compounds to optimize in vitro drug - drug interaction parameters • New product : v ersion 1.0 scheduled for early 2016 ‒ Validated software for non - compartmental (NCA) & compartmental PK modeling ‒ Reports in user - customized formats for regulatory submission ‒ Large potential market

22 FY15 Sales Review • Highlights: – Software revenue +11.5% vs. FY14 – 91% renewal rate (accounts) – 95% renewal rate (fees) – 17% increase in license units – 31 new commercial companies – 38 new nonprofit groups – PBPK consulting +105%* vs. FY14 • * Does not include FDA grant revenue 54% 13% 32% 1% Consolidated Sales Breakdown Renewal New Consulting Training 0 50 100 150 200 250 1st Quarter 2nd Quarter 3rd Quarter 4th Quarter Software License Units FY13 FY14 FY15

23 New Software Customers Annual Quarterly 0 5 10 15 20 25 Q1 Q2 Q3 Q4 2012 2013 2014 2015 0 10 20 30 40 50 60 70 80 90 100 FY12 FY13 FY14 FY15

24 FY15 Software/PBPK Consulting Revenue by Region Europe 28% (+22% vs. FY14) North America 48% (+11% vs. FY14) Asia 24% (+12% vs. FY14) South America <1% (No change vs. FY14) Japan = 63% China = 17% Korea = 8% India = 7%

25 Marketing Activities – 4QFY15 • Logo Redesign – Redesigned corporate logo – will work on website refresh in FY16 • Conferences and scientific meetings – 14 scientific meetings attended; co - authors on 8 presentations • Trainings and workshops – Hosted 7 onsite training workshops at client sites; 2 @ FDA, 1 @EPA – GastroPlus courses scheduled for China, Europe, India, Japan, Korea, and US in 2016 • Strategic digital marketing initiatives – Hosted 2 webinars on our software updates and applications – Active updates: LinkedIn, Twitter, YouTube, and Facebook accounts – Continued web - based advertising for all programs – 14 peer - reviewed publications citing use of software
26 Buffalo Office Update Expanding Our Reach in Consulting Services and Product Offerings Ted Grasela President

27 Buffalo Growth Opportunities • Strategic and synergistic benefits of the Buffalo (Cognigen) acquisition are being realized • Strong collaborations between Buffalo and Lancaster scientists have identified new and innovative ways of using modeling and simulation to bring valuable insights to our clients’ research and development programs • Social media and Email blasts emphasizing − Modeling & simulation services − Data Assembly services − KIWI™ functionality • Enhanced presence at national and international scientific meetings

28 Status Report - Consulting • Working with 20 companies on 49 projects of which 15 projects started FY16Q1 • Expanded scope of projects with 3 companies • Worked with 7 new companies over the past year • Most common therapeutic area is oncology, followed by neurology and immunology – ~25% of projects result directly in regulatory interaction. • Four contracts for process improvement initiatives to enhance the impact of modeling and simulation activities, indicating a growing commitment to M&S at Pharma companies • Presented 17 posters / publications in 2015 describing Clinical Pharmacology M&S analyses and methodologies.

29 Cutting Edge Scientific Projects • Investigating feasibility of designing formulations to match clinical therapeutic needs • Designing clinical programs for inhaled therapies to improve data input into GastroPlus to improve predictive performance • Leveraging GastroPlus ability to predict intracellular drug concentrations to build new and more predictive models of drug safety and efficacy • Redesigning R&D processes to improve interdisciplinary communications

30

31
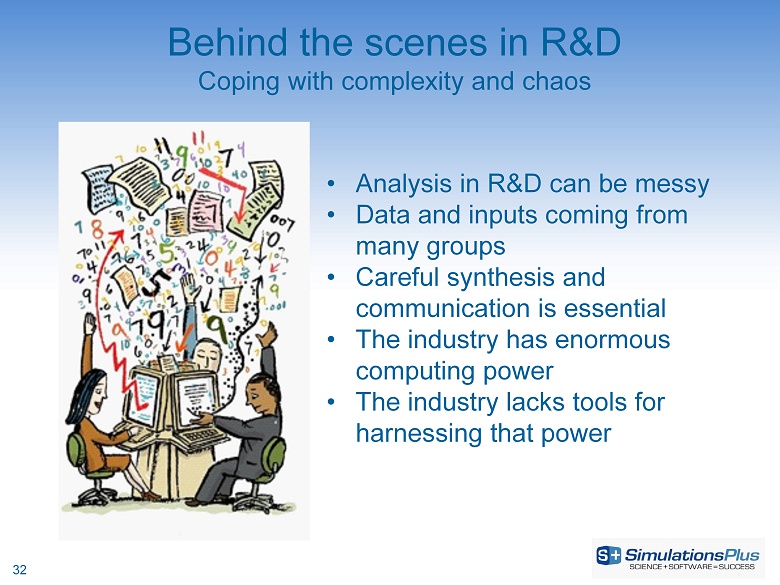
32 • Analysis in R&D can be messy • Data and inputs coming from many groups • Careful synthesis and communication is essential • The industry has enormous computing power • The industry lacks tools for harnessing that power Behind the scenes in R&D Coping with complexity and chaos
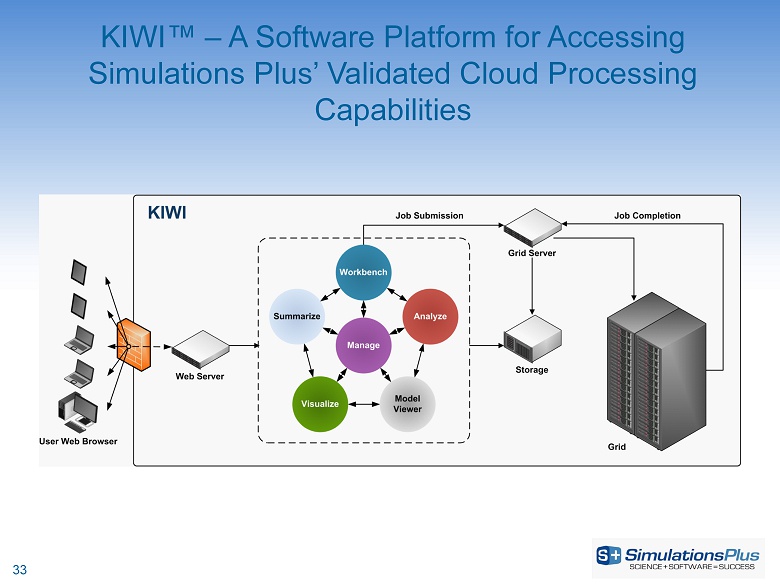
33 KIWI™ – A Software Platform for Accessing Simulations Plus’ Validated Cloud Processing Capabilities

34 • Current KIWI ™ prospects: 6 • Successful PAGE meeting in June 2015 • 10 demonstrations • Successful ACOP meeting in October 2015 • 12 demonstrations • Targeting release of KIWI ™ Version 1.5 in December 2015 • Next release – July 2016 KIWI Update

35 Summary • Buffalo office strong and growing • Revenues and earnings up and contributing to overall growth of Simulations Plus • Consulting expanding through enhanced marketing and sales and through synergies with Lancaster office for PBPK modeling in clinical pharmacology • KIWI software platform generating increased interest with enhanced marketing and sales efforts

36 Final Summary Walt Woltosz Chairman and Chief Executive Officer

37 • California and Buffalo divisions both performing well • Expected synergies being realized • Addressing regulatory agency interests in applying PBPK modeling in clinical pharmacology • Software sales continue strong growth trend • New releases expected to further enhance product offerings • Traditional products • New PKPlus™ software • Pursuing aerospace and healthcare applications of our machine - learning software engine • FY15 revenues up $6.85 million to $18.3 million. • $5.22 million of the increase was revenues from our Buffalo division. • $1.63 million was from growth in our California division. • 4QFY15 revenues were up by $1.7 million • $1.4 million were from our Buffalo division, bolstering 4 th quarter revenues and income in what has historically been the weakest quarter for the California division. • Diluted EPS for FY15 increased 22.4% to $0.23 per share compared to $0.18 in FY14 Summary