Attached files
| file | filename |
|---|---|
| EX-99.1 - EX-99.1 - HMS HOLDINGS CORP | a15-22441_1ex99d1.htm |
| 8-K - 8-K - HMS HOLDINGS CORP | a15-22441_18k.htm |
Exhibit 99.2
Q3 2015 Investor Presentation November 6, 2015

Safe Harbor Statement This presentation contains "forward-looking statements" within the meaning of the U.S. Private Securities Litigation Reform Act of 1995. Such statements give our expectations or forecasts of future events; they do not relate strictly to historical or current facts. Forward-looking statements can be identified by words such as "anticipates," "estimates," "expects," "projects," "intends," "plans," "believes," "will," "target," "seeks," "forecast" and similar expressions and references to guidance. In particular, these include statements relating to future actions, business plans, objectives and prospects, and future operating or financial performance. In addition, statements in this presentation regarding our intention to repurchase shares of our common stock from time to time under the share repurchase program, the intended use of any repurchased shares and the source of funding are forward-looking statements subject to uncertainties. Forward-looking statements are based on our current expectations and assumptions regarding our business, the economy and other future conditions. Should known or unknown risks or uncertainties materialize, or should underlying assumptions prove inaccurate, actual results could differ materially from past results and those anticipated, estimated or projected. We caution you therefore against relying on any of these forward-looking statements. Factors that could cause or contribute to such differences include, but are not limited to: the market price of our common stock prevailing from time to time; the nature of other investment and acquisition opportunities presented to us from time to time; our cash flows from operations, available cash and ability to borrow or use credit; variations in our results of operations; changes in the U.S. healthcare environment and steps we take in anticipation of such changes, including changes in Medicare and Medicaid payments and or reimbursement; regulatory, budgetary or political actions that affect procurement practices; our ability to retain customers or the loss of one or more major customers, including our failure to re-procure a contract or the reduction in scope or early termination of one or more of our significant contracts; our ability to effectively manage our growth to execute on our business plans; the risk that guidance or revenue may not be achieved; the risk that we will not receive a contract award for any current or future procurement or re-procurement, or that either or both may be delayed or cancelled, or the potential failure to prevail in legal proceedings, including any contract award protest; the risk of negative or reduced growth rate of spending on Medicaid/Medicare, simplification of the healthcare payment process or programmatic changes that diminish the scope of benefits; the risk that CMS may not support the RAC program or that the contract terms may be adverse to us; the risk that CMS may cancel or delay future re-procurements or may change the RAC program and reduce future fees or the scope, and may require repayment of certain prior fees; customer dissatisfaction or early termination of contracts triggering significant costs or liabilities; the development by competitors of new or superior products or services; the emergence of new competitors, or the development by our customers of in-house capacity to perform the services we offer; all the risks inherent in the development, introduction and implementation of new products and services; our failure to comply with laws and regulations governing health data or to protect such data from theft and misuse; our ability to maintain effective information systems and protect them from damage, interruption or breach, or the failure of third parties to comply with, or to timely or effectively implement new transaction and code set standards; restrictions on our ability to bid on/perform certain work due to other work we currently perform; the risks and uncertainties attendant to pending or threatened litigation, or the success of litigation, which is not guaranteed; the cost of litigation; our ability to successfully integrate any acquisitions and the risk that such acquisitions will not result in the anticipated benefits; our ability to continue to secure contracts through the competitive bidding process and to accurately predict the cost and time to complete such contracts; unanticipated changes in our effective tax rates; the risk of security breaches of our technology systems and networks; the risk that our efforts to protect intellectual property rights, confidential and proprietary information, or confidential or proprietary information of others in our possession, will not be adequate; our compliance with the covenants and obligations under the terms of our credit facility and our ability to generate sufficient cash to cover our interest and principal payments thereunder; negative results of government or customer reviews, audits or investigations to verify our compliance with contracts and applicable laws and regulations, and/or the risk of debarment or disqualification from doing business with a federal or state government or related agency; general economic conditions; and other factors identified in our most recent Annual Report on Form 10-K and Quarterly Report on Form 10-Q filed with the SEC. A further description of these and other risks, uncertainties and related matters can be found in our Annual Report on Form 10-K for the fiscal year ended December 31, 2014, which is available at www.hms.com under the "Investor Relations" tab and at www.sec.gov. Factors or events that could cause actual results to differ may emerge from time to time and it is not possible for us to predict all of them. Any forward-looking statements are made as of the date of this presentation and we do not undertake an obligation to publicly update forward-looking statements, whether as a result of new information, future events or otherwise, except as may be required by law. HMSY Q3 2015 Investor Presentation / November 6, 2015
Presentation Outline HMSY Q3 2015 Investor Presentation / November 6, 2015 Pages 3Q 2015 Financial Results Highlights Income Statement Market and Product Revenue 1-3 Medicaid Enrollment Growth 4 Commercial Business Growth 5 State Government Business 3Q Sales 2015 Reprocurement Update 6-7 Capital Allocation 8

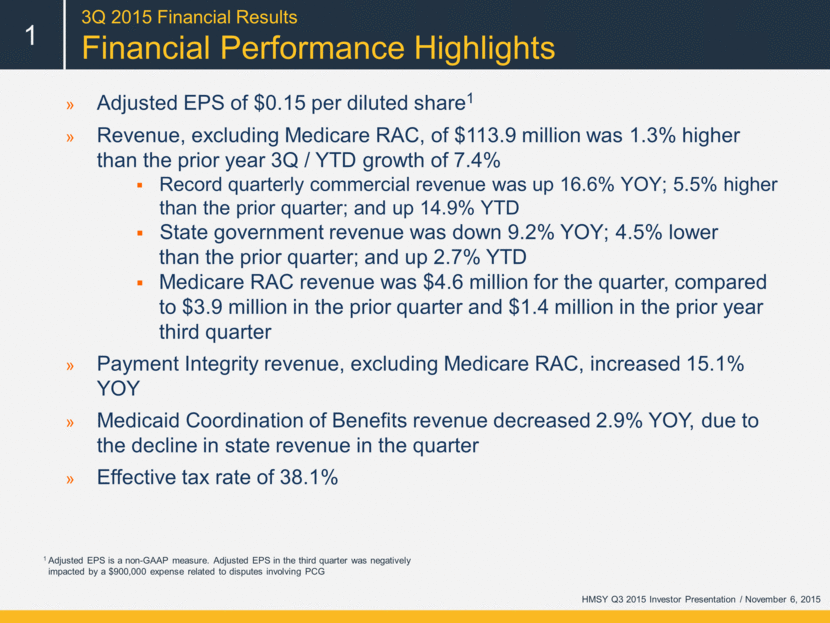
Adjusted EPS of $0.15 per diluted share1 Revenue, excluding Medicare RAC, of $113.9 million was 1.3% higher than the prior year 3Q / YTD growth of 7.4% Record quarterly commercial revenue was up 16.6% YOY; 5.5% higher than the prior quarter; and up 14.9% YTD State government revenue was down 9.2% YOY; 4.5% lower than the prior quarter; and up 2.7% YTD Medicare RAC revenue was $4.6 million for the quarter, compared to $3.9 million in the prior quarter and $1.4 million in the prior year third quarter Payment Integrity revenue, excluding Medicare RAC, increased 15.1% YOY Medicaid Coordination of Benefits revenue decreased 2.9% YOY, due to the decline in state revenue in the quarter Effective tax rate of 38.1% 3Q 2015 Financial Results Financial Performance Highlights HMSY Q3 2015 Investor Presentation / November 6, 2015 1 1 Adjusted EPS is a non-GAAP measure. Adjusted EPS in the third quarter was negatively impacted by a $900,000 expense related to disputes involving PCG
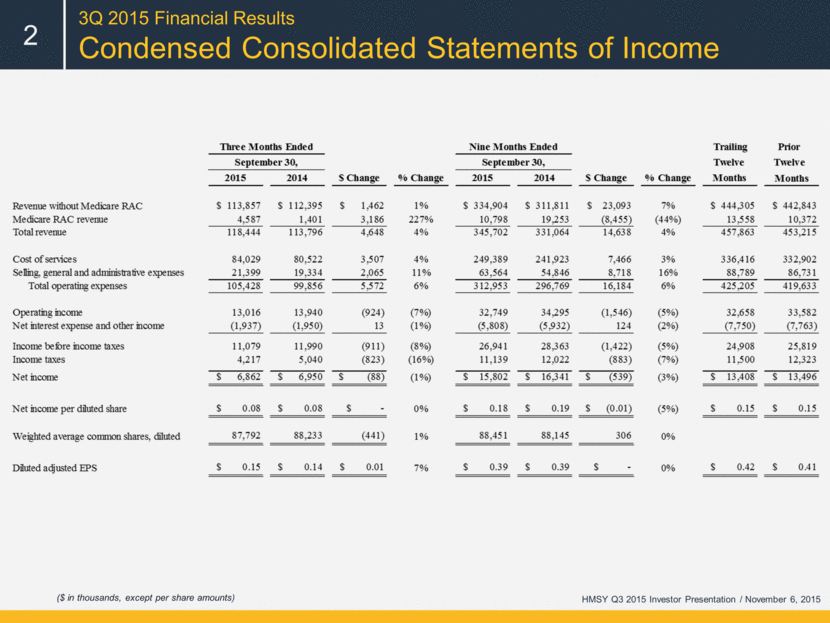
3Q 2015 Financial Results Condensed Consolidated Statements of Income 2 HMSY Q3 2015 Investor Presentation / November 6, 2015 ($ in thousands, except per share amounts) Three Months Ended S Change % Change 1% Nine Months Ended S Change % Change 7% Trailing Twelve Months Prior September 30, September 30, Twelve 2015 2014 2015 2014 Months Revenue without Medicate RAC $ 113,857 $ 112,395 $ 1,462 $ 334,904 $ 311,811 $ 23,093 $ 444,305 $ 442,843 Medicare RAC revenue 4,587 1.401 3.186 227% 10.798 19,253 (8,455) (44%) 13.558 10.372 Total revenue 118,444 113,796 4,648 4% 345,702 331,064 14,638 4% 457,863 453,215 Cost of services 84.029 80.522 3,507 4% 249.389 241.923 7,466 3% 336.416 332,902 Selling, general and administrative expenses 21,399 19,334 2,065 11% 63,564 54,846 8,718 16% 88,789 86,731 Total operating expenses 105,428 99.S56 5,572 6% 312,953 296,769 16,184 6% 425205 419,633 Operating income 13,016 13,940 (924) (7%) 32,749 34295 (1,546) (5%) 32,658 33,582 Net interest expense and other income (1,937) (1,950) 13 (1%) (5,808) 26,941 (5,932) 28,363 124 (2%) (7,750) 24,908 (7,763) Income before income taxes 11,079 11,990 (911) (8%) (1,422) (5%) 25,819 Income taxes 4,217 5,040 (823) (16%) 11,139 12,022 (883) (7%) 11,500 12,323 Net income $ 6,862 $ 6,950 $ (88) (1%) $ 15,802 $ 16,341 $ (539) (3%) $ 13,408 $ 13,496 Net income per diluted share $ 0.08 $ 0.08 $ 0% $ 0.18 $ 0.19 $ (0.01) (5%) $ 0.15 $ 0.15 Weighted average common shares, diluted 87,792 88,233 (441) 1% 88,451 88,145 306 0% Diluted adjusted EPS $ 0.15 $ 0.14 $ 0.01 7% $ 0.39 $ 0.39 $ 0% $ 0.42 $ 0.41
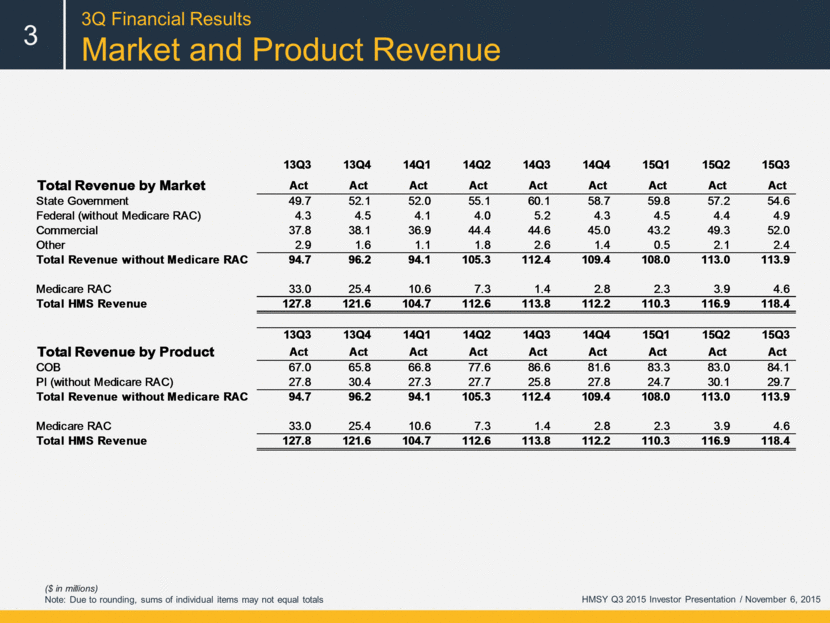
3Q Financial Results Market and Product Revenue 3 ($ in millions) Note: Due to rounding, sums of individual items may not equal totals HMSY Q3 2015 Investor Presentation / November 6, 2015 13Q3 13Q4 14Q1 14Q2 14Q3 14Q4 15Q1 15Q2 15Q3 Total Revenue by Market Act Act Act Act Act Act Act Act Act State Government 49.7 52.1 52.0 55.1 60.1 58.7 59.8 57.2 54.6 Federal (without Medicare RAC) 4.3 4.5 4.1 4.0 5.2 4.3 4.5 4.4 4.9 Commercial 37.8 38.1 36.9 44.4 44.6 45.0 43.2 49.3 52.0 Other 2.9 1.6 1.1 1.8 2.6 1.4 0.5 2.1 2.4 Total Revenue without Medicare RAC 94.7 96.2 94.1 105.3 112.4 109.4 108.0 113.0 113.9 Medicare RAC 33.0 25.4 10.6 7.3 1.4 2.8 2.3 3.9 4.6 Total HMS Revenue 127.8 121.6 104.7 112.6 113.8 112.2 110.3 116.9 118.4 13Q3 13Q4 14Q1 14Q2 14Q3 14Q4 15Q1 15Q2 15Q3 Total Revenue by Product Act Act Act Act Act Act Act Act Act COB 67.0 65.8 66.8 77.6 86.6 81.6 83.3 83.0 84.1 PI (without Medicare RAC) 27.8 30.4 27.3 27.7 25.8 27.8 24.7 30.1 29.7 Total Revenue without Medicare RAC 94.7 96.2 94.1 105.3 112.4 109.4 108.0 113.0 113.9 Medicare RAC 33.0 25.4 10.6 7.3 1.4 2.8 2.3 3.9 4.6 Total HMS Revenue 127.8 121.6 104.7 112.6 113.8 112.2 110.3 116.9 118.4
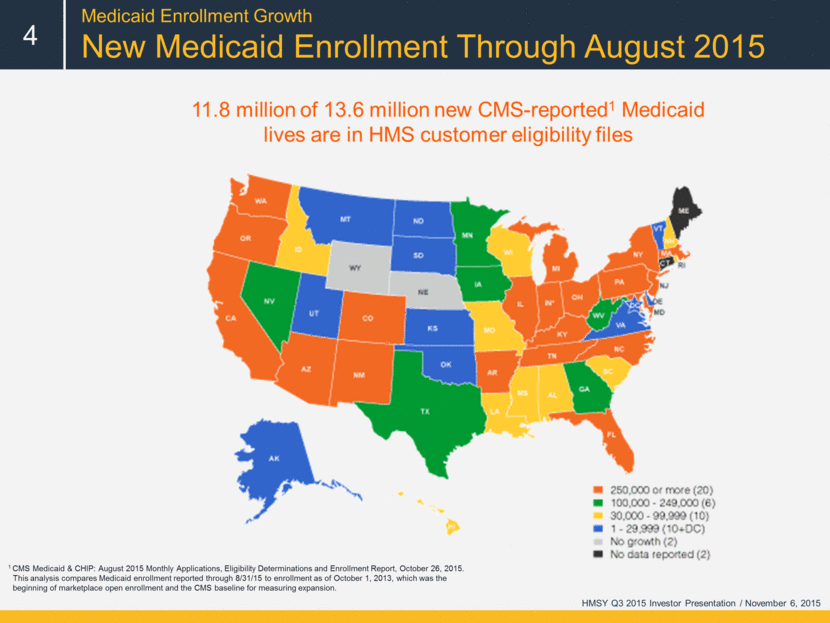
Medicaid Enrollment Growth New Medicaid Enrollment Through August 2015 4 HMSY Q3 2015 Investor Presentation / November 6, 2015 1 CMS Medicaid & CHIP: August 2015 Monthly Applications, Eligibility Determinations and Enrollment Report, October 26, 2015. This analysis compares Medicaid enrollment reported through 8/31/15 to enrollment as of October 1, 2013, which was the beginning of marketplace open enrollment and the CMS baseline for measuring expansion.
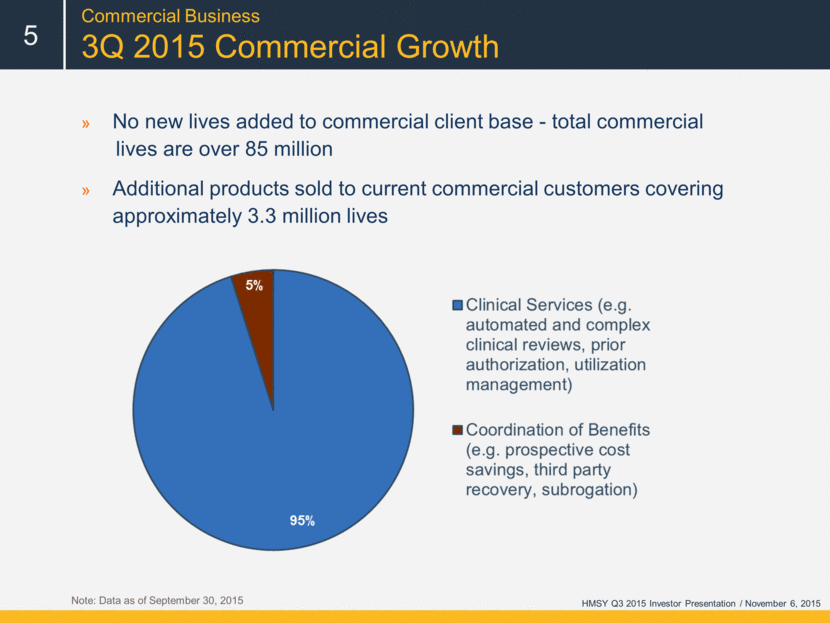
Commercial Business 3Q 2015 Commercial Growth Note: Data as of September 30, 2015 HMSY Q3 2015 Investor Presentation / November 6, 2015 5 No new lives added to commercial client base - total commercial lives are over 85 million Additional products sold to current commercial customers covering approximately 3.3 million lives
State Government Business Q3 State Government Sales* 6 *Business representing over $250K in total contract value HMSY Q3 2015 Investor Presentation / November 6, 2015 1 NE – TPL 2 NY – Dependent eligibility verification audits 3 PA – Medicaid RAC 4 SD – TPL 5 FL – TPL / Claims audit for state employees 6 WI – Rx TPL / Asset verification 7 NJ – Utilization review 8 ME – Credit balance and LTC audits

Florida TPL – New five year contract award received in June (includes option for the state to renew for up to five years) – contract start date of 9/1/15 Illinois TPL – award to competitor, protest filed Kansas TPL proposal submitted in January – current contract1 expires 6/30/17 Massachusetts TPL extended for 21 months – until 12/31/16 New Jersey TPL – award to competitor in protest process – current contract extended to November 29, 2015 New Mexico TPL – new four year contract award received in June New York TPL – New five year contract award received in August2 (includes two one year renewal options) - current contract expires on 1/6/16 Oklahoma TPL – new one year contract award received in May for 7/1/15 start (includes five one year renewal options) Tennessee TPL - RFP issued on 10/5; response due on 11/16; state notice of award scheduled for 11/25; and current contract expires on 1/31/16 Washington TPL – contract extended for one year - until 6/30/16 Wisconsin Casualty – new one year contract award received in April for 7/1/15 start (includes a one year renewal option) Wisconsin TPL – contract extended for one year - until 6/30/16 1 HMS is a subcontractor to HP Enterprise Services 2 Award is being protested by another bidder HMSY Q3 2015 Investor Presentation / November 6, 2015 State Government Business 2015 Reprocurement Update 7
Capital Allocation 3Q Share Repurchases 8 $75 million share repurchase program authorized by HMS Board of Directors in July 2015 Open market or privately negotiated transactions authorized for up to two years $25 million of shares purchased in 3Q1, pursuant to 10b5 -1 program 3Q operating cash flow of $20.4 million Cash balance of $144.8 million on September 30, 2015 Strong Cash Flow Supports Share Repurchase and Potential Acquisitions Data as of September 30, 2015 1 2,652,065 shares repurchased at an average price of $9.40 per share in August 2015 HMSY Q3 2015 Investor Presentation / November 6, 2015
[LOGO]