Attached files
| file | filename |
|---|---|
| EX-32 - EXHIBIT 32 - NET 1 UEPS TECHNOLOGIES INC | exhibit32.htm |
| EX-31.2 - EXHIBIT 31.2 - NET 1 UEPS TECHNOLOGIES INC | exhibit31-2.htm |
| EX-31.1 - EXHIBIT 31.1 - NET 1 UEPS TECHNOLOGIES INC | exhibit31-1.htm |
UNITED STATES
SECURITIES AND EXCHANGE COMMISSION
Washington, D.C. 20549
FORM 10-Q
(Mark One)
[X] QUARTERLY REPORT PURSUANT TO SECTION 13 OR 15(d) OF THE SECURITIES EXCHANGE ACT OF 1934
For the quarterly period ended September 30, 2015
OR
[ ] TRANSITION REPORT PURSUANT TO SECTION 13 OR 15(d) OF THE SECURITIES AND EXCHANGE ACT OF 1934
For the transition period from _________ To __________
Commission file number: 000-31203
NET 1 UEPS TECHNOLOGIES, INC.
(Exact name of registrant as specified in its charter)
| Florida | 98-0171860 |
| (State or other jurisdiction | (IRS Employer |
| of incorporation or organization) | Identification No.) |
President Place, 4th Floor, Cnr. Jan
Smuts Avenue and Bolton Road
Rosebank, Johannesburg 2196, South Africa
(Address of principal executive offices, including zip code)
Registrant’s telephone number, including area code: 27-11-343-2000
Not Applicable
(Former Name, Former Address
and Former Fiscal Year, if Changed Since Last Report)
Indicate by check mark whether the registrant (1) has filed all
reports required to be filed by Section 13 or 15(d) of the Securities Exchange
Act of 1934 during the preceding 12 months (or for such shorter period that the
registrant was required to file such reports), and (2) has been subject to such
filing requirements for the past 90 days.
YES [X] NO
[ ]
Indicate by check mark whether the registrant has submitted
electronically and posted on its corporate Web site, if any, every Interactive
Data File required to be submitted and posted pursuant to Rule 405 of Regulation
S-T (§232.405 of this chapter) during the preceding 12 months (or for such
shorter period that the registrant was required to submit and post such files).
YES [X] NO [ ]
Indicate by check mark whether the registrant is a large accelerated filer, an accelerated filer, a non-accelerated filer or a smaller reporting company. See the definitions of “large accelerated filer”, “accelerated filer” and “smaller reporting company” in Rule 12b-2 of the Exchange Act (check one):
| [ ] Large accelerated filer | [X ] Accelerated filer |
| [ ] Non-accelerated filer | [ ] Smaller reporting company |
| (do not check if a smaller reporting company) |
Indicate by check mark whether the registrant is a shell
company (as defined in Rule 12b-2 of the Exchange Act).
YES [
] NO [X ]
As of November 3, 2015 (the latest practicable date), 47,322,702 shares of the registrant’s common stock, par value $0.001 per share, net of treasury shares, were outstanding.
Form 10-Q
NET 1 UEPS TECHNOLOGIES, INC.
Table of Contents
1
Part I. Financial Information
Item 1. Financial Statements
NET 1 UEPS TECHNOLOGIES, INC.
Unaudited Condensed
Consolidated Balance Sheets
| Unaudited | (A) | |||||
| September 30, | June 30, | |||||
| 2015 | 2015 | |||||
| (In thousands, except share data) | ||||||
| ASSETS | ||||||
| CURRENT ASSETS | ||||||
| Cash and cash equivalents | $ | 125,610 | $ | 117,583 | ||
| Pre-funded social welfare grants receivable (Note 2) | 1,411 | 2,306 | ||||
| Accounts receivable, net of allowances of – September: $2,767; June: $1,956 | 153,453 | 148,768 | ||||
| Finance loans receivable, net of allowances of – September: $3,640; June: $4,227 | 33,921 | 40,373 | ||||
| Inventory (Note 3) | 12,335 | 12,979 | ||||
| Deferred income taxes | 6,829 | 7,298 | ||||
| Total current assets before settlement assets | 333,559 | 329,307 | ||||
| Settlement assets (Note 4) | 600,195 | 661,916 | ||||
| Total current assets | 933,754 | 991,223 | ||||
| PROPERTY, PLANT AND EQUIPMENT, net of accumulated depreciation of – | ||||||
| September: $92,145; June: $94,014 | 52,048 | 52,320 | ||||
| EQUITY-ACCOUNTED INVESTMENTS | 14,342 | 14,329 | ||||
| GOODWILL (Note 6) | 154,294 | 166,437 | ||||
| INTANGIBLE ASSETS, net (Note 6) | 40,862 | 47,124 | ||||
| OTHER LONG-TERM ASSETS, including reinsurance assets (Note 5 and Note 7) | 13,982 | 14,997 | ||||
| TOTAL ASSETS | 1,209,282 | 1,286,430 | ||||
| LIABILITIES | ||||||
| CURRENT LIABILITIES | ||||||
| Accounts payable | 15,527 | 21,453 | ||||
| Other payables | 49,011 | 45,595 | ||||
| Current portion of long-term borrowings (Note 9) | 8,359 | 8,863 | ||||
| Income taxes payable | 12,848 | 6,287 | ||||
| Total current liabilities before settlement obligations | 85,745 | 82,198 | ||||
| Settlement obligations (Note 4) | 600,195 | 661,916 | ||||
| Total current liabilities | 685,940 | 744,114 | ||||
| DEFERRED INCOME TAXES | 9,169 | 10,564 | ||||
| LONG-TERM BORROWINGS (Note 9) | 48,561 | 50,762 | ||||
| OTHER LONG-TERM LIABILITIES, including insurance policy liabilities (Note 7) | 2,178 | 2,205 | ||||
| TOTAL LIABILITIES | 745,848 | 807,645 | ||||
| COMMITMENTS AND CONTINGENCIES (Note 17) | ||||||
| EQUITY | ||||||
| COMMON STOCK (Note 10) | ||||||
| Authorized: 200,000,000 with $0.001 par value; | ||||||
| Issued and outstanding shares, net of treasury - September: 47,322,702; June: 46,679,565 | 64 | 64 | ||||
| PREFERRED STOCK | ||||||
| Authorized shares: 50,000,000 with $0.001 par value; | ||||||
| Issued and outstanding shares, net of treasury: September: -; June: - | - | - | ||||
| ADDITIONAL PAID-IN-CAPITAL | 218,384 | 213,896 | ||||
| TREASURY SHARES, AT COST: September: 18,057,228; June: 18,057,228 | (214,520 | ) | (214,520 | ) | ||
| ACCUMULATED OTHER COMPREHENSIVE LOSS | (182,545 | ) | (139,181 | ) | ||
| RETAINED EARNINGS | 640,888 | 617,868 | ||||
| TOTAL NET1 EQUITY | 462,271 | 478,127 | ||||
| NON-CONTROLLING INTEREST | 1,163 | 658 | ||||
| TOTAL EQUITY | 463,434 | 478,785 | ||||
| TOTAL LIABILITIES AND SHAREHOLDERS’ EQUITY | $ | 1,209,282 | $ | 1,286,430 | ||
(A) – Derived from audited financial statements
See Notes to Unaudited Condensed Consolidated Financial Statements
2
NET 1 UEPS TECHNOLOGIES, INC.
Unaudited Condensed
Consolidated Statements of Operations
| Three months ended | ||||||
| September 30, | ||||||
| 2015 | 2014 | |||||
| (In thousands, except per share data) | ||||||
| REVENUE | $ | 154,473 | $ | 156,441 | ||
| EXPENSE | ||||||
| Cost of goods sold, IT processing, servicing and support | 77,382 | 74,406 | ||||
| Selling, general and administration | 35,761 | 38,736 | ||||
| Depreciation and amortization | 10,115 | 10,174 | ||||
| OPERATING INCOME | 31,215 | 33,125 | ||||
| INTEREST INCOME | 4,275 | 4,090 | ||||
| INTEREST EXPENSE | 974 | 1,312 | ||||
| INCOME BEFORE INCOME TAX EXPENSE | 34,516 | 35,903 | ||||
| INCOME TAX EXPENSE (Note 16) | 10,897 | 11,648 | ||||
| NET INCOME BEFORE EARNINGS FROM EQUITY-ACCOUNTED INVESTMENTS | 23,619 | 24,255 | ||||
| EARNINGS FROM EQUITY-ACCOUNTED INVESTMENTS | 188 | 92 | ||||
| NET INCOME | 23,807 | 24,347 | ||||
| LESS NET INCOME ATTRIBUTABLE TO NON-CONTROLLING INTEREST | 787 | 258 | ||||
| NET INCOME ATTRIBUTABLE TO NET1 | $ | 23,020 | $ | 24,089 | ||
| Net income per share, in United States dollars (Note 13) | ||||||
| Basic earnings attributable to Net1 shareholders | $ | 0.49 | $ | 0.51 | ||
| Diluted earnings attributable to Net1 shareholders | $ | 0.49 | $ | 0.51 | ||
See Notes to Unaudited Condensed Consolidated Financial Statements
3
NET 1 UEPS TECHNOLOGIES, INC.
Unaudited Condensed
Consolidated Statements of Comprehensive Income
| Three months ended | ||||||
| September 30, | ||||||
| 2015 | 2014 | |||||
| (In thousands) | ||||||
| Net income | $ | 23,807 | $ | 24,347 | ||
| Other comprehensive income (loss) | ||||||
| Net unrealized income (loss) on asset available for sale, net of tax | 50 | (226 | ) | |||
| Movement in foreign currency translation reserve | (43,696 | ) | (21,185 | ) | ||
| Total other comprehensive loss, net of taxes | (43,646 | ) | (21,411 | ) | ||
| Comprehensive (loss) income | (19,839 | ) | 2,936 | |||
| (Less) comprehensive income attributable to non- controlling interest | (505 | ) | (232 | ) | ||
| Comprehensive (loss)/income attributable to Net1 | $ | (20,344 | ) | $ | 2,704 | |
See Notes to Unaudited Condensed Consolidated Financial Statements
4
NET 1 UEPS TECHNOLOGIES, INC.
Unaudited Condensed Consolidated
Statement of Changes in Equity for the three
months ended September 30, 2015 (dollar
amounts in thousands)
| Net 1 UEPS Technologies, Inc. Shareholders | |||||||||||||||||||||||||||||||||
| Accumulated | |||||||||||||||||||||||||||||||||
| Number of | Number of | Additional | other | Non- | |||||||||||||||||||||||||||||
| Number of | Treasury | Treasury | shares, net of | Paid-In | Retained | comprehensive | Total Net1 | controlling | |||||||||||||||||||||||||
| Shares | Amount | Shares | Shares | treasury | Capital | Earnings | loss | Equity | Interest | Total | |||||||||||||||||||||||
| Balance – July 1, 2015 | 64,736,793 | $ | 64 | (18,057,228 | ) | $ | (214,520 | ) | 46,679,565 | $ | 213,896 | $ | 617,868 | $ | (139,181 | ) | $ | 478,127 | $ | 658 | $ | 478,785 | |||||||||||
| Restricted stock granted (Note 12) | 319,492 | 319,492 | - | - | |||||||||||||||||||||||||||||
| Exercise of stock option (Note 12) | 323,645 | 323,645 | 3,762 | 3,762 | 3,762 | ||||||||||||||||||||||||||||
| Stock-based compensation charge (Note 12) | 726 | 726 | 726 | ||||||||||||||||||||||||||||||
| Net income | 23,020 | 23,020 | 787 | 23,807 | |||||||||||||||||||||||||||||
| Other comprehensive loss (Note 11) | (43,364 | ) | (43,364 | ) | (282 | ) | (43,646 | ) | |||||||||||||||||||||||||
| Balance – September 30, 2015 | 65,379,930 | $ | 64 | (18,057,228 | ) | $ | (214,520 | ) | 47,322,702 | $ | 218,384 | $ | 640,888 | $ | (182,545 | ) | $ | 462,271 | $ | 1,163 | $ | 463,434 | |||||||||||
See Notes to Unaudited Condensed Consolidated Financial Statements
5
NET 1 UEPS TECHNOLOGIES, INC.
Unaudited Condensed
Consolidated Statements of Cash Flows
| Three months ended | ||||||
| September 30, | ||||||
| 2015 | 2014 | |||||
| (In thousands) | ||||||
| Cash flows from operating activities | ||||||
| Net income | $ | 23,807 | $ | 24,347 | ||
| Depreciation and amortization | 10,115 | 10,174 | ||||
| Earnings from equity-accounted investments | (188 | ) | (92 | ) | ||
| Fair value adjustments | 1,433 | 413 | ||||
| Interest payable | 709 | 1,159 | ||||
| Profit on disposal of plant and equipment | (95 | ) | (122 | ) | ||
| Stock-based compensation charge | 726 | 916 | ||||
| Facility fee amortized | 34 | 82 | ||||
| (Increase) Decrease in accounts receivable,
pre-funded social welfare grants receivable and finance loans receivable |
(17,278 | ) | 9,470 | |||
| Increase in inventory | (931 | ) | (2,123 | ) | ||
| Increase (Decrease) in accounts payable and other payables | 2,972 | (10,933 | ) | |||
| Increase in taxes payable | 7,824 | 6,611 | ||||
| Decrease in deferred taxes | (1,026 | ) | (390 | ) | ||
| Net cash provided by operating activities | 28,102 | 39,512 | ||||
| Cash flows from investing activities | ||||||
| Capital expenditures | (10,698 | ) | (9,378 | ) | ||
| Proceeds from disposal of property, plant and equipment | 348 | 241 | ||||
| Proceeds from sale of business (Note 14) | - | 1,895 | ||||
| Net change in settlement assets | (21,575 | ) | (43,054 | ) | ||
| Net cash used in investing activities | (31,925 | ) | (50,296 | ) | ||
| Cash flows from financing activities | ||||||
| Proceeds from issue of common stock | 3,762 | 989 | ||||
| Long-term borrowings utilized | 720 | 1,097 | ||||
| Acquisition of treasury stock (Note 10) | - | (9,151 | ) | |||
| Sale of equity to non-controlling interest (Note 10) | - | 1,407 | ||||
| Net change in settlement obligations | 21,575 | 43,054 | ||||
| Net cash provided by financing activities | 26,057 | 37,396 | ||||
| Effect of exchange rate changes on cash | (14,207 | ) | (4,099 | ) | ||
| Net increase in cash and cash equivalents | 8,027 | 22,513 | ||||
| Cash and cash equivalents – beginning of period | 117,583 | 58,672 | ||||
| Cash and cash equivalents – end of period | $ | 125,610 | $ | 81,185 | ||
See Notes to Unaudited Condensed Consolidated Financial Statements
6
NET 1 UEPS TECHNOLOGIES, INC.
Notes to the
Unaudited Condensed Consolidated Financial Statements
for the three
months ended September 30, 2015 and 2014
(All amounts in tables
stated in thousands or thousands of United States Dollars, unless otherwise
stated)
| 1. |
Basis of Presentation and Summary of Significant Accounting Policies |
Unaudited Interim Financial Information
The accompanying unaudited condensed consolidated financial statements include all majority-owned subsidiaries over which the Company exercises control and have been prepared in accordance with U.S. generally accepted accounting principles (“GAAP”) and the rules and regulations of the United States Securities and Exchange Commission for quarterly reports on Form 10-Q and include all of the information and disclosures required for interim financial reporting. The results of operations for the three months ended September 30, 2015 and 2014, are not necessarily indicative of the results for the full year. The Company believes that the disclosures are adequate to make the information presented not misleading.
These financial statements should be read in conjunction with the financial statements, accounting policies and financial notes thereto included in the Company’s Annual Report on Form 10-K for the fiscal year ended June 30, 2015. In the opinion of management, the accompanying unaudited condensed consolidated financial statements reflect all adjustments (consisting only of normal recurring adjustments), which are necessary for a fair representation of financial results for the interim periods presented.
References to the “Company” refer to Net1 and its consolidated subsidiaries, unless the context otherwise requires. References to Net1 are references solely to Net 1 UEPS Technologies, Inc.
Recent accounting pronouncements adopted
There were no accounting pronouncements adopted during the three months ended September 30, 2015.
Recent accounting pronouncements not yet adopted as of September 30, 2015
In May 2014, the FASB issued guidance regarding Revenue from Contracts with Customers. This guidance requires an entity to recognize revenue when a customer obtains control of promised goods or services in an amount that reflects the consideration to which the entity expects to receive in exchange for those goods or services. In addition, the standard requires disclosure of the nature, amount, timing, and uncertainty of revenue and cash flows arising from contracts with customers. The guidance was effective for the Company beginning July 1, 2017, however this date has been extended as per subsequent guidance issued by the FASB. Early adoption is not permitted. The Company expects that this guidance will have a material impact on its financial statements and is currently evaluating the impact of this guidance on its financial statements on adoption.
In August 2015, the FASB issued guidance regarding Revenue from Contracts with Customers, Deferral of the Effective Date. This guidance defers the required implementation date specified in Revenue from Contracts with Customers to December 2017. Public companies may elect to adopt the standard along the original timeline. The Company expects that this guidance will have a material impact on its financial statements and is currently evaluating the impact of this guidance on its financial statements on adoption.
In August 2014, the FASB issued guidance regarding Disclosure of Uncertainties about an Entity’s Ability to Continue as a Going Concern. This guidance requires an entity to perform interim and annual assessments of its ability to continue as a going concern within one year of the date that its financial statements are issued. An entity must provide certain disclosures if conditions or events raise substantial doubt about the entity’s ability to continue as a going concern. The guidance is effective for the Company beginning July 1, 2017. Early adoption is permitted. The Company is currently assessing the impact of this guidance on its financial statements disclosure.
In February 2015, the FASB issued guidance regarding Amendments to the Consolidation Analysis. This guidance amends both the variable interest entity and voting interest entity consolidation models. The requirement to assess an entity under a different consolidation model may change previous consolidation conclusions. The guidance is effective for the Company beginning July 1, 2016. Early adoption is permitted. The Company is currently assessing the impact of this guidance on its financial statements disclosure.
7
| 1. |
Basis of Presentation and Summary of Significant Accounting Policies (continued) |
Recent accounting pronouncements not yet adopted as of September 30, 2015 (continued)
In July 2015, the FASB issued guidance regarding Simplifying the Measurement of Inventory. This guidance requires entities to measure most inventory “at the lower of cost and net realizable value,” thereby simplifying the current guidance under which an entity must measure inventory at the lower of cost or market (market in this context is defined as one of three different measures). The guidance will not apply to inventories that are measured by using either the last-in, first-out (“LIFO”) method or the retail inventory method (“RIM”). The guidance is effective for the Company beginning July 1, 2017. Early adoption is permitted. The Company is currently assessing the impact of this guidance on its financial statements disclosure.
| 2. |
Pre-funded social welfare grants receivable |
Pre-funded social welfare grants receivable represents amounts pre-funded by the Company to certain merchants participating in the merchant acquiring system. The October 2015 payment service commenced on October 1, 2015, but the Company pre-funded certain merchants participating in the merchant acquiring system on the last two days of September 2015.
| 3. |
Inventory |
The Company’s inventory comprised the following categories as of September 30, 2015 and June 30, 2015.
| September 30, | June 30, | ||||||
| 2015 | 2015 | ||||||
| Finished goods | $ | 12,335 | $ | 12,979 | |||
| $ | 12,335 | $ | 12,979 |
| 4. |
Settlement assets and settlement obligations |
Settlement assets comprise (1) cash received from the South African government that the Company holds pending disbursement to recipient beneficiaries of social welfare grants and (2) cash received from customers on whose behalf the Company processes payroll payments that the Company will disburse to customer employees, payroll-related payees and other payees designated by the customer.
Settlement obligations comprise (1) amounts that the Company is obligated to disburse to recipient beneficiaries of social welfare grants, and (2) amounts that the Company is obligated to pay to customer employees, payroll-related payees and other payees designated by the customer.
The balances at each reporting date may vary widely depending on the timing of the receipts and payments of these assets and obligations.
| 5. |
Fair value of financial instruments |
Initial recognition and measurement
Financial instruments are recognized when the Company becomes a party to the transaction. Initial measurements are at cost, which includes transaction costs.
Risk management
The Company seeks to reduce its exposure to currencies other than the South African Rand (“ZAR”) through a policy of matching, to the extent possible, assets and liabilities denominated in those currencies. In addition, the Company uses financial instruments in order to economically hedge its exposure to exchange rate and interest rate fluctuations arising from its operations. The Company is also exposed to equity price and liquidity risks as well as credit risks.
8
| 5. |
Fair value of financial instruments (continued) |
Risk management (continued)
Currency exchange risk
The Company is subject to currency exchange risk because it purchases inventories that it is required to settle in other currencies, primarily the euro and U.S. dollar. The Company has used forward contracts in order to limit its exposure in these transactions to fluctuations in exchange rates between the ZAR, on the one hand, and the U.S. dollar and the euro, on the other hand.
Translation risk
Translation risk relates to the risk that the Company’s results of operations will vary significantly as the U.S. dollar is its reporting currency, but it earns most of its revenues and incurs most of its expenses in ZAR. The U.S. dollar to ZAR exchange rate has fluctuated significantly over the past three years. As exchange rates are outside the Company’s control, there can be no assurance that future fluctuations will not adversely affect the Company’s results of operations and financial condition.
Interest rate risk
As a result of its normal borrowing and leasing activities, the Company’s operating results are exposed to fluctuations in interest rates, which it manages primarily through regular financing activities. The Company generally maintains limited investment in cash equivalents and has occasionally invested in marketable securities.
Credit risk
Credit risk relates to the risk of loss that the Company would incur as a result of non-performance by counterparties. The Company maintains credit risk policies with regard to its counterparties to minimize overall credit risk. These policies include an evaluation of a potential counterparty’s financial condition, credit rating, and other credit criteria and risk mitigation tools as the Company’s management deems appropriate.
With respect to credit risk on financial instruments, the Company maintains a policy of entering into such transactions only with South African and European financial institutions that have a credit rating of BBB or better, as determined by credit rating agencies such as Standard & Poor’s, Moody’s and Fitch Ratings.
UEPS-based microlending credit risk
The Company is exposed to credit risk in its UEPS-based microlending activities, which provides unsecured short-term loans to qualifying customers. The Company manages this risk by performing an affordability test for each prospective customer and assigns a “creditworthiness score”, which takes into account a variety of factors such as other debts and total expenditures on normal household and lifestyle expenses.
Equity price and liquidity risk
Equity price risk relates to the risk of loss that the Company would incur as a result of the volatility in the exchange-traded price of equity securities that it holds and the risk that it may not be able to liquidate these securities. The market price of these securities may fluctuate for a variety of reasons, consequently, the amount the Company may obtain in a subsequent sale of these securities may significantly differ from the reported market value.
Liquidity risk relates to the risk of loss that the Company would incur as a result of the lack of liquidity on the exchange on which these securities are listed. The Company may not be able to sell some or all of these securities at one time, or over an extended period of time without influencing the exchange traded price, or at all.
9
| 5. |
Fair value of financial instruments (continued) |
Financial instruments
The following section describes the valuation methodologies the Company uses to measure its significant financial assets and liabilities at fair value.
In general, and where applicable, the Company uses quoted prices in active markets for identical assets or liabilities to determine fair value. This pricing methodology applies to Level 1 investments. If quoted prices in active markets for identical assets or liabilities are not available to determine fair value, then the Company uses quoted prices for similar assets and liabilities or inputs other than the quoted prices that are observable either directly or indirectly. These investments are included in Level 2 investments. In circumstances in which inputs are generally unobservable, values typically reflect management’s estimates of assumptions that market participants would use in pricing the asset or liability. The fair values are therefore determined using model-based techniques that include option pricing models, discounted cash flow models, and similar techniques. Investments valued using such techniques are included in Level 3 investments.
Asset measured at fair value using significant unobservable inputs – investment in Finbond Group Limited (“Finbond”)
The Company's Level 3 asset represents an investment of 156,788,712 shares of common stock of Finbond, which are exchange-traded equity securities. Finbond’s shares are traded on the Johannesburg Stock Exchange (“JSE”) and the Company has designated such shares as available for sale investments. The Company has concluded that the market for Finbond shares is not active and consequently has employed alternative valuation techniques in order to determine the fair value of such stock. Finbond issues financial products and services under a mutual banking licence and also has a microlending offering. In determining the fair value of Finbond, the Company has considered amongst other things Finbond’s historical financial information (including its most recent public accounts), press releases issued by Finbond and its published net asset value. The Company believes that the best indicator of fair value of Finbond is its published net asset value and has used this value to determine the fair value.
Asset measured at fair value using significant unobservable inputs – investment in Finbond Group Limited (“Finbond”) (continued)
The fair value of these securities as of September 30, 2015, represented approximately 1% of the Company’s total assets, including these securities. The Company expects to hold these securities for an extended period of time and it is not concerned with short-term equity price volatility with respect to these securities provided that the underlying business, economic and management characteristics of the company remain sound.
Derivative transactions - Foreign exchange contracts
As part of the Company’s risk management strategy, the Company enters into derivative transactions to mitigate exposures to foreign currencies using foreign exchange contracts. These foreign exchange contracts are over-the-counter derivative transactions. Substantially all of the Company’s derivative exposures are with counterparties that have long-term credit ratings of BBB or better. The Company uses quoted prices in active markets for similar assets and liabilities to determine fair value (Level 2). The Company has no derivatives that require fair value measurement under Level 1 or 3 of the fair value hierarchy.
The Company’s outstanding foreign exchange contracts are as follows:
As of September 30, 2015
| Fair market | ||||||||||
| Notional amount | Strike price | value price | Maturity | |||||||
| EUR 526,263.00 | ZAR 15.3809 | ZAR15.5532 | October 20, 2015 | |||||||
| EUR 509,516.00 | ZAR 15.4728 | ZAR15.6435 | November 20, 2015 | |||||||
| EUR 529,865.00 | ZAR 15.5654 | ZAR15.7402 | December 21, 2015 | |||||||
| EUR 526,663.00 | ZAR 15.6625 | ZAR15.8358 | January 20, 2016 |
10
| 5. |
Fair value of financial instruments (continued) |
Financial instruments (continued)
As of June 30, 2015
| Fair market | ||||||||||
| Notional amount | Strike price | value price | Maturity | |||||||
| EUR 526,263.00 | ZAR 15.1145 | ZAR 13.6275 | July 20, 2015 | |||||||
| EUR 526,263.00 | ZAR 15.2025 | ZAR 13.7062 | August 20, 2015 | |||||||
| EUR 526,263.00 | ZAR 15.2944 | ZAR 13.7898 | September 21, 2015 | |||||||
| EUR 526,263.00 | ZAR 15.3809 | ZAR 13.8683 | October 20, 2015 | |||||||
| EUR 509,516.00 | ZAR 15.4728 | ZAR 13.9540 | November 20, 2015 | |||||||
| EUR 529,865.00 | ZAR 15.5654 | ZAR 14.0397 | December 21, 2015 | |||||||
| EUR 526,663.00 | ZAR 15.6625 | ZAR 14.1239 | January 20, 2016 |
The following table presents the Company’s assets and liabilities measured at fair value on a recurring basis as of September 30, 2015, according to the fair value hierarchy:
| Quoted | |||||||||||||
| Price in | |||||||||||||
| Active | Significant | ||||||||||||
| Markets for | Other | Significant | |||||||||||
| Identical | Observable | Unobservable | |||||||||||
| Assets | Inputs | Inputs | |||||||||||
| (Level 1) | (Level 2) | (Level 3) | Total | ||||||||||
| Assets | |||||||||||||
| Related to insurance business (included in other long-term assets): | |||||||||||||
| Cash and cash equivalents | $ | 1,884 | $ | - | $ | - | $ | 1,884 | |||||
| Investment in Finbond (available for sale assets included in other long-term assets) | - | - | 6,618 | 6,618 | |||||||||
| Other | - | 1,069 | - | 1,069 | |||||||||
| Total assets at fair value | $ | 1,884 | $ | 1,069 | $ | 6,618 | $ | 9,571 |
The following table presents the Company’s assets and liabilities measured at fair value on a recurring basis as of June 30, 2015, according to the fair value hierarchy:
| Quoted | |||||||||||||
| Price in | |||||||||||||
| Active | Significant | ||||||||||||
| Markets for | Other | Significant | |||||||||||
| Identical | Observable | Unobservable | |||||||||||
| Assets | Inputs | Inputs | |||||||||||
| (Level 1) | (Level 2) | (Level 3) | Total | ||||||||||
| Assets | |||||||||||||
| Related to insurance business (included in other long-term assets): | |||||||||||||
| Cash and cash equivalents | $ | 1,640 | $ | - | $ | - | $ | 1,640 | |||||
| Investment in Finbond (available for sale assets included in other long-term assets) | - | - | 7,488 | 7,488 | |||||||||
| Other | - | 1,259 | - | 1,259 | |||||||||
| Total assets at fair value | $ | 1,640 | $ | 1,259 | $ | 7,488 | $ | 10,387 | |||||
| Liabilities | |||||||||||||
| Foreign exchange contracts | $ | - | $ | 452 | $ | - | $ | 452 | |||||
| Total liabilities at fair value | $ | - | $ | 452 | $ | - | $ | 452 |
11
| 5. |
Fair value of financial instruments (continued) |
Financial instruments (continued)
Changes in the Company’s investment in Finbond (Level 3 that are measured at fair value on a recurring basis) were insignificant during the three months ended September 30, 2015 and 2014, respectively. There have been no transfers in or out of Level 3 during the three months ended September 30, 2015 and 2014, respectively.
Assets and liabilities measured at fair value on a nonrecurring basis
The Company measures its assets at fair value on a nonrecurring basis when they are deemed to be other-than-temporarily impaired. The Company has no liabilities that are measured at fair value on a nonrecurring basis. The Company reviews the carrying values of its assets when events and circumstances warrant and considers all available evidence in evaluating when declines in fair value are other-than-temporary. The fair values of the Company’s assets are determined using the best information available, and may include quoted market prices, market comparables, and discounted cash flow projections. An impairment charge is recorded when the cost of the assets exceeds its fair value and the excess is determined to be other-than-temporary. The Company has not recorded any impairment charges during the reporting periods presented herein.
| 6. |
Goodwill and intangible assets, net |
Goodwill
Summarized below is the movement in the carrying value of goodwill for the three months ended September 30, 2015:
| Accumulated | Carrying | |||||||||
| Gross value | impairment | value | ||||||||
| Balance as of June 30, 2015 | $ | 166,437 | $ | - | $ | 166,437 | ||||
| Foreign currency adjustment (1) | (12,143 | ) | - | (12,143 | ) | |||||
| Balance as of September 30, 2015 | $ | 154,294 | $ | - | $ | 154,294 |
(1) – The foreign currency adjustment represents the effects of the fluctuations between the South African rand and the Korean won, and the U.S. dollar on the carrying value.
Goodwill has been allocated to the Company’s reportable segments as follows:
| South | Financial | ||||||||||||
| African | International | inclusion and | |||||||||||
| transaction | transaction | applied | Carrying | ||||||||||
| processing | processing | technologies | value | ||||||||||
| Balance as of June 30, 2015 | $ | 24,579 | $ | 115,519 | $ | 26,339 | $ | 166,437 | |||||
| Foreign currency adjustment (1) | (3,053 | ) | (6,537 | ) | (2,553 | ) | (12,143 | ) | |||||
| Balance as of September 30, 2015 | $ | 21,526 | $ | 108,982 | $ | 23,786 | $ | 154,294 |
(1) – The foreign currency adjustment represents the effects of the fluctuations between the South African rand and the Korean won, and the U.S. dollar on the carrying value.
12
| 6. |
Goodwill and intangible assets, net (continued) |
Intangible assets, net
Carrying value and amortization of intangible assets
Summarized below is the carrying value and accumulated amortization of the intangible assets as of September 30, 2015 and June 30, 2015:
| As of September 30, 2015 | As of June 30, 2015 | ||||||||||||||||||
| Gross | Net | Gross | Net | ||||||||||||||||
| carrying | Accumulated | carrying | carrying | Accumulated | carrying | ||||||||||||||
| value | amortization | value | value | amortization | value | ||||||||||||||
| Finite-lived intangible assets: | |||||||||||||||||||
| Customer relationships | $ | 82,160 | $ | (44,008 | ) | $ | 38,152 | $ | 88,109 | $ | (45,312 | ) | $ | 42,797 | |||||
| Software and unpatented technology | 27,872 | (27,491 | ) | 381 | 29,964 | (28,323 | ) | 1,641 | |||||||||||
| FTS patent | 2,731 | (2,731 | ) | - | 3,119 | (3,119 | ) | - | |||||||||||
| Exclusive licenses | 4,506 | (4,506 | ) | - | 4,506 | (4,506 | ) | - | |||||||||||
| Trademarks | 5,589 | (3,260 | ) | 2,329 | 6,094 | (3,408 | ) | 2,686 | |||||||||||
| Total finite-lived intangible assets | $ | 122,858 | $ | (81,996 | ) | $ | 40,862 | $ | 131,792 | $ | (84,668 | ) | $ | 47,124 | |||||
Aggregate amortization expense on the finite-lived intangible assets for the three months ended September 30, 2015 and 2014, was approximately $3.3 million and $3.9 million, respectively.
Future estimated annual amortization expense for the next five fiscal years and thereafter, assuming an exchange rate prevailing on September 30, 2015, is presented in the table below. Actual amortization expense in future periods could differ from this estimate as a result of acquisitions, changes in useful lives, exchange rate fluctuations and other relevant factors.
| 2016 | $ | 10,105 | ||
| 2017 | 7,929 | |||
| 2018 | 7,928 | |||
| 2019 | 7,634 | |||
| 2020 | 7,463 | |||
| Thereafter | $ | 3,088 |
| 7. |
Reinsurance assets and policy holder liabilities under insurance and investment contracts |
Reinsurance assets and policy holder liabilities under insurance contracts
Summarized below is the movement in reinsurance assets and policy holder liabilities under insurance contracts during the three months ended September 30, 2015:
| Reinsurance | Insurance | ||||||
| assets (1) | contracts (2) | ||||||
| Balance as of June 30, 2015 | $ | 183 | $ | (567 | ) | ||
| Foreign currency adjustment (3) | (23 | ) | 71 | ||||
| Balance as of September 30, 2015 | $ | 160 | $ | (496 | ) |
(1) Included in other long-term assets.
(2) Included in other long-term liabilities.
(3) The foreign currency
adjustment represents the effects of the fluctuations between the ZAR against
the U.S. dollar.
The Company has agreements with reinsurance companies in order to limit its losses from large insurance contracts, however, if the reinsurer is unable to meet its obligations, the Company retains the liability.
Policyholders' liabilities under insurance contracts are derived from actual claims submitted which had not been settled as of September 30, 2015 and June 30, 2015, respectively, and represents management’s estimate of the net present value of future claims and benefits under existing insurance contracts, offset by probable future premiums to be received (net of expected service cost).
13
| 7. |
Reinsurance assets and policy holder liabilities under insurance and investment contracts (continued) |
Assets and policy holder liabilities under investment contracts
Summarized below is the movement in assets and policy holder liabilities under investment contracts during the three months ended September 30, 2015:
| Investment | |||||||
| Assets (1) | contracts (2) | ||||||
| Balance as of June 30, 2015 | $ | 593 | $ | (593 | ) | ||
| Foreign currency adjustment (3) | (73 | ) | 73 | ||||
| Balance as of September 30, 2015 | $ | 520 | $ | (520 | ) |
(1) Included in other long-term assets.
(2) Included in other long-term liabilities.
(3) The foreign currency
adjustment represents the effects of the fluctuations between the ZAR against
the U.S. dollar.
The Company does not offer any investment products with guarantees related to capital or returns.
| 8. |
Short-term credit facility |
The Company’s short-term credit facilities are described in Note 12 to the Company’s audited consolidated financial statements included in its Annual Report on Form 10-K for the year ended June 30, 2015.
South Africa
The Company’s short-term South African credit facility with Nedbank Limited comprises an overdraft facility of up to ZAR 50 million and indirect and derivative facilities of up to ZAR 150 million, which include letters of guarantee, letters of credit and forward exchange contracts. As of September 30, 2015, the interest rate on the overdraft facility was 8.35% . As of each of September 30, 2015 and June 30, 2015, respectively, the Company had not utilized any of its overdraft facility. As of September 30, 2015, the Company had utilized approximately ZAR 128.2 million ($9.1 million, translated at exchange rates applicable as of September 30, 2015) of its ZAR 150 million indirect and derivative facilities to obtain foreign exchange contracts from the bank and to enable the bank to issue guarantees, including stand-by letters of credit, in order for the Company to honor its obligations to third parties requiring such guarantees (refer to Note 17). As of June 30, 2015, the Company had utilized approximately ZAR 139.6 million ($11.4 million, translated at exchange rates applicable as of June 30, 2015) of its indirect and derivative facilities.
Korea
The Company had not utilized any of its KRW 10 billion ($8.4 million, translated at exchange rates applicable as of September 30, 2015) overdraft facility as of September 30, 2015 and June 30, 2015. As of September 30, 2015, the interest rate on the overdraft facility was 3.20% . The facility expires in January 2016.
| 9. |
Long-term borrowings |
The Company’s Korean senior secured loan facility is described in Note 13 to the Company’s audited consolidated financial statements included in its Annual Report on Form 10-K for the year ended June 30, 2015. The current carrying value as of September 30, 2015, is $60.0 million. As of September 30, 2015, the carrying amount of the long-term borrowings approximated fair value. The interest rate in effect on September 30, 2015, was 4.74% .
Interest expense incurred during the three months ended September 30, 2015 and 2014, was $0.7 million and $1.1 million, respectively. Prepaid facility fees amortized during the three months ended September 30, 2015 and 2014, was $0.03 million and $0.1 million, respectively.
The next scheduled principal payment of $8.4 million (translated at exchange rates applicable as of September 30, 2015) will be made on April 29, 2016.
14
| 10. |
Capital structure |
The following table presents reconciliation between the number of shares, net of treasury, presented in the unaudited condensed consolidated statement of changes in equity during the three months ended September 30, 2015 and 2014, respectively, and the number of shares, net of treasury, excluding non-vested equity shares that have not vested during the three months ended September 30, 2015 and 2014, respectively:
| Sept 30, | Sept 30, | ||||||
| 2015 | 2014 | ||||||
| Number of shares, net of treasury: | |||||||
| Statement of changes in equity | 47,322,702 | 46,475,623 | |||||
| Less: Non-vested equity shares that have not vested (Note 12) | (589,447 | ) | (453,333 | ) | |||
| Number of shares, net of treasury excluding non-vested equity shares that have not vested | 46,733,255 | 46,022,290 |
Common stock repurchases and transaction with non-controlling interests
The Company did not repurchase any of its shares during the three months ended September 30, 2015 and 2014, under its share repurchase authorization. However, on August 27, 2014, the Company entered into a Subscription and Sale of Shares Agreement with Business Venture Investments No 1567 Proprietary Limited (RF) (“BVI”), one of the Company’s BEE partners, in preparation for any new potential SASSA tender. Pursuant to the agreement: (i) the Company repurchased BVI’s remaining 1,837,432 shares of the Company’s common stock for approximately ZAR 97.4 million in cash ($9.2 million translated at exchange rates prevailing as of August 27, 2014) and (ii) BVI has subscribed for new ordinary shares of Cash Paymaster Services (Pty) Ltd (“CPS”) representing 12.5% of CPS’ ordinary shares outstanding after the subscription for ZAR 15.0 million in cash (approximately $1.4 million translated at exchange rates prevailing as of August 27, 2014). In connection with transactions described above, the CPS shareholder agreement that was negotiated as part of the original December 2013 Relationship Agreement became effective.
| 11. |
Accumulated other comprehensive loss |
The table below presents the change in accumulated other comprehensive (loss) income per component during the three months ended September 30, 2015:
| Three months ended | ||||||||||
| September 30, 2015 | ||||||||||
| Accumulated | ||||||||||
| Net | ||||||||||
| unrealized | ||||||||||
| Accumulated | income on | |||||||||
| Foreign | asset | |||||||||
| currency | available for | |||||||||
| translation | sale, net of | |||||||||
| reserve | tax | Total | ||||||||
| Balance as of June 30, 2015 | $ | (140,221 | ) | $ | 1,040 | $ | (139,181 | ) | ||
| Movement in foreign currency translation reserve | (43,414 | ) | - | (43,414 | ) | |||||
| Unrealized gain on asset available for sale, net of tax of $11 | - | 50 | 50 | |||||||
| Balance as of September 30, 2015 | $ | (183,635 | ) | $ | 1,090 | $ | (182,545 | ) | ||
There were no reclassifications from accumulated other comprehensive loss to comprehensive (loss) income during the three months ended September 30, 2015 or 2014, respectively.
15
| 12. |
Stock-based compensation |
Stock option and restricted stock activity
Options
The following table summarizes stock option activity for the three months ended September 30, 2015 and 2014:
| Weighted | Weighted | |||||||||||||||
| Weighted | Average | Average | ||||||||||||||
| average | Remaining | Aggregate | Grant | |||||||||||||
| exercise | Contractual | Intrinsic | Date Fair | |||||||||||||
| Number of | price | Term | Value | Value | ||||||||||||
| shares | ($) | (in years) | ($’000) | ($) | ||||||||||||
| Outstanding – June 30, 2015 | 2,401,169 | 15.34 | 4.74 | 11,516 | ||||||||||||
| Exercised | (323,645 | ) | 11.62 | 2,669 | ||||||||||||
| Outstanding – September 30, 2015 | 2,077,524 | 15.92 | 4.33 | 7,509 | ||||||||||||
| Outstanding – June 30, 2014 | 2,710,392 | 14.16 | 5.38 | 3,909 | ||||||||||||
| Granted under Plan: August 2014 | 464,410 | 11.23 | 10.00 | 2,113 | 4.55 | |||||||||||
| Exercised | (688,633 | ) | 8.24 | 3,697 | ||||||||||||
| Outstanding – September 30, 2014 | 2,486,169 | 15.24 | 5.45 | 1,820 |
No stock options were awarded during the three months ended September 30, 2015. The fair value of each option is estimated on the date of grant using the Cox Ross Rubinstein binomial model that uses the assumptions noted in the following table. The estimated expected volatility is calculated based on the Company’s 250 day volatility. The estimated expected life of the option was determined based on historical behavior of employees who were granted options with similar terms. The Company has estimated no forfeitures for options awarded in August 2014.
The table below presents the range of assumptions used to value options granted during the three months ended September 30, 2015 and 2014:
| Three months ended | |||||||
| September 30, | |||||||
| 2015 | 2014 | ||||||
| Expected volatility | n/a | 60% | |||||
| Expected dividends | n/a | 0% | |||||
| Expected life (in years) | n/a | 3 | |||||
| Risk-free rate | n/a | 1.0% | |||||
There were no forfeitures during each of the three months ended September 30, 2015 and 2014.
The following table presents stock options vested and expecting to vest as of September 30, 2015:
| Weighted | |||||||||||||
| Weighted | Average | ||||||||||||
| average | Remaining | Aggregate | |||||||||||
| exercise | Contractual | Intrinsic | |||||||||||
| Number of | price | Term | Value | ||||||||||
| shares | ($) | (in years) | ($’000) | ||||||||||
| Vested and expecting to vest – September 30, 2015 | 2,077,524 | 15.92 | 4.33 | 7,509 |
These options have an exercise price range of $7.35 to $24.46.
16
| 12. |
Stock-based compensation (continued) |
Stock option and restricted stock activity (continued)
The following table presents stock options that are exercisable as of September 30, 2015:
| Weighted | |||||||||||||
| Weighted | Average | ||||||||||||
| average | Remaining | Aggregate | |||||||||||
| exercise | Contractual | Intrinsic | |||||||||||
| Number of | price | Term | Value | ||||||||||
| shares | ($) | (in years) | ($’000) | ||||||||||
| Exercisable – September 30, 2015 | 1,764,931 | 16.93 | 3.55 | 5,496 |
During the three months ended September 30, 2015 and 2014, respectively, 330,967 and 273,633 stock options became exercisable. During the three months ended September 30, 2015, the Company received approximately $3.8 million from the exercise of 323,645 stock options. During the three months ended September 30, 2014, the Company received approximately $1.0 million from the exercise of 116,395 stock options. The remaining 572,238 stock options were exercised through recipients delivering 336,584 shares of the Company’s common stock to the Company on September 9, 2014, to settle the exercise price due. The Company issues new shares to satisfy stock option exercises.
Restricted stock
The following table summarizes restricted stock activity for the three months ended September 30, 2015 and 2014:
| Weighted | |||||||
| Number of | Average | ||||||
| Shares of | Grant Date | ||||||
| Restricted | Fair Value | ||||||
| Stock | ($’000) | ||||||
| Non-vested – June 30, 2015 | 341,529 | 1,759 | |||||
| Granted – August 2015 | 319,492 | 581 | |||||
| Vested – August 2015 | (71,574 | ) | 6,406 | ||||
| Non-vested – September 30, 2015 | 589,447 | 7,622 | |||||
| Non-vested – June 30, 2014 | 385,778 | 3,534 | |||||
| Granted – August 2014 | 141,707 | 581 | |||||
| Vested – August 2014 | (74,152 | ) | 828 | ||||
| Non-vested – September 30, 2014 | 453,333 | 3,568 |
The August 2015 grants comprise 301,537 and 17,955 shares of restricted stock awarded to employees and non-employee directors, respectively. The shares of restricted stock awarded to employees in August 2015 are subject to time-based and performance-based vesting conditions. In order for any of the shares to vest, the recipient must remain employed by the Company on a full-time basis on the date that it files its Annual Report on Form 10-K for the fiscal year ended June 30, 2018. If that condition is satisfied, then the shares will vest based on the level of Fundamental EPS the Company achieves for the fiscal year ended June 30, 2018 (“2018 Fundamental EPS”), as follows:
| • | One-third of the shares will vest if the Company achieves 2018 Fundamental EPS of $2.88; | |
| • | Two-thirds of the shares will vest if the Company achieves 2018 Fundamental EPS of $3.30; and | |
| • | All of the shares will vest if the Company achieves 2018 Fundamental EPS of $3.76. |
17
| 12. |
Stock-based compensation (continued) |
Stock-based compensation charge and unrecognized compensation cost
Restricted stock (continued)
At levels of 2018 Fundamental EPS greater $2.88 and less than $3.76, the number of shares that will vest will be determined by linear interpolation relative to 2018 Fundamental EPS of $3.30. Any shares that do not vest in accordance with the above-described conditions will be forfeited. All shares of restricted stock have been valued utilizing the closing price of the Company’s stock quoted on The Nasdaq Global Select Market on the date of grant.
The August 2014 grants comprise 127,626 and 14,081 shares of restricted stock awarded to employees and non-employee directors, respectively. The shares of restricted stock awarded to employees in August 2014 will vest in full only on the date, if any, the following conditions are satisfied: (1) the closing price of the Company’s common stock equals or exceeds $19.41 (subject to appropriate adjustment for any stock split or stock dividend) for a period of 30 consecutive trading days during a measurement period commencing on the date that the Company files its Annual Report on Form 10-K for the fiscal year ended 2017 and ending on December 31, 2017 and (2) the recipient is employed by the Company on a full-time basis when the condition in (1) is met. If either of these conditions is not satisfied, then none of the shares of restricted stock will vest and they will be forfeited.
The shares of restricted stock, other than the shares awarded to employees in August 2014, have been valued utilizing the closing price of the Company’s stock quoted on The Nasdaq Global Select Market on the date of grant. The shares of restricted stock awarded to employees in August 2014 are effectively forward starting knock-in barrier options with a strike price of zero. The fair value of these shares of restricted stock was calculated utilizing an adjusted Monte Carlo simulation discounted cash flow model which was developed for the purpose of the valuation of these shares. For each simulated share price path, the market share price condition was evaluated to determine whether or not the shares would vest under that simulation. The “adjustment” to the Monte Carlo simulation model incorporates a “jump diffusion” process to the standard Geometric Brownian Motion simulation, in order to capture the discontinuous share price jumps observed in the Company’s share price movements on stock exchanges on which it is listed. Therefore, the simulated share price paths capture the idiosyncrasies of the observed Company share price movements.
In scenarios where the shares do not vest, the final vested value at maturity is zero. In scenarios where vesting occurs, the final vested value on maturity is the share price on vesting date. The value of the grant is the average of the discounted vested values. The Company used an expected volatility of 76.01%, an expected life of approximately three years, a risk-free rate of 1.27% and no future dividends in its calculation of the fair value of the shares of restricted stock awarded to employees in August 2014. Estimated expected volatility was calculated based on the Company’s 30 day VWAP share price using the exponentially weighted moving average of returns.
The fair value of restricted stock vesting during the three months ended September 30, 2015 and 2014, respectively, was $1.4 million and $0.8 million.
Stock-based compensation charge and unrecognized compensation cost
The Company has recorded a stock-based compensation charge of $0.7 million and $0.9 million, respectively, during the three months ended September 30, 2015 and 2014, which comprised:
| Allocated to cost | ||||||||||
| of goods sold, IT | Allocated to | |||||||||
| processing, | selling, general | |||||||||
| Total | servicing and | and | ||||||||
| charge | support | administration | ||||||||
| Three months ended September 30, 2015 Stock-based compensation charge | $ | 726 |
$ |
- | $ | 726 | ||||
| Total – three months ended September 30, 2015 | $ | 726 | $ | - | $ | 726 | ||||
| Three months ended September 30, 2014 Stock-based compensation charge | $ | 916 | $ | - | $ | 916 | ||||
| Total – three months ended September 30, 2014 | $ | 916 | $ | - | $ | 916 |
The stock-based compensation charges have been allocated to selling, general and administration based on the allocation of the cash compensation paid to the employees.
18
| 12. |
Stock-based compensation (continued) |
Stock-based compensation charge and unrecognized compensation cost (continued)
Restricted stock (continued)
As of September 30, 2015, the total unrecognized compensation cost related to stock options was approximately $1.5 million, which the Company expects to recognize over approximately three years. As of September 30, 2015, the total unrecognized compensation cost related to restricted stock awards was approximately $1.2 million, which the Company expects to recognize over approximately two years.
As of September 30, 2015 and June 30, 2015, respectively, the Company has recorded a deferred tax asset of approximately $1.5 million and $1.6 million related to the stock-based compensation charge recognized related to employees and directors of Net1 as it is able to deduct the grant date fair value for taxation purposes in the United States.
| 13. |
Earnings per share |
Basic earnings per share include shares of restricted stock that meet the definition of a participating security because these shares are eligible to receive non-forfeitable dividend equivalents at the same rate as common stock. Basic earnings per share have been calculated using the two-class method and basic earnings per share for the three months ended September 30, 2015 and 2014, reflects only undistributed earnings. The computation below of basic earnings per share excludes the net income attributable to shares of unvested restricted stock (participating non-vested restricted stock) from the numerator and excludes the dilutive impact of these unvested shares of restricted stock from the denominator.
Diluted earnings per share have been calculated to give effect to the number of shares of additional common stock that would have been outstanding if the potential dilutive instruments had been issued in each period. Stock options are included in the calculation of diluted earnings per share utilizing the treasury stock method and are not considered to be participating securities as the stock options do not contain non-forfeitable dividend rights. The calculation of diluted earnings per share includes the dilutive effect of a portion of the restricted stock granted to employees in February 2012, August 2013, August 2014, November 2014 and August 2015 as these shares of restricted stock are considered contingently returnable shares for the purposes of the diluted earnings per share calculation and the vesting conditions in respect of a portion of the restricted stock had been satisfied. The vesting conditions are discussed in Note 18 to the Company’s audited consolidated financial statements included in its Annual Report on Form 10-K for the year ended June 30, 2015.
19
| 13. |
Earnings per share (continued) |
The following table presents net income attributable to Net1 (income from continuing operations) and the share data used in the basic and diluted earnings per share computations using the two-class method:
| Three months ended | |||||||
| September 30, | |||||||
| 2015 | 2014 | ||||||
| (in thousands except percent | |||||||
| and | |||||||
| per share data) | |||||||
| Numerator: | |||||||
| Net income attributable to Net1 | $ | 23,020 | $ | 24,089 | |||
| Undistributed earnings | 23,020 | 24,089 | |||||
| Percent allocated to common shareholders (Calculation 1) | 99% | 99% | |||||
| Numerator for earnings per share: basic and diluted | $ | 22,817 | $ | 23,847 | |||
| Denominator: | |||||||
| Denominator for
basic earnings per share: weighted-average common shares outstanding |
46,209 | 46,751 | |||||
| Effect of dilutive securities: | |||||||
| Stock options | 460 | 109 | |||||
| Denominator
for diluted earnings per share: adjusted weighted average common shares outstanding and assumed conversion |
46,669 | 46,860 | |||||
| Earnings per share: | |||||||
| Basic | $ | 0.49 | $ | 0.51 | |||
| Diluted | $ | 0.49 | $ | 0.51 | |||
| (Calculation 1) | |||||||
| Basic weighted-average common shares outstanding (A) | 46,209 | 46,751 | |||||
| Basic weighted-average
common shares outstanding and unvested restricted shares expected to vest (B) |
46,620 | 47,226 | |||||
| Percent allocated to common shareholders (A) / (B) | 99% | 99% | |||||
Options to purchase 874,443 shares of the Company’s common stock at prices ranging from $22.51 to $24.46 per share were outstanding during the three months ended September 30, 2015, but were not included in the computation of diluted earnings per share because the options’ exercise price were greater than the average market price of the Company’s common stock. The options, which expire at various dates through August 27, 2018, were still outstanding as of September 30, 2015.
| 14. |
Supplemental cash flow information |
The following table presents supplemental cash flow disclosures for the three months ended September 30, 2015 and 2014:
| Three months ended | |||||||
| September 30, | |||||||
| 2015 | 2014 | ||||||
| Cash received from interest | $ | 4,265 | $ | 4,163 | |||
| Cash paid for interest | $ | 939 | $ | 1,218 | |||
| Cash paid for income taxes | $ | 4,066 | $ | 5,160 | |||
The sale of the Company’s NUETS business is described in Note 19 to its audited consolidated financial statements included in its Annual Report on Form 10-K for the year ended June 30, 2015. The Company received cash sale proceeds of $1.9 million related to this transaction in July 2014.
As discussed in Note 12, during the three months ended September 30, 2014, employees exercised stock options through the delivery 336,584 shares of the Company’s common stock at the closing price on September 9, 2014 or $13.93 under the terms of their option agreements.
20
| 15. |
Operating segments |
The Company discloses segment information as reflected in the management information systems reports that its chief operating decision maker uses in making decisions and to report certain entity-wide disclosures about products and services, major customers, and the countries in which the entity holds material assets or reports material revenues. A description of the Company’s operating segments is contained in Note 23 to the Company’s audited consolidated financial statements included in its Annual Report on Form 10-K for the year ended June 30, 2015.
The reconciliation of the reportable segments revenue to revenue from external customers for the three months ended September 30, 2015 and 2014, respectively, is as follows:
| Revenue | ||||||||||
| From | ||||||||||
| Reportable | Inter- | external | ||||||||
| Segment | segment | customers | ||||||||
| South African transaction processing | $ | 55,639 | $ | 3,627 | $ | 52,012 | ||||
| International transaction processing | 41,229 | - | 41,229 | |||||||
| Financial inclusion and applied technologies | 67,360 | 6,128 | 61,232 | |||||||
| Total for the three months ended September 30, 2015 | 164,228 | 9,755 | 154,473 | |||||||
| South African transaction processing | 60,252 | 5,121 | 55,131 | |||||||
| International transaction processing | 43,204 | - | 43,204 | |||||||
| Financial inclusion and applied technologies | 65,197 | 7,091 | 58,106 | |||||||
| Total for the three months ended September 30, 2014 | $ | 168,653 | $ | 12,212 | $ | 156,441 | ||||
The Company does not allocate interest income, interest expense or income tax expense to its reportable segments. The Company evaluates segment performance based on segment operating income before acquisition-related intangible asset amortization which represents operating income before acquisition-related intangible asset amortization and allocation of expenses allocated to Corporate/Eliminations, all under GAAP. The reconciliation of the reportable segments measure of profit or loss to income before income taxes for the three months ended September 30, 2015 and 2014, respectively, is as follows:
| Three months ended | |||||||
| September 30, | |||||||
| 2015 | 2014 | ||||||
| Reportable segments measure of profit or loss | $ | 36,608 | $ | 38,595 | |||
| Operating income: Corporate/Eliminations | (5,393 | ) | (5,470 | ) | |||
| Interest income | 4,275 | 4,090 | |||||
| Interest expense | (974 | ) | (1,312 | ) | |||
| Income before income taxes | $ | 34,516 | $ | 35,903 | |||
The following tables summarize segment information which is prepared in accordance with GAAP for the three months ended September 30, 2015 and 2014:
| Three months ended | |||||||
| September 30, | |||||||
| 2015 | 2014 | ||||||
| Revenues | |||||||
| South African transaction processing | $ | 55,639 | $ | 60,252 | |||
| International transaction processing | 41,229 | 43,204 | |||||
| Financial inclusion and applied technologies | 67,360 | 65,197 | |||||
| Total | 164,228 | 168,653 | |||||
| Operating income (loss) | |||||||
| South African transaction processing | 13,511 | 13,639 | |||||
| International transaction processing | 6,543 | 7,349 | |||||
| Financial inclusion and applied technologies | 16,554 | 17,607 | |||||
| Subtotal: Operating segments | 36,608 | 38,595 | |||||
| Corporate/Eliminations | (5,393 | ) | (5,470 | ) | |||
| Total | $ | 31,215 | $ | 33,125 | |||
21
| 15. |
Operating segments (continued) |
| Three months ended | |||||||
| September 30, | |||||||
| 2015 | 2014 | ||||||
| Depreciation and amortization | |||||||
| South African transaction processing | $ | 1,795 | $ | 1,722 | |||
| International transaction processing | 4,696 | 4,372 | |||||
| Financial inclusion and applied technologies | 240 | 179 | |||||
| Subtotal: Operating segments | 6,731 | 6,273 | |||||
| Corporate/Eliminations | 3,384 | 3,901 | |||||
| Total | 10,115 | 10,174 | |||||
| Expenditures for long-lived assets | |||||||
| South African transaction processing | 1,447 | 682 | |||||
| International transaction processing | 8,038 | 8,327 | |||||
| Financial inclusion and applied technologies | 1,213 | 369 | |||||
| Subtotal: Operating segments | 10,698 | 9,378 | |||||
| Corporate/Eliminations | - | - | |||||
| Total | $ | 10,698 | $ | 9,378 | |||
The segment information as reviewed by the chief operating decision maker does not include a measure of segment assets per segment as all of the significant assets are used in the operations of all, rather than any one, of the segments. The Company does not have dedicated assets assigned to a particular operating segment. Accordingly, it is not meaningful to attempt an arbitrary allocation and segment asset allocation is therefore not presented.
It is impractical to disclose revenues from external customers for each product and service or each group of similar products and services.
| 16. |
Income tax |
Income tax in interim periods
For the purposes of interim financial reporting, the Company determines the appropriate income tax provision by first applying the effective tax rate expected to be applicable for the full fiscal year to ordinary income. This amount is then adjusted for the tax effect of significant unusual or extraordinary items, for instance, changes in tax law, valuation allowances and non-deductible transaction-related expenses that are reported separately, and have an impact on the tax charge. The cumulative effect of any change in the enacted tax rate, if and when applicable, on the opening balance of deferred tax assets and liabilities is also included in the tax charge as a discrete event in the interim period in which the enactment date occurs.
For the three months ended September 30, 2015, the tax charge was calculated using the expected effective tax rate for the year. The Company’s effective tax rate for the three months ended September 30, 2015, was 31.6% and was higher than the South African statutory rate as a result of a valuation allowance for foreign tax credits and non-deductible expenses (including consulting and legal fees).
The Company’s effective tax rate for the three months ended September 30, 2014, was 32.4%, and was higher than the South African statutory rate primarily as a result of non-deductible expenses (including interest expense related to the Company’s long-term Korean borrowings and stock-based compensation charges).
Uncertain tax positions
The Company increased its unrecognized tax benefits by approximately $0.1 million during the three months ended September 30, 2015. As of September 30, 2015, the Company had accrued interest related to uncertain tax positions of approximately $2.3 million on its balance sheet.
The Company does not expect changes related to its unrecognized tax benefits will have a significant impact on its results of operations or financial position in the next 12 months.
22
| 16. |
Income tax (continued) |
Uncertain tax positions (continued)
As of September 30, 2015 and June 30, 2015, the Company has unrecognized tax benefits of $2.4 million and $2.3 million, respectively, all of which would impact the Company’s effective tax rate. The Company files income tax returns mainly in South Africa, South Korea, India, the United Kingdom, Botswana and in the U.S. federal jurisdiction. As of September 30, 2015, the Company’s South African subsidiaries are no longer subject to income tax examination by the South African Revenue Service for periods before June 30, 2011. The Company is subject to income tax in other jurisdictions outside South Africa, none of which are individually material to its financial position, results of operations or cash flows.
| 17. |
Commitments and contingencies |
Guarantees
The South African Revenue Service and certain of the Company’s customers, suppliers and other business partners have asked the Company to provide them with guarantees, including standby letters of credit, issued by a South African bank. The Company is required to procure these guarantees for these third parties to operate its business.
Nedbank has issued guarantees to these third parties amounting to ZAR 124.9 million ($8.9 million, translated at exchange rates applicable as of September 30, 2015) and thereby utilizing part of the Company’s short-term facility. The Company in turn has provided nonrecourse, unsecured counter-guarantees to Nedbank for ZAR 124.9 million ($8.9 million, translated at exchange rates applicable as of September 30, 2015). The Company pays commission of between 0.2% per annum to 2.0% per annum of the face value of these guarantees and does not recover any of the commission from third parties.
The Company has not recognized any obligation related to these counter-guarantees in its consolidated balance sheet as of September 30, 2015 and June 30, 2015. The maximum potential amount that the Company could pay under these guarantees is ZAR 124.9 million ($8.9 million, translated at exchange rates applicable as of September 30, 2015). The guarantees have reduced the amount available for borrowings under the Company’s short-term credit facility described in Note 8.
Contingencies
Dismissal of U.S. Securities Litigation
On September 16, 2015, the United States District Court for the Southern District of New York dismissed the purported securities class action litigation originally filed on December 24, 2013, against the Company, its Chief Executive Officer and its Chief Financial Officer. In its opinion, the District Court provided plaintiff with 30 days to file a second amended complaint. This deadline passed without plaintiff taking any action. Accordingly, the case has been closed. Plaintiff may file a notice of appeal until November 23, 2015. The Company intends to vigorously defend any appeal of the District Court’s ruling.
The Company is subject to a variety of insignificant claims and suits that arise from time to time in the ordinary course of business.
Management currently believes that the resolution of these matters, individually or in the aggregate, will not have a material adverse impact on the Company’s financial position, results of operations or cash flows.
23
Item 2. Management’s Discussion and Analysis of Financial Condition and Results of Operations
The following discussion should be read in conjunction with our Annual Report on Form 10-K for the year ended June 30, 2015, and the unaudited condensed consolidated financial statements and the accompanying notes included in this Form 10-Q.
Forward-looking statements
Some of the statements in this Form 10-Q constitute forward-looking statements. These statements relate to future events or our future financial performance and involve known and unknown risks, uncertainties and other factors that may cause our or our industry’s actual results, levels of activity, performance or achievements to be materially different from any future results, levels of activity, performance or achievements expressed, implied or inferred by these forward-looking statements. Such factors include, among other things, those listed under Item 1A.—“Risk Factors” and elsewhere in our Annual Report on Form 10-K for the year ended June 30, 2015. In some cases, you can identify forward-looking statements by terminology such as “may,” “will,” “should,” “could,” “would,” “expects,” “plans,” “intends,” “anticipates,” “believes,” “estimates,” “predicts,” “potential” or “continue” or the negative of such terms and other comparable terminology.
Although we believe that the expectations reflected in the forward-looking statements are reasonable, we do not know whether we can achieve positive future results, levels of activity, performance, or goals. Actual events or results may differ materially. We undertake no obligation to update any of the forward-looking statements after the date of this Form 10-Q to conform those statements to reflect the occurrence of unanticipated events, except as required by applicable law.
You should read this Form 10-Q and the documents that we reference herein and the documents we have filed as exhibits hereto and thereto and which we have filed with the Securities and Exchange Commission completely and with the understanding that our actual future results, levels of activity, performance and achievements may be materially different from what we expect. We qualify all of our forward-looking statements by these cautionary statements.
Recent Developments
Cancellation of SASSA Tender
In late 2014, the South African Social Security Agency SASSA, or SASSA, issued a request for proposal, or RFP, as ordered by the South African Constitutional Court. In May 2015, after careful consideration of all the relevant factors, we decided to withdraw from the tender process and did not submit a bid.
On October 15, 2015, SASSA filed an update on the tender process with the Constitutional Court, which reported that the Chief Executive Officer, or CEO, of SASSA decided not to award the SASSA tender, in accordance with the recommendation received from the Bid Adjudication Committee, or BAC. The BAC recommended that the tender not be awarded as a result of the non-responsiveness of all the bids received with the mandatory requirements contained in the RFP.
Accordingly, the BAC recommended that the CEO should allow our current SASSA contract to continue until completion of the five-year period for which the contract was initially awarded (March 31, 2017), in accordance with the Constitutional Court’s judgment of April 2014. The BAC also recommended that the CEO should file a report with the Constitutional Court within 14 days of the decision not to award the tender, setting out all the relevant information on whether and when SASSA will be ready to assume the duty to pay grants itself.
Accordingly, we expect that we will continue to provide our social grants payment service to SASSA through March 31, 2017. We cannot predict at this time whether or not we will continue to provide our service after that date. We are committed to continue with the provision of a high level service to SASSA and the social grant beneficiaries in accordance with the service level agreement and the Constitutional Court’s order.
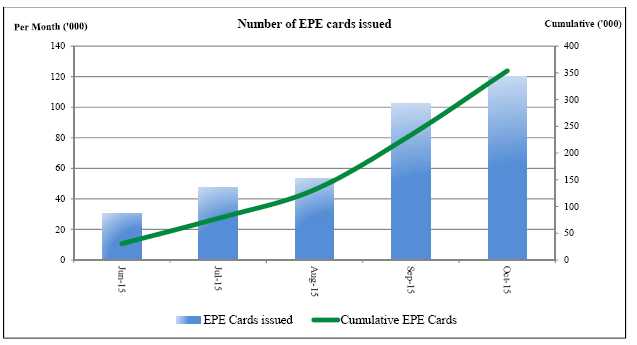
Introduction of EasyPay Everywhere “EPE” and EPE ATMs in South Africa
In June 2015, we began the rollout of EPE our business-to-consumer, or B2C, offering in South Africa and had opened approximately 350,000 bank accounts as at the end of October 2015. EPE is a fully transactional account created to serve the needs of South Africa’s unbanked and under-banked population, and is available to all consumers regardless of their financial or social status. The EPE account offers customers a comprehensive suite of financial and various financial inclusion services, such as prepaid products, in an economical, convenient and secure solution. EPE provides account holders with a UEPS-EMV debit MasterCard, mobile and internet banking services, ATM and POS services, as well as loans, insurance and other financial products and value-added services.
24
To support the rollout of EPE, we have deployed ATMs, which are both EMV-and UEPS-compliant, and provided biometric verification as well as proof of life functionality, in South Africa. We placed these ATMs with our merchant partners and within our own branches, creating a new delivery channel for our products and services that did not previously exist. ATM rollout has continued to make a positive contribution to our reported results and we have been able to expand our customer base because our ATMs accept all EMV-compliant cards. We currently have approximately 750 operational ATMs, and are actively deploying more ATMs in high demand areas. We will continue to expand our ATM footprint in fiscal 2016.
Smart Life resumes writing new insurance policies
We have complied with all the conditions imposed by the South African Financial Services Board, or FSB, to uplift the suspension of Smart Life’s license to provide long-term insurance products, which resulted in the FSB withdrawing the prohibition to conduct new business issued by it approximately two years ago. In September 2015, we resumed marketing and business development activities in selected areas for the distribution of our simple, low-cost life insurance products and have sold approximately 5,700 new policies as at the end of October 2015. We are currently recruiting staff members to expand our marketing activities across South Africa during fiscal 2016.
Critical Accounting Policies
Our unaudited condensed consolidated financial statements have been prepared in accordance with U.S. GAAP, which requires management to make estimates and assumptions about future events that affect the reported amount of assets and liabilities and disclosure of contingent assets and liabilities. As future events and their effects cannot be determined with absolute certainty, the determination of estimates requires management’s judgment based on a variety of assumptions and other determinants such as historical experience, current and expected market conditions and certain scientific evaluation techniques.
Critical accounting policies are those that reflect significant judgments or uncertainties, and potentially may result in materially different results under different assumptions and conditions. Management has identified the following critical accounting policies that are described in more detail in our Annual Report on Form 10-K for the year ended June 30, 2015:
|
|
• |
Business combinations and the recoverability of goodwill; |
|
|
• |
Intangible assets acquired through acquisitions; |
|
|
• |
Deferred taxation; |
|
|
• |
Stock-based compensation and equity instrument issued pursuant to BEE transaction; |
|
|
• |
Accounts receivable and allowance for doubtful accounts receivable; and |
|
|
• |
Research and development. |
25
Recent accounting pronouncements adopted
Refer to Note 1 to our unaudited condensed consolidated financial statements for a full description of recent accounting pronouncements adopted, including the dates of adoption and the effects on our condensed consolidated financial statements.
Recent accounting pronouncements not yet adopted as of September 30, 2015
Refer to Note 1 to our unaudited condensed consolidated financial statements for a full description of recent accounting pronouncements not yet adopted as of September 30, 2015, including the expected dates of adoption and effects on our financial condition, results of operations and cash flows.
Currency Exchange Rate Information
Actual exchange rates
The actual exchange rates for and at the end of the periods presented were as follows:
| Table 1 | Three months ended | Year ended | |||||||
| September 30, | June 30, | ||||||||
| 2015 | 2014 | 2015 | |||||||
| ZAR : $ average exchange rate | 12.9702 | 10.7581 | 11.4494 | ||||||
| Highest ZAR : $ rate during period | 14.0282 | 11.2641 | 12.5779 | ||||||
| Lowest ZAR : $ rate during period | 12.1965 | 10.5128 | 10.5128 | ||||||
| Rate at end of period | 14.0282 | 11.2641 | 12.2854 | ||||||
| KRW : $ average exchange rate | 1,169 | 1,027 | 1,078 | ||||||
| Highest KRW : $ rate during period | 1,203 | 1,051 | 1,139 | ||||||
| Lowest KRW : $ rate during period | 1,118 | 1,009 | 1,009 | ||||||
| Rate at end of period | 1,196 | 1,051 | 1,128 | ||||||
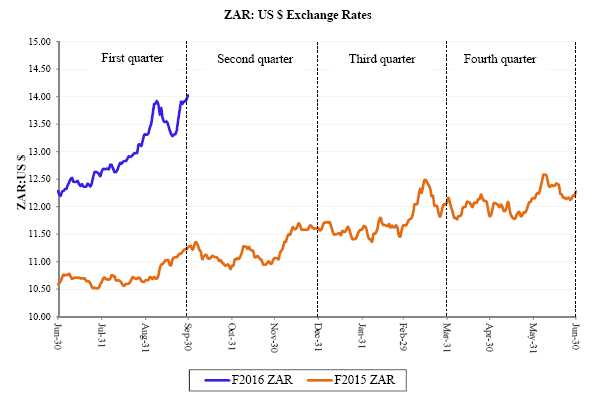
26
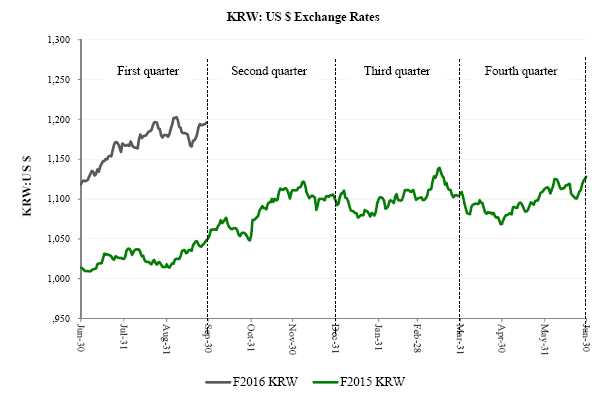
Translation exchange rates for financial reporting purposes
We are required to translate our results of operations from ZAR and KRW to U.S. dollars on a monthly basis. Thus, the average rates used to translate this data for the three months ended September 30, 2015 and 2014, vary slightly from the averages shown in the table above. The translation rates we use in presenting our results of operations are the rates shown in the following table:
| Table 2 | Three months ended | Year ended | |||||||
| September 30, | June 30, | ||||||||
| 2015 | 2014 | 2015 | |||||||
| Income and expense items: $1 = ZAR | 12.9583 | 10.7431 | 11.4275 | ||||||
| Income and expense items: $1 = KRW | 1,167 | 1,029 | 1,073 | ||||||
| Balance sheet items: $1 = ZAR | 14.0282 | 11.2641 | 12.2854 | ||||||
| Balance sheet items: $1 = KRW | 1,196 | 1,051 | 1,128 | ||||||
Results of operations
The discussion of our consolidated overall results of operations is based on amounts as reflected in our unaudited condensed consolidated financial statements which are prepared in accordance with U.S. GAAP. We analyze our results of operations both in U.S. dollars, as presented in the consolidated financial statements, and supplementally in ZAR, because ZAR is the functional currency of the entities which contribute the majority of our profits and is the currency in which the majority of our transactions are initially incurred and measured. Due to the significant impact of currency fluctuations between the U.S. dollar and ZAR on our reported results and because we use the U.S. dollar as our reporting currency, we believe that the supplemental presentation of our results of operations in ZAR is useful to investors to understand the changes in the underlying trends of our business.
Our operating segment revenue presented in “—Results of operations by operating segment” represents total revenue per operating segment before inter-segment eliminations. Reconciliation between total operating segment revenue and revenue presented in our consolidated financial statements is included in Note 15 to those statements.
27
We analyze our business and operations in terms of three inter-related but independent operating segments: (1) South African transaction processing, (2) International transaction processing and (3) Financial inclusion and applied technologies. In addition, corporate and corporate office activities that are impracticable to ascribe directly to any of the other operating segments, as well as any inter-segment eliminations, are included in corporate/eliminations.
First quarter of fiscal 2016 compared to first quarter of fiscal 2015
The following factors had a significant influence on our results of operations during the first quarter of fiscal 2016 as compared with the same period in the prior year:
|
• |
Unfavorable impact from the strengthening of the U.S. dollar against primary functional currencies: The U.S. dollar appreciated by 21% against the ZAR and 13% against the KRW during the first quarter of fiscal 2016, which negatively impacted our reported results; | |
|
|
• |
Increased contribution by KSNET: Our results were positively impacted by growth in our Korean operations; |
|
• |
Continued growth in financial inclusion services: We continued to grow our financial inclusion services offerings during the first quarter of fiscal 2016 which has resulted in higher revenues and operating income, primarily from more sales of low-margin prepaid airtime and an increase in transaction fees; | |
|
• |
Increase in the number of SASSA grants paid: Our revenue and operating income have increased as a result of the higher number of SASSA UEPS/EMV beneficiaries paid during fiscal 2016 compared with 2015; and | |
|
• |
Launch of EPE and Smart Life: During the first quarter of fiscal 2016 we launched our EPE and Smart Life offerings, which contributed to a marginal increase in revenue in ZAR, as well as an associated increase in establishment costs. |
Consolidated overall results of operations
This discussion is based on the amounts which were prepared in accordance with U.S. GAAP.
The following tables show the changes in the items comprising our statements of operations, both in U.S. dollars and in ZAR:
| In United States Dollars | |||||||||
| Table 3 | (U.S. GAAP) | ||||||||
| Three months ended September 30, | |||||||||
| 2015 | 2014 | $ % | |||||||
| $ ’000 | $ ’000 | change | |||||||
| Revenue | 154,473 | 156,441 | (1% | ) | |||||
| Cost of goods sold, IT processing, servicing and support | 77,382 | 74,406 | 4% | ||||||
| Selling, general and administration | 35,761 | 38,736 | (8% | ) | |||||
| Depreciation and amortization | 10,115 | 10,174 | (1% | ) | |||||
| Operating income | 31,215 | 33,125 | (6% | ) | |||||
| Interest income | 4,275 | 4,090 | 5% | ||||||
| Interest expense | 974 | 1,312 | (26% | ) | |||||
| Income before income tax expense | 34,516 | 35,903 | (4% | ) | |||||
| Income tax expense | 10,897 | 11,648 | (6% | ) | |||||
| Net income before earnings from equity-accounted investments | 23,619 | 24,255 | (3% | ) | |||||
| Earnings from equity-accounted investments | 188 | 92 | 104% | ||||||
| Net income | 23,807 | 24,347 | (2% | ) | |||||
| Less net income attributable to non-controlling interest | 787 | 258 | 205% | ||||||
| Net income attributable to us | 23,020 | 24,089 | (4% | ) | |||||
28
| In South African Rand | |||||||||
| Table 4 | (U.S. GAAP) | ||||||||
| Three months ended September 30, | |||||||||
| 2015 | 2014 | ||||||||
| ZAR | ZAR | ZAR % | |||||||
| ’000 | ’000 | change | |||||||
| Revenue | 2,001,707 | 1,680,661 | 19% | ||||||
| Cost of goods sold, IT processing, servicing and support | 1,002,739 | 799,351 | 25% | ||||||
| Selling, general and administration | 463,402 | 416,145 | 11% | ||||||
| Depreciation and amortization | 131,073 | 109,300 | 20% | ||||||
| Operating income | 404,493 | 355,865 | 14% | ||||||
| Interest income | 55,397 | 43,939 | 26% | ||||||
| Interest expense | 12,621 | 14,095 | (10% | ) | |||||
| Income before income tax expense | 447,269 | 385,709 | 16% | ||||||
| Income tax expense | 141,207 | 125,136 | 13% | ||||||
| Net income before earnings from equity-accounted investments | 306,062 | 260,573 | 17% | ||||||
| Earnings from equity-accounted investments | 2,436 | 988 | 147% | ||||||
| Net income | 308,498 | 261,561 | 18% | ||||||
| Less net income attributable to non-controlling interest | 10,198 | 2,772 | 268% | ||||||
| Net income attributable to us | 298,300 | 258,789 | 15% | ||||||
The increase in revenue in ZAR was primarily due to higher prepaid airtime sales, more low-margin transaction fees generated from cardholders using the South African National Payment System, more fees generated from our new EPE and ATM offerings, an increase in the number of SASSA UEPS/ EMV beneficiaries paid, a higher contribution from KSNET and more ad hoc terminal sales, offset by lower UEPS-loans fees.
The increase in cost of goods sold, IT processing, servicing and support was primarily due to higher expenses incurred from increased usage of the South African National Payment System by beneficiaries, expenses incurred to roll-out our new EPE and ATM offerings, and more prepaid airtime sold.
In ZAR, our selling, general and administration expense increased due to a higher staff complement resulting from our EPE roll-out as well as increases in goods and services purchased from third parties.
Our operating income margin for first quarter of fiscal 2016 and 2015 was 20% and 21% respectively. We discuss the components of operating income margin under “—Results of operations by operating segment.” The decrease is primarily attributable to the higher cost of goods sold, IT processing, servicing and support referred to above and an increase in depreciation expenses.
In ZAR, depreciation and amortization were higher primarily as a result of an increase in depreciation related to more terminals used to provide transaction processing in Korea and the roll-out of EPE ATMs.
Interest on surplus cash increased to $4.3 million (ZAR 55.4 million) from $4.1 million (ZAR 43.9 million), due primarily to higher average daily ZAR cash balances.
Interest expense decreased to $1.0 million (ZAR 12.6 million) from $1.3 million (ZAR 14.1 million), due to a lower average long-term debt balance on our South Korean debt and a lower interest rate.
Fiscal 2016 tax expense was $10.9 million (ZAR 141.2 million) compared to $11.6 million (ZAR 125.1 million) in fiscal 2015. Our effective tax rate for fiscal 2016, was 31.6% and was higher than the South African statutory rate as a result of a valuation allowance for foreign tax credits and non-deductible expenses (including consulting and legal fees). Our effective tax rate for fiscal 2015, was 32.4% and was higher than the South African statutory rate as a result of non-deductible expenses (including interest expense related to our long-term Korean borrowings and stock-based compensation charges).
29
Results of operations by operating segment
The composition of revenue and the contributions of our business activities to operating income are illustrated below
| Table 5 | In United States Dollars (U.S. GAAP) | ||||||||||||||
| Three months ended September 30, | |||||||||||||||
| 2015 | % of | 2014 | % of | % | |||||||||||
| Operating Segment | $ | ’000 | total | $ | ’000 | total | change | ||||||||
| Revenue: | |||||||||||||||
| South African transaction processing | 55,639 | 36% | 60,252 | 39% | (8% | ) | |||||||||
| International transaction processing | 41,229 | 27% | 43,204 | 28% | (5% | ) | |||||||||
| Financial inclusion and applied technologies | 67,360 | 44% | 65,197 | 42% | 3% | ||||||||||
| Subtotal: Operating segments | 164,228 | 107% | 168,653 | 109% | (3% | ) | |||||||||
| Intersegment eliminations | (9,755 | ) | (7% | ) | (12,212 | ) | (9% | ) | (20% | ) | |||||
| Consolidated revenue | 154,473 | 100% | 156,441 | 100% | (1% | ) | |||||||||
| Operating income (loss): | |||||||||||||||
| South African transaction processing | 13,511 | 43% | 13,639 | 41% | (1% | ) | |||||||||
| International transaction processing | 6,543 | 21% | 7,349 | 22% | (11% | ) | |||||||||
| Financial inclusion and applied technologies | 16,554 | 53% | 17,607 | 53% | (6% | ) | |||||||||
| Subtotal: Operating segments | 36,608 | 117% | 38,595 | 116% | (5% | ) | |||||||||
| Corporate/Eliminations | (5,393 | ) | (17% | ) | (5,470 | ) | (16% | ) | (1% | ) | |||||
| Consolidated operating income | 31,215 | 100% | 33,125 | 100% | (6% | ) | |||||||||
| Table 6 | In South African Rand (U.S. GAAP) | ||||||||||||||
| Three months ended September 30, | |||||||||||||||
| 2015 | 2014 | ||||||||||||||
| ZAR | % of | ZAR | % of | % | |||||||||||
| Operating Segment | ’000 | total | ’000 | total | change | ||||||||||
| Revenue: | |||||||||||||||
| South African transaction processing | 720,987 | 36% | 647,293 | 39% | 11% | ||||||||||
| International transaction processing | 534,258 | 27% | 464,145 | 28% | 15% | ||||||||||
| Financial inclusion and applied technologies | 872,871 | 44% | 700,418 | 42% | 25% | ||||||||||
| Subtotal: Operating segments | 2,128,116 | 107% | 1,811,856 | 109% | 17% | ||||||||||
| Intersegment eliminations | (126,409 | ) | (7% | ) | (131,195 | ) | (9% | ) | (4% | ) | |||||
| Consolidated revenue | 2,001,707 | 100% | 1,680,661 | 100% | 19% | ||||||||||
| Operating income (loss): | |||||||||||||||
| South African transaction processing | 175,080 | 43% | 146,525 | 41% | 19% | ||||||||||
| International transaction processing | 84,786 | 21% | 78,951 | 22% | 7% | ||||||||||
| Financial inclusion and applied technologies | 214,512 | 53% | 189,154 | 53% | 13% | ||||||||||
| Subtotal: Operating segments | 474,378 | 117% | 414,630 | 116% | 14% | ||||||||||
| Corporate/Eliminations | (69,884 | ) | (17% | ) | (58,765 | ) | (16% | ) | 19% | ||||||
| Consolidated operating income | 404,494 | 100% | 355,865 | 100% | 14% | ||||||||||
South African transaction processing
In ZAR, the increase in segment revenue was primarily due to more low-margin transaction fees generated from card holders using the South African National Payment System and an increase in the number of social welfare grants distributed, offset by fewer inter-segment transaction processing activities.
Our operating income margin for the first quarter of fiscal 2016 and 2015 was 24% and 23%, respectively, and has increased primarily due to an increase in the number of beneficiaries paid in fiscal 2016 and a modest increase in the margin of transaction fees generated from cardholders using the South African National Payment System.
International transaction-based activities
Revenue increased in constant currency primarily due to higher transaction volume at KSNET during the first quarter of fiscal 2016. Operating income during the first fiscal quarter of 2016 was higher due to increase in revenue contribution from KSNET and a positive contribution by XeoHealth, but was partially offset by ongoing ZAZOO start-up costs in the UK and India. Operating income margin for the first quarter of fiscal 2016 and 2015 was 16% and 17%, respectively.
30
Financial inclusion and applied technologies
In ZAR, Financial inclusion and applied technologies revenue and operating income increased primarily due to higher prepaid airtime and other value-added services sales, more ad hoc terminal and card sales and, in ZAR, an increase in inter-segment revenues. Operating income for the first quarter of fiscal 2016, was adversely impacted by establishment costs for EPE and Smart Life.
The South African National Credit Act, or NCA, made certain industry-wide amendments, which became effective March 13, 2015. These amendments were introduced primarily to address over-indebtedness of South African consumers and require lenders to perform a stricter affordability assessment. Compliance with the amended legislation had a modest negative impact on our UEPS-based lending businesses in the first quarter of fiscal 2016.
Operating income margin for the Financial inclusion and applied technologies segment was 25% and 27%, respectively, during the first quarter of fiscal 2016 and 2015, and has decreased primarily due to the sale of more low-margin prepaid airtime and establishment costs for EPE and Smart Life.
Corporate/ Eliminations
Our corporate expenses generally include acquisition-related intangible asset amortization; expenditure related to compliance with the Sarbanes-Oxley Act of 2002; non-employee directors’ fees; employee and executive bonuses; stock-based compensation; legal fees; audit fees; directors and officers insurance premiums; telecommunications expenses; property-related expenditures including utilities, rental, security and maintenance; and elimination entries.
In USD, our corporate expenses have decreased primarily due to the impact of the stronger USD on goods and services procured in other currencies, primarily the ZAR, and lower amortization costs, partially offset by modest increases in USD denominated goods and services purchased from third parties and directors’ fees.
Liquidity and Capital Resources
At September 30, 2015, our cash balances were $125.6 million, which comprised mainly ZAR-denominated balances of ZAR 1.4 billion ($101.0 million), U.S. dollar-denominated balances of $16.1 million and other currency deposits, primarily euros and British pounds of $8.5 million. The increase in our cash balances from June 30, 2015, was primarily due to the expansion of all of our core businesses, offset by provisional tax payments, capital expenditures and the strengthening of the U.S. dollar against our primary functional currencies.
We currently believe that our cash and credit facilities are sufficient to fund our future operations for at least the next four quarters.
We generally invest the surplus cash held by our South African operations in overnight call accounts that we maintain at South African banking institutions, and surplus cash held by our non-South African companies in the U.S. money markets. We have invested surplus cash in Korea in short-term investment accounts at Korean banking institutions.
Historically, we have financed most of our operations, research and development, working capital, capital expenditures and acquisitions through our internally generated cash. When considering whether to borrow under our financing facilities, we consider the cost of capital, cost of financing, opportunity cost of utilizing surplus cash and availability of tax efficient structures to moderate financing costs.
We have a short-term South African credit facility with Nedbank Limited of ZAR 400 million ($28.5 million), which consists of (i) a primary amount of up to ZAR 200 million, which is immediately available, and (ii) a secondary amount of up to ZAR 200 million, which is not immediately available. The primary amounts comprises an overdraft facility of up to ZAR 50 million and indirect and derivative facilities of up to ZAR 150 million, which includes letters of guarantee, letters of credit and forward exchange contracts. As of September 30, 2015, we have used none of the overdraft and ZAR 128.2 million ($9.1 million) of the indirect and derivative facilities to obtain foreign exchange contracts and to support guarantees issued by Nedbank to various third parties on our behalf. Refer to Note 12 to our audited consolidated financial statements included in our Annual Report on Form 10-K for the year ended June 30, 2015, for additional information related to our short-term facilities.
As of September 30, 2015, we had outstanding long-term debt of KRW 68.1 billion (approximately $56.9 million translated at exchange rates applicable as of September 30, 2015) under credit facilities with a group of South Korean banks. The loans bear interest at the South Korean CD rate in effect from time to time (1.64% as of September 30, 2015) plus a margin of 3.10% for one of the term loan facilities and the revolver. Scheduled remaining repayments of the term loans and loan under the revolving credit facility are as follows: April 2016, 2017 and 2018 (KRW 10 billion each) and October 2018 (KRW 30 billion plus all outstanding loans under our revolving credit facility). Refer to Note 9 to our unaudited condensed consolidated financial statements for the three months ended September 30, 2015, for additional information related to our long-term borrowings.
31
Cash flows from operating activities
First quarter of fiscal 2016 and 2015
Net cash provided by operating activities for the first quarter of fiscal 2016 was $28.1 million (ZAR 364.2 million) compared to cash provided by operating activities of $39.5 million (ZAR 424.6 million) for the first quarter of fiscal 2015. Excluding the impact of interest received, interest paid under our Korean debt and taxes presented in the table below, the decrease in cash from operating activities resulted from the timing of receipts of cash from customers.
During the first quarter of fiscal 2016, we made an additional tax payment of $3.4 million (ZAR 46.8 million) related to our 2015 tax year in South Africa. We paid dividend withholding taxes of $0.8million (ZAR 10 million) during the first quarter of fiscal 2016. We also paid taxes totaling $0.02 million in other tax jurisdictions, primarily South Korea. During the first quarter of fiscal 2015, we made an additional tax payment of $2.4 million (ZAR 26.4 million) related to our 2014 tax year in South Africa. We also paid taxes totaling $2.8 million in other tax jurisdictions, primarily South Korea.
Taxes paid during the first quarter of fiscal 2016 and 2015 were as follows:
| Table 7 | Three months ended September 30, | |||||||||||
| 2015 | 2014 | 2015 | 2014 | |||||||||
| $ | $ | ZAR | ZAR | |||||||||
| ‘000 | ‘000 | ‘000 | ‘000 | |||||||||
| Taxation paid related to prior years | 3,436 | 2,408 | 46,840 | 26,392 | ||||||||
| Taxation refunds received | (176 | ) | (34 | ) | (2,402 | ) | (365 | ) | ||||
| Dividend withholding taxation | 789 | - | 10,000 | - | ||||||||
| Total South African taxes paid | 4,049 | 2,374 | 54,438 | 26,027 | ||||||||
| Foreign taxes paid, primarily South Korea | 17 | 2,786 | 232 | 30,170 | ||||||||
| Total tax paid | 4,066 | 5,160 | 54,670 | 56,197 | ||||||||
We expect to pay our first provisional payments in South Africa related to our 2016 tax year in the second quarter of fiscal 2016.
Cash flows from investing activities
First quarter of fiscal 2016 and 2015
Cash used in investing activities for the first quarter of fiscal 2016 includes capital expenditure of $10.7 million (ZAR 138.8 million), primarily for the acquisition of payment processing terminals in Korea and the rollout of ATMs in South Africa.
Cash used in investing activities for the first quarter of fiscal 2015 includes capital expenditure of $9.4 million (ZAR 101.9 million), primarily for the acquisition of payment processing terminals in Korea.
Cash flows from financing activities
First quarter of fiscal 2016 and 2015
During the first quarter of fiscal 2016, we received approximately $3.8 million from the exercise of stock options and utilized approximately $0.7 million of our Korean borrowings to pay quarterly interest due.
During the first quarter of fiscal 2015, we repurchased BVI’s remaining 1,837,432 shares of Net1 common stock for approximately $9.2 million and BVI paid $1.4 million for 12.5% of CPS’ issued and outstanding ordinary shares. We also utilized approximately $1.1 million of our Korean borrowings to pay quarterly interest due and received approximately $1.0 million from the exercise of stock options during the first quarter of fiscal 2015.
Off-Balance Sheet Arrangements
We have no off-balance sheet arrangements.
32
Capital Expenditures
We expect capital spending for the second quarter of fiscal 2016 to primarily include the acquisition of payment terminals for the expansion of our operations in Korea and expansion of ATMs infrastructure and branch network in South Africa.
Our historical capital expenditures for the first quarter of fiscal 2016 and 2015 are discussed under “—Liquidity and Capital Resources—Cash flows from investing activities.” All of our capital expenditures for the past three fiscal years were funded through internally-generated funds. We had outstanding capital commitments as of September 30, 2015, of $1.5 million related mainly to the procurement of ATMs. We expect to fund these expenditures through internally-generated funds.
Contingent Liabilities, Commitments and Contractual Obligations
The following table sets forth our contractual obligations as of September 30, 2015:
| Table 8 | Payments due by Period, as of September 30, 2015(in $ ’000s) | ||||||||||||||
| Less | More | ||||||||||||||
| than 1 | 1-3 | 3-5 | than 5 | ||||||||||||
| Total | year | years | years | years | |||||||||||
| Long-term debt obligations (A) | 61,774 | 2,983 | 20,595 | 38,196 | - | ||||||||||
| Operating lease obligations | 9,638 | 4,325 | 5,000 | 313 | - | ||||||||||
| Purchase obligations | 4,763 | 4,763 | - | - | - | ||||||||||
| Capital commitments | 1,521 | 1,521 | - | - | - | ||||||||||
| Other long-term obligations (B)(C) | 2,178 | - | - | - | 2,178 | ||||||||||
| Total | 79,874 | 13,592 | 25,595 | 38,509 | 2,178 | ||||||||||
|
|
(A) |
– Includes $56.9 million of long-term debt and interest payable at the rate applicable on September 30, 2015, under our Korean debt facility. |
|
|
(B) |
– Includes policy holder liabilities of $1 million related to our insurance business. |
|
|
(C) |
– We have excluded cross-guarantees in the aggregate amount of $9.1 million issued as of September 30, 2015, to Nedbank to secure guarantees it has issued to third parties on our behalf as the amounts that will be settled in cash are not known and the timing of any payments is uncertain. |
Item 3. Quantitative and Qualitative Disclosures About Market Risk
In addition to the tables below, see Note 5 to the unaudited condensed consolidated financial statements for a discussion of market risk.
The following table illustrates the effect on our annual expected interest charge, translated at exchange rates applicable as of September 30, 2015, as a result of changes in the Korean CD. The effect of a hypothetical 1% (i.e. 100 basis points) increase and a 1% decrease in each of the Korean CD rate as of September 30, 2015, are shown. The selected 1% hypothetical change does not reflect what could be considered the best or worst case scenarios.
| As of September 30, 2015 | |||||||||
| Table 9 | Hypothetical | Estimated annual | |||||||
| change in | expected interest | ||||||||
| Korean CD | charge after | ||||||||
| rate or South | hypothetical change in | ||||||||
| Annual | Africa | Korean CD rate or | |||||||
| expected | overdraft | South African | |||||||
| interest | facility rate, | overdraft facility rate, | |||||||
| charge | as | as appropriate | |||||||
| ($ ’000) | appropriate | ($ ’000) | |||||||
| Interest on Korean long-term debt | 2,698 | 1% | 3,267 | ||||||
| (1% | ) | 2,129 | |||||||
33
The following table summarizes our exchange-traded equity securities with equity price risk as of September 30, 2015. The effects of a hypothetical 10% increase and a 10% decrease in market prices as of September 30, 2015, is also shown. The selected 10% hypothetical change does not reflect what could be considered the best or worst case scenarios.
| As of September 30, 2015 | ||||||||||||
| Table 10 | ||||||||||||
| Hypothetical | ||||||||||||
| Estimated fair | Percentage | |||||||||||
| value after | Increase | |||||||||||
| Fair | hypothetical | (Decrease) in | ||||||||||
| value | Hypothetical | change in price | Shareholders’ | |||||||||
| ($ ’000) | price change | ($ ’000) | Equity | |||||||||
| Exchange-traded equity securities | 6,618 | 10% | 7,280 | 0.14% | ||||||||
| (10% | ) | 5,956 | (0.14% | ) | ||||||||
Item 4. Controls and Procedures
Evaluation of disclosure controls and procedures
Under the supervision and with the participation of our management, including our chief executive officer and our chief financial officer, we conducted an evaluation of our disclosure controls and procedures, as such term is defined under Rule 13a-15(e) promulgated under the Securities Exchange Act of 1934, as amended, as of September 30, 2015. Management recognizes that any controls and procedures, no matter how well designed and operated, can provide only reasonable assurance of achieving their objectives and management necessarily applies its judgment in evaluating the cost-benefit relationship of possible controls and procedures. Based on this evaluation, the chief executive officer and the chief financial officer concluded that our disclosure controls and procedures were effective as of September 30, 2015.
Changes in Internal Control over Financial Reporting
There have not been any changes in our internal control over financial reporting during the fiscal quarter ended September 30, 2015, that have materially affected, or are reasonably likely to materially affect, our internal control over financial reporting.
34
Part II. Other Information
Item 1. Legal Proceedings
Constitutional Court Proceedings Relating to SASSA Tender Process
See disclosure under “Management’s Discussion and Analysis of Financial Condition and Results of Operations—Recent Developments—Cancellation of SASSA Tender” for an update regarding the proceedings in the Constitutional Court in connection with the SASSA tender process.
United States securities litigation
On September 16, 2015, the United States District Court for the Southern District of New York dismissed the purported securities class action litigation originally filed on December 24, 2013, against us, our Chief Executive Officer and our Chief Financial Officer. In its opinion, the District Court provided plaintiff with 30 days to file a second amended complaint. This deadline passed without plaintiff taking any action. Accordingly, the case has been closed. Plaintiff may file a notice of appeal until November 23, 2015. We intend to vigorously defend any appeal of the District Court’s ruling.
Item 6. Exhibits
The following exhibits are filed as part of this Form 10-Q:
| Incorporated by Reference Herein | ||||||||||
| Exhibit | Included | |||||||||
| No. | Description of Exhibit | Herewith | Form | Exhibit | Filing Date | |||||
| 31.1 | Certification of Principal Executive Officer pursuant to Rule 13a-14(a) under the Exchange Act | X | ||||||||
| 31.2 | Certification of Principal Financial Officer pursuant to Rule 13a-14(a) under the Exchange Act | X | ||||||||
| 32 | Certification pursuant to 18 USC Section 1350 | X | ||||||||
| 101.INS | XBRL Instance Document | X | ||||||||
| 101.SCH | XBRL Taxonomy Extension Schema | X | ||||||||
| 101.CAL | XBRL Taxonomy Extension Calculation Linkbase | X | ||||||||
| 101.DEF | XBRL Taxonomy Extension Definition Linkbase | X | ||||||||
| 101.LAB | XBRL Taxonomy Extension Label Linkbase | X | ||||||||
| 101.PRE | XBRL Taxonomy Extension Presentation Linkbase | X | ||||||||
SIGNATURES
Pursuant to the requirements of the Securities Exchange Act of 1934, the registrant has caused this report to be signed on its behalf by the undersigned, thereunto duly authorized, on November 5, 2015.
NET 1 UEPS TECHNOLOGIES, INC.
By: /s/ Dr. Serge C.P. Belamant
Dr. Serge C.P. Belamant
Chief
Executive Officer, Chairman of the Board and Director
By: /s/ Herman Gideon Kotzé
Herman Gideon Kotzé
Chief
Financial Officer, Treasurer and Secretary, Director
35