Attached files
| file | filename |
|---|---|
| 8-K - 8-K - AXON ENTERPRISE, INC. | q32015-8kearningsrelease.htm |
| EX-99.3 - EXHIBIT 99.3 - AXON ENTERPRISE, INC. | operatingmetrics2015q3.htm |
| EX-99.1 - EXHIBIT 99.1 - AXON ENTERPRISE, INC. | q32015-ex991earningsrelease.htm |

Q3 2015 Results Supplement November 3, 2015 Please re fe r to TASER’s 8-K as filed with the Securitie s and Exchange Com m ission for add itiona l in form ation .

3Q15 Results Dashboard IN MILLIONS, EXCEPT PER SHARE DATA Revenue Gross Margin % of revenue S G & A Op. CF R & D Op Inc Bookings Net Income Diluted EPS Q3 '14 Q3 '15 $44.3 $50.4 +13.6% Y/Y Q3 '14 Q3 '15 $28.7 $31.1 61.7% 64.7% +8.2% Y/Y Q3 '14 Q3 '15 $12.4 $17.8 35.4% +43.3% Y/Y 28.1% Q3 '14 Q3 '15 $3.8 $6.5 13.0%8.5% +73.7% Y/Y Q3 '14 Q3 '15 $12.5 $6.7 28.2% 13.3% -46.4% Y/Y Q3 '14 Q3 '15 $15.3 $36.9 +141.5% Y/Y Q3 '14 Q3 '15 $7.6 $1.5 17.0% -77.1% Y/Y 3.0% Q3 '14 Q3 '15 $0.14 $0.03 -78.3% Y/Y Q3 '14 Q3 '15 $16.7 $19.3 +16.0% Y/Y

3Q15 Results Drivers In thousands Revenue Drivers 3Q14 v. 3Q15 Cash & Investments 104,584 2,480 125 16,752 90,437 YE 2014 Total Cash & Investments Cash ST Investments LT Investments 9.30.15 Total Cash & Investments 50,376 44,349 2014 Q3 Sales X26E X2 X26P Cartridges Axon Flex Axon Body Axon Dock Evidence.com XREP Other 2015 Q3 Sales

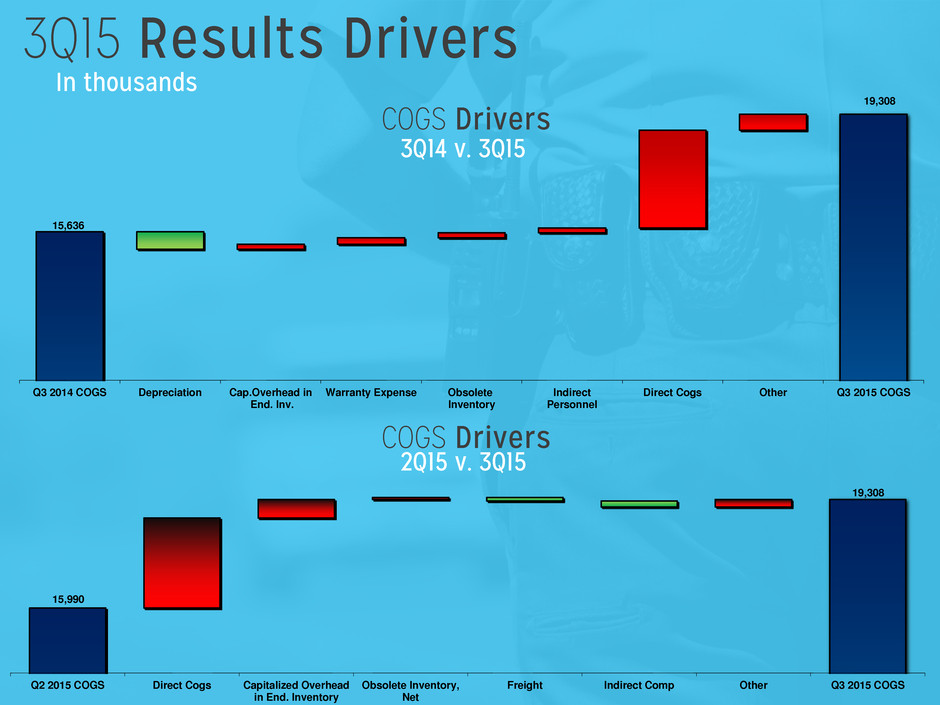
3Q15 Results Drivers In thousands COGS Drivers 3Q14 v. 3Q15 COGS Drivers 2Q15 v. 3Q15 19,308 15,990 Q2 2015 COGS Direct Cogs Capitalized Overhead in End. Inventory Obsolete Inventory, Net Freight Indirect Comp Other Q3 2015 COGS 19,308 15,636 Q3 2014 COGS Depreciation Cap.Overhead in End. Inv. Warranty Expense Obsolete Inventory Indirect Personnel Direct Cogs Other Q3 2015 COGS

3Q15 Results Drivers In thousands SG&A Drivers 3Q14 v. 3Q15 SG&A Drivers 2Q15 v. 3Q15 17,834 12,441 Q3 2014 SGA Computer Licenses Marketing Travel Supplies Consulting & Lobbying Personnel Other Q3 2015 SGA 17,834 15,443 Q2 2015 SGA Travel Legal Fees Computer Licenses Commissions Personnel Consulting Other Q3 2015 SGA

3Q15 Results Drivers Hiring Update **Salaried headcount is exclusive of manufacturing employees and interns 34 36 40 40 42 45 43 76 93 91 90 104 128 147 78 79 83 84 81 92 101 48 49 54 56 66 81 82 236 257 268 270 293 346 373 0 50 100 150 200 250 300 350 400 Q1 2014 Q2 2014 Q3 2014 Q4 2014 Q1 2015 Q2 2015 Q3 2015 Indirect Manf. Sales & Marketing Admin & Support R&D

Axon Addressable Market We continue to Expand our Addressable Market Notes: International reflects current focus where direct resources have been placed. *Domestic TAM assumes 628,000 patrol officers, 450,000 patrol vehicles, 50,000 interview rooms **Int’l TAM assumes 1.3 million patrol officers in target markets & approx. double the number of vehicles and interview rooms as the domestic market. Source: DOJ, gov.uk, statcan.gc.ca, aic.gov.au, World Police Encyclopedia, Company estimates Pre-2012 2012 2013 2014 2015 $2B+ International $1B+ Domestic $3B+ • Axon Flex• Axon Pro • TASERCam • Evidence.com • Axon Body • Professional Services • Integrations • Axon Body 2 • Interview • Axon Fleet • Evidence.com Advanced Features

Axon Addressable Market Domestic Evidence.com Licenses Notes: *Domestic TAM assumes 628,000 patrol officers, 450,000 patrol vehicles, 50,000 interview rooms Source: DOJ, gov.uk, statcan.gc.ca, aic.gov.au, World Police Encyclopedia, Company estimates 45,000 E.com Licenses 1,000,000+ Patrol Officers & Vehicles
