Attached files
| file | filename |
|---|---|
| EXCEL - IDEA: XBRL DOCUMENT - AXON ENTERPRISE, INC. | Financial_Report.xls |
| EX-31.1 - EX-31.1 - AXON ENTERPRISE, INC. | d310497dex311.htm |
| EX-23.1 - EX-23.1 - AXON ENTERPRISE, INC. | d310497dex231.htm |
| EX-21.1 - EX-21.1 - AXON ENTERPRISE, INC. | d310497dex211.htm |
| EX-32.0 - EX-32.0 - AXON ENTERPRISE, INC. | d310497dex320.htm |
| EX-31.2 - EX-31.2 - AXON ENTERPRISE, INC. | d310497dex312.htm |
UNITED STATES
SECURITIES AND EXCHANGE COMMISSION
Washington, D.C. 20549
Form 10-K
(Mark One)
| x | ANNUAL REPORT PURSUANT TO SECTION 13 OR 15(d) OF THE SECURITIES EXCHANGE ACT OF 1934 |
For the fiscal year ended December 31, 2011
or
| ¨ | TRANSITION REPORT PURSUANT TO SECTION 13 OR 15(d) OF THE SECURITIES EXCHANGE ACT OF 1934 |
For the transition period from to
Commission File Number: 001-16391
TASER International, Inc.
(Exact name of registrant as specified in its charter)
| Delaware | 86-0741227 | |
| (State or other jurisdiction of incorporation or organization) |
(I.R.S. Employer Identification No.) | |
| 17800 North 85th Street Scottsdale, Arizona |
85255 | |
| (Address of principal executive offices) | (Zip Code) | |
Registrant’s telephone number, including area code:
(480) 991-0797
Securities registered pursuant to Section 12(b) of the Act:
| Title of each class |
Name of exchange on which registered | |
| Common Stock, $0.00001 par value per share | The Nasdaq Global Select Market |
Securities registered pursuant to Section 12(g) of the Act:
None
(Title of Class)
Indicate by check mark if the registrant is a well-known seasoned issuer, as defined in Rule 405 of the Securities Act. Yes ¨ No x
Indicate by check mark if the registrant is not required to file reports pursuant to Section 13 or Section 15(d) of the Act. Yes ¨ No x
Indicate by check mark whether the registrant (1) has filed all reports required to be filed by Section 13 or 15(d) of the Securities Exchange Act of 1934 during the preceding 12 months (or for such shorter period that the registrant was required to file such reports), and (2) has been subject to such filing requirements for the past 90 days. Yes x No ¨
Indicate by check mark whether the registrant has submitted electronically and posted on its corporate Website, if any, every Interactive Data File required to be submitted and posted pursuant to Rule 405 of Regulation S-T (§232.405 of this chapter) during the preceding 12 months (or for such shorter period that the registrant was required to submit and post such files). Yes x No ¨
Indicate by check mark if disclosure of delinquent filers pursuant to Item 405 of Regulation S-K (§229.405 of this chapter) is not contained herein, and will not be contained, to the best of registrant’s knowledge, in definitive proxy or information statements incorporated by reference in Part III of this Form 10-K or any amendment to this Form 10-K. x
Indicate by check mark whether the registrant is a large accelerated filer, an accelerated filer, a non-accelerated filer, or a smaller reporting company. See the definitions of “large accelerated filer,” “accelerated filer” and “smaller reporting company” in Rule 12b-2 of the Exchange Act.
| Large accelerated filer |
¨ |
Accelerated filer |
x | |||
| Non-accelerated filer |
¨ (Do not check if a smaller reporting company) |
Smaller reporting company |
¨ | |||
Indicate by check mark whether the registrant is a shell company (as defined in Rule 12b-2 of the Act). Yes ¨ No x
The aggregate market value of the common stock held by non-affiliates of the registrant, based on the last sales price of the issuer’s common stock on June 30, 2011, which was the last business day of the registrant’s most recently completed second fiscal quarter, as reported by NASDAQ, was $264,945,572
The number of shares of the registrant’s common stock outstanding as of March 1, 2012 was 65,253,641.
DOCUMENTS INCORPORATED BY REFERENCE
Parts of the registrant’s definitive proxy statement to be prepared and filed with the Securities and Exchange Commission not later than 120 days after December 31, 2011 are incorporated by reference into Part III of this Form 10-K.
TASER INTERNATIONAL, INC.
INDEX TO ANNUAL REPORT ON FORM 10-K
FOR THE YEAR ENDED DECEMBER 31, 2011
2
The statements contained in this report that are not historical are “forward-looking statements” within the meaning of Section 27A of the Securities Act of 1933, as amended (the “Securities Act”), and Section 21E of the Securities Exchange Act of 1934, as amended (the “Exchange Act”), including statements regarding our expectations, beliefs, intentions or strategies regarding the future. We intend that such forward-looking statements be subject to the safe-harbor provided by the Private Securities Litigation Reform Act of 1995. Such forward-looking statements relate to, among other things:
| • | estimates regarding the size of our target markets; |
| • | our ability to further penetrate the law enforcement market; |
| • | our intentions and strategies to expand product sales to the international, Federal, military, corrections, private security and private citizen self-defense markets; |
| • | expansion of product capability and the sufficiency of our manufacturing capacity; |
| • | timing and expectations relating to new product and service introductions; |
| • | product safety; |
| • | our business model and strategies including, but not limited to, our perceptions about the opportunity for growth in the international law enforcement market, the need and willingness of customers to upgrade and replace existing TASER units, our plans to focus our research and development efforts in 2012 on the next generation of ECD hardware and refining and improving our AXON and EVIDENCE.COM products with new and enhanced features; |
| • | the anticipated characteristics of future X3 customers; |
| • | our belief that AXON is well positioned to save agencies money and time; |
| • | the benefits of our products compared to other lethal and less-lethal alternatives; |
| • | our intention to enter into joint ventures and make acquisitions; |
| • | the availability of alternative materials and components suppliers; |
| • | the impact of recently adopted and proposed accounting standards; |
| • | the automation of our production process; |
| • | that we will experience an increasing volume of AXON and EVIDENCE.COM trial programs in 2012; |
| • | that sales to private citizens will be a steady contributor to our business in 2012; |
| • | our plan to continue investment in web activities, public relations and law enforcement trade shows in 2012 and the benefits resulting therefrom; |
| • | the benefits and value of our EVIDENCE.COM service; |
| • | the sustainability of our cost structure; |
| • | the availability of financing; |
| • | critical accounting estimates; |
| • | the possibility we may engage in currency hedging activities; |
| • | our intention not to pay dividends; |
| • | expectations about future vesting of performance-based stock awards and stock option exercises; |
| • | our insulation from competition and our competitive advantage; |
| • | the benefits and competitive advantages of our products and services; |
| • | our litigation strategy and the importance of favorable verdicts; |
| • | the outcome of legal proceedings in which we are currently involved; |
| • | that we have readily available alternative materials and components suppliers; |
| • | the sufficiency and availability of our liquid assets and capital resources; |
| • | our strategy and intentions to move to a third party data center and the potential migration of the remainder of our data center operations to a third party cloud provider; |
| • | impact that a loss of customer data or an extended outage would have on the future prospects of our Video business; |
| • | our intentions about future development efforts and activities, including our intentions to invest in research and development; |
| • | trends and expectations relating to certain balance sheet accounts and working capital items; |
| • | the timing of the resolution of, and trends relating to, unrecognized tax benefits and liabilities; and |
| • | anticipated capital expenditures. |
3
These statements are qualified by important factors that could cause our actual results to differ materially from those reflected by the forward-looking statements. Such factors include but are not limited to those factors detailed in ITEM 1A of this annual report entitled “Risk Factors.” The risks included in the foregoing list are not exhaustive. Other sections of this report may include additional factors that could adversely affect our business and financial performance. New risk factors emerge from time to time, and it is not possible for management to predict all such factors, nor can it assess the impact of all such risk factors or the extent to which any factor, or combination of factors, may cause actual results to differ materially from those contained in any forward-looking statements. We undertake no obligation to update or revise any forward-looking statements to reflect changed assumptions, the occurrence of unanticipated events or changes to expectations over time.
We own the following trademarks: ADVANCED TASER®, CHECKLOK®, TASER®, XREP®, C2®, X2®, X3®, the bolt on West Hemisphere logo, the bolt on ball logo, the bolt on circle logo, and the bolt within circle logo, all registered in the United States. All other trademarks and service marks including M18™, M26™, X26™, X26C™, AXON™, AXON Flex™, EVIDENCE.COM™, Shockwave™, PROTECTOR™, TASER CAM™ and designs belong to TASER International, Inc., except as expressly indicated as belonging to another.
| Item 1. | Business |
Overview
TASER International, Inc.’s (the Company or TASER or we or our) core mission is to protect life, prevent conflict and resolve disputes through technologies that make communities safer. We are the market leader in the development, manufacture and sale of advanced Electronic Control Devices (ECDs) designed for use in law enforcement, military, corrections, private security and personal defense. Since our inception in 1993, we have remained committed to providing solutions to violent confrontation by developing devices with proprietary technology to incapacitate dangerous, combative, or high-risk subjects who pose a risk to law enforcement officers, innocent citizens, or themselves in a manner that is generally recognized as a safer alternative to other uses of force.
TASER solutions deliver significant results to our customers and to communities in which they are deployed. There are over 100 published studies on the effects of TASER ECDs. Just as importantly, there are eight published independent epidemiological studies covering a total of 48,228 subjects. The 2008 Eastman study found that 5.4% of conductive electronic weapons uses “clearly prevented the use of lethal force by police.” The largest epidemiological study was the 2009 MacDonald study of 24,380 uses of force. In addition, the papers of Taylor (13,983 subjects), Mesloh (4,303 subjects), Mumola (2,686 subjects), Smith (1,645 subjects), Butler (562 subjects), and White (243 subjects) show a significant reduction in both officer and suspect injuries with TASER ECD usage. Further, most reporting agencies demonstrate overall decreases in use of force and decreases in suspect and officer injuries resulting from conflict. Reducing uses of force and gaining compliance by use of a TASER ECD has provided significant reductions in worker’s compensation expenses and claims for excessive use of force for agencies, and ultimately taxpayers.
Our mission to protect life has also been extended to prevent conflict and resolve disputes. We have learned that bringing a subject into custody is not the end of the challenge for law enforcement. In fact, it is typically just the beginning since a significant number of incidents that start as a physical conflict transition into a legal conflict. Whether it’s prosecuting and convicting the individual arrested, or responding to excessive use of force allegations, the post-incident legal process is a considerable part of the challenge that law enforcement faces on a continual basis and can often take years and millions of litigation dollars to resolve in the courtroom. To help law enforcement address this challenge, we have developed a fully integrated hardware and software solution that will provide our law enforcement customers the capabilities to capture, store, manage, share and analyze video and other digital evidence. Finally, the optimal situation is to prevent the conflict from ever escalating. TASER ECDs and AXON on-officer video have a measured and positive effect on better suspect and officer behavior as well as achieving compliance without escalation of force.
Central to our strategy, we conduct research and develop advanced technologies for both the creation of new, and the enhancement of existing, hardware and software products and services. We believe that delivering breakthrough innovation and high-value solutions through our various product platforms is the key to delivering compelling value propositions to meet our customers’ needs and to drive our future growth. We place the highest level of importance on the safety and appropriate use of our products and have established industry leading training services to provide our users a comprehensive overview of the legal, policy, medical information and risk mitigation issues relating to our ECDs and the use of force. Our products are sold through a network of distribution channels developed for selling and marketing our products and services to law enforcement agencies, primarily in North America, with continued focus and effort placed on expanding these programs in international, military and other markets. In order to facilitate sales and provide customer service to certain European customers, we established TASER International Europe SE, a wholly owned subsidiary, in 2009.
4
In the fourth quarter of 2011, the investment in the AXON portion of the Video business began to be truly reviewed and analyzed as a stand-alone operation, whereas in prior years the business primarily consisted of research and development in anticipation of eventual product launch. In discussions with the Chief Operating Decision Maker (CODM), in our case the CEO, it was determined that understanding the contribution and profitability of the video business was important to his management of the entire enterprise. Senior management talked at length on the best way to look at the video business as it continued to iterate on different ways to separate the business into distinct product segments. As the Company analyzed the business in that manner, it became apparent that due to the support that the software business had to give to the video hardware to make sure the seamless integration of hardware and software occurred, it made sense to include AXON hardware in the video segment and not just the EVIDENCE.COM software-as-a-service revenue. Further, because TASER Cam uses EVIDENCE.COM to store videos and the developers of EVIDENCE.COM had to put effort into the upload and storage of TASER Cam videos, we concluded that the video segment should ultimately include sales and expenses for AXON hardware and accessories, EVIDENCE.COM software-as-a-service and TASER Cam. Based on this evaluation, during the fourth quarter of 2011 management determined that its operations are comprised of two reportable segments, the sale of ECDs, accessories and other products and services (the “ECD segment”) and the Video business, which includes the TASER Cam, AXON Video products and EVIDENCE.COM (the “Video segment”).
Only those costs directly attributable to the Video segment are included in that segment. The CODM does not see any value in allocating costs for items not directly attributable to the Video segment for several reasons. The first is that the Company’s base business is the ECD segment, and the majority of the expenses of the Company would continue even if the Company was not in the video business. If the Company were to allocate general expenses to the video business based on some allocation method (e.g. on sales), it would not improve the value of the segment reporting, it would only serve to make the ECD business look better and give investors a false sense of the profitability of the ECD business without the Video segment. The CODM wants to understand the true investment in the video business and that result is delivered by allocating only costs directly associated with the Video segment. By leaving the remainder of costs not associated with the Video segment in the ECD segment, the Company is able to compare the ECD segment to historical figures where the bulk of the business was only that segment of operations to gauge relative efficiency of the ECD operation vs. historical norms. Further information about our reportable segments and sales by geographic region is included in footnotes 1(p) and 15 of the consolidated financial statements in Part II, Item 8 of this Annual Report on Form 10-K.
Products
We make Electronic Control Devices (ECDs) that use our proprietary Neuro Muscular Incapacitation (NMI) effects for two main types of market segments: (i) the law enforcement, military, corrections and professional security markets; and (ii) the consumer market. Our products use a replaceable cartridge containing compressed nitrogen to deploy and propel two small probes that are attached to the ECD by insulated conductive wires with lengths ranging from 15 to 35 feet. Our ECDs transmit electrical pulses along the wires and into the body affecting the sensory and motor functions of the peripheral nervous system. The electric current can penetrate up to two cumulative inches of clothing or approximately one inch per probe. The basic design is to provide time cycles that provide incapacitating effects that last in cycles of five seconds for our law enforcement, military and corrections products and up to thirty seconds for our consumer market models. This effect can be extended, if necessary, by the operator.
The benefits of using ECDs in the field have been undeniable and powerful. By some studies, TASER ECDs have prevented death or serious injury over 80,000 times from the first deployment to the end of 2011. In addition to protecting life, the use of these devices instead of other force options has substantially reduced injuries for suspects and officers with substantial liability and workers’ compensation savings to agencies around the world.
Law Enforcement, Military, Corrections and Professional Security Products
For the law enforcement, military, corrections and professional security markets, we manufacture four hand-held ECD product lines and have also incorporated our technology into several other product line extensions.
Our most popular product is the TASER® X26™ with Shaped Pulse Technology™, which we introduced in 2003. Shaped Pulse Technology is a refined energy pulse that concentrates a small portion of energy to first penetrate any barriers while the majority of the energy flows into the target freely after the barrier has been penetrated. The TASER X26 product line consists of the TASER X26, various cartridges (described below), a digital power magazine (DPM™)—the replaceable battery power supply, data download software and equipment, extended warranties, and a number of holstering options and accessories. The TASER X26 product line (excluding sales of the consumer TASER® X26C™ and individual cartridge sales) accounted for $36.6 million, $40.8 million and $53.4 million, or 41%, 47% and 51% of our net sales, for the years ended December 31, 2011, 2010 and 2009, respectively.
5
In the second quarter of 2011, we began our first shipments of the TASER® X2™. The TASER X2 is cost efficient, simple to use, and similar in size to the current TASER flagship product, the TASER X26. The TASER X2 features a second shot for instant miss recovery, dual lasers for improved accuracy, enhanced power magazine with more than 500 firings, and a warning arc that helps prevent conflicts from escalating, all in a small, compact size and competitively priced. The X2 also seamlessly integrates with EVIDENCE.COM to enable easier, electronic and more automated management of the device. The TASER X2 product line accounted for $8.1 million, or 9.0%, of our net sales for the year ended December 31, 2011. In addition to the $8.1 million of X2 ECD sales for 2011, the Company also sold $2.1 million in smart cartridges for the X2 ECD.
In 2009, we introduced the TASER® X3™, a new multi-shot ECD that can engage three separate targets, display warning arcs while loaded, deliver a calibrated NMI pulse that results in improved safety characteristics and enhanced data port logs known as the Trilogy Logs that include event, pulse, and engineering logs. While the TASER X3 offers enhanced firepower over existing ECDs, it also represents a significant leap in sensor and computation power, making it the most intelligent hand-held force option ever developed. The TASER X3 product line (excluding individual cartridge sales) accounted for $0.3 million, $2.3 million and $0.7 million, or less than 1%, 3% and less than 1%, of our net sales for the years ended December 31, 2011, 2010 and 2009, respectively. Because the TASER X2 delivered many of the same advanced features as the X3 with a smaller form factor and a lower price, the Company expects that most of the future sales of the TASER X3 will be to tactical response teams and animal control officers using a variant of the TASER X3, the TASER X3W wildlife ECD.
Our fourth law enforcement product line is the ADVANCED TASER® M26™, which we originally launched in November 1999 and was the first TASER ECD featuring the NMI capability. The ADVANCED TASER M26 product line consists of the ADVANCED TASER M26, various cartridges (described below), rechargeable batteries, a battery charging system, data download software and equipment, extended warranties, and a number of holstering options and accessories. We discontinued the sale of this product to law enforcement in North America beginning in 2011; however, it will continue to be available and will be supported for emerging international markets who wish to introduce our technology with a lower cost option. The ADVANCED TASER M26 product line (excluding sales of the consumer ADVANCED TASER® M26C and individual cartridge sales) accounted for $2.4 million, $2.2 million and $3.3 million, or 3%, of our net sales for the years ended December 31, 2011, 2010 and 2009.
ECD Product Line Extensions
Over the past several years, we have developed more innovative methods to deploy our proprietary NMI technology, increasing the capabilities of our systems and extending the range at which they can be deployed. This resulted in two new products which were introduced to the market in 2009.
The TASER eXtended Range Electronic Projectile (XREP™) is a self-contained, wireless (non-tethered) ECD that deploys from a 12-gauge pump-action shotgun. It delivers an impact distraction to the suspect and a similar NMI bio-effect as our X26 handheld ECD, but can be delivered to a maximum effective range of 100 feet (30.48 meters). The battery supply is fully integrated into the chassis and provides the power to the XREP round. While the XREP can be fired from a pump-action shotgun, we also partnered with Mossberg® to develop the TASER® X12™ Less-Lethal Shotgun (LLS). The TASER X12 is a Mossberg 500 12-gauge shotgun modified for improved functioning with the XREP™. It is a fully integrated less-lethal platform. The TASER X12 includes Radial Key™ ammunition technology, which is a proprietary, patented design to prevent the TASER X12 from deploying lethal 12-gauge rounds, eliminating the possibility of an end user loading lethal ammunition during high-stress situations.
The TASER® Shockwave™ security system is the first generation of TASER® Remote Area Denial (TRAD™) technology allowing for both increased safety and stand-off capability during hostile situations through the use of our NMI technology. It is a manually activated TASER security system that simultaneously fires six TASER cartridges to saturate a 20-degree arc with 25-foot TASER cartridges. The Shockwave is designed as a fully modular system, allowing the end user complete flexibility to deploy as needed to achieve the desired objective. Multiple TASER Shockwave units can be stacked together either horizontally in order to extend area coverage, vertically to allow multiple salvo engagements, or vertically to maximize either area coverage or cartridge pattern density. These features provide the capability to project area denial from a secure location. The system minimizes risk as the system can be activated with the push of a button on a control box at a safe stand-off distance of up to 100 meters. The TASER Shockwave unit deploys its cartridges up to 25-feet to instantaneously incapacitate multiple personnel within the field of deployment coverage.
6
Consumer Products
Our primary consumer product for the personal defense market is the TASER® C2™ ECD, which we introduced in 2007. This device is a compact system that provides the same proven NMI effectiveness as our market leading TASER X26 but in a less intimidating, more compact form factor and at a price point more attractive to private citizens. Our sale and marketing of the TASER C2 promotes responsible ownership and aims to prevent misuse by keeping the device inactive until the owner has successfully completed identification verification. The primary benefit of the device is to help the average person deter and incapacitate a perpetrator at a distance as opposed to using lethal force or other less lethal options that require very close proximity in dangerous situations.
We also currently manufacture the TASER® X26C™ and ADVANCED TASER® M26C™, devices for use by consumers. The TASER X26C was developed in conjunction with the law enforcement TASER X26 version; however, its effect lasts longer allowing the owner more time to escape danger. The ADVANCED TASER M26C was designed after the law enforcement ADVANCED TASER M26 version. We previously manufactured the ADVANCED TASER M18 and ADVANCED TASER M18L, which were discontinued as of 2011. The M18 and M18L were designed after the law enforcement ADVANCED TASER M26, however, the electrical pulse rate is lower. The M18 and M18L are identical, except that the M18L has an integrated laser aiming device. These four product lines consist of the units themselves, cartridges, batteries and digital power magazines, and a number of holstering options and accessories.
Our total consumer products accounted for $4.6 million, $4.8 million and $5.9 million, or 5%, 6% and 6%, of our net sales for the years ended December 31, 2011, 2010 and 2009, respectively.
Cartridges and Other Accessories
We manufacture multiple cartridge types: a 15’ cartridge, a 21’ cartridge, a 25’ XP cartridge, a 35’ cartridge, a 21’ training cartridge, a 15’ cartridge for the TASER C2, and in 2009, we introduced the new range of Smart Cartridges for use with the TASER X2 and X3 devices. The 15’ cartridge is capable of firing a distance of 15 feet and is sold primarily to the law enforcement market for training and the consumer market for use in the ADVANCED TASER M18, ADVANCED TASER M18L, ADVANCED TASER M26C, and TASER X26C devices. The TASER C2 15’ cartridge is designed specifically for use in the TASER C2. The 21’, 25’ XP, 35’, and 21’ training cartridges are sold only to the law enforcement, military, and corrections markets. The 25’ XP cartridge is different from the 21’ cartridge in that it has a longer range and its probes are longer and heavier, which allows it to penetrate a thicker clothing barrier. The training cartridge contains non-conductive wiring, which allows law enforcement, military, and corrections trainers to use the cartridge during training role-playing scenarios. The Smart Cartridges designed for the TASER X2 and X3 come in a more compact profile to accommodate the 2-in-1 and 3-in-1 multi-shot capabilities of the TASER X2 and X3, with ranges of 15’, 25’ and 35’. The Smart Cartridge communicates with the fire control system within the TASER X2 and X3 indicating the type of cartridge loaded in each bay and its deployment status. The new static resistant propulsion system allows the TASER X2 and X3 to display NMI arcs without firing the cartridge, which also reduces the risk of accidental static discharge misfires.
All of our cartridges, with the exception of the training cartridge, contain numerous colored, confetti-like tags bearing the cartridge’s serial number. These tags, referred to as Anti-Felon Identification tags, or AFIDs, are scattered when one of our cartridges is deployed. We require sellers of our products to participate in the AFID program by registering buyers of our cartridges. In many cases, we can use AFIDs to identify the registered owner of cartridges deployed. AFIDs provide an additional level of accountability in using TASER ECD devices.
Individual cartridge sales accounted for approximately $25.3 million, $22.0 million and $27.9 million, or approximately 28%, 25% and 27%, of our net sales for the years ended December 31, 2011, 2010 and 2009, respectively.
In 2011, the Company introduced the Auto Shut-Down Performance Power Magazine (APPM). The APPM is a modified TASER ECD battery which shuts down the high voltage output of the ECD after 5 seconds and which also contains a built in speaker that alerts the user to the impending shut down. The APPM provides an audible alert for the last two seconds of a trigger activated firing cycle before automatically shutting down the device.
The APPM is available for use in the TASER X2 ECD only and is also available as an option for the new TASER Cam HD. The APPM feature of the TASER Cam HD Auto Shutdown (AS) has no impact on video and audio recording; however, the audio alert will be captured on the recording and may distort any audio captured from the incident during the duration of the audio alert. As long as the safety switch is in the up (armed) position, the TASER Cam HD AS will continue to capture the event.
7
In 2009, we introduced the TASER® Controlled Digital Power Magazine (CDPM™), a new accessory for the TASER X26 ECD. The CDPM has the same functionality as a regular DPM; however, the CDPM features a disabling safety key and wrist strap lanyard designed to secure the device to the officer. If a prisoner or suspect attempts to take the TASER X26 device away, the lanyard pulls the safety key connection away from the unit. If the key is separated for more than two seconds, the system instantly deactivates the TASER X26 and requires a password to reactivate it.
In 2006, we launched an accessory to the TASER X26 called the TASER® Cam™ recorder. The TASER Cam is a video recording device that captures both video and audio of potential and actual TASER use incidents. The device can capture video and audio before, during and after a TASER deployment, which provides law enforcement with a greater level of accountability to support their use of TASER devices against a resistant subject. The TASER Cam is capable of recording in zero light conditions through the use of an infrared illuminator. A non-audio version of the device is also available for agencies operating in states where legislation prohibits the use of audio recordings. The TASER Cam has become the leading on-officer video capability around the world with over 50,000 units deployed.
In 2004, we introduced the X-Rail™ mount as an accessory designed to attach an X26 ECD to a Picatinny rail (MIL-STD-1913 rail) providing law enforcement and military the ability to combine TASER technology with their firearms giving the user lethal and non-lethal options on the same weapon.
AXON and EVIDENCE.COM
In 2008 and 2009, we devoted significant resources to the design and development of TASER AXON™ tactical computer and EVIDENCE.COM™, our end-to-end on-officer video and digital evidence management solution.
The AXON tactical computer (ATC) combines advanced audio-video record/capture capabilities worn by first responders. An audio-video earpiece, imager, speaker and microphone integrates into the communications loop between existing radios and the communications headset, recording video of critical incidents from the visual perspective of the officer. AXON significantly reduces liability risk for individual police officers and for law enforcement agencies as it captures the ‘truth’ of what actually happened in every incident. With greater than $2 billion in annual cost to United States taxpayers in payment of law enforcement frivolous and sustained complaints alone, and many years of research by the International Association of Chiefs of Police (IACP) and other law enforcement organizations on the benefits of video, AXON is well positioned to save agencies money and time. AXON improves officer efficiency by reducing report documentation workload while increasing accuracy and accountability.
EVIDENCE.COM is a virtual evidence management system and warehouse, offering digital evidence management, sharing, analysis and storage in a highly secure, easily accessible environment. The service is designed so that an agency can manage all of its digital evidence in one place and currently accommodates video from many sources including AXON, TASER Cam, audio files, digital pictures, fixed cameras including interview rooms, trilogy logs from our X2 and X3 devices and more. From EVIDENCE.COM, both agencies and legal professionals may quickly and securely access key evidence data without the difficult and sometimes impossible inventory searches common to existing evidence management and storage methods. Further, EVIDENCE.COM automates key workflows from evidence collection to review, taking out expensive and manual steps in the production and movement of evidence among law enforcement and legal professionals.
While our cloud-based solution provides much lower implementation risk and lower total cost of ownership than agency-managed systems, market feedback in 2011 led to a key decision to offer agencies the ability to have a robust local evidence management capability or to use EVIDENCE.COM with the ability to move between the two depending upon agency preference. This decision has further enabled international field trials for the AXON and EVIDENCE.COM capabilities.
We launched initial field trials of the AXON and EVIDENCE.COM in the fourth quarter of 2009, and completed a number of trials in 2010 which resulted in several agency deployments. In 2011, we closed the year with over $1 million in orders, closing greater than 50% of those deals in the fourth quarter of 2011, providing the agencies that purchased in the fourth quarter of 2011 with the option to upgrade to AXON Flex when available in 2012. We anticipate an increasing volume of similar field trial programs in 2012 and believe these trial programs are the best way for our customers to see the powerful capabilities, benefits and strong return on investment of the value proposition of this technology for themselves.
8
Market feedback in 2011 led to development efforts of another AXON product called AXON Flex, which was introduced in early 2012. TASER’s AXON Flex is a breakthrough point of view video system that improves transparency between law enforcement agencies and their communities, while protecting officers from false claims. AXON Flex provides complete flexibility in how an officer chooses to wear the device, including an option to deploy as an attachment to Oakley Flak Jacket eyewear. AXON Flex will also provide the flexibility for officers to use Android or iOS devices to review and tag evidence without the requirement to do so, eliminating the need for the ATC used in first generation AXON. AXON Flex has followed the same market-driven development methodology used for X2 and has had significant interest from many agencies around the world. Thousands of law enforcement officers assisted in the development of AXON Flex, making it the most customer-driven officer worn camera solution ever produced.
Product Warranties
We offer a one year limited warranty on the TASER X2, X3, TASER X26, ADVANCED TASER, AXON ATC, headcam, communications hub, and TASER Cam devices. After the warranty expires, if the device fails to operate properly for any reason, we will replace the X26 at a discounted price depending on when the product was placed in service. These fees are intended to cover the handling and repair costs and include a profit. We believe this policy is attractive to our law enforcement, military and corrections agency customers. In particular, this policy avoids disputes regarding the source or cause of any defect. Extended warranties, which provide additional coverage beyond the limited warranty, ranging from one to four years, are also offered at specified fees.
We offer a 90-day limited warranty on the TASER C2 and the X26C devices. Our TASER C2 and the X26C are designed to disable an attacker for up to 30 seconds. We encourage private citizens to leave the units and flee after firing them. As a result, we also provide free replacement units to private citizens who follow this suggested procedure. To qualify for the replacement unit, users must file a police report that describes the incident and confirms the use of the TASER C2 or the X26C.
Markets
Law Enforcement and Corrections
Federal, state and local law enforcement agencies in the United States and throughout the world currently represent the primary target market for our TASER ECDs. In the law enforcement market, more than 16,000 law enforcement agencies in more than 100 countries have made initial purchases of our TASER brand devices for testing or deployment.
We continue to educate correctional facility personnel as well as parole and probation field officers on the benefits of using TASER brand products. We have developed training programs and command staff demonstrations specific to the corrections market and we attended several corrections tradeshows and conferences to expand our reach into the market. Our TASER devices are deployed in county correctional facilities such as those operated by the Los Angeles Custody Division and the Maricopa County Sheriff’s Office (AZ). State correctional agencies deploying TASER devices include Arizona, Arkansas, Colorado, Kentucky, Louisiana, Montana, Nevada, North Dakota, Oregon, Tennessee, Utah, Washington and Wisconsin.
Military Forces, both United States and Foreign Allies
TASER devices continue to be deployed in support of key strategic military operations in locations around the world. We continue our focus initiative on supporting our military customers. The former head of the Military Joint Non-Lethal Weapons Directorate is our Vice President of Government and Military Programs, and we meet quarterly with our Senior Executive Advisory Board (SEAB) comprised of a team of professionals with extensive military, homeland defense and law enforcement experience with the purpose of advising on business models in support of military users. The business group (Federal Programs) has concentrated on supporting military and other federal use of our existing products as well as developing new technology through government funded research and development. In 2008, we entered into a science and technology contract with the Joint Non-Lethal Weapons Directorate (JNLWD) of the United States Department of Defense to develop a 40mm projectile, compatible with already fielded weapons, which allows for extension and improvement of our existing eXtended Range Electronic Projectile (XREP) technology. The development contract was comprised of three phases, each of which were successfully completed between 2008 and 2010.
Private Security
We continue to pursue opportunities for sales of TASER devices in private security markets; however, we have made limited sales to date. Private security officers represent a broad range of individuals, including contract security patrol, healthcare, gaming, retail security employees and many others. Similar to our other emerging markets, we have developed training programs and demonstrations specific to the industry by meeting with several large corporate and private patrol security companies to discover their unique needs. We also attended several private security tradeshows, conferences and industry association meetings to generate a presence in this market space.
9
Private Citizen / Personal Protection
In July 2007, we introduced the TASER C2 personal protection device, specifically designed for the private citizen market. This consumer product combined with other consumer offerings, contributed 5%, 6% and 6% of our total net sales in 2011, 2010 and 2009, respectively. While it has been a challenge generating product traction in a difficult economic climate for consumers, we believe private citizen sales will continue to be a steady contributor to our business in 2012 as a result of various distribution relationships and marketing strategies we have put in place to continue to promote awareness of the TASER C2 in the consumer market.
Wildlife Management
While the focus of our core technology has been protecting human life in the law enforcement and civilian markets, through a multi-year research partnership with the Alaska Department of Fish and Game (ADFG), we have determined that our core technology may offer wildlife professionals a tool to protect both human and animal life during wildlife management activities. The TASER X3W Wildlife ECD has been optimized for wildlife professionals and sales efforts started in 2011.
Our research partnership has suggested that the X3W may be useful for animal hazing, aversive conditioning, brief capture, injury assessment, and human safety. While TASER believes that the key to decreasing human-wildlife conflict is a broad, conservation-based strategy focusing on human behavior modification, we believe that our devices offer a great tool to supplement current wildlife management tools.
Through our research partnership with ADFG, our devices have been used on Alaskan Brown Bear and Alaskan Moose in both research and field use. The research and field use has suggested that the devices are safe and effective to use on these animals. There have also been anecdotal reports of field use on white tail deer and Arizona javelina with no reports of morbidity or mortality. TASER is actively involved in ongoing research for the application of TASER technology in the area of wildlife management.
Sales and Marketing
Law enforcement, federal/military, corrections and security agencies represent our primary target markets. In each of these markets, the decision to purchase TASER ECDs is normally made by a group of people, including the agency head, the agency’s training staff and agency weapons experts. Depending on the size and cost of the device deployment and local procurement rules and customs, the decision may involve political decision-makers such as city council members or the federal government. The decision-making process can take as little as a few weeks or as long as several years. Although we have focused on three primary markets, we have been able to expand our customer base to thousands of end users within these markets. We currently sell our products to more than 16,000 law enforcement agencies.
Since the introduction of the ADVANCED TASER M26 in 1999, we have used multiple types of media to communicate the benefits of acquiring and deploying our products. These campaigns have included the development of personalized CD/DVD packages geared toward law enforcement leaders in the community, web and print advertisements in law enforcement publications, and the use of more than 2,600 training classes conducted around the world, and more recently in the case of the TASER X2, an integrated online media launch including a dedicated website. We also target key regional and national law enforcement trade shows where we can demonstrate the TASER devices to leading departments. In 2011, we attended and exhibited at many of the major regional, national and international law enforcement trade shows. We also held our annual TASER Conference as part of our certified master instructor school, the continued focus of which was to train the officers in the use of all of the latest ECDs and other new products.
In 2011, TASER launched its corporate website to deliver more benefit-driven messages and to drive follow up by TASER or one of our distribution partners. The new website has already improved TASER search engine optimization and lead capture and has led to improvements in visits, time on site and other important web statistics. We also launched our first foreign-language site for French speakers around the world (www.taser.fr) with the same goals to provide information and education on our products and services in a local language. We plan to continue investment in web activities (search, advertising and social media), public relations and law enforcement trade shows and conferences in 2012, as it provides us the ability to market our products to our target audience. We believe these types of activities accelerate penetration of our TASER product lines in each market, which should lead to increased visibility in both the private security and private citizen markets and reinforce the value of these devices for self-defense.
10
United States Distribution
With the exception of several accounts and states to which we sell directly, the vast majority of our law enforcement agency sales in the United States are made through our network of law enforcement distributors. In addition, we have one military and federal government contracting distributor. These distributors were selected based upon their reputation within their respective industries, their contacts and their distribution network. Our regional managers work closely with the distributors in their territory to inform and educate the law enforcement communities. We continue to monitor our law enforcement distributors closely to help ensure that our service standards are achieved. We also reserve the right to take any large agency order directly to secure the agency’s account balance with us.
Sales in the private citizen market are primarily made through our commercial distributors and our website, iTASER.com. We have also established relationships selling to sporting goods retail chains. We have implemented a variety of marketing initiatives to support sales of the TASER C2 personal protection device, with a focus on web, public relations and consumer trade shows. We continue to sell all other TASER citizen devices and products through internet sales and our established commercial distributors.
International Distribution
We market and distribute our products to foreign markets through a network of distributors. For geographical and cultural reasons, our distributors usually have a territory defined by their country’s borders. These distributors market both our law enforcement, military, and corrections products, and our consumer products where allowed by law.
Our distributors work with local law enforcement, military and corrections agencies in the same manner as our domestic market distributors. For example, they perform demonstrations, attend industry tradeshows, maintain country specific websites, engage in print advertising and arrange training classes. The company established a wholly owned subsidiary in Europe, TASER International Europe SE (“TASER Europe”), in 2009 to facilitate sales and provide customer service to our customers in the European region.
Training Programs
Most law enforcement, military, security and corrections agencies will not purchase new weapons until a training program is in place to instruct and certify personnel in their proper use. We offer a 20 hour class that certifies law enforcement, military, corrections and security agency trainers as instructors in the use of TASER ECDs. We have partnered with the Northeast Wisconsin Technical College (NWTC) to provide an online learning opportunity for new and re-certifying TASER instructors. As of December 31, 2011, over 49,556 law enforcement officers around the world have been trained and certified as instructors in the proper use of TASER brand devices. This includes 44,468 officers in the United States and 5,088 in other countries.
Currently, 2,050 of our certified instructors have undergone further training and become certified as master instructors, of which 1,472 were certified in the United States and 578 were international. We authorize these individuals to train and certify other law enforcement, military, corrections and professional security agency trainers as TASER instructors, not just end users within their own organization. The Master Instructors are independent professional trainers, serve as local area TASER experts, and assist in conducting TASER demonstrations at other police departments within their regions. In addition, 221 of our certified instructors have completed the same training and were certified as Advanced Instructors. Advanced Instructors are authorized to certify others within their own agency as TASER instructors. From 2001 to 2008, TASER held one Master Instructor School per year. Due to increased demand, in 2009 we started scheduling two Master Instructor Schools each year in the United States, one in the East and one in the West, to accommodate customer requests. The fee for attending the Master Instructor School is $695. Military personnel are trained by our Chief Instructor. One hundred seventy of our Master Instructors have agreed to conduct TASER device training classes on a regular basis. We provide logistical support for the training classes. We charge a fee of $350 for each training attendee who is being certified for the first time and $175 for recertification. We pay Master Instructors a per-session training fee for each session they conduct. We conducted 396 instructor courses in 2011 and certified 11,019 instructors. As of December 31, 2011, we have conducted a cumulative 3,007 training courses during which we have trained more than 58,307 individuals as instructors for TASER ECDs.
11
In 2005, we started a TASER Technician course to train agencies on proper care and preventative maintenance of TASER devices. We charge a fee of $275 to each attendee. In 2011, we hosted 43 Technician courses, including 40 in the United States and 3 internationally. A total of 510 students attended the Technician course in the United States and 32 attended in other countries. As of December 31, 2011, 2,843 people have been trained and certified as TASER Technicians in 174 courses.
In 2008, we began offering a TASER Evidence Collection and Analysis (ECA) course to teach investigators how to collect and analyze TASER ECD related evidence at a crime scene. In 2011 we conducted 29 such ECA courses in the United States and trained 240 people, and conducted three courses internationally for 23 people. As of December 31, 2011, we have conducted a total of 73 ECA courses and trained 618 people. The fee for the ECA course is $150 per student.
We have also designed a training course for private citizen customers. Customers who purchase an X26C device receive a certificate good for a one hour, one-on-one training session with an X26C certified instructor. We have 836 instructors certified to give the X26C training. In 2011 we launched a new online training course for consumer instructors. This course focuses on non-law enforcement private self-defense training schools that have expressed a desire to include TASER consumer products in their courses. The course fee is $99. As of December 31, 2011, 46 people have completed the online consumer instructor course.
In 2010 we launched an online TASER ECD End User course through NWTC. The course fee is $30 per student. In 2011, 1190 people completed the online user course for the X26. From July through December, 2011, 333 people completed the online user course for the X2 as part of a promotional program.
To coordinate the growing demands of our training programs, we created a Training Advisory Board. This board annually reviews the qualifications of the master instructors, and provides retraining or certification as required. In addition, the Training Advisory Board oversees the trainers and curriculum to ensure that new information is properly communicated and implemented. The Training Advisory Board also gives input into new product development. We also created the position of Senior Master Instructor. Twenty four experienced Master Instructors have been promoted to this position based on their exemplary performance as Master Instructors. Their primary duties are to perform quality control checks on Master Instructors during an instructor course and to help instruct at the Master Instructor School. Additionally, we employ one staff instructor who is a full-time employee responsible for coordinating course delivery and development. We also employ a Director of Training Operations who oversees the day to day operation of the department, coordinates major training events, assists with course development and delivery, and supervises the clerical staff.
Manufacturing
We perform light manufacturing, final assembly, and final test operations at our headquarters in Scottsdale, Arizona and own substantially all of the equipment required to develop, prototype, manufacture and assemble our finished products. This includes critical injection molds, schematics, automation equipment, test equipment and prototypes utilized by our supply chain for the production required raw materials and sub-assemblies. We have implemented lean/six sigma methodologies to optimize all direct and indirect resources within the organization, which has helped boost capacity for existing products, as well as provide flexibility to accommodate production of new TASER product introductions. We are currently operating a single production shift; however, other capacity options, including the use of multiple shifts, will be considered should we experience higher demand resulting from large orders of legacy or new product releases. We continue to maintain our ISO 9001 certification.
Our XREP product is considered a firearm due to the propellant used to launch it from a firearm. We have a Class 7 Federal Firearms license to manufacture, store and sell XREP and related products. We lease facilities from a local third party who specializes in defense products and provides facilities, ensuring compliance to required firearm and dangerous good standards.
We continuously seek opportunities to invest in automated equipment for the continuous improvement of product quality and reduction of manufacturing costs. As a result, we have implemented a number of equipment initiatives including the purchase and integration of robotic equipment, computerized laboratory and medical testing equipment, machining and tooling equipment, as well as sophisticated modeling equipment for our Research and Development department. In 2009, we completed an ambitious undertaking with the final installation of our highly automated cartridge assembly line which, in 2010, has improved both our production capacity and yields, while significantly improving efficiency over what was previously a very labor-intensive manufacturing process.
In 2011, we began a program to automate the gathering of our test data. We now have the ability to review real-time test data from our in-process test equipment as well as from equipment located at our suppliers. This allows us to recognize and correct processing issues before they move out of control limits. This has also reduced rework and scrap costs, as well as improving supplier quality and internal productivity.
12
Supply chain management has, and will continue to be, a focus of ours. We presently purchase completed Printed Circuit Board Assemblies (PCBAs) and components primarily from suppliers located in the United States, along with selective strategic relationships internationally. Although we currently obtain plastic components from an outside supplier base, we own all the designs and tooling. We believe there are readily available qualified alternative suppliers in most cases who can consistently meet our needs for these components. We continue to develop and implement policies to mitigate supply chain risk and ensure continuity of supply, while maintaining efficiencies at all levels within the organization.
Competition
Law Enforcement, Corrections and Private Security Markets
The primary competitive factors in the law enforcement and corrections market include a weapon’s accuracy, effectiveness, safety, cost and ease of use. Stinger Systems introduced an electronic device in 2007 to compete with the TASER X26; however, they had limited success before going out of business in 2010. Stinger Systems subsequently sold its assets to Karbon Arms. We are not aware of any significant sales to date by Karbon Arms. We were granted summary judgment in a patent infringement claim against Stinger Systems in 2010 and an injunction was issued against Stinger Systems in August 2010. In July of 2011, we filed a complaint against Karbon Arms, LLC for infringement of United States patent numbers 7,800,855 (the 855 patent) and 7,782,592 (the 592 patent) in United States District Court for the District of Delaware seeking damages, injunctive relief and an award of attorney’s fees. Karbon Arms filed a counter suit on July 18, 2011 alleging invalidity and non-infringement of four of TASER’s patents, tortuous interference with prospective contractual relations and for false advertising under the Lanham Act. This lawsuit is in the discovery phase and trial has been set for January 2014. We believe that our strong relationship with customers, our large installed base of products, and the significant amount of medical and safety testing already performed on our products will provide us with a strong competitive advantage over our competition.
We also believe the ADVANCED TASER, TASER X26, TASER X2 and TASER X3 devices compete indirectly with a variety of non-lethal alternatives. These alternatives include, but are not limited to, pepper spray and impact weapons sold by companies such as Defense Technology and PepperBall Technologies, Inc. We believe our TASER brand devices’ advanced technology, versatility, effectiveness, built-in accountability systems, and low injury rate enable it to compete effectively against these other less-lethal alternatives.
Military Market
In the military markets, both in the United States and abroad, a wide variety of weapon systems are utilized to accomplish the mission at hand. Conducted energy devices have gained increased acceptance as a result of the policing role of military personnel in the conflicts in both Iraq and Afghanistan. There has also been an increased awareness of the use of non-lethal weapons to preserve human intelligence. TASER ECDs give our armed forces one means to capture or immobilize targets without using lethal force. We are the only supplier providing ECDs to these military agencies. However, there is indirect competition from pepper spray and impact weapons sold by companies such as Defense Technology and PepperBall Technologies, Inc.
Private Citizen Market
Electronic control devices have gained limited acceptance in the private citizen market. These devices compete with other less lethal weapons such as batons, clubs and chemical sprays as well as lethal force options. The primary competitive factors in the private citizen market include a weapon’s cost, effectiveness, safety and ease of use. We believe the widespread adoption of our TASER devices by prominent law enforcement agencies will help us to further penetrate the private citizen market.
Video Evidence Market
As we move into the video evidence capture and storage market segment, we are directly competing in a highly fragmented and competitive market against companies with an established presence such as the in-car video market. We believe our AXON product, which places the camera directly on-officer, overcomes some of the inherent limitations that an in-car system brings. When combined with our EVIDENCE.COM service to store, manage and analyze video events, we believe our end-to-end solution is a compelling value proposition for law enforcement agencies to evaluate.
13
Regulation
United States Regulation
The TASER X26, TASER X2, TASER X3, ADVANCED TASER, TASER C2, SHOCKWAVE and AIR TASER 34000™ devices, as well as the cartridges used by these devices, are subject to regulations; however, none are considered to be a “firearm” by the U.S. Bureau of Alcohol, Tobacco, Firearms and Explosives. The TASER XREP, however, does use a propellant system which falls under the definition of a “firearm” and is, therefore, subject to Federal firearms-related regulations specifically applying to the sale and distribution of these devices within the United States. In the 1980s many states adopted regulations restricting the sale and use of stun guns, inexpensive hand-held shock devices and electronic weapons. We believe existing stun gun laws and regulations also apply to our devices.
In 2009, New Jersey’s Attorney General approved a supplemental use of force policy that allows law enforcement officers in New Jersey to use electronic stun devices in limited circumstances involving emotionally disturbed individuals. This policy also limits the number of patrol officers per agency who carry electronic control devices. Prior to 2009, New Jersey was the only state to prohibit the use of ECDs and stun devices by law enforcement. From 2002 through 2004, we worked with several law enforcement agencies, government agencies and distributors to overturn prior legislation preventing the sale of TASER devices to law enforcement agencies in certain regions of the United States. These combined efforts were successful in changing the legislation in the states of Hawaii, Massachusetts and Michigan with a significant additional change in New Jersey allowing all law enforcement officers to carry TASER devices if accompanied by a TASER Cam capability.
In many cases, the law enforcement and corrections market is subject to different regulations than the private citizen market. Where different regulations exist, we assume the regulations affecting the private citizen market also apply to the private security markets except as the applicable regulations otherwise specifically provide.
As of December 31, 2011, state and local codes prohibit the possession of stun guns, including TASER ECDs, by the general public in seven states: District of Columbia, Hawaii, Massachusetts, Michigan, New Jersey, New York, and Rhode Island. Some cities and municipalities also prohibit private citizen possession or use of our products. With regard to Michigan, in an April 21, 2011 decision, a Circuit Court Judge in the 18th Circuit Court for the County of Bay, in the matter of People of the State of Michigan v. Dean Scott Yanna, Case No. 10-10536-FH, found that the state statute prohibiting stun devices (MCA 750.224a) is unconstitutional under the Second Amendment of the United States Constitution.
We are also subject to environmental laws and regulations, including restrictions on the presence of certain substances in electronic products. Reference is made to Section 1A, Risk Factors under the heading “Environmental laws and regulations subject us to a number of risks and could result in significant liabilities and costs”.
Our EVIDENCE.COM Software-as-a-Service (SaaS) online offering is subject to government regulation of the internet in many areas, including telecommunications, data protection, user privacy and online content.
United States Export Regulation
Our ECDs are considered a crime control product by the United States government. Accordingly, the export of our devices is regulated under export administration regulations. As a result, we must obtain export licenses from the Department of Commerce for all shipments to foreign countries other than Canada. Most of our requests for export licenses have been granted, and the need to obtain these licenses has not caused a material delay in our shipments. The need to obtain licenses, however, has limited or impeded our ability to ship to certain foreign markets. Export regulations also prohibit the further shipment of our products from foreign markets in which we hold a valid export license to foreign markets in which we do not hold an export license for our products.
In addition, in 2000, the Department of Commerce adopted regulations restricting the export of technology used in our devices. These regulations apply to both the technology incorporated in our device systems and in the processes used to produce them. The technology export regulations do not apply to production that takes place within the United States but is applicable to all sub-assemblies and controlled items manufactured outside the United States.
14
Foreign Regulation
Foreign regulations, which may affect our devices, are numerous and often unclear. We prefer to work with a distributor who is familiar with the applicable import regulations in each of our foreign markets. Experience with foreign distributors in the past indicates that restrictions may prohibit certain sales of our products in a number of countries. The vast majority of countries permit TASER devices to be sold and used by law enforcement. We rely on our distributors to inform us of those countries where the TASER device is prohibited or restricted.
Intellectual Property
We protect our intellectual property with United States and foreign patents and trademarks. Our patents and pending patent applications relate to technology used by us in connection with our products. We also rely on international treaties, organizations and foreign laws to protect our intellectual property. As of December 31, 2011, we hold 64 United States patents and 85 foreign patents and also have numerous patents and trademarks pending. Our patents expire at varying dates ranging between 2014 and 2029. The earliest expiring United States patent covers an aiming system having two angled laser light sources, one for the top dart and one for the lower dart. This technology is used in the X2 and X3 ECDs. We continuously assess whether and where to seek formal protection for particular innovations and technologies based on such factors as the commercial significance of our operations and our competitors’ operations in particular countries and regions, our strategic technology or product directions in different countries and the degree to which intellectual property laws exist and are meaningfully enforced in different jurisdictions.
Confidentiality agreements are used with employees, consultants and key suppliers to help ensure the confidentiality of our trade secrets.
TASER has the exclusive rights to many internet domain names primarily including ‘TASER.com’ and ‘EVIDENCE.COM’.
Research and Development
Our research and development initiatives are conducted in two separate categories. The first is internally funded research and development, and the second is research externally funded by customers having requirements for specific capabilities. Both categories focus on next generation technology, yet are differentiated by the anticipated breadth of the market opportunity, the time to project completion and accounting treatment. Internally funded research has been primarily focused on improvements to existing TASER products, or the development of new applications for TASER technology that we believe generally will have broad market appeal. Externally funded work focuses on specific packaging or delivery requirements of existing TASER technology that is of high value to particular customers but may not be viable product solutions to other customers. These projects generally represent product developments which are long-term in nature and require external resources, development using outside companies or expert consulting.
Research and development initiatives include bio-medical research and electrical, mechanical and software engineering. We expect that future development projects will focus on extending the range, improving the functionality and developing new delivery options for our ECD products. In addition, during 2009, 2010 and 2011, we devoted significant resources to the development of AXON and EVIDENCE.COM and have established a dedicated software development team in Carpenteria, California to plan, develop, test and support the operation of our Software-as-a-Service product.
Our investment in internally funded research and development totaled $10.0 million, $11.4 million and $20.0 million in 2011, 2010 and 2009, respectively. Our investment in research and development staff and equipment during 2009 and 2010 represented a significant increase from previous years but has tapered down significantly in 2011 as a result of an extensive revamp of the development process, which has led to an overall reduction of headcount. Our return on that investment is intended to be realized over the long term although new systems and technologies often have a more immediate impact on our business.
Employees
As of December 31, 2011, we had 313 full-time employees and 81 temporary employees. The breakdown of our full-time employees by department is as follows: 125 direct manufacturing employees and 188 administrative and manufacturing support employees. Of the 188 administrative and manufacturing support employees, 52 were involved in sales, marketing, communications and training; 60 were employed in research, development, TASER Virtual Systems and engineering; 28 were employed in administrative functions inclusive of executive management, legal, finance and accounting; 9 were employed in information systems technologies; 9 were employed in quality control and 30 were employed in manufacturing support functions. Our employees are not covered by any collective bargaining agreement, and we have never experienced a work stoppage. We believe that our relations with our employees are good.
15
Available Information
We were incorporated in Arizona in September 1993 as an ICER Corporation. We changed our name to AIR TASER, Inc. in December 1993 and to TASER International, Incorporated in April 1998. In January 2001, we reincorporated in Delaware as TASER International, Inc. Our website is located at www.TASER.com. Our annual report on Form 10-K, quarterly reports on Form 10-Q, current reports on Form 8-K and amendments to those reports filed or furnished pursuant to Section 13(a) or 15(d) of the Securities Exchange Act of 1934 are available on our website as soon as reasonably practicable after we electronically file such material with, or furnish such material to, the SEC. Other information that is not part of this Annual Report on Form 10-K can be accessed through our website at www.TASER.com.
| Item 1A. | Risk Factors |
Because of the following factors, as well as other variables affecting our operating results, our past financial performance may not be a reliable indicator of our future performance and historical trends should not be used to anticipate our results or trends in future periods.
We are materially dependent on acceptance of our products by the law enforcement, both domestic and international, and federal markets. If law enforcement agencies do not continue to purchase our products, our revenues will be adversely affected.
A substantial number of law enforcement and corrections agencies may not purchase our electronic control devices (ECDs). Law enforcement and corrections agencies may be influenced by claims or perceptions that ECDs, such as our products, are unsafe or may be used in an abusive manner. In addition, earlier generation conducted energy devices may have been perceived as ineffective. Sales of our products to these agencies may also be delayed or limited by these claims or perceptions.
Most of our end-user customers are subject to budgetary and political constraints, particularly in the currently challenging economic environment, that may delay or prevent sales.
Most of our end-user customers are government agencies. These agencies often do not set their own budgets and therefore, have limited control over the amount of money they can spend. In addition, these agencies experience political pressure that may dictate the manner in which they spend money. As a result, even if an agency wants to acquire our products, it may be unable to purchase them due to budgetary or political constraints. Currently, many governmental agencies are continuing to experience severe budgetary constraints. There can be no assurance that the economic and budgeting issues will not worsen and adversely impact sales of our products. Some government agency orders may also be canceled or substantially delayed due to budgetary, political or other scheduling delays which frequently occur in connection with the acquisition of products by such agencies and such cancellations may accelerate or be more severe than we have experienced historically as a result of the current economic environment.
We may face personal injury, wrongful death and other liability claims that harm our reputation and adversely affect our sales and financial condition.
Our ECD products are often used in aggressive confrontations that may result in serious, permanent bodily injury or death to those involved. Our ECD products may be associated with these injuries. A person injured in a confrontation or otherwise in connection with the use of our products may bring legal action against us to recover damages on the basis of theories including personal injury, wrongful death, negligent design, defective product or inadequate warning. We are currently subject to a number of such lawsuits. We may also be subject to lawsuits involving allegations of misuse of our products. If successful, personal injury, misuse and other claims could have a material adverse effect on our operating results and financial condition and could result in negative publicity about our products. Although we carry product liability insurance, we do incur significant legal expenses within our self-insured retention in defending these lawsuits and significant litigation could also result in a diversion of management’s attention and resources, negative publicity and a potential award of monetary damages in excess of our insurance coverage. The outcome of any litigation is inherently uncertain and there can be no assurance that our existing or any future litigation will not have a material adverse effect on our revenues, our financial condition or financial results.
16
We substantially depend on sales of our TASER X26 and X2 ECDs, and if these products do not continue to be widely accepted, our growth prospects will be diminished.
In the years ended December 31, 2011, 2010 and 2009, we derived our revenues predominantly from sales of the TASER X26 brand devices and related cartridges, and expect to depend on sales of these products for the foreseeable future. In addition, we introduced the TASER X2 device in 2011 and we are seeing a large number of customers upgrade their X26 devices to the X2 device and we expect this trend to continue. A decrease in the prices of or demand for these products, or their failure to achieve broad market acceptance, would significantly harm our growth prospects, operating results and financial condition.
If we are unable to manage our growth, our prospects may be limited and our future profitability may be adversely affected.
We intend to expand our product and service lines and our manufacturing capacity as needed to meet future demand. Any significant expansion may strain our managerial, financial and other resources. If we are unable to manage our growth, our business, operating results and financial condition could be adversely affected. We will need to continually improve our operations, financial and other internal systems to manage our growth effectively, and any failure to do so may lead to inefficiencies and redundancies, and result in reduced growth prospects and profitability.
To the extent demand for our products increases, our future success will be dependent upon our ability to ramp manufacturing production capacity, which may be accomplished by the implementation of customized manufacturing automation equipment.
To the extent demand for our products increases significantly in future periods, one of our key challenges will be to ramp our production capacity to meet sales demand while maintaining product quality. Our primary strategies to accomplish this include introducing additional shifts, increasing the physical size of our assembly facilities, the hiring of additional production staff, and the implementation of customized automation equipment. The investments we make in this equipment may not yield the anticipated labor and material efficiencies. Our inability to meet any future increase in sales demand or effectively manage our expansion could have a material adverse effect on our revenues, financial results and financial condition.
Pending litigation may subject us to significant litigation costs, judgments, fines and penalties in excess of insurance coverage, and divert management attention from our business.
We are involved in numerous litigation matters relating to our products or the use of such products, litigation against persons who we believe have infringed on our intellectual property, litigation against a competitor and litigation with a former distributor. Such matters have resulted, and are expected to continue to result in, substantial costs to us and some diversion of our management’s attention, which could adversely affect our business, financial condition or operating results.
Our future success is dependent on our ability to expand sales through distributors and direct sales and our inability to recruit new distributors or increase direct sales would negatively affect our sales.
Our distribution strategy is to pursue sales through multiple channels with an emphasis on independent distributors and direct sales. Our inability to establish relationships with, and retain law enforcement equipment distributors, who we believe can successfully sell our products, would adversely affect our sales. In addition, our arrangements with our distributors are generally short-term. We are also focusing on direct sales to larger agencies through our regional sales managers and our inability to grow sales to these agencies in this manner could adversely affect our sales. If we do not competitively price our products, meet the requirements of our distributors or end-users, provide adequate marketing support, or comply with the terms of our distribution arrangements, our distributors may fail to aggressively market our products or may terminate their relationships with us. These developments would likely have a material adverse effect on our sales. Our reliance on the sales of our products by others also makes it more difficult to predict our revenues, cash flow and operating results.
The success of our EVIDENCE.COM Software-as-a-Service delivery model is materially dependent on acceptance of this business model by our law enforcement customers. Delayed or lengthy time to adoption by law enforcement agencies will negatively impact our sales and profitability.
A substantial number of law enforcement agencies may be slow to adopt our EVIDENCE.COM digital data evidence management and storage solution, requiring extended periods of trial and evaluation. The hosted service delivery business model is not presently widely adopted by our law enforcement customer base. As such the sales cycle has additional complexity with the need to educate our customers and address issues regarding agency bandwidth requirements, data retention policies, data security and chain of custody. Delays in successfully securing widespread adoption of EVIDENCE.COM services could adversely affect our revenues, profitability and financial condition.
17
If our security measures are breached and unauthorized access is obtained to a customers’ data or our data, our service may be perceived as not being secure, customers may curtail or stop using our service and we may incur significant legal and financial exposure and liabilities.
Our service involves the storage and transmission of customers’ proprietary information, and security breaches could expose us to a risk of loss of this information, litigation and possible liability. These security measures may be breached as a result of third-party action, employee error, and malfeasance or otherwise, during transfer of data to additional data centers or at any time, and result in someone obtaining unauthorized access to our data or our customers’ data. Third parties may attempt to fraudulently induce employees or customers into disclosing sensitive information such as user names, passwords or other information in order to gain access to our data or our customers’ data. Additionally, hackers may develop and deploy viruses, worms, and other malicious software programs that attack or gain access to our networks and data centers. Because the techniques used to obtain unauthorized access, or to sabotage systems, change frequently and generally are not recognized until launched against a target, we may be unable to anticipate these techniques or to implement adequate preventative measures. We devote significant resources to engineer secure products and ensure security vulnerabilities are mitigated. Despite these efforts, any security breach could result in a loss of confidence in the security of our service, damage our reputation, lead to legal liability and negatively impact our future sales.
If we are unable to design, introduce and sell new products or new product features successfully, our business and financial results could be adversely affected.
Our future success will depend on our ability to develop new products or new product features that achieve market acceptance in a timely and cost-effective manner. The development of new products and new product features is complex, time consuming and expensive, and we may experience delays in completing the development and introduction of new products. We cannot provide any assurance that products that we may develop in the future will achieve market acceptance. If we fail to develop new products or new product features on a timely basis that achieve market acceptance, our business, financial results and competitive position could be adversely affected.
Delays in product development schedules may adversely affect our revenues.
The development of software products such as EVIDENCE.COM is a complex and time-consuming process. New products and enhancements to existing products can require long development and testing periods. Our increasing focus on our Software-as-a-Service platform also presents new and complex development issues. Significant delays in new product or service releases or significant problems in creating new products or services could adversely affect our revenue.
Acquisitions and joint ventures may have an adverse effect on our business.
We expect to make acquisitions or enter into joint ventures as part of our long-term business strategy. These transactions involve significant challenges and risks including that the transaction does not advance our business strategy, that we don’t realize a satisfactory return on our investment, or that we experience difficulty in the integration of new employees, business systems, and technology, or there is a diversion of management’s attention from our other businesses. These events could harm our operating results or financial condition.
We expend significant resources in anticipation of a sale due to our lengthy sales cycle and may receive no revenue in return.
Generally, law enforcement and corrections agencies consider a wide range of issues before committing to purchase our products, including product benefits, training costs, the cost to use our products in addition to or in place of other products, budget constraints and product reliability, safety and efficacy. The length of our sales cycle may range from a few weeks to as long as several years. Adverse publicity surrounding our products or the safety of such products has in the past and could in the future lengthen our sales cycle with customers. In the past, we believe we have experienced revenue decreases in part as the result of adverse effects on our customers and potential customers of negative publicity surrounding our products or the use of our products. We may incur substantial selling costs and expend significant effort in connection with the evaluation of our products by potential customers before they place an order. If these potential customers do not purchase our products, we will have expended significant resources and received no revenue in return.
18
Government regulation of our products may adversely affect sales.
Federal regulation of sales in the United States: With the exceptions of the TASER XREP, our ECDs are not firearms regulated by the United States Bureau of Alcohol, Tobacco, Firearms and Explosives, but our consumer products are regulated by the United States Consumer Product Safety Commission. Although there are currently no federal laws restricting sales of our core ECD products in the United States, future federal regulation could adversely affect sales of our products.
Federal regulation of international sales: Our ECD devices are considered a “crime control” product by the United States Department of Commerce, or DOC, for export directly from the United States. Consequently, we must obtain an export license from the DOC for the export of our ECD devices from the United States other than to Canada. In addition, certain of our camera and software products require classifications from the DOC before they may be shipped internationally. Our inability to obtain DOC export licenses or classifications on a timely basis for sales of our products to our international customers could significantly and adversely affect our international sales.
State and local regulation: Our devices are controlled, restricted or their use prohibited by a number of state and local governments. Our devices are banned from private citizen sale or use by statute in seven states: District of Columbia, Hawaii, Massachusetts, Michigan, New Jersey, New York, and Rhode Island. Some cities and municipalities also prohibit private citizen possession or use of our products. Other jurisdictions may ban or restrict the sale of our products and our product sales may be significantly affected by additional state, county and city governmental regulation. With regards to Michigan, in an April 21, 2011 decision, a Circuit Court Judge in the 18th Circuit Court for the County of Bay, in the matter of People of the State of Michigan v. Dean Scott Yanna, Case No. 10-10536-FH, found that the state statute prohibiting stun devices (MCA 750.224a) is unconstitutional under the Second Amendment of the United States Constitution.
Foreign regulation: Certain foreign jurisdictions prohibit the sale, possession or use of ECDs, limiting our international sales opportunities.
Environmental laws and regulations subject us to a number of risks and could result in significant liabilities and costs.
We may be subject to various state, federal and international laws and regulations governing the environment, including restricting the presence of certain substances in our products and making producers for those products financially responsible for the collection, treatment, recycling and disposal. Environmental legislation within the European Union (EU) may increase our cost of doing business internationally and impact our revenues from EU countries as we comply with and implement these requirements.
The EU has published Directives on the restriction of certain hazardous substances in electronic and electrical equipment (the RoHS Directive) and on electronic and electrical waste management (the WEEE Directive). The RoHS Directive restricts the use of a number of substances, including lead. The WEEE Directive directs members of the European Union to enact laws, regulations, and administrative provisions to ensure that producers of electric and electronic equipment are financially responsible for the collection, recycling, treatment and environmentally responsible disposal of certain products sold into the EU. In addition, similar environmental legislation has been or may be enacted in other jurisdictions, including the U.S. (under federal and state laws) and other countries, the cumulative impact of which could be significant.
We continue to monitor the impact of specific registration and compliance activities required by the RoHS and WEEE Directives. We endeavor to comply with applicable environmental laws, yet compliance with such laws could increase our operations and product costs; increase the complexities of product design, procurement, and manufacturing; limit our ability to manage excess and obsolete non-compliant inventory; limit our sales activities; and impact our future financial results. Any violation of these laws can subject us to significant liability, including fines, penalties, and prohibiting sales of our products into one or more states or countries, and result in a material adverse effect on our financial condition.
If we are unable to protect our intellectual property, we may lose our competitive advantage or incur substantial litigation costs to protect our rights.
Our future success depends upon our proprietary technology. Our protective measures, including patents, trademarks, copyrights, trade secret protection, and internet identity registrations, may prove inadequate to protect our proprietary rights and market advantage. The right to stop others from misusing our trademarks and service marks in commerce depends to some extent on our ability to show evidence of enforcement of our rights against such misuse in commerce. Our efforts to stop improper use, if insufficient, may lead to loss of trademark and service mark rights, brand loyalty and notoriety among our customers and prospective customers. The scope of any patent to which we have or may obtain rights may not prevent others from developing and selling competing products. The validity and breadth of claims covered in technology patents involve complex legal and factual questions, and the resolution of such claims may be highly uncertain, lengthy and expensive. In addition, our patents may be held invalid upon challenge, or others may claim rights in or ownership of our patents.
19
We have a judgment of patent infringement against Stinger Systems as to our U.S. patent 6,999,295, claims 2 and 40. The validity of claims 2 and 40 of U.S. patent 6,999,295 were upheld by the United States Patent and Trademark Office (USPTO) in an ex parte re-examination proceeding. Stinger Systems has sold its assets to Karbon Arms. The US District Court for the District of Arizona denied our motion to hold Karbon Arms in contempt for violating the injunction against Stinger Systems. We filed a patent infringement lawsuit in July of 2011 against Karbon Arms in the US District Court for the District of Delaware and this litigation is pending. Additional details concerning this patent infringement litigation can be found in the legal proceeding section of this Form 10-K.
We may be subject to intellectual property infringement claims, which could cause us to incur litigation costs and divert management attention from our business.
Any intellectual property infringement claims against us, with or without merit, could be costly and time-consuming to defend and divert our management’s attention from our business. If our products were found to infringe a third party’s proprietary rights, we could be forced to enter into costly royalty or licensing agreements in order to be able to sell our products or discontinue use of the protected technology. Such royalty and licensing agreements may not be available on terms acceptable to us or at all.
If we face competition in foreign countries, we can enforce patent rights only in the jurisdictions in which our patent applications have been granted.
Our United States patents protect us from imported infringing products coming into the United States from abroad. Applications for patents in a few foreign countries have been made; however, these may be inadequate to protect markets for our products in other foreign countries. Each foreign patent is examined and granted according to the law of the country where it was filed independent of whether a United States patent on similar technology was granted. A patent in a foreign country may be subject to cancellation if the claimed invention has not been sold in that country. Meeting the requirements of working the invention differs by country and ranges from sales in the country to manufacturing in the country. United States export law, or the laws of some foreign countries, may prohibit us from satisfying the requirements for working the invention, creating a risk that some of our foreign patents may become unenforceable.
Our efforts to avoid the patent, trademark, and copyright rights of others may not provide notice to us of potential infringements in time to avoid investing in product development and promotion that must later be abandoned if suitable license terms cannot be reached.
There is no guarantee that our use of conventional technology searching and brand clearance searching will identify all potential rights holders. Rights holders may demand payment for past infringements and/or force us to accept costly license terms or discontinue use of protected technology and/or works of authorship that may include, for example, photos, videos, and software. Our current research and development focus on developing software-based products increases this risk.
Government regulations applied to our products may affect our markets for these products.
We rely on the opinions of The Bureau of Alcohol Tobacco and Firearms, including the determination that a device that has projectiles propelled by the release of compressed gas in place of the expanding gases from ignited gunpowder, are not classified as firearms. Changes in statutes, regulations, and interpretation outside of our control may result in our products being classified or reclassified as firearms. Our private citizen market could be substantially reduced if consumers are required to obtain a registration to own a firearm prior to purchasing our products.
Defects in our products could reduce demand for our products and result in a loss of sales, delay in market acceptance and injury to our reputation.
Complex components and assemblies used in our products may contain undetected defects that are subsequently discovered at any point in the life of the product. Defects in our products may result in a loss of sales, delay in market acceptance, and injury to our reputation and increased warranty costs, which could have a material adverse effect on profitability and financial condition.
20
We face risks associated with rapid technological change and new competing products.
The technology associated with law enforcement devices is receiving significant attention and is rapidly evolving. While we have patent protection in key areas of our ECD technology, it is possible that new technology may result in competing products that operate outside our patents and could present significant competition for our products.
Our dependence on third-party suppliers for key components of our devices could delay shipment of our products and reduce our sales.
We depend on certain domestic and foreign suppliers for the delivery of components used in the assembly of our products. Our reliance on third-party suppliers creates risks related to our potential inability to obtain an adequate supply of components or sub-assemblies and reduced control over pricing and timing of delivery of components and sub-assemblies. Specifically, we depend on suppliers of sub-assemblies, machined parts, injection molded plastic parts, printed circuit boards, custom wire fabrications and other miscellaneous customer parts for our products. We do not have long-term agreements with any of our suppliers and there is no guarantee that supply will not be interrupted. Any interruption of supply for any material components of our products could significantly delay the shipment of our products and have a material adverse effect on our revenues, profitability and financial condition.
Component shortages could result in our inability to produce at a volume to adequately meet customer demand, which could result in a loss of sales, delay in deliveries and injury to our reputation.
Single or sole-source components used in the manufacture of our products may become unavailable or discontinued. Delays caused by industry allocations or obsolescence may take weeks or months to resolve. In some cases, parts obsolescence may require a product re-design to ensure quality replacement components. These delays could cause significant delays in manufacturing and loss of sales, leading to adverse effects significantly impacting our financial condition or results of operations.
Our dependence on foreign suppliers for key components of our products could delay shipment of our finished products and reduce our sales.
We depend on foreign suppliers for the delivery of certain components used in the assembly of our products. Due to changes imposed for imports of foreign products into the United States, as well as potential port closures and delays created by terrorist attacks or threats, public health issues or national disasters, we are exposed to risk of delays caused by freight carriers or customs clearance issues for our imported parts. Delays caused by our inability to obtain components for assembly could have a material adverse effect on our revenues, profitability and financial condition.
We may experience a decline in gross margins due to rising raw material and transportation costs associated with a future increase in petroleum prices.
A significant number of our raw materials are comprised of petroleum-based products, or incur some form of landed cost associated with transporting the raw materials or components to our facility. A significant rise in oil prices could adversely impact our ability to sustain current gross margins, by increasing component pricing.
Catastrophic events may disrupt our business.
A disruption or failure of our systems or operations in the event of a major earthquake, weather event, cyber-attack, terrorist attack, or other catastrophic event could cause delays in completing sales, providing services, or performing other mission-critical functions. Our software-related research and development and primary EVIDENCE.COM data center are located in Southern California near major earthquake faults. A catastrophic event that results in the destruction or disruption of any of our critical business or information technology systems could harm our ability to conduct normal business operations and our operating results.
We may experience outages and disruptions of our EVIDENCE.COM service if we fail to maintain an adequate operations infrastructure.
We anticipate increasing user traffic related to the introduction of EVIDENCE.COM. The complexity of this SaaS product will demand significant computing power. We have spent and expect to continue to spend substantial amounts to purchase or lease data centers and equipment and to upgrade our technology and network infrastructure to handle an anticipated increase in traffic. This expansion is expensive, complex, and could result in inefficiencies or operational failures, which could diminish the quality of our products, services, and user experience, resulting in damage to our reputation and loss of current and potential users, subscribers, and advertisers, harming our operating results and financial condition.
21
We may experience outages and disruptions of our EVIDENCE.COM service due to the migration of some of our data center operations to a third party cloud provider. We may face additional disruptions due to the migration of the remainder of our data center operations to a third party cloud provider.
Our revenues and operating results may fluctuate unexpectedly from quarter-to-quarter, which may cause our stock price to decline.
Our revenues and operating results have varied significantly in the past and may vary significantly in the future due to various factors, including, but not limited to:
| • | budgetary cycles of municipal, state and federal law enforcement and corrections agencies |
| • | market acceptance of our products and services |
| • | the timing of large domestic and international orders |
| • | the outcome of any existing or future litigation |
| • | adverse publicity surrounding our products, the safety of our products, or the use of our products |
| • | changes in our sales mix |
| • | new product introduction costs |
| • | increased raw material expenses |
| • | changes in our operating expenses |
| • | regulatory changes that may affect the marketability of our products |
As a result of these and other factors, we believe that period-to-period comparisons of our operating results may not be meaningful in the short term, and our performance in a particular period may not be indicative of our performance in any future period.
Foreign currency fluctuations may affect our competitiveness and sales in foreign markets.
The relative change in currency values creates fluctuations in our product pricing for potential international customers. These changes in foreign end-user costs may result in lost orders and reduce the competitiveness of our products in certain foreign markets. These changes may also negatively affect the financial condition of some existing or potential foreign customers and reduce or eliminate their future orders of our products. We also import selected components which are used in the manufacturing of some of our products. Although our purchase orders are in the United States dollar, weakness in the United States dollar could lead to price increases for the components.
We maintain all of our cash, cash equivalent and short-term investment balances, some of which are not insured, at four depository institutions.
We maintain the majority of our cash and cash equivalent accounts at four depository institutions. As of December 31, 2011, our aggregate balances in such accounts were $21.3 million. The Company’s balances with these institutions regularly exceed Federal Deposit Insurance Corporation (FDIC) insured limits; however, to manage the related credit exposure, we continually monitor the credit worthiness of the financial institutions where we have deposits.
We could suffer losses with respect to the uninsured balances if the depositary institutions failed and the institution’s assets were insufficient to cover its deposits and/or the Federal government did not take actions to support deposits in excess of existing FDIC insurance limits. Any such losses could have a material adverse effect on our liquidity, financial condition and results of operations.
We depend on our ability to attract and retain our key management and technical personnel.
Our success depends upon the continued service of our key management personnel. Our success also depends on our ability to continue to attract, retain and motivate qualified technical personnel. Although we have employment agreements with certain of our officers, the employment of such persons is “at-will” and either we or the employee can terminate the employment relationship at any time, subject to the applicable terms of the employment agreements. The competition for our key employees is intense. The loss of the service of one or more of our key personnel could harm our business.
22
| Item 1B. | Unresolved Staff Comments |
None.
| Item 2. | Properties |
Our corporate headquarters and manufacturing facilities are based in a 100,000 square foot facility in Scottsdale, Arizona, which we own. We also lease premises in Carpenteria, California, the Washington D.C. area and Frankfurt, Germany. We believe our existing facilities are well maintained and in good operating condition. We also believe we have adequate manufacturing capacity for our existing product lines for the foreseeable future. To the extent that we introduce new products in the future, we will likely need to acquire additional facilities to locate the associated production lines. However, we believe we can acquire or lease such facilities on reasonable terms. The Company continues to make investments in capital equipment as needed to meet anticipated demand for its products.
| Item 3. | Legal Proceedings |
See discussion of litigation in Note 8(c) to the consolidated financial statements included in Part II, Item 8 of this Annual Report on Form 10-K.
| Item 4. | Mine Safety Disclosures |
None.
23
| Item 5. | Market for Registrant’s Common Equity, Related Stockholder Matters and Issuer Purchases of Equity Securities |
Market Information
Our common stock is quoted under the symbol “TASR” on The NASDAQ Global Select Market. The closing price of our common stock on March 1, 2012 was $4.22 per share. The following table sets forth the high and low sales prices per share for our common stock as reported by NASDAQ for each quarter of the last two fiscal years.
| High | Low | |||||||
| Year Ended December 31, 2011: |
||||||||
| First quarter |
$ | 5.09 | $ | 3.68 | ||||
| Second quarter |
4.72 | 3.79 | ||||||
| Third quarter |
4.60 | 3.55 | ||||||
| Fourth quarter |
6.49 | 4.04 | ||||||
| High | Low | |||||||
| Year Ended December 31, 2010: |
||||||||
| First quarter |
$ | 7.88 | $ | 4.41 | ||||
| Second quarter |
5.97 | 3.79 | ||||||
| Third quarter |
4.62 | 3.52 | ||||||
| Fourth quarter |
5.10 | 3.61 | ||||||
Holders
As of March 1, 2012, there were 347 holders of record of our common stock.
Dividends
To date, we have not declared or paid cash dividends on our common stock. We do not intend to pay cash dividends in the foreseeable future and our revolving line of credit prohibits the payment of cash dividends.
Issuer Purchases of Equity Securities
In March 2011, TASER’s Board of Directors authorized a stock repurchase program to acquire up to $12.5 million of the Company’s outstanding common stock subject to stock market conditions and corporate considerations. In July 2011, TASER’s Board of Directors authorized an additional repurchase program to acquire up to $20.0 million of the Company’s outstanding common stock, subject to stock market conditions and corporate considerations. During the year ended December 31, 2011, we purchased 7,464,583 common shares under these programs for a total cost of $32.5 million, or a weighted average cost of $4.35 per share. The table below sets forth information regarding repurchases of our common stock by us during the three months ended December 31, 2011
| Period |
Total Number of Shares Purchased |
Average Price Paid per Share |
Total Number of Shares Purchased as Part of Publicly Announced Plans or Programs |
Approximate Dollar Value of Shares that May Yet be Purchased Under the Plans or Programs |
||||||||||||
| October 1-31 |
1,100,800 | $ | 4.53 | 1,100,800 | $ | 2,629,147 | ||||||||||
| November 1-30 |
373,900 | $ | 5.25 | 373,900 | $ | 667,961 | ||||||||||
| December 1-31 |
111,800 | $ | 5.97 | 111,800 | $ | 227 | ||||||||||
| Total |
1,586,500 | $ | 4.80 | 1,586,500 | $ | 227 | ||||||||||
24
Recent Sales of Unregistered Securities
No unregistered securities were sold by us in 2011.
Stock Performance Graph
The following stock performance graph compares the performance of our common stock to the NASDAQ Stock Market (United States) and the Russell 3000 Index. The graph covers the period from December 31, 2006 to December 31, 2011. The graph assumes that the value of the investment in our stock and in each index was $100 at December 31, 2006 and that all dividends were reinvested. We do not pay dividends on our common stock.
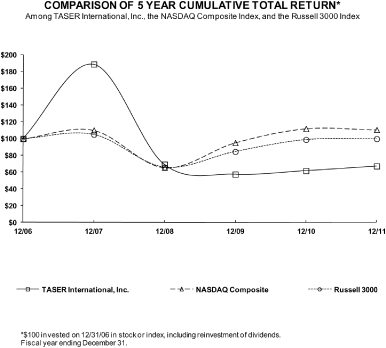
| 2006 | 2007 | 2008 | 2009 | 2010 | 2011 | |||||||||||||||||||
| TASER International, Inc. |
100.00 | 189.09 | 69.38 | 57.56 | 61.76 | 67.28 | ||||||||||||||||||
| NASDAQ Composite |
100.00 | 110.26 | 65.65 | 95.18 | 112.10 | 110.81 | ||||||||||||||||||
| Russell 3000 |
100.00 | 105.14 | 65.92 | 84.60 | 98.92 | 99.93 | ||||||||||||||||||
25
| Item 6. | Selected Financial Data |
The following selected financial data should be read in conjunction with our consolidated financial statements and the notes thereto, and with Item 7, “Management’s Discussion and Analysis of Financial Condition and Results of Operations.” The statement of operations data for the years ended December 31, 2011, 2010 and 2009, and the balance sheet data as of December 31, 2011 and 2010, have been derived from, and should be read in conjunction with, our audited consolidated financial statements and the notes thereto included herein. The statement of operations data for the years ended December 31, 2008 and 2007, and the balance sheet data as of December 31, 2009, 2008 and 2007, is derived from audited consolidated financial statements and the notes thereto which are not included in this Annual Report on Form 10-K.
| For the Year Ended December 31, | ||||||||||||||||||||
| 2011 | 2010 | 2009 | 2008 | 2007 | ||||||||||||||||
| Statement of Operations Data: |
||||||||||||||||||||
| Net sales |
$ | 90,027,906 | $ | 86,930,019 | $ | 104,251,560 | $ | 92,845,490 | $ | 100,727,191 | ||||||||||
| Cost of products sold |
41,752,520 | 41,563,144 | 40,849,151 | 35,841,263 | 43,167,372 | |||||||||||||||
| Excess inventory charges |
3,746,149 | — | — | — | — | |||||||||||||||
| Gross margin |
44,529,237 | 45,366,875 | 63,402,409 | 57,004,227 | 57,559,819 | |||||||||||||||
| Sales, general and administrative expenses |
38,000,455 | 39,021,564 | 43,479,232 | 38,860,729 | 32,814,170 | |||||||||||||||
| Research and development expenses |
9,989,219 | 11,411,889 | 20,002,351 | 12,918,161 | 4,421,596 | |||||||||||||||
| Litigation judgment expense |
3,301,243 | — | — | — | — | |||||||||||||||
| Loss on impairment |
1,353,857 | — | — | — | — | |||||||||||||||
| Loss on write down / disposal of property and equipment, net |
2,800,396 | 73,061 | — | — | — | |||||||||||||||
| (Loss) income from operations |
(10,915,933 | ) | (5,139,639 | ) | (79,174 | ) | 5,225,337 | 20,324,053 | ||||||||||||
| Net (loss) income |
(7,039,866 | ) | (4,384,435 | ) | (1,106 | ) | 3,637,041 | 15,026,476 | ||||||||||||
| Net (loss) income per common and common equivalent shares: |
||||||||||||||||||||
| Basic |
$ | (0.12 | ) | $ | (0.07 | ) | $ | (0.00 | ) | $ | 0.06 | $ | 0.24 | |||||||
| Diluted |
$ | (0.12 | ) | $ | (0.07 | ) | $ | (0.00 | ) | $ | 0.06 | $ | 0.23 | |||||||
| Weighted average number of common and common equivalent shares outstanding: |
||||||||||||||||||||
| Basic |
59,435,624 | 62,524,446 | 61,920,094 | 62,371,004 | 62,621,174 | |||||||||||||||
| Diluted |
59,435,624 | 62,524,446 | 61,920,094 | 64,070,869 | 65,685,667 | |||||||||||||||
| As of December 31, | ||||||||||||||||||||
| 2011 | 2010 | 2009 | 2008 | 2007 | ||||||||||||||||
| Balance Sheet Data: |
||||||||||||||||||||
| Working capital |
$ | 45,844,526 | $ | 70,378,201 | $ | 72,100,393 | $ | 80,642,516 | $ | 83,953,166 | ||||||||||
| Total assets |
104,962,751 | 136,186,935 | 138,425,917 | 130,015,506 | 137,763,401 | |||||||||||||||
| Total current liabilities |
15,887,897 | 11,947,994 | 13,784,853 | 10,956,199 | 12,473,616 | |||||||||||||||
| Total long-term debt and capital leases |
— | — | — | — | 11,695 | |||||||||||||||
| Total stockholders’ equity |
82,455,554 | 117,564,241 | 117,701,196 | 112,526,262 | 120,636,750 | |||||||||||||||
26
| Item 7. | Management’s Discussion and Analysis of Financial Condition and Results of Operations |
Management’s Discussion and Analysis of Financial Condition and Results of Operations (MD&A) is designed to provide a reader of our consolidated financial statements with a narrative from the perspective of our management on our financial condition, results of operations, liquidity and certain other factors that may affect our future results. Our MD&A should be read in conjunction with the other sections of this annual report on Form 10-K, including Part I, Item 1A: “Risk Factors”; Part II, Item 6: “Selected Financial Data”; and Part II, Item 8: “Financial Statements and Supplementary Data.” The various sections of this MD&A contain a number of forward-looking statements, all of which are based on our current expectations and could be affected by the uncertainties and risk factors described throughout this filing.
Executive Overview and Key Strategic Initiatives
Our core mission is to protect life, prevent conflict and resolve disputes through technologies that make communities safer. We are a market leader in the development and manufacture of advanced electronic control devices (ECDs) designed for use in law enforcement, military, corrections, private security and personal defense.
Our mission to protect life has also been extended to prevent conflict and resolve disputes. We have learned that bringing a subject into custody is not the end of the challenge for law enforcement. In fact, it is typically just the beginning since a significant number of incidents that start as a physical conflict transition into a legal conflict. Whether it’s prosecuting and convicting the individual arrested, or responding to excessive use of force allegations, the post-incident legal process is a considerable part of the challenge that law enforcement faces on a continual basis and can often take years and millions of litigation dollars to resolve in the courtroom. To help law enforcement address this challenge, we have developed a fully integrated hardware and software solution that will provide our law enforcement customers the capabilities to capture, store, manage, share and analyze video and other digital evidence. Finally, the optimum situation is to have prevented the conflict from ever escalating. TASER ECDs and AXON on-officer video have a measured and positive effect on better suspect and officer behavior, as well as achieving compliance without escalation of force.
TASER solutions deliver significant results to our customers and to communities in which they are deployed. There are over 100 published studies on the effects of TASER ECDs. Just as importantly, there are eight published independent epidemiological studies covering a total of 48,228 subjects. The 2008 Eastman study found that 5.4% of conductive electronic weapon uses “clearly prevented the use of lethal force by police.” The largest epidemiological study was the 2009 MacDonald study of 24,380 uses of force. In addition, the papers of Taylor (13,983 subjects), Mesloh (4,303 subjects), Mumola (2,686 subjects), Smith (1,645 subjects), Butler (562 subjects), and White (243 subjects), show a significant reduction in both officer and suspect injuries with TASER ECD usage. Further, most reporting agencies demonstrate overall decreases in use of force, and decreases in suspect and officer injuries resulting from conflict. Reducing uses of force and gaining compliance by use of a TASER ECD has provided significant reductions in worker’s compensation expenses and claims for excessive use of force for agencies, and ultimately taxpayers.
Technological innovation is the foundation for our long-term growth and we intend to maintain our commitment to the research and development of our technology for both new and existing products that further our mission. At the same time we have established industry leading training services to provide our users a comprehensive overview of legal and policy issues, medical information and risk mitigation relating to our ECDs and the use of force. We have built a network of distribution channels for selling and marketing our products and services to law enforcement agencies, primarily in North America, with ongoing focus and effort placed on expanding these programs in international, military and other markets. Over 16,000 law enforcement agencies in over 100 countries have made initial purchases of our TASER brand devices for testing or deployment. To date, we do not know of any significant sales of any competing ECD products.
27
Our key strategies include:
| • | Increase market penetration in both the United States and international law enforcement markets. We believe that a large portion of these markets that do not currently use our products continue to present an opportunity for future growth, particularly with respect to international law enforcement agencies where there remains a significant opportunity for more widespread adoption. In recent years we have seen international markets become increasingly significant and we seek to maintain that trend as we demonstrate the benefits of large-scale adoptions of our ECDs, using countries such as the U.K and Australia as benchmarks of successful programs. Given the sales cycle to break into a new international market can be as long as 18 to 24 months, it is important that we continue to develop our pipeline in terms of both the number and size of opportunities. |
| • | Focus on the significant opportunity of re-selling into our existing large installed base of law enforcement customers. TASER ECDs are sophisticated electronic devices that are regularly subjected to the harsh environment of law enforcement, security and the military. We design and manufacture our ECDs to be as robust as we can make them. However, these electronic systems are dropped, jarred about on an officer’s belt, used in violent confrontations, and exposed to extreme heat, cold, rain and dust, all of which can contribute to general wear and tear on the high voltage component. Taking into account all of the factors and based on our years of field experience, we recommend that the general useful life of a TASER handheld ECD is five years. With many early adopters still utilizing ECDs purchased from 2003 to 2006, we believe there exists a significant number of our customers that recognize they need to consider either a model upgrade from the Advanced TASER to the X26, X2 or X3, or purchasing replacement ECDs to refresh the aging profile of the TASER ECD handles they have in field use. |
| • | Further develop our presence in federal government and military markets. We intend to continue to place a strong emphasis on supporting our military customers through our Government and Military Programs business group and our Senior Executive Advisory Group (SEAG) comprised of a team of professionals with extensive military, homeland defense and law enforcement experience with the purpose of advising on business development in support of military users. The primary focus of these groups is placed on supporting military use for our existing hardware as well as increasing technology development through contracted support. |
| • | Focus on increasing sales of AXON and EVIDENCE.COM. We completed a number of field trials of the AXON and EVIDENCE.COM throughout 2010 and 2011 and began to make some initial sales. We experienced increasing volumes of trial programs in 2011 and believe these trial programs are the best way for our customers to see the powerful capabilities, benefits and compelling value proposition of this technology for themselves and helped to achieve increased revenues from these products in 2011. We anticipate further increases in these trial programs in 2012. |
| • | Continued investment in development of innovative new products, which both complement and add to our existing platforms. Our research and development efforts in 2011 were primarily focused on the next generation of ECD hardware, and we continue to devote resources to refine and improve both AXON and EVIDENCE.COM with new and enhanced features. We also introduced the next generation of Video products, the AXON Flex, in February 2012. |
| • | Continued focus on operational excellence through leveraging our existing cost structure and human capital to move the Company towards the next phase of revenue growth and enhanced profitability. |
| • | Continued application for patents and intellectual property rights, both in the United States and internationally, to protect key technology in our products and further attempt to protect our competitive position. |
| • | Continued aggressive litigation defense to protect our brand equity. We have assembled a team of world class medical experts and hired additional internal legal resources to provide an efficient means of defending the Company against product liability claims. We view a continued record of successful litigation defense as a key factor for our long-term growth and success. |
28
2011 Overview
Included in the Results of Operations are the following significant charges for 2011:
| • | Impairment of the Protector product line for $1.4 million, incurred during the second quarter of 2011 |
| • | Losses on disposal of property and equipment of $0.8 million, related to surplus EVIDENCE.COM equipment and billing software, incurred during the second quarter of 2011. |
| • | A litigation judgment reserve for $3.3 million, incurred during the second quarter of 2011. |
| • | Excess inventory charges for the TASER X3 and first generation AXON product lines of $3.7 million, and impairment of associated production tooling equipment of $2.0 million, incurred during the fourth quarter of 2011. |
Results of Operations
The following table presents data from our statements of operations as well as the percentage relationship to total net revenues of items included in our statements of operations (dollars in thousands):
| Year Ended December 31, | ||||||||||||||||||||||||
| 2011 | 2010 | 2009 | ||||||||||||||||||||||
| Net sales |
$ | 90,028 | 100 | % | $ | 86,930 | 100 | % | $ | 104,252 | 100 | % | ||||||||||||
| Cost of products sold |
41,753 | 46 | % | 41,563 | 48 | % | 40,850 | 39 | % | |||||||||||||||
| Excess inventory charges |
3,746 | 4 | % | — | 0 | % | — | |||||||||||||||||
|
|
|
|
|
|
|
|||||||||||||||||||
| Gross margin |
44,529 | 49 | % | 45,367 | 52 | % | 63,402 | 61 | % | |||||||||||||||
|
|
|
|
|
|
|
|||||||||||||||||||
| Operating expenses: |
||||||||||||||||||||||||
| Sales, general and administrative |
38,000 | 42 | % | 39,022 | 45 | % | 43,479 | 42 | % | |||||||||||||||
| Research and development |
9,989 | 11 | % | 11,412 | 13 | % | 20,002 | 19 | % | |||||||||||||||
| Litigation judgment |
3,301 | 4 | % | — | — | — | — | |||||||||||||||||
| Loss on impairment |
1,354 | 2 | % | — | — | — | — | |||||||||||||||||
| Loss on write down / disposal of property and equipment, net |
2,800 | 3 | % | 73 | — | * | — | — | ||||||||||||||||
|
|
|
|
|
|
|
|||||||||||||||||||
| Total operating expenses |
55,445 | 62 | % | 50,507 | 58 | % | 63,481 | 61 | % | |||||||||||||||
|
|
|
|
|
|
|
|||||||||||||||||||
| Loss from operations |
(10,916 | ) | (12 | %) | (5,140 | ) | (6 | %) | (79 | ) | * | |||||||||||||
| Interest and other income, net |
1,287 | 1 | % | 26 | * | 170 | * | |||||||||||||||||
|
|
|
|
|
|
|
|||||||||||||||||||
| Income (loss) before provision for income taxes |
(9,629 | ) | (11 | %) | (5,114 | ) | (6 | %) | 91 | * | ||||||||||||||
| Provision (benefit) for income taxes |
(2,589 | ) | (3 | %) | (730 | ) | (1 | %) | 92 | * | ||||||||||||||
|
|
|
|
|
|
|
|||||||||||||||||||
| Net loss |
$ | (7,040 | ) | (8 | %) | $ | (4,384 | ) | (5 | %) | $ | (1 | ) | * | ||||||||||
|
|
|
|
|
|
|
|||||||||||||||||||
| * | less than 1% |
29
Net Sales
Net sales by product line are as follows (dollars in thousands):
| 2011 | 2010 | 2009 | ||||||||||||||||||||||
| ECD segment: |
||||||||||||||||||||||||
| TASER X26 |
$ | 37,278 | 41 | % | $ | 41,290 | 47 | % | $ | 53,996 | 52 | % | ||||||||||||
| Single Cartridges |
25,353 | 28 | % | 21,979 | 25 | % | 27,908 | 27 | % | |||||||||||||||
| TASER X2 |
8,110 | 9 | % | — | — | — | — | |||||||||||||||||
| TASER C2 |
3,253 | 4 | % | 3,779 | 4 | % | 4,929 | 5 | % | |||||||||||||||
| ADVANCED TASER |
3,104 | 3 | % | 2,686 | 3 | % | 3,693 | 4 | % | |||||||||||||||
| TASER X3 |
326 | * | 2,305 | 3 | % | 746 | 1 | % | ||||||||||||||||
| XREP |
387 | * | 1,306 | 2 | % | 549 | 1 | % | ||||||||||||||||
| Other |
8,864 | 10 | % | 9,045 | 10 | % | 9,344 | 9 | % | |||||||||||||||
|
|
|
|
|
|
|
|
|
|
|
|
|
|||||||||||||
| ECD segment |
$ | 86,675 | 96 | % | $ | 82,390 | 95 | % | $ | 101,165 | 97 | % | ||||||||||||
|
|
|
|
|
|
|
|
|
|
|
|
|
|||||||||||||
| Video segment: |
||||||||||||||||||||||||
| TASER Cam |
$ | 2,222 | 2 | % | $ | 4,026 | 5 | % | $ | 3,051 | 3 | % | ||||||||||||
| AXON/EVIDENCE.com |
771 | 1 | % | 307 | * | — | — | |||||||||||||||||
| Other |
360 | * | 207 | * | 36 | * | ||||||||||||||||||
|
|
|
|
|
|
|
|
|
|
|
|
|
|||||||||||||
| Video segment |
$ | 3,353 | 4 | % | $ | 4,540 | 5 | % | $ | 3,087 | 3 | % | ||||||||||||
|
|
|
|
|
|
|
|
|
|
|
|
|
|||||||||||||
| Total net sales |
$ | 90,028 | 100 | % | $ | 86,930 | 100 | % | $ | 104,252 | 100 | % | ||||||||||||
|
|
|
|
|
|
|
|
|
|
|
|
|
|||||||||||||
| * | less than 1% |
Net sales to the United States and other countries are summarized as follows:
| Year Ended December 31, | ||||||||||||
| 2011 | 2010 | 2009 | ||||||||||
| United States |
80 | % | 79 | % | 78 | % | ||||||
| Other Countries |
20 | 21 | 22 | |||||||||
|
|
|
|
|
|
|
|||||||
| Total |
100 | % | 100 | % | 100 | % | ||||||
|
|
|
|
|
|
|
|||||||
Net sales were $90.0 million and $86.9 million for the years ended December 31, 2011 and 2010, respectively, an increase of $3.1 million or 4%.The increase in net sales for 2011 compared to 2010 was primarily driven by the growing demand and successful adoption of the TASER X2 as well as larger individually significant orders in both the international and Federal markets. Domestically, the launch of the TASER X2 partially replaced demand for other products within our ECD segment. The primary factors affecting our increased net sales for 2011 compared to 2010 were an increase in sales of single cartridges of $3.4 million, or 15% and the contribution of $8.1 million of TASER X2 sales. Offsetting these increases were decreased sales of our X26, X3, XREP and C2 ECD products by a combined $7.4 million, or 15%. Our Video Segment was adversely affected by declining sales of the TASER Cam of $1.8 million, or 45%, reflecting a large international order in 2010 that did not recur in 2011.
30
Net sales were $86.9 million and $104.3 million for the years ended December 31, 2010 and 2009, respectively, a decrease of $17.3 million or 17%. The decrease for our ECD segment in 2010 was primarily volume driven with fewer individually significant international and Federal orders in 2010 as sales in 2009 included follow-on orders to larger customers in these market segments. Domestic law enforcement sales also declined over the prior year as agencies continued to operate with budget constraints in prevailing adverse economic conditions and did not have the level of stimulus funds that were available in 2009. This resulted in reduced sales of the TASER X26 product line which decreased by $12.7 million, or 24%, to $41.3 million in 2010 compared to $54.0 million in 2009. Single cartridge sales also decreased by $6.0 million, or 21% to $22.0 million in 2010 compared to $27.9 million in 2009. Sales of our TASER C2 consumer product also declined by $1.2 million, or 23%, due to the negative impact of the economic downturn on consumer spending. Offsetting these decreases were sales of new products, including XREP, X3 and Shockwave, contributing $3.7 million in sales in 2010. The Video segment also provided increased net sales in 2010 as TASER Cam sales increased $0.9 million, driven by a large international order in the first quarter of 2010 and the introduction of AXON and EVIDENCE.COM, which contributed $0.3 million in sales in 2010. Other sales, which include training, extended warranty, out of warranty repair revenues and government grant revenues decreased $0.1 million over the prior year.
Cost of Products Sold
Cost of products sold, before excess inventory charges of $3.7 million in 2011, were $41.8 million and $41.6 million for the years ended December 31, 2011 and 2010, respectively, an increase of $0.2 million or 0.5%. As a percentage of net sales, cost of products sold decreased to 46.4% in 2011 compared to 47.8% in 2010. The net decrease in costs as a percent of sales is driven by a combination of offsetting factors including: (i) manufacturing costs decreased 3.4% as a percentage of sales, attributable to a more favorable market segment mix with higher margin international sales; (ii) a more favorable product sales mix with a larger contribution to net sales from higher margin products, including the newly launched TASER X2, replacing products such as the TASER X3 and XREP, which had lower margins and initial production yields; (iii) improved production efficiency resulting from reductions in temporary labor and overtime, as well as a reduction in rework effort; (iv) improved leverage on indirect manufacturing costs following the 3.6% increase in sales; and (v) scrap charges have been reduced, as have warranty provision charges resulting from increased focus on quality initiatives, which reduced product returns. Offsetting the reduction in manufacturing costs as a percentage of net sales were $4.8 million of EVIDENCE.COM datacenter operating and software maintenance costs, which relate to the Video segment and were included in cost of products sold in 2011, compared to $3.1 million in the prior year following the commercial availability of the service, representing a 1.7% increase in costs as a percentage of sales. A significant portion of these costs were included as part of research and development in 2010. In addition, the Company offered an upgrade program, which provides customers purchasing a new TASER X2 kit with a $300 trade-in credit to replace any existing ECD. This offer generated $2.1 million of trade-in credits during the second, third and fourth quarters of 2011, which reduced the average selling price on TASER X2 sales and consequently reducing gross margin.
Cost of products sold were $41.6 million and $40.8 million for the years ended December 31, 2010 and 2009, respectively, an increase of $0.8 million, or 1.7%. As a percentage of net sales, cost of products sold increased to 48% in 2010 compared to 39% in 2009. The increase in cost of products sold as a percentage of net sales in 2010 compared to 2009 was driven by a combination of factors. $3.2 million, representing a 4% increase in costs as a percentage of sales, of EVIDENCE.COM data center operating and software maintenance costs are included in cost of product sold in 2010 following the commercial availability of the service, whereas such costs were included in research and development expenses in 2009 while we were in the development phase. Direct manufacturing costs increased as a percentage of net sales due to a less favorable product and market segment sales mix, attributable to a reduction in sales of our higher margin X26 product and lower international sales. This was combined with lower initial margins on the AXON, XREP and X3 product lines, an increase in value engineering related rework costs and increases in packaging material costs. Direct labor also increased as a percentage of sales due to the overall higher cost of using temporary labor in 2010, partially offset by efficiencies gained from cartridge automation equipment, while leverage on relatively fixed indirect manufacturing expenses has been reduced as sales decreased 17% in 2010 compared to 2009. In addition to reduced leverage, the total pool of indirect manufacturing expenses increased in 2010 compared to the prior year due to a $2.4 million increase in depreciation expense for our automated cartridge and new product production equipment, $1.1 million in inventory write-off charges related to parts made obsolete from the move to automated cartridge production and some employee severance charges.
31
Excess Inventory Charges
Excess inventory charges specific to two of our product lines were $3.7 million for 2011 and nil for 2010 and 2009. The success of the new TASER X2 has led the Company to conclude that it will not sell through its current level of TASER X3 inventory, even though the Company will continue to sell and support the TASER X3 product line as part of its ECD segment. These factors resulted in an excess inventory charge of $1.7 million. Similarly, with the launch of the Company’s new AXON Flex system for our Video segment, the Company has concluded it will not sell through existing first generation AXON inventory. These factors resulted in an excess inventory charge of $2.0 million.
Gross Margin
Gross margin decreased $0.9 million to $44.5 million for 2011 compared to $45.4 million for 2010. The 2011 gross margin includes the excess inventory charge specific to our two product lines, which when excluded, would increase gross margin by $3.7 million to $48.3 million compared to 2010. As a percentage of net sales, gross margin decreased to 49% for 2011 compared to 52% for 2010. The decline in gross margin as a percentage of net sales for 2011 is primarily attributable to the excess inventory charges discussed above. After considering these excess inventory charges, gross margin improved slightly for 2011 compared to 2010, which reflects improved leverage on higher sales levels as well as the factors noted above under the discussion of cost of products sold.
Gross margin for the ECD segment was $50.7 million for 2011, compared to $47.4 million for 2010. As a percentage of net sales, gross margin on the ECD segment increased to 59%, up one percent from 58% in 2010, due to a change in the product mix from the lower margin X3 and XREP to X2. The Video segment had a negative gross margin of $6.2 million for 2011 compared to a negative gross margin of $2.0 million for 2010. The decline in the gross margin for the Video segment is mostly attributable to the inclusion of a full year of service delivery costs for EVIDENCE.COM in 2011, compared to only eight months in 2010 due to timing of product launch. The excess inventory charge of $2.0 million in 2011 also contributed to the decline in gross margin.
Gross margin decreased $18.0 million to $45.4 million for 2010 compared to $63.4 million for 2009. As a percentage of net sales, gross margins decreased to 52% for 2010 compared to 61% for 2009. The decline in gross margin as a percentage of net sales in 2010 reflects a decrease in leverage due to lower sales levels as well as the other factors noted above under the discussion of cost of products sold.
Gross margin for the ECD segment was $47.4 million for 2010, which decreased $14.8 million, or 23.7% when compared to 2009. As a percentage of net sales, gross margin declined to 58%, down from 61% in 2009. The decline in gross margin is attributed to decreased leverage on an $18.8 million decrease in sales, as well as less favorable product mix. The Video segment had a negative gross margin of $2.0 million for 2010, which declined $3.3 million compared to 2009 mostly due to the launch of AXON and EVIDENCE.COM, and the inclusion of $3.1 million of service delivery costs for EVIDENCE.COM, accompanied by service revenue of only $0.08 million.
32
Sales, General and Administrative Expenses
Sales, general and administrative expenses were comprised as follows for 2011 and 2010 (dollars in thousands):
| Year Ended December 31, | Dollar | Percent | ||||||||||||||
| 2011 | 2010 | Change | Change | |||||||||||||
| Salaries, benefits and bonus |
$ | 10,166 | $ | 10,586 | $ | (420 | ) | (4 | %) | |||||||
| Stock-based compensation |
2,291 | 2,728 | (437 | ) | (16 | %) | ||||||||||
| Legal, professional and accounting |
6,604 | 5,187 | 1,417 | 27 | % | |||||||||||
| Sales and marketing |
3,459 | 4,152 | (693 | ) | (17 | %) | ||||||||||
| Consulting and lobbying services |
2,754 | 2,872 | (118 | ) | (4 | %) | ||||||||||
| Travel and meals |
2,946 | 2,956 | (10 | ) | * | |||||||||||
| Building |
2,989 | 3,094 | (105 | ) | (3 | %) | ||||||||||
| Supplies |
1,526 | 1,451 | 75 | 5 | % | |||||||||||
| Depreciation and amortization |
2,136 | 2,023 | 113 | 6 | % | |||||||||||
| D&O and liability insurance |
1,816 | 1,613 | 203 | 13 | % | |||||||||||
| Other |
1,313 | 2,360 | (1,047 | ) | (44 | %) | ||||||||||
|
|
|
|
|
|
|
|||||||||||
| Total sales, general and administrative expenses |
$ | 38,000 | $ | 39,022 | $ | (1,022 | ) | (3 | %) | |||||||
|
|
|
|
|
|
|
|||||||||||
| Sales, general, and administrative as a percentage of net sales |
42 | % | 45 | % | ||||||||||||
| * | less than 1% |
Sales, general and administrative expenses were $38.0 million and $39.0 million for the years ended December 31, 2011 and 2010, respectively, a decrease of $1.0 million or 3%. As a percentage of total net sales, sales, general and administrative expenses decreased to 42% for 2011 compared to 45% for 2010. The overall decrease for 2011 compared to 2010 is attributable to a $0.8 million reduction in salaries, benefits, bonus and stock-based compensation primarily driven by measures taken to reduce our salaried headcount and fixed cost infrastructure in 2010, including some one-time severance charges. Sales and marketing and travel-related costs including advertising, tradeshows and outside commissions have been reduced overall by $0.7 million as we continue to focus on reducing discretionary spending, despite incurring TASER X2 product launch costs. In addition, $1.0 million relating to a litigation settlement for an officer injury during arrest claim was included in other expense in 2010, which is driving the decrease in other sales, general and administrative expenses. Offsetting these reductions, legal, professional and accounting fees increased, which was driven by the timing and volume of pending litigation, and an increase in directors and officers insurance and product liability insurance premiums over the prior year amounts.
33
Sales, general and administrative expenses were comprised as follows for 2010 and 2009 (dollars in thousands):
| Year Ended December 31, | Dollar | Percent | ||||||||||||||
| 2010 | 2009 | Change | Change | |||||||||||||
| Salaries, benefits and bonus |
$ | 10,586 | $ | 11,335 | $ | (749 | ) | (7 | %) | |||||||
| Stock-based compensation |
2,728 | 3,219 | (491 | ) | (15 | %) | ||||||||||
| Legal, professional and accounting |
5,187 | 6,081 | (894 | ) | (15 | %) | ||||||||||
| Sales and marketing |
4,152 | 5,356 | (1,204 | ) | (22 | %) | ||||||||||
| Consulting and lobbying services |
2,872 | 3,863 | (991 | ) | (26 | %) | ||||||||||
| Travel and meals |
2,956 | 3,308 | (352 | ) | (11 | %) | ||||||||||
| Building |
3,094 | 3,204 | (110 | ) | (3 | %) | ||||||||||
| Supplies |
1,451 | 1,778 | (327 | ) | (18 | %) | ||||||||||
| Depreciation and amortization |
2,023 | 1,896 | 127 | 7 | % | |||||||||||
| D&O and liability insurance |
1,613 | 1,812 | (199 | ) | (11 | %) | ||||||||||
| Other |
2,360 | 1,627 | 733 | 45 | % | |||||||||||
|
|
|
|
|
|
|
|||||||||||
| Total sales, general and administrative expenses. |
$ | 39,022 | $ | 43,479 | $ | (4,457 | ) | (10 | %) | |||||||
|
|
|
|
|
|
|
|||||||||||
| Sales, general, and administrative as a percentage of sales |
45 | % | 42 | % | ||||||||||||
Sales, general and administrative expenses were $39.0 million and $43.5 million for the years ended December 31, 2010 and 2009, respectively, a decrease of $4.5 million or 10%. As a percentage of total net sales, sales, general and administrative expenses increased to 45% in 2010 compared to 42% in 2009, a function of reduced leverage resulting from a 17% decrease in sales. The overall decrease in 2010 compared to 2009 is attributable to a number of cost control measures undertaken during the year, which resulted in a $1.0 million decrease in consulting and lobbying primarily related to strategic marketing and IT efforts incurred in the prior year; a $0.9 million decrease in legal, professional and accounting fees driven by the timing of outstanding litigation in progress and efforts to efficiently manage outside legal costs; and general reductions in discretionary spending in sales and marketing, including advertising and tradeshows, and travel as we increased our focus on controlling costs. Salaries, benefits and bonus were also decreased due to the impact of headcount reductions. These decreases in sales, general and administrative expenses were partially offset by a charge of $1.0 million relating to a litigation settlement for an officer injury during arrest claim, included in other expense, and $0.5 million of employee severance costs, included in salaries, benefits and bonuses, as we took measures to reduce our salaried headcount and fixed cost infrastructure. Other expense in 2009 included a $0.4 million settlement payment paid to a former board member as described in Note 12 to the accompanying consolidated financial statements in Part II, Item 8 of this Annual Report on Form 10-K under the heading “Settlement Agreement”.
Research and Development Expenses
Research and development expenses were $10.0 million and $11.4 million for the years ended December 31, 2011 and 2010, respectively, a decrease of $1.4 million or 12%. The reduction for 2011 compared to 2010 is driven by the impact of cost-reduction measures including continued reductions in consulting costs, headcount reductions and associated severance expenses incurred in the prior year. Additionally, the launch of EVIDENCE.COM resulted in the Company including $4.8 million of expenses in cost of products sold for ongoing delivery and maintenance of the product, compared to $3.1 million in 2010, following the service launch in the second quarter of 2010. Prior to the launch of EVIDENCE.COM, the cost of service delivered expenses were included in research and development.
Research and development expenses were $11.4 million and $20.0 million for the years ended December 31, 2010 and 2009, respectively, a decrease of $8.6 million or 43%. The decrease is a combination of a $4.9 million reduction in indirect supplies and tooling attributable to the intensive hardware development for the TASER X3 and AXON conducted in 2009, which were needed in order to expedite development for product demonstrations at the TASER Conference and the IACP trade shows. $3.1 million of EVIDENCE.COM data center and software maintenance related costs, including salary related costs, consulting, equipment leasing, rent and other overheads, were included in cost of products sold in 2010 following the commercial availability of the platform. These costs were included in research and development in 2009 while the platform was in the development phase. Salary and stock-based compensation expense have also generally been reduced following headcount reductions and cancellation and forfeiture of performance-related stock options while consulting and travel expenses have decreased in line with cost containment efforts. Partially offsetting these reductions, capitalized internal salary and consulting costs for EVIDENCE.COM development decreased by $1.0 million, from $2.3 million in 2009 to $1.3 million in 2010, following the go-live of the service in 2010.
34
Litigation Judgment Expense
Litigation judgment expense for 2011 represents a $3.3 million charge for an adverse jury verdict received in the Turner case and costs associated with post-trial motions. This charge represents management’s best estimate of the Company’s uninsured portion of the judgment after consideration of available insurance coverage. The range of loss in the Turner case is $0 to $3.8 million. The court has not yet entered an order of judgment and based on the court excluding and failing to instruct the jury to consider significant evidence that the Company believes demonstrates contributory negligence on the part of the plaintiff, the Company has moved for judgment in its favor notwithstanding the verdict, and will pursue all appropriate legal channels including filing an appeal in this matter at the appropriate time should an adverse judgment be subsequently entered.
Loss on Impairment
Loss on impairment for 2011 represents a $1.4 million asset impairment charge that was recorded in the second quarter of 2011 following our determination to abandon our Protector product line.
Loss on write down / disposal of property and equipment, net
Loss on write-down / disposal of property and equipment for 2011 was $2.8 million and consisted of $2.2 million related to the Video segment comprised of the following: (i) $1.4 million for tooling relative to the first generation AXON equipment; (ii) $0.8 million relative to the decision to dispose of surplus equipment and billing software for EVIDENCE.COM operations. The remaining $0.6 million related to tooling for the TASER X3, which is included in the ECD segment.
Interest and Other Income, Net
Interest and other income was $1.3 million and less than $0.1 million for the years ended December 31, 2011 and 2010, respectively. Other income for 2011 primarily consists of proceeds from a settlement agreement reached in our lawsuit against various brokerage firms involving the naked shorting of the Company’s stock.
Interest and other income in both 2010 and 2009 were minimal due to the significant reduction in available investment yields on our cash and investments.
Provision (Benefit) for Income Taxes
The benefit for income taxes was $2.6 million and $0.7 million for the years ended December 31, 2011 and 2010, respectively. The effective income tax rate for 2011 was 26.9% compared to 14.3% for 2010. The 2011 effective tax rate is driven by the established valuation allowance of $1.4 million for a portion of the Arizona R&D tax credit that management believes will not be realized before it fully expires in fifteen years as well as the impact of non-deductible expenses for items such as incentive stock option expense, meals and entertainment and lobbying expenses, making the income for tax purposes higher than the book pre-tax loss for 2011. Further, in 2011 we recorded a tax benefit related to a 2010 tax return to provision true-up adjustment, primarily driven by higher than expected research and development tax credits, which increased the total tax benefit and consequently the effective tax rate.
The 2010 effective tax rate of 14.3% is below the statutory rate primarily due to the impact of non-deductible expenses for items such as ISO stock option expense, meals and entertainment, and lobbying fees, which make our net loss for tax purposes significantly lower than our book pre-tax loss. Additionally, in 2010, we recorded a tax provision amount related to a 2009 tax return to provision adjustment, primarily driven by lower than expected research and development tax credits, which also reduced the net tax benefit and therefore, the effective tax rate.
The 2009 effective tax rate of 101% is higher than the statutory rate and is driven by the impact of non-deductible expenses for items such as ISO stock option expense, meals and entertainment and lobbying expenses, making the income for tax purposes higher than book pre-tax income. Additionally, we recorded a 2009 tax expense as a result of increasing our reserve for uncertain tax positions.
35
Net Loss
Our net loss increased by $2.6 million to $7.0 million for 2011 compared to $4.4 million for 2010. Net loss per basic and diluted share was $0.12 for 2011 compared to $0.07 for 2010. The increase in our net loss primarily relates to: (i) litigation judgment expense of $3.3 million; (ii) excess inventory charges of $3.7 million; (iii) loss on write down / disposal of property and equipment, net of $2.8 million; and (iv) loss on impairment of $1.4 million, all of which are described in more detail above. Offsetting these charges were increased net sales of $3.1 million, a decrease in cost of products sold as a percentage of net sales and lower overall sales, general and administrative expenses and research and development expenses.
Our net loss increased to $4.4 million for 2010 compared to a net loss of less than $0.1 million for 2009. Net loss per basic and diluted share was $0.07 for 2010 compared to $0.00 loss per basic and diluted share in 2009.
Liquidity and Capital Resources
Summary
As of December 31, 2011, we had $21.3 million of cash and cash equivalents, a decrease of $21.4 million from the end of 2010, which is primarily a function of net purchases of investments of $5.5 million and $32.5 million used for the buyback of our common stock, partially offset by $17.3 million of cash provided by operations. Our overall net working capital decreased $24.5 million to $45.8 million at December 31, 2011, compared to $70.4 million at December 31, 2010. The decrease in working capital relates primarily to our decreased cash and cash equivalent balances, as discussed above.
Cash Flows
The following table summarizes our cash flows from operating, investing and financing activities for each of the past three years (dollars in thousands):
| Year Ended December 31, | ||||||||||||
| 2011 | 2010 | 2009 | ||||||||||
| Operating activities |
$ | 17,266 | $ | 732 | $ | 10,117 | ||||||
| Investing activities |
(7,598 | ) | (4,472 | ) | (11,679 | ) | ||||||
| Financing activities |
(31,062 | ) | 929 | 187 | ||||||||
|
|
|
|
|
|
|
|||||||
| Decrease in cash and cash equivalents |
$ | (21,394 | ) | $ | (2,811 | ) | $ | (1,375 | ) | |||
|
|
|
|
|
|
|
|||||||
Operating activities
Net cash provided by operating activities was $17.3 million and $0.7 million for the years ended December 31, 2011 and 2010, respectively, an increase of $16.6 million. The increase in cash provided by operating activities for 2011 compared to 2010 primarily relates to our increased net sales, a decrease in cost of products sold as a percentage of net sales and lower overall sales, general and administrative expenses and research and development expenses. Changes in working capital provided $2.9 million in 2011 compared to a net investment in working capital of $7.0 million in 2010. These working capital changes primarily relate to the timing of certain payments at year-end, and a decline in inventory of $1.3 million occurred during 2011.
Net cash provided by operating activities was $0.7 million and $10.1 million for the years ended December 31, 2010 and 2009, respectively, a decrease of $9.4 million. Net cash provided by operating activities in 2010 of $0.7 million was primarily driven by our net loss for the period of $4.4 million adjusted for the add-back of non-cash expenses, including stock-based compensation expense of $3.7 million and depreciation and amortization expense of $7.3 million partially offset by a net reduction in working capital balances. Changes in working capital include a $3.2 million reduction in accounts payable and accrued liabilities due to a reduction in spending; timing of period end check runs and a vendor payment of $1.2 million for the final installment on the cartridge automation equipment; a $4.0 million increase in inventory attributable to our buildup of ECD finished goods for future orders as well as raw materials acquired for production of new products; and a $1.7 million increase in prepaid and other assets from the funding of our annual liability insurance premiums, an increase in training and evaluation equipment assets, and an increase in our income taxes receivable position at December 31, 2010. These net uses of cash were partially offset by a $1.8 million reduction in accounts receivable due to timing of collections and lower fourth quarter sales levels.
36
Net cash provided by operating activities in 2009 of $10.1 million was driven by the net loss for the period adjusted for the add back of non-cash expenses including stock-based compensation expense of $5.0 million; depreciation and amortization expense of $3.6 million partially offset by a $0.6 million net increase in deferred tax assets and provision for unrecognized tax benefits. Changes in working capital include a $1.3 million decrease in accounts receivable, a function of the timing of billing and collections; a $1.0 million decrease in prepaid and other assets due to a difference in the timing of funding of our annual liability insurance premium; a $1.0 million increase in accounts payable and accrued liabilities due to timing of year end check runs and a $2.4 million increase in inventory, primarily driven by raw materials acquired for production of new products.
Investing activities
We used $7.6 million for investing activities in 2011, comprised principally of $5.5 million for the net purchase of short-term investments and $2.1 million for the acquisition of various production and computer equipment and intangible assets, net of proceeds from asset disposals.
We used $4.5 million for investing activities in 2010, comprised principally of $2.2 million for capitalized software development costs related to EVIDENCE.COM and our Protector technology platform and $1.8 million for the acquisition of various production and computer equipment. We also invested $0.5 million in our intangible assets, principally new patent applications.
We used $11.7 million for investing activities in 2009, comprised of $13.7 million in acquisitions of property and equipment related to new automated cartridge production equipment, production equipment for new product lines, computer equipment to establish the first EVIDENCE.COM data center and capitalized software development costs. In addition, we invested $0.5 million in intangible assets, primarily consisting of patent applications. These net uses were partially offset by $2.5 million in net proceeds from short-term investments.
Financing activities
During 2011, net cash used by financing activities was $31.1 million, primarily attributable to the repurchase of $32.5 million of the Company’s common stock, which was purchased for an average of $4.35 per share, offset by $1.4 million of proceeds from the exercise of stock options.
During 2010 and 2009, net cash provided by financing activities was $0.9 million and $0.2 million, respectively, primarily attributable to proceeds from stock options exercised.
Liquidity
Our most significant sources of liquidity continue to be funds generated by operating activities and available cash and cash equivalents. We have no long-term debt and believe our current liquidity, as well as funds generated from our expected results of operations, will be sufficient to finance our operations, research and development efforts and strategic initiatives for 2012. In addition, our renegotiated $10.0 million revolving credit facility is available for additional working capital needs or investment opportunities. The facility matures on June 30, 2013. There can be no assurance, however, that we will continue to generate cash flows at or above current levels or that we will be able to maintain our ability to borrow under our revolving credit facility.
Capital Resources
We have a revolving line of credit with a domestic bank with a total availability of $10.0 million. The line is secured primarily by the Company’s accounts receivable and inventory, and bears interest at varying rates, currently at LIBOR plus 1.5%. The line of credit matures on June 30, 2013, and requires monthly payments of interest only. As of December 31, 2011, there were no borrowings under the line. Our agreement with the bank requires us to comply with certain financial and other covenants including maintenance of minimum tangible net worth and a fixed charge coverage ratio. The ratio of total liabilities to tangible net worth can be no greater than 1:1, and the fixed coverage charge ratio can be no less than 1.25:1, based upon a trailing twelve month period. As of December 31, 2011, the Company’s tangible net worth ratio was 0.28:1. As a result of a $5.7 million charge during the fourth quarter of 2011 for excess inventory ($3.7 million) and tooling related to such inventory ($2.0 million), which is discussed elsewhere herein, the Company’s fixed charge coverage ratio declined to 0.17:1, which resulted in a covenant violation of the line of credit at such time. During March 2012, the Company obtained a waiver of this violation, at which time availability of the $10.0 million revolving line of credit was restored. This waiver also provides relief to effectively exclude the $5.7 million charge discussed above when calculating the fixed charge coverage ratio covenant in the future, as well as waive a separate violation relative to the amount of treasury stock purchased during 2011. Excluding the impact of the $5.7 million charge, the fixed charge coverage ratio was 3.27:1.
37
Based on our strong balance sheet and the fact that we had no outstanding debt at December 31, 2011, we believe financing will be available, both through our existing credit line and possible additional financing. However, there is no assurance that such funding will be available on terms acceptable to us, or at all.
Contractual Obligations
The following table outlines our future contractual financial obligations by period in which payment is expected, as of December 31, 2011 (dollars in thousands):
| Less than | More than | |||||||||||||||||||
| Total | 1 Year | 1 - 3 Years | 4 - 5 Years | 5 Years | ||||||||||||||||
| Non-cancelable operating leases |
$ | 955,410 | $ | 535,809 | $ | 388,775 | $ | 30,826 | $ | — | ||||||||||
| Automation equipment |
95,356 | 95,356 | — | — | — | |||||||||||||||
| Open purchase orders |
7,231,522 | 7,231,522 | — | — | — | |||||||||||||||
|
|
|
|
|
|
|
|
|
|
|
|||||||||||
| Total contractual obligations |
$ | 8,282,288 | $ | 7,862,687 | $ | 388,775 | $ | 30,826 | $ | — | ||||||||||
|
|
|
|
|
|
|
|
|
|
|
|||||||||||
Open purchase orders in the above table primarily represent cancelable purchase orders with key vendors, which are included in this table due to the Company’s strategic relationships with these vendors.
We are subject to U.S. federal income tax as well as income taxes imposed by several states and foreign jurisdictions. As of December 31, 2011, we had $2.0 million of gross unrecognized tax benefits related to uncertain tax positions. The settlement period for our long-term income tax liabilities cannot be determined; however, the liabilities are not expected to become due within the next 12 months.
Off Balance Sheet Arrangements
We have no off balance sheet arrangements as of December 31, 2011.
Critical Accounting Estimates
We have identified the following accounting estimates as critical to our business operations and the understanding of our results of operations. The preparation of this annual report on Form 10-K requires us to make estimates and assumptions that affect the reported amount of assets and liabilities, disclosure of contingent assets and liabilities at the date of our consolidated financial statements, and the reported amounts of revenue and expenses during the reporting period. While we don’t believe that a change in these estimates is reasonably likely, there can be no assurance that our actual results will not differ from these estimates. The effect of these policies on our business operations is discussed below.
Standard Product Warranty Reserves
We warrant our law enforcement ECDs from manufacturing defects on a limited basis for a period of one year after purchase and thereafter will replace any defective TASER unit for a fee. The AXON Tactical Computer, the Com Hub user interface, Synapse Evidence Transfer Manager (ETM), and Headcam are warranted for one year and the TASER C2 is warranted for a period of 90 days after purchase. We track historical data related to returns and warranty costs on a quarterly basis and estimate future warranty claims based upon our historical experience. We have also historically increased our reserve amount if we become aware of a component failure that could result in larger than anticipated returns from our customers. As of December 31, 2011, our reserve for warranty returns was $0.4 million compared to a $0.6 million reserve at December 31, 2010. The reduction is substantially driven by a reduction in product returns, which we believe reflects various quality initiatives implemented in our manufacturing process as well as the utilization of specifically identified reserves during 2011. In the event that actual warranty returns differ from these estimates, changes to warranty reserves may be necessary.
38
Inventory
Inventories are stated at the lower of cost or market, with cost determined using the weighted average cost of raw materials, which approximates the first-in, first-out (FIFO) method, and an allocation of manufacturing labor and overhead costs. The allocation of manufacturing labor and overhead costs includes management’s judgments of what constitutes normal capacity of our production facilities and a determination of what costs are considered to be abnormal fixed production costs, which are expensed as current period charges. Provisions are made to reduce potentially excess, obsolete or slow-moving inventories to their net realizable value. These provisions are based on our best estimates after considering historical demand, projected future demand, inventory purchase commitments, industry and market trends and conditions and other factors. Our reserve for excess and obsolete inventory increased to $4.4 million at December 31, 2011, compared to $0.4 million at December 31, 2010. The increase is primarily attributable to excess inventory reserves on the Company’s TASER X3 ECD and first generation AXON product lines, which are described further above. In the event that actual excess, obsolete or slow-moving inventories differ from these estimates, changes to inventory reserves may be necessary.
Accounts Receivable
Sales are typically made on credit and we generally do not require collateral. We perform ongoing credit evaluations of our customers’ financial condition and maintain an allowance for estimated potential losses. Uncollectible accounts are written off when deemed uncollectible, and accounts receivable are presented net of an allowance for doubtful accounts. This allowance represents our best estimate and is based on our judgment after considering a number of factors including third-party credit reports, actual payment history, customer-specific financial information and broader market and economic trends and conditions. Our allowance for doubtful accounts was $0.5 million at December 31, 2011 and $0.2 million at December 31, 2010. In the event that actual uncollectible amounts differ from these estimates, changes in allowances for doubtful accounts may be necessary.
Valuation of Long-lived Assets
We review long-lived assets, such as property and equipment and intangible assets subject to amortization, whenever events or changes in circumstances indicate that the carrying amount of such assets may not be recoverable. We utilize a two-step approach to testing long-lived assets for impairment. The first step tests for possible impairment indicators. If an impairment indicator is present, the second step measures whether the asset is recoverable based on a comparison of the carrying amount of the asset to the estimated undiscounted future cash flows expected to be generated by the asset. If the carrying amount of an asset exceeds its estimated future cash flows, an impairment charge is recognized by the amount by which the carrying amount of the asset exceeds the fair value of the asset. Our review requires the use of judgment and estimates. Other than the impairment charge discussed above, management believes no other impairments have occurred to date. However, future events or circumstances may result in a charge to earnings if we determine that the carrying value of a long-lived asset is not recoverable.
Income Taxes
We recognize federal, state and foreign current tax liabilities or assets based on our estimate of taxes payable or refundable in the current fiscal year by tax jurisdiction. We also recognize federal, state and foreign deferred tax assets or liabilities, as appropriate, for our estimate of future tax effects attributable to temporary differences and carry forwards.
We recognize the tax benefit from an uncertain tax position only if it is more likely than not that the tax position will be sustained on examination by the taxing authorities, based on the technical merits of the position. The tax benefits recognized in the consolidated financial statements from such positions are measured based on the largest benefit that has a greater than fifty percent likelihood of being realized upon ultimate resolution. Management must also assess whether uncertain tax positions as filed could result in the recognition of a liability for possible interest and penalties if any. We have completed research and development tax credit studies which identified approximately $6.8 million in tax credits for Federal, Arizona and California income tax purposes related to the 2003 through 2011 tax years, net of the federal benefit on the Arizona and California research and development tax credits. Management made the determination that it was more likely than not that the full benefit of the research and development tax credit would not be sustained on examination and accordingly, has established a liability for unrecognized tax benefits of $1.9 million as of December 31, 2011. Also included as part of the $2.0 million total liability for unrecognized tax benefits is a management estimate of $106,000 related to uncertain tax positions for certain state income tax liabilities. As of December 31, 2011, management does not expect the amount of the unrecognized tax benefit liability to increase or decrease significantly within the next 12 months. Should the unrecognized tax benefit of $2.0 million be recognized, the Company’s effective tax rate would be favorably impacted. Our estimates are based on the information available to us at the time we prepare the income tax provisions. Our income tax returns are subject to audit by federal, state, and local governments, generally years after the returns are filed. These returns could be subject to material adjustments or differing interpretations of the tax laws.
39
Our calculation of current and deferred tax assets and liabilities is based on certain estimates and judgments and involves dealing with uncertainties in the application of complex tax laws. Our estimates of current and deferred tax assets and liabilities may change based, in part, on added certainty or finality to an anticipated outcome, changes in accounting or tax laws in the United States and overseas, or changes in other facts or circumstances. In addition, we recognize liabilities for potential United States tax contingencies based on our estimate of whether, and the extent to which, additional taxes may be due. If we determine that payment of these amounts is unnecessary, or if the recorded tax liability is less than our current assessment, we may be required to recognize an income tax benefit, or additional income tax expense, respectively, in our consolidated financial statements.
In preparing the Company’s consolidated financial statements, management assesses the likelihood that its deferred tax assets will be realized from future taxable income. In evaluating the Company’s ability to recover its deferred income tax assets, management considers all available positive and negative evidence, including its operating results, ongoing tax planning and forecasts of future taxable income on a jurisdiction by jurisdiction basis. A valuation allowance is established if it is determined that it is more likely than not that some portion or all of the net deferred tax assets will not be realized. Management exercises significant judgment in determining its provisions for income taxes, its deferred tax assets and liabilities and its future taxable income for purposes of assessing its ability to utilize any future tax benefit from its deferred tax assets.
Management believes that as of December 31, 2011, based on evaluation and projections of future sales and profitability, a valuation allowance of $1.4 million was necessary for the Arizona R&D credit carry forward as management concluded that it is not more likely than not that all of the R&D credit carry forward amount will be realized before it fully expires in 15 years. The deferred tax asset could be further reduced or the valuation allowance could be changed in the near-term if estimates of future taxable income during the carry forward period change.
Stock-Based Compensation
We estimate the fair value of our stock-based compensation by using the Black-Scholes-Merton option pricing model, which requires the input of highly subjective assumptions. These assumptions include estimating the length of time employees will retain their stock options before exercising them (expected term), the estimated volatility of our common stock price over the expected term and the number of options that will ultimately not vest (forfeitures). We have granted a combined total of 950,800 performance-based stock options, the vesting of which is contingent upon the achievement of certain performance criteria including the successful development and market acceptance of future product introductions as well as our future sales targets and operating performance. These options will vest and compensation expense will be recognized based on management’s best estimate of the probability of the performance criteria being satisfied using the most currently available projections of future product adoption and operating performance, adjusted at each balance sheet date. Changes in the subjective and probability-based assumptions can materially affect the estimate of fair value of stock-based compensation and consequently, the related amount recognized on our statements of operations. Refer to Note 1 (q) to our consolidated financial statements included elsewhere in this annual report on Form 10-K for further discussion of our valuation assumptions.
Contingencies
We are subject to the possibility of various loss contingencies including product-related litigation, arising in the ordinary course of business. We consider the likelihood of loss or impairment of an asset or the incurrence of a liability, as well as our ability to reasonably estimate the amount of loss in determining loss contingencies. An estimated loss contingency is accrued when it is probable that an asset has been impaired or a liability has been incurred and the amount of loss can be reasonably estimated. We regularly evaluate current information available to us to determine whether such accruals should be adjusted and whether new accruals are required.
40
| Item 7A. | Quantitative and Qualitative Disclosures About Market Risk |
Interest Rate Risk
We invest in a limited number of financial instruments, consisting principally of investments in money market accounts and high credit quality debt securities, denominated in United States dollars. All of our cash equivalents and investments are treated as “held-to-maturity”. Investments in fixed-rate interest-earning instruments carry a degree of interest rate risk as their market value may be adversely impacted due to a rise in interest rates. As a result, we may suffer losses in principal if we sell securities that have declined in market value due to changes in interest rates. However, because we classify our debt securities as “held-to-maturity,” no gains or losses are recognized due to changes in interest rates. These securities are reported at amortized cost, which approximates fair value. As of December 31, 2011, we estimate that a ten basis point increase or decrease in interest rates would result in a change in the fair market value of these instruments of less than $0.1 million and would result in a change in annual interest income of less than $0.1 million.
Additionally, we have access to a line of credit borrowing facility which bears interest at varying rates, currently at LIBOR plus 1.5%. At December 31, 2011, there was no amount outstanding under the line of credit and the available borrowing under the line of credit was $10 million. We have not borrowed any funds under the line of credit since its inception; however; should we need to do so in the future, such borrowings could be subject to adverse or favorable changes in the underlying interest rate.
Exchange Rate Risk
Our results of operations and cash flows are subject to fluctuations due to changes in foreign currency exchange rates, particularly changes in the Euro related to transactions performed by TASER Europe. To date, we have not engaged in any currency hedging activities, although we may do so in the future. Fluctuations in currency exchange rates could harm our business in the future.
The majority of our sales to international customers is transacted in United States dollars and therefore, is not subject to exchange rate fluctuations. However, the cost of our products to our customers increases when the U.S. dollar strengthens against their local currency. In this difficult economy this risk of loss becomes a potential credit-risk for non-payment.
41
| Item 8. | Financial Statements and Supplementary Data |
TASER INTERNATIONAL, INC.
CONSOLIDATED BALANCE SHEETS
December 31,
| 2011 | 2010 | |||||||
| ASSETS | ||||||||
| Current assets: |
||||||||
| Cash and cash equivalents |
$ | 21,300,733 | $ | 42,684,241 | ||||
| Short-term investments |
5,108,189 | — | ||||||
| Accounts receivable, net of allowance of $450,000 and $200,000 as of December 31, 2011 and 2010, respectively |
11,780,135 | 13,542,535 | ||||||
| Inventory |
11,484,761 | 17,815,405 | ||||||
| Prepaid expenses and other current assets |
2,089,676 | 1,999,525 | ||||||
| Deferred income tax assets, net |
9,968,929 | 6,284,489 | ||||||
|
|
|
|
|
|||||
| Total current assets |
61,732,423 | 82,326,195 | ||||||
| Property and equipment, net |
26,845,220 | 35,905,765 | ||||||
| Deferred income tax assets, net |
12,716,169 | 13,919,753 | ||||||
| Intangible assets, net |
3,224,006 | 3,090,876 | ||||||
| Other assets |
444,933 | 944,346 | ||||||
|
|
|
|
|
|||||
| Total assets |
$ | 104,962,751 | $ | 136,186,935 | ||||
|
|
|
|
|
|||||
| LIABILITIES AND STOCKHOLDERS’ EQUITY | ||||||||
| Current liabilities: |
||||||||
| Accounts payable |
$ | 4,513,938 | $ | 4,550,789 | ||||
| Accrued liabilities |
7,643,004 | 3,759,800 | ||||||
| Current portion of deferred revenue |
3,317,641 | 3,265,260 | ||||||
| Customer deposits |
413,314 | 372,145 | ||||||
|
|
|
|
|
|||||
| Total current liabilities |
15,887,897 | 11,947,994 | ||||||
| Deferred revenue, net of current portion |
4,636,901 | 4,392,860 | ||||||
| Liability for unrecognized tax benefits |
1,982,399 | 2,281,840 | ||||||
|
|
|
|
|
|||||
| Total liabilities |
22,507,197 | 18,622,694 | ||||||
|
|
|
|
|
|||||
| Commitments and contingencies |
||||||||
| Stockholders’ equity: |
||||||||
| Preferred stock, $0.00001 par value; 25,000,000 shares authorized; no shares issued and outstanding as of December 31, 2011 and 2010 |
— | — | ||||||
| Common stock, $0.00001 par value; 200,000,000 shares authorized; 55,696,608 and 62,621,268 shares issued and outstanding as of December 31, 2011 and 2010, respectively |
652 | 647 | ||||||
| Additional paid-in capital |
101,597,626 | 97,122,085 | ||||||
| Treasury stock at cost, 9,556,183 and 2,091,600 shares as of December 31, 2011 and 2010, respectively |
(47,207,093 | ) | (14,708,237 | ) | ||||
| Retained earnings |
28,145,325 | 35,185,191 | ||||||
| Accumulated other comprehensive loss |
(80,956 | ) | (35,445 | ) | ||||
|
|
|
|
|
|||||
| Total stockholders’ equity |
82,455,554 | 117,564,241 | ||||||
|
|
|
|
|
|||||
| Total liabilities and stockholders’ equity |
$ | 104,962,751 | $ | 136,186,935 | ||||
|
|
|
|
|
|||||
The accompanying notes are an integral part of these consolidated financial statements.
42
TASER INTERNATIONAL, INC.
CONSOLIDATED STATEMENTS OF OPERATIONS AND COMPREHENSIVE INCOME (LOSS)
For the Years Ended December 31,
| 2011 | 2010 | 2009 | ||||||||||
| Net sales |
$ | 90,027,906 | $ | 86,930,019 | $ | 104,251,560 | ||||||
| Cost of products sold |
41,752,520 | 41,563,144 | 40,849,151 | |||||||||
| Excess inventory charges |
3,746,149 | — | — | |||||||||
|
|
|
|
|
|
|
|||||||
| Gross margin |
44,529,237 | 45,366,875 | 63,402,409 | |||||||||
|
|
|
|
|
|
|
|||||||
| Operating expenses: |
||||||||||||
| Sales, general and administrative |
38,000,455 | 39,021,564 | 43,479,232 | |||||||||
| Research and development |
9,989,219 | 11,411,889 | 20,002,351 | |||||||||
| Litigation judgment |
3,301,243 | — | — | |||||||||
| Loss on impairment |
1,353,857 | — | — | |||||||||
| Loss on write down / disposal of property and equipment, net |
2,800,396 | 73,061 | — | |||||||||
|
|
|
|
|
|
|
|||||||
| Total operating expenses |
55,445,170 | 50,506,514 | 63,481,583 | |||||||||
|
|
|
|
|
|
|
|||||||
| Loss from operations |
(10,915,933 | ) | (5,139,639 | ) | (79,174 | ) | ||||||
| Interest and other income, net |
1,287,192 | 25,819 | 170,547 | |||||||||
|
|
|
|
|
|
|
|||||||
| (Loss) income before (benefit) provision for income taxes |
(9,628,741 | ) | (5,113,820 | ) | 91,373 | |||||||
| (Benefit) provision for income taxes |
(2,588,875 | ) | (729,385 | ) | 92,479 | |||||||
|
|
|
|
|
|
|
|||||||
| Net loss |
$ | (7,039,866 | ) | $ | (4,384,435 | ) | $ | (1,106 | ) | |||
|
|
|
|
|
|
|
|||||||
| Net loss per common and common equivalent shares: |
||||||||||||
| Basic |
$ | (0.12 | ) | $ | (0.07 | ) | $ | (0.00 | ) | |||
| Diluted |
$ | (0.12 | ) | $ | (0.07 | ) | $ | (0.00 | ) | |||
| Weighted average number of common and common equivalent shares outstanding: |
||||||||||||
| Basic |
59,435,624 | 62,524,446 | 61,920,094 | |||||||||
| Diluted |
59,435,624 | 62,524,446 | 61,920,094 | |||||||||
| CONSOLIDATED STATEMENTS OF COMPREHENSIVE INCOME (LOSS) | ||||||||||||
| Net loss |
$ | (7,039,866 | ) | $ | (4,384,435 | ) | $ | (1,106 | ) | |||
| Foreign currency translation adjustments |
(45,511 | ) | (35,445 | ) | — | |||||||
|
|
|
|
|
|
|
|||||||
| Comprehensive loss |
$ | (7,085,377 | ) | $ | (4,419,880 | ) | $ | (1,106 | ) | |||
|
|
|
|
|
|
|
|||||||
The accompanying notes are an integral part of these consolidated financial statements.
43
TASER INTERNATIONAL, INC.
CONSOLIDATED STATEMENTS OF STOCKHOLDERS’ EQUITY
For the Years Ended December 31, 2011, 2010 AND 2009
| Accumulated | ||||||||||||||||||||||||||||||||
| Additional | Other | Total | ||||||||||||||||||||||||||||||
| Common Stock | Paid-in | Treasury Stock | Comprehensive | Retained | Stockholders’ | |||||||||||||||||||||||||||
| Shares | Amount | Capital | Shares | Amount | Loss | Earnings | Equity | |||||||||||||||||||||||||
| Balance, December 31, 2008 |
61,795,712 | $ | 638 | $ | 87,663,129 | 2,091,600 | $ | (14,708,237 | ) | — | $ | 39,570,732 | $ | 112,526,262 | ||||||||||||||||||
| Exercise of stock options |
323,351 | 4 | 155,540 | — | — | — | — | 155,544 | ||||||||||||||||||||||||
| Stock-based compensation |
— | — | 4,988,837 | — | — | — | — | 4,988,837 | ||||||||||||||||||||||||
| Tax benefit of stock options exercised |
— | — | 31,659 | — | — | — | — | 31,659 | ||||||||||||||||||||||||
| Net loss |
— | — | — | — | — | — | (1,106 | ) | (1,106 | ) | ||||||||||||||||||||||
|
|
|
|
|
|
|
|
|
|
|
|
|
|
|
|
|
|||||||||||||||||
| Balance, December 31, 2009 |
62,119,063 | 642 | 92,839,165 | 2,091,600 | (14,708,237 | ) | — | 39,569,626 | 117,701,196 | |||||||||||||||||||||||
| Exercise of stock options |
502,205 | 5 | 1,001,471 | — | — | — | — | 1,001,476 | ||||||||||||||||||||||||
| Stock-based compensation |
— | — | 3,682,675 | — | — | — | — | 3,682,675 | ||||||||||||||||||||||||
| Tax benefit of stock options exercised |
— | — | 52,147 | — | — | — | — | 52,147 | ||||||||||||||||||||||||
| Reversal of tax benefit from stock options forfeited |
— | — | (329,143 | ) | — | — | — | — | (329,143 | ) | ||||||||||||||||||||||
| Stock option buyback |
— | — | (124,230 | ) | — | — | — | — | (124,230 | ) | ||||||||||||||||||||||
| Net loss |
— | — | — | — | — | — | (4,384,435 | ) | (4,384,435 | ) | ||||||||||||||||||||||
| Foreign currency translation adjustments |
— | — | — | — | — | (35,445 | ) | — | (35,445 | ) | ||||||||||||||||||||||
|
|
|
|
|
|
|
|
|
|
|
|
|
|
|
|
|
|||||||||||||||||
| Balance, December 31, 2010 |
62,621,268 | 647 | 97,122,085 | 2,091,600 | (14,708,237 | ) | (35,445 | ) | 35,185,191 | 117,564,241 | ||||||||||||||||||||||
| Exercise of stock options |
539,923 | 5 | 1,427,413 | — | — | — | — | 1,427,418 | ||||||||||||||||||||||||
| Stock-based compensation |
— | — | 3,038,300 | — | — | — | — | 3,038,300 | ||||||||||||||||||||||||
| Tax benefit of stock options exercised |
— | — | 9,828 | — | — | — | — | 9,828 | ||||||||||||||||||||||||
| Purchase of treasury stock |
(7,464,583 | ) | — | — | 7,464,583 | (32,498,856 | ) | — | — | (32,498,856 | ) | |||||||||||||||||||||
| Net loss |
— | — | — | — | — | — | (7,039,866 | ) | (7,039,866 | ) | ||||||||||||||||||||||
| Foreign currency translation adjustments |
— | — | — | — | — | (45,511 | ) | — | (45,511 | ) | ||||||||||||||||||||||
|
|
|
|
|
|
|
|
|
|
|
|
|
|
|
|
|
|||||||||||||||||
| Balance, December 31, 2011 |
55,696,608 | $ | 652 | $ | 101,597,626 | 9,556,183 | $ | (47,207,093 | ) | $ | (80,956 | ) | $ | 28,145,325 | $ | 82,455,554 | ||||||||||||||||
|
|
|
|
|
|
|
|
|
|
|
|
|
|
|
|
|
|||||||||||||||||
The accompanying notes are an integral part of these consolidated financial statements.
44
TASER INTERNATIONAL, INC.
CONSOLIDATED STATEMENTS OF CASH FLOWS
For the Years Ended December 31,
| 2011 | 2010 | 2009 | ||||||||||
| Cash flows from operating activities: |
||||||||||||
| Net loss |
$ | (7,039,866 | ) | $ | (4,384,435 | ) | $ | (1,106 | ) | |||
| Adjustments to reconcile net loss to net cash provided by operating activities: |
||||||||||||
| Depreciation and amortization |
8,096,543 | 7,286,915 | 3,634,412 | |||||||||
| Loss on impairment |
1,353,857 | — | — | |||||||||
| Loss on write-down / disposal of property and equipment, net |
2,800,396 | 73,061 | — | |||||||||
| Loss on disposal of intangibles |
54,356 | 47,947 | 66,828 | |||||||||
| Bond premium amortization |
371,304 | — | — | |||||||||
| Provision for doubtful accounts |
296,016 | 48,903 | 82,251 | |||||||||
| Provision for excess and obsolete inventory |
4,610,197 | 1,278,284 | 821,983 | |||||||||
| Provision for warranty |
309,779 | 843,268 | 92,278 | |||||||||
| Stock-based compensation expense |
3,038,300 | 3,682,675 | 4,988,837 | |||||||||
| Litigation judgment accrual |
3,301,243 | — | — | |||||||||
| Deferred income taxes |
(2,480,856 | ) | (1,088,377 | ) | (1,188,157 | ) | ||||||
| Provision for unrecognized tax benefits |
(299,441 | ) | 17,061 | 572,699 | ||||||||
| Tax benefit from stock-based compensation |
(9,828 | ) | (52,147 | ) | (31,659 | ) | ||||||
| Change in assets and liabilities: |
||||||||||||
| Accounts receivable |
1,463,031 | 1,768,134 | 1,326,309 | |||||||||
| Inventory |
1,327,801 | (4,007,939 | ) | (2,440,616 | ) | |||||||
| Prepaid expenses and other assets |
(373,709 | ) | (1,715,403 | ) | 976,156 | |||||||
| Accounts payable and accrued liabilities |
109,051 | (3,246,517 | ) | 1,031,196 | ||||||||
| Deferred revenue |
296,422 | 163,876 | 142,634 | |||||||||
| Customer deposits |
41,169 | 16,219 | 43,240 | |||||||||
|
|
|
|
|
|
|
|||||||
| Net cash provided by operating activities |
17,265,765 | 731,525 | 10,117,286 | |||||||||
|
|
|
|
|
|
|
|||||||
| Cash flows from investing activities: |
||||||||||||
| Purchases of investments |
(11,479,493 | ) | — | — | ||||||||
| Proceeds from call / maturity of investments |
6,000,000 | — | 2,500,000 | |||||||||
| Purchases of property and equipment |
(1,854,083 | ) | (4,023,691 | ) | (13,708,177 | ) | ||||||
| Proceeds from disposal of fixed assets |
149,400 | 30,972 | — | |||||||||
| Purchases of intangible assets |
(413,466 | ) | (478,983 | ) | (471,698 | ) | ||||||
|
|
|
|
|
|
|
|||||||
| Net cash used in investing activities |
(7,597,642 | ) | (4,471,702 | ) | (11,679,875 | ) | ||||||
|
|
|
|
|
|
|
|||||||
| Cash flows from financing activities: |
||||||||||||
| Repurchase of common stock |
(32,498,856 | ) | — | — | ||||||||
| Repurchase of stock options |
— | (124,230 | ) | — | ||||||||
| Proceeds from options exercised |
1,427,418 | 1,001,476 | 155,544 | |||||||||
| Excess tax benefit from stock-based compensation |
9,828 | 52,147 | 31,659 | |||||||||
|
|
|
|
|
|
|
|||||||
| Net cash (used in) provided by financing activities |
(31,061,610 | ) | 929,393 | 187,203 | ||||||||
|
|
|
|
|
|
|
|||||||
| Effect of exchange rate changes on cash and cash equivalents |
9,979 | (10,024 | ) | — | ||||||||
| Net decrease in cash and cash equivalents |
(21,383,508 | ) | (2,820,808 | ) | (1,375,386 | ) | ||||||
| Cash and cash equivalents, beginning of year |
42,684,241 | 45,505,049 | 46,880,435 | |||||||||
|
|
|
|
|
|
|
|||||||
| Cash and cash equivalents, end of year |
$ | 21,300,733 | $ | 42,684,241 | $ | 45,505,049 | ||||||
|
|
|
|
|
|
|
|||||||
The accompanying notes are an integral part of these consolidated financial statements.
45
TASER INTERNATIONAL, INC.
NOTES TO CONSOLIDATED FINANCIAL STATEMENTS
1. Organization and Summary of Significant Accounting Policies
TASER International, Inc. (“TASER” or the “Company”) is a developer and manufacturer of advanced electronic control devices (“ECDs”) designed for use in law enforcement, military, corrections, private security and personal defense. In addition, the Company has developed full technology solutions for the capture, storage and management of video/audio evidence as well as other tactical capabilities for use in law enforcement. The Company sells its products worldwide through its direct sales force, distribution partners, online store and third-party resellers. The Company was incorporated in Arizona in September 1993, and reincorporated in Delaware in January 2001. The Company’s corporate headquarters and manufacturing facilities are located in Scottsdale, Arizona. The Company’s internet services and software development division facilities are located in Carpenteria, California.
The accompanying consolidated financial statements include the accounts of the Company, and its wholly owned subsidiary, TASER International Europe SE (“TASER Europe”). TASER Europe was established in 2009 to facilitate sales and provide customer service to certain customers in the European region. All material intercompany accounts, transactions, and profits have been eliminated.
a. Basis of Presentation and Use of Estimates
The accompanying consolidated financial statements have been prepared in conformity with accounting principles generally accepted in the United States of America (“US GAAP”). The preparation of these consolidated financial statements requires management to make estimates and assumptions that affect the reported amounts of assets and liabilities and disclosure of contingent assets and liabilities at the date of the consolidated financial statements and the reported amounts of revenues and expenses during the reporting period. Significant estimates in these consolidated financial statements include allowances for doubtful accounts receivable, inventory valuation reserves, product warranty reserves, valuations of long-lived assets, deferred income taxes, stock-based compensation, contingencies and accrued litigation expenses. Actual results could differ from those estimates. Certain reclassifications have been made to prior year amounts to conform to current year presentation.
b. Cash, Cash Equivalents and Investments
Cash, cash equivalents and investments include cash, money market funds, certificates of deposit and corporate bonds. The Company places its cash and cash equivalents with high quality financial institutions. Balances with these institutions regularly exceed FDIC insured limits; however, to manage the related credit exposure, the Company continually monitors the credit worthiness of the financial institutions where it has deposits.
c. Inventory
Inventories are stated at the lower of cost or market. Cost is determined using the weighted average cost of raw materials which approximates the first-in, first-out (FIFO) method and includes allocations of manufacturing labor and overhead. Provisions are made to reduce potentially excess, obsolete or slow-moving inventories to their net realizable value. These provisions are based on management’s best estimate after considering historical demand, projected future demand, inventory purchase commitments, industry and market trends and conditions and other factors. Management evaluates inventory costs for abnormal costs due to excess production capacity and treats such costs as period costs.
d. Property and Equipment
Property and equipment are stated at cost, net of accumulated depreciation. Additions and improvements are capitalized, while ordinary maintenance and repair expenditures are charged to expense as incurred. Depreciation is calculated using the straight-line method over the estimated useful lives of the assets.
46
TASER INTERNATIONAL, INC.
NOTES TO CONSOLIDATED FINANCIAL STATEMENTS – (Continued)
e. Capitalized Software Development Costs
For development costs related to EVIDENCE.COM, the Company’s Software-as-a-Service (SaaS) product, the Company capitalized qualifying computer software costs that were incurred during the application development stage. Costs related to preliminary project planning activities and post-implementation activities were expensed as incurred. There were no capitalized software development costs for the year ending December 31, 2011. For the year ending December 31, 2010, capitalized software development costs were $3.7 million. Amortization of capitalized software development costs commenced during the third quarter of 2010 and was $1.3 million and $0.6 million for the years ended December 31, 2011 and 2010, respectively.
For development costs related to the TASER Protector Platform, the Company capitalized a portion of the development costs paid to RouteCloud LLC for development of the Protector Platform technology under the terms of the joint venture agreement. At December 31, 2010, capitalized software development costs were $0.8 million. However, during 2011 the Company recognized an impairment charge of $1.4 million for the Protector product line following the Company’s decision to abandon the development of this product line. The $1.4 million charge includes write-offs of capitalized software development, prepaid royalties and pre-sale inventory.
f. Impairment of Long-Lived Assets
Management evaluates whether events and circumstances have occurred that indicate the remaining estimated useful life of long-lived assets and identifiable intangible assets may warrant revision or that the remaining balance of these assets may not be recoverable. In performing the review for recoverability, management estimates the future undiscounted cash flows expected to result from the use of the assets and their eventual disposition. The amount of the impairment loss, if impairment exists, is calculated based on the excess of the carrying amounts of the assets over their estimated fair value computed using discounted cash flows. As discussed above, during 2011, the Company recognized an impairment charge of $1.4 million relative to its Protector product line following the Company’s decision to abandon ongoing operations for this product line. Further, the Company recognized a charge of $2.8 million during 2011, relative to the write down / disposal of property and equipment. These charges relate to the disposal of surplus equipment for EVIDENCE.COM operations, and impairment of production tooling related to the first generation AXON video product line and the TASER X3 ECD product line. No impairment losses were recorded in 2010 and 2009.
g. Customer Deposits
The Company requires certain deposits in advance of shipment for certain customer sales orders. Customer deposits are recorded as a current liability on the accompanying consolidated balance sheets.
h. Revenue Recognition and Accounts Receivable
The Company recognizes revenues when persuasive evidence of an arrangement exists, delivery has occurred or services have been rendered, title has transferred, the price is fixed and collectability is reasonably assured. Revenue arrangements with multiple deliverables are divided into separate units and revenue is allocated using the relative selling price method based upon vendor-specific objective evidence of selling price or third-party evidence of the selling prices if vendor-specific objective evidence of selling prices does not exist. If neither vendor-specific objective evidence nor third-party evidence exists, management would use its best estimate of selling price.
In most instances, sales of the Company’s products are final and its customers do not have a right to return the product. The Company’s consumer product, the TASER C2, has a 30 day right of return for inactivated units purchased direct from the Company. The historical product return rate is used to determine the return reserve.
In some instances the Company sells the TASER C2 product through certain retailers who do not assume title, risk of loss to the inventory or credit risk. The Company, therefore, recognizes revenue from such retailers on a sell-through method using information provided by the retailer. The revenue and related costs are deferred until the product has been sold by the retailer.
47
TASER INTERNATIONAL, INC.
NOTES TO CONSOLIDATED FINANCIAL STATEMENTS – (Continued)
During 2010, the Company began selling its AXON on-officer video product and EVIDENCE.COM, the Company’s SaaS product. In some instances, AXON equipment is sold separately, but in most instances the AXON equipment and EVIDENCE.COM SaaS are sold together. In these instances, customers typically purchase the equipment and SaaS in advance, with the AXON equipment representing a deliverable that is provided to the customer at the time of sale, and EVIDENCE.COM services provided over a specified service term, which has typically ranged from one to five years. The Company recognizes revenue for the AXON equipment at the time of the sale consistent with the discussion of multiple deliverable arrangements above. Revenue for EVIDENCE.COM service is deferred at the time of the sale and recognized over the service period. At December 31, 2011 and 2010, $0.3 million and $0.1 million were deferred for payments the Company received from customers, which is being recognized over the service term.
The Company offers customers the right to purchase extended warranties that include additional services and coverage beyond the limited warranty on the TASER X26, ADVANCED TASER, X2, X3, AXON, and C2 products. Revenue for extended warranty purchases is deferred at the time of sale and recognized over the warranty period commencing on the date of sale. The extended warranties range from one to four years. At December 31, 2011 and 2010, $7.2 million and $7.5 million was deferred under this program, respectively. The current portion of deferred revenue represents deferred extended warranty revenue that is expected to be recognized in 2012.
With the launch of the TASER X2 ECD, the Company developed a trade-in program for customers, which allows customers to trade-in their ECDs for the new TASER X2. To qualify for the upgrade credit of approximately $300 per unit, the customer must purchase an upgrade kit, which is multi-deliverable in nature because it includes an extended warranty on the TASER X2 ECD. The upgrade credit offered to customers is deferred at the time of sale, and the credit is allocated amongst the deliverables of the program based upon vendor-specific objective evidence of selling prices. The total credits issued under this program are $2.1 million, of which $1.1 million is pending, and offset with accounts receivable at December 31, 2011. The Company had a similar program in 2010 to upgrade existing M26 customers to the X26 or X3, and at December 31, 2010 there was $0.1 million of amounts related to trade-in credits.
Included as a component of revenue, is development funding, provided by the Joint Non-Lethal Weapons Directorate (JNLWD) of the United States Department of Defense under a cost-plus fixed fee contract. Periodically, an invoice summarizing the reimbursable expenses is submitted to JNLWD for payment. The payment request submitted by the Company to the JNLWD details the costs incurred in the period plus a nominal contracted profit margin. The total amount of revenue recognized for this work in the years ended December 31, 2011, 2010 and 2009 was nil, $0.4 million and $1.3 million, respectively.
Certain of the Company’s customers are charged shipping fees, which are recorded as a component of net sales. Sales tax collected on sales is netted against government remittances and thus, recorded on a net basis. Training revenue is recorded as the service is provided.
Sales are typically made on credit and the Company generally does not require collateral. Management performs ongoing credit evaluations of its customers’ financial condition and maintains an allowance for estimated potential losses. Uncollectable accounts are charged to expense when deemed uncollectible, and accounts receivable are presented net of an allowance for doubtful accounts. This allowance represents our best estimate and is based on our judgment after considering a number of factors, including third-party credit reports, actual payment history, cash discounts, customer-specific financial information and broader market and economic trends and conditions.
i. Cost of Products Sold
Cost of products sold represents manufacturing costs, consisting of materials, labor and overhead related to finished goods and components. Shipping costs incurred related to product delivery are also included in cost of products sold. Cost of products sold also includes data center operating and software maintenance costs associated with operation of EVIDENCE.COM.
j. Advertising Costs
The Company expenses advertising costs in the period in which they are incurred, with the exception of commercial advertising production costs which are expensed at the time the first commercial is shown on television. The Company incurred advertising costs of $0.3 million in 2011 and $0.7 million in 2010 and 2009. At December 31, 2011 and 2010, the Company had $18,215 and $25,000 of prepaid advertising costs, respectively. Advertising costs are included in sales, general and administrative expenses in the accompanying statements of operations.
48
TASER INTERNATIONAL, INC.
NOTES TO CONSOLIDATED FINANCIAL STATEMENTS – (Continued)
k. Warranty Costs
The Company warrants its X2 ECDs, X3 ECDs, X26 ECDs, M26 ECDs, XREP, TASER Cam, Shockwave, AXON Tactical Computer, Com Hub user interface, Synapse Evidence Transfer Manager (ETM), and Headcam products from manufacturing defects on a limited basis for a period of one year after purchase, and thereafter will replace any defective unit for a fee. The TASER C2 product is warranted for a period of 90 days after purchase. The Company also sells extended warranties for periods of up to four years after the expiration of the limited one year warranty. After the one year standard warranty expires, if the device fails to operate properly for any reason, the Company will replace the TASER X26 for a prorated discounted price depending on when the product was placed into service. These fees are intended to cover the handling and repair costs and include a profit. Management tracks historical data related to returns and warranty costs on a quarterly basis, and estimates future warranty claims by applying the estimated weighted average return rate to the product sales for the period. If management becomes aware of a component failure that could result in larger than anticipated returns from its customers, the reserve would be increased. The reserve for warranty returns is included in accrued liabilities on the consolidated balance sheet. The following table summarizes the changes in the estimated product warranty liabilities for the years ended December 31, 2011, 2010 and 2009:
| 2011 | 2010 | 2009 | ||||||||||
| Balance, beginning of period |
$ | 646,113 | $ | 369,311 | $ | 615,031 | ||||||
| Utilization of accrual |
(528,433 | ) | (566,466 | ) | (337,998 | ) | ||||||
| Warranty expense |
309,779 | 843,268 | 92,278 | |||||||||
|
|
|
|
|
|
|
|||||||
| Balance, end of period |
$ | 427,459 | $ | 646,113 | $ | 369,311 | ||||||
|
|
|
|
|
|
|
|||||||
l. Research and Development Expenses
The Company expenses research and development costs as incurred. The Company incurred product development expense of $10.0 million, $11.4 million and $20.0 million in 2011, 2010 and 2009, respectively.
m. Income Taxes
Income taxes are accounted for under the asset and liability method. Deferred tax assets and liabilities are recognized for the future tax consequences attributable to differences between the financial statement amounts of assets and liabilities and their respective tax bases and operating loss and tax credit carry forwards. Deferred tax assets and liabilities are measured using enacted tax rates expected to apply to taxable income in future years in which those temporary differences are expected to be recovered or settled. The effect on deferred tax assets and liabilities of a change in tax rate is recognized in income in the period that includes the enactment date. Deferred tax assets are reduced through the establishment of a valuation allowance at the time, based upon available evidence, it becomes more likely than not that the deferred tax assets will not be realized.
The Company recognizes the tax benefit from an uncertain tax position only if it is more likely than not that the tax position will be sustained on examination by the taxing authorities, based on the technical merits of the position. The tax benefits recognized in the consolidated financial statements from such a position are measured based on the largest benefit that has a greater than 50% likelihood of being realized upon ultimate resolution. Management also assesses whether uncertain tax positions, as filed, could result in the recognition of a liability for possible interest and penalties. The Company’s policy is to include interest and penalties related to unrecognized tax benefits as a component of income tax expense. Refer to Note 9 for additional information regarding the change in unrecognized tax benefits.
n. Concentration of Credit Risk and Major Customers / Suppliers
Financial instruments that potentially subject the Company to concentrations of credit risk consist of accounts receivable. Sales are typically made on credit and the Company generally does not require collateral. Management performs ongoing credit evaluations of its customers’ financial condition and maintains an allowance for estimated losses. Uncollectable accounts are written off when deemed uncollectible, and accounts receivable are presented net of an allowance for doubtful accounts, which totaled $0.5 million and $0.2 million as of December 31, 2011 and 2010, respectively. Historically, the Company has experienced a low level of write offs related to doubtful accounts.
49
TASER INTERNATIONAL, INC.
NOTES TO CONSOLIDATED FINANCIAL STATEMENTS – (Continued)
The Company sells its products primarily through a network of unaffiliated distributors. The Company also reserves the right to sell directly to the end user to secure the customer’s account. In 2011, one distributor represented 12.7% of total net sales with no other customers exceeding this threshold. In 2010, no single customer exceeded 10% of total sales. In 2009, one distributor represented 12% of total sales with no other customers exceeding 10% of total sales in 2009.
At December 31, 2011, the Company had accounts receivable from two customers comprising 12.9% and 12.5% of the aggregate accounts receivable balance. At December 31, 2010, the Company had accounts receivable from three customers comprising 19%, 11%, and 10% of the aggregate accounts receivable balance. These customers are unaffiliated distributors of the Company’s products.
The Company currently purchases finished circuit boards and injection-molded plastic components from suppliers located in the United States. Although the Company currently obtains many of these components from single source suppliers, the Company owns the injection molded component tooling used in their production. As a result, management believes it could obtain alternative suppliers in most cases without incurring significant production delays. The Company also purchases small, machined parts from a vendor in Taiwan, custom cartridge assemblies from a proprietary vendor in the United States, and electronic components from a variety of foreign and domestic distributors. Management believes that there are readily available alternative suppliers in most cases who can consistently meet its needs for these components. The Company acquires most of its components on a purchase order basis and does not have long-term contracts with suppliers.
o. Fair Value of Financial Instruments
The Company uses the fair value framework for measuring financial assets and liabilities measured on a recurring basis and for non-financial assets and liabilities when these items are re-measured. Fair value is defined as the price that would be received from the sale of an asset or paid to transfer a liability (an exit price) on the measurement date in an orderly transaction between market participants in the principal or most advantageous market for the asset or liability. The fair value framework specifies a hierarchy of valuation techniques, which is based on whether the inputs into the valuation technique are observable or unobservable. The hierarchy below lists these three levels of fair value based on the extent to which inputs used in measuring fair value are observable in the market. The Company categorizes each of its fair value measurements in one of these three levels based on the lowest level input that is significant to the fair value measurement in its entirety. These levels are:
| • | Level 1 – Valuation techniques in which all significant inputs are unadjusted quoted prices from active markets for assets or liabilities that are identical to the assets or liabilities being measured. |
| • | Level 2 – Valuation techniques in which significant inputs include quoted prices from active markets for assets or liabilities that are similar to the assets or liabilities being measured and/or quoted prices for assets or liabilities that are identical or similar to the assets or liabilities being measured from markets that are not active. Also, model-derived valuations in which all significant inputs and significant value drivers are observable in active markets are Level 2 valuation techniques. |
| • | Level 3 – Valuation techniques in which one or more significant inputs or significant value drivers are unobservable. Unobservable inputs are valuation technique inputs that reflect our own assumptions about the assumptions that market participants would use in pricing an asset or liability. |
The Company has cash equivalents, which at December 31, 2011 and December 31, 2010, was comprised of money market mutual funds. At December 31, 2011, the Company also held short-term investments consisting of commercial paper and a certificate of deposit. Based on management’s ability and intent to hold these investments to maturity, they are recorded at amortized cost on the balance sheet. Refer to note 2 for additional fair value disclosures for these short-term investments. The Company’s financial instruments also include accounts receivable, accounts payable and accrued liabilities. Due to the short-term nature of these instruments, their fair values approximate their carrying values as of December 31, 2011 and 2010.
p. Segment Information
In the fourth quarter of 2011, management of the Company determined its reportable segments are the ECD segment and the Video segment. Reportable segments are determined based on discrete financial information reviewed by the Company’s CODM, which in our case is the CEO. The Company organizes and reviews operations based on products and services, and currently there are no operating segments that are aggregated. The Company performs an annual analysis of its reportable segments. Information related to the Company’s business segments is summarized in Note 15, in addition to the discussion regarding geographic locations.
50
TASER INTERNATIONAL, INC.
NOTES TO CONSOLIDATED FINANCIAL STATEMENTS – (Continued)
| 2011 | 2010 | 2009 | ||||||||||
| United States |
80 | % | 79 | % | 78 | % | ||||||
| Other countries |
20 | % | 21 | % | 22 | % | ||||||
|
|
|
|
|
|
|
|||||||
| Total net sales |
100 | % | 100 | % | 100 | % | ||||||
|
|
|
|
|
|
|
|||||||
Sales to customers outside of the United States are denominated in U.S. dollars and are attributed to each country based on the billing address of the distributor or customer. To date, no individual country outside the United States has represented a material amount of total net sales. Substantially all of the Company’s assets are located in the United States.
q. Stock-Based Compensation
The Company calculates the fair value of stock-based awards using the Black-Scholes-Merton option pricing valuation model, which incorporates various assumptions including volatility, expected life and risk-free interest rates. The assumptions used for the years ended December 31, 2011, 2010 and 2009, and the resulting estimates of weighted-average fair value per share of options granted during those periods, excluding the effects of the exchange program, are as follows:
| 2011 | 2010 | 2009 | ||||||||||
| Weighted average / range of volatility |
56 | % | 61 | % | 70 | % | ||||||
| Risk-free interest rate |
1.6 | % | 2.0 | % | 1.9 | % | ||||||
| Dividend rate |
0.0 | % | 0.0 | % | 0.0 | % | ||||||
| Expected life of options |
4.5 years | 4.5 years | 4.5 years | |||||||||
| Weighted average fair value of options granted |
$ | 2.16 | $ | 2.59 | $ | 2.56 | ||||||
The expected life of the options represents the estimated period of time until exercise and is based on historical experience of similar awards, giving consideration to the contractual terms, vesting schedules and expectations of future employee behavior. Expected stock price volatility is based on a combination of historical volatility of the Company’s stock and the one-year implied volatility of its publicly traded options for the related vesting periods. The risk-free interest rate is based on the implied yield available on United States Treasury zero-coupon issues with an equivalent remaining term. The Company has not paid dividends in the past and does not plan to pay any dividends in the near future. The estimated fair value of stock-based compensation awards and other options is amortized to expense on a straight line basis over the relevant vesting period. As share-based compensation expense recognized is based on awards ultimately expected to vest, it is reduced for estimated forfeitures. Forfeitures are estimated at the time of grant and revised, if necessary, in subsequent periods if actual forfeitures differ from those estimates. The Company’s forfeiture rate was calculated based on its historical experience of awards which ultimately vested. See Note 11 for further discussion of the Company’s stock-based compensation.
51
TASER INTERNATIONAL, INC.
NOTES TO CONSOLIDATED FINANCIAL STATEMENTS – (Continued)
r. Loss per Common Share
Basic loss per share is computed by dividing net loss by the weighted average number of common shares outstanding during the periods presented. Diluted income per share reflects the potential dilution that would occur if outstanding stock options were exercised utilizing the treasury stock method. The calculation of the weighted average number of shares outstanding and earnings per share are as follows:
| For the Year Ended December 31, 2011 | ||||||||||||
| 2011 | 2010 | 2009 | ||||||||||
| Numerator for basic and diluted earnings per share: |
||||||||||||
| Net loss |
$ | (7,039,866 | ) | $ | (4,384,435 | ) | $ | (1,106 | ) | |||
|
|
|
|
|
|
|
|||||||
| Denominator for basic earnings per share: |
||||||||||||
| Weighted average shares outstanding |
59,435,624 | 62,524,446 | 61,920,094 | |||||||||
| Dilutive effect of shares issuable under stock options |
— | — | — | |||||||||
|
|
|
|
|
|
|
|||||||
| Adjusted weighted average shares outstanding |
59,435,624 | 62,524,446 | 61,920,094 | |||||||||
|
|
|
|
|
|
|
|||||||
| Net loss per common share: |
||||||||||||
| Basic |
$ | (0.12 | ) | $ | (0.07 | ) | $ | (0.00 | ) | |||
| Diluted |
(0.12 | ) | (0.07 | ) | (0.00 | ) | ||||||
Basic loss per share is based upon the weighted average number of common shares outstanding during the period. Diluted income per share includes the dilutive effect of potential stock option exercises, calculated using the treasury stock method. As a result of the net loss for the year ended December 31, 2011, 2010 and 2009, 6,972,097, 5,075,621 and 8,056,927 shares of potential dilutive securities were considered anti-dilutive and excluded from the calculation as their effect would have been to reduce the net loss per share.
s. Recently Adopted Accounting Guidance
In October 2009, the Financial Accounting Standards Board (FASB) issued authoritative guidance on revenue recognition that became effective for the Company beginning January 1, 2011. Under the new guidance on arrangements that include software elements, tangible products that have software components that are essential to the functionality of the tangible product will no longer be within the scope of the software revenue recognition guidance, and software-enabled products will now be subject to other relevant revenue recognition guidance. Additionally, the FASB issued authoritative guidance on revenue arrangements with multiple deliverables that are outside the scope of the software revenue recognition guidance. Under the new guidance, when vendor specific objective evidence or third party evidence for deliverables in an arrangement cannot be determined, a best estimate of the selling price is required to separate deliverables and allocate arrangement consideration using the relative selling price method. The new guidance includes new disclosure requirements on how the application of the relative selling price method affects the timing and amount of revenue recognition. The adoption of this new guidance did not have a material impact on the Company’s consolidated financial statements.
In December 2010, the Financial Accounting Standards Board (FASB) issued guidance to improve the disclosures that an entity provides about the credit quality of its financing receivables and the related allowance for credit losses. As a result of these amendments, an entity is required to disaggregate by portfolio segment or class certain existing disclosures and provide certain new disclosures about its financing receivables and related allowance for credit losses. The guidance became effective for the Company effective January 1, 2011, and its adoption did not have a material impact on the Company’s consolidated financial statements.
In May 2011, the Financial Accounting Standards Board (FASB) issued amended standards to achieve a consistent definition of fair value and common requirements for measurement of and disclosure about fair value between U.S. generally accepted accounting principles and International Financial Reporting Standards. For assets and liabilities categorized as Level 3 and recognized at fair value, these amended standards require disclosure of quantitative information about unobservable inputs, a description of the valuation processes used by the entity, and a qualitative discussion about the sensitivity of the measurements. In addition, these amended standards require that we disclose the level in the fair value hierarchy for financial instruments disclosed at fair value but not recorded at fair value. These new standards are effective for fiscal years beginning after December 15, 2011. We do not expect these new standards to significantly impact our consolidated financial statements.
52
TASER INTERNATIONAL, INC.
NOTES TO CONSOLIDATED FINANCIAL STATEMENTS – (Continued)
In June 2011, the Financial Accounting Standards Board (FASB) issued guidance to require presentation of the total of comprehensive income, the components of net income and the components of other comprehensive income (OCI) either in a single continuous statement of comprehensive income or in two separate but consecutive statements. This guidance eliminates the option to present the components of other comprehensive income as part of the statement of changes in stockholders’ equity. Regardless of which format is chosen, the amendments establish a requirement for entities to present on the face of the financial statements reclassification adjustments for items that are reclassified from OCI to net income in the statement(s) where the components of net income and the components of OCI are presented. This guidance will be effective for the Company on January 1, 2012; however, during December 2011 the FASB issued ASU No. 2011-12, which defers those changes in ASU 2011-05 that relate to the presentation of reclassification adjustments. Management does not believe the adoption of this new guidance will have a material impact on the Company’s consolidated financial statements.
t. Foreign Currency Translation
The Company’s foreign subsidiary uses the local currency as its functional currency. Assets and liabilities are translated at exchange rates in effect at the balance sheet date. Income and expense accounts are translated at the average monthly exchange rates during the year. Resulting translation adjustments are recorded as a component of accumulated other comprehensive loss on the consolidated balance sheets.
2. Cash, Cash Equivalents and Investments
Cash and cash equivalents include funds on hand and short-term investments with original maturities of three months or less. Short-term investments include securities generally having maturities of 90 days to one year. The Company’s short-term investments are invested in corporate bonds, which, based on management’s intent and ability, are classified as held to maturity investments and are recorded at amortized cost.
The following is a summary of cash, cash equivalents and held-to-maturity investments by type at December 31, 2011:
| December 31, 2011 | December 31, 2010 | |||||||||||||||||||||||||||||||
| Gross | Gross | Gross | Gross | |||||||||||||||||||||||||||||
| Unrealized | Unrealized | Fair | Unrealized | Unrealized | Fair | |||||||||||||||||||||||||||
| Cost | Gains | Losses | Value | Cost | Gains | Losses | Value | |||||||||||||||||||||||||
| Cash and money market funds |
$ | 21,300,733 | $ | — | $ | — | $ | 21,300,733 | $ | 42,684,241 | $ | — | $ | — | $ | 42,684,241 | ||||||||||||||||
| Corporate bonds |
5,008,189 | — | (3,238 | ) | 5,004,951 | — | — | — | — | |||||||||||||||||||||||
| Certificate of deposit |
100,000 | — | (69 | ) | 99,931 | — | — | — | — | |||||||||||||||||||||||
|
|
|
|
|
|
|
|
|
|
|
|
|
|
|
|
|
|||||||||||||||||
| Total cash, cash equivalents and investments |
$ | 26,408,922 | $ | — | $ | (3,307 | ) | $ | 26,405,615 | $ | 42,684,241 | $ | — | $ | — | $ | 42,684,241 | |||||||||||||||
|
|
|
|
|
|
|
|
|
|
|
|
|
|
|
|
|
|||||||||||||||||
Fair value in the above table was determined using level 1 inputs. The corporate bond investments above have contractual maturities of less than one year. At December 31, 2011, held-to-maturity short-term investments have gross unrealized losses of $3,307, which have been in a continuous unrealized loss position for less than 12 months. The unrealized losses on the Company’s investments in corporate bonds are due to interest rate fluctuations. As these investments were originally purchased at a premium, are short-term in nature, are expected to be redeemed at par value and because the Company has the ability and intent to hold these investments to maturity, the Company does not consider these investments to be other than temporarily impaired at December 31, 2011.
The classification of cash, cash equivalents and investments in the accompanying balance sheets is as follows at December 31:
| 2011 | 2010 | |||||||
| Cash |
$ | 6,061,523 | $ | 12,282,389 | ||||
| Cash equivalents |
15,239,210 | 30,401,852 | ||||||
|
|
|
|
|
|||||
| Total cash and cash equivalents |
21,300,733 | 42,684,241 | ||||||
| Short-term investments |
5,108,189 | — | ||||||
|
|
|
|
|
|||||
| Total cash, cash equivalents and investments |
$ | 26,408,922 | $ | 42,684,241 | ||||
|
|
|
|
|
|||||
53
TASER INTERNATIONAL, INC.
NOTES TO CONSOLIDATED FINANCIAL STATEMENTS – (Continued)
3. Inventory
Inventories consisted of the following at December 31:
| 2011 | 2010 | |||||||
| Raw materials |
$ | 11,304,265 | $ | 11,636,588 | ||||
| Work-in-process |
304,783 | 180,991 | ||||||
| Finished goods |
4,306,585 | 6,348,490 | ||||||
| Reserve for excess and obsolete inventory |
(4,430,872 | ) | (350,664 | ) | ||||
|
|
|
|
|
|||||
| Total inventory |
$ | 11,484,761 | $ | 17,815,405 | ||||
|
|
|
|
|
|||||
During the fourth quarter of 2011, the Company recognized a charge of $3.7 million for excess inventory relative to two specific product lines: the TASER X3 ECD, and the first generation of AXON. The success of the new TASER X2 has led the Company to conclude that it will not sell through its current level of TASER X3 inventory, even though the Company will continue to sell and support the TASER X3 product line. These factors resulted in an excess inventory charge of $1.7 million associated with the X3 product line. Similarly, with the launch of the Company’s new AXON Flex system for the Video segment, the Company has concluded it will not sell through existing first generation AXON inventory. These factors resulted in an excess inventory charge of $2.0 million associated with the first generation AXON product line.
4. Property and Equipment
Property and equipment consisted of the following at December 31:
| Estimated | ||||||||||||
| Useful Life | 2011 | 2010 | ||||||||||
| Land |
N/A | $ | 2,899,962 | $ | 2,899,962 | |||||||
| Building |
39 years | 13,998,874 | 14,126,110 | |||||||||
| Production equipment |
3-7 years | 17,338,392 | 18,579,556 | |||||||||
| Telephone equipment |
5 years | 9,283 | 9,283 | |||||||||
| Computer equipment |
3-5 years | 8,482,545 | 8,143,098 | |||||||||
| Furniture and office equipment |
5-7 years | 3,067,048 | 3,001,496 | |||||||||
| Vehicles |
5 years | 313,325 | 503,872 | |||||||||
| Website development costs |
3 years | 600,949 | 846,387 | |||||||||
| Capitalized software development costs |
3 years | 3,806,547 | 3,670,122 | |||||||||
| Construction-in-process |
N/A | 797,306 | 2,082,404 | |||||||||
|
|
|
|
|
|||||||||
| Total cost |
|
51,314,230 | 53,862,290 | |||||||||
| Less: Accumulated depreciation |
|
(24,469,010 | ) | (17,956,525 | ) | |||||||
|
|
|
|
|
|||||||||
| Property and equipment, net |
|
$ | 26,845,220 | $ | 35,905,765 | |||||||
|
|
|
|
|
|||||||||
In 2011, the Company recognized a loss on write-down / disposal of property and equipment of $2.8 million which consisted of the following: (i) $1.4 million for tooling relative to the first generation AXON equipment, which is discussed further above; (ii) $0.8 million relative to the decision to dispose of surplus equipment and billing software for EVIDENCE.COM operations; and (iii) $0.6 million for tooling relative to the TASER X3. In 2011, the Company also recognized an impairment charge of $1.4 million following the Company’s determination to abandon the Protector product line, of which $0.7 million relates to property and equipment. In 2010, the Company wrote off or disposed of a total of $1.6 million of computer, production and office equipment, which were no longer in service. These assets had accumulated depreciation of $1.5 million and generated a loss on disposal of $0.1 million for the equipment that was sold.
54
TASER INTERNATIONAL, INC.
NOTES TO CONSOLIDATED FINANCIAL STATEMENTS – (Continued)
At December 31, 2011 and 2010, construction-in-process includes new product production equipment that was not in service at such time. Depreciation and amortization expense relative to property and equipment was $7.5 million, $6.8 million and $3.5 million for the years ended December 31, 2011, 2010 and 2009, respectively, of which $5.2 million, $4.3 million, and $1.0 million relates to cost of products sold, respectively.
5. Intangible Assets
Intangible assets consisted of the following at December 31:
| 2011 | 2010 | |||||||||||||||||||||||||||
| Useful Life |
Gross Carrying Amount |
Accumulated Amortization |
Net Carrying Amount |
Gross Carrying Amount |
Accumulated Amortization |
Net Carrying Amount |
||||||||||||||||||||||
| Amortized: |
||||||||||||||||||||||||||||
| Domain names |
5 years | $ | 139,431 | $ | (91,943 | ) | $ | 47,488 | $ | 237,911 | $ | (66,006 | ) | $ | 171,905 | |||||||||||||
| Issued patents |
4-15 years | 1,500,192 | (342,940 | ) | 1,157,252 | 1,040,148 | (264,716 | ) | 775,432 | |||||||||||||||||||
| Issued trademarks |
9-11 years | 293,183 | (65,028 | ) | 228,155 | 207,721 | (37,659 | ) | 170,062 | |||||||||||||||||||
| Non-compete agreement |
5-7 years | 150,000 | (150,000 | ) | 150,000 | (130,000 | ) | 20,000 | ||||||||||||||||||||
|
|
|
|
|
|
|
|
|
|
|
|
|
|||||||||||||||||
| Total amortized |
2,082,806 | (649,911 | ) | 1,432,895 | 1,635,780 | (498,381 | ) | 1,137,399 | ||||||||||||||||||||
|
|
|
|
|
|
|
|
|
|
|
|
|
|||||||||||||||||
| Not amortized: |
||||||||||||||||||||||||||||
| TASER trademark |
900,000 | 900,000 | 900,000 | 900,000 | ||||||||||||||||||||||||
| Patents and trademarks pending |
891,111 | 891,111 | 1,053,477 | 1,053,477 | ||||||||||||||||||||||||
|
|
|
|
|
|
|
|
|
|||||||||||||||||||||
| Total not amortized |
1,791,111 | 1,791,111 | 1,953,477 | 1,953,477 | ||||||||||||||||||||||||
|
|
|
|
|
|
|
|
|
|
|
|
|
|||||||||||||||||
| Total intangible assets |
$ | 3,873,917 | $ | (649,911 | ) | $ | 3,224,006 | $ | 3,589,257 | $ | (498,381 | ) | $ | 3,090,876 | ||||||||||||||
|
|
|
|
|
|
|
|
|
|
|
|
|
|||||||||||||||||
Amortization expense relative to intangible assets was $0.2 million, $0.1 million and $0.1 million for the years ended December 31, 2011, 2010 and 2009, respectively. Estimated amortization for intangible assets with definitive lives for the next five years is as follows (year ended December 31):
| 2012 |
$ | 137,495 | ||
| 2013 |
136,840 | |||
| 2014 |
135,924 | |||
| 2015 |
127,173 | |||
| 2016 |
120,101 | |||
| Thereafter |
775,363 | |||
|
|
|
|||
| Total |
$ | 1,432,895 | ||
|
|
|
55
TASER INTERNATIONAL, INC.
NOTES TO CONSOLIDATED FINANCIAL STATEMENTS – (Continued)
6. Other Long-Term Assets
Other long term assets consisted primarily of long term prepaid licenses and training equipment used on a recurring basis for the Company’s training programs.
7. Accrued Liabilities
Accrued liabilities consisted of the following at December 31:
| 2011 | 2010 | |||||||
| Accrued salaries and benefits |
$ | 1,549,659 | $ | 1,411,716 | ||||
| Accrued expenses |
2,224,398 | 1,668,477 | ||||||
| Accrued judgements |
3,300,000 | — | ||||||
| Accrued warranty expense |
427,459 | 646,113 | ||||||
| Accrued income tax |
141,488 | 33,494 | ||||||
|
|
|
|
|
|||||
| Accrued Liabilities |
$ | 7,643,004 | $ | 3,759,800 | ||||
|
|
|
|
|
|||||
8. Commitments and Contingencies
a. Lease Obligations
The Company has entered into operating leases for various office space, storage facilities and equipment. Rent expense under all operating leases, including both cancelable and non-cancelable leases, was $1.8 million, $1.6 million and $1.0 million for the years ended December 31, 2011, 2010, and 2009, respectively. Future minimum lease payments under non-cancelable operating leases are as follows (years ended December 31):
| 2012 |
$ | 535,809 | ||
| 2013 |
286,744 | |||
| 2014 |
102,031 | |||
| 2015 |
30,826 | |||
| 2016 |
— | |||
| Thereafter |
— | |||
|
|
|
|||
| Total |
$ | 955,410 | ||
|
|
|
b. Purchase Commitments
On October 25, 2010, the Company entered into a contract with Automation Tooling Systems, Inc. (ATS) for the cartridge assembly line consignment parts. ATS will charge a fee of $9,300 per month for 25 months, which is a fee for access to the consignment inventory of spare parts located on the Company’s premises. The Company also routinely enters into cancelable purchase orders with many of its key vendors; however, based on the strategic relationships with many of these vendors, the Company’s ability to cancel these purchase orders and maintain a favorable relationship would be limited. As of December 31, 2011, the Company has $7.2 million of open purchase orders.
56
TASER INTERNATIONAL, INC.
NOTES TO CONSOLIDATED FINANCIAL STATEMENTS – (Continued)
c. Litigation
Product Litigation
The Company is currently named as a defendant in 42 lawsuits in which the plaintiffs allege either wrongful death or personal injury in situations in which the TASER ECD was used (or present) by law enforcement officers in connection with arrests or during training exercises. Companion cases arising from the same incident have been combined into one for reporting purposes.
In addition, 153 other lawsuits have been dismissed or judgment entered in favor of the Company at the trial court level.
The Turner (NC) lawsuit was tried in July 2011 and resulted in a jury verdict of $10 million against the Company. The Company has filed post-trial motions seeking judgment as a matter of law notwithstanding the verdict and in the alternative a new trial or alternatively a remittitur of the jury award. The court has not yet entered judgment. The Company recorded a litigation judgment charge of $3.3 million in the second quarter of 2011, which represents management’s best estimate of the Company’s uninsured portion of the judgment after consideration of available insurance coverage.
With respect to each of the pending 42 lawsuits, the following table lists the name of plaintiff, the date the Company was served with process, the jurisdiction in which the case is pending, the type of claim and the status of the matter. While the facts vary from case to case, the product liability claims are typically based on an alleged product defect resulting in injury or death, usually involving a failure to warn, and the plaintiffs are seeking monetary damages. This table also lists those cases that were dismissed or judgment entered during the most recent fiscal quarter. Cases that were dismissed or judgment entered in prior fiscal quarters are not included in this table. The claims and in some instances, the defense of each of these lawsuits has been submitted to our insurance carriers that maintained insurance coverage during these applicable periods and we continue to maintain product liability insurance coverage with varying limits and deductibles. Our product liability insurance coverage during these periods ranged from $5,000,000 to $10,000,000 in coverage limits and from $10,000 to $1,000,000 in per incident deductibles. For the 2010 insurance policy year, our product liability insurance coverage was $10 million and, as noted above, in the Turner (NC) case the Company received an adverse $10 million jury verdict. After consideration of remaining available insurance coverage, the Company’s uninsured exposure related to this case is approximately $3.8 million. The Company has recorded a reserve of $3.3 million which it believes is adequate to cover the expected outcome of the case post all applicable appeals. While the Company will explore every possible legal channel to have this verdict overturned, in the event the verdict stands, the Company’s insurance coverage for the 2010 policy year will be exhausted and, for any other claims relating to the 2010 policy year, the Company will not have insurance coverage for defense costs or any other adverse judgments, should they arise. We are defending each of these lawsuits vigorously and do not expect these lawsuits to individually and in the aggregate, materially affect our business, results of operations or financial condition.
57
TASER INTERNATIONAL, INC.
NOTES TO CONSOLIDATED FINANCIAL STATEMENTS – (Continued)
| Plaintiff |
Served | Jurisdiction |
Claim Type |
Status | ||||||
| Glowczenski |
Oct-04 | US District Court, ED NY | Wrongful Death | Trial rescheduled, date to be determined | ||||||
| Washington |
May-05 | US District Court, ED CA | Wrongful Death | Discovery Phase | ||||||
| Hollman |
Aug-06 | US District Court, ED NY | Wrongful Death | Motion Phase | ||||||
| Salinas |
Aug-08 | US District Court, ND CA | Wrongful Death | Trial scheduled September 2012 | ||||||
| Thomas (Pike) |
Oct-08 | US District Court, WD Louisiana, Alexandria | Wrongful Death | Motion Phase | ||||||
| Shrum |
May-09 | Allen County District Court, Iola, KS | Wrongful Death | Trial Scheduled November 2012 | ||||||
| Athetis |
May-09 | Maricopa County Superior Court, AZ | Wrongful Death | Discovery Phase | ||||||
| Abrahams |
July-09 | CA Superior Court, Yolo County | Wrongful Death | Dismissed | ||||||
| Humphreys |
Oct-09 | CA Superior Court, San Joaquin County | Wrongful Death | Discovery Phase | ||||||
| Terriquez |
Feb-10 | Superior Court of CA, Orange County | Wrongful Death | Dismissed | ||||||
| Rich |
Feb-10 | US District Court, NV | Wrongful Death | Motion Phase | ||||||
| Turner |
Feb-10 | US District Court, WD NC | Wrongful Death | Jury verdict for $10 million. Post trial motions filed and pending, judgment not filed. | ||||||
| Doan |
Apr-10 | Queens Bench Alberta, Red Deer Judicial Dist. | Wrongful Death | Discovery Phase | ||||||
| Piskkura |
May-10 | US District Court, OH | Wrongful Death | Discovery Phase, trial scheduled August 2012 | ||||||
| Corbin |
Jun-10 | Houston County Court, MD AL | Wrongful Death | Dismissed | ||||||
| DuBoise |
Aug-10 | US District Court, ED MO | Wrongful Death | Dismissed | ||||||
| Kelley |
Oct-10 | District Court for Harris County, TX | Wrongful Death | Discovery Phase, trial scheduled May 2012 | ||||||
| Jacobs |
Oct-10 | District Court for Travis County, TX | Wrongful Death | Discovery Phase, trial scheduled October 2012 | ||||||
| Shymko |
Dec-10 | The Queens Bench, Winnipeg Centre, Manitoba | Wrongful Death | Pleading Phase | ||||||
| Williams |
Dec-10 | US District Court, MS | Wrongful Death | Discovery Phase, trial scheduled January 2013 | ||||||
| English |
May-11 | US District Court, WD, VA | Wrongful Death | Dismissed | ||||||
| Wilson |
May-11 | US District Court, ED, MO | Wrongful Death | Discovery Phase, trial scheduled May 2013 | ||||||
| Terrell |
Jun-11 | US District Court, SD, TX | Wrongful Death | Dismissed | ||||||
| Sylvester |
Jun-11 | US District Court, ND, CA | Wrongful Death | Discovery Phase, trial scheduled April 2013 | ||||||
| La Day |
Jun-11 | US District Court, ED TX | Wrongful Death | Discovery Phase, trial scheduled October 2012 | ||||||
| Cobbs |
Aug-11 | Guilford County Superior Court, NC | Wrongful Death | Dismissed | ||||||
| Nelson |
Aug-11 | CA Superior Court, Riverside County | Wrongful Death | Discovery Phase | ||||||
| Bachtel |
Aug-11 | 14th Judicial District Circuit Court, Randolph County, MO | Wrongful Death | Discovery Phase, trial scheduled March 2013 | ||||||
| Ridelhuber |
Sep-11 | US District Court, Greenwood Division, SC | Wrongful Death | Discovery Phase | ||||||
| Cosentino |
Oct-11 | US District Court, CD, CA | Wrongful Death | Dismissed | ||||||
| Coto |
Oct-11 | CA Superior Court, Los Angeles County | Wrongful Death | Discovery Phase | ||||||
| Russell |
Dec-11 | Albemarle County Circuit Court, VA | Wrongful Death | Discovery Phase | ||||||
| Kelly |
Jan-12 | Elkhart County Circuit Court, IN | Wrongful Death | Dismissed | ||||||
| Ramsey |
Jan-12 | Broward County Circuit Court, 17th Judicial Circuit, FL | Wrongful Death | Pleading Phase | ||||||
| Stewart |
Oct-05 | Circuit Court for Broward County, FL | Training Injury | Discovery Phase | ||||||
| Husband |
Mar-06 | British Columbia Supreme Court, Canada | Training Injury | Dismissed | ||||||
| Grable |
Aug-08 | FL 6th Judicial Circuit Court, Pinellas County | Training Injury | Discovery Phase | ||||||
| Koon |
Dec-08 | 17th Judicial Circuit Court, Broward County, FL | Training Injury | Discovery Phase | ||||||
| Bickle |
Mar-09 | 18th Judicial District Court, Gallatin County, MT | Training Injury | Dismissed | ||||||
| Peppler |
Apr-09 | Circuit Court 5th Judicial Dist., Sumter City, FL | Training Injury | Discovery Phase | ||||||
| Kandt |
Jun-09 | US District Court, ND NY | Training Injury | Motion Phase | ||||||
| Maynard |
Apr-10 | Superior Court, Hartford Judicial District, CT | Training Injury | Dismissed | ||||||
| Butler |
Jan-11 | US District Court, ND TX | Training Injury | Discovery Phase, trial scheduled August 2012 | ||||||
58
TASER INTERNATIONAL, INC.
NOTES TO CONSOLIDATED FINANCIAL STATEMENTS – (Continued)
| Plaintiff |
Served | Jurisdiction |
Claim Type |
Status | ||||||
| Derbyshire |
Nov-09 | Ontario Superior Court of Justice | Officer Injury | Discovery Phase | ||||||
| Hollenback |
Dec-10 | St. Louis County Circuit Court MO | Officer Injury | Dismissed | ||||||
| Juran |
Dec-11 | Hennepin County District Court, MN, 4th Judicial District | Officer Injury | Discovery Phase | ||||||
| Stough |
Feb-11 | US District Court, ED MO | Officer Injury | Discovery Phase, trial scheduled December 2012 | ||||||
| Wheat |
Jul-09 | CA Superior Court, Los Angeles County | Suspect Injury During Arrest | Dismissed | ||||||
| Fahy |
Dec-09 | Circuit Court of City of St. Louis | Suspect Injury During Arrest | Discovery Phase, trial scheduled August 2012 | ||||||
| Thompson |
Mar-10 | 11th Judicial Circuit Court Miami-Dade County, FL | Suspect Injury During Arrest | Discovery Phase | ||||||
| Wilson |
Apr-10 | US District Court, ND IL | Suspect Injury During Arrest | Dismissed | ||||||
| Streeter |
Dec-10 | US District Court, OR | Suspect Injury During Arrest | Dismissed | ||||||
| Valkanet |
Mar-11 | US District Court, ND IL | Suspect Injury During Arrest | Dismissed | ||||||
| Sanders |
Mar-11 | US District Court, ND IL | Suspect Injury During Arrest | Dismissed | ||||||
| Payne |
Mar-11 | Blount County Circuit Court, TN | Suspect Injury During Arrest | Discovery Phase | ||||||
| Jefferson |
Apr-11 | US District Court, ED TX | Injury During Incarceration | Discovery Phase | ||||||
| Fountain |
May-11 | US District Court, MD FL | Suspect Injury During Arrest | Discovery Phase, trial scheduled April 2013 | ||||||
| Alusa |
May-11 | US District Court, CD UT | Suspect Injury During Arrest | Dismissed | ||||||
| Diehl |
Jun-11 | Court of Common Pleas, Blair County, PA | Suspect Injury During Arrest | Discovery Phase | ||||||
| Gray |
Sep-11 | US District Court, WD LA | Suspect Injury During Arrest | Discovery Phase | ||||||
| Duensing |
Feb-12 | US District Court, NV | Suspect Injury During Arrest | Pleading Phase | ||||||
In addition, several litigation matters on which TASER prevailed at the trial court level are now currently on appeal:
| Plaintiff |
Jurisdiction | Claim Type | Status | |||
| Marquez (AZ) |
US Court of Appeals for the Ninth Circuit | Wrongful Death | Oral Argument Scheduled for April 2012 | |||
| Rosa (CA) |
US Court of Appeals for the Ninth Circuit | Wrongful Death | Oral Argument Scheduled for April 2012 | |||
| Oliver |
US Court of Appeals for the Eleventh Circuit | Wrongful Death | Plaintiff’s Appeal Denied in January 2012 | |||
Other Litigation
In February 2009, we filed a complaint in the United States District Court for the District of Nevada against James F. McNulty, Jr., Robert Gruder, and Stinger Systems, Inc. alleging securities fraud under 15 U.S.C. § 78j, trade libel, unfair competition under the Lanham Act, 15 U.S.C. § 1125, abuse of process, and deceptive trade practices. Our complaint seeks compensatory damages, punitive damages, injunctive relief, attorneys’ fees and costs. Defendants filed motions to dismiss and on March 25, 2010 the Court denied Defendants’ motion on all claims except the securities fraud claim. Defendant McNulty filed a counterclaim on August 2, 2010 alleging that TASER’s XREP product infringes U.S. Patents 5,831,199 and 6,877,434. The counterclaim seeks declaratory and injunctive relief, compensatory, treble and punitive damages, and attorneys’ fees. The court issued a ruling in July 2011 dismissing TASER’s claims for civil conspiracy and abuse of process and affirming the magistrate’s order requiring defendants to disclose tax and stock information to TASER and ruling that TASER’s counterclaim for declaratory judgment with respect to the patent claims should not be dismissed. Mr. McNulty has filed a motion for summary judgment which motion is pending before the court. No trial date has been set.
59
TASER INTERNATIONAL, INC.
NOTES TO CONSOLIDATED FINANCIAL STATEMENTS – (Continued)
In January 2011 we were served with a complaint in the matter of GEOTAG, Inc. v. TASER International, et. al. that was filed in the United States District Court for the Eastern District of Texas, Marshall Division which alleges that a dealer geographical locator feature on TASER’s website infringes upon plaintiff’s US Patent No. 5,930,474. The complaint seeks a judgment of infringement, a permanent injunction against infringement, an award for damages, costs, expenses and prejudgment and post-judgment interest, and an award for enhanced damages and attorneys’ fees. TASER has licensed this locator feature from a third party and has denied liability for infringement. This lawsuit is at the discovery phase and no trial date has been set.
In September 2011 the Company filed motion with the US District Court for the District of Arizona to re-open the lawsuit in which TASER was granted a permanent injunction against Stinger Systems, Inc. which was granted in October 2011. The permanent injunction restrained Stinger and its officers, agents and employees, which would include Robert Gruder who was formerly an officer and employee of Stinger and who is currently president of Karbon Arms, LLC, from making, using, offering to sell, or selling in or from the United States, the Stinger S-200 electronic control devices (ECDs) and all other products that are only colorably different from the S-200 ECDs in the context of claims 2 or 40 of TASER’s 6,999,295 patent. This case was re-opened by the Court to consider TASER’s motion for contempt against Karbon Arms and Gruder for violation of TASER’s permanent injunction by making, offering to sell and selling the Karbon Arms MPID ECD. TASER’s motion was denied after a hearing on December 15, 2011.
In July 2011 the Company filed a complaint against Karbon Arms, LLC for infringement of U.S. Patent Nos. 7,800,885 (the “‘885 patent”) and 7,782,592 (the “‘592 patent”) in US District Court in Delaware seeking damages, injunctive relief and an award of attorneys’ fees. Karbon Arms filed a counterclaim on July 18, 2011 alleging invalidity and non-infringement of four of TASER’s patents, tortuous interference with prospective contractual relations and for false advertising under the Lanham Act. This lawsuit is at the discovery phase and a trial date has been set for January 2014.
In December 2011 the Company was served with a complaint in the matter of Law Enforcement Associates, Inc. v. TASER International, Inc. that was filed in the United States District Court for the Eastern District of North Carolina, Eastern Division which alleges that the Company’s X2 and X3 products infringe United States Patent No. 7,692,915 and that the Company breached a contract to purchase certain of Law Enforcement Associates, Inc.’s patents. The complaint seeks a judgment of infringement, a permanent injunction against infringement, an award for damages for infringement and breach of contract, an award for treble damages for patent infringement and attorney’s fees. This lawsuit is at the discovery phase and no trial date has been set.
In February 2012 the Company was served with a complaint in the matter of AA & Saba Consultants, Inc. v. TASER International, Inc. that was filed in the Superior Court for the County of Maricopa, AZ which alleges that the Company breached a contract by unilaterally terminating a distributor agreement between the Company and plaintiff without good cause. The complaint seeks an award for damages, costs, expenses and attorney’s fees. This lawsuit is at the discovery phase and no trial date has been set.
60
TASER INTERNATIONAL, INC.
NOTES TO CONSOLIDATED FINANCIAL STATEMENTS – (Continued)
General
From time to time, the Company is notified that it may be a party to a lawsuit or that a claim is being made against it. It is the Company’s policy to not disclose the specifics of any claim or threatened lawsuit until the summons and complaint are actually served on the Company. After carefully assessing the claim, and assuming we determine that we are not at fault, we vigorously defend and pursue any lawsuit filed against or by the Company. Although we do not expect the outcome in any pending individual case to be material, the outcome of any litigation is inherently uncertain and there can be no assurance that any expense, liability or damages that may ultimately result from the resolution of these matters will be covered by our insurance or will not be in excess of amounts provided by insurance coverage and will not have a material adverse effect on our business, operating results or financial condition. In addition, the Company has several lawsuits where the costs of legal defense incurred are in excess of its liability insurance self-insured retentions and are covered by its insurance policy then in effect. As of December 31, 2011, the Company has been fully reimbursed by its insurance company for these legal costs. The Company may settle a lawsuit in situations where a settlement can be obtained for nuisance value and for an amount that is expected to be less than the cost of defending a lawsuit. The number of product liability lawsuits dismissed includes a small number of police officer injury lawsuits that were settled by the Company and dismissed in cases where the settlement economics to the Company were significantly less than the cost of litigation. In addition, it is the Company’s policy to not settle suspect injury or death cases, although the Company’s insurance company may settle such lawsuits over the Company’s objection where the case is over the Company’s liability insurance deductibles. Due to the confidentiality of our litigation strategy and the confidentiality agreements that are executed in the event of a settlement, the Company does not identify or comment on which specific lawsuits have been settled or the amount of any settlement.
d. Employment Agreements
The Company has employment agreements with its Chairman, Chief Executive Officer, President and General Counsel, Chief Financial Officer, and Chief Marketing Officer and Executive Vice President of Sales, and the Technical Fellow of Research and Development. The Company may terminate the agreements with or without cause. Should the Company terminate the agreements without cause, or upon a change of control of the Company or death of the employee, the employees are entitled to additional compensation. Under these circumstances, these officers and employees may receive the amounts remaining under their contracts upon termination, which would total $1.0 million in the aggregate at December 31, 2011.
61
TASER INTERNATIONAL, INC.
NOTES TO CONSOLIDATED FINANCIAL STATEMENTS – (Continued)
9. Income Taxes
Significant components of the Company’s deferred income tax assets and liabilities are as follows at December 31:
| 2011 | 2010 | |||||||
| Deferred income tax assets: |
||||||||
| Net operating loss carryforward |
$ | 634,802 | $ | 1,875,491 | ||||
| Deferred warranty revenue |
1,674,984 | 1,820,670 | ||||||
| Inventory reserve |
1,712,978 | 136,436 | ||||||
| Non-employee stock option expense |
312,597 | 314,824 | ||||||
| Non-qualified stock option expense |
2,530,214 | 1,867,643 | ||||||
| Capitalized research and development |
9,677,167 | 11,314,412 | ||||||
| Alternative minimum tax carryforward |
1,657,287 | 1,636,024 | ||||||
| Research and development tax credit |
5,088,136 | 4,147,763 | ||||||
| Impairment Loss |
902,675 | — | ||||||
| Deferred Legal Settlement |
1,277,323 | — | ||||||
| Uniform capitalization of inventory costs |
756,341 | 504,398 | ||||||
| Reserves, accruals, and other |
1,148,970 | 1,259,175 | ||||||
|
|
|
|
|
|||||
| Total deferred income tax assets |
27,373,474 | 24,876,836 | ||||||
|
|
|
|
|
|||||
| Deferred income tax liabilities: |
||||||||
| Depreciation |
(3,133,145 | ) | (4,413,386 | ) | ||||
| Amortization |
(126,659 | ) | (147,366 | ) | ||||
| Section 481(a) adjustment |
— | (111,842 | ) | |||||
|
|
|
|
|
|||||
| Total deferred income tax liabilities |
(3,259,804 | ) | (4,672,594 | ) | ||||
|
|
|
|
|
|||||
| Net deferred income tax assets before valuation allowance |
24,113,670 | 20,204,242 | ||||||
| Less: Valuation allowance |
(1,428,572 | ) | — | |||||
|
|
|
|
|
|||||
| Net deferred income tax assets |
$ | 22,685,098 | $ | 20,204,242 | ||||
|
|
|
|
|
|||||
The Company’s net deferred tax assets are presented as follows on the accompanying consolidated balance sheets at December 31:
| 2011 | 2010 | |||||||
| Current deferred tax assets |
$ | 9,968,929 | $ | 6,284,489 | ||||
| Long-term deferred tax assets |
12,716,169 | 13,919,753 | ||||||
|
|
|
|
|
|||||
| Total |
$ | 22,685,098 | $ | 20,204,242 | ||||
|
|
|
|
|
|||||
In 2010, the Company generated a net operating loss carry forward (“NOL”) for financial reporting purposes of $2.5 million after adjustment for a return-to-provision adjustment during Q3 2011. The Company utilized an estimated $1.1 million of its federal NOL for financial reporting purposes during 2011. The federal NOL carry forward for tax purposes at December 31, 2010 was $10.1 million and is estimated to be $9.0 million at December 31, 2011. The Company’s federal NOL carry forward expires beginning in 2024. The Company also has deferred tax assets of $148,000 related to state NOLs which expire at various dates between 2014 and 2025. The Company has federal and state research and development credit carry forwards for financial reporting purposes of $2.3 million and $2.8 million, respectively, which expire at various dates beginning in 2024 for federal purposes and 2019 for state purposes. The Company has a minimum tax credit carryover of $1.6 million which does not expire.
The Company recognizes the income tax benefits associated with certain stock compensation deductions only when such deductions produce a reduction to the company’s actual tax liability. Accordingly, in 2011 and 2010 the Company recognized benefits of $9,800 and $52,000, respectively, for the reduction of state taxes payable, which was recorded as a credit to additional paid-in capital.
62
TASER INTERNATIONAL, INC.
NOTES TO CONSOLIDATED FINANCIAL STATEMENTS – (Continued)
In preparing the Company’s consolidated financial statements, management has assessed the likelihood that its deferred income tax assets will be realized from future taxable income. In evaluating the ability to recover its deferred income tax assets, management considers all available evidence, positive and negative; including the Company’s operating results, ongoing tax planning and forecasts of future taxable income on a jurisdiction by jurisdiction basis. A valuation allowance is established if it is determined that it is more likely than not that some portion or all of the net deferred income tax assets will not be realized. Management exercises significant judgment in determining the Company’s provisions for income taxes, its deferred income tax assets and liabilities and its future taxable income for purposes of assessing its ability to utilize any future tax benefit from its deferred income tax assets.
Although management believes that its tax estimates are reasonable, the ultimate tax determination involves significant judgments that could become subject to audit by tax authorities in the ordinary course of business. Management believes that as of December 31, 2011, based on evaluation and projections of future sales and profitability, a valuation allowance of $1.4 million was necessary for the Arizona R&D credit carry forward as management concluded that it is not more likely than not that all of the R&D credit carry forward amount will be realized before it fully expires in 15 years. The deferred tax asset could be further reduced or the valuation allowance could be changed in the near-term if estimates of future taxable income during the carry forward period change.
Significant components of the provision (benefit) for income taxes are as follows for the years ended December 31:
| 2011 | 2010 | 2009 | ||||||||||
| Current: |
||||||||||||
| Federal |
$ | 133,220 | $ | 270,437 | $ | 417,722 | ||||||
| State |
59,428 | 71,494 | 290,215 | |||||||||
|
|
|
|
|
|
|
|||||||
| Total current |
192,648 | 341,931 | 707,937 | |||||||||
|
|
|
|
|
|
|
|||||||
| Deferred: |
||||||||||||
| Federal |
(3,252,769 | ) | (939,803 | ) | (427,332 | ) | ||||||
| State |
770,687 | (148,574 | ) | (760,825 | ) | |||||||
|
|
|
|
|
|
|
|||||||
| Total deferred |
(2,482,082 | ) | (1,088,377 | ) | (1,188,157 | ) | ||||||
|
|
|
|
|
|
|
|||||||
| Tax provision (benefit) recorded as an increase (decrease) in liability for unrecorded tax benefits |
(299,441 | ) | 17,061 | 572,699 | ||||||||
|
|
|
|
|
|
|
|||||||
| Provision (benefit) for income taxes |
$ | (2,588,875 | ) | $ | (729,385 | ) | $ | 92,479 | ||||
|
|
|
|
|
|
|
|||||||
63
TASER INTERNATIONAL, INC.
NOTES TO CONSOLIDATED FINANCIAL STATEMENTS – (Continued)
The Company is subject to federal, state and foreign taxes; however, no separate calculation of the foreign provision for deferred tax assets was calculated for the periods presented due to the minimal amount of book income in the Company’s foreign subsidiary and the comparability of the foreign tax rate to the tax rate in the United States. A reconciliation of the Company’s effective income tax rate to the federal statutory rate for the years ended December 31, 2011, 2010 and 2009 is as follows:
| 2011 | 2010 | 2009 | ||||||||||
| Federal income tax at the statutory rate |
$ | (3,370,059 | ) | $ | (1,789,837 | ) | $ | 31,981 | ||||
| State income taxes, net of federal benefit (i) |
(357,226 | ) | (103,651 | ) | (502,186 | ) | ||||||
| Permanent differences (ii) |
680,742 | 870,757 | 1,097,908 | |||||||||
| Research and development |
(229,694 | ) | (163,883 | ) | (990,867 | ) | ||||||
| Return to provision adjustment (iii) |
(458,172 | ) | 265,028 | 111,652 | ||||||||
| Change in liability for unrecognized tax benefits |
(299,441 | ) | 17,061 | 572,699 | ||||||||
| Change in valuation allowance |
1,428,572 | — | (200,000 | ) | ||||||||
| Other |
16,404 | 175,140 | (28,708 | ) | ||||||||
|
|
|
|
|
|
|
|||||||
| Provision (benefit) for income taxes |
$ | (2,588,875 | ) | $ | (729,385 | ) | $ | 92,479 | ||||
|
|
|
|
|
|
|
|||||||
| Effective tax rate |
26.9 | % | 14.3 | % | 101.2 | % | ||||||
| (i) | The 2009 benefit for state income taxes was primarily driven by the utilization of Arizona research and development credits. |
| (ii) | Permanent differences include certain expenses which are not deductible for tax purposes including lobbying fees and stock-based compensation expense related to Incentive Stock Options (“ISOs”). |
| (iii) | The 2010 return to provision adjustment was driven by lower than estimated 2009 research and development tax credits, which reduced the net tax benefit and therefore the effective tax rate. The 2011 return to provision adjustment was driven by higher than estimated 2010 research and development tax credits, which increased the net tax benefit and therefore the effective tax rate. |
The Company has completed research and development tax credit studies which identified approximately $6.8 million in tax credits for Federal, Arizona and California income tax purposes related to the 2003 through 2011 tax years, net of the federal benefit on the Arizona and California research and development tax credits. Management has made the determination that it is more likely than not that the full benefit of the research and development tax credit will not be sustained on examination and recorded a liability for unrecognized tax benefits of $1.9 million as of December 31, 2011. In addition, management accrued approximately $106,000 for estimated uncertain tax positions related to certain state income tax liabilities. As of December 31, 2011, management does not expect the amount of the unrecognized tax benefit liability to increase or decrease significantly within the next 12 months. Should the unrecognized tax benefit of $2.0 million be recognized, the Company’s effective tax rate would be favorably impacted.
The following presents a roll forward of our liability for unrecognized tax benefits as of December 31:
| 2011 | 2010 | |||||||
| Balance, beginning of period |
$ | 2,281,840 | $ | 2,264,779 | ||||
| Increase in previous year tax positions |
— | — | ||||||
| Increase in current year tax positions |
83,298 | 58,830 | ||||||
| Increase (decrease) related to adjustment of previous estimates of activity |
(382,739 | ) | (41,769 | ) | ||||
| Decrease related to settlements with taxing authorities |
— | — | ||||||
| Decrease related to lapse of statute of limitations |
— | — | ||||||
|
|
|
|
|
|||||
| Balance, end of period |
$ | 1,982,399 | $ | 2,281,840 | ||||
|
|
|
|
|
|||||
64
TASER INTERNATIONAL, INC.
NOTES TO CONSOLIDATED FINANCIAL STATEMENTS – (Continued)
Federal income tax returns for 2007 through 2010 remain open to examination by the United States Internal Revenue Service (the “IRS”), while state and local income tax returns for 2003 through 2010 also remain open to examination. The foreign tax returns for 2009 and 2010 also remain open to examination. The Company has been notified it will be subject to examination in the following major jurisdictions for the years specified: California 2007-2010, Washington 2007-2010, Arizona 2007-2011 and Virginia 2008-2011.
10. Line of Credit
The Company has a line of credit agreement with a total availability of $10.0 million. The line is secured by the Company’s accounts receivable and inventory and bears interest at varying rates of interest, currently LIBOR plus 1.5%. The line of credit, which was amended and renewed in June 2011, primarily to remove the borrowing base restriction, matures on June 30, 2013, and requires monthly payments of interest only. At December 31, 2011 and 2010, there were no amounts outstanding under the line of credit. There have been no borrowings under the line of credit to date. The Company’s agreement with the bank requires compliance with certain financial and other covenants including maintenance of minimum tangible net worth and a fixed charge coverage ratio. The ratio of total liabilities to tangible net worth can be no greater than 1:1, and the fixed coverage charge ratio can be no less than 1.25:1, based upon a trailing twelve-month period. At December 31, 2011, the Company’s tangible net worth ratio was 0.28:1 and its fixed charge coverage ratio was 0.17:1. Accordingly, the Company was in violation of the fixed charge coverage ratio. During March 2012, the Company obtained a waiver of this violation, at which time availability of the $10.0 million revolving line of credit was restored. This waiver also provides relief to effectively exclude the $5.7 million charge discussed above when calculating the fixed charge coverage ratio covenant in the future, as well as waive a separate violation relative to the amount of treasury stock purchased during 2011. Excluding the impact of the $5.7 million charge, the fixed charge coverage ratio was 3.27:1.
11. Stockholders’ Equity
a. Common Stock and Preferred Stock
The Company has authorized the issuance of two classes of stock designated as “common stock” and “preferred stock,” each having a par value of $0.00001 per share. The Company is authorized to issue 200 million shares of common stock and 25 million shares of preferred stock.
b. Stock Repurchase
In March 2011, TASER’s Board of Directors authorized a stock repurchase program to acquire up to $12.5 million of the Company’s outstanding common stock subject to stock market conditions and corporate considerations. In July 2011, TASER’s Board of Directors authorized an additional repurchase program to acquire up to $20 million of the Company’s outstanding common stock, subject to stock market conditions and corporate considerations. During 2011, the Company repurchased 7,464,583 shares at an average cost, including commissions, of $4.35 per share, or a total cost of $32.5 million.
c. Stock Option Plans
The Company has historically issued stock options to various equity owners and key employees as a means of attracting and retaining quality personnel. The option holders have the right to purchase a stated number of shares at the market price on the grant date. The options issued under the Company’s 1999 Stock Option Plan (the “1999 Plan”), 2001 Stock Option Plan (the “2001 Plan”) and 2004 Stock Option Plan (the “2004 Plan”) generally vest over a three-year period and have a contractual maturity of ten years; however, the majority of options issued under the 2004 Plan within fiscal 2005 had vesting terms of one year. The shares issuable under each of the plans were registered on Form S-8 with the United States Securities and Exchange Commission.
On March 31, 2009, the Company’s Board of Directors approved the 2009 Stock Incentive Plan (“the 2009 Plan”), under which the Company reserved 1,000,000 shares of common stock available for future grants. The 2009 Stock Incentive Plan was approved at the Annual Meeting of Stockholders on May 28, 2009. Options issued under the 2009 Plan generally vest over a three to four-year period and have a contractual maturity of ten years.
The total number of shares registered under these plans was as follows: 9,952,500 under the 1999 Plan, 6,600,000 under the 2001 Plan, 6,800,000 under the 2004 Plan and 1,000,000 under the 2009 Plan. These plans provide for officers, key employees, directors and consultants to receive nontransferable stock options to purchase an aggregate of 24,352,500 shares of the Company’s common stock. As of December 31, 2011, 1,666,543 options remain available for future grants. Shares issued upon exercise of stock options from these plans have historically been issued from the Company’s authorized unissued shares.
65
TASER INTERNATIONAL, INC.
NOTES TO CONSOLIDATED FINANCIAL STATEMENTS – (Continued)
d. 2010 Stock Option Exchange Program
On December 27, 2010, the Company completed a stock option exchange program, which provided employees holding certain options the opportunity to exchange outstanding options granted pursuant to the Company’s 1999 Plan, 2001 Plan, and 2004 Plan, for a lesser amount of new options to be granted with lower exercise prices. The exchange offer commenced on November 24, 2010, and expired on December 27, 2010. Stock options eligible for exchange were those that had an exercise price per share greater than $8.00, and that had not expired before December 27, 2010. As of November 24, 2010, 867,540 options were eligible for exchange. Neither our executive officers nor members of our Board of Directors were eligible to participate in the exchange offer.
A total of 463,306 options were tendered by employees, representing 53% of the total stock options eligible for exchange. On December 28, 2010, the Company granted an aggregate of 221,723 new options under the 2009 Stock Incentive Plan in exchange for the eligible options surrendered. The exercise price of the new options is $4.84 per share, which was the closing price of the Company’s Common Stock on December 27, 2010, as reported by the NASDAQ Global Select Market. An incremental stock option expense of a $10,000 is being recognized over the three-year vesting period of the newly granted options.
e. Stock Option Activity
A summary of the Company’s stock options at December 31, 2011, 2010 and 2009, and for the years then ended is presented in the table below:
| 2011 | 2010 | 2009 | ||||||||||||||||||||||
| Weighted | Weighted | Weighted | ||||||||||||||||||||||
| Number | Average | Number | Average | Number | Average | |||||||||||||||||||
| of | Exercise | of | Exercise | of | Exercise | |||||||||||||||||||
| Options | Price | Options | Price | Options | Price | |||||||||||||||||||
| Options outstanding, beginning of year |
7,507,286 | $ | 5.71 | 8,780,067 | $ | 5.94 | 9,108,930 | $ | 5.87 | |||||||||||||||
| Granted under option exchange program |
— | — | 221,723 | 4.84 | — | — | ||||||||||||||||||
| Granted |
1,019,228 | 4.65 | 988,941 | 5.08 | 551,270 | 4.56 | ||||||||||||||||||
| Exercised |
(539,923 | ) | 2.64 | (502,205 | ) | 1.99 | (323,351 | ) | 0.48 | |||||||||||||||
| Expired / terminated |
(409,002 | ) | 6.38 | (1,517,934 | ) | 7.28 | (556,782 | ) | 6.36 | |||||||||||||||
| Cancelled under option exchange program |
— | — | (463,306 | ) | 11.66 | — | — | |||||||||||||||||
|
|
|
|
|
|
|
|||||||||||||||||||
| Options outstanding, end of year |
7,577,589 | 5.75 | 7,507,286 | 5.71 | 8,780,067 | 5.94 | ||||||||||||||||||
|
|
|
|
|
|
|
|||||||||||||||||||
| Options exercisable, end of year |
6,432,667 | 6.02 | 5,967,590 | 5.99 | 5,988,159 | 6.23 | ||||||||||||||||||
|
|
|
|
|
|
|
|||||||||||||||||||
| Options available for grant at end of year |
1,666,543 | 2,478,768 | 1,708,192 | |||||||||||||||||||||
|
|
|
|
|
|
|
|||||||||||||||||||
| Weighted average fair value value of options granted during the year |
$ | 2.16 | $ | 2.59 | $ | 2.56 | ||||||||||||||||||
66
TASER INTERNATIONAL, INC.
NOTES TO CONSOLIDATED FINANCIAL STATEMENTS – (Continued)
The following table summarizes information about stock options outstanding and exercisable as of December 31, 2011:
| Options Outstanding | Options Exercisable | |||||||||||||||||||
| Range of Exercise Price |
Number of Options Outstanding |
Weighted Average Exercise Price |
Weighted Average Remaining Contractual Life (Years) |
Number of Options Exercisable |
Weighted Average Exercise Price |
|||||||||||||||
| $0.28 - $0.99 |
462,655 | $ | 0.37 | 1.2 | 462,655 | $ | 0.37 | |||||||||||||
| $1.03 - $2.41 |
364,957 | 1.76 | 1.0 | 364,957 | 1.76 | |||||||||||||||
| $3.53 - $9.93 |
6,218,117 | 5.81 | 6.4 | 5,073,195 | 6.19 | |||||||||||||||
| $10.07 - $19.76 |
507,560 | 11.93 | 3.8 | 507,560 | 11.93 | |||||||||||||||
| $20.12 - $29.98 |
24,300 | 22.94 | 2.4 | 24,300 | 22.94 | |||||||||||||||
|
|
|
|
|
|||||||||||||||||
| $0.28 - $29.98 |
7,577,589 | 5.75 | 5.6 | 6,432,667 | 6.02 | |||||||||||||||
|
|
|
|
|
|||||||||||||||||
The total fair value of options exercisable was $13.9 million, $18.7 million and $19.3 million at December 31, 2011, 2010 and 2009, respectively. The aggregate intrinsic value of options outstanding and options exercisable at December 31, 2011 was $4.9 million and $4.1 million, respectively. The aggregate intrinsic value of unvested options at December 31, 2011 was $0.8 million. Aggregate intrinsic value represents the difference between the Company’s closing stock price on the last trading day of the fiscal period, which was $5.12 as of December 30, 2011, and the exercise price of the option multiplied by the number of options outstanding. Total intrinsic value of options exercised was $1.6 million, $2.2 million and $1.3 million for the years ended December 31, 2011, 2010 and 2009, respectively.
At December 31, 2011, the Company had 1.1 million unvested options outstanding with a weighted average exercise price of $4.75 per share, weighted average fair value of $2.24 per share and weighted average remaining contractual life of 8.4 years. Of the unvested options outstanding at December 31, 2011, the Company expects that 1.1 million options will ultimately vest based on its historical experience.
f. Stock-based Compensation Expense
The Company accounts for share-based compensation using the fair-value method. Reported share-based compensation was classified as follows for the years ended December 31:
| 2011 | 2010 | 2009 | ||||||||||
| Indirect manufacturing expense |
$ | 121,177 | $ | 300,787 | $ | 349,243 | ||||||
| Sales, general and administrative expenses |
2,291,339 | 2,728,360 | 3,218,735 | |||||||||
| Research and development expenses. |
625,784 | 653,528 | 1,420,859 | |||||||||
|
|
|
|
|
|
|
|||||||
| Total stock-based compensation |
$ | 3,038,300 | $ | 3,682,675 | $ | 4,988,837 | ||||||
|
|
|
|
|
|
|
|||||||
As of December 31, 2011, total unrecognized stock-based compensation expense related to non-vested stock options was $3.5 million, which is expected to be recognized over a total weighted average period of 17 months. $1.7 million of this expense is expected to be recognized in 2012.
Total share-based compensation expense recognized in the statement of operations for the years ended December 31, 2011, 2010 and 2009 includes $1.3 million, $1.9 million and $2.6 million, respectively, related to ISOs for which no tax benefit is recognized. The total future tax benefits related to non-qualified stock options were $2.5 million, $1.9 million and $1.5 million for the years ended December 31, 2011, 2010 and 2009, respectively. The Company recorded a tax benefit in 2011, 2010, and 2009 of $9,800, $0, and $32,000, respectively, to offset taxes payable related to the non-qualified disposition of ISOs exercised and sold. The total expected future tax benefit related to the non-qualified disposition of stock options in 2011, 2010 and 2009 was $1.5 million, $2.2 million and $1.3 million, respectively.
67
TASER INTERNATIONAL, INC.
NOTES TO CONSOLIDATED FINANCIAL STATEMENTS – (Continued)
The Company granted 950,800 performance-based stock options from 2008 through 2011, the vesting of which is contingent upon the achievement of certain performance criteria related to the successful and timely development and market acceptance of future product introductions, as well as the future operating performance of the Company. Compensation expense is recognized over the implicit service period (the date the performance condition is expected to be achieved) based on management’s estimate of the probability of the performance criteria being satisfied, adjusted at each balance sheet date. There were no forfeitures during the year ended December 31, 2011. Management determined that 225,000 and 106,700 of these options were forfeited during 2010 and 2009, respectively. Of the remaining 619,100 outstanding options, 405,195 options are exercisable, and 213,905 are unvested. The fair value of the remaining 201,156 performance-based stock options outstanding and still expected to vest was estimated to be $0.5 million. The Company recognized $0.3 million, $0.1 million and $0.8 million of related stock-based compensation expense related to performance-based stock options during 2011, 2010 and 2009, respectively.
| 12. | Related Party Transactions |
Aircraft Charter
The Company reimburses Thomas P. Smith, Chairman of the Company’s Board of Directors, and Patrick W. Smith, Chief Executive Officer, for business use of their personal aircraft. For the years ended December 31, 2011, 2010 and 2009, the Company incurred expenses of $0.1 million, $0.2 million and, $0.3 million, respectively, to Thomas P. Smith. For the years ended December 31, 2011, 2010 and 2009, the Company incurred expenses of less than $0.1 million to Patrick W. Smith. At December 31, 2011 and 2010, the Company had no outstanding payables due to Patrick W. Smith or Thomas P. Smith. Management believes that the rates charged by Thomas P. Smith and Patrick W. Smith are equal to or below commercial rates the Company would pay to charter similar aircraft from independent charter companies.
TASER Foundation
In November 2004, the Company established the TASER Foundation. The TASER Foundation is an Internal Revenue Code Section 501(c)(3) non-profit corporation and has been granted tax exempt status by the IRS. The TASER Foundation’s mission is to honor the service and sacrifice of local and federal law enforcement officers in the United States and Canada lost in the line of duty by providing financial support to their families. Over half of the initial $1 million endowment was contributed directly by the Company’s employees. The Company bears all administrative costs of the TASER Foundation in order to ensure 100% of all donations are distributed to the families of fallen officers. For the years ended December 31, 2011, 2010 and 2009, the Company incurred $5,000, $0.1 million and $0.3 million, respectively, in such administrative costs. For the years ended December 31, 2011, 2010 and 2009, the Company contributed $0, $0 and $35,000, respectively, to the TASER Foundation.
Consulting Services
The Company engages Mark Kroll, a member of the Board of Directors, to provide consulting services. The expenses related to these services for the years ended December 31, 2011, 2010 and 2009 were $0.2 million, $0.2 million, and $0.3 million, respectively. At December 31, 2011 and 2010, the Company had accrued liabilities of $12,475 and $20,000, respectively, related to these services.
Settlement Agreement
On May 15, 2009, Bruce and Donna Culver, husband and wife (the “Culvers”), and the Company, entered into a settlement and release agreement (the “Agreement”), the background and material terms of which are described below. Mr. Culver served as a director of the Company from January 1994 until his retirement on April 9, 2010.
In July 2000, the Culvers provided a loan to the Company in exchange for a promissory note and warrants to purchase 136,364 shares of the Company’s common stock for $0.55 per share. In October 2004, the Culvers exercised the warrants, and the Company issued them a Form 1099, which included the in-the-money value of the warrants as stock compensation based upon the advice of the Company’s then-current outside tax advisors. In 2007, the Culvers informed the Company that their personal tax advisors had determined that the 2004 Form 1099 was not the proper tax treatment for the transaction, and that the value of the warrants should not have been included as compensation because the warrants were issued in connection with the loan rather than services. The Company responded by issuing an amended Form 1099 excluding the value of the warrants, and the Culvers filed an amended 2004 federal tax return seeking a refund. The Culvers are also seeking a refund with respect to their 2004 California tax return.
68
TASER INTERNATIONAL, INC.
NOTES TO CONSOLIDATED FINANCIAL STATEMENTS – (Continued)
The parties entered into the Agreement to settle any disputes that the Culvers might have with the Company in connection with the original Form 1099 that was issued in October 2004 and the Culvers’ resulting tax liability. Pursuant to the Agreement, the Company agreed to pay the Culvers $350,000 upon execution in exchange for a full release, which was recorded in sales, general and administrative expense for the year ended December 31, 2009. The Agreement also contains a claw-back provision, pursuant to which the Culvers agreed to pay to the Company the amount of any refund they receive from the federal government and/or the State of California, up to the $350,000 amount of the settlement payment. The Culvers will be entitled to keep 100% of any refund(s) they receive in excess of $350,000. The Culvers received a refund from the Internal Revenue Service in February 2010 and they continue to seek a refund with respect to the State of California. The Company is working with the Culvers regarding the timing and the form of this payment.
13. Employee Benefit Plan
The Company has a defined contribution profit sharing 401(k) plan (the “Plan”) for eligible employees, which is qualified under Sections 401(a) and 401(k) of the Internal Revenue Code of 1986, as amended. Employees are entitled to make tax-deferred contributions of up to the maximum allowed by law of their eligible compensation, but not exceeding $16,500 in 2010. The Company matches 100% of the first 3% of eligible compensation contributed to the Plan by each participant and 50% of the next 2% of eligible compensation contributed to the Plan by each participant. Beginning January 1, 2008, the Company’s matching contributions are immediately vested. The Company’s matching contributions to the Plan for the years ended December 31, 2011, 2010 and 2009 and were $0.5 million annually. Future matching or profit sharing contributions to the Plan are at the Company’s sole discretion.
14. Joint Venture Agreement
On January 13, 2010, the Company entered into a Joint Venture Agreement (the “Protector Group Agreement”) with RouteCloud, LLC (“RouteCloud”) and certain other parties to establish the TASER Protector Group to exclusively develop, market, sell and support a new suite of products (“Protector Products”) that give parents the ability to manage their children’s mobile phone usage and driving behaviors though a simple-to-use interface on a mobile phone, computer or TV. The Company agreed to provide RouteCloud development funding up to $1.7 million, $0.3 million of which was funded in the fourth quarter of 2009 under a letter of understanding between the parties. During 2010, $1.2 million was funded under the Joint Venture agreement prior to revision on November 2, 2010.
On November 2, 2010, the Company entered into a revised agreement with RouteCloud and the other parties to the Protector Group Agreement, pursuant to which, among other things, the original Protector Group Agreement was terminated retroactively, effective as of September 29, 2010. The new agreement also provides that the Company will (i) reimburse RouteCloud the sum of $75,000 for certain transition expenses, (ii) assume responsibility for the ongoing development, marketing, sale and support of Protector Products, (iii) offer employment or consulting arrangements to certain RouteCloud personnel, and (iv) pay RouteCloud royalties on the sale of Protector Products.
The Company agreed to advance RouteCloud $180,000 in royalties, which advance will be offset against royalties otherwise payable to RouteCloud beginning in the second year following the first revenues from the sale of Protector Products.
During 2010, the Company incurred $0.3 million of salary and consulting related costs related to the internal development of Protector Products following the effective date of the revised agreement with RouteCloud.
During the second quarter of 2011, the Company recognized an impairment charge of $1.4 million relative to its Protector product line following the Company’s decision to abandon the development of this product line. Included in the impairment charges were charges for capitalized software development, prepaid royalties, and presale inventory.
69
TASER INTERNATIONAL, INC.
NOTES TO CONSOLIDATED FINANCIAL STATEMENTS – (Continued)
15. Segment Data
During the fourth quarter of 2011 management determined that its operations are comprised of two reportable segments, the sale of ECDs, accessories and other products and services (the “ECD segment”) and the Video business, which includes the TASER Cam, AXON Video products and EVIDENCE.COM (the “Video segment”). The Company has restated the corresponding items of segment information for earlier periods to reflect the change in the internal organization review structure. On an overall basis, the Company has elected to only put the costs directly attributable to the Video Segment in that segment. Included in these costs are sales, the costs of sales for both products and services, overhead allocation based on direct labor, selling expense for the Video sales team, Video segment product management expenses, Video segment trade shows and related expenses, and research and development for products included in the Video segment.
Information relative to the Company’s reportable segments is as follows:
| 2011 | ||||||||||||
| ECD | Video | Total | ||||||||||
| Product sales |
$ | 86,675,067 | $ | 3,001,143 | $ | 89,676,210 | ||||||
| Service revenue |
— | 351,696 | 351,696 | |||||||||
|
|
|
|
|
|
|
|||||||
| Net sales |
86,675,067 | 3,352,839 | 90,027,906 | |||||||||
|
|
|
|
|
|
|
|||||||
| Cost of products sold |
34,212,839 | 2,692,729 | 36,905,568 | |||||||||
| Cost of service delivered |
— | 4,846,952 | 4,846,952 | |||||||||
| Excess inventory charges |
1,749,099 | 1,997,050 | 3,746,149 | |||||||||
|
|
|
|
|
|
|
|||||||
| Gross margin |
50,713,129 | (6,183,892 | ) | 44,529,237 | ||||||||
|
|
|
|
|
|
|
|||||||
| Litigation judgment |
3,301,243 | — | 3,301,243 | |||||||||
| Loss on impairment |
1,353,857 | — | 1,353,857 | |||||||||
| Loss on write down / disposal of property and equipment, net |
643,560 | 2,156,836 | 2,800,396 | |||||||||
| Income (loss) from operations |
4,463,015 | (15,378,948 | ) | (10,915,933 | ) | |||||||
| Purchase of property and equipment |
1,573,749 | 352,962 | 1,926,711 | |||||||||
| Purchase of intangible assets |
343,983 | — | 343,983 | |||||||||
| Depreciation and amortization |
5,409,026 | 2,687,517 | 8,096,543 | |||||||||
| 2010 | ||||||||||||
| ECD | Video | Total | ||||||||||
| Product sales |
$ | 82,390,462 | $ | 4,460,212 | $ | 86,850,674 | ||||||
| Service revenue |
— | 79,345 | 79,345 | |||||||||
|
|
|
|
|
|
|
|||||||
| Net sales |
82,390,462 | 4,539,557 | 86,930,019 | |||||||||
|
|
|
|
|
|
|
|||||||
| Cost of products sold |
35,018,904 | 3,396,217 | 38,415,121 | |||||||||
| Cost of service delivered |
— | 3,148,023 | 3,148,023 | |||||||||
|
|
|
|
|
|
|
|||||||
| Gross margin |
47,371,557 | (2,004,682 | ) | 45,366,875 | ||||||||
|
|
|
|
|
|
|
|||||||
| Income (loss) from operations |
5,118,532 | (10,258,171 | ) | (5,139,639 | ) | |||||||
| Purchase of property and equipment |
3,156,918 | 1,022,986 | 4,179,904 | |||||||||
| Purchase of intangible assets |
478,984 | — | 478,984 | |||||||||
| Depreciation and amortization |
5,704,286 | 1,582,629 | 7,286,915 | |||||||||
70
TASER INTERNATIONAL, INC.
NOTES TO CONSOLIDATED FINANCIAL STATEMENTS – (Continued)
| 15. | Segment Data, continued |
| 2009 | ||||||||||||
| ECD | Video | Total | ||||||||||
| Product sales |
$ | 101,165,046 | $ | 3,086,514 | $ | 104,251,560 | ||||||
| Service revenue |
— | — | — | |||||||||
|
|
|
|
|
|
|
|||||||
| Net sales |
101,165,046 | 3,086,514 | 104,251,560 | |||||||||
|
|
|
|
|
|
|
|||||||
| Cost of products sold |
39,044,902 | 1,804,249 | 40,849,151 | |||||||||
| Cost of service delivered |
— | — | — | |||||||||
|
|
|
|
|
|
|
|||||||
| Gross margin |
62,120,144 | 1,282,265 | 63,402,409 | |||||||||
|
|
|
|
|
|
|
|||||||
| Income (loss) from operations |
8,049,449 | (8,128,623 | ) | (79,174 | ) | |||||||
| Purchase of property and equipment |
12,539,867 | 2,553,399 | 15,093,266 | |||||||||
| Purchase of intangible assets |
471,697 | — | 471,697 | |||||||||
| Depreciation and amortization |
3,448,217 | 186,195 | 3,634,412 | |||||||||
The CODM does not review assets by segment as part of the financial information provided, therefore no asset information is provided in the above table. Expenses directly attributable to the Video segment are included in this segment, with all other costs remaining in the ECD segment, which is consistent with the Company’s methodology for evaluating each of these segments.
16. Selected Quarterly Financial Data (unaudited)
Selected quarterly financial data for years ended December 31, 2011 and 2010 follows:
| Quarter Ended | ||||||||||||||||
| March 31, | June 30, | September 30, | December 31, | |||||||||||||
| 2011 | 2011 | 2011 | 2011 | |||||||||||||
| Net sales |
$ | 23,116,949 | $ | 21,198,055 | $ | 24,383,110 | $ | 21,329,792 | ||||||||
| Gross margin |
12,208,863 | $ | 12,241,693 | 13,103,608 | 6,975,073 | |||||||||||
| Net income (loss) |
19,732 | (2,294,832 | ) | 1,136,285 | (5,901,051 | ) | ||||||||||
| Basic net income (loss) per share |
$ | 0.00 | $ | (0.04 | ) | $ | 0.02 | $ | (0.11 | ) | ||||||
| Diluted net income (loss) per share |
0.00 | (0.04 | ) | 0.02 | (0.11 | ) | ||||||||||
| Quarter Ended | ||||||||||||||||
| March 31, | June 30, | September 30, | December 31, | |||||||||||||
| 2010 | 2010 | 2010 | 2010 | |||||||||||||
| Net sales |
$ | 23,843,901 | $ | 19,120,525 | $ | 21,084,081 | $ | 22,881,512 | ||||||||
| Gross margin |
13,490,421 | 9,630,710 | 10,415,682 | 11,830,062 | ||||||||||||
| Net loss |
(492,605 | ) | (1,359,389 | ) | (2,335,478 | ) | (196,963 | ) | ||||||||
| Basic net loss per share |
$ | (0.01 | ) | $ | (0.02 | ) | $ | (0.04 | ) | $ | 0.00 | |||||
| Diluted net loss per share |
(0.01 | ) | (0.02 | ) | (0.04 | ) | 0.00 | |||||||||
71
TASER INTERNATIONAL, INC.
NOTES TO CONSOLIDATED FINANCIAL STATEMENTS – (Continued)
The Company has determined that it is impracticable to break out the segment data for the unaudited quarterly data.
The following significant and infrequent charges were incurred during 2011:
| • | Impairment of the Protector product line for $1.4 million, incurred during the second quarter of 2011 |
| • | Losses on disposal of property and equipment of $0.8 million, related to surplus EVIDENCE.COM equipment and billing software, incurred in the second quarter of 2011. |
| • | A litigation judgment reserve for $3.3 million, incurred during the third quarter of 2011. |
| • | Excess inventory charges for the TASER X3 and first generation AXON product lines of $3.7 million, and impairment of associated tooling equipment of $2.0 million, incurred during the fourth quarter of 2011. |
17. Supplemental Disclosure to Cash Flows
Supplemental non-cash and other cash flow information for the years ended December 31, 2011, 2010 and 2009 are as follows:
| 2011 | 2010 | 2009 | ||||||||||
| Supplemental Disclosure: |
||||||||||||
| Cash paid for income taxes - net |
$ | 51,864 | $ | 703,982 | $ | 894,563 | ||||||
| Non Cash Transactions |
||||||||||||
| Property and equipment purchases in accounts payable |
$ | 80,618 | $ | 156,213 | $ | 1,385,089 | ||||||
| Reversal of tax benefit from stock options forfeited |
— | 329,143 | — | |||||||||
72
REPORT OF INDEPENDENT REGISTERED PUBLIC ACCOUNTING FIRM
Board of Directors and Stockholders
TASER International, Inc.
We have audited the accompanying consolidated balance sheets of TASER International, Inc. (a Delaware corporation) and subsidiary (collectively, the “Company”) as of December 31, 2011 and 2010, and the related consolidated statements of operations, comprehensive income (loss), stockholders’ equity, and cash flows for each of the three years in the period ended December 31, 2011. Our audits of the basic consolidated financial statements included the financial statement schedule listed in the index appearing under Item 15(a)(2). These financial statements and financial statement schedule are the responsibility of the Company’s management. Our responsibility is to express an opinion on these financial statements and financial statement schedule based on our audits.
We conducted our audits in accordance with the standards of the Public Company Accounting Oversight Board (United States). Those standards require that we plan and perform the audit to obtain reasonable assurance about whether the financial statements are free of material misstatement. An audit includes examining, on a test basis, evidence supporting the amounts and disclosures in the financial statements. An audit also includes assessing the accounting principles used and significant estimates made by management, as well as evaluating the overall financial statement presentation. We believe that our audits provide a reasonable basis for our opinion.
In our opinion, the consolidated financial statements referred to above present fairly, in all material respects, the financial position of TASER International, Inc. and subsidiary as of December 31, 2011 and 2010, and the results of their operations and their cash flows for each of the three years in the period ended December 31, 2011, in conformity with accounting principles generally accepted in the United States of America. Also in our opinion the related financial statement schedule, when considered in relation to the basic consolidated financial statements taken as a whole, presents fairly, in all material respects, the information set forth therein.
We also have audited, in accordance with the standards of the Public Company Accounting Oversight Board (United States), the Company’s internal control over financial reporting as of December 31, 2011, based on criteria established in Internal Control—Integrated Framework issued by the Committee of Sponsoring Organizations of the Treadway Commission (COSO) and our report dated March 13, 2012, expressed an unqualified opinion on the effectiveness of the Company’s internal control over financial reporting.
/s/ GRANT THORNTON LLP
Phoenix, AZ
March 13, 2012
73
Item 9. Changes in and Disagreements With Accountants on Accounting and Financial Disclosure
None.
Item 9A. Controls and Procedures
Attached as exhibits to this Form 10-K are certifications of the Company’s Chief Executive Officer (CEO) and Chief Financial Officer (CFO), which are required in accordance with Rule 13a-14 of the Securities Exchange Act of 1934, as amended (the “Exchange Act”). This “Controls and Procedures” section includes information concerning the controls and controls evaluation referred to in the certifications. This section should be read in conjunction with the certifications and the Grant Thornton LLP attestation report for a more complete understanding of the topics presented.
Evaluation of Disclosure Controls and Procedures
As of the end of the period covered by this Annual Report on Form 10-K, we evaluated under the supervision of our CEO and our CFO, the effectiveness of our disclosure controls and procedures (as defined in Rules 13a-15(e) or 15d-15(e) of the Exchange Act). Based on this evaluation, our CEO and our CFO have concluded that as of December 31, 2011 our disclosure controls and procedures were effective to ensure that information we are required to disclose in reports that we file or submit under the Exchange Act (i) is recorded, processed, summarized and reported within the time periods specified in Securities and Exchange Commission rules and forms, and (ii) is accumulated and communicated to our management, including our CEO and our CFO, as appropriate to allow timely decisions regarding required disclosure.
Management Report On Internal Control Over Financial Reporting
Our management is responsible for establishing and maintaining adequate internal control over financial reporting to provide reasonable assurance regarding the reliability of our financial reporting and the preparation of consolidated financial statements for external purposes in accordance with U.S. GAAP. Internal control over financial reporting includes those policies and procedures that:
| (i) | Pertain to the maintenance of records that in reasonable detail accurately and fairly reflect the transactions and dispositions of the assets of the company; |
| (ii) | Provide reasonable assurance that transactions are recorded as necessary to permit preparation of consolidated financial statements in accordance with U.S. GAAP, and that receipts and expenditures of the company are being made only in accordance with authorizations of management and directors of the company; and |
| (iii) | Provide reasonable assurance regarding prevention or timely detection of unauthorized acquisition, use or disposition of the company’s assets that could have a material effect on the consolidated financial statements. |
Management assessed our internal control over financial reporting as of December 31, 2011, the end of our fiscal year. Management based its assessment on criteria established in Internal Control—Integrated Framework issued by the Committee of Sponsoring Organizations of the Treadway Commission. Management’s assessment included evaluation of such elements as the design and operating effectiveness of key financial reporting controls, process documentation, accounting policies and our overall control environment. This assessment is supported by testing and monitoring performed by our Internal Audit organization.
Based on our assessment, management has concluded that our internal control over financial reporting was effective as of the end of the fiscal year to provide reasonable assurance regarding the reliability of financial reporting and the preparation of consolidated financial statements for external reporting purposes in accordance with US GAAP. We reviewed the results of management’s assessment with the Audit Committee of our Board of Directors.
Our independent registered public accounting firm, Grant Thornton LLP, who also audited our consolidated financial statements, assessed the effectiveness of our internal control over financial reporting. Grant Thornton LLP has issued their attestation report, which is included herein.
Changes in Internal Control Over Financial Reporting
During the three months ended December 31, 2011, there was no change in our internal control over financial reporting identified in connection with the evaluation required by paragraph (d) of Rule 13a-15 or Rule 15d-15 that has materially affected, or is reasonably likely to materially affect, our internal control over financial reporting.
74
REPORT OF INDEPENDENT REGISTERED PUBLIC ACCOUNTING FIRM
Board of Directors and Stockholders
TASER International, Inc.
We have audited TASER International, Inc.’s (a Delaware corporation) internal control over financial reporting as of December 31, 2011, based on criteria established in Internal Control—Integrated Framework issued by the Committee of Sponsoring Organizations of the Treadway Commission (COSO). TASER International, Inc.’s management is responsible for maintaining effective internal control over financial reporting and for its assessment of the effectiveness of internal control over financial reporting, included in the accompanying “Management’s Report on Internal Control Over Financial Reporting”. Our responsibility is to express an opinion on TASER International, Inc.’s internal control over financial reporting based on our audit.
We conducted our audit in accordance with the standards of the Public Company Accounting Oversight Board (United States). Those standards require that we plan and perform the audit to obtain reasonable assurance about whether effective internal control over financial reporting was maintained in all material respects. Our audit included obtaining an understanding of internal control over financial reporting, assessing the risk that a material weakness exists, testing and evaluating the design and operating effectiveness of internal control based on the assessed risk, and performing such other procedures as we considered necessary in the circumstances. We believe that our audit provides a reasonable basis for our opinion.
A company’s internal control over financial reporting is a process designed to provide reasonable assurance regarding the reliability of financial reporting and the preparation of financial statements for external purposes in accordance with generally accepted accounting principles. A company’s internal control over financial reporting includes those policies and procedures that (1) pertain to the maintenance of records that, in reasonable detail, accurately and fairly reflect the transactions and dispositions of the assets of the company; (2) provide reasonable assurance that transactions are recorded as necessary to permit preparation of financial statements in accordance with generally accepted accounting principles, and that receipts and expenditures of the company are being made only in accordance with authorizations of management and directors of the company; and (3) provide reasonable assurance regarding prevention or timely detection of unauthorized acquisition, use, or disposition of the company’s assets that could have a material effect on the financial statements.
Because of its inherent limitations, internal control over financial reporting may not prevent or detect misstatements. Also, projections of any evaluation of effectiveness to future periods are subject to the risk that controls may become inadequate because of changes in conditions, or that the degree of compliance with the policies or procedures may deteriorate.
In our opinion, TASER International, Inc. and subsidiary maintained, in all material respects, effective internal control over financial reporting as of December 31, 2011, based on criteria established in Internal Control—Integrated Framework issued by COSO.
We also have audited, in accordance with the standards of the Public Company Accounting Oversight Board (United States), the consolidated balance sheets of TASER International, Inc. and subsidiary as of December 31, 2011 and 2010, and the related consolidated statements of operations, comprehensive income (loss), stockholders’ equity, and cash flows for each of the three years in the period ended December 31, 2011. Our audits of the basic financial statements included the financial statement schedule listed in the index appearing under Item 15(a)(2). Our report dated March 13, 2012, expressed an unqualified opinion on those consolidated financial statements and the financial statement schedule.
/s/ GRANT THORNTON LLP
Phoenix, AZ
March 13, 2012
75
None.
Item 10. Directors, Executive Officers and Corporate Governance
The information required to be disclosed by this item is incorporated herein by reference to our definitive proxy statement for the 2012 Annual Meeting of Stockholders (our 2012 Proxy Statement) which proxy statement we expect to file with the Securities and Exchange Commission within 120 days after the end of our fiscal year ended December 31, 2011.
Item 11. Executive Compensation
The information required to be disclosed by this item is incorporated herein by reference to our 2012 Proxy Statement.
Item 12. Security Ownership of Certain Beneficial Owners and Management and Related Stockholder Matters
The information required to be disclosed by this item is incorporated herein by reference to our 2012 Proxy Statement.
Equity Compensation Plan Information
The following table provides details of our equity compensation plans at December 31, 2011:
| Number of | Weighted | Number of | ||||||||||
| Securities | Average | Securities | ||||||||||
| to be Issued upon | Exercise | Remaining | ||||||||||
| Exercise of | Price of | Under Equity | ||||||||||
| Outstanding | Outstanding | Compensation | ||||||||||
| Options, Warrants | Options, Warrants | Plans for | ||||||||||
| Plan Category |
and Rights | and Rights | Future Issuance | |||||||||
| Equity compensation plans approved by security holders |
7,577,589 | $ | 5.75 | 1,666,543 | ||||||||
| Equity compensation plans not approved by security holders |
— | — | — | |||||||||
|
|
|
|
|
|
|
|||||||
| Total |
7,577,589 | $ | 5.75 | 1,666,543 | ||||||||
|
|
|
|
|
|
|
|||||||
Refer to Note [11(c)] to the consolidated financial statements in Part II, Item 8 of this Annual Report for more information on the Company’s equity compensation plans.
Item 13. Certain Relationships and Related Transactions, and Director Independence
The information required to be disclosed by this item is incorporated herein by reference to our 2012 Proxy Statement.
Item 14. Principal Accounting Fees and Services
The information required to be disclosed by this item is incorporated by reference to our 2012 Proxy Statement.
76
Item 15. Exhibits, Financial Statement Schedules
| (a) | The following documents are filed as part of this report: |
| 1. | Consolidated financial statements: All consolidated financial statements as set forth under Part II, Item 8 of this report. |
| 2. | Supplementary Financial Statement Schedules: Schedule II — Valuation and Qualifying Accounts |
Other schedules have not been included because they are not applicable or because the information is included elsewhere in this report.
SCHEDULE VALUATION AND QUALIFYING ACCOUNTSSCHEDULE II – VALUATION AND QUALIFYING ACCOUNTS
| Balance at | Charged to | Charged to | Balance at | |||||||||||||||||
| Beginning | Costs and | Other | End of | |||||||||||||||||
| Description |
of Period | Expenses | Accounts | Deductions | Period | |||||||||||||||
| Allowance for doubtful accounts: |
||||||||||||||||||||
| Year ended December 31, 2011 |
$ | 200,000 | $ | 296,366 | $ | — | $ | (46,366 | ) | $ | 450,000 | |||||||||
| Year ended December 31, 2010 |
200,000 | 48,903 | — | (48,903 | ) | 200,000 | ||||||||||||||
| Year ended December 31, 2009 |
200,000 | 82,251 | — | (82,251 | ) | 200,000 | ||||||||||||||
| Allowance for excess and obsolete inventory: |
||||||||||||||||||||
| Year ended December 31, 2011 |
$ | 350,664 | $ | 4,610,197 | $ | — | $ | (529,989 | ) | $ | 4,430,872 | |||||||||
| Year ended December 31, 2010 |
474,074 | 1,278,284 | (129,900 | ) | (1,271,794 | ) | 350,664 | |||||||||||||
| Year ended December 31, 2009 |
129,900 | 821,983 | — | (477,809 | ) | 474,074 | ||||||||||||||
| Warranty reserve: |
||||||||||||||||||||
| Year ended December 31, 2011 |
$ | 646,113 | $ | 309,779 | $ | — | $ | (528,433 | ) | $ | 427,459 | |||||||||
| Year ended December 31, 2010 |
369,311 | 843,268 | — | (566,466 | ) | 646,113 | ||||||||||||||
| Year ended December 31, 2009 |
615,031 | 92,278 | — | (337,998 | ) | 369,311 | ||||||||||||||
77
| 3. | Exhibits: |
| Exhibit |
Description | |
| 3.1 | Certificate of Incorporation, as amended (incorporated by reference to Exhibit 3.1 to Registration Statement on Form SB-2, effective May 11, 2001 (Registration No. 333-55658), as amended) | |
| 3.2 | Bylaws, as amended (incorporated by reference to Exhibit 3.2 to Registration Statement on Form SB-2, effective May 11, 2001 (Registration No. 333-55658), as amended) | |
| 3.3 | Certificate of Amendment to Certificate of Incorporation dated September 1, 2004 (incorporated by reference to Exhibit 3.3 to the Annual Report on Form 10-KSB, filed March 31, 2005) | |
| 4.1 | Form of Common Stock Certificate (incorporated by reference to Exhibit 4.2 to Registration Statement on Form SB-2, effective May 11, 2001 (Registration No. 333-55658), as amended) | |
| 10.1* | Executive Employment Agreement with Patrick W. Smith, dated July 1, 1998 (incorporated by reference to Exhibit 10.1 to Registration Statement on Form SB-2 effective May 11, 2001 (Registration No. 333-55658), as amended) | |
| 10.2* | Executive Employment Agreement with Thomas P. Smith, dated November 15, 2000 (incorporated by reference to Exhibit 10.2 to Registration Statement on Form SB-2 effective May 11, 2001 (Registration No. 333-55658), as amended) | |
| 10.3* | Form of Indemnification Agreement between the Company and its directors (incorporated by reference to Exhibit 10.4 to Registration Statement on Form SB-2 effective May 11, 2001 (Registration No. 333-55658), as amended) | |
| 10.4* | Form of Indemnification Agreement between the Company and its officers (incorporated by reference to Exhibit 10.5 to Registration Statement on Form SB-2 effective May 11, 2001 (Registration No. 333-55658), as amended) | |
| 10.5* | 1999 Stock Option Plan (incorporated by reference to Exhibit 10.6 to Registration Statement on Form SB-2, effective May 11, 2001 (Registration No. 333-55658), as amended) | |
| 10.6* | 2001 Stock Option Plan (incorporated by reference to Exhibit 10.7 to Registration Statement on Form SB-2, effective May 11, 2001 (Registration No. 333-55658), as amended) | |
| 10.7 | Form of Sales Representative Agreement with respect to services by and between the Company and Sales Representatives (incorporated by reference to Exhibit 10.15 to the Annual Report on Form 10-KSB, filed March 18, 2002) | |
| 10.8* | Executive Employment Agreement with Douglas E. Klint, dated December 15, 2002 (incorporated by referenced to Exhibit 10.17 to the Annual Report on Form 10-KSB, filed March 14, 2003) | |
| 10.9 | Credit Agreement dated June 22, 2004, between the Company and Bank One (incorporated by reference to Exhibit 10.13 to the Annual Report on Form 10-KSB, filed March 31, 2005) | |
| 10.10 | Amendment to Credit Agreement dated as of October 31, 2006 between the Company and JP Morgan Chase Bank, N.A. (incorporated by reference to Exhibit 10.17 to Form 8-K, filed November 6, 2006) | |
| 10.11* | Executive Employment Agreement with Daniel Behrendt, dated April 28, 2004 (incorporated by reference to Exhibit 10.14 to the Annual Report on Form 10-KSB, filed March 31, 2005) | |
| 10.12* | 2004 Stock Option Plan (incorporated by reference to Exhibit 10.15 to the Annual Report on Form 10-KSB, filed March 31, 2005) | |
| 10.13* | 2004 Outside Director Stock Option Plan, as amended (incorporated by reference to exhibit 10.16 to the Annual Report on Form 10-KSB, filed March 31, 2005) | |
| 10.14 | 2009 Stock Incentive Plan. (incorporated by reference to Appendix A to the Company’s 2009 Proxy Statement, filed April 15, 2009) | |
| 10.15 | Agreement with Automation Tooling Systems Inc. for purchase of equipment (incorporated by reference to Exhibit 10.18 to the Quarterly Report on Form 10-Q, filed August 9, 2007) | |
| 10.16* | Executive Employment Agreement with Steven Mercier, dated February 11, 2008 (incorporated by reference to Exhibit 10.16 to the Annual Report on Form 10-K, filed February 29, 2008) | |
| 10.17* | Executive Employment Agreement with Jas Dhillon, dated August 1, 2008 (incorporated by reference to Exhibit 10.17 to the Annual Report on Form 10-K, filed March 16, 2009) | |
| 10.18 | Agreement with William D. Kennedy, WDK Enterprises, LLC and RouteCloud, LLC, dated November 2, 2010 (incorporated by reference to Exhibit 10.1 to the Quarterly Report on Form 10-Q, filed November 8, 2010) | |
| 10.19 | Amendment to Credit Agreement dated as of June 23, 2011 between the Company and JP Morgan Chase Bank, N.A (incorproated by reference to Exhibit 10.1 to the Quarterly Report on Form 10-Q, filed August, 8, 2011) | |
| 14.1 | Code of Business Conduct and Ethics, as adopted by the Company’s Board of Directors (incorporated by reference to Exhibit 14.1 to the Annual Report on Form 10-KSB, filed March 31, 2005) | |
| 21.1 | List of Subsidiaries | |
| 23.1 | Consent of Grant Thornton, LLP, independent registered public accounting firm | |
| 31.1 | Principal Executive Officer Certification pursuant to Rule 13a-14(a) or Rule 15d-14(a) | |
| 31.2 | Principal Financial Officer Certification pursuant to Rule 13a-14(a) or Rule 15d-14(a) | |
| 32.0 | Principal Executive Officer and Principal Financial Officer Certification pursuant to 18 U.S.C. Section 1350 as adopted pursuant to Section 906 of the Sarbanes-Oxley Act of 2002 | |
78
| * | Management contract or compensatory plan or arrangement |
SIGNATURES
Pursuant to the requirements of Section 13 or 15(d) of the Securities Exchange Act of 1934, the registrant has duly caused this report to be signed on its behalf by the undersigned, thereunto duly authorized.
TASER INTERNATIONAL, INC.
Date: March 13, 2012
| By: | /s/ PATRICK W. SMITH | |||||
| Chief Executive Officer |
Date: March 13, 2012
| By: | /s/ DANIEL M. BEHRENDT | |||||
| Chief Financial Officer | ||||||
| (Principal Financial and Accounting Officer) |
79
KNOW ALL PERSONS BY THESE PRESENTS, that each person whose signature appears below constitutes and appoints Patrick W. Smith his or her true and lawful attorney-in-fact and agent, with full power of substitution and resubstitution, for him or her and in his or her name, place and stead, in any and all capacities, to sign any and all amendments to this Annual Report on Form 10-K, and to file the same, with all exhibits thereto and other documents in connection therewith the Securities and Exchange Commission, granting unto said attorney-in-fact and agent full power and authority to do and perform each and every act and thing requisite and necessary to be done in and about the premises, as fully and to all intents and purposes as he or she might or could do in person hereby ratifying and confirming all that said attorney-in-fact and agent, or his substitute or substitutes, may lawfully do or cause to be done by virtue hereof.
Pursuant to the requirements of the Securities Exchange Act of 1934, this report has been signed by the following persons on behalf of the registrant and in the capacities and on the dates indicated.
| Signature |
Title |
Date | ||
| /s/ PATRICK W. SMITH Patrick W. Smith |
Director | March 13, 2012 | ||
| /s/ MATTHEW R. MCBRADY Matthew R. McBrady |
Director | March 13, 2012 | ||
| /s/ HADI PARTOVI Hadi Partovi |
Director | March 13, 2012 | ||
| /s/ JUDY MARTZ Judy Martz |
Director | March 13, 2012 | ||
| /s/ MARK W. KROLL Mark W. Kroll |
Director | March 13, 2012 | ||
| /s/ MICHAEL GARNREITER Michael Garnreiter |
Director | March 13, 2012 | ||
| /s/ JOHN S. CALDWELL John S. Caldwell |
Director | March 13, 2012 | ||
| /s/ RICHARD H. CARMONA Richard H. Carmona |
Director | March 13, 2012 | ||
80