Attached files
| file | filename |
|---|---|
| 8-K - 8-K - BLACKSTONE MORTGAGE TRUST, INC. | d37490d8k.htm |
| EX-99.1 - EX-99.1 - BLACKSTONE MORTGAGE TRUST, INC. | d37490dex991.htm |
 Blackstone Mortgage Trust, Inc. October 27, 2015 Third Quarter 2015 Results Exhibit 99.2 ****************** |
 Blackstone Mortgage Trust 1 Third Quarter 2015 Highlights Core Earnings (a) of $68 million, or $0.72 per share, driven by the accretive effects of the GE portfolio acquisition and the increased scale of the business. Increased dividend by 19% to $0.62 per share, reflecting the stabilized earnings power of the current senior floating rate loan investment strategy. Book value per share of $26.64 and GAAP net income of $67 million, or $0.72 per share. Loan closings totaled $886 million (b) and fundings totaled $868 million, (b) including $85 million of follow-on fundings under previously originated loans. Loan repayments of $497 million of directly-originated loans and $537 million of loans in the acquired GE portfolio. GE repayments were in line with underwriting and funded a $125 million (53%) reduction of the portfolio’s add-on advance acquisition financing. Executed ten loan extensions and upsizes during the quarter, reflecting the increased scale of asset management activity following the GE portfolio acquisition. Added $1.0 billion of financing capacity, including a €400 million multicurrency revolving credit facility to finance European loan program. Information included in this presentation is as of or for the period ended September 30, 2015, unless otherwise indicated. See Appendix
for a definition of Core Earnings and a reconciliation to GAAP
net income, a definition of gross return on investment (“Gross ROI”), as well as certain per share calculations that are referenced throughout this presentation. (a) 3Q 2015 Core Earnings reported net of incentive fee expenses. See Appendix for comparable presentations of prior period Core Earnings.
(b)
Includes non-consolidated senior interests of $534 million, and $491
million of related loan fundings. |
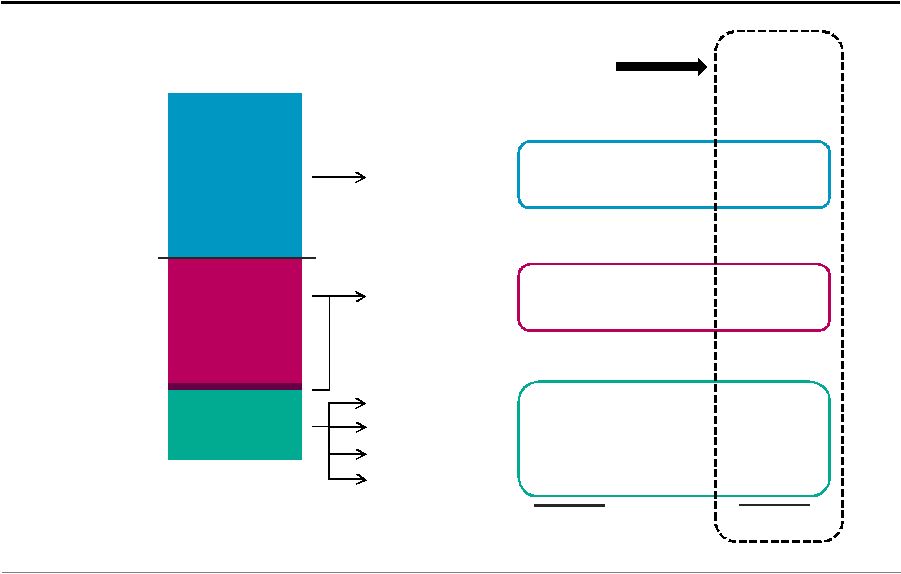 Blackstone Mortgage Trust 2 Third Quarter 2015 Balance Sheet, Net Income, and Core Earnings (a) (Dollars in Millions) $2,121 $164 $7,093 $9,378 CT Legacy net income Secured financings ($51.3) Equity and other (c) $0.4 ($3.2) ($13.8) ($2.0) Loan portfolio $136.8 $66.9 $0.4 ($2.0) Interest income Interest expense Non-cash comp. $134.8 ($50.9) Core Earnings (b) Net Income $67.5 + + + Convertible notes, net Balance Sheet (a) See Appendix page 14 for Second Quarter 2015 Balance Sheet, Net Income, and Core Earnings.
(b) See Appendix pages 15 and 12, respectively, for a definition of Core Earnings and a reconciliation to GAAP net income.
(c) Includes stockholders’ equity of $2.5 billion, less the net of (i) cash and cash equivalents of $139 million, (ii) certain accrued
interest receivable, prepaid expenses, and other assets of $306
million, (iii) certain accounts payable, accrued expenses, and other liabilities of $87 million, and (iv) CT Legacy portfolio net equity value of $8 million. Mgmt./Incentive fees ($0.4) $3.2 $- ($0.5) $- $- ($13.8) ($2.5) G&A/other |
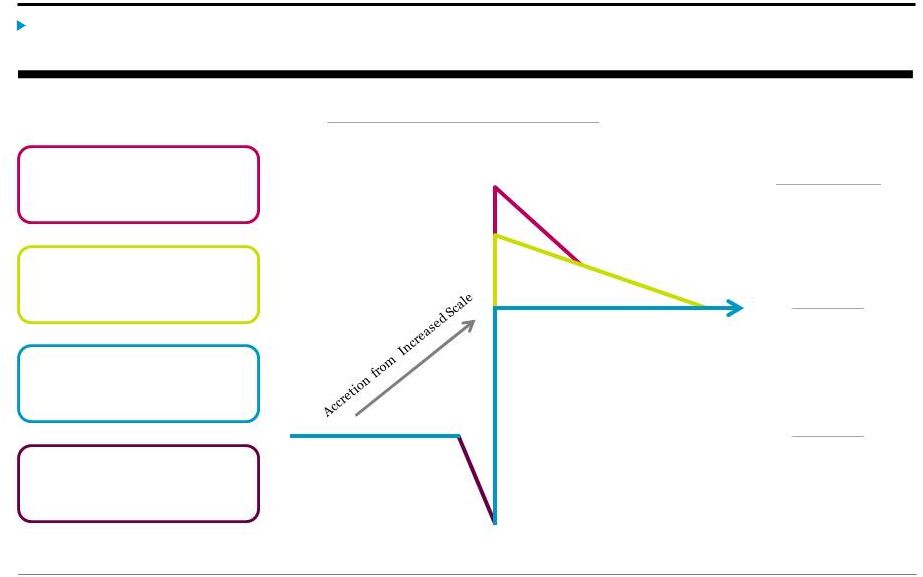 Blackstone Mortgage Trust 3 3Q Core Earnings $0.72 per share 3Q Dividend Analysis The $0.62 dividend reflects the stabilized earnings power of the senior floating rate investment strategy at its increased scale and Core Earnings of $0.72 includes the accretive effects of the GE portfolio acquisition. Core Earnings Stabilization (a) Senior floating rate loans, reinvested on an ongoing basis GE fixed rate loans with 1.7 year weighted average life (b) Additional yield from add-on financing of GE loans Transaction costs & deployment lag concentrated in 2Q 2015 3Q Dividend $0.62 per share 1Q Dividend $0.52 per share (a) Not presented to scale. (b) Weighted average life (“WAL”) calculation considers the amount and timing of contractual repayments through the expiration date
of call protection for each loan. |
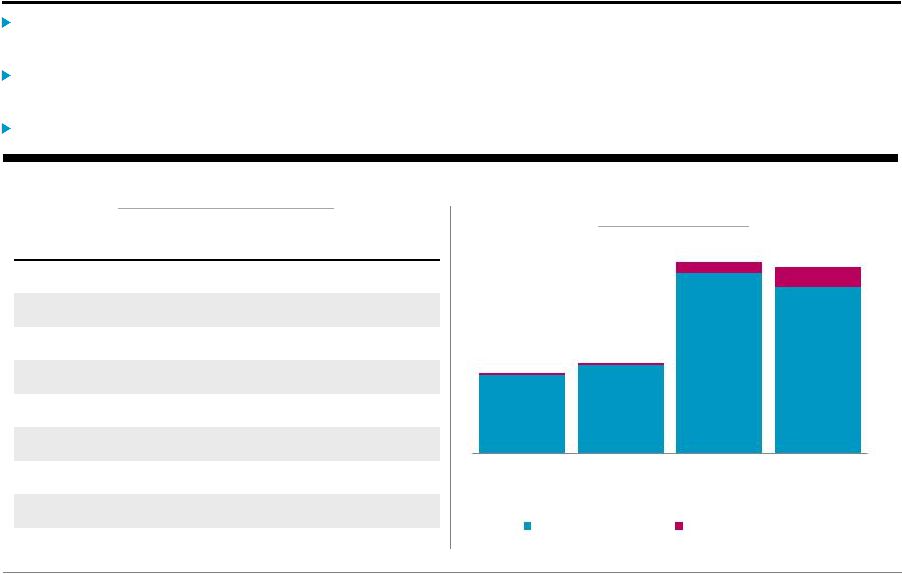 Blackstone Mortgage Trust 4 Loan Portfolio Overview Closed four new loans totaling $886 million (a) including a £367 million seven-year, fixed rate loan that is term financed through the sale of a non-consolidated senior interest. Loan repayments of $497 million of directly-originated loans plus $537 million of loans in the GE portfolio. Portfolio metrics remain consistent, with Gross ROI (b)(c) of 14.4% and LTV of 64%. Loan Portfolio Statistics (a) Includes non-consolidated senior interests of $534 million. (b) See Appendix for a definition of gross return on investment (“Gross ROI”), which among other things, assumes full leverage at
the asset level based on the maximum available leverage in place
or in negotiation for each investment, notwithstanding the amount actually borrowed. (c) Assumes applicable floating benchmark rates for weighted-average calculation. Weighted average coupon and all-in yield exclude subordinate loans, which are not comparable to other loans as they are reported net of related non-consolidated senior interests. Gross ROI calculation includes all loans and
related financings. (d)
Excludes non-consolidated senior interests of $1.1 billion.
(e) Maximum maturity assumes all extension options are exercised, however floating rate loans may generally be repaid prior to their final
maturity without penalty. (Dollars in Millions)
Floating Fixed Total Number of loans 96 36 132 Principal balance (d) $7,340 $2,073 $9,413 Net book value (d) $7,304 $2,074 $9,378 Wtd. avg. origination LTV 63% 64% 64% Wtd. avg. cash coupon (c) L + 4.00% 5.32% 4.55% Wtd. avg. all-in yield (c) L + 4.37% 5.46% 4.87% Wtd. avg. Gross ROI (b)(c) L + 12.7% 18.4% 14.4% Wtd. avg. maximum maturity (e) 3.4 yrs. 2.9 yrs. 3.3 yrs. Loan Portfolio Growth (Principal Balance in Millions) $4,573 $5,088 $10,830 $10,550 GAAP Balance Sheet Non-Consolidated Senior Interests 4Q'14 1Q'15 2Q'15 3Q'15 |
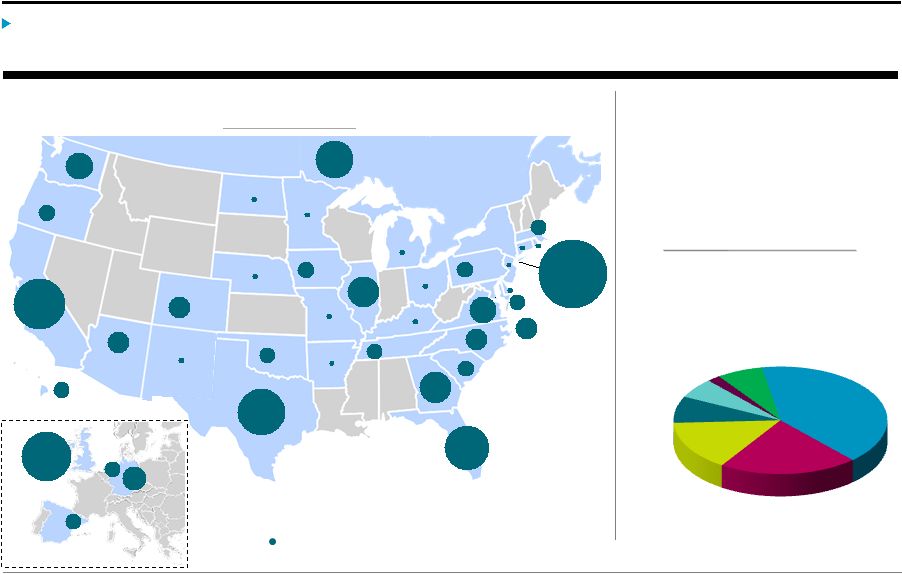 Blackstone Mortgage Trust 5 Portfolio Diversification BXMT’s portfolio is diversified by collateral property type and geographic location, and is comprised of primarily senior mortgages and similar credit quality loans. Collateral Diversification (Net Book Value, % of Total) 41% 21% 15% 8% 6% 7% Office Multifamily Hotel Condo 2% Other Retail Manufactured Housing (MHC) Geographic Diversification (Net Book Value,% of Total) Senior Loans (a) (Net Book Value, % of Total) 97% States that comprise less than 1% of total loan portfolio NM 0.4% NY 20% CA 11% TX 9% CAN 6% FL 8% GA 4% IL 4% WA 3% VA 3% DC 2% NC 2% CO 2% AZ 2% HI 1% MA 1% MD 1% OR 1% IA 1% SC 1% TN, 1% OK 1% PA 1% DEU 3% UK 10% ES 1% NL 1% (a) Senior loans include senior mortgages and similar credit quality loans, including related contiguous subordinate loans and pari passu participations in senior mortgage loans. |
 Blackstone Mortgage Trust 6 Financing Capacity Closed an additional $1.0 billion of financing capacity during the quarter, including a new €400 million multicurrency revolving credit facility. Continued opportunistic use of senior syndications, with two transactions during the quarter providing an aggregate $534 million of leverage. Total liquidity of $555 million (a) at quarter-end, providing for $2.0 billion (a) of potential loan originations and fundings. $10.4 Total Financing Capacity (Dollars in Billions) $4.6 • Seven facilities with outstanding borrowings of $2.8 billion • All-in cost of L+2.04% Revolving Credit Facilities $2.2 (b) • 11 transactions with nine counterparties; pricing directly related to underlying collateral assets • $743 million outstanding on balance sheet; remaining non-consolidated senior interests Asset-Specific (b) Financings $3.6 • Asset-specific advances totaling $3.4 billion • All-in cost of L+1.90% GE Portfolio Financing (a) Total liquidity includes $139 million of cash and $417 million of available borrowings. Potential loan originations assumes 4.0x asset-level leverage on total liquidity, net of $142 million of minimum liquidity requirements under applicable debt covenants. (b) BXMT’s balance sheet includes asset-specific repurchase agreements of $235 million and loan participations sold of $507 million. Capacity of $2.2 billion also includes $1.4 billion of non-consolidated senior interests, which result from non-recourse sales of senior loan interests in loans BXMT originates. BXMT’s net investments in these loans are reflected in the form of mezzanine or other subordinate loans on BXMT’s balance sheet. |
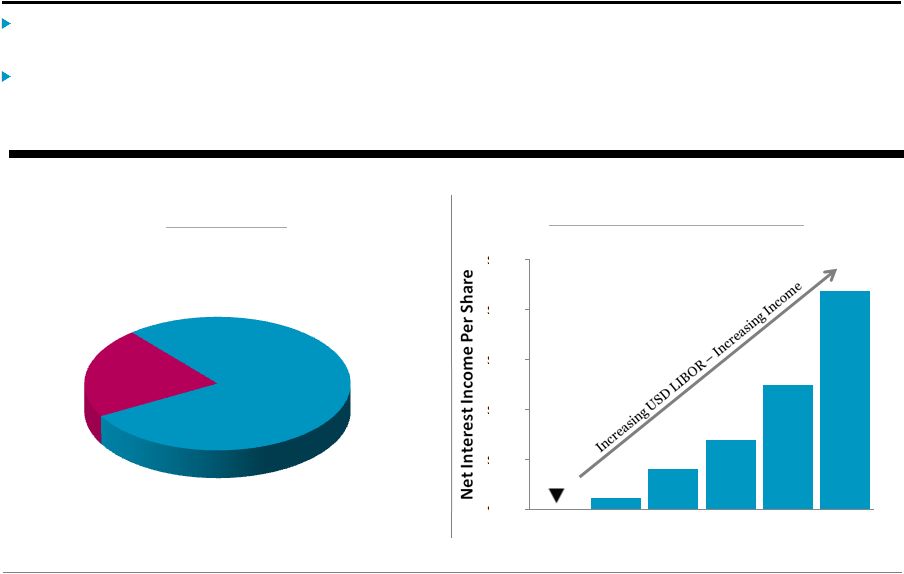 Blackstone Mortgage Trust 7 Interest Rates Earnings are positively correlated to changes in USD and GBP LIBOR, the benchmark indices for 74% of BXMT’s loan portfolio and related secured financings. Concentration of fixed rate assets in EUR and CAD results in an inverse correlation to EURIBOR and CDOR; an increase in either benchmark rate by 50bps would decrease annual Core Earnings by less than $0.02 per share. (a) As of September 30, 2015, $1.1 billion of floating rate loans earned interest based on floors that were above the applicable index, with
an average floor of 0.64%.
Portfolio Income Sensitivity to USD LIBOR
(Annual Dollars of Net Interest Income per share)
78%
22%
Portfolio Fixed vs. Floating
(% of Principal Balance)
Floating
(a)
Fixed
$0.00 $0.05 $0.10 $0.15 $0.20 $0.25 0.19% 0.69% 1.19% 1.69% 2.19% 2.69% USD LIBOR |
 Appendix *********************** |
 Blackstone Mortgage Trust 9 Loan Portfolio Details The following table provides details of BXMT’s loan portfolio:
(a) Date loan was originated or acquired by BXMT, and the LTV as of such date.
(b) Maximum maturity date assumes all extension options are exercised, however (c) Loan consists of one or more floating and fixed rate tranches. Coupon and all-in yield assume applicable floating benchmark rates for
weighted-average calculation. (d)
Includes (i) 112 senior loans with an aggregate principal balance of $5.9 billion and (ii) five mezzanine loans with an aggregate principal balance of $261 million resulting from BXMT’s sale of the related non-consolidated senior interests. (e) Weighted average coupon and all-in yield exclude subordinate loans, which are not comparable to other loans as they are reported net of syndicated amounts. (Dollars in Millions) Loan Type Origination Date (a) Total Loan Principal Balance Book Value Cash Coupon All-In Yield Maximum Maturity (b) Geographic Location Property Type Origination LTV (a) Loan 1 Senior loan 6/11/2015 340 $ 340 $ 341 $ 4.88% (c) 4.92% (c) 4/30/2019 Diversified-US MHC 78% Loan 2 Senior loan 6/23/2015 306 306 307 5.26% (c) 5.33% (c) 1/31/2017 Diversified-US MHC 60% Loan 3 Senior loan 5/22/2014 303 303 300 L+4.00% L+4.34% 5/22/2019 U.K. Hotel 57% Loan 4 Senior loan 5/1/2015 320 295 292 L+3.45% L+3.83% 5/1/2020 NY Office 68% Loan 5 Senior loan 1/7/2015 315 267 264 L+3.50% L+3.95% 1/9/2020 NY Office 53% Loan 6 Senior loan 6/4/2015 262 259 262 5.53% (c) 5.56% (c) 2/9/2019 Canada Hotel 54% Loan 7 Senior loan 6/23/2015 212 212 212 5.38% 5.53% 1/18/2017 Germany Retail 53% Loan 8 Senior loan 6/11/2015 206 206 207 4.76% (c) 4.83% (c) 1/31/2017 Diversified-US MHC 65% Loan 9 Senior loan 3/4/2015 170 170 170 L+4.25% L+4.25% 3/9/2017 WA Office 64% Loan 10 Senior loan 2/25/2014 166 166 165 L+4.40% L+4.82% 3/9/2019 Diversified-US Hotel 49% Loan 11 Senior loan 12/9/2014 211 165 164 L+3.80% L+4.31% 12/9/2019 Diversified-US Office 65% Loan 12 Senior loan 7/31/2014 215 163 163 L+3.50% L+4.09% 8/9/2019 IL Office 70% Loan 13 Senior loan 1/7/2014 156 156 156 L+4.75% L+5.14% 1/7/2019 Diversified-US Other 58% Loan 14 Senior loan 6/23/2015 154 146 146 L+5.00% L+5.01% 12/20/2017 D.C. Office 72% Loan 15 Senior loan 11/20/2014 145 145 144 L+3.40% L+3.62% 11/20/2019 U.K. Hotel 62% Loan 16-132 Various (d) Various 6,670 6,114 6,085 4.32% 4.68% Various Various Various 64% Total/Wtd. avg. (e) 10,151 $ 9,413 $ 9,378 $ 4.55% 4.87% 3.3 years 64% floating rate loans may generally be repaid prior to their final maturity without penalty. |
 Blackstone Mortgage Trust 10 Consolidated Balance Sheet (Dollars in Thousands, Except per Share Data) September 30, 2015 December 31, 2014 Assets Cash and cash equivalents 138,600 $
51,810 $
Restricted cash
9,063 11,591 Loans receivable, net 9,377,591 4,428,500 Equity investments in unconsolidated subsidiaries 7,496 10,604 Accrued interest receivable, prepaid expenses, and other assets 319,118 86,016 Total assets 9,851,868 $
4,588,521 $
Liabilities and equity
Accounts payable, accrued expenses, and other liabilities
95,153 $
61,013
$
Secured debt
agreements 6,585,654
2,365,336 Loan participations sold 507,200 499,433 Convertible notes, net 163,699 161,853 Total liabilities 7,351,706 3,087,635 Equity Class A common stock, $0.01 par value 932 583 Additional paid-in capital 3,066,662 2,027,404 Accumulated other comprehensive loss (27,588) (15,024) Accumulated deficit (552,881) (547,592) Total Blackstone Mortgage Trust, Inc. stockholders’ equity 2,487,125 1,465,371 Non-controlling interests 13,037 35,515 Total equity 2,500,162 1,500,886 Total liabilities and equity 9,851,868 $
4,588,521 $ |
 Blackstone Mortgage Trust 11 Consolidated Statement of Operations (Dollars in Thousands, Except per Share Data) Three Months Ended September 30, Nine Months Ended September 30, 2015 2014 2015 2014 Income from loans and other investments Interest and related income 138,361 $
50,386 $
282,249 $
126,507 $
Less: Interest and related expenses
51,329 19,903 106,125 47,697 Income from loans and other investments,
net 87,032
30,483
176,124
78,810
Other expenses Management and incentive fees 13,813 5,412 28,535 13,219 General and administrative
expenses 5,295
3,368 28,655 21,920 Total other expenses
19,108 8,780 57,190 35,139 Unrealized (loss) gain on investments at fair
value (82)
1,780 22,108 7,604 Income from equity investments in
unconsolidated subsidiaries 17
- 5,677
24,294
Income before income taxes 67,859 23,483 146,719 75,569 Income tax provision (benefit)
81 (118)
431
412 Net
income 67,778
$
23,601
$
146,288
$
75,157
$
Net
income attributable to non-controlling interests
(890) (1,577)
(14,724)
(6,602)
Net income attributable to Blackstone Mortgage Trust, Inc. 66,888 $
22,024 $
131,564 $
68,555 $
Per share information (basic and diluted)
Weighted-average shares of common stock outstanding
93,357,960 49,211,205 77,752,247 45,093,314 Net income per share of common stock
0.72 $
0.45
$
1.69
$
1.52
$
|
 Blackstone Mortgage Trust 12 Per Share Calculations (Amounts in Thousands, Except per Share Data) Core Earnings Reconciliation Book Value per Share Earnings per Share (a) Adjustment in respect of the deferral in Core Earnings of the accretion of a total $9.1 million of purchase discount attributable to a
certain pool of GE portfolio loans pending the repayment of those
loans. September 30, 2015
June 30, 2015 Stockholders' equity 2,487,125 $
2,483,124 $
Shares Class A common stock 93,213 93,230
Deferred
stock units 135
130 Total outstanding
93,348 93,360
Book value
per share 26.64
$
26.60 $
Three Months Ended
September 30, 2015
June 30, 2015 Net income 66,888 $
29,284 $
Weighted-average shares
outstanding, basic and diluted
93,358 80,941
Earnings per
share, basic and diluted 0.72
$
0.36 $
Three Months Ended
September 30, 2015
June 30, 2015 Net income 66,888 $
29,284 $
CT Legacy Portfolio net income
(401) (1,857)
Non-cash compensation expense
3,188 3,396
GE purchase discount accretion adjustment
(a) (2,008) (459)
Other items (119) 416
Core Earnings 67,548 $
30,780 $
Weighted-average shares outstanding, basic and diluted
93,358 80,941
Core
Earnings per share, basic and diluted 0.72
$
0.38 $
|
 Blackstone Mortgage Trust 13 Reconciliation of Net Income to Core Earnings (a) (a) Beginning in the third quarter of 2015, Core Earnings is reported net of incentive fee expenses. Prior period Core Earnings have also
been presented above net of incentive fees to allow for
comparability. (Amounts in Thousands, Except per Share
Data) Three Months Ended
Nine Months Ended
March 31, 2015 June 30, 2015 September 30, 2015 September 30, 2015 Net income 35,393 $
29,284
$
66,888 $
131,565
$
CT Legacy Portfolio segment
net income (8,400)
(1,857) (401) (10,658) Non-cash compensation expense 3,297 3,396 3,188 9,881 GE purchase discount accretion adjustment (a) - (459) (2,008) (2,467) Other items 342 416 (119) 639 Core Earnings 30,632 $
30,780
$
67,548 $
128,960
$
Weighted-average shares
outstanding, basic and diluted 58,576
80,941 93,358 77,752 $
Net income per share, basic and diluted
0.60 $
0.36
$
0.72 $
1.69
$
Core Earnings per share, basic and diluted 0.52 $
0.38
$
0.72 $
1.66
$
|
 Blackstone Mortgage Trust 14 Second Quarter 2015 Balance Sheet, Net Income, and Core Earnings (a) (Dollars in Millions) $2,243 $163 $7,725 $10,131 CT Legacy net income Secured financings ($30.6) Equity and other (b) $1.9 ($3.4) ($9.5) ($9.0) Loan Origination portfolio $80.0 $29.3 $0.4 ($0.5) Interest income Interest expense Non-cash comp. $79.5 ($30.2) Core Earnings (a) Net Income $30.8 + + + Convertible notes, net Balance Sheet (a) See Appendix pages 15 and 12, respectively, for a definition of Core Earnings and a reconciliation to GAAP net income.
(b) Includes stockholders’ equity of $2.5 billion, less the net of (i) cash and cash equivalents of $104 million, (ii) certain accrued
interest receivable, prepaid expenses, and other assets of $202
million, (iii) certain accounts payable, accrued expenses, and other liabilities of $73 million, and (iv) CT Legacy portfolio net equity value of $8 million. Mgmt. fees/G&A ($1.9) $3.4 $- $- $- $- ($9.5) ($9.0) Transaction expenses |
 Blackstone Mortgage Trust 15 Definitions Core Earnings: Blackstone Mortgage Trust, Inc. (“BXMT”) discloses Core Earnings, a financial measure that is calculated and presented on the basis of methodologies other than in accordance with generally accepted accounting principles in the United States of America (“GAAP”) in this presentation. Core Earnings is an adjusted measure that helps BXMT evaluate its performance excluding the effects of certain transactions and GAAP adjustments that it believes are not necessarily indicative of its current loan origination portfolio and operations. Although according to its management agreement BXMT calculates the incentive and base management fees due to its Manager using Core Earnings before incentive fees expense, beginning with the third quarter of 2015, BXMT will report Core Earnings after incentive fees expense, as BXMT believes this is a more meaningful presentation of the economic performance of its class A common stock. Core Earnings is defined as GAAP net income (loss), including realized losses not otherwise included in GAAP net income (loss), and excluding (i) net income (loss) attributable to the CT Legacy Portfolio, (ii) non-cash equity compensation expense, (iii) depreciation and amortization, (iv) unrealized gains (losses), and (v) certain non-cash items. Core Earnings may also be adjusted from time to time to exclude one-time events pursuant to changes in GAAP and certain other non-cash charges as determined by BXMT’s manager, subject to approval by a majority of its independent directors. Core Earnings does not represent net income or cash generated from operating activities and should not be considered as an alternative to GAAP net income, or an indication of BXMT’s GAAP cash flows from operations, a measure of BXMT’s liquidity, or an indication of funds available for its cash needs. In addition, BXMT’s methodology for calculating Core Earnings may differ from the methodologies employed by other companies to calculate the same or similar supplemental performance measures, and accordingly, its reported Core Earnings may not be comparable to the Core Earnings reported by other companies. Weighted average gross return on investment (“Gross ROI”): Investment return based on each asset’s all-in yield, assuming current rates with no dispositions, early repayments, or defaults, and all-in cost of secured debt, assuming full leverage at the asset level based on the maximum available leverage in place or in negotiation for each investment, notwithstanding the amount actually borrowed. Gross ROI includes the impact of financing the fixed rate loans in the GE portfolio with floating rate debt, but excludes costs related to convertible notes, the sequential pay advance under the GE portfolio acquisition facility, management fees, and other corporate-level expenses. Gross ROI is presented solely for informational purposes and is not representative of net income recognized in prior or future periods. |
 Blackstone Mortgage Trust 16 Forward-Looking Statements This presentation may contain forward-looking statements within the meaning of Section 27A of the Securities Act of 1933, as amended, and Section 21E of the Securities Exchange Act of 1934, as amended, which reflect Blackstone Mortgage Trust’s (“BXMT”) current views with respect to, among other things, BXMT’s operations and financial performance, including performance of its recently acquired loan portfolio from GE Capital. You can identify these forward-looking statements by the use of words such as “outlook,” “indicator,” “believes,” “expects,” “potential,” “continues,” “may,” “will,” “should,” “seeks,” “approximately,” “predicts,” “intends,” “plans,” “estimates,” “anticipates” or the negative version of these words or other comparable words. Such forward-looking statements are subject to various risks and uncertainties. Accordingly, there are or will be important factors that could cause actual outcomes or results to differ materially from those indicated in these statements. BXMT believes these factors include but are not limited to those described under the section entitled “Risk Factors” in its Annual Report on Form 10-K for the fiscal year ended December 31, 2014 and under the section entitled “Risks Related to the Loan Portfolio Acquisition” in its Quarterly Report on Form 10-Q for the fiscal quarter ended March 31, 2015, as such factors may be updated from time to time in its periodic filings with the Securities and Exchange Commission (“SEC”) which are accessible on the SEC’s website at www.sec.gov. These factors should not be construed as exhaustive and should be read in conjunction with the other cautionary statements that are included in this presentation and in the filings. BXMT assumes no obligation to update or supplement forward-looking statements that become untrue because of subsequent events or circumstances. |