Attached files
| file | filename |
|---|---|
| 8-K - FORM 8-K - Yellow Corp | d12011d8k.htm |
 YRC Worldwide Inc. Cowen Conference September 10, 2015 1 Exhibit 99.1 |
 Disclaimer Disclaimer 2 This presentation includes the presentation of Adjusted EBITDA, a non-GAAP financial measure. Adjusted EBITDA is not a measure
of financial performance in accordance with generally
accepted accounting principles and may exclude items that are significant in understanding and assessing our financial results. Therefore, this measure should not be considered in isolation or as an alternative to net income from
operations, cash flows from operations, earnings per
fully-diluted share or other measures of profitability, liquidity or performance under generally accepted accounting principles. You should be aware that this presentation of Adjusted EBITDA may not be comparable to similarly-titled measures used by other
companies. A reconciliation of this measure to the most
comparable measures presented in accordance with generally accepted accounting principles has been included in this presentation. The information in this presentation is summary in nature and may not contain all information that is important to you. The
Recipient acknowledges and agrees that (i) no
representation or warranty regarding the material contained in this presentation is made by YRC Worldwide Inc. (the “Company” or “we”) or any of its affiliates and (ii) that the Company and its affiliates have no obligation to update or
supplement this presentation or otherwise provide
additional information. This presentation is for discussion and reference purposes only and does not constitute an offer to sell or the solicitation of an offer to buy any securities or other property.
This presentation contains “forward-looking statements” within the meaning of Section 27A of the Securities Act of
1933 and Section 21E of the Securities Exchange Act of
1934. Forward-looking statements relate to future events or future performance of the Company and include statements about the Company’s expectations or forecasts for future periods and events. Specific forward-looking statements can be
identified by the fact that they do not relate strictly to
historical or current facts and include, without limitation, words such as “may,” “will,” “should,” “expect,” “plan,” “anticipate,”
“believe,” “estimate,” “predict,”
“potential” or “continue,” the negative of such terms or other comparable terminology. We disclaim any obligation to update those statements, except as applicable law may require us to do so, and we caution you not to rely unduly on them. We have
based those forward-looking statements on our current
expectations and assumptions about future events, and while our management considers those expectations and assumptions to be reasonable, they are inherently subject to significant business, economic, competitive,
regulatory and other risks, contingencies and
uncertainties, most of which are difficult to predict and many of which are beyond our control. Therefore, actual results may differ materially and adversely from those expressed in any forward-looking statements. Factors that might cause or contribute
to such differences include, but are not limited to, those
we discuss in the “Risk Factors” section of our Annual Report on Form 10-K and in other reports we file with the Securities and Exchange Commission.
|
 YRC Worldwide is one of the largest less-than-truckload (LTL) carriers in
North America and generates approximately $5B of revenue
by providing services under a portfolio of four
subsidiaries Approximately 24% of the public carrier market
share by tonnage Providing the broadest coverage and more
service capability throughout North America than any
competitor 3
Introduction |
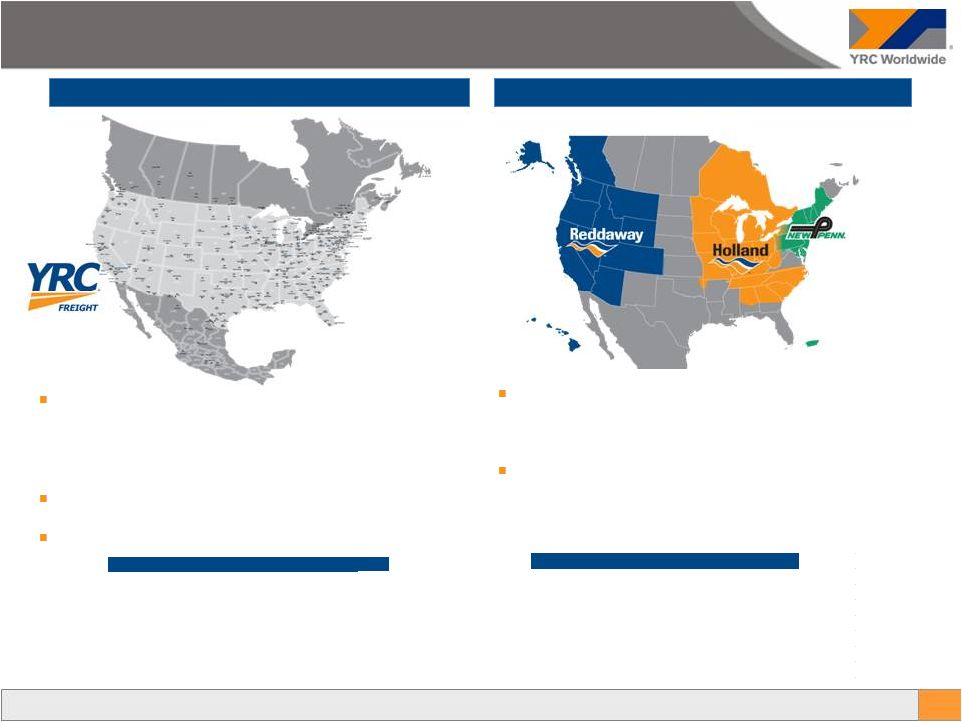  YRC Freight and Regional Transportation
Formed by the combination of Yellow Transportation
and Roadway Express
–
Roadway acquired in 2003 and integrated in 2009
Branded as YRC Freight in early 2012
Focused on longer-haul LTL shipping
Three distinct carriers serving separate regions
–
Holland, Reddaway and New Penn
–
Well established brands with long histories
Focused on next-day and time-sensitive services
YRC Freight
YRC Regional
4 YRC Freight Metric LTM revenue $3.2 billion LTM Adj. EBITDA $167 million # of Customers ~128,000 # of Terminals 259 Average Length of Haul 1,300 miles Average Weight 1,000 lbs Average Transit 3-4 days YRC Regional Metric LTM revenue $1.8 billion LTM Adj. EBITDA $159 million # of Customers ~266,000 # of Terminals 125 Average Length of Haul 400 miles Average Weight 1,300 lbs Average Transit > 90% in 2 days or less |
 Diversified Customer Base Diversified Customer Base Long-standing and stable relationships with a large, diversified base of customers
– Customers range from Fortune 1000 global corporations to small, privately-held businesses
– Top 5 customers account for ~10% of total revenue Recognized by customers as leading operator – Recently received Wal-Mart’s “2014 National LTL Carrier of the Year” award for outstanding service
• Received this award in 3 of the last 5 years Diversified Customer Base 5 |
 Largest LTL Operator in North America Largest LTL Operator in North America Market share stability 24% market share by tonnage (public LTL carriers only) YRC Freight and YRC Regional’s combined networks cover all 50 states, Puerto Rico, Canada and Mexico – Broad footprint with service to over 250,000 customers Scale is important for an LTL operator given the large “hub and spoke” network infrastructure required and the significant operating leverage associated with the business model’s fixed costs Historical market share by tonnage based upon publicly traded LTL carriers only.
Market share by tonnage reflects Q2 2015 data.
6 24% 25% 24% 25% 23% 24% 0% 5% 10% 15% 20% 25% 30% Historical Market Share 2.3% 5.6% 6.2% 9.1% 13.1% 16.2% 23.7% 23.7% 0.0% 5.0% 10.0% 15.0% 20.0% 25.0% Market Share by Tonnage (Public LTL Carriers Only) |
 YOY Revenue per Shipment and Revenue per cwt YOY Revenue per Shipment and Revenue per cwt Both segments experiencing positive pricing growth driven by a focused effort on improving yield and further supported by a favorable industry pricing environment
Note: Percent change calculation based on unrounded figures and not the
rounded figures presented 7
+6.4% +9.8% +6.5% +5.2% $9.75 $10.26 $9.40 $9.60 $9.80 $10.00 $10.20 $10.40 2Q14 2Q15 Regional Revenue per cwt (x-FSC) $19.45 $20.70 $18.50 $19.00 $19.50 $20.00 $20.50 $21.00 2Q14 2Q15 YRCF Revenue per cwt (x-FSC) $143 $152 $135 $140 $145 $150 $155 2Q14 2Q15 Regional Revenue per Shipment (x-FSC) $228 $250 $210 $220 $230 $240 $250 $260 2Q14 2Q15 YRCF Revenue per Shipment (x-FSC) |
 YOY Volume YOY Volume Note: Percent change calculation based on unrounded figures and not the rounded figures presented
8 -9.1% -6.2% -4.7% -3.5% 48.35 43.95 35.00 40.00 45.00 50.00 2Q14 2Q15 YRC Freight Shipments per Day 44.91 42.82 35.00 40.00 45.00 50.00 2Q14 2Q15 Regional Shipments per Day 28.29 26.53 25.00 27.00 29.00 2Q14 2Q15 YRC Freight Tonnage per Day 32.86 31.71 26.00 28.00 30.00 32.00 34.00 2Q14 2Q15 Regional Tonnage per Day YoY decrease at YRCF due to shift away from minimum charge and lighter shipments and toward higher yielding business YOY decrease at the Regionals is primarily due to efforts to better manage capacity and service performance |
 $147.0 $159.2 $140.0 $145.0 $150.0 $155.0 $160.0 $165.0 2Q14 2Q15 Regional LTM Adjusted EBITDA $59.4 $167.2 $.0 $50.0 $100.0 $150.0 $200.0 2Q14 2Q15 YRCF LTM Adjusted EBITDA $21.5 $53.1 $.0 $10.0 $20.0 $30.0 $40.0 $50.0 $60.0 2Q14 2Q15 YRCF 2Q Adjusted EBITDA $42.1 $56.6 $.0 $10.0 $20.0 $30.0 $40.0 $50.0 $60.0 2Q14 2Q15 Regional 2Q Adjusted EBITDA Segment Adjusted EBITDA Segment Adjusted EBITDA ($ in millions) 9 YRC Freight improvement driven by increased yield, partially offset by lower volume and lower productivity
Regional performance driven by increased yield, partially offset
by decreased volumes, lower productivity and higher
equipment lease costs Note: Percent change calculation
based on unrounded figures and not the rounded figures presented +147.0% +181.4% +34.4% +8.3% |
 YRCW Adjusted EBITDA YRCW Adjusted EBITDA ($ in millions) 10 Improved EBITDA and margin growth due to yield growth and strong base pricing environment, partially
offset by lower volume, lower productivity, and higher equipment lease
costs Highest LTM EBITDA since 2008
Note: Percent change calculation based on unrounded figures and not the
rounded figures presented +$46.4M
+120.3M
+250bps
+390bps
4.1% 6.6% 0.0% 1.0% 2.0% 3.0% 4.0% 5.0% 6.0% 7.0% 2Q14 2Q15 LTM Adjusted EBITDA Margin $206.5 $326.8 $.0 $50.0 $100.0 $150.0 $200.0 $250.0 $300.0 $350.0 2Q14 2Q15 LTM Adjusted EBITDA 4.8% 8.7% 0.0% 2.0% 4.0% 6.0% 8.0% 10.0% 2Q14 2Q15 2Q Adjusted EBITDA Margin $63.0 $109.4 $.0 $20.0 $40.0 $60.0 $80.0 $100.0 $120.0 2Q14 2Q15 2Q Adjusted EBITDA |
 Leverage Ratio Leverage Ratio 11 Steady progress every year since 2010 – Lowest implied leverage in 8 years – Standard & Poor’s increased YRCW’s credit rating to B- from CCC+ in August 2015 YRCW is on much stronger footing as a result of reduced debt and increased earnings
Note: Funded debt balances based on par value
3.6x reduction
since 2010
11.9x
8.5x 5.8x 5.3x 4.6x 3.9x 3.3x 0.0x 2.0x 4.0x 6.0x 8.0x 10.0x 12.0x 14.0x 2010 2011 2012 2013 2014 LTM 1Q15 LTM 2Q15 Funded Debt / Adjusted EBITDA |
 12.4% 8.3% 4.5% 2.2% 2.7% 0.0% 2.0% 4.0% 6.0% 8.0% 10.0% 12.0% 14.0% Industry ex YRCW YRC Regional YRC Freight LTM 2Q15 EBITDA Margin Opportunity for EBITDA Margin Growth Opportunity for EBITDA Margin Growth 12 Today, despite YoY improvement, YRC Freight’s EBITDA margin still lags the industry – 2Q15 = 5.9% – LTM 2Q15 = 4.5% YRC Regionals while better still lag the industry on a current basis as well – 2Q15 = 11.8% – LTM 2Q15 = 8.3% Significant opportunity for both segments to achieve margin improvements – Assuming current market performance of an OR of 91 to 93, the long-term EBITDA margin segment goals are as follows: YRCF = 7.2% (equivalent to an OR of 95 – 96) Regional = 10.5% (equivalent to an OR of 93 – 94) Note: For comparison purposes, EBITDA for all companies is defined as Operating Income, excluding gains or losses from property
sales, plus Depreciation and Amortization. EBITDA used to calculate EBITDA margin for YRCW above differs from the credit agreement definition of Consolidated Adjusted EBITDA.
10.5% 7.2% 2Q15 YRC Freight YRC Regional Revenue 795.2 $
463.2
$
EBITDA
45.8 55.8 (Gains) / losses on property sales 0.8 (1.3) EBITDA less (gains) / losses on property sales 46.6 $
54.5 $
EBITDA margin, less (gains) / losses on property sales
5.9% 11.8% LTM 2Q15 YRC Freight YRC Regional Revenue 3,171.3 $ 1,813.9 $ EBITDA 151.6 146.3 (Gains) / losses on property sales (8.4) 3.6 EBITDA less (gains) / losses on property sales 143.2 $
149.9
$
EBITDA margin, less (gains) / losses on property
sales 4.5%
8.3% |
 Re-investment in the Business Re-investment in the Business 13 After several years of curtailing investment in the business, capital spending has resumed Fleet replenishment through operating leases beginning in 2013 Increased leasing activity due to greater financing options resulting from the Company’s improved financial condition Acquired 44 dimensioners since 2014. Dimensioning technology is used to better cost, price and plan freight loading and flow For the LTM 2Q15, the CapEx Equivalent (CapEx plus the Capital Value of Leases) was 4.2% of revenue. This brings the
Company more in line with the industry standard of 4% to 5%
YRCW’s goal is to more aggressively replenish the fleet through
a combined approach of purchasing and leasing new tractors
and trailers
YRCW is also focusing on additional technology investments
– In-cab collision detection systems to enhance safety – Tablets for dock supervisors to more efficiently manage dock operations – Logistical planning technology to improve driver efficiencies – Further roll-out of dimensioning technology $19 $72 $66 $67 $69 $79 $87 $8 $70 $72 $100 $126 $19 $72 $75 $137 $142 $179 $213 $- $50 $100 $150 $200 $250 2010 2011 2012 2013 2014 LTM 1Q15 LTM 2Q15 CapEx Equivalent CapEx Capital Value of Leases 0.4% 1.5% 1.5% 2.8% 2.8% 3.5% 4.2% 0.0% 1.0% 2.0% 3.0% 4.0% 5.0% 2010 2011 2012 2013 2014 LTM 1Q15 LTM 2Q15 CapEx Equivalent - as a % Revenue |
 Safety o Additional field safety trainers and the deployment of in-cab technology that includes adaptive cruise control, stability control and lane departure warning o “Journey to One” will drive behavior toward world class safety results through technology, training, communication and compliance YRC Freight 2015 Initiatives YRC Freight 2015 Initiatives 14 Efficiency o In our 23 distribution centers, we have process improvement teams in place that are streamlining standard work to eliminate waste o Productivity and quality lift through bottom-up engagement of the workforce, clarifying and closing the cultural gaps that have existed since integration, and continuous improvement toward positive discretionary effort Service o Driver recruiting, hiring and training through military partnership, dock to drive program, and centralized driver recruiting department o Constancy of purpose on the YRC Freight service cycle, network optimization and upgraded linehaul systems Everyone Sells o Right price, right lanes through clear customer communication and pricing technology that drives network beneficial tonnage while protecting yield progression o Yield progression and volume growth and retention through sales process discipline |
 15 Strong Industry Position Stable Capital Structure Diversified Business Model National Footprint / Tremendous Asset Base Experienced Management Team Turnaround Still Has Legs Via Margin Expansion YRCW – Investment Thesis |
 Appendix 16 |
 EBITDA Reconciliation – Consolidated EBITDA Reconciliation – Consolidated 17 (a) As required under our Term Loan Agreement, other, net, shown above consists of the impact of certain items to be included in
Adjusted EBITDA under our Term Loan Agreement. YRCW
Consolidated 2Q15
2Q14 LTM 2Q15 LTM 2Q14 Reconciliation of net loss to adjusted EBITDA: Net income (loss) 26.0 $
(4.9)
$
11.8
$
(119.0)
$
Interest expense, net
27.9 31.6 115.0 172.4 Income tax expense (benefit) 2.3 (7.9)
(0.4)
(43.4)
Depreciation and amortization
41.3 41.0 164.5 167.2 EBITDA 97.5 59.8 290.9 177.2 Adjustments for debt covenants: Losses (gain) on property disposals, net (0.7) (6.5)
(5.0)
(5.3)
Letter of credit expense
2.2 2.1 9.2 23.5 Restructuring professional fees - -
3.1
10.2
Nonrecurring consulting fees
3.0 -
5.9
-
Permitted dispositions and other
0.1
-
1.9
2.1
Equity based compensation expense
3.2 2.5 8.9 10.9 Amortization of ratification bonus 4.6 5.2 20.2 5.2 (Gain) loss on extinguishment of debt
-
-
0.6 (11.2)
Other, net (a)
(0.5)
(0.1)
(8.9)
(6.0)
Adjusted EBITDA
109.4
$
63.0 $
326.8
$
206.5
$
Revenue
1,258.4
$
1,317.6
$
4,985.1
$
4,988.9
$
Adjusted EBITDA Margin
8.7% 4.8% 6.6% 4.1% |
 EBITDA Reconciliation – Segment EBITDA Reconciliation – Segment 18 (b) As required under our Term Loan, other nonoperating, net, shown above does not include the impact of non-cash foreign
currency gains or losses. YRC Freight segment
2Q15 2Q14 1H15 1H14 LTM 2Q15 LTM 2Q14 Reconciliation of operating income (loss) to adjusted EBITDA: Operating income (loss) 22.5 $ (0.3) $
22.7 $ (32.8) $ 56.0 $ (57.9) $ Depreciation and amortization 23.3 24.9 47.2 49.6 95.6 102.8 EBITDA 45.8 24.6 69.9 16.8 151.6 44.9 Adjustments for debt covenants: (Gains) loss on property disposals, net 0.8 (6.7) 0.6 (6.9) (8.4) (6.4) Letter of credit expense 1.5 1.4 3.0 5.0 6.3 16.2 Nonrecurring consulting fees 3.0 - 5.9 - 5.9 - Amortization of ratification bonus 3.0 3.3 6.3 3.3 13.0 3.3 Other nonoperating, net (b) (1.0) (1.1) (0.5) (0.4) (1.2) 1.4 Adjusted EBITDA 53.1 $ 21.5 $ 85.2 $ 17.8 $ 167.2 $ 59.4 $ Regional Transportation segment 2Q15 2Q14 1H15 1H14 LTM 2Q15 LTM 2Q14 Reconciliation of operating income to adjusted EBITDA: Operating income 37.7 $ 23.2 $ 42.3 $ 31.1 $ 77.3 $ 73.8 $ Depreciation and amortization 18.1 16.2 35.8 32.6 69.0 64.6 EBITDA 55.8 39.4 78.1 63.7 146.3 138.4 Adjustments for debt covenants: Losses on property disposals, net (1.3) 0.2 0.2 0.6 3.6 1.1 Letter of credit expense 0.5 0.6 1.0 1.8 2.1 5.6 Amortization of ratification bonus 1.6 1.9 3.5 1.9 7.2 1.9 Adjusted EBITDA 56.6 $ 42.1 $ 82.8 $ 68.0 $ 159.2 $ 147.0 $ |