Attached files
| file | filename |
|---|---|
| EX-99.1 - EX-99.1 - McEwen Mining Inc. | a15-19190_1ex99d1.htm |
| 8-K - 8-K - McEwen Mining Inc. | a15-19190_18k.htm |
Exhibit 99.2
|
|
September 9, 2015 1 CONTACT: Christina McCarthy, Director,Corporate Development, 1.866.441.0690 • cd@mcewenmining.com • facebook.com/mcewenrob • twitter.com/mcewenmining IF YOU BELIEVE GOLD IS GOING HIGHER CONSIDER BUYING MUX |
|
|
Cautionary Statement 2 This presentation contains certain forward-looking statements and information, including "forward-looking statements" within the meaning of the Private Securities Litigation Reform Act of 1995. The forward-looking statements and information expressed, as at the date of this news release, McEwen Mining Inc.'s (the "Company") estimates, forecasts, projections, expectations or beliefs as to future events and results. Forward-looking statements and information are necessarily based upon a number of estimates and assumptions that, while considered reasonable by management, are inherently subject to significant business, economic and competitive uncertainties, risks and contingencies, and there can be no assurance that such statements and information will prove to be accurate. Therefore, actual results and future events could differ materially from those anticipated in such statements and information. Risks and uncertainties that could cause results or future events to differ materially from current expectations expressed or implied by the forward-looking statements and information include, but are not limited to, factors associated with fluctuations in the market price of precious metals, mining industry risks, political, economic, social and security risks associated with foreign operations, the ability of the corporation to receive or receive in a timely manner permits or other approvals required in connection with operations, risks associated with the construction of mining operations and commencement of production and the projected costs thereof, risks related to litigation, the state of the capital markets, environmental risks and hazards, uncertainty as to calculation of mineral resources and reserves, risk of delisting from a public exchange, and other risks. The Company's dividend policy will be reviewed periodically by the Board of Directors and is subject to change based on certain factors such as the capital needs of the Company and its future operating results. Readers should not place undue reliance on forward-looking statements or information included herein, which speak only as of the date hereof. The Company undertakes no obligation to reissue or update forward-looking statements or information as a result of new information or events after the date hereof except as may be required by law. See McEwen Mining's Annual Report on Form 10-K for the fiscal year ended December 31, 2014 and Quarterly Report on Form 10-Q for the quarter ended June 30, 2015, and other filings with the Securities and Exchange Commission, under the caption "Risk Factors", for additional information on risks, uncertainties and other factors relating to the forward-looking statements and information regarding the Company. All forward-looking statements and information made in this news release are qualified by this cautionary statement. All currency information quoted in U.S. dollars. To see end notes, technical disclosure and cautionary guidance, and cautionary note regarding NON-GAAP measures, go to www.mcewenmining.com/files/presentation_disclosure.pdf |
|
|
3 10 Reasons MUX To Own |
|
|
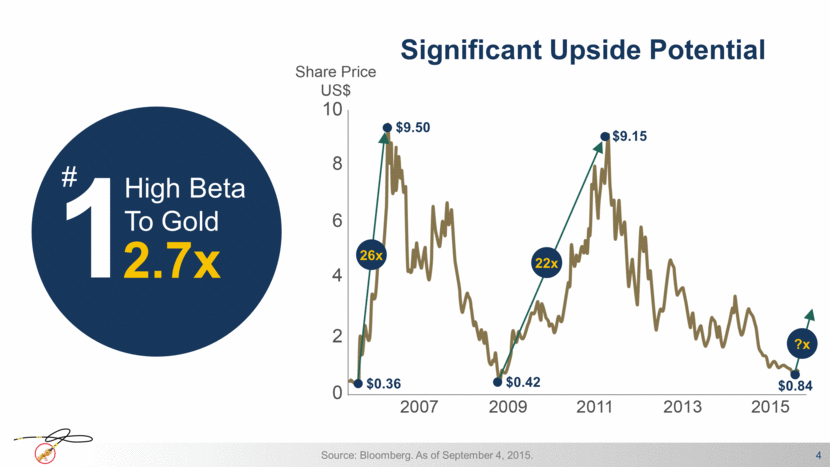
4 Source: Bloomberg. As of September 4, 2015. High Beta To Gold 2.7x Significant Upside Potential 1 $9.50 $9.15 $0.42 $0.36 $0.84 26x 22x ?x # |
|
|
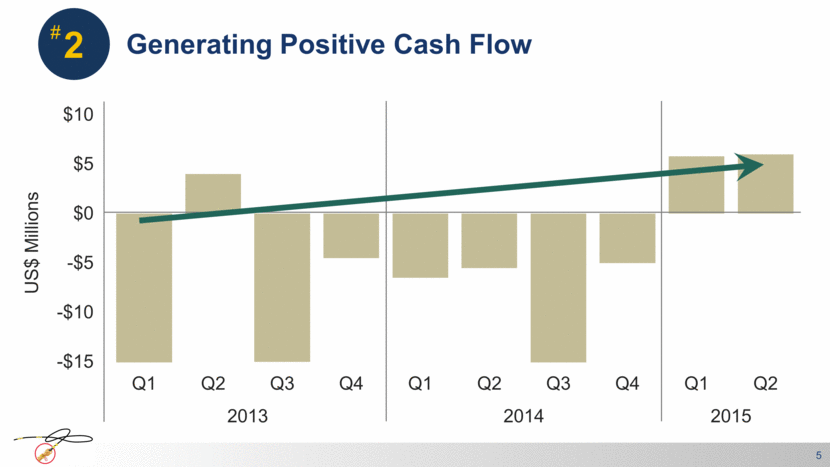
Generating Positive Cash Flow 5 2 # -$15 -$10 -$5 $0 $5 $10 Q1 Q2 Q3 Q4 Q1 Q2 Q3 Q4 Q1 Q2 2013 2014 2015 US$ Millions |
|
|
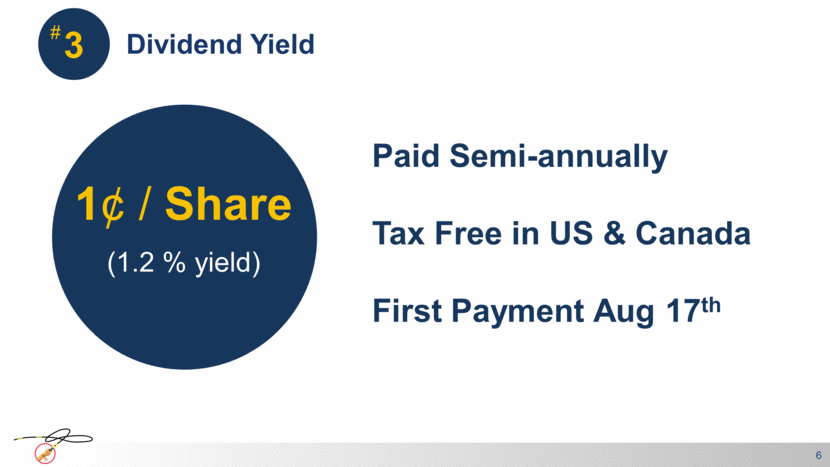
Dividend Yield 6 3 (1.2 % yield) 1¢ / Share Paid Semi-annually Tax Free in US & Canada First Payment Aug 17th # |
|
|
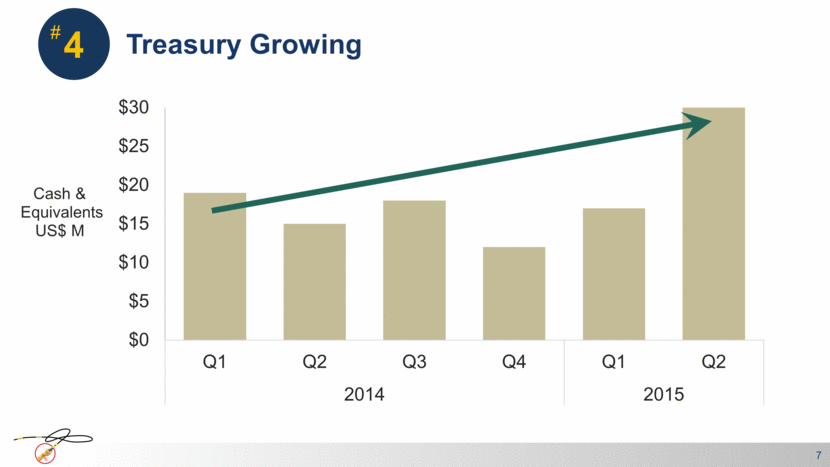
Treasury Growing 7 4 # |
|
|
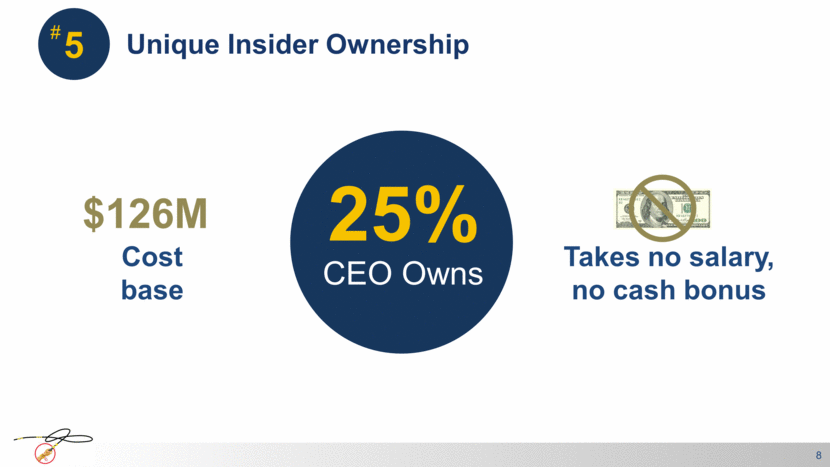
Takes no salary, no cash bonus Cost base $126M Unique Insider Ownership 8 5 CEO Owns 25% # |
|
|
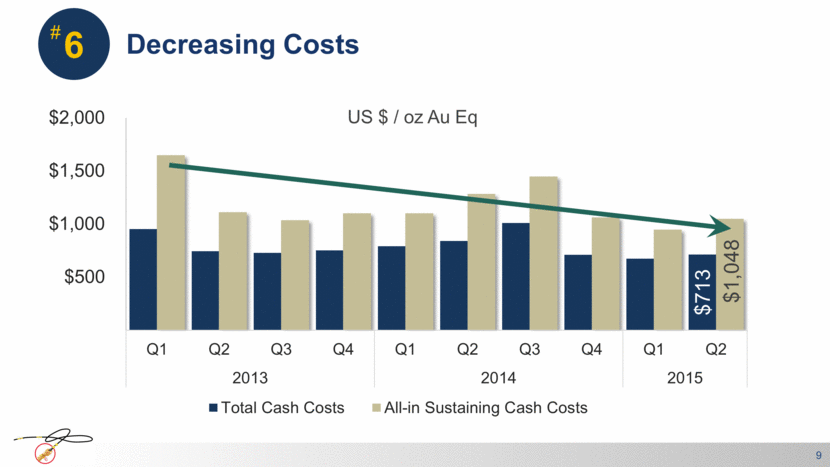
Decreasing Costs 9 6 $713 $1,048 # $- $500 $1,000 $1,500 $2,000 Q1 Q2 Q3 Q4 Q1 Q2 Q3 Q4 Q1 Q2 2013 2014 2015 US $ / oz Au Eq Total Cash Costs All-in Sustaining Cash Costs |
|
|
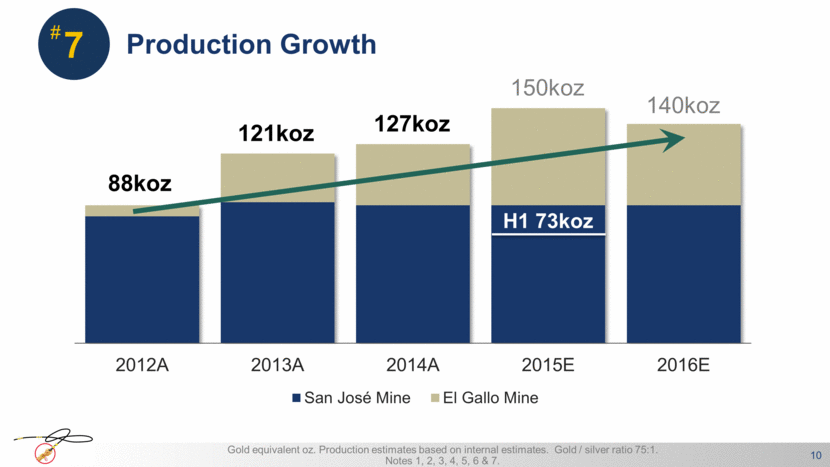
Production Growth 10 150koz 127koz 121koz 88koz Gold equivalent oz. Production estimates based on internal estimates. Gold / silver ratio 75:1. Notes 1, 2, 3, 4, 5, 6 & 7. 7 140koz H1 73koz # |
|
|
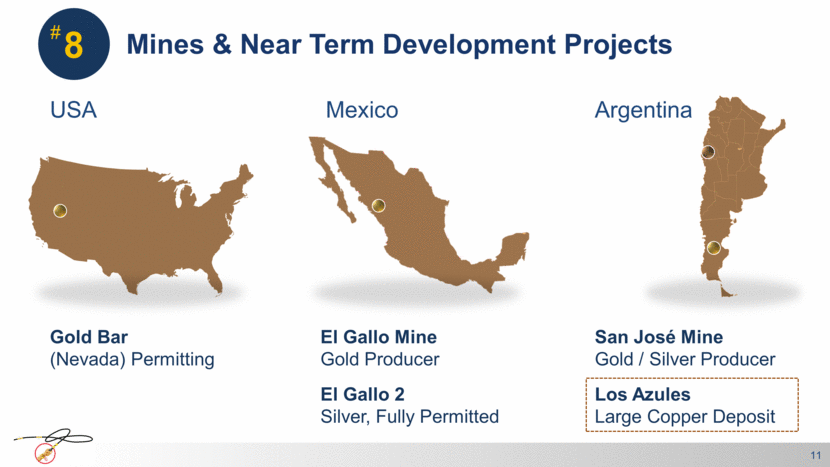
Mines & Near Term Development Projects 11 USA Mexico Argentina Gold Bar (Nevada) Permitting El Gallo Mine Gold Producer Los Azules Large Copper Deposit San José Mine Gold / Silver Producer El Gallo 2 Silver, Fully Permitted 8 # |
|
|
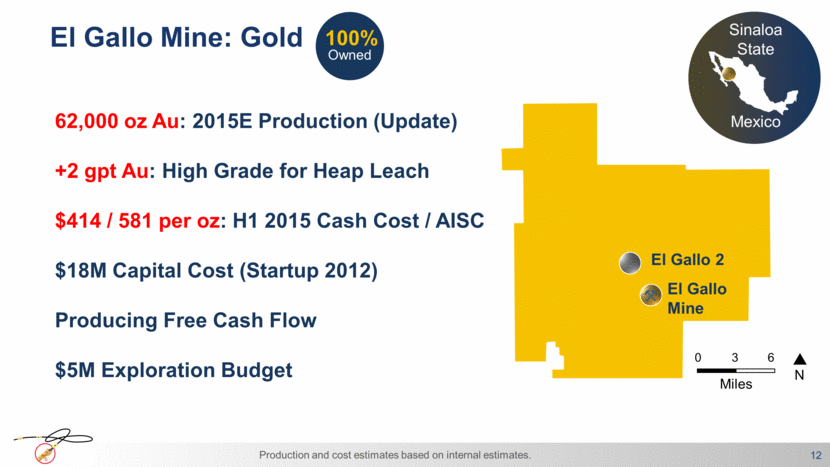
El Gallo Mine: Gold Production and cost estimates based on internal estimates. Sinaloa State Mexico 12 Owned 100% 62,000 oz Au: 2015E Production (Update) +2 gpt Au: High Grade for Heap Leach $414 / 581 per oz: H1 2015 Cash Cost / AISC $18M Capital Cost (Startup 2012) Producing Free Cash Flow $5M Exploration Budget El Gallo 2 El Gallo Mine N 0 3 6 Miles |
|
|
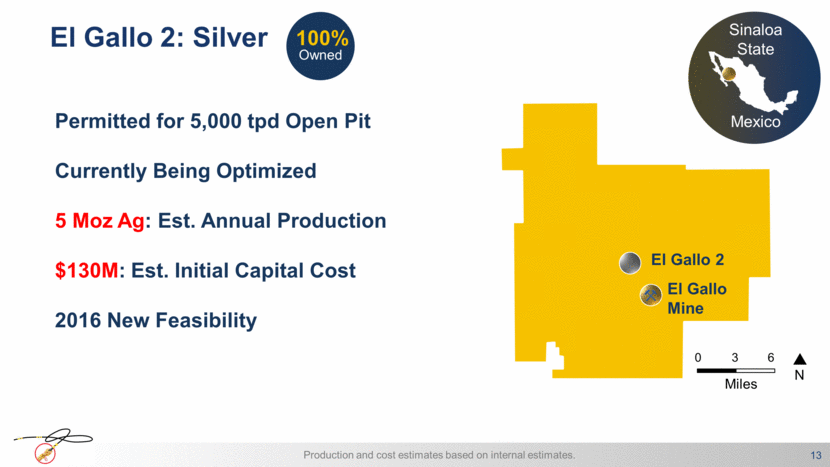
El Gallo 2: Silver Production and cost estimates based on internal estimates. Sinaloa State Mexico 13 Owned 100% Permitted for 5,000 tpd Open Pit Currently Being Optimized 5 Moz Ag: Est. Annual Production $130M: Est. Initial Capital Cost 2016 New Feasibility El Gallo 2 El Gallo Mine N 0 3 6 Miles |
|
|
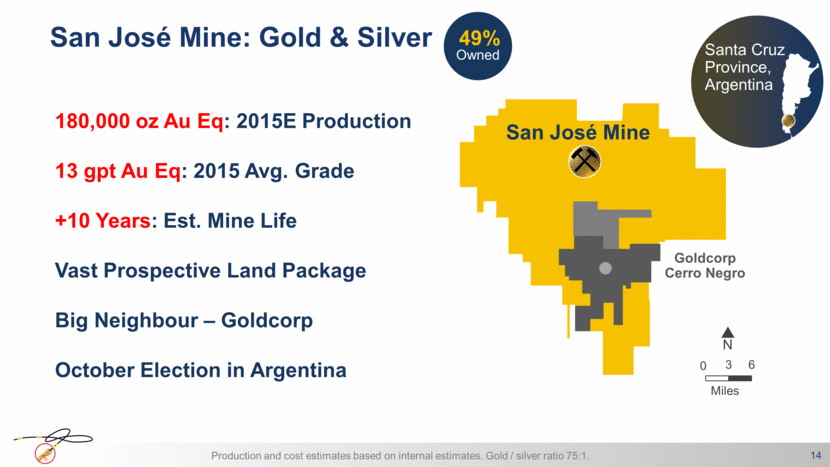
San José Mine: Gold & Silver 14 Production and cost estimates based on internal estimates. Gold / silver ratio 75:1. Santa Cruz Province, Argentina 180,000 oz Au Eq: 2015E Production 13 gpt Au Eq: 2015 Avg. Grade +10 Years: Est. Mine Life Vast Prospective Land Package Big Neighbour – Goldcorp October Election in Argentina Owned 49% Goldcorp Cerro Negro N 0 6 Miles 3 San José Mine |
|
|
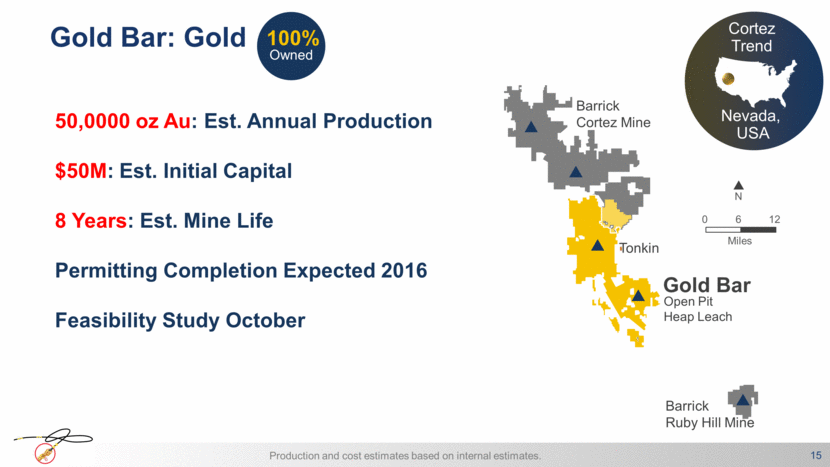
Cortez Trend Nevada, USA Gold Bar: Gold 15 Production and cost estimates based on internal estimates. Open Pit Heap Leach Tonkin Barrick Cortez Mine Barrick Ruby Hill Mine N 0 6 Miles 12 Gold Bar Owned 100% 50,0000 oz Au: Est. Annual Production $50M: Est. Initial Capital 8 Years: Est. Mine Life Permitting Completion Expected 2016 Feasibility Study October |
|
|
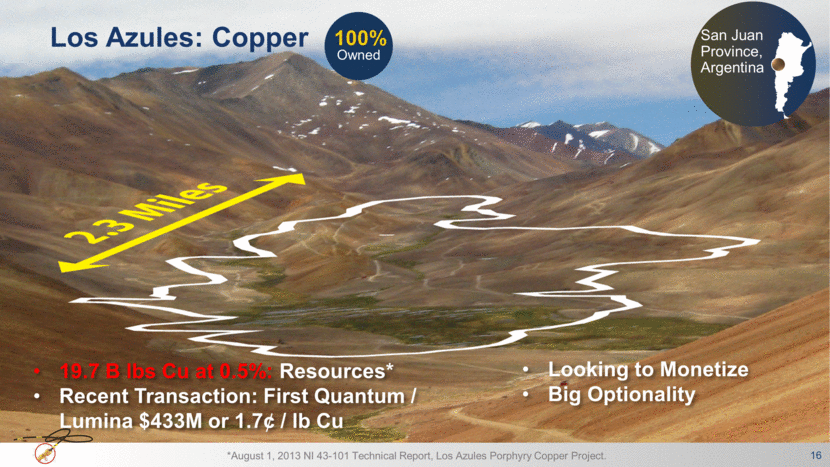
San Juan Province, Argentina Los Azules: Copper Owned 100% 19.7 B lbs Cu at 0.5%: Resources* Recent Transaction: First Quantum / Lumina $433M or 1.7¢ / lb Cu *August 1, 2013 NI 43-101 Technical Report, Los Azules Porphyry Copper Project. 16 Looking to Monetize Big Optionality |
|
|
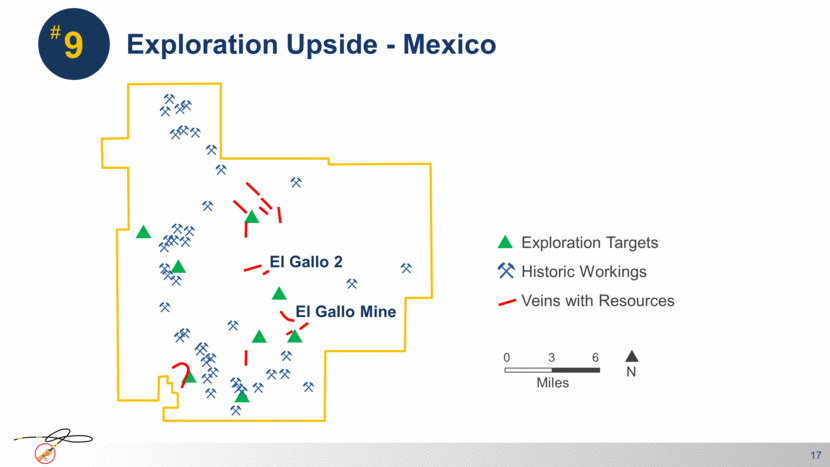
Exploration Upside - Mexico 17 9 El Gallo 2 El Gallo Mine N 0 3 6 Miles Exploration Targets Historic Workings Veins with Resources # |
|
|
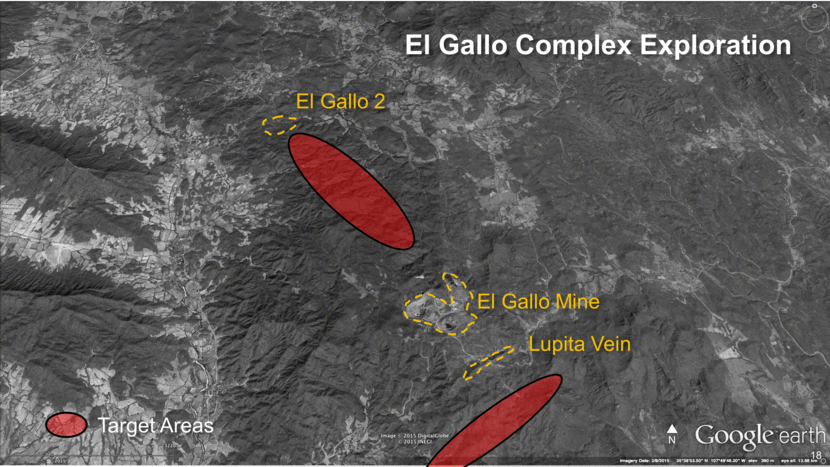
18 El Gallo 2 El Gallo Mine El Gallo Complex Exploration Target Areas Lupita Vein N |
|
|
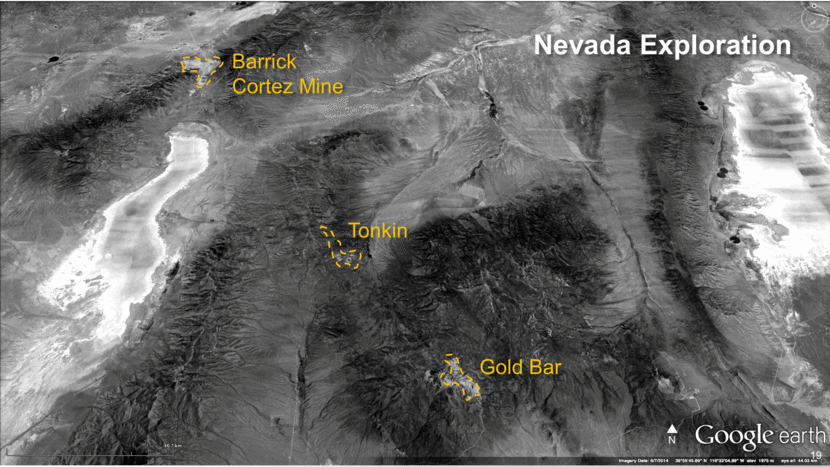
19 Barrick Cortez Mine Gold Bar Tonkin Nevada Exploration N |
|
|
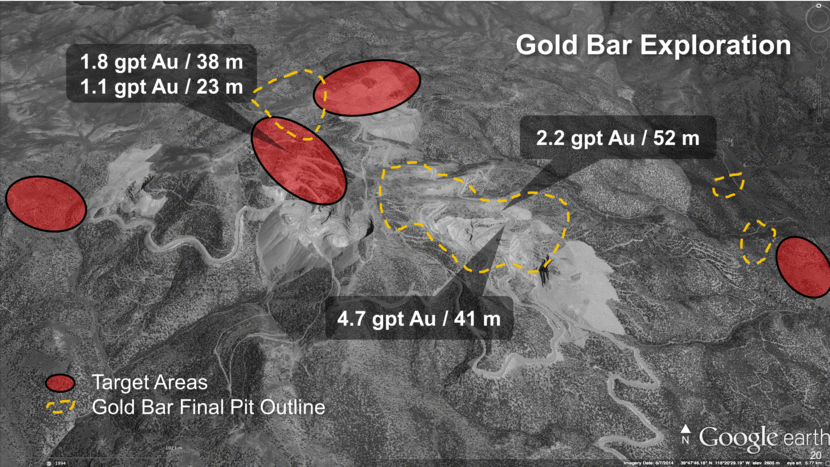
20 Gold Bar Exploration 2.2 gpt Au / 52 m 4.7 gpt Au / 41 m 1.8 gpt Au / 38 m 1.1 gpt Au / 23 m Target Areas Gold Bar Final Pit Outline N |
|
|
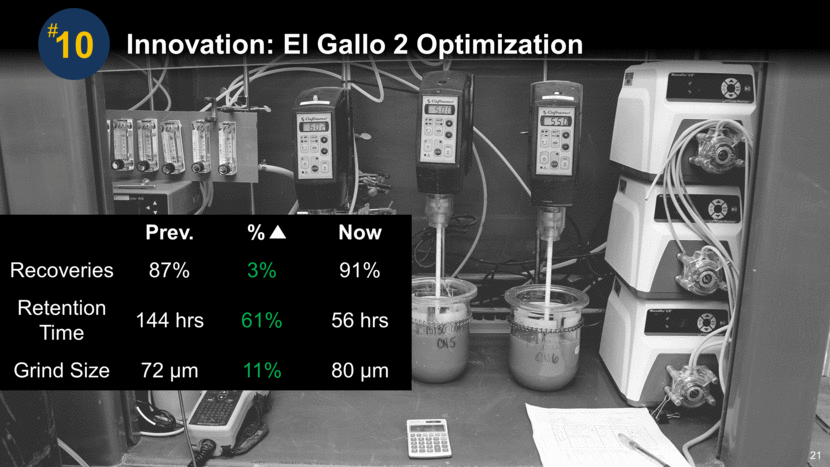
21 Innovation: El Gallo 2 Optimization 10 Prev. % Now Recoveries 87% 3% 91% Retention Time 144 hrs 61% 56 hrs Grind Size 72 m 11% 80 m # |
|
|
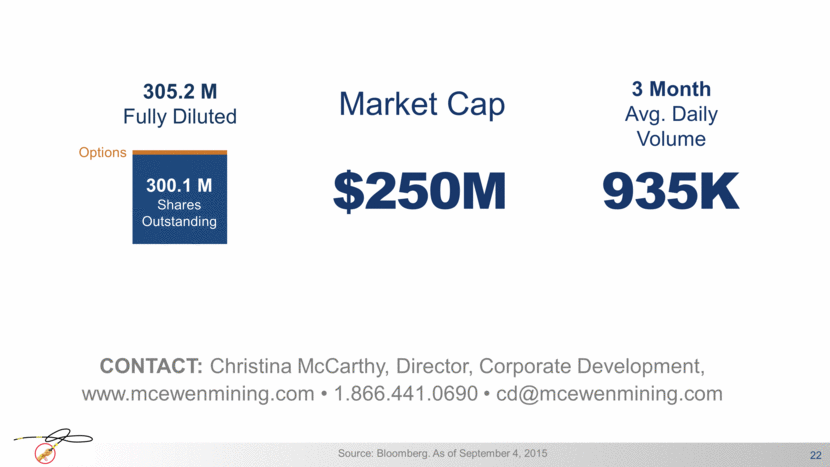
$250M Market Cap 305.2 M Fully Diluted 300.1 M Shares Outstanding Options 22 Source: Bloomberg. As of September 4, 2015 3 Month Avg. Daily Volume 935K CONTACT: Christina McCarthy, Director, Corporate Development, www.mcewenmining.com • 1.866.441.0690 • cd@mcewenmining.com |
|
|
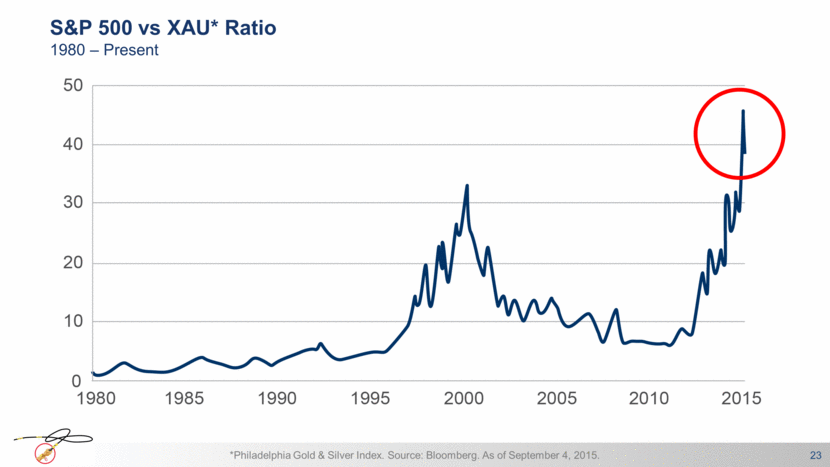
23 S&P 500 vs XAU* Ratio 1980 – Present *Philadelphia Gold & Silver Index. Source: Bloomberg. As of September 4, 2015. |


