Attached files
| file | filename |
|---|---|
| EX-10.2 - EX-10.2 - Genesis Healthcare, Inc. | gen-20150630ex102d2ce50.htm |
| EX-10.4 - EX-10.4 - Genesis Healthcare, Inc. | gen-20150630ex10476eac3.htm |
| EX-10.5 - EX-10.5 - Genesis Healthcare, Inc. | gen-20150630ex105680bbb.htm |
| EX-10.1 - EX-10.1 - Genesis Healthcare, Inc. | gen-20150630ex10141025a.htm |
| EX-10.3 - EX-10.3 - Genesis Healthcare, Inc. | gen-20150630ex1032a5124.htm |
| EX-32 - EX-32 - Genesis Healthcare, Inc. | gen-20150630xex32.htm |
| EX-31.1 - EX-31.1 - Genesis Healthcare, Inc. | gen-20150630ex3113c5b71.htm |
| EX-10.6 - EX-10.6 - Genesis Healthcare, Inc. | gen-20150630ex1060826ba.htm |
| EX-31.2 - EX-31.2 - Genesis Healthcare, Inc. | gen-20150630ex312e407dd.htm |
UNITED STATES
SECURITIES AND EXCHANGE COMMISSION
Washington, D.C. 20549
FORM 10-Q
(Mark One)
|
☒ |
Quarterly Report Pursuant to Section 13 or 15(d) of the Securities Exchange Act of 1934 |
For the quarterly period ended June 30, 2015.
OR
|
☐ |
Transition Report Pursuant to Section 13 or 15(d) of the Securities Exchange Act of 1934 |
For the transition period from to .
Commission file number: 001-33459
Genesis Healthcare, Inc.
(Exact name of registrant as specified in its charter)
|
Delaware |
|
20-3934755 |
|
(State or other jurisdiction of |
|
(IRS Employer |
|
|
|
|
|
101 East State Street |
|
|
|
Kennett Square, Pennsylvania |
|
19348 |
|
(Address of principal executive offices) |
|
(Zip Code) |
(610) 444-6350
(Registrant’s telephone number, including area code)
Indicate by check mark whether the registrant (1) has filed all reports required to be filed by Section 13 or 15(d) of the Securities Exchange Act of 1934 during the preceding 12 months (or for such shorter period that the registrant was required to file such reports) and (2) has been subject to such filing requirements for the past 90 days. Yes ☒ No ☐
Indicate by check mark whether the registrant has submitted electronically and posted on its corporate Web site, if any, every Interactive Data File required to be submitted and posted pursuant to Rule 405 of Regulation S-T during the preceding 12 months (or for such shorter period that the registrant was required to submit and post such files). Yes ☒ No ☐
Indicate by check mark whether the registrant is a large accelerated filer, an accelerated filer, a non-accelerated filer, or a smaller reporting company. See the definitions of “large accelerated filer,” “accelerated filer” and “smaller reporting company” in Rule 12b-2 of the Exchange Act.
|
Large accelerated filer ☐ |
|
Accelerated filer ☒ |
|
|
|
|
|
Non-accelerated filer ☐ |
|
Smaller reporting company ☐ |
|
(do not check if smaller reporting company) |
|
|
Indicate by check mark whether the registrant is a shell company (as defined in Rule 12b-2 of the Exchange Act). Yes ☐ No ☒
The number of shares outstanding of each of the issuer’s classes of common stock, as of the close of business on August 7, 2015, was:
Class A common stock, $0.001 par value – 73,591,665 shares
Class B common stock, $0.001 par value – 15,511,603 shares
Class C common stock, $0.001 par value – 64,449,380 shares
Genesis Healthcare, Inc.
Form 10-Q
PART I — FINANCIAL INFORMATION
GENESIS HEALTHCARE, INC. AND SUBSIDIARIES
(IN THOUSANDS, EXCEPT SHARE AND PER SHARE DATA)
(UNAUDITED)
|
|
|
|
|
|
|
|
|
|
|
|
June 30, |
|
December 31, |
|
||
|
|
|
2015 |
|
2014 |
|
||
|
|
|
|
|
|
|
||
|
Assets: |
|
|
|
|
|
|
|
|
Current assets: |
|
|
|
|
|
|
|
|
Cash and cash equivalents |
|
$ |
82,963 |
|
$ |
87,548 |
|
|
Restricted cash and investments in marketable securities |
|
|
50,111 |
|
|
38,211 |
|
|
Accounts receivable, net of allowances for doubtful accounts of $145,166 and $133,529 at June 30, 2015 and December 31, 2014 |
|
|
753,563 |
|
|
605,830 |
|
|
Prepaid expenses |
|
|
48,961 |
|
|
72,873 |
|
|
Other current assets |
|
|
40,573 |
|
|
33,511 |
|
|
Deferred income taxes |
|
|
2,657 |
|
|
58,213 |
|
|
Total current assets |
|
|
978,828 |
|
|
896,186 |
|
|
Property and equipment, net of accumulated depreciation of $535,203 and $502,176 at June 30, 2015 and December 31, 2014 |
|
|
3,995,294 |
|
|
3,493,250 |
|
|
Restricted cash and investments in marketable securities |
|
|
126,496 |
|
|
108,529 |
|
|
Other long-term assets |
|
|
172,144 |
|
|
140,119 |
|
|
Deferred income taxes |
|
|
173,156 |
|
|
160,531 |
|
|
Identifiable intangible assets, net of accumulated amortization of $55,743 and $42,661 at June 30, 2015 and December 31, 2014 |
|
|
225,945 |
|
|
173,112 |
|
|
Goodwill |
|
|
431,515 |
|
|
169,681 |
|
|
Total assets |
|
$ |
6,103,378 |
|
$ |
5,141,408 |
|
|
Liabilities and Stockholders' Deficit: |
|
|
|
|
|
|
|
|
Current liabilities: |
|
|
|
|
|
|
|
|
Current installments of long-term debt |
|
$ |
12,889 |
|
$ |
12,518 |
|
|
Capital lease obligations |
|
|
1,826 |
|
|
2,875 |
|
|
Financing obligations |
|
|
1,062 |
|
|
1,138 |
|
|
Accounts payable |
|
|
205,586 |
|
|
194,508 |
|
|
Accrued expenses |
|
|
155,370 |
|
|
125,831 |
|
|
Accrued compensation |
|
|
226,745 |
|
|
192,838 |
|
|
Self-insurance reserves |
|
|
146,884 |
|
|
130,874 |
|
|
Total current liabilities |
|
|
750,362 |
|
|
660,582 |
|
|
Long-term debt |
|
|
1,031,626 |
|
|
525,728 |
|
|
Capital lease obligations |
|
|
1,044,208 |
|
|
1,002,762 |
|
|
Financing obligations |
|
|
2,965,326 |
|
|
2,911,200 |
|
|
Deferred income taxes |
|
|
— |
|
|
19,215 |
|
|
Self-insurance reserves |
|
|
428,793 |
|
|
355,344 |
|
|
Other long-term liabilities |
|
|
127,605 |
|
|
124,067 |
|
|
Commitments and contingencies |
|
|
|
|
|
|
|
|
Stockholders’ deficit: |
|
|
|
|
|
|
|
|
Class A common stock, (par $0.001, 175,000,000 shares authorized, issued and outstanding 73,591,665 and 49,864,878 at June 30, 2015 and December 31, 2014, respectively) |
|
|
74 |
|
|
50 |
|
|
Class B common stock, (par $0.001, 30,000,000 shares authorized, issued and outstanding - 15,511,603 and 0 at June 30, 2015 and December 31, 2014, respectively) |
|
|
16 |
|
|
— |
|
|
Class C common stock (par $0.001, 150,000,000 shares authorized, issued and outstanding - 64,449,380 and 0 at June 30, 2015 and December 31, 2014, respectively) |
|
|
64 |
|
|
— |
|
|
Additional paid-in-capital |
|
|
298,899 |
|
|
143,492 |
|
|
Accumulated deficit |
|
|
(437,160) |
|
|
(603,254) |
|
|
Accumulated other comprehensive income |
|
|
318 |
|
|
515 |
|
|
Total stockholders’ deficit before noncontrolling interests |
|
|
(137,789) |
|
|
(459,197) |
|
|
Noncontrolling interests |
|
|
(106,753) |
|
|
1,707 |
|
|
Total stockholders' deficit |
|
|
(244,542) |
|
|
(457,490) |
|
|
Total liabilities and stockholders’ deficit |
|
$ |
6,103,378 |
|
$ |
5,141,408 |
|
See accompanying notes to the unaudited consolidated financial statements.
3
GENESIS HEALTHCARE, INC. AND SUBSIDIARIES
CONSOLIDATED STATEMENTS OF OPERATIONS
(IN THOUSANDS, EXCEPT PER SHARE DATA)
(UNAUDITED)
|
|
|
Three months ended June 30, |
|
Six months ended June 30, |
|
||||||||
|
|
|
2015 |
|
2014 |
|
2015 |
|
2014 |
|
||||
|
Net revenues |
|
$ |
1,419,475 |
|
$ |
1,200,651 |
|
$ |
2,762,476 |
|
$ |
2,387,195 |
|
|
Salaries, wages and benefits |
|
|
820,926 |
|
|
717,215 |
|
|
1,611,659 |
|
|
1,438,477 |
|
|
Other operating expenses |
|
|
348,236 |
|
|
269,603 |
|
|
660,797 |
|
|
533,149 |
|
|
General and administrative costs |
|
|
44,983 |
|
|
35,980 |
|
|
86,516 |
|
|
71,844 |
|
|
Provision for losses on accounts receivable |
|
|
22,113 |
|
|
17,080 |
|
|
45,509 |
|
|
35,596 |
|
|
Lease expense |
|
|
38,959 |
|
|
32,909 |
|
|
75,378 |
|
|
65,708 |
|
|
Depreciation and amortization expense |
|
|
53,605 |
|
|
48,930 |
|
|
113,538 |
|
|
96,430 |
|
|
Interest expense |
|
|
126,385 |
|
|
109,900 |
|
|
247,698 |
|
|
218,650 |
|
|
Loss on early extinguishment of debt |
|
|
— |
|
|
181 |
|
|
3,234 |
|
|
680 |
|
|
Investment income |
|
|
(431) |
|
|
(436) |
|
|
(847) |
|
|
(1,379) |
|
|
Other loss (income) |
|
|
50 |
|
|
(667) |
|
|
(7,560) |
|
|
(667) |
|
|
Transaction costs |
|
|
2,642 |
|
|
1,298 |
|
|
88,710 |
|
|
3,547 |
|
|
Equity in net income of unconsolidated affiliates |
|
|
(360) |
|
|
(390) |
|
|
(513) |
|
|
(346) |
|
|
Loss before income tax benefit |
|
|
(37,633) |
|
|
(30,952) |
|
|
(161,643) |
|
|
(74,494) |
|
|
Income tax benefit |
|
|
(4,419) |
|
|
(96) |
|
|
(10,067) |
|
|
(2,850) |
|
|
Loss from continuing operations |
|
|
(33,214) |
|
|
(30,856) |
|
|
(151,576) |
|
|
(71,644) |
|
|
Loss from discontinued operations, net of taxes |
|
|
(1,722) |
|
|
(1,176) |
|
|
(1,610) |
|
|
(4,370) |
|
|
Net loss |
|
|
(34,936) |
|
|
(32,032) |
|
|
(153,186) |
|
|
(76,014) |
|
|
Less net loss (income) attributable to noncontrolling interests |
|
|
15,750 |
|
|
(224) |
|
|
21,434 |
|
|
(409) |
|
|
Net loss attributable to Genesis Healthcare, Inc. |
|
$ |
(19,186) |
|
$ |
(32,256) |
|
$ |
(131,752) |
|
$ |
(76,423) |
|
|
Loss per common share: |
|
|
|
|
|
|
|
|
|
|
|
|
|
|
Basic and diluted: |
|
|
|
|
|
|
|
|
|
|
|
|
|
|
Weighted-average shares outstanding for basic and diluted loss from continuing operations per share |
|
|
89,211 |
|
|
49,865 |
|
|
82,279 |
|
|
49,865 |
|
|
Basic and diluted net loss per common share: |
|
|
|
|
|
|
|
|
|
|
|
|
|
|
Loss from continuing operations attributable to Genesis Healthcare, Inc. |
|
$ |
(0.20) |
|
$ |
(0.63) |
|
$ |
(1.58) |
|
$ |
(1.44) |
|
|
Loss from discontinued operations |
|
|
(0.02) |
|
|
(0.02) |
|
|
(0.02) |
|
|
(0.09) |
|
|
Net loss attributable to Genesis Healthcare, Inc. |
|
$ |
(0.22) |
|
$ |
(0.65) |
|
$ |
(1.60) |
|
$ |
(1.53) |
|
See accompanying notes to the unaudited consolidated financial statements.
4
GENESIS HEALTHCARE, INC. AND SUBSIDIARIES
CONSOLIDATED STATEMENTS OF COMPREHENSIVE INCOME (LOSS)
(IN THOUSANDS)
(UNAUDITED)
|
|
|
|
|
|
|
|
|
|
|
|
|
|
|
|
|
|
Three Months Ended June 30, |
|
Six months ended June 30, |
|
||||||||
|
|
|
2015 |
|
2014 |
|
2015 |
|
2014 |
|
||||
|
|
|
|
|
|
|
|
|
|
|
|
|
|
|
|
Net loss |
|
$ |
(34,936) |
|
$ |
(32,032) |
|
$ |
(153,186) |
|
$ |
(76,014) |
|
|
Net unrealized (loss) gain on marketable securities, net of tax |
|
|
(539) |
|
|
252 |
|
|
33 |
|
|
384 |
|
|
Comprehensive loss |
|
|
(35,475) |
|
|
(31,780) |
|
|
(153,153) |
|
|
(75,630) |
|
|
Less: comprehensive loss (income) attributable to noncontrolling interests |
|
|
15,976 |
|
|
(224) |
|
|
21,358 |
|
|
(409) |
|
|
Comprehensive loss attributable to Genesis Healthcare, Inc. |
|
$ |
(19,499) |
|
$ |
(32,004) |
|
$ |
(131,795) |
|
$ |
(76,039) |
|
See accompanying notes to the unaudited consolidated financial statements.
5
GENESIS HEALTHCARE, INC. AND SUBSIDIARIES
CONSOLIDATED STATEMENTS OF STOCKHOLDERS' EQUITY (DEFICIT)
(IN THOUSANDS)
(UNAUDITED)
|
|
|
|
|
|
|
|
|
|
|
|
|
|
|
|
|
|
|
|
|
|
|
|
Accumulated |
|
|
|
|
|
|
|
|
|
|
|
|
|
|
|
|
|
|
|
|
|
|
|
|
|
|
|
|
|
|
|
|
|
|
|
other |
|
|
|
|
|
|
|
Total |
|
||
|
|
|
Class A Common Stock |
|
Class B Common Stock |
|
Class C Common Stock |
|
Additional |
|
Accumulated |
|
comprehensive |
|
Stockholders' |
|
Noncontrolling |
|
stockholders' |
|
|||||||||||||||
|
|
|
Shares |
|
Amount |
|
Shares |
|
Amount |
|
Shares |
|
Amount |
|
paid-in capital |
|
deficit |
|
income (loss) |
|
deficit |
|
interests |
|
deficit |
|
|||||||||
|
Balance at December 31, 2013 |
|
49,865 |
|
$ |
50 |
|
— |
|
$ |
— |
|
— |
|
$ |
— |
|
$ |
161,452 |
|
$ |
(349,269) |
|
$ |
1,068 |
|
$ |
(186,699) |
|
$ |
2,818 |
|
$ |
(183,881) |
|
|
Net loss |
|
— |
|
|
— |
|
— |
|
|
— |
|
— |
|
|
— |
|
|
— |
|
|
(253,985) |
|
|
— |
|
|
(253,985) |
|
|
2,456 |
|
|
(251,529) |
|
|
Net unrealized loss on marketable securities, net of tax |
|
— |
|
|
— |
|
— |
|
|
— |
|
— |
|
|
— |
|
|
— |
|
|
— |
|
|
(553) |
|
|
(553) |
|
|
— |
|
|
(553) |
|
|
Distributions to stockholders |
|
— |
|
|
— |
|
— |
|
|
— |
|
— |
|
|
— |
|
|
(17,960) |
|
|
— |
|
|
— |
|
|
(17,960) |
|
|
— |
|
|
(17,960) |
|
|
Distributions to noncontrolling interests |
|
— |
|
|
— |
|
— |
|
|
— |
|
— |
|
|
— |
|
|
— |
|
|
— |
|
|
— |
|
|
— |
|
|
(3,567) |
|
|
(3,567) |
|
|
Balance at December 31, 2014 |
|
49,865 |
|
$ |
50 |
|
— |
|
$ |
— |
|
— |
|
$ |
— |
|
$ |
143,492 |
|
$ |
(603,254) |
|
|
515 |
|
$ |
(459,197) |
|
$ |
1,707 |
|
$ |
(457,490) |
|
|
Combination share conversion |
|
23,727 |
|
|
24 |
|
15,512 |
|
|
16 |
|
64,449 |
|
|
64 |
|
|
130,530 |
|
|
297,846 |
|
|
(154) |
|
|
428,326 |
|
|
(80,186) |
|
|
348,140 |
|
|
Net loss |
|
— |
|
|
— |
|
— |
|
|
— |
|
— |
|
|
— |
|
|
— |
|
|
(131,752) |
|
|
— |
|
|
(131,752) |
|
|
(21,434) |
|
|
(153,186) |
|
|
Net unrealized gain on marketable securities, net of tax |
|
— |
|
|
— |
|
— |
|
|
— |
|
— |
|
|
— |
|
|
— |
|
|
— |
|
|
(43) |
|
|
(43) |
|
|
76 |
|
|
33 |
|
|
Share based compensation |
|
— |
|
|
— |
|
— |
|
|
— |
|
— |
|
|
— |
|
|
24,877 |
|
|
— |
|
|
— |
|
|
24,877 |
|
|
— |
|
|
24,877 |
|
|
Distributions to noncontrolling interests |
|
— |
|
|
— |
|
— |
|
|
— |
|
— |
|
|
— |
|
|
— |
|
|
— |
|
|
— |
|
|
— |
|
|
(6,916) |
|
|
(6,916) |
|
|
Balance at June 30, 2015 |
|
73,592 |
|
$ |
74 |
|
15,512 |
|
$ |
16 |
|
64,449 |
|
$ |
64 |
|
$ |
298,899 |
|
$ |
(437,160) |
|
$ |
318 |
|
$ |
(137,789) |
|
$ |
(106,753) |
|
$ |
(244,542) |
|
See accompanying notes to the unaudited consolidated financial statements.
6
GENESIS HEALTHCARE, INC. AND SUBSIDIARIES
CONSOLIDATED STATEMENTS OF CASH FLOWS
(IN THOUSANDS)
(UNAUDITED)
|
|
|
Six months ended June 30, |
|
||||
|
|
|
2015 |
|
2014 |
|
||
|
Cash flows from operating activities |
|
|
|
|
|
|
|
|
Net loss |
|
$ |
(153,186) |
|
$ |
(76,014) |
|
|
Adjustments to reconcile net loss to net cash (used in) provided by operating activities: |
|
|
|
|
|
|
|
|
Non-cash interest and leasing arrangements, net |
|
|
47,605 |
|
|
43,302 |
|
|
Other non-cash charges and gains, net |
|
|
(7,345) |
|
|
3,027 |
|
|
Share based compensation |
|
|
25,903 |
|
|
— |
|
|
Depreciation and amortization |
|
|
113,693 |
|
|
98,947 |
|
|
Provision for losses on accounts receivable |
|
|
45,509 |
|
|
36,141 |
|
|
Equity in net income of unconsolidated affiliates |
|
|
(513) |
|
|
(346) |
|
|
Provision for deferred taxes |
|
|
(23,306) |
|
|
(13,099) |
|
|
Changes in assets and liabilities: |
|
|
|
|
|
|
|
|
Accounts receivable |
|
|
(78,695) |
|
|
(40,955) |
|
|
Accounts payable and other accrued expenses and other |
|
|
22,606 |
|
|
(14,642) |
|
|
Net cash (used in) provided by operating activities |
|
|
(7,729) |
|
|
36,361 |
|
|
Cash flows from investing activities: |
|
|
|
|
|
|
|
|
Capital expenditures |
|
|
(36,858) |
|
|
(38,898) |
|
|
Purchases of marketable securities |
|
|
(21,836) |
|
|
(20,761) |
|
|
Proceeds on maturity or sale of marketable securities |
|
|
17,423 |
|
|
14,713 |
|
|
Net change in restricted cash and equivalents |
|
|
(5,475) |
|
|
(3,580) |
|
|
Sale of investment in joint ventures |
|
|
26,358 |
|
|
— |
|
|
Sales of assets |
|
|
1,263 |
|
|
1,949 |
|
|
Purchases of assets |
|
|
(9,703) |
|
|
(590) |
|
|
Other, net |
|
|
(39) |
|
|
(328) |
|
|
Net cash used in investing activities |
|
|
(28,867) |
|
|
(47,495) |
|
|
Cash flows from financing activities: |
|
|
|
|
|
|
|
|
Borrowings under revolving credit facility |
|
|
366,500 |
|
|
294,000 |
|
|
Repayments under revolving credit facility |
|
|
(328,000) |
|
|
(274,000) |
|
|
Proceeds from issuance of long-term debt |
|
|
360,000 |
|
|
— |
|
|
Proceeds from tenant improvement draws under lease arrangements |
|
|
95 |
|
|
3,914 |
|
|
Repayment of long-term debt |
|
|
(341,893) |
|
|
(6,696) |
|
|
Debt issuance costs |
|
|
(17,775) |
|
|
(3,854) |
|
|
Distributions to noncontrolling interests |
|
|
(6,916) |
|
|
(12,016) |
|
|
Net cash provided by financing activities |
|
|
32,011 |
|
|
1,348 |
|
|
Net decrease in cash and cash equivalents |
|
|
(4,585) |
|
|
(9,786) |
|
|
Cash and equivalents: |
|
|
|
|
|
|
|
|
Beginning of period |
|
|
87,548 |
|
|
61,413 |
|
|
End of period |
|
$ |
82,963 |
|
$ |
51,627 |
|
|
Supplemental cash flow information: |
|
|
|
|
|
|
|
|
Interest paid |
|
$ |
200,087 |
|
$ |
181,674 |
|
|
Taxes paid |
|
|
13,669 |
|
|
5,043 |
|
|
Non-cash financing activities: |
|
|
|
|
|
|
|
|
Capital leases |
|
$ |
43,322 |
|
$ |
13,405 |
|
|
Financing obligations |
|
|
26,479 |
|
|
62,873 |
|
|
Assumption of long-term debt |
|
|
436,776 |
|
|
— |
|
See accompanying notes to the unaudited consolidated financial statements.
7
GENESIS HEALTHCARE, INC. AND SUBSIDIARIES
NOTES TO CONSOLIDATED FINANCIAL STATEMENTS
(UNAUDITED)
Description of Business
Genesis Healthcare, Inc. is a healthcare services company that through its subsidiaries (collectively, the Company) owns and operates skilled nursing facilities, assisted living facilities, hospices, home health providers and a rehabilitation therapy business. The Company has an administrative service company that provides a full complement of administrative and consultative services that allows its affiliated operators and third-party operators with whom the Company contracts to better focus on delivery of healthcare services. The Company provides inpatient services through 514 skilled nursing, assisted living and behavioral health centers located in 34 states. Revenues of the Company’s owned, leased and otherwise consolidated centers constitute approximately 85% of its revenues.
The Company provides a range of rehabilitation therapy services, including speech pathology, physical therapy, occupational therapy and respiratory therapy. These services are provided by rehabilitation therapists and assistants employed or contracted at substantially all of the centers operated by the Company, as well as by contract to healthcare facilities operated by others. After the elimination of intercompany revenues, the rehabilitation therapy services business constitutes approximately 12% of the Company’s revenues.
The Company provides an array of other specialty medical services, including management services, physician services, staffing services, hospice and home health services, and other healthcare related services, which comprise the balance of the Company’s revenues.
Basis of Presentation
The accompanying consolidated financial statements have been prepared in accordance with U.S. generally accepted accounting principles (U.S. GAAP). In the opinion of management, the consolidated financial statements include all necessary adjustments for a fair presentation of the financial position and results of operations for the periods presented.
The accompanying unaudited consolidated financial statements have been prepared in accordance with the instructions for Form 10-Q of Regulation S-X and do not include all of the disclosures normally required by U.S. GAAP or those normally required in annual reports on Form 10-K. Accordingly, these financial statements should be read in conjunction with the audited consolidated financial statements of the Company for the year ended December 31, 2014 filed with the Securities and Exchange Commission (the SEC) on Form 8-K on July 24, 2015. The accompanying consolidated balance sheet at December 31, 2014 was derived from audited consolidated financial statements, but does not include all disclosures required by U.S. GAAP.
Certain prior year amounts have been reclassified to conform to current period presentation, the effect of which was not material. The Company’s membership interest at December 31, 2014 has been recast as common stock and additional paid-in-capital.
The Company’s financial position at June 30, 2015 includes the impact of the Combination (as defined in Note 3 – “Significant Transactions and Events – The Combination with Skilled”), which has been accounted for as a reverse acquisition using the acquisition method effective February 2, 2015.
Recent Accounting Pronouncements
In May 2014, the Financial Accounting Standards Board (the FASB) issued ASU No. 2014-09, Revenue from Contracts with Customers, (ASU 2014-09) which changes the requirements for recognizing revenue when entities enter into contracts with customers. Under ASU 2014-09, an entity will recognize revenue when it transfers promised goods or services to customers in an amount that reflects what it expects in exchange for the goods or services. It also requires
8
GENESIS HEALTHCARE, INC. AND SUBSIDIARIES
NOTES TO CONSOLIDATED FINANCIAL STATEMENTS
(UNAUDITED)
more detailed disclosures to enable users of financial statements to understand the nature, amount, timing, and uncertainty of revenue and cash flows arising from contracts with customers. The adoption of ASU 2014-09 is effective for annual and interim periods beginning after December 15, 2017 and early adoption is not permitted. The Company is still evaluating the effect, if any, ASU 2014-09 will have on the Company’s consolidated financial condition and results of operations.
In February 2015, the FASB issued ASU 2015-02, Consolidation (Topic 810): Amendments to the Consolidation Analysis (ASU 2015-02), which changes the way reporting enterprises evaluate whether (a) they should consolidate limited partnerships and similar entities, (b) fees paid to a decision maker or service provider are variable interests in a variable interest entity (VIE), and (c) variable interests in a VIE held by related parties of the reporting enterprise require the reporting enterprise to consolidate the VIE. It also eliminates the VIE consolidation model based on majority exposure to variability that applied to certain investment companies and similar entities. The new guidance excludes money market funds that are required to comply with Rule 2a-7 of the Investment Company Act of 1940 and similar entities from the U.S. GAAP consolidation requirements. The adoption of ASU 2015-02 is effective for fiscal years beginning after December 15, 2015, and interim periods within those fiscal years, with early adoption permitted. If adopted in an interim period, this ASU must be reflected as of the beginning of the fiscal year that includes that interim period. The adoption of ASU No. 2015-02 is not expected to have a material impact on the Company’s consolidated financial condition and results of operations.
In April 2015, the FASB issued ASU No. 2015-03, Simplifying the Presentation of Debt Issuance Costs, (ASU 2015-03). This ASU requires an entity to present debt issuance costs as a direct deduction from the carrying amount of the related debt liability, consistent with debt discounts. The costs will continue to be amortized to interest expense using the effective interest method. The adoption of ASU 2015-03 is effective for fiscal years beginning after December 15, 2015, and interim periods within those fiscal years, with early adoption permitted. This ASU requires retrospective application to all prior periods presented in the financial statements. The adoption of ASU No. 2015-03 is not expected to have a material impact on the Company’s consolidated financial condition and results of operations.
(2)Certain Significant Risks and Uncertainties
Revenue Sources
The Company receives revenues from Medicare, Medicaid, private insurance, self-pay residents, other third-party payors and long-term care facilities that utilize its rehabilitation therapy and other services. The Company’s inpatient services segment derives approximately 79% of its revenue from Medicare and various state Medicaid programs.
The sources and amounts of the Company’s revenues are determined by a number of factors, including licensed bed capacity and occupancy rates of inpatient facilities, the mix of patients and the rates of reimbursement among payors. Likewise, payment for ancillary medical services, including services provided by the Company’s rehabilitation therapy services business, varies based upon the type of payor and payment methodologies. Changes in the case mix of the patients as well as payor mix among Medicare, Medicaid and private pay can significantly affect the Company’s profitability.
It is not possible to quantify fully the effect of legislative changes, the interpretation or administration of such legislation or other governmental initiatives on the Company’s business and the business of the customers served by the Company’s rehabilitation therapy business. The potential impact of reforms to the United States healthcare system, including potential material changes to the delivery of healthcare services and the reimbursement paid for such services by the government or other third party payors, is uncertain at this time. Accordingly, there can be no assurance that the impact of any future healthcare legislation or regulation will not adversely affect the Company’s business. There can be no assurance that payments under governmental and private third-party payor programs will be timely, will remain at
9
GENESIS HEALTHCARE, INC. AND SUBSIDIARIES
NOTES TO CONSOLIDATED FINANCIAL STATEMENTS
(UNAUDITED)
levels similar to present levels or will, in the future, be sufficient to cover the costs allocable to patients eligible for reimbursement pursuant to such programs. The Company’s financial condition and results of operations are and will continue to be affected by the reimbursement process, which in the healthcare industry is complex and can involve lengthy delays between the time that revenue is recognized and the time that reimbursement amounts are settled.
Laws and regulations governing the Medicare and Medicaid programs, and the Company’s business generally, are complex and are often subject to a number of ambiguities in their application and interpretation. The Company believes that it is in substantial compliance with all applicable laws and regulations. However, from time to time the Company and its affiliates are subject to pending or threatened lawsuits and investigations involving allegations of potential wrongdoing, some of which may be material or involve significant costs to resolve and/or defend against, or may lead to other adverse effects on the Company and its affiliates including, but not limited to, fines, penalties and exclusion from participation in the Medicare and/or Medicaid programs. The Company business is subject to a number of other known and unknown risks and uncertainties, which are discussed in Item 1A (Risk Factors) of the Company’s Annual Report on Form 10-K for the fiscal year ended December 31, 2014, which was filed with the SEC on February 20, 2015.
(3)Significant Transactions and Events
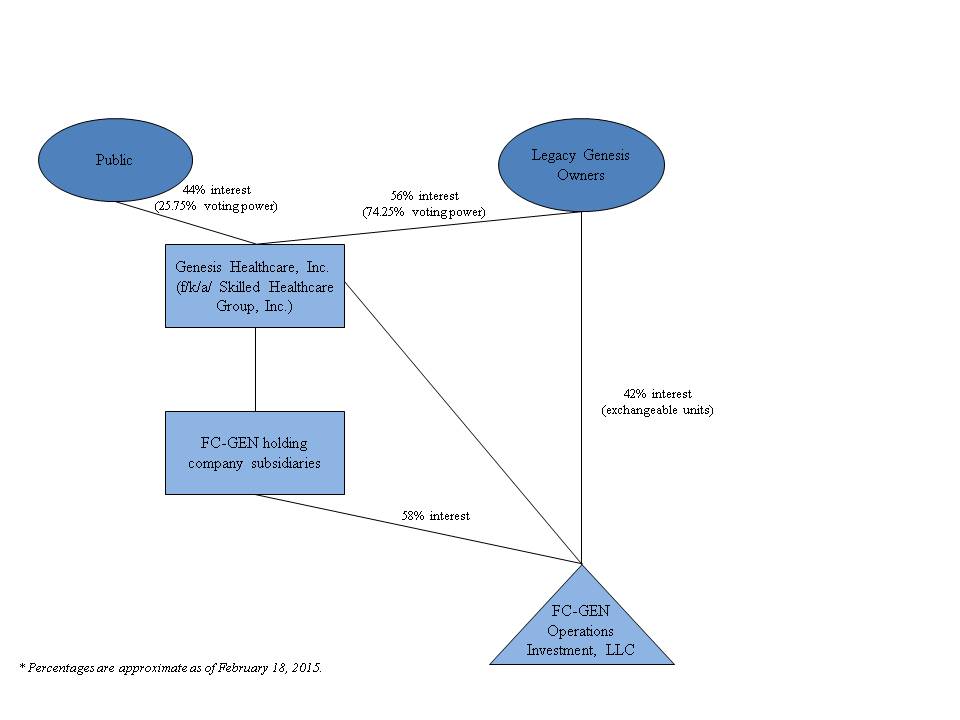
The Combination with Skilled
On August 18, 2014, Skilled Healthcare Group, Inc., a Delaware corporation (Skilled) entered into a Purchase and Contribution Agreement with FC-GEN Operations Investment, LLC (FC-GEN) pursuant to which the businesses and operations of FC-GEN and Skilled were combined (the Combination). On February 2, 2015, the Combination was completed.
The following diagram depicts the organizational structure of the Company at the time of the Combination:
10
GENESIS HEALTHCARE, INC. AND SUBSIDIARIES
NOTES TO CONSOLIDATED FINANCIAL STATEMENTS
(UNAUDITED)
Upon completion of the Combination, the Company began operating under the name Genesis Healthcare, Inc. and the Class A common stock of the combined company continues to trade on the NYSE under the symbol “GEN”. Upon the closing of the Combination, the former owners of FC-GEN held 74.25% of the economic interests in the combined entity and the former shareholders of Skilled held the remaining 25.75% of the economic interests in the combined entity post-transaction, in each case on a fully-diluted, as-exchanged and as-converted basis. Under applicable accounting standards, FC-GEN was the accounting acquirer in the Combination, which was treated as a reverse acquisition. The acquisition method has been applied to the accounts of Skilled based on Skilled’s stock price (level 1 valuation technique - quoted prices in active markets for identical assets or liabilities) as of the acquisition date. The consideration has been allocated to the legacy Skilled business that was acquired on the acquisition date with the excess consideration over the fair value of the net assets acquired recognized as goodwill. As of the effective date of the Combination, FC-GEN’s assets and liabilities remained at their historical costs.
Because FC-GEN’s pre-transaction owners held an approximately 58% direct controlling interest in Skilled and a 74.25% economic and voting interest in the combined company, FC-GEN is considered to be the acquirer of Skilled for accounting purposes. Following the closing of the Combination, the combined results of Skilled and FC-GEN are consolidated with approximately 42% direct noncontrolling economic interest shown as noncontrolling interest in the financial statements of the combined entity. The 42% direct noncontrolling economic interest is in the form of Class A common units of FC-GEN that are exchangeable on a 1 to 1 basis to public shares of the Company. The 42% direct noncontrolling economic interest will continue to decrease as Class A common units of FC-GEN are exchanged for public shares of the Company.
Consideration Price Allocation
The total Skilled consideration price of $348.1 million was allocated to Skilled’s net tangible and identifiable intangible assets based upon the estimated fair values at February 2, 2015. The excess of the consideration price over the estimated fair value of the net tangible and identifiable intangible assets was recorded as goodwill. The allocation of the consideration price to property, plant and equipment, identifiable intangible assets and deferred income taxes was based upon valuation data and estimates. The Company has not finalized the analysis of the consideration price allocation and will continue its review during the measurement period. The aggregate goodwill arising from the Combination is based upon the expected future cash flows of the Skilled operations. Goodwill recognized from the Combination is the result of (i) the expected savings to be realized from achieving certain economies of scale and (ii) anticipated long-term improvements in Skilled’s core businesses. The Company has estimated $79.8 million of pre-existing Skilled goodwill that is deductible for income tax purposes related to the Combination.
11
GENESIS HEALTHCARE, INC. AND SUBSIDIARIES
NOTES TO CONSOLIDATED FINANCIAL STATEMENTS
(UNAUDITED)
The consideration price and related allocation are summarized as follows (in thousands):
|
Accounts receivable |
|
$ |
114,234 |
|
|
|
|
Deferred income taxes and other current assets |
|
|
42,424 |
|
|
|
|
Property, plant and equipment |
|
|
490,821 |
|
|
|
|
|
|
|
|
|
Weighted |
|
|
|
|
|
|
|
Average Life |
|
|
Identifiable intangible assets: |
|
|
|
|
(Years) |
|
|
Management contracts |
|
|
30,900 |
|
3.5 |
|
|
Customer relationships |
|
|
13,400 |
|
10.0 |
|
|
Favorable lease contracts |
|
|
18,220 |
|
12.8 |
|
|
Trade names |
|
|
3,400 |
|
Indefinite |
|
|
Total identifiable intangible assets |
|
|
65,920 |
|
|
|
|
Deferred income taxes and other assets |
|
|
71,417 |
|
|
|
|
Accounts payable and other current liabilities |
|
|
(116,495) |
|
|
|
|
Long-term debt, including amounts due within one year |
|
|
(428,453) |
|
|
|
|
Unfavorable lease contracts |
|
|
(11,480) |
|
|
|
|
Deferred income taxes and other long-term liabilities |
|
|
(142,082) |
|
|
|
|
Total identifiable net assets |
|
|
86,306 |
|
|
|
|
Goodwill |
|
|
261,834 |
|
|
|
|
Net assets |
|
$ |
348,140 |
|
|
|
Pro forma information
The acquired business contributed net revenues of $382.6 million and net income of $9.5 million to the Company for the period from February 1, 2015 to June 30, 2015. The unaudited pro forma net effect of the Combination assuming the acquisition occurred as of January 1, 2014 is as follows (in thousands, except per share amounts):
|
|
Pro Forma three months ended June 30, |
|
|
Pro Forma six months ended June 30, |
|
||||||||
|
|
2015 (1) |
|
2014 |
|
|
2015 |
|
2014 |
|
||||
|
Revenues |
|
N/A |
|
$ |
1,406,823 |
|
|
$ |
2,833,764 |
|
$ |
2,799,880 |
|
|
Loss attributable to Genesis Healthcare, Inc. |
|
N/A |
|
|
(15,051) |
|
|
|
(30,846) |
|
|
(33,133) |
|
|
|
|
|
|
|
|
|
|
|
|
|
|
|
|
|
Loss per common share: |
|
|
|
|
|
|
|
|
|
|
|
|
|
|
Basic |
|
N/A |
|
$ |
(0.17) |
|
|
$ |
(0.35) |
|
$ |
(0.37) |
|
|
Diluted |
|
N/A |
|
$ |
(0.17) |
|
|
$ |
(0.35) |
|
$ |
(0.37) |
|
|
(1) |
Skilled’s financial results of operations are included fully in the three months ended June 30, 2015 |
The unaudited pro forma financial data have been derived by combining the historical financial results of the Company and the operations acquired in the Combination for the periods presented. The unaudited results of operations includes transaction and financing costs totaling $86.9 million incurred by both the Company and Skilled in connection with the Combination. These costs have been eliminated from the results of operations for the six months ended June 30, 2015 for purposes of the pro forma financial presentation.
Related Party Transactions
On March 31, 2015, the Company sold its investment in FC PAC Holdings, LLC (FC PAC), an unconsolidated joint venture in which it held an approximate 5.4% interest, for $26.4 million. The Company recognized a gain on sale of $8.4 million recorded as other income on the statement of operations. FC PAC ownership includes affiliates of Formation
12
GENESIS HEALTHCARE, INC. AND SUBSIDIARIES
NOTES TO CONSOLIDATED FINANCIAL STATEMENTS
(UNAUDITED)
Capital (Formation), a private equity sponsor of the Company prior to the Combination, and also represented by members of the Company’s board of directors.
Acquisition from Revera
On June 15, 2015, the Company announced that it had signed an asset purchase agreement with Revera Assisted Living, Inc., a leading owner, operator and investor in the senior living sector, to acquire 24 of its skilled nursing facilities along with its contract rehabilitation business for $240 million. The Company will acquire the real estate and operations of 20 of the skilled nursing facilities and enter into a long-term lease agreement with Health Care REIT, Inc., a publicly traded real estate investment trust, to operate the other four additional skilled nursing facilities. The transaction is expected to close by this calendar year-end, subject to additional due diligence, regulatory and licensing approvals, and other customary conditions.
(4)Earnings (Loss) Per Share
The Company has three classes of common stock. Classes A and B are identical in economic and voting interests. Class C has a 1:1 voting ratio with the other two classes, representing the voting interests of the approximate 42% noncontrolling interest of the legacy FC-GEN owners. See Note 3 – “Significant Transactions and Events – the Combination with Skilled”. Class C common stock is a participating security; however, it shares in a de minimis economic interest and is therefore excluded from the denominator of the basic earnings per share calculation.
Basic net loss per share was computed by dividing net loss by the weighted-average number of outstanding common shares for the period. Diluted earnings per share is computed by dividing loss plus the effect of assumed conversions (if applicable) by the weighted-average number of outstanding shares after giving effect to all potential dilutive common stock, including options, warrants, common stock subject to repurchase and convertible preferred stock, if any.
The computations of basic and diluted loss per share are consistent with any potentially dilutive adjustments to the numerator or denominator being anti-dilutive and therefore excluded from the dilutive calculation. A reconciliation of the numerator and denominator used in the calculation of basic and diluted net income per common share follows (in thousands, except per share data):
|
|
|
Three months ended June 30, |
|
Six months ended June 30, |
|
||||||||
|
|
|
2015 |
|
2014 |
|
2015 |
|
2014 |
|
||||
|
Numerator: |
|
|
|
|
|
|
|
|
|
|
|
|
|
|
Loss from continuing operations |
|
$ |
(33,214) |
|
$ |
(30,856) |
|
$ |
(151,576) |
|
$ |
(71,644) |
|
|
Less: Net (loss) income attributable to noncontrolling interests |
|
|
(15,750) |
|
|
224 |
|
|
(21,434) |
|
|
409 |
|
|
Loss from continuing operations attributable to Genesis Healthcare, Inc. |
|
$ |
(17,464) |
|
$ |
(31,080) |
|
$ |
(130,142) |
|
$ |
(72,053) |
|
|
Loss from discontinued operations, net of income tax |
|
|
(1,722) |
|
|
(1,176) |
|
|
(1,610) |
|
|
(4,370) |
|
|
Net loss attributable to Genesis Healthcare, Inc. |
|
$ |
(19,186) |
|
$ |
(32,256) |
|
$ |
(131,752) |
|
$ |
(76,423) |
|
|
Denominator: |
|
|
|
|
|
|
|
|
|
|
|
|
|
|
Weighted average shares outstanding for basic and diluted net loss per share |
|
|
89,211 |
|
|
49,865 |
|
|
82,279 |
|
|
49,865 |
|
|
Basic and diluted net loss per common share: |
|
|
|
|
|
|
|
|
|
|
|
|
|
|
Loss from continuing operations attributable to Genesis Healthcare, Inc. |
|
$ |
(0.20) |
|
$ |
(0.63) |
|
$ |
(1.58) |
|
$ |
(1.44) |
|
|
Loss from discontinued operations, net of income tax |
|
|
(0.02) |
|
|
(0.02) |
|
|
(0.02) |
|
|
(0.09) |
|
|
Net loss attributable to Genesis Healthcare, Inc. |
|
$ |
(0.22) |
|
$ |
(0.65) |
|
$ |
(1.60) |
|
$ |
(1.53) |
|
13
GENESIS HEALTHCARE, INC. AND SUBSIDIARIES
NOTES TO CONSOLIDATED FINANCIAL STATEMENTS
(UNAUDITED)
The following were excluded from net income attributable to Genesis Healthcare, Inc. and the weighted-average diluted shares computation for the three and six months ended June 30, 2015 and 2014, as their inclusion would have been anti-dilutive (in thousands):
|
|
|
Three Months Ended June 30, |
|
Six months ended June 30, |
|
||||||||||||||||
|
|
|
2015 |
|
2014 |
|
2015 |
|
2014 |
|
||||||||||||
|
|
|
Net loss attributed to Genesis Healthcare, Inc. |
|
Antidilutive shares |
|
Net loss attributed to Genesis Healthcare, Inc. |
|
Antidilutive shares |
|
Net loss attributed to Genesis Healthcare, Inc. |
|
Antidilutive shares |
|
Net loss attributed to Genesis Healthcare, Inc. |
|
Antidilutive shares |
|
||||
|
Exchange of restricted stock units of noncontrolling interests |
|
$ |
(7,088) |
|
64,461 |
|
$ |
— |
|
— |
|
$ |
(11,306) |
|
53,066 |
|
$ |
— |
|
— |
|
|
Employee and director unvested restricted stock units |
|
|
— |
|
38 |
|
|
— |
|
— |
|
|
— |
|
19 |
|
|
— |
|
— |
|
Because the Company is in a net loss position for the three and six months ended June 30, 2015, the combined impact of the assumed conversion of the approximate 42% noncontrolling interest to common stock and the related tax implications, are anti-dilutive to earnings per share (EPS). As of June 30, 2015, there were 64,449,380 units attributed to the noncontrolling interests outstanding. See Note 3 – “Significant Transactions and Events – the Combination with Skilled.” There were no convertible instruments issued or outstanding as of June 30, 2014 that could be potentially dilutive to net loss for that period. On June 3, 2015, the shareholders approved the 2015 Omnibus Equity Incentive Plan, which provided for the grant of 3,825,420 restricted stock units to employees and 198,020 restricted stock units to non-employee directors. Because the Company is in a net loss position for the three and six months ended June 30, 2015, the combined impact of the grant under the 2015 Omnibus Equity Incentive Plan to common stock and the related tax implications are anti-dilutive to EPS.
14
GENESIS HEALTHCARE, INC. AND SUBSIDIARIES
NOTES TO CONSOLIDATED FINANCIAL STATEMENTS
(UNAUDITED)
(5)Segment Information
The Company has three reportable operating segments: (i) inpatient services; (ii) rehabilitation therapy services; and (iii) other services. For additional information on these reportable segments see Note 1 – “General Information – Description of Business.”
A summary of the Company’s segmented revenues follows:
|
|
|
Three months ended June 30, |
|
|
|
|
|
|||||||||
|
|
|
2015 |
|
2014 |
|
Increase / (Decrease) |
|
|||||||||
|
|
|
Revenue |
|
Revenue |
|
Revenue |
|
Revenue |
|
|
|
|
|
|
||
|
|
|
Dollars |
|
Percentage |
|
Dollars |
|
Percentage |
|
Dollars |
|
Percentage |
|
|||
|
|
|
|
|
|
|
|
|
|
|
|
|
|
|
|
|
|
|
|
|
(in thousands, except percentages) |
|
|||||||||||||
|
Revenues: |
|
|
|
|
|
|
|
|
|
|
|
|
|
|
|
|
|
Inpatient services: |
|
|
|
|
|
|
|
|
|
|
|
|
|
|
|
|
|
Skilled Nursing facilities |
|
$ |
1,164,674 |
|
82.0 |
% |
$ |
983,071 |
|
81.9 |
% |
$ |
181,603 |
|
18.5 |
% |
|
Assisted living facilities |
|
|
36,206 |
|
2.6 |
% |
|
28,006 |
|
2.3 |
% |
|
8,200 |
|
29.3 |
% |
|
Administration of third party facilities |
|
|
2,828 |
|
0.2 |
% |
|
2,618 |
|
0.2 |
% |
|
210 |
|
8.0 |
% |
|
Elimination of administrative services |
|
|
(523) |
|
(0.0) |
% |
|
(462) |
|
(0.0) |
% |
|
(61) |
|
13.2 |
% |
|
Inpatient services, net |
|
|
1,203,185 |
|
84.8 |
% |
|
1,013,233 |
|
84.4 |
% |
|
189,952 |
|
18.8 |
% |
|
|
|
|
|
|
|
|
|
|
|
|
|
|
|
|
|
|
|
Rehabilitation therapy services: |
|
|
|
|
|
|
|
|
|
|
|
|
|
|
|
|
|
Total therapy services |
|
|
274,133 |
|
19.3 |
% |
|
254,941 |
|
21.2 |
% |
|
19,192 |
|
7.5 |
% |
|
Elimination intersegment rehabilitation therapy services |
|
|
(110,002) |
|
(7.7) |
% |
|
(98,812) |
|
(8.2) |
% |
|
(11,190) |
|
11.3 |
% |
|
Third party rehabilitation therapy services |
|
|
164,131 |
|
11.6 |
% |
|
156,129 |
|
13.0 |
% |
|
8,002 |
|
5.1 |
% |
|
|
|
|
|
|
|
|
|
|
|
|
|
|
|
|
|
|
|
Other services: |
|
|
|
|
|
|
|
|
|
|
|
|
|
|
|
|
|
Total other services |
|
|
61,409 |
|
4.3 |
% |
|
38,240 |
|
3.2 |
% |
|
23,169 |
|
60.6 |
% |
|
Elimination intersegment other services |
|
|
(9,250) |
|
(0.7) |
% |
|
(6,951) |
|
(0.6) |
% |
|
(2,299) |
|
33.1 |
% |
|
Third party other services |
|
|
52,159 |
|
3.6 |
% |
|
31,289 |
|
2.6 |
% |
|
20,870 |
|
66.7 |
% |
|
|
|
|
|
|
|
|
|
|
|
|
|
|
|
|
|
|
|
Total revenue |
|
$ |
1,419,475 |
|
100.0 |
% |
$ |
1,200,651 |
|
100.0 |
% |
$ |
218,824 |
|
18.2 |
% |
15
GENESIS HEALTHCARE, INC. AND SUBSIDIARIES
NOTES TO CONSOLIDATED FINANCIAL STATEMENTS
(UNAUDITED)
|
|
|
Six months ended June 30, |
|
|
|
|
|
|||||||||
|
|
|
2015 |
|
2014 |
|
Increase / (Decrease) |
|
|||||||||
|
|
|
Revenue |
|
Revenue |
|
Revenue |
|
Revenue |
|
|
|
|
|
|
||
|
|
|
Dollars |
|
Percentage |
|
Dollars |
|
Percentage |
|
Dollars |
|
Percentage |
|
|||
|
|
|
(in thousands, except percentages) |
|
|||||||||||||
|
Revenues: |
|
|
|
|
|
|
|
|
|
|
|
|
|
|
|
|
|
Inpatient services: |
|
|
|
|
|
|
|
|
|
|
|
|
|
|
|
|
|
Skilled Nursing facilities |
|
$ |
2,269,665 |
|
82.2 |
% |
$ |
1,952,698 |
|
81.8 |
% |
$ |
316,967 |
|
16.2 |
% |
|
Assisted living facilities |
|
|
69,862 |
|
2.5 |
% |
|
55,963 |
|
2.3 |
% |
|
13,899 |
|
24.8 |
% |
|
Administration of third party facilities |
|
|
5,499 |
|
0.2 |
% |
|
5,251 |
|
0.2 |
% |
|
248 |
|
4.7 |
% |
|
Elimination of administrative services |
|
|
(1,024) |
|
(0.0) |
% |
|
(926) |
|
(0.0) |
% |
|
(98) |
|
10.6 |
% |
|
Inpatient services, net |
|
|
2,344,002 |
|
84.9 |
% |
|
2,012,986 |
|
84.3 |
% |
|
331,016 |
|
16.4 |
% |
|
|
|
|
|
|
|
|
|
|
|
|
|
|
|
|
|
|
|
Rehabilitation therapy services: |
|
|
|
|
|
|
|
|
|
|
|
|
|
|
|
|
|
Total therapy services |
|
|
537,184 |
|
19.4 |
% |
|
510,265 |
|
21.4 |
% |
|
26,919 |
|
5.3 |
% |
|
Elimination intersegment rehabilitation therapy services |
|
|
(215,908) |
|
(7.8) |
% |
|
(197,159) |
|
(8.3) |
% |
|
(18,749) |
|
9.5 |
% |
|
Third party rehabilitation therapy services |
|
|
321,276 |
|
11.6 |
% |
|
313,106 |
|
13.1 |
% |
|
8,170 |
|
2.6 |
% |
|
|
|
|
|
|
|
|
|
|
|
|
|
|
|
|
|
|
|
Other services: |
|
|
|
|
|
|
|
|
|
|
|
|
|
|
|
|
|
Total other services |
|
|
113,955 |
|
4.1 |
% |
|
74,191 |
|
3.1 |
% |
|
39,764 |
|
53.6 |
% |
|
Elimination intersegment other services |
|
|
(16,757) |
|
(0.6) |
% |
|
(13,088) |
|
(0.5) |
% |
|
(3,669) |
|
28.0 |
% |
|
Third party other services |
|
|
97,198 |
|
3.5 |
% |
|
61,103 |
|
2.6 |
% |
|
36,095 |
|
59.1 |
% |
|
|
|
|
|
|
|
|
|
|
|
|
|
|
|
|
|
|
|
Total revenue |
|
$ |
2,762,476 |
|
100.0 |
% |
$ |
2,387,195 |
|
100.0 |
% |
$ |
375,281 |
|
15.7 |
% |
A summary of the Company’s unaudited condensed consolidated statement of operations follows:
|
|
|
|
|
|
|
|
|
|
|
|
|
|
|
|
|
|
|
|
|
|
|
|
Three months ended June 30, 2015 |
|
||||||||||||||||
|
|
|
|
|
|
Rehabilitation |
|
|
|
|
|
|
|
|
|
|
|
|
||
|
|
|
Inpatient |
|
Therapy |
|
Other |
|
|
|
|
|
|
|
|
|
|
|||
|
|
|
Services |
|
Services |
|
Services |
|
Corporate |
|
Eliminations |
|
Consolidated |
|
||||||
|
|
|
(In thousands) |
|
||||||||||||||||
|
Net revenues |
|
$ |
1,203,708 |
|
$ |
274,133 |
|
$ |
60,338 |
|
$ |
1,071 |
|
$ |
(119,775) |
|
$ |
1,419,475 |
|
|
Salaries, wages and benefits |
|
|
562,682 |
|
|
220,782 |
|
|
37,462 |
|
|
— |
|
|
— |
|
|
820,926 |
|
|
Other operating expenses |
|
|
430,954 |
|
|
19,595 |
|
|
17,463 |
|
|
— |
|
|
(119,776) |
|
|
348,236 |
|
|
General and administrative costs |
|
|
— |
|
|
— |
|
|
1 |
|
|
44,982 |
|
|
— |
|
|
44,983 |
|
|
Provision for losses on accounts receivable |
|
|
17,271 |
|
|
4,106 |
|
|
779 |
|
|
(43) |
|
|
— |
|
|
22,113 |
|
|
Lease expense |
|
|
37,738 |
|
|
14 |
|
|
747 |
|
|
460 |
|
|
— |
|
|
38,959 |
|
|
Depreciation and amortization expense |
|
|
51,032 |
|
|
3,032 |
|
|
198 |
|
|
(657) |
|
|
— |
|
|
53,605 |
|
|
Interest expense |
|
|
105,815 |
|
|
1 |
|
|
10 |
|
|
20,683 |
|
|
(124) |
|
|
126,385 |
|
|
Investment income |
|
|
(420) |
|
|
— |
|
|
— |
|
|
(135) |
|
|
124 |
|
|
(431) |
|
|
Other income |
|
|
— |
|
|
— |
|
|
— |
|
|
50 |
|
|
— |
|
|
50 |
|
|
Transaction costs |
|
|
50 |
|
|
— |
|
|
— |
|
|
2,592 |
|
|
— |
|
|
2,642 |
|
|
Equity in net (income) loss of unconsolidated affiliates |
|
|
(514) |
|
|
— |
|
|
— |
|
|
(414) |
|
|
568 |
|
|
(360) |
|
|
(Loss) income before income tax benefit |
|
|
(900) |
|
|
26,603 |
|
|
3,678 |
|
|
(66,447) |
|
|
(567) |
|
|
(37,633) |
|
|
Income tax benefit |
|
|
— |
|
|
— |
|
|
— |
|
|
(4,419) |
|
|
— |
|
|
(4,419) |
|
|
(Loss) income from continuing operations |
|
$ |
(900) |
|
$ |
26,603 |
|
$ |
3,678 |
|
$ |
(62,028) |
|
$ |
(567) |
|
$ |
(33,214) |
|
16
GENESIS HEALTHCARE, INC. AND SUBSIDIARIES
NOTES TO CONSOLIDATED FINANCIAL STATEMENTS
(UNAUDITED)
|
|
|
Three months ended June 30, 2014 |
|
||||||||||||||||
|
|
|
|
|
|
Rehabilitation |
|
|
|
|
|
|
|
|
|
|
|
|
||
|
|
|
Inpatient |
|
Therapy |
|
Other |
|
|
|
|
|
|
|
|
|
|
|||
|
|
|
Services |
|
Services |
|
Services |
|
Corporate |
|
Eliminations |
|
Consolidated |
|
||||||
|
|
|
(In thousands) |
|
||||||||||||||||
|
Net revenues |
|
$ |
1,013,695 |
|
$ |
254,941 |
|
$ |
38,119 |
|
$ |
121 |
|
$ |
(106,225) |
|
$ |
1,200,651 |
|
|
Salaries, wages and benefits |
|
|
486,698 |
|
|
205,821 |
|
|
24,696 |
|
|
— |
|
|
— |
|
|
717,215 |
|
|
Other operating expenses |
|
|
348,460 |
|
|
15,888 |
|
|
11,480 |
|
|
— |
|
|
(106,225) |
|
|
269,603 |
|
|
General and administrative costs |
|
|
— |
|
|
— |
|
|
— |
|
|
35,980 |
|
|
— |
|
|
35,980 |
|
|
Provision for losses on accounts receivable |
|
|
12,272 |
|
|
4,542 |
|
|
266 |
|
|
— |
|
|
— |
|
|
17,080 |
|
|
Lease expense |
|
|
32,436 |
|
|
44 |
|
|
207 |
|
|
222 |
|
|
— |
|
|
32,909 |
|
|
Depreciation and amortization expense |
|
|
41,731 |
|
|
2,785 |
|
|
225 |
|
|
4,189 |
|
|
— |
|
|
48,930 |
|
|
Interest expense |
|
|
94,841 |
|
|
1 |
|
|
241 |
|
|
14,941 |
|
|
(124) |
|
|
109,900 |
|
|
Loss on extinguishment of debt |
|
|
— |
|
|
— |
|
|
— |
|
|
181 |
|
|
— |
|
|
181 |
|
|
Investment income |
|
|
(415) |
|
|
— |
|
|
— |
|
|
(145) |
|
|
124 |
|
|
(436) |
|
|
Other income |
|
|
— |
|
|
— |
|
|
(667) |
|
|
— |
|
|
— |
|
|
(667) |
|
|
Transaction costs |
|
|
— |
|
|
(9) |
|
|
— |
|
|
1,307 |
|
|
— |
|
|
1,298 |
|
|
Equity in net (income) loss of unconsolidated affiliates |
|
|
(390) |
|
|
— |
|
|
— |
|
|
— |
|
|
— |
|
|
(390) |
|
|
(Loss) income before income tax benefit |
|
|
(1,938) |
|
|
25,869 |
|
|
1,671 |
|
|
(56,554) |
|
|
— |
|
|
(30,952) |
|
|
Income tax benefit |
|
|
— |
|
|
— |
|
|
— |
|
|
(96) |
|
|
— |
|
|
(96) |
|
|
(Loss) income from continuing operations |
|
$ |
(1,938) |
|
$ |
25,869 |
|
$ |
1,671 |
|
$ |
(56,458) |
|
$ |
— |
|
$ |
(30,856) |
|
|
|
|
Six months ended June 30, 2015 |
|
||||||||||||||||
|
|
|
|
|
|
Rehabilitation |
|
|
|
|
|
|
|
|
|
|
|
|
||
|
|
|
Inpatient |
|
Therapy |
|
Other |
|
|
|
|
|
|
|
|
|
|
|||
|
|
|
Services |
|
Services |
|
Services |
|
Corporate |
|
Eliminations |
|
Consolidated |
|
||||||
|
|
|
(In thousands) |
|
||||||||||||||||
|
Net revenues |
|
$ |
2,345,026 |
|
$ |
537,184 |
|
$ |
112,674 |
|
$ |
1,281 |
|
$ |
(233,689) |
|
$ |
2,762,476 |
|
|
Salaries, wages and benefits |
|
|
1,105,374 |
|
|
435,579 |
|
|
70,706 |
|
|
— |
|
|
— |
|
|
1,611,659 |
|
|
Other operating expenses |
|
|
827,496 |
|
|
34,994 |
|
|
31,996 |
|
|
— |
|
|
(233,689) |
|
|
660,797 |
|
|
General and administrative costs |
|
|
— |
|
|
— |
|
|
3 |
|
|
86,513 |
|
|
— |
|
|
86,516 |
|
|
Provision for losses on accounts receivable |
|
|
36,344 |
|
|
7,933 |
|
|
1,318 |
|
|
(86) |
|
|
— |
|
|
45,509 |
|
|
Lease expense |
|
|
73,266 |
|
|
55 |
|
|
1,206 |
|
|
851 |
|
|
— |
|
|
75,378 |
|
|
Depreciation and amortization expense |
|
|
99,257 |
|
|
5,899 |
|
|
560 |
|
|
7,822 |
|
|
— |
|
|
113,538 |
|
|
Interest expense |
|
|
209,469 |
|
|
2 |
|
|
20 |
|
|
38,454 |
|
|
(247) |
|
|
247,698 |
|
|
Loss on extinguishment of debt |
|
|
— |
|
|
— |
|
|
— |
|
|
3,234 |
|
|
— |
|
|
3,234 |
|
|
Investment income |
|
|
(778) |
|
|
— |
|
|
— |
|
|
(316) |
|
|
247 |
|
|
(847) |
|
|
Other income |
|
|
421 |
|
|
— |
|
|
— |
|
|
(7,981) |
|
|
— |
|
|
(7,560) |
|
|
Transaction costs |
|
|
— |
|
|
— |
|
|
— |
|
|
88,710 |
|
|
— |
|
|
88,710 |
|
|
Equity in net (income) loss of unconsolidated affiliates |
|
|
(823) |
|
|
— |
|
|
— |
|
|
(634) |
|
|
944 |
|
|
(513) |
|
|
(Loss) income before income tax benefit |
|
|
(5,000) |
|
|
52,722 |
|
|
6,865 |
|
|
(215,286) |
|
|
(944) |
|
|
(161,643) |
|
|
Income tax benefit |
|
|
— |
|
|
— |
|
|
— |
|
|
(10,067) |
|
|
— |
|
|
(10,067) |
|
|
(Loss) income from continuing operations |
|
$ |
(5,000) |
|
$ |
52,722 |
|
$ |
6,865 |
|
$ |
(205,219) |
|
$ |
(944) |
|
$ |
(151,576) |
|
17
GENESIS HEALTHCARE, INC. AND SUBSIDIARIES
NOTES TO CONSOLIDATED FINANCIAL STATEMENTS
(UNAUDITED)
|
|
|
Six months ended June 30, 2014 |
|
||||||||||||||||
|
|
|
|
|
|
Rehabilitation |
|
|
|
|
|
|
|
|
|
|
|
|
||
|
|
|
Inpatient |
|
Therapy |
|
Other |
|
|
|
|
|
|
|
|
|
|
|||
|
|
|
Services |
|
Services |
|
Services |
|
Corporate |
|
Eliminations |
|
Consolidated |
|
||||||
|
|
|
(In thousands) |
|
||||||||||||||||
|
Net revenues |
|
$ |
2,013,912 |
|
$ |
510,265 |
|
$ |
73,933 |
|
$ |
258 |
|
$ |
(211,173) |
|
$ |
2,387,195 |
|
|
Salaries, wages and benefits |
|
|
977,772 |
|
|
411,970 |
|
|
48,735 |
|
|
— |
|
|
— |
|
|
1,438,477 |
|
|
Other operating expenses |
|
|
691,499 |
|
|
30,972 |
|
|
21,851 |
|
|
— |
|
|
(211,173) |
|
|
533,149 |
|
|
General and administrative costs |
|
|
— |
|
|
— |
|
|
— |
|
|
71,844 |
|
|
— |
|
|
71,844 |
|
|
Provision for losses on accounts receivable |
|
|
26,855 |
|
|
8,388 |
|
|
356 |
|
|
(3) |
|
|
— |
|
|
35,596 |
|
|
Lease expense |
|
|
64,756 |
|
|
88 |
|
|
420 |
|
|
444 |
|
|
— |
|
|
65,708 |
|
|
Depreciation and amortization expense |
|
|
81,951 |
|
|
5,572 |
|
|
475 |
|
|
8,432 |
|
|
— |
|
|
96,430 |
|
|
Interest expense |
|
|
191,300 |
|
|
2 |
|
|
450 |
|
|
27,145 |
|
|
(247) |
|
|
218,650 |
|
|
Loss on extinguishment of debt |
|
|
— |
|
|
— |
|
|
— |
|
|
680 |
|
|
— |
|
|
680 |
|
|
Investment income |
|
|
(839) |
|
|
— |
|
|
— |
|
|
(787) |
|
|
247 |
|
|
(1,379) |
|
|
Other income |
|
|
— |
|
|
— |
|
|
(667) |
|
|
— |
|
|
— |
|
|
(667) |
|
|
Transaction costs |
|
|
— |
|
|
(9) |
|
|
— |
|
|
3,556 |
|
|
— |
|
|
3,547 |
|
|
Equity in net (income) loss of unconsolidated affiliates |
|
|
(680) |
|
|
— |
|
|
— |
|
|
— |
|
|
334 |
|
|
(346) |
|
|
(Loss) income before income tax benefit |
|
|
(18,702) |
|
|
53,282 |
|
|
2,313 |
|
|
(111,053) |
|
|
(334) |
|
|
(74,494) |
|
|
Income tax benefit |
|
|
— |
|
|
— |
|
|
— |
|
|
(2,850) |
|
|
— |
|
|
(2,850) |
|
|
(Loss) income from continuing operations |
|
$ |
(18,702) |
|
$ |
53,282 |
|
$ |
2,313 |
|
$ |
(108,203) |
|
$ |
(334) |
|
$ |
(71,644) |
|
The following table presents the segment assets as of June 30, 2015 compared to December 31, 2014 (in thousands):
|
|
|
June 30, 2015 |
|
December 31, 2014 |
|
||
|
Inpatient services |
|
$ |
5,278,501 |
|
$ |
4,381,044 |
|
|
Rehabilitation services |
|
|
410,103 |
|
|
322,268 |
|
|
Other services |
|
|
88,724 |
|
|
44,814 |
|
|
Corporate and eliminations |
|
|
326,050 |
|
|
393,282 |
|
|
Total assets |
|
$ |
6,103,378 |
|
$ |
5,141,408 |
|
The following table presents segment goodwill as of June 30, 2015 compared to December 31, 2014 (in thousands):
|
|
|
June 30, 2015 |
|
December 31, 2014 |
|
||
|
Inpatient services |
|
$ |
324,639 |
|
$ |
132,756 |
|
|
Rehabilitation services |
|
|
67,604 |
|
|
25,097 |
|
|
Other services |
|
|
39,272 |
|
|
11,828 |
|
|
Total goodwill |
|
$ |
431,515 |
|
$ |
169,681 |
|
18
GENESIS HEALTHCARE, INC. AND SUBSIDIARIES
NOTES TO CONSOLIDATED FINANCIAL STATEMENTS
(UNAUDITED)
(6)Property and Equipment
Property and equipment consisted of the following as of June 30, 2015 and December 31, 2014 (in thousands):
|
|
|
|
|
|
|
|
|
|
|
|
June 30, 2015 |
|
December 31, 2014 |
|
||
|
Land, buildings and improvements |
|
$ |
628,838 |
|
$ |
225,536 |
|
|
Capital lease land, buildings and improvements |
|
|
890,056 |
|
|
910,820 |
|
|
Financing obligation land, buildings and improvements |
|
|
2,569,972 |
|
|
2,526,792 |
|
|
Equipment, furniture and fixtures |
|
|
402,421 |
|
|
276,983 |
|
|
Construction in progress |
|
|
39,210 |
|
|
55,295 |
|
|
Gross property and equipment |
|
|
4,530,497 |
|
|
3,995,426 |
|
|
Less: accumulated depreciation |
|
|
(535,203) |
|
|
(502,176) |
|
|
Net property and equipment |
|
$ |
3,995,294 |
|
$ |
3,493,250 |
|
(7)Long-Term Debt
Long-term debt at June 30, 2015 and December 31, 2014 consisted of the following (in thousands):
|
|
|
As of June 30, |
|
As of December 31, |
|
||
|
|
|
2015 |
|
2014 |
|
||
|
Revolving credit facility |
|
$ |
293,000 |
|
$ |
254,500 |
|
|
Term loan facility, net of original issue discount of $9,425 at June 30, 2015 and $11,375 at December 31, 2014 |
|
|
220,641 |
|
|
219,297 |
|
|
Real estate bridge loan |
|
|
360,000 |
|
|
— |
|
|
HUD insured loans |
|
|
108,618 |
|
|
— |
|
|
Mortgages and other secured debt (recourse) |
|
|
13,197 |
|
|
14,488 |
|
|
Mortgages and other secured debt (non-recourse) |
|
|
49,059 |
|
|
49,961 |
|
|
|
|
|
1,044,515 |
|
|
538,246 |
|
|
Less: Current installments of long-term debt |
|
|
(12,889) |
|
|
(12,518) |
|
|
Long-term debt |
|
$ |
1,031,626 |
|
$ |
525,728 |
|
Revolving Credit Facilities
In connection with the Combination, on February 2, 2015 the Company entered into new revolving credit facilities and terminated its former revolving credit facilities. The new revolving credit facilities (the Revolving Credit Facilities) consist of a senior secured, asset-based revolving credit facility of up to $550 million under three separate tranches: Tranche A-1, Tranche A-2 and FILO Tranche. Interest accrues at a per annum rate equal to either (x) a base rate (calculated as the highest of the (i) prime rate, (ii) the federal funds rate plus 3.00%, or (iii) LIBOR plus the excess of the applicable margin between LIBOR loans and base rate loans) plus an applicable margin or (y) LIBOR plus an applicable margin. The applicable margin is based on the level of commitments for all three tranches, and in regards to LIBOR loans (i) for Tranche A-1 ranges from 3.25% to 2.75%; (ii) for Tranche A-2 ranges from 3.00% to 2.50%; and (iii) for FILO Tranche is 5.00%. The Revolving Credit Facilities mature on February 2, 2020, provided that if the Term Loan Facility (defined below) or the Real Estate Bridge Loan (defined below) is not refinanced with longer term debt or their terms not extended prior to their current maturities of December 4, 2017 and August 27, 2017, respectively, the Revolving Credit Facilities will mature 90 days prior to such maturity date, as applicable. Borrowing levels under the Revolving Credit Facilities are limited to a borrowing base that is computed based upon the level of the Company’s eligible accounts receivable, as defined. In addition to paying interest on the outstanding principal borrowed under the Revolving Credit Facilities, the Company is required to pay a commitment fee to the lenders for any unutilized
19
GENESIS HEALTHCARE, INC. AND SUBSIDIARIES
NOTES TO CONSOLIDATED FINANCIAL STATEMENTS
(UNAUDITED)
commitments. The commitment fee rate ranges from 0.375% per annum to 0.50% depending upon the level of unused commitment.
Borrowings and interest rates under the three tranches were as follows at June 30, 2015:
|
|
|
|
|
|
|
|
|
|
|
|
|
|
Weighted |
|
|
|
|
|
|
|
Average |
|
|
Revolving credit facility |
|
Borrowings |
|
Interest |
|
|
|
FILO tranche |
|
$ |
25,000 |
|
5.36 |
% |
|
Tranche A-1 |
|
|
193,000 |
|
3.72 |
% |
|
Tranche A-2 |
|
|
75,000 |
|
3.28 |
% |
|
|
|
$ |
293,000 |
|
3.75 |
% |
As of June 30, 2015, the Company had outstanding borrowings under the Revolving Credit Facilities of $293.0 million and had $108.5 million of drawn letters of credit securing insurance and lease obligations, leaving the Company with approximately $133.3 million of available borrowing capacity under the revolving credit facilities.
Term Loan Facility
Prior to the Combination, FC-GEN and certain of its subsidiaries became party to a five-year term loan facility (the Term Loan Facility). The Term Loan Facility is secured by a first priority lien on the membership interests in the Company and on substantially all of the Company’s and its subsidiaries’ assets other than collateral held on a first priority basis by the Revolving Credit Facilities lender. Borrowings under the Term Loan Facility bear interest at a rate per annum equal to the applicable margin plus, at the Company’s option, either (x) LIBOR or (y) a base rate determined by reference to the highest of (i) the lender defined prime rate, (ii) the federal funds rate effective plus one half of one percent and (iii) LIBOR described in subclause (x) plus 1.0%. LIBOR based loans are subject to an interest rate floor of 1.5% and base rate loans are subject to a floor of 2.5%. The Term Loan Facility matures on December 4, 2017. On September 25, 2014, FC-GEN entered into an amendment to the Term Loan Facility providing for changes to the financial covenants and other provisions allowing for and accommodating the Combination. On February 2, 2015, the amendment to the Term Loan Facility became effective. The Term Loan Facility currently has an outstanding principal balance of $230.1 million. Base rate borrowings under the Term Loan Facility bore interest of approximately 10.75% at June 30, 2015. One-month LIBOR borrowings under the Term Loan Facility bore interest of approximately 10.0% at June 30, 2015.
Principal payments for the six months ended June 30, 2015 were $0.6 million. The Term Loan Facility amortizes at a rate of 5% per annum. The lenders have the right to elect ratable principal payments or defer principal recoupment until the end of the term.
Real Estate Bridge Loan
In connection with the Combination on February 2, 2015, the Company entered into a $360.0 million real estate bridge loan (the Real Estate Bridge Loan), which is secured by a mortgage lien on the real property of 67 facilities and a second lien on certain receivables of the operators of such facilities. The Real Estate Bridge Loan is subject to a 24-month term with two extension options of 90-days each and accrues interest at a rate equal to LIBOR, plus 6.75%, plus an additional margin that ranges up to 7.00% based on the aggregate number of days the Real Estate Bridge Loan is outstanding. The interest rate is also subject to a LIBOR interest rate floor of 0.5%. The Real Estate Bridge Loan bore interest of 7.25% at June 30, 2015. The Real Estate Bridge Loan is subject to payments of interest only during the term with a balloon payment due at maturity, provided, that to the extent the subsidiaries receive any net proceeds from the sale and / or refinance of the underlying facilities such net proceeds are required to be used to repay the outstanding principal balance of the Real Estate Bridge Loan. The proceeds of the Real Estate Bridge Loan were used to repay Skilled’s first lien senior secured term loan, repay Skilled’s mortgage loans and asset based revolving credit facility with
20
GENESIS HEALTHCARE, INC. AND SUBSIDIARIES
NOTES TO CONSOLIDATED FINANCIAL STATEMENTS
(UNAUDITED)
MidCap Financial with excess proceeds used to fund direct costs of the Combination with the Company. The Real Estate Bridge Loan has an outstanding principal balance of $360.0 million at June 30, 2015.
The Revolving Credit Facilities, the Term Loan and Real Estate Bridge Loan (collectively, the Credit Facilities) each contain a number of restrictive covenants that, among other things, impose operating and financial restrictions on the Company and its subsidiaries. The Credit Facilities also require the Company to meet defined financial covenants, including interest coverage ratio, a maximum consolidated net leverage ratio and a minimum consolidated fixed charge coverage ratio, all as defined in the applicable agreements. The Credit Facilities also contain other customary covenants and events of default. At June 30, 2015, the Company was in compliance with its covenants.
HUD Insured Loans
In connection with the Combination on February 2, 2015, the Company assumed certain obligations under 10 loans insured by HUD. The loans are secured by 10 of the Company's skilled nursing facilities that were acquired in the Combination. The HUD insured loans have an original amortization term of 30 to 35 years. On May 1, 2015, the Company acquired a facility in Texas and assumed its HUD insured loan totaling $8.4 million with a maturity date of January 1, 2049. As of June 30, 2015 the HUD insured loans have a combined aggregate principal balance of $108.6 million including a $14.8 million debt premium established in purchase accounting in connection with the Combination.
These mortgages have an average remaining term of 31 years with fixed interest rates ranging from 3.4% to 4.6% and a weighted average interest rate of 4.3%. Depending on the mortgage agreement, prepayments are generally allowed only after 12 months from the inception of the mortgage. Prepayments are subject to a penalty of 10% of the remaining principal balances in the first year and the prepayment penalty decreases each subsequent year by 1% until no penalty is required. Any further HUD insured mortgages will require additional HUD approval.
All HUD-insured mortgages are non-recourse loans to the Company. All mortgages are subject to HUD regulatory agreements that require escrow reserve funds to be deposited with the loan servicer for mortgage insurance premiums, property taxes, insurance and for capital replacement expenditures. As of June 30, 2015, the Company has total escrow reserve funds of $5.5 million with the loan servicer that are reported within prepaid expenses.
Other Debt
Mortgages and other secured debt (recourse). The Company carries two mortgage loans on two of its corporate office buildings. The Company also has an outstanding note payable for an acquired facility. The loans are secured by the underlying real property and have fixed or variable rates of interest ranging from 1.9% to 6.0% at June 30, 2015, with maturity dates ranging from 2018 to 2019.
Mortgages and other secured debt (non-recourse). Loans are carried by certain of the Company’s consolidated joint ventures. The loans consist principally of revenue bonds and secured bank loans. Loans are secured by the underlying real and personal property of individual facilities and have fixed or variable rates of interest ranging from 2.5% to 21.9% at June 30, 2015, with maturity dates ranging from 2018 to 2036. Loans are labeled “non-recourse” because neither the Company nor any of its wholly owned subsidiaries is obligated to perform under the respective loan agreements.
21
GENESIS HEALTHCARE, INC. AND SUBSIDIARIES
NOTES TO CONSOLIDATED FINANCIAL STATEMENTS
(UNAUDITED)
The maturity of total debt of $1,044.5 million at June 30, 2015 is as follows (in thousands):
|
|
|
|
|
|
|
Twelve months ending June 30, |
|
|
|
|
|
2016 |
|
$ |
12,974 |
|
|
2017 |
|
|
373,122 |
|
|
2018 |
|
|
219,411 |
|
|
2019 |
|
|
13,814 |
|
|
2020 |
|
|
297,531 |
|
|
Thereafter |
|
|
127,663 |
|
|
Total debt payments |
|
$ |
1,044,515 |
|
(8)Leases and Lease Commitments
The Company leases certain facilities under capital and operating leases. Future minimum payments for the next five years and thereafter under such leases at June 30, 2015 are as follows (in thousands):
|
|
|
|
|
|
|
|
|
|
Twelve months ending June 30, |
|
Capital Leases |
|
Operating Leases |
|
||
|
2016 |
|
$ |
102,896 |
|
$ |
142,114 |
|
|
2017 |
|
|
97,887 |
|
|
141,053 |
|
|
2018 |
|
|
94,950 |
|
|
136,460 |
|
|
2019 |
|
|
97,331 |
|
|
133,161 |
|
|
2020 |
|
|
99,800 |
|
|
132,875 |
|
|
Thereafter |
|
|
3,400,966 |
|
|
340,929 |
|
|
Total future minimum lease payments |
|
|
3,893,830 |
|
$ |
1,026,592 |
|
|
Less amount representing interest |
|
|
(2,847,796) |
|
|
|
|
|
Capital lease obligation |
|
|
1,046,034 |
|
|
|
|
|
Less current portion |
|
|
(1,826) |
|
|
|
|
|
Long-term capital lease obligation |
|
$ |
1,044,208 |
|
|
|
|
Capital Lease Obligations
The capital lease obligations represent the present value of minimum lease payments under such capital lease and cease use arrangements and bear imputed interest at rates ranging from 3.5% to 12.9% at June 30, 2015, and mature at dates ranging from 2015 to 2047.
Deferred Lease Balances
At June 30, 2015 and December 31, 2014, the Company had $61.7 million and $47.8 million, respectively, of favorable leases net of accumulated amortization, included in other identifiable intangible assets, and $39.0 million and $31.4 million, respectively, of unfavorable leases net of accumulated amortization included in other long-term liabilities on the consolidated balance sheet. Favorable and unfavorable lease assets and liabilities, respectively, arise through the acquisition of leases in place which requires those contracts be recorded at their then fair value. The fair value of a lease is determined through a comparison of the actual rental rate with rental rates prevalent for similar assets in similar markets. A favorable lease asset to the Company represents a rental stream that is below market, and conversely an unfavorable lease is one with cost above market rates. These assets and liabilities amortize as lease expense over the remaining term of the respective leases on a straight-line basis. At June 30, 2015 and December 31, 2014, the Company
22
GENESIS HEALTHCARE, INC. AND SUBSIDIARIES
NOTES TO CONSOLIDATED FINANCIAL STATEMENTS
(UNAUDITED)
had $24.0 million and $20.6 million, respectively, of deferred straight-line rent balances included in other long-term liabilities on the consolidated balance sheet.
Lease Covenants
Certain lease agreements contain a number of restrictive covenants that, among other things and subject to certain exceptions, impose operating and financial restrictions on the Company and its subsidiaries. These leases also require the Company to meet defined financial covenants, including a minimum level of consolidated liquidity, a maximum consolidated net leverage ratio, a minimum consolidated fixed charge coverage and a minimum level of tangible net worth. At June 30, 2015, the Company was in compliance with its covenants under its lease arrangements.
In connection with the Combination on February 2, 2015, the Company and certain of its lessors amended the existing lease agreements. These amendments modified certain financial covenants to reflect the combined company.
(9)Financing Obligation
Future minimum payments for the next five years and thereafter under leases classified as financing obligations at June 30, 2015 are as follows (in thousands):
|
|
|
|
|
|
|
Twelve months ending June 30, |
|
|
|
|
|
2016 |
|
$ |
264,362 |
|
|
2017 |
|
|
272,711 |
|
|
2018 |
|
|
280,484 |
|
|
2019 |
|
|
288,483 |
|
|
2020 |
|
|
296,713 |
|
|
Thereafter |
|
|
9,819,799 |
|
|
Total future minimum lease payments |
|
|
11,222,552 |
|
|
Less amount representing interest |
|
|
(8,256,164) |
|
|
Financing obligation |
|
$ |
2,966,388 |
|
|
Less current portion |
|
|
(1,062) |
|
|
Long-term financing obligation |
|
$ |
2,965,326 |
|
(10)Income Taxes
Upon completion of the Combination, the Company effectively owns 58% of FC-GEN, an entity taxed as a partnership for U.S. income tax purposes. This is the Company’s only source of taxable income. The transaction did not materially impact the amount of income subject to corporate tax.
For the three months ended June 30, 2015, the Company recorded an income tax benefit of $4.4 million from continuing operations, representing an effective tax rate of 11.7%, compared to an income tax benefit of $0.1 million from continuing operations, representing an effective tax rate of 0.3%, for the same period in 2014.
For the six months ended June 30, 2015, the Company recorded an income tax benefit of $10.1 million from continuing operations, representing an effective tax rate of 6.2%, compared to an income tax benefit of $2.9 million from continuing operations, representing an effective tax rate of 3.8%, for the same period in 2014.
The 11.4% and the 2.4% respective increase in the effective tax rate is attributable to the establishment of a valuation allowance against the insurance reserves deferred tax asset of its Cayman captive insurance company and the write-off of a portion of deferred tax assets on U.S. federal and state net operating losses. The write-off is a result of a more restrictive change of ownership limitation under IRC Section 382 by which a taxpayer is limited to a certain
23
GENESIS HEALTHCARE, INC. AND SUBSIDIARIES
NOTES TO CONSOLIDATED FINANCIAL STATEMENTS
(UNAUDITED)
amount of net operating losses it can utilize in a given tax year and the insolvency of certain corporate subsidiaries that were converted to limited liability companies that will be treated as partnerships for income tax purposes.
Exchange Rights and Tax Receivable Agreement
Following the Combination, the owners of FC-GEN will have the right to exchange their membership interests in FC-GEN for shares of Class A Common Stock of the Company or cash, at the Company’s option. As a result of such exchanges, the Company’s membership interest in FC-GEN will increase and its purchase price will be reflected in its share of the tax basis of FC-GEN’s tangible and intangible assets. Any resulting increases in tax basis are likely to increase tax depreciation and amortization deductions and, therefore, reduce the amount of income tax the Company would otherwise be required to pay in the future. Any such increase would also decrease gain (or increase loss) on future dispositions of the effected assets.
Concurrent with the Combination, the Company entered into a tax receivable agreement (TRA) with the owners of FC-GEN. The agreement provides for the payment by the Company to the owners of FC-GEN of 90% of the cash savings, if any, in U.S. federal, state and local income tax that the Company actually realizes as a result of (i) the increases in tax basis attributable to the owners of FC-GEN and (ii) tax benefits related to imputed interest deemed to be paid by the Company as a result of the TRA. Under the TRA, the benefits deemed realized by the Company as a result of the increase in tax basis attributable to the owners of FC-GEN generally will be computed by comparing the actual income tax liability of the Company to the amount of such taxes that the Company would have been required to pay had there been no such increase in tax basis.
Estimating the amount of payments that may be made under the TRA is by its nature imprecise, insofar as the calculation of amounts payable depends on a variety of factors. The actual increase in tax basis and deductions, as well as the amount and timing of any payments under the TRA, will vary depending upon a number of factors, including:
|
· |
the timing of exchanges—for instance, the increase in any tax deductions will vary depending on the fair value of the depreciable or amortizable assets of FC-GEN and its subsidiaries at the time of each exchange, which fair value may fluctuate over time; |
|
· |
the price of shares of Company Class A Stock at the time of the exchange—the increase in any tax deductions, and the tax basis increase in other assets of FC-GEN and its subsidiaries is directly proportional to the price of shares of Company Class A Stock at the time of the exchange; |
|
· |
the amount and timing of the Company’s income—the Company is required to pay 90% of the deemed benefits as and when deemed realized. If FC-GEN does not have taxable income, the Company is generally not required (absent a change of control or circumstances requiring an early termination payment) to make payments under the TRA for that taxable year because no benefit will have been actually realized. However, any tax benefits that do not result in realized benefits in a given tax year likely will generate tax attributes that may be utilized to generate benefits in previous or future tax years. The utilization of such tax attributes will result in payments under the TRA; and |
|
· |
future tax rates of jurisdictions in which the Company has tax liability. |
The TRA also provides that upon certain mergers, asset sales, other forms of business combinations or other changes of control, FC-GEN (or its successor’s) obligations under the TRA would be based on certain assumptions defined in the TRA. As a result of these assumptions, FC-GEN could be required to make payments under the TRA that are greater or less than the specified percentage of the actual benefits realized by the Company that are subject to the TRA. In addition, if FC-GEN elects to terminate the TRA early, it would be required to make an early termination payment, which upfront payment may be made significantly in advance of the anticipated future tax benefits.
24
GENESIS HEALTHCARE, INC. AND SUBSIDIARIES
NOTES TO CONSOLIDATED FINANCIAL STATEMENTS
(UNAUDITED)
Payments generally are due under the TRA within a specified period of time following the filing of FC-GEN’s U.S. federal and state income tax return for the taxable year with respect to which the payment obligation arises. Payments under the TRA generally will be based on the tax reporting positions that FC-GEN will determine. Although FC-GEN does not expect the IRS to challenge the Company’s tax reporting positions, FC-GEN will not be reimbursed for any overpayments previously made under the TRA, but any overpayments will reduce future payments. As a result, in certain circumstances, payments could be made under the TRA in excess of the benefits that FC-GEN actually realizes in respect of the tax attributes subject to the TRA.
The term of the TRA generally will continue until all applicable tax benefits have been utilized or expired, unless the Company exercises its right to terminate the TRA and make an early termination payment.
In certain circumstances (such as certain changes in control, the election of the Company to exercise its right to terminate the agreement and make an early termination payment or an IRS challenge to a tax basis increase) it is possible that cash payments under the TRA may exceed actual cash savings.
(11)Commitments and Contingencies
Loss Reserves For Certain Self-Insured Programs
General and Professional Liability and Workers’ Compensation
The Company self-insures for certain insurable risks, including general and professional liabilities and workers’ compensation liabilities through the use of self-insurance or retrospective and self-funded insurance policies and other hybrid policies, which vary among states in which the Company operates, including wholly owned captive insurance subsidiaries, to provide for potential liabilities for general and professional liability claims and workers’ compensation claims. Policies are typically written for a duration of twelve months and are measured on a “claims made” basis. Regarding workers’ compensation, the Company self-insures to its deductible and purchases statutorily required insurance coverage in excess of its deductible. There is a risk that amounts funded by the Company’s self-insurance programs may not be sufficient to respond to all claims asserted under those programs. Insurance reserves represent estimates of future claims payments. This liability includes an estimate of the development of reported losses and losses incurred but not reported. Provisions for changes in insurance reserves are made in the period of the related coverage. The Company also considers amounts that may be recovered from excess insurance carriers in estimating the ultimate net liability for such risks.
The Company’s management employs its judgment and periodic independent actuarial analysis in determining the adequacy of certain self-insured workers’ compensation and general and professional liability obligations recorded as liabilities in the Company’s financial statements. The Company evaluates the adequacy of its self-insurance reserves on a quarterly basis or more often when it is aware of changes to its incurred loss patterns that could impact the accuracy of those reserves. The methods of making such estimates and establishing the resulting reserves are reviewed periodically and are based on historical paid claims information and nationwide nursing home trends. The foundation for most of these methods is the Company’s actual historical reported and/or paid loss data, over which it has effective internal controls. Any adjustments resulting therefrom are reflected in current earnings. Claims are paid over varying periods, and future payments may be different than the estimated reserves.
The Company utilizes third-party administrators (TPAs) to process claims and to provide it with the data utilized in its assessments of reserve adequacy. The TPAs are under the oversight of the Company’s in-house risk management and legal functions. These functions ensure that the claims are properly administered so that the historical data is reliable for
25
GENESIS HEALTHCARE, INC. AND SUBSIDIARIES
NOTES TO CONSOLIDATED FINANCIAL STATEMENTS
(UNAUDITED)
estimation purposes. Case reserves, which are approved by the Company’s legal and risk management departments, are determined based on an estimate of the ultimate settlement and/or ultimate loss exposure of individual claims.
The reserves for loss for workers’ compensation risks are discounted based on actuarial estimates of claim payment patterns using a discount rate of approximately 1% for each policy period presented. The discount rate for the 2015 policy year is 0.78%. The discount rates are based upon the risk-free rate for the appropriate duration for the respective policy year. The removal of discounting would have resulted in an increased reserve for workers’ compensation risks of $5.4 million and $4.8 million as of June 30, 2015 and December 31, 2014, respectively. The reserves for general and professional liability are recorded on an undiscounted basis.
For the three months ended June 30, 2015 and 2014, the provision for general and professional liability risk totaled $45.4 million and $28.3 million, respectively. The provision for general and professional liability risks totaled $71.6 million and $51.0 million for the six months ended June 30, 2015 and 2014, respectively. The reserves for general and professional liability were $346.7 million and $288.2 million as of June 30, 2015 and December 31, 2014, respectively.
For the three months ended June 30, 2015 and 2014, the provision for workers’ compensation risk totaled $13.9 million and $10.1 million, respectively. The provision for loss for workers’ compensation risks totaled $31.8 million and $25.2 million for the six months ended June 30, 2015 and 2014, respectively. The reserves for workers’ compensation risks were $229.0 million and $198.0 million as of June 30, 2015 and December 31, 2014, respectively.
Health Insurance
The Company offers employees an option to participate in self-insured health plans. Health insurance claims are paid as they are submitted to the plans’ administrators. The Company maintains an accrual for claims that have been incurred but not yet reported to the plans’ administrators and therefore have not yet been paid. The liability for the self-insured health plan is recorded in accrued compensation in the consolidated balance sheets. Although management believes that the amounts provided in the Company’s consolidated financial statements are adequate and reasonable, there can be no assurances that the ultimate liability for such self-insured risks will not exceed management’s estimates.
Legal Proceedings
The Company is a party to litigation and regulatory investigations arising in the ordinary course of business. Based on the Company’s evaluation of information currently available, with the exception of the specific matters noted below, management does not believe the results of such litigation and regulatory investigations would have a material adverse effect on the results of operations, financial position or cash flows of the Company.
Creekside Hospice Litigation
On August 2, 2013, the United States Attorney for the District of Nevada and the Civil Division of the U.S. Department of Justice (the DOJ) informed the Company that its Civil Division was investigating Skilled, as well as its subsidiary, Creekside Hospice II, LLC, for possible violations of federal and state healthcare fraud and abuse laws and regulations. Those laws could have included the federal False Claims Act (FCA) and the Nevada False Claims Act (NFCA). The FCA provides for civil and administrative fines and penalties, plus treble damages. The NFCA provides for similar fines and penalties, including treble damages. Violations of those federal or state laws could also subject the Company and/or its subsidiaries to exclusion from participation in the Medicare and Medicaid programs.
On or about August 6, 2014, in relation to the investigation the DOJ filed a notice of intervention in two pending qui tam proceedings filed by private party relators under the FCA and the NFCA and advised that it intends to take over the actions. The DOJ filed its complaint in intervention on November 25, 2014, against Creekside, Skilled Healthcare Group, Inc., and Skilled Healthcare, LLC, asserting, among other things, that certain claims for hospice services
26
GENESIS HEALTHCARE, INC. AND SUBSIDIARIES
NOTES TO CONSOLIDATED FINANCIAL STATEMENTS
(UNAUDITED)
provided by Creekside in the time period 2010 to 2013 did not meet Medicare requirements for reimbursement and are in violation of the civil False Claims Act. The DOJ is pursuing False Claims Act, NFCA, and federal common law claims remedies in an unspecified amount, with a request to treble provable damages and impose penalties per proved false claim in the amount ranging from $5,500 to $11,000 per claim, as applicable.
While the Company denies the allegations and will vigorously defend this action, including any portion of the action that the private party relators may continue to pursue, the Company has accrued $7.5 million as a contingent liability in connection with the matter. However, it could ultimately cost more than that amount to settle or otherwise resolve the matter(s), including to satisfy any judgment that might be rendered against the Company or Creekside Hospice if the litigation defense were ultimately unsuccessful.
Therapy Matters Investigation
In February 2015, representatives of the DOJ informed the Company that they are investigating and may pursue legal action against the Company and certain of its subsidiaries including Hallmark Rehabilitation GP, LLC for alleged violations of the federal and state healthcare fraud and abuse laws and regulations related to the provision of therapy services at certain Skilled Healthcare facilities from 2005 through 2013. These laws could include the FCA and similar state laws. As noted above, the FCA provides for civil and administrative fines and penalties, including civil fines ranging from $5,500 to $11,000 per claim plus treble damages. Applicable state laws provide for similar penalties. Violations of these federal or state laws could also subject the Company and/or its subsidiaries to exclusion from participation in the Medicare and Medicaid programs. Any damages, fines, penalties, other sanctions and costs that the Company may incur as a result of any federal and/or state suit could be significant and could have a material and adverse effect on its results of operations and financial condition. At this time, the Company cannot predict what effect, if any, the investigation or any potential claims arising under applicable federal or state laws and regulations could have on the Company. While the Company will continue to cooperate with the government’s investigation of the matter, the Company intends to vigorously defend against any legal action that may be brought in the matter.
Staffing Matters Investigation
On February 10, 2015, the DOJ informed the Company that it intends to pursue legal action against the Company and certain of its subsidiaries related to staffing and certain quality of care allegations related to the issues adjudicated against the Company and those subsidiaries in a previously disclosed class action lawsuit that Skilled settled in 2010. The laws under which the DOJ could seek to pursue legal action could include the FCA and similar state laws. As noted above, violations of the FCA or similar state laws and regulations could subject the Company and/or its subsidiaries to severe monetary and other penalties and remedies. Any damages, fines, penalties, other sanctions and costs that the Company may incur as a result of any federal or state suit could be significant and could have a material and adverse effect on its results of operations and financial condition. At this time, the Company cannot predict what effect, if any, the investigation or any potential claims arising under applicable federal or state laws and regulations could have on the Company. While the Company will continue to cooperate with the government's evaluation of the matter, the Company intends to vigorously defend against any legal action that may be brought in the matter.
(12)Fair Value of Financial Instruments
The Company’s financial instruments consist primarily of cash and equivalents, restricted cash, trade accounts receivable, investments in marketable securities, accounts payable, short and long-term debt and derivative financial instruments.
The Company’s financial instruments, other than its trade accounts receivable and accounts payable, are spread across a number of large financial institutions whose credit ratings the Company monitors and believes do not currently
27
GENESIS HEALTHCARE, INC. AND SUBSIDIARIES
NOTES TO CONSOLIDATED FINANCIAL STATEMENTS
(UNAUDITED)
carry a material risk of non-performance. Certain of the Company’s financial instruments, including its interest rate cap arrangements, contain an off-balance-sheet risk.
Recurring Fair Value Measures
Fair value is defined as an exit price (i.e., the price that would be received to sell an asset or paid to transfer a liability in an orderly transaction between market participants at the measurement date). The fair value hierarchy prioritizes the inputs to valuation techniques used to measure fair value into three broad levels as shown below. An instrument’s classification within the fair value hierarchy is determined based on the lowest level input that is significant to the fair value measurement.
|
|
Level 1 — |
|
Quoted prices (unadjusted) in active markets for identical assets or liabilities. |
|
|
Level 2 — |
|
Inputs that are observable for the asset or liability, either directly or indirectly through market corroboration, for substantially the full term of the asset or liability. |
|
|
Level 3 — |
|
Inputs that are unobservable for the asset or liability based on the Company’s own assumptions (about the assumptions market participants would use in pricing the asset or liability). |
The tables below presents the Company’s assets and liabilities measured at fair value on a recurring basis as of June 30, 2015 and December 31, 2014, aggregated by the level in the fair value hierarchy within which those measurements fall (in thousands):
|
|
|
|
|
|
|
|
|
|
|
|
|
|
|
|
|
|
Fair Value Measurements at Reporting Date Using |
|
||||||||||
|
|
|
June 30, |
|
Quoted Prices in |
|
Significant Other |
|
Significant |
|
||||
|
Assets: |
|
2015 |
|
(Level 1) |
|
(Level 2) |
|
(Level 3) |
|
||||
|
Cash and equivalents |
|
$ |
82,963 |
|
$ |
82,963 |
|
$ |
— |
|
$ |
— |
|
|
Restricted cash and equivalents |
|
|
43,403 |
|
|
43,403 |
|
|
— |
|
|
— |
|
|
Restricted investments in marketable securities |
|
|
133,204 |
|
|
133,204 |
|
|
— |
|
|
— |
|
|
Total |
|
$ |
259,570 |
|
$ |
259,570 |
|
$ |
— |
|
$ |
— |
|
|
|
|
|
|
|
|
|
|
|
|
|
|
|
|
|
|
|
Fair Value Measurements at Reporting Date Using |
|
||||||||||
|
|
|
December 31, |
|
Quoted Prices in |
|
Significant Other |
|
Significant |
|
||||
|
Assets: |
|
2014 |
|
(Level 1) |
|
(Level 2) |
|
(Level 3) |
|
||||
|
Cash and equivalents |
|
$ |
87,548 |
|
$ |
87,548 |
|
$ |
— |
|
$ |
— |
|
|
Restricted cash and equivalents |
|
|
36,390 |
|
|
36,390 |
|
|
— |
|
|
— |
|
|
Restricted investments in marketable securities |
|
|
110,350 |
|
|
110,350 |
|
|
— |
|
|
— |
|
|
Total |
|
$ |
234,288 |
|
$ |
234,288 |
|
$ |
— |
|
$ |
— |
|
The Company places its cash and equivalents and restricted investments in marketable securities in quality financial instruments and limits the amount invested in any one institution or in any one type of instrument. The Company has not experienced any significant losses on such investments.
28
GENESIS HEALTHCARE, INC. AND SUBSIDIARIES
NOTES TO CONSOLIDATED FINANCIAL STATEMENTS
(UNAUDITED)
Debt Instruments
The table below shows the carrying amounts and estimated fair values of the Company’s primary long-term debt instruments:
|
|
|
|
|
|
|
|
|
|
|
|
|
|
|
|
|
|
June 30, 2015 |
|
December 31, 2014 |
|
||||||||
|
|
|
Carrying Value |
|
Fair Value |
|
Carrying Value |
|
Fair Value |
|
||||
|
|
|
|
|
|
|
|
|
|
|
|
|
|
|
|
Revolving credit facility |
|
$ |
293,000 |
|
$ |
293,000 |
|
$ |
254,500 |
|
$ |
254,500 |
|
|
Term loan facility, net of original issue discount of $9,425 at June 30, 2015 and $11,375 at December 31, 2014 |
|
|
220,641 |
|
|
224,667 |
|
|
219,297 |
|
|
229,677 |
|
|
Real estate bridge loan |
|
|
360,000 |
|
|
360,000 |
|
|
— |
|
|
— |
|
|
HUD insured loans |
|
|
108,618 |
|
|
108,618 |
|
|
— |
|
|
— |
|
|
Mortgages and other secured debt (recourse) |
|
|
13,197 |
|
|
13,197 |
|
|
14,488 |
|
|
14,488 |
|
|
Mortgages and other secured debt (non-recourse) |
|
|
49,059 |
|
|
49,059 |
|
|
49,961 |
|
|
49,961 |
|
|
|
|
$ |
1,044,515 |
|
$ |
1,048,541 |
|
$ |
538,246 |
|
$ |
548,626 |
|
The fair value of debt is based upon market prices or is computed using discounted cash flow analysis, based on the Company’s estimated borrowing rate at the end of each fiscal period presented. The Company believes that the inputs to the pricing models qualify as Level 2 measurements.
Non-Recurring Fair Value Measures
The Company recently applied the fair value measurement principles to certain of its non-recurring nonfinancial assets in connection with an impairment test.
The following table presents the Company’s hierarchy for nonfinancial assets measured at fair value on a non-recurring basis (in thousands):
|
|
|
|
|
|
|
|
|
|
|
|
|
|
|
Impairment Charges - |
|
|
|
|
|
Carrying Value |
|
Six Months Ended |
|
||
|
|
|
June 30, 2015 |
|
June 30, 2015 |
|
||
|
Assets: |
|
|
|
|
|
|
|
|
Property and equipment, net |
|
$ |
3,995,294 |
|
$ |
— |
|
|
Goodwill |
|
|
431,515 |
|
|
— |
|
|
Intangible assets |
|
|
225,945 |
|
|
— |
|
|
|
|
|
|
|
|
|
|
|
|
|
|
|
|
Impairment Charges - |
|
|
|
|
|
Carrying Value |
|
Six Months Ended |
|
||
|
|
|
December 31, 2014 |
|
June 30, 2014 |
|
||
|
Assets: |
|
|
|
|
|
|
|
|
Property and equipment, net |
|
$ |
3,493,250 |
|
$ |
— |
|
|
Goodwill |
|
|
169,681 |
|
|
— |
|
|
Intangible assets |
|
|
173,112 |
|
|
— |
|
The fair value of tangible and intangible assets is determined using a discounted cash flow approach, which is a significant unobservable input (Level 3). The Company estimates the fair value using the income approach (which is a discounted cash flow technique). These valuation methods required management to make various assumptions, including, but not limited to, future profitability, cash flows and discount rates. The Company’s estimates are based upon
29
GENESIS HEALTHCARE, INC. AND SUBSIDIARIES
NOTES TO CONSOLIDATED FINANCIAL STATEMENTS
(UNAUDITED)
historical trends, management’s knowledge and experience and overall economic factors, including projections of future earnings potential.
Developing discounted future cash flows in applying the income approach requires the Company to evaluate its intermediate to longer-term strategies, including, but not limited to, estimates of revenue growth, operating margins, capital requirements, inflation and working capital management. The development of appropriate rates to discount the estimated future cash flows requires the selection of risk premiums, which can materially impact the present value of future cash flows.
The Company estimated the fair value of acquired tangible and intangible assets using discounted cash flow techniques that included an estimate of future cash flows, consistent with overall cash flow projections used to determine the purchase price paid to acquire the business, discounted at a rate of return that reflects the relative risk of the cash flows.
The Company believes the estimates and assumptions used in the valuation methods are reasonable.
(13)Subsequent Events
On July 1, 2015, the Company acquired 22 rehabilitation outpatient clinics from Formation for a purchase price of $1.1 million. The acquisition was financed entirely with a promissory note.
30
Item 2. Management’s Discussion and Analysis of Financial Condition and Results of Operations
This Management’s Discussion and Analysis of Financial Condition and Results of Operations (MD&A) is intended to assist in understanding and assessing the trends and significant changes in our results of operations and financial condition as of the dates and for the periods presented and should be read in conjunction with the consolidated financial statements and related notes thereto included in Item 1, “Financial Statements” in this Quarterly Report on Form 10-Q. As used in this MD&A, the words “we,” “our,” “us” and the “Company,” and similar terms, refer collectively to Genesis Healthcare, Inc. and its wholly-owned subsidiaries, unless the context requires otherwise. This MD&A should be read in conjunction with our condensed consolidated financial statements and related notes included in this report, as well as the financial information and MD&A contained in the Form 8-K filed with the SEC on July 24, 2015, the Genesis audited financial statements for the year ended December 31, 2014 filed with the SEC on Form 8-K/A on February 26, 2015 and the financial information and MD&A as of September 30, 2014 contained in the Schedule 14C Information Statement filed in connection with the Combination (defined below) on January 9, 2015.
All statements included or incorporated by reference in this Quarterly Report on Form 10-Q, other than statements or characterizations of historical fact, are forward-looking statements within the meaning of the federal securities laws, including the Private Securities Litigation Reform Act of 1995. You can identify these statements by the fact that they do not relate strictly to historical or current facts. These statements contain words such as “may,” “will,” “project,” “might,” “expect,” “believe,” “anticipate,” “intend,” “could,” “would,” “estimate,” “continue,” “pursue,” “plans” or “prospect,” or the negative or other variations thereof or comparable terminology. They include, but are not limited to, statements about the Company’s expectations and beliefs regarding its future operations and financial performance. Historical results may not indicate future performance. Our forward-looking statements are based on current expectations and projections about future events, and there can be no assurance that they will be achieved or occur, in whole or in part, in the timeframes anticipated by the Company or at all. Investors are cautioned that forward-looking statements are not guarantees of future performance or results and involve risks and uncertainties that cannot be predicted or quantified and, consequently, the actual performance of the Company may differ materially from that expressed or implied by such forward-looking statements. These risks and uncertainties include, but are not limited to, those discussed in our Annual Report on Form 10-K for the year ended December 31, 2014, particularly in Item 1A, “Risk Factors,” which was filed with the SEC on February 20, 2015, and in our subsequent quarterly and current reports filed with the SEC after that date, as well as others that are discussed in this Form 10-Q. These risks and uncertainties could materially and adversely affect our business, financial condition, prospects, operating results or cash flows. Our business is also subject to the risks that affect many other companies, such as employment relations, natural disasters, general economic conditions and geopolitical events. Further, additional risks not currently known to us or that we currently believe are immaterial may in the future materially and adversely affect our business, operations, liquidity and stock price. Any forward-looking statements contained herein are made only as of the date of this report. The Company disclaims any obligation to update the forward-looking statements. Investors are cautioned not to place undue reliance on these forward-looking statements.
Business Overview
Genesis is a healthcare services company that through its subsidiaries owns and operates skilled nursing facilities, assisted living facilities, hospices, home health providers and a rehabilitation therapy business. We have an administrative service company that provides a full complement of administrative and consultative services that allows our affiliated operators and third-party operators with whom we contract to better focus on delivery of healthcare services. We provide inpatient services through 514 skilled nursing, assisted living and behavioral health centers located in 34 states. Revenues of our owned, leased and otherwise consolidated centers constitute approximately 85% of our revenues.
We also provide a range of rehabilitation therapy services, including speech pathology, physical therapy, occupational therapy and respiratory therapy. These services are provided by rehabilitation therapists and assistants employed or contracted at substantially all of the centers operated by us, as well as by contract to healthcare facilities operated by others. After the elimination of intercompany revenues, the rehabilitation therapy services business constitutes approximately 12% of our revenues.
31
We provide an array of other specialty medical services, including management services, physician services, staffing services, hospice and home health services, and other healthcare related services, which comprise the balance of our revenues.
Recent Transactions
The Combination with Skilled
On August 18, 2014, Skilled Healthcare Group, Inc., a Delaware corporation (Skilled) entered into a Purchase and Contribution Agreement with FC-GEN Operations Investment, LLC (FC-GEN) pursuant to which the businesses and operations of FC-GEN and Skilled were combined (the Combination). On February 2, 2015, the Combination was completed.
The following diagram depicts the organizational structure of us at the time of the Combination:
Upon completion of the Combination, we now operate under the name Genesis Healthcare, Inc. and the Class A common stock of the combined company continues to trade on the NYSE under the symbol “GEN”. Upon the closing of the Combination, the former owners of FC-GEN held 74.25% of the economic interests in the combined entity and the former shareholders of Skilled held the remaining 25.75% of the economic interests in the combined entity post-transaction, in each case on a fully-diluted, as-exchanged and as-converted basis. Under applicable accounting standards, FC-GEN was the accounting acquirer in the Combination, which was treated as a reverse acquisition. The acquisition method has been applied to the accounts of Skilled based on Skilled’s stock price (level 1 valuation technique - quoted prices in active markets for identical assets or liabilities) as of the acquisition date. The consideration has been allocated to the legacy Skilled business that was acquired on the acquisition date with the excess consideration over the fair value of the net assets acquired recognized as goodwill. As of the effective date of the Combination, FC-GEN’s assets and liabilities remained at their historical costs.
Because FC-GEN’s pre-transaction owners held an approximately 58% direct controlling interest in Skilled and a 74.25% economic and voting interest in the combined company, FC-GEN is considered to be the acquirer of Skilled for
32
accounting purposes. Following the closing of the Combination, the combined results of Skilled and FC-GEN are consolidated with approximately 42% direct noncontrolling economic interest shown as noncontrolling interest in the financial statements of the combined entity. The 42% direct noncontrolling economic interest is in the form of Class A common units of FC-GEN that are exchangeable on a 1 to 1 basis to public shares of ours. The 42% direct noncontrolling economic interest will continue to decrease as Class A common units of FC-GEN are exchanged for public shares of ours.
Recent Accounting Pronouncements
In May 2014, the Financial Accounting Standards Board (the FASB) issued ASU No. 2014-09, Revenue from Contracts with Customers, (ASU 2014-09) which changes the requirements for recognizing revenue when entities enter into contracts with customers. Under ASU 2014-09, an entity will recognize revenue when it transfers promised goods or services to customers in an amount that reflects what it expects in exchange for the goods or services. It also requires more detailed disclosures to enable users of financial statements to understand the nature, amount, timing, and uncertainty of revenue and cash flows arising from contracts with customers. The adoption of ASU 2014-09 is effective for annual and interim periods beginning after December 15, 2017 and early adoption is not permitted. We are still evaluating the effect, if any, ASU 2014-09 will have on our consolidated financial condition and results of operations.
In February 2015, the FASB issued ASU 2015-02, Consolidation (Topic 810): Amendments to the Consolidation Analysis (ASU 2015-02), which changes the way reporting enterprises evaluate whether (a) they should consolidate limited partnerships and similar entities, (b) fees paid to a decision maker or service provider are variable interests in a variable interest entity (VIE), and (c) variable interests in a VIE held by related parties of the reporting enterprise require the reporting enterprise to consolidate the VIE. It also eliminates the VIE consolidation model based on majority exposure to variability that applied to certain investment companies and similar entities. The new guidance excludes money market funds that are required to comply with Rule 2a-7 of the Investment Company Act of 1940 and similar entities from the U.S. GAAP consolidation requirements. The adoption of ASU 2015-02 is effective for fiscal years beginning after December 15, 2015, and interim periods within those fiscal years, with early adoption permitted. If adopted in an interim period, this ASU must be reflected as of the beginning of the fiscal year that includes that interim period. The adoption of ASU No. 2015-02 is not expected to have a material impact on our consolidated financial condition and results of operations.
In April 2015, the FASB issued ASU No. 2015-03, Simplifying the Presentation of Debt Issuance Costs, (ASU 2015-03). This ASU requires an entity to present debt issuance costs as a direct deduction from the carrying amount of the related debt liability, consistent with debt discounts. The costs will continue to be amortized to interest expense using the effective interest method. The adoption of ASU 2015-03 is effective for fiscal years beginning after December 15, 2015, and interim periods within those fiscal years, with early adoption permitted. This ASU requires retrospective application to all prior periods presented in the financial statements. The adoption of ASU No. 2015-03 is not expected to have a material impact on our consolidated financial condition and results of operations.
33
Regulatory and other Governmental Actions Affecting Revenue
We derive a substantial portion of our revenue from government Medicare and Medicaid programs. In addition, our rehabilitation therapy services, for which we receive payment from private payors, is significantly dependent on Medicare and Medicaid funding, as those private payors are primarily funded or reimbursed by these programs. Medicare and Medicaid reimbursement rates and procedures are subject to change from time to time, which could materially impact our revenue.
On July 9, 2015, the Centers for Medicare & Medicaid Services (CMS) proposed a new mandatory Comprehensive Care for Joint Replacement (CCJR) model focusing on coordinated, patient-centered care. Under this proposed model, the hospital in which the hip or knee replacement takes place would be accountable for the costs and quality of care from the time of the surgery through 90 days after or an “episode” of care. Depending on the hospital’s quality and cost performance during the episode, the hospital would either earn a financial reward or be required to repay Medicare for a portion of the costs. This payment would give hospitals an incentive to work with physicians, home health agencies, and nursing facilities to make sure beneficiaries receive the coordinated care they need with the goal of reducing avoidable hospitalizations and complications. This proposed model would be in 75 geographic areas throughout the country and most hospitals in those regions would be required to participate. Following publication of a final rule and implementation of the CCJR program, our Medicare revenues derived from our affiliated skilled nursing facilities and other post-acute services related to lower extremity joint replacement hospital discharges could be increased or reduced in those geographic areas identified by CMS for mandatory participation in the bundled payment program.
On July 13, 2015, CMS released a proposed rule that would reform requirements for long-term care facilities, specifically skilled nursing facilities and nursing facilities, that participate in Medicare and Medicaid. The rule would reorder, clarify, and update regulations that the agency has not reviewed comprehensively since 1991. Under the proposed rule, facilities are required to 1) create interim care plans within 48 hours of admission; notify a resident’s physician after a change in status, engage in interdisciplinary care planning, have a practitioner assess the patient in-person prior to a transfer to the hospital, and improve clinical records to ensure providers have the necessary information to decide on hospitalization; 2) conduct comprehensive assessments of their staff and patient needs, apply current requirements for antipsychotic drugs to all psychotropic drugs, and require physicians to document their response to irregularities identified by consultant pharmacists; 3) conduct assessments of their resident population, implement and update periodically an infection prevention and control program, and establish an antibiotic stewardship program; 4) address requirements related to behavioral health services, ensuring facilities have adequate staffing to meet the needs of residents with mental illness and cognitive impairment; and 5) conduct assessments of their patient populations and related care needs to determine adequate staffing levels (i.e., number and skillsets) for nursing, behavioral health, and nutritional services. CMS estimates that these proposed regulations would cost facilities nearly $46.5 million in the first year and over $40.6 million in subsequent years. However, these amounts would vary considerably among organizations. In addition to the monetary costs, these regulations may create compliance issues, as state regulators and surveyors interpret requirements that are less explicit.
On July 30, 2015, CMS issued its final rule outlining fiscal year 2016 Medicare payment rates for skilled nursing facilities. CMS estimates that aggregate payments to skilled nursing facilities will increase by 1.2% for fiscal year 2016. This estimated increase reflected a 2.3% market basket increase, reduced by a 0.6% point forecast error adjustment and further reduced by a 0.5% multi-factor productivity adjustment required by the Patient Protection and Affordable Care Act. This final rule also identified a new skilled nursing facility value-based purchasing program and an all-cause all-condition hospital readmission measure.
On April 16, 2015, the President signed into law the H.R. 2 Medicare Access and State Children's Health Insurance Program (CHIP) Reauthorization Act of 2015. This bill includes a number of provisions, including replacement of the Sustainable Growth Rate (SGR) formula used by Medicare to pay physicians with new systems for establishing annual payment rate updates for physicians' services. In addition, it increases premiums for Part B and Part D of Medicare for beneficiaries with income above certain levels and makes numerous other changes to Medicare and Medicaid.
34
Some of our rehabilitation therapy revenue is paid by the Medicare Part B program under a fee schedule. Congress has established annual caps that limit the amounts that can be paid (including deductible and coinsurance amounts) for rehabilitation therapy services rendered to any Medicare beneficiary under Medicare Part B. The Deficit Reduction Act of 2005 added Sec. 1833(g)(5) of the Social Security Act and directed CMS to develop a process that allows exceptions for Medicare beneficiaries to therapy caps when continued therapy is deemed medically necessary. Annual limitations on beneficiary incurred expenses for outpatient therapy services under Medicare Part B are commonly referred to as “therapy caps.” All beneficiaries began a new cap year on January 1, 2015 since the therapy caps are determined on a calendar year basis. For physical therapy (PT) and speech-language pathology services (SLP) combined, the limit on incurred expenses is $1,940 in 2015. For occupational therapy (OT) services, the limit is $1,940 in 2015. Deductible and coinsurance amounts paid by the beneficiary for therapy services count toward the amount applied to the limit.
An “exceptions process” to the therapy caps was in effect through March 31, 2015 under the Protecting Access to Medicare Act of 2014. For claims furnished through March 31, 2015 that exceed the therapy caps, therapy service providers and suppliers may request an exception when one is appropriate. Manual policies relevant to the exceptions process apply only when exceptions to the therapy caps are in effect. The therapy exception process was again extended and the expected SGR of 21% to the Physician Fee Screen for outpatient therapy services was repealed through the H.R. 2 Medicare Access and CHIP Reauthorization Act of 2015. Under the act, the therapy cap exception went into effect on April 1, 2015 and extends through December 31, 2017.
A manual medical review process, as part of the therapy exceptions process, applies to therapy claims when a beneficiary’s incurred expenses exceed a threshold amount of $3,700 annually. Specifically, combined PT and SLP services that exceed $3,700 are subject to manual medical review, as well as OT services that exceed $3,700. A beneficiary’s incurred expenses apply towards the manual medical review thresholds in the same manner as it applies to the therapy caps. Manual medical review was in effect through a post-payment review system until March 31, 2015. As part of the Medicare Access and CHIP Reauthorization Act of 2015, the manual medical review process will be replaced with a new process to be developed by the Secretary of Health and Human Services.
For a discussion of historic adjustments and recent changes to the Medicare program and related reimbursement rates, please refer to those discussions included in our most recent Annual Report on Form 10-K, filed on February 20, 2015, as well as Part I, Item 1A, “Risk Factors” of that document. The federal government and state governments continue to focus on efforts to curb spending on healthcare programs such as Medicare and Medicaid. We are not able to predict the outcome of the legislative process. We also cannot predict the extent to which proposals will be adopted or, if adopted and implemented, what effect, if any, such proposals and existing new legislation will have on us. Efforts to impose reduced allowances, greater discounts and more stringent cost controls by government and other payors are expected to continue and could adversely affect our business, financial condition and results of operations.
Key Financial Performance Indicators
In order to compare our financial performance between periods, we assess certain key performance indicators for each of our operating segments separately for the periods presented.
The following is a glossary of terms for some of our key performance indicators and non-GAAP measures:
“Actual Patient Days” is defined as the number of residents occupying a bed (or units in the case of an assisted living center) for one qualifying day in that period;
“Adjusted EBITDA” is defined as EBITDA adjusted for (1) the conversion to cash basis leases (2) newly acquired or constructed businesses with start-up losses and (3) other adjustments. See “Reasons for Non-GAAP Financial Disclosure” for an explanation of the adjustments and a description of our uses of, and the limitations associated with, non-GAAP measures.
“Adjusted EBITDAR” is defined as EBITDAR adjusted for (1) the conversion to cash basis leases (2) newly acquired or constructed businesses with start-up losses and (3) other adjustments. See “Reasons for Non-GAAP Financial
35
Disclosure” for an explanation of the adjustments and a description of our uses of, and the limitations associated with, non-GAAP measures.
“Available Patient Days” is defined as the number of available beds (or units in the case of an assisted living center) multiplied by the number of days in that period;
“Average Daily Census” or “ADC” is the number of residents occupying a bed (or units in the case of an assisted living center) over a period of time, divided by the number of calendar days in that period;
“EBITDA” is defined as EBITDAR less lease expense. See “Reasons for Non-GAAP Financial Disclosure” for an explanation of the adjustments and a description of our uses of, and the limitations associated with non-GAAP measures.
“EBITDAR” is defined as net income or loss before depreciation and amortization expense, interest expense, lease expense, loss (gain) on extinguishment of debt, other (income) loss, transaction costs, long-lived asset impairment, income tax expense (benefit) and loss from discontinued operations. See “Reasons for Non-GAAP Financial Disclosure” for an explanation of the adjustments and a description of our uses of, and the limitations associated with non-GAAP measures.
“Insurance” refers collectively to commercial insurance and managed care payor sources, but does not include managed care payors serving Medicaid residents, which are included in the Medicaid category;
“Occupancy Percentage” is measured as the percentage of Actual Patient Days relative to the Available Patient Days;
“Skilled Mix” refers collectively to Medicare and Insurance payor sources.
“Therapist Efficiency” is computed by dividing billable labor minutes related to patient care by total labor minutes for the period.
Key performance indicators for our businesses are set forth below, followed by a comparison and analysis of our financial results:
|
|
|
Three months ended June 30, |
|
|
Six months ended June 30, |
|
||||||||
|
|
|
2015 |
|
2014 |
|
|
2015 |
|
2014 |
|
||||
|
|
|
(In thousands) |
|
|
(In thousands) |
|
||||||||
|
|
|
|
|
|
|
|
|
|
|
|
|
|
|
|
|
Financial Results |
|
|
|
|
|
|
|
|
|
|
|
|
|
|
|
Net revenues |
|
$ |
1,419,475 |
|
$ |
1,200,651 |
|
|
$ |
2,762,476 |
|
$ |
2,387,195 |
|
|
EBITDAR |
|
|
184,008 |
|
|
161,599 |
|
|
|
359,355 |
|
|
309,854 |
|
|
EBITDA |
|
|
145,049 |
|
|
128,690 |
|
|
|
283,977 |
|
|
244,146 |
|
|
Adjusted EBITDAR |
|
|
197,974 |
|
|
163,027 |
|
|
|
375,777 |
|
|
314,477 |
|
|
Adjusted EBITDA |
|
|
76,557 |
|
|
50,451 |
|
|
|
136,982 |
|
|
91,974 |
|
36
INPATIENT SEGMENT:
|
|
|
Three months ended June 30, |
|
|
Six months ended June 30, |
|
||||||||
|
|
|
2015 |
|
2014 |
|
|
2015 |
|
2014 |
|
||||
|
|
|
|
|
|
|
|
|
|
|
|
|
|
|
|
|
Occupancy Statistics - Inpatient |
|
|
|
|
|
|
|
|
|
|
|
|
|
|
|
Available licensed beds in service at end of period |
|
|
56,730 |
|
|
46,451 |
|
|
|
56,730 |
|
|
46,451 |
|
|
Available operating beds in service at end of period |
|
|
55,087 |
|
|
45,057 |
|
|
|
55,087 |
|
|
45,057 |
|
|
Available patient days based on licensed beds |
|
|
5,154,768 |
|
|
4,231,255 |
|
|
|
9,930,941 |
|
|
8,420,379 |
|
|
Available patient days based on operating beds |
|
|
4,996,311 |
|
|
4,103,685 |
|
|
|
9,625,192 |
|
|
8,164,113 |
|
|
Actual patient days |
|
|
4,338,337 |
|
|
3,675,482 |
|
|
|
8,427,184 |
|
|
7,307,551 |
|
|
Occupancy percentage - licensed beds |
|
|
84.2 |
% |
|
86.9 |
% |
|
|
84.9 |
% |
|
86.8 |
% |
|
Occupancy percentage - operating beds |
|
|
86.8 |
% |
|
89.6 |
% |
|
|
87.6 |
% |
|
89.5 |
% |
|
Skilled mix |
|
|
21.8 |
% |
|
22.1 |
% |
|
|
22.3 |
% |
|
22.2 |
% |
|
Average daily census |
|
|
47,674 |
|
|
40,390 |
|
|
|
46,559 |
|
|
40,373 |
|
|
|
|
|
|
|
|
|
|
|
|
|
|
|
|
|
|
Revenue per patient day (skilled nursing facilities) |
|
|
|
|
|
|
|
|
|
|
|
|
|
|
|
Medicare Part A |
|
$ |
503 |
|
$ |
493 |
|
|
$ |
502 |
|
$ |
492 |
|
|
Medicare total (including Part B) |
|
|
543 |
|
|
531 |
|
|
|
538 |
|
|
530 |
|
|
Insurance |
|
|
454 |
|
|
448 |
|
|
|
446 |
|
|
447 |
|
|
Private and other |
|
|
310 |
|
|
319 |
|
|
|
312 |
|
|
320 |
|
|
Medicaid |
|
|
217 |
|
|
213 |
|
|
|
216 |
|
|
213 |
|
|
Medicaid (net of provider taxes) |
|
|
195 |
|
|
193 |
|
|
|
195 |
|
|
193 |
|
|
Weighted average (net of provider taxes) |
|
$ |
272 |
|
$ |
271 |
|
|
$ |
273 |
|
$ |
271 |
|
|
|
|
|
|
|
|
|
|
|
|
|
|
|
|
|
|
Patient days by payor (skilled nursing facilities) |
|
|
|
|
|
|
|
|
|
|
|
|
|
|
|
Medicare |
|
|
573,295 |
|
|
537,626 |
|
|
|
1,153,193 |
|
|
1,067,923 |
|
|
Insurance |
|
|
307,163 |
|
|
224,319 |
|
|
|
594,922 |
|
|
448,606 |
|
|
Total skilled mix days |
|
|
880,458 |
|
|
761,945 |
|
|
|
1,748,115 |
|
|
1,516,529 |
|
|
Private and other |
|
|
277,038 |
|
|
239,345 |
|
|
|
563,624 |
|
|
480,968 |
|
|
Medicaid |
|
|
2,866,194 |
|
|
2,434,581 |
|
|
|
5,512,696 |
|
|
4,834,342 |
|
|
Total Days |
|
|
4,023,690 |
|
|
3,435,871 |
|
|
|
7,824,435 |
|
|
6,831,839 |
|
|
|
|
|
|
|
|
|
|
|
|
|
|
|
|
|
|
Patient days as a percentage of total patient days (skilled nursing facilities) |
|
|
|
|
|
|
|
|
|
|
|
|
|
|
|
Medicare |
|
|
14.2 |
% |
|
15.6 |
% |
|
|
14.7 |
% |
|
15.6 |
% |
|
Insurance |
|
|
7.6 |
% |
|
6.5 |
% |
|
|
7.6 |
% |
|
6.6 |
% |
|
Skilled mix |
|
|
21.8 |
% |
|
22.1 |
% |
|
|
22.3 |
% |
|
22.2 |
% |
|
Private and other |
|
|
6.9 |
% |
|
7.0 |
% |
|
|
7.2 |
% |
|
7.0 |
% |
|
Medicaid |
|
|
71.3 |
% |
|
70.9 |
% |
|
|
70.5 |
% |
|
70.8 |
% |
|
Total |
|
|
100.0 |
% |
|
100.0 |
% |
|
|
100.0 |
% |
|
100.0 |
% |
|
|
|
|
|
|
|
|
|
|
|
|
|
|
|
|
|
Facilities at end of period |
|
|
|
|
|
|
|
|
|
|
|
|
|
|
|
Skilled nursing facilities |
|
|
|
|
|
|
|
|
|
|
|
|
|
|
|
Leased |
|
|
384 |
|
|
356 |
|
|
|
384 |
|
|
356 |
|
|
Owned |
|
|
33 |
|
|
2 |
|
|
|
33 |
|
|
2 |
|
|
Joint Venture |
|
|
5 |
|
|
5 |
|
|
|
5 |
|
|
5 |
|
|
Managed * |
|
|
36 |
|
|
14 |
|
|
|
36 |
|
|
14 |
|
|
Total skilled nursing facilities |
|
|
458 |
|
|
377 |
|
|
|
458 |
|
|
377 |
|
|
Total licensed beds |
|
|
55,605 |
|
|
45,964 |
|
|
|
55,605 |
|
|
45,964 |
|
|
|
|
|
|
|
|
|
|
|
|
|
|
|
|
|
|
Assisted living facilities: |
|
|
|
|
|
|
|
|
|
|
|
|
|
|
|
Leased |
|
|
29 |
|
|
27 |
|
|
|
29 |
|
|
27 |
|
|
Owned |
|
|
22 |
|
|
1 |
|
|
|
22 |
|
|
1 |
|
|
Joint Venture |
|
|
1 |
|
|
1 |
|
|
|
1 |
|
|
1 |
|
|
Managed |
|
|
4 |
|
|
4 |
|
|
|
4 |
|
|
4 |
|
|
Total assisted living facilities |
|
|
56 |
|
|
33 |
|
|
|
56 |
|
|
33 |
|
|
Total licensed beds |
|
|
3,962 |
|
|
2,731 |
|
|
|
3,962 |
|
|
2,731 |
|
|
Total facilities |
|
|
514 |
|
|
410 |
|
|
|
514 |
|
|
410 |
|
|
|
|
|
|
|
|
|
|
|
|
|
|
|
|
|
|
Total Jointly Owned and Managed— (Unconsolidated) |
|
|
19 |
|
|
17 |
|
|
|
19 |
|
|
17 |
|
37
REHABILITATION THERAPY SEGMENT:
|
|
|
Three months ended June 30, |
|
|
Six months ended June 30, |
|
||||||||
|
|
|
2015 |
|
2014 |
|
|
2015 |
|
2014 |
|
||||
|
|
|
|
|
|
|
|
|
|
|
|
|
|
|
|
|
Revenue mix %: |
|
|
|
|
|
|
|
|
|
|
|
|
|
|
|
Company-operated |
|
|
39 |
% |
|
37 |
% |
|
|
39 |
% |
|
37 |
% |
|
Non-affiliated |
|
|
61 |
% |
|
63 |
% |
|
|
61 |
% |
|
63 |
% |
|
Sites of service (at end of period) |
|
|
1,499 |
|
|
1,367 |
|
|
|
1,499 |
|
|
1,367 |
|
|
Revenue per site |
|
$ |
171,570 |
|
$ |
176,104 |
|
|
$ |
336,478 |
|
$ |
352,856 |
|
|
Therapist efficiency % |
|
|
70 |
% |
|
69 |
% |
|
|
70 |
% |
|
70 |
% |
* Includes 20 facilities located in Texas for which the real estate is owned by Genesis.
Reasons for Non-GAAP Financial Disclosure
The following discussion includes references to EBITDAR, Adjusted EBITDAR, EBITDA and Adjusted EBITDA, which are non-GAAP financial measures. For purposes of SEC Regulation G, a non-GAAP financial measure is a numerical measure of a registrant’s historical or future financial performance, financial position and cash flows that excludes amounts, or is subject to adjustments that have the effect of excluding amounts, that are included in the most directly comparable financial measure calculated and presented in accordance with GAAP in the statement of operations, balance sheet or statement of cash flows (or equivalent statements) of the registrant; or includes amounts, or is subject to adjustments that have the effect of including amounts, that are excluded from the most directly comparable financial measure so calculated and presented. In this regard, GAAP refers to generally accepted accounting principles in the United States. Pursuant to the requirements of Regulation G, we have provided reconciliations of the non-GAAP financial measures to the most directly comparable GAAP financial measures.
We believe the presentation of EBITDAR, Adjusted EBITDAR, EBITDA and Adjusted EBITDA provides useful information to investors regarding our results of operations because these financial measures are useful for trending, analyzing and benchmarking the performance and value of our business. By excluding certain expenses and other items that may not be indicative of our core business operating results, these non-GAAP financial measures:
|
· |
allow investors to evaluate our performance from management’s perspective, resulting in greater transparency with respect to supplemental information used by us in our financial and operational decision making; |
|
· |
facilitate comparisons with prior periods and reflect the principal basis on which management monitors financial performance; |
|
· |
facilitate comparisons with the performance of others in the post-acute industry; |
|
· |
provide better transparency as to the relationship each reporting period between our cash basis lease expense and the level of operating earnings available to fund lease expense; and |
|
· |
allow investors to view our financial performance and condition in the same manner its significant landlords and lenders require us to report financial information to them in connection with determining our compliance with financial covenants. |
We use EBITDAR, Adjusted EBITDAR, EBITDA and Adjusted EBITDA primarily as performance measures and believe that the GAAP financial measure most directly comparable to them is net income (loss). We use EBITDAR, Adjusted EBITDAR, EBITDA and Adjusted EBITDA as measures to assess the relative performance of our operating businesses, as well as the employees responsible for operating such businesses. EBITDAR, Adjusted EBITDAR,
38
EBITDA and Adjusted EBITDA are useful in this regard because they do not include such costs as interest expense, income taxes and depreciation and amortization expense which may vary from business unit to business unit depending upon such factors as the method used to finance the original purchase of the business unit or the tax law in the state in which a business unit operates. By excluding such factors when measuring financial performance, many of which are outside of the control of the employees responsible for operating our business units, we are better able to evaluate the operating performance of the business unit and the employees responsible for business unit performance. Consequently, we use these non-GAAP measures to determine the extent to which our employees have met performance goals, and therefore may or may not be eligible for incentive compensation awards.
We also use EBITDAR, Adjusted EBITDAR, EBITDA and Adjusted EBITDA in our annual budget process. We believe these non-GAAP measures facilitate internal comparisons to historical operating performance of prior periods and external comparisons to competitors’ historical operating performance. The presentation of these non-GAAP financial measures is consistent with our past practice and we believe these measures further enable investors and analysts to compare current non-GAAP measures with non-GAAP measures presented in prior periods.
Although we use EBITDAR, Adjusted EBITDAR, EBITDA and Adjusted EBITDA as financial measures to assess the performance of our business, the use of these non-GAAP measures is limited because they do not consider certain material costs necessary to operate the business. These costs include our lease expense (only in the case of EBITDAR and Adjusted EBITDAR), the cost to service debt, the depreciation and amortization associated with our long-lived assets, losses (gains) on extinguishment of debt, transaction costs, long-lived asset impairment charges, federal and state income tax expenses, the operating results of our discontinued businesses and the income or loss attributed to non-controlling interests. Because EBITDAR, Adjusted EBITDAR, EBITDA and Adjusted EBITDA do not consider these important elements of our cost structure, a user of our financial information who relies on EBITDAR, Adjusted EBITDAR, EBITDA or Adjusted EBITDA as the only measures of our performance could draw an incomplete or misleading conclusion regarding our financial performance. Consequently, a user of our financial information should consider net income (loss) as an important measure of its financial performance because it provides the most complete measure of our performance.
Other companies may define EBITDAR, Adjusted EBITDAR, EBITDA and Adjusted EBITDA differently and, as a result, our non-GAAP measures may not be directly comparable to those of other companies. EBITDAR, Adjusted EBITDAR, EBITDA and Adjusted EBITDA do not represent net income (loss), as defined by GAAP. EBITDAR, Adjusted EBITDAR, EBITDA and Adjusted EBITDA should be considered in addition to, not a substitute for, or superior to, GAAP financial measures.
The following tables provide reconciliations to EBITDAR, Adjusted EBITDAR, EBITDA and Adjusted EBITDA from net income (loss) the most directly comparable financial measure presented in accordance with GAAP:
39
GENESIS HEALTHCARE, INC.
RECONCILIATION OF NET (LOSS) INCOME TO EBITDA, EBITDAR, ADJUSTED EBITDA AND ADJUSTED EBITDAR
(UNAUDITED)
(IN THOUSANDS, EXCEPT PER SHARE DATA)
|
|
|
As reported |
|
Adjustments |
|
|
|
|
As adjusted |
|
|||||||||
|
|
|
|
|
|
|
|
|
Newly acquired |
|
|
|
|
|
|
|
|
|
|
|
|
|
|
|
|
|
|
|
|
or constructed |
|
|
|
|
|
|
|
|
|
|
|
|
|
|
Three months |
|
Conversion to |
|
businesses with |
|
|
|
|
|
|
|
Three months |
|
||||
|
|
|
ended June 30, |
|
cash basis |
|
start-up losses |
|
Other |
|
Total |
|
ended June 30, |
|
||||||
|
|
|
2015 |
|
leases (a) |
|
(b) |
|
adjustments (c) |
|
adjustments |
|
2015 |
|
||||||
|
|
|
|
|
|
|
|
|
|
|
|
|
|
|
|
|
|
|
|
|
|
Net revenues |
|
$ |
1,419,475 |
|
$ |
— |
|
$ |
(8,982) |
|
$ |
(232) |
|
$ |
(9,214) |
|
$ |
1,410,261 |
|
|
Salaries, wages and benefits |
|
|
820,926 |
|
|
— |
|
|
(5,447) |
|
|
— |
|
|
(5,447) |
|
|
815,479 |
|
|
Other operating expenses |
|
|
348,236 |
|
|
— |
|
|
(4,183) |
|
|
(11,220) |
|
|
(15,403) |
|
|
332,833 |
|
|
General and administrative costs |
|
|
44,983 |
|
|
— |
|
|
— |
|
|
(2,079) |
|
|
(2,079) |
|
|
42,904 |
|
|
Provision for losses on accounts receivable |
|
|
22,113 |
|
|
— |
|
|
(251) |
|
|
— |
|
|
(251) |
|
|
21,862 |
|
|
Lease expense |
|
|
38,959 |
|
|
84,437 |
|
|
(1,979) |
|
|
— |
|
|
82,458 |
|
|
121,417 |
|
|
Depreciation and amortization expense |
|
|
53,605 |
|
|
(34,197) |
|
|
(199) |
|
|
— |
|
|
(34,396) |
|
|
19,209 |
|
|
Interest expense |
|
|
126,385 |
|
|
(103,980) |
|
|
(8) |
|
|
— |
|
|
(103,988) |
|
|
22,397 |
|
|
Other income |
|
|
50 |
|
|
— |
|
|
— |
|
|
(50) |
|
|
(50) |
|
|
— |
|
|
Investment income |
|
|
(431) |
|
|
— |
|
|
— |
|
|
— |
|
|
— |
|
|
(431) |
|
|
Transaction costs |
|
|
2,642 |
|
|
— |
|
|
— |
|
|
(2,642) |
|
|
(2,642) |
|
|
— |
|
|
Equity in net income of unconsolidated affiliates |
|
|
(360) |
|
|
— |
|
|
— |
|
|
— |
|
|
— |
|
|
(360) |
|
|
(Loss) income before income tax benefit |
|
$ |
(37,633) |
|
$ |
53,740 |
|
$ |
3,085 |
|
$ |
15,759 |
|
$ |
72,584 |
|
$ |
34,951 |
|
|
Income tax (benefit) expense |
|
|
(4,419) |
|
|
12,474 |
|
|
716 |
|
|
3,658 |
|
|
16,848 |
|
|
12,429 |
|
|
(Loss) income from continuing operations |
|
$ |
(33,214) |
|
$ |
41,266 |
|
$ |
2,369 |
|
$ |
12,101 |
|
$ |
55,736 |
|
$ |
22,522 |
|
|
Loss from discontinued operations, net of taxes |
|
|
1,722 |
|
|
460 |
|
|
— |
|
|
— |
|
|
460 |
|
|
2,182 |
|
|
Net (loss) income attributable to noncontrolling interests |
|
|
(15,750) |
|
|
15,036 |
|
|
863 |
|
|
4,409 |
|
|
20,308 |
|
|
4,558 |
|
|
Net (loss) income attributable to Genesis Healthcare, Inc. |
|
$ |
(19,186) |
|
$ |
25,770 |
|
$ |
1,506 |
|
$ |
7,692 |
|
$ |
34,968 |
|
$ |
15,782 |
|
|
Depreciation and amortization expense |
|
|
53,605 |
|
|
(34,197) |
|
|
(199) |
|
|
— |
|
|
(34,396) |
|
|
19,209 |
|
|
Interest expense |
|
|
126,385 |
|
|
(103,980) |
|
|
(8) |
|
|
— |
|
|
(103,988) |
|
|
22,397 |
|
|
Other income |
|
|
50 |
|
|
— |
|
|
— |
|
|
(50) |
|
|
(50) |
|
|
— |
|
|
Transaction costs |
|
|
2,642 |
|
|
— |
|
|
— |
|
|
(2,642) |
|
|
(2,642) |
|
|
— |
|
|
Income tax (benefit) expense |
|
|
(4,419) |
|
|
12,474 |
|
|
716 |
|
|
3,658 |
|
|
16,848 |
|
|
12,429 |
|
|
Loss from discontinued operations, net of taxes |
|
|
1,722 |
|
|
460 |
|
|
— |
|
|
— |
|
|
460 |
|
|
2,182 |
|
|
Net (loss) income attributable to noncontrolling interests |
|
|
(15,750) |
|
|
15,036 |
|
|
863 |
|
|
4,409 |
|
|
20,308 |
|
|
4,558 |
|
|
EBITDA / Adjusted EBITDA |
|
$ |
145,049 |
|
$ |
(84,437) |
|
$ |
2,878 |
|
$ |
13,067 |
|
$ |
(68,492) |
|
$ |
76,557 |
|
|
Lease expense |
|
|
38,959 |
|
|
84,437 |
|
|
(1,979) |
|
|
— |
|
|
82,458 |
|
|
121,417 |
|
|
EBITDAR / Adjusted EBITDAR |
|
$ |
184,008 |
|
$ |
— |
|
$ |
899 |
|
$ |
13,067 |
|
$ |
13,966 |
|
$ |
197,974 |
|
|
|
|
|
|
|
|
|
|
|
|
|
|
|
|
|
|
|
|
|
|
|
(Loss) income per common share: |
|
|
|
|
|
|
|
|
|
|
|
|
|
|
|
|
|
|
|
|
Diluted: |
|
|
|
|
|
|
|
|
|
|
|
|
|
|
|
|
|
|
|
|
Weighted average shares outstanding for diluted (loss) income from continuing operations per share (d) |
|
|
89,211 |
|
|
|
|
|
|
|
|
|
|
|
|
|
|
153,671 |
|
|
Diluted net (loss) income from continuing operations per share (e) |
|
$ |
(0.20) |
|
|
|
|
|
|
|
|
|
|
|
|
|
$ |
0.14 |
|
40
GENESIS HEALTHCARE, INC.
RECONCILIATION OF NET (LOSS) INCOME TO EBITDA, EBITDAR, ADJUSTED EBITDA AND ADJUSTED EBITDAR
(UNAUDITED)
(IN THOUSANDS, EXCEPT PER SHARE DATA)
|
|
|
As reported |
|
Adjustments |
|
|
|
|
As adjusted |
|
|||||||||
|
|
|
|
|
|
|
|
|
Newly acquired |
|
|
|
|
|
|
|
|
|
|
|
|
|
|
|
|
|
|
|
|
or constructed |
|
|
|
|
|
|
|
|
|
|
|
|
|
|
Three months |
|
Conversion to |
|
businesses with |
|
|
|
|
|
|
|
|
|
|
|||
|
|
|
ended June 30, |
|
cash basis |
|
start-up losses |
|
Other |
|
Total |
|
Three months ended |
|
||||||
|
|
|
2014 |
|
leases (a) |
|
(b) |
|
adjustments (c) |
|
adjustments |
|
June 30, 2014 |
|
||||||
|
|
|
|
|
|
|
|
|
|
|
|
|
|
|
|
|
|
|
|
|
|
Net revenues |
|
$ |
1,200,651 |
|
$ |
— |
|
$ |
(4,294) |
|
$ |
— |
|
$ |
(4,294) |
|
$ |
1,196,357 |
|
|
Salaries, wages and benefits |
|
|
717,215 |
|
|
— |
|
|
(3,302) |
|
|
94 |
|
|
(3,208) |
|
|
714,007 |
|
|
Other operating expenses |
|
|
269,603 |
|
|
— |
|
|
(1,800) |
|
|
(714) |
|
|
(2,514) |
|
|
267,089 |
|
|
General and administrative costs |
|
|
35,980 |
|
|
— |
|
|
— |
|
|
— |
|
|
— |
|
|
35,980 |
|
|
Provision for losses on accounts receivable |
|
|
17,080 |
|
|
— |
|
|
— |
|
|
— |
|
|
— |
|
|
17,080 |
|
|
Lease expense |
|
|
32,909 |
|
|
80,317 |
|
|
(650) |
|
|
— |
|
|
79,667 |
|
|
112,576 |
|
|
Depreciation and amortization expense |
|
|
48,930 |
|
|
(33,525) |
|
|
(22) |
|
|
— |
|
|
(33,547) |
|
|
15,383 |
|
|
Interest expense |
|
|
109,900 |
|
|
(97,660) |
|
|
— |
|
|
— |
|
|
(97,660) |
|
|
12,240 |
|
|
Loss on extinguishment of debt |
|
|
181 |
|
|
— |
|
|
— |
|
|
(181) |
|
|
(181) |
|
|
— |
|
|
Other income |
|
|
(667) |
|
|
— |
|
|
— |
|
|
667 |
|
|
667 |
|
|
— |
|
|
Investment income |
|
|
(436) |
|
|
— |
|
|
— |
|
|
— |
|
|
— |
|
|
(436) |
|
|
Transaction costs |
|
|
1,298 |
|
|
— |
|
|
— |
|
|
(1,298) |
|
|
(1,298) |
|
|
— |
|
|
Equity in net income of unconsolidated affiliates |
|
|
(390) |
|
|
— |
|
|
— |
|
|
— |
|
|
— |
|
|
(390) |
|
|
(Loss) income before income tax benefit |
|
$ |
(30,952) |
|
$ |
50,868 |
|
$ |
1,480 |
|
$ |
1,432 |
|
$ |
53,780 |
|
$ |
22,828 |
|
|
Income tax (benefit) expense |
|
|
(96) |
|
|
3,215 |
|
|
94 |
|
|
91 |
|
|
3,400 |
|
|
3,304 |
|
|
(Loss) income from continuing operations |
|
$ |
(30,856) |
|
$ |
47,653 |
|
$ |
1,386 |
|
$ |
1,341 |
|
$ |
50,380 |
|
$ |
19,524 |
|
|
Loss from discontinued operations, net of taxes |
|
|
1,176 |
|
|
(437) |
|
|
— |
|
|
— |
|
|
(437) |
|
|
739 |
|
|
Net loss attributable to noncontrolling interests |
|
|
224 |
|
|
— |
|
|
— |
|
|
— |
|
|
— |
|
|
224 |
|
|
Net (loss) income attributable to Genesis Healthcare, Inc. |
|
$ |
(32,256) |
|
$ |
48,090 |
|
$ |
1,386 |
|
$ |
1,341 |
|
$ |
50,817 |
|
$ |
18,561 |
|
|
Depreciation and amortization expense |
|
|
48,930 |
|
|
(33,525) |
|
|
(22) |
|
|
— |
|
|
(33,547) |
|
|
15,383 |
|
|
Interest expense |
|
|
109,900 |
|
|
(97,660) |
|
|
— |
|
|
— |
|
|
(97,660) |
|
|
12,240 |
|
|
Loss on extinguishment of debt |
|
|
181 |
|
|
— |
|
|
— |
|
|
(181) |
|
|
(181) |
|
|
— |
|
|
Other income |
|
|
(667) |
|
|
— |
|
|
— |
|
|
667 |
|
|
667 |
|
|
— |
|
|
Transaction costs |
|
|
1,298 |
|
|
— |
|
|
— |
|
|
(1,298) |
|
|
(1,298) |
|
|
— |
|
|
Income tax (benefit) expense |
|
|
(96) |
|
|
3,215 |
|
|
94 |
|
|
91 |
|
|
3,400 |
|
|
3,304 |
|
|
Loss from discontinued operations, net of taxes |
|
|
1,176 |
|
|
(437) |
|
|
— |
|
|
— |
|
|
(437) |
|
|
739 |
|
|
Net income attributable to noncontrolling interests |
|
|
224 |
|
|
— |
|
|
— |
|
|
— |
|
|
— |
|
|
224 |
|
|
EBITDA / Adjusted EBITDA |
|
$ |
128,690 |
|
$ |
(80,317) |
|
$ |
1,458 |
|
$ |
620 |
|
$ |
(78,239) |
|
$ |
50,451 |
|
|
Lease expense |
|
|
32,909 |
|
|
80,317 |
|
|
(650) |
|
|
— |
|
|
79,667 |
|
|
112,576 |
|
|
EBITDAR / Adjusted EBITDAR |
|
$ |
161,599 |
|
$ |
— |
|
$ |
808 |
|
$ |
620 |
|
$ |
1,428 |
|
$ |
163,027 |
|
|
|
|
|
|
|
|
|
|
|
|
|
|
|
|
|
|
|
|
|
|
|
(Loss) income per common share: |
|
|
|
|
|
|
|
|
|
|
|
|
|
|
|
|
|
|
|
|
Diluted: |
|
|
|
|
|
|
|
|
|
|
|
|
|
|
|
|
|
|
|
|
Weighted average shares outstanding for diluted (loss) income from continuing operations per share (d) |
|
|
49,865 |
|
|
|
|
|
|
|
|
|
|
|
|
|
|
|
|
|
Diluted net (loss) income from continuing operations per share (e) |
|
$ |
(0.63) |
|
|
|
|
|
|
|
|
|
|
|
|
|
|
Not calculated |
|
41
GENESIS HEALTHCARE, INC.
RECONCILIATION OF NET (LOSS) INCOME TO EBITDA, EBITDAR, ADJUSTED EBITDA AND ADJUSTED EBITDAR
(UNAUDITED)
(IN THOUSANDS, EXCEPT PER SHARE DATA)
|
|
|
As reported |
|
Adjustments |
|
|
|
|
As adjusted |
|
|||||||||
|
|
|
|
|
|
|
|
|
Newly acquired |
|
|
|
|
|
|
|
|
|
|
|
|
|
|
|
|
|
|
|
|
or constructed |
|
|
|
|
|
|
|
|
|
|
|
|
|
|
Six months |
|
Conversion to |
|
businesses with |
|
|
|
|
|
|
|
Six months |
|
||||
|
|
|
ended June 30, |
|
cash basis |
|
start-up losses |
|
Other |
|
Total |
|
ended June 30, |
|
||||||
|
|
|
2015 |
|
leases (a) |
|
(b) |
|
adjustments (c) |
|
adjustments |
|
2015 |
|
||||||
|
|
|
|
|
|
|
|
|
|
|
|
|
|
|
|
|
|
|
|
|
|
Net revenues |
|
$ |
2,762,476 |
|
$ |
— |
|
$ |
(21,365) |
|
$ |
388 |
|
$ |
(20,977) |
|
$ |
2,741,499 |
|
|
Salaries, wages and benefits |
|
|
1,611,659 |
|
|
— |
|
|
(12,513) |
|
|
— |
|
|
(12,513) |
|
|
1,599,146 |
|
|
Other operating expenses |
|
|
660,797 |
|
|
— |
|
|
(9,653) |
|
|
(11,220) |
|
|
(20,873) |
|
|
639,924 |
|
|
General and administrative costs |
|
|
86,516 |
|
|
— |
|
|
— |
|
|
(3,762) |
|
|
(3,762) |
|
|
82,754 |
|
|
Provision for losses on accounts receivable |
|
|
45,509 |
|
|
— |
|
|
(251) |
|
|
— |
|
|
(251) |
|
|
45,258 |
|
|
Lease expense |
|
|
75,378 |
|
|
168,345 |
|
|
(4,928) |
|
|
— |
|
|
163,417 |
|
|
238,795 |
|
|
Depreciation and amortization expense |
|
|
113,538 |
|
|
(67,789) |
|
|
(1,443) |
|
|
— |
|
|
(69,232) |
|
|
44,306 |
|
|
Interest expense |
|
|
247,698 |
|
|
(206,314) |
|
|
(40) |
|
|
— |
|
|
(206,354) |
|
|
41,344 |
|
|
Loss on extinguishment of debt |
|
|
3,234 |
|
|
— |
|
|
— |
|
|
(3,234) |
|
|
(3,234) |
|
|
— |
|
|
Other income |
|
|
(7,560) |
|
|
— |
|
|
— |
|
|
7,560 |
|
|
7,560 |
|
|
— |
|
|
Investment income |
|
|
(847) |
|
|
— |
|
|
— |
|
|
— |
|
|
— |
|
|
(847) |
|
|
Transaction costs |
|
|
88,710 |
|
|
— |
|
|
— |
|
|
(88,710) |
|
|
(88,710) |
|
|
— |
|
|
Equity in net income of unconsolidated affiliates |
|
|
(513) |
|
|
— |
|
|
— |
|
|
— |
|
|
— |
|
|
(513) |
|
|
(Loss) income before income tax benefit |
|
$ |
(161,643) |
|
$ |
105,758 |
|
$ |
7,463 |
|
$ |
99,754 |
|
$ |
212,975 |
|
$ |
51,332 |
|
|
Income tax (benefit) expense |
|
|
(10,067) |
|
|
24,548 |
|
|
1,732 |
|
|
23,155 |
|
|
49,435 |
|
|
39,368 |
|
|
(Loss) income from continuing operations |
|
$ |
(151,576) |
|
$ |
81,210 |
|
$ |
5,731 |
|
$ |
76,599 |
|
$ |
163,540 |
|
$ |
11,964 |
|
|
Loss from discontinued operations, net of taxes |
|
|
1,610 |
|
|
920 |
|
|
— |
|
|
— |
|
|
920 |
|
|
2,530 |
|
|
Net (loss) income attributable to noncontrolling interests |
|
|
(21,434) |
|
|
29,591 |
|
|
2,088 |
|
|
27,911 |
|
|
59,590 |
|
|
38,156 |
|
|
Net (loss) income attributable to Genesis Healthcare, Inc. |
|
$ |
(131,752) |
|
$ |
50,699 |
|
$ |
3,643 |
|
$ |
48,688 |
|
$ |
103,030 |
|
$ |
(28,722) |
|
|
Depreciation and amortization expense |
|
|
113,538 |
|
|
(67,789) |
|
|
(1,443) |
|
|
— |
|
|
(69,232) |
|
|
44,306 |
|
|
Interest expense |
|
|
247,698 |
|
|
(206,314) |
|
|
(40) |
|
|
— |
|
|
(206,354) |
|
|
41,344 |
|
|
Loss on extinguishment of debt |
|
|
3,234 |
|
|
— |
|
|
— |
|
|
(3,234) |
|
|
(3,234) |
|
|
— |
|
|
Other income |
|
|
(7,560) |
|
|
— |
|
|
— |
|
|
7,560 |
|
|
7,560 |
|
|
— |
|
|
Transaction costs |
|
|
88,710 |
|
|
— |
|
|
— |
|
|
(88,710) |
|
|
(88,710) |
|
|
— |
|
|
Income tax (benefit) expense |
|
|
(10,067) |
|
|
24,548 |
|
|
1,732 |
|
|
23,155 |
|
|
49,435 |
|
|
39,368 |
|
|
Loss from discontinued operations, net of taxes |
|
|
1,610 |
|
|
920 |
|
|
— |
|
|
— |
|
|
920 |
|
|
2,530 |
|
|
Net (loss) income attributable to noncontrolling interests |
|
|
(21,434) |
|
|
29,591 |
|
|
2,088 |
|
|
27,911 |
|
|
59,590 |
|
|
38,156 |
|
|
EBITDA / Adjusted EBITDA |
|
$ |
283,977 |
|
$ |
(168,345) |
|
$ |
5,980 |
|
$ |
15,370 |
|
$ |
(146,995) |
|
$ |
136,982 |
|
|
Lease expense |
|
|
75,378 |
|
|
168,345 |
|
|
(4,928) |
|
|
— |
|
|
163,417 |
|
|
238,795 |
|
|
EBITDAR / Adjusted EBITDAR |
|
$ |
359,355 |
|
$ |
— |
|
$ |
1,052 |
|
$ |
15,370 |
|
$ |
16,422 |
|
$ |
375,777 |
|
|
|
|
|
|
|
|
|
|
|
|
|
|
|
|
|
|
|
|
|
|
|
(Loss) income per common share: |
|
|
|
|
|
|
|
|
|
|
|
|
|
|
|
|
|
|
|
|
Diluted: |
|
|
|
|
|
|
|
|
|
|
|
|
|
|
|
|
|
|
|
|
Weighted average shares outstanding for diluted (loss) income from continuing operations per share (d) |
|
|
82,279 |
|
|
|
|
|
|
|
|
|
|
|
|
|
|
153,671 |
|
|
Diluted net (loss) income from continuing operations per share (e) |
|
$ |
(1.58) |
|
|
|
|
|
|
|
|
|
|
|
|
|
$ |
0.21 |
|
42
GENESIS HEALTHCARE, INC.
RECONCILIATION OF NET (LOSS) INCOME TO EBITDA, EBITDAR, ADJUSTED EBITDA AND ADJUSTED EBITDAR
(UNAUDITED)
(IN THOUSANDS, EXCEPT PER SHARE DATA)
|
|
|
As reported |
|
Adjustments |
|
|
|
|
As adjusted |
|
|||||||||
|
|
|
|
|
|
|
|
|
Newly acquired |
|
|
|
|
|
|
|
|
|
|
|
|
|
|
|
|
|
|
|
|
or constructed |
|
|
|
|
|
|
|
|
|
|
|
|
|
|
Six months |
|
Conversion to |
|
businesses with |
|
|
|
|
|
|
|
|
|
|
|||
|
|
|
ended June 30, |
|
cash basis |
|
start-up losses |
|
Other |
|
Total |
|
Six months ended |
|
||||||
|
|
|
2014 |
|
leases (a) |
|
(b) |
|
adjustments (c) |
|
adjustments |
|
June 30, 2014 |
|
||||||
|
|
|
|
|
|
|
|
|
|
|
|
|
|
|
|
|
|
|
|
|
|
Net revenues |
|
$ |
2,387,195 |
|
$ |
— |
|
$ |
(7,178) |
|
$ |
1,166 |
|
$ |
(6,012) |
|
$ |
2,381,183 |
|
|
Salaries, wages and benefits |
|
|
1,438,477 |
|
|
— |
|
|
(5,044) |
|
|
(1,706) |
|
|
(6,750) |
|
|
1,431,727 |
|
|
Other operating expenses |
|
|
533,149 |
|
|
— |
|
|
(3,052) |
|
|
(833) |
|
|
(3,885) |
|
|
529,264 |
|
|
General and administrative costs |
|
|
71,844 |
|
|
— |
|
|
— |
|
|
— |
|
|
— |
|
|
71,844 |
|
|
Provision for losses on accounts receivable |
|
|
35,596 |
|
|
— |
|
|
— |
|
|
— |
|
|
— |
|
|
35,596 |
|
|
Lease expense |
|
|
65,708 |
|
|
157,880 |
|
|
(1,085) |
|
|
— |
|
|
156,795 |
|
|
222,503 |
|
|
Depreciation and amortization expense |
|
|
96,430 |
|
|
(65,393) |
|
|
(73) |
|
|
— |
|
|
(65,466) |
|
|
30,964 |
|
|
Interest expense |
|
|
218,650 |
|
|
(193,068) |
|
|
— |
|
|
— |
|
|
(193,068) |
|
|
25,582 |
|
|
Loss on extinguishment of debt |
|
|
680 |
|
|
— |
|
|
— |
|
|
(680) |
|
|
(680) |
|
|
— |
|
|
Other income |
|
|
(667) |
|
|
— |
|
|
— |
|
|
667 |
|
|
667 |
|
|
— |
|
|
Investment income |
|
|
(1,379) |
|
|
— |
|
|
— |
|
|
— |
|
|
— |
|
|
(1,379) |
|
|
Transaction costs |
|
|
3,547 |
|
|
— |
|
|
— |
|
|
(3,547) |
|
|
(3,547) |
|
|
— |
|
|
Equity in net income of unconsolidated affiliates |
|
|
(346) |
|
|
— |
|
|
— |
|
|
— |
|
|
— |
|
|
(346) |
|
|
(Loss) income before income tax benefit |
|
$ |
(74,494) |
|
$ |
100,581 |
|
$ |
2,076 |
|
$ |
7,265 |
|
$ |
109,922 |
|
$ |
35,428 |
|
|
Income tax (benefit) expense |
|
|
(2,850) |
|
|
6,357 |
|
|
132 |
|
|
460 |
|
|
6,949 |
|
|
4,099 |
|
|
(Loss) income from continuing operations |
|
$ |
(71,644) |
|
$ |
94,224 |
|
$ |
1,944 |
|
$ |
6,805 |
|
$ |
102,973 |
|
$ |
31,329 |
|
|
Loss from discontinued operations, net of taxes |
|
|
4,370 |
|
|
(1,964) |
|
|
— |
|
|
— |
|
|
(1,964) |
|
|
2,406 |
|
|
Net loss attributable to noncontrolling interests |
|
|
409 |
|
|
— |
|
|
— |
|
|
— |
|
|
— |
|
|
409 |
|
|
Net (loss) income attributable to Genesis Healthcare, Inc. |
|
$ |
(76,423) |
|
$ |
96,188 |
|
$ |
1,944 |
|
$ |
6,805 |
|
$ |
104,937 |
|
$ |
28,514 |
|
|
Depreciation and amortization expense |
|
|
96,430 |
|
|
(65,393) |
|
|
(73) |
|
|
— |
|
|
(65,466) |
|
|
30,964 |
|
|
Interest expense |
|
|
218,650 |
|
|
(193,068) |
|
|
— |
|
|
— |
|
|
(193,068) |
|
|
25,582 |
|
|
Loss on extinguishment of debt |
|
|
680 |
|
|
— |
|
|
— |
|
|
(680) |
|
|
(680) |
|
|
— |
|
|
Other income |
|
|
(667) |
|
|
— |
|
|
— |
|
|
667 |
|
|
667 |
|
|
— |
|
|
Transaction costs |
|
|
3,547 |
|
|
— |
|
|
— |
|
|
(3,547) |
|
|
(3,547) |
|
|
— |
|
|
Income tax (benefit) expense |
|
|
(2,850) |
|
|
6,357 |
|
|
132 |
|
|
460 |
|
|
6,949 |
|
|
4,099 |
|
|
Loss from discontinued operations, net of taxes |
|
|
4,370 |
|
|
(1,964) |
|
|
— |
|
|
— |
|
|
(1,964) |
|
|
2,406 |
|
|
Net income attributable to noncontrolling interests |
|
|
409 |
|
|
— |
|
|
— |
|
|
— |
|
|
— |
|
|
409 |
|
|
EBITDA / Adjusted EBITDA |
|
$ |
244,146 |
|
$ |
(157,880) |
|
$ |
2,003 |
|
$ |
3,705 |
|
$ |
(152,172) |
|
$ |
91,974 |
|
|
Lease expense |
|
|
65,708 |
|
|
157,880 |
|
|
(1,085) |
|
|
— |
|
|
156,795 |
|
|
222,503 |
|
|
EBITDAR / Adjusted EBITDAR |
|
$ |
309,854 |
|
$ |
— |
|
$ |
918 |
|
$ |
3,705 |
|
$ |
4,623 |
|
$ |
314,477 |
|
|
|
|
|
|
|
|
|
|
|
|
|
|
|
|
|
|
|
|
|
|
|
(Loss) income per common share: |
|
|
|
|
|
|
|
|
|
|
|
|
|
|
|
|
|
|
|
|
Diluted: |
|
|
|
|
|
|
|
|
|
|
|
|
|
|
|
|
|
|
|
|
Weighted average shares outstanding for diluted (loss) income from continuing operations per share (d) |
|
|
49,865 |
|
|
|
|
|
|
|
|
|
|
|
|
|
|
|
|
|
Diluted net (loss) income from continuing operations per share (e) |
|
$ |
(1.44) |
|
|
|
|
|
|
|
|
|
|
|
|
|
|
Not calculated |
|
43
|
(a) |
Our leases are classified as either operating leases, capital leases or financing obligations pursuant to applicable guidance under U.S. GAAP. We view the primary provisions and economics of these leases, regardless of their accounting treatment, as being nearly identical. Virtually all of our leases are structured with triple net terms, have fixed annual rent escalators and have long-term initial maturities with renewal options. Accordingly, in connection with our evaluation of our financial performance, we reclassify all of our leases to operating lease treatment and reflect lease expense on a cash basis. This approach allows us to better understand the relationship in each reporting period of our operating performance, as measured by EBITDAR and Adjusted EBITDAR, to the cash basis obligations to our landlords in that reporting period, regardless of the lease accounting treatment. This presentation and approach is also consistent with the financial reporting and covenant compliance requirements contained in all of our major lease and loan agreements. The following table summarizes the reclassification adjustments necessary to present all leases as operating leases on a cash basis: |
|
|
|
Three months ended June 30, |
|
|
Six months ended June 30, |
|
||||||||
|
|
|
2015 |
|
2014 |
|
|
2015 |
|
2014 |
|
||||
|
|
|
(in thousands) |
|
|
(in thousands) |
|
||||||||
|
Lease expense: |
|
|
|
|
|
|
|
|
|
|
|
|
|
|
|
Cash rent - capital leases |
|
$ |
22,923 |
|
$ |
22,384 |
|
|
$ |
45,848 |
|
$ |
44,394 |
|
|
Cash rent - financing obligations |
|
|
64,065 |
|
|
61,097 |
|
|
|
126,835 |
|
|
119,632 |
|
|
Non-cash - operating lease arrangements |
|
|
(2,551) |
|
|
(3,164) |
|
|
|
(4,338) |
|
|
(6,146) |
|
|
Lease expense adjustments |
|
$ |
84,437 |
|
$ |
80,317 |
|
|
$ |
168,345 |
|
$ |
157,880 |
|
|
|
|
|
|
|
|
|
|
|
|
|
|
|
|
|
|
Depreciation and amortization expense: |
|
|
|
|
|
|
|
|
|
|
|
|
|
|
|
Capital lease accounting |
|
$ |
(9,296) |
|
$ |
(9,281) |
|
|
$ |
(18,075) |
|
$ |
(18,280) |
|
|
Financing obligation accounting |
|
|
(24,901) |
|
|
(24,244) |
|
|
|
(49,714) |
|
|
(47,113) |
|
|
Depreciation and amortization expense adjustments |
|
$ |
(34,197) |
|
$ |
(33,525) |
|
|
$ |
(67,789) |
|
$ |
(65,393) |
|
|
|
|
|
|
|
|
|
|
|
|
|
|
|
|
|
|
Interest expense: |
|
|
|
|
|
|
|
|
|
|
|
|
|
|
|
Capital lease accounting |
|
$ |
(26,157) |
|
$ |
(25,087) |
|
|
$ |
(51,643) |
|
$ |
(49,209) |
|
|
Financing obligation accounting |
|
|
(77,823) |
|
|
(72,573) |
|
|
|
(154,671) |
|
|
(143,859) |
|
|
Interest expense adjustments |
|
$ |
(103,980) |
|
$ |
(97,660) |
|
|
$ |
(206,314) |
|
$ |
(193,068) |
|
|
|
|
|
|
|
|
|
|
|
|
|
|
|
|
|
|
Total pre-tax lease accounting adjustments |
|
$ |
(53,740) |
|
$ |
(50,868) |
|
|
$ |
(105,758) |
|
$ |
(100,581) |
|
|
(b) |
The acquisition and construction of new businesses has become an important element of our growth strategy. Many of the businesses we acquire have a history of operating losses and continue to generate operating losses in the months that follow our acquisition. Newly constructed or developed businesses also generate losses while in their start-up phase. We view these losses as both temporary and an expected component of our long-term investment in the new venture. We adjust these losses when computing Adjusted EBITDAR and Adjusted EBITDA in order to better evaluate the performance of our core business. The activities of such businesses are adjusted when computing Adjusted EBITDAR and Adjusted EBITDA until such time as a new business generates positive Adjusted EBITDA. The operating performance of new businesses are no longer adjusted when computing Adjusted EBITDAR and Adjusted EBITDA beginning the period in which a new business generates positive Adjusted EBITDA and all periods thereafter. There were seven acquired or newly constructed businesses eliminated from our reported results when computing adjusted results for the three and six months ended June 30, 2015 and 2014, respectively. The results for the three and six months ended June 30, 2015 were also adjusted for operational losses incurred for a rehabilitation services start-up in China. |
44
|
(c) |
Other adjustments represent costs or gains associated with transactions or events that we do not believe are reflective of our core recurring operating business. The following items were realized in the periods presented: |
|
|
|
Three months ended June 30, |
|
|
Six months ended June 30, |
|
||||||||
|
|
|
2015 |
|
2014 |
|
|
2015 |
|
2014 |
|
||||
|
|
|
(in thousands) |
|
|
(in thousands) |
|
||||||||
|
Severance and restructuring (1) |
|
$ |
720 |
|
$ |
(94) |
|
|
$ |
2,379 |
|
$ |
1,706 |
|
|
Regulatory defense and related costs (2) |
|
|
1,317 |
|
|
714 |
|
|
|
1,961 |
|
|
1,500 |
|
|
New business development costs (3) |
|
|
— |
|
|
— |
|
|
|
— |
|
|
499 |
|
|
Self-insurance adjustment (4) |
|
|
10,500 |
|
|
— |
|
|
|
10,500 |
|
|
— |
|
|
Transaction costs (5) |
|
|
2,642 |
|
|
1,298 |
|
|
|
88,710 |
|
|
3,547 |
|
|
Loss on early extinguishment of debt |
|
|
— |
|
|
181 |
|
|
|
3,234 |
|
|
680 |
|
|
Other income (6) |
|
|
50 |
|
|
(667) |
|
|
|
(7,560) |
|
|
(667) |
|
|
Stock based compensation (7) |
|
|
530 |
|
|
— |
|
|
|
530 |
|
|
— |
|
|
Tax benefit from total adjustments |
|
|
(3,658) |
|
|
(91) |
|
|
|
(23,155) |
|
|
(460) |
|
|
Total other adjustments |
|
$ |
12,101 |
|
$ |
1,341 |
|
|
$ |
76,599 |
|
$ |
6,805 |
|
|
(1) |
We incurred costs related to the termination, severance and restructuring of certain components of our business. |
|
(2) |
We incurred legal defense and other related costs in connection with certain matters in dispute or under appeal with regulatory agencies. |
|
(3) |
We incurred business development costs in connection with the evaluation and start-up of services outside our existing service offerings. |
|
(4) |
We incurred a self-insured program adjustment for the actuarially developed prior period GLPL and worker's compensation claims. We also recorded approximately $3.6 million of incremental development related to the first six months of 2015, which has not been excluded from our non GAAP results. |
|
(5) |
We incurred costs associated with transactions including the combination with Skilled Healthcare Group, Inc. and other transactions. |
|
(6) |
We realized a net gain on the sale of certain assets in the six months ended June 30, 2015. |
(7) We incurred $0.5 million of non-cash stock-based compensation related to restricted stock units.
|
(d) |
Assumes 153.7 million diluted weighted average common shares outstanding and common stock equivalents on a fully exchanged basis. |
|
(e) |
Pro forma adjusted income from continuing operations per share assumes a tax rate of 40%, and is computed as follows: Pro forma adjusted net income before income taxes of $17.6 million x (1 — 40% tax rate) divided by 153.7 million diluted weighted average shares on a fully exchanged basis. |
45
Results of Operations
Three Months Ended June 30, 2015 Compared to Three Months Ended June 30, 2014
A summary of our unaudited results of operations for the three months ended June 30, 2015 as compared with the same period in 2014 follows:
|
|
|
Three months ended June 30, |
|
|
|
|
|
|||||||||
|
|
|
2015 |
|
2014 |
|
Increase / (Decrease) |
|
|||||||||
|
|
|
Revenue |
|
Revenue |
|
Revenue |
|
Revenue |
|
|
|
|
|
|
||
|
|
|
Dollars |
|
Percentage |
|
Dollars |
|
Percentage |
|
Dollars |
|
Percentage |
|
|||
|
|
|
|
|
|
|
|
|
|
|
|
|
|
|
|
|
|
|
|
|
(in thousands, except percentages) |
|
|||||||||||||
|
Revenues: |
|
|
|
|
|
|
|
|
|
|
|
|
|
|
|
|
|
Inpatient services: |
|
|
|
|
|
|
|
|
|
|
|
|
|
|
|
|
|
Skilled Nursing facilities |
|
$ |
1,164,674 |
|
82.0 |
% |
$ |
983,071 |
|
81.9 |
% |
$ |
181,603 |
|
18.5 |
% |
|
Assisted living facilities |
|
|
36,206 |
|
2.6 |
% |
|
28,006 |
|
2.3 |
% |
|
8,200 |
|
29.3 |
% |
|
Administration of third party facilities |
|
|
2,828 |
|
0.2 |
% |
|
2,618 |
|
0.2 |
% |
|
210 |
|
8.0 |
% |
|
Elimination of administrative services |
|
|
(523) |
|
(0.0) |
% |
|
(462) |
|
(0.0) |
% |
|
(61) |
|
13.2 |
% |
|
Inpatient services, net |
|
|
1,203,185 |
|
84.8 |
% |
|
1,013,233 |
|
84.4 |
% |
|
189,952 |
|
18.8 |
% |
|
|
|
|
|
|
|
|
|
|
|
|
|
|
|
|
|
|
|
Rehabilitation therapy services: |
|
|
|
|
|
|
|
|
|
|
|
|
|
|
|
|
|
Total therapy services |
|
|
274,133 |
|
19.3 |
% |
|
254,941 |
|
21.2 |
% |
|
19,192 |
|
7.5 |
% |
|
Elimination intersegment rehabilitation therapy services |
|
|
(110,002) |
|
(7.7) |
% |
|
(98,812) |
|
(8.2) |
% |
|
(11,190) |
|
11.3 |
% |
|
Third party rehabilitation therapy services |
|
|
164,131 |
|
11.6 |
% |
|
156,129 |
|
13.0 |
% |
|
8,002 |
|
5.1 |
% |
|
|
|
|
|
|
|
|
|
|
|
|
|
|
|
|
|
|
|
Other services: |
|
|
|
|
|
|
|
|
|
|
|
|
|
|
|
|
|
Total other services |
|
|
61,409 |
|
4.3 |
% |
|
38,240 |
|
3.2 |
% |
|
23,169 |
|
60.6 |
% |
|
Elimination intersegment other services |
|
|
(9,250) |
|
(0.7) |
% |
|
(6,951) |
|
(0.6) |
% |
|
(2,299) |
|
33.1 |
% |
|
Third party other services |
|
|
52,159 |
|
3.6 |
% |
|
31,289 |
|
2.6 |
% |
|
20,870 |
|
66.7 |
% |
|
|
|
|
|
|
|
|
|
|
|
|
|
|
|
|
|
|
|
Total revenue |
|
$ |
1,419,475 |
|
100.0 |
% |
$ |
1,200,651 |
|
100.0 |
% |
$ |
218,824 |
|
18.2 |
% |
|
|
|
Three months ended June 30, |
|
|
|
|
|
|
||||||||
|
|
|
2015 |
|
2014 |
|
Increase / (Decrease) |
|
|||||||||
|
|
|
|
|
|
Margin |
|
|
|
|
Margin |
|
|
|
|
|
|
|
|
|
Dollars |
|
Percentage |
|
Dollars |
|
Percentage |
|
Dollars |
|
Percentage |
|
|||
|
|
|
|
|
|
|
|
|
|
|
|
|
|
|
|
|
|
|
|
|
(in thousands, except percentages) |
||||||||||||||
|
EBITDAR: |
|
|
|
|
|
|
|
|
|
|
|
|
|
|
|
|
|
Inpatient services |
|
$ |
193,735 |
|
16.1 |
% |
$ |
167,069 |
|
16.5 |
% |
$ |
26,666 |
|
16.0 |
% |
|
Rehabilitation therapy services |
|
|
29,650 |
|
10.8 |
% |
|
28,690 |
|
11.3 |
% |
|
960 |
|
3.3 |
% |
|
Other services |
|
|
4,633 |
|
7.5 |
% |
|
1,676 |
|
4.4 |
% |
|
2,957 |
|
176.4 |
% |
|
Corporate and eliminations |
|
|
(44,010) |
|
- |
% |
|
(35,837) |
|
- |
% |
|
(8,173) |
|
22.8 |
% |
|
|
|
|
|
|
|
|
|
|
|
|
|
|
|
|
|
|
|
EBITDAR |
|
$ |
184,008 |
|
13.0 |
% |
$ |
161,598 |
|
13.5 |
% |
$ |
22,410 |
|
13.9 |
% |
46
A summary of our unaudited condensed consolidating statement of operations follows:
|
|
|
|
|
|
|
|
|
|
|
|
|
|
|
|
|
|
|
|
|
|
|
|
Three months ended June 30, 2015 |
|
||||||||||||||||
|
|
|
|
|
|
Rehabilitation |
|
|
|
|
|
|
|
|
|
|
|
|
||
|
|
|
Inpatient |
|
Therapy |
|
Other |
|
|
|
|
|
|
|
|
|
|
|||
|
|
|
Services |
|
Services |
|
Services |
|
Corporate |
|
Eliminations |
|
Consolidated |
|
||||||
|
|
|
(In thousands) |
|
||||||||||||||||
|
Net revenues |
|
$ |
1,203,708 |
|
$ |
274,133 |
|
$ |
60,338 |
|
$ |
1,071 |
|
$ |
(119,775) |
|
$ |
1,419,475 |
|
|
Salaries, wages and benefits |
|
|
562,682 |
|
|
220,782 |
|
|
37,462 |
|
|
— |
|
|
— |
|
|
820,926 |
|
|
Other operating expenses |
|
|
430,954 |
|
|
19,595 |
|
|
17,463 |
|
|
— |
|
|
(119,776) |
|
|
348,236 |
|
|
General and administrative costs |
|
|
— |
|
|
— |
|
|
1 |
|
|
44,982 |
|
|
— |
|
|
44,983 |
|
|
Provision for losses on accounts receivable |
|
|
17,271 |
|
|
4,106 |
|
|
779 |
|
|
(43) |
|
|
— |
|
|
22,113 |
|
|
Lease expense |
|
|
37,738 |
|
|
14 |
|
|
747 |
|
|
460 |
|
|
— |
|
|
38,959 |
|
|
Depreciation and amortization expense |
|
|
51,032 |
|
|
3,032 |
|
|
198 |
|
|
(657) |
|
|
— |
|
|
53,605 |
|
|
Interest expense |
|
|
105,815 |
|
|
1 |
|
|
10 |
|
|
20,683 |
|
|
(124) |
|
|
126,385 |
|
|
Investment income |
|
|
(420) |
|
|
— |
|
|
— |
|
|
(135) |
|
|
124 |
|
|
(431) |
|
|
Other income |
|
|
— |
|
|
— |
|
|
— |
|
|
50 |
|
|
— |
|
|
50 |
|
|
Transaction costs |
|
|
50 |
|
|
— |
|
|
— |
|
|
2,592 |
|
|
— |
|
|
2,642 |
|
|
Equity in net (income) loss of unconsolidated affiliates |
|
|
(514) |
|
|
— |
|
|
— |
|
|
(414) |
|
|
568 |
|
|
(360) |
|
|
(Loss) income before income tax benefit |
|
|
(900) |
|
|
26,603 |
|
|
3,678 |
|
|
(66,447) |
|
|
(567) |
|
|
(37,633) |
|
|
Income tax benefit |
|
|
— |
|
|
— |
|
|
— |
|
|
(4,419) |
|
|
— |
|
|
(4,419) |
|
|
(Loss) income from continuing operations |
|
$ |
(900) |
|
$ |
26,603 |
|
$ |
3,678 |
|
$ |
(62,028) |
|
$ |
(567) |
|
$ |
(33,214) |
|
|
|
|
Three months ended June 30, 2014 |
|
||||||||||||||||
|
|
|
|
|
|
Rehabilitation |
|
|
|
|
|
|
|
|
|
|
|
|
||
|
|
|
Inpatient |
|
Therapy |
|
Other |
|
|
|
|
|
|
|
|
|
|
|||
|
|
|
Services |
|
Services |
|
Services |
|
Corporate |
|
Eliminations |
|
Consolidated |
|
||||||
|
|
|
(In thousands) |
|
||||||||||||||||
|
Net revenues |
|
$ |
1,013,695 |
|
$ |
254,941 |
|
$ |
38,119 |
|
$ |
121 |
|
$ |
(106,225) |
|
$ |
1,200,651 |
|
|
Salaries, wages and benefits |
|
|
486,698 |
|
|
205,821 |
|
|
24,696 |
|
|
— |
|
|
— |
|
|
717,215 |
|
|
Other operating expenses |
|
|
348,460 |
|
|
15,888 |
|
|
11,480 |
|
|
— |
|
|
(106,225) |
|
|
269,603 |
|
|
General and administrative costs |
|
|
— |
|
|
— |
|
|
— |
|
|
35,980 |
|
|
— |
|
|
35,980 |
|
|
Provision for losses on accounts receivable |
|
|
12,272 |
|
|
4,542 |
|
|
266 |
|
|
— |
|
|
— |
|
|
17,080 |
|
|
Lease expense |
|
|
32,436 |
|
|
44 |
|
|
207 |
|
|
222 |
|
|
— |
|
|
32,909 |
|
|
Depreciation and amortization expense |
|
|
41,731 |
|
|
2,785 |
|
|
225 |
|
|
4,189 |
|
|
— |
|
|
48,930 |
|
|
Interest expense |
|
|
94,841 |
|
|
1 |
|
|
241 |
|
|
14,941 |
|
|
(124) |
|
|
109,900 |
|
|
Loss on extinguishment of debt |
|
|
— |
|
|
— |
|
|
— |
|
|
181 |
|
|
— |
|
|
181 |
|
|
Investment income |
|
|
(415) |
|
|
— |
|
|
— |
|
|
(145) |
|
|
124 |
|
|
(436) |
|
|
Other income |
|
|
— |
|
|
— |
|
|
(667) |
|
|
— |
|
|
— |
|
|
(667) |
|
|
Transaction costs |
|
|
— |
|
|
(9) |
|
|
— |
|
|
1,307 |
|
|
— |
|
|
1,298 |
|
|
Equity in net (income) loss of unconsolidated affiliates |
|
|
(390) |
|
|
— |
|
|
— |
|
|
— |
|
|
— |
|
|
(390) |
|
|
(Loss) income before income tax benefit |
|
|
(1,938) |
|
|
25,869 |
|
|
1,671 |
|
|
(56,554) |
|
|
— |
|
|
(30,952) |
|
|
Income tax benefit |
|
|
— |
|
|
— |
|
|
— |
|
|
(96) |
|
|
— |
|
|
(96) |
|
|
(Loss) income from continuing operations |
|
$ |
(1,938) |
|
$ |
25,869 |
|
$ |
1,671 |
|
$ |
(56,458) |
|
$ |
— |
|
$ |
(30,856) |
|
Prior to February 1, 2015, our results of operations exclude the revenue and expenses of Skilled’s businesses. For comparability, those revenue and expense variances attributed solely to the combination of Skilled’s businesses with ours, commencing on February 1, 2015, will be identified in the discussion of the results of operations. References to “legacy” businesses identify those businesses operating as either Skilled or Genesis, respectively, prior to the Combination.
Total Revenues
Total revenue for the three months ended June 30, 2015 as compared with the same period in 2014 increased by $218.8 million. Of that increase, Skilled’s businesses contributed $216.3 million. The remaining increase of $2.6 million or 0.2% is described further in our discussion of segment revenues as follows.
Inpatient Services – Revenue increased $190.0 million, or 18.8%, in the three months ended June 30, 2015 as compared with the same period in 2014. Of this growth, $178.8 million is due to the Combination and $23.5 million is
47
due to the acquisition or development of 12 facilities, offset by $9.0 million of revenue attributed to the divestiture of three underperforming facilities. The remaining decrease of $3.3 million, or 0.3%, is due to increased payment rates.
Rehabilitation Therapy Services – Revenue increased $19.2 million, or 7.5% comparing the three months ended June 30, 2015 with the same period in 2014. The Combination contributed $33.6 million of revenue growth, while the legacy Genesis rehabilitation business revenue decreased $14.4 million. Of this decrease, approximately $7.6 million is attributed to the loss of several large contracts during the quarter ended December 31, 2014, with the remaining decrease of $6.8 million primarily attributed to lower treatment volume in its same store customer base. These two factors translate to a decline in the average revenue per site of approximately 3%.
Other Services – Other services revenue increased $23.2 million, or 60.6% in the three months ended June 30, 2015 as compared with the same period in 2014. Of this increase, the Combination contributed $19.8 million through the hospice and home health businesses. The remaining increase of $3.4 million, or 8.9% was principally attributed to new business growth in our staffing services and physician services business lines.
EBITDAR
EBITDAR for the three months ended June 30, 2015 increased by $22.4 million, or 13.9% when compared with the same period in 2014. Of that increase, Skilled’s businesses contributed an estimated $30.1 million after an estimated overhead allocation of 2.5% of its revenues for the five month period following the Combination. The remaining decrease of approximately $7.7 million or 4.7% is described further in our discussion of segment results and corporate overhead as follows.
Inpatient Services – EBITDAR increased in the three months ended June 30, 2015 as compared with the same period in 2014, by $26.7 million, or 16.0%. Of the increase, $31.4 million is attributed to the Combination and $3.8 million is due to the acquisition or development of 12 facilities, offset by a reduction of $0.4 million attributed to the divestiture or closure of three underperforming facilities. Additionally, the three months ended June 30, 2015, compared with the same period in 2014, include an additional $13.9 million of general and professional liability (GLPL) claims development expense. This amount excludes the incremental expense associated with the Combination. The increased GLPL expense principally relates to prior year self-insured claims which were under reserved in those periods. The remaining EBITDAR increase of $5.8 million, or 3.5%, is principally attributable to the realization of cost reductions we began implementing in the quarter ended December 31, 2014.
Rehabilitation Therapy Services – EBITDAR of the rehabilitation therapy segment increased by $1.0 million or 3.3% comparing the three months ended June 30, 2015 with the same period in 2014. The Combination contributed $2.0 million, while the EBITDAR of the legacy Genesis rehabilitation therapy business EBITDAR declined $1.0 million in the same period. This decrease is attributed primarily to lost contracts and lower revenue volume but is partly offset by an improvement in Therapist Efficiency. Therapist Efficiency improved period over period by 1%, from 69% to 70%.
Other Services – EBITDAR increased $3.0 million in the three months ended June 30, 2015 as compared with the same period in 2014. Of that increase, the Combination contributed $2.4 million, principally through the addition of hospice and homecare businesses. The remaining $0.6 million of EBITDAR growth is attributed to the physician services and staffing services businesses.
Corporate and Eliminations — Corporate overhead costs increased $8.2 million, or 22.8%, in the three months ended June 30, 2015 as compared with the same period in 2014. This increase was largely due to the added overhead costs of Skilled.
Other Expense
The following discussion applies to the consolidated expense categories between consolidated EBITDAR and (loss) income from continuing operations of all reportable segments, other services, corporate and eliminations in our
48
unaudited condensed consolidating statement of operations for the three months ended June 30, 2015 as compared with the same period in 2014.
Lease expense — Lease expense represents the cash rents and non-cash adjustments required to account for operating leases. We have operating leases in each reportable segment, other services and corporate overhead, but the inpatient services business incurs the greatest proportion of this expense for those skilled nursing and assisted living facilities accounted for as operating leases. Lease expense increased $6.1 million in the three months ended June 30, 2015 as compared with the same period in the prior year. All of this increase is attributed to the Combination.
Depreciation and amortization — Each of our reportable segments, other services and corporate overhead have depreciating property, plant and equipment, including depreciation on leased properties accounted for as capital leases or as a financing obligation. Our rehabilitation therapy services and other services have identifiable intangible assets which amortize over the estimated life of those identifiable assets. The majority of the $4.7 million increase in depreciation and amortization in the three months ended June 30, 2015 compared with the same period in the prior year, is attributed to the Combination.
Interest expense — Interest expense includes the cash interest and non-cash adjustments required to account for our revolving credit facilities, term loan facility, real estate bridge loan and mortgage instruments, as well as the expense associated with leases accounted for as capital leases or financing obligations. Interest expense increased $16.5 million in the three months ended June 30, 2015 as compared with the same period in the prior year. Of this increase, $8.7 million is attributed to the Combination and the associated real estate bridge loan and individual mortgages of Skilled’s skilled nursing and assisted living facilities. The remaining $7.8 million increase is primarily attributable to growth in interest pertaining to existing lease obligations and obligations incurred in connection with newly acquired or constructed facilities.
Other income — During the three months ended June 30, 2014, we sold a medical office building and clinic for a net gain of $0.7 million.
Transaction costs — In the normal course of business, Genesis evaluates strategic acquisition, disposition and business development opportunities. The costs to pursue these opportunities, when incurred, vary from period to period depending on the nature of the transaction pursued and if those transactions are ever completed. Transaction costs incurred for the three month periods ended June 30, 2015 and 2014 were $2.6 million and $1.3 million, respectively, and of the amount in the 2015 period, the Combination contributed $2.2 million.
Income tax benefit — For the three months ended June 30, 2015, we recorded an income tax benefit of $4.4 million from continuing operations representing an effective tax rate of 11.7% compared to an income tax benefit of $0.1 million from continuing operations, representing an effective tax rate of 0.3% for the same period in 2014. The increase in tax benefit for the three months ended June 30, 2015 was mainly due to the establishment of a valuation allowance against the insurance reserves deferred tax asset of our Cayman captive insurance company and the write-off of a portion of deferred tax assets on U.S. federal and state net operating losses.
49
Six Months Ended June 30, 2015 Compared to Six Months Ended June 30, 2014
A summary of our unaudited results of operations for the six months ended June 30, 2015 as compared with the same period in 2014 follows:
|
|
|
|
|
|
|
|
|
|
|
|
|
|
|
|
|
|
|
|
|
Six months ended June 30, |
|
|
|
|
|
|||||||||
|
|
|
2015 |
|
2014 |
|
Increase / (Decrease) |
|
|||||||||
|
|
|
Revenue |
|
Revenue |
|
Revenue |
|
Revenue |
|
|
|
|
|
|
||
|
|
|
Dollars |
|
Percentage |
|
Dollars |
|
Percentage |
|
Dollars |
|
Percentage |
|
|||
|
|
|
(in thousands, except percentages) |
|
|||||||||||||
|
Revenues: |
|
|
|
|
|
|
|
|
|
|
|
|
|
|
|
|
|
Inpatient services: |
|
|
|
|
|
|
|
|
|
|
|
|
|
|
|
|
|
Skilled Nursing facilities |
|
$ |
2,269,665 |
|
82.2 |
% |
$ |
1,952,698 |
|
81.8 |
% |
$ |
316,967 |
|
16.2 |
% |
|
Assisted living facilities |
|
|
69,862 |
|
2.5 |
% |
|
55,963 |
|
2.3 |
% |
|
13,899 |
|
24.8 |
% |
|
Administration of third party facilities |
|
|
5,499 |
|
0.2 |
% |
|
5,251 |
|
0.2 |
% |
|
248 |
|
4.7 |
% |
|
Elimination of administrative services |
|
|
(1,024) |
|
(0.0) |
% |
|
(926) |
|
(0.0) |
% |
|
(98) |
|
10.6 |
% |
|
Inpatient services, net |
|
|
2,344,002 |
|
84.9 |
% |
|
2,012,986 |
|
84.3 |
% |
|
331,016 |
|
16.4 |
% |
|
|
|
|
|
|
|
|
|
|
|
|
|
|
|
|
|
|
|
Rehabilitation therapy services: |
|
|
|
|
|
|
|
|
|
|
|
|
|
|
|
|
|
Total therapy services |
|
|
537,184 |
|
19.4 |
% |
|
510,265 |
|
21.4 |
% |
|
26,919 |
|
5.3 |
% |
|
Elimination intersegment rehabilitation therapy services |
|
|
(215,908) |
|
(7.8) |
% |
|
(197,159) |
|
(8.3) |
% |
|
(18,749) |
|
9.5 |
% |
|
Third party rehabilitation therapy services |
|
|
321,276 |
|
11.6 |
% |
|
313,106 |
|
13.1 |
% |
|
8,170 |
|
2.6 |
% |
|
|
|
|
|
|
|
|
|
|
|
|
|
|
|
|
|
|
|
Other services: |
|
|
|
|
|
|
|
|
|
|
|
|
|
|
|
|
|
Total other services |
|
|
113,955 |
|
4.1 |
% |
|
74,191 |
|
3.1 |
% |
|
39,764 |
|
53.6 |
% |
|
Elimination intersegment other services |
|
|
(16,757) |
|
(0.6) |
% |
|
(13,088) |
|
(0.5) |
% |
|
(3,669) |
|
28.0 |
% |
|
Third party other services |
|
|
97,198 |
|
3.5 |
% |
|
61,103 |
|
2.6 |
% |
|
36,095 |
|
59.1 |
% |
|
|
|
|
|
|
|
|
|
|
|
|
|
|
|
|
|
|
|
Total revenue |
|
$ |
2,762,476 |
|
100.0 |
% |
$ |
2,387,195 |
|
100.0 |
% |
$ |
375,281 |
|
15.7 |
% |
|
|
|
Six months ended June 30, |
|
|
|
|
|
|
|
||||||||
|
|
|
2015 |
|
2014 |
|
Increase / (Decrease) |
|
|
|||||||||
|
|
|
|
|
|
Margin |
|
|
|
|
Margin |
|
|
|
|
|
|
|
|
|
|
Dollars |
|
Percentage |
|
Dollars |
|
Percentage |
|
Dollars |
|
Percentage |
|
|
|||
|
|
|
(in thousands, except percentages) |
|
||||||||||||||
|
EBITDAR: |
|
|
|
|
|
|
|
|
|
|
|
|
|
|
|
|
|
|
Inpatient services |
|
$ |
378,438 |
|
16.1 |
% |
$ |
320,230 |
|
15.9 |
% |
$ |
58,208 |
|
18.2 |
% |
|
|
Rehabilitation therapy services |
|
|
58,678 |
|
10.9 |
% |
|
59,060 |
|
11.6 |
% |
|
(382) |
|
(0.6) |
% |
|
|
Other services |
|
|
8,651 |
|
7.6 |
% |
|
2,992 |
|
4.0 |
% |
|
5,659 |
|
189.1 |
% |
|
|
Corporate and eliminations |
|
|
(86,413) |
|
- |
% |
|
(72,430) |
|
- |
% |
|
(13,983) |
|
19.3 |
% |
|
|
|
|
|
|
|
|
|
|
|
|
|
|
|
|
|
|
|
|
|
EBITDAR |
|
$ |
359,354 |
|
13.0 |
% |
$ |
309,852 |
|
13.0 |
% |
$ |
49,502 |
|
16.0 |
% |
|
50
A summary of our unaudited condensed consolidating statement of operations follows:
|
|
|
Six months ended June 30, 2015 |
|
||||||||||||||||
|
|
|
|
|
|
Rehabilitation |
|
|
|
|
|
|
|
|
|
|
|
|
|
|
|
|
|
Inpatient |
|
Therapy |
|
|
|
|
|
|
|
|
|
|
|
|
|
||
|
|
|
Services |
|
Services |
|
Other Services |
|
Corporate |
|
Eliminations |
|
Consolidated |
|
||||||
|
|
|
(In thousands) |
|
||||||||||||||||
|
Net revenues |
|
$ |
2,345,026 |
|
$ |
537,184 |
|
$ |
112,674 |
|
$ |
1,281 |
|
$ |
(233,689) |
|
$ |
2,762,476 |
|
|
Salaries, wages and benefits |
|
|
1,105,374 |
|
|
435,579 |
|
|
70,706 |
|
|
— |
|
|
— |
|
|
1,611,659 |
|
|
Other operating expenses |
|
|
827,496 |
|
|
34,994 |
|
|
31,996 |
|
|
— |
|
|
(233,689) |
|
|
660,797 |
|
|
General and administrative costs |
|
|
— |
|
|
— |
|
|
3 |
|
|
86,513 |
|
|
— |
|
|
86,516 |
|
|
Provision for losses on accounts receivable |
|
|
36,344 |
|
|
7,933 |
|
|
1,318 |
|
|
(86) |
|
|
— |
|
|
45,509 |
|
|
Lease expense |
|
|
73,266 |
|
|
55 |
|
|
1,206 |
|
|
851 |
|
|
— |
|
|
75,378 |
|
|
Depreciation and amortization expense |
|
|
99,257 |
|
|
5,899 |
|
|
560 |
|
|
7,822 |
|
|
— |
|
|
113,538 |
|
|
Interest expense |
|
|
209,469 |
|
|
2 |
|
|
20 |
|
|
38,454 |
|
|
(247) |
|
|
247,698 |
|
|
Loss on extinguishment of debt |
|
|
— |
|
|
— |
|
|
— |
|
|
3,234 |
|
|
— |
|
|
3,234 |
|
|
Investment income |
|
|
(778) |
|
|
— |
|
|
— |
|
|
(316) |
|
|
247 |
|
|
(847) |
|
|
Other income |
|
|
421 |
|
|
— |
|
|
— |
|
|
(7,981) |
|
|
— |
|
|
(7,560) |
|
|
Transaction costs |
|
|
— |
|
|
— |
|
|
— |
|
|
88,710 |
|
|
— |
|
|
88,710 |
|
|
Equity in net (income) loss of unconsolidated affiliates |
|
|
(823) |
|
|
— |
|
|
— |
|
|
(634) |
|
|
944 |
|
|
(513) |
|
|
(Loss) income before income tax benefit |
|
|
(5,000) |
|
|
52,722 |
|
|
6,865 |
|
|
(215,286) |
|
|
(944) |
|
|
(161,643) |
|
|
Income tax benefit |
|
|
— |
|
|
— |
|
|
— |
|
|
(10,067) |
|
|
— |
|
|
(10,067) |
|
|
(Loss) income from continuing operations |
|
$ |
(5,000) |
|
$ |
52,722 |
|
$ |
6,865 |
|
$ |
(205,219) |
|
$ |
(944) |
|
$ |
(151,576) |
|
|
|
|
Six months ended June 30, 2014 |
|
||||||||||||||||
|
|
|
|
|
|
Rehabilitation |
|
|
|
|
|
|
|
|
|
|
|
|
|
|
|
|
|
Inpatient |
|
Therapy |
|
|
|
|
|
|
|
|
|
|
|
|
|
||
|
|
|
Services |
|
Services |
|
Other Services |
|
Corporate |
|
Eliminations |
|
Consolidated |
|
||||||
|
|
|
(In thousands) |
|
||||||||||||||||
|
Net revenues |
|
$ |
2,013,912 |
|
$ |
510,265 |
|
$ |
73,933 |
|
$ |
258 |
|
$ |
(211,173) |
|
$ |
2,387,195 |
|
|
Salaries, wages and benefits |
|
|
977,772 |
|
|
411,970 |
|
|
48,735 |
|
|
— |
|
|
— |
|
|
1,438,477 |
|
|
Other operating expenses |
|
|
691,499 |
|
|
30,972 |
|
|
21,851 |
|
|
— |
|
|
(211,173) |
|
|
533,149 |
|
|
General and administrative costs |
|
|
— |
|
|
— |
|
|
— |
|
|
71,844 |
|
|
— |
|
|
71,844 |
|
|
Provision for losses on accounts receivable |
|
|
26,855 |
|
|
8,388 |
|
|
356 |
|
|
(3) |
|
|
— |
|
|
35,596 |
|
|
Lease expense |
|
|
64,756 |
|
|
88 |
|
|
420 |
|
|
444 |
|
|
— |
|
|
65,708 |
|
|
Depreciation and amortization expense |
|
|
81,951 |
|
|
5,572 |
|
|
475 |
|
|
8,432 |
|
|
— |
|
|
96,430 |
|
|
Interest expense |
|
|
191,300 |
|
|
2 |
|
|
450 |
|
|
27,145 |
|
|
(247) |
|
|
218,650 |
|
|
Loss on extinguishment of debt |
|
|
— |
|
|
— |
|
|
— |
|
|
680 |
|
|
— |
|
|
680 |
|
|
Investment income |
|
|
(839) |
|
|
— |
|
|
— |
|
|
(787) |
|
|
247 |
|
|
(1,379) |
|
|
Other income |
|
|
— |
|
|
— |
|
|
(667) |
|
|
— |
|
|
— |
|
|
(667) |
|
|
Transaction costs |
|
|
— |
|
|
(9) |
|
|
— |
|
|
3,556 |
|
|
— |
|
|
3,547 |
|
|
Equity in net (income) loss of unconsolidated affiliates |
|
|
(680) |
|
|
— |
|
|
— |
|
|
— |
|
|
334 |
|
|
(346) |
|
|
(Loss) income before income tax benefit |
|
|
(18,702) |
|
|
53,282 |
|
|
2,313 |
|
|
(111,053) |
|
|
(334) |
|
|
(74,494) |
|
|
Income tax benefit |
|
|
— |
|
|
— |
|
|
— |
|
|
(2,850) |
|
|
— |
|
|
(2,850) |
|
|
(Loss) income from continuing operations |
|
$ |
(18,702) |
|
$ |
53,282 |
|
$ |
2,313 |
|
$ |
(108,203) |
|
$ |
(334) |
|
$ |
(71,644) |
|
Prior to February 1, 2015, our results of operations exclude the revenue and expenses of Skilled’s businesses. For comparability, those revenue and expense variances attributed solely to the combination of Skilled’s businesses with
51
ours, commencing on February 1, 2015, will be identified in the discussion of the results of operations. References to “legacy” businesses identify those businesses operating as either Skilled or Genesis, respectively, prior to the Combination.
Total Revenues
Total revenue for the six months ended June 30, 2015 as compared with the same period in 2014 increased by $375.3 million. Of that increase, Skilled’s businesses contributed $359.5 million. The remaining increase of $15.8 million or 0.7% is described further in our discussion of segment revenues as follows.
Inpatient Services – Revenue increased $331.0 million, or 16.4%, in the six months ended June 30, 2015 as compared with the same period in 2014. Of this growth, $295.5 million is due to the Combination and $44.8 million is due to the acquisition or development of 13 facilities, offset by $15.9 million of revenue attributed to the divestiture of three underperforming facilities. The remaining increase of $6.6 million, or 0.3%, is due to increased payment rates.
Rehabilitation Therapy Services – Revenue increased $26.9 million, or 5.3% comparing the six months ended June 30, 2015 with the same period in 2014. The Combination contributed $57.5 million of revenue growth, while the legacy Genesis rehabilitation business revenue decreased $30.6 million. Of this decrease, approximately $16.6 million is attributed to the loss of several large contracts during the fourth fiscal quarter of 2014, with the remaining decrease of $14.0 million attributed to lower treatment volume in the same store customer base. These two factors translate to a decline in the average revenue per site of approximately 4%.
Other Services – Other services revenue increased $39.8 million, or 53.6% in the six months ended June 30, 2015 as compared with the same period in 2014. Of this increase, the Combination contributed $33.3 million through the hospice and home health businesses. The remaining increase of $6.5 million, or 8.8% was principally attributed to new business growth in our staffing services and physician services business lines.
EBITDAR
EBITDAR for the six months ended June 30, 2015 increased by $49.5 million, or 16.0% when compared with the same period in 2014. Of that increase, Skilled’s businesses contributed an estimated $50.4 million after an estimated overhead allocation of 2.5% of its revenues for the five month period following the Combination. The remaining decrease of approximately $0.9 million or 0.3% is described further in our discussion of segment results and corporate overhead as follows.
Inpatient Services – EBITDAR increased in six months ended June 30, 2015 as compared with the same period in 2014, by $58.2 million, or 18.2%. Of the increase, $51.4 million is attributed to the Combination and $6.5 million is due to the acquisition or development of 12 facilities, offset by a reduction of $0.2 million attributed to the divestiture or closure of three underperforming facilities. Additionally, the six months ended June 30, 2015, compared with the same period in 2014, include an additional $15.1 million of GLPL claims development expense. This amount excludes the incremental expense associated with the Combination. The increased GLPL expense principally relates to prior year self-insured claims which were under reserved in those periods. The remaining EBITDAR increase of $15.6 million, or 4.9%, is principally attributable to the realization of cost reductions we began implementing in the quarter ended December 31, 2014.
Rehabilitation Therapy Services – EBITDAR decreased $0.4 million comparing the six months ended June 30, 2015 with the same period in 2014. The Combination contributed $4.4 million, while the EBITDAR of the legacy Genesis rehabilitation therapy business EBITDAR declined $4.8 million in the same period. This decrease is attributed primarily to lost contracts and lower revenue volume noted above. Therapist Efficiency remained flat period over period at 70%.
Other Services – EBITDAR increased $5.7 million in the six months ended June 30, 2015 as compared with the same period in 2014. Of that increase, the Combination contributed $4.3 million, principally through the addition of
52
hospice and homecare businesses. The remaining $1.4 million of EBITDAR growth is attributed to the physician services and staffing services businesses.
Corporate and Eliminations — Corporate overhead costs increased $14.0 million, or 19.3%, in the six months ended June 30, 2015 as compared with the same period in 2014. This increase was largely due to the added overhead costs of Skilled.
Other Expense
The following discussion applies to the consolidated expense categories between consolidated EBITDAR and (loss) income from continuing operations of all reportable segments, other services, corporate and eliminations in our unaudited condensed consolidating statement of operations for the six months ended June 30, 2015 as compared with the same period in 2014.
Lease expense — Lease expense represents the cash rents and non-cash adjustments required to account for operating leases. We have operating leases in each reportable segment, other services and corporate overhead, but the inpatient services business incurs the greatest proportion of this expense for those skilled nursing and assisted living facilities accounted for as operating leases. Lease expense increased $9.7 million in the six months ended June 30, 2015 as compared with the same period in the prior year. All of this increase is attributed to the Combination.
Depreciation and amortization — Each of our reportable segments, other services and corporate overhead have depreciating property, plant and equipment, including depreciation on leased properties accounted for as capital leases or as a financing obligation. Our rehabilitation therapy services and other services have identifiable intangible assets which amortize over the estimated life of those identifiable assets. Of the $17.1 million increase in depreciation and amortization in the six months ended June 30, 2015 compared with the same period in the prior year, the Combination accounts for $12.4 million. The remaining increase of $4.7 million is primarily attributable to Genesis’ ongoing capital expenditure program and newly acquired or constructed facilities.
Interest expense — Interest expense includes the cash interest and non-cash adjustments required to account for our revolving credit facilities, term loan facility, real estate bridge loan and mortgage instruments, as well as the expense associated with leases accounted for as capital leases or financing obligations. Interest expense increased $29.0 million in the six months ended June 30, 2015 as compared with the same period in the prior year. Of this increase, $14.5 million is attributed to the Combination and the associated real estate bridge loan and individual mortgages of Skilled’s skilled nursing and assisted living facilities. The remaining $14.5 million increase is primarily attributable to growth in interest pertaining to existing lease obligations and obligations incurred in connection with newly acquired or constructed facilities.
Other income — On March 31, 2015, we sold our investment in FC PAC Holdings, LLC, an unconsolidated joint venture in which we held an approximate 5.4% interest, for $26.4 million. The gain from that sale represents the majority of the net gain recognized in the six months ended June 30, 2015. During the six months ended June 30, 2014, we sold a medical office building and clinic for a net gain of $0.7 million.
Transaction costs — In the normal course of business, we evaluate strategic acquisition, disposition and business development opportunities. The costs to pursue these opportunities, when incurred, vary from period to period depending on the nature of the transaction pursued and if those transactions are ever completed. Transaction costs incurred for the six month periods ended June 30, 2015 and 2014 were $88.7 million and $3.5 million, respectively, and of the amount in the 2015 period, the Combination contributed $86.9 million.
Income tax benefit — For the six months ended June 30, 2015, we recorded an income tax benefit of $10.1 million representing an effective tax rate of 6.2% compared to an income tax benefit of $2.9 million from continuing operations, representing an effective tax rate of 3.8% for the same period in 2014. The increase in tax benefit for the six months ended June 30, 2015 was mainly due to the establishment of a valuation allowance against the insurance reserves
53
deferred tax asset of our Cayman captive insurance company and the write-off of a portion of deferred tax assets on U.S. federal and state net operating losses.
Liquidity and Capital Resources
The following table presents selected data from our consolidated statements of cash flows (in thousands):
|
|
|
Six months ended June 30, |
|
||||
|
|
|
2015 |
|
2014 |
|
||
|
|
|
|
|
|
|
|
|
|
Net cash (used in) provided by operating activities |
|
$ |
(7,729) |
|
$ |
36,361 |
|
|
Net cash used in investing activities |
|
|
(28,867) |
|
|
(47,495) |
|
|
Net cash provided by financing activities |
|
|
32,011 |
|
|
1,348 |
|
|
|
|
|
|
|
|
|
|
|
Net decrease in cash and equivalents |
|
|
(4,585) |
|
|
(9,786) |
|
|
Beginning of period |
|
|
87,548 |
|
|
61,413 |
|
|
|
|
|
|
|
|
|
|
|
End of period |
|
$ |
82,963 |
|
$ |
51,627 |
|
Net cash used in operating activities in the six months ended June 30, 2015 of $7.7 million was unfavorably impacted by funded transaction costs of approximately $62.1 million. Adjusted for transaction costs, net cash provided by operating activities in the six months ended June 30, 2015 would have been approximately $54.4 million. Net cash provided by operating activities in the six months ended June 30, 2014 of $36.4 million was unfavorably impacted by funded transaction costs of approximately $3.5 million. Adjusted for funded transaction costs, net cash provided by operating activities in the six months ended June 30, 2014 would have been $39.9 million. The $14.5 million growth in cash provided by operating activities before funded transaction costs in the 2015 period as compared to the 2014 period is attributed to the addition of the Skilled businesses beginning in February 2015, improved operating performance of the legacy Genesis business and the impact of favorable timing of labor related expenses.
Net cash used in investing activities in the six months ended June 30, 2015 was $28.9 million, compared to a use of cash of $47.5 million in the six months ended June 30, 2014. The net reduction in cash used in investing activities of $18.6 million is principally attributed to the receipt in the 2015 period of $27.6 million of asset and investment in joint venture sale proceeds partially offset by $9.7 million of outlays for the purchases of skilled nursing facilities and a deposit on the announced Revera acquisition.
Net cash provided by financing activities was $32.0 million in the six months ended June 30, 2015 compared to $1.3 million in the six months ended June 30, 2014. The net increase in cash provided by financing activities of $30.7 million is principally attributed to $18.5 million of net incremental borrowings under the revolving credit facilities, net proceeds on the refinancing of Skilled’s real estate of $18.1 million, and $5.1 million of reduced distributions to noncontrolling interests, offset with $13.9 million of incremental debt issuance costs funded in the 2015 period. The increase in debt issuance costs is attributed to the financing costs incurred in connection with the financing activities associated with the Combination.
At June 30, 2015, we had cash and cash equivalents of $83.0 million and available borrowings under our revolving credit facilities of $133.3 million after taking into account $108.5 million of letters of credit drawn against our revolving credit facilities. Our available cash is held in accounts at third-party financial institutions. To date, we have experienced no loss or lack of access to our invested cash or cash equivalents; however, we can provide no assurances that access to its invested cash or cash equivalents will not be impacted by adverse conditions in the financial markets. During the six months ended June 30, 2015, we maintained liquidity sufficient to meet our working capital, capital expenditure and development activities.
We entered into agreements and term sheets with our major REIT partners in connection with a series of facility acquisitions, divestitures, closures and rent-prepayments. The transactions currently contemplated involve 21 facility
54
acquisitions and 12 facility divestitures or closures. The aggregate invested capital is estimated at $295 million, including $256 million of facility acquisitions, resulting in $35 million in annual rent reductions. We intend to finance approximately 60% of the total cost via mortgage financing, with the balance financed with non-core asset sale proceeds and/or capital raising activities. Upon reaching definitive agreements with our REIT partners, we expect the majority of the transactions will close in stages during 2016. To date, consummated REIT transactions include three facility divestitures and rent-prepayments and one facility acquisition, which resulted in no material impact to EBITDAR and $6.0 million in annual rent reductions.
In connection with an initiative to participate in the Chinese market, we recently opened a health and wellness Vitality Center in Phoenix City, Zengcheng, China, the first of its kind in China. We plan to open a second facility, Qinhuangdao Spring of Power Center, an in-patient rehabilitation center with the potential for 300 licensed beds in the first quarter of 2016. Also, on April 9, 2015, we signed a memorandum of understanding with intent to enter into a joint venture agreement with BangEr Orthopedic Hospital Group to open post-acute in-patient and out-patient rehab services in each of its 11 hospitals in China.
Off Balance Sheet Arrangements
We had outstanding letters of credit of $108.5 million under our letter of credit sub-facility on our revolving credit facilities as of June 30, 2015. These letters of credit are principally pledged to landlords and insurance carriers as collateral. We are not involved in any other off-balance-sheet arrangements that have or are reasonably likely to have a material current or future impact on our financial condition, changes in financial condition, revenue or expense, results of operations, liquidity, capital expenditures, or capital resources.
Contractual Obligations
The following table sets forth our contractual obligations, including principal and interest, but excluding non-cash amortization of discounts or premiums established on these instruments, as of June 30, 2015 (in thousands):
|
|
|
|
|
|
|
|
|
|
|
|
|
|
|
|
|
|
|
|
|
|
|
|
|
|
|
|
|
|
|
|
|
More than |
|
|
|
|
|
Total |
|
1 Yr. |
|
2-3 Yrs. |
|
4-5 Yrs. |
|
5 Yrs. |
|
|||||
|
Revolving credit facilities |
|
$ |
343,360 |
|
$ |
10,988 |
|
$ |
21,975 |
|
$ |
310,397 |
|
$ |
— |
|
|
Term loan facility |
|
|
277,106 |
|
|
35,038 |
|
|
242,068 |
|
|
— |
|
|
— |
|
|
Real estate bridge loan |
|
|
419,873 |
|
|
33,539 |
|
|
386,334 |
|
|
— |
|
|
— |
|
|
HUD insured loans |
|
|
170,841 |
|
|
5,463 |
|
|
10,926 |
|
|
10,926 |
|
|
143,526 |
|
|
Mortgages and other secured debt (recourse) |
|
|
14,092 |
|
|
1,004 |
|
|
2,007 |
|
|
11,081 |
|
|
— |
|
|
Mortgages and other secured debt (non-recourse) |
|
|
61,014 |
|
|
3,336 |
|
|
17,863 |
|
|
4,909 |
|
|
34,906 |
|
|
Financing obligations |
|
|
11,222,552 |
|
|
264,362 |
|
|
553,195 |
|
|
585,196 |
|
|
9,819,799 |
|
|
Capital lease obligations |
|
|
3,893,830 |
|
|
102,896 |
|
|
192,837 |
|
|
197,131 |
|
|
3,400,966 |
|
|
Operating lease obligations |
|
|
1,026,592 |
|
|
142,114 |
|
|
277,513 |
|
|
266,036 |
|
|
340,929 |
|
|
|
|
$ |
17,429,260 |
|
$ |
598,740 |
|
$ |
1,704,718 |
|
$ |
1,385,676 |
|
$ |
13,740,126 |
|
Item 3. Quantitative and Qualitative Disclosures About Market Risk
In the normal course of business, our operations are exposed to risks associated with fluctuations in interest rates. To the extent these interest rates increase, our interest expense will increase, which will make our interest payments and funding other fixed costs more expensive, and our available cash flow may be adversely affected. We routinely monitor risks associated with fluctuations in interest rates and consider the use of derivative financial instruments to hedge these exposures. We do not enter into derivative financial instruments for trading or speculative purposes nor do we enter into energy or commodity contracts.
55
Interest Rate Exposure—Interest Rate Risk Management
Our term loan facility, real estate bridge loan and revolving credit facilities expose us to variability in interest payments due to changes in interest rates. As of June 30, 2015, there is no derivative financial instrument in place to limit that exposure.
The table below presents the principal amounts, weighted-average interest rates and fair values by year of expected maturity to evaluate Genesis’ expected cash flows and sensitivity to interest rate changes:
|
|
|
|
|
|
|
|
|
|
|
|
|
|
|
|
|
|
|
|
|
|
|
|
|
|
|
|
|
|
Twelve Months Ending June 30, |
|
||||||||||||||||||||||
|
|
|
2016 |
|
2017 |
|
2018 |
|
2019 |
|
2020 |
|
Thereafter |
|
Total |
|
Fair Value |
|
||||||||
|
|
|
|
|
|
|
|
|
|
|
|
|
|
|
|
|
|
|
|
|
|
|
|
|
|
|
|
Fixed-rate debt |
|
$ |
2,733 |
|
$ |
2,852 |
|
$ |
2,976 |
|
$ |
2,993 |
|
$ |
3,762 |
|
$ |
110,559 |
|
$ |
125,875 |
|
$ |
140,740 |
|
|
Average interest rate (1) |
|
|
4.3 |
% |
|
4.3 |
% |
|
4.3 |
% |
|
4.3 |
% |
|
4.2 |
% |
|
4.4 |
% |
|
|
|
|
|
|
|
Variable-rate debt (2) |
|
$ |
13,372 |
|
$ |
373,402 |
|
$ |
217,292 |
|
$ |
10,052 |
|
$ |
293,000 |
|
$ |
— |
|
$ |
907,118 |
|
$ |
911,144 |
|
|
Average interest rate (1) |
|
|
9.5 |
% |
|
9.8 |
% |
|
9.7 |
% |
|
1.9 |
% |
|
3.5 |
% |
|
— |
% |
|
|
|
|
|
|
|
(1) |
Based on one month LIBOR of 0.19% on June 30, 2015. |
|
(2) |
Excludes unamortized original issue discounts and debt premiums which amortize through interest expense on a non-cash basis over the life of the instrument. |
The new revolving credit facilities consist of a senior secured, asset-based revolving credit facility of up to $550 million under three separate tranches: Tranche A-1, Tranche A-2 and FILO Tranche. Interest accrues at a per annum rate equal to either (x) a base rate (calculated as the highest of the (i) prime rate, (ii) the federal funds rate plus 3.00%, or (iii) LIBOR plus the excess of the applicable margin between LIBOR loans and base rate loans) plus an applicable margin or (y) LIBOR plus an applicable margin. The applicable margin is based on the level of commitments for all three tranches, and in regards to LIBOR loans (i) for Tranche A-1 ranges from 3.25% to 2.75%; (ii) for Tranche A-2 ranges from 3.00% to 2.50%; and (iii) for FILO Tranche is 5.00%. The applicable margin with respect to base rate borrowings for Tranche A-1, Tranche A-2 and FILO were 3.00%, 2.00%, and 4.00%, respectively, at June 30, 2015. The applicable margin with respect to LIBOR borrowings for Tranche A-1, Tranche A-2 and FILO were 2.00%, 3.00%, and 5.00%, respectively, at June 30, 2015.
Borrowings under the term loan facility bear interest at a rate per annum equal to the applicable margin plus, at our option, either (1) LIBOR determined by reference to the costs of funds for Eurodollar deposits for the interest period relevant to such borrowings, or (2) a base rate determined by reference to the highest of (a) the lender defined prime rate, (b) the federal funds rate effective plus one half of one percent and (c) LIBOR described in sub clause (1) plus 1.0%. LIBOR based loans are subject to an interest rate floor of 1.5% and base rate loans are subject to a floor of 2.5%. The applicable margin with respect to LIBOR borrowings was 8.5% at June 30, 2015.
Borrowings under the real estate bridge loan bear interest at a rate per annum equal to the sum of (1) LIBOR, defined as greater of (a) 0.50% per annum or (b) the one-month duration LIBOR for an amount comparable to loan amount according to a lender approved reference bank, (2) the applicable margin and (3) 675 basis points (BPS). The applicable margin escalates every 90 days after the initial 149 days of the two year term. The margin ranges from 0 BPS to 650 BPS in the initial term, 675 and up to 700 BPS if a second renewal term is opted for. The applicable interest rate on this loan was 7.25% as of June 30, 2015.
A 1% increase in the applicable interest rate on our variable-rate debt would result in an approximately $9.0 million increase in our annual interest expense.
56
Item 4. Controls and Procedures
Disclosure Controls and Procedures
As required by Rules 13a-15(e) and 15d-15(e) under the Securities Exchange Act of 1934, as amended (the Exchange Act), management has evaluated, with the participation of our Chief Executive Officer and Chief Financial Officer, the effectiveness of our disclosure controls and procedures as of the end of the period covered by this report.
Disclosure controls and procedures refer to controls and other procedures designed to ensure that information required to be disclosed in the reports we file or submit under the Exchange Act is recorded, processed, summarized and reported, within the time periods specified in the rules and forms of the SEC. Disclosure controls and procedures include, without limitation, controls and procedures designed to ensure that information required to be disclosed by us in our reports that we file or submit under the Exchange Act is accumulated and communicated to management, including our chief executive officer and chief financial officer, as appropriate to allow timely decisions regarding our required disclosure. In designing and evaluating our disclosure controls and procedures, management recognizes that any controls and procedures, no matter how well designed and operated, can provide only reasonable assurance of achieving the desired control objectives, and management was required to apply its judgment in evaluating and implementing possible controls and procedures.
We conducted an evaluation, under the supervision and with the participation of our Chief Executive Officer and Chief Financial Officer, of the effectiveness of the design and operation of our disclosure controls and procedures in accordance with the Exchange Act as of the end of the period covered by this report. Based upon their evaluation, the Chief Executive Officer and Chief Financial Officer have concluded that, as of end of the period covered by this report, the disclosure controls and procedures were designed to provide reasonable assurance of achieving their objectives and were effective at that reasonable assurance level.
Changes in Internal Control Over Financial Reporting
Management determined that there were no changes in our internal control over financial reporting that occurred during the quarter covered by this report that have materially affected, or are reasonably likely to materially affect, our internal control over financial reporting.
For information regarding certain pending legal proceedings to which we are a party or our property is subject, see Note 11, “Commitments and Contingencies—Legal Proceedings,” to our consolidated financial statements included elsewhere in this report, which is incorporated herein by reference.
There have been no material changes to the risk factors disclosed in Item 1A, “Risk Factors,” of our Annual Report on Form 10-K for the fiscal year ended December 31, 2014 filed with the SEC on February 20, 2015.
Item 2. Unregistered Sales of Equity Securities and Use of Proceeds
None.
Item 3. Defaults Upon Senior Securities
None.
57
Item 4. Mine Safety Disclosures
None.
None.
(a)Exhibits.
|
Number |
|
Description |
|
10.1 |
Asset Purchase Agreement dated as of June 11, 2015 by and among Revera Assisted Living, Inc. and its affiliates named therein as Sellers, 101 Development Group, LLC as Buyer and Genesis Healthcare, Inc. as Guarantor |
|
10.2* |
Employment Agreement dated May 28, 2015 by and between Genesis Administrative Services LLC and Laurie Thomas |
|
10.3* |
Genesis Healthcare, Inc. Amended and Restated 2015 Omnibus Equity Incentive Plan |
|
10.4* |
Genesis Healthcare, Inc. Deferred Compensation Plan |
|
10.5* |
Form of Restricted Stock Unit Agreement to be entered into between Genesis Healthcare, Inc. and its executive officers |
|
10.6* |
Form of Restricted Stock Unit Agreement to be entered into between Genesis Healthcare, Inc. and its non-employee directors |
|
31.1 |
Certification of Principal Executive Officer pursuant to Rule 13a-14(a) and 15d-14(a), as adopted pursuant to Section 302 of the Sarbanes-Oxley Act of 2002 |
|
31.2 |
Certification of Principal Financial Officer pursuant to Rule 13a-14(a) and 15d-14(a), as adopted pursuant to Section 302 of the Sarbanes-Oxley Act of 2002 |
|
32** |
Certifications pursuant to 18 U.S.C. Section 1350, as adopted pursuant to Section 906 of the Sarbanes-Oxley Act of 2002 |
|
101.INS |
XBRL Instance Document |
|
101.SCH |
XBRL Taxonomy Extension Schema Document |
|
101.CAL |
XBRL Taxonomy Extension Calculation Linkbase Document |
|
101.DEF |
XBRL Taxonomy Extension Definition Linkbase Document |
|
101.LAB |
XBRL Taxonomy Extension Labels Linkbase Document |
|
101.PRE |
XBRL Taxonomy Extension Presentation Linkbase Document |
________________
|
* |
Management contract or compensatory plan or arrangement |
|
** |
Furnished herewith and not “filed” for purposes of Section 18 of the Securities Exchange Act of 1934, as amended |
58
Pursuant to the requirements of the Securities Exchange Act of 1934, the registrant has duly caused this report to be signed on its behalf by the undersigned thereunto duly authorized.
|
|
|
GENESIS HEALTHCARE, INC. |
|
|
|
|
|
|
|
Date: |
August 10, 2015 |
By |
/S/ GEORGE V. HAGER, JR. |
|
|
|
|
George V. Hager, Jr. |
|
|
|
|
Chief Executive Officer |
|
|
|
|
|
|
Date: |
August 10, 2015 |
By |
/S/ THOMAS DIVITTORIO |
|
|
|
|
Thomas DiVittorio |
|
|
|
|
Chief Financial Officer |
|
|
|
|
(Principal Financial Officer and Authorized Signatory) |
59
|
Number |
|
Description |
|
10.1 |
Asset Purchase Agreement dated as of June 11, 2015 by and among Revera Assisted Living, Inc. and its affiliates named therein as Sellers, 101 Development Group, LLC as Buyer and Genesis Healthcare, Inc. as Guarantor |
|
10.2* |
Employment Agreement dated May 28, 2015 by and between Genesis Administrative Services LLC and Laurie Thomas |
|
10.3* |
Genesis Healthcare, Inc. Amended and Restated 2015 Omnibus Equity Incentive Plan |
|
10.4* |
Genesis Healthcare, Inc. Deferred Compensation Plan |
|
10.5* |
Form of Restricted Stock Unit Agreement to be entered into between Genesis Healthcare, Inc. and its executive officers |
|
10.6* |
Form of Restricted Stock Unit Agreement to be entered into between Genesis Healthcare, Inc. and its non-employee directors |
|
31.1 |
Certification of Principal Executive Officer pursuant to Rule 13a-14(a) and 15d-14(a), as adopted pursuant to Section 302 of the Sarbanes-Oxley Act of 2002 |
|
31.2 |
Certification of Principal Financial Officer pursuant to Rule 13a-14(a) and 15d-14(a), as adopted pursuant to Section 302 of the Sarbanes-Oxley Act of 2002 |
|
32** |
Certifications pursuant to 18 U.S.C. Section 1350, as adopted pursuant to Section 906 of the Sarbanes-Oxley Act of 2002 |
|
101.INS |
XBRL Instance Document |
|
101.SCH |
XBRL Taxonomy Extension Schema Document |
|
101.CAL |
XBRL Taxonomy Extension Calculation Linkbase Document |
|
101.DEF |
XBRL Taxonomy Extension Definition Linkbase Document |
|
101.LAB |
XBRL Taxonomy Extension Labels Linkbase Document |
|
101.PRE |
XBRL Taxonomy Extension Presentation Linkbase Document |
________________
|
* |
Management contract or compensatory plan or arrangement |
|
** |
Furnished herewith and not “filed” for purposes of Section 18 of the Securities Exchange Act of 1934, as amended |
60