Attached files
| file | filename |
|---|---|
| EX-32 - EX-32 - Genesis Healthcare, Inc. | gen-20151231xex32.htm |
| EX-10.31 - EX-10.31 - Genesis Healthcare, Inc. | gen-20151231ex10314758e.htm |
| EX-21 - EX-21 - Genesis Healthcare, Inc. | gen-20151231ex21dbed5b3.htm |
| EX-31.1 - EX-31.1 - Genesis Healthcare, Inc. | gen-20151231ex31182cae8.htm |
| EX-31.2 - EX-31.2 - Genesis Healthcare, Inc. | gen-20151231ex31242ec49.htm |
| EX-10.22 - EX-10.22 - Genesis Healthcare, Inc. | gen-20151231ex102298778.htm |
| EX-10.30 - EX-10.30 - Genesis Healthcare, Inc. | gen-20151231ex10309caac.htm |
| EX-23.1 - EX-23.1 - Genesis Healthcare, Inc. | gen-20151231ex231cb45d4.htm |
| EX-10.29 - EX-10.29 - Genesis Healthcare, Inc. | gen-20151231ex1029fcf77.htm |
| EX-10.28 - EX-10.28 - Genesis Healthcare, Inc. | gen-20151231ex1028f7038.htm |
UNITED STATES
SECURITIES AND EXCHANGE COMMISSION
Washington, D.C. 20549
FORM 10-K
(Mark One)
|
ANNUAL REPORT PURSUANT TO SECTION 13 OR 15(d) OF THE SECURITIES EXCHANGE ACT OF 1934 |
For the Fiscal Year Ended December 31, 2015
OR
|
☐ |
TRANSITION REPORT PURSUANT TO SECTION 13 OR 15(d) OF THE SECURITIES EXCHANGE ACT OF 1934 |
Commission File Number 001-33459
Genesis Healthcare, Inc.
(Exact Name of Registrant as Specified in its Charter)
|
Delaware |
|
20-3934755 |
|
(State of Incorporation) |
|
(I.R.S. Employer |
|
|
|
Identification Number) |
|
101 East State Street |
|
|
|
Kennett Square, Pennsylvania |
|
19348 |
|
(Address of Principal Executive Offices) |
|
(Zip Code) |
Registrant’s telephone number: (610) 444-6350
Securities registered pursuant to Section 12(b) of the Act:
|
Class A Common Stock, $0.001 par value per share |
|
New York Stock Exchange |
|
(Title of each class) |
|
(Name of each exchange on which registered) |
Securities registered pursuant to Section 12(g) of the Act: None
Indicate by check mark if the registrant is a well-known seasoned issuer, as defined in Rule 405 of the Securities Act. Yes ◻ No ☑
Indicate by check mark if the registrant is not required to file reports pursuant to Section 13 or Section 15(d) of the Act. Yes ◻ No ☑
Indicate by check mark whether the registrant (1) has filed all reports required to be filed by Section 13 or 15(d) of the Securities Exchange Act of 1934 during the preceding 12 months (or for such shorter period that the registrant was required to file such reports), and (2) has been subject to such filing requirements for the past 90 days. Yes ☑ No ◻
Indicate by check mark whether the registrant has submitted electronically and posted on its corporate Web site, if any, every Interactive Data File required to be submitted and posted pursuant to Rule 405 of Regulation S-T during the preceding 12 months (or for such shorter period that the registrant was required to submit and post such files). Yes ☑ No ◻
Indicate by check mark if disclosure of delinquent filers pursuant to Item 405 of Regulation S-K is not contained herein, and will not be contained, to the best of registrant’s knowledge, in definitive proxy or information statements incorporated by reference in Part III of this Form 10-K or any amendment to this Form 10-K. ☑
Indicate by check mark whether the registrant is a large accelerated filer, an accelerated filer, a non-accelerated filer or a smaller reporting company. See definitions of "large accelerated filer," "accelerated filer" and "smaller reporting company" in Rule 12b-2 of the Exchange Act:
|
Large accelerated filer |
◻ |
Accelerated filer |
||
|
Non-accelerated filer |
◻ |
Smaller Reporting Company |
◻ |
|
Indicate by check mark whether the registrant is a shell company (as defined in Rule 12b-2 of the Act). Yes ◻ No ☑
As of June 30, 2015, the last business day of the registrant's most recently completed second fiscal quarter, the aggregate market value of the shares of Class A common stock, par value $0.001 per share, and Class B common stock, par value $0.001 per share, held by non-affiliates of the registrant, computed based on the closing sale price of $6.60 per share on June 30, 2015, as reported by The New York Stock Exchange, was approximately $485.7 million. The aggregate number of shares held by non-affiliates is calculated by excluding all shares held by executive officers, directors and holders known to hold 5% or more of the voting power of the registrant’s common stock. As of March 11, 2016, there were 73,593,732 shares of the registrant’s Class A common stock issued and outstanding, 15,511,603 shares of the registrant’s Class B common stock issued and outstanding, and 64,449,379 shares of the registrants Class C common stock, par value $0.001 per share, issued and outstanding.
Documents Incorporated by Reference:
The information called for by Part III is incorporated by reference to the Definitive Proxy Statement for the 2016 Annual Meeting of Stockholders of the Registrant which will be filed with the U.S. Securities and Exchange Commission not later than April 30, 2016.
Genesis Healthcare, Inc.
Annual Report
|
|
|
|
Page |
|
|
|
|
|
Number |
|
|
Forward-Looking Statements |
|
|
1 | |
|
|
|
|
|
|
|
|
|
|
|
|
|
|
1 | |||
|
|
|
|
|
|
|
|
20 | |||
|
|
|
|
|
|
|
|
41 | |||
|
|
|
|
|
|
|
|
41 | |||
|
|
|
|
|
|
|
|
43 | |||
|
|
|
|
|
|
|
|
43 | |||
|
|
|
|
|
|
|
PART II |
|
|
|
|
|
|
|
|
|
|
|
|
43 | |||
|
|
|
|
|
|
|
|
44 | |||
|
|
|
|
|
|
|
Management’s Discussion and Analysis of Financial Condition and Results of Operations |
|
45 | ||
|
|
|
|
|
|
|
|
76 | |||
|
|
|
|
|
|
|
|
78 | |||
|
|
|
|
|
|
|
Changes in and Disagreements with Accountants on Accounting and Financial Disclosure |
|
78 | ||
|
|
|
|
|
|
|
|
78 | |||
|
|
|
|
|
|
|
|
83 | |||
|
|
|
|
|
|
|
PART III |
|
|
|
|
|
|
|
|
|
|
|
|
83 | |||
|
|
|
|
|
|
|
|
83 | |||
|
|
|
|
|
|
|
Security Ownership of Certain Beneficial Owners and Management and Related Stockholder Matters |
|
83 | ||
|
|
|
|
|
|
|
Certain Relationships and Related Transactions, and Director Independence |
|
83 | ||
|
|
|
|
|
|
|
|
83 | |||
|
|
|
|
|
|
|
PART IV |
|
|
|
|
|
|
|
|
|
|
|
|
83 | |||
|
|
|
85 | ||
Statements made by us in this report and in other reports and statements released by us that are not historical facts constitute "forward-looking statements" within the meaning of the federal securities laws, including the Private Securities Reform Act of 1995. You can identify these statements by the fact that they do not relate strictly to historical or current facts. These statements contain words such as "may," "will," "project," "might," "expect," "believe," "anticipate," "intend," "could," "would," "estimate," "continue," "pursue, "plans" or "prospect," or the negative or other variations thereof or comparable terminology. These forward-looking statements are necessarily estimates and expectations reflecting the best judgment of our senior management based on our current estimates, expectations, forecasts and projections, and include comments that express our current opinions about trends and factors that may impact future operating results. Such statements rely on a number of assumptions concerning future events, many of which are outside of our control, and involve known and unknown risks and uncertainties that could cause our actual results, performance or achievements, or industry results, to differ materially from any anticipated future results, performance or achievements, expressed or implied by such forward-looking statements. Any such forward-looking statements, whether made in this report or elsewhere, should be considered in the context of the various disclosures made by us about our business and other matters. These risks and uncertainties include, but are not limited to, those described in Item 1A. “Risk Factors" and elsewhere in this report and those described from time to time in our future reports filed with the U.S. Securities and Exchange Commission (SEC).
Any forward-looking statements contained herein are made only as of the date of this report. We expressly disclaim any duty to update the forward-looking statements and other information contained in this report, except as required by law. Investors are cautioned not to place undue reliance on these forward-looking statements.
Genesis Healthcare, Inc. (Genesis) is a holding company with subsidiaries that, on a combined basis, comprise one of the nation's largest post-acute care providers. As used in this report, the terms “we,” “us,” “our,” and the “Company,” and similar terms, refer collectively to Genesis and its consolidated subsidiaries, unless the context requires otherwise. We offer inpatient services through our network of skilled nursing and assisted/senior living facilities. We also supply rehabilitation and respiratory therapy to more than 1,700 locations in 45 states and the District of Columbia as of December 31, 2015. In addition, we provide a full complement of administrative and consultative services to our affiliated operators through our administrative services subsidiary and to third-party operators with whom we contract through our management services subsidiary. There were 49 facilities subject to such management services agreements with unaffiliated or jointly owned skilled nursing facility operators as of as of December 31, 2015. All of our healthcare operating subsidiaries focus on providing quality care to the people we serve, and our skilled nursing facility subsidiaries, which comprise the largest portion of our consolidated business, have a strong commitment to treating patients who require a high level of skilled nursing care and extensive rehabilitation therapy, whom we refer to as high-acuity patients.
Operations
As of December 31, 2015, we offered inpatient services through our network of 531 skilled nursing and assisted/senior living facilities across 34 states, consisting of 475 skilled nursing facilities and 56 stand-alone assisted/senior living facilities. Of the 531 facilities, 411 are leased, 71 are owned, 43 are managed and six are joint ventures. Collectively, these skilled nursing and assisted/senior living facilities have 62,031 licensed beds, approximately 63% of which are concentrated in the states of California, Connecticut, Maryland, Massachusetts, New Hampshire, New Jersey, Pennsylvania, Texas and West Virginia. We also own five skilled nursing facilities in California that we lease to an unaffiliated third party operator. See Item 2. “Properties” for the full count of facilities by state. Our skilled nursing and assisted/senior living facilities are generally clustered in large urban or suburban markets. We leased 77% of our facilities as of December 31, 2015. For the year ended December 31, 2015, we generated approximately 82% of our revenue from our skilled nursing facilities. The remainder of our revenue is generated from our assisted/senior living services, rehabilitation therapy services provided to third-party facilities, and other ancillary services.
1
Our services focus primarily on the medical and physical issues facing elderly patients and are provided by our skilled nursing facilities, assisted/senior living communities, integrated and third-party rehabilitation therapy business, and other ancillary services.
As of December 31, 2015, we had three reportable operating segments: (1) inpatient services, which includes the operation of skilled nursing facilities and assisted/senior living facilities and is the largest portion of our business; (2) rehabilitation therapy services, which includes our integrated and third-party rehabilitation and respiratory therapy services; and (3) all other services. For the year ended December 31, 2015, the inpatient services segment generated approximately 85% of our revenue, the rehabilitation therapy services segment generated approximately 12% of our revenue and all other services accounted for the balance of our revenue. For additional information regarding the financial performance of our reportable operating segments, see Item 7. “Management's Discussion and Analysis of Financial Condition and Results of Operations” and Note 6, "Segment Information,"” in the notes to our consolidated financial statements included elsewhere in this report.
Inpatient Services Segment
Skilled Nursing Facilities
As of December 31, 2015, our skilled nursing facilities provided skilled nursing care at 475 regionally clustered facilities, having 56,575 licensed beds, in 34 states. We have developed programs for, and actively market our services to, high-acuity patients who are typically admitted to our facilities as they recover from strokes, other neurological conditions, cardiovascular and respiratory ailments, joint replacements and other muscular or skeletal disorders.
We use interdisciplinary teams of experienced medical professionals to provide services prescribed by physicians. These teams include registered nurses, licensed practical nurses, certified nursing assistants and other professionals who provide individualized comprehensive nursing care. Many of our skilled nursing facilities are equipped to provide specialty care, such as on-site dialysis, ventilator care, cardiac and pulmonary management. We also provide standard services to each of our skilled nursing patients, including room and board, special nutritional programs, social services, recreational activities and related healthcare and other services.
Our PowerBack Rehabilitation branded facilities are 100% short stay skilled nursing facilities which deliver a comprehensive rehabilitation regimen in accommodations specifically designed to serve high-acuity patients. We believe that having PowerBack Rehabilitation facilities enables us to more effectively serve higher acuity patients and achieve a higher skilled mix than a traditional hybrid skilled nursing facility, which in turn results in higher reimbursement rates. Skilled mix is the average daily number of Medicare and managed care patients we serve at our skilled nursing facilities divided by the average daily number of total patients we serve at our skilled nursing facilities. As of December 31, 2015, we operated 11 PowerBack Rehabilitation facilities with 1,062 beds.
As of December 31, 2015, we have 49 facilities subject to management agreements with unaffiliated facility operators. The income associated with the management services provided to the third-party facility operator is included in inpatient services in our segment reporting as services are performed primarily by personnel supporting the inpatient services segment.
Our administrative service company provides a full complement of administrative and consultative services to our affiliated operators to allow them to better focus on the delivery of healthcare services.
Assisted/Senior Living Facilities
We complement our skilled nursing care business by providing assisted/senior living services at 56 stand-alone facilities with 3,985 beds and offer an additional 1,471 assisted/senior living beds within our skilled nursing facilities as of December 31, 2015. Our assisted/senior living facilities provide residential accommodations, activities, meals, security, housekeeping and assistance in the activities of daily living to seniors who are independent or who require some support, but not the level of nursing care provided in a skilled nursing facility.
Rehabilitation Therapy Services
As of December 31, 2015, we provided rehabilitation therapy services, including speech-language pathology (SLP), physical therapy (PT), occupational therapy (OT) and respiratory therapy, to more than 1,700 healthcare locations in 45 states and the District of Columbia, including 471 facilities operated by us. We provide rehabilitation therapy services at our skilled nursing facilities as part of an integrated service offering in connection with our skilled nursing
2
care. In addition to our rehabilitation therapy services in the United States, we have recently entered the Chinese market with initiatives to develop a rehabilitation therapy care delivery model and other services. The revenues generated and long-lived assets associated with this expansion are immaterial as of December 31, 2015. We believe that an integrated approach to treating high-acuity patients enhances our ability to achieve successful patient outcomes and enables us to identify and treat patients who can benefit from our rehabilitation therapy services. We believe hospitals and physician groups often refer high-acuity patients to our skilled nursing facilities because they recognize the value of an integrated approach to providing skilled nursing care and rehabilitation therapy services.
We believe that we have also established a strong reputation as a premium provider of rehabilitation therapy services to third-party skilled nursing operators in our local markets, with a recognized ability to provide these services to high-acuity patients. Our approach to providing rehabilitation therapy services for third-party operators emphasizes quality treatment and successful clinical outcomes.
Other Services
As of December 31, 2015, we provided an array of other specialty medical services, including physician services, staffing services, hospice and home health services, and other healthcare related services.
Industry Trends
Dynamic changes in the healthcare market are reshaping the landscape for post-acute and long-term care support services. Demand for services is significantly driven by changing demographics. U.S. Census data document that our nation’s population is growing older and that within the segment of the population that is 65 years of age or older, declining mortality rates are causing a significant rise in the population that is 85 years of age or older. The prevalence of disability and functional impairment is age-related.
Over the past several decades, market force changes across the healthcare spectrum have realigned the capabilities and responsiveness of health providers. Payment incentives have reshaped the role of the acute care sector imposing an increased emphasis on shorter lengths of inpatient stays. This has shifted the focus of rehabilitative and recuperative services to post-acute providers. Over 35% of hospital discharges require further medical intervention. For those patients over the age of 70 years requiring follow-through care, a significant portion are discharged to the post-acute/skilled nursing sector.
The post-acute/skilled nursing sector has expanded clinical and rehabilitative capacities to meet this demand. Among the major changes in the delivery of long-term care services is this rising demand for short stay/post-acute care. Skilled nursing facilities have strengthened clinical specialization delivering high intensity rehabilitation, restorative care and specialized clinical programs with emphasis on successful discharges to home- and community-based settings.
In addition to responding to the rehabilitative and restorative needs of patients discharged from the acute care sector, center-based programs continue to provide medical, social and specialized supportive services for those patients whose medical and functional conditions are such that they require nursing home care and protective services. Programs have been developed to provide dementia care, palliative and hospice services and long-stay home-life environments.
Our post-acute/long-term care supportive services sector is responding to the broader trends reshaping healthcare delivery: (i) value, (ii) cost efficiencies, (iii) measured quality and outcomes, (iv) care coordinating and integration, and (v) patient/resident centered care. The post-acute care/skilled nursing and rehabilitation sectors are investing efforts and energies to demonstrate value, to strengthen care efficiencies and to develop measurable benchmarks for performance.
The industry has evolved in recent years, which we believe has led to a number of favorable improvements in the industry, as described below:
Aging Demographic Trends: According to the U.S. Department of Health and Human Services, 70% of the U.S. population over the age of 65 can expect to use some form of post-acute care during their lives. Demographic trends are expected to continue to drive an increase in post-acute care spending as the populations of people in the U.S. over the ages
3
of 65 and 85 in the U.S. are expected to increase from approximately 43 million and six million people in 2012, respectively, to approximately 80 million and 14 million people in 2040, respectively. As the average life expectancy continues to increase and as the elderly population becomes a greater proportion of the overall U.S. population, management expects there to be an increasing demand for nursing and post-acute care.
Favorable Supply/Demand Dynamics: As demand and overall expenditures for post-acute services continue to grow, the supply of skilled nursing facilities has been decreasing, partially due to the increase in required clinical capabilities to care for higher acuity patients and the presence of state Certificate of Need (CON) laws, which may restrict the increase of new beds and services at existing facilities and/or limit the expansion and construction of new facilities. We expect that the supply and demand balance in the skilled nursing industry will continue to improve due to the shift of patient care to lower cost settings, an aging population and increasing life expectancies.
Shift of Patients to Quality Care in Cost-Effective Settings: As a result of rising U.S. healthcare costs, government regulations and payor preferences have led to a shift in the provision of care for higher acuity patients to less costly settings. Government sponsored programs, private insurance companies and other third-party payors have recognized that treating patients requiring complex medical care in skilled nursing facilities is a cost-effective alternative to receiving treatment in an inpatient rehabilitation facility (IRF) or long-term acute care (LTAC) hospital. This dynamic makes skilled nursing facilities an attractive provider for payors and acute care hospitals seeking cost effective quality care settings when discharging patients. As a result, skilled nursing facilities are generally serving a larger population of higher-acuity patients than in the past.
Growth of Privatization of Medicare and Medicaid through Managed Care Programs: As the expansion of Medicaid and Medicare continues, we expect migration towards managed care programs because managed Medicaid and Medicare programs improve access to coordinated healthcare services, including preventive care, and are designed to control healthcare costs. We believe post-acute providers like ours with sufficient size and scale to provide clinically coordinated care across the entire post-acute care continuum are well positioned to obtain more referrals and become a provider of choice for these payors.
Accountable Care Organizations and Reimbursement Reform: A significant goal of federal healthcare reform is to transform the delivery of healthcare by changing reimbursement for healthcare services to hold providers accountable for the cost and quality of care provided. Medicare and many commercial third party payors are implementing Accountable Care Organization (ACO) models in which groups of providers share in the benefit and risk of providing care to an assigned group of individuals. Other reimbursement methodology reforms include value-based purchasing, in which a portion of provider reimbursement is redistributed based on relative performance on designated economic, clinical quality, and patient satisfaction metrics. In addition, the Centers for Medicare & Medicaid Services (CMS) is implementing demonstration and mandatory programs to bundle acute care and post-acute care reimbursement to hold providers accountable for costs across a broader continuum of care. These reimbursement methodologies and similar programs are likely to continue and expand, both in public and commercial health plans. On January 26, 2015, CMS announced its goal to have 30% of Medicare payments for quality and value through alternative payment models such as ACOs or bundled payments by 2016 and up to 50% by the end of 2018. Providers who respond successfully to these trends and are able to deliver quality care at lower cost are likely to benefit financially.
Acquisition Opportunities: The skilled nursing industry is large and highly fragmented, characterized predominantly by numerous local and regional providers. We believe this fragmentation provides significant acquisition opportunities for us.
Revenue Sources
We derive revenue primarily from the Medicaid and Medicare programs, managed care and commercial insurance payors and private pay patients.
4
Medicaid.
Medicaid typically covers patients that require standard room and board services, and provides reimbursement rates that are generally lower than rates earned from other sources. Medicaid is a state-administered program financed by state funds and matching federal funds. Medicaid programs are administered by the states and their political subdivisions. Medicaid programs generally provide health benefits for qualifying individuals, and may supplement Medicare benefits for persons aged 65 and older meeting financial eligibility. Medicaid reimbursement formulas are established by each state with the approval of the federal government in accordance with federal guidelines. Seniors who enter skilled nursing facilities as private pay clients can become eligible for Medicaid once they have substantially depleted their assets. Medicaid is the largest source of funding for nursing home facilities.
Reimbursement varies from state to state and is based upon a number of different systems, including cost-based, prospective payment and negotiated rate systems. Rates are subject to statutory and regulatory changes and interpretations and rulings by individual state agencies.
During recent years, a number of states have advanced initiatives expanding managed care programs to include managing long-term care support services. Some states have focused efforts towards integrating Medicare and Medicaid delivery for individuals who are dually eligible for both programs. Across the states, there are a number of pilot initiatives underway. Most of these initiatives attempt to improve integration of delivery, strengthen care management and improve cost efficiencies.
Medicare.
Medicare is a federal program that provides healthcare benefits to individuals who are 65 years of age or older or are disabled. To achieve and maintain Medicare certification, a skilled nursing facility must sign a Medicare provider agreement and meet the CMS “Conditions of Participation” on an ongoing basis, as determined in periodic facility inspections or “surveys” conducted primarily by the state licensing agency in the state where the facility is located. Medicare pays for inpatient skilled nursing facility services under the prospective payment system. The prospective payment for each beneficiary is based upon the medical condition of and care needed by the beneficiary. Medicare skilled nursing facility coverage is limited to 100 days per episode of illness for those beneficiaries who require daily care following discharge from an acute care hospital.
Medicare Part A provides for inpatient services including hospital care, skilled nursing care, hospice and home healthcare.
Medicare Part B provides for outpatient services including physician services, diagnostic services, durable medical equipment, skilled therapy services and medical supplies.
Medicare Part C is a managed care option (“Medicare Advantage”) for beneficiaries who are entitled to Part A and enrolled in Part B and are administered by commercial health insurers that contract with Medicare or Medicaid.
Medicare Part D is a benefit that provides prescription drug benefits for both Medicare and Medicare/Medicaid dual eligible patients.
Medicare reimburses our skilled nursing facilities under a prospective payment system (PPS) for a defined bundle of inpatient covered services. Medicare coverage criteria require that a beneficiary spend at least three days in an inpatient acute setting before Medicare will cover the skilled nursing service. While beneficiaries are eligible for up to 100 days per spell of illness of skilled nursing care services (defined as requiring daily skilled nursing and/or skilled rehabilitation services), current law imposes a daily co-payment after the 20th day of covered services. Under the PPS, facilities are paid a predetermined amount per patient, per day, for certain services based on the anticipated costs of treating patients. The amount to be paid is determined by classifying each patient into a resource utilization group (RUG) category that is based upon each patient's acuity level. In October 2010, the number of RUG categories was
5
expanded from 53 to 66 as part of the implementation of the RUGs IV system and the introduction of a revised and substantially expanded patient assessment tool called the minimum data set version 3.0.
Current law requires CMS to calculate an annual market basket update to the payment rates. Provisions of the Patient Protection and Affordable Care Act of 2010 (PPACA) directed the agency to reduce that payment level by a calculated multi-factor productivity adjustment. The agency also retains the authority to review and adjust payments for corrections to previous year market baskets where over/under payment exceeded 0.05% between the projected market basket and the actual performance. Annually, on a federal fiscal year basis (October 1), the agency makes its payment changes. Normally CMS issues proposed rules during April providing 60-days for stakeholder input, and issues finalized rules 60 days prior to the start of the fiscal year. If there are no substantive changes in rules and regulations, the agency has the authority to issue rate adjustments in a notice, rather than a proposed rule. The notice must be issued 60 days before the beginning of the fiscal year.
Congress has the authority to change the law governing how all providers, including skilled nursing providers, are reimbursed, and the criteria and conditions for coverage. For example, under the Budget Control Act of 201l, Congress authorized a 2% sequestration on Medicare payments to most providers. Subsequent actions by Congress extended sequestration through 2023. Indeed, during the past two years, Congress has enacted several new laws that impact how skilled nursing facilities are reimbursed under Medicare. The Protecting Access to Medicare Act of 2014 established a skilled nursing facility Value-Based Incentive/Penalty program based on hospital readmissions. The fiscal year 2016 final skilled nursing facilities PPS rules set forth the criteria for this program to be implemented by 2019. The IMPACT (Improving Medicare Post-Acute Care Transformation Act) of 2014 establishes an aggressive time-line for standardized patient assessment for post-acute providers, including skilled nursing facilities. CMS has been engaging stakeholders in developing implementation instructions.
The PPS rules for fiscal year 2016 were finalized on July 30, 2015 and published in the Federal Register on August 4, 2015. Embedded in the rules were new quality reporting requirements and instructions for establishing a value-based purchasing incentive program based on hospital-readmissions performance. CMS has not indicated whether there will be skilled nursing facility PPS rule-making for fiscal year 2017. The agency is expected to provide additional guidance regarding implementation of the IMPACT Act.
Under PPS, Medicare reimburses our skilled nursing facilities for a defined bundle of Medicare Part A services. For Medicare beneficiaries who qualify for the Medicare Part A coverage, rehabilitation services are purchased through the per diem payment. For beneficiaries who do not meet the coverage criteria for Part A services, rehabilitation services may be purchased under Medicare Part B. As discussed above, there are specific coverage and payment requirements. One of the more challenging rehabilitation requirements is that covered Part B services are limited with a payment cap by combined SLP and PT services and a separate annual cap for OT services. These caps were implemented under the authority of the Balanced Budget Amendments of 1997. On multiple occasions during the past two decades, Congress has interceded to suspend the “therapy caps” offering an “exceptions process” so claims in excess of the annualized cap can be processed.
The Middle Class Tax Relief and Job Creation Act of 2012 extended the therapy exceptions process but added a second tier cap mandating Medical Manual Review for claims submitted that exceeded $3,700 for PT and SLP services combined and another threshold of $3,700 for OT services. The Medicare Access & CHIP Reauthorization Act of 2015, which authorized payment reforms for physicians and other professional services, including the three rehabilitative therapies, included provisions not only stabilizing the professional fee schedules, but also extending the therapy cap exceptions process through December 31, 2017.
In addition to setting the payment rules for skilled nursing facility services, CMS annually adjusts its payment rules for other post-acute services including inpatient rehabilitation facilities, long-stay inpatient hospitals, home health agencies and hospice services. It is important to understand the Medicare program and its reimbursement rates and rules are subject to frequent change. These include statutory and regulatory changes, rate adjustments (including retroactive adjustments), administrative or executive orders and government funding restrictions, all of which may materially adversely affect the rates at which Medicare reimburses us for our services. Budget pressures often lead the federal
6
government to reduce or place limits on reimbursement rates under Medicare. Implementation of these and other types of measures has in the past, and could in the future, result in substantial reductions in our revenue and operating margins.
Managed Care and Commercial Insurance.
Managed care patients are insured by certain third-party entities, typically a senior HMO plan, or who are Medicare beneficiaries who have assigned their Medicare benefits to a Medicare Advantage HMO plan. Another type of insurance, long-term care insurance, is also becoming more widely available to consumers, but is not expected to contribute significantly to industry revenues in the near term.
Private and Other Payors.
Private and other payors consist primarily of individuals, family members or other third parties who directly pay for the services we provide.
Reimbursement for our Services
Reimbursement for Skilled Nursing Facilities
The majority of skilled nursing facility revenues in the U.S. come from Medicare and Medicaid, with the remainder of revenues derived from managed care and commercial insurance, other third-party sources and private pay. Typically, all patients that enter a skilled nursing facility begin as a short-term acute care patient and either get discharged, or become long-term care residents. After a patient no longer qualifies for skilled care under Medicare, the reimbursement of costs incurred by a skilled nursing facility patient will be shifted to private pay (out of pocket) resources and then Medicaid if the patient qualifies.
Historically, adjustments to reimbursement under Medicare and Medicaid have had a significant effect on our revenue and results of operations. Recently enacted, pending and proposed legislation and administrative rulemaking at the federal and state levels could have similar effects on our business. Efforts to impose reduced reimbursement rates, greater discounts and more stringent cost controls by government and other payors are expected to continue for the foreseeable future and could adversely affect our business, financial condition and results of operations. Additionally, any delay or default by the federal or state governments in making Medicare and/or Medicaid reimbursement payments could materially and adversely affect our business, financial condition and results of operations.
Reimbursement for Assisted/Senior Living Facilities
Assisted/senior living facilities generate revenues primarily from private pay sources, including third-party insurance and self pay, with only a small portion derived from government sources.
Reimbursement for Rehabilitation Services
Outside of therapy received during a Medicare Part A covered stay of up to 100 days, rehabilitation therapy services are typically reimbursed under Medicare Part B, which provides reimbursement for certain physician services, and other outpatient services, such as therapy and other services. The payments made to our rehabilitation therapy services segment for services it provides to skilled nursing and assisted living facilities are determined by negotiated patient per diem rates or a negotiated fee schedule based on the type of service rendered.
Recent Regulatory and other Governmental Actions Affecting Revenue
Skilled Nursing Facilities
On November 16, 2015, CMS finalized a new rule for mandatory Comprehensive Care for Joint Replacement (CJR) model focusing on coordinated, patient-centered care. Under this model, the hospital in which the hip or knee replacement takes place would be accountable for the costs and quality of care from the time of the surgery through 90
7
days after an “episode” of care. Depending on the hospital’s quality and cost performance during the episode, the hospital will either earn a financial reward or be required to repay Medicare for a portion of the costs. This payment will give hospitals an incentive to work with physicians, home health agencies, and nursing facilities to make sure beneficiaries receive the coordinated care they need with the goal of reducing avoidable hospitalizations and complications. The CJR program is effective on April 1, 2016 and will be in 67 geographic areas throughout the country and most hospitals in those regions will be required to participate. With the implementation of the CJR program, our Medicare revenues derived from our affiliated skilled nursing facilities and other post-acute services related to lower extremity joint replacement hospital discharges could be increased or reduced in those geographic areas identified by CMS for mandatory participation in the bundled payment program. CMS has also made provisions for skilled nursing centers that have a rating of three stars or higher for at least seven of the preceding 12 months to receive a waiver of the skilled nursing facility three-day stay requirement beginning in year two of the program.
On July 13, 2015, CMS released a proposed rule that would reform requirements for long-term care facilities, specifically skilled nursing facilities and nursing facilities, that participate in Medicare and Medicaid. The rule would reorder, clarify, and update regulations that the agency has not reviewed comprehensively since 1991. Under the proposed rule, facilities are required to 1) create interim care plans within 48 hours of admission; notify a resident’s physician after a change in status, engage in interdisciplinary care planning, have a practitioner assess the patient in-person prior to a transfer to the hospital, and improve clinical records to ensure providers have the necessary information to decide on hospitalization; 2) conduct comprehensive assessments of their staff and patient needs, apply current requirements for antipsychotic drugs to all psychotropic drugs, and require physicians to document their response to irregularities identified by consultant pharmacists; 3) conduct assessments of their resident population, implement and update periodically an infection prevention and control program, and establish an antibiotic stewardship program; 4) address requirements related to behavioral health services, ensuring facilities have adequate staffing to meet the needs of residents with mental illness and cognitive impairment; and 5) conduct assessments of their patient populations and related care needs to determine adequate staffing levels (i.e., number and skillsets) for nursing, behavioral health, and nutritional services. CMS estimates that these proposed regulations would cost facilities nearly $46.5 million in the first year and over $40.6 million in subsequent years. However, these amounts would vary considerably among organizations. In addition to the monetary costs, these regulations may create compliance issues, as state regulators and surveyors interpret requirements that are less explicit. CMS has indicated that it expects to release the final rule in September 2016.
On July 30, 2015, CMS issued its final rule outlining fiscal year 2016 Medicare payment rates for skilled nursing facilities. CMS estimates that aggregate payments to skilled nursing facilities will increase by 1.2% for fiscal year 2016. This estimated increase reflected a 2.3% market basket increase, reduced by a 0.6% forecast error adjustment and further reduced by a 0.5% multi-factor productivity adjustment required by the PPACA. This final rule also identified a new skilled nursing facility value-based purchasing program and an all-cause all-condition hospital readmission measure.
On July 31, 2014, CMS issued its final rule providing for, among other things, a net increase of 2.0% in PPS payments to skilled nursing facilities for CMS fiscal year 2015 (which began October 1, 2014) as compared to the PPS payments in CMS fiscal year 2014 (which ended September 30, 2014). The 2.0% increase is on a net basis, after the application of a 2.5% market basket increase reduced by a 0.5% multi-factor productivity adjustment required by the PPACA. There was no forecast error adjustment.
On July 31, 2013, CMS issued its final rule providing for, among other things, a net increase of 1.3% in PPS payments to skilled nursing facilities for CMS's fiscal year 2014 (which began October 1, 2013) as compared to the PPS payments in CMS's fiscal year 2013 (which ended September 30, 2013). The 1.3% increase is on a net basis, after the application of a 2.3% market basket increase reduced by a 0.5% forecast error correction and further reduced by 0.5% multi-factor productivity adjustment required by the PPACA.
In addition to determining reimbursement rates, CMS through its regulatory authority significantly shapes the healthcare landscape. Under the authority provided by PPACA and subsequent actions by the Congress, CMS has moved forward with initiatives stimulating alternative payment models, establishing new quality metrics, imposing greater transparency, and strengthening enforcement.
The CMS Centers for Medicare and Medicaid Innovations (CMI), an office established by the PPACA, has been active in stimulating alternative payment models across the care spectrum. This office designed and implemented a series of bundling demonstrations for the delivery of integrated market level care. One set of demonstrations focuses on
8
integrated post-acute care services. We and a number of other post-acute providers have stepped forward to be conveners assuming responsibility and risk for the delivery of covered services under the CMS bundling initiative. During November, 2015, CMI finalized rules for a special mandated demonstration focused on comprehensive care for joint replacement. This multi-year demonstration is expected to begin April 1. We provide services in a number of the test markets.
One of the CMS initiatives authorized by the PPACA was to improve the accuracy of nursing home staffing data. CMS has moved forward with the initiative and is planning to roll-out an electronic payroll based journal requirement effective July 1, 2016. A number of technical issues have been identified in the program that is being tested. It remains to be seen if the agency will address those issues before implementing the mandate. The success of the electronic payroll based journal will impact the accuracy of the staffing data facilities are required to provide the federal government.
In 2014, with strong support from most stakeholders, Congress enacted the IMPACT Act. The intent of this enactment was to improve the uniformity of data reporting across the post-acute sector and to move forward with a common assessment tool rationalizing the delivery of post-acute services. CMS is struggling to meet the deadlines for specific performance under the enactment. Regulatory guidance is expected.
As discussed in Item 1A. “Risk Factors”, the services we provide, the credentials of the employees providing them and the enforcement actions that post-acute nursing home and rehabilitation services are subject to are complex and constantly changing. Virtually all aspects of services provisions are regulated. Survey and certification interpretive guidelines, scope of practice acts, admission, assessment and assessment requirements are rigidly enforced.
Rehabilitation Services
A portion of our rehabilitation therapy services provided are reimbursed through the Medicare Part B program as outpatient therapy services. These are therapy services provided to inpatient residents of skilled nursing facilities who do not meet the rigorous criteria for Medicare Part A coverage and patients in the community who are being serviced through Medicare certified outpatient rehabilitation agencies we operate. These outpatient services are reimbursed under the Medicare fee schedules. These fee schedules are updated annually through rule-making by CMS.
As part of the Balanced Budget Act of 1997, Congress established annual caps, commonly referred to as therapy caps, that limit the amounts that can be paid (including deductible and coinsurance amounts) for rehabilitation therapy services rendered to any Medicare beneficiary under Medicare Part B. A specific cap was established for the combined PT and SLP services and a separate cap for OT services. Under the law, these caps are indexed. In 2015 for PT and SLP services combined, the limit on incurred expenses was $1,940. In 2015 for OT services, the limit was $1,940. On October 30, 2015, CMS issued final rules for calendar year 2016 resulting in respective therapy caps increasing to $1,960.
During the past decade and a half, Congress has intervened periodically to suspend and/or revise the cap limitations. As part of the Deficit Reduction Act of 2005, Congress directed CMS to develop a process that allows exceptions for Medicare beneficiaries to therapy caps when continued therapy is deemed medically necessary. Since that enactment, Congress has extended the exceptions process to the therapy caps several times. Under the Medicare Access and CHIP Reauthorization Act of 2015, Congress extended the exceptions process through December 31, 2017.
As part of the Middle Class Tax Relief and Job Creation Act of 2012, Congress instructed CMS to implement a manual medical review (MMR) process for Medicare Part B therapy claims that qualified for the exceptions process but exceeded a $3,700 threshold (combined PT/SLP services and a separate threshold of $3,700 for OT services.) This process was extended as part of the Protecting Access to Medicare Act of 2014. Responding to concerns that MMR was causing delays in processing claims and undue hardships, Congress as part of the Medicare Access and CHIP Reauthorization Act of 2015 extended the MMR process through December 31, 2017, revised the statute to give CMS authority to selectively target its review process and clarified that MMRs should be applied as post-payment reviews. In February 2016, CMS issued an initial notice of how it plans to revise its application of the MMR process.
Federal Health Care Reform
In addition to the matters described above affecting Medicare and Medicaid participating providers, PPACA enacted several reforms with respect to skilled nursing facilities, including payment measures to realize significant
9
savings of federal and state funds by deterring and prosecuting fraud and abuse in both the Medicare and Medicaid programs. While many of the provisions of PPACA will not take effect for several years or are subject to further refinement through the promulgation of regulations, some key provisions of PPACA are presently effective.
• Enhanced CMPs and Escrow Provisions. PPACA includes expanded civil monetary penalty (CMP) and related provisions applicable to all Medicare and Medicaid providers. CMS rules adopted to implement applicable provisions of PPACA also provide that assessed CMPs may be collected and placed in whole or in part into an escrow pending final disposition of the applicable administrative and judicial appeals processes. To the extent our businesses are assessed large CMPs that are collected and placed into an escrow account pending lengthy appeals, such actions could adversely affect our liquidity and results of operations.
• Nursing Home Transparency Requirements. In addition to expanded CMP provisions, PPACA imposes new transparency requirements for Medicare-participating nursing facilities. In addition to previously required disclosures regarding a facility's owners, management and secured creditors, PPACA expanded the required disclosures to include information regarding the facility's organizational structure, additional information on officers, directors, trustees and "managing employees" of the facility (including their names, titles, and start dates of services), and information regarding certain parties affiliated with the facility. The transparency provisions could result in the potential for greater government scrutiny and oversight of the ownership and investment structure for skilled nursing facilities, as well as more extensive disclosure of entities and individuals that comprise part of skilled nursing facilities' ownership and management structure.
• Suspension of Payments During Pending Fraud Investigations. PPACA provides the federal government with expanded authority to suspend Medicare and Medicaid payments if a provider is investigated for allegations or issues of fraud. This suspension authority creates a new mechanism for the federal government to suspend both Medicare and Medicaid payments for allegations of fraud, independent of whether a state exercises its authority to suspend Medicaid payments pending a fraud investigation. To the extent the suspension of payments provision is applied to one of our businesses for allegations of fraud, such a suspension could adversely affect our liquidity and results of operations.
• Overpayment Reporting and Repayment; Expanded False Claims Act Liability. PPACA enacted several important changes that expand potential liability under the federal False Claims Act. Overpayments related to services provided to both Medicare and Medicaid beneficiaries must be reported and returned to the applicable payor within specified deadlines, or else they are considered obligations of the provider for purposes of the federal False Claims Act. This new provision substantially tightens the repayment and reporting requirements generally associated with operations of healthcare providers to avoid False Claims Act exposure.
• Home- and Community-Based Services. PPACA provides that states can provide home- and community-based attendant services and supports through the Community First Choice State plan option. States choosing to provide home- and community-based services under this option must make such services available to assist with activities of daily living and health related tasks under a plan of care agreed upon by the individual and his/her representative. PPACA also includes additional measures related to the expansion of community and home based services and authorizes states to expand coverage of community and home-based services to individuals who would not otherwise be eligible for them. The expansion of home-and community-based services could reduce the demand for the facility based services that we provide.
• Health Care-Acquired Conditions. PPACA provides that the Secretary of Health and Human Services must prohibit payments to states for any amounts expended for providing medical assistance for certain medical conditions acquired during the patient's receipt of healthcare services. The CMS regulation implementing this provision of PPACA prohibits states from making payments to providers under the Medicaid program for conditions that are deemed to be reasonably preventable. It uses Medicare's list of preventable conditions in inpatient hospital settings as the base (adjusted for the differences in the Medicare and Medicaid populations) and provides states the flexibility to identify additional preventable conditions and settings for which Medicaid payment will be denied.
10
• Value-Based Purchasing. PPACA requires the Secretary of Health and Human Services to develop a plan to implement a value-based purchasing (VBP) program for payments under the Medicare program for skilled nursing facilities and to submit a report containing the plan to Congress. The intent of the provision is to potentially reconfigure how Medicare pays for healthcare services, moving the program towards rewarding better value, outcomes, and innovations, instead of volume. According to the plan submitted to Congress in June 2012, the funding for the VBP program could come from payment withholds from poor-performing skilled nursing facilities or by holding back a portion of the base payment rate or the annual update for all skilled nursing facilities. If a VBP program is ultimately implemented, it is uncertain what effect it would have upon skilled nursing facilities, but its funding or other provisions could negatively affect skilled nursing facilities.
• Anti-Kickback Statute Amendments. PPACA amended the Anti-Kickback Statute so that (i) a claim that includes items or services violating the Anti-Kickback Statute also would constitute a false or fraudulent claim under the federal False Claims Act and (ii) the intent required to violate the Anti-Kickback Statute is lowered such that a person need not have actual knowledge or specific intent to violate the Anti-Kickback Statute in order for a violation to be deemed to have occurred. These modifications of the Anti-Kickback Statute could expose us to greater risk of inadvertent violations of the statute and to related liability under the federal False Claims Act.
The provisions of PPACA discussed above are examples of recently enacted federal health reform provisions that we believe may have a material impact on the long-term care profession generally and on our business. However, the foregoing discussion is not intended to constitute, nor does it constitute, an exhaustive review and discussion of PPACA. It is possible that other provisions of PPACA may be interpreted, clarified, or applied to our businesses in a way that could have a material adverse impact on our business, financial condition and results of operations. Similar federal and/or state legislation that may be adopted in the future could have similar effects.
Under PPACA, federal healthcare reform has ongoing implementation provisions. For example, all skilled nursing facilities/nursing facilities will be required to establish and implement a Quality Assurance and Performance Improvement (QAPI) initiative. On July 16, 2015, CMS published the proposed rule in the Federal Register which if finalized in full or in part will amend requirements that nursing facilities must meet to participate in the Medicare and Medicaid programs. The comment period for this proposed rule was later extended through October 14, 2015. CMS has indicated that it expects to release the final rule in September 2016.
The proposed rule would revise certain programs, including without limitations, QAPI, compliance and ethics programs. In addition the proposed rule would implement new requirements, for example, in person evaluation by a physician or non-physician provider for an unplanned transfer to a hospital and competency requirements for determining sufficient nursing staff based on a facility assessment, which includes but is not limited to the number of residents, resident acuity, range of diagnoses, and the content of care plans. The proposed rule reorganizes previous requirements such as Resident Rights and clarifies other requirements such as the Preadmission Screening and Resident Review.
It is possible that other provisions of PPACA may be implemented and applied to our businesses in a way that could have a material adverse impact on our business, financial condition and results of operations. Similar federal and/or state legislation that may be adopted in the future could have similar effects.
Competitive Strengths
We believe that the following competitive strengths will enable us to maintain a leading market position and continue to increase our cash flows.
Quality Patient Care, Differentiated Clinical Capabilities and Clinical Specialization: To ensure clinical oversight and continuity of patient care, we employ physicians, physician assistants and nurse practitioners that are primarily involved in providing medical direction and/or direct patient care. This medical staff structure allows for significant involvement of physicians at all levels of the organization, thus ensuring that an emphasis on quality care is maintained. In an effort to further enhance the quality of care that we provide to our patients, we have made significant investments to modernize our physical plant, expand rehabilitation gym capacity and develop clinical specialty units. Since 2007, the number of clinical specialty units in our facilities has grown from 58 units to more than 200 units. The addition of clinical
11
specialty units to our facility portfolio has allowed us to better meet the needs of our patients. These specialty units, along with our advanced capabilities in post-acute cardiac and pulmonary management, differentiate us in local areas, as competitors often do not offer these programs. Our focus on quality patient care, differentiated clinical capabilities and clinical specialization has attracted higher acuity patients who are typically reimbursed by Medicare or managed care payors.
Leading Post-Acute Provider: We are a leading provider of post-acute care services. We are the largest operator of skilled nursing facilities in the U.S. We also operate the second largest post-acute rehabilitation therapy services business in the U.S. Our scale allows us to realize economies of scale, purchasing power and increased operating efficiencies that are not available to smaller operators. Our scale also positions us to take advantage of potential acquisition opportunities in the fragmented post-acute care industry and to benefit from synergies not available to many potential acquirers.
Strong Geographic Density in Regional Markets: We have developed geographic density in attractive markets with 63% of our total licensed skilled nursing beds located in nine states: California, Connecticut, Maryland, Massachusetts, New Hampshire, New Jersey, Pennsylvania, Texas and West Virginia. Within these and other states, we seek to cluster our facilities to create a dense, localized footprint. By clustering our facilities, we are able to provide a larger and more diverse number of clinical services within a regional market. As a result, we are often the leading skilled nursing facility operator in many of the regional markets in which we operate, based on number of beds. Strategically clustered facilities in single or contiguous markets also allow us to achieve lower operating costs through greater purchasing power and operating efficiencies, facilitate the development of strong relations with state and local regulators and provide us with the ability to coordinate sales and marketing strategies. Our strong reputation and operating performance in regional markets has also allowed us to develop relationships with key referral sources, including hospitals and other managed care payors, which has led to an increase in the number of high-acuity patients that are referred to our facilities.
Experienced Management Team with Proven Operating Performance: We have an experienced management team with deep post-acute experience and a track record of growth and integration experience, providing a distinct competitive advantage in navigating the complex and evolving post-acute care industry. Our management team has also demonstrated an ability to consummate successfully and integrate both large and small acquisitions.
Key Partnerships and Relationships: Within our local markets, we have partnered with hospitals in order to enhance the coordination of patient care during and after a post-acute rehabilitation stay. The goal of these relationships is to provide quality care, while lowering hospital readmission rates and reducing overall healthcare costs. Further, these relationships allow us to manage patient outcomes and coordinate care once a patient leaves the acute care setting and enters one of our facilities. We have also forged key relationships with managed care payors to better align quality goals and reimbursement, resulting in a more coordinated care approach that reduces hospital readmissions. As an increasing number of patients gain access to health insurance through healthcare reform or move to managed Medicare and Medicaid programs, we are poised to capture additional market share as managed care companies look to match quality patient care with a cost efficient setting.
Growth Strategy
We focus on growth through various internal and external initiatives. These initiatives include a continuation of existing core strategies and a number of newly developed strategies designed to capitalize on our competitive strengths and position us for success in a post-healthcare reform environment. These growth strategies can be categorized into the following key initiatives:
Commitment to quality care. We are focused on qualitative and quantitative clinical performance measures in order to enhance and improve the care provided in our facilities. We continually seek to enhance our reputation for providing clinical capabilities and favorable outcomes. Among other things, we have and will continue to increase our professional nursing mix and integrate nurse practitioners and employed physicians into our clinical model. We have incentivized our management team to improve clinical performance to further ensure accountability for the quality of care.
Capitalize on attractive demographics. With the increasing elderly population and corollary increase in life expectancy, management believes there will be increasing demand for post-acute care services. To address this growing
12
demand and the subsequent increase in healthcare costs, acute care providers will increasingly look to post-acute service providers with demonstrated capabilities and proven performance to play a larger role in the care of medically complex, post-acute care patients. At the same time, both private and public payors are seeking more efficient and economic means of meeting the needs of the growing elderly demographic. Payors prefer to shift patients away from costlier hospital and LTAC settings to skilled nursing facilities, where personalized rehabilitation and skilled nursing care can be provided at a lower cost. To facilitate this transfer, skilled nursing facilities that can demonstrate proven clinical capabilities will be better suited to capture a greater proportion of these patients. As a leading national provider of post-acute services, we are well-positioned to capitalize on the growing demand for post-acute services.
Focus on high-acuity patients. We will continue to differentiate our facilities to capture high-acuity patients by growing the number of clinical specialty units, expanding therapy gym capacity, developing the clinical skills of employees, developing relationships with acute care hospitals and managed care payors, and expanding the use of exclusively employed physicians. By treating higher acuity patients, we strive to increase our skilled mix and further position ourselves for shifting demographics of our aging population.
Grow the rehabilitation therapy segment. We expect to continue to grow our market share of therapy contracts by further enhancing our reputation in the industry and by demonstrating the value of our services to prospective customers and their patients. We also plan to capitalize on organic cash flow growth opportunities through expansion of clinical therapy services to existing customers and continued improvement in the productivity of our therapists through the use of technology and improved workflow.
Improve operating efficiency. We are continually focused on improving operating efficiency and controlling costs, while maintaining quality patient care. Investments in information systems, the development of tools to more effectively manage operating costs and the reengineering of key business and operating processes are an economically effective way to organically grow cash flow.
Grow through selective acquisitions and successful integration. The post-acute care industry is highly fragmented. The vast majority of skilled nursing facilities are owned by local and regional groups, providing an opportunity for industry consolidation. As the largest operator of skilled nursing facilities in the United States, we are well positioned to purchase facilities. In today’s challenging economic, credit and reimbursement environment, many operators are facing challenges due to scale limitations vis-à-vis their larger competitors. As local and regional groups seek an exit strategy, we believe we can make compelling offers for their businesses owing to the strong strategic fit with our businesses. Non-strategic buyers and buyers with limited acquisition and integration experience may not be able to achieve the same synergies and, therefore, may not be able to make similar offers.
We seek strategic acquisitions in selected target markets with strong demographic trends for growth in our service population. Expansion of existing facility clusters and the creation of new clusters in local markets will allow us to leverage existing operations and to achieve greater operating efficiencies. Given our existing scale and geographic footprint, growth through acquisition can often be achieved more rapidly and efficiently than organic development.
Position ourselves for success in a post-healthcare reform environment. As healthcare reform continues to be implemented, we believe post-acute healthcare providers who provide quality diversified care, have density and strong reputations in local markets, have good relationships with acute care hospitals and operate with scale will have a competitive advantage in an episodic payment environment. Our previously described organic and strategic growth strategies will position us well to become a valuable partner to acute care hospitals and managed care organizations that are seeking to increase care coordination, reduce lengths of stay, more effectively manage healthcare costs and develop new care delivery and payment models.
Government Regulation
General
Healthcare is an area of extensive and frequent regulatory change. Changes in the law or new interpretations of existing laws may have a significant impact on our methods and costs of doing business. Our subsidiaries that provide healthcare services are subject to federal, state and local laws relating to, among other things, licensure, delivery, quality
13
and adequacy of medical care, distribution of pharmaceuticals, physical plant requirements, life safety, personnel and operating policies. In addition, our provider subsidiaries are subject to federal and state laws that govern billing and reimbursement, relationships with vendors and business relationships with physicians. Such laws include the Anti-Kickback Statue, the False Claims Act, the Stark Law and state corporate practice of medicine statutes.
Governmental and other authorities periodically inspect our skilled nursing facilities, assisted/senior living facilities and outpatient rehabilitation agencies to verify that we continue to comply with the regulations and standards. We must pass these inspections to remain licensed under state laws, to comply with our Medicare and Medicaid provider agreements, and, in some instances, to continue our participation in the Veterans Administration program. We can only participate in these third-party payment programs if inspections by regulatory authorities reveal that our facilities and agencies are in substantial compliance with applicable requirements. In the ordinary course of business, we may receive notices from federal or state regulatory authorities alleging deficiencies in certain regulatory practices. These statements of deficiency may require us to take corrective action to regain and maintain compliance. In some cases, federal or state regulators may impose other remedies including imposition of CMPs, temporary payment bans, loss of certification as a provider in the Medicare and/or Medicaid program and revocation of a state operating license.
In the ordinary course of business, we are subject from time to time to inquiries, investigations and audits by federal and state agencies related to compliance with participation and payment rules under government payment programs. These inquiries may include but are not limited to the Office of the Inspector General (OIG) audits and CMS Recovery Audit Contractors. We believe that the regulatory environment surrounding the healthcare industry subjects providers to intense scrutiny. Federal and state governments continue to impose citations for regulatory deficiencies and other regulatory penalties, including demands for refund of overpayments, expanded CMPs that extend over long periods of time and date back to incidents long before surveyor visits, Medicare and Medicaid payment bans and terminations from the Medicare and Medicaid programs. We vigorously contest these matters where appropriate; however, there are significant legal and other expenses involved that consume our financial and personnel resources. Expansion of enforcement activity could adversely affect our business and financial condition.
Quality of Care Measures
In 2008 CMS created the Five-Star Quality Rating System to help consumers, families and caregivers to compare nursing homes and choose providers more easily. Nursing homes are rated from 1 to 5 stars based on three components (survey results over the past 3 years, quality measure calculations, and staffing data), with each of the components receiving star rankings as well. Nursing homes with 5 stars are considered to have much above average quality and nursing homes with 1 star are considered to have quality much below average. Third party payors may utilize the Star Ratings to eliminate providers in certain networks, while accountable care organizations and other bundled payment programs may utilize the Star Ratings to select partners into the programs. CMS is expanding the Star Rating to Home Health Agencies. We strive to provide quality care which will facilitate the ability to achieve higher rankings to enhance our opportunities to participate in networks and bundled payment programs.
Civil and Criminal Fraud and Abuse Laws and Enforcement
Federal and state healthcare fraud and abuse laws regulate both the provision of services to government program beneficiaries and the methods and requirements for submitting claims for services rendered to such beneficiaries. Under these laws, individuals and organizations can be penalized for submitting claims for services that are not provided, that have been inadequately provided, billed in an incorrect manner, intentionally or accidentally, or other than as actually provided, not medically necessary, provided by an improper person, accompanied by an illegal inducement to utilize or refrain from utilizing a service or product, or billed or coded in a manner that does not otherwise comply with applicable governmental requirements. Penalties also may be imposed for violation of anti-kickback and patient referral laws.
Federal and state governments have a range of criminal, civil and administrative sanctions available to penalize and remediate healthcare fraud and abuse, including exclusion of the provider from participation in the Medicare and Medicaid programs, imposition of civil and criminal fines, and suspension of payments and, in the case of individuals, imprisonment.
We have internal policies and procedures, including a program designed to facilitate compliance with and to reduce exposure for violations of these and other laws and regulations. However, because enforcement efforts presently are widespread within the industry and may vary from region to region, there can be no assurance that our internal policies
14
and procedures will significantly reduce or eliminate exposure to civil or criminal sanctions or adverse administrative determinations.
Anti-Kickback Statute
Federal law commonly referred to as the Anti-Kickback Statute prohibits the knowing and willful offer, payment, solicitation or receipt of anything of value, directly or indirectly, in return for the referral of patients or arranging for the referral of patients, or in return for the recommendation, arrangement, purchase, lease or order of items or services that are covered by a federal healthcare program such as Medicare or Medicaid. Violation of the Anti-Kickback Statute is a felony, and sanctions for each violation include imprisonment of up to five years, significant criminal fines, significant CMPs plus three times the amount claimed or three times the remuneration offered, and exclusion from federal healthcare programs (including Medicare and Medicaid). Many states have adopted similar prohibitions against kickbacks and other practices that are intended to induce referrals applicable to all payors.
We are required under the Medicare conditions of participation and some state licensing laws to contract with numerous healthcare providers and practitioners, including physicians, hospitals and hospice agencies and to arrange for these individuals or entities to provide services to our residents and patients. In addition, we have contracts with other suppliers, including pharmacies, laboratories, x-ray companies, ambulance services and medical equipment companies. Some of these individuals or entities may refer, or be in a position to refer, patients to us, and we may refer, or be in a position to refer, patients to these individuals or entities. Certain safe harbor provisions have been created so that although a relationship could potentially implicate the federal anti-kickback statute, it would not be treated as an offense under the statute. We attempt to structure these arrangements in a manner that falls within one of the safe harbors. Some of these arrangements may not ultimately satisfy the applicable safe harbor requirements, but failure to meet the safe harbor does not necessarily mean an arrangement is illegal.
We believe that our arrangements with providers, practitioners and suppliers are in compliance with the Anti-Kickback Statute and similar state laws. However, if any of our arrangements with third parties were to be challenged and found to be in violation of the Anti-Kickback Statute, we could be required to repay any amounts we received, subject to criminal penalties, and we could be excluded from participating in federal and state healthcare programs such as Medicare and Medicaid. The occurrence of any of these events could significantly harm our business and financial condition.
Stark Law
Federal law commonly known as the Stark Law prohibits a physician from making referrals for particular healthcare services to entities with which the physician (or an immediate family member of the physician) has a financial relationship if the services are payable by Medicare or Medicaid. If an arrangement is covered by the Stark Law, the requirements of a Stark Law exception must be met for the physician to be able to make referrals to the entity for designated health services and for the entity to be able to bill for these services. Although the term “designated health services” does not include long-term care services, some of the services provided at our skilled nursing facilities and other related business units are classified as designated health services, including PT, SLP and OT services. The term “financial relationship” is defined very broadly to include most types of ownership or compensation relationships. The Stark Law also prohibits the entity receiving the referral from seeking payment from the patient or the Medicare and Medicaid programs for services rendered pursuant to a prohibited referral.
The Stark Law contains exceptions for certain physician ownership or investment interests in, and certain physician compensation arrangements with, certain entities. If a compensation arrangement or investment relationship between a physician, or immediate family member, and an entity satisfies the applicable requirements for a Stark Law exception, the Stark Law will not prohibit the physician from referring patients to the entity for designated health services. The exceptions for compensation arrangements cover employment relationships, personal services contracts and space and equipment leases, among others.
If an entity violates the Stark Law, it could be subject to significant civil penalties. The entity also may be excluded from participating in federal and state healthcare programs, including Medicare and Medicaid. If the Stark Law were found to apply to our relationships with referring physicians and no exception under the Stark Law were available, we would be required to restructure these relationships or refuse to accept referrals for designated health services from these physicians. If we were found to have submitted claims to Medicare or Medicaid for services provided pursuant to a referral prohibited by the Stark Law, we would be required to repay any amounts we received from Medicare or
15
Medicaid for those services and could be subject to CMPs. Further, we could be excluded from participating in Medicare and Medicaid and other federal and state healthcare programs. If we were required to repay any amounts to Medicare or Medicaid, subjected to fines, or excluded from the Medicare and Medicaid Programs, our business and financial condition would be harmed significantly.
As directed by PPACA, in 2010 CMS released a self-referral disclosure protocol (SRDP) for potential or actual violations of the Stark Law. Under SRDP, CMS states that it may, but is not required to, reduce the amounts due and owing for a Stark Law violation, and will consider the following factors in deciding whether to grant a reduction: (1) the nature and extent of the improper or illegal practice; (2) the timeliness of the self-disclosure; (3) the cooperation in providing additional information related to the disclosure; (4) the litigation risk associated with the matter disclosed; and (5) the financial position of the disclosing party.
Many states have physician relationship and referral statutes that are similar to the Stark Law. These laws generally apply regardless of the payor. We believe that our operations are structured to comply with the Stark Law and applicable state laws with respect to physician relationships and referrals. However, any finding that we are not in compliance with these laws could require us to change our operations or could subject us to penalties. This, in turn, could significantly harm our business and financial condition.
False Claims Act
Federal and state laws prohibit the submission of false claims and other acts that are considered fraudulent, wasteful or abusive. Under the federal False Claims Act (FCA), actions against a provider can be initiated by the federal government or by a private party on behalf of the federal government. These private parties, who are often referred to as “qui tam relators” or “relators,” are entitled to share in any amounts recovered by the government. Both direct enforcement activity by the government and qui tam relator actions have increased significantly in recent years. The use of private enforcement actions against healthcare providers has increased dramatically, in part because the relators are entitled to share in a portion of any settlement or judgment.
A FCA violation occurs when a provider knowingly submits a claim for items or services not provided. The Fraud Enforcement and Recovery Act of 2009 expanded the scope of the FCA by creating liability for knowingly retaining an overpayment received from the government and broadening protections for whistleblowers. The submission of false claims or the failure to timely repay overpayments may lead to the imposition of significant CMPs, significant criminal fines and imprisonment, and/or exclusion from participation in state and federally-funded healthcare programs, including the Medicare and Medicaid programs.
Allegations of poor quality of care can also lead to FCA actions under a theory of worthless services. Worthless services cases allege that although care was provided it was so deficient that it was tantamount to no service at all.
In recent years, prosecutors and relators are increasingly bringing FCA claims based on the implied certification theory as an expansion of the scope of the FCA. Under the implied certification theory, a violation of the FCA occurs when a provider’s request for payment implies a certification of compliance with the applicable statutes, regulations or contract provisions that are preconditions to payment. This development has increased the risk that a healthcare company will have to defend a false claims action, pay fines and treble damages or settlement amounts or be excluded from the federal and state healthcare programs as a result of an investigation arising out of the FCA. Many states have enacted similar laws providing for imposition of civil and criminal penalties for the filing of fraudulent claims.
Because we submit thousands of claims to Medicare each year, and there is a relatively long statute of limitations under the FCA, there is a risk that intentional, or even negligent or recklessly submitted claims that prove to be incorrect, or even billing errors, cost reporting errors or lapses in statutory or regulatory compliance with regard to the provision of healthcare services (including, without limitation the Anti-Kickback Statue and the federal self-referral law discussed above), could result in significant civil or criminal penalties against us. For example, see Note 20, "Commitment and Contingencies - Legal Proceedings," for information regarding matters in which the government is pursuing, or has expressed an intent to pursue, legal remedies against us under the FCA and similar state laws.
We believe that our operations comply with the FCA and similar state laws. However, if our claims practices were challenged and found to violate the applicable laws, any finding that we are not in compliance with these laws could require us to change our operations or could subject us to penalties or make us ineligible to participate in certain government funded healthcare programs, which could in turn significantly harm our business and financial condition.
16
Patient Privacy and Security Laws
There are numerous legislative and regulatory requirements at the federal and state levels addressing patient privacy and security of health information. The Health Insurance Portability and Accountability Act of 1996 (HIPAA) contains provisions that require us to adopt and maintain business procedures designed to protect the privacy, security and integrity of patients' individual health information. States also have laws that apply to the privacy of healthcare information. We must comply with these state privacy laws to the extent that they are more protective of healthcare information or provide additional protections not afforded by HIPAA.
HIPAA's security standards were designed to protect electronic information against reasonably anticipated threats or hazards to the security or integrity of the information and to protect the information against unauthorized use or disclosure. These standards have had and are expected to continue to have a significant impact on the healthcare industry because they impose extensive requirements and restrictions on the use and disclosure of identifiable patient information. In addition, HIPAA established uniform standards governing the conduct of certain electronic healthcare transactions and protecting the privacy and security of certain individually identifiable health information.
The Health Information Technology for Clinical Health Act of 2009 (HITECH Act) expanded the requirements and noncompliance penalties under HIPAA and require correspondingly intensive compliance efforts by companies such as ours, including self-disclosures of breaches of unsecured health information to affected patients, federal officials, and, in some cases, the media. These laws make unauthorized access by our employees illegal and subject to self-disclosure and penalties. Other states may adopt similar or more extensive breach notice and privacy requirements. Compliance with these regulations could require us to make significant investments of money and other resources. We believe that we are in substantial compliance with applicable state and federal regulations relating to privacy and security of patient information. However, if we fail to comply with the applicable regulations, we could be subject to significant penalties and other adverse consequences.
Certificates of Need and Other Regulatory Matters
There are CON programs in 35 states and the District of Columbia. We are required in these jurisdictions to obtain CON approval or exemption prior to certain changes including without limitation, change in ownership, capital expenditures over certain limits, development of a new facility or expansion of services of an existing facility or service in order to control overdevelopment of healthcare projects. Certain states that do not have CON programs may have other laws or regulations that limit or restrict the development or expansion of healthcare projects. In the event we choose to develop or expand the operations of our subsidiaries, the development or expansion could be affected adversely by the inability to obtain the necessary approvals, changes in the standards applicable to such approvals or possible delays and expenses associated with obtaining such approvals. Failure to comply with state requirements with CON or other regulations that address development or expansion of services could adversely affect the progress or completion of a healthcare project.
State Operating License Requirements
We are required to obtain state licenses to operate each of our nursing facilities. Many states require similar licenses or certificates for assisted/senior living facilities, and some states require a license to operate outpatient agencies. Medicare requires compliance with applicable state laws as a condition of participation. In addition, healthcare professionals and practitioners are required to be licensed in most states. We take measures to ensure that our healthcare professionals are properly licensed and participate in required continuing education programs. We believe that our operating companies and personnel that provide these services have all required licenses or certifications necessary for our current operations. Failure to obtain, maintain or renew a required license or certification could adversely affect our ability to bill for services or operate in the ordinary course.
Competition
Our skilled nursing facilities compete primarily on a local and regional basis with other skilled nursing facilities and with assisted/senior living facilities, from national and regional chains to smaller providers owning as few as a single facility. Competitors include other for-profit providers as well as non-profits, religiously-affiliated facilities, and government-owned facilities. We also compete under certain circumstances with inpatient rehabilitation facilities and long-term acute care hospitals. Our ability to compete successfully varies from location to location and depends on a number of factors, including the number of competing facilities in the local market and the types of services available at
17
those facilities, our local reputation for quality care of patients, the commitment and expertise of our caregivers, our local service offerings and treatment programs, the cost of care in each locality, and the physical appearance, location, age and condition of our facilities.
We seek to compete effectively in each market by establishing a reputation within the local community for quality of care, attractive and comfortable facilities, and providing specialized healthcare with an emphasized focus on high-acuity patients. Programs targeting high-acuity patients, including our PowerBack Rehabilitation facilities, generally have a higher staffing level per patient than our other inpatient facilities and compete more directly with inpatient rehabilitation facilities and long-term acute-care hospitals, in addition to assisted living facilities and other skilled nursing facilities. We believe that the average cost to a third-party payor for the treatment of our typical high-acuity patient is lower if that patient is treated in one of our skilled nursing facilities than if that same patient were to be treated in an IRF or LTAC.
Our other services, such as assisted/senior living facilities and rehabilitation therapy provided to third-party facilities, also compete with local, regional, and national companies. The primary competitive factors in these businesses are similar to those for our skilled nursing facilities and include reputation, cost to provide the services, quality of clinical services, responsiveness to patient/resident needs, location and the ability to provide support in other areas such as third-party reimbursement, information management and patient recordkeeping.
Increased competition could limit our ability to attract and retain patients or to expand our business. Some of our competitors have greater financial and other resources than we have, may have greater brand recognition and may be more established in their respective communities than we are. Competing companies may also offer newer facilities or different programs or services than we do and may as a result be more attractive to our current patients, to potential patients and to referral sources.
Employees and Labor Relations
As of December 31, 2015, we employed an aggregate of approximately 88,700 active employees as follows: 59,600 in our inpatient services segment, 20,700 (primarily therapists) in our rehabilitation therapy segment, and 8,400 in our all other services segment, which includes our administrative services subsidiary.
Our most significant operating cost is labor, which accounted for approximately 68% of our operating expenses from continuing operations for the year ended December 31, 2015. We seek to manage our labor costs by improving staffing retention, maintaining competitive labor rates, and reducing reliance on overtime compensation and temporary staffing services.
As of December 31, 2015, we had 115 collective bargaining agreements with unions covering approximately 8,900 active employees at 113 of our skilled nursing facilities. We consider our relationship with our employees to be good.
Risk Management
We have developed a risk management program intended to control our insurance and professional liability costs. As part of this program, we have implemented an arbitration agreement program at each of our nursing facilities under which, upon admission and to the extent permitted under existing regulations, patients are requested (but not required) to execute an agreement that requires disputes to be arbitrated instead of litigated in court. We believe that this program accelerates resolution of disputes and reduces our liability exposure and related costs. We have also established an incident reporting process that involves the provision of tracking and trending data to our facility administrators.
Insurance
We maintain a variety of types of insurance, including general and professional liability, workers' compensation, fiduciary liability, property, cyber/privacy liability, directors' and officers' liability, crime, boiler and machinery, automobile, employment practices liability and earthquake and flood. We believe that our insurance programs are adequate and where there has been a direct transfer of risk to the insurance carrier our risk is limited to the cost of the premium. We self-insure a significant portion of our potential liabilities for several risks, including certain types of general and professional liability, workers’ compensation and health benefits. To the extent our insurance coverage is insufficient or unavailable to cover losses that would otherwise be insurable, or to the extent that our estimates of anticipated liabilities that we self-insure are significantly lower than the actual self-insured liabilities that we incur, our financial condition and results of operations could be materially and adversely affected. For additional information
18
regarding our insurance programs, see Note 20, “Commitments and Contingencies – Loss Reserves for Certain Self-Insured Programs,” in the financial statements included elsewhere in this report.
Environmental Matters
We are subject to a wide variety of federal, state and local environmental and occupational health and safety laws and regulations. As a healthcare provider, we face regulatory requirements in areas of air and water quality control, medical and low-level radioactive waste management and disposal, asbestos management, response to mold and lead-based paint in our facilities and employee safety.
In our role as owner of subsidiaries which operate our facilities (including our leased facilities), we also may be required to investigate and remediate hazardous substances that are located on the property, including any such substances that may have migrated off, or discharged or transported from the property. Part of our operations involves the handling, use, storage, transportation, disposal and/or discharge of hazardous, infectious, toxic, flammable and other hazardous materials, wastes, pollutants or contaminants. These activities may result in damage to individuals, property or the environment; may interrupt operations and/or increase costs; may result in legal liability, damages, injunctions or fines; may result in investigations, administrative proceedings, penalties or other governmental agency actions; and may not be covered by insurance. We believe that we are in material compliance with applicable environmental and occupational health and safety requirements. However, there can be no assurance that we will not incur environmental liabilities in the future, and such liabilities may result in material adverse consequences to our operations and financial condition.
Customers
No individual customer or client accounts for a significant portion of our revenue. We do not expect that the loss of a single customer or client would have a material adverse effect on our business, results of operations or financial condition.
Available Information
Our Annual Reports on Form 10-K, Quarterly Reports on Form 10-Q, Current Reports on Form 8-K, and amendments to reports filed pursuant to Sections 13(a) and 15(d) of the Securities Exchange Act of 1934, as amended, are filed with the SEC. Such reports and other information filed by us with the SEC are available free of charge at the investor relations section of our website at www.genesishcc.com as soon as reasonably practicable after such reports are electronically filed with, or furnished to, the SEC. Copies are also available, without charge, by writing to Genesis Healthcare, Inc. Investor Relations, 101 East State Street, Kennett Square, PA 19348. The SEC also maintains a website, www.sec.gov, which contains reports, proxy and information statements, and other information regarding issuers that file electronically with the SEC. The inclusion of our website address in this annual report does not include or incorporate by reference the information on our website into this annual report.
Company History
Genesis Healthcare, Inc., a Delaware corporation, was incorporated in October 2005 under the name of SHG Holding Solutions, Inc., and it subsequently changed its name to Skilled Healthcare Group, Inc. (Skilled). On February 2, 2015, Skilled combined its businesses and operations (the Combination) with FC-GEN Operations Investment, LLC, a Delaware limited liability company (FC-GEN), pursuant to a Purchase and Contribution Agreement dated August 18, 2014. In connection with the Combination, Skilled changed its name to Genesis Healthcare, Inc.
In 2007, private equity funds managed by affiliates of Formation Capital, LLC and certain other investors acquired all the outstanding shares of Genesis HealthCare Corporation (GHC). In 2011, (i) GHC transferred to FC-GEN its business of operating and managing senior housing and care facilities, its joint venture entities and its other ancillary businesses, (ii) all the outstanding shares of GHC were sold to Welltower Inc. (Welltower) for purposes of transferring the ownership of GHC’s senior housing facilities to Welltower and (iii) FC-GEN entered into a master lease agreement with Welltower pursuant to which FC-GEN leased back the senior housing facilities that it had transferred ownership to Welltower.
Effective December 1, 2012, FC-GEN completed the acquisition of Sun Healthcare Group, Inc. (the Sun Merger) and its subsidiaries.
19
Unless the context otherwise requires, references in this report to the "Company" include the predecessors of Genesis Healthcare, Inc., including GHC, prior to 2011.
In addition to the other information set forth in this report, you should carefully consider the following factors, which could materially affect our business, financial condition or results of operations in future periods. We operate in a rapidly changing and highly regulated environment that involves a number of risks and uncertainties, some of which are highlighted below and others are discussed elsewhere in this report. These risks and uncertainties could materially and adversely affect our business, financial condition, prospects, operating results or cash flows. The following risk factors are not the only ones facing us. Our business is also subject to the risks that affect many other companies, such as employment relations, natural disasters, general economic conditions and geopolitical events. Further, additional risks not currently known to us or that we currently believe are immaterial may in the future materially and adversely affect our business, results of operations, liquidity and stock price.
Risks Related to Reimbursement and Regulation of our Business
Reductions in Medicare reimbursement rates, or changes in the rules governing the Medicare program could have a material adverse effect on our revenues, financial condition and results of operations.
We receive a significant portion of our revenue from Medicare, which accounted for 26% of our consolidated revenue during 2015 and 27% in 2014. In addition, many private payors base their reimbursement rates on the published Medicare rates or, in the case of our rehabilitation therapy services customers, are themselves reimbursed by Medicare for the services we provide. Accordingly, if Medicare reimbursement rates are reduced or fail to increase as quickly as our costs, or if there are changes in the rules governing the Medicare program that are disadvantageous to our business or industry, our business and results of operations will be adversely affected.
The Medicare program and its reimbursement rates and rules are subject to frequent change. These include statutory and regulatory changes, rate adjustments (including retroactive adjustments), administrative or executive orders and government funding restrictions, all of which may materially adversely affect the rates at which Medicare reimburses us for our services. Budget pressures often lead the federal government to reduce or place limits on reimbursement rates under Medicare. Implementation of these and other types of measures has in the past and could in the future result in substantial reductions in our revenue and operating margins. For example, due to the federal sequestration, an automatic 2% reduction in Medicare spending took effect beginning in April 2013 and will remain in effect unless Congress takes action to terminate the automatic reduction or authorize spending increases.
In addition, CMS often changes the rules governing the Medicare program, including those governing reimbursement. Changes that could adversely affect our business include:
• administrative or legislative changes to base rates or the bases of payment;
• limits on the services or types of providers for which Medicare will provide reimbursement;
• changes in methodology for patient assessment and/or determination of payment levels;
• the reduction or elimination of annual rate increases; or
• an increase in co-payments or deductibles payable by beneficiaries.
Among the important changes in statute that are being implemented by CMS include provisions of the IMPACT Act. This law imposes a stringent timeline for implementing benchmark quality measures and data metrics across post-acute care providers (Long Stay Hospitals, Inpatient Rehabilitation Facilities, Skilled Nursing Facilities and Home Health Agencies). The enactment also mandates specific actions to design a unified payment methodology for post-acute providers. CMS is in the process of promulgating regulations to implement provisions of this enactment. Depending on the final details, the costs of implementation could be significant. The failure to meet implementation requirements could expose providers to fines and payment reductions.
20
Reductions in reimbursement rates or the scope of services being reimbursed could have a material, adverse effect on our revenue, financial condition and results of operations or even result in reimbursement rates that are insufficient to cover our operating costs. Additionally, any delay or default by the federal or state governments in making Medicare and/or Medicaid reimbursement payments could materially and adversely affect our business, financial condition and results of operations.
Reductions in Medicaid reimbursement rates or changes in the rules governing the Medicaid program could have a material, adverse effect on our revenues, financial condition and results of operations.
A significant portion of reimbursement for long-term care services comes from Medicaid, a joint Federal-State program purchasing healthcare services for the low income and indigent, and individuals whose medical expenses are such that they are deemed medically needed. Under broad federal criteria, states establish rules for eligibility, services and payment. Medicaid is our largest source of revenue, accounting for 53% of our consolidated revenue during 2015 and 2014. Medicaid is a state-administered program financed by both state funds and matching federal funds. Medicaid spending has increased rapidly in recent years, becoming a significant component of state budgets. This, combined with slower state revenue growth, has led both the federal government and many states to institute measures aimed at controlling the growth of Medicaid spending, and in some instances reducing aggregate Medicaid spending. We expect these state and federal efforts to continue for the foreseeable future. The Medicaid program and its reimbursement rates and rules are subject to frequent change at both the federal and state-by-state level. These include statutory and regulatory changes, rate adjustments (including retroactive adjustments), administrative or executive orders and government funding restrictions, all of which may materially adversely affect the rates at which our services are reimbursed by state Medicaid plans. To generate funds to pay for the increasing costs of the Medicaid program, many states utilize financial arrangements commonly referred to as provider taxes. Under provider tax arrangements, states collect taxes from healthcare providers and then use the revenue to pay the providers as a Medicaid expenditure, which allows the states to then claim additional federal matching funds on the additional reimbursements. Current federal law provides for a cap on the maximum allowable provider tax as a percentage of the provider's total revenue. There can be no assurance that federal law will continue to provide matching federal funds on state Medicaid expenditures funded through provider taxes, or that the current caps on provider taxes will not be reduced. Any discontinuance or reduction in federal matching of provider tax-related Medicaid expenditures could have a significant and adverse effect on states' Medicaid expenditures, and as a result could have a material and adverse effect on our financial condition and results of operations.
Reforms to the U.S. healthcare system have imposed new requirements upon us.
PPACA and the Health Care and Education Reconciliation Act of 2010 (the Reconciliation Act) included sweeping changes to how healthcare is paid for and furnished in the U.S. It has imposed new obligations on skilled nursing facilities, requiring them to disclose information regarding ownership, expenditures and certain other information. Moreover, the law requires skilled nursing facilities to electronically submit verifiable data on direct care staffing. CMS rules implementing these reporting requirements are in development with a target implementation date of July 1, 2016.
To address potential fraud and abuse in federal healthcare programs, including Medicare and Medicaid, PPACA includes provider screening and enhanced oversight periods for new providers and suppliers, as well as enhanced penalties for submitting false claims. It also provides funding for enhanced anti-fraud activities. PPACA imposes an enrollment moratoria in elevated risk areas by requiring providers and suppliers to establish compliance programs. PPACA also provides the federal government with expanded authority to suspend payment if a provider is investigated for allegations or issues of fraud. PPACA provides that Medicare and Medicaid payments may be suspended pending a “credible investigation of fraud,” unless the Secretary of Health and Human Services determines that good cause exists not to suspend payments. To the extent the Secretary applies this suspension of payments provision to one of our affiliated facilities for allegations of fraud, such a suspension could adversely affect our results of operations.
PPACA gave authority to the U.S. Department of Health and Human Services (HHS) to establish, test and evaluate alternative payment methodologies for Medicare services. Various payment and services models have been developed by CMI. Current models provide incentives for providers to coordinate patient care across the continuum and to be jointly accountable for an entire episode of care centered around a hospitalization.
21
PPACA attempts to improve the healthcare delivery system through incentives to enhance quality, improve beneficiary outcomes and increase value of care. One of these key delivery system reforms is the encouragement of ACOs. ACOs will facilitate coordination and cooperation among providers to improve the quality of care for Medicare beneficiaries and reduce unnecessary costs. Participating ACOs that meet specified quality performance standards will be eligible to receive a share of any savings if the actual per capita expenditures of their assigned Medicare beneficiaries are a sufficient percentage below their specified benchmark amount. Quality performance standards will include measures in such categories as clinical processes and outcomes of care, patient experience and utilization of services.
In addition, PPACA required HHS to develop a plan to implement a value-based purchasing program for Medicare payments to skilled nursing facilities. HHS delivered a report to Congress outlining its plans for implementing this value-based purchasing program. Based in part on the findings of the demonstration project, Congress as part of the Protecting Access to Medicare Act enacted legislation directing CMS to implement a value-based purchasing requirement for skilled nursing facilities to be effective in 2018. Under this legislation, HHS is required to develop by October 1, 2016 measures and performance standards regarding preventable hospital readmissions from skilled nursing facilities. Beginning October 1, 2018, HHS will withhold 2% of Medicare payments from all skilled nursing facilities and distribute this pool of payment to skilled nursing facilities as incentive payments for preventing readmissions to hospitals. Measurement requirements were published in final fiscal year 2016 skilled nursing facility PPS rules released in late August 2015. In addition to the requirements that are being implemented, legislation is pending in Congress to broaden the value-based purchasing requirements featuring a payment withholding designed to fund the program across all post-acute services.
The provisions of PPACA discussed above are examples of some federal health reform provisions that we believe may have a material impact on the long-term care industry and on our business. However, the foregoing discussion is not intended to constitute, nor does it constitute, an exhaustive review and discussion of PPACA. It is possible that these and other provisions of PPACA may be interpreted, clarified, or applied to our affiliated facilities or operating subsidiaries in a way that could have a material adverse impact on the results of operations.
We cannot predict what effect these changes will have on our business, including the demand for our services or the amount of reimbursement available for those services. However, it is possible these new laws may reduce reimbursement and adversely affect our business.
PPACA and its implementation could impact our business.
PPACA could result in sweeping changes to the existing U.S. system for the delivery and financing of healthcare. As an employer, we must abide by the numerous reporting requirements imposed by the law and regulations implementing PPACA. These provisions could impact our compensation costs and force changes in how the company supports health benefits for its employees. The details for implementation of many of the requirements under PPACA will depend on the promulgation of regulations by a number of federal government agencies, including the HHS. It is impossible to predict the outcome of these changes, what many of the final requirements of PPACA will be, and the net effect of those requirements on us. As such, we cannot fully predict the impact of PPACA on our business, operations or financial performance.
Revenue we receive from Medicare and Medicaid is subject to potential retroactive reduction.
Payments we receive from Medicare and Medicaid can be retroactively adjusted after examination during the claims settlement process or as a result of post-payment audits. Payors may disallow our requests for reimbursement, or recoup amounts previously reimbursed, based on determinations by the payors or their third-party audit contractors that certain costs are not reimbursable because either adequate or additional documentation was not provided or because certain services were not covered or deemed to not be medically necessary. Significant adjustments, recoupments or repayments of our Medicare or Medicaid revenue, and the costs associated with complying with investigative audits by regulatory and governmental authorities, could adversely affect our financial condition and results of operations.
Additionally, from time to time we become aware, either based on information provided by third parties and/or the results of internal audits, of payments from payor sources that were either wholly or partially in excess of the amount
22
that we should have been paid for the service provided. Overpayments may result from a variety of factors, including insufficient documentation supporting the services rendered or medical necessity of the services, other failures to document the satisfaction of the necessary conditions of payment, or in some cases for providing services that are deemed to be worthless. We are required by law in most instances to refund the full amount of the overpayment after becoming aware of it, and failure to do so within requisite time limits imposed by the law could lead to significant fines and penalties being imposed on us. Furthermore, our initial billing of and payments for services that are unsupported by the requisite documentation and satisfaction of any other conditions of payment, regardless of our awareness of the failure at the time of the billing or payment, could expose us to significant fines and penalties, including pursuant to the FCA and the Federal Civil Monetary Penalties Law (FCMPL). Violations of the FCA could lead to any combination of a variety of criminal, civil and administrative fines and penalties. The FCA provides for civil fines ranging from $5,500 to $11,000 per claim plus treble damages. The FCMPL similarly provides for CMPs of up to $10,000 per claim plus up to treble damages. We and/or certain of our operating companies could also be subject to exclusion from participation in the Medicare or Medicaid programs in some circumstances as well, in addition to any monetary or other fines, penalties or sanctions that we may incur under applicable federal and/or state law. Our repayment of any such amounts, as well as any fines, penalties or other sanctions that we may incur, could be significant and could have a material and adverse effect on our results of operations and financial condition.
From time to time we are also involved in various external governmental investigations, audits and reviews. Reviews, audits and investigations of this sort can lead to government actions, which can result in the assessment of damages, civil or criminal fines or penalties, or other sanctions, including restrictions or changes in the way we conduct business, loss of licensure or exclusion from participation in government programs. For example, the OIG conducts a variety of routine, regular and special investigations, audits and reviews across our industry. Failure to comply with applicable laws, regulations and rules could have a material and adverse effect on our results of operations and financial condition. Furthermore, becoming subject to these governmental investigations, audits and reviews can also require us to incur significant legal and document production expenses as we cooperate with the government authorities, regardless of whether the particular investigation, audit or review leads to the identification of underlying issues. For example, as discussed under “Creekside Hospice Litigation,” "Therapy Matters Investigation," and "Staffing Matters Investigation " in Note 20, “Commitments and Contingencies - Legal Proceedings,” in the notes to the consolidated financial statements included elsewhere in this report, the government has investigated and has elected to intervene in two pending qui tam actions that allege violations of the FCA and the Nevada False Claims Act in connection with the operations of our affiliated Las Vegas, Nevada hospice, and the government is investigating and has expressed its intent to pursue litigation against us in connection with two other pending investigations. We have accrued $7.5 million as a contingent liability in connection with the Creekside Hospice Litigation and a combined $30.0 million as a contingent liability in connection with the other two aforementioned investigations, but it could ultimately cost more than that amount to settle or otherwise resolve these matters, including to satisfy any judgment that might be rendered against us if our litigation defense were ultimately unsuccessful.
Recently enacted changes in Medicare reimbursements for physician and non-physician services could impact reimbursement for medical professionals. Moreover, payment caps that limit the amounts that can be paid for outpatient therapy services rendered to any Medicare beneficiary may negatively affect our results of operations.
The Medicare Access and CHIP Reauthorization Act revised the payment system for physician and non-physician services. Section 1 of that law, the SGR repeal and Medicare Provider Payment Modernization will impact payment provisions for medical professional services. That enactment also extended for two years provisions that permit an exceptions process from therapy caps imposed on Medicare Part B outpatient therapy. There is a combined cap for PT and SLP and a separate cap for OT services that apply subject to certain exceptions. The discontinuation or change in the current cap exception process or future modifications of the Medicare Part B cap structure could have an adverse effect on the revenue that we generate through our rehabilitation therapy business. This could in turn have a negative effect on our financial condition and results of operations.
Section 202 of that enactment extended the current therapy cap exceptions process through December 31, 2017 and altered provisions for MMR. The MMR requirement generally provides that, on a per beneficiary basis and subject to limited exceptions, services above $3,700 for PT and SLP services combined and/or $3,700 for OT services are subject
23
to MMR (typically on a pre-payment basis) by the applicable Medicare contractors. In addition to extending the exceptions process, Section 202 altered the procedures CMS must follow in determining cases to review by MMR.
Outpatient therapy services are also subject to a multiple procedure payment reduction (MPPR). Under the MPPR policy, when PT, OT and SLP services are performed on the same day for the same patient and paid under Medicare Part B, then Medicare effectively makes a full reimbursement payment for only one of the procedures and the reimbursements for the other procedures are at a reduced rate. The application of the MPPR policy has negatively affected our therapy business and will continue to do so as long as the policy is in effect.
We are subject to extensive and complex laws and government regulations. If we are not operating in compliance with these laws and regulations or if these laws and regulations change, we could be required to make significant expenditures or change our operations in order to bring our facilities and operations into compliance.
We, along with other companies in the healthcare industry, are required to comply with extensive and complex laws and regulations at the federal, state and local government levels relating to, among other things:
• licensure and certification;
• adequacy and quality of healthcare services;
• qualifications of healthcare and support personnel;
• quality of medical equipment;
• confidentiality, maintenance and security issues associated with medical records and claims processing;
• relationships with physicians and other referral sources and recipients;
• constraints on protective contractual provisions with patients and third-party payors;
• operating policies and procedures;
• addition of facilities and services; and
• billing for services.
Many of these laws and regulations are expansive, and we do not always have the benefit of significant guidance or judicial interpretation of these laws and regulations. In addition, many of these laws and regulations evolve to include additional obligations and restrictions, sometimes with retroactive effect. Certain other regulatory developments, such as revisions in the building code requirements for assisted/senior living and skilled nursing facilities, mandatory increases in scope and quality of care to be offered to residents, revisions in licensing and certification standards, mandatory staffing levels, regulations regarding conditions for payment and regulations restricting those we can hire could also have a material adverse effect on us. In the future, different interpretations or enforcement of these laws and regulations could subject our current or past practices to allegations of impropriety or illegality or could require us to make changes in our facilities, equipment, personnel, services, capital expenditure programs and operating expenses.
The Bi-Partisan Budget Act enacted in October 2015 included a provision that requires government agencies to update CMPs to reflect current value no later than April 1, 2016. The breadth of the statute covers an array of penalty provisions across differing government agencies. This provision will expose our services to higher penalties and payment withholds.
In addition, federal and state government agencies have increased and coordinated civil and criminal enforcement efforts as part of numerous ongoing investigations of healthcare companies, including skilled nursing facilities. This includes investigations of:
• fraud and abuse;
• quality of care;
24
• financial relationships with referral sources; and
• the medical necessity of services provided.
We are unable to predict the future course of federal, state and local regulation or legislation, including Medicare and Medicaid statutes and regulations, the intensity of federal and state enforcement actions or the extent and size of any potential sanctions, fines or penalties. Changes in the regulatory framework, our failure to obtain or renew required regulatory approvals or licenses or to comply with applicable regulatory requirements, the suspension or revocation of our licenses or our disqualification from participation in federal and state reimbursement programs, or the imposition of other enforcement sanctions, fines or penalties could have a material adverse effect upon our results of operations, financial condition and liquidity. Furthermore, should we lose licenses or certifications for a number of our facilities or other businesses as a result of regulatory action, legal proceedings such as those described in Note 20, “Commitments and Contingencies-Legal Proceedings,” or otherwise, we could be deemed to be in default under some of our agreements, including agreements governing outstanding indebtedness and the report of such issues at one of our facilities could harm our reputation for quality care and lead to a reduction in our patient referrals and ultimately our revenue and operating income.
Our physician services operations are subject to corporate practice of medicine laws and regulations. Our failure to comply with these laws and regulations could have a material adverse effect on our business and operations.
One line of our business that we continue to develop is physician services. Certain states have laws and regulations prohibiting the corporate practice of medicine and fee-splitting, which generally prohibit business entities from owning or controlling medical practices or may limit the ability of clinical professionals to share professional service income with non-professional or business interests. These requirements may vary significantly from state to state. Compliance with applicable regulations may cause us to incur expenses that we have not anticipated, and if we are unable to comply with these additional legal requirements, we may incur liability, which could have a material adverse effect on our business and consolidated financial condition, results of operations and cash flows.
We face inspections, reviews, audits and investigations under federal and state government programs and contracts. These audits could have adverse findings that may negatively affect our business, including our results of operations, liquidity and financial condition.
As a result of our participation in the Medicare and Medicaid programs, we are subject to various governmental inspections, reviews, audits and investigations to verify our compliance with these programs and applicable laws and regulations. Managed care payors may also reserve the right to conduct audits. We also periodically conduct internal audits and reviews of our regulatory compliance. An adverse inspection, review, audit or investigation could result in:
• refunding amounts we have been paid pursuant to the Medicare or Medicaid programs or from managed care payors;
• state or federal agencies imposing fines, penalties and other sanctions on us;
• temporary suspension of payment for new patients to the facility or agency;
• decertification or exclusion from participation in the Medicare or Medicaid programs or one or more managed care payor networks;
• self-disclosure of violations to applicable regulatory authorities;
• damage to our reputation;
• the revocation of a facility's or agency's license; and
• loss of certain rights under, or termination of, our contracts with managed care payors.
We have in the past and will likely in the future be required to refund amounts we have been paid and/or pay fines and penalties, as a result of these inspections, reviews, audits and investigations. If adverse inspections, reviews, audits or investigations occur and any of the results noted above occur, it could have a material adverse effect on our business
25
and operating results. Furthermore, the legal, document production and other costs associated with complying with these inspections, reviews, audits or investigations could be significant.
Our operations are subject to environmental and occupational health and safety regulations, which could subject us to fines, penalties and increased operational costs.
We are subject to a wide variety of federal, state and local environmental and occupational health and safety laws and regulations. Regulatory requirements faced by healthcare providers such as us include those relating to air emissions, wastewater discharges, air and water quality control, occupational health and safety (such as standards regarding blood-borne pathogens and ergonomics), management and disposal of low-level radioactive medical waste, biohazards and other wastes, management of explosive or combustible gases, such as oxygen, specific regulatory requirements applicable to asbestos, lead-based paints, polychlorinated biphenyls and mold, other occupational hazards associated with our workplaces, and providing notice to employees and members of the public about our use and storage of regulated or hazardous materials and wastes. Failure to comply with these requirements could subject us to fines, penalties and increased operational costs. Moreover, changes in existing requirements or more stringent enforcement of them, as well as discovery of currently unknown conditions at our owned or leased facilities, could result in additional cost and potential liabilities, including liability for conducting cleanup, and there can be no guarantee that such increased expenditures would not be significant.
Risks Relating to Our Operations
Our substantial indebtedness, scheduled maturities and disruptions in the U.S. and global financial markets could affect our ability to obtain financing or to extend or refinance debt as it matures, which could negatively impact our results of operations, liquidity, financial condition and the market price of our common stock.
We have now and will for the foreseeable future continue to have a significant amount of indebtedness. At December 31, 2015, our total indebtedness was approximately $1,230.2 million. Our substantial indebtedness could have important consequences. For example, it could:
• increase our vulnerability to adverse economic and industry conditions;
• require us to dedicate a substantial portion of our cash flow from operations to payments on our indebtedness, thereby reducing the availability of our cash flow to fund working capital, capital expenditures and other general corporate purposes;
• limit our flexibility in planning for, or reacting to, changes in our business and the industry in which we operate;
• place us at a competitive disadvantage compared to our competitors that have less debt;
• increase the cost or limit the availability of additional financing, if needed or desired, to fund future working capital, capital expenditures and other general corporate requirements, or to carry out other aspects of our business plan;
• require us to maintain debt coverage and financial ratios at specified levels, reducing our financial flexibility; and
• limit our ability to make strategic acquisitions and develop new or expanded facilities.
As of December 31, 2015, we have debt obligations that, as a result of scheduled maturity dates or maturity date acceleration features, have $710.5 million of aggregate maturities in 2017. If we are unable to extend (or refinance, as applicable) any of our maturing credit facilities prior to their scheduled maturity or accelerated maturity dates, our liquidity and financial condition could be adversely impacted. In addition, even if we are able to extend or refinance our
26
maturing debt credit facilities, the terms of the new financing may be less favorable to us than the terms of the existing financing.
In recent years, the United States stock and credit markets have experienced significant price volatility, dislocations and liquidity disruptions, which caused market prices of many stocks to fluctuate substantially and the spreads on prospective debt financings to widen considerably. These circumstances materially impacted liquidity in the financial markets, making terms for certain financings less attractive, and in some cases resulted in the unavailability of financing. Continued uncertainty in the stock and credit markets may negatively impact our ability to access additional financing (including any refinancing or extension of our existing debt) on reasonable terms, which may negatively affect our business.
A prolonged downturn in the financial markets may cause us to seek alternative sources of potentially less attractive financing, and may require us to further adjust our business plan accordingly. These events also may make it more difficult or costly for us to raise capital, including through the issuance of common stock. Disruptions in the financial markets could have an adverse effect on us and our business. If we are not able to obtain additional financing on favorable terms, we also may have to delay or abandon some or all of our growth strategies, which could adversely affect our revenues and results of operations.
We are subject to numerous covenants and requirements under our various credit and leasing agreements and a breach of any such covenants or requirements could, unless timely and effectively remediated, lead to default and potential cross default under such agreements.
Our credit and leasing agreements contain various covenants, restrictions and events of default. Among other things, these provisions require us to maintain certain financial ratios and minimum tangible net worth. Breaches of these covenants could result in defaults under the instruments governing the applicable loans and leases, in addition to any other indebtedness or leases cross-defaulted against such instruments. These defaults could have a material adverse impact on our business, results of operations and financial condition.
Despite our substantial indebtedness, we may still be able to incur more debt. This could intensify the risks associated with this indebtedness.
The terms of our credit facilities contain restrictions on our ability to incur additional indebtedness. These restrictions are subject to a number of important qualifications and exceptions, and the indebtedness incurred in compliance with these exceptions could be substantial. Accordingly, we could incur significant additional indebtedness in the future. The more we become leveraged, the more we become exposed to the risks described above under “Our substantial indebtedness could adversely affect our financial health and prevent us from fulfilling our financial obligations.”
Our credit and leasing agreements may restrict our current and future operations, which could adversely affect our ability to respond to changes in our business and manage our operations.
The terms of our credit and leasing agreements include a number of restrictive covenants that impose significant operating and financial restrictions on us and our restricted subsidiaries, including restrictions on our and our restricted subsidiaries’ ability to, among other things:
• incur additional indebtedness;
• consolidate or merge;
• make or incur capital improvements;
• sell assets; and
• make investments, loans and acquisitions.
27
These restrictions could have an adverse effect on our business by limiting our ability to take advantage of financing, merger and acquisition or other opportunities.
Floating rate indebtedness subjects us to interest rate risk, which could cause our debt service obligations to increase.
We will have significant indebtedness in multiple instruments that bear interest at variable rates. Interest rate changes could affect the amount of our interest payments, and accordingly, our future earnings and cash flows, assuming other factors are held constant. As a result, an increase in interest rates, whether because of an increase in market interest rates or an increase in our own cost of borrowing, would increase the cost of servicing our debt and could materially reduce our profitability. See Item 7. “Management’s Discussion and Analysis of Financial Conditions and Results of Operations - Liquidity and Capital Resources” and Item 7A. “Quantitative and Qualitative Disclosures About Market Risk” for a description of the types and level of indebtedness.
Significant legal actions, which are commonplace in our industry, could subject us to increased operating costs which would materially and adversely affect our results of operations, liquidity and financial condition.
The long-term care industry has experienced an increasing trend in the number and severity of litigation claims. We believe that this trend is endemic to the industry and is a result of a variety of factors, including the number of large verdicts, including large punitive damage awards, against long-term care providers in recent years resulting in an increased awareness by plaintiffs' lawyers of potentially large recoveries. While some states have enacted tort reform legislation that limits plaintiffs' recoveries in some respects, should our professional liability and general liability costs increase significantly in the future, our operating income could suffer.
We also may be subject to lawsuits under the FFCA and comparable state laws for submitting allegedly fraudulent or otherwise inappropriate bills for services to the Medicare and Medicaid programs. These lawsuits, which may be initiated by government authorities as well as private party relators, can involve significant monetary damages, fines, attorney fees and the award of bounties to private plaintiffs who successfully bring these suits, as well as to the government programs. In recent years, government oversight and law enforcement have become increasingly active and aggressive in investigating and taking legal action against potential fraud and abuse. See Note 20, “Commitments and Contingencies-Legal Proceedings,” in the notes to the consolidated financial statements included elsewhere in this report for pending litigation and investigations which, based upon information currently available, could have a potentially material adverse effect on our results of operations, financial position or cash flows.
We may incur significant liabilities in conjunction with legal actions against us, including as a result of damages, fines and penalties that may be assessed against us, as well as a result of the sometimes significant commitments of financial and management resources that are often required to defend against such legal actions. The incurrence of such liabilities and related commitments of resources could materially and adversely affect our business, financial condition and results of operations.
Insurance coverages, including professional liability coverage, may become increasingly expensive and difficult to obtain for healthcare companies, and our self-insurance may expose us to significant losses.
It may become more difficult and costly for us to obtain coverage for patient care liabilities and certain other risks, including property and casualty insurance. Insurance carriers may require healthcare companies to increase significantly their self-insured retention levels and/or pay substantially higher premiums for reduced coverage for most insurance coverages, including workers' compensation, employee healthcare and patient care liability.
We self-insure a significant portion of our potential liabilities for several risks, including certain types of professional and general liability, workers' compensation and employee healthcare benefits. Due to our self-insured retentions under many of our professional and general liability, workers' compensation and employee healthcare benefits programs, there is no limit on the maximum number of claims or amount for which we can be liable in any policy period. We base our loss estimates and related accruals on actuarial analyses, which determine expected liabilities on an undiscounted basis, including incurred but not reported losses, based upon the available information on a given date. It is possible, however, for the ultimate amount of losses to exceed our estimates and related accruals, as well as our
28
insurance limits as applicable. In the event our actual liability exceeds our estimates for any given period, our results of operations and financial condition could be materially adversely impacted. Additionally, we may from time to time need to increase our accruals as a result of future actuarial reviews and claims that may develop. Such increases could have an adverse impact on our business and results of operations. An adverse determination in legal proceedings, whether currently asserted or arising in the future, could have a material adverse effect on our business and results of operations.
Failure to maintain effective internal control over our financial reporting could have an adverse effect on our ability to report our financial results on a timely and accurate basis.
We produce our consolidated financial statements in accordance with the requirements of accounting principles generally accepted in the United States of America (U.S. GAAP). Effective internal control over financial reporting is necessary for us to provide reliable financial reports, to help mitigate the risk of fraud and to operate successfully. We are required by federal securities laws to document and test our internal control procedures in order to satisfy the requirements of the Sarbanes-Oxley Act of 2002, which requires annual management assessments of the effectiveness of our internal control over financial reporting.
Testing and maintaining our internal control over financial reporting can be expensive and divert our management's attention from other matters that are important to our business. We may not be able to conclude on an ongoing basis that we have effective internal control over financial reporting in accordance with applicable law, or our independent registered public accounting firm may not be able or willing to issue an unqualified attestation report if we conclude that our internal control over financial reporting is not effective. As described in Item 9A. "Controls and Procedures—Management's Report on Internal Control over Financial Reporting," management has concluded that, because of a material weakness with respect to segregation of duties and related information technology general controls within our general ledger, payroll/human resources, and accounts payable IT system applications affecting capital expenditures; accounts payable; accrued compensation; salaries, wages, and benefits; general and administrative costs; and other operating expenses, our internal control over financial reporting was not effective as of December 31, 2015. If the new controls being implemented to address the material weakness and to strengthen the overall internal control over financial reporting are not designed or do not operate effectively, if we are unsuccessful in implementing or following these new processes or are otherwise unable to remediate this material weakness, this may result in untimely or inaccurate reporting of our financial condition or results of operations.
We also cannot provide assurance that our internal control over financial reporting will be operating effectively in the future. If we fail to maintain effective internal control over financial reporting, or our independent registered public accounting firm is unable to provide us with an unqualified attestation report on our internal control, we could be required to take costly and time-consuming corrective measures, be required to restate the affected historical financial statements, be subjected to investigations and/or sanctions by federal and state securities regulators, and be subjected to civil lawsuits by security holders. Any of the foregoing could also cause investors to lose confidence in our reported financial information and in our company and would likely result in a decline in the market price of our stock and in our ability to raise additional financing if needed in the future.
Changes in the acuity mix of patients as well as payor mix and payment methodologies may significantly reduce our profitability or cause us to incur losses.
Our revenue is affected by our ability to attract a favorable patient acuity mix and by our mix of payment sources. Changes in the type of patients we attract, as well as our payor mix among private payors, managed care companies, Medicare (both traditional Medicare and "managed" Medicare/Medicare Advantage) and Medicaid significantly affect our profitability because not all payors reimburse us at the same rates. Particularly, if we fail to maintain our proportion of high-acuity patients or if there is any significant increase in the percentage of our population for which we receive Medicaid reimbursement, our financial position, results of operations and cash flow may be adversely affected. Furthermore, in recent periods we have continued to see a shift from “traditional” fee-for-service Medicare patients to “managed” Medicare (Medicare Advantage) patients. Reimbursement rates are generally lower for services provided to Medicare Advantage patients than they are for the same services provided to traditional fee-for-service Medicare patients. This trend may continue in future periods. Our financial results have been negatively affected by this shift to
29
date. Our financial results will continue to be negatively affected if the trend towards Medicare Advantage continues, and particularly if it accelerates.
Federal, state and local employment-related laws and regulations could increase our cost of doing business and subject us to significant back pay awards, fines and lawsuits.
Our operations are subject to a variety of federal, state and local employment-related laws and regulations, including, but not limited to, the U.S. Fair Labor Standards Act, which governs such matters as minimum wages, the Family Medical Leave Act, overtime pay, compensable time, recordkeeping and other working conditions, Title VII of the Civil Rights Act, the ACA, the Employee Retirement Income Security Act, the Americans with Disabilities Act, the National Labor Relations Act, regulations of the Equal Employment Opportunity Commission, regulations of the Office of Civil Rights, regulations of the Department of Labor, regulations of state attorneys general, federal and state wage and hour laws, and a variety of similar laws enacted by the federal and state governments that govern these and other employment-related matters. Because labor represents such a large portion of our operating costs, compliance with these evolving federal and state laws and regulations could substantially increase our cost of doing business while failure to do so could subject us to significant back pay awards, fines and lawsuits. We are currently subject to employee-related claims in connection with our operations. These claims, lawsuits and proceedings are in various stages of adjudication or investigation and involve a wide variety of claims and potential outcomes. In addition, federal proposals to introduce a system of mandated health insurance and flexible work time and other similar initiatives could, if implemented, adversely affect our operations. Our failure to comply with federal and state employment-related laws and regulations could have a material adverse effect on our business, financial position, results of operations and liquidity.
It can be difficult to attract and retain qualified nurses, therapists, healthcare professionals and other key personnel, which, along with a growing number of minimum wage and compensation related regulations, can increase our costs related to these employees.
Our employees are our most important asset. We rely on our ability to attract and retain qualified nurses, therapists and other healthcare professionals. The market for these key personnel is highly competitive, and we could experience significant increases in our operating costs due to shortages in their availability. Like other healthcare providers, we have at times experienced difficulties in attracting and retaining qualified personnel, especially facility administrators, nurses, therapists, certified nurses' aides and other important healthcare personnel. We may continue to experience increases in our labor costs, primarily due to higher wages and greater benefits required to attract and retain qualified healthcare personnel, and such increases may adversely affect our profitability. Furthermore, while we attempt to manage overall labor costs in the most efficient way, our efforts to manage them through wage freezes and similar means may have limited effectiveness and may lead to increased turnover and other challenges.
Tight labor markets and high demand for such employees can contribute to high turnover among clinical professional staff. A shortage of qualified personnel at a facility could result in significant increases in labor costs and increased reliance on overtime and expensive temporary staffing agencies, and could otherwise adversely affect operations at the affected facilities. If we are unable to attract and retain qualified professionals, our ability to adequately provide services to our residents and patients may decline and our ability to grow may be constrained.
Our cost of labor may be influenced by unanticipated factors in certain markets or, with respect to collective bargaining agreements that we are a party to, we may experience above-market increases. A substantial number of our employees are hourly employees whose wage rates are affected by increases in the federal or state minimum wage rate. As collective bargaining agreements are renegotiated or minimum wage rates increase we may need to increase the wages paid to employees. This may be applicable to not only minimum wage employees but also to employees at wage rates which are currently above the minimum wage.
The Department of Labor recently issued proposed rule changes to the Fair Labor Standards Act that would increase the minimum salary threshold for employees exempt from overtime along with an automatic annual increase to this salary threshold. This proposed change, as well as other potential changes, could increase our cost of services provided.
30
Because we are largely funded by government programs, we do not have an ability to pass such wage increases through to revenue sources. Any such mandated wage increases could have a material adverse effect on our results of operations, liquidity and financial condition.
If we are unable to comply with state minimum staffing requirements at one or more of our facilities, we could be subject to fines or other sanctions.
In most of the states where we operate, our skilled nursing facilities are subject to state mandated staffing ratios that require minimum nursing hours of direct care per resident per day. Our ability to satisfy any minimum staffing requirements depends upon our ability to attract and retain qualified healthcare professionals, including nurses, certified nurse's assistants and other personnel. Attracting and retaining qualified personnel is difficult, given a tight labor market for these professionals in many of the markets in which we operate. Furthermore, if states do not appropriate additional funds (through Medicaid program appropriations or otherwise) sufficient to pay for any additional operating costs resulting from minimum staffing requirements, our profitability may be materially adversely affected. Failure to comply with these requirements can, among other things, jeopardize a facility's compliance with the conditions of participation under relevant state and federal healthcare programs. In addition, if a facility is determined to be out of compliance with these requirements, it may be subject to a notice of deficiency, a citation, or a significant fine or litigation risk. Deficiencies (depending on the level) may also result in the suspension of patient admissions and/or the termination of Medicaid participation, or the suspension, revocation or nonrenewal of the skilled nursing facility's license. If the federal or state governments were to issue regulations which materially change the way compliance with the minimum staffing standard is calculated or enforced, our labor costs could increase and the current shortage of healthcare workers could impact us more significantly.
If we fail to attract patients and residents and to compete effectively with other healthcare providers, our revenue and profitability may decline and we may incur losses.
The healthcare services industry is highly competitive. Our skilled nursing facilities compete primarily on a local and regional basis with other skilled nursing facilities and with assisted/senior living facilities, from national and regional chains to smaller providers owning as few as a single facility. Competitors include other for-profit providers as well as non-profits, religiously-affiliated facilities, and government-owned facilities. We also compete under certain circumstances with inpatient rehabilitation facilities and long-term acute care hospitals. Our ability to compete successfully varies from location to location and depends on a number of factors, including the number of competing facilities in the local market and the types of services available at those facilities, our local reputation for quality care of patients, the commitment and expertise of our caregivers, our local service offerings and treatment programs, the cost of care in each locality, and the physical appearance, location, age and condition of our facilities. If we are unable to attract patients to our facilities and agencies, particularly high-acuity patients, then our revenue and profitability will be adversely affected. Some of our competitors may have greater recognition and be more established in their respective communities than we are, and may have greater financial and other resources than we have. Competing long-term care companies may also offer newer facilities or different programs or services than we do, which, combined with the foregoing factors, may result in our competitors being more attractive to our current patients, to potential patients and to referral sources. Furthermore, while we budget for routine capital expenditures at our facilities to keep them competitive in their respective markets, to the extent that competitive forces cause those expenditures to increase in the future, our financial condition may be negatively affected.
We believe we utilize a conservative approach in complying with laws prohibiting kickbacks and referral payments to referral sources. If our competitors use more aggressive methods than we do with respect to obtaining patient referrals, our competitors may from time to time obtain patient referrals that are not otherwise available to us.
The primary competitive factors for our assisted/senior living and rehabilitation therapy services are similar to those for our skilled nursing businesses and include reputation, the cost of services, the quality of services, responsiveness to patient/resident needs and the ability to provide support in other areas such as third-party reimbursement, information management and patient recordkeeping. Furthermore, given the relatively low barriers to entry and continuing healthcare cost containment pressures, we expect that the markets we service will become
31
increasingly competitive in the future. Increased competition in the future could limit our ability to attract and retain patients and residents, maintain or increase our fees, or expand our business.
If our referral sources fail to view us as an attractive healthcare provider, our patient base would likely decrease.
We rely significantly on appropriate referrals from physicians, hospitals and other healthcare providers in the communities in which we deliver our services to attract the kinds of patients we target. Our referral sources are not obligated to refer business to us and generally also refer business to other healthcare providers. We believe many of our referral sources refer business to us as a result of the quality of our patient care and our efforts to establish and build a relationship with them. If we lose, or fail to maintain, existing relationships with our referral resources, fail to develop new relationships or if we are perceived by our referral sources for any reason as not providing quality patient care, our volume of referrals would likely decrease, the quality of our patient mix could suffer and our revenue and results of operations could be adversely affected.
If we do not achieve or maintain a reputation for providing quality of care, our business may be negatively affected.
Our ability to achieve and maintain a reputation for providing quality of care to our patients at each of our skilled nursing and assisted/senior living facilities, or through our rehabilitation therapy, is important to our ability to attract and retain patients, particularly high-acuity patients. In some instances, our referral sources are affiliated with healthcare systems that may have affiliated businesses that offer services that compete with ours, and the frequency of this occurring may increase in the future as accountable care organizations are formed in the markets we serve. We believe that the perception of our quality of care by a potential patient or potential patient's family seeking to contract for our services is influenced by a variety of factors, including physician and other healthcare professional referrals, community information and referral services, newspapers and other print and electronic media, results of patient surveys, recommendations from family and friends, and quality care statistics or rating systems compiled and published by CMS or other industry data. Through our focus on retaining quality staffing, reviewing feedback and surveys from our patients and referral sources to highlight areas of improvement and integrating our service offerings at each of our facilities, we seek to maintain and improve on the outcomes from each of the factors listed above in order to build and maintain a strong reputation at our facilities. If we fail to achieve or maintain a reputation for providing quality care, or are perceived to provide a lower quality of care than competitors within the same geographic area, our ability to attract and retain patients would be adversely affected. If our businesses fail to maintain a strong reputation in the areas in which we operate, our business, revenue and profitability could be adversely affected.
Our success is dependent upon retaining key executives and personnel.
Our senior management team has extensive experience in the healthcare industry. We believe that they have been instrumental in guiding our businesses, instituting valuable performance and quality monitoring, and driving innovation. Our future performance is substantially dependent upon the continued services of our senior management team or their successors. The loss of the services of any of these persons could have a material adverse effect upon us.
We may be unable to reduce costs to offset decreases in our patient census levels or other expenses completely.
We depend on implementing adequate cost management initiatives in response to fluctuations in levels of patient census in our businesses in order to maintain our current cash flow and earnings levels. Fluctuation in our patient census levels may become more common as we continue our emphasis in our skilled nursing facilities on patients with shorter stays but higher acuities. A decline in patient census levels would likely result in decreased revenue. If we are unable to put in place corresponding reductions in costs in response to decreases in our patient census or other revenue shortfalls, our financial condition and operating results could be adversely affected. There are limits in our ability to reduce the costs of our centers because we must maintain staffing levels.
32
We may not be fully reimbursed for all services that our skilled nursing facilities are able to bill through Medicare's consolidated billing requirements.
Skilled nursing facilities are required to bill Medicare on a consolidated basis for certain items and services that they furnish to patients and residents, regardless of the amount or costs of services that the patients and residents actually receive. The consolidated billing requirement essentially confers on the skilled nursing facility itself the Medicare billing responsibility for the entire package of care that its residents receive in these situations. Federal law also requires that post-hospitalization skilled nursing services be “bundled” into the hospital's Diagnostic Related Group (DRG) payment in certain circumstances. Where this rule applies, the hospital and the skilled nursing facility must, in effect, divide the payment which otherwise would have been paid to the hospital alone for the patient's treatment, and no additional funds are paid by Medicare for skilled nursing care of the patient. This requirement may, in instances where it is applicable, have a negative effect on skilled nursing facility utilization/census and payments, either because hospitals may find it difficult to place patients in skilled nursing facilities which will not be paid as they previously were, or because hospitals are reluctant to discharge patients to skilled nursing facilities and lose a portion of the payment that the hospital would otherwise receive. This bundling requirement could be extended to more DRGs in the future, which could exacerbate the potentially negative impact on skilled nursing facility utilization/census and payments. As a result of the bundling requirements we may not be fully reimbursed for all services that a facility bills through consolidated billing, which could adversely affect our results of operations and financial condition.
Consolidation of managed care organizations and other third-party payors or reductions in reimbursement from these payors may adversely affect our revenue and income or cause us to incur losses.
Managed care organizations and other third-party payors have in many instances consolidated in order to enhance their ability to influence the delivery of healthcare services. Consequently, the healthcare needs of a large percentage of the United States population are increasingly served by a small number of managed care organizations. These organizations generally enter into service agreements with a limited number of providers for needed services. These organizations have become an increasingly important source of revenue and referrals for us. To the extent that such organizations terminate us as a preferred provider or engage our competitors as a preferred or exclusive provider, our business could be materially adversely affected.
In addition, private third-party payors, including managed care payors, are continuing their efforts to control healthcare costs through direct contracts with healthcare providers, increased utilization reviews, or reviews of the propriety of, and charges for, services provided, and greater enrollment in managed care programs and preferred provider organizations. As these private payors increase their purchasing power, they are demanding discounted fee structures and the assumption by healthcare providers of all or a portion of the financial risk associated with the provision of care. Significant reductions in reimbursement from these sources could materially adversely affect our business and financial condition.
Delays in reimbursement may cause liquidity problems.
If we have information systems problems or payment or other issues arise with Medicare, Medicaid or other payors that affect the amount or timeliness of reimbursements, we may encounter delays in our payment cycle. Any significant payment timing delay could cause us to experience working capital shortages. As a result, working capital management, including prompt and diligent billing and collection, is an important factor in our consolidated results of operations and liquidity. Our working capital management procedures may not successfully mitigate the effects of any delays in our receipt of payments or reimbursements. Accordingly, such delays could have an adverse effect on our liquidity and financial condition.
Our rehabilitation and other related healthcare services are also subject to delays in reimbursement, as we act as vendors to other providers who in turn must wait for reimbursement from other third-party payors. Each of these customers is therefore subject to the same potential delays to which our nursing homes are subject, meaning any such delays would further delay the date we would receive payment for the provision of our related healthcare services. To the extent we grow and expand the rehabilitation and other complementary services that we offer to third parties, we may incur increasing delays in payment for these services, and these payment delays could have an adverse effect on our
33
liquidity and financial condition. We may also experience delays in reimbursement related to change of ownership applications for our acquired facilities, as well as changes in fiscal intermediaries.
Completed and future acquisitions may use significant resources, may be unsuccessful and could expose us to unforeseen liabilities and integration risks.
We have in the past pursued, and expect to pursue in the future, selective acquisitions and the development of skilled nursing facilities, contract rehabilitation therapy businesses, and other related healthcare operations. Acquisitions may involve significant cash expenditures, debt incurrence, operating losses and additional expenses that could have a material adverse effect on our financial position, results of operations and liquidity. Acquisitions, including our recently completed acquisitions, involve numerous risks, including:
• difficulties integrating acquired operations, personnel and accounting and information systems, or in realizing projected efficiencies and cost savings;
• diversion of management's attention from other business concerns;
• potential loss of key employees or customers of acquired companies;
• entry into markets in which we may have limited or no experience;
• increased indebtedness and reduced ability to access additional capital when needed;
• assumption of unknown liabilities or regulatory issues of acquired companies, including failure to comply with healthcare regulations or to establish internal financial controls; and
• straining of our resources, including internal controls relating to information and accounting systems, regulatory compliance, logistics and others.
Furthermore, certain of the foregoing risks could be exacerbated when combined with other growth measures that we may pursue.
We lease a significant number of our facilities and may experience risks relating to lease termination, lease expense escalators, lease extensions and special charges.
We face risks because of the number of facilities we lease. As of December 31, 2015, we leased approximately 80% of our centers; 34% were leased from Welltower and 46% were leased pursuant to lease agreements with other landlords. The loss or deterioration of our relationship with Welltower may adversely affect our business.
Each of our lease agreements provides that the lessor may terminate the lease, subject to applicable cure provisions, for a number of reasons, including, the defaults in any payment of rent, taxes or other payment obligations or the breach of any other covenant or agreement in the lease. Termination of certain of our lease agreements could result in a cross-default under our debt agreements or other lease agreements.
Most of our lease agreements include average annual rent escalators ranging from 2.5% to 3.5%. These escalators could impact our ability to satisfy certain obligations and covenants, specifically coverage ratios. If the results of our operations do not increase at or above the escalator rates, it could place an additional burden on our results of operations, liquidity and financial position.
Our leases generally provide for renewal or extension options. We expect to renew or extend our leases in the normal course of business; however, there can be no assurance that these rights will be exercised in the future or that we will be able to satisfy the conditions precedent to exercising any such renewal or extension. In addition, if we are unable to renew or extend any of our master leases, we may lose all of the facilities subject to that master lease agreement. If we are not able to renew or extend our leases at or prior to the end of the existing lease terms, or if the terms of such options are unfavorable or unacceptable to us, our business, financial condition and results of operation could be adversely affected.
34
Leasing facilities pursuant to master lease agreements may limit our ability to exit markets. For instance, if one facility under a master lease becomes unprofitable, we may be required to continue operating such facility or, if allowed by the landlord to close such facility, we may remain obligated for the lease payments on such facility. We could incur special charges relating to the closing of such facility, including lease termination costs, impairment charges and other special charges that would reduce our profits and could have a material adverse effect on our business, financial condition or results of operations.
Our failure to pay the rent or otherwise comply with the provisions of any of our lease agreements could result in an “event of default” under such lease agreement and also could result in a cross default under other master lease agreements and the agreements for our indebtedness. Upon an event of default, remedies available to our landlords generally include, without limitation, terminating such lease agreement, repossessing and reletting the leased properties and requiring us to remain liable for all obligations under such lease agreement, including the difference between the rent under such lease agreement and the rent payable as a result of reletting the leased properties, or requiring us to pay the net present value of the rent due for the balance of the term of such lease agreement. The exercise of such remedies would have a material adverse effect on our business, financial position, results of operations and liquidity.
Certain events or circumstances could result in the impairment of our assets or other charges, including, without limitation, impairments of goodwill and identifiable intangible assets that result in material charges to earnings.
Goodwill and identifiable intangible assets comprise approximately 11% of our total assets. We review the carrying value of certain long-lived assets, finite lived intangible assets and indefinite-lived intangible assets with respect to any events or circumstances that indicate an impairment or an adjustment to the amortization period may be necessary, such as when the market value of our common stock is below book equity value. On an ongoing basis, we also evaluate, based upon the fair value of our reporting units, whether the carrying value of our goodwill is impaired. If circumstances suggest that the recorded amounts of any of these assets cannot be recovered based upon estimated future cash flows, the carrying values of such assets are reduced to fair value. If the carrying value of any of these assets is impaired, we may incur a material charge to earnings. See Note 18, “Asset Impairment Charges.”
Future adverse changes in the operating environment and related key assumptions used to determine the fair value of our reporting units and indefinite-lived intangible assets or a decline in the value of our common stock may result in future impairment charges for a portion or all of these assets. Moreover, the value of our goodwill and indefinite-lived intangible assets could be negatively impacted by potential healthcare reforms. Any such impairment charges could have a material adverse effect on our business, financial position and results of operations.
A portion of our workforce is unionized and our operations may be adversely affected by work stoppages, strikes or other collective actions.
As of December 31, 2015, approximately 8,900 of our 88,700 active employees were represented by unions and covered by collective bargaining agreements. In addition, certain labor unions have publicly stated that they are concentrating their organizing efforts within the long-term healthcare industry. We cannot predict the effect that continued union representation or future organizational activities will have on our business or future operations. There can be no assurance that we will not experience a material work stoppage in the future.
Disasters and similar events may seriously harm our business.
Natural and man-made disasters and similar events, including terrorist attacks and acts of nature such as hurricanes, tornados, earthquakes, floods and wildfires, may cause damage or disruption to us, our employees and our facilities, which could have an adverse impact on our patients and our business. In order to provide care for our patients, we are dependent on consistent and reliable delivery of food, pharmaceuticals, utilities and other goods to our facilities, and the availability of employees to provide services at our facilities and other locations. If the delivery of goods or the ability of employees to reach our facilities and patients were interrupted in any material respect due to a natural disaster or other reasons, it would have a significant impact on our business. Furthermore, the impact, or impending threat, of a natural disaster has in the past and may in the future require that we evacuate one or more facilities, which would be costly and would involve risks, including potentially fatal risks, for the patients and employees. The impact of disasters and similar
35
events is inherently uncertain. Such events could harm our patients and employees, severely damage or destroy one or more of our facilities, harm our business, reputation and financial performance, or otherwise cause our business to suffer in ways that we currently cannot predict.
The operation of our business is dependent on effective and secure information systems.
We depend on several information technology systems for the efficient functioning of our business. The software programs supporting these systems are licensed to us by independent software developers. Our inability or the inability of these developers to continue to maintain and upgrade these information systems and software programs could disrupt or reduce the efficiency of our operations. In addition, costs and potential problems and interruptions associated with the implementation of new or upgraded systems and technology or with maintenance or adequate support of existing systems could also disrupt or reduce the efficiency of our operations. Furthermore, while we budget for changes and upgrades to our information technology systems that we anticipate needing over time, it is possible that we may underestimate the actual costs of those changes and upgrades. Failure to make necessary changes and upgrades due to financial or other concerns could negatively impact the effectiveness of our information technology systems, as well as our operations and financial performance.
Additionally, we maintain information necessary to conduct our business, including confidential and proprietary information as well as personal information regarding our patients, employees and others with whom we do business, in digital form. Data maintained in digital form is subject to the risk of tampering, theft and unauthorized access. We develop and maintain systems to prevent this from occurring, but the development and maintenance of these systems is costly and requires ongoing monitoring and updating as technologies change and efforts to overcome security measures become more sophisticated. Moreover, despite our efforts, the possibility of tampering, theft and other unauthorized access cannot be eliminated entirely, and risks associated with each of these remain. If our information technology systems are compromised and personal or other protected information regarding patients, employees or others with whom we do business is stolen, tampered with or otherwise improperly accessed, our ability to conduct our business and our reputation may be impaired. If personal or other protected information of our patients, employees or others with whom we do business is tampered with, stolen or otherwise improperly accessed, and we may incur significant costs to remediate possible injury to the affected persons, compensate the affected persons, pay any applicable fines, or take other action with respect to judicial or regulatory actions arising out of the incident, including under HIPAA or the HITECH Act, as applicable.
Risks Related to Ownership of Our Class A Common Stock
The holders of a majority of the voting power of Genesis’ common stock have entered into a voting agreement, and the voting group’s interests may conflict with the interests of other holders.
The holders of a majority of the voting power of our common stock have entered into a voting agreement governing the election of our directors. These holders constitute a “group” (as such term is defined in Section 13(d) of the Exchange Act) controlling a majority of the voting power of our common stock (the Voting Group), and we therefore are a “controlled company.” Our Class A common stock, Class B common stock and Class C common stock each have one vote per share. As of December 31, 2015, the Voting Group owned shares of common stock representing approximately 63% of the combined voting power of our outstanding common stock. Accordingly, the Voting Group will generally have the power to control the outcome of matters on which stockholders are entitled to vote. Such matters include the election and removal of directors, the adoption or amendment of our certificate of incorporation and bylaws, possible mergers, corporate control contests and significant transactions. Through its control of elections to our board of directors, the Voting Group may also have the ability to appoint or replace our senior management and cause us to issue additional shares of our common stock or repurchase common stock, declare dividends or take other actions. The Voting Group may make decisions regarding our company and business that are opposed to our other stockholders’ interests or with which they disagree. The Voting Group may also delay or prevent a change of control of us, even if the change of control would benefit our other stockholders, which could deprive our other stockholders of the opportunity to receive a premium for their Class A common stock. The significant concentration of stock ownership and voting power may also adversely affect the trading price of our Class A common stock due to investors’ perception that conflicts of interest may
36
exist or arise. To the extent that the interests of our public stockholders are harmed by the actions of the Voting Group, the price of our Class A common stock may be harmed.
Some of our directors are significant stockholders or representatives of significant stockholders, which may present issues regarding the diversion of corporate opportunities and other potential conflicts.
Our board of directors includes certain of our significant stockholders and representatives of certain of our significant stockholders. Those stockholders and their affiliates may invest in entities that directly or indirectly compete with us, companies in which we transact business, or companies in which they are currently invested or in which they serve as an officer or director may already compete with us. As a result of these relationships, when conflicts between the interests of those stockholders or their affiliates and the interests of our other stockholders arise, these directors may not be disinterested.
Also, in accordance with Delaware law, our board of directors adopted resolutions to specify the obligation of certain of our directors to present certain corporate opportunities to us. Such directors are required to present to us any corporate opportunities in our main lines of business (as they may be expanded by our board of directors) and any other opportunity that is expressly offered as an opportunity for us. The resolutions renounce our rights to certain other business opportunities that do not meet those criteria. The resolutions further provide that such directors will not be liable to us or our stockholders for breach of any fiduciary duty that would otherwise exist by reason of the fact that any such individual directs a corporate opportunity (other than those certain types of opportunities set forth in the resolutions) to any person instead of us or is engaged in certain current business activities, or does not refer or communicate information regarding certain corporate opportunities to us. Accordingly, we may not be presented with certain corporate opportunities that we may find attractive and may wish to pursue.
Purchasers of our Class A common stock could incur substantial losses because of the volatility of our stock price.
Our stock price has been and is likely to continue to be volatile. The stock market in general often experiences substantial volatility that is seemingly unrelated to the operating performance of particular companies. These broad market fluctuations may adversely affect the trading price of our Class A common stock. The price for our Class A common stock may be influenced by many factors, including:
• the depth and liquidity of the market for our Class A common stock;
• developments generally affecting the healthcare industry;
• investor perceptions of us and our business;
• actions by institutional or other large stockholders;
• strategic actions, such as acquisitions or restructurings, or the introduction of new services by us or our competitors;
• new laws or regulations or new interpretations of existing laws or regulations applicable to our business;
• litigation and governmental investigations;
• changes in accounting standards, policies, guidance, interpretations or principles;
• adverse conditions in the financial markets, state and federal government or general economic conditions, including those resulting from statewide, national or global financial and deficit considerations, overall market conditions, war, incidents of terrorism and responses to such events;
• sales of Class B common stock;
• sales of units by the Voting Group or members of our management team;
• additions or departures of key personnel; and
• our results of operations, financial performance and future prospects.
37
These and other factors may cause the market price and demand for our Class A common stock to fluctuate substantially, which may limit or prevent investors from readily selling their shares of Class A common stock and may otherwise negatively affect the liquidity of our Class A common stock. In addition, in the past, when the market price of a stock has been volatile, holders of that stock have sometimes instituted securities class action litigation against the company that issued the stock. If any of our stockholders brought a lawsuit against us, we could incur substantial costs defending or settling the lawsuit. Such a lawsuit could also divert the time and attention of our management from our business.
If securities or industry analysts do not publish research or reports about our business, if they adversely change their recommendations regarding our stock or if our operating results do not meet their expectations, our stock price and trading volume could decline.
The trading market for our Class A common stock is significantly influenced by the research and reports that industry or securities analysts publish about us or our business. If one or more of these analysts cease coverage of us or fail to publish reports on us regularly, we could lose visibility in the financial markets, which in turn could cause our stock price or trading volume to decline. Moreover, if one or more of the analysts who cover us downgrade our stock or if our operating results do not meet their expectations, our stock price could decline.
We do not intend to pay dividends on our common stock.
We do not anticipate paying any cash dividends on our common stock in the foreseeable future. We currently anticipate that we will retain all of our available cash, if any, for use as working capital and for other general purposes, including to service or repay our debt and to fund the operation and expansion of our business. Any payment of future dividends will be at the discretion of our board of directors and will depend on, among other things, our earnings, financial condition, capital requirements, level of indebtedness, statutory and contractual restrictions applying to the payment of dividends and other considerations that our board of directors deems relevant.
We are a “controlled company” within the meaning of the New York Stock Exchange (NYSE) rules and, as a result, qualify for and rely on exemptions from certain corporate governance requirements.
Certain of our stockholders who are parties to a voting agreement control a majority of the voting power of our outstanding common stock. Under the NYSE rules, a company of which more than 50% of the voting power is held by another person or group of persons acting together is a “controlled company” and may elect not to comply with certain NYSE corporate governance requirements, including the requirements that:
• a majority of the board of directors consist of independent directors;
• the nominating and corporate governance committee be entirely composed of independent directors with a written charter addressing the committee’s purpose and responsibilities;
• the compensation committee be entirely composed of independent directors with a written charter addressing the committee’s purpose and responsibilities; and
• there be an annual performance evaluation of the nominating and corporate governance and compensation committees.
We elect to be treated as a controlled company and thus utilize some of these exemptions. Although we have adopted charters for our audit committee, our nominating, corporate governance, quality and compliance committee and our compensation committee, and conduct annual performance evaluations for these committees, none of these committees are composed entirely of independent directors, except for our audit committee. Our board is not composed of a majority of independent directors. Accordingly, you may not have the same protections afforded to stockholders of companies that are subject to the NYSE corporate governance requirements described above.
38
Our amended and restated certificate of incorporation, bylaws and Delaware law contain provisions that could discourage transactions resulting in a change in control, which may negatively affect the market price of our Class A common stock.
In addition to the effect that the concentration of ownership and voting power in our significant stockholders may have, our amended and restated certificate of incorporation and our amended and restated bylaws contain provisions that may enable our management to resist a change in control. These provisions may discourage, delay or prevent a change in the ownership of our company or a change in our management, even if doing so might be beneficial to our stockholders. In addition, these provisions could limit the price that investors would be willing to pay in the future for shares of our Class A common stock. The provisions in our amended and restated certificate of incorporation or amended and restated bylaws include:
• our board of directors is authorized, without prior stockholder approval, to create and issue preferred stock, commonly referred to as “blank check” preferred stock, with rights senior to those of our Class A common stock, Class B common stock and Class C common stock;
• advance notice requirements for stockholders to nominate individuals to serve on our board of directors or to submit proposals that can be acted upon at stockholder meetings;
• our board of directors is classified so not all of the members of our board of directors are elected at one time, which may make it more difficult for a person who acquires control of a majority of our outstanding voting stock to replace our directors;
• special meetings of the stockholders are permitted to be called only by the chairman of our board of directors, our chief executive officer, a majority of our board of directors or a majority of the voting power of the shares entitled to vote in connection with the election of our directors;
• stockholders are not permitted to cumulate their votes for the election of directors;
• newly created directorships resulting from an increase in the authorized number of directors or vacancies on our board of directors will be filled only by majority vote of the remaining directors;
• a majority of our board of directors is expressly authorized to make, alter or repeal our bylaws; and
• the affirmative vote of the holders of at least 66 2/3% of the combined voting power of the shares entitled to vote in connection with the election of our directors is required to amend, alter, change, or repeal, or to adopt any provision inconsistent with the purpose and intent of certain articles of the Restated Charter relating to the management of our business and conduct of the affairs; the rights to call special meetings of the stockholders; the ability to take action by written consent in lieu of a meeting of stockholders; our obligations to indemnify our directors and officers; amendments to the bylaws; and amendments to the certificate of incorporation.
We are also subject to the provisions of Section 203 of the Delaware General Corporation Law, which may prohibit certain business combinations with stockholders owning 15% or more of our outstanding voting stock. These and other provisions in our amended and rested certificate of incorporation, amended and restated bylaws and Delaware law could discourage acquisition proposals and make it more difficult or expensive for stockholders or potential acquirers to obtain control of our board of directors or initiate actions that are opposed by our then-current board of directors, including delaying or impeding a merger, tender offer or proxy contest involving us. Any delay or prevention of a change of control transaction or changes in our board of directors could cause the market price of our Class A common stock to decline.
39
Risks Related to Our Organizational Structure
We will be required to pay the members of FC-GEN for certain tax benefits we may claim as a result of the tax basis step-up we receive in connection with exchanges of the members of FC-GEN for our shares. In certain circumstances, payments under the tax receivable agreement may be accelerated and/or significantly exceed the actual tax benefits we realize.
FC-GEN Class A Common Units may be exchanged for shares of Class A common stock. Such exchanges of Class A Common Units in FC-GEN may result in increases in the tax basis of the assets of FC-GEN that otherwise would not have been available. Such increases in tax basis are likely to increase (for tax purposes) depreciation and amortization deductions and therefore reduce the amount of income tax we would otherwise be required to pay in the future. These increases in tax basis may also decrease gain (or increase loss) on future dispositions of certain capital assets to the extent the increased tax basis is allocated to those capital assets.
On February 2, 2015 we entered into a tax receivable agreement (the TRA) with the members of FC-GEN that provides for the payment by us to such members of FC-GEN of 90% of the amount of cash savings, if any, in U.S. federal, state and local income tax or franchise tax that we actually realize as a result of (a) the increases in tax basis attributable to the members of FC-GEN and (b) tax benefits related to imputed interest deemed to be paid by us as a result of this TRA. While the actual increase in tax basis, as well as the amount and timing of any payments under the TRA, will vary depending upon a number of factors, the payments that we may make to the members of FC-GEN could be substantial.
Although we are not aware of any issue that would cause the Internal Revenue Service (the IRS) to challenge a tax basis increase, the IRS may challenge all or part of these tax basis increases, and a court could sustain such a challenge. In such event, the FC-GEN members generally will not reimburse us for any payments that may previously have been made to them under the TRA. As a result, in certain circumstances we could make payments to the FC-GEN members under the TRA in excess of our cash tax savings.
In addition, the TRA provides that, upon a merger, asset sale or other form of business combination or certain other changes of control or if, at any time, we elect an early termination of the TRA, our (or our successor's) obligations with respect to exchanged or acquired Class A Common Units (whether exchanged or acquired before or after such change of control or early termination) would be based on certain assumptions, including that (i) in a case of an early termination, we would have sufficient taxable income to fully utilize the deductions arising from the increased tax deductions and tax basis and other benefits related to entering into the TRA; (ii) in the case of a change of control, we would have taxable income at least equal to our taxable income for the 12-month period ending on the last day of the month immediately preceding the change of control; and (iii) any Class A Common Units that have not been exchanged will be deemed exchanged for the market value of the Class A common stock at the time of early termination or change of control. Consequently, it is possible, in these circumstances also, that the actual cash tax savings realized by us may be significantly less than the corresponding TRA payments.
If Genesis were deemed an “investment company” under the Investment Company Act of 1940 as a result of its ownership of FC-GEN, applicable restrictions could make it impractical for us to continue our business as contemplated and could materially and adversely affect our operating results.
If Genesis were to cease participation in the management of FC-GEN, its interests in FC-GEN could be deemed an "investment security" for purposes of the Investment Company Act of 1940 (the 1940 Act). Generally, a person is deemed to be an "investment company" if it owns investment securities having a value exceeding 40% of the value of its total assets (exclusive of U.S. government securities and cash items), absent an applicable exemption. Genesis has substantially no assets other than its equity interests in the managing member of FC-GEN and FC-GEN’s interests in its subsidiaries. A determination that this interest in FC-GEN was an investment security could result in Genesis being an investment company under the 1940 Act and becoming subject to the registration and other requirements of the 1940 Act. We intend to conduct our operations so that we will not be deemed an investment company. However, if we were to be deemed an investment company, restrictions imposed by the 1940 Act, including limitations on our capital structure
40
and our ability to transact with affiliates, could make it impractical for us to continue our business as contemplated and have a material adverse effect on our business and operating results and the price of our Class A common stock.
Item 1B. Unresolved Staff Comments
Not applicable.
As of December 31, 2015, our 531 long-term care facilities consisted of 71 which were owned, 411 which were leased, 43 which were managed and six which were joint ventures. In addition, we own five facilities that have been leased to an unaffiliated third party operator. As of December 31, 2015, our operated facilities had a total of 62,031 licensed beds.
41
The following table provides the facility count and licensed beds by state as of December 31, 2015 for all owned, leased, managed or joint venture skilled nursing and assisted/senior living facilities.
|
|
|
Owned Facilities |
|
Leased Facilities |
|
Managed Facilities |
|
Joint Venture Facilities |
|
Total Facilities |
|
||||||||||
|
State |
|
Count |
|
Beds |
|
Count |
|
Beds |
|
Count |
|
Beds |
|
Count |
|
Beds |
|
Count |
|
Beds |
|
|
Alabama |
|
— |
|
— |
|
9 |
|
940 |
|
— |
|
— |
|
— |
|
— |
|
9 |
|
940 |
|
|
Arizona |
|
— |
|
— |
|
1 |
|
161 |
|
— |
|
— |
|
— |
|
— |
|
1 |
|
161 |
|
|
California |
|
12 |
|
1,384 |
|
27 |
|
2,777 |
|
1 |
|
150 |
|
— |
|
— |
|
40 |
|
4,311 |
|
|
Colorado |
|
— |
|
— |
|
11 |
|
1,527 |
|
— |
|
— |
|
— |
|
— |
|
11 |
|
1,527 |
|
|
Connecticut |
|
2 |
|
300 |
|
19 |
|
2,729 |
|
— |
|
— |
|
— |
|
— |
|
21 |
|
3,029 |
|
|
Delaware |
|
— |
|
— |
|
8 |
|
879 |
|
— |
|
— |
|
— |
|
— |
|
8 |
|
879 |
|
|
Florida |
|
— |
|
— |
|
9 |
|
1,120 |
|
— |
|
— |
|
— |
|
— |
|
9 |
|
1,120 |
|
|
Georgia |
|
3 |
|
305 |
|
6 |
|
732 |
|
— |
|
— |
|
— |
|
— |
|
9 |
|
1,037 |
|
|
Idaho |
|
— |
|
— |
|
8 |
|
915 |
|
— |
|
— |
|
— |
|
— |
|
8 |
|
915 |
|
|
Indiana |
|
— |
|
— |
|
— |
|
— |
|
2 |
|
208 |
|
— |
|
— |
|
2 |
|
208 |
|
|
Iowa |
|
2 |
|
164 |
|
— |
|
— |
|
— |
|
— |
|
— |
|
— |
|
2 |
|
164 |
|
|
Kansas |
|
26 |
|
1,439 |
|
1 |
|
96 |
|
— |
|
— |
|
— |
|
— |
|
27 |
|
1,535 |
|
|
Kentucky |
|
— |
|
— |
|
19 |
|
1,735 |
|
— |
|
— |
|
— |
|
— |
|
19 |
|
1,735 |
|
|
Maine |
|
— |
|
— |
|
11 |
|
957 |
|
— |
|
— |
|
— |
|
— |
|
11 |
|
957 |
|
|
Maryland |
|
1 |
|
74 |
|
28 |
|
3,587 |
|
1 |
|
140 |
|
4 |
|
672 |
|
34 |
|
4,473 |
|
|
Massachusetts |
|
2 |
|
225 |
|
30 |
|
3,628 |
|
4 |
|
370 |
|
1 |
|
224 |
|
37 |
|
4,447 |
|
|
Missouri |
|
6 |
|
869 |
|
— |
|
— |
|
— |
|
— |
|
— |
|
— |
|
6 |
|
869 |
|
|
Montana |
|
— |
|
— |
|
5 |
|
650 |
|
— |
|
— |
|
— |
|
— |
|
5 |
|
650 |
|
|
Nebraska |
|
— |
|
— |
|
1 |
|
61 |
|
— |
|
— |
|
— |
|
— |
|
1 |
|
61 |
|
|
Nevada |
|
2 |
|
134 |
|
1 |
|
190 |
|
— |
|
— |
|
— |
|
— |
|
3 |
|
324 |
|
|
New Hampshire |
|
1 |
|
108 |
|
30 |
|
3,063 |
|
— |
|
— |
|
1 |
|
90 |
|
32 |
|
3,261 |
|
|
New Jersey |
|
4 |
|
680 |
|
38 |
|
5,638 |
|
2 |
|
279 |
|
— |
|
— |
|
44 |
|
6,597 |
|
|
New Mexico |
|
2 |
|
208 |
|
17 |
|
2,048 |
|
— |
|
— |
|
— |
|
— |
|
19 |
|
2,256 |
|
|
North Carolina |
|
— |
|
— |
|
10 |
|
1,319 |
|
— |
|
— |
|
— |
|
— |
|
10 |
|
1,319 |
|
|
Ohio |
|
— |
|
— |
|
17 |
|
2,331 |
|
— |
|
— |
|
— |
|
— |
|
17 |
|
2,331 |
|
|
Pennsylvania |
|
— |
|
— |
|
43 |
|
5,272 |
|
8 |
|
1,057 |
|
— |
|
— |
|
51 |
|
6,329 |
|
|
Rhode Island |
|
1 |
|
120 |
|
8 |
|
1,059 |
|
— |
|
— |
|
— |
|
— |
|
9 |
|
1,179 |
|
|
Tennessee |
|
— |
|
— |
|
3 |
|
389 |
|
— |
|
— |
|
— |
|
— |
|
3 |
|
389 |
|
|
Texas |
|
2 |
|
214 |
|
2 |
|
230 |
|
20 |
|
2,901 |
|
— |
|
— |
|
24 |
|
3,345 |
|
|
Utah |
|
— |
|
— |
|
1 |
|
120 |
|
— |
|
— |
|
— |
|
— |
|
1 |
|
120 |
|
|
Vermont |
|
1 |
|
123 |
|
3 |
|
331 |
|
5 |
|
579 |
|
— |
|
— |
|
9 |
|
1,033 |
|
|
Virginia |
|
1 |
|
130 |
|
2 |
|
208 |
|
— |
|
— |
|
— |
|
— |
|
3 |
|
338 |
|
|
Washington |
|
3 |
|
371 |
|
5 |
|
468 |
|
— |
|
— |
|
— |
|
— |
|
8 |
|
839 |
|
|
West Virginia |
|
— |
|
— |
|
38 |
|
3,353 |
|
— |
|
— |
|
— |
|
— |
|
38 |
|
3,353 |
|
|
Total |
|
71 |
|
6,848 |
|
411 |
|
48,513 |
|
43 |
|
5,684 |
|
6 |
|
986 |
|
531 |
|
62,031 |
|
|
|
|
|
|
|
|
|
|
|
|
|
|
|
|
|
|
|
|
|
|
|
|
|
Skilled nursing |
|
49 |
|
5,789 |
|
381 |
|
46,104 |
|
40 |
|
5,257 |
|
5 |
|
896 |
|
475 |
|
58,046 |
|
|
|
|
|
|
|
|
|
|
|
|
|
|
|
|
|
|
|
|
|
|
|
|
|
Assisted/Senior living |
|
22 |
|
1,059 |
|
30 |
|
2,409 |
|
3 |
|
427 |
|
1 |
|
90 |
|
56 |
|
3,985 |
|
Our executive offices are located in Kennett Square, Pennsylvania and we have several other corporate offices, including Andover, Massachusetts; Towson, Maryland; Albuquerque, New Mexico; and Foothill Ranch, California. We own our executive offices in Kennett Square, Pennsylvania.
42
For information regarding certain pending legal proceedings to which we are a party or our property is subject, see Note 20, “Commitments and Contingencies—Legal Proceedings,” to our consolidated financial statements included elsewhere in this report, which is incorporated herein by reference.
Item 4. Mine Safety Disclosures
Not applicable.
Item 5. Market for Registrant’s Common Equity, Related Stockholder Matters and Issuer Purchases of Equity Securities
Our Class A common stock is listed on the NYSE under the symbol "GEN." Information with respect to sales prices and record holders of our Class A common stock is set forth below. There is no established trading market for our Class B common stock or Class C common stock.
Market Information
The following table sets forth, for the indicated quarterly periods, the high and low sale prices of our Class A common stock as reported by the NYSE:
|
Year Ended December 31, 2015 |
High ($) |
|
Low ($) |
||||
|
First quarter |
$ |
9.22 |
|
|
$ |
6.82 |
|
|
Second quarter |
7.31 |
|
|
5.86 |
|
||
|
Third quarter |
7.67 |
|
|
5.72 |
|
||
|
Fourth quarter |
5.92 |
|
|
3.47 |
|
||
|
Year Ended December 31, 2014 |
High ($) |
|
Low ($) |
||||
|
First quarter |
$ |
5.50 |
|
|
$ |
4.08 |
|
|
Second quarter |
7.15 |
|
|
4.77 |
|
||
|
Third quarter |
7.90 |
|
|
5.75 |
|
||
|
Fourth quarter |
9.00 |
|
|
6.06 |
|
||
On March 11, 2016, the closing sales price of our Class A common stock on the NYSE was $2.50 per share. On that date, there were 88 holders of record of our Class A common stock, 14 holders of record of our Class B common stock, and 73 holders of record of our Class C common stock.
Dividend Payment
We did not declare or pay cash dividends in either 2015 or 2014 on our Class A, Class B or Class C common stock. We do not anticipate paying any cash dividends on our common stock in the foreseeable future. We have made and will continue to make distributions on the behalf of FC-GEN members to satisfy tax obligations. We currently anticipate that we will retain all of our available cash, if any, for use as working capital and for other general purposes, including to service or repay our debt and to fund the operation and expansion of our business.
Securities Authorized for Issuance Under Equity Compensation Plans
We primarily issue restricted stock units under our share-based compensation plans, which are part of a broad-based, long-term retention program that is intended to attract and retain talented employees and directors, and align stockholder and employee interests.
43
Our 2015 Omnibus Equity Incentive Plan, or 2015 Plan, provides for the grant of incentive and non-qualified stock options as well as stock appreciation rights, restricted stock, restricted stock units, performance units and shares, and other stock-based awards. Generally, restricted stock unit grants to employees vest over three years. Approximately 50% of our awards to executives and certain employees have performance based criteria that must be met in order for the awards to vest. The Board of Directors may terminate the 2015 Plan at any time. Only shares of our Class A common stock can be issued or transferred pursuant to awards under the 2015 Plan. Upon closing of the Combination, options to purchase shares of common stock and shares of restricted stock held by employees and directors of Skilled automatically vested.
Additional information regarding our stock plan activity for fiscal year 2015, 2014 and 2013 is provided in the notes to our consolidated financial statements in this annual report, see Note 14, “Stock-Based Compensation."
The equity compensation plan information set forth in Item 12 "Security Ownership of Certain Beneficial Owners and Management and Related Stockholder Matters" of this report contains information concerning securities authorized for issuance under our equity compensation plans.
Stock Performance Graph
The following graph illustrates a comparison of the total cumulative stockholder return on our Class A common stock since December 31, 2010, to two indices: the S&P 500 and the S&P 1500 Health Care Index. Historically, we used the Morningstar Long-Term Care Facility Index as our published industry index; however, that index is no longer available. Accordingly, this year we used the S&P 1500 Health Care Index as our published industry index. Because the Morningstar Long-Term Care Facility Index is no longer available, we cannot provide a concurrent comparison to that index.
The graph assumes an initial investment of $100 on December 31, 2010, assuming reinvestment of dividends, if any. The comparisons in the graph are required by the SEC and are not intended to forecast or be indicative of possible future performance of our Class A common stock. The following graph and related information shall not be deemed "soliciting material" or deemed to be "filed" with the SEC, nor shall such information be incorporated by reference into any SEC filing unless we specifically incorporate it by reference into the particular filing.
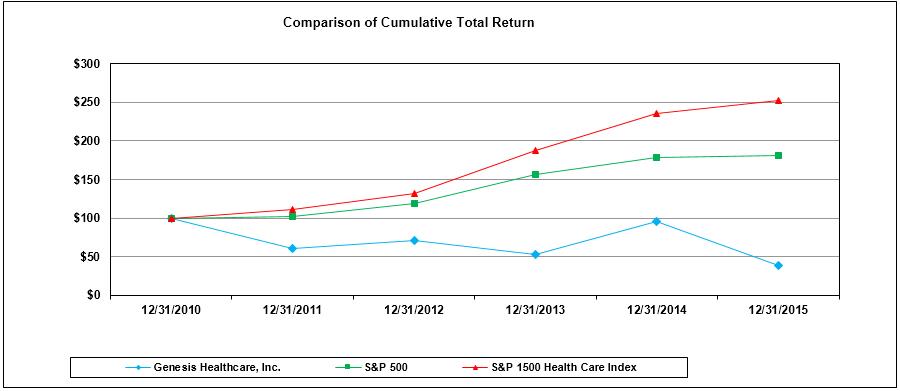
|
|
12/31/2010 |
12/31/2011 |
12/31/2012 |
12/31/2013 |
12/31/2014 |
12/31/2015 |
|
Genesis Healthcare, Inc. |
$ 100.00
|
$ 60.80
|
$ 70.94
|
$ 53.56
|
$ 95.43
|
$ 38.64
|
|
S&P 500 |
100.00 | 102.11 | 118.44 | 156.78 | 178.22 | 180.67 |
|
S&P 1500 Health Care Index |
100.00 | 111.88 | 132.42 | 188.29 | 234.96 | 252.38 |
Item 6. Selected Financial Data
We derived the selected historical consolidated financial data below for each of the years ended December 31, 2015, 2014, and 2013, and as of December 31, 2015 and 2014, from our audited consolidated financial statements included elsewhere in this report. We derived the selected historical consolidated financial data for the years ended December 31, 2012 and 2011 and as of December 31, 2013, 2012 and 2011 from our consolidated financial statements not included in this report. Historical results are not necessarily indicative of future performance.
44
Please refer to the information set forth below in conjunction with other sections of this report, including Item 7.“Management’s Discussion and Analysis of Financial Condition and Results of Operations,” and our consolidated historical financial statements and related notes included elsewhere in this report.
|
|
|
Year Ended December 31, |
|
|||||||||||||
|
|
|
2015 |
|
2014 |
|
2013 |
|
2012 |
|
2011 |
|
|||||
|
|
|
|
|
|
|
|
|
|
|
|
|
|
|
|
|
|
|
Consolidated Statement of Operations Data: |
|
|
|
|
|
|
|
|
|
|
|
|
|
|
|
|
|
Net revenues |
|
$ |
5,619,224 |
|
$ |
4,768,080 |
|
$ |
4,710,341 |
|
$ |
3,076,298 |
|
$ |
2,735,799 |
|
|
Expenses |
|
|
5,972,249 |
|
|
5,049,587 |
|
|
4,889,126 |
|
|
3,258,843 |
|
|
2,770,114 |
|
|
(Loss) income before income tax (benefit) expense |
|
|
(353,025) |
|
|
(281,507) |
|
|
(178,785) |
|
|
(182,545) |
|
|
(34,315) |
|
|
Income tax expense (benefit) |
|
|
172,524 |
|
|
(44,022) |
|
|
(9,179) |
|
|
(11,633) |
|
|
(129,873) |
|
|
(Loss) income from continuing operations |
|
|
(525,549) |
|
|
(237,485) |
|
|
(169,606) |
|
|
(170,912) |
|
|
95,558 |
|
|
Loss from discontinued operations, net of taxes |
|
|
(1,219) |
|
|
(14,044) |
|
|
(7,364) |
|
|
(810) |
|
|
(1,551) |
|
|
Net (loss) income |
|
|
(526,768) |
|
|
(251,529) |
|
|
(176,970) |
|
|
(171,722) |
|
|
94,007 |
|
|
Less net loss (income) attributable to noncontrolling interests |
|
|
100,573 |
|
|
(2,456) |
|
|
(1,025) |
|
|
448 |
|
|
716 |
|
|
Net (loss) income attributable to Genesis Healthcare, Inc. |
|
$ |
(426,195) |
|
$ |
(253,985) |
|
$ |
(177,995) |
|
$ |
(171,274) |
|
$ |
94,723 |
|
|
|
|
|
|
|
|
|
|
|
|
|
|
|
|
|
|
|
|
(Loss) income per common share: |
|
|
|
|
|
|
|
|
|
|
|
|
|
|
|
|
|
Weighted average shares outstanding for basic and diluted (loss) income from continuing operations per share |
|
|
85,755 |
|
|
49,865 |
|
|
49,865 |
|
|
49,865 |
|
|
49,865 |
|
|
Basic and diluted net (loss) income per common share: |
|
|
|
|
|
|
|
|
|
|
|
|
|
|
|
|
|
(Loss) income from continuing operations attributable to Genesis Healthcare, Inc. |
|
$ |
(4.96) |
|
$ |
(4.81) |
|
$ |
(3.42) |
|
$ |
(3.41) |
|
$ |
1.93 |
|
|
Loss from discontinued operations, net of taxes |
|
|
(0.01) |
|
|
(0.28) |
|
|
(0.15) |
|
|
(0.02) |
|
|
(0.03) |
|
|
Net (loss) income attributable to Genesis Healthcare, Inc. |
|
$ |
(4.97) |
|
$ |
(5.09) |
|
$ |
(3.57) |
|
$ |
(3.43) |
|
$ |
1.90 |
|
|
|
|
|
|
|
|
|
|
|
|
|
|
|
|
|
|
|
|
Other Financial Data: |
|
|
|
|
|
|
|
|
|
|
|
|
|
|
|
|
|
Capital expenditures |
|
$ |
(85,723) |
|
$ |
(70,987) |
|
$ |
(77,399) |
|
$ |
(66,704) |
|
$ |
(69,247) |
|
|
Net cash provided by operating activities |
|
|
8,618 |
|
|
107,652 |
|
|
82,149 |
|
|
9,972 |
|
|
15,549 |
|
|
Net cash used in investing activities |
|
|
(253,484) |
|
|
(95,675) |
|
|
(91,702) |
|
|
(182,899) |
|
|
(165,629) |
|
|
Net cash provided by financing activities |
|
|
218,861 |
|
|
14,158 |
|
|
20,748 |
|
|
172,229 |
|
|
78,180 |
|
|
|
|
|
|
|
|
|
|
|
|
|
|
|
|
|
|
|
|
|
|
December 31, |
|
|||||||||||||
|
|
|
2015 |
|
2014 |
|
2013 |
|
2012 |
|
2011 |
|
|||||
|
Balance Sheet Data: |
|
|
|
|
|
|
|
|
|
|
|
|
|
|
|
|
|
Cash and cash equivalents |
|
$ |
61,543 |
|
$ |
87,548 |
|
$ |
61,413 |
|
$ |
50,218 |
|
$ |
50,916 |
|
|
Working capital |
|
|
212,828 |
|
|
177,391 |
|
|
195,456 |
|
|
174,390 |
|
|
182,511 |
|
|
Property and equipment and leased facility assets, net |
|
|
4,085,247 |
|
|
3,493,250 |
|
|
3,550,950 |
|
|
3,704,547 |
|
|
2,850,718 |
|
|
Total assets |
|
|
6,091,470 |
|
|
5,141,408 |
|
|
5,137,005 |
|
|
5,248,119 |
|
|
3,703,666 |
|
|
Long-term debt, including current installments (recourse) |
|
|
1,199,650 |
|
|
488,285 |
|
|
434,610 |
|
|
404,766 |
|
|
77,000 |
|
|
Long-term debt, including current installments (non-recourse) |
|
|
30,507 |
|
|
49,961 |
|
|
54,823 |
|
|
53,215 |
|
|
59,053 |
|
|
Capital lease obligations, including current installments |
|
|
1,055,658 |
|
|
1,005,637 |
|
|
975,617 |
|
|
1,026,977 |
|
|
356,327 |
|
|
Financing obligations, including current installments |
|
|
3,065,066 |
|
|
2,912,338 |
|
|
2,786,391 |
|
|
2,668,793 |
|
|
2,424,979 |
|
|
Stockholders' (deficit) equity |
|
|
(619,387) |
|
|
(457,490) |
|
|
(183,881) |
|
|
2,019 |
|
|
180,122 |
|
Item 7. Management’s Discussion and Analysis of Financial Condition and Results of Operations
This Management’s Discussion and Analysis of Financial Condition and Results of Operations is intended to assist in understanding and assessing the trends and significant changes in our results of operations and financial condition as of the dates and for the periods presented. Historical results may not indicate future performance. Our forward-looking statements, which reflect our current views about future events, are based on assumptions and are
45
subject to known and unknown risks and uncertainties that could cause actual results to differ materially from those contemplated by these statements. Factors that may cause differences between actual results and those contemplated by forward-looking statements include, but are not limited to, those discussed in Item 1A. “Risk Factors,” of this report on Form 10-K. This Management’s Discussion and Analysis of Financial Condition and Results of Operations should be read in conjunction with “Selected Financial Data” in Item 6 of this Annual Report on Form 10-K and our consolidated financial statements and related notes included in this report.
Business Overview
Genesis is a healthcare services company that through its subsidiaries owns and operates skilled nursing facilities, assisted/senior living facilities and a rehabilitation therapy business. We have an administrative service company that provides a full complement of administrative and consultative services that allows our affiliated operators and third-party operators with whom we contract to better focus on delivery of healthcare services. We provide inpatient services through 531 skilled nursing, assisted/senior living and behavioral health centers located in 34 states. Revenues of our owned, leased and otherwise consolidated centers constitute approximately 85% of our revenues.
We also provide a range of rehabilitation therapy services, including speech pathology, physical therapy, occupational therapy and respiratory therapy. These services are provided by rehabilitation therapists and assistants employed or contracted at substantially all of the centers operated by us, as well as by contract to healthcare facilities operated by others. After the elimination of intercompany revenues, the rehabilitation therapy services business constitutes approximately 12% of our revenues.
We provide an array of other specialty medical services, including management services, physician services, staffing services, hospice and home health services, and other healthcare related services, which comprise the balance of our revenues.
The Combination with Skilled
On August 18, 2014, Skilled entered into a Purchase and Contribution Agreement with FC-GEN Operations Investment, LLC (FC-GEN) pursuant to which the businesses and operations of FC-GEN and Skilled were combined (the Combination). On February 2, 2015, the Combination was completed.
46
The following diagram depicts the organizational structure of us at the time of the Combination:
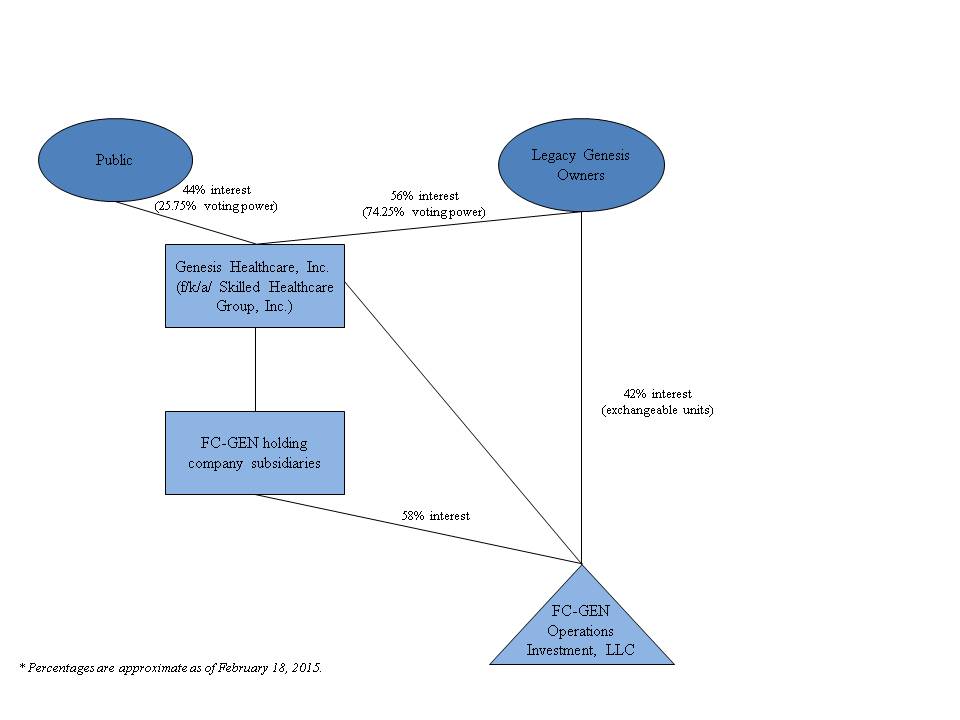
Upon completion of the Combination, we now operate under the name Genesis Healthcare, Inc. and the Class A common stock of the combined company continues to trade on the NYSE under the symbol “GEN.” Upon the closing of the Combination, the former owners of FC-GEN held 74.25% of the economic interests in the combined entity and the former stockholders of Skilled held the remaining 25.75% of the economic interests in the combined entity post-transaction, in each case on a fully-diluted, as-exchanged and as-converted basis. Under applicable accounting standards, FC-GEN was the accounting acquirer in the Combination, which was treated as a reverse acquisition. The acquisition method has been applied to the accounts of Skilled based on Skilled’s stock price (level 1 valuation technique - quoted prices in active markets for identical assets or liabilities) as of the acquisition date. The consideration has been allocated to the legacy Skilled business that was acquired on the acquisition date with the excess consideration over the fair value of the net assets acquired recognized as goodwill. As of the effective date of the Combination, FC-GEN’s assets and liabilities remained at their historical costs.
Because FC-GEN’s pre-transaction owners held an approximately 58% direct controlling interest in Skilled and a 74.25% economic and voting interest in the combined company, FC-GEN is considered to be the acquirer of Skilled for accounting purposes. Following the closing of the Combination, the combined results of Skilled and FC-GEN are consolidated with approximately 42% direct noncontrolling economic interest shown as noncontrolling interest in the financial statements of the combined entity. The 42% direct noncontrolling economic interest is in the form of Class A common units of FC-GEN that are exchangeable on a 1 to 1 basis to our public shares. The 42% direct noncontrolling economic interest will continue to decrease as Class A common units of FC-GEN are exchanged for public shares. There have been no conversions of Class A common units since the completion of the Combination.
Acquisition from Revera
On June 15, 2015, we announced that we had signed an asset purchase agreement with Revera Assisted Living, Inc., (Revera) a leading owner, operator and investor in the senior living sector, to acquire 24 of its skilled nursing facilities along with its contract rehabilitation business for $240 million (the Acquisition from Revera). The agreement provided for the acquisition of the real estate and operations of 20 of the skilled nursing facilities and the addition of the
47
facilities to an existing master lease agreement with Welltower to operate the other four additional skilled nursing facilities.
On December 1, 2015, we acquired 19 of the 24 skilled nursing facilities and entered into management agreements to manage the remaining five facilities. Only upon change of ownership approval by the State of Vermont will we be able to complete the transaction and acquire the remaining five facilities. The purchase price on December 1, 2015 for the 15 owned and four leased facilities was $206.0 million. The purchase price for the 15 owned facilities was primarily financed through a bridge loan with Welltower of $134.1 million and we paid cash of $20.5 million. The master lease agreement with Welltower was amended to include the four leased facilities resulting in a financing obligation of $54.3 million.
Critical Accounting Policies
The consolidated financial statements have been prepared in conformity with accounting principles generally accepted in the United States of America (U.S. GAAP), which requires us to consolidate company financial information and make informed estimates and assumptions that affect the reported amounts of assets and liabilities, disclosure of contingent assets and liabilities at the date of the financial statements and the reported amounts of revenue and expenses during the reporting period. The most significant estimates in our consolidated financial statements relate to allowance for doubtful accounts, self-insured liability risks, income taxes, impairment of long-lived assets and goodwill, and other contingencies. Actual results could differ from those estimates.
Net Revenues and Accounts Receivable
Revenues and accounts receivable are recorded on an accrual basis as services are performed at their estimated net realizable value. We derive a majority of our revenue from funds under federal Medicare and state Medicaid assistance programs, the continuation of which is dependent upon governmental policies and is subject to audit risk and potential recoupment. We also receive payments through reimbursement from Medicaid and Medicare programs and directly from individual residents (private pay), third-party insurers and long-term care facilities. We assess collectability on all accounts prior to providing services.
We record revenue for inpatient services and the related receivables in the accounting records at our established billing rates in the period the related services are rendered. The provision for contractual adjustments, which represents the differences between the established billing rates and predetermined reimbursement rates, is deducted from gross revenue to determine net revenue. Retroactive adjustments that are likely to result from future examinations by third party payors are accrued on an estimated basis in the period the related services are rendered and adjusted as necessary in future periods based upon new information or final settlements.
We record revenue for rehabilitation therapy services and other ancillary services and the related receivables at the time services or products are provided or delivered to the customer. Upon delivery of products or services, we have no additional performance obligation to the customer.
Allowance for Doubtful Accounts
We evaluate the adequacy of our allowance for doubtful accounts by estimating allowance requirement percentages for each accounts receivable aging category for each type of payor. We have developed estimated allowance requirement percentages by utilizing historical collection trends and our understanding of the nature and collectability of receivables in the various aging categories and the various lines of our business. The allowance percentages are developed by payor type as the accounts receivable from each payor type have unique characteristics. The allowance for doubtful accounts also considers accounts specifically identified as uncollectible. Accounts receivable that we specifically estimate to be uncollectible, based upon the age of the receivables, the results of collection efforts, or other circumstances, are reserved in the allowance for doubtful accounts until written-off.
48
Impairment of Long-Lived Assets
Property and equipment are carried at cost less accumulated depreciation. Depreciation is calculated using the straight-line method over the estimated useful lives of the depreciable assets, which generally range from 20-35 years for buildings, building improvements and land improvements, and 3-15 years for equipment, furniture and fixtures and information systems. Depreciation expense on leasehold improvements and assets held under capital leases is calculated using the straight-line method over the lesser of the lease term or the estimated useful life of the asset. Expenditures for maintenance and repairs necessary to maintain property and equipment in efficient operating condition are expensed as incurred. Costs of additions and betterments are capitalized.
Total depreciation expense from continuing operations for the years ended December 31, 2015, 2014 and 2013 was $218.8 million, $184.3 million, and $179.4 million, respectively.
Definite-lived intangible assets primarily consist of management contracts, customer relationships and favorable leases. These assets are amortized in accordance with the authoritative guidance for intangible assets using the straight-line method over their estimated useful lives. Indefinite-lived intangible assets primarily consist of trade names.
Goodwill represents the excess of the purchase price over the fair value of identifiable net assets acquired in business combinations. See Note 9 – “Goodwill and Identifiable Intangible Assets.”
Our long-lived assets are reviewed for impairment whenever events or changes in circumstances indicate the carrying amount of an asset may not be recoverable. Recoverability of assets to be held and used is measured by comparison of the carrying amount of an asset to the future cash flows expected to be generated by the asset. If the carrying amount of an asset exceeds its estimated future undiscounted cash flows, an impairment charge is recognized to the extent the carrying amount of the asset exceeds the fair value of the asset. Assets to be disposed of are reported at the lower of the carrying amount or the fair value less costs to sell. For 2015, 2014 and 2013, we recognized impairment charges in the inpatient segment totaling $28.5 million, $31.4 million and $10.0 million, respectively.
We perform an assessment of qualitative factors prior to the use of the two step quantitative method to determine if goodwill has been impaired. If such qualitative assessment does not indicate that it is more likely than not the fair value of the reporting is less than its carrying value, no further analysis is required. If required, we would perform a quantitative goodwill impairment test which involves a two-step process. The first step is a comparison of each reporting unit’s fair value to its carrying value. If the carrying value of the reporting unit is greater than its fair value, there is an indication that impairment may exist and the second step must be performed to measure the amount of impairment loss, if any. We perform our annual impairment assessment for our reporting units as of September 30 of each year, or more frequently if adverse events or changes in circumstances indicate that the asset may be impaired. We considered various factors in performing the qualitative test, including macroeconomic conditions, industry and market considerations, the overall financial performance of our reporting units, our stock price and the excess amount between our reporting unit’s fair value and carrying value as indicated on our most recent quantitative assessment. Based on that quantitative assessment, management concluded the fair value of its reporting units far exceeded its carrying value. See Note 18 – “Asset Impairment Charges.”
Self-Insurance Risks
We provide for self-insurance risks for both general and professional liability and workers’ compensation claims based on estimates of the ultimate costs for both reported claims and claims incurred but not reported. Estimated losses from asserted and incurred but not reported claims are accrued based on our estimate of the ultimate costs of the claims, which includes costs associated with litigating or settling claims, and the relationship of past reported incidents to eventual claims payments. All relevant information, including our own historical experience, the nature and extent of existing asserted claims and reported incidents, and independent actuarial analyses of this information is used in estimating the expected amount of claims. The reserves for loss for workers’ compensation risks are discounted based on actuarial estimates of claim payment patterns whereas the reserves for general and professional liability are recorded
49
on an undiscounted basis. We also consider amounts that may be recovered from excess insurance carriers in estimating the ultimate net liability for such risks. See Note 20 – “Commitments and Contingencies – Loss Reserves For Certain Self-Insured Programs – General and Professional Liability and Workers’ Compensation.”
Income Taxes
Our effective tax rate is based on pretax income, statutory tax rates and tax planning opportunities available in the various jurisdictions in which we operate. We account for income taxes in accordance with applicable guidance on accounting for income taxes, which requires that deferred tax assets and liabilities be recognized using enacted tax rates for the effect of temporary differences between book and tax bases on recorded assets and liabilities. Accounting guidance also requires that deferred tax assets be reduced by a valuation allowance, when it is more likely than not that a tax benefit will not be realized.
The recognition and measurement of a tax position is based on management’s best judgment given the facts, circumstances and information available at the reporting date. We evaluate tax positions to determine whether the benefits of tax positions are more likely than not of being sustained upon audit based on the technical merits of the tax position. For tax positions that are more likely than not of being sustained upon audit, we recognize the largest amount of the benefit that is greater than 50% likely of being realized upon ultimate settlement in the financial statements. For tax positions that are not more likely than not of being sustained upon audit, we do not recognize any portion of the benefit in the financial statements. If the more likely than not threshold is not met in the period for which a tax position is taken, we may subsequently recognize the benefit of that tax position if the tax matter is effectively settled, the statute of limitations expires, or if the more likely than not threshold is met in a subsequent period.
We evaluate, on a quarterly basis, our ability to realize deferred tax assets by assessing our valuation allowance and by adjusting the amount of such allowance, if necessary. The factors used to assess the likelihood of realization are our forecast of pre-tax earnings, our forecast of future taxable income and available tax planning strategies that could be implemented to realize the net deferred tax assets. To the extent we prevail in matters for which reserves have been established, or are required to pay amounts in excess of our reserves, our effective tax rate in a given financial statement period could be materially affected. An unfavorable tax settlement would require use of cash and result in an increase in the effective tax rate in the year of resolution. A favorable tax settlement would be recognized as a reduction in our effective tax rate in the year of resolution. We record accrued interest and penalties associated with uncertain tax positions as income tax expense in the consolidated statement of operations.
Leases
Leasing transactions are a material part of our business. The following discussion summarizes various aspects of our accounting for leasing transactions and the related balances.
Capital Leases
Lease arrangements are capitalized when such leases convey substantially all the risks and benefits incidental to ownership. Capital leases are amortized over either the lease term or the life of the related assets, depending upon available purchase options and lease renewal features. Amortization related to capital leases is included in the consolidated statements of operations within depreciation and amortization expense. See Note 11 – “Lease and Lease Commitments.”
Operating Leases
For operating leases, minimum lease payments, including minimum scheduled rent increases, are recognized as lease expense on a straight-line basis over the applicable lease terms and any periods during which we have use of the property but are not charged rent by a landlord. Lease terms, in most cases, provide for rent escalations and renewal options.
50
When we purchase businesses that have operating lease agreements, we recognize the fair value of the lease arrangements as either favorable or unfavorable and record these amounts as other identifiable intangible assets or other long-term liabilities, respectively. Favorable and unfavorable leases are amortized to lease expense on a straight-line basis over the remaining term of the leases. See Note 11 – “Lease and Lease Commitments.”
Sale/Leaseback Financing Obligation
Prior to recognition as a sale, or profit/loss thereon, sale/leaseback transactions are evaluated to determine if their terms transfer all of the risks and rewards of ownership as demonstrated by the absence of any other continuing involvement by the seller-lessee. A sale/leaseback transaction that does not qualify for sale/leaseback accounting because of any form of continuing involvement by the seller-lessee is accounted for as a financing transaction. Under the financing method: (1) the assets and accumulated depreciation remain on the consolidated balance sheet and continue to be depreciated over the remaining useful lives; (2) no gain is recognized; and (3) proceeds received by us from these transactions are recorded as a financing obligation. See Note 12 – “Financing Obligations.”
Business Combinations
Our acquisition strategy is to purchase or lease operating subsidiaries that are complementary to our current affiliated facilities, accretive to our business or otherwise advance our strategy. The results of all of our operating subsidiaries are included in the accompanying financial statements subsequent to the date of acquisition. Acquisitions are accounted for using the acquisition method of accounting and include leasing and other financing arrangements as well as cash transactions. Assets and liabilities of the acquired entities are recorded at their estimated fair values at the acquisition date. Goodwill represents the excess of the purchase price over the fair value of net assets, including the amount assigned to identifiable intangible assets. Given the time it takes to obtain pertinent information to finalize the acquired company’s balance sheet, the initial fair value might not be finalized up to one year after the date of acquisition. Accordingly, it is not uncommon for the initial estimates to be subsequently revised.
In developing estimates of fair values for long-lived assets, we utilize a variety of factors including market data, cash flows, growth rates, and replacement costs. Determining the fair value for specifically identified intangible assets involves significant judgment, estimates and projections related to the valuation to be applied to intangible assets such as favorable leases, customer relationships, management contracts and trade names. The subjective nature of management’s assumptions increases the risk associated with estimates surrounding the projected performance of the acquired entity. In transactions where significant judgement or other assumptions could have a material impact on the conclusion, we engage third party specialists to assist in the valuation of the acquired assets and liabilities. Additionally, as we amortize finite-lived acquired intangible assets over time, the purchase accounting allocation directly impacts the amortization expense recorded on the financial statements.
Recent Accounting Pronouncements
In May 2014, the Financial Accounting Standards Board (the FASB) issued ASU No. 2014-09, Revenue from Contracts with Customers, (ASU 2014-09) which changes the requirements for recognizing revenue when entities enter into contracts with customers. Under ASU 2014-09, an entity will recognize revenue when it transfers promised goods or services to customers in an amount that reflects what it expects in exchange for the goods or services. It also requires more detailed disclosures to enable users of financial statements to understand the nature, amount, timing, and uncertainty of revenue and cash flows arising from contracts with customers. The adoption of ASU 2014-09 is effective for annual and interim periods beginning after December 15, 2017 and early adoption is not permitted. We are still evaluating the effect, if any, ASU 2014-09 will have on our consolidated financial condition and results of operations.
In February 2015, the FASB issued ASU 2015-02, Consolidation (Topic 810): Amendments to the Consolidation Analysis (ASU 2015-02), which changes the way reporting enterprises evaluate whether (a) they should consolidate limited partnerships and similar entities, (b) fees paid to a decision maker or service provider are variable interests in a variable interest entity (VIE), and (c) variable interests in a VIE held by related parties of the reporting enterprise require the reporting enterprise to consolidate the VIE. It also eliminates the VIE consolidation model based on majority exposure to variability that applied to certain investment companies and similar entities. The new guidance excludes
51
money market funds that are required to comply with Rule 2a-7 of the Investment Company Act of 1940 and similar entities from the U.S. GAAP consolidation requirements. The adoption of ASU 2015-02 is effective for fiscal years beginning after December 15, 2015, and interim periods within those fiscal years, with early adoption permitted. If adopted in an interim period, this ASU must be reflected as of the beginning of the fiscal year that includes that interim period. The adoption of ASU No. 2015-02 is not expected to have a material impact on our consolidated financial condition and results of operations.
In April 2015, the FASB issued ASU No. 2015-03, Simplifying the Presentation of Debt Issuance Costs, (ASU 2015-03) and in August 2015 issued ASU No. 2015-15, Presentation and Subsequent Measurement of Debt Issuance Costs Associated with Line-of-Credit Arrangements (ASU 2015-15). ASU 2015-03 requires an entity to present debt issuance costs as a direct deduction from the carrying amount of the related debt liability, consistent with debt discounts. The costs will continue to be amortized to interest expense using the effective interest method. While ASU 2015-03 addresses costs related to term debt, ASU No. 2015-15 provides clarification regarding costs to secure revolving lines of credit, which are, at the outset, not associated with an outstanding borrowing. ASU 2015-15 provides commentary that the SEC staff would not object to an entity deferring and presenting costs associated with line-of-credit arrangements as an asset and subsequently amortizing them ratably over the term of the revolving debt arrangement. The adoption of ASU 2015-03 is effective for fiscal years beginning after December 15, 2015, and interim periods within those fiscal years, with early adoption permitted. This ASU requires retrospective application to all prior periods presented in the financial statements. The adoption of ASU 2015-03 is not expected to have a material impact on our consolidated financial condition and results of operations.
In September 2015, the FASB issued ASU No. 2015-16, Business Combinations (Topic 805): Simplifying the Accounting for Measurement-Period Adjustments (ASU 2015-16), which eliminates the requirement for an acquirer to retrospectively adjust the financial statements for measurement-period adjustments that occur in periods after a business combination is consummated. The adoption of ASU 2015-16 is effective for fiscal years beginning after December 15, 2015, and interim periods within those fiscal years, with early adoption permitted. We are still evaluating the effect, if any, ASU 2015-16 will have on our consolidated financial condition and results of operations.
In November 2015, the FASB issued ASU No. 2015-17, Income Taxes (Topic 740): Balance Sheet Classification of Deferred Taxes (ASU 2015-17), which changes how deferred taxes are classified on organizations’ balance sheets. ASU 2015-17 eliminates the current requirement for organizations to present deferred tax liabilities and assets as current and noncurrent in a classified balance sheet. Instead, organizations will be required to classify all deferred tax assets and liabilities as noncurrent. As permitted by ASU 2015-17, the Company early-adopted this standard and applied it retrospectively to all periods presented. Adoption of ASU 2015-17 resulted in a reclassification of current deferred income tax assets to noncurrent deferred income tax assets in our consolidated balance sheets as of December 31, 2015 and 2014.
In February 2016, the FASB issued amended authoritative guidance on accounting for leases. The new provisions require that a lessee of operating leases recognize a liability to make lease payments (the lease liability) and a right-of-use asset representing its right to use the underlying asset for the lease term. The lease liability will be equal to the present value of lease payments, with the right-of-use asset based upon the lease liability. The classification criteria for distinguishing between finance (or capital) leases and operating leases are substantially similar to the previous lease guidance, but with no explicit bright lines. As such, operating leases will result in straight-line rent expense similar to current practice. For short term leases (term of 12 months or less), a lessee is permitted to make an accounting election not to recognize lease assets and lease liabilities, which would generally result in lease expense being recognized on a straight-line basis over the lease term. The guidance is effective for annual and interim periods beginning after December 15, 2018, and will require application of the new guidance at the beginning of the earliest comparable period presented. Early adoption is permitted. The new standard must be adopted using a modified retrospective transition. The adoption of this standard is expected to have a material impact on our financial position. We are still evaluating the impact on our results of operations and there is no impact on liquidity.
52
Key Financial Performance Indicators
In order to compare our financial performance between periods, we assess certain key performance indicators for each of our operating segments separately for the periods presented.
The following is a glossary of terms for some of our key performance indicators and non-GAAP measures:
“Actual Patient Days” is defined as the number of residents occupying a bed (or units in the case of an assisted/senior living center) for one qualifying day in that period.
“Adjusted EBITDA” is defined as EBITDA adjusted for (1) the conversion to cash basis leases (2) newly acquired or constructed businesses with start-up losses and (3) other adjustments. See “Reasons for Non-GAAP Financial Disclosure” for an explanation of the adjustments and a description of our uses of, and the limitations associated with, non-GAAP measures.
“Adjusted EBITDAR” is defined as EBITDAR adjusted for (1) the conversion to cash basis leases (2) newly acquired or constructed businesses with start-up losses and (3) other adjustments. See “Reasons for Non-GAAP Financial Disclosure” for an explanation of the adjustments and a description of our uses of, and the limitations associated with, non-GAAP measures.
“Available Patient Days” is defined as the number of available beds (or units in the case of an assisted/senior living center) multiplied by the number of days in that period.
“Average Daily Census” or “ADC” is the number of residents occupying a bed (or units in the case of an assisted/senior living center) over a period of time, divided by the number of calendar days in that period.
“EBITDA” is defined as EBITDAR less lease expense. See “Reasons for Non-GAAP Financial Disclosure” for an explanation of the adjustments and a description of our uses of, and the limitations associated with non-GAAP measures.
“EBITDAR” is defined as net income or loss before depreciation and amortization expense, interest expense, lease expense, loss (gain) on extinguishment of debt, other (income) loss, transaction costs, long-lived asset impairment, Skilled Healthcare loss contingency expense, income tax expense (benefit) and loss from discontinued operations, net of taxes. See “Reasons for Non-GAAP Financial Disclosure” for an explanation of the adjustments and a description of our uses of, and the limitations associated with non-GAAP measures.
“Insurance” refers collectively to commercial insurance and managed care payor sources, but does not include managed care payors serving Medicaid residents, which are included in the Medicaid category;
“Occupancy Percentage” is measured as the percentage of Actual Patient Days relative to the Available Patient Days;
“Skilled Mix” refers collectively to Medicare and Insurance payor sources.
“Therapist Efficiency” is computed by dividing billable labor minutes related to patient care by total labor minutes for the period.
53
Key performance indicators for our businesses are set forth below, followed by a comparison and analysis of our financial results:
|
|
|
Year ended December 31, |
|
|||||||
|
|
|
2015 |
|
2014 |
|
2013 |
|
|||
|
|
|
(In thousands) |
|
|||||||
|
Financial Results |
|
|
|
|
|
|
|
|
|
|
|
Net revenues |
|
$ |
5,619,224 |
|
$ |
4,768,080 |
|
$ |
4,710,341 |
|
|
EBITDAR |
|
|
697,827 |
|
|
532,537 |
|
|
584,537 |
|
|
EBITDA |
|
|
547,551 |
|
|
400,639 |
|
|
453,306 |
|
|
Adjusted EBITDAR |
|
|
725,588 |
|
|
589,816 |
|
|
589,673 |
|
|
Adjusted EBITDA |
|
|
243,870 |
|
|
140,617 |
|
|
159,564 |
|
54
INPATIENT SEGMENT:
|
|
|
Year ended December 31, |
|
|||||||
|
|
|
2015 |
|
2014 |
|
|
2013 |
|||
|
Occupancy Statistics - Inpatient |
|
|
|
|
|
|
|
|
|
|
|
Available licensed beds in service at end of period |
|
|
58,841 |
|
|
46,407 |
|
|
46,338 |
|
|
Available operating beds in service at end of period |
|
|
57,325 |
|
|
45,058 |
|
|
45,317 |
|
|
Available patient days based on licensed beds |
|
|
20,216,691 |
|
|
16,967,951 |
|
|
16,947,617 |
|
|
Available patient days based on operating beds |
|
|
19,663,712 |
|
|
16,463,613 |
|
|
16,564,662 |
|
|
Actual patient days |
|
|
17,061,645 |
|
|
14,679,338 |
|
|
14,627,220 |
|
|
Occupancy percentage - licensed beds |
|
|
84.4 |
% |
|
86.5 |
% |
|
86.3 |
% |
|
Occupancy percentage - operating beds |
|
|
86.8 |
% |
|
89.2 |
% |
|
88.3 |
% |
|
Skilled mix |
|
|
21.4 |
% |
|
21.7 |
% |
|
21.8 |
% |
|
Average daily census |
|
|
46,744 |
|
|
40,217 |
|
|
40,075 |
|
|
|
|
|
|
|
|
|
|
|
|
|
|
Revenue per patient day (skilled nursing facilities) |
|
|
|
|
|
|
|
|
|
|
|
Medicare Part A |
|
$ |
504 |
|
$ |
492 |
|
$ |
485 |
|
|
Medicare total (including Part B) |
|
|
543 |
|
|
530 |
|
|
522 |
|
|
Insurance |
|
|
448 |
|
|
450 |
|
|
444 |
|
|
Private and other |
|
|
295 |
|
|
316 |
|
|
301 |
|
|
Medicaid |
|
|
216 |
|
|
213 |
|
|
209 |
|
|
Medicaid (net of provider taxes) |
|
|
195 |
|
|
193 |
|
|
189 |
|
|
Weighted average (net of provider taxes) |
|
$ |
270 |
|
$ |
270 |
|
$ |
266 |
|
|
|
|
|
|
|
|
|
|
|
|
|
|
Patient days by payor (skilled nursing facilities) |
|
|
|
|
|
|
|
|
|
|
|
Medicare |
|
|
2,214,184 |
|
|
2,076,272 |
|
|
2,138,427 |
|
|
Insurance |
|
|
1,172,776 |
|
|
900,663 |
|
|
828,120 |
|
|
Total skilled mix days |
|
|
3,386,960 |
|
|
2,976,935 |
|
|
2,966,547 |
|
|
Private and other |
|
|
1,160,070 |
|
|
971,500 |
|
|
1,061,963 |
|
|
Medicaid |
|
|
11,272,487 |
|
|
9,759,092 |
|
|
9,609,372 |
|
|
Total Days |
|
|
15,819,517 |
|
|
13,707,527 |
|
|
13,637,882 |
|
|
|
|
|
|
|
|
|
|
|
|
|
|
Patient days as a percentage of total patient days (skilled nursing facilities) |
|
|
|
|
|
|
|
|
|
|
|
Medicare |
|
|
14.0 |
% |
|
15.1 |
% |
|
15.7 |
% |
|
Insurance |
|
|
7.4 |
% |
|
6.6 |
% |
|
6.1 |
% |
|
Skilled mix |
|
|
21.4 |
% |
|
21.7 |
% |
|
21.8 |
% |
|
Private and other |
|
|
7.3 |
% |
|
7.1 |
% |
|
7.8 |
% |
|
Medicaid |
|
|
71.3 |
% |
|
71.2 |
% |
|
70.4 |
% |
|
Total |
|
|
100.0 |
% |
|
100.0 |
% |
|
100.0 |
% |
|
|
|
|
|
|
|
|
|
|
|
|
|
Facilities at end of period |
|
|
|
|
|
|
|
|
|
|
|
Skilled nursing facilities |
|
|
|
|
|
|
|
|
|
|
|
Leased |
|
|
381 |
|
|
359 |
|
|
357 |
|
|
Owned |
|
|
49 |
|
|
2 |
|
|
3 |
|
|
Joint Venture |
|
|
5 |
|
|
5 |
|
|
5 |
|
|
Managed * |
|
|
40 |
|
|
14 |
|
|
14 |
|
|
Total skilled nursing facilities |
|
|
475 |
|
|
380 |
|
|
379 |
|
|
Total licensed beds |
|
|
58,046 |
|
|
46,204 |
|
|
46,298 |
|
|
|
|
|
|
|
|
|
|
|
|
|
|
Assisted/Senior living facilities: |
|
|
|
|
|
|
|
|
|
|
|
Leased |
|
|
30 |
|
|
28 |
|
|
27 |
|
|
Owned |
|
|
22 |
|
|
1 |
|
|
— |
|
|
Joint Venture |
|
|
1 |
|
|
1 |
|
|
1 |
|
|
Managed |
|
|
3 |
|
|
4 |
|
|
4 |
|
|
Total assisted/senior living facilities |
|
|
56 |
|
|
34 |
|
|
32 |
|
|
Total licensed beds |
|
|
3,985 |
|
|
2,762 |
|
|
2,702 |
|
|
Total facilities |
|
|
531 |
|
|
414 |
|
|
411 |
|
|
|
|
|
|
|
|
|
|
|
|
|
|
Total Jointly Owned and Managed— (Unconsolidated) |
|
|
22 |
|
|
17 |
|
|
17 |
|
55
REHABILITATION THERAPY SEGMENT:
|
|
|
Year ended December 31, |
|
|||||||
|
|
|
2015 |
|
2014 |
|
2013 |
|
|||
|
Revenue mix %: |
|
|
|
|
|
|
|
|
|
|
|
Company-operated |
|
|
38 |
% |
|
37 |
% |
|
36 |
% |
|
Non-affiliated |
|
|
62 |
% |
|
63 |
% |
|
64 |
% |
|
Sites of service (at end of period) |
|
|
1,670 |
|
|
1,358 |
|
|
1,408 |
|
|
Revenue per site |
|
$ |
672,296 |
|
$ |
687,782 |
|
$ |
656,265 |
|
|
Therapist efficiency % |
|
|
69 |
% |
|
68 |
% |
|
67 |
% |
* Includes 20 facilities located in Texas for which the real estate is owned by Genesis.
Reasons for Non-GAAP Financial Disclosure
The following discussion includes references to EBITDAR, Adjusted EBITDAR, EBITDA and Adjusted EBITDA, which are non-GAAP financial measures (collectively, Non-GAAP Financial Measures). For purposes of SEC Regulation G, a non-GAAP financial measure is a numerical measure of a registrant’s historical or future financial performance, financial position and cash flows that excludes amounts, or is subject to adjustments that have the effect of excluding amounts, that are included in the most directly comparable financial measure calculated and presented in accordance with GAAP in the statement of operations, balance sheet or statement of cash flows (or equivalent statements) of the registrant; or includes amounts, or is subject to adjustments that have the effect of including amounts, that are excluded from the most directly comparable financial measure so calculated and presented. In this regard, GAAP refers to generally accepted accounting principles in the United States. Pursuant to the requirements of Regulation G, we have provided reconciliations of the Non-GAAP Financial Measures to the most directly comparable GAAP financial measures.
We believe the presentation of Non-GAAP Financial Measures provides useful information to investors regarding our results of operations because these financial measures are useful for trending, analyzing and benchmarking the performance and value of our business. By excluding certain expenses and other items that may not be indicative of our core business operating results, these Non-GAAP Financial Measures:
allow investors to evaluate our performance from management’s perspective, resulting in greater transparency with respect to supplemental information used by us in our financial and operational decision making;
facilitate comparisons with prior periods and reflect the principal basis on which management monitors financial performance;
facilitate comparisons with the performance of others in the post-acute industry;
provide better transparency as to the relationship each reporting period between our cash basis lease expense and the level of operating earnings available to fund lease expense; and
allow investors to view our financial performance and condition in the same manner its significant landlords and lenders require us to report financial information to them in connection with determining our compliance with financial covenants.
We use Non-GAAP Financial Measures primarily as performance measures and believe that the GAAP financial measure most directly comparable to them is net income (loss). We use Non-GAAP Financial Measures as measures to assess the relative performance of our operating businesses, as well as the employees responsible for operating such businesses. Non-GAAP Financial Measures are useful in this regard because they do not include such costs as interest expense, income taxes and depreciation and amortization expense which may vary from business unit to business unit depending upon such factors as the method used to finance the original purchase of the business unit or the tax law in the
56
state in which a business unit operates. By excluding such factors when measuring financial performance, many of which are outside of the control of the employees responsible for operating our business units, we are better able to evaluate the operating performance of the business unit and the employees responsible for business unit performance. Consequently, we use these Non-GAAP Financial Measures to determine the extent to which our employees have met performance goals, and therefore may or may not be eligible for incentive compensation awards.
We also use Non-GAAP Financial Measures in our annual budget process. We believe these Non-GAAP Financial Measures facilitate internal comparisons to historical operating performance of prior periods and external comparisons to competitors’ historical operating performance. The presentation of these Non-GAAP Financial Measures is consistent with our past practice and we believe these measures further enable investors and analysts to compare current non-GAAP measures with non-GAAP measures presented in prior periods.
Although we use Non-GAAP Financial Measures as financial measures to assess the performance of our business, the use of these Non-GAAP Financial Measures is limited because they do not consider certain material costs necessary to operate the business. These costs include our lease expense (only in the case of EBITDAR and Adjusted EBITDAR), the cost to service debt, the depreciation and amortization associated with our long-lived assets, losses (gains) on extinguishment of debt, transaction costs, long-lived asset impairment charges, federal and state income tax expenses, the operating results of our discontinued businesses and the income or loss attributed to non-controlling interests. Because Non-GAAP Financial Measures do not consider these important elements of our cost structure, a user of our financial information who relies on Non-GAAP Financial Measures as the only measures of our performance could draw an incomplete or misleading conclusion regarding our financial performance. Consequently, a user of our financial information should consider net income (loss) as an important measure of its financial performance because it provides the most complete measure of our performance.
Other companies may define Non-GAAP Financial Measures differently and, as a result, our Non-GAAP Financial Measures may not be directly comparable to those of other companies. Non-GAAP Financial Measures do not represent net income (loss), as defined by GAAP. Non-GAAP Financial Measures should be considered in addition to, not a substitute for, or superior to, GAAP financial measures.
The following tables provide reconciliations to EBITDAR, Adjusted EBITDAR, EBITDA and Adjusted EBITDA from net income (loss) the most directly comparable financial measure presented in accordance with GAAP:
57
GENESIS HEALTHCARE, INC.
RECONCILIATION OF NET (LOSS) INCOME TO EBITDA, EBITDAR, ADJUSTED EBITDA AND ADJUSTED EBITDAR
(UNAUDITED)
(IN THOUSANDS, EXCEPT PER SHARE DATA)
|
|
|
As reported |
|
Adjustments |
|
As adjusted |
|
|||||||||
|
|
|
|
|
|
|
|
|
Newly acquired |
|
|
|
|
|
|
|
|
|
|
|
|
|
|
|
|
|
or constructed |
|
|
|
|
|
|
|
|
|
|
|
|
|
|
|
|
|
businesses with |
|
|
|
|
|
|
|
|
|
|
|
|
|
|
|
|
|
start-up losses |
|
|
|
|
|
|
|
|
|
|
|
Year ended |
|
Conversion to |
|
and newly |
|
|
|
|
Year ended |
|
||||
|
|
|
December 31, |
|
cash basis |
|
divested |
|
Other |
|
December 31, |
|
|||||
|
|
|
2015 |
|
leases (a) |
|
facilities (b) |
|
adjustments (c) |
|
2015 |
|
|||||
|
Net revenues |
|
$ |
5,619,224 |
|
$ |
— |
|
$ |
(45,613) |
|
$ |
388 |
|
$ |
5,573,999 |
|
|
Salaries, wages and benefits |
|
|
3,289,820 |
|
|
— |
|
|
(25,890) |
|
|
(3,211) |
|
|
3,260,719 |
|
|
Other operating expenses |
|
|
1,358,983 |
|
|
— |
|
|
(22,742) |
|
|
(10,602) |
|
|
1,325,639 |
|
|
General and administrative costs |
|
|
175,889 |
|
|
— |
|
|
— |
|
|
(9,530) |
|
|
166,359 |
|
|
Provision for losses on accounts receivable |
|
|
100,521 |
|
|
— |
|
|
(1,011) |
|
|
— |
|
|
99,510 |
|
|
Lease expense |
|
|
150,276 |
|
|
341,030 |
|
|
(9,588) |
|
|
— |
|
|
481,718 |
|
|
Depreciation and amortization expense |
|
|
237,617 |
|
|
(135,472) |
|
|
(5,919) |
|
|
— |
|
|
96,226 |
|
|
Interest expense |
|
|
507,809 |
|
|
(417,033) |
|
|
(162) |
|
|
— |
|
|
90,614 |
|
|
Loss on extinguishment of debt |
|
|
130 |
|
|
— |
|
|
— |
|
|
(130) |
|
|
— |
|
|
Investment income |
|
|
(1,677) |
|
|
— |
|
|
— |
|
|
— |
|
|
(1,677) |
|
|
Other (income) loss |
|
|
(1,400) |
|
|
— |
|
|
(55) |
|
|
1,455 |
|
|
— |
|
|
Transaction costs |
|
|
96,374 |
|
|
— |
|
|
(69) |
|
|
(96,305) |
|
|
— |
|
|
Long-lived asset impairment |
|
|
28,546 |
|
|
— |
|
|
— |
|
|
(28,546) |
|
|
— |
|
|
Skilled Healthcare loss contingency expense |
|
|
31,500 |
|
|
— |
|
|
— |
|
|
(31,500) |
|
|
— |
|
|
Equity in net income of unconsolidated affiliates |
|
|
(2,139) |
|
|
— |
|
|
— |
|
|
— |
|
|
(2,139) |
|
|
(Loss) income before income tax benefit |
|
$ |
(353,025) |
|
$ |
211,475 |
|
$ |
19,823 |
|
$ |
178,757 |
|
$ |
57,030 |
|
|
Income tax expense (benefit) |
|
|
172,524 |
|
|
49,088 |
|
|
4,601 |
|
|
(180,366) |
|
|
45,847 |
|
|
(Loss) income from continuing operations |
|
$ |
(525,549) |
|
$ |
162,387 |
|
$ |
15,222 |
|
$ |
359,123 |
|
$ |
11,183 |
|
|
Loss from discontinued operations, net of taxes |
|
|
1,219 |
|
|
1,283 |
|
|
— |
|
|
— |
|
|
2,502 |
|
|
Net (loss) income attributable to noncontrolling interests |
|
|
(100,573) |
|
|
29,591 |
|
|
2,088 |
|
|
27,911 |
|
|
(40,983) |
|
|
Net (loss) income attributable to Genesis Healthcare, Inc. |
|
$ |
(426,195) |
|
$ |
131,513 |
|
$ |
13,134 |
|
$ |
331,212 |
|
$ |
49,664 |
|
|
Depreciation and amortization expense |
|
|
237,617 |
|
|
(135,472) |
|
|
(5,919) |
|
|
— |
|
|
96,226 |
|
|
Interest expense |
|
|
507,809 |
|
|
(417,033) |
|
|
(162) |
|
|
— |
|
|
90,614 |
|
|
Loss on extinguishment of debt |
|
|
130 |
|
|
— |
|
|
— |
|
|
(130) |
|
|
— |
|
|
Other (income) loss |
|
|
(1,400) |
|
|
— |
|
|
(55) |
|
|
1,455 |
|
|
— |
|
|
Transaction costs |
|
|
96,374 |
|
|
— |
|
|
(69) |
|
|
(96,305) |
|
|
— |
|
|
Long-lived asset impairment |
|
|
28,546 |
|
|
— |
|
|
— |
|
|
(28,546) |
|
|
— |
|
|
Skilled Healthcare loss contingency expense |
|
|
31,500 |
|
|
— |
|
|
— |
|
|
(31,500) |
|
|
— |
|
|
Income tax expense (benefit) |
|
|
172,524 |
|
|
49,088 |
|
|
4,601 |
|
|
(180,366) |
|
|
45,847 |
|
|
Loss from discontinued operations, net of taxes |
|
|
1,219 |
|
|
1,283 |
|
|
— |
|
|
— |
|
|
2,502 |
|
|
Net (loss) income attributable to noncontrolling interests |
|
|
(100,573) |
|
|
29,591 |
|
|
2,088 |
|
|
27,911 |
|
|
(40,983) |
|
|
EBITDA / Adjusted EBITDA |
|
$ |
547,551 |
|
$ |
(341,030) |
|
$ |
13,618 |
|
$ |
23,731 |
|
$ |
243,870 |
|
|
Lease expense |
|
|
150,276 |
|
|
341,030 |
|
|
(9,588) |
|
|
— |
|
|
481,718 |
|
|
EBITDAR / Adjusted EBITDAR |
|
$ |
697,827 |
|
$ |
— |
|
$ |
4,030 |
|
$ |
23,731 |
|
$ |
725,588 |
|
|
|
|
|
|
|
|
|
|
|
|
|
|
|
|
|
|
|
|
(Loss) income per common share: |
|
|
|
|
|
|
|
|
|
|
|
|
|
|
|
|
|
Diluted: |
|
|
|
|
|
|
|
|
|
|
|
|
|
|
|
|
|
Weighted average shares outstanding for diluted (loss) income from continuing operations per share (d) |
|
|
85,755 |
|
|
|
|
|
|
|
|
|
|
|
153,671 |
|
|
Diluted net (loss) income from continuing operations per share (e) |
|
$ |
(4.96) |
|
|
|
|
|
|
|
|
|
|
$ |
0.34 |
|
58
GENESIS HEALTHCARE, INC.
RECONCILIATION OF NET (LOSS) INCOME TO EBITDA, EBITDAR, ADJUSTED EBITDA AND ADJUSTED EBITDAR
(UNAUDITED)
(IN THOUSANDS, EXCEPT PER SHARE DATA)
|
|
|
As reported |
|
Adjustments |
|
As adjusted |
|
|||||||||
|
|
|
|
|
|
|
|
|
Newly acquired |
|
|
|
|
|
|
|
|
|
|
|
|
|
|
|
|
|
or constructed |
|
|
|
|
|
|
|
|
|
|
|
|
|
|
|
|
|
businesses with |
|
|
|
|
|
|
|
|
|
|
|
|
|
|
|
|
|
start-up losses |
|
|
|
|
|
|
|
|
|
|
|
Year ended |
|
Conversion to |
|
and newly |
|
|
|
|
Year ended |
|
||||
|
|
|
December 31, |
|
cash basis |
|
divested |
|
Other |
|
December 31, |
|
|||||
|
|
|
2014 |
|
leases (a) |
|
facilities (b) |
|
adjustments (c) |
|
2014 |
|
|||||
|
Net revenues |
|
$ |
4,768,080 |
|
$ |
— |
|
$ |
(18,526) |
|
$ |
4,260 |
|
$ |
4,753,814 |
|
|
Salaries, wages and benefits |
|
|
2,904,094 |
|
|
— |
|
|
(16,233) |
|
|
(2,579) |
|
|
2,885,282 |
|
|
Other operating expenses |
|
|
1,109,699 |
|
|
— |
|
|
(8,372) |
|
|
(44,361) |
|
|
1,056,966 |
|
|
General and administrative costs |
|
|
147,063 |
|
|
— |
|
|
— |
|
|
— |
|
|
147,063 |
|
|
Provision for losses on accounts receivable |
|
|
77,670 |
|
|
— |
|
|
— |
|
|
— |
|
|
77,670 |
|
|
Lease expense |
|
|
131,898 |
|
|
320,306 |
|
|
(3,005) |
|
|
— |
|
|
449,199 |
|
|
Depreciation and amortization expense |
|
|
193,675 |
|
|
(132,326) |
|
|
(434) |
|
|
— |
|
|
60,915 |
|
|
Interest expense |
|
|
442,724 |
|
|
(391,962) |
|
|
— |
|
|
— |
|
|
50,762 |
|
|
Loss on extinguishment of debt |
|
|
1,133 |
|
|
— |
|
|
— |
|
|
(1,133) |
|
|
— |
|
|
Investment income |
|
|
(3,399) |
|
|
— |
|
|
— |
|
|
— |
|
|
(3,399) |
|
|
Other (income) loss |
|
|
(138) |
|
|
— |
|
|
— |
|
|
138 |
|
|
— |
|
|
Transaction costs |
|
|
13,353 |
|
|
— |
|
|
— |
|
|
(13,353) |
|
|
— |
|
|
Long-lived asset impairment |
|
|
31,399 |
|
|
— |
|
|
— |
|
|
(31,399) |
|
|
— |
|
|
Equity in net income of unconsolidated affiliates |
|
|
416 |
|
|
— |
|
|
— |
|
|
— |
|
|
416 |
|
|
(Loss) income before income tax benefit |
|
$ |
(281,507) |
|
$ |
203,982 |
|
$ |
9,518 |
|
$ |
96,947 |
|
$ |
28,940 |
|
|
Income tax (benefit) expense |
|
|
(44,022) |
|
|
31,899 |
|
|
1,488 |
|
|
15,161 |
|
|
4,526 |
|
|
(Loss) income from continuing operations |
|
$ |
(237,485) |
|
$ |
172,083 |
|
$ |
8,030 |
|
$ |
81,786 |
|
$ |
24,414 |
|
|
Loss (income) from discontinued operations, net of taxes |
|
|
14,044 |
|
|
(2,041) |
|
|
— |
|
|
— |
|
|
12,003 |
|
|
Net loss attributable to noncontrolling interests |
|
|
2,456 |
|
|
— |
|
|
— |
|
|
— |
|
|
2,456 |
|
|
Net (loss) income attributable to Genesis Healthcare, Inc. |
|
$ |
(253,985) |
|
$ |
174,124 |
|
$ |
8,030 |
|
$ |
81,786 |
|
$ |
9,955 |
|
|
Depreciation and amortization expense |
|
|
193,675 |
|
|
(132,326) |
|
|
(434) |
|
|
— |
|
|
60,915 |
|
|
Interest expense |
|
|
442,724 |
|
|
(391,962) |
|
|
— |
|
|
— |
|
|
50,762 |
|
|
Loss on extinguishment of debt |
|
|
1,133 |
|
|
— |
|
|
— |
|
|
(1,133) |
|
|
— |
|
|
Other (income) loss |
|
|
(138) |
|
|
— |
|
|
— |
|
|
138 |
|
|
— |
|
|
Transaction costs |
|
|
13,353 |
|
|
— |
|
|
— |
|
|
(13,353) |
|
|
— |
|
|
Long-lived asset impairment |
|
|
31,399 |
|
|
— |
|
|
— |
|
|
(31,399) |
|
|
— |
|
|
Income tax (benefit) expense |
|
|
(44,022) |
|
|
31,899 |
|
|
1,488 |
|
|
15,161 |
|
|
4,526 |
|
|
Loss (income) from discontinued operations, net of taxes |
|
|
14,044 |
|
|
(2,041) |
|
|
— |
|
|
— |
|
|
12,003 |
|
|
Net loss attributable to noncontrolling interests |
|
|
2,456 |
|
|
— |
|
|
— |
|
|
— |
|
|
2,456 |
|
|
EBITDA / Adjusted EBITDA |
|
$ |
400,639 |
|
$ |
(320,306) |
|
$ |
9,084 |
|
$ |
51,200 |
|
$ |
140,617 |
|
|
Lease expense |
|
|
131,898 |
|
|
320,306 |
|
|
(3,005) |
|
|
— |
|
|
449,199 |
|
|
EBITDAR / Adjusted EBITDAR |
|
$ |
532,537 |
|
$ |
— |
|
$ |
6,079 |
|
$ |
51,200 |
|
$ |
589,816 |
|
|
|
|
|
|
|
|
|
|
|
|
|
|
|
|
|
|
|
|
(Loss) income per common share: |
|
|
|
|
|
|
|
|
|
|
|
|
|
|
|
|
|
Diluted: |
|
|
|
|
|
|
|
|
|
|
|
|
|
|
|
|
|
Weighted average shares outstanding for diluted (loss) income from continuing operations per share (d) |
|
|
49,865 |
|
|
|
|
|
|
|
|
|
|
|
|
|
|
Diluted net (loss) income from continuing operations per share (e) |
|
$ |
(4.81) |
|
|
|
|
|
|
|
|
|
|
|
Not calculated |
|
59
GENESIS HEALTHCARE, INC.
RECONCILIATION OF NET (LOSS) INCOME TO EBITDA, EBITDAR, ADJUSTED EBITDA AND ADJUSTED EBITDAR
(UNAUDITED)
(IN THOUSANDS, EXCEPT PER SHARE DATA)
|
|
|
As reported |
|
Adjustments |
|
As adjusted |
|||||||||
|
|
|
|
|
|
|
|
|
Newly acquired |
|
|
|
|
|
|
|
|
|
|
|
|
|
|
|
|
or constructed |
|
|
|
|
|
|
|
|
|
|
|
|
|
|
|
|
businesses with |
|
|
|
|
|
|
|
|
|
|
|
|
|
|
|
|
start-up losses |
|
|
|
|
|
|
|
|
|
|
Year ended |
|
Conversion to |
|
and newly |
|
|
|
|
Year ended |
||||
|
|
|
December 31, |
|
cash basis |
|
divested |
|
Other |
|
December 31, |
|||||
|
|
|
2013 |
|
leases (a) |
|
facilities (b) |
|
adjustments (c) |
|
2013 |
|||||
|
Net revenues |
|
$ |
4,710,341 |
|
$ |
— |
|
$ |
(21,131) |
|
$ |
— |
|
$ |
4,689,210 |
|
Salaries, wages and benefits |
|
|
2,898,860 |
|
|
— |
|
|
(12,263) |
|
|
(1,616) |
|
|
2,884,981 |
|
Other operating expenses |
|
|
1,007,909 |
|
|
— |
|
|
(8,824) |
|
|
(3,564) |
|
|
995,521 |
|
General and administrative costs |
|
|
152,555 |
|
|
— |
|
|
— |
|
|
— |
|
|
152,555 |
|
Provision for losses on accounts receivable |
|
|
69,939 |
|
|
— |
|
|
— |
|
|
— |
|
|
69,939 |
|
Lease expense |
|
|
131,231 |
|
|
303,328 |
|
|
(4,450) |
|
|
— |
|
|
430,109 |
|
Depreciation and amortization expense |
|
|
188,726 |
|
|
(131,839) |
|
|
(247) |
|
|
— |
|
|
56,640 |
|
Interest expense |
|
|
426,975 |
|
|
(377,556) |
|
|
— |
|
|
— |
|
|
49,419 |
|
Loss on extinguishment of debt |
|
|
63 |
|
|
— |
|
|
— |
|
|
(63) |
|
|
— |
|
Investment income |
|
|
(4,150) |
|
|
— |
|
|
— |
|
|
— |
|
|
(4,150) |
|
Other loss (income) |
|
|
450 |
|
|
— |
|
|
— |
|
|
(450) |
|
|
— |
|
Transaction costs |
|
|
5,878 |
|
|
— |
|
|
— |
|
|
(5,878) |
|
|
— |
|
Long-lived asset impairment |
|
|
9,999 |
|
|
— |
|
|
— |
|
|
(9,999) |
|
|
— |
|
Equity in net income of unconsolidated affiliates |
|
|
691 |
|
|
— |
|
|
— |
|
|
— |
|
|
691 |
|
(Loss) income before income tax benefit |
|
$ |
(178,785) |
|
$ |
206,067 |
|
$ |
4,653 |
|
$ |
21,570 |
|
$ |
53,505 |
|
Income tax (benefit) expense |
|
|
(9,179) |
|
|
32,021 |
|
|
723 |
|
|
3,352 |
|
|
26,917 |
|
(Loss) income from continuing operations |
|
$ |
(169,606) |
|
$ |
174,046 |
|
$ |
3,930 |
|
$ |
18,218 |
|
$ |
26,588 |
|
Loss from discontinued operations, net of taxes |
|
|
7,364 |
|
|
(57) |
|
|
— |
|
|
— |
|
|
7,307 |
|
Net loss attributable to noncontrolling interests |
|
|
1,025 |
|
|
— |
|
|
— |
|
|
— |
|
|
1,025 |
|
Net (loss) income attributable to Genesis Healthcare, Inc. |
|
$ |
(177,995) |
|
$ |
174,103 |
|
$ |
3,930 |
|
$ |
18,218 |
|
$ |
18,256 |
|
Depreciation and amortization expense |
|
|
188,726 |
|
|
(131,839) |
|
|
(247) |
|
|
— |
|
|
56,640 |
|
Interest expense |
|
|
426,975 |
|
|
(377,556) |
|
|
— |
|
|
— |
|
|
49,419 |
|
Loss on extinguishment of debt |
|
|
63 |
|
|
— |
|
|
— |
|
|
(63) |
|
|
— |
|
Other loss (income) |
|
|
450 |
|
|
— |
|
|
— |
|
|
(450) |
|
|
— |
|
Transaction costs |
|
|
5,878 |
|
|
— |
|
|
— |
|
|
(5,878) |
|
|
— |
|
Long-lived asset impairment |
|
|
9,999 |
|
|
— |
|
|
— |
|
|
(9,999) |
|
|
— |
|
Income tax (benefit) expense |
|
|
(9,179) |
|
|
32,021 |
|
|
723 |
|
|
3,352 |
|
|
26,917 |
|
Loss from discontinued operations, net of taxes |
|
|
7,364 |
|
|
(57) |
|
|
— |
|
|
— |
|
|
7,307 |
|
Net income attributable to noncontrolling interests |
|
|
1,025 |
|
|
— |
|
|
— |
|
|
— |
|
|
1,025 |
|
EBITDA / Adjusted EBITDA |
|
$ |
453,306 |
|
$ |
(303,328) |
|
$ |
4,406 |
|
$ |
5,180 |
|
$ |
159,564 |
|
Lease expense |
|
|
131,231 |
|
|
303,328 |
|
|
(4,450) |
|
|
— |
|
|
430,109 |
|
EBITDAR / Adjusted EBITDAR |
|
$ |
584,537 |
|
$ |
— |
|
$ |
(44) |
|
$ |
5,180 |
|
$ |
589,673 |
|
|
|
|
|
|
|
|
|
|
|
|
|
|
|
|
|
|
(Loss) income per common share: |
|
|
|
|
|
|
|
|
|
|
|
|
|
|
|
|
Diluted: |
|
|
|
|
|
|
|
|
|
|
|
|
|
|
|
|
Weighted average shares outstanding for diluted (loss) income from continuing operations per share (d) |
|
|
49,865 |
|
|
|
|
|
|
|
|
|
|
|
|
|
Diluted net (loss) income from continuing operations per share (e) |
|
$ |
(3.42) |
|
|
|
|
|
|
|
|
|
|
|
Not calculated |
(a)Our leases are classified as either operating leases, capital leases or financing obligations pursuant to applicable guidance under U.S. GAAP. We view the primary provisions and economics of these leases, regardless of their accounting treatment, as being nearly identical. Virtually all of our leases are structured with triple net terms, have fixed annual rent escalators and have long-term initial maturities with renewal options. Accordingly, in connection with our evaluation of our financial performance, we reclassify all of our leases to operating lease treatment and reflect lease expense on a cash basis. This approach allows us to better understand the relationship in each reporting period of our operating performance, as measured by EBITDAR and Adjusted EBITDAR, to the cash basis obligations to our landlords in that reporting period, regardless of the lease accounting treatment. This presentation and approach is also consistent with the financial reporting and covenant
60
compliance requirements contained in all of our major lease and loan agreements. The following table summarizes the reclassification adjustments necessary to present all leases as operating leases on a cash basis:
|
|
|
Year ended December 31, |
|
|||||||
|
|
|
2015 |
|
2014 |
|
2013 |
|
|||
|
|
|
(in thousands) |
|
|||||||
|
Lease expense: |
|
|
|
|
|
|
|
|
|
|
|
Cash rent - capital leases |
|
$ |
91,899 |
|
$ |
89,683 |
|
$ |
88,549 |
|
|
Cash rent - financing obligations |
|
|
257,121 |
|
|
242,918 |
|
|
229,452 |
|
|
Non-cash - operating lease arrangements |
|
|
(7,990) |
|
|
(12,295) |
|
|
(14,673) |
|
|
Lease expense adjustments |
|
$ |
341,030 |
|
$ |
320,306 |
|
$ |
303,328 |
|
|
|
|
|
|
|
|
|
|
|
|
|
|
Depreciation and amortization expense: |
|
|
|
|
|
|
|
|
|
|
|
Capital lease accounting |
|
$ |
(35,544) |
|
$ |
(35,385) |
|
$ |
(35,116) |
|
|
Financing obligation accounting |
|
|
(99,928) |
|
|
(96,941) |
|
|
(96,723) |
|
|
Depreciation and amortization expense adjustments |
|
$ |
(135,472) |
|
$ |
(132,326) |
|
$ |
(131,839) |
|
|
|
|
|
|
|
|
|
|
|
|
|
|
Interest expense: |
|
|
|
|
|
|
|
|
|
|
|
Capital lease accounting |
|
$ |
(104,660) |
|
$ |
(100,846) |
|
$ |
(98,870) |
|
|
Financing obligation accounting |
|
|
(312,373) |
|
|
(291,116) |
|
|
(278,686) |
|
|
Interest expense adjustments |
|
$ |
(417,033) |
|
$ |
(391,962) |
|
$ |
(377,556) |
|
|
|
|
|
|
|
|
|
|
|
|
|
|
Total pre-tax lease accounting adjustments |
|
$ |
(211,475) |
|
$ |
(203,982) |
|
$ |
(206,067) |
|
(b)The acquisition and construction of new businesses has become an important element of our growth strategy. Many of the businesses we acquire have a history of operating losses and continue to generate operating losses in the months that follow our acquisition. Newly constructed or developed businesses also generate losses while in their start-up phase. We view these losses as both temporary and an expected component of our long-term investment in the new venture. We adjust these losses when computing Adjusted EBITDAR and Adjusted EBITDA in order to better evaluate the performance of our core business. The activities of such businesses are adjusted when computing Adjusted EBITDAR and Adjusted EBITDA until such time as a new business generates positive Adjusted EBITDA. The operating performance of new businesses are no longer adjusted when computing Adjusted EBITDAR and Adjusted EBITDA beginning the period in which a new business generates positive Adjusted EBITDA and all periods thereafter. The divestiture of underperforming or non-strategic facilities has also become an important element of our earnings optimization strategy. We eliminate the results of divested facilities beginning in the quarter in which they become divested. We view the losses associated with the wind down of such divested facilities as non-recurring and not indicative of the performance of our core business.
61
(c)Other adjustments represent costs or gains associated with transactions or events that we do not believe are reflective of our core recurring operating business. The following items were realized in the periods presented:
|
|
|
Year ended December 31, |
|
|||||||
|
|
|
2015 |
|
2014 |
|
2013 |
|
|||
|
|
|
(in thousands) |
|
|||||||
|
Severance and restructuring (1) |
|
$ |
3,485 |
|
$ |
8,975 |
|
$ |
3,254 |
|
|
Regulatory defense and related costs (2) |
|
|
4,992 |
|
|
5,085 |
|
|
310 |
|
|
New business development costs (3) |
|
|
— |
|
|
1,641 |
|
|
— |
|
|
New contract obligation assumption |
|
|
— |
|
|
— |
|
|
1,616 |
|
|
Self-insurance adjustment (4) |
|
|
10,500 |
|
|
35,499 |
|
|
— |
|
|
Transaction costs (5) |
|
|
96,305 |
|
|
13,353 |
|
|
5,878 |
|
|
Long-lived asset impairment (9) |
|
|
28,546 |
|
|
31,399 |
|
|
9,999 |
|
|
Skilled Healthcare loss contingency expense (8) |
|
|
31,500 |
|
|
— |
|
|
— |
|
|
(Gain) loss on early extinguishment of debt |
|
|
130 |
|
|
1,133 |
|
|
63 |
|
|
Other income (6) |
|
|
(1,455) |
|
|
(138) |
|
|
450 |
|
|
Stock based compensation (7) |
|
|
4,754 |
|
|
— |
|
|
— |
|
|
Tax benefit from total adjustments |
|
|
(41,493) |
|
|
(15,161) |
|
|
(3,352) |
|
|
Deferred tax valuation allowance adjustment (10) |
|
|
221,859 |
|
|
— |
|
|
— |
|
|
Total other adjustments |
|
$ |
359,123 |
|
$ |
81,786 |
|
$ |
18,218 |
|
(1) We incurred costs related to the termination, severance and restructuring of certain components of our business.
(2) We incurred legal defense and other related costs in connection with certain matters in dispute or under appeal with regulatory agencies.
(3) We incurred business development costs in connection with the evaluation and start-up of services outside our existing service offerings.
(4) For the year ended December 31, 2015, we incurred a self-insured program adjustment of $10.5 million for the actuarially developed general liability / professional liability (GLPL) and worker's compensation claims related to policy periods 2014 and prior. For the year ended December 31, 2014 we incurred a self-insured program adjustment of $35.5 million for the actuarial developed GLPL and workers' compensation claims related to prior policy years specific to the Sun Merger acquired in December 2012.
(5) We incurred costs associated with transactions including the Combination of Skilled and other transactions.
(6) We realized net gains and losses on the sale of certain assets in the years ended December 31, 2015, 2014 and 2013.
(7) We incurred non-cash stock-based compensation related to restricted stock units.
(8) For the year ended December 31, 2015, we recognized $31.5 million of loss contingency expense associated with three Skilled regulatory matters.
(9) We incurred non-cash charges in connection with long-lived asset impairment testing.
(10) We established a valuation allowance against our net deferred tax assets, as realization of such assets is no longer more likely than not.
(d)Assumes 153.7 million diluted weighted average common shares outstanding and common stock equivalents on a fully exchanged basis.
(e)Pro forma adjusted income from continuing operations per share assumes a tax rate of 40%, and is computed as follows: Pro forma adjusted income before income taxes x (1 - 40% tax rate) / diluted weighted average shares on a fully exchanged basis.
62
Results of Operations
Year Ended December 31, 2015 Compared to Year Ended December 31, 2014
A summary of our results of operations for the year ended December 31, 2015 as compared with the same period in 2014 follows:
|
|
|
Year ended December 31, |
|
|
|
|
|
|||||||||
|
|
|
2015 |
|
2014 |
|
Increase / (Decrease) |
|
|||||||||
|
|
|
Revenue |
|
Revenue |
|
Revenue |
|
Revenue |
|
|
|
|
|
|
||
|
|
|
Dollars |
|
Percentage |
|
Dollars |
|
Percentage |
|
Dollars |
|
Percentage |
|
|||
|
|
|
(in thousands, except percentages) |
|
|||||||||||||
|
Revenues: |
|
|
|
|
|
|
|
|
|
|
|
|
|
|
|
|
|
Inpatient services: |
|
|
|
|
|
|
|
|
|
|
|
|
|
|
|
|
|
Skilled nursing facilities |
|
$ |
4,597,671 |
|
81.7 |
% |
$ |
3,924,571 |
|
82.3 |
% |
$ |
673,100 |
|
17.2 |
% |
|
Assisted/Senior living facilities |
|
|
143,321 |
|
2.6 |
% |
|
107,034 |
|
2.2 |
% |
|
36,287 |
|
33.9 |
% |
|
Administration of third party facilities |
|
|
9,488 |
|
0.2 |
% |
|
10,297 |
|
0.2 |
% |
|
(809) |
|
(7.9) |
% |
|
Elimination of administrative services |
|
|
(1,800) |
|
— |
% |
|
(2,089) |
|
— |
% |
|
289 |
|
(13.8) |
% |
|
Inpatient services, net |
|
|
4,748,680 |
|
84.5 |
% |
|
4,039,813 |
|
84.7 |
% |
|
708,867 |
|
17.5 |
% |
|
|
|
|
|
|
|
|
|
|
|
|
|
|
|
|
|
|
|
Rehabilitation therapy services: |
|
|
|
|
|
|
|
|
|
|
|
|
|
|
|
|
|
Total therapy services |
|
|
1,099,130 |
|
19.6 |
% |
|
990,081 |
|
20.8 |
% |
|
109,049 |
|
11.0 |
% |
|
Elimination intersegment rehabilitation therapy services |
|
|
(429,828) |
|
(7.6) |
% |
|
(385,721) |
|
(8.1) |
% |
|
(44,107) |
|
11.4 |
% |
|
Third party rehabilitation therapy services |
|
|
669,302 |
|
11.9 |
% |
|
604,360 |
|
12.7 |
% |
|
64,942 |
|
10.7 |
% |
|
|
|
|
|
|
|
|
|
|
|
|
|
|
|
|
|
|
|
Other services: |
|
|
|
|
|
|
|
|
|
|
|
|
|
|
|
|
|
Total other services |
|
|
240,350 |
|
4.3 |
% |
|
154,011 |
|
3.2 |
% |
|
86,339 |
|
56.1 |
% |
|
Elimination intersegment other services |
|
|
(39,108) |
|
(0.7) |
% |
|
(30,104) |
|
(0.6) |
% |
|
(9,004) |
|
29.9 |
% |
|
Third party other services |
|
|
201,242 |
|
3.6 |
% |
|
123,907 |
|
2.6 |
% |
|
77,335 |
|
62.4 |
% |
|
|
|
|
|
|
|
|
|
|
|
|
|
|
|
|
|
|
|
Net revenue |
|
$ |
5,619,224 |
|
100.0 |
% |
$ |
4,768,080 |
|
100.0 |
% |
$ |
851,144 |
|
17.9 |
% |
63
|
|
|
Year ended December 31, |
|
|
|
|
|
|
||||||||
|
|
|
2015 |
|
2014 |
|
Increase / (Decrease) |
|
|||||||||
|
|
|
|
|
|
Margin |
|
|
|
|
Margin |
|
|
|
|
|
|
|
|
|
Dollars |
|
Percentage |
|
Dollars |
|
Percentage |
|
Dollars |
|
Percentage |
|
|||
|
|
|
(in thousands, except percentages) |
||||||||||||||
|
EBITDAR: |
|
|
|
|
|
|
|
|
|
|
|
|
|
|
|
|
|
Inpatient services |
|
$ |
740,616 |
|
15.6 |
% |
$ |
585,807 |
|
14.5 |
% |
$ |
154,809 |
|
26.4 |
% |
|
Rehabilitation therapy services |
|
|
109,090 |
|
9.9 |
% |
|
94,405 |
|
9.5 |
% |
|
14,685 |
|
15.6 |
% |
|
Other services |
|
|
21,714 |
|
9.0 |
% |
|
(465) |
|
(0.3) |
% |
|
22,179 |
|
(4,769.7) |
% |
|
Corporate and eliminations |
|
|
(173,593) |
|
— |
% |
|
(147,210) |
|
— |
% |
|
(26,383) |
|
17.9 |
% |
|
|
|
|
|
|
|
|
|
|
|
|
|
|
|
|
|
|
|
EBITDAR |
|
$ |
697,827 |
|
12.4 |
% |
$ |
532,537 |
|
11.2 |
% |
$ |
165,290 |
|
31.0 |
% |
|
|
|
Year ended December 31, 2015 |
|
||||||||||||||||
|
|
|
|
|
|
Rehabilitation |
|
|
|
|
|
|
|
|
|
|
|
|
|
|
|
|
|
Inpatient |
|
Therapy |
|
|
|
|
|
|
|
|
|
|
|
|
|
||
|
|
|
Services |
|
Services |
|
Other Services |
|
Corporate |
|
Eliminations |
|
Consolidated |
|
||||||
|
|
|
(In thousands) |
|
||||||||||||||||
|
Net revenues |
|
$ |
4,750,480 |
|
$ |
1,099,130 |
|
$ |
238,585 |
|
$ |
1,765 |
|
$ |
(470,736) |
|
$ |
5,619,224 |
|
|
Salaries, wages and benefits |
|
|
2,248,197 |
|
|
898,226 |
|
|
143,397 |
|
|
— |
|
|
— |
|
|
3,289,820 |
|
|
Other operating expenses |
|
|
1,684,487 |
|
|
74,210 |
|
|
70,770 |
|
|
— |
|
|
(470,484) |
|
|
1,358,983 |
|
|
General and administrative costs |
|
|
— |
|
|
— |
|
|
— |
|
|
175,889 |
|
|
— |
|
|
175,889 |
|
|
Provision for losses on accounts receivable |
|
|
80,998 |
|
|
17,604 |
|
|
2,704 |
|
|
(785) |
|
|
— |
|
|
100,521 |
|
|
Lease expense |
|
|
146,329 |
|
|
106 |
|
|
2,316 |
|
|
1,779 |
|
|
(254) |
|
|
150,276 |
|
|
Depreciation and amortization expense |
|
|
206,026 |
|
|
12,931 |
|
|
1,227 |
|
|
17,433 |
|
|
— |
|
|
237,617 |
|
|
Interest expense |
|
|
423,393 |
|
|
31 |
|
|
40 |
|
|
84,635 |
|
|
(290) |
|
|
507,809 |
|
|
(Gain) loss on extinguishment of debt |
|
|
(3,104) |
|
|
— |
|
|
— |
|
|
3,234 |
|
|
— |
|
|
130 |
|
|
Investment income |
|
|
(1,568) |
|
|
— |
|
|
— |
|
|
(399) |
|
|
290 |
|
|
(1,677) |
|
|
Other loss (income) |
|
|
1,165 |
|
|
— |
|
|
— |
|
|
(2,565) |
|
|
— |
|
|
(1,400) |
|
|
Transaction costs |
|
|
540 |
|
|
— |
|
|
90 |
|
|
95,744 |
|
|
— |
|
|
96,374 |
|
|
Long-lived asset impairment charges |
|
|
28,546 |
|
|
— |
|
|
— |
|
|
— |
|
|
— |
|
|
28,546 |
|
|
Skilled Healthcare loss contingency expense |
|
|
— |
|
|
— |
|
|
— |
|
|
31,500 |
|
|
— |
|
|
31,500 |
|
|
Equity in net (income) loss of unconsolidated affiliates |
|
|
(2,250) |
|
|
— |
|
|
— |
|
|
(1,681) |
|
|
1,792 |
|
|
(2,139) |
|
|
(Loss) income before income tax expense |
|
|
(62,279) |
|
|
96,022 |
|
|
18,041 |
|
|
(403,019) |
|
|
(1,790) |
|
|
(353,025) |
|
|
Income tax expense |
|
|
— |
|
|
— |
|
|
— |
|
|
172,524 |
|
|
— |
|
|
172,524 |
|
|
(Loss) income from continuing operations |
|
$ |
(62,279) |
|
$ |
96,022 |
|
$ |
18,041 |
|
$ |
(575,543) |
|
$ |
(1,790) |
|
$ |
(525,549) |
|
64
|
|
|
Year ended December 31, 2014 |
|
||||||||||||||||
|
|
|
|
|
|
Rehabilitation |
|
|
|
|
|
|
|
|
|
|
|
|
|
|
|
|
|
Inpatient |
|
Therapy |
|
|
|
|
|
|
|
|
|
|
|
|
|
||
|
|
|
Services |
|
Services |
|
Other Services |
|
Corporate |
|
Eliminations |
|
Consolidated |
|
||||||
|
|
|
(In thousands) |
|
||||||||||||||||
|
Net revenues |
|
$ |
4,041,902 |
|
$ |
990,081 |
|
$ |
153,397 |
|
$ |
614 |
|
$ |
(417,914) |
|
$ |
4,768,080 |
|
|
Salaries, wages and benefits |
|
|
1,987,550 |
|
|
817,144 |
|
|
99,400 |
|
|
— |
|
|
— |
|
|
2,904,094 |
|
|
Other operating expenses |
|
|
1,417,738 |
|
|
62,032 |
|
|
47,844 |
|
|
— |
|
|
(417,915) |
|
|
1,109,699 |
|
|
General and administrative costs |
|
|
— |
|
|
— |
|
|
— |
|
|
147,063 |
|
|
— |
|
|
147,063 |
|
|
Provision for losses on accounts receivable |
|
|
54,582 |
|
|
16,500 |
|
|
6,618 |
|
|
(30) |
|
|
— |
|
|
77,670 |
|
|
Lease expense |
|
|
130,005 |
|
|
176 |
|
|
821 |
|
|
896 |
|
|
— |
|
|
131,898 |
|
|
Depreciation and amortization expense |
|
|
165,105 |
|
|
11,055 |
|
|
917 |
|
|
16,598 |
|
|
— |
|
|
193,675 |
|
|
Interest expense |
|
|
393,521 |
|
|
4 |
|
|
19 |
|
|
49,678 |
|
|
(498) |
|
|
442,724 |
|
|
Loss on extinguishment of debt |
|
|
— |
|
|
— |
|
|
— |
|
|
1,133 |
|
|
— |
|
|
1,133 |
|
|
Investment income |
|
|
(2,491) |
|
|
— |
|
|
— |
|
|
(1,406) |
|
|
498 |
|
|
(3,399) |
|
|
Other income |
|
|
(47) |
|
|
— |
|
|
(91) |
|
|
— |
|
|
— |
|
|
(138) |
|
|
Transaction costs |
|
|
— |
|
|
— |
|
|
— |
|
|
13,353 |
|
|
— |
|
|
13,353 |
|
|
Long-lived asset impairment charges |
|
|
31,399 |
|
|
— |
|
|
— |
|
|
— |
|
|
— |
|
|
31,399 |
|
|
Equity in net (income) loss of unconsolidated affiliates |
|
|
(1,284) |
|
|
— |
|
|
— |
|
|
— |
|
|
1,700 |
|
|
416 |
|
|
(Loss) income before income tax benefit |
|
|
(134,176) |
|
|
83,170 |
|
|
(2,131) |
|
|
(226,671) |
|
|
(1,699) |
|
|
(281,507) |
|
|
Income tax benefit |
|
|
— |
|
|
— |
|
|
— |
|
|
(44,022) |
|
|
— |
|
|
(44,022) |
|
|
(Loss) income from continuing operations |
|
$ |
(134,176) |
|
$ |
83,170 |
|
$ |
(2,131) |
|
$ |
(182,649) |
|
$ |
(1,699) |
|
$ |
(237,485) |
|
Prior to February 1, 2015, our results of operations exclude the revenue and expenses of Skilled’s businesses. For comparability, those revenue and expense variances attributed solely to the Combination of Skilled’s businesses with ours, commencing on February 1, 2015, will be identified in the discussion of the results of operations. References to “legacy” businesses identify those businesses operating as either Skilled or Genesis, respectively, prior to the Combination.
Prior to December 1, 2015, our results of operations exclude the revenue and expenses of the acquired Revera businesses. For comparability, those revenue and expense variances attributed solely to the Acquisition from Revera, commencing on December 1, 2015, will be identified in the discussion of the results of operations.
Net Revenues
Net revenues for the year ended December 31, 2015 as compared with the year ended December 31, 2014 increased by $851.1 million. Of that increase, Skilled’s businesses contributed $832.4 million. The remaining increase of $18.7 million or 0.4% is primarily attributed to the Acquisition from Revera.
Inpatient Services – Revenue increased $708.9 million, or 17.5%, in the year ended December 31, 2015 as compared with the same period in 2014. Of this growth, $650.9 million is due to the Combination, $18.4 million is due to the Acquisition from Revera and $91.8 million is due to the acquisition or development of 14 facilities, offset by $41.0 million of revenue attributed to the divestiture of six underperforming facilities. The remaining decrease of $11.2 million, or 0.3%, is due to a decline in the occupancy of legacy Genesis inpatient facilities, partially offset by increased payment rates.
Rehabilitation Therapy Services – Revenue increased $64.9 million, or 10.7% comparing the year ended December 31, 2015 with the same period in 2014. The Combination contributed $118.0 million of revenue growth, while the
65
legacy Genesis rehabilitation business revenue decreased $53.1 million, driven by lost therapy contract revenue exceeding new business contract revenue.
Other Services – Other services revenue increased $77.3 million, or 62.4% in the year ended December 31, 2015 as compared with the same period in 2014. Of this increase, the Combination contributed $63.6 million through the hospice and home health businesses. The remaining increase of $13.7 million or 11.1% was principally attributed to new business growth in our staffing services business line.
EBITDAR
EBITDAR for the year ended December 31, 2015 increased by $165.3 million, or 31.0% when compared with the same period in 2014. Of that increase, Skilled’s businesses contributed an estimated $108.3 million after an estimated overhead allocation of 2.5% of its revenues for the eleven month period following the Combination. The remaining increase of approximately $57.0 million or 10.7% is described further in our discussion below of segment results and corporate overhead. The Acquisition from Revera did not contribute materially to EBITDAR in the first month following the acquisition.
Inpatient Services – EBITDAR increased in the year ended December 31, 2015 as compared with the same period in 2014, by $154.8 million, or 26.4%. Of the increase, $113.0 million is attributed to the Combination, $15.8 million is due to the acquisition or development of 14 facilities, partially offset by $0.5 million for the losses attributed to the divestiture or closure of six underperforming facilities. Additionally, the year ended December 31, 2015, compared with the same period in 2014, include an additional $6.4 million of GLPL claims development expense, excluding the incremental GLPL expense associated with the Combination. The increased GLPL expense principally relates to actuarially developed claims related to prior year policy periods. The remaining EBITDAR increase of $32.9 million, or 5.6%, is principally attributable to the realization of cost reductions we began implementing in the quarter ended December 31, 2014, offset by a decline in the occupancy of legacy Genesis inpatient facilities.
Rehabilitation Therapy Services – EBITDAR of the rehabilitation therapy segment increased by $14.7 million or 15.6% comparing the year ended December 31, 2015 with the same period in 2014. The Combination contributed $6.4 million, while the EBITDAR of the legacy Genesis rehabilitation therapy business EBITDAR increased another $8.3 million by the earnings of net new therapy contracts and a 1% improvement in Therapist Efficiency from 68% to 69%.
Other Services – EBITDAR increased $22.2 million in the year ended December 31, 2015 as compared with the same period in 2014. Of that increase, the Combination contributed $9.7 million, principally through the addition of hospice and home health businesses. The remaining $12.5 million of EBITDAR growth is principally attributed to the staffing services businesses and the physician services business.
Corporate and Eliminations — Corporate overhead costs increased $26.4 million, or 17.9%, in the year ended December 31, 2015 as compared with the same period in 2014. This increase was largely due to the added overhead costs of Skilled.
Other Expense
The following discussion applies to the consolidated expense categories between consolidated EBITDAR and (loss) income from continuing operations of all reportable segments, other services, corporate and eliminations in our consolidating statement of operations for the year ended December 31, 2015 as compared with the same period in 2014.
Lease expense — Lease expense represents the cash rents and non-cash adjustments required to account for operating leases. We have operating leases in each reportable segment, other services and corporate overhead, but the inpatient services business incurs the greatest proportion of this expense for those skilled nursing and assisted living facilities leases accounted for as operating leases. Lease expense increased $18.4 million in the year ended December 31, 2015 as compared with the same period in the prior year. Of that increase, $20.9 million resulted from the Combination and $2.5 million resulted from two new operating leases, with the remaining decrease of $5.0 million principally due to our efforts to divest underperforming leased facilities.
66
Depreciation and amortization — Each of our reportable segments, other services and corporate overhead have depreciating property, plant and equipment, including depreciation on leased properties accounted for as capital leases or as a financing obligation. Our rehabilitation therapy services and other services have identifiable intangible assets which amortize over the estimated life of those identifiable assets. The majority of the $43.9 million increase in depreciation and amortization in the year ended December 31, 2015 compared with the same period in the prior year is attributed to the Combination and other acquisition and construction activities in 2015.
Interest expense — Interest expense includes the cash interest and non-cash adjustments required to account for our revolving credit facilities, term loan facility, real estate bridge loans and mortgage instruments, as well as the expense associated with leases accounted for as capital leases or financing obligations. Interest expense increased $65.1 million in the year ended December 31, 2015 as compared with the same period in the prior year. Of this increase, $34.9 million is attributed to the debt assumed or issued in the Combination. The remaining $30.2 million increase is primarily attributable to growth in interest pertaining to existing lease obligations and obligations incurred in connection with newly acquired or constructed facilities.
Skilled Healthcare loss contingency expense — For the year ended December 31, 2015, we accrued $31.5 million for contingent liabilities. We are engaged in discussions with representatives of the Department of Justice in an effort to reach mutually acceptable resolution of two investigations involving therapy matters and staffing matters and a hospice litigation related to Skilled’s business prior to the Combination. Discussions have progressed to a point where we believe it is appropriate to recognize an estimated loss contingency reserve. Recognition of the loss contingency reserve is not an admission of liability or fault by us or any of our subsidiaries. Because these discussions are ongoing, there can be no certainty about the timing or likelihood of a definitive resolution. As these discussions proceed and additional information becomes available, the amount of the estimated loss contingency reserve may need to be increased or decreased to reflect this new information.
Transaction costs — In the normal course of business, we evaluate strategic acquisition, disposition and business development opportunities. The costs to pursue these opportunities, when incurred, vary from period to period depending on the nature of the transaction pursued and if those transactions are ever completed. Transaction costs incurred for the years ended December 31, 2015 and 2014 were $96.4 million and $13.4 million, respectively, and of the amount in the 2015 period, the Combination contributed $89.2 million and the Acquisition from Revera contributed $4.0 million.
Income tax expense (benefit) — For the year ended December 31, 2015, we recorded an income tax expense of $172.5 million from continuing operations representing an effective tax rate of (48.9)% compared to an income tax benefit of $44.0 million from continuing operations, representing an effective tax rate of 15.6% for the same period in 2014. The change in the effective income tax rate from 2014 to 2015 was largely due to the establishment of a $221.9 million valuation allowance against our deferred tax assets.
67
Year Ended December 31, 2014 Compared to Year Ended December 31, 2013
A summary of our results of operations for the year ended December 31, 2014 as compared with the same period in 2013 follows:
|
|
|
Year ended December 31, |
|
|
|
|
|
|||||||||
|
|
|
2014 |
|
2013 |
|
Increase / (Decrease) |
|
|||||||||
|
|
|
Revenue |
|
Revenue |
|
Revenue |
|
Revenue |
|
|
|
|
|
|
||
|
|
|
Dollars |
|
Percentage |
|
Dollars |
|
Percentage |
|
Dollars |
|
Percentage |
|
|||
|
|
|
(in thousands, except percentages) |
|
|||||||||||||
|
Revenues: |
|
|
|
|
|
|
|
|
|
|
|
|
|
|
|
|
|
Inpatient services: |
|
|
|
|
|
|
|
|
|
|
|
|
|
|
|
|
|
Skilled nursing facilities |
|
$ |
3,924,571 |
|
82.3 |
% |
$ |
3,847,857 |
|
81.7 |
% |
$ |
76,714 |
|
2.0 |
% |
|
Assisted/Senior living facilities |
|
|
107,034 |
|
2.2 |
% |
|
113,960 |
|
2.4 |
% |
|
(6,926) |
|
(6.1) |
% |
|
Administration of third party facilities |
|
|
10,297 |
|
0.2 |
% |
|
11,006 |
|
0.2 |
% |
|
(709) |
|
(6.4) |
% |
|
Elimination of administrative services |
|
|
(2,089) |
|
— |
% |
|
(2,146) |
|
— |
% |
|
57 |
|
(2.7) |
% |
|
Inpatient services, net |
|
|
4,039,813 |
|
84.7 |
% |
|
3,970,677 |
|
84.3 |
% |
|
69,136 |
|
1.7 |
% |
|
|
|
|
|
|
|
|
|
|
|
|
|
|
|
|
|
|
|
Rehabilitation therapy services: |
|
|
|
|
|
|
|
|
|
|
|
|
|
|
|
|
|
Total therapy services |
|
|
990,081 |
|
20.8 |
% |
|
993,459 |
|
21.1 |
% |
|
(3,378) |
|
(0.3) |
% |
|
Elimination intersegment rehabilitation therapy services |
|
|
(385,721) |
|
(8.1) |
% |
|
(375,175) |
|
(8.0) |
% |
|
(10,546) |
|
2.8 |
% |
|
Third party rehabilitation therapy services |
|
|
604,360 |
|
12.7 |
% |
|
618,284 |
|
13.1 |
% |
|
(13,924) |
|
(2.3) |
% |
|
|
|
|
|
|
|
|
|
|
|
|
|
|
|
|
|
|
|
Other services: |
|
|
|
|
|
|
|
|
|
|
|
|
|
|
|
|
|
Total other services |
|
|
154,011 |
|
3.2 |
% |
|
141,712 |
|
3.0 |
% |
|
12,299 |
|
8.7 |
% |
|
Elimination intersegment other services |
|
|
(30,104) |
|
(0.6) |
% |
|
(20,332) |
|
(0.4) |
% |
|
(9,772) |
|
48.1 |
% |
|
Third party other services |
|
|
123,907 |
|
2.6 |
% |
|
121,380 |
|
2.6 |
% |
|
2,527 |
|
2.1 |
% |
|
|
|
|
|
|
|
|
|
|
|
|
|
|
|
|
|
|
|
Net revenue |
|
$ |
4,768,080 |
|
100.0 |
% |
$ |
4,710,341 |
|
100.0 |
% |
$ |
57,739 |
|
1.2 |
% |
|
|
|
Year ended December 31, |
|
|
|
|
|
|
||||||||
|
|
|
2014 |
|
2013 |
|
Increase / (Decrease) |
|
|||||||||
|
|
|
|
|
|
Margin |
|
|
|
|
Margin |
|
|
|
|
|
|
|
|
|
Dollars |
|
Percentage |
|
Dollars |
|
Percentage |
|
Dollars |
|
Percentage |
|
|||
|
|
|
(in thousands, except percentages) |
||||||||||||||
|
EBITDAR: |
|
|
|
|
|
|
|
|
|
|
|
|
|
|
|
|
|
Inpatient services |
|
$ |
585,807 |
|
14.5 |
% |
$ |
656,227 |
|
16.5 |
% |
$ |
(70,420) |
|
(10.7) |
% |
|
Rehabilitation therapy services |
|
|
94,405 |
|
9.5 |
% |
|
77,790 |
|
7.8 |
% |
|
16,615 |
|
21.4 |
% |
|
Other services |
|
|
(465) |
|
(0.3) |
% |
|
5,114 |
|
3.6 |
% |
|
(5,579) |
|
(109.1) |
% |
|
Corporate and eliminations |
|
|
(147,210) |
|
— |
% |
|
(154,594) |
|
— |
% |
|
7,384 |
|
(4.8) |
% |
|
|
|
|
|
|
|
|
|
|
|
|
|
|
|
|
|
|
|
EBITDAR |
|
$ |
532,537 |
|
11.2 |
% |
$ |
584,537 |
|
12.4 |
% |
$ |
(52,000) |
|
(8.9) |
% |
68
A summary of our condensed consolidating statement of operations follows:
|
|
|
Year ended December 31, 2014 |
|
||||||||||||||||
|
|
|
|
|
|
Rehabilitation |
|
|
|
|
|
|
|
|
|
|
|
|
|
|
|
|
|
Inpatient |
|
Therapy |
|
|
|
|
|
|
|
|
|
|
|
|
|
||
|
|
|
Services |
|
Services |
|
Other Services |
|
Corporate |
|
Eliminations |
|
Consolidated |
|
||||||
|
|
|
(In thousands) |
|
||||||||||||||||
|
Net revenues |
|
$ |
4,041,902 |
|
$ |
990,081 |
|
$ |
153,397 |
|
$ |
614 |
|
$ |
(417,914) |
|
$ |
4,768,080 |
|
|
Salaries, wages and benefits |
|
|
1,987,550 |
|
|
817,144 |
|
|
99,400 |
|
|
— |
|
|
— |
|
|
2,904,094 |
|
|
Other operating expenses |
|
|
1,417,738 |
|
|
62,032 |
|
|
47,844 |
|
|
— |
|
|
(417,915) |
|
|
1,109,699 |
|
|
General and administrative costs |
|
|
— |
|
|
— |
|
|
— |
|
|
147,063 |
|
|
— |
|
|
147,063 |
|
|
Provision for losses on accounts receivable |
|
|
54,582 |
|
|
16,500 |
|
|
6,618 |
|
|
(30) |
|
|
— |
|
|
77,670 |
|
|
Lease expense |
|
|
130,005 |
|
|
176 |
|
|
821 |
|
|
896 |
|
|
— |
|
|
131,898 |
|
|
Depreciation and amortization expense |
|
|
165,105 |
|
|
11,055 |
|
|
917 |
|
|
16,598 |
|
|
— |
|
|
193,675 |
|
|
Interest expense |
|
|
393,521 |
|
|
4 |
|
|
19 |
|
|
49,678 |
|
|
(498) |
|
|
442,724 |
|
|
Loss on extinguishment of debt |
|
|
— |
|
|
— |
|
|
— |
|
|
1,133 |
|
|
— |
|
|
1,133 |
|
|
Investment income |
|
|
(2,491) |
|
|
— |
|
|
— |
|
|
(1,406) |
|
|
498 |
|
|
(3,399) |
|
|
Other income |
|
|
(47) |
|
|
— |
|
|
(91) |
|
|
— |
|
|
— |
|
|
(138) |
|
|
Transaction costs |
|
|
— |
|
|
— |
|
|
— |
|
|
13,353 |
|
|
— |
|
|
13,353 |
|
|
Long-lived asset impairment charges |
|
|
31,399 |
|
|
— |
|
|
— |
|
|
— |
|
|
— |
|
|
31,399 |
|
|
Equity in net (income) loss of unconsolidated affiliates |
|
|
(1,284) |
|
|
— |
|
|
— |
|
|
— |
|
|
1,700 |
|
|
416 |
|
|
(Loss) income before income tax benefit |
|
|
(134,176) |
|
|
83,170 |
|
|
(2,131) |
|
|
(226,671) |
|
|
(1,699) |
|
|
(281,507) |
|
|
Income tax benefit |
|
|
— |
|
|
— |
|
|
— |
|
|
(44,022) |
|
|
— |
|
|
(44,022) |
|
|
(Loss) income from continuing operations |
|
$ |
(134,176) |
|
$ |
83,170 |
|
$ |
(2,131) |
|
$ |
(182,649) |
|
$ |
(1,699) |
|
$ |
(237,485) |
|
69
|
|
|
Year ended December 31, 2013 |
|
||||||||||||||||
|
|
|
|
|
|
Rehabilitation |
|
|
|
|
|
|
|
|
|
|
|
|
|
|
|
|
|
Inpatient |
|
Therapy |
|
|
|
|
|
|
|
|
|
|
|
|
|
||
|
|
|
Services |
|
Services |
|
Other Services |
|
Corporate |
|
Eliminations |
|
Consolidated |
|
||||||
|
|
|
(In thousands) |
|
||||||||||||||||
|
Net revenues |
|
$ |
3,972,823 |
|
$ |
993,459 |
|
$ |
141,712 |
|
$ |
— |
|
$ |
(397,653) |
|
$ |
4,710,341 |
|
|
Salaries, wages and benefits |
|
|
1,977,112 |
|
|
828,406 |
|
|
93,342 |
|
|
— |
|
|
— |
|
|
2,898,860 |
|
|
Other operating expenses |
|
|
1,291,695 |
|
|
74,477 |
|
|
39,390 |
|
|
— |
|
|
(397,653) |
|
|
1,007,909 |
|
|
General and administrative costs |
|
|
— |
|
|
— |
|
|
— |
|
|
152,555 |
|
|
— |
|
|
152,555 |
|
|
Provision for losses on accounts receivable |
|
|
53,287 |
|
|
12,786 |
|
|
3,866 |
|
|
— |
|
|
— |
|
|
69,939 |
|
|
Lease expense |
|
|
129,296 |
|
|
198 |
|
|
843 |
|
|
894 |
|
|
— |
|
|
131,231 |
|
|
Depreciation and amortization expense |
|
|
160,954 |
|
|
10,607 |
|
|
1,027 |
|
|
16,138 |
|
|
— |
|
|
188,726 |
|
|
Interest expense |
|
|
378,461 |
|
|
10 |
|
|
525 |
|
|
48,515 |
|
|
(536) |
|
|
426,975 |
|
|
Loss on extinguishment of debt |
|
|
63 |
|
|
— |
|
|
— |
|
|
— |
|
|
— |
|
|
63 |
|
|
Investment income |
|
|
(3,431) |
|
|
— |
|
|
— |
|
|
(1,255) |
|
|
536 |
|
|
(4,150) |
|
|
Other loss |
|
|
— |
|
|
346 |
|
|
— |
|
|
104 |
|
|
— |
|
|
450 |
|
|
Transaction costs |
|
|
— |
|
|
— |
|
|
— |
|
|
5,878 |
|
|
— |
|
|
5,878 |
|
|
Long-lived asset impairment charges |
|
|
9,999 |
|
|
— |
|
|
— |
|
|
— |
|
|
— |
|
|
9,999 |
|
|
Equity in net (income) loss of unconsolidated affiliates |
|
|
(2,067) |
|
|
— |
|
|
— |
|
|
1,066 |
|
|
1,692 |
|
|
691 |
|
|
(Loss) income before income tax benefit |
|
|
(22,546) |
|
|
66,629 |
|
|
2,719 |
|
|
(223,895) |
|
|
(1,692) |
|
|
(178,785) |
|
|
Income tax benefit |
|
|
— |
|
|
— |
|
|
— |
|
|
(9,179) |
|
|
— |
|
|
(9,179) |
|
|
(Loss) income from continuing operations |
|
$ |
(22,546) |
|
$ |
66,629 |
|
$ |
2,719 |
|
$ |
(214,716) |
|
$ |
(1,692) |
|
$ |
(169,606) |
|
Net Revenues
Net revenues for the year ended December 31, 2014 as compared with the year ended December 31, 2013 increased by $57.7 million, or 1.2%.
Inpatient Services – Revenue increased $69.1 million, or 1.7%, in the year ended December 31, 2014 as compared with the same period in 2013. Of this growth, $45.8 million is due to 13 newly acquired or developed centers and partially offset by the loss of $3.1 million of revenue of two divested centers. The remaining increase of $26.4 million, or 0.7% is due to increased payment rates and partially offset by a decline in Skilled Mix.
Rehabilitation Therapy Services – Revenue declined $13.9 million, or 2.3% for the year ended December 31, 2014 as compared with the same period in 2013, with rate increases to existing customers more than offset by the selective termination of underperforming contracts and Medicare reimbursement reductions which began on April 1, 2013 under the Budget Control Act of 2011 (as amended by the Taxpayer Relief Act). Total external sites served declined period-over-period by 50, or 3.6%.
Other Services – Other services revenue increased $2.5 million, or 2.1% in the year ended December 31, 2014 as compared with the same period in 2013. This increase was principally centered in our physician services business.
EBITDAR
Inpatient Services – EBITDAR declined in the year ended December 31, 2014 as compared with the same period in 2013, by $70.4 million, or 10.7%. Of this decline, approximately $55 million resulted from changes in estimates pertaining to our self-insurance programs for general and professional liability exposures and workman’s compensation, resulting in additional expense in the 2014 period. Losses of the two divested underperforming centers, prior to their
70
divestiture late in 2014 contributed $1.6 million of the EBTIDAR decline year-over-year. The 13 newly acquired or developed centers contributed $2.6 million of increased EBITDAR as compared with the 2013 year. The remaining decline of approximately $16.4 million, or 2.5%, is principally attributable to Medicare reimbursement reductions which began on April 1, 2013 under the Budget Control Act of 2011 (as amended by the Taxpayer Relief Act), and increased operating costs associated with the Sun Merger.
Rehabilitation Therapy Services – EBITDAR increased $16.6 million, or 21.4%. This increase is attributed to a number of initiatives designed to improve the profitability of this segment, including: a reengineered approach to managing therapist labor costs, a reduction in the use of expensive agent therapists, a reduction in the number of employees and the exit of underperforming contracts. Therapist Efficiency improved period over period by 1%, from 67% to 68%.
Other Services – EBITDAR increased $5.6 million year-over-year comparing the year ended December 31, 2014 with the same period in 2013.
Corporate and Eliminations – Corporate overhead costs declined $7.4 million, or 4.8%, in the year ended December 31, 2014 as compared with the same period in 2013. This decline was largely due to incremental cost synergies realized in connection with the Sun Merger.
Other Expense
The following discussion applies to the consolidated expense categories between consolidated EBITDAR and (loss) income from continuing operations of all reportable segments, other services, corporate and eliminations in our consolidating statement of operations for the year ended December 31, 2014 as compared with the same period in 2013.
Lease expense – Lease expense represents the cash rents and non-cash adjustments required to account for operating leases. Genesis has operating leases in each of its reportable segments, other services and corporate overhead, but the inpatient services business incurs the greatest proportion of this expense for those skilled nursing and assisted living facilities leases accounted for as operating leases. Lease expense was flat in the year ended December 31, 2014 as compared with the same period in the prior year.
Depreciation and amortization – Each of Genesis’ reportable segments, other services and corporate overhead has depreciating property, plant and equipment, including depreciation on leased properties accounted for as capital leases or as a financing obligation. Genesis’ rehabilitation therapy services and other services have identifiable intangible assets which amortize over the estimated life of those identifiable assets. The $4.9 million increase in depreciation and amortization is primarily attributable to Genesis’ ongoing capital expenditure program and newly acquired or constructed facilities.
Interest expense – Interest expense includes the cash interest and non-cash adjustments required to account for Genesis’ revolving credit facilities, term loan facilities and mortgage instruments, as well as the expense associated with leases accounted for as capital leases or financing obligations. The $15.7 million increase in interest expense in the year ended December 31, 2014 as compared to the prior year is primarily attributable to growth in interest pertaining to existing lease obligations and obligations incurred in connection with newly acquired or constructed facilities.
Transaction costs – In the normal course of business, Genesis evaluates strategic acquisition, disposition and business development opportunities. The costs to pursue these opportunities, when incurred, vary from period to period depending on the nature of the transaction pursued and if those transactions are ever completed. Transaction costs incurred for the years ended December 31, 2014 and 2013 were $13.4 million and $5.9 million, respectively.
Income tax benefit – For the year ended December 31, 2014, Genesis recorded income tax benefit of $44.0 million on pretax loss of $281.5 million. For the same period in 2013, Genesis recorded income tax benefit of $9.2 million on pretax loss of $178.8 million. For the years ended December 31, 2014 and 2013, the overall effective tax rate was
71
different than the statutory rate of 35% primarily due to the allocation to certain members of their respective share of taxable income or loss not subject to corporate income tax.
Liquidity and Capital Resources
Our primary sources of liquidity are cash on hand, cash flows from operations, and borrowings under our revolving credit facility.
The objectives of our capital planning strategy are to ensure we maintain adequate liquidity and flexibility. Pursuing and achieving those objectives allows us to support the execution of our operating and strategic plans and weather temporary disruptions in the capital markets and general business environment. Maintaining adequate liquidity is a function of our unrestricted cash and cash equivalents and our available borrowing capacity.
At December 31, 2015, we had cash and cash equivalents of $61.5 million and available borrowings under our revolving credit facilities of $117.0 million after taking into account $66.9 million of letters of credit drawn against our revolving credit facilities. During the year ended December 31, 2015, we maintained liquidity sufficient to meet our working capital, capital expenditure and development activities and we believe we will continue to meet those needs for at least the subsequent twelve month period.
As of December 31, 2015, we have debt obligations that, as a result of scheduled maturity dates or maturity date acceleration features, have $710.5 million of aggregate maturities in 2017. If we are unable to extend (or refinance, as applicable) any of our maturing credit facilities prior to their scheduled maturity or accelerated maturity dates, our liquidity and financial condition could be adversely impacted. In addition, even if we are able to extend or refinance our maturing debt credit facilities, the terms of the new financing may be less favorable to us than the terms of the existing financing.
Our available cash is held in accounts at third-party financial institutions. To date, we have experienced no loss or lack of access to our invested cash or cash equivalents; however, we can provide no assurances that access to our invested cash or cash equivalents will not be impacted by adverse conditions in the financial markets.
The following table presents selected data from our consolidated statements of cash flows (in thousands):
|
|
|
Year ended December 31, |
|
|||||||
|
|
|
2015 |
|
2014 |
|
2013 |
|
|||
|
Net cash provided by operating activities |
|
$ |
8,618 |
|
$ |
107,652 |
|
$ |
82,149 |
|
|
Net cash used in investing activities |
|
|
(253,484) |
|
|
(95,675) |
|
|
(91,702) |
|
|
Net cash provided by financing activities |
|
|
218,861 |
|
|
14,158 |
|
|
20,748 |
|
|
Net (decrease) increase in cash and cash equivalents |
|
|
(26,005) |
|
|
26,135 |
|
|
11,195 |
|
|
Beginning of period |
|
|
87,548 |
|
|
61,413 |
|
|
50,218 |
|
|
End of period |
|
$ |
61,543 |
|
$ |
87,548 |
|
$ |
61,413 |
|
Net cash used in operating activities in the year ended December 31, 2015 of $8.6 million was unfavorably impacted by funded transaction costs of approximately $71.0 million. Adjusted for transaction costs, net cash provided by operating activities in the year ended December 31, 2015 would have been approximately $79.6 million. Net cash provided by operating activities in the year ended December 31, 2014 of $107.7 million was unfavorably impacted by funded transaction costs of approximately $13.4 million. Adjusted for funded transaction costs, net cash provided by operating activities in the year ended December 31, 2014 would have been $121.1 million. The $41.5 million reduction in cash provided by operating activities before funded transaction costs in the 2015 period as compared to the 2014 period is attributed to growth of accounts receivable balances of the Skilled businesses through the year ended December 31, 2015, and the impact of unfavorable timing of labor related expense payments.
Net cash used in investing activities in the year ended December 31, 2015 was $253.5 million, compared to a use of cash of $95.7 million in the year ended December 31, 2014. The year ended December 31, 2015, as compared with the same period in 2014, included the receipt of $26.4 million of asset and investment in joint venture sale proceeds offset by
72
$167.3 million of outlays for the purchases of skilled nursing facilities and rehabilitation therapy clinics, including the Revera acquisition. The remaining incremental use of cash from investing activities in the year ended December 31, 2015 as compared with the same period in 2014 is principally due to incremental routine capital expenditures of $14.7 million.
Net cash provided by financing activities was $218.9 million in the year ended December 31, 2015 compared to a use of $14.2 million in the year ended December 31, 2014. The net increase in cash provided by financing activities of $204.7 million is principally attributed to $134.1 million of incremental borrowing under the Revera Real Estate Bridge Loan, $54.0 million of net incremental borrowings under the revolving credit facilities, net proceeds on the refinancing of Skilled’s real estate and prepayment of capital lease obligations of $17.2 million, and $10.7 million of reduced distributions to noncontrolling interests, offset with $11.3 million of incremental debt issuance costs funded in the 2015 period. The increase in debt issuance costs is attributed to the financing costs incurred in connection with the financing activities associated with the Combination.
Long-term debt at December 31, 2015 and 2014 consisted of the following (in thousands):
|
|
|
December 31, |
|
December 31, |
|
||
|
|
|
2015 |
|
2014 |
|
||
|
Revolving credit facility |
|
$ |
363,000 |
|
$ |
254,500 |
|
|
Term loan facility, net of original issue discount of $7,475 at December 31, 2015 and $11,375 at December 31, 2014 |
|
|
220,971 |
|
|
219,297 |
|
|
Real estate bridge loans |
|
|
494,100 |
|
|
— |
|
|
HUD insured loans |
|
|
107,645 |
|
|
— |
|
|
Mortgages and other secured debt (recourse) |
|
|
13,934 |
|
|
14,488 |
|
|
Mortgages and other secured debt (non-recourse) |
|
|
30,507 |
|
|
49,961 |
|
|
|
|
|
1,230,157 |
|
|
538,246 |
|
|
Less: Current installments of long-term debt |
|
|
(12,477) |
|
|
(12,518) |
|
|
Long-term debt |
|
$ |
1,217,680 |
|
$ |
525,728 |
|
Revolving Credit Facilities
In connection with the Combination, on February 2, 2015 we entered into new revolving credit facilities and terminated our former revolving credit facilities. The new revolving credit facilities (the Revolving Credit Facilities) consist of a senior secured, asset-based revolving credit facility of up to $550 million under three separate tranches: Tranche A-1, Tranche A-2 and FILO Tranche. Interest accrues at a per annum rate equal to either (x) a base rate (calculated as the highest of the (i) prime rate, (ii) the federal funds rate plus 3.00%, or (iii) LIBOR plus the excess of the applicable margin between LIBOR loans and base rate loans) plus an applicable margin or (y) LIBOR plus an applicable margin. The applicable margin is based on the level of commitments for all three tranches, and in regards to LIBOR loans (i) for Tranche A-1 ranges from 3.25% to 2.75%; (ii) for Tranche A-2 ranges from 3.00% to 2.50%; and (iii) for FILO Tranche is 5.00%. The Revolving Credit Facilities mature on February 2, 2020, provided that if the Term Loan Facility (defined below) or the Real Estate Bridge Loans (defined below) is not refinanced with longer term debt or their terms not extended prior to their current maturities of December 4, 2017 and August 27, 2017, respectively, the Revolving Credit Facilities will mature 90 days prior to such maturity date, as applicable. Borrowing levels under the Revolving Credit Facilities are limited to a borrowing base that is computed based upon the level of our eligible accounts receivable, as defined therein. In addition to paying interest on the outstanding principal borrowed under the Revolving Credit Facilities, we are required to pay a commitment fee to the lenders for any unutilized commitments. The commitment fee rate ranges from 0.375% per annum to 0.50% depending upon the level of unused commitment.
73
Borrowings and interest rates under the three tranches were as follows at December 31, 2015 (dollars in thousands):
|
|
|
|
|
|
Weighted |
|
|
|
|
|
|
|
Average |
|
|
Revolving credit facility |
|
Borrowings |
|
Interest |
|
|
|
FILO tranche |
|
$ |
25,000 |
|
5.51 |
% |
|
Tranche A-1 |
|
|
263,000 |
|
3.92 |
% |
|
Tranche A-2 |
|
|
75,000 |
|
3.36 |
% |
|
|
|
$ |
363,000 |
|
3.91 |
% |
Term Loan Facility
Prior to the Combination, FC-GEN and certain of its subsidiaries became party to a five-year term loan facility (the Term Loan Facility). The Term Loan Facility is secured by a first priority lien on the membership interests in FC-GEN and on substantially all of our and our subsidiaries’ assets other than collateral held on a first priority basis by the Revolving Credit Facilities lender. Borrowings under the Term Loan Facility bear interest at a rate per annum equal to the applicable margin plus, at our option, either (x) LIBOR or (y) a base rate determined by reference to the highest of (i) the lender defined prime rate, (ii) the federal funds rate effective plus one half of one percent and (iii) LIBOR described in subclause (x) plus 1.0%. LIBOR based loans are subject to an interest rate floor of 1.5% and base rate loans are subject to a floor of 2.5%. The Term Loan Facility matures on December 4, 2017. On September 25, 2014, FC-GEN entered into an amendment to the Term Loan Facility providing for changes to the financial covenants and other provisions allowing for and accommodating the Combination. On February 2, 2015, the amendment to the Term Loan Facility became effective. The Term Loan Facility currently has an outstanding principal balance of $228.4 million. Base rate borrowings under the Term Loan Facility bore interest of approximately 11.00% at December 31, 2015. One-month LIBOR borrowings under the Term Loan Facility bore interest of approximately 10.0% at December 31, 2015.
Principal payments for the year ended December 31, 2015 were $2.2 million. The Term Loan Facility amortizes quarterly at a rate of 5% per annum. The lenders have the right to elect ratable principal payments or defer principal recoupment until the end of the term.
Real Estate Bridge Loans
In connection with the Combination on February 2, 2015, we entered into a $360.0 million real estate bridge loan (the Skilled Real Estate Bridge Loan), which is secured by a mortgage lien on the real property of 67 facilities and a second lien on certain receivables of the operators of such facilities. The Skilled Real Estate Bridge Loan is subject to a 24-month term with two extension options of 90-days each and accrues interest at a rate equal to LIBOR, plus 6.75%, plus an additional margin that ranges up to 7.00% based on the aggregate number of days the Skilled Real Estate Bridge Loan is outstanding. The interest rate is also subject to a LIBOR interest rate floor of 0.5%. The Skilled Real Estate Bridge Loan bore interest of 9.75% at December 31, 2015. The Skilled Real Estate Bridge Loan is subject to payments of interest only during the term with a balloon payment due at maturity, provided, that to the extent the subsidiaries receive any net proceeds from the sale and / or refinance of the underlying facilities such net proceeds are required to be used to repay the outstanding principal balance of the Skilled Real Estate Bridge Loan. The proceeds of the Skilled Real Estate Bridge Loan were used to repay Skilled’s first lien senior secured term loan, repay Skilled’s mortgage loans and asset based revolving credit facility with MidCap Financial with excess proceeds used to fund direct costs of the Combination with us. The Skilled Real Estate Bridge Loan has an outstanding principal balance of $360.0 million at December 31, 2015.
In connection with the acquisition of Revera on December 1, 2015, we entered into a $134.1 million real estate bridge loan (the Revera Real Estate Bridge Loan), which is secured by a mortgage lien on the real property of 15 facilities and a second lien on certain receivables of the operators of such facilities. The Revera Real Estate Bridge Loan is subject to a 24-month term with two extension options of 90-days each and accrues interest at a rate equal to LIBOR, plus 6.75%, plus an additional margin that ranges up to 7.00% based on the aggregate number of days the Revera Real Estate Bridge Loan is outstanding, plus 0.25% multiplied by the result of dividing the number of percentage points by which the loan-to-value ratio, defined as the ratio, expressed as a percentage, of (i) the outstanding principal balance to (ii) the total appraised value of the facilities as of the closing date, exceeds 75% by five. The interest rate is also subject
74
to a LIBOR interest rate floor of 0.5%. The Revera Real Estate Bridge Loan bore interest of 8.00% at December 31, 2015. The Revera Real Estate Bridge Loan is subject to payments of interest only during the term with a balloon payment due at maturity, provided, that to the extent the subsidiaries receive any net proceeds from the sale and / or refinance of the underlying facilities such net proceeds are required to be used to repay the outstanding principal balance of the Revera Real Estate Bridge Loan. The proceeds of the Revera Real Estate Bridge Loan were used to finance the acquisition of 15 Revera facilities. The Revera Real Estate Bridge Loan has an outstanding principal balance of $134.1 million at December 31, 2015. In connection with the acquisition of Revera, we agreed to acquire an additional five facilities located in the State of Vermont, which are pending change of ownership approval. If such approval is received, the acquisition of the five revera Vermont facilities will be financed by a $37.0 million expansion to the Revera Real Estate Bridge Loan.
The Revolving Credit Facilities, the Term Loan, the Skilled Real Estate Bridge Loan and the Revera Real Estate Bridge Loan (collectively, the Credit Facilities) each contain a number of restrictive covenants that, among other things, impose operating and financial restrictions on us and our subsidiaries. The Credit Facilities also require us to meet defined financial covenants, including interest coverage ratio, a maximum consolidated net leverage ratio and a minimum consolidated fixed charge coverage ratio, all as defined in the applicable agreements. The Credit Facilities also contain other customary covenants and events of default. At December 31, 2015, we were in compliance with these covenants.
HUD Insured Loans
In connection with the Combination on February 2, 2015, we assumed certain obligations under 10 loans insured by the U.S. Department of Housing and Urban Development (HUD). The loans are secured by 10 of our skilled nursing facilities that were acquired in the Combination. The HUD insured loans have an original amortization term of 30 to 35 years. On May 1, 2015, we acquired a facility in Texas and assumed its HUD insured loan totaling $8.4 million with a maturity date of January 1, 2049. As of December 31, 2015 the HUD insured loans have a combined aggregate principal balance of $107.6 million including a $14.5 million debt premium established in purchase accounting in connection with the Combination.
These mortgages have an average remaining term of 31 years with fixed interest rates ranging from 3.4% to 4.6% and a weighted average interest rate of 4.3%. Depending on the mortgage agreement, prepayments are generally allowed only after 12 months from the inception of the mortgage. Prepayments are subject to a penalty of 10% of the remaining principal balances in the first year and the prepayment penalty decreases each subsequent year by 1% until no penalty is required. Any further HUD insured mortgages will require additional HUD approval.
All HUD-insured mortgages are non-recourse loans to us. All mortgages are subject to HUD regulatory agreements that require escrow reserve funds to be deposited with the loan servicer for mortgage insurance premiums, property taxes, insurance and for capital replacement expenditures. As of December 31, 2015, we had total escrow reserve funds of $7.2 million with the loan servicer that are reported within prepaid expenses.
Other Debt
Mortgages and other secured debt (recourse). We carry mortgage loans and notes payable on certain of our corporate office buildings and other acquired assets. The loans are secured by the underlying real property and have fixed or variable rates of interest ranging from 1.9% to 6.0% at December 31, 2015, with maturity dates ranging from 2018 to 2020.
Mortgages and other secured debt (non-recourse). Loans are carried by certain of our consolidated joint ventures. The loans consist principally of revenue bonds and secured bank loans. Loans are secured by the underlying real and personal property of individual facilities and have fixed or variable rates of interest ranging from 2.5% to 22.2% at December 31, 2015, with maturity dates ranging from 2018 to 2034. Loans are labeled “non-recourse” because neither we nor any of our wholly owned subsidiaries is obligated to perform under the respective loan agreements.
75
The maturity of total debt of $1,230.2 million at December 31, 2015 is as follows (in thousands):
|
Years ending December 31, |
|
|
|
|
2016 |
|
$ |
12,477 |
|
2017 |
|
|
710,524 |
|
2018 |
|
|
25,021 |
|
2019 |
|
|
3,898 |
|
2020 |
|
|
367,284 |
|
Thereafter |
|
|
110,953 |
|
Total debt maturity |
|
$ |
1,230,157 |
In October 2015, we received approval from HUD to access up to $760 million of additional HUD insured loans. We intend to refinance approximately $440 million of the Real Estate Bridge Loans described above with newly issued HUD insured loans having terms and maturities similar to the our existing HUD insured loans, or through other longer term financing sources.
We are also actively pursuing opportunities to sell certain non-strategic assets, including our hospice, home health and staffing businesses. Proceeds generated from any such sales would be available to us to either reinvest or to repay indebtedness. In March 2016, we announced we had entered into an agreement to sell our hospice and home health business for $84 million. In January 2016, we sold 18 assisted living facilities located in Kansas for $67 million, $54.2 million of which was used to repay Real Estate Bridge Loans.
Off Balance Sheet Arrangements
We had outstanding letters of credit of $66.9 million under our letter of credit sub-facility on our revolving credit facilities as of December 31, 2015. These letters of credit are principally pledged to landlords and insurance carriers as collateral. We are not involved in any other off-balance-sheet arrangements that have or are reasonably likely to have a material current or future impact on our financial condition, changes in financial condition, revenue or expense, results of operations, liquidity, capital expenditures, or capital resources.
Contractual Obligations
The following table sets forth our contractual obligations, including principal and interest, but excluding non-cash amortization of discounts or premiums established on these instruments, as of December 31, 2015 (in thousands):
|
|
|
|
|
|
|
|
|
|
|
|
|
|
|
More than |
|
|
|
|
|
Total |
|
1 Yr. |
|
2-3 Yrs. |
|
4-5 Yrs. |
|
5 Yrs. |
|
|||||
|
Revolving Credit Facilities |
|
$ |
427,021 |
|
$ |
14,774 |
|
$ |
29,548 |
|
$ |
382,699 |
|
$ |
— |
|
|
Term Loan Facility |
|
|
270,227 |
|
|
34,876 |
|
|
235,351 |
|
|
— |
|
|
— |
|
|
Real Estate Bridge Loans |
|
|
566,317 |
|
|
52,861 |
|
|
513,456 |
|
|
— |
|
|
— |
|
|
HUD insured loans |
|
|
168,110 |
|
|
5,463 |
|
|
10,926 |
|
|
10,926 |
|
|
140,795 |
|
|
Mortgages and other secured debt (recourse) |
|
|
14,976 |
|
|
1,059 |
|
|
11,864 |
|
|
2,053 |
|
|
— |
|
|
Mortgages and other secured debt (non-recourse) |
|
|
33,933 |
|
|
1,799 |
|
|
14,610 |
|
|
2,617 |
|
|
14,907 |
|
|
Financing obligations |
|
|
11,351,320 |
|
|
274,657 |
|
|
573,675 |
|
|
606,905 |
|
|
9,896,083 |
|
|
Capital lease obligations |
|
|
3,860,183 |
|
|
93,656 |
|
|
196,246 |
|
|
201,355 |
|
|
3,368,926 |
|
|
Operating lease obligations |
|
|
931,652 |
|
|
140,598 |
|
|
271,271 |
|
|
261,261 |
|
|
258,522 |
|
|
|
|
$ |
17,623,739 |
|
$ |
619,743 |
|
$ |
1,856,947 |
|
$ |
1,467,816 |
|
$ |
13,679,233 |
|
Item 7A. Quantitative and Qualitative Disclosures About Market Risk
In the normal course of business, our operations are exposed to risks associated with fluctuations in interest rates. To the extent these interest rates increase, our interest expense will increase, which will make our interest payments and funding other fixed costs more expensive, and our available cash flow may be adversely affected. We routinely monitor
76
risks associated with fluctuations in interest rates and consider the use of derivative financial instruments to hedge these exposures. We do not enter into derivative financial instruments for trading or speculative purposes nor do we enter into energy or commodity contracts.
Interest Rate Exposure—Interest Rate Risk Management
Our term loan facility, real estate bridge loans and revolving credit facilities expose us to variability in interest payments due to changes in interest rates. As of December 31, 2015, there is no derivative financial instrument in place to limit that exposure.
The table below presents the principal amounts, weighted-average interest rates and fair values by year of expected maturity to evaluate our expected cash flows and sensitivity to interest rate changes (dollars in thousands):
|
|
|
Years Ending December 31, |
|
||||||||||||||||||||||
|
|
|
2016 |
|
2017 |
|
2018 |
|
2019 |
|
2020 |
|
Thereafter |
|
Total |
|
Fair Value |
|
||||||||
|
Fixed-rate debt |
|
$ |
2,469 |
|
$ |
2,571 |
|
$ |
2,676 |
|
$ |
3,333 |
|
$ |
3,720 |
|
$ |
97,395 |
|
$ |
112,164 |
|
$ |
126,686 |
|
|
Average interest rate (1) |
|
|
4.1 |
% |
|
4.1 |
% |
|
4.1 |
% |
|
4.0 |
% |
|
2.8 |
% |
|
4.1 |
% |
|
|
|
|
|
|
|
Variable-rate debt (2) |
|
$ |
13,387 |
|
$ |
710,964 |
|
$ |
21,781 |
|
$ |
— |
|
$ |
363,000 |
|
$ |
— |
|
$ |
1,109,132 |
|
$ |
1,108,560 |
|
|
Average interest rate (1) |
|
|
9.5 |
% |
|
8.0 |
% |
|
3.2 |
% |
|
— |
% |
|
3.7 |
% |
|
— |
% |
|
|
|
|
|
|
(1)Based on one month LIBOR of 0.43% on December 31, 2015.
(2)Excludes unamortized original issue discounts and debt premiums which amortize through interest expense on a non-cash basis over the life of the instrument.
The Revolving Credit Facilities consist of a senior secured, asset-based revolving credit facility of up to $550 million under three separate tranches: Tranche A-1, Tranche A-2 and FILO Tranche. Interest accrues at a per annum rate equal to either (x) a base rate (calculated as the highest of the (i) prime rate, (ii) the federal funds rate plus 3.00%, or (iii) LIBOR plus the excess of the applicable margin between LIBOR loans and base rate loans) plus an applicable margin or (y) LIBOR plus an applicable margin. The applicable margin is based on the level of commitments for all three tranches, and in regards to LIBOR loans (i) for Tranche A-1 ranges from 3.25% to 2.75%, (ii) for Tranche A-2 ranges from 3.00% to 2.50%, and (iii) for FILO Tranche is 5.00%. The applicable margins with respect to base rate borrowings for Tranche A-1, Tranche A-2 and FILO were 2.00%, 2.00%, and 4.00%, respectively, at December 31, 2015. The applicable margins with respect to LIBOR borrowings for Tranche A-1, Tranche A-2 and FILO were 3.00%, 3.00%, and 5.00%, respectively, at December 31, 2015.
Borrowings under the Term Loan Facility bear interest at a rate per annum equal to the applicable margin plus, at our option, either (1) LIBOR determined by reference to the costs of funds for Eurodollar deposits for the interest period relevant to such borrowings, or (2) a base rate determined by reference to the highest of (a) the lender defined prime rate, (b) the federal funds rate effective plus one half of one percent and (c) LIBOR described in sub clause (1) plus 1.0%. LIBOR based loans are subject to an interest rate floor of 1.5% and base rate loans are subject to a floor of 2.5%. The applicable margin with respect to LIBOR borrowings was 8.5% at December 31, 2015.
Borrowings under the Skilled Real Estate Bridge Loan bear interest at a rate per annum equal to the sum of (1) LIBOR, defined as the greater of (a) 0.50% per annum or (b) the one-month duration LIBOR for an amount comparable to the loan amount according to a lender approved reference bank, (2) the applicable margin and (3) 675 basis points (BPS). The applicable margin escalates every 90 days after the initial 149 days of the two year term. The margin ranges from 0 BPS to 650 BPS in the initial term, 675 and up to 700 BPS if a second renewal term is opted for. The applicable interest rate on this loan was 9.75% as of December 31, 2015.
Borrowings under the Revera Real Estate Bridge Loan bear interest at a rate per annum equal to the sum of (1) LIBOR, defined as the greater of (a) 0.50% per annum or (b) the one-month duration LIBOR for an amount comparable to the loan amount according to a lender-approved reference bank, (2) the applicable margin, (3) 675 BPS and (4) 25 BPS multiplied by the result of dividing the number of percentage points by which the loan-to-value ratio, defined as the ratio, expressed as a percentage, of (i) the outstanding principal balance to (ii) the total appraised value of the facilities as of the closing date, exceeds 75% by five. The applicable margin escalates every 90 days after the initial
77
149 days of the two year term. The margin ranges from 0 BPS to 650 BPS in the initial term and 675 to 700 BPS if a second renewal term is opted for. The applicable interest rate on this loan was 8.00% as of December 31, 2015.
A 1% increase in the applicable interest rate on our variable-rate debt would result in an approximately $11.0 million increase in our annual interest expense.
Item 8. Financial Statements and Supplementary Data
The information required by this item is incorporated herein by reference to the financial statements set forth in Item15. “Exhibits and Financial Statement Schedules—Consolidated Financial Statements and Supplementary Data.”
Item 9. Changes in and Disagreement with Accountants on Accounting and Financial Disclosure
Not applicable.
Item 9A.Controls and Procedures
Evaluation of Disclosure Controls and Procedures
As required by Rules 13a-15(e) and 15d-15(e) under the Securities Exchange Act of 1934, as amended (the Exchange Act), management has evaluated, with the participation of our Chief Executive Officer and Chief Financial Officer, the effectiveness of our disclosure controls and procedures as of the end of the period covered by this report.
Disclosure controls and procedures refer to controls and other procedures designed to ensure that information required to be disclosed in the reports we file or submit under the Exchange Act is recorded, processed, summarized and reported, within the time periods specified in the rules and forms of the U.S. Securities and Exchange Commission. Disclosure controls and procedures include, without limitation, controls and procedures designed to ensure that information required to be disclosed by us in the reports that we file or submit under the Exchange Act is accumulated and communicated to management, including our Chief Executive Officer and Chief Financial Officer, as appropriate to allow timely decisions regarding our required disclosure. In designing and evaluating our disclosure controls and procedures, management recognizes that any controls and procedures, no matter how well designed and operated, can provide only reasonable assurance of achieving the desired control objectives, and management is required to apply its judgment in evaluating and implementing possible controls and procedures.
We conducted an evaluation, under the supervision and with the participation of our Chief Executive Officer and Chief Financial Officer, of the effectiveness of the design and operation of our disclosure controls and procedures as of the end of the period covered by this report. Based on their evaluation and subject to the foregoing, our Chief Executive Officer and Chief Financial Officer have concluded that, as of the end of the period covered by this report, the disclosure controls and procedures were not effective as of December 31, 2015 because of the material weakness in our internal control over financial reporting described below.
However, giving full consideration to the material weakness, management has concluded that the consolidated financial statements included in this annual report present fairly, in all material respects, our financial position, results of operations and cash flows for the periods disclosed in conformity with U.S. generally accepted accounting principles. KPMG LLP has issued its report dated March 14, 2016, which expressed an unqualified opinion on those consolidated financial statements.
Management’s Report on Internal Control over Financial Reporting
Management is responsible for establishing and maintaining adequate internal control over financial reporting as defined in Rule 13a-15(f) under the Exchange Act.
Internal control over financial reporting refers to a process designed by, or under the supervision of, our Chief Executive Officer and Chief Financial Officer and effected by our board of directors, management and other personnel,
78
to provide reasonable assurance regarding the reliability of financial reporting and the preparation of financial statements for external purposes in accordance with generally accepted accounting principles and includes those policies and procedures that:
|
· |
pertain to the maintenance of records that in reasonable detail accurately and fairly reflect the transactions and dispositions of our assets; |
|
· |
provide reasonable assurance that transactions are recorded as necessary to permit preparation of financial statements in accordance with generally accepted accounting principles, and that our receipts and expenditures are being made only in accordance with authorizations of our management and members of our board of directors; and |
|
· |
provide reasonable assurance regarding prevention or timely detection of unauthorized acquisition, use, or disposition of our assets that could have a material effect on our financial statements. |
A system of internal control over financial reporting, no matter how well conceived and operated, can provide only reasonable, not absolute assurance of achieving financial reporting objectives because of its inherent limitations. Internal control over financial reporting is a process that involves human diligence and compliance and is subject to lapses in judgment and breakdowns resulting from human failures. Internal control over financial reporting also can be circumvented by collusion or improper override. Because of such limitations, there is a risk that material misstatements may not be prevented or detected on a timely basis by internal control over financial reporting. However, these inherent limitations are known features of the financial reporting process, and it is possible to design into the process safeguards to reduce, though not eliminate, this risk.
Management conducted the above-referenced assessment of the effectiveness of our internal control over financial reporting as of December 31, 2015 using the framework set forth in the report entitled, "Internal Control — Integrated Framework (2013 COSO Framework)," issued by the Committee of Sponsoring Organizations of the Treadway Commission. Based on management’s evaluation and the criteria set forth in the 2013 COSO Framework, management concluded that our internal control over financial reporting was not effective as of December 31, 2015 due to a material weakness in internal control over financial reporting, as described below.
The scope of management’s assessment of the effectiveness of its internal control over financial reporting included the Company's consolidated operations except for the operations of Revera Inc., which were acquired in December 2015. The operations acquired from Revera Inc. represented 3% of the Company’s consolidated total assets and less than 1% of consolidated revenues as of and for the year ended December 31, 2015.
A material weakness is a deficiency, or a combination of deficiencies, in internal control over financial reporting, such that there is a reasonable possibility that a material misstatement of the Company’s annual or interim financial statements will not be prevented or detected on a timely basis.
Based on its evaluation of internal control over financial reporting as described above, management concluded that it did not design and maintain effective internal controls with respect to segregation of duties and related information technology general controls (ITGCs) within the Company’s general ledger, payroll/human resources, and accounts payable IT system applications affecting capital expenditures; accounts payable; accrued compensation; salaries, wages, and benefits; general and administrative costs; and other operating expenses. This material weakness represents the aggregation of the following control deficiencies:
|
· |
The ITGCs supporting these IT system applications were not designed and operating effectively to ensure that access to the applications and data, and the ability to make program changes, were adequately restricted to authorized personnel commensurate with their job responsibilities. The ineffective ITGCs resulted in ineffective segregation of duties, whereby certain personnel have the ability to perform conflicting duties within the general ledger, payroll/human resources, and accounts payable IT system applications and related general ledger accounts without effective monitoring of their activity. |
79
|
· |
Due to the impact of these ineffective ITGCs, automated controls related to the IT system applications and manual controls that rely on information produced by and maintained within these IT system applications were also ineffective. |
While management has determined that the control deficiencies identified did not result in any misstatements, a reasonable possibility exists that a material misstatement to the annual or interim consolidated financial statements and disclosures would not be prevented or detected on a timely basis. Accordingly, our management concluded that the aggregated deficiencies represent a material weakness in our internal control over financial reporting as of December 31, 2015.
The effectiveness of our internal control over financial reporting as of December 31, 2015 has been audited by KPMG LLP, our independent registered public accounting firm. KPMG’s report on our internal control over financial reporting is included in this item under "Report of Independent Registered Public Accounting Firm" and expresses an adverse opinion on the effectiveness of our internal control over financial reporting as of December 31, 2015.
Remediation Plan for Material Weakness in Internal Control over Financial Reporting
Management, with the oversight from the Audit Committee of the Board of Directors is actively engaged in the planning for, and implementation of, remediation efforts to address the material weaknesses identified above. Management has taken or intends to take the following actions to address the material weakness:
|
· |
Establish a more comprehensive review, including a consideration of appropriate segregation of duties, and approval process for authorizing user access to the Company’s general ledger, payroll/human resources and accounts payable IT system applications and monitoring user access to ensure that all information technology controls designed to restrict access to operating systems, applications and data, and the ability to make program changes, are operating in a manner that provides the Company with assurance that such access is properly restricted to the appropriate personnel commensurate with their assigned roles and responsibilities. |
|
· |
Document and implement policies to reinforce pre-established and new information technology controls and their financial reporting objectives. |
The Company believes the foregoing efforts will effectively remediate the material weakness described above. Because the reliability of the internal control process requires repeatable execution, the successful remediation of this material weakness will require review and evidence of effectiveness prior to concluding that the controls are effective and there is no assurance that additional remediation steps will not be necessary.
Changes in Internal Control Over Financial Reporting
Management determined that, as of December 31, 2015, there have been no changes in our internal control over financial reporting during the fiscal quarter ended December 31, 2015 that have materially affected, or are reasonably likely to materially affect, our internal control over financial reporting.
80
Report of Independent Registered Public Accounting Firm
The Board of Directors and Stockholders
Genesis Healthcare, Inc.:
We have audited Genesis Healthcare Inc.’s internal control over financial reporting as of December 31, 2015, based on criteria established in Internal Control ‑ Integrated Framework (2013) issued by the Committee of Sponsoring Organizations of the Treadway Commission (COSO). Genesis Healthcare, Inc.'s management is responsible for maintaining effective internal control over financial reporting and for its assessment of the effectiveness of internal control over financial reporting, included in the accompanying Management’s Report on Internal Control over Financial Reporting. Our responsibility is to express an opinion on Genesis Healthcare, Inc.'s internal control over financial reporting based on our audit.
We conducted our audit in accordance with the standards of the Public Company Accounting Oversight Board (United States). Those standards require that we plan and perform the audit to obtain reasonable assurance about whether effective internal control over financial reporting was maintained in all material respects. Our audit included obtaining an understanding of internal control over financial reporting, assessing the risk that a material weakness exists, and testing and evaluating the design and operating effectiveness of internal control based on the assessed risk. Our audit also included performing such other procedures as we considered necessary in the circumstances. We believe that our audit provides a reasonable basis for our opinion.
A company's internal control over financial reporting is a process designed to provide reasonable assurance regarding the reliability of financial reporting and the preparation of financial statements for external purposes in accordance with generally accepted accounting principles. A company’s internal control over financial reporting includes those policies and procedures that (1) pertain to the maintenance of records that, in reasonable detail, accurately and fairly reflect the transactions and dispositions of the assets of the company; (2) provide reasonable assurance that transactions are recorded as necessary to permit preparation of financial statements in accordance with generally accepted accounting principles, and that receipts and expenditures of the company are being made only in accordance with authorizations of management and directors of the company; and (3) provide reasonable assurance regarding prevention or timely detection of unauthorized acquisition, use, or disposition of the company’s assets that could have a material effect on the financial statements.
Because of its inherent limitations, internal control over financial reporting may not prevent or detect misstatements. Also, projections of any evaluation of effectiveness to future periods are subject to the risk that controls may become inadequate because of changes in conditions, or that the degree of compliance with the policies or procedures may deteriorate.
A material weakness is a deficiency, or a combination of deficiencies, in internal control over financial reporting, such that there is a reasonable possibility that a material misstatement of the company’s annual or interim financial statements will not be prevented or detected on a timely basis. A material weakness related to ineffective controls over segregation of duties and ineffective information technology access controls and automated controls within the Company’s general ledger, payroll/human resources, and accounts payable IT system applications has been identified and included in management’s assessment.
In our opinion, because of the effect of the aforementioned material weakness on the achievement of the objectives of the control criteria, Genesis Healthcare, Inc. has not maintained effective internal control over financial reporting as of December 31, 2015, based on criteria established in Internal Control—Integrated Framework (2013) issued by the Committee of Sponsoring Organizations of the Treadway Commission (COSO).
The scope of management’s assessment of their effectiveness of internal control over financial reporting included Genesis Healthcare Inc.’s consolidated operations except for the operations of Revera Inc., which was acquired in December 2015. Revera Inc. represented 3% of Genesis Healthcare Inc.’s consolidated total assets and less than 1% of consolidated revenues as of and for the year ended December 31, 2015. Our audit of internal control over financial reporting of Genesis Healthcare Inc. also excluded an evaluation of the internal control over financial reporting of Revera Inc.
We also have audited, in accordance with the standards of the Public Company Accounting Oversight Board (United States), the consolidated balance sheets of Genesis Healthcare, Inc. and subsidiaries as of December 31, 2015 and 2014 and the related consolidated statements of operations, comprehensive loss, stockholders’ equity (deficit) and cash flows
81
for each of the years in the three-year period ended December 31, 2015. This material weakness was considered in determining the nature, timing, and extent of audit tests applied in our audit of the 2015 consolidated financial statements, and this report does not affect our report dated March 14, 2016, which expressed an unqualified opinion on those consolidated financial statements.
/s/ KPMG LLP
Philadelphia, Pennsylvania
March 14, 2016
82
On March 10, 2016, the Company and Welltower, Inc. entered into the Second Amendment to the Nineteenth Amended and Restated Master Lease. The Second Amendment amended certain definitions and covenants contained in the Nineteenth Amended and Restated Master Lease.
Item 10. Directors, Executive Officers and Corporate Governance
The information to be included in the sections entitled, “Election of Directors,” “Our Executive Officers," “Section16(a) Beneficial Ownership Reporting Compliance,” “Code of Conduct” and “Corporate Governance – Committees of the Board of Directors – Audit Committee,” respectively, in the Definitive Proxy Statement for the Annual Meeting of Stockholders to be filed by us with the U.S. Securities and Exchange Commission no later than 120 days after December 31, 2015 (the 2016 Proxy Statement) is incorporated herein by reference.
We have filed, as exhibits to this annual report, the certifications of our Principal Executive Officer and Principal Financial Officer required pursuant to Section 302 of the Sarbanes-Oxley Act of 2002.
Item 11. Executive Compensation
The information to be included in the sections entitled “Executive Compensation” and “Directors Compensation” in the 2016 Proxy Statement is incorporated herein by reference.
Item 12. Security Ownership of Certain Beneficial Owners and Management and Related Stockholder Matters
The information to be included in the section entitled “Security Ownership of Directors and Executive Officers and Certain Beneficial Owners” and “Equity Compensation Plan Information” in the 2016 Proxy Statement is incorporated herein by reference.
Item 13. Certain Relationships and Related Transactions, and Director Independence
The information to be included in the sections entitled “Certain Relationships and Related Transactions,” “Board Independence,” and “Compensation Committee Interlocks and Insider Participation” in the 2016 Proxy Statement is incorporated herein by reference.
Item 14. Principal Accountant Fees and Services
The information to be included in the section entitled “Independent Registered Public Accounting Firm” in the 2016 Proxy Statement is incorporated herein by reference.
Item 15. Exhibits and Financial Statement Schedules
(a)1. Consolidated Financial Statements and Supplementary Data:
83
The following consolidated financial statements, and notes thereto, and the related Report of our Independent Registered Public Accounting Firm, are filed as part of this Form 10-K:
2.Financial Statement Schedule:
The following financial statement schedule is filed as part of this Form 10-K:
|
|
|
Page |
|
|
|
Number |
|
|
F-46 |
All other schedules have been omitted for the reason that the required information is presented in financial statements or notes thereto, the amounts involved are not significant or the schedules are not applicable.
(b)Exhibits: A list of the exhibits filed or furnished with this Form 10-K is set forth on the Exhibit Index immediately following the signature page to this Form 10-K and is incorporated herein by reference.
(c)Item 601 Exhibits
Reference is hereby made to Item 15(a) of this report, “Exhibits and Financial Statement Schedules—Exhibits.”
84
Pursuant to the requirements of Section 13 or 15(d) of the Securities Exchange Act of 1934, as amended, the registrant has duly caused this report to be signed on its behalf by the undersigned, thereunto duly authorized.
|
|
|
GENESIS HEALTHCARE, INC. |
|
|
|
|
|
|
|
|
|
By |
/S/ GEORGE V. HAGER JR. |
|
|
|
|
George V. Hager Jr. |
|
Date: |
March 14, 2016 |
|
Chief Executive Officer |
Pursuant to the requirements of the Securities Exchange Act of 1934, as amended, this report has been signed below by the following persons on behalf of the registrant and in the capacities and on the date indicated.
|
Date: |
March 14, 2016 |
By |
/S/ GEORGE V. HAGER JR. |
|
|
|
|
George V. Hager Jr. |
|
|
|
|
Chief Executive Officer |
|
|
|
|
|
|
Date: |
March 14, 2016 |
By |
/S/ TOM DIVITTORIO |
|
|
|
|
Tom DiVittorio |
|
|
|
|
Chief Financial Officer |
|
|
|
|
(Principal Financial Officer and Authorized Signatory) |
|
|
|
|
|
|
Date: |
March 14, 2016 |
By |
/S/ STEPHEN S. YOUNG |
|
|
|
|
Stephen S. Young |
|
|
|
|
Vice President and Controller |
|
|
|
|
(Principal Accounting Officer and Authorized Signatory) |
|
|
|
|
|
|
Date: |
March 14, 2016 |
By |
/S/ JAMES H. BLOEM |
|
|
|
|
James H. Bloem |
|
|
|
|
Director |
|
|
|
|
|
|
Date: |
March 14, 2016 |
By |
/S/ JOHN F. DEPODESTA |
|
|
|
|
John F. DePodesta |
|
|
|
|
Director |
|
|
|
|
|
|
Date: |
March 14, 2016 |
By |
/S/ ROBERT FISH |
|
|
|
|
Robert Fish |
|
|
|
|
Director |
|
|
|
|
|
|
Date: |
March 14, 2016 |
By |
/S/ STEVEN FISHMAN |
|
|
|
|
Steven Fishman |
|
|
|
|
Chairman of the Board |
|
|
|
|
|
|
Date: |
March 14, 2016 |
By |
/S/ ROBERT HARTMAN |
|
|
|
|
Robert Hartman |
|
|
|
|
Director |
|
|
|
|
|
|
Date: |
March 14, 2016 |
By |
/S/ JOSHUA HAUSMAN |
|
|
|
|
Joshua Hausman |
|
|
|
|
Director |
|
|
|
|
|
|
Date: |
March 14, 2016 |
By |
/S/ JAMES V. MCKEON |
|
|
|
|
James V. McKeon |
|
|
|
|
Director |
85
|
|
|
|
|
|
Date: |
March 14, 2016 |
By |
/S/ DAVID REIS |
|
|
|
|
David Reis |
|
|
|
|
Director |
|
|
|
|
|
|
Date: |
March 14, 2016 |
By |
/S/ GLENN SCHAFER |
|
|
|
|
Glenn Schafer |
|
|
|
|
Lead Independent Director |
|
|
|
|
|
|
Date: |
March 14, 2016 |
By |
/S/ ARNOLD WHITMAN |
|
|
|
|
Arnold Whitman |
|
|
|
|
Director |
86
EXHIBIT INDEX
|
Number |
Description |
|
2.1 |
Purchase and Contribution Agreement, dated as of August 18, 2014, by and between FC-GEN Operations Investment, LLC and Skilled Healthcare Group, Inc. (filed as Exhibit 2.1 to our Current Report on Form 8-K filed on August 18, 2014, and incorporated herein by reference). |
|
2.2 |
Amendment No. 1 to Purchase and Contribution Agreement, dated as of January 5, 2015, by and between FC-GEN Operations Investment, LLC and Skilled Healthcare Group, Inc. (filed as Exhibit 2.1 to our Current Report on Form 8-K filed on January 9, 2015, and incorporated herein by reference). |
|
3.1 |
Third Amended and Restated Certificate of Incorporation of Genesis Healthcare, Inc. (filed as Exhibit 3.1 to our Current Report on Form 8-K filed on February 6, 2015, and incorporated herein by reference). |
|
3.2 |
Amended and Restated By-Laws of Genesis Healthcare, Inc. (filed as Exhibit 3.2 to our Current Report on Form 8-K filed on February 6, 2015, and incorporated herein by reference). |
|
4.1 |
Amended and Restated Registration Rights Agreement, dated as of August 18, 2014, among Onex Holders (as defined therein), Greystone Holders (as defined therein) and Skilled Healthcare Group, Inc. (filed as Exhibit 10.1 to our Quarterly Report on Form 10-Q filed on November 3, 2014, and incorporated herein by reference). |
|
10.1 |
Sixth Amended and Restated Limited Liability Company Operating Agreement of FC-GEN Operations Investment, LLC, dated as of February 2, 2015 (filed as Exhibit 10.1 to our Current Report on Form 8-K filed on February 6, 2015, and incorporated herein by reference). |
|
10.2 |
Amendment No. 1 to Sixth Amended and Restated Limited Liability Company Operating Agreement of FC-GEN Operations Investment, LLC, dated as of April 1, 2015 (filed as Exhibit 10.2 to our Quarterly Report on Form 10-Q filed on May 8, 2015, and incorporated herein by reference). |
|
10.3 |
Tax Receivable Agreement, dated as of February 2, 2015, by and among Genesis Healthcare, Inc. (formerly Skilled Healthcare Group, Inc.), FC-GEN Operations Investment, LLC and each of the Members (as defined therein) (filed as Exhibit 10.2 to our Current Report on Form 8-K filed on February 6, 2015, and incorporated herein by reference). |
|
10.4* |
Form of Indemnification Agreement with Genesis Healthcare, Inc.’s directors 2015 (filed as Exhibit 10.4 to our Quarterly Report on Form 10-Q filed on May 8, 2015, and incorporated herein by reference). |
|
10.5* |
Employment Agreement, dated February 2, 2015, between George V. Hager, Jr. and Genesis Administrative Services, LLC (filed as Exhibit 10.5 to our Quarterly Report on Form 10-Q filed on May 8, 2015, and incorporated herein by reference). |
|
10.6* |
Employment Agreement, dated February 2, 2015, between Thomas DiVittorio and Genesis Administrative Services, LLC (filed as Exhibit 10.6 to our Quarterly Report on Form 10-Q filed on May 8, 2015, and incorporated herein by reference). |
|
10.7* |
Employment Agreement, dated as of May 28, 2015, with Laurie Thomas (filed as Exhibit 10.2 to our Quarterly Report on Form 10-Q filed on August 10, 2015, and incorporated herein by reference). |
|
10.8* |
Amended and Restated Skilled Healthcare Group, Inc. 2007 Incentive Award Plan (filed as Exhibit A to our Definitive Proxy Statement filed on March 25, 2013, and incorporated herein by reference). |
|
10.9* |
Form of Stock Option Agreement under the Amended and Restated Skilled Healthcare Group, Inc. 2007 Incentive Award Plan (filed as Exhibit 10.18 to our Annual Report on Form 10-K filed on February 11, 2013, and incorporated herein by reference). |
|
10.10* |
Form of Restricted Stock Unit Agreement under the Amended and Restated Skilled Healthcare Group, Inc. 2007 Incentive Award Plan (filed as Exhibit 10.19 to our Annual Report on Form 10-K filed on February 11, 2013, and incorporated herein by reference). |
|
10.11* |
Genesis Healthcare, Inc. 2015 Omnibus Equity Incentive Plan (filed as Exhibit 10.3 to our Quarterly Report on Form 10-Q filed on August 10, 2015, and incorporated herein by reference). |
|
10.12* |
Form of Restricted Stock Unit Agreement to be entered into between Genesis Healthcare, Inc. and its executive officers (filed as Exhibit 10.5 to our Quarterly Report on Form 10-Q filed on August 10, 2015, and incorporated herein by reference). |
|
10.13* |
Form of Restricted Stock Unit Agreement to be entered into between Genesis Healthcare, Inc. and its non-employee directors (filed as Exhibit 10.6 to our Quarterly Report on Form 10-Q filed on August 10, 2015, and incorporated herein by reference). |
|
10.14* |
Genesis Healthcare, Inc. Deferred Compensation Plan (filed as Exhibit 10.4 to our Quarterly Report on Form 10-Q filed on August 10, 2015, and incorporated herein by reference). |
87
|
10.15 |
Third Amended and Restated Credit Agreement, dated as of February 2, 2015, by and among Genesis Healthcare, Inc., FC-GEN Operations Investment, LLC, Skilled Healthcare, LLC, Genesis Holdings, LLC, Genesis Healthcare LLC, certain other borrower entities as set forth therein, certain financial institutions from time to time party thereto, and General Electric Capital Corporation, as administrative agent thereto (filed as Exhibit 10.14 to our Quarterly Report on Form 10-Q filed on May 8, 2015, and incorporated herein by reference). |
|
10.16 |
Amended and Restated Revolving Credit Agreement, dated as of July 26, 2013, among certain borrower entities set forth therein, certain guarantor entities set forth therein, certain lender entities set forth therein, and General Electric Capital Corporation, as administrative agent and collateral agent, regarding HUD centers (filed as Exhibit 10.18 to our Annual Report on Form 10-K filed on May 8, 2015, and incorporated herein by reference). |
|
10.17 |
Form of Healthcare Facility Note with respect to HUD-insured loans (filed as Exhibit 10.1 to our Current Report on Form 8-K filed on September 24, 2013, and incorporated herein by reference). |
|
10.18 |
Term Loan Agreement, dated as of December 3, 2012, among FC-GEN Operations Investment, LLC, GEN Operations I, LLC, GEN Operations II, LLC, Genesis Healthcare LLC, Sun Healthcare Group, Inc., certain banks and other financial institutions or entities from time to time parties thereto, and Barclays Bank PLC, as administrative agent and collateral agent thereto (filed as Exhibit 10.15 to our Quarterly Report filed on Form 10-Q filed on May 8, 2015, and incorporated herein by reference). |
|
10.19 |
Amendment No. 1 to Term Loan Agreement, dated as of January 21, 2014, among FC-GEN Operations Investment, LLC, GEN Operations I, LLC, GEN Operations II, LLC, Genesis Healthcare LLC, Sun Healthcare Group, Inc., certain entities listed on Annex A thereto, certain lenders party thereto, and Barclays Bank PLC, as administrative agent and collateral agent thereto (filed as Exhibit 10.16 to our Quarterly Report on Form 10-Q filed on May 8, 2015, and incorporated herein by reference). |
|
10.20 |
Amendment No. 2 to Term Loan Agreement, dated as of September 25, 2014, among FC-GEN Operations Investment, LLC, GEN Operations I, LLC, GEN Operations II, LLC, Genesis Healthcare LLC, Sun Healthcare Group, Inc., certain entities listed on Annex I thereto, certain lenders party thereto, and Barclays Bank PLC, as administrative agent and collateral agent thereto (filed as Exhibit 10.17 to our Quarterly Report on Form 10-Q filed on May 8, 2015, and incorporated herein by reference). |
|
10.21 |
Loan Agreement, dated as of February 2, 2015, between Welltower Inc. (formerly Health Care REIT, Inc.) and each of the borrowers set forth on Schedule 1 thereto (filed as Exhibit 10.13 to our Quarterly Report on Form 10-Q filed on May 8, 2015, and incorporated herein by reference). |
|
10.22 |
Loan Agreement, dated as of December 1, 2015, between Welltower Inc. and each of the borrowers set forth on Schedule 1 thereto. |
|
10.23 |
Asset Purchase Agreement dated as of June 11, 2015 by and among Revera Assisted Living, Inc. and its affiliates named therein as Sellers, 101 Development Group, LLC as Buyer and Genesis Healthcare, Inc. as Guarantor (filed as Exhibit 10.1 to our Quarterly Report on Form 10-Q filed on August 10, 2015, and incorporated herein by reference). |
|
10.24 |
Amendment No. 1 dated July 26, 2015 to Asset Purchase Agreement dated as of June 11, 2015 by and among Revera Assisted Living, Inc. and its affiliates named therein as Sellers, 101 Development Group, LLC as Buyer and Genesis Healthcare, Inc. as Guarantor (filed as Exhibit 10.1 to our Quarterly Report on Form 10-Q filed on November 6, 2015, and incorporated herein by reference). |
|
10.25 |
Amendment No. 2 dated July 30, 2015 to Asset Purchase Agreement dated as of June 11, 2015 by and among Revera Assisted Living, Inc. and its affiliates named therein as Sellers, 101 Development Group, LLC as Buyer and Genesis Healthcare, Inc. as Guarantor (filed as Exhibit 10.2 to our Quarterly Report on Form 10-Q filed on November 6, 2015, and incorporated herein by reference). |
|
10.26 |
Amendment No. 3 dated October 14, 2015 to Asset Purchase Agreement dated as of June 11, 2015 by and among Revera Assisted Living, Inc. and its affiliates named therein as Sellers, 101 Development Group, LLC as Buyer and Genesis Healthcare, Inc. as Guarantor (filed as Exhibit 10.3 to our Quarterly Report on Form 10-Q filed on November 6, 2015, and incorporated herein by reference). |
|
10.27 |
Amendment No. 4 dated October 16, 2015 to Asset Purchase Agreement dated as of June 11, 2015 by and among Revera Assisted Living, Inc. and its affiliates named therein as Sellers, 101 Development Group, LLC as Buyer and Genesis Healthcare, Inc. as Guarantor (filed as Exhibit 10.4 to our Quarterly Report on Form 10-Q filed on November 6, 2015, and incorporated herein by reference). |
88
|
10.28 |
Amendment No. 5 dated December 1, 2015 to Asset Purchase Agreement dated as of June 11, 2015 by and among Revera Assisted Living, Inc. and its affiliates named therein as Sellers, 101 Development Group, LLC as Buyer and Genesis Healthcare, Inc. as Guarantor. |
|
10.29 |
Nineteenth Amended and Restated Master Lease Agreement, dated December 1, 2015, between FC-GEN Real Estate, LLC and Genesis Operations LLC. |
|
10.30 |
First Amendment to Nineteenth Amended and Restated Master Lease Agreement, dated as of February 2, 2016, between FC-GEN Real Estate, LLC and Genesis Operations LLC. |
|
10.31 |
Second Amendment to Nineteenth Amended and Restated Master Lease Agreement, dated as of March 10, 2016 to be effective as of December 31, 2015, between FC-GEN Real Estate, LLC and Genesis Operations LLC. |
|
10.32* |
Consulting Agreement, dated February 24, 2015, between Roland Rapp and Genesis Administrative Services, LLC (filed as Exhibit 10.7 to our Quarterly Report on Form 10-Q filed on May 8, 2015, and incorporated herein by reference). |
|
10.33* |
Separation Agreement and General Release, dated February 5, 2015, between Robert H. Fish and Skilled Healthcare, LLC (filed as Exhibit 10.8 to our Quarterly Report on Form 10-Q filed on May 8, 2015, and incorporated herein by reference). |
|
10.34* |
Separation Agreement and General Release, dated March 7, 2015, between Chris Felfe and Skilled Healthcare, LLC (filed as Exhibit 10.9 to our Quarterly Report on Form 10-Q filed on May 8, 2015, and incorporated herein by reference). |
|
10.35* |
Separation Agreement and General Release, dated April 10, 2015, between Roland Rapp and Skilled Healthcare, LLC (filed as Exhibit 10.10 to our Quarterly Report on Form 10-Q filed on May 8, 2015, and incorporated herein by reference). |
|
10.36* |
Separation Agreement and General Release, dated March 3, 2015, between Paxton Wiffler and Skilled Healthcare, LLC (filed as Exhibit 10.11 to our Quarterly Report on Form 10-Q filed on May 8, 2015, and incorporated herein by reference). |
|
21 |
Subsidiaries of the Registrant. |
|
23.1 |
Consent of Independent Registered Public Accounting Firm. |
|
31.1 |
Certification of Principal Executive Officer pursuant to Rule 13a-14(a) and 15d-14(a), as adopted pursuant to Section 302 of the Sarbanes-Oxley Act of 2002. |
|
31.2 |
Certification of Principal Financial Officer pursuant to Rule 13a-14(a) and 15d-14(a), as adopted pursuant to Section 302 of the Sarbanes-Oxley Act of 2002. |
|
32** |
Certification pursuant to 18 U.S.C. Section 1350, as adopted pursuant to Section 906 of the Sarbanes-Oxley Act of 2002. |
|
101.INS |
XBRL Instance Document. |
|
101.SCH |
XBRL Taxonomy Extension Schema Document. |
|
101.CAL |
XBRL Taxonomy Extension Calculation Linkbase Document. |
|
101.DEF |
XBRL Taxonomy Extension Definition Linkbase Document. |
|
101.LAB |
XBRL Taxonomy Extension Labels Linkbase Document. |
|
101.PRE |
XBRL Taxonomy Extension Presentation Linkbase Document. |
|
* |
Management contract or compensatory plan or arrangement. |
|
** |
Furnished herewith and not “filed” for purposes of Section 18 of the Securities Exchange Act of 1934, as amended. |
89
Report of Independent Registered Public Accounting Firm
The Board of Directors and Stockholders
Genesis Healthcare, Inc.:
We have audited the accompanying consolidated balance sheets of Genesis Healthcare, Inc. and subsidiaries (the Company) as of December 31, 2015 and 2014, and the related consolidated statements of operations, comprehensive loss, stockholders’ equity (deficit), and cash flows for each of the years in the three year period ended December 31, 2015. In connection with our audits of the consolidated financial statements, we also have audited financial statement schedule “Schedule II. Valuation and Qualifying Accounts.” These consolidated financial statements and financial statement schedule are the responsibility of the Company’s management. Our responsibility is to express an opinion on these consolidated financial statements and financial statement schedule based on our audits.
We conducted our audits in accordance with the standards of the Public Company Accounting Oversight Board (United States). Those standards require that we plan and perform the audit to obtain reasonable assurance about whether the financial statements are free of material misstatement. An audit includes examining, on a test basis, evidence supporting the amounts and disclosures in the financial statements. An audit also includes assessing the accounting principles used and significant estimates made by management, as well as evaluating the overall financial statement presentation. We believe that our audits provide a reasonable basis for our opinion.
In our opinion, the consolidated financial statements referred to above present fairly, in all material respects, the financial position of Genesis Healthcare, Inc. and subsidiaries as of December 31, 2015 and 2014, and the results of their operations and their cash flows for each of the years in the three year period ended December 31, 2015, in conformity with U.S. generally accepted accounting principles. Also in our opinion, the related financial statement schedule, when considered in relation to the basic consolidated financial statements taken as a whole, presents fairly, in all material respects, the information set forth therein.
We also have audited, in accordance with the standards of the Public Company Accounting Oversight Board (United States), Genesis Healthcare Inc.’s internal control over financial reporting as of December 31, 2015, based on criteria established in Internal Control – Integrated Framework (2013) issued by the Committee of Sponsoring Organizations of the Treadway Commission (COSO), and our report dated March 14, 2016 expressed an adverse opinion on the effectiveness of the Company’s internal control over financial reporting.
Our report dated March 14, 2016, on the effectiveness of internal control over financial reporting as of December 31, 2015, contains an explanatory paragraph that states that the scope of management’s assessment of their effectiveness of internal control over financial reporting included Genesis Healthcare, Inc.’s consolidated operations except for the operations of Revera Inc., which was acquired in December 2015. Revera Inc. represented 3% of Genesis Healthcare Inc.’s consolidated total assets and less than 1% of consolidated revenues as of and for the year ended December 31, 2015. Our audit of internal control over financial reporting of Genesis Healthcare, Inc. also excluded an evaluation of the internal control over financial reporting of Revera Inc.
/s/ KPMG LLP
Philadelphia, Pennsylvania
March 14, 2016
F-1
GENESIS HEALTHCARE, INC. AND SUBSIDIARIES
(IN THOUSANDS, EXCEPT SHARE AND PER SHARE DATA)
|
|
|
December 31, |
|
December 31, |
|
||
|
|
|
2015 |
|
2014 |
|
||
|
Assets: |
|
|
|
|
|
|
|
|
Current assets: |
|
|
|
|
|
|
|
|
Cash and cash equivalents |
|
$ |
61,543 |
|
$ |
87,548 |
|
|
Restricted cash and investments in marketable securities |
|
|
52,917 |
|
|
38,211 |
|
|
Accounts receivable, net of allowances for doubtful accounts of $189,739 and $133,529 at December 31, 2015 and December 31, 2014, respectively |
|
|
789,387 |
|
|
605,830 |
|
|
Prepaid expenses |
|
|
58,622 |
|
|
72,873 |
|
|
Other current assets |
|
|
49,024 |
|
|
33,511 |
|
|
Total current assets |
|
|
1,011,493 |
|
|
837,973 |
|
|
Property and equipment, net of accumulated depreciation of $638,768 and $502,176 at December 31, 2015 and December 31, 2014, respectively |
|
|
4,085,247 |
|
|
3,493,250 |
|
|
Restricted cash and investments in marketable securities |
|
|
145,210 |
|
|
108,529 |
|
|
Other long-term assets |
|
|
162,390 |
|
|
140,119 |
|
|
Deferred income taxes |
|
|
7,144 |
|
|
218,744 |
|
|
Identifiable intangible assets, net of accumulated amortization of $66,570 and $42,661 at December 31, 2015 and December 31, 2014, respectively |
|
|
209,967 |
|
|
173,112 |
|
|
Goodwill |
|
|
470,019 |
|
|
169,681 |
|
|
Total assets |
|
$ |
6,091,470 |
|
$ |
5,141,408 |
|
|
Liabilities and Stockholders' Deficit: |
|
|
|
|
|
|
|
|
Current liabilities: |
|
|
|
|
|
|
|
|
Current installments of long-term debt |
|
$ |
12,477 |
|
$ |
12,518 |
|
|
Capital lease obligations |
|
|
1,842 |
|
|
2,875 |
|
|
Financing obligations |
|
|
989 |
|
|
1,138 |
|
|
Accounts payable |
|
|
233,801 |
|
|
194,508 |
|
|
Accrued expenses |
|
|
197,741 |
|
|
125,831 |
|
|
Accrued compensation |
|
|
185,054 |
|
|
192,838 |
|
|
Self-insurance reserves |
|
|
166,761 |
|
|
130,874 |
|
|
Total current liabilities |
|
|
798,665 |
|
|
660,582 |
|
|
Long-term debt |
|
|
1,217,680 |
|
|
525,728 |
|
|
Capital lease obligations |
|
|
1,053,816 |
|
|
1,002,762 |
|
|
Financing obligations |
|
|
3,064,077 |
|
|
2,911,200 |
|
|
Deferred income taxes |
|
|
14,939 |
|
|
19,215 |
|
|
Self-insurance reserves |
|
|
428,569 |
|
|
355,344 |
|
|
Other long-term liabilities |
|
|
133,111 |
|
|
124,067 |
|
|
Commitments and contingencies |
|
|
|
|
|
|
|
|
Stockholders’ deficit: |
|
|
|
|
|
|
|
|
Class A common stock, (par $0.001, 1,000,000,000 shares authorized, issued and outstanding - 73,593,732 and 49,864,878 at December 31, 2015 and December 31, 2014, respectively) |
|
|
74 |
|
|
50 |
|
|
Class B common stock, (par $0.001, 20,000,000 shares authorized, issued and outstanding - 15,511,603 and 0 at December 31, 2015 and December 31, 2014, respectively) |
|
|
16 |
|
|
— |
|
|
Class C common stock, (par $0.001, 150,000,000 shares authorized, issued and outstanding - 64,449,380 and 0 at December 31, 2015 and December 31, 2014, respectively) |
|
|
64 |
|
|
— |
|
|
Additional paid-in-capital |
|
|
295,359 |
|
|
143,492 |
|
|
Accumulated deficit |
|
|
(731,602) |
|
|
(603,254) |
|
|
Accumulated other comprehensive (loss) income |
|
|
(218) |
|
|
515 |
|
|
Total stockholders’ deficit before noncontrolling interests |
|
|
(436,307) |
|
|
(459,197) |
|
|
Noncontrolling interests |
|
|
(183,080) |
|
|
1,707 |
|
|
Total stockholders' deficit |
|
|
(619,387) |
|
|
(457,490) |
|
|
Total liabilities and stockholders’ deficit |
|
$ |
6,091,470 |
|
$ |
5,141,408 |
|
See accompanying notes to consolidated financial statements.
F-2
GENESIS HEALTHCARE, INC. AND SUBSIDIARIES
CONSOLIDATED STATEMENTS OF OPERATIONS
(IN THOUSANDS, EXCEPT PER SHARE DATA)
|
|
|
Year ended December 31, |
|
|||||||
|
|
|
2015 |
|
2014 |
|
2013 |
|
|||
|
Net revenues |
|
$ |
5,619,224 |
|
$ |
4,768,080 |
|
$ |
4,710,341 |
|
|
Salaries, wages and benefits |
|
|
3,289,820 |
|
|
2,904,094 |
|
|
2,898,860 |
|
|
Other operating expenses |
|
|
1,358,983 |
|
|
1,109,699 |
|
|
1,007,909 |
|
|
General and administrative costs |
|
|
175,889 |
|
|
147,063 |
|
|
152,555 |
|
|
Provision for losses on accounts receivable |
|
|
100,521 |
|
|
77,670 |
|
|
69,939 |
|
|
Lease expense |
|
|
150,276 |
|
|
131,898 |
|
|
131,231 |
|
|
Depreciation and amortization expense |
|
|
237,617 |
|
|
193,675 |
|
|
188,726 |
|
|
Interest expense |
|
|
507,809 |
|
|
442,724 |
|
|
426,975 |
|
|
Loss on early extinguishment of debt |
|
|
130 |
|
|
1,133 |
|
|
63 |
|
|
Investment income |
|
|
(1,677) |
|
|
(3,399) |
|
|
(4,150) |
|
|
Other (income) loss |
|
|
(1,400) |
|
|
(138) |
|
|
450 |
|
|
Transaction costs |
|
|
96,374 |
|
|
13,353 |
|
|
5,878 |
|
|
Long-lived asset impairment |
|
|
28,546 |
|
|
31,399 |
|
|
9,999 |
|
|
Skilled Healthcare loss contingency expense |
|
|
31,500 |
|
|
— |
|
|
— |
|
|
Equity in net (income) loss of unconsolidated affiliates |
|
|
(2,139) |
|
|
416 |
|
|
691 |
|
|
Loss before income tax benefit |
|
|
(353,025) |
|
|
(281,507) |
|
|
(178,785) |
|
|
Income tax expense (benefit) |
|
|
172,524 |
|
|
(44,022) |
|
|
(9,179) |
|
|
Loss from continuing operations |
|
|
(525,549) |
|
|
(237,485) |
|
|
(169,606) |
|
|
Loss from discontinued operations, net of taxes |
|
|
(1,219) |
|
|
(14,044) |
|
|
(7,364) |
|
|
Net loss |
|
|
(526,768) |
|
|
(251,529) |
|
|
(176,970) |
|
|
Less net loss (income) attributable to noncontrolling interests |
|
|
100,573 |
|
|
(2,456) |
|
|
(1,025) |
|
|
Net loss attributable to Genesis Healthcare, Inc. |
|
$ |
(426,195) |
|
$ |
(253,985) |
|
$ |
(177,995) |
|
|
Loss per common share: |
|
|
|
|
|
|
|
|
|
|
|
Basic and diluted: |
|
|
|
|
|
|
|
|
|
|
|
Weighted-average shares outstanding for basic and diluted loss from continuing operations per share |
|
|
85,755 |
|
|
49,865 |
|
|
49,865 |
|
|
Basic and diluted net loss per common share: |
|
|
|
|
|
|
|
|
|
|
|
Loss from continuing operations attributable to Genesis Healthcare, Inc. |
|
$ |
(4.96) |
|
$ |
(4.81) |
|
$ |
(3.42) |
|
|
Loss from discontinued operations, net of taxes |
|
|
(0.01) |
|
|
(0.28) |
|
|
(0.15) |
|
|
Net loss attributable to Genesis Healthcare, Inc. |
|
$ |
(4.97) |
|
$ |
(5.09) |
|
$ |
(3.57) |
|
See accompanying notes to consolidated financial statements.
F-3
GENESIS HEALTHCARE, INC. AND SUBSIDIARIES
CONSOLIDATED STATEMENTS OF COMPREHENSIVE LOSS
(IN THOUSANDS)
|
|
|
Year ended December 31, |
|
|||||||
|
|
|
2015 |
|
2014 |
|
2013 |
|
|||
|
Net loss |
|
$ |
(526,768) |
|
$ |
(251,529) |
|
$ |
(176,970) |
|
|
Net unrealized loss on marketable securities, net of tax |
|
|
(891) |
|
|
(553) |
|
|
(1,916) |
|
|
Comprehensive loss |
|
|
(527,659) |
|
|
(252,082) |
|
|
(178,886) |
|
|
Less: comprehensive loss (income) attributable to noncontrolling interests |
|
|
100,885 |
|
|
(2,456) |
|
|
(1,025) |
|
|
Comprehensive loss attributable to Genesis Healthcare, Inc. |
|
$ |
(426,774) |
|
$ |
(254,538) |
|
$ |
(179,911) |
|
See accompanying notes to consolidated financial statements.
F-4
GENESIS HEALTHCARE, INC. AND SUBSIDIARIES
CONSOLIDATED STATEMENTS OF STOCKHOLDERS’ EQUITY (DEFICIT)
(IN THOUSANDS)
|
|
|
|
|
|
|
|
|
|
|
|
|
|
|
|
|
|
|
|
|
|
|
|
Accumulated |
|
|
|
|
|
|
|
|
|
|
|
|
|
|
|
|
|
|
|
|
|
|
|
|
|
|
|
|
|
|
|
|
|
|
|
other |
|
|
|
|
|
|
|
Total |
|
||
|
|
|
Class A Common Stock |
|
Class B Common Stock |
|
Class C Common Stock |
|
Additional |
|
Accumulated |
|
comprehensive |
|
Stockholders' |
|
Noncontrolling |
|
stockholders' |
|
|||||||||||||||
|
|
|
Shares |
|
Amount |
|
Shares |
|
Amount |
|
Shares |
|
Amount |
|
paid-in capital |
|
deficit |
|
income (loss) |
|
deficit |
|
interests |
|
equity (deficit) |
|
|||||||||
|
Balance at December 31, 2012 |
|
49,865 |
|
$ |
50 |
|
— |
|
$ |
— |
|
— |
|
$ |
— |
|
$ |
166,791 |
|
$ |
(171,274) |
|
$ |
2,984 |
|
$ |
(1,449) |
|
$ |
3,468 |
|
$ |
2,019 |
|
|
Net loss |
|
— |
|
|
— |
|
— |
|
|
— |
|
— |
|
|
— |
|
|
— |
|
|
(177,995) |
|
|
— |
|
|
(177,995) |
|
|
1,025 |
|
|
(176,970) |
|
|
Net unrealized loss on marketable securities, net of tax |
|
— |
|
|
— |
|
— |
|
|
— |
|
— |
|
|
— |
|
|
— |
|
|
— |
|
|
(1,916) |
|
|
(1,916) |
|
|
— |
|
|
(1,916) |
|
|
Distributions to stockholders |
|
— |
|
|
— |
|
— |
|
|
— |
|
— |
|
|
— |
|
|
(5,339) |
|
|
— |
|
|
— |
|
|
(5,339) |
|
|
— |
|
|
(5,339) |
|
|
Distributions to noncontrolling interests |
|
— |
|
|
— |
|
— |
|
|
— |
|
— |
|
|
— |
|
|
— |
|
|
— |
|
|
— |
|
|
— |
|
|
(1,675) |
|
|
(1,675) |
|
|
Balance at December 31, 2013 |
|
49,865 |
|
$ |
50 |
|
— |
|
$ |
— |
|
— |
|
$ |
— |
|
$ |
161,452 |
|
$ |
(349,269) |
|
$ |
1,068 |
|
$ |
(186,699) |
|
$ |
2,818 |
|
$ |
(183,881) |
|
|
Net loss |
|
— |
|
|
— |
|
— |
|
|
— |
|
— |
|
|
— |
|
|
— |
|
|
(253,985) |
|
|
— |
|
|
(253,985) |
|
|
2,456 |
|
|
(251,529) |
|
|
Net unrealized loss on marketable securities, net of tax |
|
— |
|
|
— |
|
— |
|
|
— |
|
— |
|
|
— |
|
|
— |
|
|
— |
|
|
(553) |
|
|
(553) |
|
|
— |
|
|
(553) |
|
|
Distributions to stockholders |
|
— |
|
|
— |
|
— |
|
|
— |
|
— |
|
|
— |
|
|
(17,960) |
|
|
— |
|
|
— |
|
|
(17,960) |
|
|
— |
|
|
(17,960) |
|
|
Distributions to noncontrolling interests |
|
— |
|
|
— |
|
— |
|
|
— |
|
— |
|
|
— |
|
|
— |
|
|
— |
|
|
— |
|
|
— |
|
|
(3,567) |
|
|
(3,567) |
|
|
Balance at December 31, 2014 |
|
49,865 |
|
$ |
50 |
|
— |
|
$ |
— |
|
— |
|
$ |
— |
|
$ |
143,492 |
|
$ |
(603,254) |
|
$ |
515 |
|
$ |
(459,197) |
|
$ |
1,707 |
|
$ |
(457,490) |
|
|
Combination share conversion |
|
23,723 |
|
|
24 |
|
15,512 |
|
|
16 |
|
64,449 |
|
|
64 |
|
|
130,530 |
|
|
297,847 |
|
|
(154) |
|
|
428,327 |
|
|
(80,186) |
|
|
348,141 |
|
|
Net loss |
|
— |
|
|
— |
|
— |
|
|
— |
|
— |
|
|
— |
|
|
— |
|
|
(426,195) |
|
|
— |
|
|
(426,195) |
|
|
(100,573) |
|
|
(526,768) |
|
|
Net unrealized gain on marketable securities, net of tax |
|
— |
|
|
— |
|
— |
|
|
— |
|
— |
|
|
— |
|
|
— |
|
|
— |
|
|
(579) |
|
|
(579) |
|
|
(312) |
|
|
(891) |
|
|
Share based compensation |
|
— |
|
|
— |
|
— |
|
|
— |
|
— |
|
|
— |
|
|
28,472 |
|
|
— |
|
|
— |
|
|
28,472 |
|
|
— |
|
|
28,472 |
|
|
Issuance of common stock |
|
6 |
|
|
— |
|
— |
|
|
— |
|
— |
|
|
— |
|
|
24 |
|
|
— |
|
|
— |
|
|
24 |
|
|
— |
|
|
24 |
|
|
Acquisition of a noncontrolling interest |
|
— |
|
|
— |
|
— |
|
|
— |
|
— |
|
|
— |
|
|
(7,159) |
|
|
— |
|
|
— |
|
|
(7,159) |
|
|
7,159 |
|
|
— |
|
|
Distributions to noncontrolling interests |
|
— |
|
|
— |
|
— |
|
|
— |
|
— |
|
|
— |
|
|
— |
|
|
— |
|
|
— |
|
|
— |
|
|
(10,875) |
|
|
(10,875) |
|
|
Balance at December 31, 2015 |
|
73,594 |
|
$ |
74 |
|
15,512 |
|
$ |
16 |
|
64,449 |
|
$ |
64 |
|
$ |
295,359 |
|
$ |
(731,602) |
|
$ |
(218) |
|
$ |
(436,307) |
|
$ |
(183,080) |
|
$ |
(619,387) |
|
See accompanying notes to consolidated financial statements.
F-5
GENESIS HEALTHCARE, INC. AND SUBSIDIARIES
CONSOLIDATED STATEMENTS OF CASH FLOWS
(IN THOUSANDS)
|
|
|
Year ended December 31, |
|
|||||||
|
|
|
2015 |
|
2014 |
|
2013 |
|
|||
|
Cash flows from operating activities |
|
|
|
|
|
|
|
|
|
|
|
Net loss |
|
$ |
(526,768) |
|
$ |
(251,529) |
|
$ |
(176,970) |
|
|
Adjustments to reconcile net loss to net cash provided by operating activities: |
|
|
|
|
|
|
|
|
|
|
|
Non-cash interest and leasing arrangements, net |
|
|
93,800 |
|
|
86,073 |
|
|
89,141 |
|
|
Other non-cash charges and gains, net |
|
|
(1,063) |
|
|
3,947 |
|
|
2,853 |
|
|
Share based compensation |
|
|
28,472 |
|
|
— |
|
|
— |
|
|
Depreciation and amortization |
|
|
237,763 |
|
|
196,192 |
|
|
191,479 |
|
|
Provision for losses on accounts receivable |
|
|
100,521 |
|
|
78,552 |
|
|
71,538 |
|
|
Equity in net (income) loss of unconsolidated affiliates |
|
|
(2,139) |
|
|
416 |
|
|
691 |
|
|
Provision (benefit) for deferred taxes |
|
|
164,750 |
|
|
(58,293) |
|
|
(25,693) |
|
|
Long-lived asset impairment |
|
|
28,546 |
|
|
31,399 |
|
|
9,999 |
|
|
Loss on early extinguishment of debt |
|
|
130 |
|
|
1,133 |
|
|
63 |
|
|
Changes in assets and liabilities: |
|
|
|
|
|
|
|
|
|
|
|
Transaction costs |
|
|
— |
|
|
— |
|
|
(17,203) |
|
|
Accounts receivable |
|
|
(144,624) |
|
|
(33,568) |
|
|
(109,844) |
|
|
Accounts payable and other accrued expenses and other |
|
|
29,230 |
|
|
53,330 |
|
|
46,095 |
|
|
Net cash provided by operating activities |
|
|
8,618 |
|
|
107,652 |
|
|
82,149 |
|
|
Cash flows from investing activities: |
|
|
|
|
|
|
|
|
|
|
|
Capital expenditures |
|
|
(85,723) |
|
|
(70,987) |
|
|
(77,399) |
|
|
Purchases of marketable securities |
|
|
(83,916) |
|
|
(30,449) |
|
|
(39,569) |
|
|
Proceeds on maturity or sale of marketable securities |
|
|
41,314 |
|
|
30,188 |
|
|
26,227 |
|
|
Net change in restricted cash and equivalents |
|
|
10,269 |
|
|
(24,405) |
|
|
4,235 |
|
|
Sale of investment in joint venture |
|
|
26,358 |
|
|
— |
|
|
— |
|
|
Purchases of inpatient assets, net of cash acquired |
|
|
(167,272) |
|
|
(1,878) |
|
|
(12,200) |
|
|
Sales of inpatient assets |
|
|
3,738 |
|
|
5,227 |
|
|
8,354 |
|
|
Investments in joint venture |
|
|
(392) |
|
|
(2,309) |
|
|
(6,182) |
|
|
Other, net |
|
|
2,140 |
|
|
(1,062) |
|
|
4,832 |
|
|
Net cash used in investing activities |
|
|
(253,484) |
|
|
(95,675) |
|
|
(91,702) |
|
|
Cash flows from financing activities: |
|
|
|
|
|
|
|
|
|
|
|
Borrowings under revolving credit facility |
|
|
864,500 |
|
|
603,500 |
|
|
866,000 |
|
|
Repayments under revolving credit facility |
|
|
(756,000) |
|
|
(549,000) |
|
|
(828,000) |
|
|
Proceeds from issuance of long-term debt |
|
|
495,201 |
|
|
960 |
|
|
15,095 |
|
|
Proceeds from tenant improvement draws under lease arrangements |
|
|
2,920 |
|
|
6,087 |
|
|
10,498 |
|
|
Repayment of long-term debt |
|
|
(357,716) |
|
|
(17,946) |
|
|
(35,085) |
|
|
Debt issuance costs |
|
|
(19,193) |
|
|
(7,916) |
|
|
(746) |
|
|
Distributions to noncontrolling interests and stockholders |
|
|
(10,875) |
|
|
(21,527) |
|
|
(7,014) |
|
|
Issuance of stock |
|
|
24 |
|
|
— |
|
|
— |
|
|
Net cash provided by financing activities |
|
|
218,861 |
|
|
14,158 |
|
|
20,748 |
|
|
Net (decrease) increase in cash and cash equivalents |
|
|
(26,005) |
|
|
26,135 |
|
|
11,195 |
|
|
Cash and cash equivalents: |
|
|
|
|
|
|
|
|
|
|
|
Beginning of period |
|
|
87,548 |
|
|
61,413 |
|
|
50,218 |
|
|
End of period |
|
$ |
61,543 |
|
$ |
87,548 |
|
$ |
61,413 |
|
|
Supplemental cash flow information: |
|
|
|
|
|
|
|
|
|
|
|
Interest paid |
|
$ |
416,163 |
|
$ |
369,124 |
|
$ |
354,129 |
|
|
Taxes paid |
|
|
20,893 |
|
|
2,408 |
|
|
12,584 |
|
|
Non-cash financing activities: |
|
|
|
|
|
|
|
|
|
|
|
Capital leases |
|
$ |
56,766 |
|
$ |
13,096 |
|
$ |
(54,626) |
|
|
Financing obligations |
|
|
83,989 |
|
|
80,284 |
|
|
43,934 |
|
|
Assumption of long-term debt |
|
|
436,887 |
|
|
— |
|
|
— |
|
See accompanying notes to consolidated financial statements.
F-6
Genesis Healthcare, Inc. and Subsidiaries
Notes to Consolidated Financial Statements
Description of Business
Genesis Healthcare, Inc. is a healthcare services company that through its subsidiaries (collectively, the Company) owns and operates skilled nursing facilities, assisted/senior living facilities and a rehabilitation therapy business. The Company has an administrative service company that provides a full complement of administrative and consultative services that allows its affiliated operators and third-party operators with whom the Company contracts to better focus on delivery of healthcare services. The Company provides inpatient services through 531 skilled nursing, assisted/senior living and behavioral health centers located in 34 states. Revenues of the Company’s owned, leased and otherwise consolidated centers constitute approximately 85% of its revenues.
The Company provides a range of rehabilitation therapy services, including speech pathology, physical therapy, occupational therapy and respiratory therapy. These services are provided by rehabilitation therapists and assistants employed or contracted at substantially all of the centers operated by the Company, as well as by contract to healthcare facilities operated by others. After the elimination of intercompany revenues, the rehabilitation therapy services business constitutes approximately 12% of the Company’s revenues.
The Company provides an array of other specialty medical services, including management services, physician services, staffing services, hospice and home health services, and other healthcare related services, which comprise the balance of the Company’s revenues.
Basis of Presentation
The accompanying consolidated financial statements have been prepared in accordance with U.S. generally accepted accounting principles (U.S. GAAP). In the opinion of management, the consolidated financial statements include all necessary adjustments for a fair presentation of the financial position and results of operations for the periods presented.
The consolidated financial statements of the Company include the accounts of the Company and its wholly-owned subsidiaries. All significant intercompany transactions have been eliminated in consolidation. The Company presents noncontrolling interests within the stockholders’ deficit section of its consolidated balance sheets. The Company presents the amount of net loss attributable to Genesis Healthcare, Inc. and net loss (income) attributable to noncontrolling interests in its consolidated statements of operations.
The consolidated financial statements include the accounts of all entities controlled by the Company through its ownership of a majority voting interest and the accounts of any variable interest entities (VIEs) where the Company is subject to a majority of the risk of loss from the VIE's activities, or entitled to receive a majority of the entity's residual returns, or both. The Company assesses the requirements related to the consolidation of VIEs, including a qualitative assessment of power and economics that considers which entity has the power to direct the activities that "most significantly impact" the VIE's economic performance and has the obligation to absorb losses of, or the right to receive benefits that could be potentially significant to, the VIE. The Company's composition of variable interest entities was not material at December 31, 2015.
Prior period results reflect reclassifications, for comparative purposes, related to the early adoption of authoritative guidance for the presentation of deferred taxes. Deferred income taxes have been presented on the balance sheet as noncurrent for all periods presented. Historically, deferred income taxes were classified as either current or noncurrent assets, as applicable.
The Company’s financial position at December 31, 2015 includes the impact of certain significant transactions and events, as disclosed within Note 4 – “Significant Transactions and Events.”
F-7
Genesis Healthcare, Inc. and Subsidiaries
Notes to Consolidated Financial Statements
(2)Summary of Significant Accounting Policies
Estimates and Assumptions
The consolidated financial statements have been prepared in conformity with U.S. GAAP, which requires management to consolidate company financial information and make informed estimates and assumptions that affect the reported amounts of assets and liabilities, disclosure of contingent assets and liabilities at the date of the financial statements and the reported amounts of revenue and expenses during the reporting period. The most significant estimates in the Company’s consolidated financial statements relate to allowance for doubtful accounts, self-insured liability risks, income taxes, impairment of long-lived assets and goodwill, and other contingencies. Actual results could differ from those estimates.
Net Revenues and Accounts Receivable
Revenues and accounts receivable are recorded on an accrual basis as services are performed at their estimated net realizable value. The Company derives a majority of its revenue from funds under federal Medicare and state Medicaid assistance programs, the continuation of which is dependent upon governmental policies and is subject to audit risk and potential recoupment. The Company also receives payments through reimbursement from Medicaid and Medicare programs and directly from individual residents (private pay), third-party insurers and long-term care facilities. The Company assesses collectibility on all accounts prior to providing services.
The Company records revenue for inpatient services and the related receivables in the accounting records at the Company’s established billing rates in the period the related services are rendered. The provision for contractual adjustments, which represents the differences between the established billing rates and predetermined reimbursement rates, is deducted from gross revenue to determine net revenue. Retroactive adjustments that are likely to result from future examinations by third party payors are accrued on an estimated basis in the period the related services are rendered and adjusted as necessary in future periods based upon new information or final settlements.
The Company records revenue for rehabilitation therapy services and other ancillary services and the related receivables at the time services or products are provided or delivered to the customer. Upon delivery of products or services, the Company has no additional performance obligation to the customer.
Cash and Cash Equivalents
Cash and cash equivalents consist of cash and short-term investments with original maturities of three months or less when purchased and therefore, approximate fair value. The Company’s available cash is held in accounts at commercial banking institutions.
Restricted Cash and Investments in Marketable Securities
Restricted cash includes cash and money market funds principally held by the Company’s wholly owned captive insurance subsidiaries, which are substantially restricted to securing outstanding claims losses. The restricted cash and investments in marketable securities balances at December 31, 2015 and 2014 were $198.1 million and $146.7 million, respectively.
Restricted investments in marketable securities, comprised principally of fixed interest rate securities, are considered to be available-for-sale and accordingly are reported at fair value with unrealized gains and losses, net of related tax effects, included within accumulated other comprehensive income, a separate component of stockholders’ deficit. Fair values for fixed interest rate securities are based on quoted market prices.
A decline in the market value of any security below cost that is deemed other-than-temporary is charged to income, resulting in the establishment of a new cost basis for the security. Realized gains and losses for securities classified as available for sale are derived using the specific identification method for determining the cost of securities sold.
F-8
Genesis Healthcare, Inc. and Subsidiaries
Notes to Consolidated Financial Statements
Allowance for Doubtful Accounts
The Company evaluates the adequacy of its allowance for doubtful accounts by estimating allowance requirement percentages for each accounts receivable aging category for each type of payor. The Company has developed estimated allowance requirement percentages by utilizing historical collection trends and its understanding of the nature and collectibility of receivables in the various aging categories and the various lines of the Company’s business. The allowance percentages are developed by payor type as the accounts receivable from each payor type have unique characteristics. The allowance for doubtful accounts also considers accounts specifically identified as uncollectible. Accounts receivable that Company management specifically estimates to be uncollectible, based upon the age of the receivables, the results of collection efforts, or other circumstances, are reserved in the allowance for doubtful accounts until written-off.
Property and Equipment
Property and equipment are carried at cost less accumulated depreciation. Depreciation is calculated using the straight-line method over the estimated useful lives of the depreciable assets, which generally range from 20-35 years for buildings, building improvements and land improvements, and 3-15 years for equipment, furniture and fixtures and information systems. Depreciation expense on leasehold improvements and assets held under capital leases is calculated using the straight-line method over the lesser of the lease term or the estimated useful life of the asset. Expenditures for maintenance and repairs necessary to maintain property and equipment in efficient operating condition are expensed as incurred. Costs of additions and betterments are capitalized.
Total depreciation expense from continuing operations for the years ended December 31, 2015, 2014 and 2013 was $218.8 million, $184.3 million, and $179.4 million, respectively.
Identifiable Intangible Assets and Goodwill
Definite-lived intangible assets primarily consist of management contracts, customer relationships and favorable leases. These assets are amortized in accordance with the authoritative guidance for intangible assets using the straight-line method over their estimated useful lives. Indefinite-lived intangible assets primarily consist of trade names.
Goodwill represents the excess of the purchase price over the fair value of identifiable net assets acquired in business combinations. See Note 9 – “Goodwill and Identifiable Intangible Assets.”
Impairment of Long-Lived Assets
The Company’s long-lived assets are reviewed for impairment whenever events or changes in circumstances indicate the carrying amount of an asset may not be recoverable. Recoverability of assets to be held and used is measured by comparison of the carrying amount of an asset to the future cash flows expected to be generated by the asset. If the carrying amount of an asset exceeds its estimated future undiscounted cash flows, an impairment charge is recognized to the extent the carrying amount of the asset exceeds the fair value of the asset. Assets to be disposed of are reported at the lower of the carrying amount or the fair value less costs to sell.
The Company performs an assessment of qualitative factors prior to the use of the two step quantitative method to determine if goodwill has been impaired. If such qualitative assessment does not indicate that it is more likely than not the fair value of the reporting is less than its carrying value, no further analysis is required. If required, the Company performs a quantitative goodwill impairment test which involves a two-step process. The first step is a comparison of each reporting unit’s fair value to its carrying value. If the carrying value of the reporting unit is greater than its fair value, there is an indication that impairment may exist and the second step must be performed to measure the amount of impairment loss, if any. The Company performs its annual impairment assessment for its reporting units as of September 30 of each year or more frequently if adverse events or changes in circumstances indicate that the asset may be impaired. See Note 18 – “Asset Impairment Charges.”
F-9
Genesis Healthcare, Inc. and Subsidiaries
Notes to Consolidated Financial Statements
Self-Insurance Risks
The Company provides for self-insurance risks for both general and professional liability and workers’ compensation claims based on estimates of the ultimate costs for both reported claims and claims incurred but not reported. Estimated losses from asserted and incurred but not reported claims are accrued based on the Company’s estimates of the ultimate costs of the claims, which includes costs associated with litigating or settling claims, and the relationship of past reported incidents to eventual claims payments. All relevant information, including the Company’s own historical experience, the nature and extent of existing asserted claims and reported incidents, and independent actuarial analyses of this information is used in estimating the expected amount of claims. The reserves for loss for workers’ compensation risks are discounted based on actuarial estimates of claim payment patterns whereas the reserves for general and professional liability are recorded on an undiscounted basis. The Company also considers amounts that may be recovered from excess insurance carriers in estimating the ultimate net liability for such risks. See Note 20 – “Commitments and Contingencies – Loss Reserves For Certain Self-Insured Programs – General and Professional Liability and Workers’ Compensation.”
Income Taxes
The Company’s effective tax rate is based on pretax income, statutory tax rates and tax planning opportunities available in the various jurisdictions in which it operates. The Company accounts for income taxes in accordance with applicable guidance on accounting for income taxes, which requires that deferred tax assets and liabilities be recognized using enacted tax rates for the effect of temporary differences between book and tax bases on recorded assets and liabilities. Accounting guidance also requires that deferred tax assets be reduced by a valuation allowance, when it is more likely than not that a tax benefit will not be realized.
The recognition and measurement of a tax position is based on management’s best judgment given the facts, circumstances and information available at the reporting date. The Company evaluates tax positions to determine whether the benefits of tax positions are more likely than not of being sustained upon audit based on the technical merits of the tax position. For tax positions that are more likely than not of being sustained upon audit, the Company recognizes the largest amount of the benefit that is greater than 50% likely of being realized upon ultimate settlement in the financial statements. For tax positions that are not more likely than not of being sustained upon audit, the Company does not recognize any portion of the benefit in the financial statements. If the more likely than not threshold is not met in the period for which a tax position is taken, the Company may subsequently recognize the benefit of that tax position if the tax matter is effectively settled, the statute of limitations expires, or if the more likely than not threshold is met in a subsequent period.
The Company evaluates, on a quarterly basis, its ability to realize deferred tax assets by assessing its valuation allowance and by adjusting the amount of such allowance, if necessary. The factors used to assess the likelihood of realization are its forecast of pre-tax earnings, its forecast of future taxable income and available tax planning strategies that could be implemented to realize the net deferred tax assets. To the extent the Company prevails in matters for which reserves have been established, or are required to pay amounts in excess of its reserves, its effective tax rate in a given financial statement period could be materially affected. An unfavorable tax settlement would require use of cash and result in an increase in the effective tax rate in the year of resolution. A favorable tax settlement would be recognized as a reduction in the Company’s effective tax rate in the year of resolution. The Company records accrued interest and penalties associated with uncertain tax positions as income tax expense in the consolidated statement of operations.
Leases
Leasing transactions are a material part of the Company’s business. The following discussion summarizes various aspects of the Company’s accounting for leasing transactions and the related balances.
F-10
Genesis Healthcare, Inc. and Subsidiaries
Notes to Consolidated Financial Statements
Capital Leases
Lease arrangements are capitalized when such leases convey substantially all the risks and benefits incidental to ownership. Capital leases are amortized over either the lease term or the life of the related assets, depending upon available purchase options and lease renewal features. Amortization related to capital lease assets is included in the consolidated statements of operations within depreciation and amortization expense. See Note 11 – “Lease and Lease Commitments.”
Operating Leases
For operating leases, minimum lease payments, including minimum scheduled rent increases, are recognized as lease expense on a straight-line basis over the applicable lease terms and any periods during which the Company has use of the property but is not charged rent by a landlord. Lease terms, in most cases, provide for rent escalations and renewal options.
When the Company purchases businesses that have operating lease agreements, it recognizes the fair value of the lease arrangements as either favorable or unfavorable and records these amounts as other identifiable intangible assets or other long-term liabilities, respectively. Favorable and unfavorable leases are amortized to lease expense on a straight-line basis over the remaining term of the leases. See Note 11 – “Lease and Lease Commitments.”
Sale/Leaseback Financing Obligation
Prior to recognition as a sale, or profit/loss thereon, sale/leaseback transactions are evaluated to determine if their terms transfer all of the risks and rewards of ownership as demonstrated by the absence of any other continuing involvement by the seller-lessee. A sale/leaseback transaction that does not qualify for sale/leaseback accounting because of any form of continuing involvement by the seller-lessee is accounted for as a financing transaction. Under the financing method: (1) the assets and accumulated depreciation remain on the consolidated balance sheet and continue to be depreciated over the remaining useful lives; (2) no gain is recognized; and (3) proceeds received by the Company from these transactions are recorded as a financing obligation. See Note 12 – “Financing Obligations.”
Earnings (Loss) Per Common Share
Earnings (loss) per common share are based upon the weighted average number of common shares outstanding during the respective periods. The Company follows the provisions of the authoritative guidance for determining whether instruments granted in share-based payment transactions are participating securities for purposes of calculating earnings per common share. See Note 5 – “Earnings (Loss) Per Share.”
Stock-Based Compensation
The Company recognizes compensation expense related to stock-based compensation awards in accordance with the related authoritative guidance. See Note 14 – “Stock-Based Compensation.”
F-11
Genesis Healthcare, Inc. and Subsidiaries
Notes to Consolidated Financial Statements
Recent Accounting Pronouncements
In May 2014, the Financial Accounting Standards Board (the FASB) issued ASU No. 2014-09, Revenue from Contracts with Customers, (ASU 2014-09) which changes the requirements for recognizing revenue when entities enter into contracts with customers. Under ASU 2014-09, an entity will recognize revenue when it transfers promised goods or services to customers in an amount that reflects what it expects in exchange for the goods or services. It also requires more detailed disclosures to enable users of financial statements to understand the nature, amount, timing, and uncertainty of revenue and cash flows arising from contracts with customers. The adoption of ASU 2014-09 is effective for annual and interim periods beginning after December 15, 2017 and early adoption is not permitted. The Company is still evaluating the effect, if any, ASU 2014-09 will have on the Company’s consolidated financial condition and results of operations.
In February 2015, the FASB issued ASU 2015-02, Consolidation (Topic 810): Amendments to the Consolidation Analysis (ASU 2015-02), which changes the way reporting enterprises evaluate whether (a) they should consolidate limited partnerships and similar entities, (b) fees paid to a decision maker or service provider are variable interests in a variable interest entity (VIE), and (c) variable interests in a VIE held by related parties of the reporting enterprise require the reporting enterprise to consolidate the VIE. It also eliminates the VIE consolidation model based on majority exposure to variability that applied to certain investment companies and similar entities. The new guidance excludes money market funds that are required to comply with Rule 2a-7 of the Investment Company Act of 1940 and similar entities from the U.S. GAAP consolidation requirements. The adoption of ASU 2015-02 is effective for fiscal years beginning after December 15, 2015, and interim periods within those fiscal years, with early adoption permitted. If adopted in an interim period, this ASU must be reflected as of the beginning of the fiscal year that includes that interim period. The adoption of ASU No. 2015-02 is not expected to have a material impact on the Company’s consolidated financial condition and results of operations.
In April 2015, the FASB issued ASU No. 2015-03, Simplifying the Presentation of Debt Issuance Costs, (ASU 2015-03) and in August 2015 issued ASU No. 2015-15, Presentation and Subsequent Measurement of Debt Issuance Costs Associated with Line-of-Credit Arrangements (ASU 2015-15). ASU 2015-03 requires an entity to present debt issuance costs as a direct deduction from the carrying amount of the related debt liability, consistent with debt discounts. The costs will continue to be amortized to interest expense using the effective interest method. While ASU 2015-03 addresses costs related to term debt, ASU No. 2015-15 provides clarification regarding costs to secure revolving lines of credit, which are, at the outset, not associated with an outstanding borrowing. ASU 2015-15 provides commentary that the SEC staff would not object to an entity deferring and presenting costs associated with line-of-credit arrangements as an asset and subsequently amortizing them ratably over the term of the revolving debt arrangement. The adoption of ASU 2015-03 is effective for fiscal years beginning after December 15, 2015, and interim periods within those fiscal years, with early adoption permitted. This ASU requires retrospective application to all prior periods presented in the financial statements. The adoption of ASU 2015-03 is not expected to have a material impact on the Company’s consolidated financial condition and results of operations.
In September 2015, the FASB issued ASU No. 2015-16, Business Combinations (Topic 805): Simplifying the Accounting for Measurement-Period Adjustments (ASU 2015-16), which eliminates the requirement for an acquirer to retrospectively adjust the financial statements for measurement-period adjustments that occur in periods after a business combination is consummated. The adoption of ASU 2015-16 is effective for fiscal years beginning after December 15, 2015, and interim periods within those fiscal years, with early adoption permitted. The Company is still evaluating the effect, if any, ASU 2015-16 will have on the Company’s consolidated financial condition and results of operations.
In November 2015, the FASB issued ASU No. 2015-17, Income Taxes (Topic 740): Balance Sheet Classification of Deferred Taxes (ASU 2015-17), which changes how deferred taxes are classified on organizations’ balance sheets. ASU 2015-17 eliminates the current requirement for organizations to present deferred tax liabilities and assets as current and noncurrent in a classified balance sheet. Instead, organizations will be required to classify all deferred tax assets and
F-12
Genesis Healthcare, Inc. and Subsidiaries
Notes to Consolidated Financial Statements
liabilities as noncurrent. As permitted by ASU 2015-17, the Company early-adopted this standard and applied it retrospectively to all periods presented. Adoption of ASU 2015-17 resulted in a reclassification of the Company’s current deferred income taxes to noncurrent deferred income taxes in its consolidated balance sheets as of December 31, 2015 and 2014.
In February 2016, the FASB issued amended authoritative guidance on accounting for leases. The new provisions require that a lessee of operating leases recognize a liability to make lease payments (the lease liability) and a right-of-use asset representing its right to use the underlying asset for the lease term. The lease liability will be equal to the present value of lease payments, with the right-of-use asset based upon the lease liability. The classification criteria for distinguishing between finance (or capital) leases and operating leases are substantially similar to the previous lease guidance, but with no explicit bright lines. As such, operating leases will result in straight-line rent expense similar to current practice. For short term leases (term of 12 months or less), a lessee is permitted to make an accounting election not to recognize lease assets and lease liabilities, which would generally result in lease expense being recognized on a straight-line basis over the lease term. The guidance is effective for annual and interim periods beginning after December 15, 2018, and will require application of the new guidance at the beginning of the earliest comparable period presented. Early adoption is permitted. The new standard must be adopted using a modified retrospective transition. The adoption of this standard is expected to have a material impact on the Company’s financial position. The Company is still evaluating the impact on its results of operations and there is no impact on liquidity.
(3)Certain Significant Risks and Uncertainties
Revenue Sources
The Company receives revenues from Medicare, Medicaid, private insurance, self-pay residents, other third-party payors and long-term care facilities that utilize its rehabilitation therapy and other services. The Company’s inpatient services segment derives approximately 79% of its revenue from Medicare and various state Medicaid programs. The following table depicts the Company’s inpatient services segment revenue by source for the years ended December 31, 2015, 2014 and 2013.
|
|
Year ended December 31, |
|
||||
|
|
2015 |
|
2014 |
|
2013 |
|
|
Medicare |
26 |
% |
27 |
% |
28 |
% |
|
Medicaid |
53 |
% |
53 |
% |
52 |
% |
|
Insurance |
11 |
% |
10 |
% |
9 |
% |
|
Private and other |
10 |
% |
10 |
% |
11 |
% |
|
Total |
100 |
% |
100 |
% |
100 |
% |
The sources and amounts of the Company’s revenues are determined by a number of factors, including licensed bed capacity and occupancy rates of inpatient facilities, the mix of patients and the rates of reimbursement among payors. Likewise, payment for ancillary medical services, including services provided by the Company’s rehabilitation therapy services business, varies based upon the type of payor and payment methodologies. Changes in the case mix of the patients as well as payor mix among Medicare, Medicaid and private pay can significantly affect the Company’s profitability.
It is not possible to quantify fully the effect of legislative changes, the interpretation or administration of such legislation or other governmental initiatives on the Company’s business and the business of the customers served by the Company’s rehabilitation therapy business. The potential impact of reforms to the United States healthcare system, including potential material changes to the delivery of healthcare services and the reimbursement paid for such services by the government or other third party payors, is uncertain at this time. Accordingly, there can be no assurance that the impact of any future healthcare legislation or regulation will not adversely affect the Company’s business. There can be no assurance that payments under governmental and private third-party payor programs will be timely, will remain at levels similar to present levels or will, in the future, be sufficient to cover the costs allocable to patients eligible for
F-13
Genesis Healthcare, Inc. and Subsidiaries
Notes to Consolidated Financial Statements
reimbursement pursuant to such programs. The Company’s financial condition and results of operations are and will continue to be affected by the reimbursement process, which in the healthcare industry is complex and can involve lengthy delays between the time that revenue is recognized and the time that reimbursement amounts are settled.
Laws and regulations governing the Medicare and Medicaid programs, and the Company’s business generally, are complex and are often subject to a number of ambiguities in their application and interpretation. The Company believes that it is in substantial compliance with all applicable laws and regulations. However, from time to time the Company and its affiliates are subject to pending or threatened lawsuits and investigations involving allegations of potential wrongdoing, some of which may be material or involve significant costs to resolve and/or defend against, or may lead to other adverse effects on the Company and its affiliates including, but not limited to, fines, penalties and exclusion from participation in the Medicare and/or Medicaid programs. The Company’s business is subject to a number of other known and unknown risks and uncertainties, which are discussed in Item 1A. “Risk Factors.”
(4)Significant Transactions and Events
The Combination with Skilled
On August 18, 2014, Skilled Healthcare Group, Inc., a Delaware corporation (Skilled) entered into a Purchase and Contribution Agreement with FC-GEN Operations Investment, LLC (FC-GEN) pursuant to which the businesses and operations of FC-GEN and Skilled were combined (the Combination). On February 2, 2015, the Combination was completed.
The following diagram depicts the organizational structure of the Company at the time of the Combination:
Upon completion of the Combination, the Company began operating under the name Genesis Healthcare, Inc. and the Class A common stock of the combined company continues to trade on the NYSE under the symbol “GEN.” Upon the closing of the Combination, the former owners of FC-GEN held 74.25% of the economic interests in the combined entity and the former stockholders of Skilled held the remaining 25.75% of the economic interests in the combined entity
F-14
Genesis Healthcare, Inc. and Subsidiaries
Notes to Consolidated Financial Statements
post-transaction, in each case on a fully-diluted, as-exchanged and as-converted basis. Under applicable accounting standards, FC-GEN was the accounting acquirer in the Combination, which was treated as a reverse acquisition. The acquisition method has been applied to the accounts of Skilled based on Skilled’s stock price (level 1 valuation technique – quoted prices in active markets for identical assets or liabilities) as of the acquisition date. The consideration has been allocated to the legacy Skilled business that was acquired on the acquisition date with the excess consideration over the fair value of the net assets acquired recognized as goodwill. As of the effective date of the Combination, FC-GEN’s assets and liabilities remained at their historical costs.
Because FC-GEN’s pre-transaction owners held an approximately 58% direct controlling interest in Skilled and a 74.25% economic and voting interest in the combined company, FC-GEN is considered to be the acquirer of Skilled for accounting purposes. Following the closing of the Combination, the combined results of Skilled and FC-GEN are consolidated with approximately 42% direct noncontrolling economic interest shown as noncontrolling interest in the financial statements of the combined entity. The 42% direct noncontrolling economic interest is in the form of Class A common units of FC-GEN that are exchangeable on a 1 to 1 basis to public shares of the Company. The 42% direct noncontrolling economic interest will continue to decrease as Class A common units of FC-GEN are exchanged for public shares of the Company.
Consideration Price Allocation
The total Skilled consideration price of $348.1 million was allocated to Skilled’s net tangible and identifiable intangible assets based upon the estimated fair values at February 2, 2015. The excess of the consideration price over the estimated fair value of the net tangible and identifiable intangible assets was recorded as goodwill. The allocation of the consideration price to property, plant and equipment, identifiable intangible assets and deferred income taxes was based upon valuation data and estimates. The aggregate goodwill arising from the Combination is based upon the expected future cash flows of the Skilled operations. Goodwill recognized from the Combination is the result of (i) the expected savings to be realized from achieving certain economies of scale and (ii) anticipated long-term improvements in Skilled’s core businesses. The Company has estimated $79.8 million of pre-existing Skilled goodwill that is deductible for income tax purposes related to the Combination.
For the year ended December 31, 2015, the Company incurred transaction costs of $89.2 million, consisting of approximately $31.6 million of accounting, investment banking, legal and other costs associated with the transaction, management incentive compensation charges of $54.6 million, and a $3.0 million transaction advisory fee paid to an
F-15
Genesis Healthcare, Inc. and Subsidiaries
Notes to Consolidated Financial Statements
affiliate of the Company’s sponsors . The Company also incurred $17.8 million of deferred financing fees associated with the debt financing of the Combination.
The consideration price and related allocation are summarized as follows (in thousands):
|
Accounts receivable |
|
$ |
114,032 |
|
|
|
|
Deferred income taxes and other current assets |
|
|
39,586 |
|
|
|
|
Property, plant and equipment |
|
|
488,528 |
|
|
|
|
|
|
|
|
|
Weighted |
|
|
|
|
|
|
|
Average Life |
|
|
Identifiable intangible assets: |
|
|
|
|
(Years) |
|
|
Management contracts |
|
|
30,900 |
|
3.5 |
|
|
Customer relationships |
|
|
13,400 |
|
10.0 |
|
|
Favorable lease contracts |
|
|
18,110 |
|
12.8 |
|
|
Trade names |
|
|
3,400 |
|
Indefinite |
|
|
Total identifiable intangible assets |
|
|
65,810 |
|
|
|
|
Deferred income taxes and other assets |
|
|
76,461 |
|
|
|
|
Accounts payable and other current liabilities |
|
|
(121,479) |
|
|
|
|
Long-term debt, including amounts due within one year |
|
|
(428,453) |
|
|
|
|
Unfavorable lease contracts |
|
|
(11,480) |
|
|
|
|
Deferred income taxes and other long-term liabilities |
|
|
(141,914) |
|
|
|
|
Total identifiable net assets |
|
|
81,091 |
|
|
|
|
Goodwill |
|
|
267,050 |
|
|
|
|
Net assets |
|
$ |
348,141 |
|
|
|
Pro forma information
The acquired business contributed net revenues of $832.0 million and net loss of $10.5 million to the Company for the period from February 1, 2015 to December 31, 2015. The unaudited pro forma net effect of the Combination assuming the acquisition occurred as of January 1, 2013 is as follows (in thousands, except per share amounts):
|
|
|
Year ended December 31, |
|
|||||||
|
|
|
2015 |
|
2014 |
|
2013 |
|
|||
|
Revenues |
|
$ |
5,690,512 |
|
$ |
5,601,336 |
|
$ |
5,552,613 |
|
|
Loss attributable to Genesis Healthcare, Inc. |
|
|
(315,329) |
|
|
(118,071) |
|
|
(81,575) |
|
|
|
|
|
|
|
|
|
|
|
|
|
|
Loss per common share: |
|
|
|
|
|
|
|
|
|
|
|
Basic |
|
$ |
(3.54) |
|
$ |
(1.32) |
|
$ |
(0.91) |
|
|
Diluted |
|
$ |
(3.54) |
|
$ |
(1.51) |
|
$ |
(1.05) |
|
The unaudited pro forma financial data have been derived by combining the historical financial results of the Company and the operations acquired in the Combination for the periods presented. The results of operations include transaction and financing costs totaling $89.2 million incurred by both the Company and Skilled in connection with the Combination. These costs have been eliminated from the results of operations for the year ended December 31, 2015 for purposes of the pro forma financial presentation.
Acquisition from Revera
On June 15, 2015, the Company announced that it had signed an asset purchase agreement with Revera Assisted Living, Inc., a leading owner, operator and investor in the senior living sector, to acquire 24 of its skilled nursing facilities along with its contract rehabilitation business for $240 million. The agreement provided for the acquisition of the real estate and operations of 20 of the skilled nursing facilities and the addition of the facilities to an existing master lease agreement with Welltower Inc. (Welltower), a publicly traded real estate investment trust, to operate the other four additional skilled nursing facilities.
F-16
Genesis Healthcare, Inc. and Subsidiaries
Notes to Consolidated Financial Statements
On December 1, 2015, the Company acquired 19 of the 24 skilled nursing facilities and entered into management agreements to manage the remaining five facilities. Only upon change of ownership approval by the State of Vermont will the Company be able to complete the transaction and acquire the remaining five facilities. The purchase price on December 1, 2015 for the 15 owned and four leased facilities was $206.0 million. The purchase price for the 15 owned facilities was primarily financed through a bridge loan with Welltower of $134.1 million and the Company paid $20.5 million in cash. See Note 10 – “Long-Term Debt – Real Estate Bridge Loans.” The master lease agreement with Welltower was amended to include the four leased facilities resulting in a financing obligation of $54.3 million.
(5)Earnings (Loss) Per Share
The Company has three classes of common stock. Classes A and B are identical in economic and voting interests. Class C has a 1:1 voting ratio with each of the other two classes, representing the voting interests of the approximate 42% noncontrolling interest of the legacy FC-GEN owners. See Note 4 – “Significant Transactions and Events – the Combination with Skilled.” Class C common stock is a participating security; however, it shares in a de minimis economic interest and is therefore excluded from the denominator of the basic earnings (loss) per share (EPS) calculation.
Basic EPS was computed by dividing net loss by the weighted-average number of outstanding common shares for the period. Diluted EPS is computed by dividing loss plus the effect of assumed conversions (if applicable) by the weighted-average number of outstanding shares after giving effect to all potential dilutive common stock, including options, warrants, common stock subject to repurchase and convertible preferred stock, if any.
The computations of basic and diluted EPS are consistent with any potentially dilutive adjustments to the numerator or denominator being anti-dilutive and therefore excluded from the dilutive calculation. A reconciliation of the numerator and denominator used in the calculation of basic and diluted net income per common share follows (in thousands, except per share data):
|
|
|
Year ended December 31, |
|
|||||||
|
|
|
2015 |
|
2014 |
|
2013 |
|
|||
|
Numerator: |
|
|
|
|
|
|
|
|
|
|
|
Loss from continuing operations |
|
$ |
(525,549) |
|
$ |
(237,485) |
|
$ |
(169,606) |
|
|
Less: Net (loss) income attributable to noncontrolling interests |
|
|
(100,573) |
|
|
2,456 |
|
|
1,025 |
|
|
Loss from continuing operations attributable to Genesis Healthcare, Inc. |
|
$ |
(424,976) |
|
$ |
(239,941) |
|
$ |
(170,631) |
|
|
Loss from discontinued operations, net of income tax |
|
|
(1,219) |
|
|
(14,044) |
|
|
(7,364) |
|
|
Net loss attributable to Genesis Healthcare, Inc. |
|
$ |
(426,195) |
|
$ |
(253,985) |
|
$ |
(177,995) |
|
|
Denominator: |
|
|
|
|
|
|
|
|
|
|
|
Weighted average shares outstanding for basic and diluted net loss per share |
|
|
85,755 |
|
|
49,865 |
|
|
49,865 |
|
|
Basic and diluted net loss per common share: |
|
|
|
|
|
|
|
|
|
|
|
Loss from continuing operations attributable to Genesis Healthcare, Inc. |
|
$ |
(4.96) |
|
$ |
(4.81) |
|
$ |
(3.42) |
|
|
Loss from discontinued operations, net of income tax |
|
|
(0.01) |
|
|
(0.28) |
|
|
(0.15) |
|
|
Net loss attributable to Genesis Healthcare, Inc. |
|
$ |
(4.97) |
|
$ |
(5.09) |
|
$ |
(3.57) |
|
The following were excluded from net income attributable to Genesis Healthcare, Inc. and the weighted-average diluted shares computation for the years ended December 31, 2015, 2014 and 2013, as their inclusion would have been anti-dilutive (in thousands):
|
|
|
Year ended December 31, |
|
||||||||
|
|
|
2015 |
|
2014 and 2013 |
|
||||||
|
|
|
Net loss |
|
|
|
Net loss |
|
|
|
||
|
|
|
attributed to |
|
|
|
attributed to |
|
|
|
||
|
|
|
Genesis |
|
Antidilutive |
|
Genesis |
|
Antidilutive |
|
||
|
|
|
Healthcare, Inc. |
|
shares |
|
Healthcare, Inc. |
|
shares |
|
||
|
Exchange of restricted stock units of noncontrolling interests |
|
$ |
(54,761) |
|
58,810 |
|
$ |
— |
|
— |
|
|
Employee and director unvested restricted stock units |
|
|
— |
|
124 |
|
|
— |
|
— |
|
F-17
Genesis Healthcare, Inc. and Subsidiaries
Notes to Consolidated Financial Statements
Because the Company is in a net loss position for the year ended December 31, 2015, the combined impact of the assumed conversion of the approximate 42% noncontrolling interest to common stock and the related tax implications, are anti-dilutive to EPS. As of December 31, 2015, there were 64,449,380 units attributed to the noncontrolling interests outstanding. See Note 4 – “Significant Transactions and Events – the Combination with Skilled.” There were no convertible instruments issued or outstanding as of December 31, 2014 or 2013 that could be potentially dilutive to net loss for that period. On June 3, 2015, the stockholders approved the 2015 Omnibus Equity Incentive Plan, which provided for the grant of 4,116,870 restricted stock units to employees and 178,218 restricted stock units to non-employee directors. On October 26, 2015, an additional 653,130 restricted stock units were granted to employees. Because the Company is in a net loss position for the year ended December 31, 2015, the combined impact of the grant under the 2015 Omnibus Equity Incentive Plan to common stock and the related tax implications are anti-dilutive to EPS.
(6)Segment Information
The Company has three reportable operating segments: (i) inpatient services; (ii) rehabilitation therapy services; and (iii) other services. For additional information on these reportable segments see Note 1 – “General Information – Description of Business.”
F-18
Genesis Healthcare, Inc. and Subsidiaries
Notes to Consolidated Financial Statements
A summary of the Company’s segmented revenues follows:
|
|
|
Year ended December 31, |
|
|
|
|
|
|||||||||
|
|
|
2015 |
|
2014 |
|
Increase / (Decrease) |
|
|||||||||
|
|
|
Revenue |
|
Revenue |
|
Revenue |
|
Revenue |
|
|
|
|
|
|
||
|
|
|
Dollars |
|
Percentage |
|
Dollars |
|
Percentage |
|
Dollars |
|
Percentage |
|
|||
|
|
|
(in thousands, except percentages) |
|
|||||||||||||
|
Revenues: |
|
|
|
|
|
|
|
|
|
|
|
|
|
|
|
|
|
Inpatient services: |
|
|
|
|
|
|
|
|
|
|
|
|
|
|
|
|
|
Skilled nursing facilities |
|
$ |
4,597,671 |
|
81.7 |
% |
$ |
3,924,571 |
|
82.3 |
% |
$ |
673,100 |
|
17.2 |
% |
|
Assisted/Senior living facilities |
|
|
143,321 |
|
2.6 |
% |
|
107,034 |
|
2.2 |
% |
|
36,287 |
|
33.9 |
% |
|
Administration of third party facilities |
|
|
9,488 |
|
0.2 |
% |
|
10,297 |
|
0.2 |
% |
|
(809) |
|
(7.9) |
% |
|
Elimination of administrative services |
|
|
(1,800) |
|
— |
% |
|
(2,089) |
|
— |
% |
|
289 |
|
(13.8) |
% |
|
Inpatient services, net |
|
|
4,748,680 |
|
84.5 |
% |
|
4,039,813 |
|
84.7 |
% |
|
708,867 |
|
17.5 |
% |
|
|
|
|
|
|
|
|
|
|
|
|
|
|
|
|
|
|
|
Rehabilitation therapy services: |
|
|
|
|
|
|
|
|
|
|
|
|
|
|
|
|
|
Total therapy services |
|
|
1,099,130 |
|
19.6 |
% |
|
990,081 |
|
20.8 |
% |
|
109,049 |
|
11.0 |
% |
|
Elimination intersegment rehabilitation therapy services |
|
|
(429,828) |
|
(7.6) |
% |
|
(385,721) |
|
(8.1) |
% |
|
(44,107) |
|
11.4 |
% |
|
Third party rehabilitation therapy services |
|
|
669,302 |
|
11.9 |
% |
|
604,360 |
|
12.7 |
% |
|
64,942 |
|
10.7 |
% |
|
|
|
|
|
|
|
|
|
|
|
|
|
|
|
|
|
|
|
Other services: |
|
|
|
|
|
|
|
|
|
|
|
|
|
|
|
|
|
Total other services |
|
|
240,350 |
|
4.3 |
% |
|
154,011 |
|
3.2 |
% |
|
86,339 |
|
56.1 |
% |
|
Elimination intersegment other services |
|
|
(39,108) |
|
(0.7) |
% |
|
(30,104) |
|
(0.6) |
% |
|
(9,004) |
|
29.9 |
% |
|
Third party other services |
|
|
201,242 |
|
3.6 |
% |
|
123,907 |
|
2.6 |
% |
|
77,335 |
|
62.4 |
% |
|
|
|
|
|
|
|
|
|
|
|
|
|
|
|
|
|
|
|
Net revenue |
|
$ |
5,619,224 |
|
100.0 |
% |
$ |
4,768,080 |
|
100.0 |
% |
$ |
851,144 |
|
17.9 |
% |
|
|
|
Year ended December 31, |
|
|
|
|
|
|||||||||
|
|
|
2014 |
|
2013 |
|
Increase / (Decrease) |
|
|||||||||
|
|
|
Revenue |
|
Revenue |
|
Revenue |
|
Revenue |
|
|
|
|
|
|
||
|
|
|
Dollars |
|
Percentage |
|
Dollars |
|
Percentage |
|
Dollars |
|
Percentage |
|
|||
|
|
|
(in thousands, except percentages) |
|
|||||||||||||
|
Revenues: |
|
|
|
|
|
|
|
|
|
|
|
|
|
|
|
|
|
Inpatient services: |
|
|
|
|
|
|
|
|
|
|
|
|
|
|
|
|
|
Skilled nursing facilities |
|
$ |
3,924,571 |
|
82.3 |
% |
$ |
3,847,857 |
|
81.7 |
% |
$ |
76,714 |
|
2.0 |
% |
|
Assisted/Senior living facilities |
|
|
107,034 |
|
2.2 |
% |
|
113,960 |
|
2.4 |
% |
|
(6,926) |
|
(6.1) |
% |
|
Administration of third party facilities |
|
|
10,297 |
|
0.2 |
% |
|
11,006 |
|
0.2 |
% |
|
(709) |
|
(6.4) |
% |
|
Elimination of administrative services |
|
|
(2,089) |
|
— |
% |
|
(2,146) |
|
— |
% |
|
57 |
|
(2.7) |
% |
|
Inpatient services, net |
|
|
4,039,813 |
|
84.7 |
% |
|
3,970,677 |
|
84.3 |
% |
|
69,136 |
|
1.7 |
% |
|
|
|
|
|
|
|
|
|
|
|
|
|
|
|
|
|
|
|
Rehabilitation therapy services: |
|
|
|
|
|
|
|
|
|
|
|
|
|
|
|
|
|
Total therapy services |
|
|
990,081 |
|
20.8 |
% |
|
993,459 |
|
21.1 |
% |
|
(3,378) |
|
(0.3) |
% |
|
Elimination intersegment rehabilitation therapy services |
|
|
(385,721) |
|
(8.1) |
% |
|
(375,175) |
|
(8.0) |
% |
|
(10,546) |
|
2.8 |
% |
|
Third party rehabilitation therapy services |
|
|
604,360 |
|
12.7 |
% |
|
618,284 |
|
13.1 |
% |
|
(13,924) |
|
(2.3) |
% |
|
|
|
|
|
|
|
|
|
|
|
|
|
|
|
|
|
|
|
Other services: |
|
|
|
|
|
|
|
|
|
|
|
|
|
|
|
|
|
Total other services |
|
|
154,011 |
|
3.2 |
% |
|
141,712 |
|
3.0 |
% |
|
12,299 |
|
8.7 |
% |
|
Elimination intersegment other services |
|
|
(30,104) |
|
(0.6) |
% |
|
(20,332) |
|
(0.4) |
% |
|
(9,772) |
|
48.1 |
% |
|
Third party other services |
|
|
123,907 |
|
2.6 |
% |
|
121,380 |
|
2.6 |
% |
|
2,527 |
|
2.1 |
% |
|
|
|
|
|
|
|
|
|
|
|
|
|
|
|
|
|
|
|
Net revenue |
|
$ |
4,768,080 |
|
100.0 |
% |
$ |
4,710,341 |
|
100.0 |
% |
$ |
57,739 |
|
1.2 |
% |
F-19
Genesis Healthcare, Inc. and Subsidiaries
Notes to Consolidated Financial Statements
A summary of the Company’s condensed consolidated statement of operations follows:
|
|
|
Year ended December 31, 2015 |
|
||||||||||||||||
|
|
|
|
|
|
Rehabilitation |
|
|
|
|
|
|
|
|
|
|
|
|
||
|
|
|
Inpatient |
|
Therapy |
|
Other |
|
|
|
|
|
|
|
|
|
|
|||
|
|
|
Services |
|
Services |
|
Services |
|
Corporate |
|
Eliminations |
|
Consolidated |
|
||||||
|
|
|
(In thousands) |
|
||||||||||||||||
|
Net revenues |
|
$ |
4,750,480 |
|
$ |
1,099,130 |
|
$ |
238,585 |
|
$ |
1,765 |
|
$ |
(470,736) |
|
$ |
5,619,224 |
|
|
Salaries, wages and benefits |
|
|
2,248,197 |
|
|
898,226 |
|
|
143,397 |
|
|
— |
|
|
— |
|
|
3,289,820 |
|
|
Other operating expenses |
|
|
1,684,487 |
|
|
74,210 |
|
|
70,770 |
|
|
— |
|
|
(470,484) |
|
|
1,358,983 |
|
|
General and administrative costs |
|
|
— |
|
|
— |
|
|
— |
|
|
175,889 |
|
|
— |
|
|
175,889 |
|
|
Provision for losses on accounts receivable |
|
|
80,998 |
|
|
17,604 |
|
|
2,704 |
|
|
(785) |
|
|
— |
|
|
100,521 |
|
|
Lease expense |
|
|
146,329 |
|
|
106 |
|
|
2,316 |
|
|
1,779 |
|
|
(254) |
|
|
150,276 |
|
|
Depreciation and amortization expense |
|
|
206,026 |
|
|
12,931 |
|
|
1,227 |
|
|
17,433 |
|
|
— |
|
|
237,617 |
|
|
Interest expense |
|
|
423,393 |
|
|
31 |
|
|
40 |
|
|
84,635 |
|
|
(290) |
|
|
507,809 |
|
|
(Gain) loss on extinguishment of debt |
|
|
(3,104) |
|
|
— |
|
|
— |
|
|
3,234 |
|
|
— |
|
|
130 |
|
|
Investment income |
|
|
(1,568) |
|
|
— |
|
|
— |
|
|
(399) |
|
|
290 |
|
|
(1,677) |
|
|
Other loss (income) |
|
|
1,165 |
|
|
— |
|
|
— |
|
|
(2,565) |
|
|
— |
|
|
(1,400) |
|
|
Transaction costs |
|
|
540 |
|
|
— |
|
|
90 |
|
|
95,744 |
|
|
— |
|
|
96,374 |
|
|
Long-lived asset impairment charges |
|
|
28,546 |
|
|
— |
|
|
— |
|
|
— |
|
|
— |
|
|
28,546 |
|
|
Skilled Healthcare loss contingency expense |
|
|
— |
|
|
— |
|
|
— |
|
|
31,500 |
|
|
— |
|
|
31,500 |
|
|
Equity in net (income) loss of unconsolidated affiliates |
|
|
(2,250) |
|
|
— |
|
|
— |
|
|
(1,681) |
|
|
1,792 |
|
|
(2,139) |
|
|
(Loss) income before income tax expense |
|
|
(62,279) |
|
|
96,022 |
|
|
18,041 |
|
|
(403,019) |
|
|
(1,790) |
|
|
(353,025) |
|
|
Income tax expense |
|
|
— |
|
|
— |
|
|
— |
|
|
172,524 |
|
|
— |
|
|
172,524 |
|
|
(Loss) income from continuing operations |
|
$ |
(62,279) |
|
$ |
96,022 |
|
$ |
18,041 |
|
$ |
(575,543) |
|
$ |
(1,790) |
|
$ |
(525,549) |
|
|
|
|
Year ended December 31, 2014 |
|
||||||||||||||||
|
|
|
|
|
|
Rehabilitation |
|
|
|
|
|
|
|
|
|
|
|
|
||
|
|
|
Inpatient |
|
Therapy |
|
Other |
|
|
|
|
|
|
|
|
|
|
|||
|
|
|
Services |
|
Services |
|
Services |
|
Corporate |
|
Eliminations |
|
Consolidated |
|
||||||
|
|
|
(In thousands) |
|
||||||||||||||||
|
Net revenues |
|
$ |
4,041,902 |
|
$ |
990,081 |
|
$ |
153,397 |
|
$ |
614 |
|
$ |
(417,914) |
|
$ |
4,768,080 |
|
|
Salaries, wages and benefits |
|
|
1,987,550 |
|
|
817,144 |
|
|
99,400 |
|
|
— |
|
|
— |
|
|
2,904,094 |
|
|
Other operating expenses |
|
|
1,417,738 |
|
|
62,032 |
|
|
47,844 |
|
|
— |
|
|
(417,915) |
|
|
1,109,699 |
|
|
General and administrative costs |
|
|
— |
|
|
— |
|
|
— |
|
|
147,063 |
|
|
— |
|
|
147,063 |
|
|
Provision for losses on accounts receivable |
|
|
54,582 |
|
|
16,500 |
|
|
6,618 |
|
|
(30) |
|
|
— |
|
|
77,670 |
|
|
Lease expense |
|
|
130,005 |
|
|
176 |
|
|
821 |
|
|
896 |
|
|
— |
|
|
131,898 |
|
|
Depreciation and amortization expense |
|
|
165,105 |
|
|
11,055 |
|
|
917 |
|
|
16,598 |
|
|
— |
|
|
193,675 |
|
|
Interest expense |
|
|
393,521 |
|
|
4 |
|
|
19 |
|
|
49,678 |
|
|
(498) |
|
|
442,724 |
|
|
Loss on extinguishment of debt |
|
|
— |
|
|
— |
|
|
— |
|
|
1,133 |
|
|
— |
|
|
1,133 |
|
|
Investment income |
|
|
(2,491) |
|
|
— |
|
|
— |
|
|
(1,406) |
|
|
498 |
|
|
(3,399) |
|
|
Other income |
|
|
(47) |
|
|
— |
|
|
(91) |
|
|
— |
|
|
— |
|
|
(138) |
|
|
Transaction costs |
|
|
— |
|
|
— |
|
|
— |
|
|
13,353 |
|
|
— |
|
|
13,353 |
|
|
Long-lived asset impairment charges |
|
|
31,399 |
|
|
— |
|
|
— |
|
|
— |
|
|
— |
|
|
31,399 |
|
|
Equity in net (income) loss of unconsolidated affiliates |
|
|
(1,284) |
|
|
— |
|
|
— |
|
|
— |
|
|
1,700 |
|
|
416 |
|
|
(Loss) income before income tax benefit |
|
|
(134,176) |
|
|
83,170 |
|
|
(2,131) |
|
|
(226,671) |
|
|
(1,699) |
|
|
(281,507) |
|
|
Income tax benefit |
|
|
— |
|
|
— |
|
|
— |
|
|
(44,022) |
|
|
— |
|
|
(44,022) |
|
|
(Loss) income from continuing operations |
|
$ |
(134,176) |
|
$ |
83,170 |
|
$ |
(2,131) |
|
$ |
(182,649) |
|
$ |
(1,699) |
|
$ |
(237,485) |
|
F-20
Genesis Healthcare, Inc. and Subsidiaries
Notes to Consolidated Financial Statements
|
|
|
Year ended December 31, 2013 |
|
||||||||||||||||
|
|
|
|
|
|
Rehabilitation |
|
|
|
|
|
|
|
|
|
|
|
|
||
|
|
|
Inpatient |
|
Therapy |
|
Other |
|
|
|
|
|
|
|
|
|
|
|||
|
|
|
Services |
|
Services |
|
Services |
|
Corporate |
|
Eliminations |
|
Consolidated |
|
||||||
|
|
|
(In thousands) |
|
||||||||||||||||
|
Net revenues |
|
$ |
3,972,823 |
|
$ |
993,459 |
|
$ |
141,712 |
|
$ |
— |
|
$ |
(397,653) |
|
$ |
4,710,341 |
|
|
Salaries, wages and benefits |
|
|
1,977,112 |
|
|
828,406 |
|
|
93,342 |
|
|
— |
|
|
— |
|
|
2,898,860 |
|
|
Other operating expenses |
|
|
1,291,695 |
|
|
74,477 |
|
|
39,390 |
|
|
— |
|
|
(397,653) |
|
|
1,007,909 |
|
|
General and administrative costs |
|
|
— |
|
|
— |
|
|
— |
|
|
152,555 |
|
|
— |
|
|
152,555 |
|
|
Provision for losses on accounts receivable |
|
|
53,287 |
|
|
12,786 |
|
|
3,866 |
|
|
— |
|
|
— |
|
|
69,939 |
|
|
Lease expense |
|
|
129,296 |
|
|
198 |
|
|
843 |
|
|
894 |
|
|
— |
|
|
131,231 |
|
|
Depreciation and amortization expense |
|
|
160,954 |
|
|
10,607 |
|
|
1,027 |
|
|
16,138 |
|
|
— |
|
|
188,726 |
|
|
Interest expense |
|
|
378,461 |
|
|
10 |
|
|
525 |
|
|
48,515 |
|
|
(536) |
|
|
426,975 |
|
|
Loss on extinguishment of debt |
|
|
63 |
|
|
— |
|
|
— |
|
|
— |
|
|
— |
|
|
63 |
|
|
Investment income |
|
|
(3,431) |
|
|
— |
|
|
— |
|
|
(1,255) |
|
|
536 |
|
|
(4,150) |
|
|
Other income |
|
|
— |
|
|
346 |
|
|
— |
|
|
104 |
|
|
— |
|
|
450 |
|
|
Transaction costs |
|
|
— |
|
|
— |
|
|
— |
|
|
5,878 |
|
|
— |
|
|
5,878 |
|
|
Long-lived asset impairment charges |
|
|
9,999 |
|
|
— |
|
|
— |
|
|
— |
|
|
— |
|
|
9,999 |
|
|
Equity in net (income) loss of unconsolidated affiliates |
|
|
(2,067) |
|
|
— |
|
|
— |
|
|
1,066 |
|
|
1,692 |
|
|
691 |
|
|
(Loss) income before income tax benefit |
|
|
(22,546) |
|
|
66,629 |
|
|
2,719 |
|
|
(223,895) |
|
|
(1,692) |
|
|
(178,785) |
|
|
Income tax benefit |
|
|
— |
|
|
— |
|
|
— |
|
|
(9,179) |
|
|
— |
|
|
(9,179) |
|
|
(Loss) income from continuing operations |
|
$ |
(22,546) |
|
$ |
66,629 |
|
$ |
2,719 |
|
$ |
(214,716) |
|
$ |
(1,692) |
|
$ |
(169,606) |
|
The following table presents the segment assets as of December 31, 2015 compared to December 31, 2014 (in thousands):
|
|
|
December 31, 2015 |
|
December 31, 2014 |
|
||
|
Inpatient services |
|
$ |
5,439,088 |
|
$ |
4,381,044 |
|
|
Rehabilitation services |
|
|
442,969 |
|
|
322,268 |
|
|
Other services |
|
|
91,775 |
|
|
44,814 |
|
|
Corporate and eliminations |
|
|
117,638 |
|
|
393,282 |
|
|
Total assets |
|
$ |
6,091,470 |
|
$ |
5,141,408 |
|
The following table presents segment goodwill as of December 31, 2015 compared to December 31, 2014 (in thousands):
|
|
|
December 31, 2015 |
|
December 31, 2014 |
|
||
|
Inpatient services |
|
$ |
357,649 |
|
$ |
132,756 |
|
|
Rehabilitation services |
|
|
73,098 |
|
|
25,097 |
|
|
Other services |
|
|
39,272 |
|
|
11,828 |
|
|
Total goodwill |
|
$ |
470,019 |
|
$ |
169,681 |
|
(7)Restricted Cash and Investments in Marketable Securities
The current portion of restricted cash and investments in marketable securities principally represents an estimate of the level of outstanding self-insured losses the Company expects to pay in the succeeding year through its wholly owned captive insurance company. See Note 20 – “Commitments and Contingencies – Loss Reserves For Certain Self-Insured Programs.”
F-21
Genesis Healthcare, Inc. and Subsidiaries
Notes to Consolidated Financial Statements
Restricted cash and investments in marketable securities at December 31, 2015 consist of the following (in thousands):
|
|
|
|
|
|
|
|
|
Unrealized losses |
|
|
|
||||
|
|
|
Amortized |
|
Unrealized |
|
Less than |
|
Greater than |
|
|
|
||||
|
|
|
cost |
|
gains |
|
12 months |
|
12 months |
|
Fair value |
|||||
|
Restricted cash and equivalents: |
|
|
|
|
|
|
|
|
|
|
|
|
|
|
|
|
Cash |
|
$ |
33,698 |
|
$ |
— |
|
$ |
— |
|
$ |
— |
|
$ |
33,698 |
|
Money market funds |
|
|
672 |
|
|
— |
|
|
— |
|
|
— |
|
|
672 |
|
Restricted investments in marketable securities: |
|
|
|
|
|
|
|
|
|
|
|
|
|
|
|
|
Mortgage/government backed securities |
|
|
13,251 |
|
|
— |
|
|
— |
|
|
(49) |
|
|
13,202 |
|
Corporate bonds |
|
|
82,912 |
|
|
138 |
|
|
(117) |
|
|
(350) |
|
|
82,583 |
|
Government bonds |
|
|
67,549 |
|
|
708 |
|
|
(197) |
|
|
(88) |
|
|
67,972 |
|
|
|
$ |
198,082 |
|
$ |
846 |
|
$ |
(314) |
|
$ |
(487) |
|
|
198,127 |
|
Less: Current portion of restricted investments |
|
|
|
|
|
|
|
|
|
|
|
|
|
|
(52,917) |
|
Long-term restricted investments |
|
|
|
|
|
|
|
|
|
|
|
|
|
$ |
145,210 |
Restricted cash and investments in marketable securities at December 31, 2014 consist of the following (in thousands):
|
|
|
|
|
|
|
|
|
Unrealized losses |
|
|
|
||||
|
|
|
Amortized |
|
Unrealized |
|
Less than |
|
Greater than |
|
|
|
||||
|
|
|
cost |
|
gains |
|
12 months |
|
12 months |
|
Fair value |
|||||
|
Restricted cash and equivalents: |
|
|
|
|
|
|
|
|
|
|
|
|
|
|
|
|
Cash |
|
$ |
35,791 |
|
$ |
— |
|
$ |
— |
|
$ |
— |
|
$ |
35,791 |
|
Money market funds |
|
|
599 |
|
|
— |
|
|
— |
|
|
— |
|
|
599 |
|
Restricted investments in marketable securities: |
|
|
|
|
|
|
|
|
|
|
|
|
|
|
|
|
Mortgage/government backed securities |
|
|
8,499 |
|
|
— |
|
|
(27) |
|
|
— |
|
|
8,472 |
|
Corporate bonds |
|
|
38,704 |
|
|
238 |
|
|
(4) |
|
|
(60) |
|
|
38,878 |
|
Government bonds |
|
|
62,246 |
|
|
997 |
|
|
(19) |
|
|
(224) |
|
|
63,000 |
|
|
|
$ |
145,839 |
|
$ |
1,235 |
|
$ |
(50) |
|
$ |
(284) |
|
|
146,740 |
|
Less: Current portion of restricted investments |
|
|
|
|
|
|
|
|
|
|
|
|
|
|
(38,211) |
|
Long-term restricted investments |
|
|
|
|
|
|
|
|
|
|
|
|
|
$ |
108,529 |
Maturities of restricted investments yielded proceeds of $26.2 million, $22.9 million and $23.5 million for the years ended December 31, 2015, 2014 and 2013, respectively.
Sales of investments yielded proceeds of $15.1 million, $7.3 million and $2.7 million for the years ended December 31, 2015, 2014 and 2013, respectively. Associated gross realized gain and (loss) for the year ended December 31, 2015 were $0.1 million and $(0.8) million, respectively. Associated gross realized gain and (loss) for the year ended December 31, 2014 were $0.8 million and $(0.3) million, respectively. Associated gross realized gain and (loss) for the year ended December 31, 2013 were $1.7 million and $(0.4) million, respectively.
The majority of the Company’s investments are investment grade government and corporate debt securities that have maturities of five years or less, and the Company has both the ability and intent to hold the investments until maturity.
F-22
Genesis Healthcare, Inc. and Subsidiaries
Notes to Consolidated Financial Statements
Restricted investments in marketable securities held at December 31, 2015 mature as follows (in thousands):
|
|
|
Amortized |
|
Fair |
||
|
|
|
cost |
|
value |
||
|
Due in one year or less |
|
$ |
46,036 |
|
$ |
45,942 |
|
Due after 1 year through 5 years |
|
|
114,491 |
|
|
114,807 |
|
Due after 5 years through 10 years |
|
|
3,185 |
|
|
3,008 |
|
|
|
$ |
163,712 |
|
$ |
163,757 |
Actual maturities may differ from stated maturities because borrowers may have the right to call or prepay certain obligations and may exercise that right with or without prepayment penalties.
The Company has issued letters of credit totaling $127.1 million at December 31, 2015 to its third party administrators and the Company’s excess insurance carriers. Restricted cash of $14.1 million and restricted investments with an amortized cost of $141.5 million and a market value of $141.2 million are pledged as security for these letters of credit as of December 31, 2015.
(8)Property and Equipment
Property and equipment consisted of the following as of December 31, 2015 and December 31, 2014 (in thousands):
|
|
|
December 31, 2015 |
|
December 31, 2014 |
|
||
|
Land, buildings and improvements |
|
$ |
714,766 |
|
$ |
225,536 |
|
|
Capital lease land, buildings and improvements |
|
|
903,977 |
|
|
910,820 |
|
|
Financing obligation land, buildings and improvements |
|
|
2,644,307 |
|
|
2,526,792 |
|
|
Equipment, furniture and fixtures |
|
|
436,300 |
|
|
276,983 |
|
|
Construction in progress |
|
|
24,665 |
|
|
55,295 |
|
|
Gross property and equipment |
|
|
4,724,015 |
|
|
3,995,426 |
|
|
Less: accumulated depreciation |
|
|
(638,768) |
|
|
(502,176) |
|
|
Net property and equipment |
|
$ |
4,085,247 |
|
$ |
3,493,250 |
|
(9)Goodwill and Identifiable Intangible Assets
The changes in the carrying value of goodwill are as follows (in thousands):
|
|
|
Total |
|
|
Balance at December 31, 2013 |
|
$ |
169,681 |
|
|
|
|
|
|
Balance at December 31, 2014 |
|
$ |
169,681 |
|
|
|
|
|
|
Skilled Combination |
|
|
267,050 |
|
Acquisition from Revera |
|
|
32,452 |
|
Other goodwill additions |
|
|
836 |
|
Balance at December 31, 2015 |
|
$ |
470,019 |
The Company has no accumulated amortization of goodwill.
Goodwill is an asset representing the future economic benefits arising from other assets acquired in a business combination that are not individually identified and separately recognized.
F-23
Genesis Healthcare, Inc. and Subsidiaries
Notes to Consolidated Financial Statements
Identifiable intangible assets consist of the following at December 31, 2015 and 2014 (in thousands):
|
|
|
|
|
|
Weighted |
|
|
|
|
|
|
Average |
|
|
|
|
|
|
Remaining |
|
|
|
2015 |
|
Life (Years) |
|
|
Customer relationship assets, net of accumulated amortization of $34,336 |
|
$ |
78,493 |
|
10 |
|
Management contracts, net of accumulated amortization of $8,093 |
|
|
22,807 |
|
3 |
|
Favorable leases, net of accumulated amortization of $24,141 |
|
|
54,711 |
|
10 |
|
Trade names |
|
|
53,956 |
|
Indefinite |
|
Identifiable intangible assets |
|
$ |
209,967 |
|
7 |
|
|
|
|
|
|
Weighted |
|
|
|
|
|
|
Average |
|
|
|
|
|
|
Remaining |
|
|
|
2014 |
|
Life (Years) |
|
|
Customer relationship assets, net of accumulated amortization of $24,039 |
|
$ |
74,765 |
|
10 |
|
Favorable leases, net of accumulated amortization of $18,622 |
|
|
47,791 |
|
9 |
|
Trade names |
|
|
50,556 |
|
Indefinite |
|
Identifiable intangible assets |
|
$ |
173,112 |
|
10 |
Acquisition-related identified intangible assets consist of customer relationship assets, management contracts, favorable lease contracts and trade names.
Customer relationship assets exist in the Company’s rehabilitation services, respiratory services, management services and medical staffing businesses. These assets are amortized on a straight-line basis over the expected period of benefit.
Management contracts are derived through the organization of facilities under an upper payment limit supplemental payment program in Texas that provides supplemental Medicaid payments with federal matching funds for skilled nursing facilities that are affiliated with county-owned hospital districts. Under this program, the Company acts as the manager of the facilities and shares in these supplemental payments with the county hospitals. These assets are amortized on a straight-line basis over the management contract life.
Favorable lease contracts represent the estimated value of future cash outflows of operating lease contracts compared to lease rates that could be negotiated in an arms-length transaction at the time of measurement. Favorable lease contracts are amortized on a straight-line basis over the lease terms.
The Company’s trade names have value, in particular in the rehabilitation business which markets its services to other providers of skilled nursing and assisted/senior living services. The trade name asset has an indefinite life and is measured no less than annually or if indicators of potential impairment become apparent.
Amortization expense from continuing operations related to customer relationship assets, which is included in depreciation and amortization expense, for the years ended December 31, 2015, 2014 and 2013 was $10.3 million, $9.1 million and $9.1 million, respectively.
Amortization expense from continuing operations related to management contracts, which is included in depreciation and amortization expense, for the years ended December 31, 2015, 2014 and 2013 was $8.1 million, $0.0 million and $0.0 million, respectively.
Amortization expense from continuing operations related to favorable leases, which is included in lease expense, for the years ended December 31, 2015, 2014 and 2013 was $8.4 million, $9.3 million and $9.7 million, respectively.
F-24
Genesis Healthcare, Inc. and Subsidiaries
Notes to Consolidated Financial Statements
Based upon amounts recorded at December 31, 2015, total estimated amortization expense of identifiable intangible assets will be $27.6 million in 2016, $27.2 million in 2017, $23.0 million in 2018, $17.5 million in 2019, and $12.1 million in 2020 and $48.6 million, thereafter.
Asset impairment charges of $1.8 million and $3.0 million were recognized on favorable lease assets in the years ended December 31, 2015 and 2014 associated with the write-down of underperforming properties. No asset impairment charges were recognized in the year ended December 31, 2013. See Note 18 – “Asset Impairment Charges – Long-Lived Assets with a Definite Useful Life.”
(10)Long-Term Debt
Long-term debt at December 31, 2015 and 2014 consisted of the following (in thousands):
|
|
|
December 31, |
|
December 31, |
|
||
|
|
|
2015 |
|
2014 |
|
||
|
Revolving credit facility |
|
$ |
363,000 |
|
$ |
254,500 |
|
|
Term loan facility, net of original issue discount of $7,475 at December 31, 2015 and $11,375 at December 31, 2014 |
|
|
220,971 |
|
|
219,297 |
|
|
Real estate bridge loans |
|
|
494,100 |
|
|
— |
|
|
HUD insured loans |
|
|
107,645 |
|
|
— |
|
|
Mortgages and other secured debt (recourse) |
|
|
13,934 |
|
|
14,488 |
|
|
Mortgages and other secured debt (non-recourse) |
|
|
30,507 |
|
|
49,961 |
|
|
|
|
|
1,230,157 |
|
|
538,246 |
|
|
Less: Current installments of long-term debt |
|
|
(12,477) |
|
|
(12,518) |
|
|
Long-term debt |
|
$ |
1,217,680 |
|
$ |
525,728 |
|
Revolving Credit Facilities
In connection with the Combination, on February 2, 2015 the Company entered into new revolving credit facilities and terminated its former revolving credit facilities. The new revolving credit facilities (the Revolving Credit Facilities) consist of a senior secured, asset-based revolving credit facility of up to $550 million under three separate tranches: Tranche A-1, Tranche A-2 and FILO Tranche. Interest accrues at a per annum rate equal to either (x) a base rate (calculated as the highest of the (i) prime rate, (ii) the federal funds rate plus 3.00%, or (iii) LIBOR plus the excess of the applicable margin between LIBOR loans and base rate loans) plus an applicable margin or (y) LIBOR plus an applicable margin. The applicable margin is based on the level of commitments for all three tranches, and in regards to LIBOR loans (i) for Tranche A-1 ranges from 3.25% to 2.75%; (ii) for Tranche A-2 ranges from 3.00% to 2.50%; and (iii) for FILO Tranche is 5.00%. The Revolving Credit Facilities mature on February 2, 2020, provided that if the Term Loan Facility (defined below) or the Real Estate Bridge Loans (defined below) is not refinanced with longer term debt or their terms not extended prior to their current maturities of December 4, 2017 and August 27, 2017, respectively, the Revolving Credit Facilities will mature 90 days prior to such maturity date, as applicable. Borrowing levels under the Revolving Credit Facilities are limited to a borrowing base that is computed based upon the level of the Company’s eligible accounts receivable, as defined therein. In addition to paying interest on the outstanding principal borrowed under the Revolving Credit Facilities, the Company is required to pay a commitment fee to the lenders for any unutilized commitments. The commitment fee rate ranges from 0.375% per annum to 0.50% depending upon the level of unused commitment.
F-25
Genesis Healthcare, Inc. and Subsidiaries
Notes to Consolidated Financial Statements
Borrowings and interest rates under the three tranches were as follows at December 31, 2015 (dollars in thousands):
|
|
|
|
|
|
Weighted |
|
|
|
|
|
|
|
Average |
|
|
Revolving credit facility |
|
Borrowings |
|
Interest |
|
|
|
FILO tranche |
|
$ |
25,000 |
|
5.51 |
% |
|
Tranche A-1 |
|
|
263,000 |
|
3.92 |
% |
|
Tranche A-2 |
|
|
75,000 |
|
3.36 |
% |
|
|
|
$ |
363,000 |
|
3.91 |
% |
As of December 31, 2015, the Company had outstanding borrowings under the Revolving Credit Facilities of $363.0 million and had $66.9 million of drawn letters of credit securing insurance and lease obligations, leaving the Company with approximately $117.0 million of available borrowing capacity under the revolving credit facilities.
Term Loan Facility
Prior to the Combination, FC-GEN and certain of its subsidiaries became party to a five-year term loan facility (the Term Loan Facility). The Term Loan Facility is secured by a first priority lien on the membership interests in FC-GEN and on substantially all of the Company’s and its subsidiaries’ assets other than collateral held on a first priority basis by the Revolving Credit Facilities lender. Borrowings under the Term Loan Facility bear interest at a rate per annum equal to the applicable margin plus, at the Company’s option, either (x) LIBOR or (y) a base rate determined by reference to the highest of (i) the lender defined prime rate, (ii) the federal funds rate effective plus one half of one percent and (iii) LIBOR described in subclause (x) plus 1.0%. LIBOR based loans are subject to an interest rate floor of 1.5% and base rate loans are subject to a floor of 2.5%. The Term Loan Facility matures on December 4, 2017. On September 25, 2014, FC-GEN entered into an amendment to the Term Loan Facility providing for changes to the financial covenants and other provisions allowing for and accommodating the Combination. On February 2, 2015, the amendment to the Term Loan Facility became effective. The Term Loan Facility currently has an outstanding principal balance of $228.4 million. Base rate borrowings under the Term Loan Facility bore interest of approximately 11.00% at December 31, 2015. One-month LIBOR borrowings under the Term Loan Facility bore interest of approximately 10.0% at December 31, 2015.
Principal payments for the year ended December 31, 2015 were $2.2 million. The Term Loan Facility amortizes at a rate of 5% per annum. The lenders have the right to elect ratable principal payments or defer principal recoupment until the end of the term.
Real Estate Bridge Loans
In connection with the Combination on February 2, 2015, the Company entered into a $360.0 million real estate bridge loan (the Skilled Real Estate Bridge Loan), which is secured by a mortgage lien on the real property of 67 facilities and a second lien on certain receivables of the operators of such facilities. The Skilled Real Estate Bridge Loan is subject to a 24-month term with two extension options of 90-days each and accrues interest at a rate equal to LIBOR, plus 6.75%, plus an additional margin that ranges up to 7.00% based on the aggregate number of days the Skilled Real Estate Bridge Loan is outstanding. The interest rate is also subject to a LIBOR interest rate floor of 0.5%. The Skilled Real Estate Bridge Loan bore interest of 9.75% at December 31, 2015. The Skilled Real Estate Bridge Loan is subject to payments of interest only during the term with a balloon payment due at maturity, provided, that to the extent the subsidiaries receive any net proceeds from the sale and / or refinance of the underlying facilities such net proceeds are required to be used to repay the outstanding principal balance of the Skilled Real Estate Bridge Loan. The proceeds of the Skilled Real Estate Bridge Loan were used to repay Skilled’s first lien senior secured term loan, repay Skilled’s mortgage loans and asset based revolving credit facility with MidCap Financial with excess proceeds used to fund direct costs of the Combination with the Company. The Skilled Real Estate Bridge Loan has an outstanding principal balance of $360.0 million at December 31, 2015.
In connection with the acquisition of Revera on December 1, 2015, the Company entered into a $134.1 million real estate bridge loan (the Revera Real Estate Bridge Loan), which is secured by a mortgage lien on the real property of 15
F-26
Genesis Healthcare, Inc. and Subsidiaries
Notes to Consolidated Financial Statements
facilities and a second lien on certain receivables of the operators of such facilities. The Revera Real Estate Bridge Loan is subject to a 24-month term with two extension options of 90-days each and accrues interest at a rate equal to LIBOR, plus 6.75%, plus an additional margin that ranges up to 7.00% based on the aggregate number of days the Revera Real Estate Bridge Loan is outstanding, plus 0.25% multiplied by the result of dividing the number of percentage points by which the loan-to-value ratio, defined as the ratio, expressed as a percentage, of (i) the outstanding principal balance to (ii) the total appraised value of the facilities as of the closing date, exceeds 75% by five. The interest rate is also subject to a LIBOR interest rate floor of 0.5%. The Revera Real Estate Bridge Loan bore interest of 8.00% at December 31, 2015. The Revera Real Estate Bridge Loan is subject to payments of interest only during the term with a balloon payment due at maturity, provided, that to the extent the subsidiaries receive any net proceeds from the sale and / or refinance of the underlying facilities such net proceeds are required to be used to repay the outstanding principal balance of the Revera Real Estate Bridge Loan. The proceeds of the Revera Real Estate Bridge Loan were used to finance the acquisition of 15 Revera facilities. The Revera Real Estate Bridge Loan has an outstanding principal balance of $134.1 million at December 31, 2015.
The Revolving Credit Facilities, the Term Loan, the Skilled Real Estate Bridge Loan and the Revera Real Estate Bridge Loan (collectively, the Credit Facilities) each contain a number of restrictive covenants that, among other things, impose operating and financial restrictions on the Company and its subsidiaries. The Credit Facilities also require the Company to meet defined financial covenants, including interest coverage ratio, a maximum consolidated net leverage ratio and a minimum consolidated fixed charge coverage ratio, all as defined in the applicable agreements. The Credit Facilities also contain other customary covenants, events of default and cross default. At December 31, 2015, the Company was in compliance with its covenants.
HUD Insured Loans
In connection with the Combination on February 2, 2015, the Company assumed certain obligations under 10 loans insured by the U.S. Department of Housing and Urban Development (HUD). The loans are secured by 10 of the Company’s skilled nursing facilities that were acquired in the Combination. The HUD insured loans have an original amortization term of 30 to 35 years. On May 1, 2015, the Company acquired a facility in Texas and assumed its HUD insured loan totaling $8.4 million with a maturity date of January 1, 2049. As of December 31, 2015 the HUD insured loans have a combined aggregate principal balance of $107.6 million including a $14.5 million debt premium established in purchase accounting in connection with the Combination.
These mortgages have an average remaining term of 31 years with fixed interest rates ranging from 3.4% to 4.6% and a weighted average interest rate of 4.3%. Depending on the mortgage agreement, prepayments are generally allowed only after 12 months from the inception of the mortgage. Prepayments are subject to a penalty of 10% of the remaining principal balances in the first year and the prepayment penalty decreases each subsequent year by 1% until no penalty is required. Any further HUD insured mortgages will require additional HUD approval.
All HUD-insured mortgages are non-recourse loans to the Company. All mortgages are subject to HUD regulatory agreements that require escrow reserve funds to be deposited with the loan servicer for mortgage insurance premiums, property taxes, insurance and for capital replacement expenditures. As of December 31, 2015, the Company has total escrow reserve funds of $7.2 million with the loan servicer that are reported within prepaid expenses.
Other Debt
Mortgages and other secured debt (recourse). The Company carries mortgage loans and notes payable on certain of its corporate office buildings and other acquired assets. The loans are secured by the underlying real property and have fixed or variable rates of interest ranging from 1.9% to 6.0% at December 31, 2015, with maturity dates ranging from 2018 to 2020.
Mortgages and other secured debt (non-recourse). Loans are carried by certain of the Company’s consolidated joint ventures. The loans consist principally of revenue bonds and secured bank loans. Loans are secured by the underlying real and personal property of individual facilities and have fixed or variable rates of interest ranging from 2.5% to 22.2%
F-27
Genesis Healthcare, Inc. and Subsidiaries
Notes to Consolidated Financial Statements
at December 31, 2015, with maturity dates ranging from 2018 to 2034. Loans are labeled “non-recourse” because neither the Company nor any of its wholly owned subsidiaries is obligated to perform under the respective loan agreements.
The maturity of total debt of $1,230.2 million at December 31, 2015 is as follows (in thousands):
|
Years ending December 31, |
|
|
|
|
2016 |
|
$ |
12,477 |
|
2017 |
|
|
710,524 |
|
2018 |
|
|
25,021 |
|
2019 |
|
|
3,898 |
|
2020 |
|
|
367,284 |
|
Thereafter |
|
|
110,953 |
|
Total debt maturity |
|
$ |
1,230,157 |
(11)Leases and Lease Commitments
The Company leases certain facilities under capital and operating leases. Future minimum payments for the next five years and thereafter under such leases at December 31, 2015 are as follows (in thousands):
|
Years ending December 31, |
|
Capital Leases |
|
Operating Leases |
|
||
|
2016 |
|
$ |
93,656 |
|
$ |
140,598 |
|
|
2017 |
|
|
99,261 |
|
|
137,486 |
|
|
2018 |
|
|
96,985 |
|
|
133,785 |
|
|
2019 |
|
|
99,425 |
|
|
130,281 |
|
|
2020 |
|
|
101,930 |
|
|
130,980 |
|
|
Thereafter |
|
|
3,368,926 |
|
|
258,522 |
|
|
Total future minimum lease payments |
|
|
3,860,183 |
|
$ |
931,652 |
|
|
Less amount representing interest |
|
|
(2,804,525) |
|
|
|
|
|
Capital lease obligation |
|
|
1,055,658 |
|
|
|
|
|
Less current portion |
|
|
(1,842) |
|
|
|
|
|
Long-term capital lease obligation |
|
$ |
1,053,816 |
|
|
|
|
Capital Lease Obligations
The capital lease obligations represent the present value of minimum lease payments under such capital lease and cease use arrangements and bear imputed interest at rates ranging from 3.5% to 12.8% at December 31, 2015, and mature at dates ranging from 2016 to 2047.
Deferred Lease Balances
At December 31, 2015 and December 31, 2014, the Company had $54.7 million and $47.8 million, respectively, of favorable leases net of accumulated amortization, included in identifiable intangible assets, and $35.5 million and $31.4 million, respectively, of unfavorable leases net of accumulated amortization included in other long-term liabilities on the consolidated balance sheet. Favorable and unfavorable lease assets and liabilities, respectively, arise through the acquisition of leases in place which requires those contracts be recorded at their then fair value. The fair value of a lease is determined through a comparison of the actual rental rate with rental rates prevalent for similar assets in similar markets. A favorable lease asset to the Company represents a rental stream that is below market, and conversely an unfavorable lease is one with cost above market rates. These assets and liabilities amortize as lease expense over the remaining term of the respective leases on a straight-line basis. At December 31, 2015 and December 31, 2014, the Company had $27.3 million and $20.6 million, respectively, of deferred straight-line rent balances included in other long-term liabilities on the consolidated balance sheet.
F-28
Genesis Healthcare, Inc. and Subsidiaries
Notes to Consolidated Financial Statements
Lease Covenants
Certain lease agreements contain a number of restrictive covenants that, among other things and subject to certain exceptions, impose operating and financial restrictions on the Company and its subsidiaries. These leases also require the Company to meet defined financial covenants, including a minimum level of consolidated liquidity, a maximum consolidated net leverage ratio, a minimum consolidated fixed charge coverage and a minimum level of tangible net worth. At December 31, 2015, the Company was in compliance with its covenants under its lease arrangements.
In connection with the Combination on February 2, 2015, the Company and certain of its lessors amended the existing lease agreements. These amendments modified certain financial covenants to reflect the combined company. On March 10, 2016, the Company and certain of its lessors amended several of the financial covenants contained within their existing lease agreements. The most significant amendment eliminates the minimum tangible net worth requirement effective January 1, 2016. Other amendments reduced certain coverage ratio requirements or clarified the definitions of amounts to be included in specific calculations to accommodate recent acquisitions.
(12)Financing Obligations
Financing obligations represent the present value of minimum lease payments under such lease arrangements and bear imputed interest at rates ranging from 1.2% to 27.8% at December 31, 2015, and mature at dates ranging from 2021 to 2043.
Future minimum payments for the next five years and thereafter under leases classified as financing obligations at December 31, 2015 are as follows (in thousands):
|
Years ending December 31, |
|
|
|
|
|
2016 |
|
$ |
274,643 |
|
|
2017 |
|
|
282,763 |
|
|
2018 |
|
|
290,846 |
|
|
2019 |
|
|
299,162 |
|
|
2020 |
|
|
307,710 |
|
|
Thereafter |
|
|
9,900,894 |
|
|
Total future minimum lease payments |
|
|
11,356,018 |
|
|
Less amount representing interest |
|
|
(8,290,952) |
|
|
Financing obligations |
|
$ |
3,065,066 |
|
|
Less current portion |
|
|
(989) |
|
|
Long-term financing obligations |
|
$ |
3,064,077 |
|
(13)Stockholders’ Equity (Deficit)
The total number of shares of all classes of stock that the Company shall have authority to issue is 1,200,000,000 consisting of:
|
· |
1,000,000,000 shares of Class A common stock, par value $0.001 per share, of which 73,593,732 shares and 49,864,878 shares were issued at December 31, 2015 and December 31, 2014, respectively; |
|
· |
20,000,000 shares of Class B common stock, par value $0.001 per share, of which 15,511,603 shares and 0 shares were issued at December 31, 2015 and December 31, 2014, respectively; |
|
· |
150,000,000 shares of Class C common stock, par value $0.001 per share, of which 64,449,380 shares and 0 shares were issued at December 31, 2015 and December 31, 2014, respectively; and |
|
· |
30,000,000 shares of Preferred Stock, par value $0.001 per share, of which 0 shares were issued at December 31, 2015 and December 31, 2014, respectively. |
F-29
Genesis Healthcare, Inc. and Subsidiaries
Notes to Consolidated Financial Statements
Capital Transactions with Stockholders and Noncontrolling Interests
During the years ended December 31, 2015, 2014 and 2013, the Company distributed $7.0 million, $18.0 million and $5.3 million, respectively, to the stockholders and noncontrolling interests. These distributions represent tax payments made by the Company on the behalf of FC-GEN members.
(14)Stock-Based Compensation
The Company provides stock-based compensation to attract and retain employees while also aligning employees’ interests with the interests of its shareholders. The Genesis Healthcare, Inc. 2015 Omnibus Equity Incentive Plan (the 2015 Plan), which was approved by the Company’s shareholders in June 2015, provides that the Company may grant various cash-based and equity-based awards to key employees and directors.
Restricted Stock Units (RSUs) and Performance Stock Units (PSUs)
During 2015, the Company granted RSUs and PSUs under the 2015 Plan, which are subject to vesting and other requirements as determined at the time of grant. These awards represent an obligation to deliver to the holder one share of the Company’s Class A Common Stock upon vesting. The fair value of stock-based award grants is amortized to expense over the vesting period, which is generally 3 years.
RSUs are subject to service-based vesting criteria and generally vest in equal installments on each of the first three anniversaries from the date of grant. The fair value of RSUs is measured at the market price of the Company’s stock on the date of grant.
PSUs are subject to service-based and market-based vesting criteria. Generally, these units vest on the third anniversary of the date of grant only if and to the extent certain market performance conditions are met. The fair value of PSUs subject to market-based vesting criteria is measured at the market price of the Company’s stock on the date prior to the grant date using the Monte-Carlo simulation option-pricing model. This model incorporates into the fair value determination the possibility that the market condition may not be satisfied. Compensation costs related to these awards are recognized regardless of whether the market condition is satisfied, provided that the requisite service has been provided.
The Company’s Monte-Carlo fair value assumptions are as follows:
|
|
|
|
December 31, 2015 |
|
|
Expected term, in years |
|
|
1.2 |
|
|
Risk-free interest rate |
|
|
1% |
|
|
Volatility |
|
|
45% - 55% |
|
|
Dividends |
|
|
N/A |
|
During the year ended December 31, 2015, the following activity occurred with respect to RSUs and PSUs under the 2015 plan (number of shares in thousands):
|
|
|
Number of Shares |
|
Weighted-Average Grant Date Fair Value |
||||||||
|
|
|
RSU |
|
PSU |
|
RSU |
|
PSU |
||||
|
Non-vested balance at January 1, 2015 |
|
|
— |
|
|
— |
|
$ |
— |
|
$ |
— |
|
Granted |
|
|
3,196 |
|
|
1,752 |
|
|
6.01 |
|
|
3.34 |
|
Vested |
|
|
(2) |
|
|
— |
|
|
6.12 |
|
|
— |
|
Forfeited |
|
|
(151) |
|
|
(50) |
|
|
6.04 |
|
|
3.31 |
|
Non-vested balance at December 31, 2015 |
|
|
3,043 |
|
|
1,702 |
|
$ |
6.01 |
|
$ |
3.34 |
F-30
Genesis Healthcare, Inc. and Subsidiaries
Notes to Consolidated Financial Statements
As of December 31, 2015, there were approximately $19.4 million of total unrecognized compensation costs related to unvested stock based compensation, which are expected to be recognized over a weighted average term of 2.41 years. During 2015, the fair value of stock-based compensation that vested was less than $0.1 million. At December 31, 2015, a total of 16.5 million shares of the Company’s Class A Common Stock are available for delivery under the 2015 Plan.
The amount of compensation costs related to RSUs and PSUs included in general and administrative costs was $4.7 million for the year ended December 31, 2015.
(15)Income Taxes
The Company’s provision (benefit) for income taxes was based upon management’s estimate of taxable income or loss for each respective accounting period. The Company recognizes an asset or liability for the deferred tax consequences of temporary differences between the tax bases of assets including net operating loss and credit carryforwards and liabilities and the amounts reported in the financial statements. These temporary differences would result in taxable or deductible amounts in future years when the reported amounts of the assets are recovered or liabilities are settled.
For the years ended December 31, 2014 and 2013 and through February 2, 2015, the Company owned two separate corporate consolidated taxable groups: GHC Ancillary group and Sun group. Management calculates a separate provision for each group. The Company combines the provisions in its consolidated financial statements.
On February 2, 2015, Skilled, along with its subsidiary healthcare companies (the Skilled Companies) and FC-GEN, along with its subsidiary companies (the Genesis HealthCare Companies) completed the Combination pursuant to which the businesses of the Skilled Companies and the Genesis HealthCare Companies were combined and now operate under the name Genesis Healthcare, Inc.
The Internal Revenue Code imposes limitations on a corporation’s ability to utilize federal and state tax attributes (such as net unrealized built-in-deductions), including federal income tax credits, in the event of an “ownership change.” States may impose similar limitations. In general terms, an ownership change may result from transactions increasing the ownership of certain shareholders in the stock of a corporation by more than 50 percentage points over a three year period. The Combination generated such an ownership change. The Skilled Companies were treated as a purchase for accounting and tax purposes. As a result of the Combination, the tax bases of its assets and attributes such as net operating losses and tax credit carryforwards were carried over and subject to the provisions of IRC Sec. 382.
As a result of the Combination, the Company effectively owns 58% of FC-GEN, an entity taxed as a partnership for U.S. income tax purposes. This is the Company’s only source of taxable income. The taxable income of the partnership is subject to the income allocation rules of IRC Sec. 704. Management believes the mechanics of IRC Sec. 704 will cause a greater portion of the temporary tax deductions to be allocated to the Company. This allocation will reduce the Company’s taxable income.
Income Tax Provision (Benefit)
Total income tax expense (benefit) was as follows (in thousands):
|
|
|
Year ended December 31, |
|||||||
|
|
|
2015 |
|
2014 |
|
2013 |
|||
|
|
|
|
|
|
|
|
|
|
|
|
Continuing operations |
|
$ |
172,524 |
|
$ |
(44,022) |
|
$ |
(9,179) |
|
Discontinued operations |
|
|
(885) |
|
|
(4,440) |
|
|
(6,017) |
|
Noncontrolling interests |
|
|
— |
|
|
(331) |
|
|
(196) |
|
Stockholder's deficit |
|
|
(212) |
|
|
(368) |
|
|
(1,271) |
|
Total |
|
$ |
171,427 |
|
$ |
(49,161) |
|
$ |
(16,663) |
F-31
Genesis Healthcare, Inc. and Subsidiaries
Notes to Consolidated Financial Statements
The components of the provision for income taxes on income (loss) from continuing operations for the periods presented were as follows (in thousands):
|
|
|
Year ended December 31, |
|||||||
|
|
|
2015 |
|
2014 |
|
2013 |
|||
|
Current: |
|
|
|
|
|
|
|
|
|
|
Federal |
|
$ |
5,151 |
|
$ |
7,569 |
|
$ |
7,355 |
|
State |
|
|
1,738 |
|
|
1,931 |
|
|
2,946 |
|
|
|
|
6,889 |
|
|
9,500 |
|
|
10,301 |
|
Deferred: |
|
|
|
|
|
|
|
|
|
|
Federal |
|
|
134,151 |
|
|
(47,050) |
|
|
(15,935) |
|
State |
|
|
31,484 |
|
|
(6,472) |
|
|
(3,545) |
|
|
|
|
165,635 |
|
|
(53,522) |
|
|
(19,480) |
|
Total |
|
$ |
172,524 |
|
$ |
(44,022) |
|
$ |
(9,179) |
At December 31, 2015, 2014, 2013, the current income taxes was primarily generated on the taxable income of the Company’s rehabilitation services corporate subsidiary and the Company’s Bermuda captive insurance company.
In assessing the requirement for, and amount of, a valuation allowance in accordance with the more likely than not standard for all periods, the Company gives appropriate consideration to all positive and negative evidence related to the realization of the deferred tax assets. The assessment considers the nature, frequency and severity of current and cumulative losses, forecasts of future profitability, the duration of statutory carryforward periods and the Company’s experience with operating loss and tax credit expirations. A history of cumulative losses is a significant piece of negative evidence used in the assessment.
At December 31, 2015 and 2014, the Company has established a valuation allowance in the amount of $245.1 million and $23.2 million, respectively. The valuation allowance in 2014 has been established mainly against the Company’s state net operating loss carryforwards that management expects will not be realized. The Company’s valuation allowance increased by $221.9 million from December 31, 2014, due mainly to management’s assessment that the Company will not realize its deferred tax assets. Therefore, management recorded a full valuation allowance against the majority of its net deferred tax assets in the amount of $245.1 million, except for discounted unpaid loss reserve deferred tax asset of the Company’s captive insurance company.
Total income tax expense (benefit) for the periods presented differed from the amounts computed by applying the federal income tax rate of 35% to income (loss) before income taxes as illustrated below (in thousands):
|
|
|
Year ended December 31, |
|||||||
|
|
|
2015 |
|
2014 |
|
2013 |
|||
|
Computed “expected” benefit |
|
$ |
(123,560) |
|
$ |
(98,527) |
|
$ |
(62,575) |
|
Increase (reduction) in income taxes resulting from: |
|
|
|
|
|
|
|
|
|
|
State and local income taxes, net of federal tax benefit |
|
|
1,738 |
|
|
1,931 |
|
|
2,987 |
|
Adjustment to income taxes for income not subject to corporate income tax |
|
|
34,196 |
|
|
64,575 |
|
|
52,390 |
|
Income tax credits |
|
|
(2,469) |
|
|
(1,347) |
|
|
(1,891) |
|
Non-controlling interest |
|
|
39,843 |
|
|
— |
|
|
— |
|
Adjustment to deferred taxes, including credits and valuation allowance |
|
|
225,259 |
|
|
(12,502) |
|
|
— |
|
Other, net |
|
|
(2,483) |
|
|
1,848 |
|
|
(90) |
|
Total income tax benefit |
|
$ |
172,524 |
|
$ |
(44,022) |
|
$ |
(9,179) |
A significant portion of the Company’s 2015, 2014 and 2013 income (loss) before taxes is not subject to corporate income tax. However, in many jurisdictions in which the Company operates, it is obligated to remit income taxes on behalf of its members. The Company recorded these payments as distributions to its stockholders.
F-32
Genesis Healthcare, Inc. and Subsidiaries
Notes to Consolidated Financial Statements
The Company’s effective income tax rate was (48.9)% in 2015, 15.6% in 2014 and 5.1% in 2013. The change in the effective income tax rate from 2014 to 2015 was largely due to the establishment of a $221.9 million valuation allowance against its deferred tax assets. The change in the effective income tax rate from 2013 to 2014 was largely due to a release of a valuation allowance in 2014 in the amount of $11.3 million.
The tax effects of temporary differences that give rise to significant portions of the deferred tax assets and deferred tax liabilities at December 31, 2015 and 2014 are presented below (in thousands):
|
|
|
2015 |
|
2014 |
|
Deferred Tax Assets: |
|
|
|
|
|
Accounts receivable |
|
— |
|
30,793 |
|
Self-insurance reserves |
|
— |
|
62,810 |
|
Accrued liabilities and reserves |
|
— |
|
16,391 |
|
Long-lived assets: real property |
|
— |
|
89,856 |
|
Other long term liabilities |
|
— |
|
17,246 |
|
Investment in partnership |
|
131,767 |
|
— |
|
Net operating loss carryforwards |
|
93,281 |
|
58,304 |
|
Discounted unpaid loss reserve |
|
7,143 |
|
8,336 |
|
General business credits |
|
20,017 |
|
14,016 |
|
Total deferred tax assets |
|
252,208 |
|
297,752 |
|
Valuation allowance |
|
(245,064) |
|
(23,205) |
|
Deferred tax assets, net of valuation allowance |
|
7,144 |
|
274,547 |
|
Deferred Tax Liabilities: |
|
|
|
|
|
Accrued liabilities and reserves |
|
— |
|
(123) |
|
Long-lived assets: tangible personal property |
|
— |
|
(14,779) |
|
Long-lived assets: intangible property |
|
(14,939) |
|
(60,116) |
|
Total deferred tax liabilities |
|
(14,939) |
|
(75,018) |
|
Net deferred tax assets |
|
(7,795) |
|
199,529 |
Uncertain Tax Positions
The Company follows the provisions of the authoritative guidance for accounting for uncertainty in income taxes which clarifies the accounting for uncertain income tax issues recognized in an entity’s financial statements. The guidance prescribes a recognition threshold and measurement attribute for the financial statement recognition and measurement of a tax position taken or expected to be taken in an income tax return.
The Company, excluding its corporate groups, is only subject to state and local income tax in certain jurisdictions. The Company’s corporate groups are subject to federal, state and local income taxes. Significant judgment is required in evaluating its uncertain tax positions and determining its provision for income taxes. Under GAAP, the Company utilizes a two-step approach to recognizing and measuring uncertain tax positions. The first step is to evaluate the tax position for recognition by determining if the weight of available evidence indicates that it is more likely than not that the position will be sustained on audit, including resolution of related appeals or litigation processes. The second step is to measure the tax benefit as the largest amount that is more than 50% likely of being realized upon settlement.
The Company is subject to various federal and state income tax audits in the ordinary course of business. Such audits could result in increased tax payments, interest and penalties. While the Company believes its tax positions are appropriate, it cannot assure that the various authorities engaged in the examination of its income tax returns will not challenge the Company’s positions. The Company believes it has adequately reserved for its uncertain tax positions, though no assurance can be given that the final tax outcome of these matters will not be different. The Company adjusts these reserves in light of changing facts and circumstances, such as the closing of a tax audit or the expiration of the statute of limitations. To the extent that the final tax outcome of these matters is different than the amounts recorded, such differences will impact the provision for income taxes in the period in which such determination is made. The
F-33
Genesis Healthcare, Inc. and Subsidiaries
Notes to Consolidated Financial Statements
provision for income taxes includes the impact of reserve provisions and changes to reserves that are considered appropriate, as well as the related net interest.
A reconciliation of unrecognized tax benefits follows (in thousands):
|
Balance, December 31, 2012 |
|
$ |
24,212 |
|
Reductions due to lapses of applicable statute of limitations |
|
|
(3) |
|
Balance, December 31, 2013 |
|
$ |
24,209 |
|
Additions based upon tax positions related to the current year |
|
|
24 |
|
Balance, December 31, 2014 |
|
$ |
24,233 |
|
Additions recorded in purchase accounting |
|
|
59 |
|
Balance, December 31, 2015 |
|
$ |
24,292 |
The Company’s unrecognized tax benefits reserve for uncertain tax positions primarily relate to certain tax exposure items acquired as a result of the Sun Merger, the most significant item is an IRC 382 realized built-in-gain net operating loss carryforward. The liability related to the Sun Merger reserve was accounted for as part of the purchase price and was not charged to income tax expense.
All of the gross unrecognized tax benefits would affect the effective tax rate if recognized. Unrecognized tax benefits are adjusted in the period in which new information about a tax position becomes available or the final outcome differs from the amount recorded. Unrecognized tax benefits are not expected to change significantly over the next twelve months. The Company recognizes potential accrued interest related to unrecognized tax benefits in income tax expense. Penalties, if incurred, would also be recognized as a component of income tax expense. The amount of accrued interest related to unrecognized tax benefits as of December 31, 2015, 2014, and 2013 was $0.4 million, $0.4 million, and $0.4 million, respectively. Generally, the Company has open tax years for state purposes subject to tax audit on average of between three years to six years. The Company’s U.S. income tax returns from 2010 through 2014 are open and could be subject to examination.
Exchange Rights and Tax Receivable Agreement
Following the Combination, the owners of FC-GEN will have the right to exchange their membership interests in FC-GEN for shares of Class A Common Stock of the Company or cash, at the Company’s option. As a result of such exchanges, the Company’s membership interest in FC-GEN will increase and its purchase price will be reflected in its share of the tax basis of FC-GEN’s tangible and intangible assets. Any resulting increases in tax basis are likely to increase tax depreciation and amortization deductions and, therefore, reduce the amount of income tax the Company would otherwise be required to pay in the future. Any such increase would also decrease gain (or increase loss) on future dispositions of the affected assets. There have been no exchanges for the year ended December 31, 2015.
Concurrent with the Combination, the Company entered into a tax receivable agreement (TRA) with the owners of FC-GEN. The agreement provides for the payment by the Company to the owners of FC-GEN of 90% of the cash savings, if any, in U.S. federal, state and local income tax that the Company actually realizes as a result of (i) the increases in tax basis attributable to the owners of FC-GEN and (ii) tax benefits related to imputed interest deemed to be paid by the Company as a result of the TRA. Under the TRA, the benefits deemed realized by the Company as a result of the increase in tax basis attributable to the owners of FC-GEN generally will be computed by comparing the actual income tax liability of the Company to the amount of such taxes that the Company would have been required to pay had there been no such increase in tax basis.
F-34
Genesis Healthcare, Inc. and Subsidiaries
Notes to Consolidated Financial Statements
Estimating the amount of payments that may be made under the TRA is by its nature imprecise, insofar as the calculation of amounts payable depends on a variety of factors. The actual increase in tax basis and deductions, as well as the amount and timing of any payments under the TRA, will vary depending upon a number of factors, including:
the timing of exchanges—for instance, the increase in any tax deductions will vary depending on the fair value of the depreciable or amortizable assets of FC-GEN and its subsidiaries at the time of each exchange, which fair value may fluctuate over time;
the price of shares of Company Class A Common Stock at the time of the exchange—the increase in any tax deductions, and the tax basis increase in other assets of FC-GEN and its subsidiaries is directly proportional to the price of shares of Company Class A Common Stock at the time of the exchange;
the amount and timing of the Company’s income—the Company is required to pay 90% of the deemed benefits as and when deemed realized. If FC-GEN does not have taxable income, the Company is generally not required (absent a change of control or circumstances requiring an early termination payment) to make payments under the TRA for that taxable year because no benefit will have been actually realized. However, any tax benefits that do not result in realized benefits in a given tax year likely will generate tax attributes that may be utilized to generate benefits in previous or future tax years. The utilization of such tax attributes will result in payments under the TRA; and
future tax rates of jurisdictions in which the Company has tax liability.
The TRA also provides that upon certain mergers, asset sales, other forms of business combinations or other changes of control, FC-GEN (or its successor’s) obligations under the TRA would be based on certain assumptions defined in the TRA. As a result of these assumptions, FC-GEN could be required to make payments under the TRA that are greater or less than the specified percentage of the actual benefits realized by the Company that are subject to the TRA. In addition, if FC-GEN elects to terminate the TRA early, it would be required to make an early termination payment, which upfront payment may be made significantly in advance of the anticipated future tax benefits.
Payments generally are due under the TRA within a specified period of time following the filing of FC-GEN’s U.S. federal and state income tax return for the taxable year with respect to which the payment obligation arises. Payments under the TRA generally will be based on the tax reporting positions that FC-GEN will determine. Although FC-GEN does not expect the IRS to challenge the Company’s tax reporting positions, FC-GEN will not be reimbursed for any overpayments previously made under the TRA, but any overpayments will reduce future payments. As a result, in certain circumstances, payments could be made under the TRA in excess of the benefits that FC-GEN actually realizes in respect of the tax attributes subject to the TRA.
The term of the TRA generally will continue until all applicable tax benefits have been utilized or expired, unless the Company exercises its right to terminate the TRA and make an early termination payment.
In certain circumstances (such as certain changes in control, the election of the Company to exercise its right to terminate the agreement and make an early termination payment or an IRS challenge to a tax basis increase) it is possible that cash payments under the TRA may exceed actual cash savings.
(16)Related Party Transactions
Prior to the Combination on February 2, 2015, the Company was wholly owned by private investors sponsored by affiliates of Formation Capital, LLC (Formation).
The Company made an investment of $1.0 million and received an approximate 6.8% interest in National Home Care Holdings, LLC, an unconsolidated joint venture affiliated with one of the Company’s sponsors.
F-35
Genesis Healthcare, Inc. and Subsidiaries
Notes to Consolidated Financial Statements
The Company maintained an approximately 5.4% interest in FC PAC Holdings, LLC (FC PAC), an unconsolidated joint venture, affiliated with one of the Company’s sponsors. The Company contracts with FC PAC to provide hospice and diagnostic services in the normal course of business. On March 31, 2015, the Company sold its investment in FC PAC for $26.4 million. The Company recognized a gain on sale of $8.4 million recorded as other income on the statement of operations. FC PAC ownership includes affiliates of Formation, some of whom are members of the Company’s board of directors.
On July 1, 2015, the Company acquired 22 rehabilitation outpatient clinics from entities associated with Formation for a purchase price of $1.1 million. The acquisition was financed entirely with a promissory note. The note bears interest equal to 5% per annum with principal due in full on July 1, 2020.
The Company provides rehabilitation services to certain facilities owned and operated by affiliates of the Company’s sponsors. These services resulted in revenue of $161.4 million, $161.2 million and $148.5 million in the years ended December 31, 2015, 2014, and 2013, respectively. The services resulted in accounts receivable balances of $57.1 million and $37.6 million at December 31, 2015 and 2014, respectively.
The Company is billed by an affiliate of the Company’s sponsors a monthly fee for the provision of administrative services. The fees billed were $0.1 million, $2.5 million and $2.5 million for the years ended December 31, 2015, 2014 and 2013, respectively. On February 2, 2015 in connection with the Combination, an affiliate of the Company’s sponsors received a transaction advisory fee of $3.0 million and the administrative services monthly fee was discontinued.
(17)Defined Contribution Plan
The Company sponsors a defined contribution plan covering substantially all employees who meet certain eligibility requirements. The Company did not match employee contributions for the defined contribution plan in 2015 and 2014.
(18)Asset Impairment Charges
Long-Lived Assets with a Definite Useful Life
In the fourth quarter of 2015, 2014 and 2013, the Company’s long-lived assets with a definite useful life were tested for impairment at the lowest levels for which there are identifiable cash flows. The Company estimated the future net undiscounted cash flows expected to be generated from the use of the long-lived assets and then compared the estimated undiscounted cash flows to the carrying amount of the long-lived assets. The cash flow period was based on the remaining useful lives of the primary asset in each long-lived asset group, principally a building in the inpatient segment and customer relationship assets in the rehabilitation therapy services segment. For 2015, 2014 and 2013, the Company recognized impairment charges in the inpatient segment totaling $28.5 million, $31.4 million and $10.0 million, respectively.
Goodwill
Adverse changes in the operating environment and related key assumptions used to determine the fair value of the Company’s reporting units and indefinite-lived intangible assets may result in future impairment charges for a portion or all of these assets. Specifically, if the rate of growth of government and commercial revenues earned by the Company’s reporting units were to be less than projected or if healthcare reforms were to negatively impact the Company’s business, an impairment charge of a portion or all of these assets may be required. An impairment charge could have a material adverse effect on the Company’s business, financial position and results of operations, but would not be expected to have an impact on the Company’s cash flows or liquidity.
The Company performed its annual goodwill impairment test as of September 30, 2015, 2014 and 2013 and determined that no impairment was necessary.
F-36
Genesis Healthcare, Inc. and Subsidiaries
Notes to Consolidated Financial Statements
Due to a decline in the market capitalization of the Company and industry peers in the fourth quarter of 2015, the Company concluded a test for impairment was warranted. The Company determined that the fair value of the reporting unit exceeded the carrying value based upon the market capitalization including a control premium and a discounted cash flow analysis. Determining fair value requires the exercise of significant judgment, including judgment about appropriate discount rates, perpetual growth rates, the amount and timing of expected future cash flows, as well as relevant comparable company earnings multiples for the market-based approach. The cash flows employed in the discounted cash flow analyses are based on the Company’s internal business model for 2016 and, for years beyond 2016 the growth rates used are an estimate of the future growth in the industry in which the Company participates. The discount rates used in the discounted cash flow analyses are intended to reflect the risks inherent in the future cash flows of the reporting unit and are based on an estimated cost of capital, which was determined based on the Company’s estimated cost of capital relative to its capital structure. In addition, the market-based approach utilizes comparable company public trading values, research analyst estimates and, where available, values observed in private market transactions.
The Company performed a quantitative test for impairment of goodwill to assess the impact of changes in the regulatory and reimbursement environment. The quantitative analysis is a two-step process as follows:
|
· |
Step one, the Company compares the carrying amount of each of the reporting units to the fair value of each of the reporting units. If the carrying amount of each of its reporting units exceeds its fair value, the Company must perform the second step of the process. If not, no further testing is needed. |
|
· |
Step two, the Company allocates the fair value of each of the reporting units to all assets and liabilities as if each of the reporting units had been acquired in a business combination at the date of the impairment test. The Company would then compare the implied fair value of each of the reporting units’ goodwill to its carrying amount. If the carrying amount of the goodwill exceeds its implied fair value, it recognizes an impairment loss in an amount equal to that excess. |
Step one of the analysis indicated that the reporting unit fair value exceeded the book value and accordingly did not perform the second step in the analysis. As a result, no impairment of goodwill was recognized in the fourth quarter of 2015.
(19)Discontinued Operations
In the normal course of business, the Company continually evaluates the performance of its operating units, with an emphasis on selling or closing underperforming or non-strategic assets. Discontinued businesses are removed from the results of continuing operations. The results of operations in the current and prior year periods, along with any cost to exit such businesses in the year of discontinuation, are classified as discontinued operations in the consolidated statements of operations.
The following table sets forth net revenues and the components of loss from discontinued operations (in thousands):
|
|
|
Year ended December 31, |
|||||||
|
|
|
2015 |
|
2014 |
|
2013 |
|||
|
Net revenues |
|
$ |
70 |
|
$ |
8,788 |
|
$ |
57,782 |
|
Net operating loss of discontinued businesses |
|
$ |
(2,104) |
|
$ |
(16,559) |
|
$ |
(10,783) |
|
Loss on discontinuation of business |
|
|
— |
|
|
(1,925) |
|
|
(2,598) |
|
Income tax benefit |
|
|
885 |
|
|
4,440 |
|
|
6,017 |
|
Loss from discontinued operations, net of taxes |
|
$ |
(1,219) |
|
$ |
(14,044) |
|
$ |
(7,364) |
Subsequent to October 1, 2014, there have been no operational closures which have been categorized as a discontinued operation. In 2014 prior to October 1, 2014, the Company closed or transferred operations of four facilities with licensed beds of 440 located in the states of California and Massachusetts. During 2013, the Company closed or transferred the operations of 14 facilities with licensed beds of 1,462 located in the states of Oklahoma, Idaho, Wyoming, Tennessee, Kentucky and Massachusetts.
F-37
Genesis Healthcare, Inc. and Subsidiaries
Notes to Consolidated Financial Statements
(20)Commitments and Contingencies
Loss Reserves For Certain Self-Insured Programs
General and Professional Liability and Workers’ Compensation
The Company self-insures for certain insurable risks, including general and professional liabilities and workers’ compensation liabilities through the use of self-insurance or retrospective and self-funded insurance policies and other hybrid policies, which vary among states in which the Company operates, including wholly owned captive insurance subsidiaries, to provide for potential liabilities for general and professional liability claims and workers’ compensation claims. Policies are typically written for a duration of twelve months and are measured on a “claims made” basis. Regarding workers’ compensation, the Company self-insures to its deductible and purchases statutorily required insurance coverage in excess of its deductible. There is a risk that amounts funded by the Company’s self-insurance programs may not be sufficient to respond to all claims asserted under those programs. Insurance reserves represent estimates of future claims payments. This liability includes an estimate of the development of reported losses and losses incurred but not reported. Provisions for changes in insurance reserves are made in the period of the related coverage. The Company also considers amounts that may be recovered from excess insurance carriers in estimating the ultimate net liability for such risks.
The Company’s management employs its judgment and periodic independent actuarial analysis in determining the adequacy of certain self-insured workers’ compensation and general and professional liability obligations recorded as liabilities in the Company’s financial statements. The Company evaluates the adequacy of its self-insurance reserves on a semi-annual basis or more often when it is aware of changes to its incurred loss patterns that could impact the accuracy of those reserves. The methods of making such estimates and establishing the resulting reserves are reviewed periodically and are based on historical paid claims information and nationwide nursing home trends. The foundation for most of these methods is the Company’s actual historical reported and/or paid loss data. Any adjustments resulting therefrom are reflected in current earnings. Claims are paid over varying periods, and future payments may be different than the estimated reserves.
The Company utilizes third-party administrators (TPAs) to process claims and to provide it with the data utilized in its assessments of reserve adequacy. The TPAs are under the oversight of the Company’s in-house risk management and legal functions. These functions ensure that the claims are properly administered so that the historical data is reliable for estimation purposes. Case reserves, which are approved by the Company’s legal and risk management departments, are determined based on an estimate of the ultimate settlement and/or ultimate loss exposure of individual claims.
The reserves for loss for workers’ compensation risks are discounted based on actuarial estimates of claim payment patterns using a discount rate of approximately 1% for each policy period presented. The discount rate for the 2015 policy year is 0.97%. The discount rates are based upon the risk-free rate for the appropriate duration for the respective policy year. The removal of discounting would have resulted in an increased reserve for workers’ compensation risks of $8.6 million and $4.8 million as of December 31, 2015 and December 31, 2014, respectively. The reserves for general and professional liability are recorded on an undiscounted basis.
The provision for general and professional liability risks totaled $151.1 million, $130.8 million and $87.4 million for the year ended December 31, 2015, 2014 and 2013, respectively. The reserves for general and professional liability were $371.6 million and $288.2 million as of December 31, 2015 and December 31, 2014, respectively.
The provision for loss for workers’ compensation risks totaled $60.7 million, $62.4 million and $52.2 million for the year ended December 31, 2015, 2014 and 2013, respectively. The reserves for workers’ compensation risks were $223.7 million and $198.0 million as of December 31, 2015 and December 31, 2014, respectively.
F-38
Genesis Healthcare, Inc. and Subsidiaries
Notes to Consolidated Financial Statements
Health Insurance
The Company offers employees an option to participate in self-insured health plans. Health insurance claims are paid as they are submitted to the plans’ administrators. The Company maintains an accrual for claims that have been incurred but not yet reported to the plans’ administrators and therefore have not yet been paid. The liability for the self-insured health plan is recorded in accrued compensation in the consolidated balance sheets. Although management believes that the amounts provided in the Company’s consolidated financial statements are adequate and reasonable, there can be no assurances that the ultimate liability for such self-insured risks will not exceed management’s estimates.
Legal Proceedings
The Company is a party to litigation and regulatory investigations arising in the ordinary course of business. Based on the Company’s evaluation of information currently available, with the exception of the specific matters noted below, management does not believe the results of such litigation and regulatory investigations would have a material adverse effect on the results of operations, financial position or cash flows of the Company.
Creekside Hospice Litigation
On August 2, 2013, the United States Attorney for the District of Nevada and the Civil Division of the U.S. Department of Justice (the DOJ) informed the Company that its Civil Division was investigating Skilled, as well as its subsidiary, Creekside Hospice II, LLC, for possible violations of federal and state healthcare fraud and abuse laws and regulations. Those laws could have included the federal False Claims Act (FCA) and the Nevada False Claims Act (NFCA). The FCA provides for civil and administrative fines and penalties, plus treble damages. The NFCA provides for similar fines and penalties, including treble damages. Violations of those federal or state laws could also subject the Company and/or its subsidiaries to exclusion from participation in the Medicare and Medicaid programs. Any damages, fines, penalties, other sanctions and costs that the Company may incur as a result of any federal or state suit could be significant and could have a material and adverse effect on its results of operations and financial condition.
On or about August 6, 2014, in relation to the investigation the DOJ filed a notice of intervention in two pending qui tam proceedings filed by private party relators under the FCA and the NFCA and advised that it intends to take over the actions. The DOJ filed its complaint in intervention on November 25, 2014, against Creekside, Skilled Healthcare Group, Inc., and Skilled Healthcare, LLC, asserting, among other things, that certain claims for hospice services provided by Creekside in the time period 2010 to 2013 did not meet Medicare requirements for reimbursement and are in violation of the civil False Claims Act. The DOJ is pursuing False Claims Act, NFCA, and federal common law claims remedies in an unspecified amount, with a request to treble provable damages and impose penalties per proved false claim in the amount ranging from $5,500 to $11,000 per claim, as applicable.
While the Company denies the allegations and will vigorously defend this action, including any portion of the action that the private party relators may continue to pursue, the Company has accrued $7.5 million as a contingent liability in connection with the matter. However, it could ultimately cost more than that amount to settle or otherwise resolve the matter(s), including to satisfy any judgment that might be rendered against the Company or Creekside Hospice if the litigation defense were ultimately unsuccessful.
Therapy Matters Investigation
In February 2015, representatives of the DOJ informed the Company that they are investigating and may pursue legal action against the Company and certain of its subsidiaries including Hallmark Rehabilitation GP, LLC for alleged violations of the federal and state healthcare fraud and abuse laws and regulations related to the provision of therapy services at certain Skilled facilities from 2005 through 2013 (the Therapy Matters Investigation). These laws could include the FCA and similar state laws. As noted above, the FCA provides for civil and administrative fines and penalties, including civil fines ranging from $5,500 to $11,000 per claim plus treble damages. Applicable state laws provide for similar penalties. Violations of these federal or state laws could also subject the Company and/or its subsidiaries to exclusion from participation in the Medicare and Medicaid programs. Any damages, fines, penalties, other
F-39
Genesis Healthcare, Inc. and Subsidiaries
Notes to Consolidated Financial Statements
sanctions and costs that the Company may incur as a result of any federal and/or state suit could be significant and could have a material and adverse effect on its results of operations and financial condition. The Company has had discussions with the DOJ regarding both the Therapy Matters Investigation and the Staffing Matters Investigation (defined below). The Company has accrued a combined $30 million as a contingent liability in connection with those two matters. However, it could ultimately cost more than that amount to settle or otherwise resolve the matter(s), including to satisfy any judgment that might be rendered against the Company if legal proceedings are commenced. At this time, the Company cannot predict what additional effect, if any, the investigation or any potential claims arising under applicable federal or state laws and regulations could have on the Company. While the Company will continue to cooperate with the government’s investigation of the matter, the Company intends to vigorously defend against any legal action that may be brought in the matter.
Staffing Matters Investigation
On February 10, 2015, the DOJ informed the Company that it intends to pursue legal action against the Company and certain of its subsidiaries related to staffing and certain quality of care allegations related to the issues adjudicated against the Company and those subsidiaries in a previously disclosed class action lawsuit that Skilled settled in 2010 (the Staffing Matters Investigation). The laws under which the DOJ could seek to pursue legal action could include the FCA and similar state laws. As noted above, violations of the FCA or similar state laws and regulations could subject the Company and/or its subsidiaries to severe monetary and other penalties and remedies. Any damages, fines, penalties, other sanctions and costs that the Company may incur as a result of any federal or state suit could be significant and could have a material and adverse effect on its results of operations and financial condition. As noted above, the Company has had discussions with the DOJ regarding both the Staffing Matters Investigation and the Therapy Matters Investigation. The Company has accrued a combined $30 million as a contingent liability in connection with those two matters. However, it could ultimately cost more than that amount to settle or otherwise resolve the matter(s), including to satisfy any judgment that might be rendered against the Company if legal proceedings are commenced. At this time, the Company cannot predict what additional effect, if any, the investigation or any potential claims arising under applicable federal or state laws and regulations could have on the Company. While the Company will continue to cooperate with the government’s evaluation of the matter, the Company intends to vigorously defend against any legal action that may be brought in the matter.
SunDance Part B Therapy Matter
SunDance Rehabilitation Agency Inc. (SunDance), a subsidiary of the Company, which is an outpatient agency licensed to provide Medicare Part B therapy services at assisted/senior living facilities in Georgia, is a party to a qui tam proceeding that was filed by private party relators under the FCA. No SunDance agencies outside of Georgia are part of the qui tam proceeding. The Civil Division of the United States Attorney's Office for the District of Georgia has recently filed a notice of intervention in this matter. It is believed that when filed, the complaint in intervention may assert, among other things, that certain claims for therapy services provided by SunDance to certain Georgia facilities from the time period 2008 to 2012 did not meet Medicare requirements for reimbursement and are in violation of the FCA. The Company denies the allegations and intends to vigorously defend this action.
Conditional Asset Retirement Obligations
Certain of the Company’s leased real estate assets contain asbestos. The asbestos is believed to be appropriately contained in accordance with environmental regulations. If these properties were demolished or subject to renovation activities that disturb the asbestos, certain environmental regulations are in place, which specify the manner in which the asbestos must be handled and disposed.
At December 31, 2015 and 2014, the Company has a liability for the asset retirement obligation associated primarily with the cost of asbestos removal aggregating approximately $9.5 million and $5.0 million, respectively, which is included in other long-term liabilities. The liability for each facility will be accreted to its settlement value, which is estimated to approximate $22.0 million through the estimated settlement dates extending from 2016 through 2042. Due to the time over which these obligations could be settled and the judgment used to determine the liability, the ultimate
F-40
Genesis Healthcare, Inc. and Subsidiaries
Notes to Consolidated Financial Statements
obligation may differ from the estimate. Upon settlement, any difference between actual cost and the estimate is recognized as a gain or loss in that period.
Annual accretion of the liability and depreciation expense is recorded each year for the impacted assets until the obligation year is reached, either by sale of the property, demolition or some other future event such as a government action.
Employment Agreements
The Company has employment agreements and arrangements with its executive officers and certain members of management. The agreements generally continue until terminated by the executive or the Company, and provide for severance payments under certain circumstances.
(21)Fair Value of Financial Instruments
The Company’s financial instruments consist primarily of cash and equivalents, restricted cash, trade accounts receivable, investments in marketable securities, accounts payable, short and long-term debt and derivative financial instruments.
The Company’s financial instruments, other than its trade accounts receivable and accounts payable, are spread across a number of large financial institutions whose credit ratings the Company monitors and believes do not currently carry a material risk of non-performance. Certain of the Company’s financial instruments, including its interest rate cap arrangements, contain an off-balance-sheet risk.
Recurring Fair Value Measures
Fair value is defined as an exit price (i.e., the price that would be received to sell an asset or paid to transfer a liability in an orderly transaction between market participants at the measurement date). The fair value hierarchy prioritizes the inputs to valuation techniques used to measure fair value into three broad levels as shown below. An instrument’s classification within the fair value hierarchy is determined based on the lowest level input that is significant to the fair value measurement.
|
|
Level 1 — |
|
Quoted prices (unadjusted) in active markets for identical assets or liabilities. |
|
|
Level 2 — |
|
Inputs that are observable for the asset or liability, either directly or indirectly through market corroboration, for substantially the full term of the asset or liability. |
|
|
Level 3 — |
|
Inputs that are unobservable for the asset or liability based on the Company’s own assumptions (about the assumptions market participants would use in pricing the asset or liability). |
F-41
Genesis Healthcare, Inc. and Subsidiaries
Notes to Consolidated Financial Statements
The tables below presents the Company’s assets and liabilities measured at fair value on a recurring basis as of December 31, 2015 and December 31, 2014, aggregated by the level in the fair value hierarchy within which those measurements fall (in thousands):
|
|
|
Fair Value Measurements at Reporting Date Using |
|
||||||||||
|
|
|
|
|
|
Quoted Prices in |
|
|
|
|
Significant |
|
||
|
|
|
|
|
|
Active Markets for |
|
Significant Other |
|
Unobservable |
|
|||
|
|
|
December 31, |
|
Identical Assets |
|
Observable Inputs |
|
Inputs |
|
||||
|
Assets: |
|
2015 |
|
(Level 1) |
|
(Level 2) |
|
(Level 3) |
|
||||
|
Cash and cash equivalents |
|
$ |
61,543 |
|
$ |
61,543 |
|
$ |
— |
|
$ |
— |
|
|
Restricted cash and equivalents |
|
|
34,370 |
|
|
34,370 |
|
|
— |
|
|
— |
|
|
Restricted investments in marketable securities |
|
|
|
|
|
|
|
|
|
|
|
|
|
|
Mortgage/government backed securities |
|
|
13,202 |
|
|
13,202 |
|
|
— |
|
|
— |
|
|
Corporate bonds |
|
|
82,583 |
|
|
82,583 |
|
|
— |
|
|
— |
|
|
Government bonds |
|
|
67,972 |
|
|
67,972 |
|
|
— |
|
|
— |
|
|
Total |
|
$ |
259,670 |
|
$ |
259,670 |
|
$ |
— |
|
$ |
— |
|
|
|
|
Fair Value Measurements at Reporting Date Using |
|
||||||||||
|
|
|
|
|
|
Quoted Prices in |
|
|
|
|
Significant |
|
||
|
|
|
|
|
|
Active Markets for |
|
Significant Other |
|
Unobservable |
|
|||
|
|
|
December 31, |
|
Identical Assets |
|
Observable Inputs |
|
Inputs |
|
||||
|
Assets: |
|
2014 |
|
(Level 1) |
|
(Level 2) |
|
(Level 3) |
|
||||
|
Cash and cash equivalents |
|
$ |
87,548 |
|
$ |
87,548 |
|
$ |
— |
|
$ |
— |
|
|
Restricted cash and equivalents |
|
|
36,390 |
|
|
36,390 |
|
|
— |
|
|
— |
|
|
Restricted investments in marketable securities |
|
|
|
|
|
|
|
|
|
|
|
|
|
|
Mortgage/government backed securities |
|
|
8,472 |
|
|
8,472 |
|
|
— |
|
|
— |
|
|
Corporate bonds |
|
|
38,878 |
|
|
38,878 |
|
|
— |
|
|
— |
|
|
Government bonds |
|
|
63,000 |
|
|
63,000 |
|
|
— |
|
|
— |
|
|
Total |
|
$ |
234,288 |
|
$ |
234,288 |
|
$ |
— |
|
$ |
— |
|
The Company places its cash and cash equivalents and restricted investments in marketable securities in quality financial instruments and limits the amount invested in any one institution or in any one type of instrument. The Company has not experienced any significant losses on such investments.
Debt Instruments
The table below shows the carrying amounts and estimated fair values of the Company’s primary long-term debt instruments:
|
|
|
December 31, 2015 |
|
December 31, 2014 |
|
||||||||
|
|
|
Carrying Value |
|
Fair Value |
|
Carrying Value |
|
Fair Value |
|
||||
|
Revolving credit facility |
|
$ |
363,000 |
|
$ |
363,000 |
|
$ |
254,500 |
|
$ |
254,500 |
|
|
Term loan facility, net of original issue discount of $7,475 at December 31, 2015 and $11,375 at December 31, 2014 |
|
|
220,971 |
|
|
220,400 |
|
|
219,297 |
|
|
229,677 |
|
|
Real estate bridge loan |
|
|
494,100 |
|
|
494,100 |
|
|
— |
|
|
— |
|
|
HUD insured loans |
|
|
107,645 |
|
|
107,645 |
|
|
— |
|
|
— |
|
|
Mortgages and other secured debt (recourse) |
|
|
13,934 |
|
|
13,934 |
|
|
14,488 |
|
|
14,488 |
|
|
Mortgages and other secured debt (non-recourse) |
|
|
30,507 |
|
|
30,507 |
|
|
49,961 |
|
|
49,961 |
|
|
|
|
$ |
1,230,157 |
|
$ |
1,229,586 |
|
$ |
538,246 |
|
$ |
548,626 |
|
The fair value of debt is based upon market prices or is computed using discounted cash flow analysis, based on the Company’s estimated borrowing rate at the end of each fiscal period presented. The Company believes that the inputs to the pricing models qualify as Level 2 measurements.
F-42
Genesis Healthcare, Inc. and Subsidiaries
Notes to Consolidated Financial Statements
Non-Recurring Fair Value Measures
The Company recently applied the fair value measurement principles to certain of its non-recurring nonfinancial assets in connection with an impairment test.
The following table presents the Company’s hierarchy for nonfinancial assets measured at fair value on a non-recurring basis (in thousands):
|
|
|
|
|
|
Impairment Charges - |
|
|
|
|
|
Carrying Value |
|
Year ended |
|
||
|
|
|
December 31, 2015 |
|
December 31, 2015 |
|
||
|
Assets: |
|
|
|
|
|
|
|
|
Property and equipment, net |
|
$ |
4,085,247 |
|
$ |
26,768 |
|
|
Goodwill |
|
|
470,019 |
|
|
— |
|
|
Intangible assets |
|
|
209,967 |
|
|
1,778 |
|
|
|
|
|
|
|
|
|
|
|
|
|
|
|
|
Impairment Charges - |
|
|
|
|
|
Carrying Value |
|
Year ended |
|
||
|
|
|
December 31, 2014 |
|
December 31, 2014 |
|
||
|
Assets: |
|
|
|
|
|
|
|
|
Property and equipment, net |
|
$ |
3,493,250 |
|
$ |
28,359 |
|
|
Goodwill |
|
|
169,681 |
|
|
— |
|
|
Intangible assets |
|
|
173,112 |
|
|
3,040 |
|
The fair value allocation related to the Company’s acquisitions and the fair value of tangible and intangible assets related to the Company’s impairment analysis are determined using a discounted cash flow approach, which is a significant unobservable input (Level 3). The Company estimates the fair value using the income approach (which is a discounted cash flow technique). These valuation methods required management to make various assumptions, including, but not limited to, future profitability, cash flows and discount rates. The Company’s estimates are based upon historical trends, management’s knowledge and experience and overall economic factors, including projections of future earnings potential.
Developing discounted future cash flows in applying the income approach requires the Company to evaluate its intermediate to longer-term strategies, including, but not limited to, estimates of revenue growth, operating margins, capital requirements, inflation and working capital management. The development of appropriate rates to discount the estimated future cash flows requires the selection of risk premiums, which can materially impact the present value of future cash flows.
The Company estimated the fair value of acquired tangible and intangible assets using discounted cash flow techniques that included an estimate of future cash flows, consistent with overall cash flow projections used to determine the purchase price paid to acquire the business, discounted at a rate of return that reflects the relative risk of the cash flows.
The Company believes the estimates and assumptions used in the valuation methods are reasonable.
F-43
Genesis Healthcare, Inc. and Subsidiaries
Notes to Consolidated Financial Statements
(22)Quarterly Financial Information (Unaudited)
The following table summarizes unaudited quarterly financial data for the years ended December 31, 2015 and 2014 (dollars in thousands, except per share data):
|
|
|
Quarter ended |
|
|||||||
|
|
|
March 31, 2015 |
|
June 30, 2015 |
|
September 30, 2015 |
|
December 31, 2015 |
|
|
|
Net revenues |
|
$ |
1,343,001 |
(1) |
1,419,475 |
|
1,416,027 |
|
1,440,721 |
|
|
|
|
|
|
|
|
|
|
|
|
|
|
Net loss: |
|
|
|
|
|
|
|
|
|
|
|
Loss from continuing operations |
|
|
(118,362) |
(2) |
(33,214) |
|
(60,981) |
|
(312,992) |
(3) |
|
Net loss attributable to noncontrolling interests |
|
|
5,684 |
|
15,750 |
|
31,990 |
|
47,149 |
|
|
Loss from continuing operations attributable to Genesis Healthcare, Inc. |
|
|
(112,678) |
|
(17,464) |
|
(28,991) |
|
(265,843) |
|
|
Income (loss) from discontinued operations, net of taxes |
|
|
112 |
|
(1,722) |
|
39 |
|
352 |
|
|
Net loss attributable to Genesis Healthcare, Inc. |
|
|
(112,566) |
|
(19,186) |
|
(28,952) |
|
(265,491) |
|
|
Loss per common share: |
|
|
|
|
|
|
|
|
|
|
|
Basic and diluted: |
|
|
|
|
|
|
|
|
|
|
|
Loss from continuing operations |
|
|
(1.58) |
|
(0.38) |
|
(0.68) |
|
(3.51) |
|
|
Net loss attributable to noncontrolling interests |
|
|
0.08 |
|
0.18 |
|
0.36 |
|
0.53 |
|
|
Loss from continuing operations attributable to Genesis Healthcare, Inc. |
|
|
(1.50) |
|
(0.20) |
|
(0.32) |
|
(2.98) |
|
|
Income (loss) from discontinued operations, net of taxes |
|
|
— |
|
(0.02) |
|
— |
|
— |
|
|
Net loss attributable to Genesis Healthcare, Inc. |
|
|
(1.50) |
|
(0.22) |
|
(0.32) |
|
(2.98) |
|
|
|
|
|
|
|
|
|
|
|
|
|
|
Shares used in computing loss per common share: |
|
|
|
|
|
|
|
|
|
|
|
Basic and diluted: |
|
|
75,234 |
|
89,211 |
|
89,213 |
|
89,197 |
|
|
|
|
Quarter ended |
|
|||||||
|
|
|
March 31, 2014 |
|
June 30, 2014 |
|
September 30, 2014 |
|
December 31, 2014 |
|
|
|
Net revenues |
|
$ |
1,186,544 |
|
1,200,651 |
|
1,187,618 |
|
1,193,267 |
|
|
|
|
|
|
|
|
|
|
|
|
|
|
Net loss: |
|
|
|
|
|
|
|
|
|
|
|
Loss from continuing operations |
|
|
(40,789) |
|
(30,856) |
|
(42,608) |
|
(123,232) |
(4) |
|
Net income attributable to noncontrolling interests |
|
|
(185) |
|
(224) |
|
(961) |
|
(1,086) |
|
|
Loss from continuing operations attributable to Genesis Healthcare, Inc. |
|
|
(40,974) |
|
(31,080) |
|
(43,569) |
|
(124,318) |
|
|
Loss from discontinued operations, net of taxes |
|
|
(3,194) |
|
(1,176) |
|
(1,191) |
|
(8,483) |
|
|
Net loss attributable to Genesis Healthcare, Inc. |
|
|
(44,168) |
|
(32,256) |
|
(44,760) |
|
(132,801) |
|
|
Loss per common share: |
|
|
|
|
|
|
|
|
|
|
|
Basic and diluted: |
|
|
|
|
|
|
|
|
|
|
|
Loss from continuing operations |
|
|
(0.82) |
|
(0.62) |
|
(0.86) |
|
(2.47) |
|
|
Net income attributable to noncontrolling interests |
|
|
— |
|
— |
|
(0.02) |
|
(0.02) |
|
|
Loss from continuing operations attributable to Genesis Healthcare, Inc. |
|
|
(0.82) |
|
(0.62) |
|
(0.88) |
|
(2.49) |
|
|
Loss from discontinued operations, net of taxes |
|
|
(0.07) |
|
(0.02) |
|
(0.02) |
|
(0.17) |
|
|
Net loss attributable to Genesis Healthcare, Inc. |
|
|
(0.89) |
|
(0.64) |
|
(0.90) |
|
(2.66) |
|
|
|
|
|
|
|
|
|
|
|
|
|
|
Shares used in computing loss per common share: |
|
|
|
|
|
|
|
|
|
|
|
Basic and diluted: |
|
|
49,865 |
|
49,865 |
|
49,865 |
|
49,865 |
|
|
1) |
The quarter ended March 31, 2015 includes two months of revenue associated with the Combination. |
|
2) |
The quarter ended March 31, 2015 includes transaction costs associated with the Combination. |
F-44
Genesis Healthcare, Inc. and Subsidiaries
Notes to Consolidated Financial Statements
|
3) |
The quarter ended December 31, 2015 includes a deferred tax valuation allowance of $221.9 million recorded as income tax expense and $28.5 million of long-lived asset impairments. |
|
4) |
The quarter ended December 31, 2014 includes a $35.5 million self-insured program adjustment for the actuarial developed GLPL and workers' compensation claims related to prior policy years specifically to the Sun Merger, $31.4 million of long-lived asset impairments and $8.0 million of transaction costs associated with the Combination. |
|
5) |
|
(23) Subsequent Events
Sale of Kansas ALFs
On January 1, 2016, the Company sold 18 assisted/senior living facilities located in Kansas for $67.0 million. $54.2 million of the proceeds were used to pay down the Skilled Real Estate Bridge Loan.
Sale of Hospice and Home Health
On March 9, 2016, the Company announced that it has signed an agreement with Compassus, a nationwide network of community-based hospice and palliative care programs, to sell the majority of its hospice and home health operations for $84 million.
F-45
GENESIS HEALTHCARE, INC. AND SUBSIDIARIES
SCHEDULE II—VALUATION AND QUALIFYING ACCOUNTS
FOR THE YEARS ENDED DECEMBER 31, 2015, 2014 AND 2013
|
|
|
Balance at |
|
|
|
|
|
|
|
|
|
|
|
|
|
beginning of the |
|
Charged to cost |
|
Deductions or |
|
Balance at end of |
||||
|
|
|
period |
|
and expenses (1) |
|
payments |
|
the period |
||||
|
Allowance for loss on accounts receivable |
|
|
|
|
|
|
|
|
|
|
|
|
|
Year ended December 31, 2013 |
|
$ |
68,419 |
|
$ |
64,268 |
|
$ |
(26,594) |
|
$ |
106,093 |
|
Year ended December 31, 2014 |
|
|
106,093 |
|
|
70,950 |
|
|
(43,514) |
|
|
133,529 |
|
Year ended December 31, 2015 |
|
$ |
133,529 |
|
$ |
86,224 |
|
$ |
(30,014) |
|
$ |
189,739 |
|
(1) |
Amounts per year differ from the provision for losses on accounts receivable due to discontinued operations as well as managed care coinsurance reserves and other adjustments, which are included in the provision for loss on accounts receivable but not in the allowance for loss on accounts receivable. |
F-46