Attached files
| file | filename |
|---|---|
| EX-32 - EXHIBIT 32 - GATX CORP | gmt-20150630xexhibit32.htm |
| EX-31.A - EXHIBIT 31.A - GATX CORP | gmt-20150630xexhibit31a.htm |
| EX-31.B - EXHIBIT 31.B - GATX CORP | gmt-20150630xexhibit31b.htm |
| EX-10.1 - EXHIBIT 10.1 - GATX CORP | gmt20150630exhibit101.htm |
UNITED STATES
SECURITIES AND EXCHANGE COMMISSION
Washington, D.C. 20549
__________________________________________
FORM 10-Q
__________________________________________
x | QUARTERLY REPORT PURSUANT TO SECTION 13 OR 15(d) OF THE SECURITIES EXCHANGE ACT OF 1934 |
For the quarterly period ended June 30, 2015
or
¨ | TRANSITION REPORT PURSUANT TO SECTION 13 OR 15(d) OF THE SECURITIES EXCHANGE ACT OF 1934 |
Commission File Number: 1-2328

GATX Corporation
(Exact name of registrant as specified in its charter)
New York | 36-1124040 |
(State of incorporation) | (I.R.S. Employer Identification No.) |
222 West Adams Street | |
Chicago, Illinois 60606-5314 | |
(Address of principal executive offices, including zip code) | |
(312) 621-6200 | |
(Registrant's telephone number, including area code) | |
Indicate by check mark whether the registrant (1) has filed all reports required to be filed by Section 13 or 15(d) of the Securities Exchange Act of 1934 during the preceding 12 months (or for such shorter period that the registrant was required to file such reports), and (2) has been subject to such filing requirements for the past 90 days. Yes x No ¨
Indicate by check mark whether the registrant has submitted electronically and posted on its corporate Web site, if any, every Interactive Data File required to be submitted and posted pursuant to Rule 405 of Regulation S-T (§232.405 of this chapter) during the preceding 12 months (or for such shorter period that the registrant was required to submit and post such files). Yes x No ¨
Indicate by check mark whether the registrant is a large accelerated filer, an accelerated filer, a non-accelerated filer, or a smaller reporting company (as defined in Rule 12b-2 of the Exchange Act).
x | Large accelerated filer | ¨ | Accelerated filer | ||
¨ | Non-accelerated filer | ¨ | Smaller reporting company | ||
Indicate by check mark whether the registrant is a shell company (as defined in Rule 12b-2 of the Exchange Act).
Yes ¨ No x
As of June 30, 2015, 43.2 million common shares were outstanding.
GATX CORPORATION
FORM 10-Q
QUARTERLY REPORT FOR THE PERIOD ENDED JUNE 30, 2015
INDEX
Item No. | Page No. | |
Forward-Looking Statements | ||
Item 1. | ||
Item 2. | ||
Item 3. | ||
Item 4. | ||
Item 1. | ||
Item 1A. | ||
Item 2. | Unregistered Sales of Equity Securities and Use of Proceeds | |
Item 6. | ||
FORWARD-LOOKING STATEMENTS
Forward looking statements in this report that are not historical facts are "forward-looking statements" within the meaning of the Private Securities Litigation Reform Act of 1995. These include statements that reflect our current views with respect to, among other things, future events, financial performance and market conditions. In some cases, you can identify forward-looking statements by the use of words such as “may,” “could,” “expect,” “intend,” “plan,” “seek,” “anticipate,” “believe,” “estimate,” “predict,” “potential,” “continue,” “likely,” “will,” “would” and variations of these terms and similar expressions, or the negative of these terms or similar expressions.
A detailed discussion of the known material risks and uncertainties that could cause actual results and events to differ materially from such forward-looking statements is included in our Annual Report on Form 10-K for the year ended December 31, 2014, and in our other filings with the Securities and Exchange Commission. Specific risks and uncertainties include, but are not limited to, (1) changes in regulatory requirements for tank cars carrying crude, ethanol, and other flammable liquids, (2) competitive factors in our primary markets, (3) weak economic conditions, financial market volatility, and other factors that may decrease demand for our assets and services, (4) inability to maintain our assets on lease at satisfactory rates, (5) changes to, or failure to comply with, laws, rules, and regulations applicable to our assets and operations, (6) operational disruption and increased costs associated with compliance maintenance programs and other maintenance initiatives, (7) financial and operational risks associated with long-term railcar purchase commitments, (8) deterioration of conditions in the capital markets, reductions in our credit ratings, or increases in our financing costs, (9) events having an adverse impact on assets, customers, or regions where we have a large investment, (10) decreased demand for certain railcars used in the petroleum industry due to sustained low crude oil prices, (11) risks related to international operations and expansion into new geographic markets, (12) inadequate allowances to cover credit losses in our portfolio, (13) asset impairment charges we may be required to recognize, (14) environmental remediation costs or a negative outcome in pending or threatened litigation, (15) inability to obtain cost-effective insurance, (16) fluctuations in foreign exchange rates, (17) operational and financial risks related to our affiliate investments, (18) reduced opportunities to generate asset remarketing income, (19) failure to successfully negotiate collective bargaining agreements with the unions representing a substantial portion of our employees and (20) other risks discussed in our filings with the US Securities and Exchange Commission ("SEC"), including our Form 10-K for the year ended December 31, 2014, all of which are available on the SEC's website (www.sec.gov). You should not place undue reliance on forward-looking statements, which speak only as of the date they are made and are not guarantees of future performance. The Company undertakes no obligation to publicly update or revise any forward-looking statements.
1
PART I - FINANCIAL INFORMATION
Item 1. Financial Statements
GATX CORPORATION AND SUBSIDIARIES
CONSOLIDATED BALANCE SHEETS (UNAUDITED)
(In millions, except share data)
June 30 | December 31 | ||||||
2015 | 2014 | ||||||
Assets | |||||||
Cash and Cash Equivalents | $ | 58.6 | $ | 209.9 | |||
Restricted Cash | 13.3 | 14.5 | |||||
Receivables | |||||||
Rent and other receivables | 76.3 | 86.0 | |||||
Loans | 12.5 | 97.3 | |||||
Finance leases | 177.9 | 174.7 | |||||
Less: allowance for losses | (6.0 | ) | (5.7 | ) | |||
260.7 | 352.3 | ||||||
Operating Assets and Facilities ($123.0 and $123.1 related to a consolidated VIE) | 8,341.3 | 8,143.5 | |||||
Less: allowance for depreciation ($37.4 and $35.0 related to a consolidated VIE) | (2,506.9 | ) | (2,455.5 | ) | |||
5,834.4 | 5,688.0 | ||||||
Investments in Affiliated Companies | 368.7 | 357.7 | |||||
Goodwill | 81.2 | 86.1 | |||||
Other Assets | 243.1 | 229.0 | |||||
Total Assets | $ | 6,860.0 | $ | 6,937.5 | |||
Liabilities and Shareholders’ Equity | |||||||
Accounts Payable and Accrued Expenses | $ | 171.3 | $ | 165.9 | |||
Debt | |||||||
Commercial paper and borrowings under bank credit facilities | 3.8 | 72.1 | |||||
Recourse | 4,208.1 | 4,179.9 | |||||
Nonrecourse ($11.5 and $15.9 related to a consolidated VIE) | 11.5 | 15.9 | |||||
Capital lease obligations | 5.0 | 6.3 | |||||
4,228.4 | 4,274.2 | ||||||
Deferred Income Taxes | 974.5 | 937.3 | |||||
Other Liabilities | 200.4 | 246.1 | |||||
Total Liabilities | 5,574.6 | 5,623.5 | |||||
Shareholders’ Equity | |||||||
Common stock, $0.625 par value: Authorized shares — 120,000,000 Issued shares — 66,727,318 and 66,600,984 Outstanding shares — 43,218,915 and 44,198,850 | 41.5 | 41.4 | |||||
Additional paid in capital | 673.8 | 672.8 | |||||
Retained earnings | 1,574.9 | 1,501.7 | |||||
Accumulated other comprehensive loss | (183.3 | ) | (148.4 | ) | |||
Treasury stock at cost (23,508,403 and 22,402,134 shares) | (821.5 | ) | (753.5 | ) | |||
Total Shareholders’ Equity | 1,285.4 | 1,314.0 | |||||
Total Liabilities and Shareholders’ Equity | $ | 6,860.0 | $ | 6,937.5 | |||
See accompanying notes to consolidated financial statements.
2
GATX CORPORATION AND SUBSIDIARIES
CONSOLIDATED STATEMENTS OF COMPREHENSIVE INCOME (UNAUDITED)
(In millions, except per share data)
Three Months Ended June 30 | Six Months Ended June 30 | ||||||||||||||
2015 | 2014 | 2015 | 2014 | ||||||||||||
Revenues | |||||||||||||||
Lease revenue | $ | 280.6 | $ | 274.3 | $ | 558.9 | $ | 524.9 | |||||||
Marine operating revenue | 66.0 | 72.2 | 90.2 | 89.9 | |||||||||||
Other revenue | 18.7 | 19.3 | 35.9 | 37.6 | |||||||||||
Total Revenues | 365.3 | 365.8 | 685.0 | 652.4 | |||||||||||
Expenses | |||||||||||||||
Maintenance expense | 80.2 | 84.0 | 158.5 | 157.1 | |||||||||||
Marine operating expense | 47.3 | 54.6 | 66.2 | 69.6 | |||||||||||
Depreciation expense | 74.4 | 71.1 | 142.9 | 129.8 | |||||||||||
Operating lease expense | 22.4 | 27.3 | 43.1 | 54.2 | |||||||||||
Other operating expense | 7.8 | 6.7 | 15.1 | 13.3 | |||||||||||
Selling, general and administrative expense | 44.6 | 44.9 | 90.3 | 87.6 | |||||||||||
Total Expenses | 276.7 | 288.6 | 516.1 | 511.6 | |||||||||||
Other Income (Expense) | |||||||||||||||
Net gain on asset dispositions | 8.7 | 28.2 | 54.0 | 56.3 | |||||||||||
Interest expense, net | (38.5 | ) | (39.5 | ) | (79.4 | ) | (81.5 | ) | |||||||
Other expense | (1.6 | ) | (4.9 | ) | (5.6 | ) | (8.3 | ) | |||||||
Income before Income Taxes and Share of Affiliates’ Earnings | 57.2 | 61.0 | 137.9 | 107.3 | |||||||||||
Income Taxes | (20.8 | ) | (20.2 | ) | (47.8 | ) | (34.3 | ) | |||||||
Share of Affiliates’ Earnings, Net of Taxes | 9.0 | 12.3 | 17.5 | 22.2 | |||||||||||
Net Income | $ | 45.4 | $ | 53.1 | $ | 107.6 | $ | 95.2 | |||||||
Other Comprehensive Income, Net of Taxes | |||||||||||||||
Foreign currency translation adjustments | 11.5 | (1.9 | ) | (36.5 | ) | (1.2 | ) | ||||||||
Unrealized (loss) gain on securities | (0.1 | ) | 0.1 | (0.1 | ) | (0.1 | ) | ||||||||
Unrealized gain (loss) on derivative instruments | 0.1 | 0.8 | (2.5 | ) | 1.5 | ||||||||||
Post-retirement benefit plans | 2.1 | 1.7 | 4.2 | 3.1 | |||||||||||
Other comprehensive income (loss) | 13.6 | 0.7 | (34.9 | ) | 3.3 | ||||||||||
Comprehensive Income | $ | 59.0 | $ | 53.8 | $ | 72.7 | $ | 98.5 | |||||||
Share Data | |||||||||||||||
Basic earnings per share | $ | 1.04 | $ | 1.17 | $ | 2.46 | $ | 2.08 | |||||||
Average number of common shares | 43.5 | 45.5 | 43.8 | 45.7 | |||||||||||
Diluted earnings per share | $ | 1.03 | $ | 1.15 | $ | 2.42 | $ | 2.05 | |||||||
Average number of common shares and common share equivalents | 44.2 | 46.3 | 44.5 | 46.5 | |||||||||||
Dividends declared per common share | $ | 0.38 | $ | 0.33 | $ | 0.76 | $ | 0.66 | |||||||
See accompanying notes to consolidated financial statements.
3
GATX CORPORATION AND SUBSIDIARIES
CONSOLIDATED STATEMENTS OF CASH FLOWS (UNAUDITED)
(In millions)
Six Months Ended June 30 | |||||||
2015 | 2014 | ||||||
Operating Activities | |||||||
Net income | $ | 107.6 | $ | 95.2 | |||
Adjustments to reconcile net income to net cash provided by operating activities: | |||||||
Depreciation expense | 149.1 | 136.5 | |||||
Gains on sales of assets | (50.7 | ) | (50.0 | ) | |||
Deferred income taxes | 40.0 | 27.8 | |||||
Share of affiliates’ earnings, net of dividends | (17.3 | ) | (2.5 | ) | |||
Change in accrued operating lease expense | (33.2 | ) | (22.0 | ) | |||
Other | (4.0 | ) | (16.9 | ) | |||
Net cash provided by operating activities | 191.5 | 168.1 | |||||
Investing Activities | |||||||
Portfolio investments and capital additions | (356.2 | ) | (655.1 | ) | |||
Purchases of leased-in assets | (99.5 | ) | (150.5 | ) | |||
Portfolio proceeds | 211.5 | 137.8 | |||||
Proceeds from sales of other assets | 12.9 | 16.3 | |||||
Net decrease in restricted cash | 1.2 | 7.2 | |||||
Other | 9.7 | — | |||||
Net cash used in investing activities | (220.4 | ) | (644.3 | ) | |||
Financing Activities | |||||||
Net proceeds from issuances of debt (original maturities longer than 90 days) | 689.0 | 876.6 | |||||
Repayments of debt (original maturities longer than 90 days) | (645.2 | ) | (665.8 | ) | |||
Net (decrease) increase in debt with original maturities of 90 days or less | (68.1 | ) | 117.1 | ||||
Stock repurchases | (64.1 | ) | (88.5 | ) | |||
Dividends | (35.2 | ) | (32.2 | ) | |||
Other | 5.1 | (1.5 | ) | ||||
Net cash (used in) provided by financing activities | (118.5 | ) | 205.7 | ||||
Effect of Exchange Rate Changes on Cash and Cash Equivalents | (3.9 | ) | 1.1 | ||||
Net decrease in Cash and Cash Equivalents | (151.3 | ) | (269.4 | ) | |||
Cash and Cash Equivalents, beginning of period | 209.9 | 379.7 | |||||
Cash and Cash Equivalents, end of period | $ | 58.6 | $ | 110.3 | |||
Noncash Investing Transactions | |||||||
Distributions from affiliates (1) | $ | — | $ | 1.1 | |||
_________
(1) In 2014, we received distributions of 62 railcars from our Southern Capital affiliate.
See accompanying notes to consolidated financial statements.
4
NOTES TO CONSOLIDATED FINANCIAL STATEMENTS (UNAUDITED)
NOTE 1. Description of Business
As used herein, "GATX," "we," "us," "our," and similar terms refer to GATX Corporation and its subsidiaries, unless indicated otherwise.
We lease, operate, manage, and remarket long-lived, widely-used assets, primarily in the rail and marine markets. We also invest in joint ventures that complement our existing business activities. We report our financial results through four primary business segments: Rail North America, Rail International, American Steamship Company (“ASC”), and Portfolio Management.
NOTE 2. Basis of Presentation
We prepared the accompanying unaudited consolidated financial statements in accordance with US Generally Accepted Accounting Principles ("GAAP") for interim financial information and the instructions to Form 10-Q and Article 10 of Regulation S-X. Accordingly, our unaudited consolidated financial statements do not include all of the information and footnotes required for complete financial statements. We have included all of the normal recurring adjustments that we deemed necessary for a fair presentation.
Operating results for the six months ended June 30, 2015, are not necessarily indicative of the results we may achieve for the entire year ending December 31, 2015. In particular, ASC's fleet is inactive for a significant portion of the first quarter of each year due to winter conditions on the Great Lakes. In addition, asset remarketing income does not occur evenly throughout the year. For more information, refer to the consolidated financial statements and footnotes in our Annual Report on Form 10-K for the year ended December 31, 2014.
Accounting Changes
Discontinued Operations
In April 2014, the Financial Accounting Standards Board ("FASB") issued amendments to authoritative guidance for reporting discontinued operations and disposals of components of an entity. The amendments require that disposals representing strategic shifts that have (or will have) a major effect on an entity’s operations or financial results should be reported as discontinued operations. The amendments also expand the disclosure requirements for both discontinued operations and significant dispositions that do not qualify as discontinued operations.
The amendments were effective for us beginning in the first quarter of 2015. Adoption of the new guidance did not impact the amount or timing of net income or the presentation and disclosures of our financial statements.
New Accounting Pronouncements
Debt Issue Costs
In April 2015, the FASB issued authoritative guidance that requires presentation of debt issue costs as a deduction from the carrying amount of the related debt liability on the balance sheet, rather than as a deferred charge. The new guidance is effective for us beginning in the first quarter of 2016, with early adoption permitted. Adoption of the new guidance is not expected to impact the amount or timing of net income but may result in changes to the presentation and disclosures of our financial statements.
Consolidation
In February 2015, the FASB issued authoritative guidance amending the analysis required to determine whether to consolidate certain types of legal entities such as limited partnerships, limited liability corporations, and certain securitization structures. The new guidance is effective for us beginning in the first quarter of 2016, with early adoption permitted. We are currently evaluating the effect, if any, the new guidance will have on our financial statements and related disclosures.
5
NOTES TO CONSOLIDATED FINANCIAL STATEMENTS (UNAUDITED) (Continued)
Revenue from Contracts with Customers
In May 2014, the FASB issued authoritative accounting guidance that supersedes most current revenue recognition guidance, including industry-specific guidance. The new guidance requires companies to recognize revenue to depict the transfer of promised goods or services to customers in an amount that reflects the consideration it expects to be entitled to in exchange for those goods or services.
In July 2015, the FASB deferred the effective date of this standard from the first quarter of 2017 to the first quarter of 2018. Early adoption is permitted as of the original effective date. We can adopt the new guidance using either the retrospective method or the cumulative effect transition method. We are still evaluating the effect that the new guidance will have on our consolidated financial statements and related disclosures, including which transition method we will use and when we will choose to adopt this standard.
NOTE 3. Variable Interest Entities
We are the primary beneficiary of one of our variable interest entities, a structured lease financing of a portfolio of railcars, because we have the power to direct its significant activities. As a result, we consolidate this variable interest entity. The risks associated with it are similar to those of our wholly owned railcar leasing activities.
The following table shows the carrying amounts of assets and liabilities of the consolidated variable interest entity (in millions):
June 30 2015 | December 31 2014 | ||||||
Operating assets, net of accumulated depreciation (1) | $ | 85.6 | $ | 88.1 | |||
Nonrecourse debt | 11.5 | 15.9 | |||||
_________
(1) | All operating assets are pledged as collateral on the nonrecourse debt. |
We determined that we are not the primary beneficiary of our other variable interest entities, which are primarily investments in equipment leasing affiliates that were financed through a variety of equity investments and third party lending arrangements. We are not the primary beneficiary of these variable interest entities because we do not have the power to direct the activities that most significantly impact the entities’ economic performance. For investments in affiliates we determined were variable interest entities, we concluded that power was shared by the affiliate partners based on the terms of the relevant joint venture agreements, which require approval of all partners for significant decisions regarding the variable interest entity.
The following table shows the carrying amounts and maximum exposure to loss for our unconsolidated variable interest entities (in millions):
June 30, 2015 | December 31, 2014 | ||||||||||||||
Net Carrying Amount | Maximum Exposure to Loss | Net Carrying Amount | Maximum Exposure to Loss | ||||||||||||
Investments in affiliates | $ | 153.4 | $ | 153.4 | $ | 143.9 | $ | 143.9 | |||||||
Other investment | 0.3 | 0.3 | 0.4 | 0.4 | |||||||||||
Total | $ | 153.7 | $ | 153.7 | $ | 144.3 | $ | 144.3 | |||||||
6
NOTES TO CONSOLIDATED FINANCIAL STATEMENTS (UNAUDITED) (Continued)
NOTE 4. Fair Value Disclosure
The following tables show our assets and liabilities that are measured at fair value on a recurring basis (in millions):
Assets | June 30, 2015 | Quoted Prices in Active Markets for Identical Assets (Level 1) | Significant Observable Inputs (Level 2) | Significant Unobservable Inputs (Level 3) | |||||||||||
Interest rate derivatives (1) | $ | 1.6 | $ | — | $ | 1.6 | $ | — | |||||||
Foreign exchange rate derivatives (1) | 7.8 | — | 7.8 | — | |||||||||||
Foreign exchange rate derivatives (2) | 1.6 | — | 1.6 | — | |||||||||||
Available-for-sale equity securities | 4.2 | 4.2 | — | — | |||||||||||
Liabilities | |||||||||||||||
Foreign exchange rate derivatives (1) | 4.2 | — | 4.2 | — | |||||||||||
Foreign exchange rate derivatives (2) | 2.5 | — | 2.5 | — | |||||||||||
Assets | December 31, 2014 | Quoted Prices in Active Markets for Identical Assets (Level 1) | Significant Observable Inputs (Level 2) | Significant Unobservable Inputs (Level 3) | |||||||||||
Interest rate derivatives (1) | $ | 1.8 | $ | — | $ | 1.8 | $ | — | |||||||
Foreign exchange rate derivatives (2) | 9.7 | — | 9.7 | — | |||||||||||
Available-for-sale equity securities | 4.4 | 4.4 | — | — | |||||||||||
Liabilities | |||||||||||||||
Interest rate derivatives (1) | 5.9 | — | 5.9 | — | |||||||||||
Foreign exchange rate derivatives (2) | 1.6 | — | 1.6 | — | |||||||||||
_________
(1) Designated as hedges.
(2) Not designated as hedges.
We base our valuations of available-for-sale equity securities on their quoted prices on an active exchange. We value derivatives using a pricing model with inputs (such as yield curves and foreign currency rates) that are observable in the market or that can be derived principally from observable market data.
Derivative instruments
Fair Value Hedges
We use interest rate swaps to manage the fixed-to-floating rate mix of our debt obligations by converting the fixed rate debt to floating rate debt. For fair value hedges, we recognize changes in fair value of both the derivative and the hedged item as interest expense. We had eight instruments outstanding with an aggregate notional amount of $550.0 million as of June 30, 2015 that mature from 2017 to 2020, and eight instruments outstanding with an aggregate notional amount of $600.0 million as of December 31, 2014 that mature from 2015 to 2020.
7
NOTES TO CONSOLIDATED FINANCIAL STATEMENTS (UNAUDITED) (Continued)
Cash Flow Hedges
We use interest rate swaps to convert floating rate debt to fixed rate debt. We use Treasury rate locks to hedge our exposure to interest rate risk on anticipated transactions. We also use currency swaps to hedge our exposure to fluctuations in the exchange rates of the foreign currencies in which we conduct business. We had seven instruments outstanding with an aggregate notional amount of $346.2 million as of June 30, 2015, and seven instruments outstanding with an aggregate notional amount of $281.5 million as of December 31, 2014. These derivatives had maturities ranging from 2015 to 2022. Within the next 12 months, we expect to reclassify $5.7 million ($3.6 million after-tax) of net losses on previously terminated derivatives from accumulated other comprehensive loss. We reclassify these amounts when interest and operating lease expense on the related hedged transactions affect earnings.
Non-designated Derivatives
We do not hold derivative financial instruments for purposes other than hedging, although certain of our derivatives are not designated as accounting hedges. We recognize changes in the fair value of these derivatives in other (income) expense immediately.
Some of our derivative instruments contain credit risk provisions that could require us to make immediate payment on net liability positions in the event that we default on certain outstanding debt obligations. The aggregate fair value of our derivative instruments with credit risk related contingent features that are in a liability position as of June 30, 2015, was $4.2 million. We are not required to post any collateral on our derivative instruments and do not expect the credit risk provisions to be triggered.
In the event that a counterparty fails to meet the terms of an interest rate swap agreement or a foreign exchange contract, our exposure is limited to the fair value of the swap, if in our favor. We manage the credit risk of counterparties by transacting with institutions that we consider financially sound and by avoiding concentrations of risk with a single counterparty. We believe that the risk of non-performance by any of our counterparties is remote.
The following table shows the impacts of our derivative instruments on our statements of comprehensive income (in millions):
Three Months Ended June 30 | Six Months Ended June 30 | |||||||||||||||||
Derivative Designation | Location of Loss (Gain) Recognized | 2015 | 2014 | 2015 | 2014 | |||||||||||||
Fair value hedges (1) | Interest expense | $ | 1.4 | $ | (0.5 | ) | $ | (0.9 | ) | $ | 1.6 | |||||||
Cash flow hedges | Other comprehensive (income) loss (effective portion) | 10.9 | 1.4 | 2.5 | 3.2 | |||||||||||||
Cash flow hedges | Interest expense (effective portion reclassified from accumulated other comprehensive loss) | 1.4 | 1.2 | 2.7 | 2.4 | |||||||||||||
Cash flow hedges | Operating lease expense (effective portion reclassified from accumulated other comprehensive loss) | 0.1 | 0.3 | 0.2 | 0.5 | |||||||||||||
Cash flow hedges (2) | Other (income) expense (effective portion reclassified from accumulated other comprehensive loss) | 12.6 | — | 4.2 | 2.2 | |||||||||||||
Non-designated (3) | Other (income) expense | (1.6 | ) | 0.9 | (5.8 | ) | 1.0 | |||||||||||
_________
(1) The fair value adjustments related to the underlying debt equally offset the amounts recognized in interest expense.
(2) For 2015, includes $12.6 million and $2.7 million of losses for the three and six months ended June 30, 2015 on foreign currency derivatives which are substantially offset by gains from foreign currency remeasurement adjustments, also recognized in Other (income) expense.
(3) For 2015, includes $5.1 million of gains on foreign currency derivatives which are substantially offset by losses from foreign currency remeasurement adjustments on the AAE loan, also recognized in Other (income) expense.
8
NOTES TO CONSOLIDATED FINANCIAL STATEMENTS (UNAUDITED) (Continued)
Other Financial Instruments
The carrying amounts of cash and cash equivalents, restricted cash, rent and other receivables, accounts payable, and commercial paper and bank credit facilities approximate fair value due to the short maturity of those instruments. We base the fair values of investment funds, which are accounted for under the cost method, on the best information available, which may include quoted investment fund values. We estimate the fair values of loans and fixed and floating rate debt using discounted cash flow analyses based on interest rates currently offered for loans with similar terms to borrowers of similar credit quality. The estimated fair values for these investments are classified in Level 2 of the fair value hierarchy because they are based on directly or indirectly observable inputs.
The following table shows the carrying amounts and fair values of our other financial instruments as of (in millions):
June 30, 2015 | December 31, 2014 | ||||||||||||||
Carrying Amount | Fair Value | Carrying Amount | Fair Value | ||||||||||||
Assets | |||||||||||||||
Investment funds | $ | 0.8 | $ | 1.8 | $ | 1.5 | $ | 2.4 | |||||||
Loans | 12.5 | 12.6 | 97.3 | 97.4 | |||||||||||
Liabilities | |||||||||||||||
Recourse fixed rate debt | $ | 3,990.8 | $ | 4,022.0 | $ | 3,639.9 | $ | 3,775.0 | |||||||
Recourse floating rate debt | 217.3 | 216.5 | 540.0 | 540.0 | |||||||||||
Nonrecourse debt | 11.5 | 11.9 | 15.9 | 16.6 | |||||||||||
9
NOTES TO CONSOLIDATED FINANCIAL STATEMENTS (UNAUDITED) (Continued)
NOTE 5. Pension and Other Post-Retirement Benefits
The following table shows components of our pension and other post-retirement benefits expense for the three months ended June 30, 2015 and 2014 (in millions):
2015 Pension Benefits | 2014 Pension Benefits | 2015 Retiree Health and Life | 2014 Retiree Health and Life | ||||||||||||
Service cost | $ | 2.0 | $ | 1.6 | $ | 0.1 | $ | 0.1 | |||||||
Interest cost | 5.0 | 5.3 | 0.3 | 0.4 | |||||||||||
Expected return on plan assets | (6.4 | ) | (7.1 | ) | — | — | |||||||||
Amortization of (1): | |||||||||||||||
Unrecognized prior service credit | (0.3 | ) | (0.3 | ) | (0.1 | ) | (0.1 | ) | |||||||
Unrecognized net actuarial loss (gain) | 3.9 | 3.1 | — | (0.1 | ) | ||||||||||
Net expense | $ | 4.2 | $ | 2.6 | $ | 0.3 | $ | 0.3 | |||||||
The following table shows components of our pension and other post-retirement benefits expense for the six months ended June 30, 2015 and 2014 (in millions):
2015 Pension Benefits | 2014 Pension Benefits | 2015 Retiree Health and Life | 2014 Retiree Health and Life | ||||||||||||
Service cost | $ | 3.7 | $ | 3.0 | $ | 0.1 | $ | 0.1 | |||||||
Interest cost | 9.9 | 10.4 | 0.7 | 0.8 | |||||||||||
Expected return on plan assets | (12.9 | ) | (14.3 | ) | — | — | |||||||||
Amortization of (1): | |||||||||||||||
Unrecognized prior service credit | (0.5 | ) | (0.5 | ) | (0.1 | ) | (0.1 | ) | |||||||
Unrecognized net actuarial loss (gain) | 7.4 | 5.7 | — | (0.1 | ) | ||||||||||
Net expense | $ | 7.6 | $ | 4.3 | $ | 0.7 | $ | 0.7 | |||||||
_________
(1) Amounts reclassified from accumulated other comprehensive loss.
10
NOTES TO CONSOLIDATED FINANCIAL STATEMENTS (UNAUDITED) (Continued)
NOTE 6. Share-Based Compensation
During the six months ended of 2015, we granted 341,800 stock appreciation rights (“SARs”), 65,850 restricted stock units, 61,740 performance shares, and 5,617 phantom stock units. For the three and six months ended June 30, 2015, total share-based compensation expense was $3.2 million and $6.1 million and the related tax benefits were $1.2 million and $2.3 million. For the three and six months ended June 30, 2014, total share-based compensation expense was $3.1 million and $6.2 million and the related tax benefits were $1.2 million and $2.3 million.
The estimated fair value of our 2015 SARs awards and related underlying assumptions are shown in the table below.
2015 | |||
Estimated fair value | $ | 18.16 | |
Quarterly dividend rate | $ | 0.38 | |
Expected term of stock appreciation rights, in years | 4.7 | ||
Risk-free interest rate | 1.2 | % | |
Dividend yield | 2.6 | % | |
Expected stock price volatility | 29.2 | % | |
Present value of dividends | $ | 6.90 | |
NOTE 7. Income Taxes
Our effective tax rate was 35% for the six months ended June 30, 2015, compared to 32% for the six months ended June 30, 2014. The difference in the effective rates for the prior year, compared to the statutory rate of 35%, is primarily attributable to the mix of pretax income among domestic and foreign jurisdictions which are taxed at different rates. The current year reflects a higher contribution from domestic source income, which is taxed at a higher rate, as well as the impact of an increase in the statutory tax rate in Alberta, Canada.
As of June 30, 2015, our gross liability for unrecognized tax benefits was $5.6 million. If fully recognized, these tax benefits would decrease our income tax expense by $5.6 million ($3.6 million, net of federal tax). We do not anticipate the recognition of any tax benefits that were previously unrecognized within the next 12 months.
11
NOTES TO CONSOLIDATED FINANCIAL STATEMENTS (UNAUDITED) (Continued)
NOTE 8. Commercial Commitments
We have entered into various commercial commitments, such as guarantees and standby letters of credit, related to certain transactions. These commercial commitments require us to fulfill specific obligations in the event of third party demands. Similar to our balance sheet investments, these commitments expose us to credit, market, and equipment risk. Accordingly, we evaluate these commitments and other contingent obligations using techniques similar to those we use to evaluate funded transactions.
The following table shows our commercial commitments (in millions):
June 30 2015 | December 31 2014 | ||||||
Lease payment guarantees | $ | 25.4 | $ | 28.5 | |||
Standby letters of credit | 8.6 | 8.7 | |||||
Performance bonds | 0.4 | 0.4 | |||||
Total commercial commitments (1) | $ | 34.4 | $ | 37.6 | |||
_________
(1) The carrying value of liabilities on the balance sheet for commercial commitments was $4.6 million at June 30, 2015 and $5.1 million at December 31, 2014. The expirations of these commitments range from 2017 to 2023. We are not aware of any event that would require us to satisfy any of our commitments.
Lease payment guarantees are commitments to financial institutions to make lease payments for a third party in the event they default. We reduce any liability that may result from these guarantees by the value of the underlying asset or group of assets.
We are also parties to standby letters of credit and performance bonds, which primarily relate to contractual obligations and general liability insurance coverages. No material claims have been made against these obligations, and no material losses are anticipated.
NOTE 9. Earnings per Share
We compute basic earnings per share by dividing net income available to our common shareholders by the weighted average number of shares of our common stock outstanding. We appropriately weighted shares issued or reacquired during the period that they were outstanding. Our diluted earnings per share reflect the impacts of our potentially dilutive securities and our equity compensation awards.
In the first quarter of 2014, our board of directors authorized a $250 million share repurchase program. During the first six months of 2015, 1.2 million shares were acquired for $68.0 million. As of June 30, 2015, a total of 3.1 million shares had been repurchased for $192.5 million, and $57.5 million was available under the repurchase authorization.
The following table shows the computation of our basic and diluted net income per common share (in millions, except per share amounts):
Three Months Ended June 30 | Six Months Ended June 30 | ||||||||||||||
2015 | 2014 | 2015 | 2014 | ||||||||||||
Numerator: | |||||||||||||||
Net income | $ | 45.4 | $ | 53.1 | $ | 107.6 | $ | 95.2 | |||||||
Denominator: | |||||||||||||||
Weighted average shares outstanding - basic | 43.5 | 45.5 | 43.8 | 45.7 | |||||||||||
Effect of dilutive securities: | |||||||||||||||
Equity compensation plans | 0.7 | 0.8 | 0.7 | 0.8 | |||||||||||
Weighted average shares outstanding - diluted | 44.2 | 46.3 | 44.5 | 46.5 | |||||||||||
Basic earnings per share | $ | 1.04 | $ | 1.17 | $ | 2.46 | $ | 2.08 | |||||||
Diluted earnings per share | $ | 1.03 | $ | 1.15 | $ | 2.42 | $ | 2.05 | |||||||
12
NOTES TO CONSOLIDATED FINANCIAL STATEMENTS (UNAUDITED) (Continued)
NOTE 10. Accumulated Other Comprehensive Loss
The following table shows the change in components for accumulated other comprehensive loss (in millions):
Foreign Currency Translation Gain (Loss) | Unrealized Gain (Loss) on Securities | Unrealized Gain (Loss) on Derivative Instruments | Post-Retirement Benefit Plans | Total | |||||||||||||||
Balance at December 31, 2014 | $ | (21.9 | ) | $ | 0.3 | $ | (19.1 | ) | $ | (107.7 | ) | $ | (148.4 | ) | |||||
Change in component | (48.0 | ) | — | 6.0 | — | (42.0 | ) | ||||||||||||
Reclassification adjustments into earnings | — | — | (7.0 | ) | 3.3 | (3.7 | ) | ||||||||||||
Income tax effect | — | — | (1.6 | ) | (1.2 | ) | (2.8 | ) | |||||||||||
Balance at March 31, 2015 | $ | (69.9 | ) | $ | 0.3 | $ | (21.7 | ) | $ | (105.6 | ) | $ | (196.9 | ) | |||||
Change in component | 11.5 | (0.2 | ) | (13.3 | ) | — | (2.0 | ) | |||||||||||
Reclassification adjustments into earnings | — | — | 14.1 | 3.5 | 17.6 | ||||||||||||||
Income tax effect | — | 0.1 | (0.7 | ) | (1.4 | ) | (2.0 | ) | |||||||||||
Balance at June 30, 2015 | $ | (58.4 | ) | $ | 0.2 | $ | (21.6 | ) | $ | (103.5 | ) | $ | (183.3 | ) | |||||
See "Note 4. Fair Value Disclosure" and "Note 5. Pension and Other Post-Retirement Benefits" for impacts of the reclassification adjustments on the statement of comprehensive income.
NOTE 11. Legal Proceedings and Other Contingencies
Various legal actions, claims, assessments and other contingencies arising in the ordinary course of business are pending against GATX and certain of our subsidiaries. These matters are subject to many uncertainties, and it is possible that some of these matters could ultimately be decided, resolved or settled adversely. For a full discussion of our pending legal matters, please refer to "Note 23. Legal Proceedings and Other Contingencies" of our consolidated financial statements in our Annual Report on Form 10-K for the year ended December 31, 2014.
Viareggio Derailment
In June 2009, a train consisting of fourteen liquefied petroleum gas (“LPG”) tank cars owned by GATX Rail Austria GmbH (an indirect subsidiary of the Company, "GATX Rail Austria") and its subsidiaries derailed while passing through the City of Viareggio, in the province of Lucca, Italy. Five tank cars overturned and one of the overturned cars was punctured by a peg or obstacle along the side of the track, resulting in a release of LPG, which subsequently ignited. Thirty-two people died and others were injured in the fire, which also resulted in property damage. The LPG tank cars were leased to FS Logistica S.p.A., a subsidiary of the Italian state-owned railway, Ferrovie dello Stato S.p.A (the “Italian Railway”).
On December 14, 2012, the Public Prosecutors of Lucca ("Public Prosecutors") formally charged GATX Rail Austria and two of its subsidiaries (collectively, "GRA"), as well as ten maintenance and supervisory employees (the "Employees"), with various negligence-based crimes related to the accident, all of which are punishable under Italian law by incarceration, damages and fines. Similar charges were brought against four Italian Railway companies and eighteen of their employees, among others. The Public Prosecutors assert that the axle on a tank car broke, causing the derailment and resulting in a tank rupture and release of LPG, after the car hit an obstacle placed on the side of the track by the Italian Railway. The Public Prosecutors further allege that a crack in the axle was detectable at the time of final inspection but was overlooked by the Employees at the Jungenthal Waggon GmbH workshop (a subsidiary of GATX Rail Austria). The trial in the Court of Lucca (the “Lucca Trial”) commenced on November 13, 2013.
13
NOTES TO CONSOLIDATED FINANCIAL STATEMENTS (UNAUDITED) (Continued)
With respect to civil claims, GRA’s insurers continue to work cooperatively with the insurer for the Italian Railway to adjust and settle personal injury and property damage claims. These joint settlement efforts have so far settled most of the significant civil claims related to the accident; however, approximately 90 civil claimants did not settle and are currently parties to the Lucca Trial. The Court of Lucca will determine both the civil and criminal liability of the defendants in the one proceeding. GRA expects that its insurers will cover any civil damages if awarded to the claimants in the Lucca trial. The Public Prosecutors and civil claimants have finished presenting their cases in the Lucca Trial. GRA, the Italian Railway, and the other defendants in the Lucca Trial will begin presenting the defense of their cases on September 16, 2015.
Since May 2012, one of the excess insurers providing coverage, Liberty Mutual Insurance Europe Limited (“Liberty”), has settled civil claims but has refused to reimburse GRA for its ongoing legal defense fees and costs, taking a position contrary to our other insurers in the prior underlying layers who had provided coverage for such expenses. As of June 30, 2015, GRA had incurred approximately $9.6 million in unreimbursed defense fees and costs, and GRA continues to incur costs in connection with the Lucca Trial. Consequently, in October 2013, GRA filed an arbitration proceeding against Liberty seeking to recoup its unreimbursed defense fees and costs (the “Liberty Arbitration”), which is set for hearing in November 2015. GRA is also negotiating issues of reimbursement for outstanding defense costs with the three other insurers in the current coverage layer, which includes a 25% share held by Liberty. GRA cannot predict the outcome of the Liberty Arbitration or the amount of defense fees and costs that ultimately may not be reimbursed by Liberty or the other excess insurers in the current coverage layer.
GRA believes that it and its Employees acted diligently and properly, but we cannot predict the outcome of the Lucca Trial or what other legal proceedings or claims, if any, may be initiated against GRA or its personnel, and, therefore, cannot reasonably estimate the possible amount or range of loss that may ultimately be incurred in connection with this accident. Accordingly, we have not established any accruals with respect to this matter.
14
NOTES TO CONSOLIDATED FINANCIAL STATEMENTS (UNAUDITED) (Continued)
NOTE 12. Financial Data of Business Segments
The financial data presented below depicts the profitability, financial position, and capital expenditures of each of our business segments.
We lease, operate, manage, and remarket long-lived, widely-used assets, primarily in the rail and marine markets. We also invest in joint ventures that complement our existing business activities. We report our financial results through four primary business segments: Rail North America, Rail International, ASC, and Portfolio Management.
Rail North America comprises our wholly owned operations in the United States, Canada, and Mexico, as well as an affiliate investment. Rail North America primarily provides railcars pursuant to full-service leases under which it maintains the railcars, pays ad valorem taxes and insurance, and provides other ancillary services.
Rail International comprises our wholly owned European operations ("GATX Rail Europe" or "GRE"), a railcar leasing business in India ("GATX India Pte. Ltd." or "GIPL"), and a recently established railcar leasing business in Russia ("GATX Rail Vostok LLC" or "GRV"), as well as one development stage affiliate in China. GRE leases railcars to customers throughout Europe pursuant to full-service leases under which it maintains the railcars and provides insurance and other ancillary services.
ASC operates the largest fleet of US-flagged vessels on the Great Lakes, providing waterborne transportation of dry bulk commodities such as iron ore, coal, limestone aggregates, and metallurgical limestone.
Portfolio Management generates leasing, marine operating, asset remarketing and management fee income through a collection of diversified wholly owned assets and joint venture investments.
Segment profit is an internal performance measure used by the Chief Executive Officer to assess the performance of each segment in a given period. Segment profit includes all revenues, pretax earnings from affiliates, and net gains on asset dispositions that are attributable to the segments, as well as expenses that management believes are directly associated with the financing, maintenance, and operation of the revenue earning assets. Segment profit excludes selling, general and administrative expenses, income taxes, and certain other amounts not allocated to the segments. These amounts are included in Other.
We allocate debt balances and related interest expense to each segment based upon a predetermined fixed recourse leverage level expressed as a ratio of recourse debt (including off-balance-sheet debt) to equity. The leverage levels are 5:1 for Rail North America, 2:1 for Rail International, 1.5:1 for ASC, and 3:1 for Portfolio Management. We believe that by using this leverage and interest expense allocation methodology, each operating segment’s financial performance reflects appropriate risk-adjusted borrowing costs.
15
NOTES TO CONSOLIDATED FINANCIAL STATEMENTS (UNAUDITED) (Continued)
The following tables show certain segment data for each of our business segments (in millions):
Rail North America | Rail International | ASC | Portfolio Management | Other | GATX Consolidated | ||||||||||||||||||
Three Months Ended June 30, 2015 | |||||||||||||||||||||||
Profitability | |||||||||||||||||||||||
Revenues | |||||||||||||||||||||||
Lease revenue | $ | 230.9 | $ | 42.4 | $ | 1.0 | $ | 6.3 | $ | — | $ | 280.6 | |||||||||||
Marine operating revenue | — | — | 51.0 | 15.0 | — | 66.0 | |||||||||||||||||
Other revenue | 16.8 | 1.7 | — | 0.2 | — | 18.7 | |||||||||||||||||
Total Revenues | 247.7 | 44.1 | 52.0 | 21.5 | — | 365.3 | |||||||||||||||||
Expenses | |||||||||||||||||||||||
Maintenance expense | 63.8 | 9.4 | 7.0 | — | — | 80.2 | |||||||||||||||||
Marine operating expense | — | — | 34.1 | 13.2 | — | 47.3 | |||||||||||||||||
Depreciation expense | 53.3 | 10.8 | 4.9 | 5.4 | — | 74.4 | |||||||||||||||||
Operating lease expense | 20.7 | 0.1 | 1.7 | — | (0.1 | ) | 22.4 | ||||||||||||||||
Other operating expense | 5.8 | 1.5 | — | 0.5 | — | 7.8 | |||||||||||||||||
Total Expenses | 143.6 | 21.8 | 47.7 | 19.1 | (0.1 | ) | 232.1 | ||||||||||||||||
Other Income (Expense) | |||||||||||||||||||||||
Net gain on asset dispositions | 6.1 | 1.1 | — | 1.5 | — | 8.7 | |||||||||||||||||
Interest expense, net | (24.6 | ) | (3.0 | ) | (1.3 | ) | (5.6 | ) | (4.0 | ) | (38.5 | ) | |||||||||||
Other (expense) income | (0.8 | ) | (1.2 | ) | (0.1 | ) | — | 0.5 | (1.6 | ) | |||||||||||||
Share of affiliates' earnings (pretax) | 0.1 | (0.1 | ) | — | 12.0 | — | 12.0 | ||||||||||||||||
Segment Profit (Loss) | $ | 84.9 | $ | 19.1 | $ | 2.9 | $ | 10.3 | $ | (3.4 | ) | 113.8 | |||||||||||
Selling, general and administrative expense | 44.6 | ||||||||||||||||||||||
Income taxes (including $3.0 related to affiliates' earnings) | 23.8 | ||||||||||||||||||||||
Net Income | $ | 45.4 | |||||||||||||||||||||
Net Gain on Asset Dispositions | |||||||||||||||||||||||
Asset Remarketing Income: | |||||||||||||||||||||||
Disposition gains on owned assets | $ | 5.0 | $ | — | $ | — | $ | 0.1 | $ | — | $ | 5.1 | |||||||||||
Residual sharing income | 0.2 | — | — | 1.4 | — | 1.6 | |||||||||||||||||
Non-remarketing disposition gains (1) | 0.9 | 1.1 | — | — | — | 2.0 | |||||||||||||||||
Asset impairment | — | — | — | — | — | — | |||||||||||||||||
$ | 6.1 | $ | 1.1 | $ | — | $ | 1.5 | $ | — | $ | 8.7 | ||||||||||||
Capital Expenditures | |||||||||||||||||||||||
Portfolio investments and capital additions | $ | 135.2 | $ | 27.8 | $ | 10.2 | $ | 0.3 | $ | 1.8 | $ | 175.3 | |||||||||||
Selected Balance Sheet Data at June 30, 2015 | |||||||||||||||||||||||
Investments in affiliated companies | $ | 13.4 | $ | 1.6 | $ | — | $ | 353.7 | $ | — | $ | 368.7 | |||||||||||
Identifiable assets | $ | 4,560.4 | $ | 1,104.9 | $ | 307.8 | $ | 796.5 | $ | 90.4 | $ | 6,860.0 | |||||||||||
(1) Includes scrapping gains.
16
NOTES TO CONSOLIDATED FINANCIAL STATEMENTS (UNAUDITED) (Continued)
Rail North America | Rail International | ASC | Portfolio Management | Other | GATX Consolidated | ||||||||||||||||||
Three Months Ended June 30, 2014 | |||||||||||||||||||||||
Profitability | |||||||||||||||||||||||
Revenues | |||||||||||||||||||||||
Lease revenue | $ | 218.2 | $ | 47.7 | $ | 1.0 | $ | 7.4 | $ | — | $ | 274.3 | |||||||||||
Marine operating revenue | — | — | 59.4 | 12.8 | — | 72.2 | |||||||||||||||||
Other revenue | 16.1 | 2.4 | — | 0.8 | — | 19.3 | |||||||||||||||||
Total Revenues | 234.3 | 50.1 | 60.4 | 21.0 | — | 365.8 | |||||||||||||||||
Expenses | |||||||||||||||||||||||
Maintenance expense | 65.1 | 11.6 | 7.3 | — | — | 84.0 | |||||||||||||||||
Marine operating expense | — | — | 42.3 | 12.3 | — | 54.6 | |||||||||||||||||
Depreciation expense | 49.1 | 11.8 | 4.4 | 5.8 | — | 71.1 | |||||||||||||||||
Operating lease expense | 25.7 | — | 1.7 | — | (0.1 | ) | 27.3 | ||||||||||||||||
Other operating expense | 5.2 | 1.0 | — | 0.5 | — | 6.7 | |||||||||||||||||
Total Expenses | 145.1 | 24.4 | 55.7 | 18.6 | (0.1 | ) | 243.7 | ||||||||||||||||
Other Income (Expense) | |||||||||||||||||||||||
Net gain on asset dispositions | 23.9 | 2.6 | — | 1.7 | — | 28.2 | |||||||||||||||||
Interest expense, net | (25.3 | ) | (6.2 | ) | (1.4 | ) | (6.1 | ) | (0.5 | ) | (39.5 | ) | |||||||||||
Other expense | (0.3 | ) | (2.7 | ) | (0.2 | ) | — | (1.7 | ) | (4.9 | ) | ||||||||||||
Share of affiliates' earnings (pretax) | 4.2 | — | — | 13.5 | — | 17.7 | |||||||||||||||||
Segment Profit (Loss) | $ | 91.7 | $ | 19.4 | $ | 3.1 | $ | 11.5 | $ | (2.1 | ) | 123.6 | |||||||||||
Selling, general and administrative expense | 44.9 | ||||||||||||||||||||||
Income taxes (including $5.4 related to affiliates' earnings) | 25.6 | ||||||||||||||||||||||
Net Income | $ | 53.1 | |||||||||||||||||||||
Net Gain on Asset Dispositions | |||||||||||||||||||||||
Asset Remarketing Income: | |||||||||||||||||||||||
Disposition gains on owned assets | $ | 17.7 | $ | 0.6 | $ | — | $ | 0.5 | $ | — | $ | 18.8 | |||||||||||
Residual sharing income | 3.8 | — | — | 1.2 | — | 5.0 | |||||||||||||||||
Non-remarketing disposition gains (1) | 2.4 | 2.0 | — | — | — | 4.4 | |||||||||||||||||
Asset impairment | — | — | — | — | — | — | |||||||||||||||||
$ | 23.9 | $ | 2.6 | $ | — | $ | 1.7 | $ | — | $ | 28.2 | ||||||||||||
Capital Expenditures | |||||||||||||||||||||||
Portfolio investments and capital additions | $ | 145.8 | $ | 42.3 | $ | 7.7 | $ | 12.0 | $ | 1.8 | $ | 209.6 | |||||||||||
Selected Balance Sheet Data at December 31, 2014 | |||||||||||||||||||||||
Investments in affiliated companies | $ | 17.2 | $ | 1.8 | $ | — | $ | 338.7 | $ | — | $ | 357.7 | |||||||||||
Identifiable assets | $ | 4,358.3 | $ | 1,229.4 | $ | 286.7 | $ | 813.3 | $ | 249.8 | $ | 6,937.5 | |||||||||||
(1) Includes scrapping gains.
17
NOTES TO CONSOLIDATED FINANCIAL STATEMENTS (UNAUDITED) (Continued)
Rail North America | Rail International | ASC | Portfolio Management | Other | GATX Consolidated | ||||||||||||||||||
Six Months Ended June 30, 2015 | |||||||||||||||||||||||
Profitability | |||||||||||||||||||||||
Revenues | |||||||||||||||||||||||
Lease revenue | $ | 459.4 | $ | 84.5 | $ | 2.0 | $ | 13.0 | $ | — | $ | 558.9 | |||||||||||
Marine operating revenue | — | — | 58.0 | 32.2 | — | 90.2 | |||||||||||||||||
Other revenue | 31.5 | 3.6 | — | 0.8 | — | 35.9 | |||||||||||||||||
Total Revenues | 490.9 | 88.1 | 60.0 | 46.0 | — | 685.0 | |||||||||||||||||
Expenses | |||||||||||||||||||||||
Maintenance expense | 133.0 | 18.3 | 7.2 | — | — | 158.5 | |||||||||||||||||
Marine operating expense | — | — | 41.0 | 25.2 | — | 66.2 | |||||||||||||||||
Depreciation expense | 105.6 | 21.5 | 4.9 | 10.9 | — | 142.9 | |||||||||||||||||
Operating lease expense | 41.4 | 0.1 | 1.7 | — | (0.1 | ) | 43.1 | ||||||||||||||||
Other operating expense | 11.3 | 2.4 | — | 1.4 | — | 15.1 | |||||||||||||||||
Total Expenses | 291.3 | 42.3 | 54.8 | 37.5 | (0.1 | ) | 425.8 | ||||||||||||||||
Other Income (Expense) | |||||||||||||||||||||||
Net gain on asset dispositions | 42.9 | 6.0 | — | 5.1 | — | 54.0 | |||||||||||||||||
Interest expense, net | (49.1 | ) | (9.5 | ) | (2.6 | ) | (10.8 | ) | (7.4 | ) | (79.4 | ) | |||||||||||
Other expense | (3.0 | ) | (1.2 | ) | (0.1 | ) | — | (1.3 | ) | (5.6 | ) | ||||||||||||
Share of affiliates' earnings (pretax) | 0.3 | (0.2 | ) | — | 23.4 | — | 23.5 | ||||||||||||||||
Segment Profit (Loss) | $ | 190.7 | $ | 40.9 | $ | 2.5 | $ | 26.2 | $ | (8.6 | ) | 251.7 | |||||||||||
Selling, general and administrative expense | 90.3 | ||||||||||||||||||||||
Income taxes (including $6.0 related to affiliates' earnings) | 53.8 | ||||||||||||||||||||||
Net Income | $ | 107.6 | |||||||||||||||||||||
Net Gain on Asset Dispositions | |||||||||||||||||||||||
Asset Remarketing Income: | |||||||||||||||||||||||
Disposition gains on owned assets | $ | 40.9 | $ | — | $ | — | $ | 2.1 | $ | — | $ | 43.0 | |||||||||||
Residual sharing income | 0.4 | — | — | 3.0 | — | 3.4 | |||||||||||||||||
Non-remarketing disposition gains (1) | 1.6 | 6.1 | — | — | — | 7.7 | |||||||||||||||||
Asset impairment | — | (0.1 | ) | — | — | — | (0.1 | ) | |||||||||||||||
$ | 42.9 | $ | 6.0 | $ | — | $ | 5.1 | $ | — | $ | 54.0 | ||||||||||||
Capital Expenditures | |||||||||||||||||||||||
Portfolio investments and capital additions | $ | 265.0 | $ | 69.2 | $ | 19.5 | $ | 0.3 | $ | 2.2 | $ | 356.2 | |||||||||||
(1) Includes scrapping gains.
18
NOTES TO CONSOLIDATED FINANCIAL STATEMENTS (UNAUDITED) (Continued)
Rail North America | Rail International | ASC | Portfolio Management | Other | GATX Consolidated | ||||||||||||||||||
Six Months Ended June 30, 2014 | |||||||||||||||||||||||
Profitability | |||||||||||||||||||||||
Revenues | |||||||||||||||||||||||
Lease revenue | $ | 413.1 | $ | 94.9 | $ | 2.1 | $ | 14.8 | $ | — | $ | 524.9 | |||||||||||
Marine operating revenue | — | — | 62.5 | 27.4 | — | 89.9 | |||||||||||||||||
Other revenue | 30.7 | 4.4 | — | 2.5 | — | 37.6 | |||||||||||||||||
Total Revenues | 443.8 | 99.3 | 64.6 | 44.7 | — | 652.4 | |||||||||||||||||
Expenses | |||||||||||||||||||||||
Maintenance expense | 126.5 | 23.1 | 7.5 | — | — | 157.1 | |||||||||||||||||
Marine operating expense | — | — | 45.7 | 23.9 | — | 69.6 | |||||||||||||||||
Depreciation expense | 90.6 | 23.5 | 4.4 | 11.3 | — | 129.8 | |||||||||||||||||
Operating lease expense | 52.6 | — | 1.7 | — | (0.1 | ) | 54.2 | ||||||||||||||||
Other operating expense | 10.0 | 2.4 | — | 0.9 | — | 13.3 | |||||||||||||||||
Total Expenses | 279.7 | 49.0 | 59.3 | 36.1 | (0.1 | ) | 424.0 | ||||||||||||||||
Other Income (Expense) | |||||||||||||||||||||||
Net gain on asset dispositions | 48.7 | 5.0 | (0.4 | ) | 3.0 | — | 56.3 | ||||||||||||||||
Interest expense, net | (49.9 | ) | (12.4 | ) | (2.8 | ) | (12.9 | ) | (3.5 | ) | (81.5 | ) | |||||||||||
Other (expense) income | (3.7 | ) | (2.7 | ) | (0.2 | ) | 0.3 | (2.0 | ) | (8.3 | ) | ||||||||||||
Share of affiliates' earnings (pretax) | 7.5 | (0.1 | ) | — | 24.4 | — | 31.8 | ||||||||||||||||
Segment Profit (Loss) | $ | 166.7 | $ | 40.1 | $ | 1.9 | $ | 23.4 | $ | (5.4 | ) | 226.7 | |||||||||||
Selling, general and administrative expense | 87.6 | ||||||||||||||||||||||
Income taxes (including $9.6 related to affiliates' earnings) | 43.9 | ||||||||||||||||||||||
Net Income | $ | 95.2 | |||||||||||||||||||||
Net Gain on Asset Dispositions | |||||||||||||||||||||||
Asset Remarketing Income: | |||||||||||||||||||||||
Disposition gains on owned assets | $ | 39.3 | $ | 0.6 | $ | — | $ | 0.5 | $ | — | $ | 40.4 | |||||||||||
Residual sharing income | 4.4 | — | — | 2.4 | — | 6.8 | |||||||||||||||||
Non-remarketing disposition gains (1) | 5.0 | 4.4 | — | — | — | 9.4 | |||||||||||||||||
Asset impairment | — | — | (0.4 | ) | 0.1 | — | (0.3 | ) | |||||||||||||||
$ | 48.7 | $ | 5.0 | $ | (0.4 | ) | $ | 3.0 | $ | — | $ | 56.3 | |||||||||||
Capital Expenditures | |||||||||||||||||||||||
Portfolio investments and capital additions | $ | 541.8 | $ | 81.6 | $ | 16.0 | $ | 12.0 | $ | 3.7 | $ | 655.1 | |||||||||||
(1) Includes scrapping gains.
19
Item 2. Management’s Discussion and Analysis of Financial Condition and Results of Operations
BUSINESS OVERVIEW
We lease, operate, manage, and remarket long-lived, widely-used assets, primarily in the rail and marine markets. We also invest in joint ventures that complement our existing business activities. We report our financial results through four primary business segments: Rail North America, Rail International, American Steamship Company (“ASC”), and Portfolio Management.
The following discussion and analysis should be read in conjunction with the MD&A in our Annual Report on Form 10-K for the year ended December 31, 2014. We based the discussion and analysis that follows on financial data we derived from the financial statements prepared in accordance with GAAP and on certain other financial data that we prepared using non-GAAP components. For a reconciliation of these non-GAAP components to the most comparable GAAP components, see “Non-GAAP Financial Measures” at the end of this item. In prior periods, we reported net income excluding certain items that we believe are not necessarily reflective of our ongoing business activities. No such adjustments occurred in the first six months of 2015 or 2014, however, certain of these adjustments occurred in 2013 and impacted the computation of return on equity for the trailing twelve months earnings as disclosed in this report.
Operating results for the three and six months ended June 30, 2015 are not necessarily indicative of the results we may achieve for the entire year ending December 31, 2015. For more information about our business, refer to our Annual Report on Form 10-K for the year ended December 31, 2014.
DISCUSSION OF OPERATING RESULTS
The following table shows a summary of our reporting segments and consolidated financial results for the three and six months ended June 30 (in millions, except per share data and percentages):
Three Months Ended June 30 | Six Months Ended June 30 | ||||||||||||||
2015 | 2014 | 2015 | 2014 | ||||||||||||
Segment Revenues | |||||||||||||||
Rail North America | $ | 247.7 | $ | 234.3 | $ | 490.9 | $ | 443.8 | |||||||
Rail International | 44.1 | 50.1 | 88.1 | 99.3 | |||||||||||
ASC | 52.0 | 60.4 | 60.0 | 64.6 | |||||||||||
Portfolio Management | 21.5 | 21.0 | 46.0 | 44.7 | |||||||||||
$ | 365.3 | $ | 365.8 | $ | 685.0 | $ | 652.4 | ||||||||
Segment Profit | |||||||||||||||
Rail North America | $ | 84.9 | $ | 91.7 | $ | 190.7 | $ | 166.7 | |||||||
Rail International | 19.1 | 19.4 | 40.9 | 40.1 | |||||||||||
ASC | 2.9 | 3.1 | 2.5 | 1.9 | |||||||||||
Portfolio Management | 10.3 | 11.5 | 26.2 | 23.4 | |||||||||||
117.2 | 125.7 | 260.3 | 232.1 | ||||||||||||
Less: | |||||||||||||||
Selling, general and administrative expense | 44.6 | 44.9 | 90.3 | 87.6 | |||||||||||
Unallocated interest expense, net | 4.0 | 0.5 | 7.4 | 3.5 | |||||||||||
Other, including eliminations | (0.6 | ) | 1.6 | 1.2 | 1.9 | ||||||||||
Income taxes ($3.0 and $5.4 QTR and $6.0 and $9.6 YTD related to affiliates' earnings) | 23.8 | 25.6 | 53.8 | 43.9 | |||||||||||
Net Income | $ | 45.4 | $ | 53.1 | $ | 107.6 | $ | 95.2 | |||||||
Diluted earnings per share | $ | 1.03 | $ | 1.15 | $ | 2.42 | $ | 2.05 | |||||||
Investment Volume | $ | 175.3 | $ | 209.6 | $ | 356.2 | $ | 655.1 | |||||||
20
The following table shows our return on equity ("ROE") for the trailing twelve months ended June 30:
2015 | 2014 | ||||
ROE | 16.3 | % | 15.6 | % | |
ROE, excluding tax adjustments and other items | 16.3 | % | 15.4 | % | |
Net income was $107.6 million, or $2.42 per diluted share, for the first six months of 2015 compared to $95.2 million, or $2.05 per diluted share, in 2014. Net income increased $12.4 million compared to the prior year, driven by a positive income contribution from the acquisition of boxcars discussed in more detail in the "Rail North America" section of the MD&A, higher lease rates and lower operating lease expense, partially offset by higher depreciation expense and lower share of affiliates' earnings.
Net income was $45.4 million, or $1.03 per diluted share, for the second quarter of 2015 compared to $53.1 million, or $1.15 per diluted share, in 2014. Net income decreased $7.7 million compared to the prior year largely due to lower asset remarketing income and share of affiliates' earnings, partially offset by lower maintenance and operating lease expense.
Segment Operations
Segment profit is an internal performance measure used by the Chief Executive Officer to assess the performance of each segment in a given period. Segment profit includes all revenues, pretax earnings from affiliates, and net gains on asset dispositions that are attributable to the segments, as well as expenses that management believes are directly associated with the financing, maintenance, and operation of the revenue earning assets. Segment profit excludes selling, general and administrative expenses, income taxes, and certain other amounts not allocated to the segments. These amounts are included in Other.
We allocate debt balances and related interest expense to each segment based upon a predetermined fixed recourse leverage level expressed as a ratio of recourse debt (including off-balance-sheet debt) to equity. The leverage levels are 5:1 for Rail North America, 2:1 for Rail International, 1.5:1 for ASC, and 3:1 for Portfolio Management. We believe that by using this leverage and interest expense allocation methodology, each operating segment’s financial performance reflects appropriate risk-adjusted borrowing costs.
RAIL NORTH AMERICA
Segment Summary
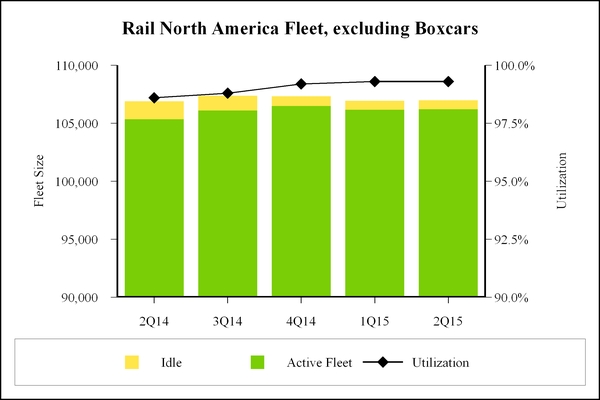
At the end of the first quarter of 2014, we acquired a fleet of more than 18,500 boxcars for approximately $340 million (the "Boxcar Fleet"). At June 30, 2015, Rail North America's wholly owned fleet consisted of approximately 125,600 cars, including approximately 18,700 boxcars. Fleet utilization, excluding boxcars, was 99.3% at the end of the second quarter of 2015 compared to 99.3% at the end of the prior quarter and 98.6% at June 30, 2014. Fleet utilization for boxcars was 97.3% at the end of the second quarter of 2015, compared to 92.8% at the end of the prior quarter and 90.7% at June 30, 2014 as we continued to successfully lease idle cars from the Boxcar Fleet and scrap older boxcars.
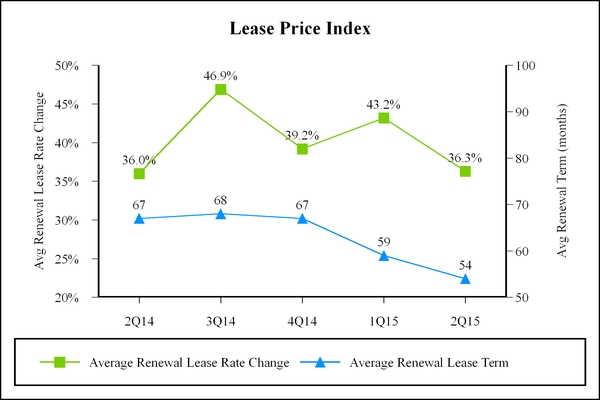
During the second quarter of 2015, the Lease Price Index on renewals (the “LPI,” see definition below) increased 36.3%, compared to an increase of 43.2% in the prior quarter and 36.0% in the second quarter of 2014. Lease terms on renewals for cars in the LPI averaged 54 months in the current quarter, compared to 59 months in the prior quarter and 67 months in the second quarter of 2014. While renewal terms for many car types remained longer than historical averages, specific weakness in coal, coupled with regulatory uncertainty impacting cars in flammable service, resulted in shorter lease terms for these car types. During the second quarter of 2015, an average of approximately 106,200 railcars, excluding boxcars, were on lease, compared to 106,500 in the prior quarter and 105,400 in the second quarter of 2014.
The effects of the recently enacted flammable tank car regulatory changes on the industry will take some time to fully develop. However, we are well positioned to address these changes as fewer than 1,400 tank cars require modification or retirement before 2023.
21
For the remainder of 2015, we expect the LPI renewal rate change to be in the mid-30% range; however, the uncertain pricing environment for some car types may create volatility in the LPI measure. As of June 30, 2015, leases for approximately 8,800 railcars in our term lease fleet and approximately 3,500 boxcars have expired or are scheduled to expire prior to the end of the year. These amounts exclude railcars on leases that were scheduled to expire in the second half of 2015 but have already been renewed or assigned to a new lessee.
The following table shows Rail North America's segment results (in millions):
Three Months Ended June 30 | Six Months Ended June 30 | ||||||||||||||
2015 | 2014 | 2015 | 2014 | ||||||||||||
Revenues | |||||||||||||||
Lease revenue | $ | 230.9 | $ | 218.2 | $ | 459.4 | $ | 413.1 | |||||||
Other revenue | 16.8 | 16.1 | 31.5 | 30.7 | |||||||||||
Total Revenues | 247.7 | 234.3 | 490.9 | 443.8 | |||||||||||
Expenses | |||||||||||||||
Maintenance expense | 63.8 | 65.1 | 133.0 | 126.5 | |||||||||||
Depreciation expense | 53.3 | 49.1 | 105.6 | 90.6 | |||||||||||
Operating lease expense | 20.7 | 25.7 | 41.4 | 52.6 | |||||||||||
Other operating expense | 5.8 | 5.2 | 11.3 | 10.0 | |||||||||||
Total Expenses | 143.6 | 145.1 | 291.3 | 279.7 | |||||||||||
Other Income (Expense) | |||||||||||||||
Net gain on asset dispositions | 6.1 | 23.9 | 42.9 | 48.7 | |||||||||||
Interest expense, net | (24.6 | ) | (25.3 | ) | (49.1 | ) | (49.9 | ) | |||||||
Other expense | (0.8 | ) | (0.3 | ) | (3.0 | ) | (3.7 | ) | |||||||
Share of affiliates' earnings (pretax) | 0.1 | 4.2 | 0.3 | 7.5 | |||||||||||
Segment Profit | $ | 84.9 | $ | 91.7 | $ | 190.7 | $ | 166.7 | |||||||
Investment Volume | $ | 135.2 | $ | 145.8 | $ | 265.0 | $ | 541.8 | |||||||
The following table shows the components of Rail North America's lease revenue (in millions):
Three Months Ended June 30 | Six Months Ended June 30 | ||||||||||||||
2015 | 2014 | 2015 | 2014 | ||||||||||||
Railcars (excluding boxcars) | $ | 201.0 | $ | 189.6 | $ | 399.4 | $ | 375.0 | |||||||
Boxcars | 20.6 | 20.0 | 41.7 | 21.3 | |||||||||||
Locomotives | 9.3 | 8.6 | 18.3 | 16.8 | |||||||||||
$ | 230.9 | $ | 218.2 | $ | 459.4 | $ | 413.1 | ||||||||
Lease Price Index
Our LPI is an internally-generated business indicator that measures lease rate pricing on renewals for our North American railcar fleet, excluding boxcars. We calculate the index using the weighted average lease rate for a group of railcar types that we believe best represents our overall North American fleet, excluding boxcars. The average renewal lease rate change is reported as the percentage change between the average renewal lease rate and the average expiring lease rate, weighted by fleet composition. The average renewal lease term is reported in months and reflects the average renewal lease term of railcar types in the LPI, weighted by fleet composition.
22
Rail North America Fleet Data
The following table shows fleet activity for Rail North America's railcars, excluding boxcars:
June 30 2014 | September 30 2014 | December 31 2014 | March 31 2015 | June 30 2015 | ||||||||||
Beginning balance | 106,804 | 106,894 | 107,387 | 107,343 | 106,949 | |||||||||
Cars added | 1,174 | 958 | 835 | 1,013 | 823 | |||||||||
Cars scrapped | (387 | ) | (440 | ) | (202 | ) | (261 | ) | (347 | ) | ||||
Cars sold | (697 | ) | (25 | ) | (677 | ) | (1,146 | ) | (441 | ) | ||||
Ending balance | 106,894 | 107,387 | 107,343 | 106,949 | 106,984 | |||||||||
Utilization rate at quarter end | 98.6 | % | 98.8 | % | 99.2 | % | 99.3 | % | 99.3 | % | ||||
Average active railcars | 105,366 | 105,755 | 106,569 | 106,541 | 106,211 | |||||||||
23
The following table shows fleet activity for Rail North America's boxcars:
June 30 2014 | September 30 2014 | December 31 2014 | March 31 2015 | June 30 2015 | ||||||||||
Ending balance | 19,254 | 19,146 | 19,021 | 18,912 | 18,651 | |||||||||
Utilization | 90.7 | % | 91.3 | % | 92.7 | % | 92.8 | % | 97.3 | % | ||||
The following table shows fleet activity for Rail North America's locomotives:
June 30 2014 | September 30 2014 | December 31 2014 | March 31 2015 | June 30 2015 | ||||||||||
Beginning balance | 600 | 602 | 603 | 603 | 608 | |||||||||
Locomotives added | 9 | 1 | 7 | 7 | — | |||||||||
Locomotives scrapped or sold | (7 | ) | — | (7 | ) | (2 | ) | — | ||||||
Ending balance | 602 | 603 | 603 | 608 | 608 | |||||||||
Utilization rate at quarter end | 99.2 | % | 97.7 | % | 99.3 | % | 98.8 | % | 96.1 | % | ||||
Average active locomotives | 594 | 591 | 592 | 599 | 593 | |||||||||
Comparison of the First Six Months of 2015 to the First Six Months of 2014
Segment Profit
Segment profit was $190.7 million, compared to $166.7 million in the prior year. The increase was driven by a positive contribution from the Boxcar Fleet, higher lease rates and lower operating lease expense, partially offset by higher depreciation expense and maintenance expense as well as lower share of affiliates' earnings.
24
Revenues
Lease revenue increased $46.3 million in 2015, primarily due to higher lease rates across the non-boxcar fleet and additional revenue from the Boxcar Fleet. Other revenue increased $0.8 million, primarily due to higher excess mileage and equalization revenue.
Expenses
Maintenance expense increased $6.5 million in 2015, primarily due to additional costs attributable to the Boxcar Fleet, partially offset by higher capitalized repairs and fewer wheelset replacements. Depreciation expense increased $15.0 million, largely due to depreciation on new investments, including the Boxcar Fleet. Operating lease expense decreased $11.2 million, resulting from the purchase of railcars previously on operating leases in each year. Other operating expense increased $1.3 million, primarily due to higher storage and switching costs.
Other Income (Expense)
Net gain on asset dispositions decreased $5.8 million in 2015, driven by lower scrapping gains in the current year and the absence of a residual sharing fee received in the prior year, partially offset by higher gains on sales of cars sold. Net interest expense decreased $0.8 million, primarily due to the impact of lower average interest rates. Other expense decreased $0.7 million, primarily due to lower termination costs associated with the early buyouts of operating leases, which occurred in each period. Share of affiliates' earnings decreased $7.2 million, primarily due to gains on dispositions of railcars at our Southern Capital affiliate in the prior year.
Investment Volume
During 2015, investment volume was $265.0 million compared to $541.8 million in 2014. We acquired 1,631 newly built railcars and purchased 200 railcars in the secondary market in the first half of 2015, compared to 1,154 newly built railcars and 384 railcars purchased in the secondary market in 2014. Additionally, investments in 2014 included the purchase of the Boxcar Fleet of approximately 18,500 boxcars.
Comparison of the Second Quarter of 2015 to the Second Quarter of 2014
Segment Profit
Segment profit was $84.9 million, compared to $91.7 million in the prior year. The decrease was driven by lower asset remarketing income and share of affiliates' earnings as well as higher depreciation expense, partially offset by higher lease revenue.
Revenues
Lease revenue increased $12.7 million, primarily due to higher lease rates across the non-boxcar fleet. Other revenue increased $0.7 million, largely due to higher excess mileage revenue.
Expenses
Maintenance expense decreased $1.3 million, driven by higher capitalized repairs and fewer wheelset replacements, partially offset by additional costs attributable to the Boxcar Fleet. Depreciation expense increased $4.2 million, largely due to depreciation on new investments. Operating lease expense decreased $5.0 million, resulting from the purchase of railcars previously on operating leases. Other operating expense increased $0.6 million, primarily due to higher storage and switching costs.
Other Income (Expense)
Net gain on asset dispositions decreased $17.8 million in 2015, primarily due to a lower number of cars sold in the current year, lower scrapping gains and the absence of a residual sharing fee received in the prior year. Net interest expense decreased $0.7 million due to the impact of lower average interest rates. Other expense increased $0.5 million, primarily due to a paint rebate received in the prior year. Share of affiliates' earnings decreased $4.1 million, primarily due to gains on dispositions of railcars at our Southern Capital affiliate in the prior year.
25
North American Rail Regulatory Matters
On May 1, 2015 the Pipeline and Hazardous Materials Safety Administration of the US Department of Transportation (“PHMSA”) issued a Final Rule (the “US Rule”) intended to improve the safety of trains that transport large volumes of flammable liquids, primarily crude oil and ethanol. In addition to rail operating requirements and standards for the classification of mined gases and liquids, the US Rule establishes new design standards for tank cars operating in “high hazard flammable trains” (“HHFT”), which are trains that include 20 or more consecutive cars carrying flammable liquids or more than 34 cars carrying flammable liquids in a train. The US Rule requires newly built tank cars for use in HHFT service to comply with the new standards beginning on October 1, 2015. The US Rule establishes standards for modifications to existing tank cars in HHFT service. Existing tank cars in HHFT service would have to be modified or removed from that service between January, 2018, and May, 2025, depending on the type of car and the type of commodity carried. The US Rule was published in the Federal Register on May 8, 2015, and the rule became effective on July 7, 2015. Several legal challenges to the US Rule have been filed in the United States Circuit Court for the District of Columbia, and several petitions for reconsideration have been filed with PHMSA. We cannot predict the timing or the outcome of these challenges.
On May 1, 2015 Transport Canada (“TC”) issued a Final Rule (the “Canada Rule”) intended to improve the safety of trains that transport flammable liquids, primarily crude and ethanol. The Canada Rule establishes new design standards for tank cars carrying flammable liquids. The Canada Rule requires newly built tank cars for use in flammable liquids to comply with the new standards beginning on October 1, 2015. The Canada Rule establishes standards for modifications to existing tank cars. Existing tank cars would have to be modified or removed from flammable liquids service between May, 2017, and May, 2025, depending on the type of car and the type of commodity carried. The Rule was published in the Canada Gazette on May 20, 2015, and took effect that day. The Canada Rule is not subject to legal or administrative challenges.
We have a fleet of approximately 126,000 railcars in North America, including approximately 14,000 tank cars currently used to transport flammable liquids, of which approximately 4,600 are moving crude oil and ethanol. Approximately 90% of our tank cars requiring modification have a deadline of 2023 or later. We have not yet determined the number of cars that will be modified, repurposed or retired.
RAIL INTERNATIONAL
Segment Summary
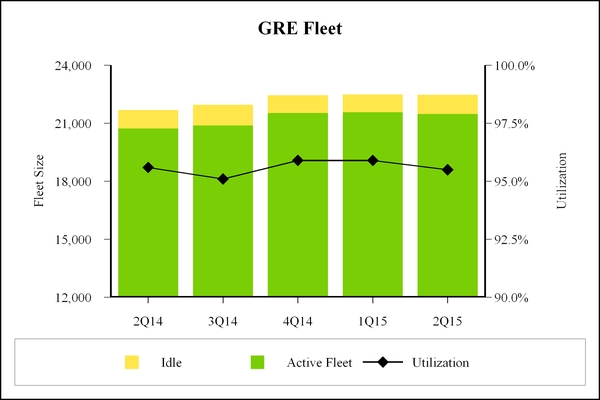
Rail International's performance has been stable despite the ongoing, unsettled European economy, and we continue to pursue investment opportunities. Railcar utilization for our wholly owned European operations ("GATX Rail Europe" or "GRE") was 95.5% at the end of the second quarter of 2015 compared to 95.9% at the end of the prior quarter and 95.6% at June 30, 2014.
26
The following table shows Rail International's segment results (in millions):
Three Months Ended June 30 | Six Months Ended June 30 | ||||||||||||||
2015 | 2014 | 2015 | 2014 | ||||||||||||
Revenues | |||||||||||||||
Lease revenue | $ | 42.4 | $ | 47.7 | $ | 84.5 | $ | 94.9 | |||||||
Other revenue | 1.7 | 2.4 | 3.6 | 4.4 | |||||||||||
Total Revenues | 44.1 | 50.1 | 88.1 | 99.3 | |||||||||||
Expenses | |||||||||||||||
Maintenance expense | 9.4 | 11.6 | 18.3 | 23.1 | |||||||||||
Depreciation expense | 10.8 | 11.8 | 21.5 | 23.5 | |||||||||||
Operating lease expense | 0.1 | — | 0.1 | — | |||||||||||
Other operating expense | 1.5 | 1.0 | 2.4 | 2.4 | |||||||||||
Total Expenses | 21.8 | 24.4 | 42.3 | 49.0 | |||||||||||
Other Income (Expense) | |||||||||||||||
Net gain on asset dispositions | 1.1 | 2.6 | 6.0 | 5.0 | |||||||||||
Interest expense, net | (3.0 | ) | (6.2 | ) | (9.5 | ) | (12.4 | ) | |||||||
Other expense | (1.2 | ) | (2.7 | ) | (1.2 | ) | (2.7 | ) | |||||||
Share of affiliates' earnings (pretax) | (0.1 | ) | — | (0.2 | ) | (0.1 | ) | ||||||||
Segment Profit | $ | 19.1 | $ | 19.4 | $ | 40.9 | $ | 40.1 | |||||||
Investment Volume | $ | 27.8 | $ | 42.3 | $ | 69.2 | $ | 81.6 | |||||||
The following table shows fleet activity for GRE railcars:
June 30 2014 | September 30 2014 | December 31 2014 | March 31 2015 | June 30 2015 | ||||||||||
Beginning balance | 21,591 | 21,684 | 21,960 | 22,451 | 22,497 | |||||||||
Cars added | 409 | 481 | 657 | 249 | 301 | |||||||||
Cars scrapped or sold | (316 | ) | (205 | ) | (166 | ) | (203 | ) | (315 | ) | ||||
Ending balance | 21,684 | 21,960 | 22,451 | 22,497 | 22,483 | |||||||||
Utilization rate at quarter end | 95.6 | % | 95.1 | % | 95.9 | % | 95.9 | % | 95.5 | % | ||||
Average active railcars | 20,706 | 20,833 | 21,111 | 21,479 | 21,427 | |||||||||
27
 \
\Comparison of the First Six Months of 2015 to the First Six Months of 2014
Foreign Currency
Rail International's results of operations are impacted by fluctuations in the exchange rates of the foreign currencies in which it conducts business, primarily the euro. In the first six months of 2015, a weaker euro negatively impacted lease revenue by approximately $17.5 million and segment profit, excluding other income (expense), by approximately $9.2 million compared to the first six months of 2014.
Segment Profit
Segment profit was $40.9 million, compared to $40.1 million in the prior year and was positively impacted by higher lease revenue from more cars on lease, lower maintenance expense, a gain on the sale of a workshop in the current year and lower interest expense. These favorable items were largely offset by higher depreciation expense and the negative effects of foreign exchange.
Revenues
Lease revenue decreased $10.4 million in 2015, primarily due to the effects of a weaker euro, as noted above. The decrease was partially offset by additional cars on lease in the current year. Other revenue decreased $0.8 million primarily due to the absence of interest income on a loan that was repaid in the current year.
Expenses
Maintenance expense decreased $4.8 million in 2015, primarily due to the positive effects of foreign exchange, lower costs at our European maintenance facilities and lower costs of wheelset replacements, partially offset by higher cost of railcar revisions. Depreciation expense decreased $2.0 million, largely due to the effects of foreign exchange partially offset by the impact of new cars added to the fleet.
28
Other Income (Expense)
Net gain on asset dispositions increased $1.0 million in 2015, primarily due to a gain on the sale of a workshop in the current year, partially offset by lower railcar scrapping gains and fewer railcars sold. Net interest expense decreased $2.9 million, driven by lower average rates in the current year and the effects of foreign exchange. Other expense decreased $1.5 million largely due to the net impact of changes in foreign exchange rates on non-functional currency items and derivatives, partially offset by higher legal fees and costs related to the early repayment of debt in the current year.
Investment Volume
Investment volume in 2015, which includes progress payments on scheduled deliveries of new railcars and car improvements, was $69.2 million compared to $81.6 million in 2014. During 2015, we took delivery of 550 railcars at GRE, 277 railcars at Rail India and 50 railcars at Rail Russia, compared to approximately 535 railcars at GRE in 2014.
Comparison of the Second Quarter of 2015 to the Second Quarter of 2014
Foreign Currency
In the second quarter of 2015, a weaker euro negatively impacted lease revenue by approximately $9.1 million and segment profit, excluding other income (expense), by approximately $4.9 million compared to the second quarter of 2014.
Segment Profit
Segment profit was $19.1 million in 2015, compared to $19.4 million in 2014 and was positively impacted by higher lease revenue from more cars on lease and lower interest expense. These favorable items were partially offset by higher depreciation expense, lower asset remarketing income and the negative effects of foreign exchange.
Revenues
Lease revenue decreased $5.3 million, primarily due to the effects of a weaker euro. The decrease was partially offset by additional cars on lease in the current year. Other revenue decreased $0.7 million primarily due to the absence of interest income on a loan that was repaid in the current year.
Expenses
Maintenance expense decreased $2.2 million, largely due to the effects of foreign exchange. Depreciation expense decreased $1.0 million, driven by the effects of foreign exchange, partially offset by the impact of new cars added to the fleet. Other operating expense increased $0.5 million primarily due to higher switching and freight costs.
Other Income (Expense)
Net gain on asset dispositions decreased $1.5 million, primarily due to a gain on the sale of railcars in the prior year and lower railcar scrapping gains. Net interest expense decreased $3.2 million primarily due to lower average rates in the current year and the effects of foreign exchange. Other expense decreased $1.5 million largely due to the net impact of changes in foreign exchange rates on non-functional currency items and derivatives, partially offset by higher legal fees and costs related to the early repayment of debt in the current year.
29
ASC
Segment Summary
Extended winter weather conditions on the Great Lakes resulted in significant ice coverage and thickness and a later start to the 2015 sailing season, consistent with 2014. ASC experienced lower demand for iron ore shipments as domestic steel production declined. ASC expects to recover some of this lost iron ore volume in the second half of the year, but segment profit for the full year will be lower than 2014. Twelve vessels were in service at the end of the quarter, compared to thirteen vessels in the prior year.
During the first six months of 2015, we carried 9.2 million net tons of freight compared to 8.3 million net tons during the first six months of 2014.
The following table shows ASC’s segment results (in millions):
Three Months Ended June 30 | Six Months Ended June 30 | ||||||||||||||
2015 | 2014 | 2015 | 2014 | ||||||||||||
Revenues | |||||||||||||||
Lease revenue | $ | 1.0 | $ | 1.0 | $ | 2.0 | $ | 2.1 | |||||||
Marine operating revenue | 51.0 | 59.4 | 58.0 | 62.5 | |||||||||||
Total Revenues | 52.0 | 60.4 | 60.0 | 64.6 | |||||||||||
Expenses | |||||||||||||||
Maintenance expense | 7.0 | 7.3 | 7.2 | 7.5 | |||||||||||
Marine operating expense | 34.1 | 42.3 | 41.0 | 45.7 | |||||||||||
Depreciation expense | 4.9 | 4.4 | 4.9 | 4.4 | |||||||||||
Operating lease expense | 1.7 | 1.7 | 1.7 | 1.7 | |||||||||||
Total Expenses | 47.7 | 55.7 | 54.8 | 59.3 | |||||||||||
Other Income (Expense) | |||||||||||||||
Net loss on asset dispositions | — | — | — | (0.4 | ) | ||||||||||
Interest expense, net | (1.3 | ) | (1.4 | ) | (2.6 | ) | (2.8 | ) | |||||||
Other expense | (0.1 | ) | (0.2 | ) | (0.1 | ) | (0.2 | ) | |||||||
Segment Profit | $ | 2.9 | $ | 3.1 | $ | 2.5 | $ | 1.9 | |||||||
Investment Volume | $ | 10.2 | $ | 7.7 | $ | 19.5 | $ | 16.0 | |||||||
Total Net Tons Carried (000's) | 8,447 | 7,827 | 9,231 | 8,276 | |||||||||||
Comparison of the First Six Months of 2015 to the First Six Months of 2014
Segment Profit
Segment profit was $2.5 million, compared to a profit of $1.9 million in the prior period. Both periods were impacted by difficult operating conditions on the Great Lakes. Additionally, results in the current year were negatively impacted by lower shipments of higher-margin iron ore.
Revenues
Marine operating revenue decreased $4.5 million in 2015, primarily due to lower shipments of iron ore, which is longer haul, higher rate business, the impact of which more than offset the increase in overall volume. In addition, lower fuel revenue, which is offset in marine operating expense, contributed to the variance.
30
Expenses
Marine operating expense decreased $4.7 million in 2015, largely driven by lower fuel costs and the impact of fewer operating days. Due to the delay in the deployment of vessels at the beginning of the season, as well as the temporary lay-up of certain vessels for repairs, total operating days were lower in the current year. Inefficiencies associated with extended winter conditions earlier in each year also negatively impacted operations in both periods.
Other Income (Expense)
Net loss on asset dispositions of $0.4 million in 2014 was attributable to the ultimate disposal of an older, idle vessel.
Investment Volume
ASC's investments in each period consisted of structural and mechanical upgrades to our vessels.
Comparison of the Second Quarter of 2015 to the Second Quarter of 2014
Segment Profit
Segment profit was $2.9 million, compared to a profit of $3.1 million in the prior period. Lower iron ore shipments more than offset the impact of higher overall volume and lower marine operating expenses.
Revenues
Marine operating revenue decreased $8.4 million in 2015, primarily due to lower shipments of iron ore, which is longer haul, higher rate business, which more than offset the impact of higher overall volume. In addition, lower fuel revenue, which is offset in marine operating expense, contributed to the variance.
Expenses
Marine operating expense decreased $8.2 million in 2015, largely driven by lower fuel costs, fewer operating days and the temporary lay-up of a particular vessel for repairs.
Other Income (Expense)
Other expenses were comparable to prior year.
PORTFOLIO MANAGEMENT
Segment Summary
Portfolio Management's total asset base was $796.5 million at June 30, 2015, compared to $813.3 million at December 31, 2014, and $859.3 million at June 30, 2014.
The Rolls-Royce & Partners Finance companies (collectively the "RRPF affiliates") reported solid results, which reflect continued strong demand for spare aircraft engines. The RRPF affiliates contributed $24.0 million and $12.4 million to segment profit for the first six months and second quarter of 2015, compared to $21.8 million and $11.3 million in 2014.
The outlook for the inland marine market continues to be favorable for the remainder of 2015. Separately, the ocean-going vessels have recorded mixed results. The Nordic vessels have benefited from increased freight rates, resulting from an increase in demand and a decrease in excess supply. Alternatively, the Norgas vessels have experienced a significant market slowdown, resulting in reduced loads, shipments and rates. In aggregate, marine operations had a higher contribution to our segment profit for the first six months of 2015 compared to 2014.
31
The following table shows Portfolio Management's segment results (in millions):
Three Months Ended June 30 | Six Months Ended June 30 | ||||||||||||||
2015 | 2014 | 2015 | 2014 | ||||||||||||
Revenues | |||||||||||||||
Lease revenue | $ | 6.3 | $ | 7.4 | $ | 13.0 | $ | 14.8 | |||||||
Marine operating revenue | 15.0 | 12.8 | 32.2 | 27.4 | |||||||||||
Other revenue | 0.2 | 0.8 | 0.8 | 2.5 | |||||||||||
Total Revenues | 21.5 | 21.0 | 46.0 | 44.7 | |||||||||||
Expenses | |||||||||||||||
Marine operating expense | 13.2 | 12.3 | 25.2 | 23.9 | |||||||||||
Depreciation expense | 5.4 | 5.8 | 10.9 | 11.3 | |||||||||||
Other operating expense | 0.5 | 0.5 | 1.4 | 0.9 | |||||||||||
Total Expenses | 19.1 | 18.6 | 37.5 | 36.1 | |||||||||||
Other Income (Expense) | |||||||||||||||
Net gain on asset dispositions | 1.5 | 1.7 | 5.1 | 3.0 | |||||||||||
Interest expense, net | (5.6 | ) | (6.1 | ) | (10.8 | ) | (12.9 | ) | |||||||
Other income | — | — | — | 0.3 | |||||||||||
Share of affiliates' earnings (pretax) | 12.0 | 13.5 | 23.4 | 24.4 | |||||||||||
Segment Profit | $ | 10.3 | $ | 11.5 | $ | 26.2 | $ | 23.4 | |||||||
Investment Volume | $ | 0.3 | $ | 12.0 | $ | 0.3 | $ | 12.0 | |||||||
The following table shows the approximate net book values of Portfolio Management's assets (in millions):
June 30 2014 | September 30 2014 | December 31 2014 | March 31 2015 | June 30 2015 | |||||||||||||||
Net book value of owned assets | $ | 523.0 | $ | 488.5 | $ | 474.6 | $ | 450.2 | $ | 442.8 | |||||||||
Affiliate investments | 336.3 | 327.9 | 338.7 | 344.2 | 353.7 | ||||||||||||||
Net book value of managed portfolio | 85.1 | 77.4 | 64.1 | 107.8 | 88.1 | ||||||||||||||
Comparison of the First Six Months of 2015 to the First Six Months of 2014
Segment Profit
Segment profit was $26.2 million, compared to $23.4 million in the prior year. This increase was attributable to higher marine operating income, lower interest expense and higher gains on asset dispositions. These favorable items were partially offset by lower lease revenue and share of affiliates' earnings.
Revenues
Lease revenue decreased $1.8 million in 2015, primarily due to the sale of leased assets in both years. Marine operating revenue increased $4.8 million, primarily due to higher inland marine revenue and higher revenue from the Nordic vessels, partially offset by lower revenue from the Norgas vessels. Other revenue decreased $1.7 million, primarily due to lower distributions from investment funds and lower interest income due to the payoff of loans in the prior year.
32
Expenses
Marine operating expense increased $1.3 million in 2015, primarily due to higher expenses for inland marine operations and higher expenses for the Norgas vessels related to the allocation of expenses from the pool in which it operates. Partially offsetting these higher expenses was an insurance claim recovery received in the current year.
Other Income (Expense)
Net gain on asset dispositions increased $2.1 million in 2015, primarily due to the sale of an inland marine asset in the current year. Net interest expense decreased $2.1 million as a result of a lower average debt balance and lower average interest rates.
Share of affiliates' earnings decreased $1.0 million in 2015, largely due to a casualty gain recognized at our Cardinal Marine affiliate in the prior year and the absence of earnings from terminated joint ventures, partially offset by lower interest expense and higher gains on engine disposals at the RRPF affiliates in the current year.
Investment Volume
Investment volume in 2015 included $0.3 million to convert six open hopper barges to covered hopper barges.
Comparison of the Second Quarter of 2015 to the Second Quarter of 2014
Segment Profit
Segment profit was $10.3 million in 2015 compared to $11.5 million in the prior year. This decrease was attributable to lower share of affiliates' earnings and lower lease revenue, partially offset by lower interest expense.
Revenues
Lease revenue decreased $1.1 million in 2015, primarily due to the sale of leased assets in both years. Marine operating revenue increased $2.2 million, primarily due to higher revenue from the Nordic vessels and higher inland marine revenue, partially offset by lower revenue from the Norgas vessels. Other revenue decreased $0.6 million, primarily due to lower interest income due to the payoff of loans in the prior year and lower distributions from investment funds.
Expenses
Marine operating expense increased $0.9 million in 2015, primarily due to higher expenses for the Norgas vessels related to the allocation of expenses from the pool in which it operates. Depreciation expense decreased $0.4 million primarily due to the sale of a leased asset in the current year.
Other Income (Expense)
Net gain on asset dispositions decreased $0.2 million in 2015, primarily due to fewer asset dispositions. Net interest expense decreased $0.5 million as a result of a lower average debt balance and lower average interest rates.
Share of affiliates' earnings decreased $1.5 million in 2015, largely due to a casualty gain recognized at our Cardinal Marine affiliate in the prior year and the absence of earnings from terminated joint ventures, partially offset by lower interest expense and higher gains on engine disposals at the RRPF affiliates in the current year.
33
OTHER
Other comprises selling, general and administrative expense (“SG&A”), unallocated interest expense, and miscellaneous income and expense not directly associated with the reporting segments and eliminations.
The following table shows components of Other (in millions):
Three Months Ended June 30 | Six Months Ended June 30 | ||||||||||||||
2015 | 2014 | 2015 | 2014 | ||||||||||||
Selling, general and administrative expense | $ | 44.6 | $ | 44.9 | $ | 90.3 | $ | 87.6 | |||||||
Unallocated interest expense, net | 4.0 | 0.5 | 7.4 | 3.5 | |||||||||||
Other expense (including eliminations) | (0.6 | ) | 1.6 | 1.2 | 1.9 | ||||||||||
SG&A, Unallocated Interest and Other
SG&A was $2.7 million higher for the six months of 2015 compared to the prior year, primarily due to higher compensation and pension expense, partially offset by lower information technology expense. SG&A was modestly lower for the second quarter of 2015 compared to the prior year largely due to lower information technology expense, which is expected to be timing in nature, partially offset by higher pension expense. Unallocated interest expense (the difference between external interest expense and interest expense allocated to the reporting segments in accordance with assigned leverage targets) in any period is affected by our consolidated leverage position as well as the timing of debt issuances and investing activities. Other expense and eliminations decreased $0.7 million and $2.2 million for the first six months and the second quarter of 2015, compared to the prior year periods. Both decreases were due to the impacts of foreign exchange on a pension plan and termination costs incurred in the prior year related to the prepayment of debt.
Consolidated Income Taxes
See "Note 7. Income Taxes" in Part I, Item 1 of this Form 10-Q.
CASH FLOW AND LIQUIDITY
We generate a significant amount of cash from operating activities and from our investment portfolio. We also access domestic and international capital markets by issuing unsecured or secured debt and commercial paper. We use these sources of cash, along with our available cash balances, to fulfill our debt, lease, and dividend obligations and to fund portfolio investments and capital additions. We primarily use cash from operations and commercial paper issuances to fund daily operations.
The timing of asset dispositions and changes in working capital impacts cash flows from operations and portfolio proceeds. As a result, these cash flow components may vary materially from quarter to quarter and year to year. As of June 30, 2015, we had an unrestricted cash balance of $58.6 million.
34
The following table shows our principal sources and uses of cash for the six months ended June 30 (in millions):
2015 | 2014 | ||||||
Principal sources of cash | |||||||
Net cash provided by operating activities | $ | 191.5 | $ | 168.1 | |||
Portfolio proceeds | 211.5 | 137.8 | |||||
Other asset sales | 12.9 | 16.3 | |||||
Proceeds from issuance of debt, commercial paper, and credit facilities | 689.0 | 993.7 | |||||
$ | 1,104.9 | $ | 1,315.9 | ||||
Principal uses of cash | |||||||
Portfolio investments and capital additions | $ | (356.2 | ) | $ | (655.1 | ) | |
Repayments of debt, commercial paper, and credit facilities | (713.3 | ) | (665.8 | ) | |||
Purchases of leased-in assets | (99.5 | ) | (150.5 | ) | |||
Payments on capital lease obligations | (1.3 | ) | (1.3 | ) | |||
Cash dividends | (35.2 | ) | (32.2 | ) | |||
Stock repurchases | (64.1 | ) | (88.5 | ) | |||
$ | (1,269.6 | ) | $ | (1,593.4 | ) | ||
Net cash provided by operating activities of $191.5 million increased $23.4 million compared to 2014. The increase was driven by higher lease revenue and lower maintenance expense, partially offset by a decrease in distributions from joint ventures and other net changes in certain working capital items.
Portfolio proceeds for the first six months of 2015 of $211.5 million increased by $73.7 million compared to 2014, driven by a loan repayment and higher asset sales. In January 2015, Ahaus Alstätter Eisenbahn Cargo AG (“AAE”) repaid its outstanding loan in the amount of €67.5 million ($76.4 million).
Proceeds from the issuance of debt for the first six months of 2015 were $689.0 million (net of hedges and debt issuance costs). In North America, $650 million of unsecured debt was issued, which included $100 million of 2.60% senior notes due in 2020, $300 million of 3.25% senior notes due in 2025, and $250 million of 4.50% senior notes due in 2045. In Europe, $56.5 million of unsecured debt was issued. Debt repayments of $713.3 million for the first six months of 2015 were $47.5 million higher than prior year and included debt repayments of $290.7 million in Europe. Each year included scheduled maturities in addition to the early retirement of higher cost debt.
Portfolio investments and capital additions primarily consist of purchases of operating assets, investments in affiliates, and capitalized asset improvements. See individual segment discussions for further information on investment volume. In 2014, we acquired a fleet of more than 18,500 boxcars for approximately $340 million.
In the first quarter of 2014, our board of directors authorized a $250 million share repurchase program. As of June 30, 2015, 3.1 million shares had been acquired for $192.5 million, and $57.5 million remains available under the repurchase authorization.
35
Short-Term Borrowings
The following table provides additional information regarding our short-term borrowings for the six months ended June 30, 2015:
_________
North America (1) | Europe (2) | ||||||
Balance as of June 30 (in millions) | $ | — | $ | 3.8 | |||
Weighted average interest rate | — | % | 1.3 | % | |||
Euro/Dollar exchange rate | n/a | 1.11 | |||||
Average amount outstanding year to date (in millions) | $ | 10.9 | $ | 3.8 | |||
Weighted average interest rate | 0.5 | % | 1.3 | % | |||
Average Euro/Dollar exchange rate | n/a | 1.12 | |||||
Average amount outstanding during 2nd quarter (in millions) | $ | 0.1 | $ | 3.8 | |||
Weighted average interest rate | 0.4 | % | 1.3 | % | |||
Average Euro/Dollar exchange rate | n/a | 1.11 | |||||
Maximum month-end amount outstanding year to date (in millions) | $ | 35.0 | $ | 3.8 | |||
Applicable month-end Euro/Dollar exchange rate | n/a | 1.11 | |||||
(1) Short-term borrowings in North America consist solely of commercial paper issued in the US.
(2) Short-term borrowings in Europe are comprised of borrowings under bank credit facilities.
Revolving Credit Facility
As of June 30, 2015, we had a $575 million 5-year unsecured credit facility in the US. In May 2015, we exercised an option to extend the maturity date of our revolving credit facility by one year to April 2020. As of June 30, 2015, the full $575 million was available under the facility.
Restrictive Covenants
Our $575 million revolving credit facility contains various restrictive covenants, including requirements to maintain a fixed charge coverage ratio and an asset coverage test. Some of our bank term loans have the same financial covenants as the facility.
The indentures for our public debt also contain various restrictive covenants, including limitation on liens provisions that limit the amount of additional secured indebtedness that we may incur. Additionally, certain exceptions to the covenants permit us to incur an unlimited amount of purchase money and nonrecourse indebtedness.
The loan agreements for our European rail subsidiaries (collectively, "GRE") also contain restrictive covenants, including leverage and cash flow covenants specific to those subsidiaries, restrictions on making loans, and limitations on the ability of those subsidiaries to repay loans or to distribute capital to certain related parties (including GATX, the US parent company). These covenants effectively limit GRE's ability to transfer funds to us.
We do not anticipate any covenant violations nor do we anticipate that any of these covenants will restrict our operations or our ability to obtain additional financing. At June 30, 2015, we were in compliance with all covenants and conditions of all of our credit agreements.
Credit Ratings
The global capital market environment and outlook may affect our funding options and our financial performance. Our access to capital markets at competitive rates depends on our credit rating and ratings outlook, as determined by rating agencies. As of June 30, 2015, our long-term unsecured debt was rated BBB by Standard & Poor's and Baa2 by Moody’s Investors Service and our short-term unsecured debt was rated A-2 by Standard & Poor's and P-2 by Moody’s Investor Service. Our rating outlook from both agencies was stable.
36
Contractual Commitments
The following table shows our contractual commitments, including debt principal amounts, lease payments, and portfolio investments at June 30, 2015, (in millions):
Payments Due by Period | |||||||||||||||||||||||||||
Total | 2015 (1) | 2016 | 2017 | 2018 | 2019 | Thereafter | |||||||||||||||||||||
Recourse debt | $ | 4,217.3 | $ | 76.7 | $ | 558.1 | $ | 412.8 | $ | 519.7 | $ | 550.0 | $ | 2,100.0 | |||||||||||||
Nonrecourse debt | 11.5 | 4.5 | 7.0 | — | — | — | — | ||||||||||||||||||||
Commercial paper and credit facilities | 3.8 | 3.8 | — | — | — | — | — | ||||||||||||||||||||
Capital lease obligations | 5.4 | 1.5 | 2.7 | 1.2 | — | — | — | ||||||||||||||||||||
Operating leases — recourse | 689.3 | 33.5 | 86.8 | 93.0 | 84.1 | 79.2 | 312.7 | ||||||||||||||||||||
Operating leases — nonrecourse | 60.4 | 5.5 | 8.1 | 9.5 | 9.0 | 9.7 | 18.6 | ||||||||||||||||||||
Portfolio investments (2) | 1,821.5 | 279.8 | 490.0 | 345.8 | 313.8 | 392.1 | — | ||||||||||||||||||||
$ | 6,809.2 | $ | 405.3 | $ | 1,152.7 | $ | 862.3 | $ | 926.6 | $ | 1,031.0 | $ | 2,431.3 | ||||||||||||||
_________
(1) For remainder of the year.
(2) Primarily railcar purchase commitments. The amounts shown for all years are based on management's estimates of the timing, anticipated car types and related costs of railcars to be purchased under its agreements. Amount shown for 2017 also includes $24.0 million related to an option we exercised to purchase a vessel that is currently on lease.
In 2014, we entered into a long-term supply agreement with Trinity Rail Group, LLC (“Trinity”), a subsidiary of Trinity Industries, Inc., to take effect upon the scheduled expiration of the current railcar supply agreement in 2016. Under terms of the agreement, we will purchase up to a total of 8,950 newly built railcars over a four-year period from March, 2016 through March, 2020. We may order both tank and freight cars; however, we expect that the majority of the order will be for tank cars. Except to the extent the parties otherwise agree, railcar pricing will be on an agreed upon or cost-plus basis subject to certain specified adjustments and surcharges throughout the term of the agreement. In addition, in January, 2017, either party may initiate a review of the cost-plus basis pricing if it is not reflective of then-current market prices. If the parties cannot agree on revised cost-plus pricing (or otherwise agree that no changes are necessary), either party may, at its election, deliver to the other party a notice of its intent to terminate, and in such case, the agreement will automatically terminate 30 days thereafter unless the non-terminating party agrees to a specified revised margin as set forth in the agreement.
CRITICAL ACCOUNTING POLICIES
There have been no changes to our critical accounting policies during the six months ended June 30, 2015. Refer to our Annual Report on Form 10-K for the year ended December 31, 2014, for a summary of our policies.
37
NON-GAAP FINANCIAL MEASURES
We compute some financial measures using non-GAAP components, as defined by the SEC. These measures are not in accordance with, or a substitute for, GAAP and our financial measures may be different from non-GAAP financial measures used by other companies.
We have provided a reconciliation of our non-GAAP components to the most directly comparable GAAP components. We include these non-GAAP financial measures to provide additional information and insight into our operating results and financial position. We use these measures in analyzing our financial performance from period to period and when making compensation decisions.
Glossary of Key Terms
• | Non-GAAP financial measures — Numerical or percentage-based measures of a company’s historical performance, financial position, or liquidity calculated using a component different from that presented in the financial statements as prepared in accordance with GAAP. |
• | Net income excluding tax adjustments and other items — Net income excluding certain items that we believe are not necessarily related to our ongoing business activities. |
• | Off-balance-sheet assets — Assets, primarily railcars, that are financed with operating leases and therefore not recorded on the balance sheet. We estimate the off-balance-sheet asset amount by calculating the present value of committed future operating lease payments using the interest rate implicit in each lease. |
• | On-balance-sheet assets — Total assets reported on the balance sheet. |
• | Return on equity — Net income divided by average shareholders’ equity. |
• | Return on equity excluding tax adjustments and other items — Net income excluding tax adjustments and other items divided by average shareholders’ equity. |
Reconciliation of Non-GAAP Components used in the Computation of Certain Financial Measures
Balance Sheet Measures
We disclose total on- and off-balance-sheet assets because a portion of our North America railcar fleet has been financed through sale-leasebacks that are accounted for as operating leases and the assets are not recorded on the balance sheet. Additionally, ASC utilizes a tug and barge unit that is accounted for as an operating lease and the assets are not recorded on the balance sheet. We believe this information provides investors with a better representation of the assets deployed in our businesses.
The following table shows total on- and off-balance-sheet assets (in millions):
June 30 2014 | September 30 2014 | December 31 2014 | March 31 2015 | June 30 2015 | |||||||||||||||
Consolidated on-balance-sheet assets | $ | 6,921.1 | $ | 6,816.3 | $ | 6,937.5 | $ | 7,056.4 | $ | 6,860.0 | |||||||||
Off-balance-sheet assets: | |||||||||||||||||||
Rail North America | 683.2 | 602.9 | 606.1 | 566.1 | 557.2 | ||||||||||||||
ASC | 14.1 | 12.9 | 11.7 | 10.5 | 9.3 | ||||||||||||||
Total On- and Off-Balance-Sheet Assets | $ | 7,618.4 | $ | 7,432.1 | $ | 7,555.3 | $ | 7,633.0 | $ | 7,426.5 | |||||||||
Shareholders’ Equity | $ | 1,374.4 | $ | 1,331.2 | $ | 1,314.0 | $ | 1,282.5 | $ | 1,285.4 | |||||||||
38
Net Income Measures
We report net income excluding certain items that we believe are not necessarily reflective of our ongoing business activities. No such adjustments occurred in the first six months of 2015 or 2014, however, certain of these adjustments occurred in 2013 and impacted the computation of return on equity for the trailing twelve months earnings as disclosed in this report. The following table shows our net income, excluding tax adjustments and other items, for the trailing twelve months ended June 30 (in millions):
2015 | 2014 | ||||||
Net income | $ | 217.4 | $ | 202.3 | |||
Adjustments attributable to consolidated income: | |||||||
GATX income taxes on sale of AAE (1) | — | 23.2 | |||||
Foreign tax credit carryforward (1)(2) | — | (3.9 | ) | ||||
Adjustments attributable to affiliates' earnings: | |||||||
Pretax gain on sale of AAE (1) | — | (9.3 | ) | ||||
Gains on interest rate swaps at AAE, net of taxes (3) | — | (5.2 | ) | ||||
Income tax rate changes (4) | — | (7.6 | ) | ||||
Net income excluding tax adjustments and other items | $ | 217.4 | $ | 199.5 | |||
________
(1) Aggregate after-tax impact of the AAE sale, including the $3.9 million foreign credit carryforward, was a net loss of $10.0
million.
(2) Represents benefits attributable to the utilization of foreign tax credit carryforwards.
(3) Represents unrealized gains on AAE interest rate swaps.
(4) Deferred tax adjustments due to an enacted statutory rate decrease in the United Kingdom.
39
Item 3. Quantitative and Qualitative Disclosures about Market Risk
Since December 31, 2014, there have been no material changes in our interest rate and foreign currency exposures or types of derivative instruments used to hedge these exposures. For a discussion of our exposure to market risk, refer to "Item 7A. Quantitative and Qualitative Disclosure about Market Risk" of our Annual Report on Form 10-K for the year ended December 31, 2014.
Item 4. Controls and Procedures
We have conducted an evaluation of our disclosure controls and procedures (as defined in Rules 13a-15(e) and 15d-15(e) of the Securities Exchange Act of 1934 (the “Exchange Act”)), with the participation of our Chief Executive Officer and Chief Financial Officer. Based on such evaluation, our Chief Executive Officer and Chief Financial Officer have concluded that, as of the end of the period covered by this quarterly report, our disclosure controls and procedures were effective.
No change in our internal control over financial reporting (as defined in Exchange Act Rules 13a-15(f) and 15d-15(f)) occurred during the quarter ended June 30, 2015, that materially affected, or is reasonably likely to materially affect, our internal control over financial reporting.
40
PART II - OTHER INFORMATION
Item 1. Legal Proceedings
Information concerning litigation and other contingencies is described in "Note 11. Legal Proceedings and Other Contingencies" in Part I, Item 1 of this Form 10-Q and is incorporated herein by reference.
Item 1A. Risk Factors
Since December 31, 2014, there have been no material changes in our risk factors. For a discussion of our risk factors, refer to "Item 1A. Risk Factors" of our Annual Report on Form 10-K for the year ended December 31, 2014.
Item 2. Unregistered Sales of Equity Securities and Use of Proceeds
(c) On January 23, 2014, our board of directors authorized a $250 million share repurchase program. The following is a summary of stock repurchases for the quarter ended June 30, 2015. As of June 30, 2015, $57.5 million was available under the repurchase authorization.
Issuer Purchases of Equity Securities | ||||||||||
(a) | (b) | (c) | (d) | |||||||
Total | Total Number of Shares Purchased | Average Price Paid per Share | Total Number of Shares Purchased as Part of Publicly Announced Plans or Programs | Maximum Number (or Approximate Dollar Value) of Shares that May Yet Be Purchased Under the Plans or Programs (1) | ||||||
April 1, 2015 - April 30, 2015 | 205,112 | $57.83 | 205,112 | $86.6 million | ||||||
May 1, 2015 - May 31, 2015 | 222,715 | $55.44 | 222,715 | $74.2 million | ||||||
June 1, 2015 - June 30, 2015 | 298,943 | $56.01 | 298,943 | $57.5 million | ||||||
Total | 726,770 | $56.35 | 726,770 | |||||||
_________
(1) Does not include commissions paid to repurchase shares.
Item 6. Exhibits
Exhibits:
Reference is made to the exhibit index which is included herewith and is incorporated by reference hereto.
41
SIGNATURE
Pursuant to the requirements of the Securities Exchange Act of 1934, the registrant has duly caused this report to be signed on its behalf by the undersigned thereunto duly authorized.
GATX CORPORATION (Registrant) |
/s/ Robert C. Lyons |
Robert C. Lyons |
Executive Vice President and Chief Financial Officer |
(Duly Authorized Officer) |
Date: July 31, 2015
42
EXHIBIT INDEX
Exhibit Number | Exhibit Description | |
Filed with this Report: | ||
10.1 | Amendment No. 2 to the Credit Agreement, dated as of May 20, 2015, among GATX Corporation, as borrower, Citigroup Global Markets Inc. and Merrill Lynch, Pierce, Fenner & Smith Incorporated, as joint lead arrangers and joint book managers, Bank of America, N.A., as syndication agent, PNC Bank, N.A., U.S. Bank, National Association and Bayerische Landesbank, acting through its New York branch, as co-documentation agents, Citibank, N.A., as administrative agent, and the lenders party thereto. | |
31A. | Certification Pursuant to Exchange Act Rule 13a-14(a) and Rule 15d-14(a) (CEO Certification). | |
31B. | Certification Pursuant to Exchange Act Rule 13a-14(a) and Rule 15d-14(a) (CFO Certification). | |
32. | Certification Pursuant to 18 U.S.C. Section 1350 (CEO and CFO Certification). | |
101. | The following materials from GATX Corporation’s Quarterly Report on Form 10-Q for the quarter ended June 30, 2015, formatted in XBRL (eXtensible Business Reporting Language): (i) Consolidated Balance Sheets at June 30, 2015 and December 31, 2014, (ii) Consolidated Statements of Comprehensive Income for the three and six months ended June 30, 2015 and 2014, (iii) Consolidated Statements of Cash Flows for the six months ended June 30, 2015 and 2014, and (iv) Notes to the Consolidated Financial Statements. | |
43