Attached files
| file | filename |
|---|---|
| 8-K - FORM 8-K - Simulations Plus, Inc. | simulations_8k-071315.htm |
| EX-99.2 - PRESS RELEASE - Simulations Plus, Inc. | simulations_8k-ex9902.htm |
| EX-99.3 - EMPLOYMENT AGREEMENT - Simulations Plus, Inc. | simulations_8k-ex9903.htm |
Exhibit 99.1

Copyright (c) 2015 Simulations Plus, Inc. 1 Simulations Plus, Inc . and its wholly owned subsidiary Cognigen Corporation ( NASDAQ:SLP ) Investor Call July 13, 2015
| 1 |

Copyright (c) 2015 Simulations Plus, Inc. 2 With the exception of historical information, the matters discussed in this presentation are forward - looking statements that involve a number of risks and uncertainties . The actual results of the Company could differ significantly from those statements . Factors that could cause or contribute to such differences include, but are not limited to : continuing demand for the Company’s products, competitive factors, the Company’s ability to finance future growth, the Company’s ability to produce and market new products in a timely fashion, the Company’s ability to continue to attract and retain skilled personnel, and the Company’s ability to sustain or improve current levels of productivity . Further information on the Company’s risk factors is contained in the Company’s quarterly and annual reports and filed with the Securities and Exchange Commission . Safe Harbor Statement
| 2 |
Copyright (c) 2015 Simulations Plus, Inc. 3 Quarterly Highlights Walt Woltosz Chairman and Chief Executive Officer
| 3 |

Copyright (c) 2015 Simulations Plus, Inc. 4 • Major provider of software and consulting services for pharmaceutical research and development • Expertise and software tools spanning from earliest drug discovery through clinical trials and beyond patent life to supporting generic companies • In addition to being a leader in model - based drug development, the company is now developing new applications in aerospace and general healthcare based on it’s machine - learning technologies • In 3QFY15, revenues increased by 58.9% to $5.9 million • Total revenues through the end of the third quarter were $14.6 million, up 54% over the prior year • In 3QFY15, diluted EPS increased 36.5% to $0.11 per share compared to same period last year • The board voted to continue distribution of a $0.05 per quarter dividend to be paid July 30 Simulations Plus, Inc. Overview
| 4 |

Copyright (c) 2015 Simulations Plus, Inc. 5 • Software renewal rates 99%(fees) • 21 new software client sites added • Product releases • GastroPlus 9.0: biologics, dermal dosing, enhanced oral cavity dosing , enhanced ADMET Predictor integration • ADMET Predictor 7.2: new properties, retrained metabolism models, greater GastroPlus integration • KIWI 1.3: faster, enhanced exporting and comparison of models • Consulting services continue to grow Quarterly Highlights
| 5 |
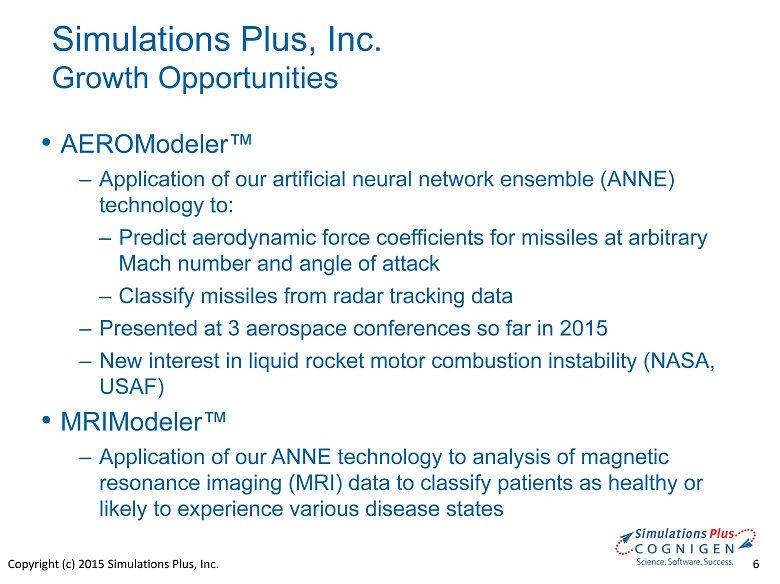
Copyright (c) 2015 Simulations Plus, Inc. 6 • AEROModeler™ ‒ Application of our artificial neural network ensemble (ANNE) technology to: ‒ Predict aerodynamic force coefficients for missiles at arbitrary Mach number and angle of attack ‒ Classify missiles from radar tracking data ‒ Presented at 3 aerospace conferences so far in 2015 ‒ New interest in liquid rocket motor combustion instability (NASA, USAF) • MRIModeler™ ‒ Application of our ANNE technology to analysis of magnetic resonance imaging (MRI) data to classify patients as healthy or likely to experience various disease states Simulations Plus, Inc. Growth Opportunities
| 6 |

Copyright (c) 2015 Simulations Plus, Inc. 7 Financial Overview John Kneisel Chief Financial Officer
| 7 |
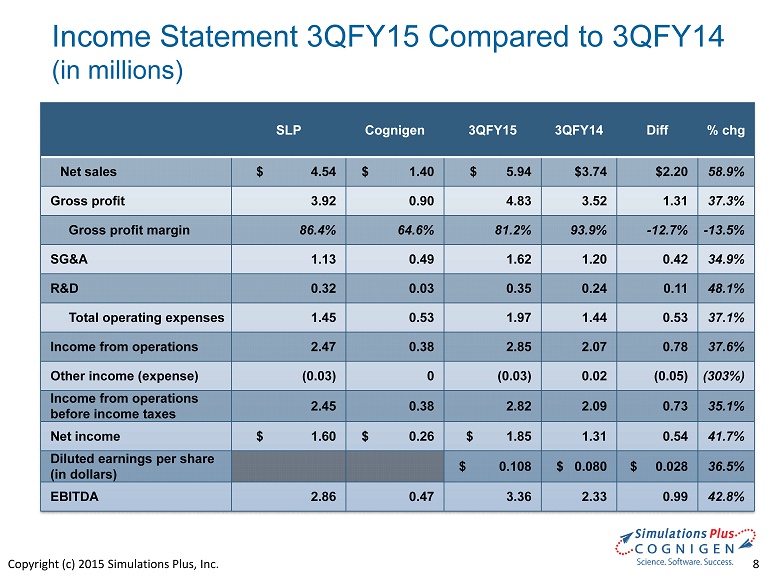
Copyright (c) 2015 Simulations Plus, Inc. 8 Income Statement 3QFY15 Compared to 3QFY14 (in millions) SLP Cognigen 3QFY15 3QFY14 Diff % chg Net sales $ 4.54 $ 1.40 $ 5.94 $ 3.74 $ 2.20 58.9% Gross profit 3.92 0.90 4.83 3.52 1.31 37.3% Gross profit margin 86.4% 64.6% 81.2% 93.9% - 12.7% - 13.5% SG&A 1.13 0.49 1.62 1.20 0.42 34.9% R&D 0.32 0.03 0.35 0.24 0.11 48.1% Total operating expenses 1.45 0.53 1.97 1.44 0.53 37.1% Income from operations 2.47 0.38 2.85 2.07 0.78 37.6% Other income (expense) (0.03) 0 (0.03) 0.02 ( 0.05) (303%) Income from operations before income taxes 2.45 0.38 2.82 2.09 0.73 35.1% Net income $ 1.60 $ 0.26 $ 1.85 1.31 0.54 41.7% Diluted earnings per share (in dollars) $ 0.108 $ 0.080 $ 0.028 36.5% EBITDA 2.86 0.47 3.36 2.33 0.99 42.8%
| 8 |

Copyright (c) 2015 Simulations Plus, Inc. 9 Income Statement 9moFY15 Compared to 9moFY14 (in millions) SLP Cog 9MoFY15 9moFY14 Diff % chg Net sales $ 10.80 $ 3.81 $ 14.60 $ 9.46 $ 5.14 54.3% Gross profit 9.12 2.24 11.36 8.29 3.07 37.0% Gross profit margin 84.5% 58.9% 75.4% 87.6% - 12.2% - 13.9% SG&A 3.75 1.56 5.30 3.38 1.92 57.0% R&D 0.93 0.06 0.98 0.75 0.23 30.8% Total operating expenses 4.68 1.61 6.29 4.13 2.16 52.2% Income from operations 4.45 0.63 5.08 4.17 0.91 21.9% Other income (expense) (0.06) - (0.06) 0.06 ( 0.12) (207%) Income from operations before income taxes 4.39 0.63 5.01 4.23 0.78 18.6% Net income $ 2.93 $ 0.42 $ 3.35 2.803 0.55 19.6% Diluted earnings per share (in dollars) $ 0.196 $ 0.170 $ 0.026 14.6% EBITDA 5.60 0.90 6.50 4.88 1.62 33.2%
| 9 |

Copyright (c) 2015 Simulations Plus, Inc. 10 Consolidated Revenues, by Fiscal Quarter and YTD (pro forma prior to 2012; in millions) 4.01 4.57 5.99 $0 $1 $2 $3 $4 $5 $6 $7 Q1 Q2 Q3 Q4 2009 2010 2011 2012 2013 2014 2015 14.57 $0 $1 $2 $3 $4 $5 $6 $7 $8 $9 $10 $11 $12 $13 $14 $15 $16 YTD 9 Months 2009 2010 2011 2012 2013 2014 2015
| 10 |

Copyright (c) 2015 Simulations Plus, Inc. 11 Consolidated Gross Profit, by Fiscal Quarter & YTD (pro forma prior to 2012; in millions) 3.09 3.45 4.83 $0 $1 $2 $3 $4 $5 $6 Q1 Q2 Q3 Q4 2009 2010 2011 2012 2013 2014 2015 11.37 $0 $1 $2 $3 $4 $5 $6 $7 $8 $9 $10 $11 $12 YTD 9 Months 2009 2010 2011 2012 2013 2014 2015
| 11 |

Copyright (c) 2015 Simulations Plus, Inc. 12 Consolidated Net Income, by Fiscal Quarter and YTD (pro forma prior to 2012; in millions) $0.53 $0.97 $1.85 $- $0.20 $0.40 $0.60 $0.80 $1.00 $1.20 $1.40 $1.60 $1.80 $2.00 Q1 Q2 Q3 Q4 2009 2010 2011 2012 2013 2014 2015 $3.35 $- $0.50 $1.00 $1.50 $2.00 $2.50 $3.00 $3.50 $4.00 YTD 9 Months 2009 2010 2011 2012 2013 2014 2015
| 12 |

Copyright (c) 2015 Simulations Plus, Inc. 13 Consolidated Diluted Earnings per share by Fiscal Quarter and YTD $0.20 $0.00 $0.05 $0.10 $0.15 $0.20 $0.25 Q3 YTD EPS (9 months) FY09 FY10 FY11 FY12 FY13 FY14 FY15 0 0.02 0.04 0.06 0.08 0.1 0.12 Q1 Q2 Q3 Q4 $0.03 $0.06 $0.11 Quarterly EPS FY09 FY10 FY11 FY12 FY13 FY14 FY15
| 13 |

Copyright (c) 2015 Simulations Plus, Inc. 14 Consolidated EBITDA, by Fiscal Quarter & YTD (in millions) 6.5 $0 $1 $2 $3 $4 $5 $6 $7 YTD 9 Months 2009 2010 2011 2012 1.45 1.97 3.33 $0 $1 $2 $3 $4 Q1 Q2 Q3 Q4 2009 2010 2011 2012 2013 2014 2015
| 14 |

Copyright (c) 2015 Simulations Plus, Inc. 15 Selected Balance Sheet Items (in millions) May 31, 2015 August 31, 2014 Cash and cash equivalents $6.429* $8.614 Cash per share 0.38 0.52 Total current assets 11.823 11.533 Total assets 27.912 20.981 Total current liabilities 1.717 1.391 Total liabilities 8.095 5.545 Current ratio 6.89 8.29 Shareholders’ equity 19.817 15.435 Total liabilities and shareholders’ equity 27.912 20.981 Shareholders’ equity per diluted share 1.161 0.94 * Cash as of July 10, 2015 was $7.7 million
| 15 |

Copyright (c) 2015 Simulations Plus, Inc. 16 Returning Cash to Shareholders (in millions) 1.6 0.8 0.8 2.2 0 0.5 0.5 0.6 0.81 0.81 0.81 0.84 0.84 0.84 13.2 12.9 12.7 11.4 9.3 9.8 10 10.1 10.6 11 7.8 8.6 5.8 6.1 6.4 7.7 $0 $1 $1 $2 $2 $3 $0 $2 $4 $6 $8 $10 $12 $14 Dividend Paid Cash on Hand Cash paid $2.5M TSRL Cash paid $2.1M for Cognigen
| 16 |

Copyright (c) 2015 Simulations Plus, Inc. 17 Sales and Marketing John DiBella VP of Sales and Marketing
| 17 |

Copyright (c) 2015 Simulations Plus, Inc. 18 • Version 9.0 released in May 2015 ‒ I ntegration with ADMET Predictor metabolism models – new add - on licensed by several clients ‒ PBPK models for biologics and dermal delivery – new add - on licensed by several clients • Version 7.2 released in May 2015 ‒ Significantly improved and expanded metabolism predictions – meaningful increase in revenue seen in FY15 ‒ Refresh of user interface slated for fall 2015 release – major marketing campaign planned • Version 4.0 & MedChem Designer 3.0 released in May 2014 ‒ Optical Structure Recognition (OSR) feature ‒ U ltra - fast screening methods for large molecular libraries • Version 5.0 slated for release in fall 2015 ‒ Coming soon: integration of ADMET Predictor models – new optional add - on ‒ Coming soon: upgraded handling of complex dosage forms/formulations • Version 1.0 released in November 2014 ‒ Integration with GastroPlus™ to accurately predict IVIVE for absorption processes ‒ Two license sales – changing marketing message to promote additional capabilities Simulations Plus Software Product News
| 18 |

Copyright (c) 2015 Simulations Plus, Inc. 19 Consolidated FY15.3 Sales Review • Consolidated revenue increased 58.8% vs. FY14.3 – SLP revenue increased 21.4% • Highlights: – 94% renewal rate ( accounts) – 99% renewal rate (fees ) – Strong new license revenue • 21 new software clients – Chinese SFDA, US FDA, US EPA + companies in Taiwan, Korea, Japan, Brazil, US and Europe – PBPK c onsulting revenue increased 155% vs. FY14.3: • $157K from SLP • $107K from Cognigen 0 50 100 150 200 250 1st Quarter 2nd Quarter 3rd Quarter 4th Quarter License Units FY13 FY14 FY15 61% 26% 12% 1% Renewal Consulting New Training
| 19 |

Copyright (c) 2015 Simulations Plus, Inc. 20 New Software Customers: Fiscal & YTD 64 0 10 20 30 40 50 60 70 Q3 YTD 9 Months 2011 2012 2013 2014 2015 23 20 21 0 5 10 15 20 25 Q1 Q2 Q3 Q4 Quarterly 2011 2012 2013 2014 2015
| 20 |

Copyright (c) 2015 Simulations Plus, Inc. 21 FY15.3 Software Sales – by Region Europe 30% North America 47% Asia 24% Japan = 63% China = 16% Korea = 8% India = 8% Other = 5 % South America <1%
| 21 |

Copyright (c) 2015 Simulations Plus, Inc. 22 Marketing Activities – FY15.3 • Marketing group restructuring – Filled new Marketing Coordinator position to manage campaigns – Transitioned scientist into Business Development role • Conferences and scientific meetings – 16 scientific meetings attended; co - authors on 12 presentations • Trainings and workshops – Conducted training workshops in Germany, Korea, and Buffalo – Remaining 2015 workshops scheduled for Boston and Japan – Hosted numerous onsite training seminars at client sites • Strategic digital marketing initiatives – Hosted 2 webinars on our software updates and applications – Active updates: LinkedIn, Facebook, Google+, and Twitter accounts – Continued web - based advertising for all programs – 15 peer - reviewed publications citing use of software
| 22 |

Copyright (c) 2015 Simulations Plus, Inc. 23 Cognigen Update Ted Grasela President
| 23 |

Copyright (c) 2015 Simulations Plus, Inc. 24 Simulations Plus, Inc. Cognigen Growth Opportunities • Strategic and synergistic benefits of the Cognigen acquisition are being realized • Strong collaborations between our scientists have identified new and innovative ways of using modeling and simulation to bring valuable insights to our clients’ research and development programs • Social media and Email blasts emphasizing − Modeling & simulation services − Data Assembly services − KIWI™ functionality • Enhanced presence at national and international scientific meetings
| 24 |

Copyright (c) 2015 Simulations Plus, Inc. 25 • 3QFY15 ‒ Active projects at end of quarter: ~48 ‒ New clients: 2 ‒ New projects and expansions in scope: ~14 ‒ Client assistance in regulatory interactions: ~25% of projects • Beyond 3QFY15 – current ‒ New clients and new clients in pipeline: 6 ‒ New projects and expansions in scope: ~12 • KIWI ™ licenses 3QFY15: 3 ‒ KIWI ™ prospects: 6 ‒ Successful PAGE meeting in June 2015 – 10 demonstrations ‒ Targeting release of KIWI ™ Version 1.5 in October 2015 Simulations Plus, Inc. Cognigen Sales Update
| 25 |

Copyright (c) 2015 Simulations Plus, Inc. 26 • Analysis in R&D can be messy with data and inputs coming from many groups • Careful synthesis and communication is essential • The industry has enormous computing power • The industry lacks tools for harnessing that power Behind the scenes in R&D Coping with complexity and chaos
| 26 |

Copyright (c) 2015 Simulations Plus, Inc. 27 KIWI™ – A Software Platform for Accessing Cognigen’s Validated Cloud Processing Capabilities
| 27 |

Copyright (c) 2015 Simulations Plus, Inc. 28 • Company awarded a $200,000 cooperative agreement to develop improved modeling and simulation capabilities for dosage forms designed to be applied to the eye • Completed first 3/4 - year of 3 - year funded collaboration • On target to meet all milestones • Consortium of leading pharmaceutical companies has been established to ensure the scientific integrity of the improved model and maximize the impact on the industry. • In a recent report, the global ophthalmic drugs market was valued at $16 billion in 2012 and is expected to reach an estimated value of $21.6 billion in 2018 • Globally, the ophthalmic drugs market is witnessing significant growth due to increasing prevalence of eye disorders, such as diabetic retinopathy and macular degeneration Simulations Plus, Inc. Collaboration FDA Office of Generic Drugs (OGD)
| 28 |

Copyright (c) 2015 Simulations Plus, Inc. 29 • Continued Growth • Seven - year - plus profitable trend • Successful strategic acquisition • Customer base increase: 21 new software customers, 64 year - to - date; with a 90+ percent renewal rate. This means future continuing revenue • Earnings per share increase 36.5% for the quarter • Strong cash position; returning cash to shareholders - Company continues to pay dividend of $0.05 per quarter - Cash dividends totaling approximately $11 million have been distributed since 2012, yet cash remains at $7.7 million as of today Summary
| 29 |