Attached files
| file | filename |
|---|---|
| 8-K - 8-K - INDUS REALTY TRUST, INC. | a15-11171_18k.htm |
Exhibit 99.1
|
|
GRIFFIN INDUSTRIAL REALTY, INC. MaY 2015 1 |
|
|
2 Forward-Looking Statements This presentation (the “Presentation”) contains forward-looking statements within the meaning of Section 27A of the Securities Act of 1933, as amended, and Section 21E of the Exchange Act of 1934, as amended. For this purpose, any statements contained in this Presentation that relate to future events or conditions, including without limitation, the statements regarding the cost and timing of completion of a building currently under construction, construction of additional buildings, acquisitions of real estate assets, leasing of currently vacant space and the cash flows that would be generated from leasing currently vacant space, the renewal of leases scheduled to terminate in fiscal 2015, adjusted square footage leased and net rental profit, projected average cash on cash return over lease terms, completion of the sale of the Florida nursery, industry prospects or Griffin’s plans, expectations, or prospective results of operations or financial position, may be deemed to be forward-looking statements. Without limiting the foregoing, the words “believes,” “anticipates,” “plans,” “expects,” and similar expressions are intended to identify forward-looking statements. Such forward-looking statements represent management’s current expectations and are inherently uncertain. There are a number of important factors that could materially impact the value of Griffin’s common stock or cause actual results to differ materially from those indicated by such forward-looking statements. Such factors are described in Griffin’s Securities and Exchange Commission filings, including the “Business”, “Risk Factors” and “Forward-Looking Information” sections in Griffin’s Annual Report on Form 10-K for the fiscal year ended November 30, 2014. Although Griffin believes that its plans, intentions and expectations reflected in such forward-looking statements are reasonable, it can give no assurance that such plans, intentions or expectations will be achieved. The projected information disclosed in this Presentation is based on assumptions and estimates that, while considered reasonable by Griffin as of the date hereof, are inherently subject to significant business, economic, competitive and regulatory uncertainties and contingencies, many of which are beyond the control of Griffin, including a decision by the Florida tenant not to consummate the purchase of the Florida nursery, and which could cause actual results and events to differ materially from those expressed or implied in the forward-looking statements. Griffin disclaims any obligation to update any forward-looking statements in this Presentation as a result of developments occurring after the date of this Presentation except as required by law. |
|
|
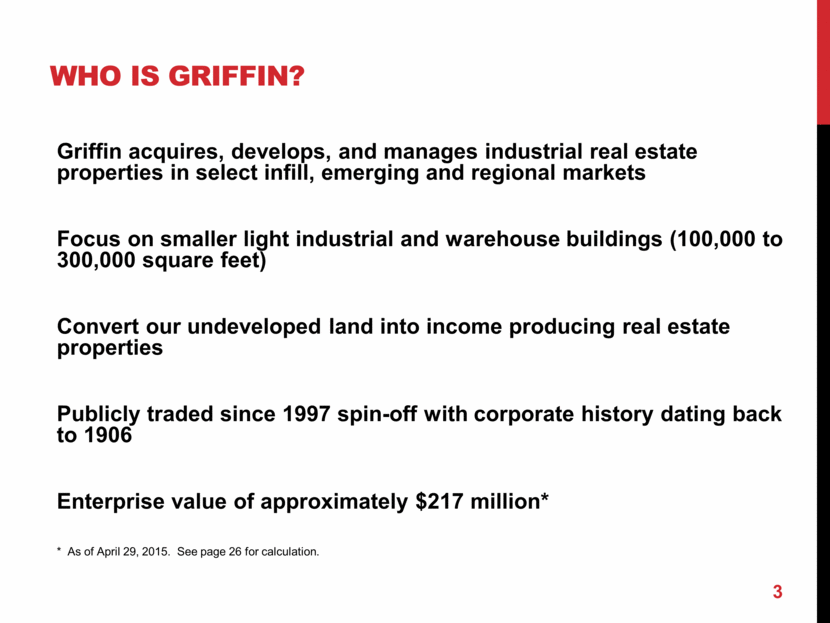
WHO IS GRIFFIN? Griffin acquires, develops, and manages industrial real estate properties in select infill, emerging and regional markets Focus on smaller light industrial and warehouse buildings (100,000 to 300,000 square feet) Convert our undeveloped land into income producing real estate properties Publicly traded since 1997 spin-off with corporate history dating back to 1906 Enterprise value of approximately $217 million* * As of April 29, 2015. See page 26 for calculation. 3 |
|
|
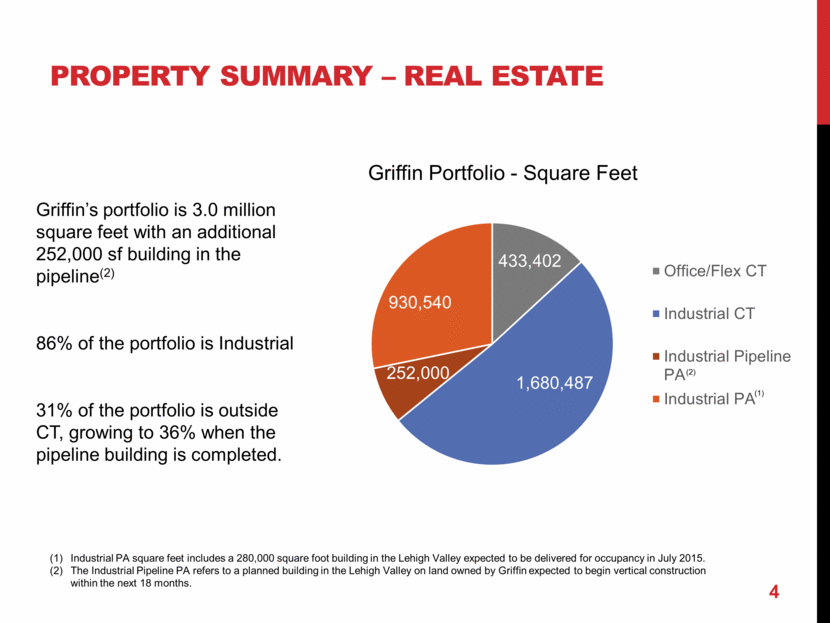
Griffin’s portfolio is 3.0 million square feet with an additional 252,000 sf building in the pipeline(2) 86% of the portfolio is Industrial 31% of the portfolio is outside CT, growing to 36% when the pipeline building is completed. 4 Property Summary – Real Estate Industrial PA square feet includes a 280,000 square foot building in the Lehigh Valley expected to be delivered for occupancy in July 2015. The Industrial Pipeline PA refers to a planned building in the Lehigh Valley on land owned by Griffin expected to begin vertical construction within the next 18 months. Griffin Portfolio - Square Feet (1) |
|
|
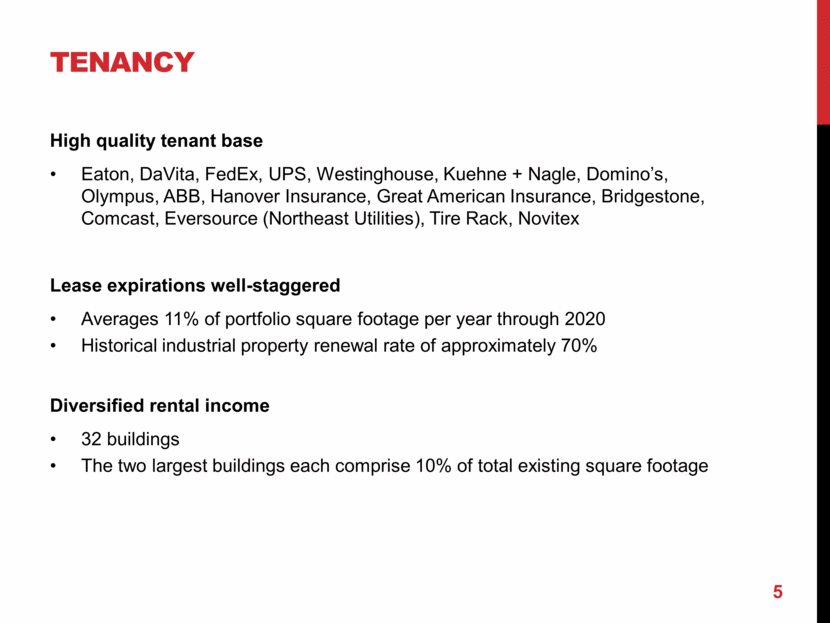
TENANCY High quality tenant base Eaton, DaVita, FedEx, UPS, Westinghouse, Kuehne + Nagle, Domino’s, Olympus, ABB, Hanover Insurance, Great American Insurance, Bridgestone, Comcast, Eversource (Northeast Utilities), Tire Rack, Novitex Lease expirations well-staggered Averages 11% of portfolio square footage per year through 2020 Historical industrial property renewal rate of approximately 70% Diversified rental income 32 buildings The two largest buildings each comprise 10% of total existing square footage 5 |
|
|
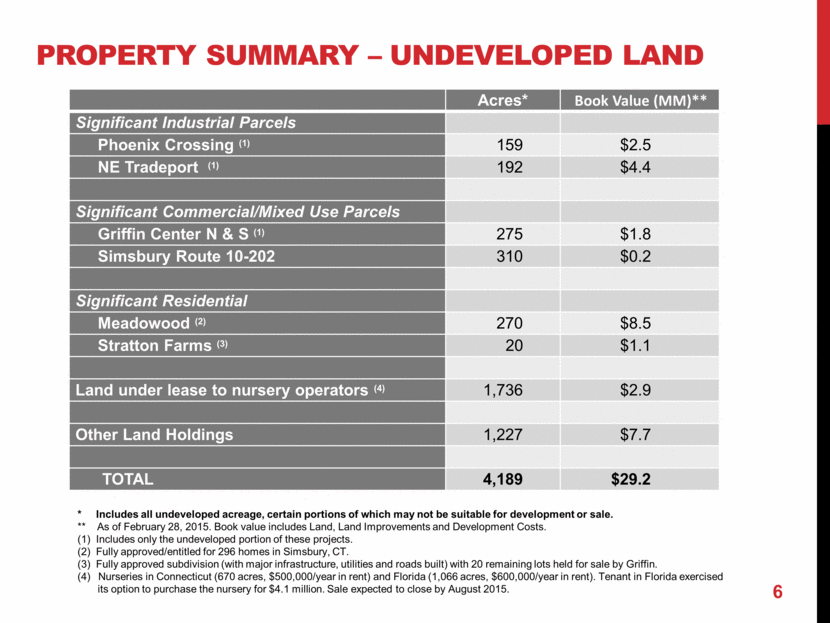
PROPERTY SUMMARY – UNDEVELOPED LAND * Includes all undeveloped acreage, certain portions of which may not be suitable for development or sale. ** As of February 28, 2015. Book value includes Land, Land Improvements and Development Costs. (1) Includes only the undeveloped portion of these projects. (2) Fully approved/entitled for 296 homes in Simsbury, CT. (3) Fully approved subdivision (with major infrastructure, utilities and roads built) with 20 remaining lots held for sale by Griffin. Nurseries in Connecticut (670 acres, $500,000/year in rent) and Florida (1,066 acres, $600,000/year in rent). Tenant in Florida exercised its option to purchase the nursery for $4.1 million. Sale expected to close by August 2015. Acres* Book Value (MM)** Significant Industrial Parcels Phoenix Crossing (1) 159 $2.5 NE Tradeport (1) 192 $4.4 Significant Commercial/Mixed Use Parcels Griffin Center N & S (1) 275 $1.8 Simsbury Route 10-202 310 $0.2 Significant Residential Meadowood (2) 270 $8.5 Stratton Farms (3) 20 $1.1 Land under lease to nursery operators (4) 1,736 $2.9 Other Land Holdings 1,227 $7.7 TOTAL 4,189 $29.2 6 |
|
|
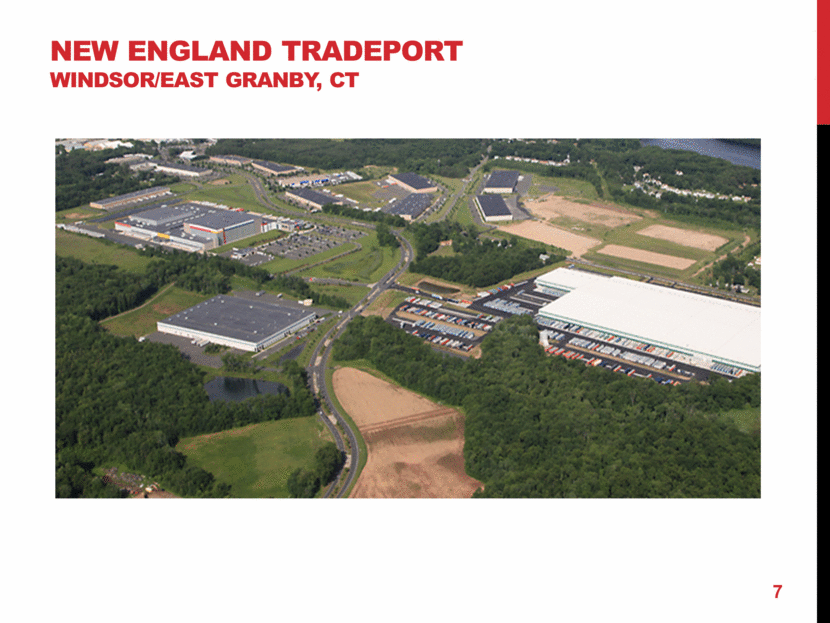
New England Tradeport Windsor/east Granby, CT 7 |
|
|
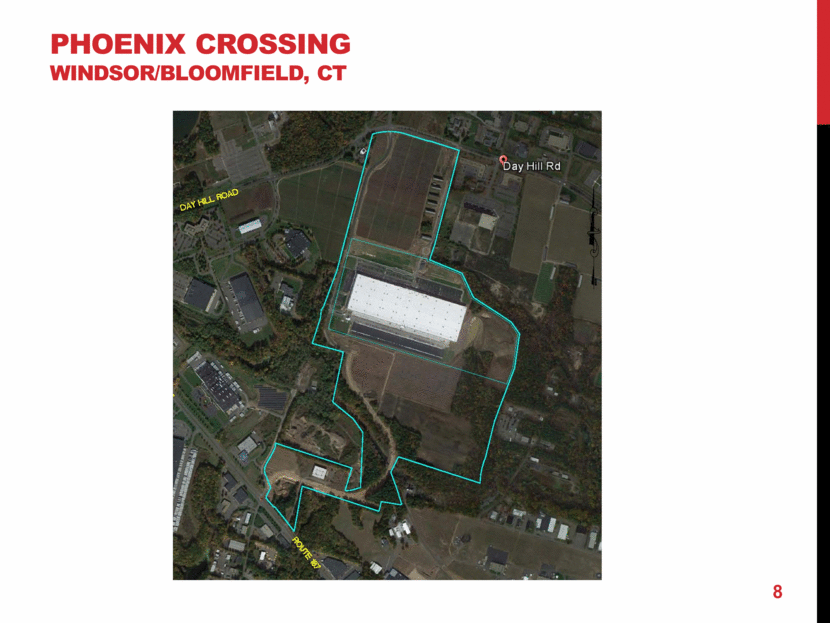
Phoenix Crossing Windsor/Bloomfield, CT 8 |
|
|
HARTFORD MARKET Key location for reaching highly populous Northeast region (NY, CT, MA, PA) Properties close to I-91, I-84, I-90 Hartford warehouse/distribution market totals 71 million square feet, with 27.6 million in the Hartford North market where Griffin’s CT properties are located* Emerging as a major distribution point for retailers and e-commerce Amazon, Dollar Tree and Walgreen’s recently built big-box DCs on land sold to them by Griffin Large, well-educated and affluent nearby population with strong labor availability Griffin has 1.7 million square feet of industrial properties in the Hartford market Well located, Class A properties, best in class reputation for building quality and management * Source: CBRE Hartford Industrial Snapshot, Q4 2014 9 |
|
|
LEHIGH VALLEY MARKET Emerging as a major warehouse/distribution market for the east coast 63 million square foot industrial market Equidistant between I-95 and I-81 – 1 day drive to 1/3 of the US population Excellent road infrastructure, highway access Pennsylvania considered to be business friendly Strong supply of labor, well-educated population Significant market growth – from 35 million square feet in 1997 to 63 million in 2014 Market vacancy rate below 5% Griffin has 930,540 square feet of industrial buildings in the Lehigh Valley with one additional 252,000 square foot building planned for future development Well located, Class A properties Note: All market statistics from CBRE Marketview Greater Philadelphia Industrial, Q4 2014. Includes all properties 100,000 square feet and larger. 10 |
|
|
GRIFFIN STRATEGY 11 |
|
|
KEYS TO GROWING CASH FLOW AND increasING SHAREHOLDER VALUE Increase occupancy in existing portfolio Development on existing land holdings Converting owned land (through sale) into income (through development and acquisition) Focused niche acquisition strategy Leverage existing infrastructure/G&A 12 |
|
|
INCREASE OCCUPANCY IN EXISTING PORTFOLIO Recovery in Hartford area industrial market – market vacancy has declined from 17.8% in 2010 to 12.3% at year-end 2014 with limited increase in capacity(1) Lease rates remain attractive CT and New England continue to be a land constrained market for new warehouse and industrial development especially for larger big box sites Seek to fill the vacant space in Griffin’s portfolio Limited competitive product available or in the pipeline Offer turn-key tenant improvement packages with in-house construction and property management Lease-up of Griffin’s 512,000(2) square feet of expected vacancy could generate meaningful incremental cash flow at a relatively low investment cost (TI/commissions vs. cost of new building) 13 (1) Sources: CBRE Connecticut 2011 Market Outlook (2010 vacancy); CBRE Hartford Industrial Snapshot, Q4 2014 (2014 vacancy). (2) See appendix for definition of Expected Vacancy. |
|
|
DEVELOPMENT ON EXISTING PROPERTY Considerable land holdings with several entitled and/or pad ready sites Low cost basis in CT land helps drive strong cash on cash returns Recent success in Lehigh Valley speculative development 3 buildings constructed in last 4 years 1 additional building of 252,000 square feet in development pipeline Industrial Build to Suit activity in CT has picked up – we have received several proposals over the last 12 months No planned speculative development in CT until current vacancy significantly reduced and market conditions improve 14 |
|
|
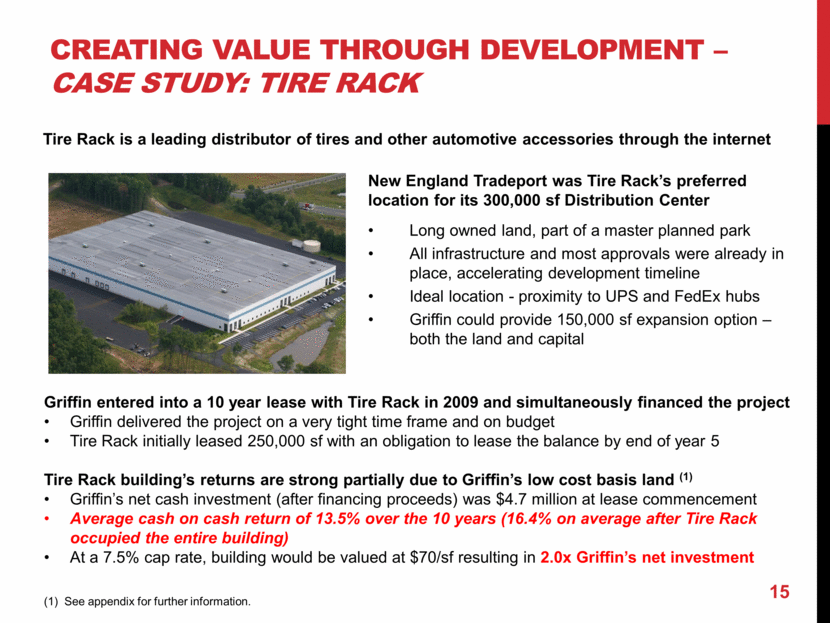
New England Tradeport was Tire Rack’s preferred location for its 300,000 sf Distribution Center Long owned land, part of a master planned park All infrastructure and most approvals were already in place, accelerating development timeline Ideal location - proximity to UPS and FedEx hubs Griffin could provide 150,000 sf expansion option – both the land and capital CREATING VALUE THROUGH DEVELOPMENT – CASE STUDY: TIRE RACK Griffin entered into a 10 year lease with Tire Rack in 2009 and simultaneously financed the project Griffin delivered the project on a very tight time frame and on budget Tire Rack initially leased 250,000 sf with an obligation to lease the balance by end of year 5 Tire Rack building’s returns are strong partially due to Griffin’s low cost basis land (1) Griffin’s net cash investment (after financing proceeds) was $4.7 million at lease commencement Average cash on cash return of 13.5% over the 10 years (16.4% on average after Tire Rack occupied the entire building) At a 7.5% cap rate, building would be valued at $70/sf resulting in 2.0x Griffin’s net investment (1) See appendix for further information. Tire Rack is a leading distributor of tires and other automotive accessories through the internet 15 |
|
|
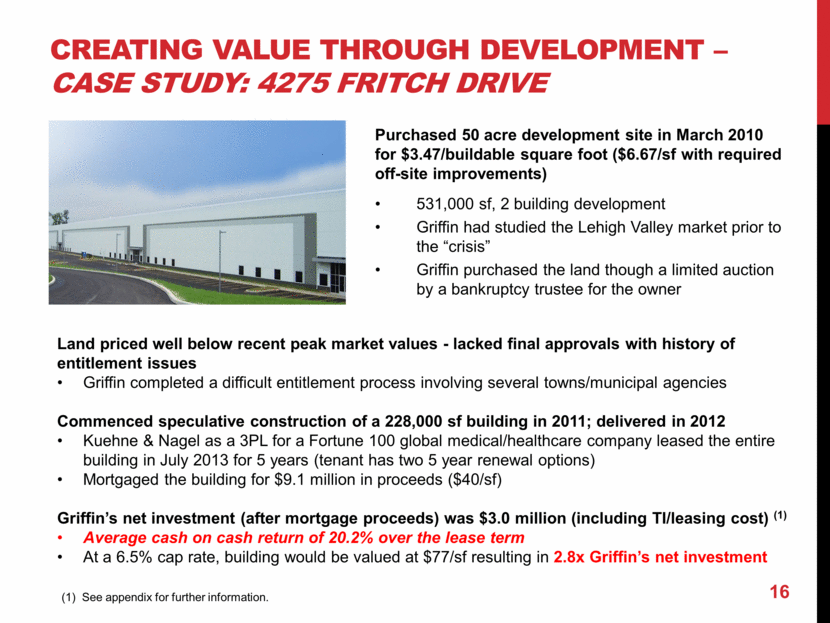
Purchased 50 acre development site in March 2010 for $3.47/buildable square foot ($6.67 /sf with required off-site improvements) 531,000 sf, 2 building development Griffin had studied the Lehigh Valley market prior to the “crisis” Griffin purchased the land though a limited auction by a bankruptcy trustee for the owner CREATING VALUE THROUGH DEVELOPMENT – CASE STUDY: 4275 Fritch Drive Land priced well below recent peak market values - lacked final approvals with history of entitlement issues Griffin completed a difficult entitlement process involving several towns/municipal agencies Commenced speculative construction of a 228,000 sf building in 2011; delivered in 2012 Kuehne & Nagel as a 3PL for a Fortune 100 global medical/healthcare company leased the entire building in July 2013 for 5 years (tenant has two 5 year renewal options) Mortgaged the building for $9.1 million in proceeds ($40/sf) Griffin’s net investment (after mortgage proceeds) was $3.0 million (including TI/leasing cost) (1) Average cash on cash return of 20.2% over the lease term At a 6.5% cap rate, building would be valued at $77/sf resulting in 2.8x Griffin’s net investment (1) See appendix for further information. 16 |
|
|
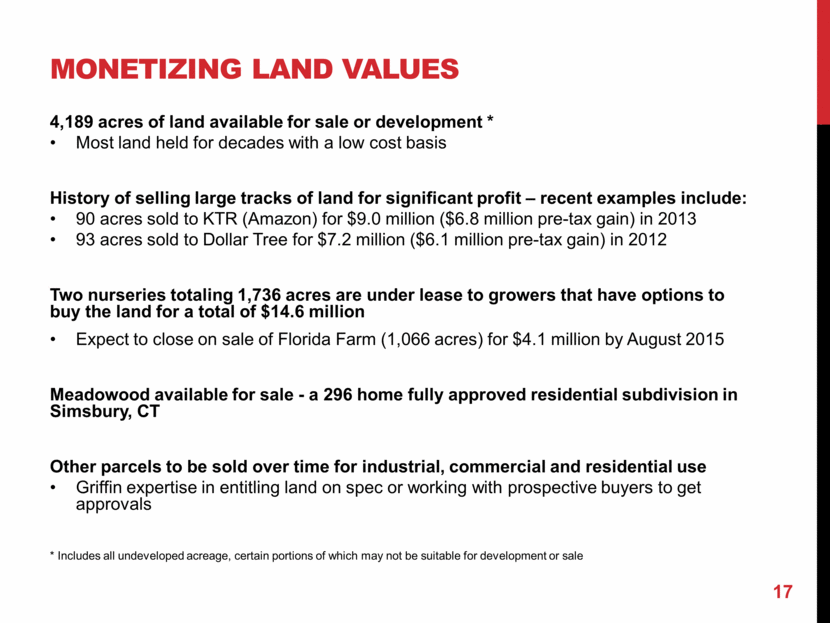
MONETIZING LAND VALUES 4,189 acres of land available for sale or development * Most land held for decades with a low cost basis History of selling large tracks of land for significant profit – recent examples include: 90 acres sold to KTR (Amazon) for $9.0 million ($6.8 million pre-tax gain) in 2013 93 acres sold to Dollar Tree for $7.2 million ($6.1 million pre-tax gain) in 2012 Two nurseries totaling 1,736 acres are under lease to growers that have options to buy the land for a total of $14.6 million Expect to close on sale of Florida Farm (1,066 acres) for $4.1 million by August 2015 Meadowood available for sale - a 296 home fully approved residential subdivision in Simsbury, CT Other parcels to be sold over time for industrial, commercial and residential use Griffin expertise in entitling land on spec or working with prospective buyers to get approvals * Includes all undeveloped acreage, certain portions of which may not be suitable for development or sale 17 |
|
|
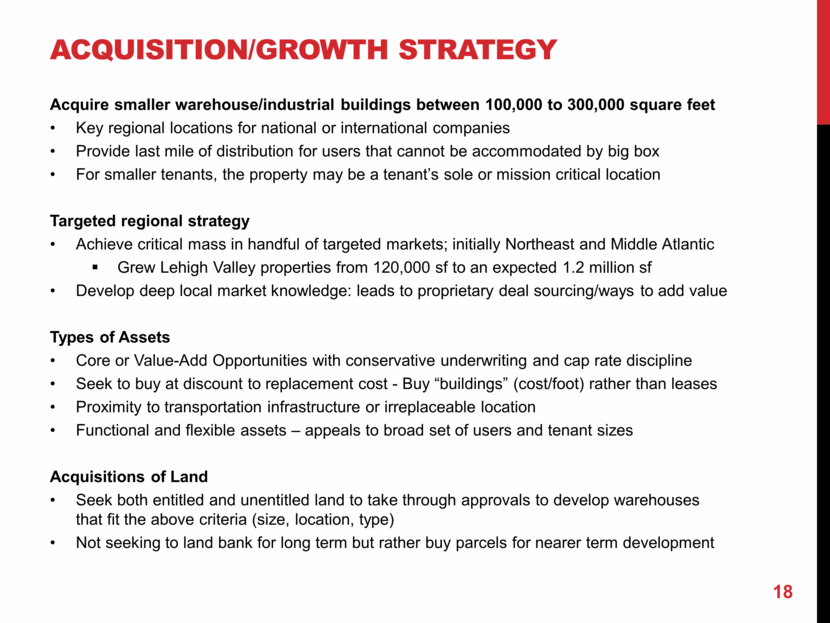
ACQUISITION/GROWTH STRATEGY Acquire smaller warehouse/industrial buildings between 100,000 to 300,000 square feet Key regional locations for national or international companies Provide last mile of distribution for users that cannot be accommodated by big box For smaller tenants, the property may be a tenant’s sole or mission critical location Targeted regional strategy Achieve critical mass in handful of targeted markets; initially Northeast and Middle Atlantic Grew Lehigh Valley properties from 120,000 sf to an expected 1.2 million sf Develop deep local market knowledge: leads to proprietary deal sourcing/ways to add value Types of Assets Core or Value-Add Opportunities with conservative underwriting and cap rate discipline Seek to buy at discount to replacement cost - Buy “buildings” (cost/foot) rather than leases Proximity to transportation infrastructure or irreplaceable location Functional and flexible assets – appeals to broad set of users and tenant sizes Acquisitions of Land Seek both entitled and unentitled land to take through approvals to develop warehouses that fit the above criteria (size, location, type) Not seeking to land bank for long term but rather buy parcels for nearer term development 18 |
|
|
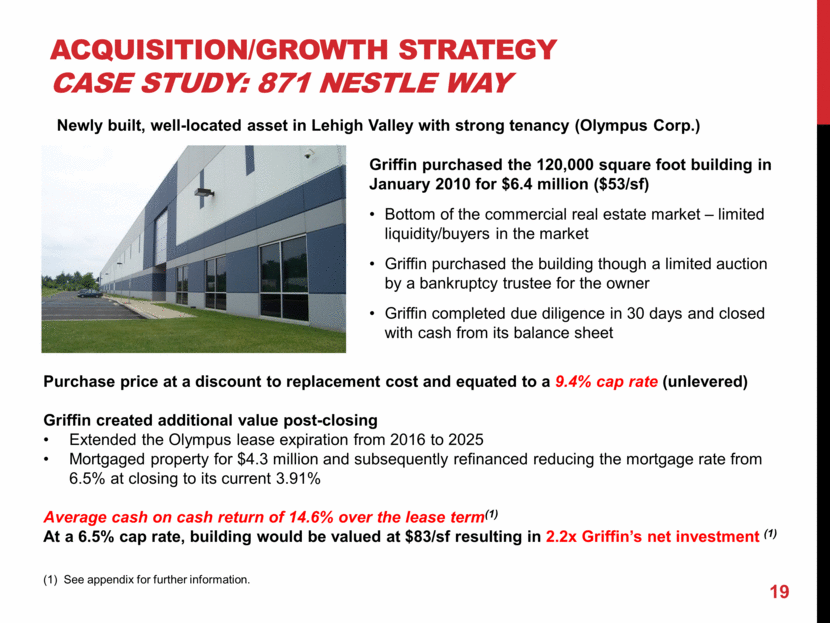
Griffin purchased the 120,000 square foot building in January 2010 for $6.4 million ($53/sf) Bottom of the commercial real estate market – limited liquidity/buyers in the market Griffin purchased the building though a limited auction by a bankruptcy trustee for the owner Griffin completed due diligence in 30 days and closed with cash from its balance sheet ACQUISITION/GROWTH STRATEGY CASE STUDY: 871 NESTLE WAY Purchase price at a discount to replacement cost and equated to a 9.4% cap rate (unlevered) Griffin created additional value post-closing Extended the Olympus lease expiration from 2016 to 2025 Mortgaged property for $4.3 million and subsequently refinanced reducing the mortgage rate from 6.5% at closing to its current 3.91% Average cash on cash return of 14.6% over the lease term(1) At a 6.5% cap rate, building would be valued at $83/sf resulting in 2.2x Griffin’s net investment (1) (1) See appendix for further information. Newly built, well-located asset in Lehigh Valley with strong tenancy (Olympus Corp.) 19 |
|
|
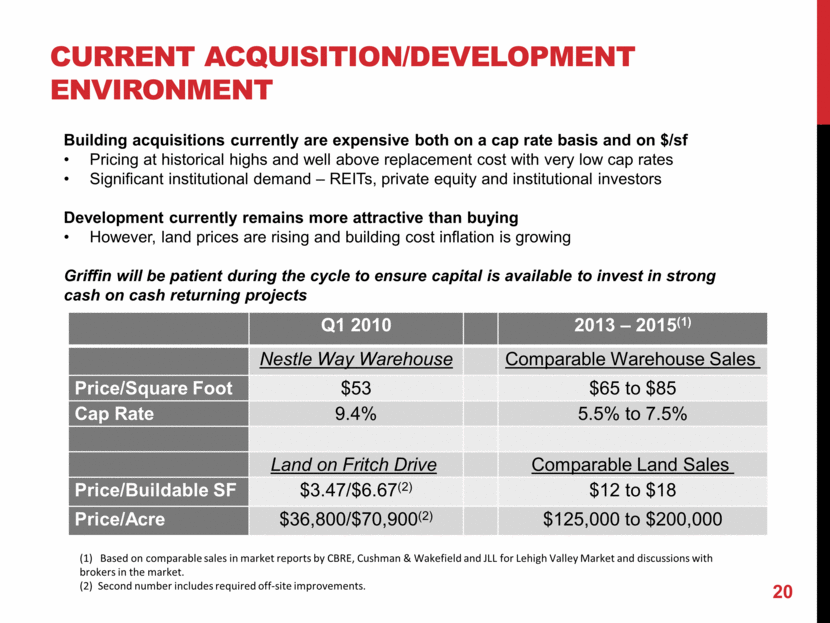
CURRENT ACQUISITION/DEVELOPMENT ENVIRONMENT Q1 2010 2013 – 2015(1) Nestle Way Warehouse Comparable Warehouse Sales Price/Square Foot $53 $65 to $85 Cap Rate 9.4% 5.5% to 7.5% Land on Fritch Drive Comparable Land Sales Price/Buildable SF $3.47/$6.67(2) $12 to $18 Price/Acre $36,800/$70,900 (2) $125,000 to $200,000 Building acquisitions currently are expensive both on a cap rate basis and on $/sf Pricing at historical highs and well above replacement cost with very low cap rates Significant institutional demand – REITs, private equity and institutional investors Development currently remains more attractive than buying However, land prices are rising and building cost inflation is growing Griffin will be patient during the cycle to ensure capital is available to invest in strong cash on cash returning projects (1) Based on comparable sales in market reports by CBRE, Cushman & Wakefield and JLL for Lehigh Valley Market and discussions with brokers in the market. (2) Second number includes required off-site improvements. 20 |
|
|
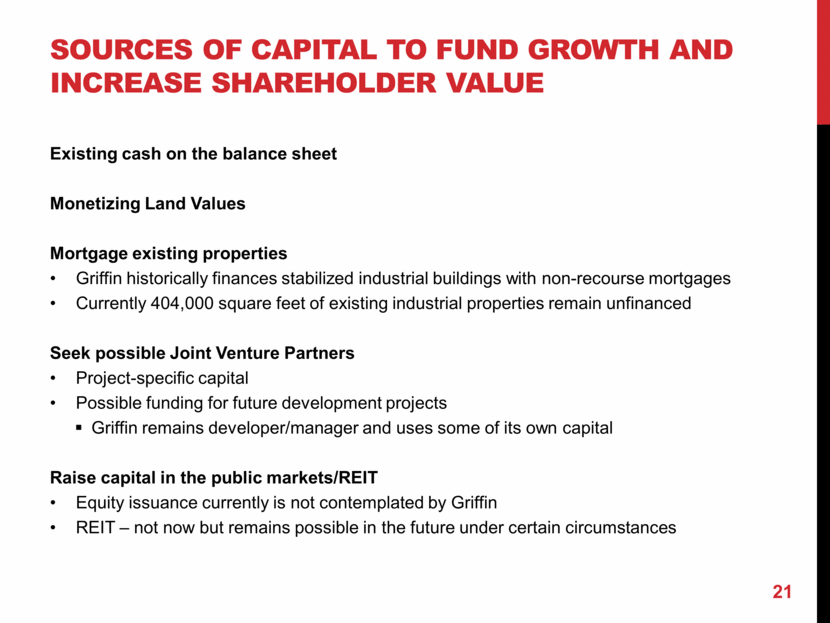
SOURCES OF CAPITAL TO FUND GROWTH AND INCREASE SHAREHOLDER VALUE Existing cash on the balance sheet Monetizing Land Values Mortgage existing properties Griffin historically finances stabilized industrial buildings with non-recourse mortgages Currently 404,000 square feet of existing industrial properties remain unfinanced Seek possible Joint Venture Partners Project-specific capital Possible funding for future development projects Griffin remains developer/manager and uses some of its own capital Raise capital in the public markets/REIT Equity issuance currently is not contemplated by Griffin REIT – not now but remains possible in the future under certain circumstances 21 |
|
|
FINANCIALS AND Valuation 22 |
|
|
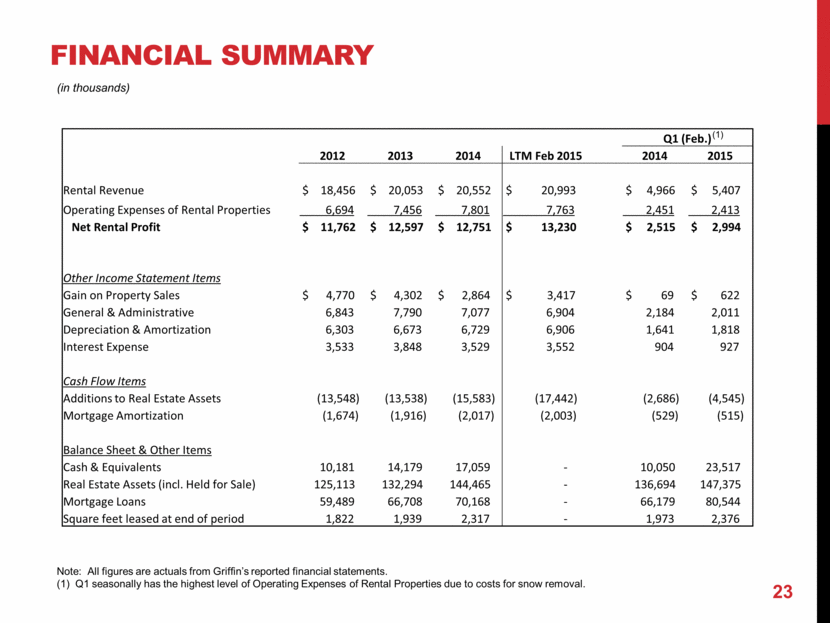
Financial summary 23 (in thousands) Note: All figures are actuals from Griffin’s reported financial statements. (1) Q1 seasonally has the highest level of Operating Expenses of Rental Properties due to costs for snow removal. (1) Q1 (Feb.) 2012 2013 2014 LTM Feb 2015 2014 2015 Rental Revenue $ 18,456 $ 20,053 $ 20,552 $ 20,993 $ 4,966 $ 5,407 Operating Expenses of Rental Properties 6,694 7,456 7,801 7,763 2,451 2,413 Net Rental Profit $ 11,762 $ 12,597 $ 12,751 $ 13,230 $ 2,515 $ 2,994 Other Income Statement Items Gain on Property Sales $ 4,770 $ 4,302 $ 2,864 $ 3,417 $ 69 $ 622 General & Administrative 6,843 7,790 7,077 6,904 2,184 2,011 Depreciation & Amortization 6,303 6,673 6,729 6,906 1,641 1,818 Interest Expense 3,533 3,848 3,529 3,552 904 927 Cash Flow Items Additions to Real Estate Assets (13,548) (13,538) (15,583) (17,442) (2,686) (4,545) Mortgage Amortization (1,674) (1,916) (2,017) (2,003) (529) (515) Balance Sheet & Other Items Cash & Equivalents 10,181 14,179 17,059 - 10,050 23,517 Real Estate Assets (incl. Held for Sale) 125,113 132,294 144,465 - 136,694 147,375 Mortgage Loans 59,489 66,708 70,168 - 66,179 80,544 Square feet leased at end of period 1,822 1,939 2,317 - 1,973 2,376 |
|
|
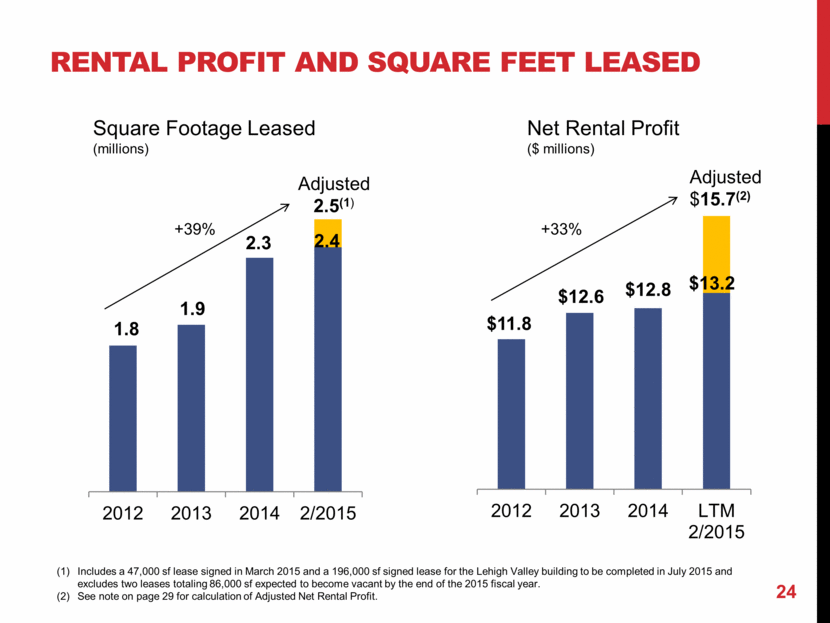
Rental Profit and Square Feet Leased 24 Adjusted 2.5(1) Square Footage Leased (millions) Includes a 47,000 sf lease signed in March 2015 and a 196,000 sf signed lease for the Lehigh Valley building to be completed in July 2015 and excludes two leases totaling 86,000 sf expected to become vacant by the end of the 2015 fiscal year. See note on page 29 for calculation of Adjusted Net Rental Profit. Adjusted $15.7(2) Net Rental Profit ($ millions) +39% $11.8 $12.6 $12.8 $13.2 2012 2013 2014 LTM 2/2015 +33% |
|
|
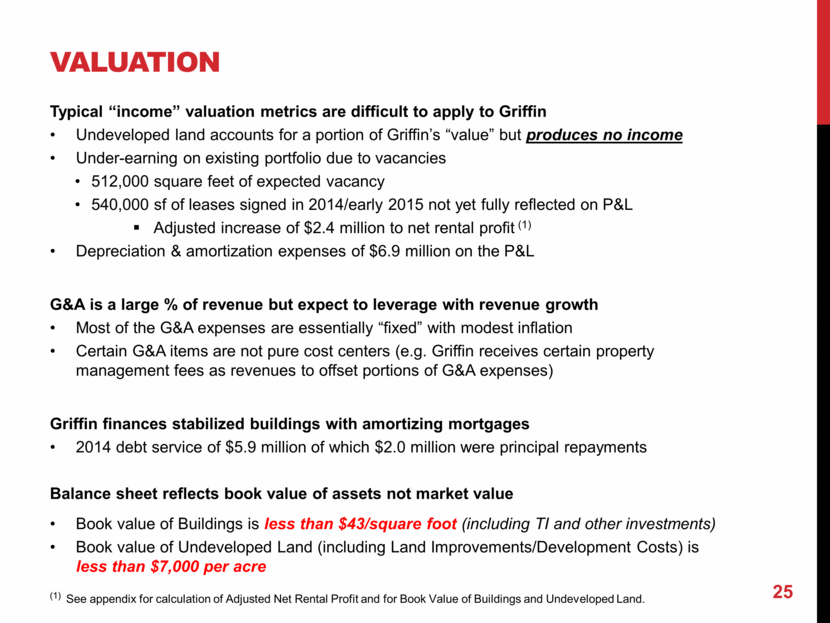
valuation Typical “income” valuation metrics are difficult to apply to Griffin Undeveloped land accounts for a portion of Griffin’s “value” but produces no income Under-earning on existing portfolio due to vacancies 512,000 square feet of expected vacancy 540,000 sf of leases signed in 2014/early 2015 not yet fully reflected on P&L Adjusted increase of $2.4 million to net rental profit (1) Depreciation & amortization expenses of $6.9 million on the P&L G&A is a large % of revenue but expect to leverage with revenue growth Most of the G&A expenses are essentially “fixed” with modest inflation Certain G&A items are not pure cost centers (e.g. Griffin receives certain property management fees as revenues to offset portions of G&A expenses) Griffin finances stabilized buildings with amortizing mortgages 2014 debt service of $5.9 million of which $2.0 million were principal repayments Balance sheet reflects book value of assets not market value Book value of Buildings is less than $43/square foot (including TI and other investments) Book value of Undeveloped Land (including Land Improvements/Development Costs) is less than $7,000 per acre (1) See appendix for calculation of Adjusted Net Rental Profit and for Book Value of Buildings and Undeveloped Land. 25 |
|
|
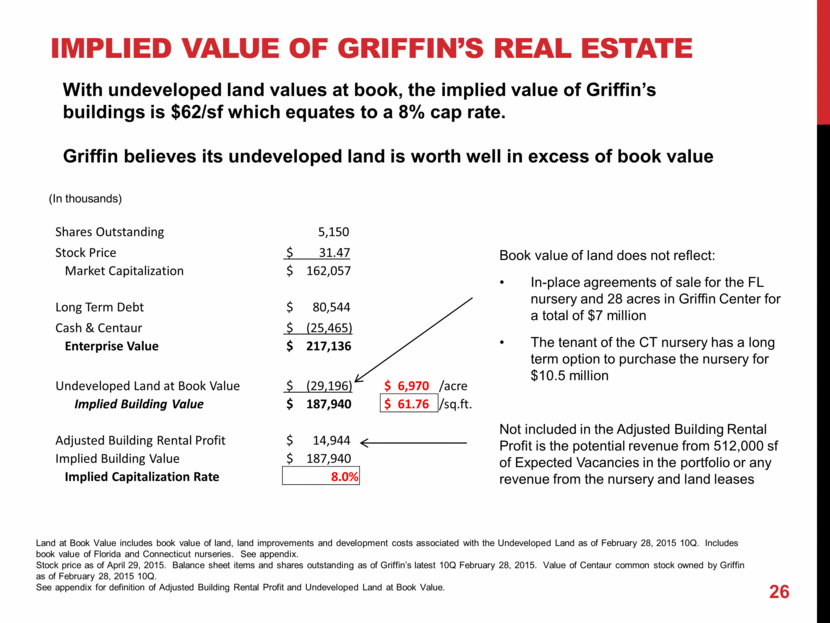
Book value of land does not reflect: In-place agreements of sale for the FL nursery and 28 acres in Griffin Center for a total of $7 million The tenant of the CT nursery has a long term option to purchase the nursery for $10.5 million Not included in the Adjusted Building Rental Profit is the potential revenue from 512,000 sf of Expected Vacancies in the portfolio or any revenue from the nursery and land leases (In thousands) 26 Implied value of Griffin’s real estate Land at Book Value includes book value of land, land improvements and development costs associated with the Undeveloped Land as of February 28, 2015 10Q. Includes book value of Florida and Connecticut nurseries. See appendix. Stock price as of April 29, 2015. Balance sheet items and shares outstanding as of Griffin’s latest 10Q February 28, 2015. Value of Centaur common stock owned by Griffin as of February 28, 2015 10Q. See appendix for definition of Adjusted Building Rental Profit and Undeveloped Land at Book Value. With undeveloped land values at book, the implied value of Griffin’s buildings is $62/sf which equates to a 8% cap rate. Griffin believes its undeveloped land is worth well in excess of book value Shares Outstanding 5,150 Stock Price $ 31.47 Market Capitalization $ 162,057 Long Term Debt $ 80,544 Cash & Centaur $ (25,465) Enterprise Value $ 217,136 Undeveloped Land at Book Value $ (29,196) $ 6,970 /acre Implied Building Value $ 187,940 $ 61.76 /sq.ft. Adjusted Building Rental Profit $ 14,944 Implied Building Value $ 187,940 Implied Capitalization Rate 8.0% |
|
|
WHO IS GRIFFIN? Griffin acquires, develops, and manages industrial real estate properties in select infill, emerging and regional markets Focus on smaller light industrial and warehouse buildings (100,000 to 300,000 square feet) Convert our undeveloped land into income producing real estate properties Publicly traded since 1997 spin-off with corporate history dating back to 1906 Enterprise value of approximately $217 million* * As of April 29, 2015. See page 26 for calculation. 27 |
|
|
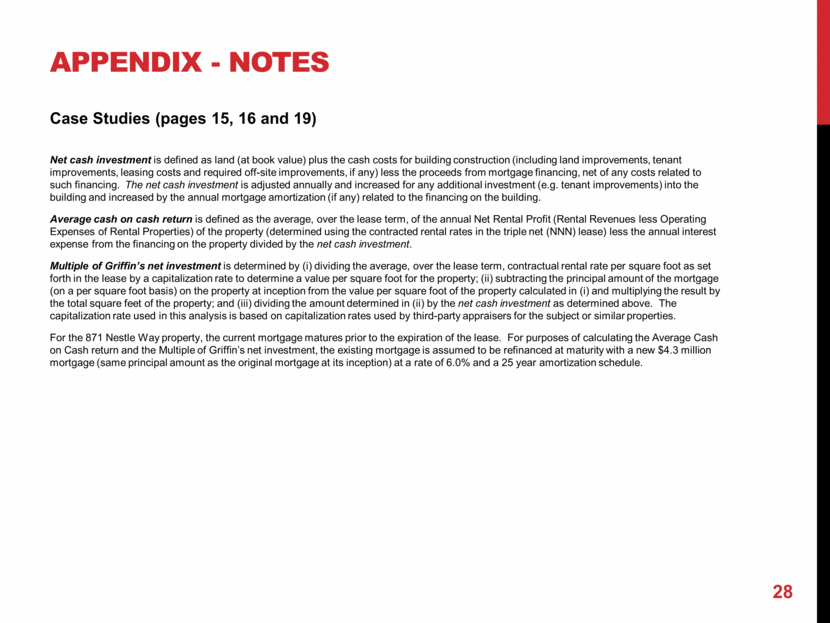
Appendix - NOTES Case Studies (pages 15, 16 and 19) Net cash investment is defined as land (at book value) plus the cash costs for building construction (including land improvements, tenant improvements, leasing costs and required off-site improvements, if any) less the proceeds from mortgage financing, net of any costs related to such financing. The net cash investment is adjusted annually and increased for any additional investment (e.g. tenant improvements) into the building and increased by the annual mortgage amortization (if any) related to the financing on the building. Average cash on cash return is defined as the average, over the lease term, of the annual Net Rental Profit (Rental Revenues less Operating Expenses of Rental Properties) of the property (determined using the contracted rental rates in the triple net (NNN) lease) less the annual interest expense from the financing on the property divided by the net cash investment. Multiple of Griffin’s net investment is determined by (i) dividing the average, over the lease term, contractual rental rate per square foot as set forth in the lease by a capitalization rate to determine a value per square foot for the property; (ii) subtracting the principal amount of the mortgage (on a per square foot basis) on the property at inception from the value per square foot of the property calculated in (i) and multiplying the result by the total square feet of the property; and (iii) dividing the amount determined in (ii) by the net cash investment as determined above. The capitalization rate used in this analysis is based on capitalization rates used by third-party appraisers for the subject or similar properties. For the 871 Nestle Way property, the current mortgage matures prior to the expiration of the lease. For purposes of calculating the Average Cash on Cash return and the Multiple of Griffin’s net investment, the existing mortgage is assumed to be refinanced at maturity with a new $4.3 million mortgage (same principal amount as the original mortgage at its inception) at a rate of 6.0% and a 25 year amortization schedule. 28 |
|
|
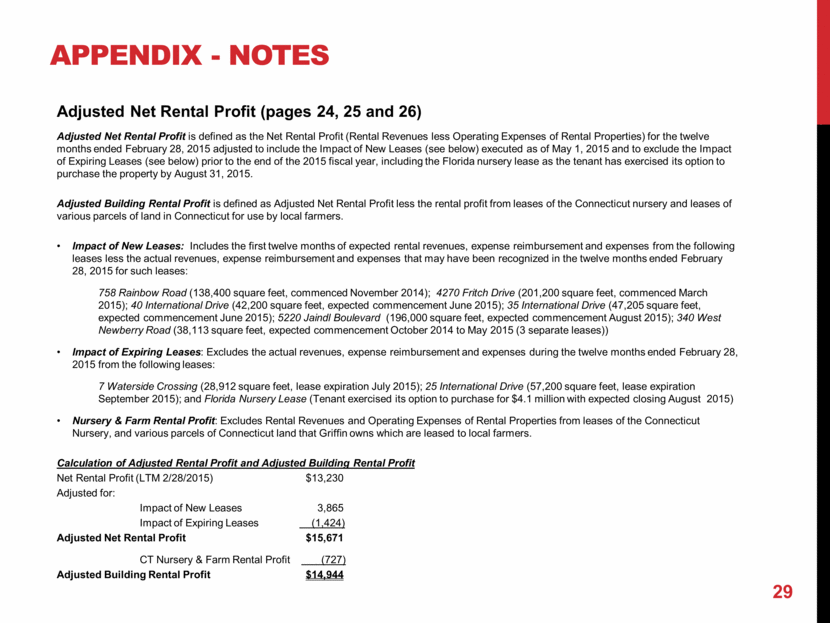
Appendix - NOTES Adjusted Net Rental Profit (pages 24, 25 and 26) Adjusted Net Rental Profit is defined as the Net Rental Profit (Rental Revenues less Operating Expenses of Rental Properties) for the twelve months ended February 28, 2015 adjusted to include the Impact of New Leases (see below) executed as of May 1, 2015 and to exclude the Impact of Expiring Leases (see below) prior to the end of the 2015 fiscal year, including the Florida nursery lease as the tenant has exercised its option to purchase the property by August 31, 2015. Adjusted Building Rental Profit is defined as Adjusted Net Rental Profit less the rental profit from leases of the Connecticut nursery and leases of various parcels of land in Connecticut for use by local farmers. Impact of New Leases: Includes the first twelve months of expected rental revenues, expense reimbursement and expenses from the following leases less the actual revenues, expense reimbursement and expenses that may have been recognized in the twelve months ended February 28, 2015 for such leases: 758 Rainbow Road (138,400 square feet, commenced November 2014); 4270 Fritch Drive (201,200 square feet, commenced March 2015); 40 International Drive (42,200 square feet, expected commencement June 2015); 35 International Drive (47,205 square feet, expected commencement June 2015); 5220 Jaindl Boulevard (196,000 square feet, expected commencement August 2015); 340 West Newberry Road (38,113 square feet, expected commencement October 2014 to May 2015 (3 separate leases)) Impact of Expiring Leases: Excludes the actual revenues, expense reimbursement and expenses during the twelve months ended February 28, 2015 from the following leases: 7 Waterside Crossing (28,912 square feet, lease expiration July 2015); 25 International Drive (57,200 square feet, lease expiration September 2015); and Florida Nursery Lease (Tenant exercised its option to purchase for $4.1 million with expected closing August 2015) Nursery & Farm Rental Profit: Excludes Rental Revenues and Operating Expenses of Rental Properties from leases of the Connecticut Nursery, and various parcels of Connecticut land that Griffin owns which are leased to local farmers. Calculation of Adjusted Rental Profit and Adjusted Building Rental Profit Net Rental Profit (LTM 2/28/2015) $13,230 Adjusted for: Impact of New Leases 3,865 Impact of Expiring Leases (1,424) Adjusted Net Rental Profit $15,671 CT Nursery & Farm Rental Profit (727) Adjusted Building Rental Profit $14,944 29 |
|
|
Appendix - NOTES Calculation of Expected Vacancy (pages 13, 25 and 26) Expected vacancy reflects the actual vacancy of 389,000 sf as of February 28, 2015 adjusted for: (i) an increase of 86,122 of vacant space for leases at 25 International Drive and 7 Waterside Crossing that will terminate in fiscal 2015 and are not expected to be renewed; (ii) an increase of 84,000 sf of vacant space at 5220 Jaindl Boulevard, a 280,000 square foot building currently under construction with 196,000 sf pre-leased and for which the tenant for the 196,000 square feet has an option, until December 2015, to lease the remaining 84,000 feet and (iii) a decrease of 47,205 of vacant space from the lease at 35 International Drive signed in March 2015. Book Value of Buildings and Book Value of Undeveloped Land (pages 6, 25 and 26) Calculation of Book Value of Buildings: Book Value of Buildings reflects the sum of: (i) $112.4 million for the net book value (after depreciation) of land, land improvements, buildings, building improvements and tenant improvements for Griffin’s buildings as of February 28, 2015; and (ii) $18.1 million for the expected book value of the land, land improvements, buildings, building improvements and tenant improvements for the 280,000 sf Lehigh Valley building currently under construction that is expected to be completed in July 2015. The Book Value of Buildings of $42.90 per square foot is calculated by dividing the Book Value of Buildings totaling $130.5 million by the 3.0 million square feet of buildings in Griffin’s portfolio, which includes the 280,000 sf Lehigh Valley building currently under construction Calculation of Book Value of Undeveloped Land Undeveloped Land includes all acreage not associated with an existing building or a building currently under construction. Book Value of Undeveloped Land reflects the cost of the land, any land improvements (after depreciation) and any development costs on undeveloped land. The Book Value of Undeveloped Land per acre of $6,970 is calculated by dividing the $29.2 million Book Value of Undeveloped Land (see pages 6 and 26) by Griffin’s total undeveloped acres of 4,189 (see page 6). 30 |

