Attached files
| file | filename |
|---|---|
| 8-K - 8-K - HMS HOLDINGS CORP | a15-11141_18k.htm |
| EX-99.1 - EX-99.1 - HMS HOLDINGS CORP | a15-11141_1ex99d1.htm |
Exhibit 99.2
|
|
Q1 2015 Investor Presentation May 8, 2015 |

|
|
Safe Harbor Statement HMSY Q1 2015 Investor Presentation / May 8, 2015 This presentation contains "forward-looking statements" within the meaning of the U.S. Private Securities Litigation Reform Act of 1995. Such statements give our expectations or forecasts of future events; they do not relate strictly to historical or current facts. Forward-looking statements can be identified by words such as "anticipates," "estimates," "expects," "projects," "intends," "plans," "believes," "will," "target," "seeks," "forecast" and similar expressions and references to guidance. In particular, these include statements relating to future actions, business plans, objectives and prospects, and future operating or financial performance. In addition, statements in this presentation regarding the Company's intention to repurchase shares of its common stock from time to time under the share repurchase program, the intended use of any repurchased shares and the source of funding are forward-looking statements subject to uncertainties. Forward-looking statements are based on our current expectations and assumptions regarding our business, the economy and other future conditions. Should known or unknown risks or uncertainties materialize, or should underlying assumptions prove inaccurate, actual results could differ materially from past results and those anticipated, estimated or projected. We caution you therefore against relying on any of these forward-looking statements. Factors that could cause or contribute to such differences include, but are not limited to: the market price of the Company's common stock prevailing from time to time; the nature of other investment opportunities presented to the Company from time to time; the Company's cash flows from operations, available cash, and ability to borrow or use credit, general economic conditions, and other factors identified in the Company's most recent Annual Report on Form 10-K and Quarterly Report on Form 10-Q filed with the SEC; variations in our results of operations; changes in the U.S. healthcare environment and steps we take in anticipation of such changes; regulatory, budgetary or political actions that affect procurement practices; our ability to retain customers or the loss of one or more major customers, including through our failure to reprocure a contract or the reduction in scope or early termination of one or more of our significant contracts; our ability to effectively manage our growth to execute on our business plans; the risk that guidance may not be achieved including but not limited to the risk that we may not achieve non-Medicare margin expansion; the risk that HMS will not receive a contract award for any current or future procurement or reprocurement or that either or both may be delayed; the risk of negative or reduced growth rate of spending on Medicaid/Medicare, simplification of the healthcare payment process or programmatic changes that diminish the scope of benefits; the risk that CMS may not support the RAC program, may change the RAC program and reduce future fees, and may require repayment of certain prior fees; our ability to retain customers or the loss of one or more major customers; customer dissatisfaction or early termination of contracts triggering significant costs or liabilities; the development by competitors of new or superior products or services; the emergence of new competitors, or the development by our customers of in-house capacity to perform the services we offer; all the risks inherent in the development, introduction, and implementation of new products and services; our failure to comply with laws and regulations governing health data or to protect such data from theft and misuse; our ability to maintain effective information systems and protect them from damage, interruption or breach; restrictions on our ability to bid on/perform certain work due to other work we currently perform; the risks and uncertainties attendant to litigation; our ability to successfully integrate any acquisitions and the risk that such acquisitions will not result in the anticipated benefits; our ability to continue to secure contracts through the competitive bidding process and to accurately predict the cost and time to complete such contracts; unanticipated changes in our effective tax rates; the risk of security breaches of our technology systems and networks; the risk that our efforts to protect intellectual property rights, confidential and proprietary information, or confidential or proprietary information of others in our possession, will not be adequate; our compliance with the covenants and obligations under the terms of our credit facility and our ability to generate sufficient cash to cover our interest and principal payments thereunder; and negative results of government or customer reviews, audits or investigations to verify our compliance with contracts and applicable laws and regulations. A further description of these and other risks, uncertainties, and related matters can be found in our Annual Report on Form 10-K for the fiscal year ended December 31, 2014, which is available at www.hms.com under the "Investor Relations" tab and at www.sec.gov. Factors or events that could cause actual results to differ may emerge from time to time and it is not possible for us to predict all of them. Any forward-looking statements are made as of the date of this presentation and we do not undertake an obligation to publicly update forward-looking statements, whether as a result of new information, future events or otherwise, except as may be required by law. |
|
|
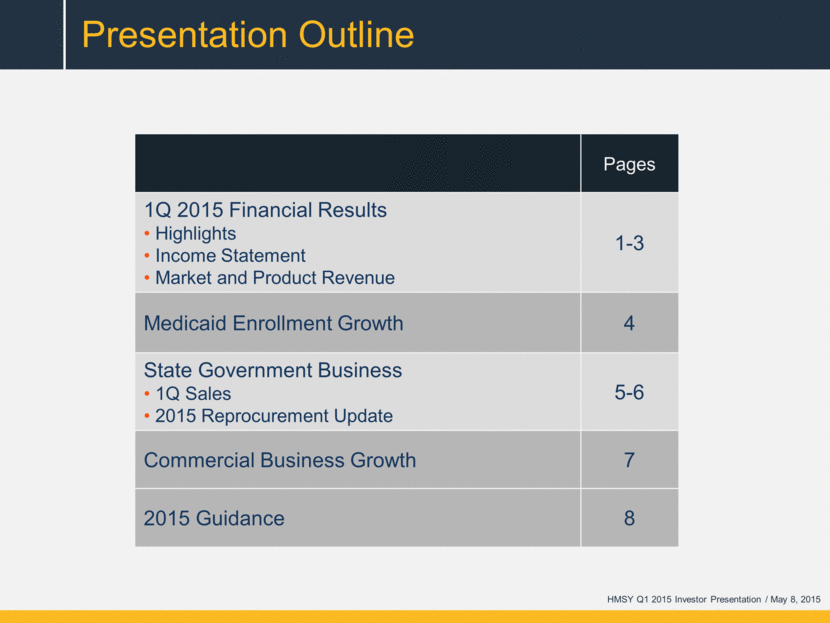
Presentation Outline Pages 1Q 2015 Financial Results Highlights Income Statement Market and Product Revenue 1-3 Medicaid Enrollment Growth 4 State Government Business 1Q Sales 2015 Reprocurement Update 5-6 Commercial Business Growth 7 2015 Guidance 8 HMSY Q1 2015 Investor Presentation / May 8, 2015 |
|
|
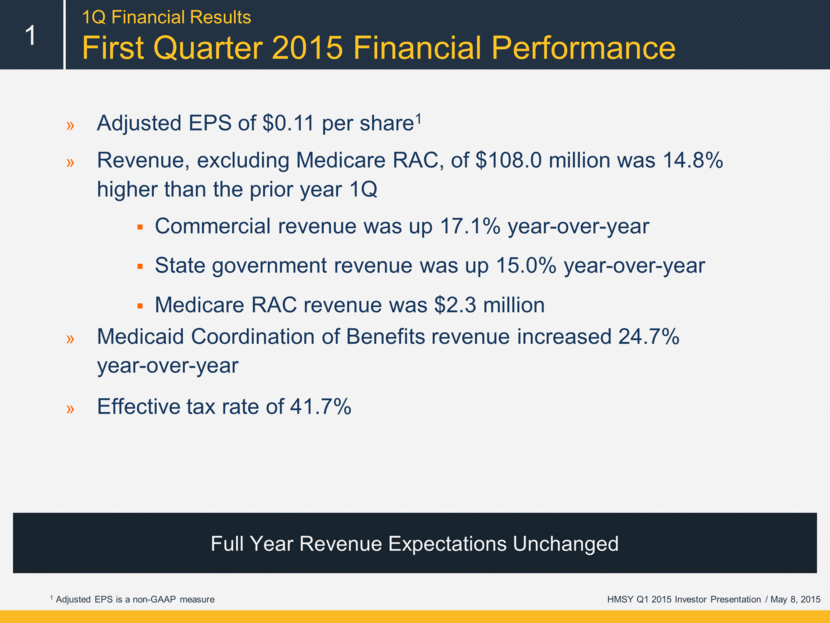
Adjusted EPS of $0.11 per share1 Revenue, excluding Medicare RAC, of $108.0 million was 14.8% higher than the prior year 1Q Commercial revenue was up 17.1% year-over-year State government revenue was up 15.0% year-over-year Medicare RAC revenue was $2.3 million Medicaid Coordination of Benefits revenue increased 24.7% year-over-year Effective tax rate of 41.7% 1Q Financial Results First Quarter 2015 Financial Performance Full Year Revenue Expectations Unchanged HMSY Q1 2015 Investor Presentation / May 8, 2015 1 1 Adjusted EPS is a non-GAAP measure |
|
|
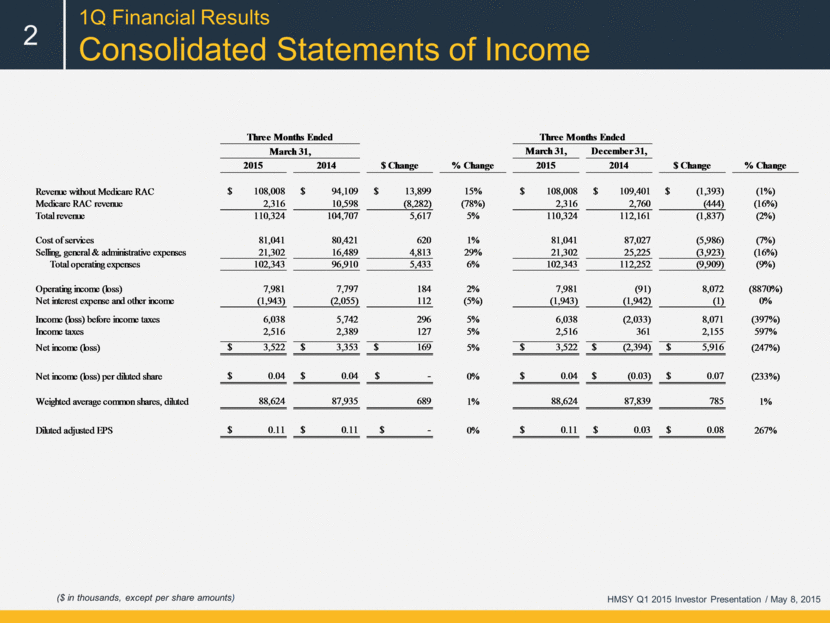
1Q Financial Results Consolidated Statements of Income 2 HMSY Q1 2015 Investor Presentation / May 8, 2015 ($ in thousands, except per share amounts) March 31, December 31, 2015 2014 $ Change % Change 2015 2014 $ Change % Change $ 108,008 $ 94,109 $ 13,899 15% $ 108,008 $ 109,401 $ (1,393) (1%) 2,316 10,598 (8,282) (78%) 2,316 2,760 (444) (16%) 110,324 104,707 5,617 5% 110,324 112,161 (1,837) (2%) 81,041 80,421 620 1% 81,041 87,027 (5,986) (7%) 21,302 16,489 4,813 29% 21,302 25,225 (3,923) (16%) 102,343 96,910 5,433 6% 102,343 112,252 (9,909) (9%) 7,981 7,797 184 2% 7,981 (91) 8,072 (8870%) (1,943) (2,055) 112 (5%) (1,943) (1,942) (1) 0% 6,038 5,742 296 5% 6,038 (2,033) 8,071 (397%) 2,516 2,389 127 5% 2,516 361 2,155 597% $ 3,522 $ 3,353 $ 169 5% $ 3,522 $ (2,394) $ 5,916 (247%) $ 0.04 $ 0.04 $ - 0% $ 0.04 $ (0.03) $ 0.07 (233%) 88,624 87,935 689 1% 88,624 87,839 785 1% $ 0.11 $ 0.11 $ - 0% $ 0.11 $ 0.03 $ 0.08 267% Income (loss) before income taxes Revenue without Medicare RAC Medicare RAC revenue Total revenue Three Months Ended March 31, Three Months Ended Cost of services Selling, general & administrative expenses Total operating expenses Operating income (loss) Net interest expense and other income Income taxes Net income (loss) per diluted share Diluted adjusted EPS Net income (loss) Weighted average common shares, diluted |
|
|
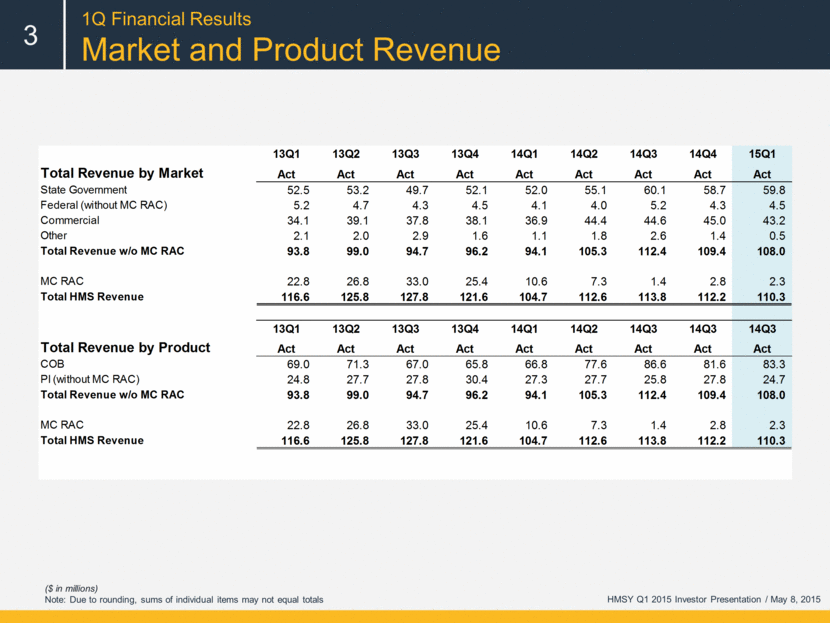
1Q Financial Results Market and Product Revenue 3 ($ in millions) Note: Due to rounding, sums of individual items may not equal totals HMSY Q1 2015 Investor Presentation / May 8, 2015 13Q1 13Q2 13Q3 13Q4 14Q1 14Q2 14Q3 14Q4 15Q1 Total Revenue by Market Act Act Act Act Act Act Act Act Act State Government 52.5 53.2 49.7 52.1 52.0 55.1 60.1 58.7 59.8 Federal (without MC RAC) 5.2 4.7 4.3 4.5 4.1 4.0 5.2 4.3 4.5 Commercial 34.1 39.1 37.8 38.1 36.9 44.4 44.6 45.0 43.2 Other 2.1 2.0 2.9 1.6 1.1 1.8 2.6 1.4 0.5 Total Revenue w/o MC RAC 93.8 99.0 94.7 96.2 94.1 105.3 112.4 109.4 108.0 MC RAC 22.8 26.8 33.0 25.4 10.6 7.3 1.4 2.8 2.3 Total HMS Revenue 116.6 125.8 127.8 121.6 104.7 112.6 113.8 112.2 110.3 13Q1 13Q2 13Q3 13Q4 14Q1 14Q2 14Q3 14Q3 14Q3 Total Revenue by Product Act Act Act Act Act Act Act Act Act COB 69.0 71.3 67.0 65.8 66.8 77.6 86.6 81.6 83.3 PI (without MC RAC) 24.8 27.7 27.8 30.4 27.3 27.7 25.8 27.8 24.7 Total Revenue w/o MC RAC 93.8 99.0 94.7 96.2 94.1 105.3 112.4 109.4 108.0 MC RAC 22.8 26.8 33.0 25.4 10.6 7.3 1.4 2.8 2.3 Total HMS Revenue 116.6 125.8 127.8 121.6 104.7 112.6 113.8 112.2 110.3 |
|
|
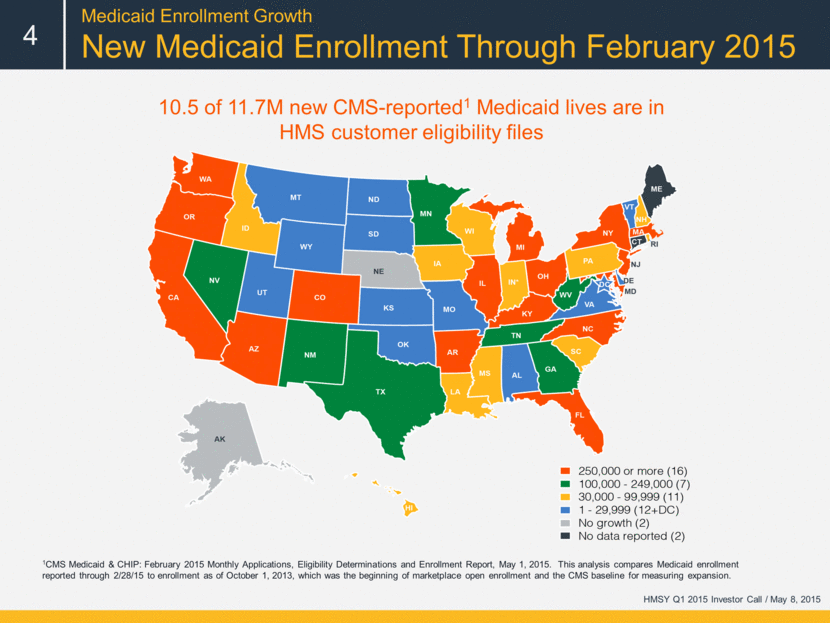
Medicaid Enrollment Growth New Medicaid Enrollment Through February 2015 4 1CMS Medicaid & CHIP: February 2015 Monthly Applications, Eligibility Determinations and Enrollment Report, May 1, 2015. This analysis compares Medicaid enrollment reported through 2/28/15 to enrollment as of October 1, 2013, which was the beginning of marketplace open enrollment and the CMS baseline for measuring expansion. HMSY Q1 2015 Investor Call / May 8, 2015 10.5 of 11.7M new CMS-reported1 Medicaid lives are in HMS customer eligibility files |
|
|
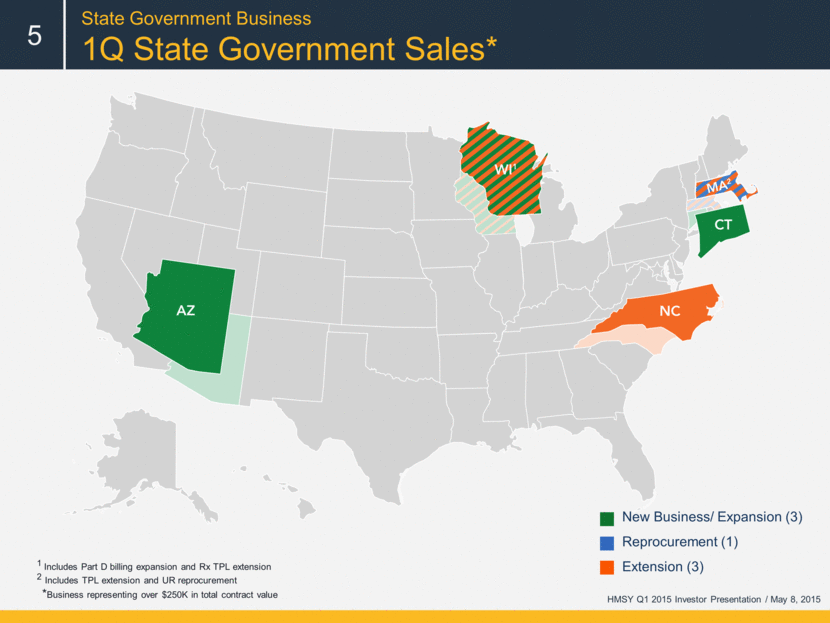
State Government Business 1Q State Government Sales* 5 New Business/ Expansion (3) Reprocurement (1) Extension (3) 1 Includes Part D billing expansion and Rx TPL extension 2 Includes TPL extension and UR reprocurement *Business representing over $250K in total contract value HMSY Q1 2015 Investor Presentation / May 8, 2015 |
|
|
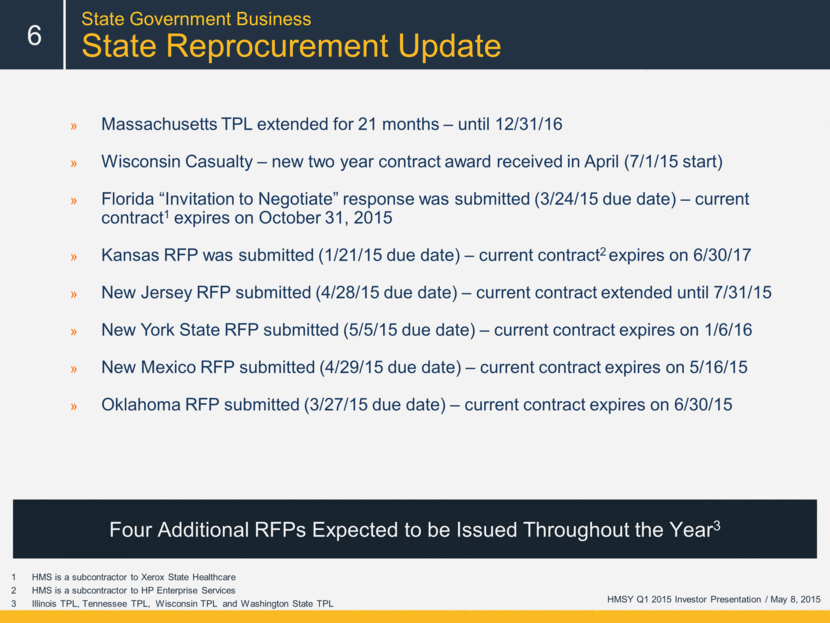
Massachusetts TPL extended for 21 months – until 12/31/16 Wisconsin Casualty – new two year contract award received in April (7/1/15 start) Florida “Invitation to Negotiate” response was submitted (3/24/15 due date) – current contract1 expires on October 31, 2015 Kansas RFP was submitted (1/21/15 due date) – current contract2 expires on 6/30/17 New Jersey RFP submitted (4/28/15 due date) – current contract extended until 7/31/15 New York State RFP submitted (5/5/15 due date) – current contract expires on 1/6/16 New Mexico RFP submitted (4/29/15 due date) – current contract expires on 5/16/15 Oklahoma RFP submitted (3/27/15 due date) – current contract expires on 6/30/15 Four Additional RFPs Expected to be Issued Throughout the Year3 State Government Business State Reprocurement Update HMS is a subcontractor to Xerox State Healthcare HMS is a subcontractor to HP Enterprise Services Illinois TPL, Tennessee TPL, Wisconsin TPL and Washington State TPL HMSY Q1 2015 Investor Presentation / May 8, 2015 6 |
|
|
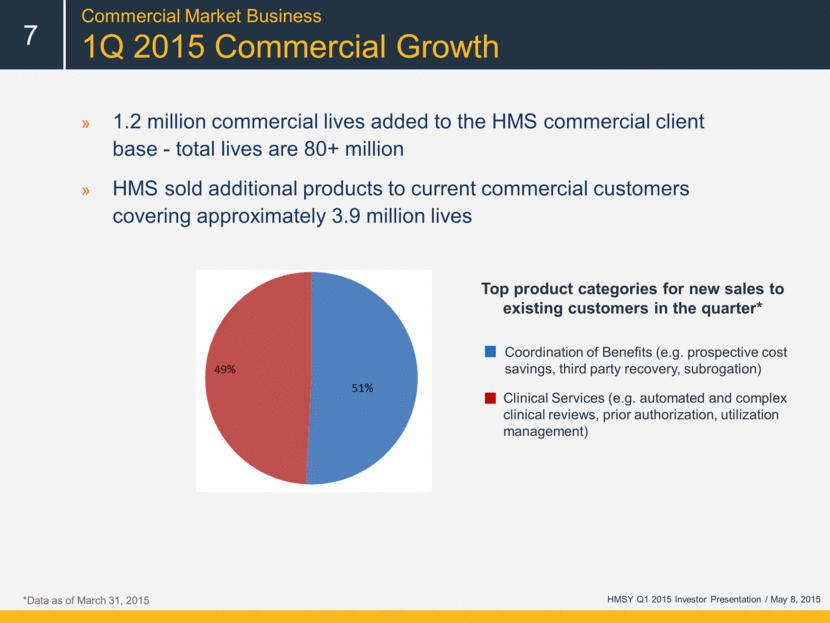
Commercial Market Business 1Q 2015 Commercial Growth 1.2 million commercial lives added to the HMS commercial client base - total lives are 80+ million HMS sold additional products to current commercial customers covering approximately 3.9 million lives Top product categories for new sales to existing customers in the quarter* *Data as of March 31, 2015 HMSY Q1 2015 Investor Presentation / May 8, 2015 7 Coordination of Benefits (e.g. prospective cost savings, third party recovery, subrogation) Clinical Services (e.g. automated and complex clinical reviews, prior authorization, utilization management) |
|
|
2015 Guidance Expectations for the Year Ahead HMSY Q1 2015 Investor Presentation / May 8, 2015 8 7-9% Revenue growth, excluding Medicare RAC 20% Commercial growth Flat State revenue, due primarily to unusually level high of cost avoidance work done in 2014 resulting from Medicaid expansion Medicare RAC revenue of ~ $3 Million per quarter Normalized full year tax rate of 42% Ongoing efforts to reduce costs and improve product yield expected to contribute to margin expansion Commercial Business is Key Driver of Expected 2015 Revenue Growth |
|
|
[LOGO] |