Attached files
| file | filename |
|---|---|
| EX-5 - TIAA REAL ESTATE ACCOUNT | c80401_ex5.htm |
| EX-99.(3)(B) - TIAA REAL ESTATE ACCOUNT | c80401_ex3b.htm |
| EX-99.(3)(A) - TIAA REAL ESTATE ACCOUNT | c80401_ex3a.htm |
| EX-23.(C) - TIAA REAL ESTATE ACCOUNT | c80401_ex23-c.htm |
| EX-23.(G) - TIAA REAL ESTATE ACCOUNT | c80401_ex23-g.htm |
| EX-23.(E) - TIAA REAL ESTATE ACCOUNT | c80401_ex23-e.htm |
| EX-23.(D) - TIAA REAL ESTATE ACCOUNT | c80401_ex23-d.htm |
| EX-23.(F) - TIAA REAL ESTATE ACCOUNT | c80401_ex23-f.htm |
| EX-23.(B) - TIAA REAL ESTATE ACCOUNT | c80401_ex23-b.htm |
| EX-23.(H) - TIAA REAL ESTATE ACCOUNT | c80401_ex23-h.htm |
As filed with the Securities and Exchange Commission on April 22, 2015
Registration No. 333-202583
UNITED STATES
SECURITIES AND EXCHANGE COMMISSION
WASHINGTON, D.C. 20549
AMENDMENT NO. 1
to
FORM
S-1
FOR REGISTRATION
UNDER
THE SECURITIES ACT OF 1933
TIAA REAL ESTATE ACCOUNT
(Exact name of registrant as specified in its charter)
New York
(State or other jurisdiction of incorporation or organization)
(Not applicable)
(Primary Standard Industrial Classification Code Number)
(Not applicable)
(I.R.S. Employer Identification No.)
c/o Teachers Insurance and Annuity Association of America
730 Third Avenue
New York, New York 10017-3206
(212) 490-9000
(Address including zip code, and telephone number, including area code, of registrant’s principal executive offices)
F. Scott Thomas, Esquire
Teachers Insurance and Annuity Association of America
8500 Andrew Carnegie Blvd.
Charlotte, North Carolina 28262
(704) 988-1000
(Name, address, including zip code, and telephone number, including area code, of agent for service)
Copy to:
Jeffrey S. Puretz, Esquire
Dechert LLP
1900 K Street, N.W.
Washington, D.C. 20006
Approximate date of commencement of proposed sale to the public: As soon as practicable after the effective date of the registration statement.
If any of the securities being registered on this Form are to be offered on a delayed or continuous basis pursuant to Rule 415 under the Securities Act of 1933, check the following box: x
If this Form is filed to register additional securities for an offering pursuant to Rule 462(b) under the Securities Act, check the following box and list the Securities Act registration statement number of the earlier effective registration statement for the same offering: o
If this Form is a post-effective amendment filed pursuant to Rule 462(c) under the Securities Act, check the following box and list the Securities Act registration statement number of the earlier effective registration statement for the same offering: o
If this Form is a post-effective amendment filed pursuant to Rule 462(d) under the Securities Act, check the following box and list the Securities Act registration statement number of the earlier effective registration statement for the same offering: o
Indicate by check mark whether the registrant is a large accelerated filer, an accelerated filer, a non-accelerated filer or a smaller reporting company. See definition of “accelerated filer and large accelerated filer” in Rule 12b-2 of the Exchange Act.
Large accelerated filer o Accelerated filer o Non-accelerated filer
x Smaller Reporting Company o
Pursuant to Rule 429 under the Securities Act, the prospectus contained herein also relates to and constitutes a post-effective amendment to Securities Act registration statements 33-92990, 333-13477, 333-22809, 333-59778, 333-83964, 333-113602, 333-121493, 333-132580, 333-141513, 333-149862, 333-158136, 333-165286, 333-172900, 333-180173, 333-187309 and 333-194591 (collectively, the “Prior Registration Statements”).
CALCULATION OF REGISTRATION FEE
|
|
|
|
|
|
|
|
|
|
||||||||
|
Title of Each Class of |
Amount to be |
Proposed |
Proposed |
Amount of |
||||
|
||||||||
|
Accumulation units in TIAA Real Estate Account |
* |
* |
$1,000,000,000** |
$116,200** |
||||
|
||||||||
* |
The securities are not issued in predetermined amounts or units, and the maximum aggregate offering price is estimated solely for purposes of determining the registration fee pursuant to Rule 457(o) under the Securities Act. |
||
** |
In addition to the $1,000,000,000 of accumulation units registered hereunder, the registrant is carrying forward securities which remain unsold but which were previously registered under the Prior Registration Statements for which filing fees were previously paid. |
||
(1) |
The Registrant paid filing fees in the amount of $128,800 in connection with the registration of accumulation units on its Registration Statement on Form S-1 (File No. 333-194591), which was initially filed with the Commission on March 14, 2014 and declared effective on May 1, 2014. The Registrant is not offsetting any filing fees previously paid in connection with any prior Registration Statement. |
||
(2) |
Previously paid. |
The registrant hereby amends this registration statement on such date or dates as may be necessary to delay its effective date until the registrant shall file a further amendment which specifically states that this registration statement shall thereafter become effective in accordance with Section 8(a) of the Securities Act of 1933 or until the registration statement shall become effective on such date as the Securities and Exchange Commission, acting pursuant to Section 8(a), may determine.
The information in this prospectus is not complete and may be changed. We may not sell these securities until the registration statement filed with the Securities and Exchange Commission is effective. This prospectus is not an offer to sell these securities and we are not soliciting an offer to buy these securities in any state where the offer or sale is not permitted.
SUBJECT TO COMPLETION, DATED APRIL 22, 2015
PROSPECTUS
_______, 2015
TIAA Real Estate Account
A tax-deferred variable annuity option offered by Teachers Insurance and Annuity Association of America (“TIAA”)
This prospectus tells you about the TIAA Real Estate Account, an investment option offered through individual and group variable annuity contracts issued by TIAA. Please read it carefully before investing and keep it for future reference. The Real Estate Account, which we refer to sometimes as “the Account” in this prospectus, invests primarily in real estate and real estate-related investments. TIAA, one of the largest and most experienced mortgage and real estate investors in the nation, manages the Account’s assets.
The value of your investment in the Real Estate Account will go up or down depending on how the Account performs and you could lose money. The Account’s performance depends mainly on the value of the Account’s real estate and other real estate-related investments, the income generated by those investments and the Account’s expenses. The Account’s returns could go down if, for example, real estate values or rental and occupancy rates, or the value of real estate-related securities, decrease due to general economic conditions and/or a weak market for real estate generally. Property operating costs, costs associated with leverage on the Account’s properties, and government regulations, such as zoning or environmental laws, could also affect a property’s profitability. TIAA does not guarantee the investment performance of the Account, and you will bear the entire investment risk. For a detailed discussion of the specific risks of investing in the Account, see “Risk factors.”
We take deductions daily from the Account’s net assets for the Account’s operating and investment management expenses. The Account also pays TIAA for bearing mortality and expense risks and for providing a liquidity guarantee. The current estimated annual expense deductions from the Account’s net assets over the next 12 months total 0.865%.
The Real Estate Account is designed as an option for retirement and tax-deferred savings plans for employees of non-profit and governmental institutions. TIAA currently offers the Real Estate Account under the following annuity contracts:
< |
RAs and GRAs (Retirement Annuities and Group Retirement Annuities) |
||
< |
SRAs (Supplemental Retirement Annuities) |
||
< |
GSRAs (Group Supplemental Retirement Annuities) |
||
< |
Retirement Choice and Retirement Choice Plus Annuity |
||
< |
GAs (Group Annuities) and Institutionally Owned GSRAs |
||
< |
Classic and Roth IRAs (Individual Retirement Annuities) including SEP IRAs (Simplified Employee Pension Plans) |
||
< |
Keoghs |
||
< |
ATRAs (After-Tax Retirement Annuities) |
Note that state regulatory approval may be pending for certain of these contracts and these contracts may not currently be available in your state. TIAA may also offer the Real Estate Account as an investment option under additional contracts, both at the individual and plan sponsor level, in the future.
Neither the Securities and Exchange Commission (“SEC”) nor any state securities commission has approved or disapproved of these securities or passed upon the adequacy of the information in this prospectus. Any representation to the contrary is a criminal offense.
An investment in the Real Estate Account is not a bank deposit and is not insured or guaranteed by the Federal Deposit Insurance Corporation or any other government agency.

Table of contents
|
|
|
|||||
|
|
3 |
|||||
|
|
14 |
|||||
|
19 |
||||||
|
22 |
||||||
|
|
35 |
|||||
|
|
38 |
|||||
|
41 |
||||||
|
|
42 |
|||||
|
43 |
||||||
|
|
46 |
|||||
|
47 |
||||||
|
48 |
||||||
|
50 |
||||||
|
|
53 |
|||||
|
|
58 |
|||||
|
63 |
||||||
|
|
65 |
|||||
|
|
67 |
|||||
|
|
68 |
|||||
|
|
69 |
|||||
|
|
70 |
|||||
Management’s discussion and analysis of the Account’s financial condition and results of operations |
|
|
71 |
||||
|
95 |
||||||
107 |
|||||||
109 |
|||||||
115 |
|||||||
|
119 |
||||||
|
119 |
||||||
|
121 |
||||||
122 |
|||||||
|
126 |
||||||
127 |
|||||||
130 |
|||||||
|
131 |
||||||
136 |
|||||||
|
137 |
||||||
138 |
|||||||
138 |
|||||||
139 |
|||||||
139 |
|||||||
141 |
|||||||
142 |
|||||||
142 |
|||||||
262 |
|||||||
267 |
|||||||
273 |
|||||||
Please see Appendix C for definitions of certain special terms used in this prospectus.
The Real Estate Account securities offered by this prospectus are only being offered in those jurisdictions where it is legal to do so. No person may make any representation to you or give you any information about the offering that is not in the prospectus. If anyone provides you with information about the offering that is not in the prospectus, you shouldn’t rely on it.
Prospectus summary
TIAA Real Estate Account
You should read this summary together with the more detailed information regarding the Account, including the Account’s financial statements and related notes, appearing elsewhere in this prospectus. More information about the Account may be obtained by writing us at 730 Third Avenue, New York, NY 10017-3206, calling us at 877 518-9161 or visiting our website at www.tiaa-cref.org.
About the TIAA Real Estate Account
The TIAA Real Estate Account was established in February 1995 as a separate account of Teachers Insurance and Annuity Association of America (“TIAA”) and interests in the Account were first offered to eligible participants on October 2, 1995. The Account offers individual and group accumulating annuity contracts (with contributions made on a pre-tax or after-tax basis), as well as individual lifetime and term-certain variable payout annuity contracts (including the payment of death benefits to beneficiaries). Investors are entitled to transfer funds to or from the Account under certain circumstances. Funds invested in the Account for each category of contract are expressed in terms of units, and unit values will fluctuate depending on the Account’s performance.
Investment objective
The Account seeks favorable long-term returns primarily through rental income and appreciation of real estate and real estate-related investments owned by the Account. The Account will also invest in non-real estate-related publicly traded securities and short-term higher quality liquid investments that are easily converted to cash to enable the Account to meet participant redemption requests, purchase or improve properties or cover other expense needs.
Investment strategy
Real Estate-Related Investments. The Account intends to have between 75% and 85% of its net assets invested directly in real estate or real estate-related investments with the goal of producing favorable long-term returns primarily through rental income and appreciation. These investments may consist of:
• |
Direct ownership interests in real estate, |
||
• |
Direct ownership of real estate through interests in joint ventures, |
||
• |
Indirect interests in real estate through real estate-related securities, such as: |
• |
equity investments in real estate investment trusts (“REITs”), which investments may consist of common or preferred stock interests, |
TIAA Real Estate Account ¡ Prospectus3 |
• |
real estate limited partnerships, |
||
• |
investments in equity or debt securities of companies whose operations involve real estate (i.e., that primarily own or manage real estate) which may not be REITs, and |
||
• |
conventional commercial mortgage loans, participating mortgage loans, secured mezzanine loans and collateralized mortgage obligations, including commercial mortgage-backed securities (“CMBS”) and other similar investments. |
The Account’s principal strategy is to purchase direct ownership interests in income-producing real estate, primarily office, industrial, retail and multi-family properties. The Account is targeted to hold between 65% and 80% of the Account’s net assets in such direct ownership interests at any time. Historically, approximately 70% of the Account’s net assets have comprised of such direct ownership interests in real estate.
In addition, while the Account is authorized to hold up to 25% of its net assets in liquid real estate-related securities, such as REITs and CMBS, management intends that the Account will not hold more than 10% of its net assets in such securities on a long-term basis. Traditionally, less than 10% of the Account’s net assets have been comprised of interests in these securities, although the Account has recently held approximately 10% of its net assets in equity REIT securities. In addition, under the Account’s current investment guidelines, the Account is authorized to hold up to 10% of its net assets in CMBS. As of December 31, 2014, REIT securities comprised approximately 9.2% of the Account’s net assets, and the Account held no CMBS as of such date.
Non-Real Estate-Related Investments. The Account will invest the remaining portion of its assets (targeted to be between 15% and 25% of its net assets) in publicly traded, liquid investments; namely:
• |
Short-term government related instruments, including U.S. Treasury bills, |
||
• |
Long-term government related instruments, such as securities issued by U.S. government agencies or U.S. government sponsored entities, |
||
• |
Short-term non-government related instruments, such as money market instruments and commercial paper, |
||
• |
Long-term non-government related instruments, such as corporate debt securities, and |
||
• |
stock of companies that do not primarily own or manage real estate. |
However, from time to time (including between late 2008 and mid-2010), the Account’s non-real estate-related liquid investments may comprise less than 15% (and possibly less than 10%) of its assets (on a net basis and/or a gross basis), especially during and immediately following periods of significant net participant outflows, in particular due to significant participant transfer activity. In addition, the Account, from time to time and on a temporary basis, may hold in excess of 25% of its net assets in non-real estate-related liquid investments, particularly during times of significant inflows into the Account and/or a lack of attractive real estate-related investments available in the market.
4Prospectus ¡ TIAA Real Estate Account |
Liquid Securities Generally. Primarily due to management’s need to manage fluctuations in cash flows, in particular during and immediately following periods of significant participant net transfer activity into or out of the Account, the Account may, on a temporary basis (i) exceed the upper end of its targeted holdings (currently 35% of the Account’s net assets) in liquid securities of all types, including both publicly traded non-real estate-related liquid investments and liquid real estate-related securities, such as REITs and CMBS, or (ii) be below the low end of its targeted holdings in such liquid securities (currently 15% of the Account’s net assets).
The portion of the Account’s net assets invested in liquid investments of all types may exceed the upper end of its target, for example, if (i) the Account receives a large inflow of money in a short period of time, in particular due to significant participant transfer activity into the Account, (ii) the Account receives significant proceeds from sales or financings of direct real estate assets, (iii) there is a lack of attractive direct real estate investments available on the market, and/or (iv) the Account anticipates more near-term cash needs, including to apply to acquire direct real estate investments, pay expenses or repay indebtedness.
Foreign Investments. The Account from time to time will also make foreign real estate investments. Under the Account’s investment guidelines, investments in direct foreign real estate, together with foreign real estate-related securities and foreign non-real estate-related liquid investments, may not comprise more than 25% of the Account’s net assets. However, through the date of this prospectus, such foreign real estate-related investments have never represented more than 7.5% of the Account’s net assets and management does not intend such foreign investments to exceed 10% of the Account’s net assets. As of December 31, 2014, the Account did not have any foreign assets.
Investments Summary. At December 31, 2014, the Account’s net assets totaled $19.8 billion. As of that date, the Account’s investments in real estate properties, real estate joint ventures, limited partnerships and real estate-related marketable securities, net of the fair value of mortgage loans payable on real estate, represented 80.5% of the Account’s net assets.
At December 31, 2014, the Account held a total of 108 real estate investments (including its interests in 15 real estate-related joint ventures), representing 72.9% of the Account’s total investments, measured on a gross asset value basis (“Total Investments”). As of that date, the Account also held investments in REIT equity securities (representing 8.2% of Total Investments), real estate limited partnerships (representing 1.6% of Total Investments), government agency notes (representing 10.7% of Total Investments) and U.S. Treasury Securities (representing 6.6% of Total Investments). See the Account’s audited financial statements for more information as to the Account’s investments as of December 31, 2014.
Borrowing. The Account is authorized to borrow money in accordance with its investment guidelines. Under the Account’s current investment guidelines, management intends to maintain the Account’s loan to value ratio at or below 30%. The Account’s “loan to value ratio” at any time is based on the outstanding
TIAA Real Estate Account ¡ Prospectus5 |
principal amount of the Account’s debt to the Account’s total gross asset value. This ratio will be measured at the time of any debt incurrence and will be assessed after giving effect thereto.
As of December 31, 2014, the Account’s loan to value ratio was approximately 16.8%.
In addition, the Account may borrow up to 70% of the then-current value of a particular property. Non-construction mortgage loans on a property will be non-recourse to the Account. Please see the section below entitled “General investment and operating policies — Other real estate-related policies — Borrowing.”
Summary of expense deductions
Expense deductions are made each valuation day from the net assets of the Account for various services to manage the Account’s investments, administer the Account and the contracts, and distribute the contracts, and to cover certain risks borne by TIAA. Investment management, administration and distribution services are provided “at cost” by TIAA and TIAA-CREF Individual & Institutional Services, LLC (“Services”), a registered broker-dealer and wholly owned subsidiary of TIAA. Currently, TIAA provides investment management services and administration services for the Account, and Services provides distribution services for the Account. In addition, TIAA charges the Account a fee to bear certain mortality and expense risks, and risks associated with providing the liquidity guarantee. TIAA guarantees that in the aggregate, the expense charges will never be more than 2.50% of average net assets per year.
The estimated annual expense deduction rate that appears in the expense table below reflects an estimate of the amount we currently expect to deduct to approximate the costs that the Account will incur from April 24, 2015 through April 30, 2016. Actual expenses may be higher or lower. The expenses identified in the table below do not include any fees which may be imposed by your employer under a plan maintained by your employer.
|
|
|
|
|
Type of Expense Deduction |
Estimated |
Services Performed |
||
|
||||
Investment Management |
0.335% |
For investment advisory, investment management, portfolio accounting, custodial and similar services, including independent fiduciary and appraisal fees |
||
Administration |
0.250% |
For administration and operations of the Account and the contracts, including administrative services such as receiving and allocating premiums and calculating and making annuity payments |
||
Distribution |
0.125% |
For services and expenses associated with distributing the annuity contracts |
||
Mortality and Expense Risk |
0.005% |
For TIAA’s bearing certain mortality and expense risks |
||
Liquidity Guarantee |
0.150% |
For TIAA’s liquidity guarantee |
||
Total Annual Expense Deduction1,2 |
0.865% |
Total |
||
|
||||
1 |
TIAA guarantees that the total annual expense deduction will not exceed an annual rate of 2.50% of average net assets. |
6Prospectus ¡ TIAA Real Estate Account |
2 |
Property-level expenses, including property management fees and transfer taxes, are not reflected in the table above; instead these expenses are charged directly to the Account’s properties. |
Please see “Expense deductions” and “Selected financial data” for additional information.
TIAA currently does not impose a fee on transfers from the Account, but reserves the right to impose a fee on transfers from the Account in the future.
Example. The following table shows you an example of the expenses you would incur on a hypothetical investment of $10,000 in the TIAA Real Estate Account over several periods. The table assumes a 5% annual return on assets and an annual expense deduction equal to 0.865%. These figures do not represent actual expenses or investment performance, which may differ.
|
|
|
|
|
|
|
|
|
1 Year |
3 Year |
5 Year |
10 Year |
||||
|
|||||||
|
$88 |
$276 |
$480 |
$1,071 |
||||
|
|||||||
Summary risk factors
The value of your investment in the Account will fluctuate based on the value of the Account’s assets and the income the assets generate. You may lose money by investing in this Account. The Account’s assets and income can be affected by many factors, and you should consider the specific risks presented in this prospectus before investing in the Account. The principal risks include the following:
• |
Acquiring and Owning Real Estate: The risks associated with acquiring and owning real property, including general economic and real estate market conditions, the availability of, and economic cost associated with, financing the Account’s properties, the risk that the Account’s properties become too concentrated (whether by geography, sector or tenant mix), competition for acquiring real estate properties, leasing risk (including tenant defaults) and the risk of uninsured losses at properties (including due to terrorism, natural disasters or acts of violence); |
||
• |
Selling Real Estate: The risk that the sales price of a property might differ, perhaps significantly, from its estimated or appraised value, leading to losses or reduced profits to the Account, the risk that the Account might not be able to sell a property at a particular time for a price which management believes represents its fair or full value, the risk of a lack of availability of financing (for potential purchasers of the Account’s properties), risks associated with disruptions in the credit and capital markets, and the risk that the Account may be required to make significant expenditures before the Account is able to market and/or sell a property; |
||
• |
Valuation: The risks associated with property valuations, including the fact that appraisals can be subjective in a number of respects and the fact that the Account’s appraisals are generally obtained on a quarterly basis and there may be periods in between appraisals of a property during which the value attributed to the property for purposes of the Account’s daily accumulation unit value may be more or less than the actual realizable value of the property; |
TIAA Real Estate Account ¡ Prospectus7 |
• |
Borrowing: Risks associated with financing the Account’s properties, including the risk of default on loans secured by the Account’s properties (which could lead to foreclosure), the risk associated with high loan to value ratios on the Account’s properties (including the fact that the Account may have limited, or no net value in such a property), the risk that significant sums of cash could be required to make principal and interest payments on the loans and the risk that the Account may not have the ability to obtain financing or refinancing on favorable terms (or at all), which may be aggravated by general disruptions in credit and capital markets; |
||
• |
Participant Transactions and Cash Management: Investment risk associated with participant transactions, in particular that (i) significant net participant transfers out of the Account may impair our ability to pursue or consummate new investment opportunities that are otherwise attractive to the Account and/or may result in sales of real estate-related assets to generate liquidity, (ii) significant net participant transfers into the Account may result, on a temporary basis, in our cash holdings and/or holdings in liquid real estate-related investments exceeding our long-term targeted holding levels and (iii) high levels of cash in the Account during times of appreciating real estate values can impair the Account’s overall return; |
||
• |
Joint Venture Investments: The risks associated with joint venture partnerships, including the risk that a co-venturer may have interests or goals inconsistent with that of the Account, that a co-venturer may have financial difficulties, and the risk that the Account may have limited rights with respect to operation of the property and transfer of the Account’s interest; |
||
• |
Regulatory Matters: Uncertainties associated with environmental liability and regulations and other governmental regulatory matters such as zoning laws, rent control laws, and property taxes; |
||
• |
Foreign Investments: The risks associated with purchasing, owning and disposing of foreign investments (primarily real estate properties), including political risk, the risk associated with currency fluctuations (whether hedged or not), regulatory and taxation risks and risks associated with enforcing judgments; |
||
• |
Conflicts of Interest: Conflicts of interest associated with TIAA serving as investment manager of the Account and provider of the liquidity guarantee at the same time as TIAA and its affiliates are serving as an investment manager to other real estate accounts or funds, including conflicts associated with satisfying its fiduciary duties to all such accounts and funds associated with the purchasing, selling and leasing of properties; |
||
• |
Required Property Sales: The risk that, if TIAA were to own too large a percentage of the Account’s accumulation units through funding the liquidity guarantee (as determined by the independent fiduciary), the independent fiduciary could require the sales of properties to reduce TIAA’s ownership |
8Prospectus ¡ TIAA Real Estate Account |
|
interest, which sales could occur at times and at prices that depress the sale proceeds to the Account; |
||
• |
Government and Government Agency Securities: Risks associated with investment securities issued by U.S. government agencies and U.S. government-sponsored entities, including the risk that the issuer may not have their securities backed by the full faith and credit of the U.S. government, and that transaction activity may fluctuate significantly from time to time, which could negatively impact the value of the securities and the Account’s ability to dispose of a security at a favorable time; and |
||
• |
Liquid Assets and Securities: Risks associated with investments in real estate-related liquid assets (which could include, from time to time, REIT securities and CMBS), and non-real estate-related liquid assets, including: |
• |
Financial/credit risk — Risks that the issuer will not be able to pay principal and interest when due or that the issuer’s earnings will fall; |
||
• |
Market volatility risk — Risk that the changing conditions in financial markets may cause the Account’s investments to experience price volatility; |
||
• |
Interest rate volatility risk — Risk that interest rate volatility may affect the Account’s current income from an investment or the pricing of that investment. As of the date of this prospectus, interest rates in the United States are at or near historic lows, which may increase the Fund’s exposure to risk associated with rising interest rates; and |
||
• |
Deposit/money market risk — Risk that the Account could experience losses if banks fail. |
More detailed discussions of these risks and other risk factors associated with an investment in the Account are contained in the section below entitled “Risk factors.”
Valuing the Account’s assets
The assets of the Account are valued at the close of each valuation day and the Account calculates and publishes a unit value, which is available on TIAA-CREF’s website (www.tiaa-cref.org), for each valuation day. The values of the Account’s properties are adjusted daily to account for capital expenditures and appraisals as they occur.
With respect to the Account’s real property investments, following the initial purchase of a property or the making of a mortgage loan on a property by the Account (at which time the Account normally receives an independent appraisal on such property), each of the Account’s real properties are appraised, and mortgage loans are valued, at least once every calendar quarter. Each of the Account’s real estate properties is appraised each quarter by an independent external state-certified (or its foreign equivalent) appraiser (which we refer to in this prospectus as an “independent appraiser”) who is a member of a professional appraisal organization. In addition, TIAA’s internal appraisal staff performs a review of each of these quarterly appraisals, in conjunction with the
TIAA Real Estate Account ¡ Prospectus9 |
Account’s independent fiduciary, and TIAA’s internal appraisal staff or the independent fiduciary may request an additional appraisal or valuation outside of this quarterly cycle. Any differences in the conclusions of TIAA’s internal appraisal staff and the independent appraiser will be reviewed by the independent fiduciary, which will make a final determination on the matter (which may include ordering a subsequent independent appraisal).
In general, the Account obtains appraisals of its real estate properties spread out throughout the quarter, which is intended to result in appraisal adjustments and thus adjustments to the valuations of its holdings (to the extent adjustments are made) that happen regularly throughout each quarter and not on one specific day in each period. In addition, an estimated daily equivalent of net operating income is taken into consideration and is adjusted for actual transactional activity. The remaining assets in the Account are primarily marketable securities that are priced on a daily basis and are included in the Account’s daily unit value.
As of December 31, 2014, the Account’s net assets totaled approximately $19.8 billion. Please see the section below entitled “Valuing the Account’s assets” for more information on how each class of the Account’s investments are valued.
Past performance
The bar chart and performance table below illustrate how investment performance during the accumulation period has varied. The chart shows the Account’s total return (which includes all expenses) during the accumulation period over each of the last ten calendar years. It also shows the Account’s returns during the accumulation period for the one-, three-, five- and ten-year periods through December 31, 2014. These returns represent the total return during each such year and reflect both the Account’s investment income and capital appreciation from the Account’s total investments during each such year. How the Account has performed in the past is not necessarily an indication of how it will perform in the future. Please see “Risk factors” below.
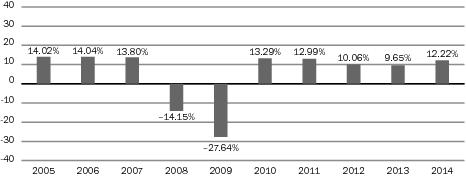
Best quarter: 5.68%, for the quarter ended December 31, 2010.
Worst quarter: –13.18%, for the quarter ended December 31, 2008.
10Prospectus ¡ TIAA Real Estate Account |
AVERAGE ANNUAL TOTAL RETURNS (AS OF DECEMBER 31, 2014)
|
|
|
|
|
|
|
|
|
|
|
1 Year |
3 Year |
5 Year |
10 Year |
||||
|
||||||||
|
TIAA Real Estate Account |
12.22% |
10.64% |
11.63% |
4.77% |
||||
|
||||||||
About TIAA and TIAA’s role with the Account
TIAA is the companion organization of the College Retirement Equities Fund (“CREF”), the first company in the United States to issue a variable annuity. CREF is a non-profit membership corporation established in New York State in 1952. Together, TIAA and CREF, serving approximately 4.0 million people and approximately 15,000 institutions as of December 31, 2014, form the principal retirement system for the nation’s education and research communities and form one of the largest pension systems in the U.S., based on assets under management. As of December 31, 2014, TIAA’s total statutory admitted assets were approximately $263 billion; the combined assets under management for TIAA, CREF and other entities within the TIAA-CREF organization (including TIAA-sponsored mutual funds) totaled approximately $851 billion. CREF does not stand behind TIAA’s guarantees and TIAA does not guarantee CREF products.
The Account does not have officers, directors or employees. TIAA employees, under the direction and control of TIAA’s Board of Trustees (the “Board”) and its Investment Committee, manage the investment of the Account’s assets, following investment management procedures TIAA has adopted for the Account. In addition, TIAA performs administration functions for the Account (which include receiving and allocating premiums, calculating and making annuity payments and providing recordkeeping and other services). Distribution services for the Account (which include, without limitation, distribution of the annuity contracts, advising existing annuity contract owners in connection with their accumulations and helping employers implement and manage retirement plans) are performed by Services. TIAA and Services provide investment management, administration and distribution services, as applicable, on an “at-cost” basis.
With over 65 years in the real estate business and interests in properties located across the U.S. and internationally, TIAA is one of the nation’s largest and most experienced investors in mortgages and real estate equity interests. As of December 31, 2014, the TIAA General Account had a mortgage and real property portfolio (including interests in TIAA subsidiaries that hold real estate, real estate funds and joint ventures but excluding mortgage-backed securities and REIT securities) valued at approximately $22.9 billion.
Liquidity Guarantee. In the event that the Account’s level of liquidity is not sufficient to guarantee that Account participants may redeem their accumulation units (at their accumulation unit value as of the date of such redemption request received in good order), the TIAA General Account will purchase accumulation units issued by the Account (sometimes called “liquidity units”) in accordance with its liquidity guarantee. The cost of this guarantee is embedded in the overall expense charge of the Account. This liquidity guarantee is not a guarantee of either investment performance or the value of units in the Account.
TIAA Real Estate Account ¡ Prospectus11 |
This liquidity guarantee was first exercised in December 2008 and between December 2008 and June 2009, approximately $1.2 billion in liquidity units in the aggregate were purchased. The liquidity guarantee has not been exercised since June 2009. The independent fiduciary has since completed the systematic redemption of all of the liquidity units held by the TIAA General Account. Approximately one-quarter of such units were redeemed evenly over the business days in each of June, September and December 2012, and March 2013, representing a total of $1.3 billion redeemed during this period. Please see the sections below entitled “Establishing and managing the Account — The role of TIAA — Liquidity guarantee” and “— Role of the independent fiduciary.”
The contracts
TIAA offers the Account as a variable option for the annuity contracts listed on the cover page of this prospectus, although some employer plans may not offer the Account as an option for certain contracts. Each payment to the Account buys a number of accumulation units. Similarly, any transfer or withdrawal from the Account results in the redemption of a number of accumulation units. The price you pay for an accumulation unit, and the price you receive for an accumulation unit when you redeem accumulation units, is the accumulation unit value (“AUV”) calculated for the business day on which we receive your purchase, redemption or transfer request in good order (unless you ask for a later date for a redemption or transfer).
The Right to Cancel Your Contract. Generally, you may cancel any RA, SRA, GSRA, Classic IRA, Roth IRA, ATRA or Keogh contract in accordance with the contract’s Right to Examine provision (unless we have begun making annuity payments from it) and subject to the time period regulated by the state in which the contract is issued. Although the contract terms and state law provisions differ, you will generally have between 10 and 60 days to exercise this cancellation right.
Transfers and Withdrawals. Subject to the terms of the contracts and your employer’s plan, you can move your money to and from the Account in the following ways:
• |
from the Account to a CREF investment account, a TIAA Access variable account (if available), TIAA’s Traditional Annuity or a fund (including TIAA-CREF affiliated funds) or other option available under your plan; |
||
• |
to the Account from a CREF investment account, a TIAA Access variable account (if available), TIAA’s Traditional Annuity (transfers from TIAA’s Traditional Annuity under RA, GRA or Retirement Choice contracts are subject to restrictions), a TIAA-CREF affiliated fund or other options available under your plan or from other companies/plans; |
||
• |
by withdrawing cash; and/or |
||
• |
by setting up a program of automatic withdrawals or transfers. |
12Prospectus ¡ TIAA Real Estate Account |
Importantly, transfers out of the Account to a TIAA or CREF account or into another investment option can be executed on any business day but are limited to once per calendar quarter, although some plans may allow systematic transfers that result in more than one transfer per calendar quarter. Other limited exceptions may apply. Also, transfers to CREF accounts or to certain other options may be restricted by your employer’s plan, current tax law or by the terms of your contract.
In addition, individual participants are limited from making internal funding vehicle transfers into their Account accumulation if, after giving effect to such transfer, the total value of such participant’s Account accumulation (under all contracts issued to such participant) would exceed $150,000. Categories of transactions that TIAA deems “internal funding vehicle transfers” for purposes of this limitation are described in detail in the section below entitled “Restrictions on premiums and transfers to the Account.” As of the date of this prospectus, all jurisdictions in which the Account is offered have approved this limitation, but the effective date of the limitation as applies to an individual participant will be reflected on his or her applicable contract or endorsement form. Please see the section below entitled “How to transfer and withdraw your money.”
By limiting these transfers to the Real Estate Account, as anticipated, the amount of funds going into and out of the Account has become more predictable, which we believe will continue to enhance our ability to invest and manage the Real Estate Account’s portfolio with a long-term perspective. Please see the section below entitled “Management’s discussion and analysis of the Account’s financial condition and results of operations — Liquidity and capital resources” for a discussion of participant flow activity.
The Annuity Period. Your income payments may be paid out of the Account through a variety of income options. Ordinarily, your annuity payments begin on the date you designate as your annuity starting date, subject to the terms of your employer’s plan. Your initial income payments are based on the value of your accumulation on the last valuation day before the annuity starting date and annuity payments can change after the initial payment based on the Account’s investment experience, the income option you choose and the income change method you choose. Important tax considerations may also apply. Please see the section below entitled “Receiving annuity income.’’
Death Benefits. Subject to the terms of your employer’s plan, TIAA may pay death benefits if you or your annuity partner dies. When you purchase your annuity contract, you name one or more beneficiaries to receive the death benefit if you die. You can change your beneficiaries any time before you die, and, unless you instruct otherwise, your annuity partner can do the same after your death. Your choice of beneficiary for death benefits may, in some cases, be subject to the consent of your spouse and federal and state law may impose additional restrictions. If you die during the accumulation period, the death benefit is the amount of your accumulation. If you and your annuity partner die during the annuity period while payments are still due under a fixed-period annuity or for the remainder of a guaranteed period, the death benefit is the present value, based
TIAA Real Estate Account ¡ Prospectus13 |
on interest at the effective annual rate of 4%, of the unit annuity payments due for the remainder of the period. Death benefits may be paid out during the accumulation period (currently under one of five available methods) or during the annuity period. Ordinarily, death benefits are subject to federal estate tax. Generally, if taken as a lump sum, death benefits would be taxed like complete withdrawals. If taken as annuity benefits, death benefits would be taxed like annuity payments. See the section below entitled “Death benefits.”
The value of your investment in the Account will fluctuate based on the value of the Account’s assets, the income the assets generate and the Account’s expenses. Participants can lose money by investing in the Account. There is risk associated with an investor attempting to “time” an investment in the Account’s units, or effecting a redemption of an investor’s units. The Account’s assets and income can be affected by many factors, and you should consider the specific risks presented below before investing in the Account. In particular, for a discussion of how forward-looking statements contained in this prospectus are subject to uncertainties that are difficult to predict, which may be beyond management’s control and which could cause actual results to differ materially from historical experience or management’s present expectations, please refer to the subsection entitled “Forward-looking statements,” which is contained in the section below entitled “Management’s discussion and analysis of the Account’s financial condition and results of operations.”
Risks associated with real estate investing
General Risks of Acquiring and Owning Real Property: As referenced elsewhere in this prospectus, the substantial majority of the Account’s net assets are comprised of direct ownership interests in real estate. As such, the Account is particularly subject to the risks inherent in acquiring and owning real property, including in particular the following:
• |
Adverse Global and Domestic Economic Conditions. The economic conditions in the markets where the Account’s properties are located may be adversely impacted by factors which include: |
• |
adverse domestic or global economic conditions, particularly in the event of a deep recession which results in significant employment losses across many sectors of the economy and reduced levels of consumer spending; |
||
• |
a weak market for real estate generally and/or in specific locations where the Account may own property; |
||
• |
business closings, industry or sector slowdowns, employment losses and related factors; |
||
• |
the availability of financing (both for the Account and potential purchasers of the Account’s properties); |
14Prospectus ¡ TIAA Real Estate Account |
• |
an oversupply of, or a reduced demand for, certain types of real estate properties; |
||
• |
natural disasters, flooding and other significant and severe weather-related events, including those caused by global climate change; |
||
• |
terrorist attacks and/or other man-made events; and |
||
• |
decline in population or shifting demographics. |
The incidence of some or all of these factors could reduce occupancy, rental rates and the fair value of the Account’s real properties or interests in investment vehicles (such as limited partnerships) which directly hold real properties.
• |
Concentration Risk. The Account may experience periods in which its investments are geographically concentrated, either regionally or in certain markets with similar demographics. Further, while the Account seeks diversification across its four primary property types: office, industrial, retail and multifamily properties, the Account may experience periods where it has concentration in one property type, increasing the potential exposure if there were to be an oversupply of, or a reduced demand for, certain types of real estate properties in the markets in which the Account operates. |
||
Also, the Account may experience periods in which its tenant base is concentrated within a particular industry sector. For example, the Account owns and operates a number of industrial properties, which typically feature larger tenant concentration. The insolvency and/or closing of a single tenant in one of our industrial properties may significantly impair the income generated by an industrial property, and may also depress the value of such property. |
In addition, the Account owns and operates a number of properties in the Washington, DC metropolitan area and a prolonged period of significantly diminished federal expenditures could have an adverse impact on demand for office space by the U.S. government and the sectors and industries dependent upon the U.S. government in such region or other regions where the government or such related businesses are large lessees.
If any or all of these events occur, the Account’s income and performance may be adversely impacted disproportionately by deteriorating economic conditions in those areas or industry sectors in which the Account’s investments are concentrated. Also, the Account could experience a more rapid negative change in the value of its real estate investments than would be the case if its real estate investments were more diversified.
• |
Leasing Risk. A number of factors could cause the Account’s rental income, a key source of the Account’s revenue and investment return, to decline, which would adversely impact the Account’s results and investment returns. These factors include the following: |
• |
A property may be unable to attract new tenants or retain existing tenants. This situation could be exacerbated if a concentration of lease expirations occurred during any one time period or multiple tenants exercise early termination at the same time. |
TIAA Real Estate Account ¡ Prospectus15 |
• |
The financial condition of our tenants may be adversely impacted, particularly in a prolonged economic downturn. The Account could lose revenue if tenants do not pay rent when contractually obligated, request some form of rent relief and/or default under a lease at one of the Account’s properties. Such a default could occur if a tenant declared bankruptcy, suffered from a lack of liquidity, failed to continue to operate its business or for other reasons. In the event of any such default, we may experience a delay in, or an inability to effect, the enforcement of our rights against that tenant, particularly if that tenant filed for bankruptcy protection. Further, any disputes with tenants could involve costly and time consuming litigation. |
||
• |
In the event a tenant vacates its space at one of the Account’s properties, whether as a result of a default, the expiration of the lease term, rejection of the lease in bankruptcy or otherwise, given current market conditions, we may not be able to re-lease the vacant space either (i) for as much as the rent payable under the previous lease or (ii) at all. Also, we may not be able to re-lease such space without incurring substantial expenditures for tenant improvements and other lease-up related costs, while still being obligated for any mortgage payments, real estate taxes and other expenditures related to the property. |
• |
In some instances, our properties may be specifically suited to and/or outfitted for the particular needs of a certain tenant based on the type of business the tenant operates. For example, many companies desire space with an open floor plan. We may have difficulty obtaining a new tenant for any vacant space in our properties, particularly if the floor plan limits the types of businesses that can use the space without major renovation, which may require us to incur substantial expense in re-planning the space. Also, upon expiration of a lease, the space preferences of our major tenants may no longer align with the space they previously rented, which could cause those tenants to not renew their lease, or may require us to expend significant sums to reconfigure the space to their needs. |
||
• |
The Account owns and operates retail properties, which, in addition to the risks listed above, are subject to specific risks, including the insolvency and/or closing of an anchor tenant. Many times, anchor tenants will be “big box” stores and other large retailers that can be particularly adversely impacted by a global recession and reduced consumer spending generally. Factors that can impact the level of consumer spending include increases in fuel and energy costs, residential and commercial real estate and mortgage conditions, labor and healthcare costs, access to credit, consumer confidence and other macroeconomic factors. Under certain circumstances, co-tenancy clauses in tenants’ leases may allow certain tenants in a retail property to terminate their leases or reduce or withhold rental payments when overall occupancy at the property falls below certain minimum levels. The insolvency and/or closing of an anchor tenant may also cause such |
16Prospectus ¡ TIAA Real Estate Account |
|
tenants to terminate their leases, or to fail to renew their leases at expiration. |
||
• |
Competition. The Account may face competition for real estate investments from multiple sources, including individuals, corporations, insurance companies or other insurance company separate accounts, as well as real estate limited partnerships, real estate investment funds, commercial developers, pension plans, other institutional and foreign investors and other entities engaged in real estate investment activities. Some of these competitors may have similar financial and other resources as the Account, and/or they may have investment strategies and policies (including the ability to incur significantly more leverage than the Account) that allow them to compete more aggressively for real estate investment opportunities, which could result in the Account paying higher prices for investments, experiencing delays in acquiring investments or failing to consummate such purchases. Any resulting delays in the acquisition of investments, or the failure to consummate acquisitions the Account deems desirable, may increase the Account’s costs or otherwise adversely affect the Account’s investment results. |
||
In addition, the Account’s properties may be located close to properties that are owned by other real estate investors and that compete with the Account for tenants. These competing properties may be better located, more suitable for tenants than our properties, or have owners who may compete more aggressively for tenants, resulting in a competitive advantage for these other properties. We may also face similar competition from other properties that may be developed in the future. This competition may limit the Account’s ability to lease space, increase its costs of securing tenants, and limit our ability to maximize our rents and/or require the Account to make capital improvements it otherwise would not, in order to make its properties more attractive to prospective tenants. |
|||
• |
Operating Costs. A property’s cash flow could decrease if operating costs, such as property taxes, utilities, litigation expenses associated with a property, maintenance and insurance costs that are not reimbursed by tenants, increase in relation to gross rental income, or if the property needs unanticipated repairs and renovations. In addition, the Account’s expenses of owning and operating a property are not necessarily reduced when the Account’s income from a property is reduced. |
||
• |
Condemnation. A governmental agency may condemn and convert for a public use (i.e., through eminent domain) all or a portion of a property owned by the Account. While the Account would receive compensation in connection with any such condemnation, such compensation may not be in an amount the Account believes represents equivalent value for the condemned property. Further, a partial condemnation could impair the ability of the Account to maximize the value of the property during its operation, including making it more difficult to find new tenants or retain existing tenants. Finally, |
TIAA Real Estate Account ¡ Prospectus17 |
|
a property which has been subject to a partial condemnation may be more difficult to sell at a price the Account believes is appropriate. |
||
• |
Terrorism and Acts of War and Violence. Terrorist attacks may harm our property investments. The Account cannot assure you that there will not be further terrorist attacks against the United States or U.S. businesses or elsewhere in the world. These attacks or armed conflicts may directly or indirectly impact the value of the property we own or that secure our loans. Losses resulting from these types of events may be uninsurable or not insurable to the full extent of the loss suffered. Moreover, any of these events could cause consumer confidence and spending to decrease or result in increased volatility in the United States, worldwide financial markets, and the global economy. Such events could also result in economic uncertainty in the United States or abroad. Adverse economic conditions resulting from terrorist activities could reduce demand for space in the Account’s properties and thereby reduce the value of the Account’s properties and therefore your investment return. |
||
• |
Risk of Limited Warranty. Purchasing a property “as is” or with limited warranties, which limit the Account’s recourse if due diligence fails to identify all material risks, can negatively impact the Account by reducing the value of such properties and increasing the Account’s cost to hold or sell properties. |
General Risks of Selling Real Estate Investments: Among the risks of selling real estate investments are:
• |
The sale price of an Account property might differ, perhaps significantly, from its estimated or appraised value, leading to losses or reduced profits to the Account. |
|||||||||||||||||||||||||||||||||||||||||||||||||||||||||||||||||||||||||||||||||||||||||||||||||
|
||||||||||||||||||||||||||||||||||||||||||||||||||||||||||||||||||||||||||||||||||||||||||||||||||
• |
The Account might not be able to sell a property at a particular time for a price which management believes represents its fair or full value. This illiquidity may result from the cyclical nature of real estate, general economic conditions impacting the location of the property, disruption in the credit markets or the availability of financing on favorable terms or at all, and the supply of and demand for available tenant space, among other reasons. This might make it difficult to raise cash quickly which could impair the Account’s liquidity position (particularly during any period of sustained significant net participant outflows) and also could lead to Account losses. Further, the liquidity guarantee does not serve as a working capital facility or credit line to enhance the Account’s liquidity levels generally, as its purpose is tied to participants having the ability to redeem their accumulation units upon demand (thus alleviating the Account’s need to dispose of properties solely to increase liquidity levels in what management deems a suboptimal sales environment). |
|||||||||||||||||||||||||||||||||||||||||||||||||||||||||||||||||||||||||||||||||||||||||||||||||
|
||||||||||||||||||||||||||||||||||||||||||||||||||||||||||||||||||||||||||||||||||||||||||||||||||
• |
The Account may need to provide financing to a purchaser if no cash buyers are available, or if buyers are unable to receive financing on terms enabling them to consummate the purchase. Such seller financing introduces a risk |
|||||||||||||||||||||||||||||||||||||||||||||||||||||||||||||||||||||||||||||||||||||||||||||||||
18Prospectus ¡ TIAA Real Estate Account |
|
that the counterparty may not perform its obligations to repay the amounts borrowed from the Account to complete the purchase. |
||
• |
For any particular property, the Account may be required to make expenditures for improvements to, or to correct defects in, the property before the Account is able to market and/or sell the property. |
||
• |
Interests in real estate limited partnerships tend to be in particular illiquid, and the Account may be unable to dispose of such investments at opportune times. |
||
• |
Seller Indemnities. When the Account sells property, it is often required to provide some amount of indemnity for loss to the buyer. While the Account takes steps to try to mitigate the impact of the indemnities, such indemnities could negatively impact the sale price or result in claims by the buyer for indemnity in the future, which could increase the Account’s expenses and thereby reduce the return on investment. |
Valuation and Appraisal Risks: Investments in the Account’s assets are stated at fair value, which is defined as the price that would be received to sell the asset in an orderly transaction between market participants at the measurement date. Determination of fair value, particularly for real estate assets, involves significant judgment. Valuation of the Account’s real estate properties (which comprise a substantial majority of the Account’s net assets) are based on real estate appraisals, which are estimates of property values based on a professional’s opinion and may not be accurate predictors of the amount the Account would actually receive if it sold a property. Appraisals can be subjective in certain respects and rely on a variety of assumptions and conditions at that property or in the market in which the property is located, which may change materially after the appraisal is conducted. Among other things, market prices for comparable real estate may be volatile, in particular if there has been a lack of recent transaction activity in such market. Recent disruptions in the macroeconomy, real estate markets and the credit markets have led to a significant decline in transaction activity in most markets and sectors and the lack of observable transaction data may have made it more difficult for an appraisal to determine the fair value of the Account’s real estate. In addition, a portion of the data used by appraisers is based on historical information at the time the appraisal is conducted, and subsequent changes to such data, after an appraiser has used such data in connection with the appraisal, may not be adequately captured in the appraised value. Also, to the extent that the Account uses a relatively small number of independent appraisers to value a significant portion of its properties, valuations may be subject to any institutional biases of such appraisers and their valuation procedures.
Further, as the Account generally obtains appraisals on a quarterly basis, there may be circumstances in the period between appraisals or interim valuation adjustments in which the true realizable value of a property is not reflected in the Account’s daily net asset value calculation or in the Account’s periodic consolidated financial statements. This disparity may be more apparent when the commercial and/or residential real estate markets experience an overall and
TIAA Real Estate Account ¡ Prospectus19 |
possibly dramatic decline (or increase) in property values in a relatively short period of time between appraisals.
If the appraised values of the Account’s properties as a whole are too high, those participants who purchased accumulation units prior to (i) a downward valuation adjustment of a property or multiple properties or (ii) a property or properties being sold for a lower price than the appraised value will be credited with less of an interest than if the value had previously been adjusted downward. Also, those participants who redeem during any such period will have received more than their pro rata share of the value of the Account’s assets, to the detriment of other non-redeeming participants. In particular, appraised property values may prove to be too high (as a whole) in a rapidly declining commercial real estate market. Further, implicit in the Account’s definition of fair value is a principal assumption that there will be a reasonable time to market a given property and that the property will be exchanged between a willing buyer and willing seller in a nondistressed scenario. However, an appraised value may not reflect the actual realizable value that would be obtained in a rush sale where time was of the essence. Also, appraised values may lag actual realizable values to the extent there is significant and rapid economic deterioration in a particular geographic market or a particular sector within a geographic market.
If the appraised values of the Account’s properties as a whole are too low, those participants who redeem prior to (i) an upward valuation adjustment of a property or multiple properties or (ii) a property or properties being sold for a higher price than the appraised value will have received less than their pro rata share of the value of the Account’s assets, and those participants who purchase units during any such period will be credited with more than their pro rata share of the value of the Account’s assets.
Finally, the Account recognizes items of income (such as net operating income from real estate investments, distributions from real estate limited partnerships or joint ventures, or dividends from REIT stocks) and expense in many cases on an intermittent basis, where the Account cannot predict with certainty the magnitude or the timing of such items. As such, even as the Account estimates items of net operating income on a daily basis, the AUV for the Account may fluctuate, perhaps significantly, from day to day, as a result of adjusting these estimates for the actual recognized item of income or expense.
Investment Risk Associated with Participant Transactions: The amount the Account has available to invest in new properties and other real estate-related assets will depend, in large part, on the level of net participant transfers into or out of the Account as well as participant premiums into the Account. As noted elsewhere in this prospectus, the Account intends to hold between 15% and 25% of its net assets in publicly traded, liquid investments (other than real estate and real estate-related investments), comprised of publicly traded, liquid investments. These liquid assets are intended to be available to purchase real estate-related investments in accordance with the Account’s investment objective and strategy and are also available to meet participant redemption requests and the Account’s expense needs (including, from time to time, obligations on debt). Significant
20Prospectus ¡ TIAA Real Estate Account |
participant transaction activity into or out of the Account’s units is generally not predictable, and wide fluctuations can occur as a result of macroeconomic or geopolitical conditions, the performance of equities or fixed income securities or general investor sentiment, regardless of the historical performance of the Account or of the performance of the real estate asset class generally.
In the second half of 2008 and in 2009, the Account experienced significant net participant transfers out of the Account, eventually causing the Account’s liquid assets to comprise less than 10% of the Account’s assets (on a net and total basis) throughout all of 2009 and into early 2010. Due in large part to this activity, the TIAA liquidity guarantee was initially executed in December 2008. Please see the section below entitled “Establishing and managing the Account — The role of TIAA — Liquidity guarantee.” Among other things, this continued shortfall in the amount of liquid assets impaired management’s ability to consummate new transactions. If a significant amount of net participant transfers out of the Account were to recur, particularly in high volumes similar to those experienced in late 2008 and 2009, the Account may not have enough available liquid assets to pursue, or consummate, new investment opportunities presented to us that are otherwise attractive to the Account. This, in turn, could harm the Account’s returns. Even though net transfers out of the Account ceased in early 2010 and, as of the date of this prospectus, the Account has been in a net inflow position since such time, there is no guarantee that redemption activity will not increase again, perhaps in a significant and rapid manner.
Alternatively, periods of significant net transfer activity into the Account can result in the Account holding a higher percentage of its net assets in publicly traded liquid non-real estate-related investments than the Account’s managers would target to hold under the Account’s long-term strategy. As of December 31, 2014, the Account’s non-real estate-related liquid assets comprised 19.5% of its net assets. At times, the portion of the Account’s net assets invested in these types of liquid instruments may exceed 25%, particularly if the Account receives a large inflow of money in a short period of time, coupled with a lack of attractive real estate-related investments on the market. Also, large inflows from participant transactions often occur in times of appreciating real estate values and pricing, which can render it challenging to execute on some transactions at ideal prices.
In an appreciating real estate market generally, this large percentage of assets held in liquid investments and not in real estate and real estate-related investments may impair the Account’s overall returns. This scenario may be exacerbated in a low interest rate environment for U.S. Treasury securities and related highly liquid securities, such as has existed since 2009 and which may persist in the future. In addition, to manage cash flow, the Account may temporarily hold a higher percentage of its net assets in liquid real estate-related securities, such as REIT and CMBS securities, than its long-term targeted holdings in such securities, particularly during and immediately following times of significant net transfer activity into the Account. Such holdings could increase the volatility of the Account’s returns.
TIAA Real Estate Account ¡ Prospectus21 |
Risks of Borrowing: The Account acquires some of its properties subject to existing financing and from time to time borrows new funds at the time of purchase. Also, the Account may from time to time place new leverage on, increase the leverage already placed on, or refinance maturing debt on, existing properties the Account owns. Under the Account’s current investment guidelines, the Account intends to maintain its loan to value ratio at or below 30% (measured at the time of incurrence and after giving effect thereto). As of December 31, 2014, the Account’s loan to value ratio was approximately 16.8%. Also, the Account may borrow up to 70% of the then-current value of a particular property. Non-construction mortgage loans on a property will be non-recourse to the Account.
Among the risks of borrowing money or otherwise investing in a property subject to a mortgage are:
• |
General Economic Conditions. General economic conditions, dislocations in the capital or credit markets generally or the market conditions then in effect in the real estate finance industry, may hinder the Account’s ability to obtain financing or refinancing for its property investments on favorable terms or at all, regardless of the quality of the Account’s property for which financing or refinancing is sought. Such unfavorable terms might include high interest rates, increased fees and costs and restrictive covenants applicable to the Account’s operation of the property. Longer term disruptions in the capital and credit markets as a result of uncertainty, changing or increased regulation, reduced alternatives, rising interest rates or failures of significant financial institutions could adversely affect our access to financing necessary to make profitable real estate investments. Our failure to obtain financing or refinancing on favorable terms due to the current state of the credit markets or otherwise could have an adverse impact on the returns of the Account. Also, the Account’s ability to secure financing may be impaired if negative marketplace effects such as those which followed from the worldwide economic slowdown following the banking crisis of 2008 and the subsequent sovereign debt and banking difficulties recently experienced in parts of the Eurozone were to persist. These difficulties could include tighter lending standards instituted by banks and financial institutions, the reduced availability of credit facilities and project finance facilities from banks and the fall of consumer and/or business confidence. |
||
• |
Default Risk. The property or group of encumbered properties may not generate sufficient cash flow to support the debt service on the loan, the property may fail to meet certain financial or operating covenants contained in the loan documents and/or the property may have negative equity (i.e., the loan balance exceeds the value of the property) or inadequate equity. In any of these circumstances, we (or a joint venture in which we invest) may default on the loan, including due to the failure to make required debt service payments when due. If a loan is in default, the Account or the venture may determine that it is not economically desirable and/or in the best interests of the Account to continue to make payments on the loan |
22Prospectus ¡ TIAA Real Estate Account |
|
(including accessing other sources of funds to support debt service on the loan), and/or the Account or venture may not be able to otherwise remedy such default on commercially reasonable terms or at all. In either case, the lender then could accelerate the outstanding amount due on the loan and/or foreclose on the underlying property, in which case the Account could lose the value of its investment in the foreclosed property. Further, any such default or acceleration could trigger a default under loan agreements in respect of other Account properties pledged as security for the defaulted loan or other loans. Finally, any such default could increase the Account’s borrowing costs, or result in less favorable terms, with respect to financing future properties. |
|||||||||||||||||||||||||||||||||||||||||||||||||||||||||||||||||||||||||||||||||||||||||||||||||
• |
Balloon Maturities. If the Account obtains a mortgage loan that involves a balloon payment, there is a risk that the Account may not be able to make the lump sum principal payment due under the loan at the end of the loan term, or otherwise obtain adequate refinancing on terms commercially acceptable to the Account or at all. The Account then may be forced to sell the property or other properties under unfavorable market conditions, restructure the loan on terms not advantageous to the Account, or default on its mortgage, resulting in the lender exercising its remedies, which may include repossession of the property, and the Account could lose the value of its investment in that property. |
|||||||||||||||||||||||||||||||||||||||||||||||||||||||||||||||||||||||||||||||||||||||||||||||||
• |
Variable Interest Rate Risk. If the Account obtains variable-rate loans, the Account’s returns may be volatile when interest rates are volatile. Further, to the extent that the Account takes out fixed-rate loans and interest rates subsequently decline, this may cause the Account to pay interest at above-market rates for a significant period of time. Any interest rate hedging activities the Account engages in to mitigate this risk may not fully protect the Account from the impact of interest rate volatility. |
|||||||||||||||||||||||||||||||||||||||||||||||||||||||||||||||||||||||||||||||||||||||||||||||||
|
||||||||||||||||||||||||||||||||||||||||||||||||||||||||||||||||||||||||||||||||||||||||||||||||||
• |
Variable Rate Demand Obligation (VRDO) Risk. To the extent the Account obtains financing pursuant to a variable rate demand obligation subject to periodic remarketing or similar mechanisms, the Account or the joint ventures in which it invests could face higher borrowing costs if the remarketing results in a higher prevailing interest rate. In addition, the terms of such variable rate obligations may allow the remarketing agent to cause the Account or venture to repay the loan on demand in the event insufficient market demand for such loans is present. In particular, RGM 42, LLC, a joint venture in which the Account holds a 70% interest, is the borrower under a VRDO loan program, as described in more detail in the section below entitled “Management’s discussion and analysis of the Account’s financial condition and results of operations.” |
|||||||||||||||||||||||||||||||||||||||||||||||||||||||||||||||||||||||||||||||||||||||||||||||||
|
||||||||||||||||||||||||||||||||||||||||||||||||||||||||||||||||||||||||||||||||||||||||||||||||||
• |
Valuation Risk. The market valuation of mortgage loans payable could have an adverse impact on the Account’s performance. Valuations of mortgage loans payable are generally based on the amount at which the liability could be transferred in a current transaction, exclusive of transaction costs, and such valuations are subject to a number of assumptions and factors with |
|||||||||||||||||||||||||||||||||||||||||||||||||||||||||||||||||||||||||||||||||||||||||||||||||
TIAA Real Estate Account ¡ Prospectus23 |
|
respect to the loan and the underlying property, a change in any of which could cause the value of a mortgage loan to fluctuate. |
A general disruption in the credit markets, such as the disruption experienced in 2008 and 2009, may aggravate some or all of these risks.
Risks of Joint Ownership: Investing in joint venture partnerships or other forms of joint property ownership may involve special risks, many of which are exacerbated when the consent of parties other than the Account is required to take action.
• |
The co-venturer may have interests or goals inconsistent with those of the Account, including during times when a co-venturer may be experiencing financial difficulty. For example: |
• |
a co-venturer may desire a higher current income return on a particular investment than does the Account (which may be motivated by a longer-term investment horizon or exit strategy), or vice versa, which could cause difficulty in managing a particular asset; |
||
• |
a co-venturer may desire to maximize or minimize leverage in the venture, which may be at odds with the Account’s strategy; |
||
• |
a co-venturer may be more or less likely than the Account to agree to modify the terms of significant agreements (including loan agreements) binding the venture, or may significantly delay in reaching a determination whether to do so, each of which may frustrate the business objectives of the Account and/or lead to a default under a loan secured by a property owned by the venture; and |
||
• |
for reasons related to its own business strategy, a co-venturer may have different concentration standards as to its investments (geographically, by sector, or by tenant), which might frustrate the execution of the business plan for the joint venture. |
• |
The co-venturer may be unable to fulfill its obligations (such as to fund its pro rata share of committed capital, expenditures or guarantee obligations of the venture) during the term of such agreement or may become insolvent or bankrupt, any of which could expose the Account to greater liabilities than expected and frustrate the investment objective of the venture. |
|||||||||||||||||||||||||||||||||||||||||||||||||||||||||||||||||||||||||||||||||||||||||||||||||
|
||||||||||||||||||||||||||||||||||||||||||||||||||||||||||||||||||||||||||||||||||||||||||||||||||
• |
If a co-venturer doesn’t follow the Account’s instructions or adhere to the Account’s policies, the jointly owned properties, and consequently the Account, might be exposed to greater liabilities than expected. |
|||||||||||||||||||||||||||||||||||||||||||||||||||||||||||||||||||||||||||||||||||||||||||||||||
|
||||||||||||||||||||||||||||||||||||||||||||||||||||||||||||||||||||||||||||||||||||||||||||||||||
• |
The Account may have limited rights with respect to the underlying property pursuant to the terms of the joint venture, including the right to operate, manage or dispose of a property, and a co-venturer could have approval rights over the marketing or the ultimate sale of the underlying property. |
|||||||||||||||||||||||||||||||||||||||||||||||||||||||||||||||||||||||||||||||||||||||||||||||||
• |
The terms of the Account’s ventures often provide for complicated agreements which can impede our ability to direct the sale of the property owned by the venture at times the Account views most favorable. One such agreement is a “buy-sell” right, which may force us to make a decision |
|||||||||||||||||||||||||||||||||||||||||||||||||||||||||||||||||||||||||||||||||||||||||||||||||
24Prospectus ¡ TIAA Real Estate Account |
|
(either to buy our co-venturer’s interest or sell our interest to our co-venturer) at inopportune times. |
||
• |
A co-venturer can make it harder for the Account to transfer its equity interest in the venture to a third party, which could adversely impact the valuation of the Account’s interest in the venture. |
||
• |
To the extent the Account serves as the general partner or managing member in a venture, it may owe certain contractual or other duties to the co-venturer, including fiduciary duties, which may present perceived or actual conflicts of interest in the management of the underlying assets. Such an arrangement could also subject the Account to liability to third parties in the performance of its duties as a general partner or managing member. |
Risks of Developing or Redeveloping Real Estate or Buying Recently Constructed Properties: If the Account chooses to develop or redevelop a property or buys a recently constructed property, it may face the following risks:
• |
There may be delays or unexpected increases in the cost of property development, redevelopment and construction due to strikes, bad weather, material shortages, increases in material and labor costs or other events. |
||
• |
There are risks associated with potential underperformance or nonperformance by, and/or solvency of, a contractor we select or other third party vendors involved in developing or redeveloping the property. |
||
• |
If the Account were viewed as developing or redeveloping underperforming properties, suffering losses on our investments, or defaulting on any loans on our properties, our reputation could be damaged. Damage to our reputation could make it more difficult to successfully develop or acquire properties in the future and to continue to grow and expand our relationships with our lenders, venture partners and tenants. |
||
• |
Because external factors may have changed from when the project was originally conceived (e.g., slower growth in the local economy, higher interest rates, overbuilding in the area or changes in the regulatory and permitting environment), the property may not attract tenants on the schedule we originally planned and/or may not operate at the income and expense levels first projected. |
Risks with Purchase-Leaseback Transactions: To the extent the Account invested in a purchase-leaseback transaction, the major risk is that the third party lessee will be unable to make required payments to the Account. If the leaseback interest is subordinate to other interests in the real property, such as a first mortgage or other lien, the risk to the Account increases because the lessee may have to pay the senior lienholder to prevent foreclosure before it pays the Account. If the lessee defaults or the leaseback is terminated prematurely, the Account might not recover its investment unless the property is sold or leased on favorable terms.
Real Estate Regulatory Risks: Government regulation at the federal, state and local levels, including, without limitation, zoning laws, rent control or rent stabilization laws, laws regulating housing on the Account’s multifamily
TIAA Real Estate Account ¡ Prospectus25 |
properties, the Americans with Disabilities Act, property taxes and fiscal, accounting, environmental or other government policies, could operate or change in a way that adversely affects the Account and its properties. For example, these regulations could raise the cost of acquiring, owning, improving or maintaining properties, present barriers to otherwise desirable investment opportunities or make it harder to sell, rent, finance, or refinance properties either on economically desirable terms, or at all, due to the increased costs associated with regulatory compliance.
Environmental Risks: The Account may be liable for damage to the environment or injury to individuals caused by hazardous substances used or found on its properties. Under various environmental regulations, the Account may also be liable, as a current or previous property owner or mortgagee, for the cost of removing or cleaning up hazardous substances found on a property, even if it did not know of and wasn’t responsible for the hazardous substances. If any hazardous substances are present or the Account does not properly clean up any hazardous substances, or if the Account fails to comply with regulations requiring it to actively monitor the business activities on its premises, the Account may have difficulty selling or renting a property or be liable for monetary penalties. Further, environmental laws may impose restrictions on the manner in which a property may be used, the tenants which may be allowed, or the manner in which businesses may be operated, which may require the Account to expend funds in order to comply with these laws. These laws may also cause the most ideal use of the property to differ from that originally contemplated and as a result could impair the Account’s returns. The cost of any required cleanup relating to a single real estate investment (including remediating contaminated property) and the Account’s potential liability for environmental damage, including paying personal injury claims and performing under indemnification obligations to third parties, could exceed the value of the Account’s investment in a property, the property’s value, or in an extreme case, a significant portion of the Account’s assets. Finally, while the Account may from time to time acquire third-party insurance related to environmental risks, such insurance coverage may be inadequate to cover the full cost of any loss and would cause the Account to be reliant on the financial health of our third-party insurer at the time any such claim is submitted.
Uninsurable Losses: Certain catastrophic losses (e.g., from earthquakes, wars, terrorist acts, nuclear accidents, hurricanes, wind, floods or environmental or industrial hazards or accidents) may be uninsurable or so expensive to insure against that it is economically disadvantageous to buy insurance for them. Further, the terms and conditions of the insurance coverage the Account has on its properties, in conjunction with the type of loss actually suffered at a property, may subject the property, or the Account as a whole, to a cap on insurance proceeds that is less than the loss or losses suffered. If a disaster that we have not insured against occurs, if the insurance contains a high deductible, and/or if the aggregate insurance proceeds for a particular type of casualty are capped, the Account could lose some of its original investment and any future profits from the property. Also, the Account may not have sufficient access to internal or external
26Prospectus ¡ TIAA Real Estate Account |
sources of funding to repair or reconstruct a damaged property to the extent insurance proceeds do not cover the full loss. In addition, some leases may permit a tenant to terminate its obligations in certain situations, regardless of whether those events are fully covered by insurance. In that case, the Account would not receive rental income from the property while that tenant’s space is vacant, and any such vacancy might impact the value of that property. Finally, as with respect to all third-party insurance, we are reliant on the continued financial health of such insurers and their ability to pay on valid claims. If the financial health of an insurer were to deteriorate quickly, we may not be able to find adequate coverage from another carrier on favorable terms, which could adversely impact the Account’s returns.
Risks of investing in real estate investment trust securities
The Account invests in REIT securities for diversification, liquidity management and other purposes. The Account’s investment in REITs may also increase, as a percentage of net assets, during periods in which the Account is experiencing large net inflow activity, in particular due to net participant transfers into the Account. As of December 31, 2014, REIT securities comprised approximately 9.2% of the Account’s net assets. Investments in REIT securities are part of the Account’s real estate-related investment strategy and are subject to many of the same general risks associated with direct real property ownership. In particular, equity REITs may be affected by changes in the value of the underlying properties owned by the entity, while mortgage REITs may be affected by the quality of any credit extended. In addition to these risks, because REIT investments are securities and generally publicly traded, they may be exposed to market risk and potentially significant price volatility due to changing conditions in the financial markets and, in particular, changes in overall interest rates, regardless of the value of the underlying real estate such REIT may own. Also, sales of REIT securities by the Account for liquidity management purposes may occur at times when values of such securities have declined and it is otherwise an inopportune time to sell the security. Volatility in REITs can cause significant fluctuations in the Account’s AUV on a daily basis, as they are correlated to equity markets which have experienced significant day to day fluctuations over the past few years.
REITs do not pay federal income taxes if they distribute most of their earnings to their shareholders and meet other tax requirements. Many of the requirements to qualify as a REIT, however, are highly technical and complex. Failure to qualify as a REIT results in tax consequences, as well as disqualification from operating as a REIT for a period of time. Consequently, if the Account invests in securities of a REIT that later fails to qualify as a REIT, this may adversely affect the performance of our investment.
Risks of mortgage-backed securities
The Account from time to time has invested in mortgage-backed securities and may in the future invest in such securities. Mortgage-backed securities, such as CMBS, are subject to many of the same general risks inherent in real estate
TIAA Real Estate Account ¡ Prospectus27 |
investing, making mortgage loans and investing in debt securities. The underlying mortgage loans may experience defaults with greater frequency than projected when such mortgages were underwritten, which would impact the values of these securities, and could hamper our ability to sell such securities. In particular, these types of investments may be subject to prepayment risk or extension risk (i.e., the risk that borrowers will repay the loans earlier or later than anticipated). If the underlying mortgage assets experience faster than anticipated prepayments of principal, the Account could fail to recoup some or all of its initial investment in these securities, since the original price paid by the Account was based in part on assumptions regarding the receipt of interest payments. If the underlying mortgage assets are repaid later than anticipated, the Account could lose the opportunity to reinvest the anticipated cash flows at a time when interest rates might be rising. The rate of prepayments depends on a variety of geographic, social and other functions, including prevailing market interest rates and general economic factors. Further, it is possible that the U.S. Government may change its support of, and policies regarding, Fannie Mae and Freddie Mac and, thus, the Account may be unable to acquire agency mortgage- backed securities in the future and even if the Account so acquired them, such changes may result in a negative effect on the pricing of such securities. Other policy changes impacting Fannie Mae and Freddie Mac and/or U.S. Government programs related to mortgages that may be implemented in the future could create market uncertainty and affect the actual or perceived credit quality of issued securities, adversely affecting mortgage-backed securities through an increased risk of loss.
Importantly, the fair market value of these securities is also highly sensitive to changes in interest rates, liquidity of the secondary market and economic conditions impacting financial institutions and the credit markets generally. Note that the potential for appreciation, which could otherwise be expected to result from a decline in interest rates, may be limited by any increased prepayments. Further, volatility and disruption in the mortgage market and credit markets generally (such as was the case in 2008 and 2009) may cause there to be a very limited or even no secondary market for these securities and they therefore may be harder to sell than other securities.
Risks of U.S. government agency securities and corporate obligations
The Account invests in securities issued by U.S. government agencies and U.S. government-sponsored entities. Some of these issuers may not have their securities backed by the full faith and credit of the U.S. government, which could adversely affect the pricing and value of such securities. Also, the Account may invest in corporate obligations (such as commercial paper) and while the Account seeks out such holdings in short-term, higher-quality liquid instruments, the ability of the Account to sell these securities may be uncertain, particularly when there are general dislocations in the finance or credit markets. Any such volatility could have a negative impact on the value of these securities. Further, transaction activity may fluctuate significantly from time to time, which could impair the
28Prospectus ¡ TIAA Real Estate Account |
Account’s ability to dispose of a security at a favorable time, regardless of the credit quality of the underlying issuer. Also, inherent with investing in any corporate obligation is the risk that the credit quality of the issuer will deteriorate, which could cause the obligations to be downgraded and hamper the value or the liquidity of these securities. Finally, any further downgrades or threatened downgrades of the credit rating for U.S. government obligations generally could impact the pricing and liquidity of agency securities or corporate obligations in a manner which could impact the value of the Account’s units.
Risks of liquid investments
The Account’s investments in liquid investments (whether real estate-related, such as REITs, CMBS or some mortgage loans receivable, or non-real estate-related, such as cash equivalents and government securities, and whether debt or equity), are subject to the following general risks:
|
||||||||||||||||||||||||||||||||||||||||||||||||||||||||||||||||||||||||||||||||||||||||||||||||||
• |
Financial/Credit Risk — The risk, for debt securities, that the issuer will not be able to pay principal and interest when due (and/or declare bankruptcy or be subject to receivership) and, for equity securities such as common or preferred stock, that the issuer’s current earnings will fall or that its overall financial soundness will decline, reducing the security’s value. |
|||||||||||||||||||||||||||||||||||||||||||||||||||||||||||||||||||||||||||||||||||||||||||||||||
|
||||||||||||||||||||||||||||||||||||||||||||||||||||||||||||||||||||||||||||||||||||||||||||||||||
• |
Market Volatility Risk — The risk that the Account’s investments will experience price volatility due to changing conditions in the financial markets even regardless of the credit quality or financial condition of the underlying issuer. This risk is particularly acute to the extent the Account holds equity securities, which have experienced significant short-term price volatility in recent years. Also, to the extent the Account holds debt securities, changes in overall interest rates can cause price fluctuations. |
|||||||||||||||||||||||||||||||||||||||||||||||||||||||||||||||||||||||||||||||||||||||||||||||||
• |
Interest Rate Volatility — The risk that interest rate volatility may affect the Account’s current income from an investment. As interest rates rise, the value of certain debt securities (such as those bearing lower fixed rates) held by the Account is likely to decrease. As of the date of this prospectus, interest rates in the United States are at or near historic lows, which may increase the Account’s exposure to risks associated with rising interest rates. |
|||||||||||||||||||||||||||||||||||||||||||||||||||||||||||||||||||||||||||||||||||||||||||||||||
|
||||||||||||||||||||||||||||||||||||||||||||||||||||||||||||||||||||||||||||||||||||||||||||||||||
• |
Deposit/Money Market Risk — The risk that, to the extent the Account’s cash held in bank deposit accounts exceeds federally insured limits as to that bank, the Account could experience losses if banks fail. In addition, there is some risk that investments held in money market accounts or funds can suffer losses. |
|||||||||||||||||||||||||||||||||||||||||||||||||||||||||||||||||||||||||||||||||||||||||||||||||
|
||||||||||||||||||||||||||||||||||||||||||||||||||||||||||||||||||||||||||||||||||||||||||||||||||
Further, to the extent that a significant portion of the Account’s net assets at any particular time are comprised of cash, cash equivalents and non-real estate-related liquid securities, the Account’s returns may suffer as compared to the return that could have been generated by more profitable real estate-related investments. Such a potential negative impact on returns may be exacerbated in times of low prevailing interest rates payable on many classes of liquid securities, such as is the case as of the date hereof and which may persist in the future.
TIAA Real Estate Account ¡ Prospectus29 |
Risks of foreign investments
In addition to other investment risks noted above, foreign investments present the following special risks:
• |
The value of foreign investments or rental income can increase or decrease due to changes in currency exchange rates, currency exchange control or market control regulations, possible expropriation or confiscatory taxation, political, social, diplomatic and economic developments and foreign regulations. The Account translates into U.S. dollars purchases and sales of securities, income receipts and expense payments made in foreign currencies at the exchange rates prevailing on the respective dates of the transactions. The effect of any changes in currency exchange rates on investments and mortgage loans payable is included in the Account’s net realized and unrealized gains and losses. As such, fluctuations in currency exchange rates may impair the Account’s returns. |
||
• |
The Account may, but is not required to, hedge its exposure to changes in currency rates, which could involve extra costs. Further, any hedging activities might not be successful. Such hedges may also be subject to valuation changes. In addition, a lender to a foreign property owned by the Account could require the Account to compensate it for its loss associated with such lender’s hedging activities. |
||
• |
Non-U.S. jurisdictions may impose withholding taxes on the Account as a result of its investment activity in that jurisdiction. TIAA may be eligible for a foreign tax credit in respect of such tax paid by the Account and such credit (if available to TIAA) would be reimbursed to the Account. However, there may be circumstances where TIAA is unable to receive some or all of the benefit of a foreign tax credit and the Account would thus not receive reimbursement, which could harm the value of the Account’s units. |
||
• |
Foreign real estate markets may have different liquidity and volatility attributes than U.S. markets. |
||
• |
The regulatory environment in non-U.S. jurisdictions may disfavor owners and operators of real estate investment properties, resulting in less predictable and/or economically harmful outcomes if the Account were to face a significant dispute with a tenant or with a regulator itself. |
||
• |
The Account may be subject to increased risk of regulatory scrutiny pursuant to U.S. federal statutes, such as the Foreign Corrupt Practices Act, which, among other things, requires robust compliance and oversight programs to help prevent violations. The costs associated with maintaining such programs, in addition to costs associated with a potential regulatory inquiry, could impair the Account’s returns and divert management’s attention from other Account activities. |
||
• |
It may be more difficult to obtain and collect a judgment on foreign investment than on domestic investments, and the costs associated with contesting claims relating to foreign investments may exceed those costs associated with a similar claim on domestic investments. |
30Prospectus ¡ TIAA Real Estate Account |
• |
We may invest from time to time in securities issued by (1) entities domiciled in foreign countries, (2) domestic affiliates of such entities and/ or (3) foreign domiciled affiliates of domestic entities. Such investments could be subject to the risks associated with investments subject to foreign regulation, including political unrest or the seizure, expropriation, repatriation or nationalization of the issuer’s assets. These events could depress the value of such securities and/or make such securities harder to sell on favorable terms, if at all. |
Risks of investing in mortgage loans and related investments
The Account’s investment strategy includes, to a limited extent, investments in mortgage loans (i.e., the Account serving as lender).
• |
General Risks of Mortgage Loans. The Account will be subject to the risks inherent in making mortgage loans, including: |
• |
The borrower may default on the loan, requiring that the Account foreclose on the underlying property to protect the value of its mortgage loan. Since its mortgage loans are usually non-recourse, the Account must rely solely on the value of a property for its security. |
||
• |
In addition, there is a risk of delay in exercising any contractual remedies due to actions of the borrower, including, without limitation, bankruptcy or insolvency of the borrower. |
||
• |
The larger the mortgage loan compared to the value of the property securing it, the greater the loan’s risk. Upon default, the Account may not be able to sell the property for its estimated or appraised value. Also, certain liens on the property, such as mechanic’s or tax liens, may have priority over the Account’s security interest. |
• |
A deterioration in the financial condition of tenants, which could be caused by general or local economic conditions or other factors beyond the control of the Account, or the bankruptcy or insolvency of a major tenant, may adversely affect the income of a property, which could increase the likelihood that the borrower will default under its obligations. |
||
• |
The borrower may be unable to make a lump sum principal payment due under a mortgage loan at the end of the loan term, unless it can refinance the mortgage loan with another lender. |
||
• |
If interest rates are volatile during the loan period, the Account’s variable-rate mortgage loans could have volatile yields. Further, to the extent the Account makes mortgage loans with fixed interest rates, it may receive lower yields than that which is then available in the market if interest rates rise generally. |
||
• |
Interest Rate Risk. The risk that the value or yield of fixed-income securities may decline if interest rates change. In general, when prevailing interest rates decline, the market value of fixed-income securities (particularly those paying a fixed rate of interest) tends to increase. Conversely, when prevailing |
TIAA Real Estate Account ¡ Prospectus31 |
|
interest rates increase, the market value of fixed-income securities (particularly those paying a fixed rate of interest) tends to decline. Depending on the timing of the purchase of a fixed-income security and the price paid for it, changes in prevailing interest rates may increase or decrease the security’s yield. |
||
• |
Extension Risk. The risk that during periods of rising interest rates, borrowers pay off their mortgage loans later than expected, preventing the Account from reinvesting principal proceeds at higher interest rates, resulting in less income than potentially available. These risks are normally present in mortgage-backed securities and other asset-backed securities. For example, homeowners have the option to prepay their mortgages. Therefore, the duration of a security backed by home mortgages can lengthen depending on homeowner prepayment activity. A decline in the prepayment rate and the resulting increase in duration of fixed-income securities held by the Account can result in losses to the Account. |
||
• |
Prepayment Risks. The Account’s mortgage loan investments will usually be subject to the risk that the borrower repays a loan early. Also, the Account may be unable to reinvest the proceeds at as high an interest rate as the original mortgage loan rate, resulting in a decline in income. |
||
• |
Interest Limitations. The interest rate we charge on mortgage loans may inadvertently violate state usury laws that limit rates, if, for example, state law changes during the loan term. If this happens, the Account could incur penalties or may be unable to enforce payment of the loan. |
||
• |
Risks of Investing in Mezzanine Loans. The Account may invest from time to time in mezzanine loans to entities which own real estate assets. Generally these loans will be secured by a pledge of the equity securities of the entity, but not by a first lien security interest in the property itself. As such, the Account’s recovery in the event of an adverse circumstance at the property (such as a default under a mortgage loan on the property) will be subordinated to the recovery available to the first lien mortgage lender(s) to the property. The Account’s remedy may solely consist of foreclosing on the equity interest in the entity owning the property, and that equity interest will be junior in right of recovery to a loan secured by the property owned by the entity. Also, as a subordinated lender, the Account may have limited rights to exercise control over the process by which the mortgage loan is restructured or the property is liquidated following a default. Any of these circumstances may result in the Account being unable to recover some or all of its original investment. |
||
• |
Risks of Participations. To the extent the Account invested in a participating mortgage, the following additional risks would apply: |
• |
The participation feature, in tying the Account’s returns to the performance of the underlying asset, might generate insufficient returns to make up for the higher interest rate the loan would have obtained without the participation feature. |
32Prospectus ¡ TIAA Real Estate Account |
• |
In very limited circumstances, a court may characterize the Account’s participation interest as a partnership or joint venture with the borrower and the Account could lose the priority of its security interest or become liable for the borrower’s debts. |
Conflicts of interest within TIAA
General. TIAA and its affiliates (including TIAA-CREF Alternatives Advisors, LLC and Teachers Advisors, Inc., its wholly owned subsidiaries and registered investment advisers, and TIAA Henderson Real Estate Limited, its majority-owned subsidiary) have interests in other real estate programs and accounts and also engage in other business activities and as such, they will have conflicts of interest in allocating their time between the Account’s business and these other activities. Also, the Account may be buying properties at the same time as TIAA affiliates that may have similar investment objectives to those of the Account. There is also a risk that TIAA will choose a property that provides lower returns to the Account than a property purchased by TIAA and its affiliates. Further, the Account will likely acquire properties in geographic areas where TIAA and its affiliates own or manage properties. In addition, the Account may desire to sell a property at the same time another TIAA affiliate is selling a property in an overlapping market. Conflicts could also arise because some properties owned or managed by TIAA and its affiliates may compete with the Account’s properties for tenants. Among other things, if one of the TIAA entities attracts a tenant that the Account is competing for, the Account could suffer a loss of revenue due to delays in locating another suitable tenant. TIAA has adopted allocation policies and procedures applicable to the purchasing conflicts scenario, but the resolution of such conflicts may be economically disadvantageous to the Account. As a result of TIAA’s and its affiliates’ obligations to TIAA itself and to other current and potential investment vehicles sponsored by TIAA affiliates with similar objectives to those of the Account, there is no assurance that the Account will be able to take advantage of every attractive investment opportunity that otherwise is in accordance with the Account’s investment objectives.
Liquidity Guarantee: In addition, as discussed elsewhere in this prospectus, the TIAA General Account provides a liquidity guarantee to the Account. While an independent fiduciary is responsible for establishing a “trigger point” (a percentage of TIAA’s ownership of liquidity units beyond which TIAA’s ownership may be reduced at the fiduciary’s direction), there is no express cap on the amount TIAA may be obligated to fund under this guarantee. Further, the Account’s independent fiduciary oversees any redemption of TIAA liquidity units. TIAA’s ownership of liquidity units (including the potential for changes in its levels of ownership in the future) from time to time could result in the perception that TIAA is taking into account its own economic interests while serving as investment manager for the Account. In particular, the value of TIAA’s liquidity units fluctuates in the same manner as the value of accumulation units held by all participants. Any perception of a conflict of interest could cause participants to transfer accumulations out of the Account to another investment option, which
TIAA Real Estate Account ¡ Prospectus33 |
could have an adverse impact on the Account’s ability to act most optimally upon its investment strategy. For a discussion of the relevant allocation policies and procedures TIAA has established as well as a summary of other conflicts of interest which may arise as a result of TIAA’s management of the Account, see the section below entitled “Establishing and managing the Account — The role of TIAA — Conflicts of interest.”
No opportunity for prior review of transactions
Investors do not have the opportunity to evaluate the economic or financial merit of the purchase, sale or financing of a property or other investment before the Account completes the transaction, so investors will need to rely solely on TIAA’s judgment and ability to select investments consistent with the Account’s investment objective and policies. Further, the Account may change its investment objective and pursue specific investments in accordance with any such amended investment objective without the consent of the Account’s investors.
Risks of registration under the Investment Company Act of 1940
The Account has not registered, and management intends to continue to operate the Account so that it will not have to register, as an “investment company” under the Investment Company Act of 1940, as amended (the “Investment Company Act”). Generally, a company is an “investment company” and required to register under the Investment Company Act if, among other things, it holds itself out as being engaged primarily, or proposes to engage primarily, in the business of investing, reinvesting or trading in securities, or it is engaged or proposes to engage in the business of investing, reinvesting, owning, holding or trading in securities and owns or proposes to acquire investment securities having a value exceeding 40% of the value of such company’s total assets (exclusive of government securities and cash items) on an unconsolidated basis.
If the Account were obligated to register as an investment company, the Account would have to comply with a variety of substantive requirements under the Investment Company Act that impose, among other things, limitations on capital structure, restrictions on certain investments, compliance with reporting, record keeping, voting and proxy disclosure requirements and other rules and regulations that could significantly increase its operating expenses and reduce its operating flexibility. To maintain compliance with the exemptions from the Investment Company Act, the Account may be unable to sell assets it would otherwise want to sell and may be unable to purchase securities it would otherwise want to purchase, which might materially adversely impact the Account’s performance.
Cybersecurity risks
The Account’s variable product business is highly dependent upon the effective operation of the computer systems and those of its business partners,
34Prospectus ¡ TIAA Real Estate Account |
including TIAA and Services. Consequently, the Account’s business is potentially susceptible to operational and information security risks resulting from a cyber-attack. These risks include, among other things, the theft, misuse, corruption and destruction of data maintained online or digitally, denial of service attacks on websites and other operational disruption and unauthorized release of confidential customer information. Cyber-attacks affecting the Account, TIAA, Services, financial intermediaries and other third party service providers (e.g., the independent fiduciary or the Account’s custodian) may adversely affect the Account and the value of your accumulation units. For instance, cyber-attacks may: interfere with the processing of contract transactions, including the processing of orders from TIAA’s website; affect the Account’s ability to calculate AUVs; cause the release and possible destruction of confidential customer or business information; impede order processing; subject the Account, TIAA and/or its service providers and financial intermediaries to regulatory fines and financial losses; and/or cause reputational damage. Cybersecurity risks may also affect the issuers of securities in which the Account invests, which may in turn cause your accumulation units to lose value. There can be no assurance that the Account or its service providers (including TIAA and Services) will avoid losses affecting your accumulation units that result from cyber-attacks or information security breaches in the future.
The Account’s investment objective and strategy
Investment Objective: The Account seeks favorable long-term returns primarily through rental income and appreciation of real estate and real estate-related investments owned by the Account. The Account will also invest in non-real estate-related publicly traded securities and short-term higher quality liquid investments that are easily converted to cash to enable the Account to meet participant redemption requests, purchase or improve properties or cover other expense needs.
Investment Strategy:
Real Estate-Related Investments. The Account intends to have between 75% and 85% of its net assets invested directly in real estate or real estate-related investments with the goal of producing favorable long-term returns primarily through rental income and appreciation. These investments may consist of:
• |
Direct ownership interests in real estate, |
||
• |
Direct ownership of real estate through interests in joint ventures, |
||
• |
Indirect interests in real estate through real estate-related securities, such as: |
• |
equity investments in real estate investment trusts (“REITs”), which investments may consist of common or preferred stock interests, |
||
• |
real estate limited partnerships, |
TIAA Real Estate Account ¡ Prospectus35 |
• |
investments in equity or debt securities of companies whose operations involve real estate (i.e., that primarily own or manage real estate) which may not be REITs, and |
||
• |
conventional commercial mortgage loans, participating mortgage loans, secured mezzanine loans and collateralized mortgage obligations, including CMBS and other similar investments. |
The Account’s principal strategy is to purchase direct ownership interests in income-producing real estate, primarily office, industrial, retail and multi-family residential properties. The Account is targeted to hold between 65% and 80% of the Account’s net assets in such direct ownership interests at any time. Historically, approximately 70% of the Account’s net assets have been comprised of such direct ownership interests in real estate.
In addition, while the Account is authorized to hold up to 25% of its net assets in liquid real estate-related securities, such as REITs and CMBS, management intends that the Account will not hold more than 10% of its net assets in such securities on a long-term basis. Traditionally, less than 10% of the Account’s net assets have been comprised of interests in these securities although the Account has recently held approximately 10% of its net assets in equity REIT securities. In addition, under the Account’s current investment guidelines, the Account is authorized to hold up to 10% of its net assets in CMBS. As of December 31, 2014, REIT securities comprised approximately 9.2% of the Account’s net assets, and the Account held no CMBS as of such date.
Non-Real Estate-Related Investments. The Account will invest the remaining portion of its assets (targeted to be between 15% and 25% of its net assets) in publicly traded, liquid investments; namely:
• |
Short term government related instruments, including U.S. Treasury bills, |
||
• |
Long-term government related instruments, such as securities issued by U.S. government agencies or U.S. government sponsored entities, |
||
• |
Short-term non-government related instruments, such as money market instruments and commercial paper, |
||
• |
Long-term non-government related instruments, such as corporate debt securities, and |
||
• |
stock of companies that do not primarily own or manage real estate. |
However, from time to time (including between late 2008 and mid-2010), the Account’s non-real estate-related liquid investments may comprise less than 15% (and possibly less than 10%) of its assets (on a net basis and/or a gross basis), especially during and immediately following periods of significant net participant outflows, in particular due to significant participant transfer activity. In addition, the Account, from time to time and on a temporary basis, may hold in excess of 25% of its net assets in non-real estate-related liquid investments, particularly during times of significant inflows into the Account and/or a lack of attractive real estate-related investments available in the market.
Liquid Securities Generally. Primarily due to management’s need to manage fluctuations in cash flows, in particular during and immediately following periods
36Prospectus ¡ TIAA Real Estate Account |
of significant participant net transfer activity into or out of the Account, the Account may, on a temporary basis (i) exceed the upper end of its targeted holdings (currently 35% of the Account’s net assets) in liquid securities of all types, including both publicly traded non-real estate-related liquid investments and liquid real estate-related securities, such as REITs and CMBS, or (ii) be below the low end of its targeted holdings in such liquid securities (currently 15% of the Account’s net assets).
The portion of the Account’s net assets invested in liquid investments of all types may exceed the upper end of its target, for example, if (i) the Account receives a large inflow of money in a short period of time, in particular due to significant participant transfer activity into the Account, (ii) the Account receives significant proceeds from sales or financings of direct real estate assets, (iii) there is a lack of attractive direct real estate investments available on the market, and/or (iv) the Account anticipates more near-term cash needs, including to apply to acquire direct real estate investments, pay expenses or repay indebtedness.
At December 31, 2014, the Account’s net assets totaled $19.8 billion. As of that date, the Account’s investments in real estate properties, real estate joint ventures, limited partnerships and real estate-related marketable securities, net of the fair value of mortgage loans payable on real estate, represented 80.5% of the Account’s net assets.
As discussed in more detail under the section below entitled “Establishing and managing the Account — The role of TIAA — Liquidity guarantee,” and pursuant to its existing liquidity guarantee obligation, TIAA has agreed to purchase accumulation units issued by the Account in the event the Account has insufficient cash and liquid investments to ensure the ability, on its own, to fund participant transfer, redemption or withdrawal requests. This liquidity guarantee was first exercised in December 2008 and as of the date of this prospectus, was last exercised in June 2009. As of the date of this prospectus, the independent fiduciary has completed the systematic redemption of all of the liquidity units held by the TIAA General Account.
Foreign Investments. The Account from time to time will also make foreign real estate investments. Under the Account’s investment guidelines, investments in direct foreign real estate, together with foreign real estate-related securities and foreign non-real estate-related liquid investments, may not comprise more than 25% of the Account’s net assets. Please see the section below entitled “About the Account’s investments — In general — Foreign real estate and other foreign investments.”
Borrowing. The Account is authorized to borrow money in accordance with its investment guidelines. Under the Account’s current investment guidelines, management intends to maintain the Account’s loan to value ratio at or below 30%. The Account’s “loan to value ratio” at any time is based on the outstanding principal amount of the Account’s debt to the Account’s total gross asset value. Please see the section below entitled “General investment and operating policies — Other real estate-related policies — Borrowing.”
TIAA Real Estate Account ¡ Prospectus37 |
At December 31, 2014, the Account held a total of 108 real estate investments (including its interests in 15 real estate-related joint ventures), representing 72.9% of the Account’s total investments, measured on a gross asset value basis (“Total Investments”). As of that date, the Account also held investments in REIT equity securities (representing 8.2% of Total Investments), real estate limited partnerships (representing 1.6% of Total Investments), government agency notes (representing 10.7% of Total Investments) and U.S. Treasury Bills (representing 6.6% of Total Investments). See the Account’s audited financial statements for more information as to the Account’s investments as of December 31, 2014.
About the Account’s investments — In general
Direct investments in real estate
Direct Purchase: The Account will generally buy direct ownership interests in existing or newly constructed income-producing properties, primarily office, industrial, retail, and multi-family residential properties, and, to a lesser extent, the Account will selectively buy student housing properties. The Account will invest mainly in established properties with existing rent and expense schedules or in newly constructed properties with predictable cash flows or, in very limited cases, where a seller agrees to provide certain minimum income levels. In addition, the Account will selectively invest in real estate development projects or engage in redevelopment projects, including pure ‘ground up’ developments. The Account does not directly invest in single-family residential real estate, nor does it currently invest in residential mortgage-backed securities (“RMBS”), although it may invest in such securities in the future.
Purchase-Leaseback Transactions: Although it has not yet done so, the Account can enter into purchase-leaseback transactions (leasebacks) in which it would buy land and income-producing improvements on the land (such as buildings), and simultaneously lease the land and improvements to a third party (the lessee). Leasebacks are generally for very long terms. Usually, the lessee is responsible for operating the property and paying all operating costs, including taxes and mortgage debt. The Account can also give the lessee an option to buy the land and improvements.
In some leasebacks, the Account may purchase only the land under an income-producing building and lease the land to the building owner. In those cases, the Account could seek to share (or “participate”) in any increase in property value from building improvements or in the lessee’s revenues from the building above a base amount. The Account can invest in leasebacks that are subordinated to other interests in the land, buildings, and improvements (e.g., first mortgages); in that case, the leaseback interest would be subject to greater risks.
38Prospectus ¡ TIAA Real Estate Account |
Investments in mortgages
General: The Account can originate or acquire interests in mortgage loans, generally on the same types of properties it might otherwise buy — i.e., the Account will be a creditor. These mortgage loans may pay fixed or variable interest rates or have “participating” features (as described below). Normally the Account’s mortgage loans will be secured by properties that have income-producing potential. They usually will not be insured or guaranteed by the U.S. government, its agencies or anyone else. They usually will be non-recourse, which means they won’t be the borrower’s personal obligations. Most will be first mortgage loans on existing income-producing property, with first-priority liens on the property. These loans may be amortized (i.e., principal is paid over the course of the loan), or may provide for interest-only payments, with a balloon payment at maturity. In addition, the Account may originate a mortgage loan on a property it has recently sold (this is sometimes called “seller financing”).
Participating Mortgage Loans: The Account may make mortgage loans which permit the Account to share (have a “participation”) in the income from or appreciation of the underlying property. These participations let the Account receive additional interest, usually calculated as a percentage of the income the borrower receives from operating, selling or refinancing the property. The Account may also have an option to buy an interest in the property securing the participating loan.
Managing Mortgage Loan Investments: TIAA can manage the Account’s mortgage loans in a variety of ways, including:
• |
renegotiating and restructuring the terms of a mortgage loan; |
||
• |
extending the maturity of any mortgage loan made by the Account; |
||
• |
consenting to a sale of the property subject to a mortgage loan; |
||
• |
financing the purchase of a property by making a new mortgage loan in connection with the sale; and/or |
||
• |
selling the mortgage loans, or portions of them, before maturity. |
Other real estate-related investments
Joint Investment Vehicles Involved in Real Estate Activities: The Account can hold interests in joint ventures, limited partnerships, funds, and other commingled investment vehicles involved in real estate-related activities, including owning, financing, managing, or developing real estate. Many times, the Account will have limited voting and management rights in these commingled vehicles, including over the selection and disposition of the underlying real estate-related assets owned by the vehicle. Also, the Account’s ability to sell freely its interests in commingled vehicles may be restricted by the terms of the governing agreements. From time to time, the Account may also serve as the general partner, managing member, manager or administrator for a joint venture, for which it may earn fees and assume certain responsibilities typically associated with serving as a manager. The Account will not hold real property jointly with TIAA or its affiliates.
TIAA Real Estate Account ¡ Prospectus39 |
Real Estate Investment Trusts: The Account may invest in REITs, which are entities (usually publicly owned and traded) that lease, manage, acquire, hold mortgages on, and develop real estate. Normally the Account will attempt to replicate the holdings of widely recognized REIT indexes, but at times may gain exposure to REITs by purchasing the common or preferred stock of an individual REIT, by purchasing index funds or exchange traded funds, or by purchasing debt securities issued by a REIT. REITs seek to maximize share value and increase cash flows by acquiring and developing new real estate projects, upgrading existing properties or renegotiating existing arrangements to increase rental rates and occupancy levels. REITs must distribute at least 90% of their taxable income to shareholders in order to benefit from a special tax structure, which means they may pay high dividends. The value of a particular REIT can be affected by such factors as general economic and market conditions (in particular as to publicly traded REITs), the performance of the real estate sector in which the REIT primarily invests, cash flow, the skill of its management team, and defaults by its lessees or borrowers.
Mortgage-Backed Securities: The Account can invest in mortgage-backed securities and other mortgage-related or asset-backed instruments, including CMBS, RMBS, mortgage-backed securities issued or guaranteed by agencies or instrumentalities of the U.S. government, non-agency mortgage instruments, and collateralized mortgage obligations that are fully collateralized by a portfolio of mortgages or mortgage-related securities. Mortgage-backed securities are instruments that directly or indirectly represent a participation in, or are secured by and payable from, one or more mortgage loans secured by real estate. In most cases, mortgage-backed securities distribute principal and interest payments on the mortgages to investors. Interest rates on these instruments can be fixed or variable. Some classes of mortgage-backed securities may be entitled to receive mortgage prepayments before other classes do. Therefore, the prepayment risk for a particular instrument may be different than for other mortgage-related securities. Many classes of mortgage-backed securities experienced volatility in pricing and liquidity following the 2008 financial crisis with some volatility persisting to the present day.
Mezzanine Loan Investments: Consistent with its investment objectives, the Account may consider investments in mezzanine debt. Management believes that mezzanine lending may provide opportunities to generate returns that are commensurate with targeted returns for property acquisitions. Unlike a commercial mortgage loan, a mezzanine loan is not secured by a mortgage on a property. Rather, it is a debt investment whereby the lender typically has a security interest in an owner’s stock in an entity that owns a property. A mezzanine loan is subordinate to a first mortgage but senior to the owner’s ownership interest. If a borrower fails to make an interest payment, a mezzanine lender can foreclose on the stock of the entity that owns the property. Management intends to minimize risk by providing financing for low and moderate levels of leverage, including from 50% to 65% of total property value.
40Prospectus ¡ TIAA Real Estate Account |
Stock of Companies Involved in Real Estate Activities: From time to time, the Account can invest in common or preferred stock of companies whose business involves real estate. These stocks may be listed on U.S. or foreign stock exchanges or traded over-the-counter in the U.S. or abroad.
Non-real estate-related investments
The Account can also invest in:
• |
U.S. treasury or U.S. government agency securities; |
||
• |
Money market instruments and other cash equivalents. These will usually be high-quality, short-term debt instruments, including U.S. government or government agency securities, commercial paper, certificates of deposit, bankers’ acceptances, repurchase agreements, interest-bearing time deposits, and corporate debt securities; |
||
• |
Corporate debt or asset-backed securities of U.S. or foreign entities, or debt securities of foreign governments or multinational organizations, but only if they are investment-grade and rated in the top four categories by a nationally recognized rating organization (or, if not rated, deemed by TIAA to be of equal quality); and |
||
• |
To a limited extent common or preferred stock, or other ownership interests, of U.S. or foreign companies that are not involved in real estate, to a limited extent. |
Foreign real estate and other foreign investments
The Account from time to time will invest in foreign real estate or real estate-related investments. It might also invest in securities or other instruments of foreign government or private issuers. Under the Account’s investment guidelines, investments in direct foreign real estate, together with foreign real estate-related securities and foreign non-real estate-related liquid investments, may not comprise more than 25% of the Account’s net assets. However, through the date of this prospectus, such foreign real estate-related investments have never represented more than 7.5% of the Account’s net assets and management does not intend such foreign investments to exceed 10% of the Account’s net assets. As of the date of this prospectus, the Account did not hold any foreign real estate investments.
Depending on investment opportunities, the Account’s foreign investments could at times be concentrated in one or two foreign countries. We will consider the special risks involved in foreign investing before investing in foreign real estate and won’t invest unless our standards are met.
TIAA Real Estate Account ¡ Prospectus41 |
General investment and operating policies
Standards for real estate investments
Buying Real Estate or Making Mortgage Loans: Before the Account purchases real estate or makes a mortgage loan, TIAA will consider such factors as:
• |
the location, condition, and use of the underlying property; |
||
• |
its operating history and its future income-producing capacity; and |
||
• |
the quality, operating experience, and creditworthiness of the tenants or the borrower. |
TIAA will also analyze the fair market value of the underlying real estate, taking into account the property’s operating cash flow (based on the historical and projected levels of rental and occupancy rates and expenses), as well as the general economic conditions in the area where the property is located.
Diversification: We haven’t placed percentage limitations on the type and location of properties that the Account can buy. However, the Account seeks to diversify its investments by type of property, geographic location and tenant mix. How much the Account diversifies will depend upon whether suitable investments are available, the Account’s ability to divest of properties that are in over-concentrated locations or sectors, and how much the Account has available to invest.
Special Criteria for Making Mortgage Loans: Ordinarily, the Account will only make a mortgage loan if the loan, when added to any existing debt, will not exceed 85% of the appraised value of the mortgaged property when the loan is made, unless the Account is compensated for taking additional risk.
Selling Real Estate Investments: The Account doesn’t intend to buy and sell its real estate investments simply to make short-term profits, although proceeds from sales of real estate investments do play a role in the Account’s cash management generally. Rather, the Account’s general strategy in selling real estate investments is to dispose of those assets which management believes:
• |
have maximized in value; |
||
• |
have underperformed or face deteriorating property-specific or market conditions; |
||
• |
represent properties needing significant capital infusions in the future; |
||
• |
are appropriate to dispose of in order to remain consistent with its intent to diversify the Account by property type and geographic location (including reallocating the Account’s exposure to or away from certain property types in certain geographic locations); and/or |
||
• |
otherwise do not satisfy the investment objectives or strategy of the Account. |
Management from time to time will evaluate the need to manage liquidity in the Account as part of its analysis as to whether to undertake a particular asset sale. The Account will reinvest any sale proceeds that management doesn’t believe it will need to pay operating expenses, fund other obligations (such as
42Prospectus ¡ TIAA Real Estate Account |
debt obligations and funding commitments under limited partnership agreements) or to meet participant redemption requests (e.g., cash withdrawals or transfers).
Other real estate-related policies
Appraisals and Valuations of Real Estate Assets: The Account will rely on TIAA’s own analysis, normally along with an independent external appraisal, in connection with the purchase of a property by the Account. The Account will normally receive an independent external appraisal performed by a third-party appraisal firm at or before the time it buys a real estate asset, and the Account also generally obtains an independent appraisal when it makes mortgage loans.
Subsequently, each of the Account’s real properties are appraised, and mortgage loans are valued, at least once every calendar quarter. Each of the Account’s real estate properties are appraised each quarter by an independent third-party appraiser who is a member of a professional appraisal organization. In addition, TIAA’s internal appraisal staff performs a review of each independent appraisal of each real estate property as the final step in the Account’s process of determining the value, in conjunction with the Account’s independent fiduciary, and TIAA’s internal appraisal staff or the independent fiduciary may request an additional appraisal or valuation outside of this quarterly cycle. Any differences in the conclusions of TIAA’s internal appraisal staff and the independent appraiser will be reviewed by the independent fiduciary, which will make a final determination on the matter (which may include ordering a subsequent independent appraisal).
Please see the section below entitled “Valuing the Account’s assets” for more information on how each class of the Account’s investments (including assets other than real estate properties) are valued.
Borrowing: The Account may borrow money and assume or obtain a mortgage on a property — i.e., make leveraged real estate investments. Under the Account’s current investment guidelines, management intends to maintain the Account’s loan to value ratio at or below 30% (measured at the time of incurrence and after giving effect thereto). Forms of borrowing may include:
• |
incurring new debt on the Account’s properties, |
||
• |
refinancing outstanding debt, |
||
• |
assuming debt on the Account’s properties, or |
||
• |
long term extensions of the maturity date of outstanding debt. |
The Account’s loan to value ratio at any time is based on the ratio of the outstanding principal amount of the Account’s debt to the Account’s total gross asset value. The Account’s total gross asset value, for these purposes, is equal to the total fair value of the Account’s assets (including the fair value of the Account’s interest in joint ventures), with no reduction associated with any indebtedness on such assets.
In calculating outstanding indebtedness, we will include only the Account’s actual percentage interest in any borrowings on a joint venture investment and not that of any joint venture partner. Also, at the time the Account (or a joint
TIAA Real Estate Account ¡ Prospectus43 |
venture in which the Account is a partner) enters into a revolving line of credit, management deems the maximum amount which may be drawn under that line of credit as fully incurred, regardless of whether the maximum amount available has been drawn from time to time.
As of December 31, 2014, the aggregate principal amount of the Account’s outstanding debt (including the Account’s share of debt on its joint venture investments) was approximately $4.0 billion and the Account’s loan to value ratio was approximately 16.8%.
In times of high net inflow activity, in particular during times of high net participant transfer inflows, management may determine to apply a portion of such cash flows to make prepayments of indebtedness prior to scheduled maturity, which would have the effect of reducing the Account’s loan to value ratio. Such prepayments may require the Account to pay fees or ‘yield maintenance’ amounts to lenders.
The Account may only borrow up to 70% of the then current value of a property, although construction loans may be for 100% of costs incurred in developing a property. Except for construction loans, any mortgage loans on a property will be non-recourse to the Account, meaning that if there is a default on a loan in respect of a specific property, the lender will have recourse to (i.e., be able to foreclose on) only the property encumbered (or the joint venture owning the property), or to other specific Account properties that may have been pledged as security for the defaulted loan, but not to any other assets of the Account. When possible, the Account will seek to have loans mature at different times to limit the risks of borrowing.
The Account will not obtain mortgage financing on properties it owns from TIAA or any of its affiliates. Under certain circumstances, TIAA or an affiliate may provide a loan to a third party purchaser of a property sold by the Account, but no such financing will be made with respect to a property the Account still owns. However, the Account may place an intra-company mortgage on an Account property held by a subsidiary for tax planning or other purposes. This type of mortgage will not be subject to the general limitations on borrowing described above.
When the Account assumes or obtains a mortgage on a property, it will bear the expense of mortgage payments. It will also be exposed to certain additional risks, which are described in the section above entitled “Risk factors — Risks of borrowing.”
In addition, while it has not done so through the date of this prospectus, the Account may obtain a line of credit to meet short-term cash needs, which line of credit may be unsecured and/or contain terms that may require the Account to secure a loan with one or more of its properties. Management expects the proceeds from any such short-term borrowing would be used to meet the cash flow needs of the Account’s properties and real estate-related investments, but depending on the circumstances, proceeds could be used for Account-level funding needs (including the need to honor unexpected participant withdrawal activity).
44Prospectus ¡ TIAA Real Estate Account |
Discretion to Evict or Foreclose: TIAA may, in its discretion, evict defaulting tenants or foreclose on defaulting borrowers to maintain the value of an investment, when it decides that it is in the Account’s best interests.
Property Management and Leasing Services: The Account usually will hire a national or regional independent third-party property management company to perform the day-to-day management services for each of the Account’s properties, including supervising any on-site personnel, negotiating maintenance and service contracts, providing advice on major repairs and capital improvements and assisting the Account in ensuring compliance with environmental regulations. The property manager will also recommend changes in rent schedules and create marketing and advertising programs to attain and maintain high levels of occupancy by responsible tenants. The Account may also hire independent third-party leasing companies to perform or coordinate leasing and marketing services to fill any vacancies. The fees paid to the property management company, along with any leasing commissions and expenses, will reduce the Account’s cash flow from a property.
Insurance: We intend to arrange for, or require proof of, comprehensive insurance, including liability, fire, and extended coverage, for the Account’s real properties and properties securing mortgage loans or subject to purchase-leaseback transactions. The Account currently participates in property, casualty and other related insurance programs as part of TIAA’s property insurance programs, and the Account only bears the cost of insuring only the properties it owns. The terms and conditions of the insurance coverage the Account has on its properties, in conjunction with the type of loss actually suffered at a property, may subject the property, or the Account as a whole, to a cap on insurance proceeds that is less than the loss or losses suffered. In addition, the Account’s insurance policies on its properties currently include catastrophic coverage for wind, earthquakes and terrorist acts, but we can’t assure you that it will be adequate to cover all losses. We also can’t assure you that we will be able to obtain coverage for wind, earthquakes and terrorist acts at an acceptable cost, if at all, at the time a policy expires. While the Account will seek to have coverage placed with highly rated, financially healthy insurance carriers, the Account is reliant on the continued financial health of the third-party insurers it engages.
Other policies
Investment Company Act of 1940: The Account has not registered, and we intend to operate the Account so that it will not have to register, as an “investment company” under the Investment Company Act. This will require monitoring the Account’s portfolio so that it won’t have more than 40 percent of the value of its total assets, excluding U.S. government securities and cash items, in investment securities. As a result, the Account may be unable to make some potentially profitable investments, it may be unable to sell assets it would otherwise want to sell or it may be forced to sell investments in investment securities before it would otherwise want to do so.
TIAA Real Estate Account ¡ Prospectus45 |
Changing Operating Policies or Winding Down: Under the terms of the contracts and in accordance with applicable insurance law, TIAA can decide to change, in its sole discretion, the operating policies of the Account or to wind it down. If the Account is wound down, you may need to transfer your accumulations or annuity income to TIAA’s Traditional Annuity or any CREF account available under your employer’s plan. All investors in the Account will be notified in advance if we decide to change a significant policy or wind down the Account.
Establishing and managing the Account — The role of TIAA
Establishing the Account
The Board established the Real Estate Account as a separate account of TIAA under New York law on February 22, 1995. The Account is regulated by the New York State Department of Financial Services (“NYDFS”) and the insurance departments of the other jurisdictions in which the annuity contracts are offered. Although TIAA owns the assets of the Real Estate Account, and the Account’s obligations under the contracts are obligations of TIAA, the Account’s income, investment gains, and investment losses are credited to or charged against the assets of the Account without regard to TIAA’s other income, gains, or losses. Under New York insurance law, we can’t charge the Account with liabilities incurred by any other TIAA business activities or any other TIAA separate account.
Managing the Account
TIAA employees, under the direction and control of the Board and its Investment Committee, manage the investment of the Account’s assets, following investment management procedures TIAA has adopted for the Account. The Account does not have officers, directors or employees. TIAA’s investment management responsibilities include:
• |
identifying and recommending purchases, sales and financings of appropriate real estate-related and other investments; |
||
• |
providing (including by arranging for others to provide) all portfolio accounting, custodial, and related services for the Account; and |
||
• |
arranging for others to provide certain advisory or other management services to the Account’s joint ventures or other investments. |
In addition, TIAA performs administration functions for the Account. These functions include receiving and allocating premiums, calculating and making annuity payments and providing recordkeeping and other services. Distribution services for the Account (which include, without limitation, distribution of the annuity contracts, advising existing annuity contract owners in connection with their accumulations and helping employers implement and manage retirement plans) are performed by Services. TIAA and Services provide investment management, administration and distribution services, as applicable, on an “at-cost” basis. For more information about the charge for investment management,
46Prospectus ¡ TIAA Real Estate Account |
administration and distribution services, please see the section below entitled “Expense deductions.”
You don’t have the right to vote for TIAA Trustees. Please see the section below entitled “General matters — Voting rights.” For information about the Trustees, certain executive officers of TIAA and the Account’s portfolio management team, see Appendix A of this prospectus.
TIAA’s ERISA Fiduciary Status. To the extent that assets of a plan subject to the Employee Retirement Income Security Act of 1974, as amended (“ERISA”), are allocated to the Account, TIAA will be acting as an “investment manager” and a fiduciary under ERISA with respect to those assets.
The TIAA General Account provides the Account with a liquidity guarantee enabling the Account to have funds available to meet participant redemption, transfer or cash withdrawal requests. This guarantee is required by the NYDFS. If the Account can’t fund participant requests from the Account’s own cash flow and liquid investments, the TIAA General Account will fund such requests by purchasing accumulation units (accumulation units that are purchased by TIAA are generally referred to as “liquidity units”) issued by the Account. TIAA guarantees that you can redeem your accumulation units at their accumulation unit value next determined after your transfer or cash withdrawal request is received in good order. “Good order” means actual receipt of the transaction request along with all information and supporting legal documentation necessary to effect the transaction. Whether the liquidity guarantee is exercised is based on the cash level of the Account from time to time, as well as recent participant withdrawal activity and the Account’s expected working capital, debt service and cash needs, all subject to the oversight of the independent fiduciary. While the proceeds from liquidity unit purchases are not placed in a segregated account solely to fund participant requests, the guarantee is in place to meet participant needs. Liquidity units owned by TIAA are valued in the same manner as accumulation units owned by the Account’s participants. Importantly, however, this liquidity guarantee is not a guarantee of the investment performance of the Account or a guarantee of the value of your units. Transfers from the Account to a CREF or TIAA account, or another investment option, are limited to once every calendar quarter (except for specifically prescribed systematic transfers established in accordance with the terms of the participant’s contract and employer’s plan), and cash withdrawals may be further restricted by the terms of your plan.
TIAA’s obligation to provide Account participants liquidity through purchases of liquidity units is not subject to an express regulatory or contractual limitation, although as described under the section below entitled “Establishing and managing the Account — the role of TIAA — Role of the independent fiduciary,” the independent fiduciary may (but is not obligated to) require the reduction of TIAA’s interest through sales of assets from the Account if TIAA’s interest exceeds a predetermined trigger point. Even if this trigger point were reached and
TIAA Real Estate Account ¡ Prospectus47 |
regardless of whether the independent fiduciary has required the Account to dispose of any assets, TIAA’s obligation to provide liquidity under the guarantee will continue.
The Account pays TIAA for the risk associated with providing the liquidity guarantee through a daily deduction from the Account’s net assets. Please see the section below entitled “Expense deductions.” Primarily as a result of significant net participant transfers throughout 2008 (in particular, in the second half of 2008), pursuant to this liquidity guarantee obligation, the TIAA General Account first purchased liquidity units on December 24, 2008. Between December 2008 and June 2009, the TIAA General Account paid an aggregate of approximately $1.2 billion to purchase liquidity units in a number of separate transactions, with the last such transaction occurring in June 2009. Management cannot predict whether future liquidity unit purchases will be required under the liquidity guarantee although as of the date of this prospectus, management believes such purchases are unlikely in the near term.
Redemption of Liquidity Units. The independent fiduciary is vested with oversight and approval over any redemption of TIAA’s liquidity units, acting in the best interests of Real Estate Account participants.
As of December 31, 2014, TIAA did not own any liquidity units, as the independent fiduciary completed the systematic redemption of all of the liquidity units previously held by the TIAA General Account in March 2013. As a general matter, the independent fiduciary may authorize or direct the redemption of all or a portion of liquidity units at any time and TIAA will request the approval of the independent fiduciary before any liquidity units are redeemed.
Upon termination and liquidation of the Account (wind-up), any liquidity units held by TIAA will be the last units redeemed, unless the independent fiduciary directs otherwise. Finally, TIAA may redeem its liquidity units more frequently than once per calendar quarter, subject at all times to the oversight and approval of the Account’s independent fiduciary (discussed in more detail in the subsection entitled “— Role of the independent fiduciary” immediately below).
Role of the independent fiduciary
Because TIAA’s ability to purchase and sell liquidity units raises certain technical issues under ERISA, TIAA applied for and received a prohibited transaction exemption from the U.S. Department of Labor in 1996 PTE-96-76. In connection with the exemption, TIAA has appointed an independent fiduciary for the Real Estate Account, with overall responsibility for reviewing Account transactions to determine whether they are in accordance with the Account’s investment guidelines. RERC, LLC, a real estate consulting firm whose principal offices are located in Des Moines, IA (“RERC”), was initially appointed as independent fiduciary effective March 1, 2006 and currently serves as the Account’s independent fiduciary whose term expires on February 28, 2018. In February 2014, RERC was acquired by Situs Group LLC (“Situs”), a real estate advisory firm. In December 2014, Situs was acquired by Situs Group Holding Corporation, an affiliate of Stone Point Capital LLC.
48Prospectus ¡ TIAA Real Estate Account |
Under the terms of PTE 96-76, RERC’s responsibilities include:
• |
reviewing and approving the Account’s investment guidelines and monitoring whether the Account’s investments comply with those guidelines; |
||
• |
reviewing and approving the valuation of the Account and of the properties held in the Account as well as the valuation procedures and rules for the Account; |
||
• |
approving adjustments to any property valuations that change the value of the property or the Account as a whole above or below certain prescribed levels, or that are made within three months of the annual independent appraisal; |
||
• |
reviewing and approving how the Account values accumulation and annuity units; |
||
• |
approving the appointment of all independent appraisers; |
||
• |
reviewing the purchase and sale of units by TIAA and Account participants to ensure that the Account uses the correct unit values; and |
||
• |
requiring appraisals besides those normally conducted, if the independent fiduciary believes that any of the properties have changed materially, or that an additional appraisal is necessary or appropriate to ensure the Account has correctly valued a property. |
In addition, RERC has certain responsibilities with respect to the Account that it had historically undertaken or is currently undertaking with respect to TIAA’s purchase and ownership of liquidity units, including among other things reviewing the purchases and redemption of liquidity units by TIAA to ensure the Account uses the correct unit values. In connection therewith, as set forth in PTE 96-76, the independent fiduciary’s responsibilities include:
• |
establishing the percentage of total liquidity units that TIAA’s ownership should not exceed (the “trigger point”) and creating a method for changing the trigger point; |
||
• |
approving any adjustment of TIAA’s ownership interest in the Account and, in its discretion, requiring an adjustment if TIAA’s ownership of liquidity units reaches the trigger point; and |
||
• |
once the trigger point has been reached, participating in any program to reduce TIAA’s ownership in the Account by utilizing cash flow or liquid investments in the Account, or by utilizing the proceeds from asset sales. If the independent fiduciary were to determine that TIAA’s ownership should be reduced following the trigger point, its role in participating in any asset sales program would include: |
|
|
|
(i) |
participating in the selection of properties for sale, |
|
(ii) |
providing sales guidelines, and |
|
(iii) |
approving those sales if, in the independent fiduciary’s opinion, such sales are desirable to reduce TIAA’s ownership of liquidity units. |
In establishing the appropriate trigger point, including whether or not to require certain actions once the trigger point has been reached, the independent fiduciary will assess, among other things and to the extent consistent with PTE 96-76 and
TIAA Real Estate Account ¡ Prospectus49 |
the independent fiduciary’s duties under ERISA, the risk that a conflict of interest could arise due to the level of TIAA’s ownership interest in the Account.
A special subcommittee consisting of five (5) independent outside members of the Investment Committee of the Board renewed the appointment of RERC as the independent fiduciary for an additional three-year term, which appointment was effective as of March 1, 2015, and continues through February 28, 2018. This subcommittee may renew the independent fiduciary appointment, remove the independent fiduciary, or appoint its successor. The independent fiduciary can be removed for cause by the vote of three (3) out of the five (5) subcommittee members and will not be reappointed if two (2) of the subcommittee members disapprove of the reappointment. The independent fiduciary can resign after providing at least 180 days’ written notice.
The Account pays the independent fiduciary directly. The investment management charge includes the costs associated with retaining the independent fiduciary. Under PTE 96-76, the independent fiduciary must receive less than 5% of its annual gross revenues (including payment for its services to the Account) from TIAA and its affiliates.
When you decide as a participant or plan fiduciary to invest in the Account, after TIAA has provided you with full and fair disclosure, including the disclosure in this prospectus, you are also acknowledging that you approve and accept RERC or any successor to serve as the Account’s independent fiduciary.
General. Employees of TIAA that provide advice with respect to the Real Estate Account may also provide investment advice with respect to investments owned by TIAA, and investments managed by TIAA-CREF Alternatives Advisors, LLC (“TCAA”) and Teachers Advisors, Inc., both indirect, wholly owned subsidiaries of TIAA and registered investment advisers. In addition, TIAA and its affiliates offer (and may in the future offer) other accounts and investment products that are not managed under an “at cost” expense structure. Therefore, TIAA and its employees may at times face various conflicts of interest. For example, the TIAA General Account and a privately offered core property investment fund managed by TCAA (the “core property investment fund”) may sometimes compete with the Real Estate Account in the purchase of investments; however, both accounts will be subject to the allocation procedure described below. (Each of the TIAA General Account, the Real Estate Account and the core property investment fund together with any other real estate accounts or funds that are established or may be established by TIAA or its affiliates in the future, are herein referred to as an “account.”)
Many of the personnel of TIAA involved in performing services to the Real Estate Account will have competing demands on their time. The personnel will devote such time to the affairs of the Account as TIAA’s management determines, in its sole discretion exercising good faith, is necessary to properly service the Account. TIAA believes that it has sufficient personnel to discharge its responsibility to the Real Estate Account, the General Account, the core property investment fund and other accounts to avoid conflicts of interest. TIAA or its
50Prospectus ¡ TIAA Real Estate Account |
affiliates may form and/or manage other real estate investment vehicles in the future and we will take steps to assure that those vehicles are integrated into appropriate conflict of interest policies. TIAA does not accept acquisition or placement fees for the services it provides to the Account.
Allocation Procedure. TIAA and its affiliates allocate new investments (including real property investments and commercial mortgages, but generally not real estate limited partnership investments) among the accounts in accordance with a written allocation procedure as adopted by TIAA and modified from time to time. Generally, the portfolio managers for each of the accounts will evaluate acquisition opportunities which conform to the investment strategy of the applicable account. If more than one account expresses an interest in a particular investment in a particular sector, a strict rotation system will be used whereby the interested account highest on the list will be allowed to pursue the transaction, and then such account will drop to the bottom of the rotation for new investments in that sector. This rotation system is employed on a sector-by-sector basis for each of the office, retail, industrial, multi-family, student housing and other sectors; meaning that an account (including the Real Estate Account) could, at any one time, be at the top or the bottom of the rotation for new investment opportunities in all of the five sectors in which the Real Estate Account could invest. If only one account is interested, that account will be allocated the opportunity with no change in its position in the rotation. In addition, where an account is a co-investor in a non-discretionary mandate (e.g., where a TIAA affiliate does not have discretion to deploy investors’ capital for acquisitions within such mandate), such mandate will be included as part of that account’s rotation and will not have a separate place in the foregoing rotation.
Also, there may be circumstances where multiple properties are presented to TIAA for sale as a single acquisition opportunity, and the proposed price is inclusive of all the properties. If more than one account has interest in all or a portion of such bundled acquisition opportunity, TIAA’s acquisition staff will investigate with the seller whether the properties can be unbundled and offered to the accounts on an individual basis and the sector-based rotation system described above will apply to the allocation of such unbundled properties.
An asset allocation oversight committee made up of senior officers of TIAA (representing its asset management, risk management, product management, internal audit, compliance, legal and accounting groups) will review and discuss, on a quarterly basis, the allocations made during the previous quarter based on this allocation procedure to, among other things, ensure the procedure is being followed and to review and approve any changes to the procedure. In addition, the procedure will be reviewed by this internal committee on at least an annual basis.
Leasing Conflicts. Conflicts could also arise because some properties in the TIAA General Account, the core property investment fund and other accounts may compete for tenants with the Real Estate Account’s properties. Management believes the potential for leasing conflicts are minimized by the unique characteristics of each property, including location, submarket, physical characteristics, amenities and lease rollover schedules. Management believes
TIAA Real Estate Account ¡ Prospectus51 |
the differing business strategies of the accounts also reduce potential conflicts. If a conflict arises, as appropriate, the competing accounts will arrange that different property managers and leasing brokers are engaged, each charged with using their best efforts to support the property management and leasing activity for each particular property and an ethical screen will be placed between the internal asset managers for the respective properties. Any conflicts that arise will be reported to the next occurring global real estate portfolio oversight committee (which is comprised of portfolio managers for the accounts).
Sales Conflicts. Conflicts could also potentially arise when two TIAA accounts attempt to sell properties located in the same market or submarket, especially if there are a limited number of potential purchasers and/or if such purchaser has an ongoing business relationship with TIAA or one of its specific accounts.
Liquidity Guarantee. TIAA’s ownership of liquidity units (including potential changes in future ownership levels) could result in the perception that TIAA is taking into account its own economic interests while serving as investment manager for the Account. In particular, there is the concern that TIAA could make investment decisions (and other management decisions) with respect to the Account which serve the interest of the TIAA General Account, at the expense of those participants that have chosen the Account as an investment option. This could manifest itself, among other ways, by the Account disposing its properties solely to raise liquidity in avoidance of having a need for the liquidity guarantee, or by foregoing otherwise attractive investment opportunities so as not to impair liquid asset levels.
Management believes that any conflict (or potential conflict) is mitigated by, among other things, the detailed valuation procedure for the Account’s properties, which includes independent appraisals and the oversight of the independent fiduciary. Also, the independent fiduciary oversees the execution of the liquidity guarantee to ensure the proper unit values are applied, and the independent fiduciary will oversee any liquidity unit redemptions. Further, the independent fiduciary is vested with the right to establish a trigger point, which is a level of ownership at which the fiduciary is empowered, but not required, to reduce TIAA’s ownership interest (with the goal to mitigate any potential conflict of interest) through the means described in the immediately preceding section. For example, the independent fiduciary could perceive a conflict of interest if it believed that management directed the sale of properties solely to increase liquidity (not in accordance with the Account’s investment guidelines or at “fire sale” prices) with the sole goal of avoiding the need for further TIAA liquidity unit purchases under the liquidity guarantee. In such case, the independent fiduciary would be authorized to adjust the trigger point, at which time the fiduciary would have control over the sales of properties (including the timing and pricing) to ensure such sales are in the best interests of the Account.
While it retains the oversight over the Account’s investment guidelines, valuation and appraisal matters and the liquidity guarantee as described above in “— Role of the independent fiduciary,” the independent fiduciary’s authority to override investment management decisions made by TIAA’s managers acting on
52Prospectus ¡ TIAA Real Estate Account |
behalf of the Account is limited to those circumstances after which the trigger point has been reached or during a wind-down of the Account.
Indemnification
The Account has agreed to indemnify TIAA and its affiliates, including its officers and trustees, against certain liabilities to the extent permitted by law, including liabilities under the Securities Act of 1933. The Account may make such indemnification out of its assets. Insofar as indemnification for liabilities arising under the Securities Act of 1933 may be permitted to TIAA and its affiliates, the Account has been advised that in the opinion of the SEC such indemnification is against public policy as expressed in the Securities Act of 1933 and is therefore unenforceable.
Summary of the Account’s properties
The properties — In general
At December 31, 2014, the Account owned a total of 108 real estate investments (93 of which were wholly owned and 15 of which were held in real estate-related joint ventures), representing 72.9% of the Account’s total investment portfolio (on a gross asset value basis). At December 31, 2014, the real estate portfolio included:
• |
29 office investments (including four held in joint ventures); |
||
• |
28 industrial investments (including one held in a joint venture); |
||
• |
20 retail investments (including eight held in joint ventures); |
||
• |
29 apartment investments (including one held in a joint venture); |
||
• |
a 75% joint venture interest in a portfolio of storage facilities located throughout the United States; and |
||
• |
a fee interest encumbered by a ground lease. |
Of the 108 real estate investments, 32 were subject to mortgages (including eleven joint venture property investments).
In the tables and the footnotes contained in Appendix B to this prospectus, you will find more detailed information about each of the Account’s portfolio property investments as of December 31, 2014. The Account’s investments include both properties that are wholly owned by the Account and properties owned by the Account’s joint venture investments. Certain property investments detailed in Appendix B are comprised of a portfolio of properties.
Commercial (non-residential) properties
At December 31, 2014, the Account held 79 commercial (non-residential) investments in its portfolio, including a portfolio of storage facilities located throughout the United States. Fourteen of these investments were held through joint ventures, and 21 were subject to mortgages (including ten joint venture investments). Although the terms vary under each lease, certain expenses, such
TIAA Real Estate Account ¡ Prospectus53 |
as real estate taxes and other operating expenses, are paid or reimbursed in whole or in part by the tenants.
Management believes that the Account’s portfolio is diversified by both property type and geographic location. At December 31, 2014, the portfolio consisted of:
• |
Office. 29 investments containing approximately 15.8 million square feet located in 10 states and the District of Columbia. As of December 31, 2014, the Account’s office properties had an aggregate fair value of approximately $7.2 billion. |
||
• |
Industrial. 28 investments containing approximately 28.4 million square feet located in 10 states. As of December 31, 2014, the Account’s industrial properties had an aggregate fair value of approximately $2.2 billion. |
||
• |
Retail. 20 investments containing approximately 17.0 million square feet located in 15 states and the District of Columbia. As of December 31, 2014, the Account’s retail properties had an aggregate fair value of approximately $2.5 billion. One of the retail property investments is an 85% interest in a portfolio containing 26 individual retail shopping centers primarily located throughout the Eastern and Southern regions. |
||
• |
Other — Land (425 Park Avenue). The Account has a fee interest real estate investment encumbered by a ground lease. As of December 31, 2014, this investment had a fair value of $420.0 million. |
||
• |
Other — Storage. The Account has a 75% interest in a portfolio of storage facilities located throughout the United States containing approximately 1.7 million square feet. As of December 31, 2014, the Account’s interest in this portfolio had a fair value of approximately $114.8 million. |
As of December 31, 2014, the Account’s commercial real estate investment holdings were 90.3% leased. The Account’s:
• |
office properties investments were 89.6% leased; |
||
• |
industrial properties investments were 87.6% leased; |
||
• |
retail properties investments were 95.6% leased; and |
||
• |
the storage portfolio was 91.2% leased. |
Major Tenants: The following tables list the Account’s ten most significant tenants based on the total space they occupied as of December 31, 2014 in each of the Account’s commercial property types.
54Prospectus ¡ TIAA Real Estate Account |
|
|
|
|
|
|
|
|
Major Office Tenants |
Occupied |
Percentage of Total |
Percentage of Total |
|||
|
||||||
|
BHP Petroleum (Americas), Inc.(1) |
782,956 |
5.0% |
1.3% |
|||
|
Salesforce.com Inc(2)(4) |
502,348 |
3.2% |
0.8% |
|||
|
Microsoft Corporation(2) |
479,193 |
3.0% |
0.8% |
|||
|
The Bank of New York Mellon Corporation(3)(4) |
470,628 |
3.0% |
0.8% |
|||
|
Crowell & Moring LLP(2) |
414,464 |
2.6% |
0.7% |
|||
|
Atmos Energy Corporation(2) |
312,238 |
2.0% |
0.5% |
|||
|
Yahoo! Inc.(1) |
307,134 |
1.9% |
0.5% |
|||
|
GE Healthcare(2) |
294,306 |
1.9% |
0.5% |
|||
|
Bridgewater Associates LP(2) |
227,883 |
1.4% |
0.4% |
|||
|
Pearson Education, Inc.(2) |
225,299 |
1.4% |
0.4% |
|||
|
||||||
|
|
|
|
|
|
|
|
Major Industrial Tenants |
Occupied |
Percentage of Total |
Percentage of Total |
|||
|
||||||
|
Wal-Mart Stores, Inc.(2) |
1,099,112 |
3.9% |
1.8% |
|||
|
Regal West Corporation(2) |
968,535 |
3.4% |
1.6% |
|||
|
Restoration Hardware, Inc.(2) |
886,052 |
3.1% |
1.4% |
|||
|
Kumho Tire U.S.A. Inc.(2) |
830,485 |
2.9% |
1.4% |
|||
|
Del Monte Fresh Product, N.A., Inc.(2) |
689,660 |
2.4% |
1.1% |
|||
|
R.R Donnelley & Sons Company(2) |
659,157 |
2.3% |
1.1% |
|||
|
Rheem Sales Company, Inc.(2) |
656,600 |
2.3% |
1.1% |
|||
|
Global Equipment Company, Inc.(2) |
647,228 |
2.3% |
1.1% |
|||
|
Mohawk Carpet Distribution LP(2) |
616,992 |
2.2% |
1.0% |
|||
|
Campbell Soup Supply Company LLC(2) |
573,000 |
2.0% |
0.9% |
|||
|
||||||
|
|
|
|
|
|
|
|
Major Retail Tenants |
Occupied |
Percentage of Total |
Percentage of Total |
|||
|
||||||
|
Dick’s Sporting Goods, Inc.(1) |
415,902 |
2.5% |
0.7% |
|||
|
Ross Stores, Inc.(1) |
399,205 |
2.4% |
0.7% |
|||
|
Kohl’s Corporation(1) |
349,777 |
2.1% |
0.6% |
|||
|
PetSmart, Inc.(3) |
332,745 |
2.0% |
0.5% |
|||
|
J.C. Penney Corporation, Inc(1) |
327,027 |
1.9% |
0.5% |
|||
|
Sears, Roebuck & Co.(1) |
304,465 |
1.8% |
0.5% |
|||
|
Bed Bath & Beyond, Inc.(3) |
279,347 |
1.6% |
0.5% |
|||
|
Publix Super Markets, Inc.(3) |
277,615 |
1.6% |
0.5% |
|||
|
Michaels Stores, Inc.(3) |
267,821 |
1.6% |
0.4% |
|||
|
Best Buy Co., Inc.(3) |
267,791 |
1.6% |
0.4% |
|||
|
||||||
(1) |
Tenant occupied space within joint venture investments. |
||
(2) |
Tenant occupied space within wholly owned property investments. |
||
(3) |
Tenant occupied space within wholly owned property investments and joint venture investments. |
||
(4) |
Tenant occupied space within an investment that has been sold subsequent to date of this report. |
The following tables list the rentable area for long term leases subject to expiring leases during the next ten years and an aggregate figure for expirations in 2025 and after, in the Account’s commercial (non-residential) properties that are both wholly owned by the Account and held within the Account’s joint venture
TIAA Real Estate Account ¡ Prospectus55 |
investments. While many of the leases contain renewal options with varying terms, these charts assume that none of the tenants exercise their renewal options, including those with terms that expired on December 31, 2014 or are month to month leases.
OFFICE PROPERTIES
|
|
|
|
|
|
|
|
|
|
|
Year of |
Number of |
Rental Income |
Expiring Rent as |
Rentable Area |
Percentage of |
|||||
|
||||||||||
|
2015 |
173 |
$ 38.4 |
3.0% |
2,014,764 |
12.8% |
|||||
|
2016 |
149 |
30.1 |
2.4% |
1,538,019 |
9.7% |
|||||
|
2017 |
136 |
22.9 |
1.8% |
1,088,130 |
6.9% |
|||||
|
2018 |
118 |
31.3 |
2.5% |
1,681,040 |
10.7% |
|||||
|
2019 |
86 |
27.1 |
2.1% |
1,339,283 |
8.5% |
|||||
|
2020 |
58 |
29.3 |
2.3% |
827,736 |
5.2% |
|||||
|
2021 |
37 |
16.6 |
1.3% |
1,668,615 |
10.6% |
|||||
|
2022 |
34 |
11.7 |
0.9% |
687,394 |
4.4% |
|||||
|
2023 |
22 |
5.6 |
0.4% |
553,084 |
3.5% |
|||||
|
2024 |
27 |
18.6 |
1.5% |
668,014 |
4.2% |
|||||
|
Thereafter |
37 |
83.0 |
6.5% |
1,529,130 |
9.7% |
|||||
|
||||||||||
|
Total |
877 |
$314.6 |
24.7% |
13,595,209 |
86.2% |
|||||
|
||||||||||
INDUSTRIAL PROPERTIES
|
|
|
|
|
|
|
|
|
|
|
Year of |
Number of |
Rental Income |
Expiring Rent as |
Rentable Area |
Percentage of |
|||||
|
||||||||||
|
2015 |
95 |
$20.4 |
1.6% |
6,600,234 |
23.2% |
|||||
|
2016 |
89 |
9.2 |
0.7% |
4,281,704 |
15.1% |
|||||
|
2017 |
83 |
7.1 |
0.6% |
3,123,582 |
11.0% |
|||||
|
2018 |
49 |
9.8 |
0.8% |
4,536,417 |
16.0% |
|||||
|
2019 |
41 |
5.5 |
0.4% |
1,308,481 |
4.6% |
|||||
|
2020 |
16 |
4.6 |
0.4% |
2,104,495 |
7.4% |
|||||
|
2021 |
3 |
2.4 |
0.2% |
414,876 |
1.5% |
|||||
|
2022 |
7 |
3.2 |
0.3% |
1,497,191 |
5.3% |
|||||
|
2023 |
5 |
1.8 |
0.1% |
399,825 |
1.4% |
|||||
|
2024 |
2 |
0.7 |
0.1% |
275,208 |
1.0% |
|||||
|
Thereafter |
5 |
0.7 |
0.1% |
114,272 |
0.4% |
|||||
|
||||||||||
|
Total |
395 |
$65.4 |
5.3% |
24,656,285 |
86.9% |
|||||
|
||||||||||
56Prospectus ¡ TIAA Real Estate Account |
RETAIL PROPERTIES
|
|
|
|
|
|
|
|
|
|
|
Year of |
Number of |
Rental Income |
Expiring Rent as |
Rentable Area |
Percentage of |
|||||
|
||||||||||
|
2015 |
276 |
$13.4 |
1.1% |
1,528,016 |
9.0% |
|||||
|
2016 |
281 |
17.0 |
1.3% |
2,321,316 |
13.7% |
|||||
|
2017 |
247 |
13.1 |
1.0% |
1,691,435 |
10.0% |
|||||
|
2018 |
202 |
15.3 |
1.2% |
1,545,069 |
9.1% |
|||||
|
2019 |
192 |
14.7 |
1.2% |
1,665,001 |
9.8% |
|||||
|
2020 |
134 |
7.6 |
0.6% |
569,496 |
3.4% |
|||||
|
2021 |
111 |
8.3 |
0.7% |
591,484 |
3.5% |
|||||
|
2022 |
76 |
6.3 |
0.5% |
947,155 |
5.6% |
|||||
|
2023 |
99 |
9.8 |
0.8% |
664,769 |
3.9% |
|||||
|
2024 |
81 |
7.8 |
0.6% |
560,806 |
3.3% |
|||||
|
Thereafter |
48 |
18.2 |
1.4% |
1,111,752 |
6.6% |
|||||
|
||||||||||
|
Total |
1,747 |
$131.5 |
10.4% |
13,196,299 |
77.9% |
|||||
|
||||||||||
(1) |
Rental income includes income from wholly owned properties, which is shown as Rental income on the Consolidated Statements of Operations, as well as income from properties held in joint venture investments, which is included in Income from real estate joint ventures and limited partnerships on the Consolidated Statements of Operations. |
Certain leases provide for additional rental amounts based upon the recovery of actual operating expenses in excess of specified base amounts, sales volume or contractual increases as defined in the lease agreement. These contractual contingent rentals are not included in the table above.
The table below details the leasing activity during the year ended December 31, 2014.
|
|
|
|
|
|
|
Leasing Activity |
|
|
|
|
||||
|
Vacant space beginning of year |
5,884,458 |
|
|
|
|
Vacant space acquired during the year |
901,396 |
|
|
|
|
Vacant space disposed of during the year |
(222,462) |
|
|
|
|
Vacant space placed into service during the year |
(6,554,021) |
|
|
|
|
Expiring leases during the year |
5,917,179 |
|
|
|
|
||||
|
Vacant space end of year |
5,926,550 |
|
|
|
|
||||
|
Average remaining lease term* |
44 Months |
|
|
|
|
||||
* |
Includes office, industrial and retail properties. |
The Account currently anticipates leases representing approximately 16.1% of net rentable area to expire throughout 2015. Rents associated with such lease expirations are generally at or below prevailing market rents in the Account’s primary metropolitan markets.
Residential properties
The Account’s residential property investment portfolio consisted of 29 properties as of December 31, 2014, comprised of first class or luxury multi-family, garden, mid-rise, and high-rise apartment buildings. The portfolio contains approximately 9,700 units located in ten states and one located in the District of
TIAA Real Estate Account ¡ Prospectus57 |
Columbia. The portfolio was 90.1% leased as of December 31, 2014. Eleven of the residential properties in the portfolio are subject to mortgages. The complexes generally contain one to three bedroom apartment units with a range of amenities, such as patios or balconies, washers and dryers, and central air conditioning. Many of these apartment communities have on-site fitness facilities, including some with swimming pools. Rents on each of the properties tend to be comparable with competitive communities and are not subject to rent regulation. The Account is responsible for the expenses of operating its residential properties.
As of December 31, 2014, the Account’s residential properties had an aggregate fair value of approximately $3.7 billion. Set forth in Appendix B to this prospectus is a table containing detailed information regarding the residential properties in the Account’s portfolio as of December 31, 2014.
Recent transactions
The following describes property and financing transactions by the Account since February 12, 2015, the date of the Account’s most recent prospectus supplement (comprising a part of Registration Statement No. 333-194591). Except as noted, the expenses for operating the properties purchased are either borne or reimbursed, in whole or in part, by the property tenants, although the terms vary under each lease. The Account is responsible for operating expenses not reimbursed under the terms of a lease. All rental rates are quoted on an annual basis unless otherwise noted.
Sales
50 Fremont Street–San Francisco, CA
On February 12, 2015, the Account sold an office property located in San Francisco, California for a net sales price of $621.4 million. Concurrent with the sale of the property, a $200.0 million mortgage loan was extinguished.
Lion Gables Apartment Fund
On February 18, 2015, the Account’s 18.46% interest in the Lion Gables Apartment Fund was dissolved. The Account received $341.6 million as a result of the dissolution.
Concurrent with the liquidation of the Account’s interest, the Account purchased a $100.0 million 5 year convertible note in a newly formed fund, CPMG REIT, L.P. The note is convertible into units of CPMG REIT, L.P.
We value the Account’s assets as of the close of each valuation day by taking the sum of:
• |
the value of the Account’s cash, cash equivalents, and short-term and other debt instruments; |
58Prospectus ¡ TIAA Real Estate Account |
• |
the value of the Account’s other securities and other non-real estate assets; |
||
• |
the value of the individual real properties (based on the most recent valuation of that property) and other real estate-related investments owned by the Account; |
||
• |
an estimate of the net operating income accrued by the Account from its properties, other real estate-related investments and non-real estate-related investments (including short-term marketable securities) since the end of the prior valuation day; and |
||
• |
actual net operating income earned from the Account’s properties, other real estate-related investments and non-real estate-related investments (but only to the extent any such item of income differs from the estimated income accrued for on such investments), |
and then reducing the sum by the Account’s liabilities, including the daily investment management, administration and distribution fees and certain other fees and expenses attributable to operating the Account. Daily estimates of net operating income are adjusted to reflect actual net operating income on a monthly basis, at which time such adjustments (if any) are reflected in the Account’s unit value. Please see the section below entitled “Expense deductions.”
Fair value for the Account’s assets is based upon quoted market prices in active exchange markets, where available. If listed prices or quotes in such markets are not available, fair value is based upon vendor-provided, evaluated prices or internally developed models that primarily use market-based or independently sourced market data, including interest rate yield curves, market spreads, and currency rates. Valuation adjustments may be made to reflect credit quality, a counterparty’s creditworthiness, the Account’s creditworthiness, liquidity, and other observable and unobservable data that are applied consistently over time.
The methods described above are considered to produce a fair value calculation that represents a good faith estimate as to what an unaffiliated buyer in the market place would pay to purchase the asset or receive to transfer the liability. Since fair value calculations involve significant professional judgment in the application of both observable and unobservable attributes, actual realizable values or future fair values may differ from amounts reported. Furthermore, while the Account believes its valuation methods are appropriate and consistent with other market participants, the use of different methodologies or assumptions to determine the fair value of certain financial instruments, while reasonable, could result in different estimates of fair value at the reporting date.
Valuing real estate investments
Valuing Real Property: Investments in real estate properties are stated at fair value, as determined in accordance with policies and procedures reviewed by the Investment Committee of the Board and in accordance with the responsibilities of the Board as a whole. Accordingly, the Account does not record depreciation.
TIAA Real Estate Account ¡ Prospectus59 |
Fair value for real estate properties is defined as the price that would be received to sell the asset in an orderly transaction between market participants at the measurement date. Determination of fair value involves significant levels of judgment because the actual market value of real estate can be determined only by negotiation between the parties in a sales transaction. Property and investment values are affected by, among other things, the availability of capital, occupancy rates, rental rates, and interest and inflation rates. As a result, determining real estate and investment values involves many assumptions. Amounts ultimately realized from each investment may vary significantly from the market value presented. Actual results could differ from those estimates. Please see the section above entitled “Risk factors — Risks associated with real estate investing — Valuation and appraisal risks.”
In accordance with the Account’s procedures designed to comply with Fair Value Measurements and Disclosures in U.S. Generally Accepted Accounting Principles (“GAAP”), the Account values real estate properties purchased by the Account initially based on an independent appraisal at the time of the closing of the purchase, which may result in a potential unrealized gain or loss reflecting the difference between an investment’s fair value (i.e., exit price) and its cost basis (which is inclusive of transaction costs).
Subsequently, each property will be valued each quarter by an independent appraiser and the property value will be updated as appropriate. In general, the Account obtains independent appraisals of its real estate properties spread out throughout the quarter, which is intended to result in appraisal adjustments, and thus, adjustments to the valuations of its holdings (to the extent such adjustments are made), that happen regularly throughout each quarter and not on one specific day in each quarter.
Further, management reserves the right to order an appraisal and/or conduct another valuation outside of the normal quarterly process when facts or circumstances at a specific property change (for example, under certain circumstances a valuation adjustment could be made when bids are obtained for properties held for sale). The Account’s independent fiduciary, RERC, LLC oversees the Account’s entire appraisal process and, among other things, must approve all independent appraisers used by the Account. TIAA’s internal appraisal staff oversees the entire appraisal process and reviews each independent quarterly appraisal, in conjunction with the Account’s independent fiduciary, prior to the value reflected in that appraisal being recorded in the Account. Any differences in the conclusions of TIAA’s internal appraisal staff and the independent appraiser will be reviewed by the independent fiduciary, which will make a final determination on the matter (which may include ordering a subsequent independent appraisal).
Real estate appraisals are estimates of property values based on a professional’s opinion. All appraisals are performed in accordance with Uniform Standards of Professional Appraisal Practices, the real estate appraisal industry standards created by The Appraisal Foundation. Appraisals of properties held outside of the U.S. are performed in accordance with industry standards
60Prospectus ¡ TIAA Real Estate Account |
commonly applied in the applicable jurisdiction. Further, these independent appraisers (as well as TIAA’s internal appraisal staff) are always expected to be MAI-designated members of the Appraisal Institute (or its European equivalent, Royal Institute of Chartered Surveyors) and state certified appraisers from national or regional firms with relevant property type experience and market knowledge. Under the Account’s current procedures, each independent appraisal firm will be rotated off of a particular property at least every three years, although such appraisal firm may perform appraisals of other Account properties subsequent to such rotation.
We intend that the overarching principle and primary objective when valuing our real estate investments will be to produce a valuation that represents a fair and accurate estimate of the fair value of our investments. Implicit in our definition of fair value is the consummation of a sale as of a specified date and the passing of title from seller to buyer under conditions whereby:
• |
Buyer and seller are typically motivated; |
||
• |
Both parties are well informed or well advised, and acting in what they consider their best interests; |
||
• |
A reasonable time is allowed for exposure in the open market; |
||
• |
Payment is made in terms of cash or in terms of financial arrangements comparable thereto; and |
||
• |
The price represents the normal consideration for the property sold unaffected by special or creative financing or sales concessions granted by anyone associated with the sale. |
The Account’s net asset value will include the value of any note receivable (an amount that someone else owes the Account) from selling a real estate-related investment. We’ll estimate the value of the note by applying a discount rate appropriate to then-current market conditions.
Development Properties. Development properties will be carried at fair value, which is anticipated initially to equal the Account’s cost, and the value will be adjusted as additional development costs are incurred. At a minimum, once a property receives a certificate of occupancy, within one year from the initial funding by the Account, or the property is substantially leased, whichever is earlier, the property will be appraised by an independent external appraiser approved by the independent fiduciary. We may also have the properties independently appraised earlier if circumstances warrant.
Property Portfolios. The Account may, at times, value individual properties together (whether or not purchased at the same time) in a portfolio as a single asset, to the extent we believe that the property may be sold as one portfolio. The Account may also realize efficiencies in property management by pooling a number of properties into a portfolio. The value assigned to the portfolio as a whole may be more or less than the valuation of each property individually. The Account will also, from time to time, sell one or more individual properties that comprise a portfolio, with the Account retaining title to the remaining individual
TIAA Real Estate Account ¡ Prospectus61 |
properties comprising that portfolio. In such a circumstance, the Account could determine to no longer designate such remaining properties as one portfolio.
Because of the nature of real estate assets and because the fair value of our investments is not reduced by transaction costs that will be incurred to sell the investments, the Account’s net asset value won’t necessarily reflect the net realizable value of its real estate assets (i.e., what the Account would receive if it sold them). Please see the section below entitled “Valuing the Account’s assets — Valuation Adjustments.”
Valuing Real Property Subject to a Mortgage: When a real estate property is subject to a mortgage, the mortgage is valued independently of the property and its fair value is reported separately. The independent fiduciary reviews and approves all mortgage valuation adjustments before such adjustments are recorded by the Account. The Account will continue to use the revised value for each real estate property and mortgage loan payable to calculate the Account’s daily net asset value until the next valuation review or appraisal.
Valuing Mortgage Loans Receivable (i.e., the Account as a creditor): Mortgage loans receivable are stated at fair value and are initially valued at the face amount of the mortgage loan funding. Subsequently, mortgage loans receivable are valued at least quarterly based on market factors, such as market interest rates and spreads for comparable loans, the liquidity for mortgage loans of similar characteristics, the performance of the underlying collateral and the credit quality of the counterparty.
Valuing Mortgage Loans Payable (i.e., the Account as a debtor): Mortgage loans payable are stated at fair value. The estimated fair value of mortgage loans payable is generally based on the amount at which the liability could be transferred in a current transaction, exclusive of transaction costs. Fair values are estimated based on market factors, such as market interest rates and spreads on comparable loans, the liquidity for mortgage loans of similar characteristics, the performance of the underlying collateral (such as the loan-to-value ratio and the cash flow of the underlying collateral), the maturity date of the loan, the return demands of the market, and the credit quality of the Account. Different assumptions or changes in future market conditions could significantly affect estimated fair values. At times, the Account may assume debt in connection with the purchase of real estate.
Valuing Real Estate Joint Ventures: Real estate joint ventures are stated at the fair value of the Account’s ownership interests in the underlying entities. The Account’s ownership interests are valued based on the fair value of the underlying real estate, any related mortgage loans payable, and other factors, such as ownership percentage, ownership rights, buy/sell agreements, distribution provisions and capital call obligations. In addition, any restrictions on the right of the Account to transfer its ownership interest to third-parties could adversely affect the value of the Account’s interest. Upon the disposition of all real estate investments by an investee entity, the Account will continue to state its equity in the remaining net assets of the investee entity during the wind down period, if any, which occurs prior to the dissolution of the investee entity.
62Prospectus ¡ TIAA Real Estate Account |
Valuing Real Estate Limited Partnerships: Limited partnerships are stated at the fair value of the Account’s ownership in the partnership, which is based on the most recent net asset value of the partnership, as reported by the sponsor. Since market quotations are not readily available, the limited partnership interests are valued at fair value as determined in good faith under the direction of the Investment Committee of the Board and in accordance with the responsibilities of the Board as a whole. As circumstances warrant, prior to the receipt of financial statements of the limited partnership, the Account will estimate the value of its interests in good faith and will from time to time seek input from the issuer or the sponsor of the investment vehicle.
Net Operating Income: The Account usually receives operating income from its investments intermittently, not daily. In fairness to participants, we estimate the Account’s net operating income rather than applying it when we actually receive it, and assume that the Account has earned (accrued) a proportionate amount of that estimated amount daily. You bear the risk that, until we adjust the estimates when we receive actual items of income, the Account’s net assets could be under- or over-valued.
Every year, we prepare a month-by-month estimate of the revenues and expenses (estimated net operating income) for each of the Account’s properties. Each day, we add the appropriate fraction of the estimated net operating income for the month to the Account’s net asset value.
Every month, the Account receives a report of the actual operating results for the prior month for each property (actual net operating income). We then recognize the actual net operating income on the accounting records of the Account and adjust the outstanding daily accrued receivable accordingly. As the Account actually receives income from a property, we’ll adjust the daily accrued receivable and other accounts appropriately.
Valuation Adjustments: General. Management reserves the right to order an appraisal and/or conduct another valuation outside of the normal quarterly process when facts or circumstances at a specific property change. Also, the independent fiduciary can require additional appraisals if it believes a property’s value may have changed materially and such change is not reflected in the quarterly valuation review, or otherwise to ensure that the Account is valued appropriately. For example, under certain circumstances a valuation adjustment could be made when bids are obtained for properties held for sale by the Account. In addition, adjustments may be made for events or circumstances indicating an impairment of a tenant’s ability to pay amounts due to the Account under a lease (including due to a bankruptcy filing of that tenant). Also, adjustments may be made to reflect factors (such as sales values for comparable properties or local employment rate) bearing uniquely on a particular region in which the Account holds properties. We may not always be aware of each event that might require a valuation adjustment, and because our evaluation is based on subjective factors and we give different weight to different factors, we may not in all cases make a valuation adjustment where changing conditions could potentially affect the value of an investment.
TIAA Real Estate Account ¡ Prospectus63 |
Required Approvals. The independent fiduciary will need to approve adjustments to any valuation of one or more properties or real estate-related assets that:
• |
is made within three months of the annual independent appraisal, or |
||
• |
results in an increase or decrease of: |
|
||||||||||||||||||||||||||||||||||||||||||||||||||||||||||||||||||||||||||||||||||||||||||||||||||
• |
more than 6% of the value of any of the Account’s properties since the last independent annual appraisal; |
|||||||||||||||||||||||||||||||||||||||||||||||||||||||||||||||||||||||||||||||||||||||||||||||||
• |
more than 2% in the value of the Account since the prior calendar month; and/or |
|||||||||||||||||||||||||||||||||||||||||||||||||||||||||||||||||||||||||||||||||||||||||||||||||
• |
more than 4% in the value of the Account within any calendar quarter. |
|||||||||||||||||||||||||||||||||||||||||||||||||||||||||||||||||||||||||||||||||||||||||||||||||
|
||||||||||||||||||||||||||||||||||||||||||||||||||||||||||||||||||||||||||||||||||||||||||||||||||
Right to Change Valuation Methods: If we decide that a different valuation method would reflect the value of a real estate-related investment more accurately, we may use that method if the independent fiduciary consents. Changes in TIAA’s valuation methods could change the Account’s net asset value and change the values at which participants purchase or redeem Account interests.
Valuing other investments (including certain real estate-related investments)
Debt Securities: We value debt securities (excluding money market instruments) for which market quotations are readily available based on the most recent bid price or the equivalent quoted yield for such securities (or those of comparable maturity, quality and type). We derive these values utilizing an independent pricing service, such as FT Interactive Data Corp, Reuters and Bloomberg, except when we believe the prices do not accurately reflect the security’s fair value. Debt securities for which market quotations are not readily available are valued at fair value as determined in good faith by the Investment Committee of the Board and in accordance with the responsibilities of the Board as a whole.
Short-term Investments: Short-term investments are valued in the same manner as debt securities stated in the preceding paragraph.
Money Market Instruments: We value money market instruments at amortized cost.
Equity Securities: We value equity securities (including REITs) listed or traded on the New York Stock Exchange (or any of its affiliated exchanges) at their last sale price on the valuation day. If no sale is reported that day, we use the mean of the last bid and asked prices, exclusive of transaction costs. Equity securities listed or traded on any other exchange are valued in a comparable manner on the principal exchange where traded.
We value equity securities traded on the Nasdaq Stock Market at the Nasdaq Official Closing Price on the valuation day. If no sale is reported that day, we use the mean of the last bid and asked prices, exclusive of transaction costs. Other U.S. over-the-counter equity securities are valued at the mean of the last bid and asked prices.
64Prospectus ¡ TIAA Real Estate Account |
Mortgage-Backed Securities: We value mortgage-backed securities, including CMBS and RMBS, in the same manner in which we value debt securities, as described above.
Foreign Securities: To value equity and fixed income securities traded on a foreign exchange or in foreign markets, we use their closing values under the generally accepted valuation method in the country where traded, as of the valuation date. We convert this to U.S. dollars at the exchange rate in effect on the valuation day. Under certain circumstances (for example, if there are significant movements in the United States markets and there is an expectation the securities traded on foreign markets will adjust based on such movements when the foreign markets open the next day), the Account may adjust the value of equity or fixed income securities that trade on a foreign exchange or market after the foreign exchange or market has closed.
Investments Lacking Current Market Quotations: We value securities or other assets for which current market quotations are not readily available at fair value as determined in good faith under the direction of the Investment Committee of the Board and in accordance with the responsibilities of the Board as a whole. In evaluating fair value for the Account’s interest in certain commingled investment vehicles, the Account will generally look to the value periodically assigned to interests by the issuer. When possible, the Account will seek to have input in formulating the issuer’s valuation methodology.
Expense deductions are made each valuation day from the net assets of the Account for various services to manage the Account’s investments, administer the Account and the contracts, distribute the contracts and to cover certain risks borne by TIAA. Investment management, administration and distribution services are provided “at cost” by TIAA and Services. Currently, TIAA provides investment management services and administration services for the Account, and Services provides distribution services for the Account. In addition, TIAA charges the Account a fee to bear certain mortality and expense risks, and risks associated with providing the liquidity guarantee. TIAA guarantees that in the aggregate, the expense charges will never be more than 2.50% of average net assets per year.
The estimated annual expense deduction rate that appears in the expense table below reflects an estimate of the amount we currently expect to deduct to approximate the costs that the Account will incur from April 24, 2015 through April 30, 2016. Actual expenses may be higher or lower. The expenses identified
TIAA Real Estate Account ¡ Prospectus65 |
in the table below do not include any fees which may be imposed by your employer under a plan maintained by your employer.
|
|
|
|
|
Type of Expense Deduction |
Estimated |
Services Performed |
||
|
||||
Investment Management |
0.335% |
For investment advisory, investment management, portfolio accounting, custodial and similar services, including independent fiduciary and appraisal fees |
||
Administration |
0.250% |
For administration and operations of the Account and the contracts, including administrative services such as receiving and allocating premiums and calculating and making annuity payments |
||
Distribution |
0.125% |
For services and expenses associated with distributing the annuity contracts |
||
Mortality and Expense Risk |
0.005% |
For TIAA’s bearing certain mortality and expense risks |
||
Liquidity Guarantee |
0.150% |
For TIAA’s liquidity guarantee |
||
Total Annual Expense Deduction1,2 |
0.865% |
Total |
||
|
||||
1 |
TIAA guarantees that the total annual expense deduction will not exceed an annual rate of 2.50% of average net assets. |
||
2 |
Property-level expenses, including property management fees and transfer taxes, are not reflected in the table above; instead these expenses are charged directly to the Account’s properties. |
Since expenses for services provided to the Account are charged to the Account at cost, they are estimates for the year based on projected expense and asset levels. Administration charges include certain costs associated with the provision by TIAA entities of recordkeeping and other services for retirement plans and other pension products in addition to the Account. A portion of these expenses are allocated to the Account in accordance with applicable allocation procedures. In limited circumstances, TIAA may pay third parties for providing certain recordkeeping services for the Account.
At the end of every quarter, we reconcile the amount deducted from the Account during that quarter as discussed above with the expenses the Account actually incurred. If there is a difference, we add it to or deduct it from the Account in equal daily installments over the remaining days in the immediately following quarter, provided that material differences may be repaid in the current calendar quarter in accordance with GAAP. Our at-cost deductions are based on projections of Account assets and overall expenses, and the size of any adjusting payments will be directly affected by how different our projections are from the Account’s actual assets or expenses. The expenses identified in the table above do not include any fees which may be imposed by your employer under a plan maintained by your employer.
The size of the Account’s assets can be affected by many factors, including changes in the value of portfolio holdings, net income earned on the Account’s investments, premium activity and participant transfers into or out of the Account and participant cash withdrawals from the Account. In addition, our operating expenses can fluctuate based on a number of factors including participant transaction volume, operational efficiency, and technological, personnel and other infrastructure costs. Historically, the adjusting payments have resulted in both upward and downward adjustments to the Account’s expense deductions for the following quarter.
66Prospectus ¡ TIAA Real Estate Account |
The Board can revise the estimated expense rates (the daily deduction rate before the quarterly adjustment referenced above) for the Account from time to time, usually on an annual basis, to keep deductions as close as possible to actual expenses.
Currently there are no deductions from premiums, transfers or withdrawals, but we reserve the right to change this in the future. Any such deductions would only be assessed to the extent the relevant contract provided for such deductions at the time the contract was issued.
Employer plan fee withdrawals
Your employer may, in accordance with the terms of your plan, and in accordance with TIAA’s policies and procedures, withdraw amounts from your Real Estate Account accumulation under your Retirement Choice or Retirement Choice Plus contract, and, on a limited basis, under your GA, GSRA, GRA or Keogh contract, to pay fees associated with the administration of the plan. These fees are separate from the expense deductions of the Account and are not included for purposes of TIAA’s guarantee that the total annual expense deduction of the Account will not exceed 2.50% of average net assets per year.
The amount and the effective date of an employer plan fee withdrawal will be in accordance with the terms of your plan. TIAA will determine all values as of the end of the effective date. An employer plan fee withdrawal cannot be revoked after its effective date. Each employer plan fee withdrawal will be made on a pro rata basis from all your available TIAA and CREF accounts. An employer plan fee withdrawal reduces the accumulation from which it is paid by the amount withdrawn.
Certain relationships with TIAA
As noted elsewhere in this prospectus, the TIAA General Account plays a significant role in operating the Real Estate Account, including providing a liquidity guarantee and investment advisory, administration and other services. In addition, Services, a wholly owned subsidiary of TIAA, provides distribution services for the Account.
Liquidity Guarantee. As noted above under the section entitled “Establishing and managing the Account — The role of TIAA — Liquidity guarantee,” if the Account’s liquid assets and its cash flow from operating activities and participant transactions are insufficient to fund redemption requests, the TIAA General Account has agreed to purchase liquidity units. TIAA thereby guarantees that a participant can redeem accumulation units at their net asset value next determined.
In the years ended December 31, 2008 and December 31, 2009, TIAA purchased liquidity units in a number of separate transactions at a purchase price equal to $155.6 million and approximately $1.1 billion, respectively. Since January 1, 2010 and through the date of this prospectus, the TIAA General Account has purchased no additional liquidity units. These liquidity units are
TIAA Real Estate Account ¡ Prospectus67 |
valued in the same manner as are accumulation units held by the Account’s participants.
For the years ended December 31, 2014, December 31, 2013 and December 31, 2012, the Account expensed $29.2 million, $30.5 million and $31.3 million, respectively, for this liquidity guarantee from TIAA through a daily deduction from the net assets of the Account.
Investment Advisory, Administration and Distribution Services/Mortality and Expense Risks Borne by TIAA. As noted above under the section entitled “Expense deductions”, deductions are made each valuation day from the net assets of the Account for various services required to manage investments, administer the Account and distribute the contracts. These services are performed at cost by TIAA and Services. Deductions are also made each valuation day to cover mortality and expense risks borne by TIAA.
For the years ended December 31, 2014, December 31, 2013 and December 31, 2012, the Account expensed $70.7 million, $59.3 million and $56.3 million, respectively, for investment advisory services and $0.9 million, $0.8 million and $2.8 million, respectively, for mortality and expense risks provided/borne by TIAA. For the same period, the Account expensed $62.2 million, $54.5 million and $46.3 million, respectively, for administrative and distribution services provided by TIAA and Services, as applicable.
The Account is party to various claims and routine litigation arising in the ordinary course of business. As of the date of this prospectus, management of the Account does not believe that the results of any such claims or litigation, individually or in the aggregate, will have a material effect on the Account’s business, financial position or results of operations.
68Prospectus ¡ TIAA Real Estate Account |
The following selected financial data should be considered in conjunction with the Account’s consolidated financial statements and notes provided in this prospectus (amounts in millions except for per accumulation unit amounts).
|
|
|
|
|
|
|
|
|
|
|
|||||||||||||||||||||||||
|
|
Years Ended December 31, |
||||||||||||||||||||||||||||||||||
2014 |
2013 |
2012 |
2011 |
2010 |
|||||||||||||||||||||||||||||||
|
|||||||||||||||||||||||||||||||||||
|
Investment income: |
|
|
|
|
|
|
|
|
|
|
|||||||||||||||||||||||||
|
Real estate income, net |
|
|
$ |
|
457.0 |
|
|
$ |
|
391.0 |
|
|
$ |
|
388.7 |
|
|
$ |
|
435.6 |
|
|
$ |
|
421.1 |
||||||||||
|
Income from real estate joint ventures and limited partnerships |
|
|
148.1 |
|
|
104.7 |
|
|
80.9 |
|
|
86.4 |
|
|
89.3 |
||||||||||||||||||||
|
Dividends and interest |
|
|
47.7 |
|
|
45.1 |
|
|
35.3 |
|
|
22.4 |
|
|
8.6 |
||||||||||||||||||||
|
|||||||||||||||||||||||||||||||||||
|
Total investment income |
|
|
652.8 |
|
|
540.8 |
|
|
504.9 |
|
|
544.4 |
|
|
519.0 |
||||||||||||||||||||
|
Expenses |
|
|
163.0 |
|
|
145.1 |
|
|
136.7 |
|
|
121.3 |
|
|
95.8 |
||||||||||||||||||||
|
|||||||||||||||||||||||||||||||||||
|
Investment income, net |
|
|
489.8 |
|
|
395.7 |
|
|
368.2 |
|
|
423.1 |
|
|
423.2 |
||||||||||||||||||||
|
Net realized and unrealized gains on investments and mortgage loans payable |
|
|
1,628.4 |
|
|
1,060.2 |
|
|
1,011.2 |
|
|
1,076.0 |
|
|
757.0 |
||||||||||||||||||||
|
|||||||||||||||||||||||||||||||||||
|
Net increase in net assets resulting from operations |
|
|
2,118.2 |
|
|
1,455.9 |
|
|
1,379.4 |
|
|
1,499.1 |
|
|
1,180.2 |
||||||||||||||||||||
|
Participant transactions |
|
|
802.9 |
|
|
916.3 |
|
|
894.8 |
|
|
1,225.0 |
|
|
1,743.0 |
||||||||||||||||||||
|
TIAA redemption of Liquidity Units |
|
|
— |
|
|
(325.4 |
) |
|
|
|
(940.3 |
) |
|
|
|
— |
|
|
— |
||||||||||||||||
|
|||||||||||||||||||||||||||||||||||
|
Net increase in net assets |
|
|
$ |
|
2,921.1 |
|
|
$ |
|
2,046.8 |
|
|
$ |
|
1,333.9 |
|
|
$ |
|
2,724.1 |
|
|
$ |
|
2,923.2 |
||||||||||
|
|||||||||||||||||||||||||||||||||||
|
|
|
|
|
|
|
|
|
|
|
|||||||||||||||||||||||||
|
|
Years Ended December 31, |
||||||||||||||||||||||||||||||||||
2014 |
2013 |
2012 |
2011 |
2010 |
|||||||||||||||||||||||||||||||
|
|||||||||||||||||||||||||||||||||||
|
Total assets |
|
|
$ |
|
22,408.7 |
|
|
$ |
|
19,417.1 |
|
|
$ |
|
17,378.6 |
|
|
$ |
|
15,749.9 |
|
|
$ |
|
12,839.9 |
||||||||||
|
Total liabilities |
|
|
2,579.7 |
|
|
2,509.2 |
|
|
2,517.5 |
|
|
2,222.7 |
|
|
2,036.8 |
||||||||||||||||||||
|
|||||||||||||||||||||||||||||||||||
|
Total net assets |
|
|
$ |
|
19,829.0 |
|
|
$ |
|
16,907.9 |
|
|
$ |
|
14,861.1 |
|
|
$ |
|
13,527.2 |
|
|
$ |
|
10,803.1 |
||||||||||
|
|||||||||||||||||||||||||||||||||||
|
Number of per accumulation unit amounts |
|
|
57.9 |
|
|
55.3 |
|
|
53.3 |
|
|
53.4 |
|
|
48.1 |
||||||||||||||||||||
|
|||||||||||||||||||||||||||||||||||
|
Net asset value, per accumulation unit |
|
|
$ |
|
335.393 |
|
|
$ |
|
298.872 |
|
|
$ |
|
272.569 |
|
|
$ |
|
247.654 |
|
|
$ |
|
219.173 |
||||||||||
|
|||||||||||||||||||||||||||||||||||
|
Mortgage loans payable |
|
|
$ |
|
2,373.8 |
|
|
$ |
|
2,279.1 |
|
|
$ |
|
2,282.6 |
|
|
$ |
|
2,028.2 |
|
|
$ |
|
1,860.2 |
||||||||||
|
|||||||||||||||||||||||||||||||||||
TIAA Real Estate Account ¡ Prospectus69 |
Quarterly selected financial information
The following quarterly selected unaudited financial data for each full quarter of 2014 and 2013 are derived from the consolidated financial statements of the Account for the years ended December 31, 2014 and 2013 (amounts in millions).
|
|
|
|
|
|
|
|
|
|
|
|||||||||||||||||||||||||
|
|
2014 |
Year Ended |
|||||||||||||||||||||||||||||||||
For the Three Months Ended |
|||||||||||||||||||||||||||||||||||
March 31 |
June 30 |
September 30 |
December 31 |
||||||||||||||||||||||||||||||||
|
|||||||||||||||||||||||||||||||||||
|
Investment income, net |
|
|
$ |
|
106.9 |
|
|
$ |
|
128.5 |
|
|
$ |
|
124.7 |
|
|
$ |
|
129.7 |
|
|
$ |
|
489.8 |
||||||||||
|
Net realized and unrealized gain on investments and mortgage loans payable |
|
|
289.1 |
|
|
457.5 |
|
|
303.2 |
|
|
578.6 |
|
|
1,628.4 |
||||||||||||||||||||
|
|||||||||||||||||||||||||||||||||||
|
Net increase in net assets resulting from operations |
|
|
$ |
|
396.0 |
|
|
$ |
|
586.0 |
|
|
$ |
|
427.9 |
|
|
$ |
|
708.3 |
|
|
$ |
|
2,118.2 |
||||||||||
|
|||||||||||||||||||||||||||||||||||
|
Total return |
|
|
2.33 |
% |
|
|
|
3.32 |
% |
|
|
|
2.32 |
% |
|
|
|
3.73 |
% |
|
|
|
12.22 |
% |
|
||||||||||
|
|||||||||||||||||||||||||||||||||||
|
|
|
|
|
|
|
|
|
|
|
|||||||||||||||||||||||||
|
|
2013 |
Year Ended |
|||||||||||||||||||||||||||||||||
For the Three Months Ended |
|||||||||||||||||||||||||||||||||||
March 31 |
June 30 |
September 30 |
December 31 |
||||||||||||||||||||||||||||||||
|
|||||||||||||||||||||||||||||||||||
|
Investment income, net |
|
|
$ |
|
84.1 |
|
|
$ |
|
98.0 |
|
|
$ |
|
91.4 |
|
|
$ |
|
122.2 |
|
|
$ |
|
395.7 |
||||||||||
|
Net realized and unrealized gain on investments and mortgage loans payable |
|
|
196.1 |
|
|
287.9 |
|
|
430.5 |
|
|
145.7 |
|
|
1,060.2 |
||||||||||||||||||||
|
|||||||||||||||||||||||||||||||||||
|
Net increase in net assets resulting from operations |
|
|
$ |
|
280.2 |
|
|
$ |
|
385.9 |
|
|
$ |
|
521.9 |
|
|
$ |
|
267.9 |
|
|
$ |
|
1,455.9 |
||||||||||
|
|||||||||||||||||||||||||||||||||||
|
Total return |
|
|
1.88 |
% |
|
|
|
2.54 |
% |
|
|
|
3.29 |
% |
|
|
|
1.62 |
% |
|
|
|
9.65 |
% |
|
||||||||||
|
|||||||||||||||||||||||||||||||||||
70Prospectus ¡ TIAA Real Estate Account |
Management’s discussion and analysis of the Account’s financial condition and results of operations
The following discussion and analysis of our financial condition and results of operations should be read together with our consolidated financial statements and notes contained in this prospectus and with consideration to the sub-section entitled “Forward-Looking Statements,” which begins below, and the section above entitled “Risk factors.” The past performance of the Account is not indicative of future results.
Forward-looking statements
Some statements in this prospectus which are not historical facts may be “forward-looking statements” within the meaning of Section 27A of the Securities Act of 1933, Section 21E of the Securities Exchange Act of 1934 and the Private Securities Litigation Reform Act of 1995. Forward-looking statements include statements about management’s expectations, beliefs, intentions or strategies for the future, include the assumptions and beliefs underlying these forward-looking statements, and are based on current expectations, estimates and projections about the real estate industry, domestic and global economic conditions, including conditions in the credit and capital markets, the sectors, and markets in which the Account invests and operates, and the transactions described in this prospectus. While management believes the assumptions underlying any of its forward-looking statements and information to be reasonable, such information may be subject to uncertainties and may involve certain risks which may be difficult to predict and are beyond management’s control. These risks and uncertainties could cause actual results to differ materially from those contained in any forward-looking statement. These risks and uncertainties include, but are not limited to, the following:
• |
Acquiring and Owning Real Estate: The risks associated with acquiring and owning real property, including general economic and real estate market conditions, the availability of, and economic cost associated with, financing the Account’s properties, the risk that the Account’s properties become too concentrated (whether by geography, sector or by tenant mix), competition for acquiring real estate properties, leasing risk (including tenant defaults) and the risk of uninsured losses at properties (including due to terrorism, natural disasters, and acts of violence); |
||
• |
Selling Real Estate: The risk that the sales price of a property might differ, perhaps significantly, from its estimated or appraised value, leading to losses or reduced profits to the Account, the risk that the Account might not be able to sell a property at a particular time for a price which management believes represents its fair or full value, the risk of a lack of availability of financing (for potential purchasers of the Account’s properties), risks associated with disruptions in the credit and capital markets, and the risk |
TIAA Real Estate Account ¡ Prospectus71 |
|
that the Account may be required to make significant expenditures before the Account is able to market and/or sell a property; |
||
• |
Valuation: The risks associated with property valuations, including the fact that appraisals can be subjective in a number of respects and the fact that the Account’s appraisals are generally obtained on a quarterly basis and there may be periods in between appraisals of a property during which the value attributed to the property for purposes of the Account’s daily accumulation unit value may be more or less than the actual realizable value of the property; |
||
• |
Borrowing: Risks associated with financing the Account’s properties, including the risk of default on loans secured by the Account’s properties (which could lead to foreclosure), the risk associated with high loan to value ratios on the Account’s properties (including the fact that the Account may have limited, or no net value in such a property), the risk that significant sums of cash could be required to make principal and interest payments on the loans and the risk that the Account may not have the ability to obtain financing or refinancing on favorable terms (or at all), which may be aggravated by general disruptions in credit and capital markets; |
||
• |
Participant Transactions and Cash Management: Investment risk associated with participant transactions, in particular that (i) significant net participant transfers out of the Account may impair our ability to pursue or consummate new investment opportunities that are otherwise attractive to the Account and/or may result in sales of real estate-related assets to generate liquidity, (ii) significant net participant transfers into the Account may result, on a temporary basis, in our cash holdings and/or holdings in liquid real estate-related investments exceeding our long-term targeted holding levels and (iii) high levels of cash in the Account during times of appreciating real estate values can impair the Account’s overall return; |
||
• |
Joint Venture Investments: The risks associated with joint venture partnerships, including the risk that a co-venturer may have interests or goals inconsistent with that of the Account, that a co-venturer may have financial difficulties, and the risk that the Account may have limited rights with respect to operation of the property and transfer of the Account’s interest; |
||
• |
Regulatory Matters: Uncertainties associated with environmental liability and regulations and other governmental regulatory matters such as zoning laws, rent control laws, and property taxes; |
||
• |
Foreign Investments: The risks associated with purchasing, owning and disposing foreign investments (primarily real estate properties), including political risk, the risk associated with currency fluctuations (whether hedged or not), regulatory and taxation risks and risks of enforcing judgments; |
||
• |
Conflicts of Interest: Conflicts of interest associated with TIAA serving as investment manager of the Account and provider of the liquidity guarantee at the same time as TIAA and its affiliates are serving as an investment manager to other real estate accounts or funds, including conflicts |
72Prospectus ¡ TIAA Real Estate Account |
|
associated with satisfying its fiduciary duties to all such accounts and funds associated with purchasing, selling and leasing of properties; |
||
• |
Required Property Sales: The risk that, if TIAA were to own too large a percentage of the Account’s accumulation units through funding the liquidity guarantee (as determined by the independent fiduciary), the independent fiduciary could require the sales of properties to reduce TIAA’s ownership interest, which sales could occur at times and at prices that depress the sale proceeds to the Account; |
||
• |
Government and Government Agency Securities: Risks associated with investment securities issued by U.S. government agencies and U.S. government-sponsored entities, including the risk that the issuer may not have their securities backed by the full faith and credit of the U.S. government, and that transaction activity may fluctuate significantly from time to time, which could negatively impact the value of the securities and the Account’s ability to dispose of a security at a favorable time; and |
||
• |
Liquid Assets and Securities: Risks associated with investments in real estate-related liquid assets (which could include, from time to time, REIT securities and CMBS), and non-real estate-related liquid assets, including: |
• |
Financial/credit risk — Risks that the issuer will not be able to pay principal and interest when due or that the issuer’s earnings will fall; |
||
• |
Market volatility risk — Risk that the changing conditions in financial markets may cause the Account’s investments to experience price volatility; |
||
• |
Interest rate volatility risk — Risk that interest rate volatility may affect the Account’s current income from an investment; and |
||
• |
Deposit/money market risk — Risks that the Account could experience losses if banks fail. |
More detailed discussions of certain of these risk factors are contained in the section of this prospectus entitled “Risk factors” and in this section below and also in the section entitled “Quantitative and qualitative disclosures about market risk,” that could cause actual results to differ materially from historical experience or management’s present expectations.
Caution should be taken not to place undue reliance on management’s forward-looking statements, which represent management’s views only as of the date that this prospectus is filed. Neither management nor the Account undertake any obligation to update publicly or revise any forward-looking statement, whether as a result of new information, changed assumptions, future events or otherwise.
Commercial real estate market statistics discussed in this section are obtained by the Account from sources that management considers reliable, but some of the data are preliminary for the year or quarter ended December 31, 2014 and may be subsequently revised. Prior period data may have been adjusted to reflect updated calculations. Investors should not rely exclusively on the data presented below in forming a judgment regarding the current or prospective performance of the commercial real estate market generally.
TIAA Real Estate Account ¡ Prospectus73 |
2014 U.S. economic and commercial real estate overview
The Account invests primarily in high-quality, core real estate in order to meet its investment objective of obtaining favorable long-term returns through rental income and the appreciation of its real estate holdings.
Economic and capital markets overview and outlook
Recent trends in key U.S. economic indicators are summarized in the table below. U.S. Gross Domestic Product (“GDP”) grew by 2.6% in the fourth quarter of 2014 following growth of 4.6% and 5.0% in the second and third quarters of 2014, respectively. While fourth quarter growth came in below economists’ expectations, consumer spending, a primary driver of economic growth, grew 4.3% following growth of 3.2% in the third quarter. Other contributors to growth included residential investment, business inventory growth, and exports, which were consistent with growth drivers in the second and third quarters. However, an increase in imports, a modest decline in non-residential investment, and a decline in federal government defense spending reduced overall GDP growth. For 2014 as a whole, GDP grew by 2.4% which was the strongest annual growth in the U.S. economy in four years. Economic activity was characterized by a pickup in employment growth, industrial production, and consumer spending over the course of the year and is expected to sustain GDP growth in 2015.
ECONOMIC INDICATORS*
|
|
|
|
|
|
|
|
|
|
|
|
|
|
|
|
|
2014 |
1Q 2014 |
2Q 2014 |
3Q 2014 |
4Q 2014 |
Forecast |
||||||||
2015 |
2016 |
|||||||||||||
|
||||||||||||||
|
Economy(1) |
|
|
|
|
|
|
|
|
|
|
|
|
|
|
|
Gross Domestic Product (GDP) |
2.4% |
-2.1% |
4.6% |
5.0% |
2.6% |
3.2% |
2.9% |
|||||||
|
Employment Growth (Thousands) |
3,116 |
579 |
852 |
712 |
973 |
3,300 |
3,500 |
|||||||
|
Unemployment Rate |
6.2% |
6.6% |
6.1% |
5.9% |
5.6% |
5.4% |
5.0% |
|||||||
|
Interest Rates(2) |
|
|
|
|
|
|
|
|
|
|
|
|
|
|
|
10 Year Treasury |
2.5% |
2.8% |
2.6% |
2.5% |
2.3% |
2.4% |
3.2% |
|||||||
|
||||||||||||||
Sources: BEA, BLS, Federal Reserve, Blue Chip Consensus Forecasts, and Moody’s Analytics
* |
Data subject to revision |
||
(1) |
GDP growth rates are annual rates. Quarterly unemployment rates are the reported value for the final month of the quarter while average annual values represent a twelve-month average. |
||
(2) |
The Treasury rates are an average over the stated time period. |
Following its January 27–28, 2015 meeting, the Federal Open Market Committee (“FOMC”) released a statement noting that the economy continued to expand at a moderate pace due to strengthening of labor market conditions and rising levels of household spending. The FOMC also “reaffirmed its view that the current 0 to 0.25% target range for the federal funds rate remains appropriate.” Further, the FOMC “judges that it can be patient in beginning to normalize the stance of monetary policy” and that “it likely will be appropriate to maintain the 0 to 0.25% target range for a considerable time.” Despite market expectations that the Fed will ultimately raise interest rates in 2015, yields on ten year Treasuries declined during the fourth quarter and fell below 2.0% in January 2015, due to concerns about slowing global growth.
74Prospectus ¡ TIAA Real Estate Account |
Blue Chip economists expect the healthy growth of 2014 to continue through 2015. GDP is expected to grow by 3.2% in 2015, driven by steady growth in consumer spending and stronger employment growth. Consumers will benefit from the recent sharp decline in oil prices which Moody’s Analytics estimates will put an extra $100 billion in consumers’ pockets during 2015. Stronger employment growth in 2015 is expected to push the unemployment rate down further and ultimately lead to meaningful wage growth as labor market conditions tighten. While the housing market moderated in 2014, home sales and housing construction are expected to pick up in 2015 as Fannie Mae and Freddie Mac relax lending standards. Improvement in the housing market would generate ancillary economic benefits due to increases in construction employment and household spending on home furnishings and home improvements. While domestic forces are supportive of stronger growth, concerns about a slowdown in the global economy escalated during the fourth quarter. Markets became concerned about slowing growth in China, Japan and Europe along with the implications for the export-based economies of emerging markets. These concerns caused major stock indices to tumble in December 2014, including a 5% decline in the S&P 500 in a one week period. Markets have remained volatile thus far in 2015 as investors remain skittish. The European Central Bank’s recent announcement of plans to begin purchasing €60 billion per month of public and private bonds through September 2016 has spurred hopes that its “quantitative easing” program will stimulate the sluggish European economy. For the U.S. economy, weaker global growth does not substantially affect near term prospects, although weaker global growth and the recent surge in the value of the dollar would slow exports and growth in the manufacturing sector.
An increase in interest rates could also dampen growth. While the FOMC expects that “it likely will be appropriate to maintain the 0 to 1/4% target range for a considerable time,” the majority of economists responding to the Blue Chip survey expect the FOMC to start raising the federal funds rate in the latter half of 2015. However, increases in the fed funds rate during 2015 are expected to be relatively modest with the midpoint of the fed funds rate target anticipated to be 1.0% as of year-end 2015 as compared with 0.125% currently. Though growth may moderate if the FOMC raises interest rates, growth would still be healthy with the economy benefitting from the recent decline in oil prices which Blue Chip economists expect to boost 2015 GDP growth by 0.25%.
With GDP growth of 3.2% expected in 2015 and employment projected to grow by 3.3 million, economic conditions would be in line with the inherent growth potential of the U.S. economy. Growth of this magnitude, in turn, would provide support for further improvement in commercial real estate market conditions.
TIAA Real Estate Account ¡ Prospectus75 |
Real estate market conditions and outlook
Industry sources such as CB Richard Ellis Econometric Advisors calculate vacancy based on square footage. In keeping with industry standards, the Account’s vacancy data is calculated as a percentage of net rentable space leased, weighted by square footage that is under contractual lease obligation in effect at the end of the period.
Commercial real estate markets and sales activity remained strong during the fourth quarter of 2014. Tenant demand for space remained at or above third quarter levels across the nation. Construction has increased from the lows of recent years but remains moderate and real estate market fundamentals continued to improve across all sectors. Sales of office, industrial, retail, multi-family, and other commercial properties totaled $110 billion in the fourth quarter, up from $105 billion in third quarter 2014 and $96 billion in the fourth quarter of 2013. Sales for 2014 as a whole totaled an estimated $367 billion, a 16% increase compared to 2013.
Green Street Advisors’ Commercial Property Price Index (“CPPI”) increased 2.8% during the fourth quarter of 2014 compared with a gain of 2.1% in the third quarter of 2014. For 2014 as a whole, the CPPI increased 10% as property values benefited from stronger economic growth, improving property market fundamentals, and robust investor demand. In its December 2014 report, Green Street Advisors noted, “values across all major property sectors are now above the then-peak levels reached in 2007.”
The NAREIT All Equity REIT index return was 12.9% during the fourth quarter of 2014 following a decline of 2.5% in the third quarter of 2014. Despite the increase, Green Street Advisors concluded in its January 5, 2015 Real Estate Securities Monthly that REIT prices were “fairly valued” based on a comparison of current and prospective REIT yields and returns with those of private real estate as well as fixed income investments like corporate and high-yield bonds.
Commercial property returns were positive for the twentieth consecutive quarter during the fourth quarter of 2014. For the quarter ending December 31, 2014, NCREIF Fund Index Open-End Diversified Core Equity (“NFI-ODCE”) equal weight returns net of fees were 2.88%, consisting of a 0.97% income return and a 1.91% capital return. By comparison, the total return for third quarter 2014 was 3.24%. The NFI-ODCE is a leveraged fund-level return index which includes property investments at ownership share, cash balances, and other investments.
Data for the Account’s top five markets in terms of market value as of December 31, 2014 are provided in the following table. These markets represent 54.9% of the Account’s total real estate portfolio.
76Prospectus ¡ TIAA Real Estate Account |
|
|
|
|
|
|
|
|
|
Top 5 Metro Areas by Fair Market Value |
Account % |
Number of |
Metro Area |
Metro Area |
||||
|
||||||||
|
Washington-Arlington-Alexandria, |
78.7% |
14 |
16.3% |
11.9% |
||||
|
New York-White Plains-Wayne, NY-NJ |
95.4% |
8 |
12.2% |
8.9% |
||||
|
Los Angeles-Long Beach-Glendale, CA |
93.5% |
13 |
10.3% |
7.5% |
||||
|
San Francisco-San Mateo-Redwood City, CA |
92.2% |
7 |
9.2% |
6.7% |
||||
|
Boston-Quincy, MA |
81.7% |
4 |
6.9% |
5.0% |
||||
|
||||||||
* |
Weighted by fair market value, which differs from the calculations provided for market comparisons to CBRE-EA data and are used here to reflect the fair market value of the Account’s monetary investments in those markets. |
The market value weighted occupancy in certain top markets may vary from quarter to quarter due to the Account’s investment strategy of selectively acquiring recently constructed properties that may be vacant or in their initial lease-up phase when acquired. This investment strategy provides the Account with greater opportunity to access properties in prime locations in major metropolitan areas which have exceptional long term prospects and which management expects will lease at a steady pace given local market conditions. In the case of the Washington DC metro, the value weighted occupancy of properties located there is lower in large part because of two newly constructed apartment properties and one recently constructed industrial property that were vacant when acquired and are now in their initial lease-up phase. In Boston, the percentage leased does not include recent leases at one of the Account’s properties that have been executed but the space is not yet occupied by the new tenants.
Office
According to CB Richard Ellis Econometric Advisors (“CBRE-EA”), the national office vacancy rate declined to 13.9% in the fourth quarter of 2014 as compared to 14.1% in the third quarter of 2014. The national office vacancy rate, which started the year at 14.9%, declined over the course of 2014 as the U.S. economy gained momentum. Office market fundamentals have strengthened as modest levels of construction, coupled with stronger demand and declining vacancies, generated average rent growth of 4.5% in 2014.
The vacancy rate for the Account’s office portfolio declined to 10.4% as of fourth quarter 2014 as compared with 11.0% in the third quarter of 2014. As shown in the table below, the average vacancy rate of the Account’s properties in four of its top five markets were at or below their respective market averages. In Washington DC, the Account’s top office market, the average vacancy rate of the Account’s properties remained elevated but below the market average at 14.4% as leasing activity remained slow due in part to weaker leasing from federal government agencies related to cutbacks in government spending. The average vacancy of the Account’s properties in Boston also remained elevated at 17.5%; however, the current vacancy rate does not include recent leases at one of the Account’s properties that have been executed but the space is not yet occupied
TIAA Real Estate Account ¡ Prospectus77 |
by new tenants, which would reduce the vacancy rate to 10.6%. The vacancy rate of the Account’s New York properties declined to 7.0% due to a recent acquisition which was 98% leased and additional leasing at the Account’s existing property.
|
|
|
|
|
|
|
|
|
|
|
|
|
|
|
|||||
Sector |
Metropolitan Area |
Total Sector by |
% of Total |
Account |
Market Vacancy* |
||||||||||||||
2014Q4 |
2014Q3 |
2014Q4 |
2014Q3 |
||||||||||||||||
|
|||||||||||||||||||
Office |
Account/Nation |
10.4% |
11.0% |
13.9% |
14.1% |
||||||||||||||
|
|||||||||||||||||||
1 |
Washington-Arlington-Alexandria, DC-VA-MD-WV |
|
|
$ |
|
1,497.5 |
6.8% |
14.4% |
14.1% |
16.3% |
16.1% |
||||||||
2 |
San Francisco-San Mateo-Redwood City, CA |
|
|
$ |
|
1,269.6 |
5.7% |
6.3% |
8.0% |
7.3% |
7.7% |
||||||||
3 |
Boston-Quincy, MA |
|
|
$ |
|
1,077.9 |
4.9% |
17.5% |
17.1% |
10.7% |
11.2% |
||||||||
4 |
New York-White Plains-Wayne, NY-NJ |
|
|
$ |
|
652.0 |
2.9% |
7.0% |
16.8% |
8.8% |
8.5% |
||||||||
5 |
Seattle-Bellevue-Everett, WA |
|
|
$ |
|
630.0 |
2.8% |
5.5% |
5.5% |
11.0% |
11.4% |
||||||||
|
|||||||||||||||||||
* |
Source: CBRE-EA. |
Historically, the financial services sector has been a significant source of office space demand; however, demand collapsed in the wake of the Great Recession. More recently, new industry regulations have slowed companies’ hiring and the need for additional space. However, demand may soon increase, as the financial services sector added 35,000 jobs in the fourth quarter and 120,000 in 2014 as a whole. Professional and business services have also been a significant source of demand and particularly over the past year as the sector added 190,000 jobs in the fourth quarter and 730,000 in all of 2014. One exception within the sector has been legal services where employment is growing slowly and firms are economizing on space by reducing per employee space allocations and eliminating conference rooms and libraries, a law industry trend which is likely to persist through 2015 and beyond. While employee space standards for all office users have declined slowly in recent years, law firms had traditionally had more generous space allocations both for employees and ancillary space. Demand from traditional office users has been supplemented by robust demand from technology, media and entertainment companies in markets such as San Francisco, Seattle, and New York, where rent growth surpassed the national average in 2014. Houston has benefited from growth in energy-related industries but the recent sharp decline in the price of oil is likely to reduce space demand from energy companies in the near term. On the whole, continued improvement in office market conditions during 2015 appears likely given recent employment and office employment growth trends.
Industrial
Industrial market conditions are influenced to a large degree by growth in GDP, industrial production and international trade flows. U.S. industrial market conditions continued to improve in the fourth quarter due to ongoing growth in
78Prospectus ¡ TIAA Real Estate Account |
U.S. GDP and industrial production coupled with healthy global trade flows. During the fourth quarter of 2014, the national industrial availability rate fell to 10.3% as compared to 10.5% in the third quarter of 2014. The national industrial availability rate has declined steadily from its peak of 14.5% in the third quarter of 2010 and national rent growth improved to 4.8% in 2014. Coastal port markets continued to benefit from the growth in trade, though market conditions in major inland markets like Atlanta, Chicago and Dallas have also improved significantly. The steady improvement in industrial market fundamentals resulted in average rent growth of 4.8% nationally in 2014. Top coastal markets like Riverside, Seattle and New York recorded double digit rent growth.
The vacancy rate for the Account’s industrial property portfolio averaged 12.4% in the fourth quarter of 2014, up from 11.5% in the third quarter. The vacancy rate increased in large part due to the two recent acquisitions which at the time of acquisition were in their initial lease-up. These two investments are newly constructed, high quality properties in top industrial markets with strong long term growth prospects. Excluding these two properties, the vacancy rate of the Account’s industrial property portfolio averaged 9.9%. As shown in the following table, the vacancy rate of the Account’s properties in three of its top five industrial markets remained below their respective market averages. In Riverside, the Account’s top market, the average vacancy rate of the Account’s properties averaged 6.1%. Excluding a recently constructed property that was vacant when acquired, all of the space in the Account’s other Riverside properties remained fully leased. The average vacancy rate in the Account’s Dallas properties increased to 5.1% due to the loss of a large tenant. Marketing of the space to prospective tenants has begun. The average vacancy rate in the Account’s Ft. Lauderdale properties remained elevated due to space vacated by a large tenant. The space has been subdivided and is being marketed to accommodate moderate-sized tenants that are prevalent in the market.
|
|
|
|
|
|
|
|
|
|
|
|
|
|
|
|||||
Sector |
Metropolitan Area |
Total Sector by |
% of Total |
Account |
Market Vacancy* |
||||||||||||||
2014Q4 |
2014Q3 |
2014Q4 |
2014Q3 |
||||||||||||||||
|
|||||||||||||||||||
Industrial |
Account/Nation |
12.4% |
11.5% |
10.3% |
10.5% |
||||||||||||||
|
|||||||||||||||||||
1 |
Riverside-San Bernardino-Ontario, CA |
|
|
$ |
|
678.2 |
3.1% |
6.1% |
6.1% |
7.8% |
8.3% |
||||||||
2 |
Los Angeles-Long Beach-Glendale, CA |
|
|
$ |
|
240.7 |
1.1% |
2.3% |
4.6% |
5.5% |
5.7% |
||||||||
3 |
Tacoma, WA |
|
|
$ |
|
227.1 |
1.0% |
7.6% |
3.6% |
6.7% |
7.2% |
||||||||
4 |
Dallas-Plano-Irving, TX |
|
|
$ |
|
225.0 |
1.0% |
5.1% |
0.0% |
10.3% |
10.1% |
||||||||
5 |
Fort Lauderdale-Pompano Beach-Deerfield Beach, FL |
|
|
$ |
|
165.8 |
0.7% |
16.2% |
16.2% |
10.5% |
11.0% |
||||||||
|
|||||||||||||||||||
* |
Source: CBRE-EA. |
TIAA Real Estate Account ¡ Prospectus79 |
Multi-family
U.S. apartment markets remained tight. The national vacancy rate averaged 4.4% in the fourth quarter as compared with 4.3% in the third quarter. Rents grew steadily over the course of 2014, with the strongest growth occurring in metro areas with sizeable technology sectors, such as Denver, San Francisco and San Jose. Construction has picked up nationally but markets readily absorbed the new supply in 2014. However, additional supply is slated to be delivered in 2015 and rent growth is expected to moderate, in response, over the near term. Nonetheless, apartment market prospects remain promising due to favorable demographic trends and strengthening employment growth.
The vacancy rate of the Account’s multi-family portfolio averaged 9.9% in the fourth quarter of 2014 as compared with 10.2% in the third quarter. The portfolio vacancy rate is above the national average in large part due to the recent acquisition of two newly constructed properties in Washington, DC. Excluding these two properties, the vacancy rate of the Account’s portfolio averaged 7.2%. The average vacancy rate of the Account’s properties in Washington, DC, was 23.8% but 6.7% excluding these recent acquisitions. The two properties are currently in the initial lease-up stage and 85 units were leased during the quarter, bringing their average occupancy rate to 38%. In New York, the average vacancy rate of the Account’s properties declined to 6.2% due to the completion of the first phase of a renovation program at one of the properties and the releasing of those units. The renovation program, which required vacating several floors and combining units to create larger apartments, resulted in significant rent increases for new units. Additional unit renovations are planned in 2015. In Los Angeles, the average vacancy rate of properties owned by the Account remained above the market average at 7.8% due in part to ongoing renovation programs at two of the properties which requires units to be vacant for 30 days or more while renovations are completed and units are re-leased. The increase in the vacancy rate of the Account’s Houston properties was largely due to new construction being delivered to the market.
|
|
|
|
|
|
|
|
|
|
|
|
|
|
|
|||||
Sector |
Metropolitan Area |
Total Sector by |
% of Total |
Account |
Market Vacancy* |
||||||||||||||
2014Q4 |
2014Q3 |
2014Q4 |
2014Q3 |
||||||||||||||||
|
|||||||||||||||||||
Apartment |
Account/Nation |
9.9% |
10.2% |
4.4% |
4.3% |
||||||||||||||
|
|||||||||||||||||||
1 |
New York-White Plains-Wayne, NY-NJ |
|
|
$ |
|
790.8 |
3.6% |
6.2% |
9.1% |
5.4% |
5.3% |
||||||||
2 |
Washington-Arlington-Alexandria, DC-VA-MD-WV |
|
|
$ |
|
785.3 |
3.5% |
23.8% |
28.9% |
4.8% |
4.3% |
||||||||
3 |
Los Angeles-Long Beach-Glendale, CA |
|
|
$ |
|
514.5 |
2.3% |
7.8% |
7.3% |
2.9% |
3.0% |
||||||||
4 |
Denver-Aurora, CO |
|
|
$ |
|
283.3 |
1.3% |
4.7% |
6.1% |
3.2% |
3.4% |
||||||||
5 |
Houston-Sugar Land-Baytown, TX |
|
|
$ |
|
233.7 |
1.1% |
9.4% |
5.7% |
5.2% |
5.2% |
||||||||
|
|||||||||||||||||||
* |
Source: CBRE-EA. |
80Prospectus ¡ TIAA Real Estate Account |
Retail
Retail sales growth was flat in the fourth quarter. Preliminary data from the U.S. Census Bureau showed that retail sales excluding motor vehicles and parts increased just 0.1% in the fourth quarter of 2014 compared with the third quarter. However, sales increased 3.0% compared with the fourth quarter of 2013, and retail markets benefited from moderate growth in retail sales throughout 2014. Availability rates in neighborhood and community centers continued their gradual decline, dropping to an average of 11.4% in the fourth quarter as compared with 11.5% as of the end of the third quarter. The slow improvement in retail market conditions resulted in average rent growth of just 0.8% nationally in 2014. The vacancy rate for the Account’s retail portfolio remained low, averaging 4.4% during the fourth quarter as compared with 3.8% in the third quarter. The vacancy rate of the Account’s retail portfolio remained below the national average primarily due to the overall high quality of the retail portfolio. For example, regional malls, which generally have lower vacancy rates nationwide, account for approximately one-third of the Account’s square footage and have an average vacancy rate of 1.5%.
Outlook
Commercial real estate fundamentals continued to improve during the fourth quarter of 2014 as a result of stronger employment growth, minimal construction, and low interest rates. Competition for top properties remained intense, but commercial real estate continued to offer attractive returns compared with other asset classes. Market conditions remain strongest in metro areas with sizeable technology, medical and biotechnology sectors. Energy related markets had been experiencing strong growth as well; however, the recent sharp decline in oil prices has caused oil companies to cut production, slash exploration budgets, and begin layoffs until oil prices stabilize. Conditions have also been weaker in metro areas with sizeable U.S. government and defense sectors and are likely to remain so until government and defense spending recovers. While regional prospects differ, prospects for the U.S. economy as a whole appear stronger than they have been in a number of years given the acceleration in economic activity over the course of 2014. However, prospects for the global economy have weakened, and geopolitical and terrorist risks remain. Despite uncertainty about the global economy, the U.S. economy appears positioned for continued growth even if the global economy softens. If U.S. economic conditions generally fall in line with economists’ expectations, U.S. real estate market conditions are likely to experience further improvement in 2015.
The Account completed two acquisitions in the fourth quarter of 2014, acquiring an office building in Manhattan’s growing West Side and a 197 unit apartment complex in a top South Florida market. There were also three dispositions in the quarter, consisting of a retail property in Paris, an office building in San Francisco, and a portfolio of four Houston apartment buildings. Activities were consistent with the Account’s strategy of investing in high quality properties in target markets, managing overall exposure in target office markets,
TIAA Real Estate Account ¡ Prospectus81 |
and disposing of properties in non-target markets or those with limited future growth potential.
Management continued to maintain the Account’s income returns through aggressive property management and leasing in combination with expense management. As of the fourth quarter of 2014, the Account’s holdings were 90.3% leased as compared with 90.4% as of the third quarter of 2014. During the fourth quarter of 2014, the Account generated a 3.73% total return. The Account’s real estate assets generated a leveraged 1.18% income return and a 2.65% capital return. As shown in the graph below, real estate asset returns for the fourth quarter of 2014 were the nineteenth consecutive quarter of positive income and capital returns.
TIAA REAL ESTATE ACCOUNT QUARTERLY INVESTMENT RETURNS
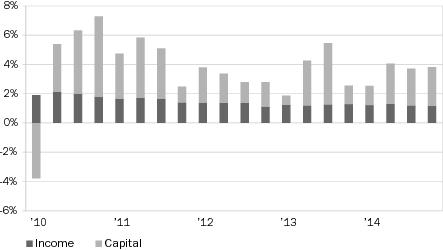
Management intends to continue to manage the Account’s liquidity position in a manner that maintains adequate reserves for new property acquisitions, the potential redemption of units from participants, capital expenditures for existing properties, property and Account operating expenses. Management intends to balance potential property acquisitions with expected financing and disposition activities while maintaining adequate cash reserves, with the ultimate goal of generating incremental Account returns. During 2015, management intends to maintain the Account’s diversification across property sectors at or close to its current sector weightings. In addition to ongoing investment activities, management will carefully evaluate opportunities to place commercial mortgage debt on recent acquisitions and refinance existing assets at lower interest rates in order to further reduce the Account’s overall weighted cost of capital. Management has significantly reduced the Account’s overall weighted cost of capital in recent quarters and believes that the current interest rate environment can still provide opportunities to further reduce the overall weighted cost of capital and benefit Account returns by locking in low cost long-term mortgage financing.
82Prospectus ¡ TIAA Real Estate Account |
However, refinancing activities will only be undertaken provided mortgage proceeds can be reinvested in real estate properties or other investments that will benefit overall Account returns.
A portion of the Account’s liquid assets is invested in publicly traded REITs, which provides incremental exposure to U.S. commercial real estate, an attractive dividend yield, and a high degree of liquidity. The Account’s $1.8 billion portfolio consists of a mix of REIT stocks that closely replicates the NAREIT All Equity REIT index, thereby providing the Account with exposure to a diverse mix of property types and geographic markets. By effectively replicating the index, the Account portfolio avoids the risks associated with concentrated investments in any particular company or sector. The return profile of REITs is currently and has historically been favorable to corporate bonds and government agency debt, albeit with added short term volatility as compared to direct investments in commercial real estate property. The Account’s REIT investments, inclusive of dividends, generated a return of 12.9% during the fourth quarter of 2014, consistent with the strength in the overall REIT market during the quarter.
Based on the economic and real estate market outlook for 2015, management will maintain its focus on selected property types in target markets with an emphasis on high quality properties in prime urban locations and dense suburban locations where there is limited available land for additional development. These may include properties that have recently completed construction and have not yet begun leasing or are in their initial lease-up phase, and properties that are ground up development projects in selected markets with limited acquisition opportunities. This investment strategy will provide greater opportunity to gain access to properties in prime locations in major metropolitan areas which have exceptional long term prospects and which management expects will lease at a steady pace given local market conditions. Management will also evaluate prospective acquisitions based on short- and long-term growth potential, purchase price relative to replacement cost, and portfolio diversification benefits. Emphasis will be given to institutional quality properties with strong operating histories and favorable tenant rollover schedules. Management believes that a disciplined investment strategy coupled with further strengthening of the U.S. economy and U.S. real estate market conditions will position the Account for favorable long-term performance.
Investments as of December 31, 2014
As of December 31, 2014, the Account had total net assets of $19.8 billion, a 17.3% increase from December 31, 2013. The increase in the Account’s net assets was primarily due to net participant inflows into the Account and net appreciation in value of the Account’s investments.
As of December 31, 2014, the Account owned a total of 108 real estate investments (of which 93 were wholly owned, 15 of which were held in joint ventures). The real estate portfolio included 29 office investments (including four held in joint ventures), 28 industrial investments (including one held in a joint venture), 29 apartment investments (including one held in a joint venture), 20
TIAA Real Estate Account ¡ Prospectus83 |
retail investments (including eight held in joint ventures), one 75% owned joint venture interest in a portfolio of storage facilities and one fee interest encumbered by a ground lease. Of the real estate investments, 32 are subject to debt (including 11 joint venture investments).
The outstanding principal on mortgage loans payable on the Account’s wholly owned real estate portfolio as of December 31, 2014 was $2.3 billion. The Account’s proportionate share of outstanding principal on mortgage loans payable within its joint venture investments was $1.7 billion, which is netted against the underlying properties when determining the joint venture investments fair value presented on the consolidated schedules of investments. When the mortgage loans payable within the joint venture investments are considered, total outstanding principal on the Account’s portfolio as of December 31, 2014 was $4.0 billion, which represented a loan to value ratio of 16.8%. The Account currently has no Account-level debt.
Management believes that the Account’s real estate portfolio is diversified by location and property type. The Account’s largest investment, 1001 Pennsylvania Avenue located in Washington, DC, represented 5.0% of total real estate investments and 3.6% of total investments. As discussed in the Account’s prospectus, the Account does not intend to buy and sell its real estate investments simply to make short-term profits. Rather, the Account’s general strategy in selling real estate investments is to dispose of those assets that management believes (i) have maximized in value, (ii) have underperformed or face deteriorating property-specific or market conditions, (iii) need significant capital infusions in the future, (iv) are appropriate to dispose of in order to remain consistent with the Account’s intent to diversify the Account by property type and geographic location (including reallocating the Account’s exposure to or away from certain property types in certain geographic locations), or (v) otherwise do not satisfy the investment objectives of the Account. Management, from time to time, will evaluate the need to manage liquidity in the Account as part of its analysis as to whether to undertake a particular asset sale. The Account could reinvest any sale proceeds that it does not need to pay operating expenses or to meet debt service or redemption requests (e.g., participant withdrawals or benefit payments).
84Prospectus ¡ TIAA Real Estate Account |
During 2014, the Account purchased 13 wholly owned real estate investments for $1.4 billion and two joint venture investments for $175.0 million, net of $92.3 million in mortgage loans payable, as displayed in the following table.
PROPERTY INVESTMENTS ACQUIRED IN 2014
(In millions)
|
|
|
|
|
|
|
|
|
|
|
|
|
|
|
||||||||||||||||||||
Property Name |
Property |
City |
State |
Net |
Joint |
Mortgage |
Net |
|||||||||||||||||||||||||||
|
||||||||||||||||||||||||||||||||||
|
Wholly Owned |
|
|
|
|
|
|
|
|
|
|
|
|
|
|
||||||||||||||||||||
|
Landover Logistics Center |
Industrial |
Landover |
MD |
|
|
$ |
|
35.0 |
|
|
N/A |
|
|
$ |
|
— |
|
|
$ |
|
35.0 |
|||||||||||||
|
Township Apartments |
Apartments |
Redwood City |
CA |
|
|
83.2 |
|
|
N/A |
|
|
— |
|
|
83.2 |
|||||||||||||||||||
|
200 Middlefield Road |
Office |
Menlo Park |
CA |
|
|
49.8 |
|
|
N/A |
|
|
— |
|
|
49.8 |
|||||||||||||||||||
|
55 Second Street |
Office |
San Francisco |
CA |
|
|
268.9 |
|
|
N/A |
|
|
— |
|
|
268.9 |
|||||||||||||||||||
|
The Louis at 14th |
Apartments |
Washington |
DC |
|
|
179.4 |
|
|
N/A |
|
|
— |
|
|
179.4 |
|||||||||||||||||||
|
Plaza America |
Retail |
Reston |
VA |
|
|
98.1 |
|
|
N/A |
|
|
— |
|
|
98.1 |
|||||||||||||||||||
|
Northwest Houston Industrial Portfolio |
Industrial |
Houston |
TX |
|
|
65.2 |
|
|
N/A |
|
|
— |
|
|
65.2 |
|||||||||||||||||||
|
Park 10 Distribution Center |
Industrial |
Houston |
TX |
|
|
13.4 |
|
|
N/A |
|
|
— |
|
|
13.4 |
|||||||||||||||||||
|
Southside at McEwen |
Retail |
Franklin |
TN |
|
|
44.3 |
|
|
N/A |
|
|
— |
|
|
44.3 |
|||||||||||||||||||
|
The Woodley |
Apartments |
Washington |
DC |
|
|
198.3 |
|
|
N/A |
|
|
— |
|
|
198.3 |
|||||||||||||||||||
|
Ontario Mills Industrial Portfolio |
Industrial |
Ontario |
CA |
|
|
38.1 |
|
|
N/A |
|
|
— |
|
|
38.1 |
|||||||||||||||||||
|
The Manor Apartments |
Apartments |
Plantation |
FL |
|
|
52.3 |
|
|
N/A |
|
|
— |
|
|
52.3 |
|||||||||||||||||||
|
21 Penn Plaza |
Office |
New York |
NY |
|
|
242.2 |
|
|
N/A |
|
|
— |
|
|
242.2 |
|||||||||||||||||||
|
||||||||||||||||||||||||||||||||||
|
Total Wholly Owned |
|
|
|
|
|
|
|
|
$ |
|
1,368.2 |
|
|
|
|
$ |
|
— |
|
|
$ |
|
1,368.2 |
|||||||||||
|
||||||||||||||||||||||||||||||||||
|
Joint Ventures |
|
|
|
|
|
|
|
|
|
|
|
|
|
|
||||||||||||||||||||
|
401 West 14th Street |
Retail |
New York |
NY |
|
|
$ |
|
71.4 |
|
|
42.2 |
% |
|
|
|
$ |
|
37.2 |
|
|
$ |
|
34.2 |
|||||||||||
|
Foundry Square II |
Office |
San Francisco |
CA |
|
|
195.9 |
|
|
50.1 |
% |
|
|
|
55.1 |
|
|
140.8 |
|||||||||||||||||
|
||||||||||||||||||||||||||||||||||
|
Total Joint Ventures |
|
|
|
|
|
|
|
|
$ |
|
267.3 |
|
|
|
|
$ |
|
92.3 |
|
|
$ |
|
175.0 |
|||||||||||
|
||||||||||||||||||||||||||||||||||
|
Total |
|
|
|
|
|
|
|
|
$ |
|
1,635.5 |
|
|
|
|
$ |
|
92.3 |
|
|
$ |
|
1,543.2 |
|||||||||||
|
||||||||||||||||||||||||||||||||||
TIAA Real Estate Account ¡ Prospectus85 |
During 2014, the Account sold ten wholly owned real estate investments for a net sales price of $933.8 million, realizing a gain of $69.8 million. The Account’s DDR Joint Venture investment conveyed to the lender one property that was part of the DDR retail portfolio, realizing a loss of $35.8 million.
PROPERTY INVESTMENTS SOLD IN 2014
(In millions)
|
|
|
|
|
|
|
|
|
|||||
Property Name |
Property Type |
City |
State |
Net |
|||||||||
|
|||||||||||||
|
Wholly Owned |
|
|
|
|
|
|
|
|
|||||
|
Plantation Grove |
Retail |
Ocoee |
FL |
|
|
$ |
|
11.8 |
|||||
|
Suncrest Village Shopping Center |
Retail |
Orlando |
FL |
|
|
13.7 |
|||||||
|
725 Darlington Ave—Konica Imaging HQ |
Industrial |
Mahwah |
NJ |
|
|
19.9 |
|||||||
|
Five Oaks(1) |
Land (Under |
Houston |
TX |
|
|
39.0 |
|||||||
|
North 40 Office Complex |
Office |
Boca Raton |
FL |
|
|
34.7 |
|||||||
|
Glenridge Walk Apartments |
Apartments |
Sandy Springs |
GA |
|
|
49.7 |
|||||||
|
Windsor at Lenox Park |
Apartments |
Atlanta |
GA |
|
|
74.9 |
|||||||
|
Houston Apartment Portfolio(2) |
Apartments |
Houston |
TX |
|
|
110.2 |
|||||||
|
Printemps De L’Homme |
Retail |
Paris |
France |
|
|
282.4 |
|||||||
|
275 Battery Street |
Office |
San Francisco |
CA |
|
|
297.5 |
|||||||
|
|||||||||||||
|
Total Wholly Owned |
|
|
|
|
|
|
|
|
$ |
|
933.8 |
||
|
|||||||||||||
|
Joint Ventures |
|
|
|
|
|
|
|
|
|||||
|
DDR Joint Venture(3) |
Retail |
Willoughby Hills |
OH |
|
|
$ |
|
— |
|||||
|
|||||||||||||
|
Total Joint Ventures |
|
|
|
|
|
|
|
|
$ |
|
— |
||
|
|||||||||||||
|
Total |
|
|
|
|
|
|
|
|
$ |
|
933.8 |
||
|
|||||||||||||
(1) |
The Account contributed 51% of land under development to its joint venture investment Four Oaks Place, L.P., selling the remaining 49% to its joint venture partner. |
||
(2) |
Four assets held within the Houston Apartment Portfolio were sold during the quarter ended December 31, 2014. |
||
(3) |
The Account’s DDR joint venture investment conveyed to the lender the property that secured a $6.4 million mortgage. |
The following charts reflect the diversification of the Account’s real estate assets by region and property type and list its ten largest investments. All information is based on the fair values of the investments at December 31, 2014.
DIVERSIFICATION BY FAIR VALUE(1)
|
|
|
|
|
|
|
|
|
|
|
|
|
East |
West |
South |
Midwest |
Total |
|||||
|
||||||||||
|
Office |
20.9% |
16.8% |
6.9% |
0.3% |
44.9% |
|||||
|
Apartment |
10.6% |
8.6% |
3.5% |
— |
22.7% |
|||||
|
Retail |
4.0% |
3.9% |
7.5% |
0.3% |
15.7% |
|||||
|
Industrial |
1.4% |
7.4% |
3.8% |
0.9% |
13.5% |
|||||
|
Other(2) |
2.8% |
0.2% |
0.1% |
0.1% |
3.2% |
|||||
|
||||||||||
|
Total |
39.7% |
36.9% |
21.8% |
1.6% |
100.0% |
|||||
|
||||||||||
(1) |
Wholly owned properties are represented at fair value and gross of any debt, while joint venture properties are represented at the net equity value. |
||
(2) |
Represents interest in Storage Portfolio investment and a fee interest encumbered by a ground lease real estate investment. |
86Prospectus ¡ TIAA Real Estate Account |
Properties in the “East” region are located in: CT, DC, DE, KY, MA, MD, ME, NC, NH, NJ, NY, PA, RI, SC, VA, VT, WV
Properties in the “West” region are located in: AK, AZ, CA, CO, HI, ID, MT, NM, NV, OR, UT, WA, WY
Properties in the “South” region are located in: AL, AR, FL, GA, LA, MS, OK, TN, TX
Properties in the “Midwest” region are located in: IA, IL, IN, KS, MI, MN, MO, ND, NE, OH, SD, WI
TOP TEN LARGEST REAL ESTATE INVESTMENTS
|
|
|
|
|
|
|
|
|
|
|
|
|
||||||||||
Property Investment Name |
City |
State |
Type |
Value |
Property as a |
Property as a |
||||||||||||||||
|
||||||||||||||||||||||
|
1001 Pennsylvania Avenue |
Washington |
DC |
Office |
|
|
$805.4 |
(2) |
|
5.0% |
|
|
3.6 |
% |
|
||||||||
|
50 Fremont Street(10) |
San Francisco |
CA |
Office |
|
|
637.6 |
(3) |
|
3.9% |
|
|
2.9 |
% |
|
||||||||
|
The Florida Mall |
Orlando |
FL |
Retail |
|
|
533.6 |
(4) |
|
3.3% |
|
|
2.4 |
% |
|
||||||||
|
99 High Street |
Boston |
MA |
Office |
|
|
477.2 |
(5) |
|
3.0% |
|
|
2.2 |
% |
|
||||||||
|
Fourth and Madison |
Seattle |
WA |
Office |
|
|
455.0 |
(6) |
|
2.8% |
|
|
2.1 |
% |
|
||||||||
|
DDR Joint Venture |
Various |
USA |
Retail |
|
|
448.4 |
(7) |
|
2.8% |
|
|
2.0 |
% |
|
||||||||
|
425 Park Avenue |
New York |
NY |
Land |
|
|
420.0 |
2.6% |
|
|
1.9 |
% |
|
||||||||||
|
780 Third Avenue |
New York |
NY |
Office |
|
|
405.4 |
(8) |
|
2.5% |
|
|
1.8 |
% |
|
||||||||
|
501 Boylston Street |
Boston |
MA |
Office |
|
|
392.1 |
2.4% |
|
|
1.8 |
% |
|
||||||||||
|
Colorado Center |
Santa Monica |
CA |
Office |
|
|
368.1 |
(9) |
|
2.3% |
|
|
1.7 |
% |
|
||||||||
|
||||||||||||||||||||||
(1) |
Fair value as reported in the December 31, 2014 Consolidated Schedules of Investments. Investments owned 100% by the Account are reported based on fair value. Investments in joint ventures are reported at fair value and are presented at the Account’s ownership interest. |
||
(2) |
This property is presented gross of debt. The value of the Account’s interest less the fair value of leverage was $472.5 million. |
||
(3) |
This property is presented gross of debt. The value of the Account’s interest less the fair value of leverage was $437.6 million. |
||
(4) |
This property is a held in a joint venture with Simon Property Group, L.P., in which the Account holds a 50% interest, and is presented net of debt. As of December 31, 2014 this debt had a fair value of $190.8 million. |
||
(5) |
This property is presented gross of debt. The value of the Account’s interest less the fair value of leverage was $292.2 million. |
||
(6) |
This property is presented gross of debt. The value of the Account’s interest less the fair value of leverage was $253.5 million. |
||
(7) |
This investment is held in a joint venture with DDR Corp., in which the Account holds an 85% interest, and consists of 26 retail properties located in 11 states and is presented net of debt. As of December 31, 2014, this debt had a fair value of $684.8 million. |
||
(8) |
This property investment is presented gross of debt. The value of the Account’s interest less the fair value of leverage was $235.9 million. |
||
(9) |
This property is held in a joint venture with EOP Operating LP, in which the Account’s holds 50% interest, and is presented net of debt. As of December 31, 2014, this debt had a fair value of $125.0 million. |
||
(10) |
This property was sold on February 12, 2015. |
As of December 31, 2014, the Account held 72.9% of its total investments in real estate and real estate joint ventures. The Account also held investments in government agency notes representing 10.7% of total investments, real estate-related equity securities representing 8.2% of total investments, U.S. Treasury securities representing 6.6% of total investments, and real estate limited partnerships, representing 1.6% of total investments.
TIAA Real Estate Account ¡ Prospectus87 |
Results of operations
Year ended December 31, 2014 compared to year ended
December 31, 2013
Performance
The Account’s total return was 12.22% for the year ended December 31, 2014 as compared to 9.65% for the year ended 2013. The Account’s annualized total returns over the past one, three, five, and ten year periods ended December 31, 2014 were 12.22%, 10.64%, 11.63%, and 4.77%, respectively. As of December 31, 2014, the Account’s annualized total return since inception was 6.42%.
Net investment income
The table below shows the results of operations for the years ended December 31, 2014 and 2013 and the dollar and percentage changes for those periods (dollars in millions).
|
|
|
|
|
|
|
|
|
||||||||||||||||||||
|
|
Years Ended |
Change |
||||||||||||||||||||||||||
2014 |
2013 |
$ |
% |
|||||||||||||||||||||||||
|
||||||||||||||||||||||||||||
|
INVESTMENT INCOME |
|
|
|
|
|
|
|
|
||||||||||||||||||||
|
Real estate income, net: |
|
|
|
|
|
|
|
|
||||||||||||||||||||
|
Rental income |
|
|
$ |
|
897.8 |
|
|
$ |
|
831.5 |
|
|
$ |
|
66.3 |
|
|
8.0 |
% |
|
||||||||
|
||||||||||||||||||||||||||||
|
Real estate property level expenses and taxes: |
|
|
|
|
|
|
|
|
||||||||||||||||||||
|
Operating expenses |
|
|
208.0 |
|
|
202.4 |
|
|
5.6 |
|
|
2.8 |
% |
|
||||||||||||||
|
Real estate taxes |
|
|
134.1 |
|
|
121.3 |
|
|
12.8 |
|
|
10.6 |
% |
|
||||||||||||||
|
Interest expense |
|
|
98.7 |
|
|
116.8 |
|
|
(18.1 |
) |
|
|
|
-15.5 |
% |
|
||||||||||||
|
||||||||||||||||||||||||||||
|
Total real estate property level expenses and taxes |
|
|
440.8 |
|
|
440.5 |
|
|
0.3 |
|
|
0.1 |
% |
|
||||||||||||||
|
||||||||||||||||||||||||||||
|
Real estate income, net |
|
|
457.0 |
|
|
391.0 |
|
|
66.0 |
|
|
16.9 |
% |
|
||||||||||||||
|
Income from real estate joint ventures and limited partnerships |
|
|
148.1 |
|
|
104.7 |
|
|
43.4 |
|
|
41.5 |
% |
|
||||||||||||||
|
Interest |
|
|
2.8 |
|
|
2.9 |
|
|
(0.1 |
) |
|
|
|
-3.4 |
% |
|
||||||||||||
|
Dividends |
|
|
44.9 |
|
|
42.2 |
|
|
2.7 |
|
|
6.4 |
% |
|
||||||||||||||
|
||||||||||||||||||||||||||||
|
TOTAL INVESTMENT INCOME |
|
|
652.8 |
|
|
540.8 |
|
|
112.0 |
|
|
20.7 |
% |
|
||||||||||||||
|
||||||||||||||||||||||||||||
|
Expenses: |
|
|
|
|
|
|
|
|
||||||||||||||||||||
|
Investment advisory charges |
|
|
70.7 |
|
|
59.3 |
|
|
11.4 |
|
|
19.2 |
% |
|
||||||||||||||
|
Administrative charges |
|
|
44.9 |
|
|
41.7 |
|
|
3.2 |
|
|
7.7 |
% |
|
||||||||||||||
|
Distribution charges |
|
|
17.3 |
|
|
12.8 |
|
|
4.5 |
|
|
35.2 |
% |
|
||||||||||||||
|
Mortality and expense risk charges |
|
|
0.9 |
|
|
0.8 |
|
|
0.1 |
|
|
12.5 |
% |
|
||||||||||||||
|
Liquidity guarantee charges |
|
|
29.2 |
|
|
30.5 |
|
|
(1.3 |
) |
|
|
|
-4.3 |
% |
|
||||||||||||
|
||||||||||||||||||||||||||||
|
TOTAL EXPENSES |
|
|
163.0 |
|
|
145.1 |
|
|
17.9 |
|
|
12.3 |
% |
|
||||||||||||||
|
||||||||||||||||||||||||||||
|
INVESTMENT INCOME, NET |
|
|
$ |
|
489.8 |
|
|
$ |
|
395.7 |
|
|
$ |
|
94.1 |
|
|
23.8 |
% |
|
||||||||
|
||||||||||||||||||||||||||||
Rental Income: Rental income increased $66.3 million or 8.0% due in part to a $20.4 million increase in the office sector driven by higher occupancy and rental rates in the San Francisco, Miami, and Washington, DC markets. The remaining sectors drove a $16.6 million increase as a result of increases in occupancy and rental rates. Additional increases were associated with the net acquisitions of real estate investments.
88Prospectus ¡ TIAA Real Estate Account |
Operating Expenses: Operating expenses increased $5.6 million or 2.8% primarily related to net acquisitions of real estate investments with marginal increases at existing real estate investments.
Real Estate Taxes: Real estate taxes increased $12.8 million or 10.6% primarily due to higher property tax assessments resulting from increases in value across the real estate portfolio. Additional increases were associated with the net acquisitions of real estate investments.
Interest Expense: Interest expense decreased $18.1 million or 15.5% primarily due to the payoff of mortgage loans associated with sold and existing real estate investments, as well as the refinance of existing mortgage loans, reducing the overall average interest rate of the Account’s mortgage loans payable.
Income from Real Estate Joint Ventures and Limited Partnerships: Income from real estate joint ventures and limited partnerships increased $43.4 million or 41.5% due to increased cash distributions driven by earnings primarily from the Account’s joint venture investments. The largest distributions were from the Account’s DDR, Four Oaks, Florida and Miami International Mall joint ventures.
Interest and Dividend Income: Interest and dividend income remained relatively consistent as a ratio of marketable securities held during 2014 compared to 2013.
Expenses: The Account’s expenses increased $17.9 million or 12.3%. Investment advisory, administrative and distribution charges are costs charged to the Account associated with managing the Account. These costs have fixed and variable components, the latter of which generally correspond to the level of the Account’s net assets under management. Investment advisory, administrative and distribution charges were, collectively, 0.73% and 0.72% of average net assets during 2014 and 2013, respectively.
Mortality and expense risk and liquidity guarantee charges are contractual charges to the Account from TIAA for TIAA’s assumption of these risks and provision of the guarantee. The rate for these charges generally is established annually effective May 1 for each twelve month period ending each April 30 and is charged based on the Account’s net assets. While net assets increased during 2014 compared to 2013, liquidity guarantee charges decreased as a result of the change in deduction rates effective May 1, 2014.
Net realized and unrealized gains and losses on investments and mortgage loans payable
The following table shows the net realized and unrealized gains (losses) on investments and mortgage loans payable for the years ended December 31,
TIAA Real Estate Account ¡ Prospectus89 |
2014 and 2013 and the dollar and percentage changes for those periods (dollars in millions).
|
|
|
|
|
|
|
|
|
||||||||||||||||||||
|
|
Years Ended |
Change |
||||||||||||||||||||||||||
2014 |
2013 |
$ |
% |
|||||||||||||||||||||||||
|
||||||||||||||||||||||||||||
|
NET REALIZED AND UNREALIZED GAIN (LOSS) |
|
|
|
|
|
|
|
|
||||||||||||||||||||
|
Net realized gain (loss) on investments: |
|
|
|
|
|
|
|
|
||||||||||||||||||||
|
Real estate properties |
|
|
$ |
|
69.0 |
|
|
$ |
|
(210.0 |
) |
|
|
|
$ |
|
279.0 |
|
|
N/M |
||||||||
|
Real estate joint ventures and limited partnerships |
|
|
(34.7 |
) |
|
|
|
(153.0 |
) |
|
|
|
118.3 |
|
|
77.3 |
% |
|
||||||||||
|
Marketable securities |
|
|
65.4 |
|
|
31.6 |
|
|
33.8 |
|
|
N/M |
||||||||||||||||
|
||||||||||||||||||||||||||||
|
Total realized gain (loss) on investments: |
|
|
99.7 |
|
|
(331.4 |
) |
|
|
|
431.1 |
|
|
N/M |
||||||||||||||
|
||||||||||||||||||||||||||||
|
Net change in unrealized appreciation (depreciation) on: |
|
|
|
|
|
|
|
|
||||||||||||||||||||
|
Real estate properties |
|
|
918.8 |
|
|
863.1 |
|
|
55.7 |
|
|
6.5 |
% |
|
||||||||||||||
|
Real estate joint ventures and limited partnerships |
|
|
372.0 |
|
|
479.0 |
|
|
(107.0 |
) |
|
|
|
-22.3 |
% |
|
||||||||||||
|
Marketable securities |
|
|
302.8 |
|
|
(41.7 |
) |
|
|
|
344.5 |
|
|
N/M |
||||||||||||||
|
Mortgage loans payable |
|
|
(64.9 |
) |
|
|
|
91.2 |
|
|
(156.1 |
) |
|
|
|
N/M |
||||||||||||
|
||||||||||||||||||||||||||||
|
Net change in unrealized appreciation on investments and mortgage loans payable |
|
|
1,528.7 |
|
|
1,391.6 |
|
|
137.1 |
|
|
9.9 |
% |
|
||||||||||||||
|
||||||||||||||||||||||||||||
|
NET REALIZED AND UNREALIZED GAIN ON INVESTMENTS AND MORTGAGE LOANS PAYABLE |
|
|
$ |
|
1,628.4 |
|
|
$ |
|
1,060.2 |
|
|
$ |
|
568.2 |
|
|
53.6 |
% |
|
||||||||
|
||||||||||||||||||||||||||||
N/M — Not meaningful
Real Estate Properties, Joint Ventures and Limited Partnerships: Net realized losses in the Account are primarily due to the sale of wholly owned real estate property investments and real estate property investments underlying the Account’s joint venture investments. See the Recent Transactions section herein for additional disclosure regarding the sale of the Account’s real estate property investments.
Real Estate Properties: The Account’s wholly owned real estate investments experienced net realized and unrealized gains of $987.8 million for the year ended December 31, 2014, compared to $653.1 million of net realized and unrealized gains for 2013. The resulting $334.7 million net increase was primarily driven by continued compression of capitalization rates, improved occupancy, increased market rents, and several newly acquired real estate property investments. The largest increases were in the office and industrial sectors, most notably in the Western region. Included within the net unrealized gains of the Account were foreign exchange losses of $38.9 million and $4.8 million during 2014 and 2013, respectively.
Real Estate Joint Ventures and Limited Partnerships: The Account’s real estate joint ventures and limited partnerships experienced net realized and unrealized gains of $337.3 million for the year ended December 31, 2014 compared to net realized and unrealized gains of $326.0 million for 2013. The resulting $11.3 million net increase was driven by an increase in valuation, most notably in the
90Prospectus ¡ TIAA Real Estate Account |
office sector, partially offset by a higher distribution of earnings as previously discussed in Income from Real Estate Joint Ventures and Limited Partnerships.
Marketable Securities: The Account’s marketable securities positions experienced net realized and unrealized gains of $368.2 million for the year ended December 31, 2014 compared to net realized and unrealized losses of $10.1 million for the year ended December 31, 2013. During 2014, the markets for REITs increased in the U.S. as measured by the FTSE NAREIT All Equity REITs Index; the Account’s real estate related equity securities appreciated in line with these market movements.
Additionally, the Account held $3.8 billion invested in government agency notes and U.S. Treasury Securities, which had nominal changes due to the short term nature of these investments.
Mortgage Loans Payable: Mortgage loans payable experienced unrealized losses of $64.9 million for the year ended December 31, 2014 compared to unrealized gains of $91.2 million for 2013. Valuation adjustments to mortgage loans payable are highly dependent upon interest rates, investment return demands, and the performance of the underlying real estate investment. Overall, the Account’s mortgage loans have increased in value primarily as a result of reductions in U.S. Treasury rates.
Year ended December 31, 2013 compared to year ended
December 31, 2012
Performance
The Account’s total return was 9.65% for the year ended December 31, 2013 as compared to 10.06% for the year ended 2012. The Account’s annualized total returns over the past one, three, five, and ten year periods ended December 31, 2013 were 9.65%, 10.89%, 2.25%, and 4.80%, respectively. As of December 31, 2013, the Account’s annualized total return since inception was 6.11%.
TIAA Real Estate Account ¡ Prospectus91 |
Net investment income
The table below shows the results of operations for the years ended December 31, 2013 and 2012 and the dollar and percentage changes for those periods (dollars in millions).
|
|
|
|
|
|
|
|
|
||||||||||||||||||||
|
|
Years Ended |
Change |
||||||||||||||||||||||||||
2013 |
2012 |
$ |
% |
|||||||||||||||||||||||||
|
||||||||||||||||||||||||||||
|
INVESTMENT INCOME |
|
|
|
|
|
|
|
|
||||||||||||||||||||
|
Real estate income, net: |
|
|
|
|
|
|
|
|
||||||||||||||||||||
|
Rental income |
|
|
$ |
|
831.5 |
|
|
$ |
|
872.0 |
|
|
$ |
|
(40.5 |
) |
|
|
|
-4.6 |
% |
|
||||||
|
Real estate property level expenses and taxes: |
|
|
|
|
|
|
|
|
||||||||||||||||||||
|
Operating expenses |
|
|
202.4 |
|
|
218.2 |
|
|
(15.8 |
) |
|
|
|
-7.2 |
% |
|
||||||||||||
|
Real estate taxes |
|
|
121.3 |
|
|
119.1 |
|
|
2.2 |
|
|
1.8 |
% |
|
||||||||||||||
|
Interest expense |
|
|
116.8 |
|
|
146.0 |
|
|
(29.2 |
) |
|
|
|
-20.0 |
% |
|
||||||||||||
|
||||||||||||||||||||||||||||
|
Total real estate property level expenses and taxes |
|
|
440.5 |
|
|
483.3 |
|
|
(42.8 |
) |
|
|
|
-8.9 |
% |
|
||||||||||||
|
||||||||||||||||||||||||||||
|
Real estate income, net |
|
|
391.0 |
|
|
388.7 |
|
|
2.3 |
|
|
0.6 |
% |
|
||||||||||||||
|
Income from real estate joint ventures and limited partnerships |
|
|
104.7 |
|
|
80.9 |
|
|
23.8 |
|
|
29.4 |
% |
|
||||||||||||||
|
Interest |
|
|
2.9 |
|
|
3.0 |
|
|
(0.1 |
) |
|
|
|
-3.3 |
% |
|
||||||||||||
|
Dividends |
|
|
42.2 |
|
|
32.3 |
|
|
9.9 |
|
|
30.7 |
% |
|
||||||||||||||
|
||||||||||||||||||||||||||||
|
TOTAL INVESTMENT INCOME |
|
|
540.8 |
|
|
504.9 |
|
|
35.9 |
|
|
7.1 |
% |
|
||||||||||||||
|
||||||||||||||||||||||||||||
|
Expenses: |
|
|
|
|
|
|
|
|
||||||||||||||||||||
|
Investment advisory charges |
|
|
59.3 |
|
|
56.3 |
|
|
3.0 |
|
|
5.3 |
% |
|
||||||||||||||
|
Administrative charges |
|
|
41.7 |
|
|
32.4 |
|
|
9.3 |
|
|
28.7 |
% |
|
||||||||||||||
|
Distribution charges |
|
|
12.8 |
|
|
13.9 |
|
|
(1.1 |
) |
|
|
|
-7.9 |
% |
|
||||||||||||
|
Mortality and expense risk charges |
|
|
0.8 |
|
|
2.8 |
|
|
(2.0 |
) |
|
|
|
-71.4 |
% |
|
||||||||||||
|
Liquidity guarantee charges |
|
|
30.5 |
|
|
31.3 |
|
|
(0.8 |
) |
|
|
|
-2.6 |
% |
|
||||||||||||
|
||||||||||||||||||||||||||||
|
TOTAL EXPENSES |
|
|
145.1 |
|
|
136.7 |
|
|
8.4 |
|
|
6.1 |
% |
|
||||||||||||||
|
||||||||||||||||||||||||||||
|
INVESTMENT INCOME, NET |
|
|
$ |
|
395.7 |
|
|
$ |
|
368.2 |
|
|
$ |
|
27.5 |
|
|
7.5 |
% |
|
||||||||
|
||||||||||||||||||||||||||||
Rental Income: Rental Income decreased $40.5 million or 4.6% primarily related to net disposition activity of real estate investments during 2012 and 2013. Rental income decreased $99.0 million as a result of dispositions; partially offset by $42.4 million of additional rental income related to new acquisitions and $16.1 million attributed to existing real estate investments driven by higher occupancy, higher rents and lower rent concessions, most notably in the apartment and retail sectors.
Operating Expenses: Operating expenses decreased $15.8 million or 7.2% primarily related to net disposition activity of real estate investments during 2012 and 2013. Operating expenses decreased $29.7 million as a result of dispositions; partially offset by $7.3 million of additional operating expenses related to new acquisitions and $6.6 million attributed to existing real estate investments, driven most notably by higher expenses in the apartment and office sectors, due to higher occupancy.
Real Estate Taxes: Real estate taxes increased $2.2 million or 1.8% primarily due to increased property tax assessments, most notably in the Texas and California regions.
92Prospectus ¡ TIAA Real Estate Account |
Interest Expense: Interest expense decreased $29.2 million or 20.0% primarily due to the extinguishment of mortgage loans with higher interest rates.
Income from Real Estate Joint Ventures and Limited Partnerships: Income from real estate joint ventures and limited partnerships increased $23.8 million or 29.4% due primarily to three new joint venture investments during the fourth quarter of 2012, partially offset by the dispositions of several smaller investments from within the Florida Retail Portfolio and DDR joint ventures.
Interest and Dividend Income: Interest income decreased $0.1 million or 3.3% due to decreases in short term treasury rates during the year. Dividend income increased $9.9 million or 30.7% due primarily to the $208.6 million increase in the cost of real estate-related marketable securities.
Expenses: The Account’s expenses increased $8.4 million or 6.1%. Investment advisory, administrative and distribution charges are costs charged to the Account associated with managing the Account. These costs have fixed and variable components, the latter of which generally correspond to the level of the Account’s net assets under management. These costs increased 10.9% during 2013, generally corresponding to the 13.8% increase in the Account’s net assets from December 31, 2012 to December 31, 2013.
Mortality and expense risk and liquidity guarantee charges are contractual charges to the Account from TIAA for TIAA’s assumption of these risks and provision of the guarantee. The rate for these charges generally is established annually effective May 1 for each twelve month period ending each April 30 and is charged based on the Account’s net assets. Even though net assets increased in 2013 compared to 2012, mortality and expense risk charges decreased as a result of the change in such rates.
Net realized and unrealized gains and losses on investments and mortgage loans payable
The following table shows the net realized and unrealized gains (losses) on investments and mortgage loans payable for the years ended December 31, 2013 and 2012 and the dollar and percentage changes for those periods (dollars in millions).
TIAA Real Estate Account ¡ Prospectus93 |
|
|
|
|
|
|
|
|
|
||||||||||||||||||||
|
|
Years Ended |
Change |
||||||||||||||||||||||||||
2013 |
2012 |
$ |
% |
|||||||||||||||||||||||||
|
||||||||||||||||||||||||||||
|
NET REALIZED AND UNREALIZED GAIN (LOSS) ON INVESTMENTS AND MORTGAGE LOANS PAYABLE |
|
|
|
|
|
|
|
|
||||||||||||||||||||
|
Net realized gain (loss) on investments: |
|
|
|
|
|
|
|
|
||||||||||||||||||||
|
Real estate properties |
|
|
$ |
|
(210.0 |
) |
|
|
|
$ |
|
(11.3 |
) |
|
|
|
$ |
|
(198.7 |
) |
|
|
|
N/M |
||||
|
Real estate joint ventures and limited partnerships |
|
|
(153.0 |
) |
|
|
|
(104.5 |
) |
|
|
|
(48.5 |
) |
|
|
|
-46.4 |
% |
|
||||||||
|
Marketable securities |
|
|
31.6 |
|
|
53.7 |
|
|
(22.1 |
) |
|
|
|
-41.2 |
% |
|
||||||||||||
|
||||||||||||||||||||||||||||
|
Total realized loss on investments: |
|
|
(331.4 |
) |
|
|
|
(62.1 |
) |
|
|
|
(269.3 |
) |
|
|
|
N/M |
||||||||||
|
||||||||||||||||||||||||||||
|
Net change in unrealized appreciation (depreciation) on: |
|
|
|
|
|
|
|
|
||||||||||||||||||||
|
Real estate properties |
|
|
863.1 |
|
|
555.8 |
|
|
307.3 |
|
|
55.3 |
% |
|
||||||||||||||
|
Real estate joint ventures and limited partnerships |
|
|
479.0 |
|
|
424.1 |
|
|
54.9 |
|
|
12.9 |
% |
|
||||||||||||||
|
Marketable securities |
|
|
(41.7 |
) |
|
|
|
126.8 |
|
|
(168.5 |
) |
|
|
|
N/M |
||||||||||||
|
Mortgage loans payable |
|
|
91.2 |
|
|
(33.4 |
) |
|
|
|
124.6 |
|
|
N/M |
||||||||||||||
|
||||||||||||||||||||||||||||
|
Net change in unrealized appreciation on investments and mortgage loans payable |
|
|
1,391.6 |
|
|
1,073.3 |
|
|
318.3 |
|
|
29.7 |
% |
|
||||||||||||||
|
||||||||||||||||||||||||||||
|
NET REALIZED AND UNREALIZED GAIN ON INVESTMENTS AND MORTGAGE LOANS PAYABLE |
|
|
$ |
|
1,060.2 |
|
|
$ |
|
1,011.2 |
|
|
$ |
|
49.0 |
|
|
4.8 |
% |
|
||||||||
|
||||||||||||||||||||||||||||
N/M — Not meaningful
Real Estate Properties: Real estate properties experienced net realized and unrealized gains of $653.1 million for the year as compared to net realized and unrealized gains of $544.5 million for 2012.
Net realized losses in the Account are due to the sale of real estate property investments during 2013.
Net unrealized gains in the Account increased primarily as a result of improved occupancy, continued compression in capitalization rates, and increased market rents. The largest increases were experienced in the office sector, with larger increases in the Boston, San Francisco and Washington D.C. markets. These increases were offset by foreign exchange losses of $4.8 million during the year as compared to foreign exchange gains of $14.6 million during 2012.
Real Estate Joint Ventures and Limited Partnerships: Real estate joint ventures and limited partnerships experienced net realized and unrealized gains of $326.0 million for the year ended December 31, 2013 compared to net realized and unrealized gains of $319.6 million for 2012.
Net realized losses related to the Account’s investments in joint ventures and limited partnerships are primarily due to the sale of real estate property investments underlying the Account’s joint venture investments during 2013.
Net unrealized appreciation increased $54.9 million as compared to 2012. The largest increases were experienced in the retail sector, specifically in the Florida market.
Marketable Securities: The Account’s marketable securities experienced net realized and unrealized losses of $10.1 million for the year as compared to net realized and unrealized gains of $180.5 million for 2012. At December 31, 2013
94Prospectus ¡ TIAA Real Estate Account |
the Account’s real estate related marketable securities were $1.5 billion as compared to $1.3 billion at December 31, 2012, an increase of $167.0 million or 12.5%. During 2013 the markets for REITs in the United States decreased as measured by the FTSE NAREIT All Equity REITs Index. The Account’s real estate related equity securities depreciated in line with these market movements.
Additionally, the Account held $3.1 billion of short term marketable securities invested in government agency notes and United States Treasury Securities, which had nominal appreciation due to the short term nature of these investments.
Mortgage Loans Payable: Mortgage loans payable experienced unrealized gains of $91.2 million for the year compared to unrealized losses of $33.4 million for 2012. Valuation adjustments to mortgage loans payable are highly dependent upon interest rates, investment return demands, the performance of the underlying real estate investment, and where applicable, foreign exchange rates. The increase in unrealized gains during the year was primarily due to increases in 10-year treasury rates as well as favorable foreign exchange rates, resulting in exchange gains of $16.0 million as compared to foreign exchange losses of $9.4 million during 2012.
Liquidity and capital resources
As of December 31, 2014 and 2013, the Account’s cash and cash equivalents and non-real estate-related marketable securities had a value of $3.9 billion and $3.1 billion, respectively (19.5% and 18.5% of the Account’s net assets at such dates, respectively).
Year ended December 31, 2014 compared to year ended
December 31, 2013
During the year ended December 31, 2014, the Account received $2.4 billion in premiums from participants offset by participant outflows of $1.6 billion in annuity payments and withdrawals and death benefits. During the year ended December 31, 2013, the Account received $2.4 billion in premiums from participants offset by participant outflows of $1.5 billion in annuity payments, withdrawals and death benefits. The Account had additional outflows of $325.4 million related to redemptions of liquidity units during the year ended December 31, 2013. See Redemption of Liquidity Units section for additional discussions related to the redemption of liquidity units.
Liquidity guarantee
Primarily as a result of significant net participant transfers out of the Account during late 2008 and mid-2009, pursuant to TIAA’s existing liquidity guarantee obligation, the TIAA General Account purchased $1.2 billion of liquidity units issued by the Account in a number of separate transactions between December 2008 and June 2009. Subsequent to June 2009, the TIAA General Account did not purchase any additional liquidity units. As disclosed under “Establishing and Managing the Account—the Role of TIAA—Liquidity Guarantee” in the Account’s
TIAA Real Estate Account ¡ Prospectus95 |
prospectus, in accordance with this liquidity guarantee obligation, TIAA guarantees that all participants in the Account may redeem their accumulation units at their accumulation unit value next determined after their transfer or cash withdrawal request is received in good order.
Net participant transfers out of the Account significantly slowed following the first quarter of 2009, and net participant transfer activity turned to net inflows in early 2010, which has continued through the date of this report. As a result, while management cannot predict whether any future TIAA liquidity unit purchases will be required under this liquidity guarantee, it is unlikely that additional purchases will be required in the near term. However, management cannot predict for how long net inflows will continue to occur. If net outflows were to occur (even if not at the same intensity as in 2008 and early 2009), it could have a negative impact on the Account’s operations and returns and could require TIAA to purchase additional liquidity units, perhaps to a significant degree, as was the case in late 2008 and early 2009.
TIAA’s obligation to provide Account participants liquidity through purchases of liquidity units is not subject to an express regulatory or contractual limitation, although as described in the paragraph below, the independent fiduciary may (but is not obligated to) require the reduction of TIAA’s interest through sales of assets from the Account if TIAA’s interest exceeds the trigger point. Even if the independent fiduciary so requires TIAA’s obligation to provide liquidity under the guarantee, which is required by the New York State Department of Financial Services, will continue. Management also believes that TIAA has the ability to meet its obligations under this liquidity guarantee.
Whenever TIAA owns liquidity units, the duties of the Account’s independent fiduciary, as part of its monitoring of the Account, include reviewing the purchase and redemption of liquidity units by TIAA to ensure the Account uses the correct accumulation unit values. In addition, the independent fiduciary’s responsibilities include:
• |
establishing the percentage of total accumulation units that TIAA’s ownership should not exceed (the “trigger point”) and creating a method for reviewing the trigger point; |
||
• |
approving any adjustment of TIAA’s ownership interest in the Account and, in its discretion, requiring an adjustment if TIAA’s ownership of liquidity units reaches the trigger point; and |
||
• |
once the trigger point has been reached, participating in any program to reduce TIAA’s ownership in the Account by utilizing cash flow or liquid investments in the Account, or by utilizing the proceeds from asset sales. If the independent fiduciary were to determine that TIAA’s ownership should be reduced following the trigger point, its role in participating in any asset sales program would include (i) participating in the selection of properties for sale, (ii) providing sales guidelines and (iii) approving those sales if, in the independent fiduciary’s opinion, such sales are desirable to reduce TIAA’s ownership of liquidity units. |
96Prospectus ¡ TIAA Real Estate Account |
In establishing the appropriate trigger point, including whether or not to require certain actions once the trigger point has been reached, the independent fiduciary will assess, among other things and to the extent consistent with the Prohibited Transaction Exemption (PTE 96-76) issued by the U.S. Department of Labor in 1996 with respect to the liquidity guarantee and the independent fiduciary’s duties under ERISA, the risk that a conflict of interest could arise due to the level of TIAA’s ownership interest in the Account.
Redemption of Liquidity Units. The independent fiduciary is vested with oversight and approval over any redemption of TIAA’s liquidity units, acting in the best interests of Real Estate Account participants.
As of March 31, 2013, the independent fiduciary completed the systematic redemption of all of the liquidity units held by the TIAA General Account. Approximately one-quarter of such units were redeemed evenly over the business days in each of the months of June, September, and December 2012, and March 2013, representing a total of $1.3 billion redeemed during this period.
As a general matter, the independent fiduciary may authorize or direct the redemption of all or a portion of liquidity units at any time and TIAA will request the approval of the independent fiduciary before any liquidity units are redeemed. Upon termination and liquidation of the Account (wind-up), any liquidity units held by TIAA will be the last units redeemed, unless the independent fiduciary directs otherwise. The Account pays TIAA for the risk associated with providing the liquidity guarantee through a daily deduction from the Account’s net assets.
Net income and marketable securities
The Account’s net investment income continues to be an additional source of liquidity for the Account. Net investment income was $489.8 million for the year ended December 31, 2014 as compared to $395.7 million during 2013. Total net investment income increased as described more fully in the Results of Operations section.
As of December 31, 2014, cash and cash equivalents, along with real estate-related and non-real estate-related marketable securities comprised 28.7% of the Account’s net assets. The Account’s real estate-related marketable securities primarily consist of publicly traded REITs. The Account’s liquid assets continue to be available to purchase suitable real estate properties, meet the Account’s debt obligations, expense needs, and participant redemption requests (i.e., participant withdrawals or benefit payments).
Leverage
The Account may borrow money and assume or obtain a mortgage on a property to make leveraged real estate investments. Also, to meet any short-term cash needs, the Account may obtain a line of credit that may be unsecured and/or contain terms that may require the Account to secure the loan with one or more of its properties.
The Account is authorized to borrow money in accordance with its investment guidelines. Under the Account’s current investment guidelines, the Account’s
TIAA Real Estate Account ¡ Prospectus97 |
loan to value ratio (as described below) is to be maintained at or below 30%. Such incurrences of debt from time to time may include:
• |
placing new debt on properties; |
||
• |
refinancing outstanding debt; |
||
• |
assuming debt on acquired properties or interests in the Account’s properties; and/or |
||
• |
long term extensions of the maturity date of outstanding debt. |
In calculating this limit, only the Account’s actual percentage interest in any borrowings is included, and not that percentage interest held by any joint venture partner. Further, the Account may only borrow up to 70% of the then-current value of a property, although construction loans may be for 100% of the costs incurred in developing a property. As of December 31, 2014, one construction loan was held within the Account’s joint venture investment Four Oaks Place, L.P. At the time the Account (or a joint venture in which the Account is a partner) enters into a revolving line of credit, management deems the maximum amount which may be drawn under that line of credit as fully incurred, regardless of whether the maximum amount available has been drawn from time to time.
As of December 31, 2014, the Account’s ratio of outstanding principal amount of debt (inclusive of the Account’s proportionate share of debt held within its joint venture investments) to total gross asset value (i.e., a “loan to value ratio”) was 16.8%. The Account intends to maintain its loan to value ratio at or below 30% (this ratio is measured at the time of incurrence and after giving effect thereto). The Account’s total gross asset value, for these purposes, is equal to the total fair value of the Account’s assets (including the fair value of the Account’s interest in joint ventures), with no reduction associated with any indebtedness on such assets.
As of December 31, 2014, $185.8 million in principal amount of mortgage obligations secured by real estate investments wholly owned by the Account are obligated to be paid throughout 2015. The Account currently has sufficient liquidity in the form of cash and cash equivalents and short term securities to meet its current mortgage obligations.
In times of high net inflow activity, in particular during times of high net participant transfer inflows, management may determine to apply a portion of such cash flows to make prepayments of indebtedness prior to scheduled maturity, which would have the effect of reducing the Account’s loan to value ratio.
Recent transactions
The following describes property transactions by the Account during the fourth quarter of 2014. Except as noted, the expenses for operating the properties purchased are either borne or reimbursed, in whole or in part, by the property tenants, although the terms vary under each lease. The Account is responsible for operating expenses not reimbursed under the terms of a lease. All rental rates are quoted on an annual basis unless otherwise noted.
98Prospectus ¡ TIAA Real Estate Account |
Purchases
The Manor Apartments — Plantation, FL
On October 24, 2014, the Account purchased a 192,538 square foot multi-family property located in Plantation, Florida for $52.3 million. The property consists of a six-story mid-rise building and four buildings containing sixteen, three-story townhomes, for a total of 197 units. At the time of purchase, the property was 95% leased.
21 Penn Plaza — New York, NY
On November 18, 2014, the Account purchased a 373,781 square foot, seventeen-story office building located in New York, New York for $242.2 million. At the time of purchase, the property was 98% leased.
Sales
Houston Apartment Portfolio — Houston, TX
On November 10, 2014, the Account sold four multi-family properties from the Houston Apartment Portfolio located in Houston, Texas for a net sales price of $110.2 million, realizing a gain from the sale of $9.6 million, the majority of which had been previously recognized as unrealized gains in the Account’s consolidated statements of operations. The Account’s cost basis in the properties at the date of sale was $100.6 million.
Printemps de l’Homme — Paris, France
On November 17, 2014, the Account sold a retail property located in Paris, France for a net sales price of $282.4 million, realizing a gain from the sale of $23.2 million, the majority of which had been previously recognized as unrealized gains in the Account’s consolidated statements of operations. The Account’s cost basis in the property at the date of sale was $259.2 million.
275 Battery Street — San Francisco, CA
On December 18, 2014, the Account sold an office property located in San Francisco, California for a net sales price of $297.5 million, realizing a gain from the sale of $55.5 million, the majority of which had been previously recognized as unrealized gains in the Account’s consolidated statements of operations. The Account’s cost basis in the property at the date of sale was $242.0 million.
Financings
1401 H Street — Washington, DC
On October 7, 2014, the Account extinguished a $108.0 million mortgage loan associated with the property. Concurrent with this extinguishment, the Account entered into a new mortgage loan with a total principal of $115.0 million maturing on November 5, 2024. The debt has a 3.65% interest rate and is interest only through maturity.
TIAA Real Estate Account ¡ Prospectus99 |
Contractual obligations
The following table sets forth a summary regarding the Account’s known contractual obligations, including required interest payments for those items that are interest bearing, as of December 31, 2014 (amounts in millions):
|
|
|
|
|
|
|
|
|
|
|
|
|
|
|
|||||||||||||||||||||||||||||||||||
|
|
Amounts Due During Years Ending December 31, |
Thereafter |
Total |
||||||||||||||||||||||||||||||||||||||||||||||
2015 |
2016 |
2017 |
2018 |
2019 |
|||||||||||||||||||||||||||||||||||||||||||||
|
|||||||||||||||||||||||||||||||||||||||||||||||||
|
Mortgage Loans Payable: |
|
|
|
|
|
|
|
|
|
|
|
|
|
|
|||||||||||||||||||||||||||||||||||
|
Principal Payments |
|
|
$ |
|
185.8 |
|
|
$ |
|
188.5 |
|
|
$ |
|
51.9 |
|
|
$ |
|
16.8 |
|
|
$ |
|
112.4 |
|
|
$ |
|
1,782.1 |
|
|
$ |
|
2,337.5 |
||||||||||||||
|
Interest Payments(1) |
|
|
97.3 |
|
|
80.2 |
|
|
76.5 |
|
|
74.5 |
|
|
73.1 |
|
|
243.0 |
|
|
644.6 |
||||||||||||||||||||||||||||
|
|||||||||||||||||||||||||||||||||||||||||||||||||
|
Total Mortgage Loans Payable |
|
|
$ |
|
283.1 |
|
|
$ |
|
268.7 |
|
|
$ |
|
128.4 |
|
|
$ |
|
91.3 |
|
|
$ |
|
185.5 |
|
|
$ |
|
2,025.1 |
|
|
$ |
|
2,982.1 |
||||||||||||||
|
Other Commitments(2) |
|
|
0.2 |
|
|
— |
|
|
— |
|
|
— |
|
|
— |
|
|
— |
|
|
0.2 |
||||||||||||||||||||||||||||
|
Tenant improvements(3) |
|
|
63.9 |
|
|
— |
|
|
— |
|
|
— |
|
|
— |
|
|
— |
|
|
63.9 |
||||||||||||||||||||||||||||
|
|||||||||||||||||||||||||||||||||||||||||||||||||
|
Total Contractual Obligations |
|
|
$ |
|
347.2 |
|
|
$ |
|
268.7 |
|
|
$ |
|
128.4 |
|
|
$ |
|
91.3 |
|
|
$ |
|
185.5 |
|
|
$ |
|
2,025.1 |
|
|
$ |
|
3,046.2 |
||||||||||||||
|
|||||||||||||||||||||||||||||||||||||||||||||||||
(1) |
These amounts represent interest payments due on mortgage loans payable based on the stated rates at December 31, 2014. |
||
(2) |
This includes the Account’s commitment to purchase interest in its limited partnerships, which could be called by the partner at any time. |
||
(3) |
This amount represents tenant improvements and leasing inducements committed by the Account as of December 31, 2014. |
The Contractual Obligations above does not include payments on debt held in joint ventures, which are the obligation of the individual joint venture entities.
Effects of inflation and increasing operating expenses
Inflation, along with increased insurance, taxes, utilities and security costs, may increase property operating expenses in the future. Any such increases in operating expenses are generally billed to tenants either through contractual lease provisions in office, industrial, and retail properties or through rent increases in apartment complexes. The Account remains responsible for the expenses for unleased space in a property as well as expenses which may not be reimbursed under the terms of an existing lease.
Critical accounting policies
The consolidated financial statements of the Account are prepared in conformity with accounting principles generally accepted in the United States of America.
In preparing the Account’s consolidated financial statements, management is required to make estimates and judgments that affect the reported amounts of assets, liabilities, revenues, and expenses. Management bases its estimates on historical experience and assumptions that are believed to be reasonable under the circumstances, the results of which form the basis for making judgments about the carrying value of assets and liabilities that are not readily apparent from other sources. Actual results may differ from these estimates.
Determination of Investments at Fair Value: The Account reports all investments and investment related mortgage loans payable at fair value. The
100Prospectus ¡ TIAA Real Estate Account |
Financial Accounting Standards Board (“FASB”) has defined fair value as the price that would be received to sell an asset or paid to transfer a liability in an orderly transaction between market participants.
The following is a description of the valuation methodologies used to determine the fair value of the Account’s investments and investment related mortgage payables.
Valuation of Real Estate Properties — Investments in real estate properties are stated at fair value, as determined in accordance with policies and procedures reviewed by the Investment Committee of the Board and in accordance with the responsibilities of the Board as a whole. Accordingly, the Account does not record depreciation. Determination of fair value involves judgment because the actual fair value of real estate can be determined only by negotiation between the parties in a sales transaction. The Account’s primary objective when valuing its real estate investments will be to produce a valuation that represents a reasonable estimate of the fair value of its investments. Implicit in the Account’s definition of fair value are the consummation of a sale as of a specified date and the passing of title from seller to buyer under conditions whereby:
• |
Buyer and seller are typically motivated; |
||
• |
Both parties are well informed or well advised, and acting in what they consider their best interests; |
||
• |
A reasonable time is allowed for exposure in the open market; |
||
• |
Payment is made in terms of cash or in terms of financial arrangements comparable thereto; and |
||
• |
The price represents the normal consideration for the property sold unaffected by special or creative financing or sales concessions granted by anyone associated with the sale. |
Property and investment values are affected by, among other things, the availability of capital, occupancy rates, rental rates, and interest and inflation rates. As a result, determining real estate and investment values involves many assumptions. Key inputs and assumptions include rental income and expense amounts, related rental income and expense growth rates, discount rates and capitalization rates. Valuation techniques include discounted cash flow analysis, prevailing market capitalization rates or multiples applied to earnings from the property, analysis of recent comparable sales transactions, actual sale negotiations and bona fide purchase offers received from third parties. Amounts ultimately realized from each investment may vary significantly from the fair value presented.
Real estate properties owned by the Account are initially valued based on an independent third party appraisal, as reviewed by TIAA’s internal appraisal staff and as applicable the Account’s independent fiduciary at the time of the closing of the purchase, which may result in a potential unrealized gain or loss reflecting the difference between an investment’s fair value (i.e., exit price) and its cost basis (which is inclusive of transaction costs).
Subsequently, each property is appraised each quarter by an independent third party appraiser, reviewed by TIAA’s internal appraisal staff and as applicable the Account’s independent fiduciary. In general, the Account obtains appraisals of its
TIAA Real Estate Account ¡ Prospectus101 |
real estate properties spread out throughout the quarter, which is intended to result in appraisal adjustments, and thus, adjustments to the valuations of its holdings (to the extent such adjustments are made) that happen regularly throughout each quarter and not on one specific day or month in each period.
Further, management reserves the right to order an appraisal and/or conduct another valuation outside of the normal quarterly process when facts or circumstances at a specific property change. For example, under certain circumstances a valuation adjustment could be made when the account receives a bona fide bid for the sale of a property held within the Account or one of the Account’s joint ventures. In addition, adjustments may be made for events or circumstances indicating an impairment of a tenant’s ability to pay amounts due to the Account under a lease (including due to a bankruptcy filing of that tenant). Alternatively, adjustments may be made to reflect the execution or renewal of a significant lease. Also, adjustments may be made to reflect factors (such as sales values for comparable properties or local employment rate) bearing uniquely on a particular region in which the Account holds properties. TIAA’s internal appraisal staff oversees the entire appraisal process, in conjunction with the Account’s independent fiduciary (the independent fiduciary is more fully described in the paragraph below). Any differences in the conclusions of TIAA’s internal appraisal staff and the independent appraiser will be reviewed by the independent fiduciary, which will make a final determination on the matter (which may include ordering a subsequent independent appraisal).
The independent fiduciary, RERC, has been appointed by a special subcommittee of the Investment Committee of the Board to, among other things, oversee the appraisal process. The independent fiduciary must approve all independent appraisers used by the Account. All appraisals are performed in accordance with Uniform Standards of Professional Appraisal Practices, the real estate appraisal industry standards created by The Appraisal Foundation. Real estate appraisals are estimates of property values based on a professional’s opinion. Appraisals of properties held outside of the U.S. are performed in accordance with industry standards commonly applied in the applicable jurisdiction. These independent appraisers are always expected to be MAI-designated members of the Appraisal Institute (or its European equivalent, Royal Institute of Chartered Surveyors) and state certified appraisers from national or regional firms with relevant property type experience and market knowledge. Under the Account’s current procedures, each independent appraisal firm will be rotated off of a particular property at least every three years, although such appraisal firm may perform appraisals of other Account properties subsequent to such rotation.
Also, the independent fiduciary can require additional appraisals if factors or events have occurred that could materially change a property’s value (including those identified above) and such change is not reflected in the quarterly valuation review, or otherwise to ensure that the Account is valued appropriately. The independent fiduciary must also approve any valuation change of real estate-related assets where a property’s value changed by more than 6% from the most
102Prospectus ¡ TIAA Real Estate Account |
recent independent annual appraisal, or if the value of the Account would change by more than 4% within any calendar quarter or more than 2% since the prior calendar month. When a real estate property is subject to a mortgage, the property is valued independently of the mortgage and the property and mortgage fair values are reported separately (see Valuation of Mortgage Loans Payable below). The independent fiduciary reviews and approves all mortgage valuation adjustments before such adjustments are recorded by the Account. The Account continues to use the revised value for each real estate property and mortgage loan payable to calculate the Account’s daily net asset value until the next valuation review or appraisal.
Valuation of Real Estate Joint Ventures — Real estate joint ventures are stated at the fair value of the Account’s ownership interests of the underlying entities. The Account’s ownership interests are valued based on the fair value of the underlying real estate, any related mortgage loans payable, and other factors, such as ownership percentage, ownership rights, buy/sell agreements, distribution provisions and capital call obligations. Upon the disposition of all real estate investments by an investee entity, the Account will continue to state its equity in the remaining net assets of the investee entity during the wind down period, if any, which occurs prior to the dissolution of the investee entity.
Valuation of Real Estate Limited Partnerships — Limited partnership interests are stated at the fair value of the Account’s ownership in the partnership which are recorded based upon the changes in the net asset values of the limited partnerships as determined from the financial statements of the limited partnerships when received by the Account. Prior to the receipt of the financial statements from the limited partnerships, the Account estimates the value of its interest in good faith and will from time to time seek input from the issuer or the sponsor of the investments. Since market quotations are not readily available, the limited partnership interests are valued at fair value as determined in good faith by management under the direction of the Investment Committee of the Board and in accordance with the responsibilities of the Board as a whole.
Valuation of Marketable Securities — Equity securities listed or traded on any national market or exchange are valued at the last sale price as of the close of the principal securities market or exchange on which such securities are traded or, if there is no sale, at the mean of the last bid and asked prices on such market or exchange, exclusive of transaction costs.
Debt securities, other than money market instruments, are generally valued at the most recent bid price or the equivalent quoted yield for such securities (or those of comparable maturity, quality and type).
Short-term investments are valued in the same manner as debt securities, as described above.
Money market instruments are valued at amortized cost.
Equity and fixed income securities traded on a foreign exchange or in foreign markets are valued using their closing values under the valuation methods generally accepted in the country where traded, as of the valuation date. This value is converted to U.S. dollars at the exchange rate in effect on the valuation
TIAA Real Estate Account ¡ Prospectus103 |
day. Under certain circumstances (for example, if there are significant movements in the United States markets and there is an expectation the securities traded on foreign markets will adjust based on such movements when the foreign markets open the next day), the Account may adjust the value of equity or fixed income securities that trade on a foreign exchange or market after the foreign exchange or market has closed.
Valuation of Mortgage Loans Payable — Mortgage loans payable are stated at fair value. The estimated fair value of mortgage loans payable are based on the amount at which the liability could be transferred to a third party exclusive of transaction costs. Mortgage loans payable are valued internally by TIAA’s internal appraisal department, as reviewed by the Account’s independent fiduciary, at least quarterly based on market factors, such as market interest rates and spreads for comparable loans, the performance of the underlying collateral (such as the loan-to-value ratio and the cash flow of the underlying collateral), the liquidity for mortgage loans of similar characteristics, the maturity date of the loan, the return demands of the market.
Foreign currency transactions and translation: Portfolio investments and other assets and liabilities denominated in foreign currencies are translated into U.S. dollars at the exchange rates prevailing at the end of the period. Purchases and sales of securities, income receipts and expense payments made in foreign currencies are translated into U.S. dollars at the exchange rates prevailing on the respective dates of the transactions. The effect of any changes in foreign currency exchange rates on portfolio investments and mortgage loans payable are included in net realized and unrealized gains and losses on real estate properties and mortgage loans payable. Net realized gains and losses on foreign currency transactions include disposition of foreign currencies, and currency gains and losses between the accrual and receipt dates of portfolio investment income and between the trade and settlement dates of portfolio investment transactions.
Accumulation and Annuity Funds: The accumulation fund represents the net assets attributable to participants in the accumulation phase of their investment (“Accumulation Fund”). The annuity fund represents the net assets attributable to the participants currently receiving annuity payments (“Annuity Fund”). The net increase or decrease in net assets from investment operations is apportioned between the accounts based upon their relative daily net asset values. Once an Account participant begins receiving lifetime annuity income benefits, payment levels cannot be reduced as a result of the Account’s adverse mortality experience. In addition, the contracts pursuant to which the Account is offered are required to stipulate the maximum expense charge for all Account level expenses that can be assessed, which is not to exceed 2.5% of average net assets per year. The Account pays a fee to TIAA to assume mortality and expense risks.
Accounting for Investments: The investments held by the Account are accounted for as follows:
Real Estate Properties — Rent from real estate properties consists of all amounts earned under tenant operating leases, including base rent, recoveries of real estate taxes and other expenses and charges for miscellaneous services
104Prospectus ¡ TIAA Real Estate Account |
provided to tenants. Rental income is recognized in accordance with the billing terms of the lease agreements. The Account bears the direct expenses of the real estate properties owned. These expenses include, but are not limited to, fees to local property management companies, property taxes, utilities, maintenance, repairs, insurance, and other operating and administrative costs. An estimate of the net operating income earned from each real estate property is accrued by the Account on a daily basis and such estimates are adjusted when actual operating results are determined.
Real Estate Joint Ventures — The Account has limited ownership interests in various real estate joint ventures (collectively, the “joint ventures”). The Account records its contributions as increases to its investments in the joint ventures, and distributions from the joint ventures are treated as income within income from real estate joint ventures and limited partnerships in the Account’s consolidated statements of operations. Distributions that are identified as returns of capital are recorded as a reduction to the cost basis of the investment, whereas distributions identified as capital gains or losses are recorded as realized gains or losses. Income from the joint ventures is recorded based on the Account’s proportional interest of the income distributed by the joint ventures. Income earned by the joint ventures, but not yet distributed to the Account by the joint ventures is recorded as unrealized gains and losses.
Limited Partnerships — The Account has limited ownership interests in various private real estate funds (primarily limited partnerships) and a private real estate investment trust (collectively, the “limited partnerships”). The Account records its contributions as increases to the investments, and distributions from the investments are treated as income within income from real estate joint ventures and limited partnerships in the Account’s consolidated statements of operations. Distributions that are identified as returns of capital are recorded as a reduction to the cost basis of the investment, whereas distributions identified as capital gains or losses are recorded as realized gains or losses. Unrealized gains and losses are recorded based upon the changes in the net asset values of the limited partnerships as determined from the financial statements of the limited partnerships when received by the Account. Prior to the receipt of the financial statements from the limited partnerships, the Account estimates the value of its interest in good faith and will from time to time seek input from the issuer or the sponsor of the investment. Changes in value based on such estimates are recorded by the Account as unrealized gains and losses.
Marketable Securities — Transactions in marketable securities are accounted for as of the date the securities are purchased or sold (trade date). Interest income is recorded as earned. Dividend income is recorded on the ex-dividend date within dividend income. Dividends that are identified as returns of capital are recorded as a reduction to the cost basis of the investment, whereas dividends identified as capital gains or losses are recorded as realized gains or losses. Realized gains and losses on securities transactions are accounted for on the specific identification method.
TIAA Real Estate Account ¡ Prospectus105 |
Realized and Unrealized Gains and Losses — Unrealized gains and losses are recorded as the fair values of the Account’s investments are adjusted, and as discussed within the Real Estate Joint Ventures and Limited Partnerships sections above. Realized gains and losses are recorded at the time an investment is sold or a distribution is received from the joint ventures or limited partnerships. Real estate transactions are accounted for as of the date on which the purchase or sale transactions for the real estate properties close (settlement date). The Account recognizes a realized gain on the sale of a real estate property to the extent that the contract sales price exceeds the cost-to-date of the property being sold. A realized loss occurs when the cost-to-date exceeds the sales price.
Net Assets — The Account’s net assets as of the close of each valuation day are valued by taking the sum of:
• |
the value of the Account’s cash; cash equivalents, and short-term and other debt instruments; |
||
• |
the value of the Account’s other securities and other non-real estate assets; |
||
• |
the value of the individual real properties (based on the most recent valuation of that property) and other real estate-related investments owned by the Account; |
||
• |
an estimate of the net operating income accrued by the Account from its properties, other real estate-related investments and non-real estate-related investments (including short-term marketable securities) since the end of the prior valuation day; and |
||
• |
actual net operating income earned from the Account’s properties, other real estate-related investments and non-real estate-related investments (but only to the extent any such item of income differs from the estimated income accrued for on such investments), |
and then reducing the sum by liabilities held within the Account, including the daily investment management fee, administration and distribution fees and certain other expenses attributable to operating the Account.
After the end of every quarter, the Account reconciles the amount of expenses deducted from the Account (which is established in order to approximate the costs that the Account will incur) with the expenses the Account actually incurred. If there is a difference, the Account adds it to or deducts it from the Account in equal daily installments over the remaining days of the following quarter. Material differences may be repaid in the current calendar quarter. The Account’s at-cost deductions are based on projections of Account assets and overall expenses, and the size of any adjusting payments will be directly affected by the difference between management’s projections and the Account’s actual assets or expenses.
Federal Income Taxes: Based on provisions of the Internal Revenue Code, Section 817, the Account is taxed as a segregated asset account of TIAA and as such, the Account should incur no material federal income tax attributable to the net investment activity of the Account.
106Prospectus ¡ TIAA Real Estate Account |
Quantitative and qualitative disclosures about market risk
The Account’s real estate holdings, including real estate joint ventures and limited partnerships, which, as of December 31, 2014, represented 74.5% of the Account’s total investments, expose the Account to a variety of risks. These risks include, but are not limited to:
• |
General Real Estate Risk — The risk that the Account’s property values or rental and occupancy rates could go down due to general economic conditions, a weak market for real estate generally, disruptions in the credit and/or capital markets, or changing supply and demand for certain types of properties; |
||
• |
Appraisal Risk — The risk that the sale price of an Account property (i.e., the value that would be determined by negotiations between independent parties) might differ substantially from its estimated or appraised value, leading to losses or reduced profits to the Account upon sale; |
||
• |
Risk Relating to Property Sales — The risk that the Account might not be able to sell a property at a particular time for its full value, particularly in a poor market. This might make it difficult to raise cash quickly and also could lead to Account losses; |
||
• |
Risks of Borrowing — The risk that interest rate changes may impact Account returns if the Account takes out a mortgage on a property, buys a property subject to a mortgage or holds a property subject to a mortgage, and hedging against such interest rate changes, if undertaken by the Account, may entail additional costs and be unsuccessful; and |
||
• |
Foreign Currency Risk — The risk that the value of the Account’s foreign investments, related debt, or rental income could increase or decrease due to changes in foreign currency exchange rates or foreign currency exchange control regulations, and hedging against such currency changes, if undertaken by the Account, may entail additional costs and be unsuccessful. |
The Account believes the diversification of its real estate portfolio, both geographically and by sector, along with its quarterly valuation procedure, helps manage the real estate and appraisal risks described above.
As of December 31, 2014, 25.5% of the Account’s total investments were comprised of marketable securities. Marketable securities include high-quality debt instruments (i.e., government agency notes) and REIT securities. The consolidated schedules of investments for the Account sets forth the general financial terms of these instruments, along with their fair values, as determined in accordance with procedures described earlier in Critical Accounting Policies section above and in Note 1 — Organization and Significant Accounting Policies to the Account’s consolidated financial statements included herewith. As of the date of this report, the Account does not invest in derivative financial investments, nor does the Account engage in any hedging activity, although it may do so in selected circumstances in the future.
TIAA Real Estate Account ¡ Prospectus107 |
Risks associated with investments in real estate-related liquid assets (which could include, from time to time, REIT securities and CMBS), and non-real estate-related liquid assets, including financial/credit risk, market volatility risk, interest rate volatility risk and deposit/money market risk.
• |
Financial/Credit Risk — The risk, for debt securities, that the issuer will not be able to pay principal and interest when due (and/or declare bankruptcy or be subject to receivership) and, for equity securities such as common or preferred stock, that the issuer’s current earnings will fall or that its overall financial soundness will decline, reducing the security’s value. |
||
• |
Market Volatility Risk — The risk that the Account’s investments will experience price volatility due to changing conditions in the financial markets regardless of the credit quality or financial condition of the underlying issuer. This risk is particularly acute to the extent the Account holds equity securities, which have experienced significant short-term price volatility over the past year. Also, to the extent the Account holds debt securities, changes in overall interest rates can cause price fluctuations. |
||
• |
Interest Rate Volatility — The risk that interest rate volatility may affect the Account’s current income from an investment. |
||
• |
Deposit/Money Market Risk — The risk that, to the extent the Account’s cash held in bank deposit accounts exceeds federally insured limits as to that bank, the Account could experience losses if banks fail. The Account does not believe it has exposure to significant concentration of deposit risk. In addition, there is some risk that investments held in money market accounts can suffer losses. |
In addition, to the extent the Account were to hold mortgage-backed securities (including commercial mortgage-backed securities) these securities are subject to prepayment risk or extension risk (i.e., the risk that borrowers will repay the loans earlier or later than anticipated). If the underlying mortgage assets experience faster than anticipated repayments of principal, the Account could fail to recoup some or all of its initial investment in these securities, since the original price paid by the Account was based in part on assumptions regarding the receipt of interest payments. If the underlying mortgage assets are repaid later than anticipated, the Account could lose the opportunity to reinvest the anticipated cash flows at a time when interest rates might be rising. The rate of prepayment depends on a variety of geographic, social and other functions, including prevailing market interest rates and general economic factors. The fair value of these securities is also highly sensitive to changes in interest rates. Note that the potential for appreciation, which could otherwise be expected to result from a decline in interest rates, may be limited by any increased prepayments. These securities may be harder to sell than other securities.
In addition to these risks, real estate equity securities (such as REIT stocks and mortgage-backed securities) would be subject to many of the same general risks inherent in real estate investing, making mortgage loans and investing in
108Prospectus ¡ TIAA Real Estate Account |
debt securities. For more information on the risks associated with all of the Account’s investments, see the section above entitled “Risk factors.”
TIAA offers the Real Estate Account as a variable option for the annuity contracts described below. Some employer plans may not offer the Real Estate Account as an option for RA, GA, SRA, GRA, GSRA (including institutionally owned GSRA), Retirement Choice, Retirement Choice Plus or Keogh contracts. CREF is a companion organization to TIAA. A companion CREF contract may have been issued to you when you received the TIAA contract offering the Account. For more information about the CREF annuity contracts, the TIAA Traditional Annuity, the TIAA Access variable annuity accounts, other TIAA annuities and separate accounts offered from time to time and particular funds and investment options offered under the terms of your plan, please see the applicable contracts and respective prospectuses for those investment options.
Importantly, neither TIAA nor CREF guarantee the investment performance of the Account nor do they guarantee the value of your units at any time.
RA (Retirement Annuity) and GRA (Group Retirement Annuity)
RA and GRA contracts are used mainly for employee retirement plans. RA contracts are issued directly to you. GRA contracts, which are group contracts, are issued through an agreement between your employer and TIAA.
Depending on the terms of your employer’s plan, RA premiums can be paid by your employer, you, or both. GRA premiums can only be paid by your employer (though some such premiums may be paid by your employer pursuant to a salary reduction agreement). If you’re paying some or all of the entire periodic premium, your contributions can be in either pre-tax dollars by salary reduction or after-tax dollars by payroll deduction. Your employer may offer you the option of making contributions in the form of after-tax Roth IRA-style contributions, though you won’t be able to take tax deductions for these contributions. You can also transfer accumulations from another investment choice under your employer’s plan to your contract. Your GRA premiums can be from pre-tax or after-tax contributions. Ask your employer for more information about these contracts. As with RAs, you can transfer your accumulations from another investment choice under your employer’s plan to your GRA contract.
SRA (Supplemental Retirement Annuity) and GSRA (Group Supplemental Retirement Annuity)
These are generally limited to supplemental voluntary tax-deferred annuity (“TDA”) plans and supplemental 401(k) plans. SRA contracts are issued directly to you. GSRA contracts, which are group contracts, are issued through an agreement between your employer and TIAA. Generally, your employer pays
TIAA Real Estate Account ¡ Prospectus109 |
premiums in pre-tax dollars through salary reduction. Your employer may offer you the option of making contributions in the form of after-tax Roth IRA-style contributions, though you won’t be able to take tax deductions for these contributions. Although you can’t pay premiums directly, you can transfer amounts from other TDA plans subject to the terms of the plan.
Retirement Choice/Retirement Choice Plus annuities
These are very similar in operation to the GRAs and GSRAs, respectively, except that, unlike GRAs, they are issued directly to your employer or your plan’s trustee, and they may be issued to your employer directly without participant recordkeeping. Among other rights, the employer retains the right to transfer accumulations under these contracts to alternate funding vehicles.
Classic IRA and Roth IRA
Classic IRAs are individual contracts issued directly to you. You and your spouse can each open a Classic IRA with an annual contribution of up to $5,500 or by rolling over funds from another IRA or eligible retirement plan, if you meet the Account’s eligibility requirements. If you are age 50 or older, you may contribute up to $6,500. The combined limit for your contributions to a Classic IRA and a Roth IRA for a single year is $5,500, or $6,500 if you are age 50 or older, excluding rollovers. (The dollar limits listed are for 2015; different dollar limits may apply in future years.)
Roth IRAs are also individual contracts issued directly to you. You and your spouse can each open a Roth IRA with an annual contribution up to $5,500 or with a rollover from another IRA or a Classic IRA issued by TIAA if you meet the Account’s eligibility requirements, subject to rules applicable to Roth IRA conversions. If you are age 50 or older you may contribute up to $6,500. The combined limit for your contributions to a Classic IRA and a Roth IRA for a single year is $5,500, or $6,500 if you are age 50 or older, excluding rollovers. (The dollar limits listed are for 2015; different dollar limits may apply in future years.)
We can’t issue a joint Classic IRA or Roth IRA contract. Your employer may offer SEP IRAs (Simplified Employee Retirement Plans), which are subject to different rules.
Classic and Roth IRAs may together be referred to as “IRAs” in this prospectus.
GA (Group Annuity) and institutionally owned GSRAs
These are used exclusively for employer retirement plans and are issued directly to your employer or your plan’s trustee. Your employer pays premiums directly to TIAA (you can’t pay the premiums directly to TIAA) and your employer or the plan’s trustee may control the allocation of contributions and transfers to and from these contracts including withdrawing completely from the Account. If a GA or Institutionally Owned GSRA contract is issued pursuant to your plan, the rules relating to transferring and withdrawing your money, receiving any annuity income
110Prospectus ¡ TIAA Real Estate Account |
or death benefits, and the timing of payments may be different, and are determined by your plan. Ask your employer or plan administrator for more information.
Keogh contracts
TIAA offered contracts under Keogh plans. If you are a self-employed individual who owns an unincorporated business, you could, prior to 2013, use the Account’s Keogh contracts for a Keogh plan, and cover common law employees, subject to the Account’s eligibility requirements. Note, however, that while TIAA will offer new contracts for new entrants into Keogh plans established prior to 2013, it will no longer offer contracts for Keogh plans that the Account is not currently funding.
ATRA (after-tax retirement annuity)
The after-tax retirement annuities (“ATRA”) are individual non-qualified deferred annuity contracts, issued to participants who are eligible and would like to remit personal premiums under the contractual provisions of their RA contract. To be eligible, you must have an active and premium-paying or paid up RA contract.
Note that the tax rules governing these non-qualified contracts differ significantly from the treatment of qualified contracts. Please see the section below entitled “Taxes” for more information.
Eligibility for IRA and KEOGH contracts
Each of you and your spouse can open a Classic or Roth IRA or a Keogh, subject to the limitations described above, if you’re a current or retired employee or trustee of an Eligible Institution, or if you own a TIAA or CREF annuity contract or a TIAA individual insurance contract. To be considered a retired employee for this purpose, an individual must be at least 55 years old and have completed at least three years of service at an Eligible Institution. In the case of partnerships, at least half the partners must be eligible individuals and the partnership itself must be primarily engaged in education or research. Eligibility may be restricted by certain income limits on opening Roth IRA contracts.
State regulatory approval
State regulatory approval may be pending for certain of these contracts, and these contracts may not currently be available in your state.
Starting out
Generally, we’ll issue you a TIAA contract when we receive a completed application or enrollment form in good order. “Good order” means actual receipt of the transaction request along with all information and supporting legal documentation necessary to effect the transaction. This information and documentation generally includes your complete application and any other information or supporting documentation we may require. With respect to
TIAA Real Estate Account ¡ Prospectus111 |
purchase requests, “good order” also generally includes receipt of sufficient funds by us to effect the transaction. We may, in our sole discretion, determine whether any particular transaction request is in good order and reserve the right to change or waive any good order requirement at any time either in general or with respect to a particular plan, contract or transaction.
If your application is incomplete and we do not receive the necessary information and signed application in good order within five business days of our receipt of the initial premium, we will return the initial premium at that time.
If we receive premiums from your employer and, where applicable, a completed application from you before we receive your specific allocation instructions (or if your allocation instructions violate employer plan restrictions or do not total 100%), we will invest all premiums remitted on your behalf in the default option your employer has designated. It is possible that the default option will not be the Real Estate Account but will be another investment option available under your plan. We consider your employer’s designation of a default option to be an instruction to us to allocate your premiums to that option as described above. You should consult your plan documents or sales representative to determine your employer’s designated default option and to obtain information about that option. Further, to the extent you hold an IRA contract, the default option will be that fund or account specified in your IRA forms.
When we receive complete allocation instructions from you in good order, we’ll follow your instructions for future premiums. However, if you want the premiums previously allocated to the default option (and earnings and losses on them) to be transferred to the options identified in your instructions, you must specifically request that we transfer these amounts from the default option to your investment option choices.
Amounts may be invested in an account other than the Real Estate Account (absent a participant’s specific instructions) only in the limited circumstances identified in the paragraph immediately above and the circumstances outlined under the section below entitled “How to transfer and withdraw your money — Restrictions on premiums and transfers to the account”, namely: (1) we receive premiums before we receive your completed application or allocation instructions, (2) a participant’s allocations violate employer plan restrictions or do not total 100%, or (3) we stop accepting premiums for and/or transfers into the Account.
TIAA doesn’t generally restrict the amount or frequency of payment of premiums to your contract, although we may in the future. Your employer’s retirement plan may limit your premium amounts. There also may be restrictions on remitting premiums on an IRA. In addition, the Code limits the total annual premiums you may invest in plans qualified for favorable tax treatment. If you want to directly contribute personal premiums under the contractual provisions of your RA contract, you will be issued an ATRA contract. Premiums and any earnings on the ATRA contract will not be subject to your employer’s retirement plan. The restrictions relating to these premiums are in the contract itself.
112Prospectus ¡ TIAA Real Estate Account |
In most cases (subject to any restriction we may impose, as described in this prospectus), TIAA accepts premiums to a contract during your accumulation period. Once your first premium has been paid, your TIAA contract can’t lapse or be forfeited for nonpayment of premiums. However, TIAA can stop accepting premiums to the Real Estate Account at any time.
You may remit premium payments to the following address: P.O. Box 1259, Charlotte, N.C. 28201.
Note that we cannot accept money orders or travelers checks. In addition, we will not accept a third-party check where the relationship of the pay or to the account owner cannot be identified from the face of the check.
You will receive a confirmation statement each time you make a transfer to, a transfer out, or a cash withdrawal from the Account. The statement will show the date and amount of each transaction. However, if you’re remitting premiums through an employer or other qualified plan, using an automatic investment plan or systematic withdrawal plan, you may instead receive a statement confirming those transactions following the end of each calendar quarter.
If you have any accumulations in the Account, you will be sent a statement in each quarter which sets forth the following information:
(1) |
Premiums paid during the quarter; |
||
(2) |
The number and dollar value of accumulation units in the Account credited to you during the quarter and in total; |
||
(3) |
Cash withdrawals, if any, from the Account during the quarter; and |
||
(4) |
Any transfers during the quarter. |
You also will receive reports containing the financial statements of the Account and certain information about the Account’s investments.
Important information about procedures for opening a new account
To help the U.S. government fight the funding of terrorism and money laundering activities, Federal law requires all financial institutions to obtain, verify and record information that identifies each person who opens an account.
What this means for you: When you open an account, we will ask for your name, street address (not a post office box), date of birth, Social Security number and other information that will allow us to identify you, such as your home telephone number and driver’s license or certain other identifying documents. Until you provide us with the information needed, we may not be able to open an account or effect any transactions for you. Furthermore, if we are unable to verify your identity, or that of another person authorized to act on your behalf, or if it is believed that potentially criminal activity has been identified, we reserve the right to take such action as deemed appropriate, which may include closing your account.
TIAA Real Estate Account ¡ Prospectus113 |
Choosing among investment accounts
Once an account is opened on your behalf, you may allocate all or part of your premiums to the Real Estate Account, unless your employer’s plan precludes that choice. You can also allocate premiums to TIAA’s Traditional Annuity, the CREF variable investment accounts, the TIAA Access variable annuity accounts, other TIAA annuities and separate accounts offered from time to time (if available under the terms of your employer’s plan) and, in some cases, certain funds if the account or fund is available under your employer’s plan.
You can change your allocation choices for future premiums by:
• |
writing to our office at P.O. Box 1259, Charlotte, N.C. 28201; |
||
• |
using the TIAA-CREF Web Center’s account access feature at www.tiaa-cref.org; or |
||
• |
calling our Automated Telephone Service (24 hours a day) at 800 842-2252. |
The right to cancel your contract
Generally, you may cancel any RA, SRA, GSRA, Classic IRA, Roth IRA, ATRA or Keogh contract in accordance with the contract’s Right to Examine provision (unless we have begun making annuity payments from it) and subject to the time period regulated by the state in which the contract is issued. Although the contract terms and state law provisions differ, you will generally have between 10 and 60 days to exercise this cancellation right. To cancel a contract, you must mail or deliver the contract with your cancellation instructions (or signed Notice of Cancellation when such has been provided with your contract) to our home office. We’ll cancel the contract, then send either the current accumulation or the premium, depending on the state in which your contract was issued, to whomever originally submitted the premiums. Unless we are returning premiums paid as required by state law, you will bear the investment risk during this period.
Determining the value of your interest in the account — accumulation units
Each payment to the Real Estate Account buys a number of accumulation units. Similarly, any withdrawal from the Account results in the redemption of a number of accumulation units. The price you pay for accumulation units, and the price you receive for accumulation units when you redeem accumulation units, is the value of the accumulation units calculated for the business day on which we receive your purchase, redemption or transfer request in good order (unless you ask for a later date for a redemption or transfer). This date is called the “effective date.” Therefore, if we receive your purchase, redemption or transfer request in good order before the NYSE closes, that business day will be considered the effective date of your order. If we receive your request in good order after the NYSE closes, the next business day will be considered the effective date of your order.
Payments and orders to redeem accumulation units (or adjustments thereto) may be processed after the effective date. “Processed” means when amounts
114Prospectus ¡ TIAA Real Estate Account |
are credited or debited to you in the Account. In the event there are market fluctuations between the effective date and the processing date and the price of accumulation units on the processing date is higher or lower than your price on the effective date, that difference will be paid or retained by Services, the Account’s distributor. This amount, which may be positive or negative, together with similar amounts paid or retained by Services in connection with transactions involving other investment products offered under pension plans administered by TIAA or its affiliates and the amount of interest, if any, paid by Services to participants in connection with certain delayed payments, is apportioned to the Account pursuant to an agreement with Services, under which the Account reimburses Services for the services it has provided to the Account.
The accumulation unit value reflects the Account’s investment experience (i.e., the real estate net operating income accrued, as well as dividends, interest and other income accrued), realized and unrealized capital gains and losses, as well as Account expense charges.
Calculating Accumulation Unit Values: We calculate the Account’s accumulation unit value at the end of each valuation day. To do that, we multiply the previous day’s value by the net investment factor for the Account. The net investment factor is calculated as A divided by B, where A and B are defined as:
A. |
The value of the Account’s net assets at the end of the current valuation period, less premiums received during the current valuation period. |
||
B. |
The value of the Account’s net assets at the end of the previous valuation period, plus the net effect of transactions made at the start of the current valuation period. |
How to transfer and withdraw your money
Generally, depending on the terms of your plan, contracts, tax law and applicable governing documents, TIAA allows you to move your money to and from the Real Estate Account in the following ways:
• |
from the Real Estate Account to a CREF investment account, a TIAA Access variable account (if available) or TIAA’s Traditional Annuity; |
||
• |
to the Real Estate Account from a CREF investment account, a TIAA Access variable account (if available) or TIAA’s Traditional Annuity (transfers from TIAA’s Traditional Annuity under RA, GRA or Retirement Choice contracts are subject to restrictions); |
||
• |
from the Real Estate Account to a fund (including TIAA-CREF affiliated funds), if available under your plan; |
||
• |
to the Real Estate Account from a TIAA-CREF affiliated fund, if available under your plan; |
||
• |
depending on the terms of your plan, contracts and governing instruments, to the Real Estate Account from other TIAA annuity products and separate accounts, and/or from the Real Estate Account to other TIAA annuity products and separate accounts; |
TIAA Real Estate Account ¡ Prospectus115 |
• |
from the Real Estate Account to investment options offered by other companies, if available under your plan; |
||
• |
to the Real Estate Account from other companies/plans; |
||
• |
by withdrawing cash; and |
||
• |
by setting up a program of automatic withdrawals or transfers. |
For more information regarding the transfer policies of CREF, TIAA Access, TIAA’s Traditional Annuity or another investment option listed above, please see the respective contract, prospectus or other governing instrument. These options may be limited by the terms of your employer’s plan, by current tax law, or by the terms of your contract, as set forth below.
Currently, transfers from the Real Estate Account to any TIAA annuity offered by your employer’s plan, to one of the CREF accounts or to funds offered under the terms of your plan must generally be at least $1,000 (except for systematic transfers, which must be at least $100) or your entire accumulation, if less. In the future, we may eliminate these minimum transaction levels. Lump sum cash withdrawals from the Real Estate Account and transfers to other companies are not subject to a minimum amount. Transfers and cash withdrawals are currently free. TIAA can place restrictions on transfers or charge fees for transfers and/or withdrawals in the future.
As indicated, transfers and cash withdrawals are effective at the end of the business day we receive your request and all required documentation in good order. You can also choose to have transfers and withdrawals take effect at the close of any future valuation day. For any transfers to TIAA’s Traditional Annuity, the crediting rate will be the rate in effect at the close of business of the first day that you participate in TIAA’s Traditional Annuity, which is the next business day after the effective date of the transfer.
To request a transfer or to withdraw cash, you may:
• |
write to TIAA’s office at P.O. Box 1259, Charlotte, N.C. 28201; |
||
• |
call us at 800 842-2252; or |
||
• |
use the TIAA-CREF Web Center’s account access feature at www.tiaa-cref.org. |
If you are married, and all or part of your accumulation is attributable to contributions made under
• |
an employer plan subject to ERISA; or |
||
• |
an employer plan that provides for spousal rights to benefits, then only to the extent required by the Internal Revenue Code the (“Code”) or ERISA or the terms of your employer plan, your rights to choose certain benefits are restricted by the rights of your spouse to benefits. |
You may be required to complete and return certain forms (in good order) to effect these transactions. We can limit, suspend or terminate your ability to transact by telephone, over the Internet, or by fax at any time, for any reason.
Before you transfer or withdraw cash, please make sure that you consult the terms of your employer’s plan, as it may contain additional restrictions. In
116Prospectus ¡ TIAA Real Estate Account |
addition, please make sure you understand the possible federal and other income tax consequences. Please see the section below entitled “Taxes.”
Transfers to and from other TIAA-CREF accounts and funds
Transfers from the Real Estate Account. Once every calendar quarter you can transfer some or all of your accumulation in the Real Estate Account to TIAA’s Traditional Annuity, to another TIAA annuity offered by your employer’s plan, to one of the CREF accounts, to a TIAA Access variable annuity account or to funds (which may include TIAA-CREF affiliated funds) offered under the terms of your employer’s plan. Transfers to TIAA’s Traditional Annuity or other TIAA annuities or accounts, a CREF account or to certain other options may be restricted by your employer’s plan, current tax law or by the terms of your contract. In addition, there are important exceptions to this once per calendar quarter limitation, as outlined in the section below entitled “How to transfer and withdraw your money — Market timing/excessive trading policy.”
Transfers to the Real Estate Account. Currently, you can also transfer some or all of your accumulation in TIAA’s Traditional Annuity, in your CREF accounts, TIAA Access variable annuity accounts or in the funds or TIAA annuities offered under the terms of your plan to the Real Estate Account, if your employer’s plan offers the Account; subject to the terms of the plan, current tax law and the terms of your contract. Transfers from TIAA’s Traditional Annuity to the Real Estate Account under RA, GRA or Retirement Choice contracts can only be effected over a period of time (up to 10 annual installments) and may be subject to other limitations, as specified in your contract. Amounts held under an ATRA contract cannot be transferred to or from any retirement plan contract.
Currently, these transfers must generally be at least $1,000 (except for systematic transfers, which must be at least $100) or your entire accumulation, if less. Because excessive transfer activity can hurt Account performance and other participants, subject to applicable state law and the terms of your contract, we may seek to further limit how often, or in what amounts, you may make transfers, or we may otherwise modify the transfer privilege generally. Please see the section below entitled “How to transfer and withdraw your money — Restrictions on premiums and transfers to the Account.”
Transfers to other companies
Generally you may transfer funds from the Real Estate Account to a company other than TIAA or CREF, subject to certain tax restrictions. This right may be limited by your employer’s plan or the terms of your contract. If your employer participates in our special transfer services program, we can make automatic monthly transfers from your RA or GRA contract to another company. Roth amounts in a 403(b) or 401(a) plan can only be rolled over to another Roth account under such plan or to a Roth IRA, as permitted by applicable law and the terms of the plans. IRA to IRA rollover rules have recently changed. See the section below entitled “Taxes” for more information on these developments.
TIAA Real Estate Account ¡ Prospectus117 |
Under the Retirement Choice and Retirement Choice Plus contracts, your employer could transfer monies from the Account and apply it to another account or investment option, subject to the terms of your plan, and without your consent.
Transfers from other companies/plans
Subject to your employer’s plan and federal tax law, you can usually transfer or roll over money from another 403(b), 401(a)/403(a) or governmental 457(b) retirement plan to your qualified TIAA contract. You may also roll over before-tax amounts in a Traditional IRA to 403(b) plans, 401(a)/403(a) plans or eligible governmental 457(b) plans, provided such employer plans agree to accept the rollover. Roth amounts in a 403(b) or 401(a) plan can only be rolled over to another Roth account under such plan or to a Roth IRA, as permitted by applicable law and the terms of the plans. Funds in a private 457(b) plan can be transferred to another private 457(b) plan only. Accumulations in private 457(b) plans may not be rolled over to a qualified plan (e.g., a 401(a) plan), a 403(b) plan, a governmental 457(b) plan or an IRA. IRA to IRA rollover rules have recently changed. See the section below entitled “Taxes” for more information on these developments.
Withdrawing cash
You may withdraw cash from your SRA, GSRA, IRA, ATRA or Keogh Real Estate Account accumulation at any time during the accumulation period, provided federal tax law and the terms of your employer’s plan permit it (see below). Normally, you can’t withdraw money from a contract if you’ve already applied that money to begin receiving lifetime annuity income. Current federal tax law restricts your ability to make cash withdrawals from your accumulation under most voluntary salary reduction agreements.
Withdrawals are generally available only if you reach age 591/2, leave your job, become disabled, die, satisfy requirements related to qualified reservist distributions or if your employer terminates its retirement plan. If your employer’s plan permits, you may also be able to withdraw money if you encounter hardship, as defined by the IRS, but hardship withdrawals can be from contributions only, and not investment earnings. You may be subject to a 10% penalty tax if you make a withdrawal before you reach age 591/2, unless an exception applies to your situation.
Under current federal tax law, you are not permitted to withdraw from 457(b) plans earlier than the calendar year in which you reach age 701/2, leave your job or are faced with an unforeseeable emergency (as defined by law). There are generally no early withdrawal tax penalties if you withdraw under any of these circumstances (i.e., no 10% tax on distributions prior to age 591/2). If you’re married, you may be required by law or your employer’s plan to show us advance written consent from your spouse before TIAA makes certain transactions on your behalf.
Special rules and restrictions apply to Classic and Roth IRAs.
118Prospectus ¡ TIAA Real Estate Account |
If you request a withdrawal, we will send the proceeds by check to the address of record, or by electronic funds transfer to the bank account on file. A letter of instruction with a bank signature guarantee is required if the withdrawal is sent to an address other than the address of record, or to an address of record that has been changed within either the last 30 or 14 calendar days, depending on the service model applicable to your plan. You may obtain a signature guarantee from some commercial or savings banks, credit unions, trust companies, or member firms of a U.S. stock exchange. A notary public cannot provide a signature guarantee. Proceeds directed to a bank account not on file have similar restrictions that require completion of a verification process. Please contact us for further information. We reserve the right to require a signature guarantee on any redemption.
Systematic withdrawals and transfers
If your employer’s plan allows, you can set up a program to make cash withdrawals or transfers automatically by specifying that we withdraw from your Real Estate Account accumulation, or transfer to or from the Real Estate Account, any fixed number of accumulation units, dollar amount, or percentage of accumulation until you tell us to stop or until your accumulation is exhausted. Currently, the program must be set up so that at least $100 is automatically transferred or withdrawn at a time. In the future, we may eliminate this minimum transfer amount. Further, a systematic plan of this type may allow pre-specified transfers or withdrawals to be made more often than quarterly, depending on the terms of your employer’s plan.
Withdrawals to pay financial advisor fees
If permitted by your employer’s plan, you may authorize a series of systematic withdrawals to pay the fees of a financial advisor. Such systematic withdrawals are subject to all provisions applicable to systematic withdrawals, except as otherwise described in this section. One series of systematic withdrawals to pay financial advisor fees may be in effect at the same time that one other series of systematic withdrawals is also in effect. Systematic withdrawals to pay financial advisor fees must be scheduled to be made quarterly only, on the first day of each calendar quarter. The amount withdrawn from each investment account must be specified in dollars or as a percentage of accumulation, and will be in proportion to the accumulations in each account at the end of the business day prior to the withdrawal. The financial advisor may request that we stop making withdrawals. We reserve the right to determine the eligibility of financial advisors for this type of fee reimbursement. Before you set up this program, make sure you understand the possible tax consequences of these withdrawals. Please see the discussion in the section below entitled “Taxes.”
Restrictions on premiums and transfers to the Account
From time to time we may stop accepting premiums for and/or transfers into the Account. We might do so if, for example, we can’t find enough appropriate
TIAA Real Estate Account ¡ Prospectus119 |
real estate-related investment opportunities at a particular time. Whenever reasonably possible, we will notify you before we decide to restrict premiums and/or transfers. However, because we may need to respond quickly to changing market conditions or to the liquidity needs and demands of the Account, we reserve the right (subject to the terms of some contracts) to stop accepting premiums and/or transfers at any time without prior notice.
Individual participants are limited from making internal funding vehicle transfers into their Account accumulation if, after giving effect to such transfer, the total value of such participant’s Account accumulation (under all contracts issued to such participant) would exceed $150,000.
As of the date of this prospectus, all jurisdictions in which the Account is offered have approved this limitation, but the effective date of the limitation as applies to an individual participant will be reflected on his or her applicable contract or endorsement form. These contracts or endorsements will contain important details with respect to this limitation.
Under this limitation, an internal funding vehicle transfer means the movement (or attempted movement) of accumulations from any of the following to the Account:
• |
a TIAA Traditional Annuity accumulation, |
||
• |
a Real Estate Account accumulation (from one contract to another), |
||
• |
a companion CREF certificate, |
||
• |
other TIAA separate account accumulations, and |
||
• |
any other funding vehicle accumulation which is administered by TIAA or CREF on the same record-keeping system as the contract. |
The following transfers are currently not subject to this limitation:
• |
systematic transfers, |
||
• |
automatic rebalancing activity, |
||
• |
any transaction arising from a TIAA-sponsored advice product or service, and |
||
• |
Transfer Payout Annuity payments directed to the Account. |
This limitation does not apply to most types of premium contributions and certain group contracts recordkept on non-TIAA platforms. Minimum Distribution Option (“MDO”) contracts will be subject to this limitation, but the limitation does not apply to other annuity pay-out contracts.
A transfer which cannot be applied pursuant to this limitation, along with any other attempted movements of funds submitted as part of a noncompliant transfer request into the Account, will be rejected in its entirety, and therefore the funds that were to be transferred will remain in the investment option from which the transfer was to be made. The Account accumulation unit values used in applying this provision will be those calculated as of the valuation day preceding the day on which the proposed transfer is to be effective. A participant will not be required to reduce his or her accumulation to a level at or below $150,000 if the total value of the participant’s Account accumulation under all contracts exceeds $150,000 on the effective date as indicated in the contract or contract endorsement. TIAA reserves the right in the future to modify the nature of this
120Prospectus ¡ TIAA Real Estate Account |
limitation and to include categories of transactions associated with services that may be introduced in the future.
If we decide to stop accepting premiums into the Account, amounts that would otherwise be allocated to the Account will be allocated to the default option designated by your employer instead (or the default option specified on your IRA forms), unless you give us other allocation instructions. We will not transfer these amounts out of the default option designated by your employer when the restriction period is over, unless you request that we do so. However, we will resume allocating premiums to the Account on the date we remove the restrictions.
Additional limitations
Federal law requires us to obtain, verify and record information that identifies each person who opens an account. Until we receive the information we need, we may not be able to effect transactions for you. Furthermore, if we are unable to verify your identity, or that of another person authorized to act on your behalf, or if we believe that we have identified potentially criminal activity, we reserve the right to take such action as we deem appropriate, which may include closing your account.
Market timing/excessive trading policy
There are participants who may try to profit from making transactions back and forth among the CREF accounts, the Real Estate Account, the TIAA Access variable account and the funds or other investment options available under the terms of your plan in an effort to “time” the market or for other reasons. As money is shifted in and out of these accounts, the accounts or funds may incur transaction costs, including, among other things, expenses for buying and selling securities. These costs are borne by all participants, including long-term investors who do not generate these costs. In addition, excessive trading can interfere with efficient portfolio management and cause dilution if traders are able to take advantage of pricing inefficiencies. Consequently, the Account is not appropriate for market timing or frequent trading and you should not invest in the Account if you want to engage in such activity.
To discourage this activity, transfers of accumulations from the Real Estate Account to a CREF or TIAA account, or another investment option, are limited to once every calendar quarter. A few limited exceptions to this once per calendar quarter limitation apply, including:
|
||||||||||||||||||||||||||||||||||||||||||||||||||||||||||||||||||||||||||||||||||||||||||||||||||
(i) |
systematic transfers out of the Real Estate Account (as described in the section above entitled “How to transfer and withdraw your money — Systematic withdrawals and transfers”), |
|||||||||||||||||||||||||||||||||||||||||||||||||||||||||||||||||||||||||||||||||||||||||||||||||
|
||||||||||||||||||||||||||||||||||||||||||||||||||||||||||||||||||||||||||||||||||||||||||||||||||
(ii) |
annual portfolio rebalancing activities, |
|||||||||||||||||||||||||||||||||||||||||||||||||||||||||||||||||||||||||||||||||||||||||||||||||
(iii) |
plan or plan-sponsor initiated transactions, including transfers and rollovers made to external carriers, |
|||||||||||||||||||||||||||||||||||||||||||||||||||||||||||||||||||||||||||||||||||||||||||||||||
(iv) |
participants enrolled in TIAA’s qualified managed account for retirement plan assets, |
|||||||||||||||||||||||||||||||||||||||||||||||||||||||||||||||||||||||||||||||||||||||||||||||||
TIAA Real Estate Account ¡ Prospectus121 |
(v) |
single-sum distributions where funds are moved from one TIAA annuity contract or certificate to another, as well as those made directly to a participant, |
||
(vi) |
asset allocation programs and similar programs approved by TIAA’s management, |
||
(vii) |
death and hardship withdrawals or withdrawals made pursuant to a qualified domestic relations order (“QDRO”), and |
||
(viii) |
certain transactions made within a retirement or employee benefit plan, such as contributions, mandatory (or minimum) distributions and loans. |
TIAA reserves the right to reject any purchase or exchange request with respect to the Account, including when it is believed that a request would be disruptive to the Account’s efficient portfolio management. TIAA also may suspend or terminate your ability to transact in the Account by telephone, fax or over the Internet for any reason, including the prevention of excessive trading. A purchase or exchange request could be rejected or electronic trading privileges could be suspended because of the timing or amount of the investment or because of a history of excessive trading by the participant. Because TIAA has discretion in applying this policy, it is possible that similar transaction activity could be handled differently because of the surrounding circumstances. Notwithstanding such discretion, TIAA seeks to apply its excessive trading policies and procedures uniformly to all Account participants. As circumstances warrant, TIAA may request transaction data from intermediaries from time to time to verify whether the Account’s policies are being followed and/or to instruct intermediaries to take action against participants who have violated the Account’s policies. TIAA has the right to modify these policies and procedures at any time without advance notice.
The Account is not appropriate for excessive trading. You should not invest in the Account if you want to engage in excessive trading or market timing activity. Participants seeking to engage in excessive trading may deploy a variety of strategies to avoid detection, and, despite TIAA’s efforts to discourage excessive trading, there is no guarantee that TIAA or its agents will be able to identify all such participants or curtail their trading practices.
If you invest in the Account through an intermediary, including through a retirement or employee benefit plan, you may be subject to additional market timing or excessive trading policies implemented by the intermediary or plan. Please contact your intermediary or plan sponsor for more details.
The annuity period in general
You can annuitize and receive an income stream from all or part of your Real Estate Account accumulation. Unless you opt for a lifetime annuity, generally you must be at least age 591/2 to begin receiving annuity income payments from your annuity contract free of a 10% early distribution penalty tax. Your employer’s plan
122Prospectus ¡ TIAA Real Estate Account |
may also restrict when you can begin income payments. Under the minimum distribution rules of the Code, you generally must begin receiving some payments from your contract shortly after you reach the later of age 701/2 or you retire. Please consult your tax advisor. For more information, see the section below entitled “Taxes — minimum distribution requirements.” Also, you can’t begin a one-life annuity after you reach age 90, nor may you begin a two-life annuity after either you or your annuity partner reach age 90.
Your income payments may be paid out from the Real Estate Account through a variety of income options. You can pick a different income option for different portions of your accumulation, but once you’ve started payments you usually can’t change your income option or annuity partner for that payment stream. Usually income payments are monthly. You can choose quarterly, semi-annual, and annual payments as well. (TIAA has the right to not make payments at any interval that would cause the initial payment to be less than $100.) We’ll send your payments by mail to your home address or, on your request, by mail or electronic funds transfer to your bank.
Your initial income payments are based on the value of your accumulation on the last valuation day before the annuity starting date. Your payments change after the initial payment based on the Account’s investment experience and the income change method you choose.
There are two income change methods for annuity payments: annual and monthly. Under the annual income change method, payments from the Account change each May 1, based on the net investment results during the prior year (from the day following the last valuation day in March of the prior year through the last valuation day in the March of the current year). Under the monthly income change method, payments from the Account change every month, based on the net investment results during the previous month. For the formulas used to calculate the amount of annuity payments, see the section below entitled “Annuity payments — Calculating the number of annuity units payable.” The total value of your annuity payments may be more or less than your total premiums. TIAA reserves the right to modify or stop offering the annual or monthly change methods.
Annuity starting date
Ordinarily, annuity payments begin on the date you designate as your annuity starting date, provided we have received all documentation necessary for the income option you’ve picked. If something’s missing, we’ll defer your annuity starting date until we receive the missing items and/or information. You may designate any future date for your annuitization request, in accordance with our procedures and as long as it is one on which we process annuitizations. Your first annuity check may be delayed while we process your choice of income options and calculate the amount of your initial payment. Any premiums received within 70 days after payments begin may be used to provide additional annuity income. Premiums received after 70 days will remain in your accumulating annuity contract until you have given us further instructions. Ordinarily, your first annuity payment can be made on any business day between the first and twentieth of any month.
TIAA Real Estate Account ¡ Prospectus123 |
Annuity income options
Both the number of annuity units you purchase and the amount of your income payments will depend on which income option you pick. Your employer’s plan, tax law and ERISA may limit which income options you can use to receive income from an RA or GRA, GSRA, Retirement Choice, Retirement Choice Plus or Keogh contract. Ordinarily you’ll choose your income options shortly before you want payments to begin, but you can make or change your choice any time before your annuity starting date. After your annuity starting date, you cannot change your income option.
All Real Estate Account income options provide variable payments, and the amount of income you receive depends in part on the investment experience of the Account. The current options are:
• |
One-Life Annuity with or without Guaranteed Period: Pays income as long as you live. If you opt for a guaranteed period (10, 15 or 20 years) and you die before it’s over, income payments will continue to your beneficiary until the end of the period. If you don’t opt for a guaranteed period, all payments end at your death — so it’s possible for you to receive only one payment if you die less than a month after payments start. |
||
• |
Annuity for a Fixed Period: Pays income for any period you choose from five to 30 years (two to 30 years for RAs, SRAs and GRAs). This option is not available under all contracts. |
||
• |
Two-Life Annuities: Pays income to you as long as you live, then continues at either the same or a reduced level for the life of your annuity partner. There are four types of two-life annuity options, all available with or without a guaranteed period — Full Benefit to Survivor, Two-Thirds Benefit to Survivor, 75% Benefit to Annuity Partner and a Half-Benefit to Annuity Partner. Under the Two-Thirds Benefit to Survivor option, payments to you will be reduced upon the death of your annuity partner. |
||
• |
MDO: Generally available only if you must begin annuity payments under the Code minimum distribution requirements. (Some employer plans allow you to elect this option earlier — contact TIAA for more information.) The option, if elected, automatically pays an amount designed to fulfill the distribution requirements under federal tax law. Please consult your tax advisor for more information. |
You must apply your entire accumulation under a contract if you want to use the MDO. It is possible that income under the MDO will cease during your lifetime. Prior to age 90, and subject to applicable plan and legal restrictions, you can elect a distribution option other than the MDO and apply any remaining part of an accumulation applied to the MDO to any other income option for which you’re eligible. Using the MDO won’t affect your right to take a cash withdrawal of any accumulation not yet distributed. This automatic payout option is not available for IRA contracts issued on or after October 11, 2010. An automatic payout option is currently not available under Retirement Choice or Retirement Choice Plus contracts instead, required minimum distributions under Retirement
124Prospectus ¡ TIAA Real Estate Account |
Choice or Retirement Choice Plus contracts, will be paid directly from these contracts pursuant to the terms of your employer’s plan.
For any of the income options described above, current federal tax law provides that your guaranteed period can’t exceed the joint life expectancy of you and your beneficiary or annuity partner, and other Code stipulations may make some income options unavailable to you. If you are married at your annuity start date, you may be required by law to choose an income option that provides survivor annuity income to your spouse, unless your spouse waives the right. Other income options may become available in the future, subject to the terms of your retirement plan and relevant federal and state laws. For more information about any annuity option, please contact us.
Receiving Lump Sum Payments (Retirement Transition Benefit): If your employer’s plan allows, you may be able to receive a single sum payment of up to 10% of the value of any part of an accumulation being converted to annuity income on the annuity starting date. (This does not apply to IRAs.) Of course, if your employer’s plan allows cash withdrawals, you can take a larger amount (up to 100%) of your Real Estate Account accumulation as a cash payment. The retirement transition benefit will be subject to current federal income tax requirements and possible early distribution penalties. Please see the section below entitled “Taxes.”
Transfers during the annuity period
After you begin receiving annuity income, you, subject to your employer’s plan, can transfer all or part of the future annuity income (which is the actuarial present value of the payments based on the applicable interest rate and the mortality basis associated with that fund at the time of the transfer) payable once each calendar quarter (i) from the Real Estate Account into a “comparable annuity” payable from a CREF or TIAA account or TIAA’s Traditional Annuity, or (ii) from a CREF account into a comparable annuity payable from the Real Estate Account. Comparable annuities are those which are payable under the same income option and have the same first and second annuitant, and remaining guaranteed period.
We’ll process your transfer on the business day we receive your request in good order. You can also choose to have a transfer take effect at the close of any future business day. Transfers under the annual income payment method will affect your annuity payments beginning on the May 1 following the March 31 which is on or after the effective date of the transfer. Transfers under the monthly income payment method and all transfers into TIAA’s Traditional Annuity will affect your annuity payments beginning with the first payment due after the monthly payment valuation day that is on or after the transfer date. You can switch between the annual and monthly income change methods, and the switch will go into effect on the last valuation day of the following March. Although the payout streams are actuarially equivalent and there is no charge for engaging in such a transfer, it is possible that the new funds may apply different mortality or interest assumptions, and could therefore result in variation between the initial
TIAA Real Estate Account ¡ Prospectus125 |
payments from the new fund and the payments that were being made out of the original fund.
Annuity payments
The amount of annuity payments we pay you or your beneficiary (annuitant) will depend upon the number and value of the annuity units payable. The number of annuity units is first determined on the day before the annuity starting date. The amount of the annuity payments will change according to the income change method chosen.
Under the annual income change method, the value of an annuity unit for payments is redetermined on March 31 of each year (or, if March 31 is not a valuation day, the immediately preceding valuation day). This date is called the “annual payment valuation day.” Annuity payments change beginning May 1. The change reflects the net investment experience of the Real Estate Account. The net investment experience for the twelve months following the annual payment valuation day will be reflected in the annuity unit value determined on the next year’s annual payment valuation day.
Under the monthly income change method, the value of an annuity unit for payments is determined on the payment valuation day, which is the 20th day of the month preceding the payment due date or, if the 20th is not a business day, the preceding business day. The monthly changes in the value of an annuity unit reflect the net investment experience of the Real Estate Account. The formulas for calculating the number and value of annuity units payable are described below.
Calculating the Number of Annuity Units Payable: When a participant or a beneficiary converts the value of all or a portion of his or her accumulation into an income-paying contract, the number of annuity units payable from the Real Estate Account under an income change method is determined by dividing the value of the Account accumulation to be applied to provide the annuity payments by the product of the annuity unit value for that income change method and an annuity factor. The annuity factor as of the annuity starting date is the value of an annuity in the amount of $1.00 per month beginning on the first day such annuity units are payable, and continuing for as long as such annuity units are payable.
The annuity factor will reflect interest assumed at the effective annual rate of 4%, and the mortality assumptions for the person(s) on whose life (lives) the annuity payments will be based. Mortality assumptions will be based on the then-current settlement mortality schedules for this Account. Annuitants bear no mortality risk under their contracts — actual mortality experience will not reduce annuity payments after they have started. TIAA may change the mortality assumptions used to determine the number of annuity units payable for any future accumulations converted to provide annuity payments.
The number of annuity units payable under an income change method under your contract will be reduced by the number of annuity units you transfer out of that income change method under your contract. The number of annuity units
126Prospectus ¡ TIAA Real Estate Account |
payable will be increased by any internal transfers you make to that income change method under your contract.
Value of Annuity Units: The Real Estate Account’s annuity unit value is calculated separately for each income change method for each valuation day. The annuity unit value for each income change method is determined by updating the annuity unit value from the previous valuation day to reflect the net investment performance of the Account for the current valuation period relative to the 4% assumed investment return. In general, your payments will increase if the performance of the Account is greater than 4% and decrease if the value is less than 4%. The value is further adjusted to take into account any changes expected to occur in the future at revaluation either once a year or once a month, assuming the Account will earn the 4% assumed investment return in the future.
The initial value of the annuity unit for a new annuitant is the value determined as of the valuation day before annuity payments start.
For participants under the annual income change method, the value of the annuity unit for payment remains level until the following May 1. For those who have already begun receiving annuity income as of March 31, the value of the annuity unit for payments due on and after the next succeeding May 1 is equal to the annuity unit value determined as of the last valuation day in March.
For participants under the monthly income change method, the value of the annuity unit for payments changes on the payment valuation day of each month for the payment due on the first of the following month.
Further, certain variable annuity payouts might not be available if issuing the payout annuity would violate state law.
TIAA reserves the right, subject to approval by the Board of Trustees, to modify the manner in which the number and/or value of annuity units is calculated in the future. No such modification will reduce any participant’s benefit once the participant’s annuitization period has commenced.
Availability; choosing beneficiaries
Subject to the terms of your employer’s plan, TIAA may pay death benefits if you or your annuity partner dies. When you purchase your annuity contract, you name one or more beneficiaries to receive the death benefit if you die. You can change your beneficiaries any time before you die, and, unless you instruct otherwise, your annuity partner can do the same after your death.
Your spouse’s rights
Your choice of beneficiary for death benefits may, in some cases, be subject to the consent of your spouse. Similarly, if you are married at the time of your death, federal law may require a portion of the death benefit be paid to your spouse even if you have named someone else as beneficiary. If you die without having named any beneficiary, any portion of your death benefit not payable to
TIAA Real Estate Account ¡ Prospectus127 |
your spouse will generally go to your estate unless your employer’s plan provides otherwise.
Amount of death benefit
If you die during the accumulation period, the death benefit is the amount of your accumulation. If you and your annuity partner die during the annuity period while payments are still due under a fixed-period annuity or for the remainder of a guaranteed period, the death benefit is the present value, based on interest at the effective annual rate of 4%, of the unit annuity payments due for the remainder of the period.
Payment of death benefit
To authorize payment and pay a death benefit, we must have received all necessary forms and documentation in good order, including proof of death and the selection of the method of payment.
Every state has some form of unclaimed property laws that impose varying legal and practical obligations on insurers and, indirectly, on Contract owners, insureds, beneficiaries and other payees of proceeds. Unclaimed property laws generally provide for escheatment to the state of unclaimed proceeds under various circumstances.
Contract owners are urged to keep their own, as well as their insureds’, beneficiaries’ and other payees’, information up to date, including full names, postal and electronic media addresses, telephone numbers, dates of birth, and Social Security numbers. Such updates should be communicated in writing to TIAA-CREF Life Insurance Company at P.O. Box 1259, Charlotte, NC 28201, by calling our Automated Telephone Service (24 hours a day) at 800 842-2252, or via www.tiaa-cref.org.
Methods of payment of death benefits
Generally, you can choose for your beneficiary the method we’ll use to pay the death benefit, but few participants do this. If you choose a payment method, you can also prevent your beneficiaries from changing it. Most people leave the choice to their beneficiaries. We can prevent any choice if its initial payment is less than $25. If death occurs while your contract is in the accumulation stage, in most cases we can pay the death benefit using the TIAA-CREF Savings & Investment Plan. We won’t do this if you preselected another option or if the beneficiary elects another option. Some beneficiaries aren’t eligible for the TIAA-CREF Savings & Investment Plan. In addition, the TIAA-CREF Savings & Investment Plan is not available under Retirement Choice, Retirement Choice Plus or IRA contracts issued on or after October 11, 2010. If your beneficiary isn’t eligible and doesn’t specifically tell us to start paying death benefits within a year of your death, we can start making payments to them over five years using the fixed-period annuity method of payment.
128Prospectus ¡ TIAA Real Estate Account |
Payments During the Accumulation Period: Currently, the available methods of payment for death benefits from funds in the accumulation period are:
• |
Single-Sum Payment, in which the entire death benefit is paid to your beneficiary at once; |
||
• |
One-Life Annuity with or without Guaranteed Period, in which the death benefit is paid monthly for the life of the beneficiary or through the guaranteed period; |
||
• |
Annuity for a Fixed Period of 5 to 30 years (not available under Retirement Choice or Retirement Choice Plus), in which the death benefit is paid for a fixed period (This option is not available under all contracts); |
||
• |
Accumulation-Unit Deposit Option, which pays a lump sum at the end of a fixed period, ordinarily two to five years, during which period the accumulation units deposited participate in the Account’s investment experience (generally the death benefit value must be at least $5,000); (This option is not available under all contracts); and |
||
• |
Minimum Distribution Payments (currently called the TIAA-CREF Savings & Investment Plan), which automatically pays income according to the Code’s minimum distribution requirements. This payment method is not available under Retirement Choice or Retirement Choice Plus contracts, and is not available for IRA contracts issued on or after October 11, 2010. It operates in much the same way as the MDO annuity income option. It’s possible, under this method, that your beneficiary will not receive income for life. |
Death benefits are usually paid monthly (unless you chose a single-sum method of payment), but your beneficiary can switch them to quarterly, semi-annual, or annual payments. Note that for Retirement Choice, Retirement Choice Plus and IRA contracts issued on or after October 11, 2010, instead of an annuity for a fixed period, beneficiaries may only receive either a single-sum payment or a one-life annuity.
Payments During the Annuity Period: If you and your annuity partner die during the annuity period, your beneficiary can choose to receive any remaining guaranteed periodic payments due under your contract.
Alternatively, your beneficiary can choose to receive the commuted value of those payments in a single sum unless you have indicated otherwise. The amount of the commuted value will be different than the total of the periodic payments that would otherwise be paid.
Ordinarily, death benefits are subject to federal estate tax. Generally, if taken as a lump sum, death benefits would be taxed like complete withdrawals. If taken as annuity benefits, death benefits would be taxed like annuity payments. For more information on death benefits, see the discussion under “Taxes” below, or for further detail, contact TIAA.
TIAA Real Estate Account ¡ Prospectus129 |
This section offers general information concerning federal taxes. It doesn’t cover every situation. Tax treatment varies depending on the circumstances, and state and local taxes may also be involved. For complete information on your personal tax situation, check with a qualified tax advisor.
How the Real Estate Account is treated for tax purposes
The Account is not a separate taxpayer for purposes of the Code — its earnings are taxed as part of TIAA’s operations. Although TIAA is not expected to owe any federal income taxes on the Account’s earnings, if TIAA does incur taxes attributable to the Account, it may make a corresponding charge against the Account.
Taxes in general
During the accumulation period, Real Estate Account premiums paid in before-tax dollars, employer contributions and earnings attributable to these amounts are not taxed until they’re withdrawn. Annuity payments, single-sum withdrawals, systematic withdrawals, and death benefits are usually taxed as ordinary income. Premiums paid in after-tax dollars aren’t taxable when withdrawn, but earnings attributable to these amounts are taxable unless those amounts are contributed as Roth contributions to a 401(a), 403(b) or governmental 457(b) plan and certain criteria are met before the amounts (and the income on the amounts) are withdrawn. Generally, transfers between qualified retirement plans are not taxed.
After prevailing in Bobrow v. Commissioner, T.C. Memo. 2014-21, the Internal Revenue Service announced a significant change in the longstanding position on the treatment on multiple IRA rollovers occurring in a 12 month period. Federal tax law permits only one tax-deferred rollover between IRAs of distributions taken in a 12 month period. The IRS had previously interpreted that restriction to apply separately to each IRA owned by an individual. However, in the Bobrow case the Tax Court held that the 12 month restriction period applied to all of the taxpayer’s traditional IRAs. The IRS has issued guidance expanding this new interpretation of the one-rollover- per-year rule to all types of IRAs. Please consult your qualified tax adviser for more information before making any IRA rollover.
Generally, contributions you can make under an employer’s plan are limited by federal tax law. Employee voluntary salary reduction contributions and Roth after-tax contributions to 403(b) and 401(k) plans are limited in the aggregate to $18,000 per year ($24,000 per year if you are age 50 or older). Certain long-term employees may be able to defer additional amounts to a 403(b) plan. Contributions to Classic and Roth IRAs, other than rollover contributions, cannot generally exceed $5,500 per year ($6,500 per year for taxpayers age 50 or older). The maximum contribution limit to a 457(b) non-qualified deferred compensation plan for employees of state and local governments is $18,000 ($24,000 if you are age 50 or older). Special catch-up rules may permit a higher
130Prospectus ¡ TIAA Real Estate Account |
contribution in one or more of the last three years prior to an individual’s normal retirement age under the plan.
Note that the dollar limits listed above are for 2015; different dollar limits may apply in future years.
Early distributions
If you want to withdraw funds or begin receiving income from any 401(a), 403(a), or 403(b) retirement plan or an IRA before you reach age 591/2, you may have to pay a 10 percent early distribution tax on the taxable amount. Distributions from a Roth IRA generally are not taxed, except that, once aggregate distributions exceed contributions to the Roth IRA, income tax and a 10% penalty tax may apply to distributions made (1) before age 591/2 (subject to certain exceptions) or (2) during the five taxable years starting with the year in which the first contribution is made to any Roth IRA. A 10% penalty tax may apply to amounts attributable to a conversion from an IRA if they are distributed during the five taxable years beginning with the year in which the conversion was made. You won’t have to pay this tax in certain circumstances. Early distributions from 457(b) plans are not subject to a 10% penalty tax unless, in the case of a governmental 457(b) plan, the distribution includes amounts rolled over to the plan from an IRA, 401(a)/403(a), or 403(b) plan. Consult your tax advisor for more information.
Minimum distribution requirements
In most cases, payments from qualified contracts must begin by April 1 of the year after the year you reach age 701/2, or if later, by retirement. For Classic IRAs, and with respect to 5% or more owners of the business covered by a Keogh plan, payments must begin by April 1 of the year after you reach age 701/2. Under the terms of certain retirement plans, the plan administrator may direct us to make the minimum distributions required by law even if you do not elect to receive them. In addition, if you don’t begin distributions on time, you may be subject to a 50% excise tax on the amount you should have received but did not. Roth IRAs are generally not subject to these rules requiring minimum distributions during your lifetime. You are responsible for requesting distributions that comply with the minimum distribution rules. Please consult your tax advisor for more information.
Premium taxes
Some states assess premium taxes on the premiums paid under the contract. We will deduct the total amount of premium taxes, if any, from your accumulation based on current state insurance laws, subject to the provisions of your contract, and our status in the state. Generally, premium taxes range from 0% to 3.5%, depending on the state.
Withholding on distributions
If we pay an “eligible rollover” distribution directly to you, federal law requires us to withhold 20% from the taxable portion. On the other hand, if we roll over
TIAA Real Estate Account ¡ Prospectus131 |
such a distribution directly to an IRA or employer plan, we do not withhold any federal income tax. The 20% withholding also does not apply to certain types of distributions that are not considered eligible rollovers such as payments from IRAs, hardship withdrawals, lifetime annuity payments, substantially equal periodic payments over your life expectancy or over 10 or more years, or minimum distribution payments.
For the taxable portion of non-eligible rollover distributions, we will usually withhold federal income taxes unless you tell us not to and you are eligible to avoid withholding. However, if you tell us not to withhold but we don’t have your taxpayer identification number on file, we still are required to withhold taxes. These rules also apply to distributions from governmental 457(b) plans. In general, all amounts received under a private 457(b) plan are taxable and are subject to federal income tax withholding as wages. Nonresident aliens who pay U.S. taxes are subject to different withholding rules.
Federal estate, gift, and generation-skipping transfer taxes
While no attempt is being made to discuss in detail the federal estate tax implications of the contract, a purchaser should keep in mind that the value of an annuity contract owned by a decedent and payable to a beneficiary who survives the decedent is included in the decedent’s gross estate. Depending on the terms of the contract, the value of the annuity included in the gross estate may be the value of the lump sum payment payable to the designated beneficiary or the actuarial value of the payments to be received by the beneficiary. Consult an estate planning advisor for more information.
Under certain circumstances, the Code may impose a generation-skipping (“GST”) tax when all or part of an annuity contract is transferred to, or a death benefit is paid to, an individual two or more generations younger than the contract owner. Regulations issued under the Code may require us to deduct the tax from your contract, or from any applicable payment, and pay it directly to the IRS. For 2015, the federal estate tax, gift tax, and GST tax exemptions and maximum rates are $5,430,000 and 40%, respectively. The potential application of these taxes underscores the importance of seeking guidance from a qualified adviser to help ensure that your estate plan adequately addresses your needs and those of your beneficiaries under all possible scenarios.
Federal defense of marriage act
Any right of a spouse that is made available to continue the contract and all contract provisions relating to spouses and spousal continuation are available only to a person who meets the definition of “spouse” under federal law. The U.S. Supreme Court has held Section 3 of the federal Defense of Marriage Act (which purportedly did not recognize same-sex marriages, even those that are permitted under individual state laws) to be unconstitutional. Therefore, same-sex marriages recognized under state or foreign law will be recognized for federal law purposes. The Department of the Treasury, the Internal Revenue Service and the
132Prospectus ¡ TIAA Real Estate Account |
Department of Labor have determined that for federal tax purposes, and for ERISA purposes, same-sex spouses will be determined based on the law of the state in which the marriage was celebrated irrespective of the law of the state in which the person resides. IRS guidance provides that civil unions and similar relationships recognized under state law are not marriages unless denominated as such. However, some uncertainty remains regarding the treatment of same-sex spouses as defined under applicable law. Consult a qualified tax adviser for more information on this subject.
Special rules for after-tax retirement annuities
If you paid premiums directly to an RA and the premiums are not subject to your employer’s retirement plan, or if you have been issued an ATRA contract, the following general discussion describes our understanding of current federal income tax law that applies to these accumulations. This discussion does not apply to premiums paid on your behalf under the terms of your employer’s retirement plan. It also does not cover every situation and does not address all possible circumstances.
In General. These annuities are generally not taxed until distributions occur. When distributions occur, they are taxed as follows:
• |
Withdrawals, including withdrawals of the entire accumulation under the contract, are generally taxed as ordinary income to the extent that the contract’s value is more than your investment in the contract (i.e., what you have paid into it). |
||
• |
Annuity payments are generally treated in part as taxable ordinary income and in part as non-taxable recovery of your investment in the contract until you recover all of your investment in the contract. After that, annuity payments are taxable in full as ordinary income. |
Required Distributions. In general, if you die after you start your annuity payments but before the entire interest in the annuity contract has been distributed, the remaining portion must be distributed at least as quickly as under the method in effect on the date of your death. If you die before your annuity payments begin, the entire interest in your annuity contract generally must be distributed within five years after your death, or be used to provide payments that begin within one year of your death and that will be made for the life of your designated beneficiary or for a period not extending beyond the life expectancy of your designated beneficiary. The “designated beneficiary” refers to a natural person you designate and to whom ownership of the contract passes because of your death. However, if the designated beneficiary is your surviving spouse, your surviving spouse can continue the annuity contract as the new owner.
Death Benefit Proceeds. Death benefit proceeds are taxed like withdrawals of the entire accumulation in the contract if distributed in a single sum and are taxed like annuity payments if distributed as annuity payments. Your beneficiary may be required to take death benefit proceeds within a certain time period.
TIAA Real Estate Account ¡ Prospectus133 |
Penalty Tax on Certain Distributions. You may have to pay a penalty tax (10% of the amount treated as taxable income) on distributions you take prior to age 591/2. There are some exceptions to this rule, however. You should consult a tax advisor for information about those exceptions.
Withholding. Annuity distributions are generally subject to federal income tax withholding but most recipients can usually choose not to have the tax withheld.
Certain Designations or Exchanges. Designating an annuitant, payee or other beneficiary, or exchanging a contract may have tax consequences that should be discussed with a tax advisor before you engage in any of these transactions.
Multiple Contracts. All non-qualified deferred annuity contracts issued by us and certain of our affiliates to the same owner during a calendar year must generally be treated as a single contract in determining when and how much income is taxable and how much income is subject to the 10% penalty tax (see above).
Diversification Requirements. The investments of the Real Estate Account must be “adequately diversified” in order for the ATRA Contracts to be treated as annuity contracts for Federal income tax purposes. It is intended that Real Estate Account will satisfy these diversification requirements.
Owner Control. In certain circumstances, owners of non-qualified variable annuity contracts have been considered for Federal income tax purposes to be the owners of the assets of the separate account supporting their contracts due to their ability to exercise investment control over those assets. When this is the case, the contract owners have been currently taxed on income and gains attributable to the variable account assets. While we believe that the ATRA Contracts do not give you investment control over assets in the Real Estate Account or any other separate account underlying your ATRA Contract, we reserve the right to modify the ATRA Contracts as necessary to prevent you from being treated as an owner of the assets in the Real Estate Account.
Premium Taxes. Some states, the District of Columbia, and Puerto Rico assess premium taxes on the premiums paid under the ATRA contract. We will deduct the total amount of premium taxes, if any, from your accumulation based on current state insurance laws, subject to the provisions of your contract, and our status in the state. Generally, the premium taxes range from 0.5% to 3.5% (6% for Puerto Rico) depending on the state.
Residents of Puerto Rico
The IRS has announced that income from an annuity received by residents of Puerto Rico is U.S.-source income that is generally subject to United States federal income tax.
Annuity purchases by nonresident aliens
The discussion above provides general information regarding U.S. federal income tax consequences to annuity purchasers that are U.S. citizens or residents. Purchasers that are not U.S. citizens or residents will generally be
134Prospectus ¡ TIAA Real Estate Account |
subject to U.S. federal withholding tax on taxable distributions from annuity contracts at a 30% rate, unless a lower treaty rate applies. In addition, purchasers may be subject to state and/or municipal taxes and taxes that may be imposed by the purchaser’s country of citizenship or residence. Prospective purchasers who are nonresident aliens are advised to consult with a qualified tax adviser regarding U.S., state, and foreign taxation with respect to an annuity contract purchase.
Special rules for withdrawals to pay advisory fees
If you have arranged for us to pay advisory fees to your financial advisor from your accumulations, those partial withdrawals generally will not be treated as taxable distributions as long as:
• |
the payment is for expenses that are ordinary and necessary; |
||
• |
the payment is made from a Section 401 or 403 retirement plan or an IRA; |
||
• |
your financial advisor’s payment is only made from the accumulations in your retirement plan or IRA, as applicable, and not directly by you or anyone else, under the agreement with your financial advisor; and |
||
• |
once advisory fees begin to be paid from your retirement plan or IRA, as applicable, you continue to pay those fees solely from your plan or IRA, as applicable, and not from any other source. |
However, withdrawals to pay advisory fees to your financial advisor from your accumulations under an ATRA contract will be treated as taxable distributions.
Foreign tax credit
The Account may be subject to foreign taxes on investments in other countries, including capital gains tax on any appreciation in value when a real estate investment in a foreign jurisdiction is eventually sold. Any potential tax impact will not be reflected in the valuation of the foreign investment and may not be fully reflected in a tax accrual by the Account. Upon payment of any foreign tax by the Account, TIAA may be eligible to receive a foreign tax credit, which (subject to certain limitations) may be available to reduce its U.S. tax burden. The Account is a segregated asset account of TIAA and incurs no material federal income tax attributable to the investment performance of the Account under the Code. As a result, the Account will not realize any tax benefit from any foreign tax credit that may be available to TIAA; however, to the extent that TIAA can utilize the foreign tax credit in its consolidated tax return, TIAA will reimburse the Account for that benefit at that time. The extent to which TIAA is able to utilize the credits when the Account incurs a foreign tax will determine the amount and timing of reimbursement from TIAA to the Account for the resulting foreign tax credit. The Account’s unit values may be adversely impacted in the future if a foreign tax is paid, and TIAA is not able to utilize (and therefore does not reimburse the Account for), either immediately or in the future, the foreign tax credit earned as a result of the foreign tax paid by the Account.
TIAA Real Estate Account ¡ Prospectus135 |
Possible tax law changes
Although the likelihood of legislative changes is uncertain, there is always the possibility that the tax treatment of your contract could change by legislation or otherwise. Consult a tax advisor with respect to legislative developments and their effect on your contract.
We have the right to modify the contract in response to legislative changes that could otherwise diminish the favorable tax treatment that annuity contract owners currently receive. We make no guarantee regarding the tax status of any contract and do not intend the above discussion as tax advice.
Making choices and changes
You may have to make certain choices or changes (e.g., changing your income option, making a cash withdrawal) by written notice in good order satisfactory to us and received at our home office or at some other location that we have specifically designated for that purpose. When we receive a notice of a change in beneficiary or other person named to receive payments, we’ll execute the change as of the date it was signed, even if the signer has died in the meantime. We execute all other changes as of the date received.
Telephone and internet transactions
You can use our Automated Telephone Service (“ATS”) or the TIAA-CREF Web Center’s account access feature to check your account balances, transfer to TIAA’s Traditional Annuity, TIAA Access variable annuity accounts or CREF, and/or allocate future premiums among the accounts and funds available to you through TIAA-CREF. Note that, currently, all requests to make lump-sum transfers out of the Real Estate Account to another investment option (whether or not affiliated with TIAA or CREF) may not be made by means of TIAA-CREF’s Internet website. You will be asked to enter your Personal Identification Number (“PIN”) and Social Security number for both systems. (You can establish a PIN by calling us.) Both will lead you through the transaction process and will use reasonable procedures to confirm that instructions given are genuine. If we use such procedures, we are not responsible for incorrect or fraudulent transactions. All transactions made over the ATS and Internet are electronically recorded.
To use the ATS, you need a touch-tone phone. The toll free number for the ATS is 800 842-2252. To use the Internet, go to the account access feature of the TIAA-CREF Web Center at www.tiaa-cref.org. We can suspend or terminate your ability to transact by telephone, over the Internet, or by fax at any time, for any reason.
136Prospectus ¡ TIAA Real Estate Account |
You don’t have the right to vote on the management and operation of the Account directly; however, you may send ballots to advise the TIAA Board of Overseers about voting for nominees for the TIAA Board of Trustees.
Electronic prospectus
If you received this prospectus electronically and would like a paper copy, please call 877 518-9161 and we will send it to you. Under certain circumstances where we are legally required to deliver a prospectus to you, we cannot send you a prospectus electronically unless you’ve consented.
Householding
To lower costs and eliminate duplicate documents sent to your home, we may begin mailing only one copy of the Account’s prospectus, prospectus supplements or any other required documents to your household, even if more than one participant lives there. If you would prefer to continue receiving your own copy of any of these documents, you may call us toll-free at 877 518-9161, or write us.
Miscellaneous policies
Amending the Contracts: The contract may be amended by agreement of TIAA and the contractholder without the consent of any other person, provided that such change does not reduce any benefit purchased under the contract up to that time. Any endorsement or amendment of the contract, waiver of any of its provisions, or change in rate schedule will be valid only if in writing and signed by an executive officer of TIAA.
If You’re Married: If you’re married, you may be required by law or your employer’s plan to get advance written consent from your spouse before we make certain transactions for you. If you’re married at your annuity starting date, you may also be required by law or your employer’s plan to choose an income option that provides survivor annuity income to your spouse, unless he or she waives that right in writing. There are limited exceptions to the waiver requirement.
Texas Optional Retirement Program Restrictions: If you’re in the Texas Optional Retirement Program, you or your beneficiary can redeem some or all of your accumulation only if you retire, die, or leave your job in the state’s public institutions of higher education.
Assigning Your Contract: Generally, neither you nor your beneficiaries can assign your ownership of a TIAA retirement contract to anyone else.
Overpayment of Premiums: If your employer mistakenly sends more premiums on your behalf than you’re entitled to under your employer’s retirement plan or the Code, we’ll refund them to your employer as long as we’re requested to do so (in writing) before you start receiving annuity income.
TIAA Real Estate Account ¡ Prospectus137 |
Any time there’s a question about premium refunds, TIAA will rely on information from your employer. If you’ve withdrawn or transferred the amounts involved from your accumulation, we won’t refund them.
Errors or Omissions: We reserve the right to correct any errors or omissions on any form, report, or statement that we send you.
Payment to an Estate, Guardian, Trustee, etc.: We reserve the right to pay in one sum the commuted value of any benefits due an estate, corporation, partnership, trustee, or other entity not a natural person. Neither TIAA nor the Account will be responsible for the conduct of any executor, trustee, guardian, or other third party to whom payment is made.
Benefits Based on Incorrect Information: If the amounts of benefits provided under a contract were based on information that is incorrect, benefits will be recalculated on the basis of the correct data. If the Account has overpaid or underpaid, appropriate adjustments will be made.
Proof of Survival: We reserve the right to require satisfactory proof that anyone named to receive benefits under a contract is living on the date payment is due. If we have not received this proof after we request it in writing, the Account will have the right to make reduced payments or to withhold payments entirely until such proof is received.
The annuity contracts are offered continuously by Services, which is registered with the SEC as a broker-dealer and a registered investment adviser and is a member of the Financial Industry Regulatory Authority (“FINRA”). Teachers Personal Investors Services, Inc. (“TPIS”), also a broker-dealer registered with the SEC and a member of FINRA, may participate in the distribution of the contracts on a limited basis. Services and TPIS are direct or indirect wholly owned subsidiaries of TIAA. Their addresses are at 730 Third Avenue, New York, NY 10017-3206. No commissions are paid for distributing the contracts.
TIAA, the Real Estate Account, and the contracts (including any proposed modification thereto) are subject to regulation by the NYDFS as well as by the insurance regulatory authorities of certain other states and jurisdictions.
TIAA and the Real Estate Account must file with the NYDFS both quarterly and annual statements. The Account’s books and assets are subject to review and examination by the NYDFS at all times, and a full examination into the affairs of the Account is made at least every five years. In addition, a full examination of the Real Estate Account operations is usually conducted periodically by insurance regulators in several other states.
138Prospectus ¡ TIAA Real Estate Account |
All matters involving state law and relating to the contracts, including TIAA’s right to issue the contracts, have been passed upon by Jon Feigelson, Senior Managing Director, General Counsel and Head of Corporate Governance of TIAA.
Dechert LLP has provided legal advice to the Account related to certain matters under the federal securities laws.
PricewaterhouseCoopers LLP, located at 214 North Tryon Street, Suite 3600, Charlotte, North Carolina 28202, is the independent registered public accounting firm for the Real Estate Account. PricewaterhouseCoopers LLP, located at 300 Madison Avenue, New York, New York 10017, is the independent auditor of Teachers Insurance and Annuity Association of America.
The financial statements of TIAA Real Estate Account as of December 31, 2014 and 2013 and for each of the three years in the period ended December 31, 2014 included in this Registration Statement have been so included in reliance on the report of PricewaterhouseCoopers LLP, an independent registered public accounting firm, given on the authority of said firm as experts in auditing and accounting.
The statutory basis financial statements of Teachers Insurance and Annuity Association of America as of December 31, 2014 and 2013 and for each of the three years in the period ended December 31, 2014 included in this Registration Statement have been so included in reliance on the report of PricewaterhouseCoopers LLP, an independent auditor, given on the authority of said firm as experts in auditing and accounting.
AGH, LLC, an independent registered public accounting firm, has audited the statement of revenues and certain expenses of the following properties:
(i) |
401 West 14th Street, New York, New York, for the year ended December 31, 2013; |
||
(ii) |
200 Middlefield Road, Menlo Park, California, for the year ended December 31, 2013; |
||
(iii) |
The Louis at 14th, Washington, D.C., for the year ended December 31, 2013; |
||
(iv) |
Northwest Houston Industrial Portfolio, Houston, Texas, for the year ended December 31, 2013; and |
||
(v) |
The Manor Apartments, Plantation, Florida, for the year ended December 31, 2013. |
After reasonable inquiry, the Account is not aware of any material factors relating to the specific properties audited by AGH, LLC, other than as specifically set forth elsewhere in this prospectus that would cause the reported financial information indicated in such financial statements not to be necessarily indicative of future operating results.
TIAA Real Estate Account ¡ Prospectus139 |
We have included these financial statements in the prospectus and elsewhere in the registration statement in reliance on AGH, LLC’s reports, given on the authority of such firm as experts in accounting and auditing.
Cohn Reznick LLP, an independent registered public accounting firm, has audited the statement of revenues and certain expenses of the following properties:
(i) |
Landover Logistics Center, Landover, Maryland, for the year ended December 31, 2013; and |
||
(ii) |
Southside at McEwen, Franklin, Tennessee, for the year ended December 31, 2013 and the period January 1, 2014 through April 30, 2014. |
After reasonable inquiry, the Account is not aware of any material factors relating to the specific properties audited by Cohn Reznick, LLP, other than as specifically set forth elsewhere in this prospectus that would cause the reported financial information indicated in such financial statements not to be necessarily indicative of future operating results.
We have included these financial statements in the prospectus and elsewhere in the registration statement in reliance on Cohn Reznick, LLP’s reports, given on the authority of such firm as experts in accounting and auditing.
Friedman LLP, an independent registered public accounting firm, has audited the statement of revenues and certain expenses of the following properties:
(i) |
55 Second Street, San Francisco, California, for the year ended December 31, 2013; |
|||||||||||||||||||||||||||||||||||||||||||||||||||||||||||||||||||||||||||||||||||||||||||||||||
(ii) |
Plaza America, Reston, Virginia, for the year ended December 31, 2013; and |
|||||||||||||||||||||||||||||||||||||||||||||||||||||||||||||||||||||||||||||||||||||||||||||||||
(iii) |
837 Washington Street, New York, New York, for the period ended December 31, 2014. |
|||||||||||||||||||||||||||||||||||||||||||||||||||||||||||||||||||||||||||||||||||||||||||||||||
|
||||||||||||||||||||||||||||||||||||||||||||||||||||||||||||||||||||||||||||||||||||||||||||||||||
After reasonable inquiry, the Account is not aware of any material factors relating to the specific properties audited by Friedman, LLP, other than as specifically set forth elsewhere in this prospectus that would cause the reported financial information indicated in such financial statements not to be necessarily indicative of future operating results.
We have included these financial statements in the prospectus and elsewhere in the registration statement in reliance on Friedman, LLP’s reports, given on the authority of such firm as experts in accounting and auditing.
Grant Thornton LLP, an independent registered public accounting firm, has audited the statement of revenues and certain expenses of the following properties:
(i) |
Foundry Square II, San Francisco, California, for the year ended December 31, 2013; and |
||
(ii) |
21 Penn Plaza, New York, New York, for the year ended December 31, 2013. |
After reasonable inquiry, the Account is not aware of any material factors relating to the specific properties audited by Grant Thornton LLP, other than as
140Prospectus ¡ TIAA Real Estate Account |
specifically set forth elsewhere in this prospectus that would cause the reported financial information indicated in such financial statements not to be necessarily indicative of future operating results.
We have included these financial statements in the prospectus and elsewhere in the registration statement in reliance on Grant Thornton LLP’s reports, given on the authority of such firm as experts in accounting and auditing.
Information available at the SEC
The Account has filed with the SEC a registration statement under the Securities Act of 1933, which contains this prospectus and additional information related to the offering described in this prospectus. The Account also files annual, quarterly, and current reports, along with other information, with the SEC, as required by the Securities Exchange Act of 1934. You may read and copy the full registration statement, and any reports and information filed with the SEC for the Account, at the SEC’s Public Reference Room at 100 F Street, N.E., Washington, DC 20549. This information can also be obtained through the SEC’s website on the Internet (www.sec.gov). The public may obtain information on the operation of the SEC’s Public Reference Room by calling the SEC at 800 SEC-0330.
Further information; reports to participants
TIAA will mail to each participant in the Real Estate Account periodic reports providing information relating to their accumulations in the Account, including premiums paid, number and value of accumulations, and withdrawals or transfers during the period, as well as such other information as may be required by applicable law or regulations. Further information may be obtained from TIAA at 730 Third Avenue, New York, NY 10017-3206.
Customer complaints
Customer complaints may be directed to TIAA-CREF Customer Care, P.O. Box 1259, Charlotte, NC 28201-1259, telephone 800 842-2252.
TIAA Real Estate Account ¡ Prospectus141 |
The financial statements of the TIAA Real Estate Account and condensed unaudited statutory-basis financial statements of TIAA follow within this prospectus. The full audited statutory-basis financial statements of TIAA, which are incorporated into this prospectus by reference, are available upon request by calling 877 518-9161.
The financial statements of TIAA should be distinguished from the financial statements of the Account and should be considered only as bearing on the ability of TIAA to meet its obligations under the contracts. They should not be considered as bearing upon the assets held in the Account.
TIAA REAL ESTATE ACCOUNT
|
|
|
|
143 |
||
|
144 |
||
|
146 |
||
|
147 |
||
148 |
||
|
149 |
||
|
150 |
||
|
174 |
||
|
189 |
PRO FORMA CONDENSED FINANCIAL STATEMENTS (UNAUDITED)
|
|
|
|
190 |
||
|
190 |
||
|
191 |
PROPERTY FINANCIAL STATEMENTS:
|
|
|
|
192 |
||
|
197 |
||
|
202 |
||
|
204 |
||
|
209 |
||
|
214 |
||
|
219 |
||
|
224 |
||
|
228 |
||
|
233 |
||
|
237 |
||
|
241 |
||
|
245 |
TEACHERS INSURANCE AND ANNUITY ASSOCIATION OF AMERICA
|
|
|
|
249 |
||
250 |
142Prospectus ¡ TIAA Real Estate Account |
Report of Management Responsibility
To the Participants of the TIAA Real Estate Account:
The accompanying consolidated financial statements of the TIAA Real Estate Account (“Account”) of Teachers Insurance and Annuity Association of America (“TIAA”) are the responsibility of TIAA’s management. They have been prepared in accordance with accounting principles generally accepted in the United States of America and have been presented fairly and objectively in accordance with such principles.
TIAA has established and maintains an effective system of internal controls over financial reporting designed to provide reasonable assurance that assets are properly safeguarded, that transactions are properly executed in accordance with management’s authorization, and to carry out the ongoing responsibilities of management for reliable consolidated financial statements. In addition, TIAA’s internal audit personnel provide regular reviews and assessments of the internal controls and operations of the Account, and the Senior Managing Director, Chief Auditor of Internal Audit regularly reports to the Audit Committee of the TIAA Board of Trustees.
The independent registered public accounting firm of PricewaterhouseCoopers LLP has audited the accompanying consolidated financial statements for the years ended December 31, 2014, 2013 and 2012. To maintain auditor independence and avoid even the appearance of a conflict of interest, it continues to be the Account’s policy (consistent with TIAA’s specific auditor independence policies, which are designed to avoid such conflicts) that any management advisory or consulting services would be obtained from a firm other than the independent accounting firm. The independent auditors’ report expresses an independent opinion on the fairness of presentation of the Account’s consolidated financial statements.
The Audit Committee of the TIAA Board of Trustees, comprised entirely of independent, non-management trustees, meets regularly with management, representatives of the independent registered public accounting firm and internal audit group personnel to review matters relating to financial reporting, internal controls and auditing. In addition to the annual independent audit of the Account’s consolidated financial statements, the New York State Insurance Department and other state insurance departments regularly examine the operations and consolidated financial statements of the Account as part of their periodic corporate examinations.
|
|
|
March 6, 2015 |
|
|
|
|
|
|
|
|
Robert G. Leary |
Virginia M. Wilson |


TIAA Real Estate Account ¡ Prospectus143 |
To the Participants of the TIAA Real Estate Account:
The TIAA Audit Committee (“Committee”) oversees the financial reporting process of the TIAA Real Estate Account (“Account”) on behalf of TIAA’s Board of Trustees. The Committee operates in accordance with a formal written charter (copies of which are available upon request) which describes the Audit Committee’s responsibilities. All members of the Committee are independent, as defined under the listing standards of the New York Stock Exchange.
Management has the primary responsibility for the Account’s consolidated financial statements, development and maintenance of a strong system of internal controls and disclosure controls, and compliance with applicable laws and regulations. In fulfilling its oversight responsibilities, the Committee reviewed and approved the audit plans of the internal audit group and the independent registered public accounting firm in connection with their respective audits of the Account. The Committee also meets regularly with the internal audit group and the independent registered public accounting firm, both with and without management present, to discuss the results of their examinations, their evaluation of internal controls, and the overall quality of financial reporting. As required by its charter, the Committee will evaluate rotation of the independent registered public accounting firm whenever circumstances warrant, but in no event will the evaluation be later than between their fifth and tenth years of service.
The Committee reviewed and discussed the accompanying audited consolidated financial statements with management, including a discussion of the quality and appropriateness of the accounting principles and financial reporting practices followed, the reasonableness of significant judgments, and the clarity and completeness of disclosures in the consolidated financial statements. The Committee has also discussed the audited consolidated financial statements with PricewaterhouseCoopers LLP, the independent registered public accounting firm responsible for expressing an opinion on the conformity of these audited consolidated financial statements with accounting principles generally accepted in the United States of America.
The discussion with PricewaterhouseCoopers LLP focused on their judgments concerning the quality and appropriateness of the accounting principles and financial reporting practices followed by the Account, the clarity and completeness of the consolidated financial statements and related disclosures, and other significant matters, such as any significant changes in accounting policies, internal controls, management judgments and estimates, and the nature of any uncertainties or unusual transactions. In addition, the Committee discussed with PricewaterhouseCoopers LLP the auditors’ independence from management and the Account, and has received a written disclosure regarding such independence, as required by the Securities and Exchange Commission.
144Prospectus ¡ TIAA Real Estate Account |
Based on the review and discussions referred to above, the Committee has approved the release of the accompanying audited consolidated financial statements for publication and filing with appropriate regulatory authorities.
Jeffrey R. Brown, Audit Committee Chair
Lisa W. Hess, Audit Committee Member
Lawrence H. Linden, Audit Committee Member
Maureen O’Hara, Audit Committee Member
Donald K. Peterson, Audit Committee Member
March 6, 2015
TIAA Real Estate Account ¡ Prospectus145 |
Consolidated statements of assets and liabilities
TIAA Real Estate Account
|
|
|
|
|
||||||||||
(In millions, except per accumulation unit amounts) |
December 31, |
|||||||||||||
2014 |
2013 |
|||||||||||||
|
||||||||||||||
|
ASSETS |
|
|
|
|
||||||||||
|
Investments, at fair value: |
|
|
|
|
||||||||||
|
Real estate properties |
|
|
$ |
|
13,139.0 |
|
|
$ |
|
11,565.1 |
||||
|
Real estate joint ventures and limited partnerships |
|
|
3,379.6 |
|
|
2,925.6 |
||||||||
|
Marketable securities: |
|
|
|
|
||||||||||
|
Real estate related |
|
|
1,818.4 |
|
|
1,499.3 |
||||||||
|
Other |
|
|
3,831.1 |
|
|
3,119.6 |
||||||||
|
||||||||||||||
|
Total investments |
|
|
22,168.1 |
|
|
19,109.6 |
||||||||
|
||||||||||||||
|
Cash and cash equivalents |
|
|
36.5 |
|
|
14.6 |
||||||||
|
Due from investment manager |
|
|
7.2 |
|
|
2.5 |
||||||||
|
Other |
|
|
196.9 |
|
|
290.4 |
||||||||
|
||||||||||||||
|
TOTAL ASSETS |
|
|
22,408.7 |
|
|
19,417.1 |
||||||||
|
||||||||||||||
|
LIABILITIES |
|
|
|
|
||||||||||
|
Mortgage loans payable, at fair value—Note 9 |
|
|
2,373.8 |
|
|
2,279.1 |
||||||||
|
Accrued real estate property expenses |
|
|
165.5 |
|
|
198.6 |
||||||||
|
Other |
|
|
40.4 |
|
|
31.5 |
||||||||
|
||||||||||||||
|
TOTAL LIABILITIES |
|
|
2,579.7 |
|
|
2,509.2 |
||||||||
|
||||||||||||||
|
COMMITMENTS AND CONTINGENCIES—Note 12 |
|
|
|
|
||||||||||
|
NET ASSETS |
|
|
|
|
||||||||||
|
Accumulation Fund |
|
|
19,409.7 |
|
|
16,535.4 |
||||||||
|
Annuity Fund |
|
|
419.3 |
|
|
372.5 |
||||||||
|
||||||||||||||
|
TOTAL NET ASSETS |
|
|
$ |
|
19,829.0 |
|
|
$ |
|
16,907.9 |
||||
|
||||||||||||||
|
NUMBER OF ACCUMULATION UNITS OUTSTANDING—Note 11 |
|
|
57.9 |
|
|
55.3 |
||||||||
|
||||||||||||||
|
NET ASSET VALUE, PER ACCUMULATION UNIT—Note 10 |
|
|
$ |
|
335.393 |
|
|
$ |
|
298.872 |
||||
|
||||||||||||||
146Prospectus ¡ TIAA Real Estate Account |
See notes to the consolidated financial statements |
Consolidated statements of operations
TIAA Real Estate Account
|
|
|
|
|
|
|
|||||||||||||||
(In millions) |
Years Ended December 31, |
||||||||||||||||||||
2014 |
2013 |
2012 |
|||||||||||||||||||
|
|||||||||||||||||||||
|
INVESTMENT INCOME |
|
|
|
|
|
|
|||||||||||||||
|
Real estate income, net: |
|
|
|
|
|
|
|||||||||||||||
|
Rental income |
|
|
$ |
|
897.8 |
|
|
$ |
|
831.5 |
|
|
$ |
|
872.0 |
||||||
|
|
|
|
|
|
|
|
|||||||||||||||
|
Real estate property level expenses and taxes: |
|
|
|
|
|
|
|||||||||||||||
|
Operating expenses |
|
|
208.0 |
|
|
202.4 |
|
|
218.2 |
||||||||||||
|
Real estate taxes |
|
|
134.1 |
|
|
121.3 |
|
|
119.1 |
||||||||||||
|
Interest expense |
|
|
98.7 |
|
|
116.8 |
|
|
146.0 |
||||||||||||
|
|||||||||||||||||||||
|
Total real estate property level expenses and taxes |
|
|
440.8 |
|
|
440.5 |
|
|
483.3 |
||||||||||||
|
|||||||||||||||||||||
|
Real estate income, net |
|
|
457.0 |
|
|
391.0 |
|
|
388.7 |
||||||||||||
|
Income from real estate joint ventures and limited partnerships |
|
|
148.1 |
|
|
104.7 |
|
|
80.9 |
||||||||||||
|
Interest |
|
|
2.8 |
|
|
2.9 |
|
|
3.0 |
||||||||||||
|
Dividends |
|
|
44.9 |
|
|
42.2 |
|
|
32.3 |
||||||||||||
|
|||||||||||||||||||||
|
TOTAL INVESTMENT INCOME |
|
|
652.8 |
|
|
540.8 |
|
|
504.9 |
||||||||||||
|
|||||||||||||||||||||
|
Expenses: |
|
|
|
|
|
|
|||||||||||||||
|
Investment advisory charges |
|
|
70.7 |
|
|
59.3 |
|
|
56.3 |
||||||||||||
|
Administrative charges |
|
|
44.9 |
|
|
41.7 |
|
|
32.4 |
||||||||||||
|
Distribution charges |
|
|
17.3 |
|
|
12.8 |
|
|
13.9 |
||||||||||||
|
Mortality and expense risk charges |
|
|
0.9 |
|
|
0.8 |
|
|
2.8 |
||||||||||||
|
Liquidity guarantee charges |
|
|
29.2 |
|
|
30.5 |
|
|
31.3 |
||||||||||||
|
|||||||||||||||||||||
|
TOTAL EXPENSES |
|
|
163.0 |
|
|
145.1 |
|
|
136.7 |
||||||||||||
|
|||||||||||||||||||||
|
INVESTMENT INCOME, NET |
|
|
489.8 |
|
|
395.7 |
|
|
368.2 |
||||||||||||
|
|||||||||||||||||||||
|
NET REALIZED AND UNREALIZED GAIN (LOSS) ON |
|
|
|
|
|
|
|||||||||||||||
|
Net realized gain (loss) on investments: |
|
|
|
|
|
|
|||||||||||||||
|
Real estate properties |
|
|
69.0 |
|
|
(210.0 |
) |
|
|
|
(11.3 |
) |
|
||||||||
|
Real estate joint ventures and limited partnerships |
|
|
(34.7 |
) |
|
|
|
(153.0 |
) |
|
|
|
(104.5 |
) |
|
||||||
|
Marketable securities |
|
|
65.4 |
|
|
31.6 |
|
|
53.7 |
||||||||||||
|
|||||||||||||||||||||
|
Net realized gain (loss) on investments |
|
|
99.7 |
|
|
(331.4 |
) |
|
|
|
(62.1 |
) |
|
||||||||
|
|||||||||||||||||||||
|
Net change in unrealized appreciation |
|
|
|
|
|
|
|||||||||||||||
|
Real estate properties |
|
|
918.8 |
|
|
863.1 |
|
|
555.8 |
||||||||||||
|
Real estate joint ventures and limited partnerships |
|
|
372.0 |
|
|
479.0 |
|
|
424.1 |
||||||||||||
|
Marketable securities |
|
|
302.8 |
|
|
(41.7 |
) |
|
|
|
126.8 |
||||||||||
|
Mortgage loans payable |
|
|
(64.9 |
) |
|
|
|
91.2 |
|
|
(33.4 |
) |
|
||||||||
|
|||||||||||||||||||||
|
Net change in unrealized appreciation on |
|
|
1,528.7 |
|
|
1,391.6 |
|
|
1,073.3 |
||||||||||||
|
|||||||||||||||||||||
|
NET REALIZED AND UNREALIZED GAIN ON INVESTMENTS |
|
|
1,628.4 |
|
|
1,060.2 |
|
|
1,011.2 |
||||||||||||
|
|||||||||||||||||||||
|
NET INCREASE IN NET ASSETS RESULTING FROM |
|
|
$ |
|
2,118.2 |
|
|
$ |
|
1,455.9 |
|
|
$ |
|
1,379.4 |
||||||
|
|||||||||||||||||||||
See notes to the consolidated financial statements |
TIAA Real Estate Account ¡ Prospectus147 |
Consolidated statements of changes in net assets
TIAA Real Estate Account
|
|
|
|
|
|
|
|||||||||||||||
(In millions) |
Years Ended December 31, |
||||||||||||||||||||
2014 |
2013 |
2012 |
|||||||||||||||||||
|
|||||||||||||||||||||
|
FROM OPERATIONS |
|
|
|
|
|
|
|||||||||||||||
|
Investment income, net |
|
|
$ |
|
489.8 |
|
|
$ |
|
395.7 |
|
|
$ |
|
368.2 |
||||||
|
Net realized gain (loss) on investments |
|
|
99.7 |
|
|
(331.4 |
) |
|
|
|
(62.1 |
) |
|
||||||||
|
Net change in unrealized appreciation on investments and mortgage loans payable |
|
|
1,528.7 |
|
|
1,391.6 |
|
|
1,073.3 |
||||||||||||
|
|||||||||||||||||||||
|
NET INCREASE IN NET ASSETS |
|
|
2,118.2 |
|
|
1,455.9 |
|
|
1,379.4 |
||||||||||||
|
|||||||||||||||||||||
|
FROM PARTICIPANT TRANSACTIONS |
|
|
|
|
|
|
|||||||||||||||
|
Premiums |
|
|
2,432.6 |
|
|
2,439.0 |
|
|
2,068.4 |
||||||||||||
|
Liquidity units redeemed—Note 3 |
|
|
— |
|
|
(325.4 |
) |
|
|
|
(940.3 |
) |
|
||||||||
|
Annuity payments |
|
|
(31.6 |
) |
|
|
|
(28.3 |
) |
|
|
|
(25.1 |
) |
|
||||||
|
Withdrawals and death benefits |
|
|
(1,598.1 |
) |
|
|
|
(1,494.4 |
) |
|
|
|
(1,148.5 |
) |
|
||||||
|
|||||||||||||||||||||
|
NET INCREASE (DECREASE) IN NET ASSETS |
|
|
802.9 |
|
|
590.9 |
|
|
(45.5 |
) |
|
||||||||||
|
|||||||||||||||||||||
|
NET INCREASE IN NET ASSETS |
|
|
2,921.1 |
|
|
2,046.8 |
|
|
1,333.9 |
||||||||||||
|
NET ASSETS |
|
|
|
|
|
|
|||||||||||||||
|
Beginning of period |
|
|
16,907.9 |
|
|
14,861.1 |
|
|
13,527.2 |
||||||||||||
|
|||||||||||||||||||||
|
End of period |
|
|
$ |
|
19,829.0 |
|
|
$ |
|
16,907.9 |
|
|
$ |
|
14,861.1 |
||||||
|
|||||||||||||||||||||
148Prospectus ¡ TIAA Real Estate Account |
See notes to the consolidated financial statements |
Consolidated statements of cash flows
TIAA Real Estate Account
|
|
|
|
|
|
|
|||||||||||||||
(In millions) |
For the Years Ended December 31, |
||||||||||||||||||||
2014 |
2013 |
2012 |
|||||||||||||||||||
|
|||||||||||||||||||||
|
CASH FLOWS FROM OPERATING ACTIVITIES |
|
|
|
|
|
|
|||||||||||||||
|
Net increase in net assets resulting from operations |
|
|
$ |
|
2,118.2 |
|
|
$ |
|
1,455.9 |
|
|
$ |
|
1,379.4 |
||||||
|
Adjustments to reconcile net changes in net assets resulting from operations to net cash used in operating activities: |
|
|
|
|
|
|
|||||||||||||||
|
Deferred financing costs |
|
|
— |
|
|
— |
|
|
3.8 |
||||||||||||
|
Net realized (gain) loss on investments |
|
|
(99.7 |
) |
|
|
|
331.4 |
|
|
62.1 |
||||||||||
|
Net change in unrealized appreciation on |
|
|
(1,528.7 |
) |
|
|
|
(1,391.6 |
) |
|
|
|
(1,073.3 |
) |
|
||||||
|
Purchase of real estate properties |
|
|
(1,368.2 |
) |
|
|
|
(582.0 |
) |
|
|
|
(619.3 |
) |
|
||||||
|
Capital improvements on real estate properties |
|
|
(206.7 |
) |
|
|
|
(196.1 |
) |
|
|
|
(186.3 |
) |
|
||||||
|
Proceeds from sale of real estate properties |
|
|
933.8 |
|
|
435.8 |
|
|
449.8 |
||||||||||||
|
Purchases of long term investments |
|
|
(458.9 |
) |
|
|
|
(370.2 |
) |
|
|
|
(1,076.6 |
) |
|
||||||
|
Proceeds from long term investments |
|
|
431.9 |
|
|
224.9 |
|
|
675.5 |
||||||||||||
|
(Increase) decrease in other investments |
|
|
(711.8 |
) |
|
|
|
(550.0 |
) |
|
|
|
233.3 |
||||||||
|
Change in due (from) to investment manager |
|
|
(4.7 |
) |
|
|
|
(13.1 |
) |
|
|
|
17.4 |
||||||||
|
Decrease (increase) in other assets |
|
|
85.7 |
|
|
(21.4 |
) |
|
|
|
(30.6 |
) |
|
||||||||
|
(Decrease) increase in other liabilities |
|
|
(1.7 |
) |
|
|
|
8.6 |
|
|
15.6 |
||||||||||
|
|||||||||||||||||||||
|
NET CASH USED IN OPERATING ACTIVITIES |
|
|
(810.8 |
) |
|
|
|
(667.8 |
) |
|
|
|
(149.2 |
) |
|
||||||
|
|||||||||||||||||||||
|
CASH FLOWS FROM FINANCING ACTIVITIES |
|
|
|
|
|
|
|||||||||||||||
|
Mortgage loan proceeds received |
|
|
252.5 |
|
|
900.0 |
|
|
208.1 |
||||||||||||
|
Payments of mortgage loans |
|
|
(222.7 |
) |
|
|
|
(830.2 |
) |
|
|
|
(9.2 |
) |
|
||||||
|
Premiums |
|
|
2,432.6 |
|
|
2,439.0 |
|
|
2,068.4 |
||||||||||||
|
Liquidity units redeemed |
|
|
— |
|
|
(325.4 |
) |
|
|
|
(940.3 |
) |
|
||||||||
|
Annuity payments |
|
|
(31.6 |
) |
|
|
|
(28.3 |
) |
|
|
|
(25.1 |
) |
|
||||||
|
Withdrawals and death benefits |
|
|
(1,598.1 |
) |
|
|
|
(1,494.4 |
) |
|
|
|
(1,148.5 |
) |
|
||||||
|
|||||||||||||||||||||
|
NET CASH PROVIDED BY FINANCING ACTIVITIES |
|
|
832.7 |
|
|
660.7 |
|
|
153.4 |
||||||||||||
|
|||||||||||||||||||||
|
NET INCREASE (DECREASE) IN CASH AND CASH |
|
|
21.9 |
|
|
(7.1 |
) |
|
|
|
4.2 |
||||||||||
|
CASH AND CASH EQUIVALENTS |
|
|
|
|
|
|
|||||||||||||||
|
Beginning of period |
|
|
14.6 |
|
|
21.7 |
|
|
17.5 |
||||||||||||
|
|||||||||||||||||||||
|
End of period |
|
|
$ |
|
36.5 |
|
|
$ |
|
14.6 |
|
|
$ |
|
21.7 |
||||||
|
|||||||||||||||||||||
|
SUPPLEMENTAL DISCLOSURES: |
|
|
|
|
|
|
|||||||||||||||
|
Cash paid for interest |
|
|
$ |
|
100.1 |
|
|
$ |
|
116.2 |
|
|
$ |
|
117.0 |
||||||
|
|||||||||||||||||||||
|
Debt assumed in acquisition of property |
|
|
$ |
|
— |
|
|
$ |
|
— |
|
|
$ |
|
36.9 |
||||||
|
|||||||||||||||||||||
See notes to the consolidated financial statements |
TIAA Real Estate Account ¡ Prospectus149 |
Notes to the consolidated financial statements
TIAA Real Estate Account
Note 1—Organization and significant accounting policies
Business: The TIAA Real Estate Account (“Account”) is a segregated investment account of Teachers Insurance and Annuity Association of America (“TIAA”) and was established by resolution of TIAA’s Board of Trustees (the “Board”) on February 22, 1995, under the insurance laws of the State of New York, for the purpose of funding variable annuity contracts issued by TIAA. The Account offers individual and group accumulating annuity contracts (with contributions made on a pre-tax or after-tax basis), as well as individual lifetime and term-certain variable payout annuity contracts (including the payment of death benefits to beneficiaries). Investors are entitled to transfer funds to or from the Account, and make withdrawals from the Account on a daily basis under certain circumstances. Funds invested in the Account for each category of contract are expressed in terms of units, and unit values will fluctuate depending on the Account’s performance.
The investment objective of the Account is to seek favorable long-term returns primarily through rental income and capital appreciation from real estate and real estate-related investments owned by the Account. The Account holds real estate properties directly and through subsidiaries wholly owned by TIAA for the benefit of the Account. The Account also holds interests in real estate joint ventures and limited partnerships in which the Account does not hold a controlling interest; as such, such interests are not consolidated into these consolidated financial statements. The Account also has invested in mortgage loans receivable collateralized by commercial real estate properties. Additionally, the Account invests in real estate-related and non-real estate-related publicly traded securities, cash and other instruments to maintain adequate liquidity levels for operating expenses, capital expenditures and to fund benefit payments (withdrawals, transfers and related transactions).
The consolidated financial statements were prepared in accordance with accounting principles generally accepted in the United States of America, which requires the use of estimates made by management. Actual results may vary from those estimates and such differences may be material. The following is a summary of the significant accounting policies of the Account.
Basis of Presentation: The accompanying consolidated financial statements include the Account and those subsidiaries wholly owned by TIAA for the benefit of the Account. All significant intercompany accounts and transactions between the Account and such subsidiaries have been eliminated.
The Accumulation Unit Value (“AUV”) used for financial reporting purposes may differ from the AUV used for processing transactions. The AUV used for financial reporting purposes includes security and participant transactions effective through the period end date to which this report relates.
150Prospectus ¡ TIAA Real Estate Account |
Notes to the consolidated financial statements continued
Certain prior year amounts have been reclassified to conform to the current year presentation.
The amount disclosed in the consolidated statements of assets and liabilities and consolidated schedules of investments for the cost of real estate joint ventures and limited partnerships as of December 31, 2013 has been revised by $41.2 million. This revision was not considered material to the previously issued financial statements and it had no impact to the Account’s net assets, results of operations or cash flows.
Determination of Investments at Fair Value: The Account reports all investments at fair value in accordance with the Financial Accounting Standards Board (“FASB”) Accounting Standards Codification (“ASC”) 946, Financial Services — Investment Companies. Further in accordance with the adoption of the fair value option allowed under ASC 825, Financial Instruments, and at the election of Account management, mortgage loans payable are reported at fair value. The FASB has defined fair value as the price that would be received to sell an asset or paid to transfer a liability in an orderly transaction between market participants.
The following is a description of the valuation methodologies used to determine the fair value of the Account’s investments and investment related mortgage loans payable.
Valuation of Real Estate Properties — Investments in real estate properties are stated at fair value, as determined in accordance with policies and procedures reviewed by the Investment Committee of the Board and in accordance with the responsibilities of the Board as a whole. Accordingly, the Account does not record depreciation. Determination of fair value involves significant levels of judgment because the actual fair value of real estate can be determined only by negotiation between the parties in a sales transaction. The Account’s primary objective when valuing its real estate investments will be to produce a valuation that represents a reasonable estimate of the fair value of its investments. Implicit in the Account’s definition of fair value are the consummation of a sale as of a specified date and the passing of title from seller to buyer under conditions whereby:
• |
Buyer and seller are typically motivated; |
||
• |
Both parties are well informed or well advised, and acting in what they consider their best interests; |
||
• |
A reasonable time is allowed for exposure in the open market; |
||
• |
Payment is made in terms of cash or in terms of financial arrangements comparable thereto; and |
||
• |
The price represents the normal consideration for the property sold unaffected by special or creative financing or sales concessions granted by anyone associated with the sale. |
TIAA Real Estate Account ¡ Prospectus151 |
Notes to the consolidated financial statements continued
Property and investment values are affected by, among other things, the availability of capital, occupancy rates, rental rates, and interest and inflation rates. As a result, determining real estate and investment values involves many assumptions. Key inputs and assumptions include rental income and expense amounts, related rental income and expense growth rates, discount rates and capitalization rates. Valuation techniques include discounted cash flow analysis, prevailing market capitalization rates or multiples applied to earnings from the property, analysis of recent comparable sales transactions, actual sale negotiations and bona fide purchase offers received from third parties. Amounts ultimately realized from each investment may vary significantly from the fair value presented.
Real estate properties owned by the Account are initially valued based on an independent third party appraisal, as reviewed by TIAA’s internal appraisal staff and as applicable the Account’s independent fiduciary at the time of the closing of the purchase, which may result in a potential unrealized gain or loss reflecting the difference between an investment’s fair value (i.e., exit price) and its cost basis (which is inclusive of transaction costs).
Subsequently, each property is appraised each quarter by an independent third party appraiser, reviewed by TIAA’s internal appraisal staff and as applicable the Account’s independent fiduciary. In general, the Account obtains appraisals of its real estate properties spread out throughout the quarter, which is intended to result in appraisal adjustments, and thus, adjustments to the valuations of its holdings (to the extent such adjustments are made) that happen regularly throughout each quarter and not on one specific day or month in each period.
Further, management reserves the right to order an appraisal and/or conduct another valuation outside of the normal quarterly process when facts or circumstances at a specific property change. For example, under certain circumstances a valuation adjustment could be made when the account receives a bona fide bid for the sale of a property held within the Account or one of the Account’s joint ventures. In addition, adjustments may be made for events or circumstances indicating an impairment of a tenant’s ability to pay amounts due to the Account under a lease (including due to a bankruptcy filing of that tenant). Alternatively, adjustments may be made to reflect the execution or renewal of a significant lease. Also, adjustments may be made to reflect factors (such as sales values for comparable properties or local employment rate) bearing uniquely on a particular region in which the Account holds properties. TIAA’s internal appraisal staff oversees the entire appraisal process, in conjunction with the Account’s independent fiduciary (the independent fiduciary is more fully described in the paragraph below). Any differences in the conclusions of TIAA’s internal appraisal staff and the independent appraiser will be reviewed by the independent fiduciary, which will make a final determination on the matter (which may include ordering a subsequent independent appraisal).
152Prospectus ¡ TIAA Real Estate Account |
Notes to the consolidated financial statements continued
The independent fiduciary, RERC, has been appointed by a special subcommittee of the Investment Committee of the Board to, among other things, oversee the appraisal process. The independent fiduciary must approve all independent appraisers used by the Account. All appraisals are performed in accordance with Uniform Standards of Professional Appraisal Practices, the real estate appraisal industry standards created by The Appraisal Foundation. Real estate appraisals are estimates of property values based on a professional’s opinion. Appraisals of properties held outside of the U.S. are performed in accordance with industry standards commonly applied in the applicable jurisdiction. These independent appraisers are always expected to be MAI-designated members of the Appraisal Institute (or its European equivalent, Royal Institute of Chartered Surveyors) and state certified appraisers from national or regional firms with relevant property type experience and market knowledge. Under the Account’s current procedures, each independent appraisal firm will be rotated off of a particular property at least every three years, although such appraisal firm may perform appraisals of other Account properties subsequent to such rotation.
Also, the independent fiduciary can require additional appraisals if factors or events have occurred that could materially change a property’s value (including those identified above) and such change is not reflected in the quarterly valuation review, or otherwise to ensure that the Account is valued appropriately. The independent fiduciary must also approve any valuation change of real estate-related assets where a property’s value changed by more than 6% from the most recent independent annual appraisal, or if the value of the Account would change by more than 4% within any calendar quarter or more than 2% since the prior calendar month. When a real estate property is subject to a mortgage, the property is valued independently of the mortgage and the property and mortgage fair values are reported separately (see Valuation of Mortgage Loans Payable below). The independent fiduciary reviews and approves all mortgage valuation adjustments before such adjustments are recorded by the Account. The Account continues to use the revised value for each real estate property and mortgage loan payable to calculate the Account’s daily net asset value until the next valuation review or appraisal.
Valuation of Real Estate Joint Ventures — Real estate joint ventures are stated at the fair value of the Account’s ownership interests of the underlying entities. The Account’s ownership interests are valued based on the fair value of the underlying real estate, any related mortgage loans payable, and other factors, such as ownership percentage, ownership rights, buy/sell agreements, distribution provisions and capital call obligations. Upon the disposition of all real estate investments by an investee entity, the Account will continue to state its equity in the remaining net assets of the investee entity during the wind down period, if any, which occurs prior to the dissolution of the investee entity.
TIAA Real Estate Account ¡ Prospectus153 |
Notes to the consolidated financial statements continued
Valuation of Real Estate Limited Partnerships — Limited partnership interests are stated at the fair value of the Account’s ownership in the partnership which are recorded based upon the changes in the net asset values of the limited partnerships as determined from the financial statements of the limited partnerships when received by the Account. Prior to the receipt of the financial statements from the limited partnerships, the Account estimates the value of its interest in good faith and will from time to time seek input from the issuer or the sponsor of the investments. Since market quotations are not readily available, the limited partnership interests are valued at fair value as determined in good faith by management under the direction of the Investment Committee of the Board and in accordance with the responsibilities of the Board as a whole.
Valuation of Marketable Securities — Equity securities listed or traded on any national market or exchange are valued at the last sale price as of the close of the principal securities market or exchange on which such securities are traded or, if there is no sale, at the mean of the last bid and asked prices on such market or exchange, exclusive of transaction costs.
Debt securities, other than money market instruments, are generally valued at the most recent bid price or the equivalent quoted yield for such securities (or those of comparable maturity, quality and type).
Short-term investments with maturities of 60 days or less (excluding money market instruments) are valued at amortized cost. Short-term investments with maturities in excess of 60 days (excluding money market instruments) are valued in the same manner as debt securities, as described above.
Money market instruments are valued at amortized cost.
Equity and fixed income securities traded on a foreign exchange or in foreign markets are valued using their closing values under the valuation methods generally accepted in the country where traded, as of the valuation date. This value is converted to U.S. dollars at the exchange rate in effect on the valuation day. Under certain circumstances (for example, if there are significant movements in the United States markets and there is an expectation the securities traded on foreign markets will adjust based on such movements when the foreign markets open the next day), the Account may adjust the value of equity or fixed income securities that trade on a foreign exchange or market after the foreign exchange or market has closed.
Valuation of Mortgage Loans Payable — Mortgage loans payable are stated at fair value. The estimated fair values of mortgage loans payable are based on the amount at which the liability could be transferred to a third party exclusive of transaction costs. Mortgage loans payable are valued internally by TIAA’s internal valuation department, as reviewed by the Account’s independent fiduciary, at least quarterly based on market factors, such as market interest rates and spreads for comparable loans, the performance of the underlying collateral (such as the loan-to-value ratio and the cash flow of the underlying collateral), the
154Prospectus ¡ TIAA Real Estate Account |
Notes to the consolidated financial statements continued
liquidity for mortgage loans of similar characteristics, the maturity date of the loan, the return demands of the market.
See Note 6 — Assets and liabilities measured at fair value on a recurring basis for further discussion and disclosure regarding the determination of the fair value of the Account’s investments.
Foreign Currency Transactions and Translation: Portfolio investments and other assets and liabilities denominated in foreign currencies are translated into U.S. dollars at the exchange rates prevailing at the end of the period. Purchases and sales of securities, income receipts and expense payments made in foreign currencies are translated into U.S. dollars at the exchange rates prevailing on the respective dates of the transactions. The effect of any changes in foreign currency exchange rates on portfolio investments and mortgage loans payable are included in net realized and unrealized gains and losses on real estate properties and mortgage loans payable. Net realized gains and losses on foreign currency transactions include disposition of foreign currencies, and currency gains and losses between the accrual and receipt dates of portfolio investment income and between the trade and settlement dates of portfolio investment transactions.
Accumulation and Annuity Funds: The accumulation fund represents the net assets attributable to participants in the accumulation phase of their investment (“Accumulation Fund”). The annuity fund represents the net assets attributable to the participants currently receiving annuity payments (“Annuity Fund”). The net increase or decrease in net assets from investment operations is apportioned between the accounts based upon their relative daily net asset values. Once an Account participant begins receiving lifetime annuity income benefits, payment levels cannot be reduced as a result of the Account’s actual mortality experience. In addition, the contracts pursuant to which the Account is offered are required to stipulate the maximum expense charge for all Account level expenses that can be assessed, which is not to exceed 2.5% of average net assets per year. The Account pays a fee to TIAA to assume mortality and expense risks.
Accounting for Investments: The investments held by the Account are accounted for as follows:
Real Estate Properties — Rent from real estate properties consists of all amounts earned under tenant operating leases, including base rent, recoveries of real estate taxes and other expenses and charges for miscellaneous services provided to tenants. Rental income is recognized in accordance with the billing terms of the lease agreements. The Account bears the direct expenses of the real estate properties owned. These expenses include, but are not limited to, fees to local property management companies, property taxes, utilities, maintenance, repairs, insurance, and other operating and administrative costs. An estimate of the net operating income earned from each real estate property is accrued by the Account on a daily basis and such estimates are adjusted when actual operating results are determined.
TIAA Real Estate Account ¡ Prospectus155 |
Notes to the consolidated financial statements continued
Real Estate Joint Ventures — The Account has limited ownership interests in various real estate joint ventures (collectively, the “joint ventures”). The Account records its contributions as increases to its investments in the joint ventures, and distributions from the joint ventures are treated as income within income from real estate joint ventures and limited partnerships in the Account’s consolidated statements of operations. Distributions that are identified as returns of capital are recorded as a reduction to the cost basis of the investment, whereas distributions identified as capital gains or losses are recorded as realized gains or losses. Income from the joint ventures is recorded based on the Account’s proportional interest of the income distributed by the joint ventures. Income earned but not yet distributed to the Account by the joint ventures is recorded as unrealized gains and losses.
Limited Partnerships — The Account has limited ownership interests in various private real estate funds (primarily limited partnerships) and a private real estate investment trust (collectively, the “limited partnerships”). The Account records its contributions as increases to the investments, and distributions from the investments are treated as income within income from real estate joint ventures and limited partnerships in the Account’s consolidated statements of operations. Distributions that are identified as returns of capital are recorded as a reduction to the cost basis of the investment, whereas distributions identified as capital gains or losses are recorded as realized gains or losses. Unrealized gains and losses are recorded based upon the changes in the net asset values of the limited partnerships as determined from the financial statements of the limited partnerships when received by the Account. Prior to the receipt of the financial statements from the limited partnerships, the Account estimates the value of its interest in good faith and will from time to time seek input from the issuer or the sponsor of the investments. Changes in value based on such estimates are recorded by the Account as unrealized gains and losses.
Marketable Securities — Transactions in marketable securities are accounted for as of the date the securities are purchased or sold (trade date). Interest income is recorded as earned. Dividend income is recorded on the ex-dividend date within dividend income. Dividends that are identified as returns of capital are recorded as a reduction to the cost basis of the investment, whereas dividends identified as capital gains or losses are recorded as realized gains or losses. Realized gains and losses on securities transactions are accounted for on the specific identification method.
Realized and Unrealized Gains and Losses — Realized gains and losses are recorded at the time an investment is sold or a distribution is received in relation to an investment sale from a joint venture or limited partnership. Real estate transactions are accounted for as of the date on which the purchase or sale transactions for the real estate properties close (settlement date). The Account recognizes a realized gain on the sale of a real estate property to the extent that
156Prospectus ¡ TIAA Real Estate Account |
Notes to the consolidated financial statements continued
the contract sales price exceeds the cost-to-date of the property being sold. A realized loss occurs when the cost-to-date exceeds the sales price.
Unrealized gains and losses are recorded as the fair values of the Account’s investments are adjusted, and as discussed within the Real Estate Joint Ventures and Limited Partnerships sections above.
Net Assets — The Account’s net assets as of the close of each valuation day are valued by taking the sum of:
• |
the value of the Account’s cash; cash equivalents, and short-term and other debt instruments; |
||
• |
the value of the Account’s other securities and other non-real estate assets; |
||
• |
the value of the individual real properties (based on the most recent valuation of that property) and other real estate-related investments owned by the Account; |
||
• |
an estimate of the net operating income accrued by the Account from its properties, other real estate-related investments and non-real estate-related investments (including short-term marketable securities) since the end of the prior valuation day; and |
||
• |
actual net operating income earned from the Account’s properties, other real estate-related investments and non-real estate-related investments (but only to the extent any such item of income differs from the estimated income accrued for on such investments), |
and then reducing the sum by liabilities held within the Account, including the daily investment management fee, administration and distribution fees, mortality and expense fee, and liquidity guarantee fee, and certain other expenses attributable to operating the Account. Daily estimates of net operating income are adjusted to reflect actual net operating income on a monthly basis, at which time such adjustments (if any) are reflected in the Account’s unit value.
After the end of every quarter, the Account reconciles the amount of expenses deducted from the Account (which is established in order to approximate the costs that the Account will incur) with the expenses the Account actually incurred. If there is a difference, the Account adds it to or deducts it from the Account in equal daily installments over the remaining days of the following quarter. Material differences may be repaid in the current calendar quarter. The Account’s at-cost deductions are based on projections of Account assets and overall expenses, and the size of any adjusting payments will be directly affected by the difference between management’s projections and the Account’s actual assets or expenses.
Cash and Cash Equivalents: Cash and cash equivalents are balances held by the Account in bank deposit accounts which, at times, exceed federally insured limits. The Account’s management monitors these balances to mitigate the
TIAA Real Estate Account ¡ Prospectus157 |
Notes to the consolidated financial statements continued
exposure of risk due to concentration and has not experienced any losses from such concentration.
Other Assets and Other Liabilities: Other assets and other liabilities are comprised of operating assets and liabilities utilized and held at each individual real estate property investment. Other assets consist of, amongst other items, cash, tenant receivables and prepaid expenses; whereas other liabilities primarily consist of security deposits.
Federal Income Taxes: Based on provisions of the Internal Revenue Code, Section 817, the Account is taxed as a segregated asset account of TIAA and as such, the Account incurs no material federal income tax attributable to the net investment activity of the Account. The Account’s federal income tax return is generally subject to examination for a period of three years after filed. State and local tax returns may be subject to examination for an additional period of time depending on the jurisdiction. Management has analyzed the Accounts’ tax positions taken for all open federal income tax years and has concluded that no provision for federal income tax is required in the Accounts’ financial statements.
Restricted Cash: The Account held $20.4 million and $46.0 million as of December 31, 2014 and 2013, respectively, in escrow accounts for property taxes, insurance, and various other property related matters as required by certain creditors related to outstanding mortgage loans payable collateralized by certain real estate investments. These amounts are recorded within other assets on the consolidated statements of assets and liabilities. See Note 9 — Mortgage loans payable for additional information regarding the Account’s outstanding mortgage loans payable.
Changes in Net Assets: Premiums include premiums paid by existing accumulation unit holders in the Account and transfers into the Account. Withdrawals and death benefits include withdrawals out of the Account which include transfers out of the Account and required minimum distributions.
Due to/from Investment Manager: Due to/from investment manager represents amounts that are to be paid or received by TIAA on behalf of the Account. Amounts generally are paid or received by the Account within one or two business days and no interest is contractually charged on these amounts.
New Accounting Pronouncement: In June 2013, the FASB issued Accounting Standards Update 2013-08 Financial Services — Investment Companies (Topic 946) — Amendments to the Scope, Measurement, and Disclosure Requirements (the “ASU”) which amends the criteria for an entity to qualify as an investment company and introduces new disclosure requirements that apply to all investment companies. Effective January 1, 2014, the Account adopted the ASU. The adoption of the ASU did not have an impact on the Account’s consolidated financial statements.
158Prospectus ¡ TIAA Real Estate Account |
Notes to the consolidated financial statements continued
Note 2—Management agreements and arrangements
Investment advisory services for the Account are provided by TIAA employees, under the direction of the Board and its Investment Committee, pursuant to investment management procedures adopted by TIAA for the Account. TIAA’s investment management decisions for the Account are subject to review by the Account’s independent fiduciary. TIAA also provides various portfolio accounting and related services for the Account.
The Account is a party to the Distribution Agreement for the Contracts Funded by the TIAA Real Estate Account (the “Distribution Agreement”), dated January 1, 2008, by and among TIAA, for itself and on behalf of the Account, and TIAA-CREF Individual and Institutional Services, LLC (“Services”), a wholly owned subsidiary of TIAA, a registered broker-dealer and a member of the Financial Industry Regulatory Authority. Pursuant to the Distribution Agreement, Services performs distribution services for the Account which include, among other things, (i) distribution of annuity contracts issued by TIAA and funded by the Account, (ii) advising existing annuity contract owners in connection with their accumulations and (iii) helping employers implement and manage retirement plans. In addition, TIAA performs administrative functions for the Account, which include, among other things, (i) maintaining accounting records and performing accounting services, (ii) receiving and allocating premiums, (iii) calculating and making annuity payments, (iv) processing withdrawal requests, (v) providing regulatory compliance and reporting services, (vi) maintaining the Account’s records of contract ownership and (vii) otherwise assisting generally in all aspects of the Account’s operations. Both distribution services (pursuant to the Distribution Agreement) and administrative services are provided to the Account by Services and TIAA, as applicable, on a cost basis.
The Distribution Agreement is terminable by either party upon 60 days written notice and terminates automatically upon any assignment thereof.
TIAA and Services provide investment management, administrative and distribution services at cost. TIAA and Services receive payments from the Account on a daily basis according to formulas established each year and adjusted periodically with the objective of keeping the payments as close as possible to the Account’s expenses actually incurred. Any differences between actual expenses and the amounts paid by the Account are adjusted quarterly.
TIAA also provides a liquidity guarantee to the Account, for a fee, to ensure that sufficient funds are available to meet participant transfer and cash withdrawal requests in the event that the Account’s cash flows and liquid investments are insufficient to fund such requests. TIAA ensures sufficient funds are available for such transfer and withdrawal requests by purchasing accumulation units of the Account. See Note 3—Related party transactions below.
To the extent TIAA owns accumulation units issued pursuant to the liquidity guarantee, the independent fiduciary monitors and oversees, among other things,
TIAA Real Estate Account ¡ Prospectus159 |
Notes to the consolidated financial statements continued
TIAA’s ownership interest in the Account and may require TIAA to eventually redeem some of its units, particularly when the Account has un-invested cash or liquid investments available. TIAA also receives a fee for assuming certain mortality and expense risks.
The expenses for the services noted above that are provided to the Account by TIAA and Services are identified in the accompanying consolidated statements of operations and are reflected in Note 10—Financial highlights.
Note 3—Related party transactions
Pursuant to its existing liquidity guarantee obligation, the TIAA General Account purchased in multiple transactions an aggregate of 4.7 million accumulation units (which are generally referred to as “liquidity units”) in the Account between December 2008 and June 2009 for an aggregate amount of $1.2 billion. TIAA has not purchased additional liquidity units since June 2009.
In accordance with this liquidity guarantee obligation, TIAA guarantees that all participants in the Account may redeem their accumulation units at their accumulation unit value next determined after their transfer or cash withdrawal request is received in good order. Liquidity units owned by TIAA are valued in the same manner as accumulation units owned by the Account’s participants. Management believes that TIAA has the ability to meet its obligations under the liquidity guarantee.
As discussed in the Account’s prospectus and in accordance with a prohibited transaction exemption from the U.S. Department of Labor (PTE 96-76), the Account’s independent fiduciary, RERC, has certain responsibilities with respect to the Account that it has undertaken or is currently undertaking with respect to TIAA’s purchase of liquidity units, including among other things, reviewing the purchase and redemption of liquidity units by TIAA to ensure the Account uses the correct unit values. In addition, as set forth in PTE 96-76, the independent fiduciary’s responsibilities include:
• |
establishing the percentage of total accumulation units that TIAA’s ownership should not exceed (the “trigger point”) and creating a method for changing the trigger point; |
||
• |
approving any adjustment of TIAA’s ownership interest in the Account and, in its discretion, requiring an adjustment if TIAA’s ownership of liquidity units reaches the trigger point; and |
||
• |
once the trigger point has been reached, participating in any program to reduce TIAA’s ownership in the Account by utilizing cash flow or liquid investments in the Account, or by utilizing the proceeds from asset sales. The independent fiduciary’s role in participating in any such asset sales program would include (i) participating in the selection of properties for sale, (ii) providing sales guidelines and (iii) approving those sales if, in the |
160Prospectus ¡ TIAA Real Estate Account |
Notes to the consolidated financial statements continued
|
independent fiduciary’s opinion, such sales are desirable to reduce TIAA’s ownership of liquidity units. |
The independent fiduciary, which has the right to adjust the trigger point, has established the trigger point at 45% of the outstanding accumulation units and it will continue to monitor TIAA’s ownership interest in the Account and provide further recommendations as necessary.
As of March 31, 2013, the independent fiduciary completed the systematic redemption of all of the liquidity units held by TIAA. Approximately one-quarter of such units were redeemed evenly over the business days in each of the months of June, September, December 2012, and March 2013, representing a total of $940.3 million and $325.4 million redeemed during 2012 and 2013, respectively.
As discussed in Note 2—Management agreements and arrangements, TIAA and Services provide certain services to the Account on an at cost basis. See Note 10—Financial highlights for details of the expense charge and expense ratio.
Note 4—Credit risk concentrations
Concentrations of credit risk may arise when a number of properties or tenants are located in a similar geographic region such that the economic conditions of that region could impact tenants’ obligations to meet their contractual obligations or cause the values of individual properties to decline. The Account has no significant concentrations of tenants as no single tenant has annual contract rent that makes up more than 2.6% of the rental income of the Account.
The following table represents the diversification of the Account’s portfolio by region and property type:
DIVERSIFICATION BY FAIR VALUE(1)
|
|
|
|
|
|
|
|
|
|
|
|
|
East |
West |
South |
Midwest |
Total |
|||||
|
||||||||||
|
Office |
20.9% |
16.8% |
6.9% |
0.3% |
44.9% |
|||||
|
Apartment |
10.6% |
8.6% |
3.5% |
— |
22.7% |
|||||
|
Retail |
4.0% |
3.9% |
7.5% |
0.3% |
15.7% |
|||||
|
Industrial |
1.4% |
7.4% |
3.8% |
0.9% |
13.5% |
|||||
|
Other(2) |
2.8% |
0.2% |
0.1% |
0.1% |
3.2% |
|||||
|
||||||||||
|
Total |
39.7% |
36.9% |
21.8% |
1.6% |
100.0% |
|||||
|
||||||||||
(1) |
Wholly owned properties are represented at fair value and gross of any debt, while joint venture properties are represented at the net equity value. |
||
(2) |
Represents interest in Storage Portfolio investment and a fee interest encumbered by a ground lease real estate investment. |
||
Properties in the “East” region are located in: CT, DC, DE, KY, MA, MD, ME, NC, NH, NJ, NY, PA, RI, SC, VA, VT, WV |
|||
Properties in the “West” region are located in: AK, AZ, CA, CO, HI, ID, MT, NM, NV, OR, UT, WA, WY |
|||
Properties in the “South” region are located in: AL, AR, FL, GA, LA, MS, OK, TN, TX |
|||
Properties in the “Midwest” region are located in: IA, IL, IN, KS, MI, MN, MO, ND, NE, OH, SD, WI |
TIAA Real Estate Account ¡ Prospectus161 |
Notes to the consolidated financial statements continued
Note 5—Leases
The Account’s wholly owned real estate properties are leased to tenants under operating lease agreements which expire on various dates through 2090. Aggregate minimum annual rentals for wholly owned real estate investments owned by the Account, excluding short-term residential leases, are as follows (in millions):
|
|
|
|
|
Years Ending December 31, |
|
|
||
|
2015 |
$ 493.8 |
|
|
2016 |
466.3 |
|
|
2017 |
415.3 |
|
|
2018 |
363.7 |
|
|
2019 |
313.6 |
|
|
Thereafter |
2,990.9 |
|
|
||
|
Total |
$5,043.6 |
|
|
||
Certain leases provide for additional rental amounts based upon the recovery of actual operating expenses in excess of specified base amounts, sales volume or contractual increases as defined in the lease agreement. These contractual contingent rentals are not included in the table above.
Note 6—Assets and liabilities measured at fair value on a recurring basis
Valuation Hierarchy: The Account’s fair value measurements are grouped categorically into three levels, as defined by the FASB. The levels are defined as follows:
Level 1 — Valuations using unadjusted quoted prices for assets traded in active markets, such as stocks listed on the New York Stock Exchange. Active markets are defined as having the following characteristics for the measured asset or liability: (i) many transactions, (ii) current prices, (iii) price quotes not varying substantially among market makers, (iv) narrow bid/ask spreads and (v) most information regarding the issuer is publicly available. Level 1 assets held by the Account are generally marketable equity securities.
Level 2 — Valuations for assets and liabilities traded in less active, dealer or broker markets. Fair values are primarily obtained from third party pricing services for identical or comparable assets or liabilities. Level 2 inputs for fair value measurements are inputs, other than quoted prices included within Level 1, that are observable for the asset or liability, either directly or indirectly. Level 2 inputs include:
a. |
Quoted prices for similar assets or liabilities in active markets; |
||
b. |
Quoted prices for identical or similar assets or liabilities in markets that are not active (that is, markets in which there are few transactions for the asset (or liability), the prices are not current, price quotations vary |
162Prospectus ¡ TIAA Real Estate Account |
Notes to the consolidated financial statements continued
|
substantially either over time or among market makers (for example, some brokered markets), or in which little information is released publicly); |
||
c. |
Inputs other than quoted prices that are observable within the market for the asset (or liability) (for example, interest rates and yield curves, volatilities, prepayment speeds, loss severities, credit risks, and default rates that are observable at commonly quoted intervals); and |
||
d. |
Inputs that are derived principally from or corroborated by observable market data by correlation or other means (for example, market-corroborated inputs). |
Examples of securities which may be held by the Account and included in Level 2 include certificates of deposit, commercial paper, government agency notes, variable notes, United States Treasury securities, and debt securities.
Level 3 — Valuations for assets and liabilities that are derived from other valuation methodologies, including pricing models, discounted cash flow models and similar techniques, and are not based on market exchange, dealer, or broker-traded transactions. Level 3 valuations incorporate certain assumptions and projections that are not observable in the market, and require significant professional judgment in determining the fair value assigned to such assets or liabilities. Examples of Level 3 assets and liabilities which may be held by the Account from time to time include investments in real estate, investments in joint ventures and limited partnerships, and mortgage loans receivable and payable.
An investment’s categorization within the valuation hierarchy described above is based upon the lowest level of input that is significant to the fair value measurement.
The Account’s determination of fair value is based upon quoted market prices, where available. If listed prices or quotes are not available, fair value is based upon vendor-provided, evaluated prices or internally developed models that primarily use market-based or independently sourced market data, including interest rate yield curves, market spreads, and currency rates. Valuation adjustments will be made to reflect changes in credit quality, counterparty’s creditworthiness, the Account’s creditworthiness, liquidity, and other observable and unobservable inputs that are applied consistently over time.
The methods described above are considered to produce fair values that represent a good faith estimate of what an unaffiliated buyer in the marketplace would pay to purchase the asset or would receive to transfer the liability. Since fair value calculations involve significant professional judgment in the application of both observable and unobservable attributes, actual realizable values or future fair values may differ from amounts reported. Furthermore, while the Account believes its valuation methods are appropriate and consistent with other market participants, the use of different methodologies or assumptions to determine the fair value of certain financial instruments, while reasonable, could result in
TIAA Real Estate Account ¡ Prospectus163 |
Notes to the consolidated financial statements continued
different estimates of fair value at the reporting date. As discussed in Note 1—Organization and significant accounting policies in more detail, the Account generally obtains independent third party appraisals on a quarterly basis; there may be circumstances in the interim in which the true realizable value of a property is not reflected in the Account’s daily net asset value calculation or in the Account’s periodic consolidated financial statements. This disparity may be more apparent when the commercial and/or residential real estate markets experience an overall and possibly dramatic decline (or increase) in property values in a relatively short period of time between appraisals.
The following tables show the major categories of assets and liabilities measured at fair value on a recurring basis as of December 31, 2014 and 2013, using unadjusted quoted prices in active markets for identical assets (Level 1); significant other observable inputs (Level 2); and significant unobservable inputs (Level 3) (in millions):
|
|
|
|
|
|
|
|
|
|||||||||||||||
Description |
Level 1: |
Level 2: |
Level 3: |
Total at |
|||||||||||||||||||
|
|||||||||||||||||||||||
|
Real estate properties |
|
|
$ |
|
— |
|
|
$ |
|
— |
|
|
$ |
|
13,139.0 |
$13,139.0 |
|||||||
|
Real estate joint ventures |
|
|
— |
|
|
— |
|
|
3,022.1 |
3,022.1 |
|||||||||||||
|
Limited partnerships |
|
|
— |
|
|
— |
|
|
357.5 |
357.5 |
|||||||||||||
|
Marketable securities: |
|
|
|
|
|
|
|
|
|||||||||||||||
|
Real estate related |
|
|
1,818.4 |
|
|
— |
|
|
— |
1,818.4 |
|||||||||||||
|
Government agency notes |
|
|
— |
|
|
2,369.9 |
|
|
— |
2,369.9 |
|||||||||||||
|
United States Treasury securities |
|
|
— |
|
|
1,461.2 |
|
|
— |
1,461.2 |
|||||||||||||
|
|||||||||||||||||||||||
|
Total Investments at December 31, 2014 |
|
|
$ |
|
1,818.4 |
|
|
$ |
|
3,831.1 |
|
|
$ |
|
16,518.6 |
$22,168.1 |
|||||||
|
|||||||||||||||||||||||
|
Mortgage loans payable |
|
|
$ |
|
— |
|
|
$ |
|
— |
|
|
$ |
|
(2,373.8 |
) |
|
$(2,373.8) |
|||||
|
|||||||||||||||||||||||
|
|
|
|
|
|
|
|
|
|||||||||||||||
Description |
Level 1: |
Level 2: |
Level 3: |
Total at |
|||||||||||||||||||
|
|||||||||||||||||||||||
|
Real estate properties |
|
|
$ |
|
— |
|
|
$ |
|
— |
|
|
$ |
|
11,565.1 |
$11,565.1 |
|||||||
|
Real estate joint ventures |
|
|
— |
|
|
— |
|
|
2,563.6 |
2,563.6 |
|||||||||||||
|
Limited partnerships |
|
|
— |
|
|
— |
|
|
362.0 |
362.0 |
|||||||||||||
|
Marketable securities: |
|
|
|
|
|
|
|
|
|||||||||||||||
|
Real estate related |
|
|
1,499.3 |
|
|
— |
|
|
— |
1,499.3 |
|||||||||||||
|
Government agency notes |
|
|
— |
|
|
1,989.1 |
|
|
— |
1,989.1 |
|||||||||||||
|
United States Treasury securities |
|
|
— |
|
|
1,130.5 |
|
|
— |
1,130.5 |
|||||||||||||
|
|||||||||||||||||||||||
|
Total Investments at December 31, 2013 |
|
|
$ |
|
1,499.3 |
|
|
$ |
|
3,119.6 |
|
|
$ |
|
14,490.7 |
$19,109.6 |
|||||||
|
|||||||||||||||||||||||
|
Mortgage loans payable |
|
|
$ |
|
— |
|
|
$ |
|
— |
|
|
$ |
|
(2,279.1 |
) |
|
$(2,279.1) |
|||||
|
|||||||||||||||||||||||
164Prospectus ¡ TIAA Real Estate Account |
Notes to the consolidated financial statements continued
The following tables show the reconciliation of the beginning and ending balances for assets and liabilities measured at fair value on a recurring basis using significant unobservable inputs (Level 3) during the years ended December 31, 2014 and 2013 (in millions):
|
|
|
|
|
|
|
|
|
|
|
|
|
|||||||||||||||||||||||||
|
|
Real Estate |
Real Estate |
Limited |
Total |
Mortgage |
|
|
||||||||||||||||||||||||||||||
|
|||||||||||||||||||||||||||||||||||||
|
For the year ended December 31, 2014 |
|
|
|
|
|
|
|
|
|
|
|
|
|||||||||||||||||||||||||
|
Beginning balance January 1, 2014 |
|
|
$ |
|
11,565.1 |
|
|
$ |
|
2,563.6 |
|
|
$ |
|
362.0 |
|
|
$ |
|
14,490.7 |
|
|
$ |
|
(2,279.1 |
) |
|
|
|
||||||||
|
Total realized and unrealized gains (losses) included in changes in net assets |
|
|
987.8 |
|
|
308.4 |
|
|
28.9 |
|
|
1,325.1 |
|
|
(64.9 |
) |
|
|
|
||||||||||||||||||
|
Purchases(1) |
|
|
1,562.5 |
|
|
232.9 |
|
|
— |
|
|
1,795.4 |
|
|
(252.5 |
) |
|
|
|
||||||||||||||||||
|
Sales |
|
|
(976.4 |
) |
|
|
|
— |
|
|
— |
|
|
(976.4 |
) |
|
|
|
— |
|
|
||||||||||||||||
|
Settlements(2) |
|
|
— |
|
|
(82.8 |
) |
|
|
|
(33.4 |
) |
|
|
|
(116.2 |
) |
|
|
|
222.7 |
|
|
||||||||||||||
|
|||||||||||||||||||||||||||||||||||||
|
Ending balance December 31, 2014 |
|
|
$ |
|
13,139.0 |
|
|
$ |
|
3,022.1 |
|
|
$ |
|
357.5 |
|
|
$ |
|
16,518.6 |
|
|
$ |
|
(2,373.8 |
) |
|
|
|
||||||||
|
|||||||||||||||||||||||||||||||||||||
|
|
|
|
|
|
|
|
|
|
|
|
|
|||||||||||||||||||||||||
|
|
Real Estate |
Real Estate |
Limited |
Total |
Mortgage |
|
|
||||||||||||||||||||||||||||||
|
|||||||||||||||||||||||||||||||||||||
|
For the year ended December 31, 2013 |
|
|
|||||||||||||||||||||||||||||||||||
|
Beginning balance January 1, 2013 |
|
|
$ |
|
10,554.6 |
|
|
$ |
|
2,291.5 |
|
|
$ |
|
339.8 |
|
|
$ |
|
13,185.9 |
|
|
$ |
|
(2,282.6 |
) |
|
|
|
||||||||
|
Total realized and unrealized gains included in changes in net assets |
|
|
653.1 |
|
|
294.1 |
|
|
31.9 |
|
|
979.1 |
|
|
73.3 |
|
|
||||||||||||||||||||
|
Purchases(1) |
|
|
793.2 |
|
|
48.7 |
|
|
3.2 |
|
|
845.1 |
|
|
(900.0 |
) |
|
|
|
||||||||||||||||||
|
Sales |
|
|
(435.8 |
) |
|
|
|
— |
|
|
— |
|
|
(435.8 |
) |
|
|
|
— |
|
|
||||||||||||||||
|
Settlements(2) |
|
|
— |
|
|
(70.7 |
) |
|
|
|
(12.9 |
) |
|
|
|
(83.6 |
) |
|
|
|
830.2 |
|
|
||||||||||||||
|
|||||||||||||||||||||||||||||||||||||
|
Ending balance December 31, 2013 |
|
|
$ |
|
11,565.1 |
|
|
$ |
|
2,563.6 |
|
|
$ |
|
362.0 |
|
|
$ |
|
14,490.7 |
|
|
$ |
|
(2,279.1 |
) |
|
|
|
||||||||
|
|||||||||||||||||||||||||||||||||||||
(1) |
Includes purchases, contributions for joint ventures and limited partnerships, and capital expenditures. |
||
(2) |
Includes operating income for real estate joint ventures and limited partnerships, net of distributions and principal payments on mortgage loans payable. |
The following table shows quantitative information about unobservable inputs related to the Level 3 fair value measurements as of December 31, 2014.
TIAA Real Estate Account ¡ Prospectus165 |
Notes to the consolidated financial statements continued
|
|
|
|
|
|
|
|
|
Type |
Asset |
Valuation Technique(s) |
Unobservable Inputs |
Range |
||||
|
||||||||
Real Estate |
Office |
Income Approach— |
|
|
|
|
||
Properties |
|
|
Discounted Cash Flow |
Discount Rate |
6.0%–8.8% (6.7%) |
|||
and Joint Ventures |
|
|
|
|
Terminal Capitalization Rate |
5.0%–7.8% (5.7%) |
||
|
|
|||||||
|
|
|
|
Income Approach— |
|
|
|
|
|
|
|
Direct Capitalization |
Overall Capitalization Rate |
4.0%–7.5% (5.0%) |
||||
|
|
|
||||||
|
|
Industrial |
Income Approach— |
|
|
|
|
||
|
|
Discounted Cash Flow |
Discount Rate |
6.0%–10.0% (7.1%) |
||||
|
|
|
|
|
|
Terminal Capitalization Rate |
5.3%–8.0% (6.0%) |
||
|
|
|||||||
|
|
Income Approach— |
|
|
|
|
||
|
|
|
|
Direct Capitalization |
Overall Capitalization Rate |
4.3%–8.3% (5.3%) |
|||
|
|
|
||||||
Residential |
Income Approach— |
|
|
|
|
|||
|
|
|
|
Discounted Cash Flow |
Discount Rate |
5.3%–7.8% (6.3%) |
|||
|
|
|
|
Terminal Capitalization Rate |
4.0%–5.8% (4.8%) |
|||
|
|
|||||||
|
|
|
|
Income Approach— |
|
|
|
|
|
|
|
Direct Capitalization |
Overall Capitalization Rate |
3.3%–5.4% (4.2%) |
||||
|
|
|
||||||
|
|
Retail |
Income Approach— |
|
|
|
|
||
|
|
Discounted Cash Flow |
Discount Rate |
5.8%–10.2% (7.3%) |
||||
|
|
|
|
|
|
Terminal Capitalization Rate |
5.0%–9.5% (6.1%) |
||
|
|
|||||||
|
|
Income Approach— |
|
|
|
|
||
|
|
|
|
Direct Capitalization |
Overall Capitalization Rate |
4.5%–8.8% (5.6%) |
|||
|
||||||||
|
Mortgage Loans |
Office and |
Discounted Cash Flow |
Loan to Value Ratio |
35.0%–47.9% (43.1%) |
||||
|
Payable |
Industrial |
|
|
Equivalency Rate |
2.9%–3.9% (3.6%) |
|||
|
|
|||||||
|
|
Net Present Value |
Loan to Value Ratio |
35.0%–47.9% (43.1%) |
||||
|
|
|
|
|
|
Weighted Average Cost of |
1.2–1.3 (1.3) |
||
|
|
|
||||||
Residential |
Discounted Cash Flow |
Loan to Value Ratio |
32.9%–63.7% (45.3%) |
|||||
|
|
|
|
|
|
Equivalency Rate |
2.2%–3.6% (3.2%) |
||
|
|
|||||||
|
|
Net Present Value |
Loan to Value Ratio |
32.9%–63.7% (45.3%) |
||||
|
|
|
|
|
Weighted Average Cost of |
1.2–1.5 (1.3) |
|||
|
|
|
||||||
Retail |
Discounted Cash Flow |
Loan to Value Ratio |
24.8%–124.4% (55.4%) |
|||||
|
|
|
|
|
|
Equivalency Rate |
2.2%–6.3% (3.5%) |
||
|
|
|||||||
|
|
Net Present Value |
Loan to Value Ratio |
24.8%–124.4% (55.4%) |
||||
|
|
|
|
|
|
Weighted Average Cost of |
1.1–3.0 (1.5) |
||
|
||||||||
Real Estate Properties and Joint Ventures: The significant unobservable inputs used in the fair value measurement of the Account’s real estate properties and joint ventures are the selection of certain investment rates (Discount Rate, Terminal Capitalization Rate, and Overall Capitalization Rate). Significant increases (decreases) in any of those inputs in isolation would result in significantly lower (higher) fair value measurements, respectively.
Mortgage Loans Payable: The significant unobservable inputs used in the fair value measurement of the Account’s mortgage loans payable are the loan to value ratios and the selection of certain credit spreads and weighted average
166Prospectus ¡ TIAA Real Estate Account |
Notes to the consolidated financial statements continued
cost of capital risk premiums. Significant increases (decreases) in any of those inputs in isolation would result in a significantly lower (higher) fair value, respectively.
During the years ended December 31, 2014 and 2013 there were no transfers between Levels 1, 2 or 3.
The amount of total net unrealized gains (losses) included in changes in net assets attributable to the change in net unrealized gains (losses) relating to Level 3 investments and mortgage loans payable using significant unobservable inputs still held as of the reporting date is as follows (in millions):
|
|
|
|
|
|
|
|
|
|
|
|||||||||||||||||||||||||
|
|
Real Estate |
Real Estate |
Limited |
Total |
Mortgage |
||||||||||||||||||||||||||||||
|
|||||||||||||||||||||||||||||||||||
|
For the year ended December 31, 2014 |
|
|
$ |
|
1,007.2 |
|
|
$ |
|
305.4 |
|
|
$ |
|
30.8 |
|
|
$ |
|
1,343.4 |
|
|
$ |
|
(64.9 |
) |
|
||||||||
|
|||||||||||||||||||||||||||||||||||
|
For the year ended December 31, 2013 |
|
|
$ |
|
676.1 |
|
|
$ |
|
300.6 |
|
|
$ |
|
31.0 |
|
|
$ |
|
1,007.7 |
|
|
$ |
|
57.4 |
||||||||||
|
|||||||||||||||||||||||||||||||||||
Note 7—Investments in joint ventures
The Account owns interests in several real estate properties through joint ventures and receives distributions and allocations of profits and losses from the joint ventures based on the Account’s ownership interest in those investments. Several of these joint ventures have mortgage loans payable collateralized by the properties owned by the aforementioned joint ventures. At December 31, 2014, the Account held investments in joint ventures with non-controlling ownership interest percentages that ranged from 33% to 85%. Certain joint ventures are subject to adjusted distribution percentages when earnings in the investment reach a pre-determined threshold. The fair value of the Account’s equity interest in these joint ventures was $3.0 billion and $2.6 billion at December 31, 2014 and 2013, respectively. The Account’s most significant joint venture investment is The Florida Mall which represented 2.7% of the Account’s net assets and 2.4% of the Account’s invested assets at December 31, 2014. The Account’s proportionate share of the mortgage loans payable held within the joint venture investments at fair value was $1.8 billion and $1.6 billion at December 31, 2014 and 2013, respectively. The Account’s share in the outstanding principal of the mortgage loans payable held within the joint venture investments was $1.7 billion and $1.6 billion at December 31, 2014 and 2013, respectively.
TIAA Real Estate Account ¡ Prospectus167 |
Notes to the consolidated financial statements continued
A condensed summary of the financial position and results of operations of the joint ventures are shown below (in millions):
|
|
|
|
|
|
|
December 31, 2014 |
December 31, 2013 |
||
|
||||
|
Assets |
|
|
|
|
|
Real Estate properties, at fair value |
$7,980.2 |
$6,715.6 |
||
|
Other assets |
246.8 |
249.0 |
||
|
||||
|
Total assets |
$8,227.0 |
$6,964.6 |
||
|
||||
|
Liabilities & Equity |
|
|
|
|
|
Mortgage notes payable and other obligations, at fair value |
$2,750.0 |
$2,360.4 |
||
|
Other liabilities |
147.0 |
139.9 |
||
|
||||
|
Total liabilities |
2,897.0 |
2,500.3 |
||
|
Equity |
5,330.0 |
4,464.3 |
||
|
||||
|
Total liabilities and equity |
$8,227.0 |
$6,964.6 |
||
|
||||
|
|
|
|
|
|
|
|
|
Years Ended December 31, |
|||||
2014 |
2013 |
2012 |
||||
|
||||||
|
Operating Revenue and Expenses |
|
|
|
|
|
|
|
Revenues |
$612.8 |
$562.5 |
$478.9 |
|||
|
Expenses |
315.8 |
309.6 |
273.5 |
|||
|
||||||
|
Excess of revenues over expenses |
$297.0 |
$252.9 |
$205.4 |
|||
|
||||||
Note 8—Investments in limited partnerships
The Account invests in limited partnerships, limited liability companies and private real estate equity investment trusts that own real estate properties and real estate related securities including mezzanine debt. The Account receives distributions from these investments based on the Account’s ownership interest percentage. At December 31, 2014, the Account held interests in three limited partnerships, one limited liability and one private real estate equity investment trust. The Account held non-controlling ownership interest in these investments ranging from 5.3% to 18.5%. As of December 31, 2014 and 2013, the fair value of the Account’s ownership interest was $357.5 million and $362.0 million, respectively.
As of December 31, 2014, three of the limited partnership investments were in dissolution. The Heitman Value Partners Fund began liquidation in 2013, with the remaining investment assets anticipated to be liquidated during 2015. Colony Realty Partners LP began liquidation in May 2014, with final liquidation anticipated during 2016. In December 2014, all underlying assets held by Cobalt Industrial REIT were sold with final liquidation expected in September 2015. Subsequent to December 31, 2014, the Lion Gables Apartment Fund liquidated all assets as further discussed in Note 13—Subsequent Events.
168Prospectus ¡ TIAA Real Estate Account |
Notes to the consolidated financial statements continued
Transwestern Mezzanine Realty Partners III may engage in liquidation activities in 2017 based on the terms of its partnership agreement. The Account may elect to sell or transfer its ownership units by giving notice and acquiring consent from the management committee of the limited partnership, which requires approval by a majority of the members.
Note 9—Mortgage loans payable
At December 31, 2014, the Account had outstanding mortgage loans payable secured by the following properties (in millions):
|
|
|
|
|
|
|
|
|
||||||||||
Property |
Interest Rate and |
Principal Amounts as of |
Maturity |
|||||||||||||||
December 31, |
December 31, |
|||||||||||||||||
|
||||||||||||||||||
|
Wilshire Rodeo Plaza(4) |
5.28% paid monthly |
|
|
$ |
|
— |
|
|
$ |
|
112.7 |
April 11, 2014 |
||||||
|
99 High Street |
5.52% paid monthly |
|
|
185.0 |
|
|
185.0 |
November 11, 2015 |
||||||||||
|
Lincoln Centre |
5.51% paid monthly |
|
|
153.0 |
|
|
153.0 |
February 1, 2016 |
||||||||||
|
Charleston Plaza(1)(4) |
5.60% paid monthly |
|
|
35.5 |
|
|
36.2 |
September 11, 2016 |
||||||||||
|
The Legend at Kierland(4)(5) |
4.97% paid monthly |
|
|
21.8 |
|
|
21.8 |
August 1, 2017 |
||||||||||
|
The Tradition at Kierland(4)(5) |
4.97% paid monthly |
|
|
25.8 |
|
|
25.8 |
August 1, 2017 |
||||||||||
|
Mass Court(4) |
2.88% paid monthly |
|
|
92.6 |
|
|
92.6 |
September 1, 2019 |
||||||||||
|
Red Canyon at Palomino Park(4)(6) |
5.34% paid monthly |
|
|
27.1 |
|
|
27.1 |
August 1, 2020 |
||||||||||
|
Green River at Palomino Park(4)(6) |
5.34% paid monthly |
|
|
33.2 |
|
|
33.2 |
August 1, 2020 |
||||||||||
|
Blue Ridge at Palomino Park(4)(6) |
5.34% paid monthly |
|
|
33.4 |
|
|
33.4 |
August 1, 2020 |
||||||||||
|
Ashford Meadows(4) |
5.17% paid monthly |
|
|
44.6 |
|
|
44.6 |
August 1, 2020 |
||||||||||
|
The Corner(4) |
4.66% paid monthly |
|
|
105.0 |
|
|
105.0 |
June 1, 2021 |
||||||||||
|
The Palatine(4) |
4.25% paid monthly |
|
|
80.0 |
|
|
80.0 |
January 10, 2022 |
||||||||||
|
The Forum at Carlsbad(4) |
4.25% paid monthly |
|
|
90.0 |
|
|
90.0 |
March 1, 2022 |
||||||||||
|
The Colorado(4) |
3.69% paid monthly |
|
|
91.7 |
|
|
91.7 |
November 1, 2022 |
||||||||||
|
The Legacy at Westwood(4) |
3.69% paid monthly |
|
|
46.7 |
|
|
46.7 |
November 1, 2022 |
||||||||||
|
Regents Court(4) |
3.69% paid monthly |
|
|
39.6 |
|
|
39.6 |
November 1, 2022 |
||||||||||
|
The Caruth(4) |
3.69% paid monthly |
|
|
45.0 |
|
|
45.0 |
November 1, 2022 |
||||||||||
|
Fourth & Madison(4) |
3.75% paid monthly |
|
|
200.0 |
|
|
200.0 |
June 1, 2023 |
||||||||||
|
1001 Pennsylvania Avenue |
3.70% paid monthly |
|
|
330.0 |
|
|
330.0 |
June 1, 2023 |
||||||||||
|
50 Fremont Street(4)(8) |
3.75% paid monthly |
|
|
200.0 |
|
|
200.0 |
June 1, 2023 |
||||||||||
|
1401 H Street NW(4)(7) |
3.65% paid monthly |
|
|
115.0 |
|
|
109.3 |
November 5, 2024 |
||||||||||
|
780 Third Avenue(4) |
3.55% paid monthly |
|
|
150.0 |
|
|
150.0 |
August 1, 2025 |
||||||||||
|
780 Third Avenue(4) |
3.55% paid monthly |
|
|
20.0 |
|
|
20.0 |
August 1, 2025 |
||||||||||
|
55 Second Street(4) |
3.74% paid monthly |
|
|
137.5 |
|
|
— |
October 1, 2026 |
||||||||||
|
Publix at Weston Commons(4) |
5.08% paid monthly |
|
|
35.0 |
|
|
35.0 |
January 1, 2036 |
||||||||||
|
||||||||||||||||||
|
Total Principal Outstanding |
|
|
|
|
$ |
|
2,337.5 |
|
|
$ |
|
2,307.7 |
|
|
||||
|
Fair Value Adjustment(3) |
|
|
|
|
36.3 |
|
|
(28.6) |
|
|
||||||||
|
||||||||||||||||||
|
Total mortgage loans payable |
|
|
|
|
$ |
|
2,373.8 |
|
|
$ |
|
2,279.1 |
|
|
||||
|
||||||||||||||||||
(1) |
The mortgage is adjusted monthly for principal payments. |
||
(2) |
Interest rates are fixed, unless stated otherwise. |
||
(3) |
The fair value adjustment consists of the difference (positive or negative) between the principal amount of the outstanding debt and the fair value of the outstanding debt. See Note 1—Organization and Significant Accounting Policies. |
TIAA Real Estate Account ¡ Prospectus169 |
Notes to the consolidated financial statements continued
(4) |
These properties are each owned by separate wholly owned subsidiaries of TIAA for benefit of the Account. The assets and credit of each of these borrowings entities are not available to satisfy the debts and other obligations of the Account or any other entity or person other than such borrowing entity. |
||
(5) |
Represents mortgage loans on these individual properties which are held within the Kierland Apartment portfolio. |
||
(6) |
Represents mortgage loans on these individual properties which are held within the Palomino Park portfolio. |
||
(7) |
Mortgage loan was refinanced on October 7, 2014 into a 10-year $115.0 million interest only loan at 3.65% with a maturity date of November 5, 2024. |
||
(8) |
This property was sold on February 12, 2015. |
Principal payment schedule on mortgage loans payable as of December 31, 2014 was as follows (in millions):
|
|
|
|||||
|
|
Amount |
||||||
|
|||||||
|
2015 |
|
|
$ |
|
185.8 |
||
|
2016 |
|
|
188.5 |
||||
|
2017 |
|
|
51.9 |
||||
|
2018 |
|
|
16.8 |
||||
|
2019 |
|
|
112.4 |
||||
|
Thereafter |
|
|
1,782.1 |
||||
|
|||||||
|
Total maturities |
|
|
$ |
|
2,337.5 |
||
|
|||||||
170Prospectus ¡ TIAA Real Estate Account |
Notes to the consolidated financial statements continued
Note 10—Financial highlights
Selected condensed financial information for an Accumulation Unit of the Account is presented below. Per Accumulation Unit data is calculated on average units outstanding.
|
|
|
|
|
|
|
|
|
|
|
|||||||||||||||||||||||||
|
|
Years Ended December 31, |
||||||||||||||||||||||||||||||||||
2014 |
2013 |
2012 |
2011 |
2010 |
|||||||||||||||||||||||||||||||
|
|||||||||||||||||||||||||||||||||||
|
PER ACCUMULATION UNIT DATA: |
|
|
|
|
|
|
|
|
|
|
|||||||||||||||||||||||||
|
Rental income |
|
|
$ |
|
15.862 |
|
|
$ |
|
15.313 |
|
|
$ |
|
16.345 |
|
|
$ |
|
17.224 |
|
|
$ |
|
19.516 |
||||||||||
|
Real estate property level expenses and taxes |
|
|
7.788 |
|
|
8.112 |
|
|
9.059 |
|
|
8.640 |
|
|
9.987 |
||||||||||||||||||||
|
|||||||||||||||||||||||||||||||||||
|
Real estate income, net |
|
|
8.074 |
|
|
7.201 |
|
|
7.286 |
|
|
8.584 |
|
|
9.529 |
||||||||||||||||||||
|
Other income |
|
|
3.459 |
|
|
2.759 |
|
|
2.178 |
|
|
2.143 |
|
|
2.214 |
||||||||||||||||||||
|
|||||||||||||||||||||||||||||||||||
|
Total income |
|
|
11.533 |
|
|
9.960 |
|
|
9.464 |
|
|
10.727 |
|
|
11.743 |
||||||||||||||||||||
|
Expense charges(1) |
|
|
2.880 |
|
|
2.672 |
|
|
2.562 |
|
|
2.390 |
|
|
2.167 |
||||||||||||||||||||
|
|||||||||||||||||||||||||||||||||||
|
Investment income, net |
|
|
8.653 |
|
|
7.288 |
|
|
6.902 |
|
|
8.337 |
|
|
9.576 |
||||||||||||||||||||
|
Net realized and unrealized gain on investments and mortgage loans payable |
|
|
27.868 |
|
|
19.015 |
|
|
18.013 |
|
|
20.144 |
|
|
16.143 |
||||||||||||||||||||
|
|||||||||||||||||||||||||||||||||||
|
Net increase in Accumulation Unit Value |
|
|
36.521 |
|
|
26.303 |
|
|
24.915 |
|
|
28.481 |
|
|
25.719 |
||||||||||||||||||||
|
Accumulation Unit Value: |
|
|
|
|
|
|
|
|
|
|
|||||||||||||||||||||||||
|
Beginning of period |
|
|
298.872 |
|
|
272.569 |
|
|
247.654 |
|
|
219.173 |
|
|
193.454 |
||||||||||||||||||||
|
|||||||||||||||||||||||||||||||||||
|
End of period |
|
|
$ |
|
335.393 |
|
|
$ |
|
298.872 |
|
|
$ |
|
272.569 |
|
|
$ |
|
247.654 |
|
|
$ |
|
219.173 |
||||||||||
|
|||||||||||||||||||||||||||||||||||
|
TOTAL RETURN |
|
|
12.22 |
% |
|
|
|
9.65 |
% |
|
|
|
10.06 |
% |
|
|
|
12.99 |
% |
|
|
|
13.29 |
% |
|
||||||||||
|
RATIOS TO AVERAGE NET ASSETS: |
|
|
|
|
|
|
|
|
|
|
|||||||||||||||||||||||||
|
Expenses(1) |
|
|
0.89 |
% |
|
|
|
0.92 |
% |
|
|
|
0.95 |
% |
|
|
|
0.98 |
% |
|
|
|
1.09 |
% |
|
||||||||||
|
Investment income, net |
|
|
2.68 |
% |
|
|
|
2.50 |
% |
|
|
|
2.55 |
% |
|
|
|
3.42 |
% |
|
|
|
4.84 |
% |
|
||||||||||
|
Portfolio turnover rate: |
|
|
|
|
|
|
|
|
|
|
|||||||||||||||||||||||||
|
Real estate properties(2) |
|
|
6.5 |
% |
|
|
|
2.1 |
% |
|
|
|
10.2 |
% |
|
|
|
3.0 |
% |
|
|
|
1.0 |
% |
|
||||||||||
|
Marketable securities(3) |
|
|
15.9 |
% |
|
|
|
8.4 |
% |
|
|
|
21.9 |
% |
|
|
|
3.4 |
% |
|
|
|
19.2 |
% |
|
||||||||||
|
Accumulation Units outstanding at end of period (in millions): |
|
|
57.9 |
|
|
55.3 |
|
|
53.3 |
|
|
53.4 |
|
|
48.1 |
||||||||||||||||||||
|
Net assets end of period (in millions) |
|
|
$ |
|
19,829.0 |
|
|
$ |
|
16,907.9 |
|
|
$ |
|
14,861.1 |
|
|
$ |
|
13,527.2 |
|
|
$ |
|
10,803.1 |
||||||||||
|
|||||||||||||||||||||||||||||||||||
(1) |
Expense charges per Accumulation Unit and the Ratio of Expenses to average net assets reflect the year to date Account level expenses and exclude real estate property level expenses which are included in real estate income, net. |
||
(2) |
Real estate investment portfolio turnover rate is calculated by dividing the lesser of purchases or sales of real estate property investments (including contributions to, or return of capital distributions received from, existing joint venture and limited partnership investments) by the average value of the portfolio of real estate investments held during the period. |
||
(3) |
Marketable securities portfolio turnover rate is calculated by dividing the lesser of purchases or sales of securities, excluding securities having maturity dates at acquisition of one year or less, by the average value of the portfolio securities held during the period. |
TIAA Real Estate Account ¡ Prospectus171 |
Notes to the consolidated financial statements continued
Note 11—Accumulation Units
Changes in the number of Accumulation Units outstanding were as follows (in millions):
|
|
|
|
|
|
|
|||||||||||||||
|
|
For The Years Ended |
||||||||||||||||||||
2014 |
2013 |
2012 |
|||||||||||||||||||
|
|||||||||||||||||||||
|
Outstanding: |
|
|
|
|
|
|
|||||||||||||||
|
Beginning of period |
|
|
55.3 |
|
|
53.3 |
|
|
53.4 |
||||||||||||
|
Credited for premiums |
|
|
7.7 |
|
|
8.5 |
|
|
7.9 |
||||||||||||
|
Liquidity units redeemed (See Note 3) |
|
|
— |
|
|
(1.2 |
) |
|
|
|
(3.6 |
) |
|
||||||||
|
Annuity, other periodic payments, withdrawals and death benefits |
|
|
(5.1 |
) |
|
|
|
(5.3 |
) |
|
|
|
(4.4 |
) |
|
||||||
|
|||||||||||||||||||||
|
End of period |
|
|
57.9 |
|
|
55.3 |
|
|
53.3 |
||||||||||||
|
|||||||||||||||||||||
Note 12—Commitments and contingencies
Commitments — The Account had $0.2 million and $0.5 million of outstanding immediately callable commitments to purchase additional interests in its limited partnership investments as of December 31, 2014 and 2013, respectively. The commitment at December 31, 2014 is related to the Heitman Value Partners Fund, which is in dissolution. Currently, there is no expectation the limited partnership will call the remaining commitment.
The Account has committed a total of $63.9 million and $74.1 million as of December 31, 2014 and 2013, respectively, to various tenants for tenant improvements and leasing inducements.
Contingencies — The Account is party to various claims and routine litigation arising in the ordinary course of business. Management of the Account does not believe the results of any such claims or litigation, individually, or in the aggregate, will have a material effect on the Account’s business, financial position, or results of operations.
Note 13—Subsequent Events
Purchases
837 Washington Street—New York, NY
On January 30, 2015, the Account purchased a six-story, 55,497 square foot office building located in New York, New York for $190.8 million. At the time of purchase, the property was 100% leased.
Sales
50 Fremont Street—San Francisco, CA
On February 12, 2015, the Account sold an office property located in San Francisco, California for a net sales price of $621.4 million. Concurrent with the sale of the property, a $200.0 million mortgage loan was extinguished.
172Prospectus ¡ TIAA Real Estate Account |
Notes to the consolidated financial statements continued
Lion Gables Apartment Fund
On February 18, 2015, the Account’s 18.46% interest in the Lion Gables Apartment Fund was dissolved. The Account received $341.6 million as a result of the dissolution.
Concurrent with the liquidation of the Account’s interest, the Account purchased a $100.0 million 5 year convertible note in a newly formed fund, CGMT REIT, L.P. The note is convertible into units of CGMT REIT, L.P.
TIAA Real Estate Account ¡ Prospectus173 |
Consolidated schedules of investments
TIAA Real Estate Account
(Dollar values shown in millions)
|
|
|
|
|
||||||||||
Location / Description—Type |
Fair Value at |
|||||||||||||
2014 |
2013 |
|||||||||||||
|
||||||||||||||
|
REAL ESTATE PROPERTIES—59.3% and 60.5% |
|
|
|
|
||||||||||
|
ARIZONA: |
|
|
|
|
||||||||||
|
Camelback Center—Office |
|
|
$ |
|
44.5 |
|
|
$ |
|
38.6 |
||||
|
Kierland Apartment Portfolio—Apartments |
|
|
118.1 |
(1) |
|
|
|
119.0 |
(1) |
|
||||
|
CALIFORNIA: |
|
|
|
|
||||||||||
|
3 Hutton Centre Drive—Office |
|
|
45.5 |
|
|
41.3 |
||||||||
|
50 Fremont Street(10)—Office |
|
|
637.6 |
(1) |
|
|
|
518.0 |
(1) |
|
||||
|
55 Second Street—Office |
|
|
292.2 |
(1) |
|
|
|
— |
||||||
|
88 Kearny Street—Office |
|
|
130.7 |
|
|
111.8 |
||||||||
|
200 Middlefield Road—Office |
|
|
51.0 |
|
|
— |
||||||||
|
275 Battery Street—Office |
|
|
— |
|
|
251.4 |
||||||||
|
Centre Pointe and Valley View—Industrial |
|
|
36.3 |
|
|
31.9 |
||||||||
|
Cerritos Industrial Park—Industrial |
|
|
98.5 |
|
|
86.4 |
||||||||
|
Charleston Plaza—Retail |
|
|
82.0 |
(1) |
|
|
|
82.0 |
(1) |
|
||||
|
Great West Industrial Portfolio—Industrial |
|
|
128.8 |
|
|
119.0 |
||||||||
|
Holly Street Village—Apartments |
|
|
128.3 |
|
|
124.0 |
||||||||
|
Larkspur Courts—Apartments |
|
|
131.6 |
|
|
96.4 |
||||||||
|
Northern CA RA Industrial Portfolio—Industrial |
|
|
56.7 |
|
|
47.3 |
||||||||
|
Northpark Village Square—Retail |
|
|
45.2 |
|
|
40.8 |
||||||||
|
Oceano at Warner Center—Apartments |
|
|
81.4 |
|
|
87.3 |
||||||||
|
Ontario Industrial Portfolio—Industrial |
|
|
366.4 |
|
|
329.2 |
||||||||
|
Ontario Mills Industrial Portfolio—Industrial |
|
|
39.6 |
|
|
— |
||||||||
|
Pacific Plaza—Office |
|
|
96.1 |
|
|
82.0 |
||||||||
|
Rancho Cucamonga Industrial Portfolio—Industrial |
|
|
143.4 |
|
|
124.4 |
||||||||
|
Regents Court—Apartments |
|
|
81.8 |
(1) |
|
|
|
78.5 |
(1) |
|
||||
|
Southern CA RA Industrial Portfolio—Industrial |
|
|
105.9 |
|
|
88.6 |
||||||||
|
Stella—Apartments |
|
|
170.1 |
|
|
168.5 |
||||||||
|
The Forum at Carlsbad—Retail |
|
|
203.0 |
(1) |
|
|
|
192.9 |
(1) |
|
||||
|
The Legacy at Westwood—Apartments |
|
|
134.7 |
(1) |
|
|
|
126.0 |
(1) |
|
||||
|
Township Apartments—Apartments |
|
|
86.0 |
|
|
— |
||||||||
|
West Lake North Business Park—Office |
|
|
49.3 |
|
|
48.7 |
||||||||
|
Westcreek—Apartments |
|
|
39.3 |
|
|
36.8 |
||||||||
|
Westwood Marketplace—Retail |
|
|
116.5 |
|
|
108.0 |
||||||||
|
Wilshire Rodeo Plaza—Office |
|
|
209.8 |
|
|
181.1 |
(1) |
|
||||||
|
COLORADO: |
|
|
|
|
||||||||||
|
Palomino Park—Apartments |
|
|
283.3 |
(1) |
|
|
|
264.3 |
(1) |
|
||||
|
South Denver Marketplace—Retail |
|
|
70.6 |
|
|
69.9 |
||||||||
|
CONNECTICUT: |
|
|
|
|
||||||||||
|
Wilton Woods Corporate Campus(7)—Office |
|
|
142.8 |
|
|
150.0 |
||||||||
|
FLORIDA: |
|
|
|
|
||||||||||
|
701 Brickell Avenue—Office |
|
|
320.1 |
|
|
271.3 |
||||||||
|
North 40 Office Complex—Office |
|
|
— |
|
|
27.8 |
||||||||
|
Plantation Grove—Retail |
|
|
— |
|
|
12.5 |
||||||||
|
Publix at Weston Commons—Retail |
|
|
58.0 |
(1) |
|
|
|
55.0 |
(1) |
|
||||
|
Seneca Industrial Park—Industrial |
|
|
79.2 |
|
|
73.8 |
||||||||
|
|
|
|
|
|
|
|
||||||||
174Prospectus ¡ TIAA Real Estate Account |
Consolidated schedules of investments continued
TIAA Real Estate Account
(Dollar values shown in millions)
|
|
|
|
|
||||||||||
Location / Description—Type |
Fair Value at |
|||||||||||||
2014 |
2013 |
|||||||||||||
|
||||||||||||||
|
FLORIDA: (continued) |
|
|
|
|
||||||||||
|
South Florida Apartment Portfolio—Apartments |
|
|
$ |
|
84.1 |
|
|
$ |
|
77.9 |
||||
|
Suncrest Village Shopping Center—Retail |
|
|
— |
|
|
13.5 |
||||||||
|
The Manor Apartments—Apartments |
|
|
52.6 |
|
|
— |
||||||||
|
The Residences at the Village of Merrick Park—Apartments |
|
|
69.3 |
|
|
63.8 |
||||||||
|
Urban Centre—Office |
|
|
113.0 |
|
|
107.6 |
||||||||
|
Weston Business Center—Industrial |
|
|
86.6 |
|
|
85.5 |
||||||||
|
FRANCE: |
|
|
|
|
||||||||||
|
Printemps de L’Homme—Retail |
|
|
— |
|
|
226.9 |
||||||||
|
GEORGIA: |
|
|
|
|
||||||||||
|
Atlanta Industrial Portfolio—Industrial |
|
|
47.3 |
|
|
42.5 |
||||||||
|
Glenridge Walk—Apartments |
|
|
— |
|
|
40.1 |
||||||||
|
Shawnee Ridge Industrial Portfolio—Industrial |
|
|
71.2 |
|
|
61.4 |
||||||||
|
Windsor at Lenox Park—Apartments |
|
|
— |
|
|
64.9 |
||||||||
|
ILLINOIS: |
|
|
|
|
||||||||||
|
Chicago Caleast Industrial Portfolio—Industrial |
|
|
66.9 |
|
|
62.7 |
||||||||
|
Chicago Industrial Portfolio—Industrial |
|
|
75.9 |
|
|
66.7 |
||||||||
|
Parkview Plaza—Office |
|
|
45.6 |
|
|
45.6 |
||||||||
|
MARYLAND: |
|
|
|
|
||||||||||
|
Landover Logistics Center—Industrial |
|
|
35.0 |
|
|
— |
||||||||
|
The Shops at Wisconsin Place—Retail |
|
|
109.9 |
|
|
99.1 |
||||||||
|
MASSACHUSETTS: |
|
|
|
|
||||||||||
|
99 High Street—Office |
|
|
477.2 |
(1) |
|
|
|
438.0 |
(1) |
|
||||
|
501 Boylston Street—Office |
|
|
392.1 |
|
|
364.1 |
||||||||
|
Northeast RA Industrial Portfolio—Industrial |
|
|
35.9 |
|
|
29.6 |
||||||||
|
Residence at Rivers Edge—Apartments |
|
|
84.9 |
|
|
87.6 |
||||||||
|
NEW JERSEY: |
|
|
|
|
||||||||||
|
Konica Photo Imaging Headquarters—Industrial |
|
|
— |
|
|
20.4 |
||||||||
|
Marketfair—Retail |
|
|
99.0 |
|
|
84.7 |
||||||||
|
Mohawk Distribution Center—Industrial |
|
|
81.0 |
|
|
78.0 |
||||||||
|
South River Road Industrial—Industrial |
|
|
65.5 |
|
|
54.7 |
||||||||
|
NEW YORK: |
|
|
|
|
||||||||||
|
21 Penn Plaza—Office |
|
|
246.6 |
|
|
— |
||||||||
|
425 Park Avenue—Ground Lease |
|
|
420.0 |
|
|
400.0 |
||||||||
|
780 Third Avenue—Office |
|
|
405.4 |
(1) |
|
|
|
365.2 |
(1) |
|
||||
|
The Colorado—Apartments |
|
|
215.6 |
(1) |
|
|
|
190.3 |
(1) |
|
||||
|
The Corner—Apartments |
|
|
270.0 |
(1) |
|
|
|
230.0 |
(1) |
|
||||
|
PENNSYLVANIA: |
|
|
|
|
||||||||||
|
1619 Walnut Street—Retail |
|
|
22.4 |
|
|
19.0 |
||||||||
|
The Pepper Building—Apartments |
|
|
50.9 |
|
|
51.1 |
||||||||
|
TENNESSEE: |
|
|
|
|
||||||||||
|
Southside at McEwen—Retail |
|
|
45.1 |
|
|
— |
||||||||
|
Summit Distribution Center—Industrial |
|
|
16.9 |
|
|
17.0 |
||||||||
|
|
|
|
|
|
|
|
||||||||
TIAA Real Estate Account ¡ Prospectus175 |
Consolidated schedules of investments continued
TIAA Real Estate Account
(Dollar values shown in millions)
|
|
|
|
|
||||||||||
Location / Description—Type |
Fair Value at |
|||||||||||||
2014 |
2013 |
|||||||||||||
|
||||||||||||||
|
TEXAS: |
|
|
|
|
||||||||||
|
Cliffs at Barton Creek—Apartments |
|
|
$ |
|
43.7 |
|
|
$ |
|
39.1 |
||||
|
Dallas Industrial Portfolio—Industrial |
|
|
182.7 |
|
|
176.9 |
||||||||
|
Four Oaks Place—Land |
|
|
— |
(8) |
|
|
|
64.3 |
||||||
|
Houston Apartment Portfolio—Apartments |
|
|
176.9 |
(9) |
|
|
|
263.2 |
||||||
|
Lincoln Centre—Office |
|
|
317.1 |
(1) |
|
|
|
267.7 |
(1) |
|
||||
|
Northwest Houston Industrial Portfolio—Industrial |
|
|
67.0 |
|
|
— |
||||||||
|
Park 10 Distribution—Industrial |
|
|
13.0 |
|
|
— |
||||||||
|
Pinnacle Industrial Portfolio—Industrial |
|
|
42.4 |
|
|
44.1 |
||||||||
|
The Caruth—Apartments |
|
|
80.6 |
(1) |
|
|
|
81.3 |
(1) |
|
||||
|
The Maroneal—Apartments |
|
|
56.8 |
|
|
51.7 |
||||||||
|
VIRGINIA: |
|
|
|
|
||||||||||
|
8270 Greensboro Drive—Office |
|
|
45.3 |
|
|
41.8 |
||||||||
|
Ashford Meadows Apartments—Apartments |
|
|
106.0 |
(1) |
|
|
|
105.6 |
(1) |
|
||||
|
The Ellipse at Ballston—Office |
|
|
86.8 |
|
|
85.3 |
||||||||
|
The Palatine—Apartments |
|
|
125.6 |
(1) |
|
|
|
130.0 |
(1) |
|
||||
|
Plaza America—Retail |
|
|
99.4 |
|
|
— |
||||||||
|
WASHINGTON: |
|
|
|
|
||||||||||
|
Circa Green Lake—Apartments |
|
|
86.1 |
|
|
85.0 |
||||||||
|
Fourth and Madison—Office |
|
|
455.0 |
(1) |
|
|
|
435.0 |
(1) |
|
||||
|
Millennium Corporate Park—Office |
|
|
175.0 |
|
|
149.0 |
||||||||
|
Northwest RA Industrial Portfolio—Industrial |
|
|
27.1 |
|
|
27.1 |
||||||||
|
Pacific Corporate Park—Industrial |
|
|
37.2 |
|
|
35.8 |
||||||||
|
Prescott Wallingford Apartments—Apartments |
|
|
54.4 |
|
|
53.6 |
||||||||
|
Rainier Corporate Park—Industrial |
|
|
91.3 |
|
|
86.5 |
||||||||
|
Regal Logistics Campus—Industrial |
|
|
71.5 |
|
|
73.4 |
||||||||
|
WASHINGTON DC: |
|
|
|
|
||||||||||
|
1001 Pennsylvania Avenue—Office |
|
|
805.4 |
(1) |
|
|
|
726.7 |
(1) |
|
||||
|
1401 H Street, NW—Office |
|
|
240.3 |
(1) |
|
|
|
231.8 |
(1) |
|
||||
|
1900 K Street, NW—Office |
|
|
319.7 |
|
|
287.3 |
||||||||
|
Mass Court—Apartments |
|
|
172.2 |
(1) |
|
|
|
170.3 |
(1) |
|
||||
|
Mazza Gallerie—Retail |
|
|
88.8 |
|
|
80.2 |
||||||||
|
The Louis at 14th—Apartments |
|
|
182.5 |
|
|
— |
||||||||
|
The Woodley—Apartments |
|
|
199.0 |
|
|
— |
||||||||
|
|
|
|
|
|
||||||||||
|
TOTAL REAL ESTATE PROPERTIES |
|
|
|
|
||||||||||
|
(Cost $11,309.0 and $10,679.5) |
|
|
$ |
|
13,139.0 |
|
|
$ |
|
11,565.1 |
||||
|
|
|
|
|
|
||||||||||
176Prospectus ¡ TIAA Real Estate Account |
Consolidated schedules of investments continued
TIAA Real Estate Account
(Dollar values shown in millions)
|
|
|
|
|
||||||||||
Location / Description—Type |
Fair Value at |
|||||||||||||
2014 |
2013 |
|||||||||||||
|
||||||||||||||
|
OTHER REAL ESTATE-RELATED INVESTMENTS—15.2% |
|
|
||||||||||||
|
REAL ESTATE JOINT VENTURES—13.6% and 13.4% (Note 7) |
|
|
||||||||||||
|
CALIFORNIA: |
|
|
|
|
||||||||||
|
CA—Colorado Center LP |
|
|
$ |
|
368.1 |
(2) |
|
|
|
$ |
|
261.3 |
(2) |
|
|
T-C Foundry Square II Venture LLC |
|
|
158.0 |
(2) |
|
|
|
— |
||||||
|
Valencia Town Center Associates LP |
|
|
114.3 |
(2) |
|
|
|
113.5 |
(2) |
|
||||
|
FLORIDA: |
|
|
|
|
||||||||||
|
Florida Mall Associates, Ltd |
|
|
533.6 |
(2) |
|
|
|
490.9 |
(2) |
|
||||
|
TREA Florida Retail, LLC |
|
|
140.1 |
|
|
119.3 |
||||||||
|
West Dade County Associates |
|
|
119.6 |
(2) |
|
|
|
196.4 |
||||||
|
MARYLAND: |
|
|
|
|
||||||||||
|
WP Project Developer |
|
|
15.1 |
|
|
13.9 |
||||||||
|
MASSACHUSETTS: |
|
|
|
|
||||||||||
|
One Boston Place REIT |
|
|
208.6 |
|
|
208.3 |
||||||||
|
NEW YORK: |
|
|
|
|
||||||||||
|
401 West 14th Street, LLC |
|
|
35.3 |
(2) |
|
|
|
— |
||||||
|
RGM 42, LLC |
|
|
305.2 |
(2) |
|
|
|
290.4 |
(2) |
|
||||
|
TENNESSEE: |
|
|
|
|
||||||||||
|
West Town Mall, LLC |
|
|
94.6 |
(2) |
|
|
|
77.8 |
(2) |
|
||||
|
TEXAS: |
|
|
|
|
||||||||||
|
Four Oaks Venture LP |
|
|
365.8 |
(2,8) |
|
|
|
275.9 |
||||||
|
VARIOUS: |
|
|
|
|
||||||||||
|
DDRTC Core Retail Fund, LLC |
|
|
448.4 |
(2,3) |
|
|
|
413.7 |
(2,3) |
|
||||
|
Storage Portfolio I, LLC |
|
|
114.8 |
(2,3) |
|
|
|
101.6 |
(2,3) |
|
||||
|
Strategic Ind Portfolio I, LLC |
|
|
0.6 |
(3,5) |
|
|
|
0.6 |
(3,5) |
|
||||
|
|
|
|
|
|
||||||||||
|
TOTAL REAL ESTATE JOINT VENTURES |
|
|
|
|
||||||||||
|
(Cost $2,361.4 and $2,208.5) |
|
|
$ |
|
3,022.1 |
|
|
$ |
|
2,563.6 |
||||
|
|
|
|
|
|
||||||||||
TIAA Real Estate Account ¡ Prospectus177 |
Consolidated schedules of investments continued
TIAA Real Estate Account
(Dollar values shown in millions)
|
|
|
|
|
||||||||||
Location / Description |
Fair Value at |
|||||||||||||
2014 |
2013 |
|||||||||||||
|
||||||||||||||
|
LIMITED PARTNERSHIPS—1.6% and 1.9% (Note 8) |
|
|
|
|
||||||||||
|
Cobalt Industrial REIT (10.998% Account Interest) |
|
|
$ |
|
1.1 |
|
|
$ |
|
24.8 |
||||
|
Colony Realty Partners LP (5.27% Account Interest) |
|
|
21.1 |
|
|
20.7 |
||||||||
|
Heitman Value Partners Fund (8.43% Account Interest) |
|
|
0.3 |
|
|
0.4 |
||||||||
|
Lion Gables Apartment Fund (18.46% Account Interest) |
|
|
314.1 |
|
|
288.4 |
||||||||
|
Transwestern Mezz Realty Partners III, LLC (11.708% Account Interest) |
|
|
20.9 |
|
|
27.7 |
||||||||
|
|
|
|
|
|
||||||||||
|
TOTAL LIMITED PARTNERSHIPS |
|
|
|
|
||||||||||
|
(Cost $222.1 and $257.4) |
|
|
$ |
|
357.5 |
|
|
$ |
|
362.0 |
||||
|
|
|
|
|
|
||||||||||
|
TOTAL REAL ESTATE JOINT VENTURES AND LIMITED PARTNERSHIPS |
|
|
|
|
||||||||||
|
(Cost $2,583.5 and $2,465.9) |
|
|
$ |
|
3,379.6 |
|
|
$ |
|
2,925.6 |
||||
|
|
|
|
|
|
||||||||||
178Prospectus ¡ TIAA Real Estate Account |
Consolidated schedules of investments continued
TIAA Real Estate Account
(Dollar values shown in millions)
|
|
|
|
|
|
|
|
|
||||||||||
Shares |
Issuer |
Fair Value at |
||||||||||||||||
2014 |
2013 |
2014 |
2013 |
|||||||||||||||
|
||||||||||||||||||
MARKETABLE SECURITIES—25.5% and 24.2% |
|
|
||||||||||||||||
REAL ESTATE-RELATED MARKETABLE SECURITIES—8.2% and 7.9% |
|
|
||||||||||||||||
128,562 |
134,862 |
Acadia Realty Trust |
|
|
$ |
|
4.1 |
|
|
$ |
|
3.3 |
||||||
31,670 |
33,840 |
Agree Realty Corporation |
|
|
1.0 |
|
|
1.0 |
||||||||||
4,549 |
5,049 |
Alexander’s, Inc. |
|
|
2.0 |
|
|
1.7 |
||||||||||
132,373 |
174,957 |
Alexandria Real Estate Equities, Inc. |
|
|
11.7 |
|
|
11.1 |
||||||||||
55,491 |
86,953 |
American Assets Trust, Inc. |
|
|
2.2 |
|
|
2.7 |
||||||||||
232,629 |
256,019 |
American Campus Communities, Inc. |
|
|
9.6 |
|
|
8.2 |
||||||||||
331,090 |
114,990 |
American Homes 4 Rent |
|
|
5.6 |
|
|
1.9 |
||||||||||
— |
451,330 |
American Realty Capital Properties, Inc. |
|
|
— |
|
|
5.8 |
||||||||||
40,280 |
45,810 |
American Residential Properties |
|
|
0.7 |
|
|
0.8 |
||||||||||
851,739 |
969,299 |
American Tower Corp. |
|
|
84.2 |
|
|
77.5 |
||||||||||
324,603 |
355,553 |
Apartment Investment and Management Company |
|
|
12.1 |
|
|
9.2 |
||||||||||
45,930 |
47,530 |
Armada Hoffler Properties Inc. |
|
|
0.4 |
|
|
0.4 |
||||||||||
40,976 |
31,236 |
Ashford Hospitality Prime Inc. |
|
|
0.7 |
|
|
0.6 |
||||||||||
228,348 |
156,183 |
Ashford Hospitality Trust, Inc. |
|
|
2.4 |
|
|
1.3 |
||||||||||
131,435 |
143,225 |
Associated Estates Realty Corporation |
|
|
3.1 |
|
|
2.3 |
||||||||||
285,499 |
316,410 |
AvalonBay Communities, Inc. |
|
|
46.6 |
|
|
37.4 |
||||||||||
82,002 |
25,510 |
Aviv REIT, Inc. |
|
|
2.8 |
|
|
0.6 |
||||||||||
427,097 |
470,857 |
BioMed Realty Trust, Inc. |
|
|
9.2 |
|
|
8.5 |
||||||||||
314,607 |
370,695 |
Boston Properties, Inc. |
|
|
40.5 |
|
|
37.2 |
||||||||||
398,099 |
386,249 |
Brandywine Realty Trust |
|
|
6.4 |
|
|
5.4 |
||||||||||
— |
187,688 |
BRE Properties, Inc. |
|
|
— |
|
|
10.3 |
||||||||||
238,279 |
101,190 |
Brixmore Porperty Group Inc |
|
|
5.9 |
|
|
2.1 |
||||||||||
188,626 |
207,546 |
Camden Property Trust |
|
|
13.9 |
|
|
11.8 |
||||||||||
258,814 |
161,828 |
Campus Crest Communities, Inc. |
|
|
1.9 |
|
|
1.5 |
||||||||||
69,250 |
— |
Catchmark Timber Trust, Inc. |
|
|
0.8 |
|
|
— |
||||||||||
335,345 |
415,687 |
CBL & Associates Properties, Inc. |
|
|
6.5 |
|
|
7.5 |
||||||||||
177,495 |
183,285 |
Cedar Shopping Centers, Inc. |
|
|
1.3 |
|
|
1.1 |
||||||||||
417,369 |
578,960 |
Chambers Street Properties |
|
|
3.4 |
|
|
4.4 |
||||||||||
73,127 |
57,737 |
Chatham Lodging Trust |
|
|
2.1 |
|
|
1.2 |
||||||||||
121,692 |
123,712 |
Chesapeake Lodging Trust |
|
|
4.5 |
|
|
3.1 |
||||||||||
— |
1,146,830 |
Cole Real Estate Investments |
|
|
— |
|
|
16.1 |
||||||||||
277,710 |
270,050 |
Columbia Property Trust Inc |
|
|
7.0 |
|
|
6.8 |
||||||||||
— |
289,848 |
CommonWealth REIT |
|
|
— |
|
|
6.8 |
||||||||||
70,620 |
— |
Corenergy Infrastructure Trust, Inc. |
|
|
0.5 |
|
|
— |
||||||||||
48,733 |
52,653 |
CoreSite Realty Corporation |
|
|
1.9 |
|
|
1.7 |
||||||||||
150,486 |
201,393 |
Corporate Office Properties Trust |
|
|
4.3 |
|
|
4.8 |
||||||||||
247,990 |
271,810 |
Corrections Corporation of America |
|
|
9.0 |
|
|
8.7 |
||||||||||
589,552 |
435,676 |
Cousins Properties Incorporated |
|
|
6.7 |
|
|
4.5 |
||||||||||
728,325 |
— |
Crown Castle International Corporation |
|
|
57.3 |
|
|
— |
||||||||||
410,111 |
336,620 |
Cubesmart |
|
|
9.0 |
|
|
5.4 |
||||||||||
78,620 |
44,330 |
CyrusOne Inc |
|
|
2.2 |
|
|
1.0 |
||||||||||
184,830 |
773,940 |
DCT Industrial Trust, Inc. |
|
|
6.6 |
|
|
5.5 |
||||||||||
806,645 |
748,278 |
DDR Corp |
|
|
14.8 |
|
|
11.5 |
||||||||||
440,687 |
479,587 |
DiamondRock Hospitality Company |
|
|
6.6 |
|
|
5.5 |
||||||||||
|
||||||||||||||||||
TIAA Real Estate Account ¡ Prospectus179 |
Consolidated schedules of investments continued
TIAA Real Estate Account
(Dollar values shown in millions)
|
|
|
|
|
|
|
|
|
||||||||||
Shares |
Issuer |
Fair Value at |
||||||||||||||||
2014 |
2013 |
2014 |
2013 |
|||||||||||||||
|
||||||||||||||||||
301,192 |
313,752 |
Digital Realty Trust, Inc. |
|
|
$ |
|
20.0 |
|
|
$ |
|
15.4 |
||||||
295,214 |
326,594 |
Douglas Emmett, Inc. |
|
|
8.4 |
|
|
7.6 |
||||||||||
756,115 |
795,686 |
Duke Realty Corporation |
|
|
15.3 |
|
|
12.0 |
||||||||||
111,572 |
161,116 |
DuPont Fabros Technology, Inc. |
|
|
3.7 |
|
|
4.0 |
||||||||||
46,023 |
74,049 |
EastGroup Properties, Inc. |
|
|
2.9 |
|
|
4.3 |
||||||||||
79,160 |
281,251 |
Education Realty Trust, Inc. |
|
|
2.9 |
|
|
2.5 |
||||||||||
223,187 |
184,140 |
Empire State Realty Trust |
|
|
3.9 |
|
|
2.8 |
||||||||||
72,480 |
124,602 |
EPR Properties |
|
|
4.2 |
|
|
6.1 |
||||||||||
285,705 |
— |
Equity Commonwealth |
|
|
7.3 |
|
|
— |
||||||||||
147,548 |
183,486 |
Equity Lifestyle Properties, Inc. |
|
|
7.6 |
|
|
6.6 |
||||||||||
190,245 |
143,936 |
Equity One, Inc. |
|
|
4.8 |
|
|
3.2 |
||||||||||
764,996 |
871,504 |
Equity Residential |
|
|
55.0 |
|
|
45.2 |
||||||||||
136,082 |
92,809 |
Essex Property Trust, Inc. |
|
|
28.1 |
|
|
13.3 |
||||||||||
131,275 |
111,535 |
Excel Trust, Inc. |
|
|
1.8 |
|
|
1.3 |
||||||||||
242,082 |
280,022 |
Extra Space Storage, Inc. |
|
|
14.2 |
|
|
11.8 |
||||||||||
142,140 |
160,436 |
Federal Realty Investment Trust |
|
|
19.0 |
|
|
16.3 |
||||||||||
284,615 |
300,775 |
FelCor Lodging Trust Incorporated |
|
|
3.1 |
|
|
2.5 |
||||||||||
295,495 |
273,923 |
First Industrial Realty Trust, Inc. |
|
|
6.1 |
|
|
4.8 |
||||||||||
133,251 |
144,421 |
First Potomac Realty Trust |
|
|
1.6 |
|
|
1.7 |
||||||||||
198,119 |
217,299 |
Franklin Street Properties Corp. |
|
|
2.4 |
|
|
2.6 |
||||||||||
241,051 |
— |
Gaming and Leisure Properties, Inc. |
|
|
7.1 |
|
|
— |
||||||||||
1,116,547 |
1,270,239 |
General Growth Properties, Inc. |
|
|
31.4 |
|
|
25.5 |
||||||||||
156,310 |
169,050 |
GEO Group Inc/The |
|
|
6.3 |
|
|
5.4 |
||||||||||
60,598 |
63,548 |
Getty Realty Corp. |
|
|
1.1 |
|
|
1.2 |
||||||||||
34,020 |
34,020 |
Gladstone Commercial Corporation |
|
|
0.6 |
|
|
0.6 |
||||||||||
326,692 |
360,422 |
Glimcher Realty Trust |
|
|
4.5 |
|
|
3.4 |
||||||||||
200,061 |
136,327 |
Government Properties Income Trust |
|
|
4.6 |
|
|
3.4 |
||||||||||
403,115 |
127,720 |
Gramercy Property Trust Inc |
|
|
2.8 |
|
|
0.7 |
||||||||||
951,260 |
1,107,319 |
HCP, Inc. |
|
|
41.9 |
|
|
40.2 |
||||||||||
734,406 |
695,326 |
Health Care REIT, Inc. |
|
|
55.6 |
|
|
37.2 |
||||||||||
211,892 |
237,712 |
Healthcare Realty Trust Inc. |
|
|
5.8 |
|
|
5.1 |
||||||||||
263,910 |
579,520 |
Healthcare Trust of America |
|
|
7.1 |
|
|
5.7 |
||||||||||
386,553 |
426,743 |
Hersha Hospitality Trust |
|
|
2.7 |
|
|
2.4 |
||||||||||
219,746 |
219,889 |
Highwoods Properties, Inc. |
|
|
9.7 |
|
|
8.0 |
||||||||||
107,460 |
140,210 |
Home Properties, Inc. |
|
|
7.0 |
|
|
7.5 |
||||||||||
332,850 |
366,850 |
Hospitality Properties Trust |
|
|
10.3 |
|
|
9.9 |
||||||||||
1,641,705 |
1,822,914 |
Host Hotels & Resorts, Inc. |
|
|
39.0 |
|
|
35.4 |
||||||||||
123,652 |
106,312 |
Hudson Pacific Properties, Inc. |
|
|
3.7 |
|
|
2.3 |
||||||||||
190,919 |
216,059 |
Inland Real Estate Corp. |
|
|
2.1 |
|
|
2.3 |
||||||||||
241,151 |
256,491 |
Investors Real Estate Trust |
|
|
2.0 |
|
|
2.2 |
||||||||||
298,480 |
— |
Iron Mountain Inc. |
|
|
11.5 |
|
|
— |
||||||||||
1,500,000 |
1,500,000 |
iShares Dow Jones US Real Estate Index Fund |
|
|
115.3 |
|
|
94.6 |
||||||||||
183,003 |
201,093 |
Kilroy Realty Corporation |
|
|
12.6 |
|
|
10.1 |
||||||||||
911,057 |
993,333 |
Kimco Realty Corporation |
|
|
22.9 |
|
|
19.6 |
||||||||||
254,398 |
321,483 |
Kite Realty Group Trust |
|
|
7.3 |
|
|
2.1 |
||||||||||
259,799 |
254,432 |
LaSalle Hotel Properties |
|
|
10.5 |
|
|
7.9 |
||||||||||
|
||||||||||||||||||
180Prospectus ¡ TIAA Real Estate Account |
Consolidated schedules of investments continued
TIAA Real Estate Account
(Dollar values shown in millions)
|
|
|
|
|
|
|
|
|
||||||||||
Shares |
Issuer |
Fair Value at |
||||||||||||||||
2014 |
2013 |
2014 |
2013 |
|||||||||||||||
|
||||||||||||||||||
508,105 |
543,895 |
Lexington Realty Trust |
|
|
$ |
|
5.6 |
|
|
$ |
|
5.6 |
||||||
328,620 |
355,290 |
Liberty Property Trust |
|
|
12.4 |
|
|
12.0 |
||||||||||
58,133 |
84,816 |
LTC Properties, Inc. |
|
|
2.5 |
|
|
3.0 |
||||||||||
142,118 |
217,063 |
Mack-Cali Realty Corporation |
|
|
2.7 |
|
|
4.7 |
||||||||||
385,417 |
395,297 |
Medical Properties Trust, Inc. |
|
|
5.3 |
|
|
4.8 |
||||||||||
177,150 |
181,705 |
Mid-America Apartment Communities, Inc. |
|
|
13.2 |
|
|
11.0 |
||||||||||
118,597 |
102,977 |
Monmouth Real Estate Investment Corporation |
|
|
1.3 |
|
|
0.9 |
||||||||||
65,594 |
72,294 |
National Health Investors, Inc. |
|
|
4.6 |
|
|
4.1 |
||||||||||
305,461 |
296,600 |
National Retail Properties, Inc. |
|
|
12.0 |
|
|
9.0 |
||||||||||
237,208 |
— |
New Senior Investment Group |
|
|
3.9 |
|
|
— |
||||||||||
570,000 |
— |
Northstar Realty Finance Corp. |
|
|
10.0 |
|
|
— |
||||||||||
281,073 |
299,263 |
Omega Healthcare Investors, Inc. |
|
|
11.0 |
|
|
8.9 |
||||||||||
28,607 |
31,357 |
One Liberty Properties, Inc. |
|
|
0.7 |
|
|
0.6 |
||||||||||
256,813 |
133,229 |
Parkway Properties, Inc. |
|
|
4.7 |
|
|
2.6 |
||||||||||
179,213 |
153,837 |
Pebblebrook Hotel Trust |
|
|
8.2 |
|
|
4.7 |
||||||||||
147,065 |
162,035 |
Pennsylvania Real Estate Investment Trust |
|
|
3.5 |
|
|
3.1 |
||||||||||
168,375 |
47,950 |
Physicians Realty Trust |
|
|
2.8 |
|
|
0.6 |
||||||||||
271,204 |
409,892 |
Piedmont Office Realty Trust, Inc. |
|
|
5.1 |
|
|
6.8 |
||||||||||
393,917 |
432,157 |
Plum Creek Timber Company, Inc. |
|
|
16.9 |
|
|
20.1 |
||||||||||
119,803 |
133,253 |
Post Properties, Inc. |
|
|
7.0 |
|
|
6.0 |
||||||||||
84,078 |
92,248 |
Potlatch Corporation |
|
|
3.5 |
|
|
3.9 |
||||||||||
1,129,782 |
1,218,251 |
ProLogis |
|
|
48.6 |
|
|
45.0 |
||||||||||
44,040 |
49,510 |
PS Business Parks, Inc. |
|
|
3.5 |
|
|
3.8 |
||||||||||
304,858 |
349,519 |
Public Storage, Inc. |
|
|
56.4 |
|
|
52.6 |
||||||||||
10,813 |
— |
QTS Realty Trust, Inc. |
|
|
0.4 |
|
|
— |
||||||||||
168,010 |
150,090 |
Ramco-Gershenson Properties Trust |
|
|
3.1 |
|
|
2.4 |
||||||||||
345,772 |
308,209 |
Rayonier, Inc. |
|
|
9.7 |
|
|
13.0 |
||||||||||
517,842 |
500,294 |
Realty Income Corporation |
|
|
24.7 |
|
|
18.7 |
||||||||||
202,908 |
224,748 |
Regency Centers Corporation |
|
|
12.9 |
|
|
10.4 |
||||||||||
197,186 |
178,566 |
Retail Opportunity Investment |
|
|
3.3 |
|
|
2.6 |
||||||||||
520,915 |
468,255 |
Retail Properties of America |
|
|
8.7 |
|
|
6.0 |
||||||||||
90,510 |
39,760 |
Rexford Industrial Realty Inc |
|
|
1.4 |
|
|
0.5 |
||||||||||
220,006 |
300,884 |
RLJ Lodging Trust |
|
|
7.4 |
|
|
7.3 |
||||||||||
83,313 |
53,113 |
Rouse Properties, Inc. |
|
|
1.5 |
|
|
1.2 |
||||||||||
108,370 |
117,520 |
Ryman Hospitality Properties |
|
|
5.7 |
|
|
4.9 |
||||||||||
118,843 |
91,983 |
Sabra Health Care REIT Inc |
|
|
3.6 |
|
|
2.4 |
||||||||||
28,976 |
32,736 |
Saul Centers, Inc. |
|
|
1.7 |
|
|
1.6 |
||||||||||
83,490 |
68,430 |
Select Income Real Estate Investment Trust |
|
|
2.0 |
|
|
1.8 |
||||||||||
499,658 |
460,237 |
Senior Housing Properties Trust |
|
|
11.0 |
|
|
10.2 |
||||||||||
82,090 |
93,740 |
Silver Bay Realty Trust Corp |
|
|
1.4 |
|
|
1.5 |
||||||||||
674,617 |
750,616 |
Simon Property Group, Inc. |
|
|
122.9 |
|
|
114.2 |
||||||||||
189,478 |
232,245 |
SL Green Realty Corp. |
|
|
22.6 |
|
|
21.5 |
||||||||||
53,568 |
78,699 |
Sovran Self Storage, Inc. |
|
|
4.7 |
|
|
5.1 |
||||||||||
1,080,553 |
868,341 |
Spirit Realty Capital Inc. |
|
|
12.8 |
|
|
8.5 |
||||||||||
200,698 |
104,960 |
Stag Industrial, Inc. |
|
|
4.9 |
|
|
2.1 |
||||||||||
89,340 |
— |
Starwood Waypoint Residential Trust |
|
|
2.4 |
|
|
— |
||||||||||
|
||||||||||||||||||
TIAA Real Estate Account ¡ Prospectus181 |
Consolidated schedules of investments continued
TIAA Real Estate Account
(Dollar values shown in millions)
|
|
|
|
|
|
|
|
|
||||||||||
Shares |
Issuer |
Fair Value at |
||||||||||||||||
2014 |
2013 |
2014 |
2013 |
|||||||||||||||
|
||||||||||||||||||
641,315 |
417,139 |
Strategic Hotels & Resorts, Inc. |
|
|
$ |
|
8.5 |
|
|
$ |
|
3.9 |
||||||
186,578 |
199,598 |
Summit Hotel Properties, Inc. |
|
|
2.3 |
|
|
1.8 |
||||||||||
100,386 |
85,816 |
Sun Communities, Inc. |
|
|
6.1 |
|
|
3.7 |
||||||||||
511,462 |
447,056 |
Sunstone Hotel Investors, L.L.C. |
|
|
8.4 |
|
|
6.0 |
||||||||||
212,284 |
228,624 |
Tanger Factory Outlet Centers, Inc. |
|
|
7.8 |
|
|
7.3 |
||||||||||
120,329 |
155,209 |
Taubman Centers, Inc. |
|
|
9.2 |
|
|
9.9 |
||||||||||
70,574 |
59,134 |
Terreno Realty Corporation |
|
|
1.5 |
|
|
1.0 |
||||||||||
336,472 |
343,852 |
The Macerich Company |
|
|
28.1 |
|
|
20.2 |
||||||||||
556,651 |
612,561 |
UDR, Inc. |
|
|
17.2 |
|
|
14.3 |
||||||||||
44,774 |
31,724 |
UMH Properties, Inc. |
|
|
0.4 |
|
|
0.3 |
||||||||||
29,158 |
31,798 |
Universal Health Realty Income Trust |
|
|
1.4 |
|
|
1.3 |
||||||||||
51,473 |
58,833 |
Urstadt Biddle Properties, Inc. |
|
|
1.1 |
|
|
1.1 |
||||||||||
652,228 |
719,138 |
Ventas, Inc. |
|
|
46.8 |
|
|
41.2 |
||||||||||
351,441 |
409,723 |
Vornado Realty Trust |
|
|
41.4 |
|
|
36.4 |
||||||||||
349,878 |
— |
Washington Prime Group, Inc. |
|
|
6.0 |
|
|
— |
||||||||||
96,831 |
164,207 |
Washington Real Estate Investment Trust |
|
|
2.7 |
|
|
3.8 |
||||||||||
190,047 |
266,400 |
Weingarten Realty Investors |
|
|
6.6 |
|
|
7.3 |
||||||||||
1,119,582 |
1,423,998 |
Weyerhaeuser Company |
|
|
40.2 |
|
|
45.0 |
||||||||||
50,900 |
45,930 |
Whitestone Real Estate Investment Trust B |
|
|
0.8 |
|
|
0.6 |
||||||||||
75,457 |
80,257 |
Winthrop Realty Trust |
|
|
1.2 |
|
|
0.9 |
||||||||||
246,629 |
141,520 |
WP Carey Inc. |
|
|
17.3 |
|
|
8.7 |
||||||||||
|
|
|
|
|
|
|
|
|||||||||||
TOTAL REAL ESTATE-RELATED MARKETABLE SECURITIES |
|
|
|
|
||||||||||||||
|
(Cost $1,400.2 and $1,384.3) |
|
|
$ |
|
1,818.4 |
|
|
$ |
|
1,499.3 |
||||||||
|
|
|
|
|
|
|
|
|||||||||||
182Prospectus ¡ TIAA Real Estate Account |
Consolidated schedules of investments continued
TIAA Real Estate Account
(Dollar values shown in millions)
|
|
|
|
|
|
|
|
|
|
|
|
|
||||||||||||||||||||
Principal |
Issuer |
Yield(4) |
Maturity |
Fair Value at |
||||||||||||||||||||||||||||
2014 |
2013 |
2014 |
2013 |
|||||||||||||||||||||||||||||
|
||||||||||||||||||||||||||||||||
OTHER MARKETABLE SECURITIES—17.3% and 16.3% |
|
|
|
|
||||||||||||||||||||||||||||
GOVERNMENT AGENCY NOTES—10.7% and 10.4% |
|
|
|
|
|
|
||||||||||||||||||||||||||
|
$ |
|
— |
|
|
$ |
|
21.0 |
Fannie Mae Discount Notes |
0.041%–0.046% |
1/15/2014 |
|
|
$ |
|
— |
|
|
$ |
|
21.0 |
|||||||||||
|
— |
|
|
3.5 |
Fannie Mae Discount Notes |
0.112% |
1/21/2014 |
|
|
— |
|
|
3.5 |
|||||||||||||||||||
|
— |
|
|
7.0 |
Fannie Mae Discount Notes |
0.035%–0.051% |
1/22/2014 |
|
|
— |
|
|
7.0 |
|||||||||||||||||||
|
— |
|
|
28.2 |
Fannie Mae Discount Notes |
0.041% |
1/29/2014 |
|
|
— |
|
|
28.2 |
|||||||||||||||||||
|
— |
|
|
32.1 |
Fannie Mae Discount Notes |
0.071% |
2/3/2014 |
|
|
— |
|
|
32.1 |
|||||||||||||||||||
|
— |
|
|
30.0 |
Fannie Mae Discount Notes |
0.061%–0.066% |
2/5/2014 |
|
|
— |
|
|
30.0 |
|||||||||||||||||||
|
— |
|
|
50.0 |
Fannie Mae Discount Notes |
0.077% |
2/19/2014 |
|
|
— |
|
|
50.0 |
|||||||||||||||||||
|
— |
|
|
31.0 |
Fannie Mae Discount Notes |
0.061% |
2/24/2014 |
|
|
— |
|
|
31.0 |
|||||||||||||||||||
|
— |
|
|
22.0 |
Fannie Mae Discount Notes |
0.086% |
2/26/2014 |
|
|
— |
|
|
22.0 |
|||||||||||||||||||
|
— |
|
|
31.0 |
Fannie Mae Discount Notes |
0.066% |
3/3/2014 |
|
|
— |
|
|
31.0 |
|||||||||||||||||||
|
— |
|
|
14.0 |
Fannie Mae Discount Notes |
0.066% |
4/2/2014 |
|
|
— |
|
|
13.9 |
|||||||||||||||||||
|
— |
|
|
18.0 |
Fannie Mae Discount Notes |
0.091%–0.101% |
4/23/2014 |
|
|
— |
|
|
18.0 |
|||||||||||||||||||
|
— |
|
|
23.0 |
Fannie Mae Discount Notes |
0.107% |
5/1/2014 |
|
|
— |
|
|
23.0 |
|||||||||||||||||||
|
— |
|
|
25.0 |
Fannie Mae Discount Notes |
0.107% |
5/7/2014 |
|
|
— |
|
|
25.0 |
|||||||||||||||||||
|
— |
|
|
32.7 |
Fannie Mae Discount Notes |
0.127% |
6/4/2014 |
|
|
— |
|
|
32.7 |
|||||||||||||||||||
|
— |
|
|
20.3 |
Fannie Mae Discount Notes |
0.127% |
6/11/2014 |
|
|
— |
|
|
20.3 |
|||||||||||||||||||
|
— |
|
|
38.0 |
Fannie Mae Discount Notes |
0.132% |
6/18/2014 |
|
|
— |
|
|
38.0 |
|||||||||||||||||||
|
44.0 |
|
|
— |
Fannie Mae Discount Notes |
0.094%–0.101% |
1/14/2015 |
|
|
44.0 |
|
|
— |
|||||||||||||||||||
|
15.0 |
|
|
— |
Fannie Mae Discount Notes |
0.046% |
1/15/2015 |
|
|
15.0 |
|
|
— |
|||||||||||||||||||
|
21.9 |
|
|
— |
Fannie Mae Discount Notes |
0.046%–0.071% |
1/20/2015 |
|
|
21.8 |
|
|
— |
|||||||||||||||||||
|
10.0 |
|
|
— |
Fannie Mae Discount Notes |
0.051% |
1/28/2015 |
|
|
10.0 |
|
|
— |
|||||||||||||||||||
|
40.9 |
|
|
— |
Fannie Mae Discount Notes |
0.068%–0.101% |
2/11/2015 |
|
|
40.9 |
|
|
— |
|||||||||||||||||||
|
46.1 |
|
|
— |
Fannie Mae Discount Notes |
0.101% |
2/17/2015 |
|
|
46.1 |
|
|
— |
|||||||||||||||||||
|
35.6 |
|
|
— |
Fannie Mae Discount Notes |
0.089% |
2/25/2015 |
|
|
35.6 |
|
|
— |
|||||||||||||||||||
|
12.0 |
|
|
— |
Fannie Mae Discount Notes |
0.076% |
2/27/2015 |
|
|
12.0 |
|
|
— |
|||||||||||||||||||
|
39.0 |
|
|
— |
Fannie Mae Discount Notes |
0.101% |
3/2/2015 |
|
|
39.0 |
|
|
— |
|||||||||||||||||||
|
37.1 |
|
|
— |
Fannie Mae Discount Notes |
0.091% |
3/3/2015 |
|
|
37.1 |
|
|
— |
|||||||||||||||||||
|
44.6 |
|
|
— |
Fannie Mae Discount Notes |
0.086% |
3/16/2015 |
|
|
44.6 |
|
|
— |
|||||||||||||||||||
|
38.0 |
|
|
— |
Fannie Mae Discount Notes |
0.066% |
3/18/2015 |
|
|
38.0 |
|
|
— |
|||||||||||||||||||
|
35.0 |
|
|
— |
Fannie Mae Discount Notes |
0.061% |
3/25/2015 |
|
|
35.0 |
|
|
— |
|||||||||||||||||||
|
40.0 |
|
|
— |
Fannie Mae Discount Notes |
0.066% |
4/1/2015 |
|
|
40.0 |
|
|
— |
|||||||||||||||||||
|
26.7 |
|
|
— |
Fannie Mae Discount Notes |
0.096% |
4/6/2015 |
|
|
26.7 |
|
|
— |
|||||||||||||||||||
|
44.7 |
|
|
— |
Fannie Mae Discount Notes |
0.096%–0.112% |
4/8/2015 |
|
|
44.7 |
|
|
— |
|||||||||||||||||||
|
28.3 |
|
|
— |
Fannie Mae Discount Notes |
0.096% |
4/13/2015 |
|
|
28.3 |
|
|
— |
|||||||||||||||||||
|
35.7 |
|
|
— |
Fannie Mae Discount Notes |
0.101%–0.152% |
4/27/2015 |
|
|
35.7 |
|
|
— |
|||||||||||||||||||
|
17.5 |
|
|
— |
Fannie Mae Discount Notes |
0.101% |
4/29/2015 |
|
|
17.5 |
|
|
— |
|||||||||||||||||||
|
30.0 |
|
|
— |
Fannie Mae Discount Notes |
0.081% |
5/1/2015 |
|
|
30.0 |
|
|
— |
|||||||||||||||||||
|
11.5 |
|
|
— |
Fannie Mae Discount Notes |
0.107% |
5/4/2015 |
|
|
11.5 |
|
|
— |
|||||||||||||||||||
|
25.0 |
|
|
— |
Fannie Mae Discount Notes |
0.101% |
5/6/2015 |
|
|
25.0 |
|
|
— |
|||||||||||||||||||
|
20.0 |
|
|
— |
Fannie Mae Discount Notes |
0.112% |
5/13/2015 |
|
|
20.0 |
|
|
— |
|||||||||||||||||||
|
10.9 |
|
|
— |
Fannie Mae Discount Notes |
0.127% |
5/20/2015 |
|
|
10.9 |
|
|
— |
|||||||||||||||||||
|
35.0 |
|
|
— |
Fannie Mae Discount Notes |
0.091% |
6/17/2015 |
|
|
35.0 |
|
|
— |
|||||||||||||||||||
|
25.0 |
|
|
— |
Fannie Mae Discount Notes |
0.144% |
7/1/2015 |
|
|
25.0 |
|
|
— |
|||||||||||||||||||
TIAA Real Estate Account ¡ Prospectus183 |
Consolidated schedules of investments continued
TIAA Real Estate Account
(Dollar values shown in millions)
|
|
|
|
|
|
|
|
|
|
|
|
|
||||||||||||||||||||
Principal |
Issuer |
Yield(4) |
Maturity |
Fair Value at |
||||||||||||||||||||||||||||
2014 |
2013 |
2014 |
2013 |
|||||||||||||||||||||||||||||
|
||||||||||||||||||||||||||||||||
|
$ |
|
100.0 |
|
|
$ |
|
— |
Fannie Mae Discount Notes |
0.112% |
7/20/2015 |
|
|
$ |
|
99.9 |
|
|
$ |
|
— |
|||||||||||
|
50.0 |
|
|
— |
Fannie Mae Discount Notes |
0.000% |
8/17/2015 |
|
|
50.0 |
|
|
— |
|||||||||||||||||||
|
2.9 |
|
|
— |
Federal Farm Credit Bank Discount Notes |
0.091% |
5/21/2015 |
|
|
2.9 |
|
|
— |
|||||||||||||||||||
|
— |
|
|
25.0 |
Federal Home Loan Bank Discount Notes |
0.056% |
1/2/2014 |
|
|
— |
|
|
25.0 |
|||||||||||||||||||
|
— |
|
|
27.2 |
Federal Home Loan Bank Discount Notes |
0.066% |
1/3/2014 |
|
|
— |
|
|
27.2 |
|||||||||||||||||||
|
— |
|
|
22.0 |
Federal Home Loan Bank Discount Notes |
0.051% |
1/8/2014 |
|
|
— |
|
|
22.0 |
|||||||||||||||||||
|
— |
|
|
100.0 |
Federal Home Loan Bank Discount Notes |
0.061% |
1/10/2014 |
|
|
— |
|
|
100.0 |
|||||||||||||||||||
|
— |
|
|
50.0 |
Federal Home Loan Bank Discount Notes |
0.035%–0.066% |
1/17/2014 |
|
|
— |
|
|
50.0 |
|||||||||||||||||||
|
— |
|
|
14.0 |
Federal Home Loan Bank Discount Notes |
0.051% |
1/24/2014 |
|
|
— |
|
|
14.0 |
|||||||||||||||||||
|
— |
|
|
14.1 |
Federal Home Loan Bank Discount Notes |
0.086%–0.096% |
2/21/2014 |
|
|
— |
|
|
14.1 |
|||||||||||||||||||
|
— |
|
|
14.5 |
Federal Home Loan Bank Discount Notes |
0.071%–0.076% |
3/7/2014 |
|
|
— |
|
|
14.5 |
|||||||||||||||||||
|
— |
|
|
19.5 |
Federal Home Loan Bank Discount Notes |
0.076% |
3/12/2014 |
|
|
— |
|
|
19.5 |
|||||||||||||||||||
|
— |
|
|
50.0 |
Federal Home Loan Bank Discount Notes |
0.066%–0.106% |
3/21/2014 |
|
|
— |
|
|
50.0 |
|||||||||||||||||||
|
— |
|
|
43.2 |
Federal Home Loan Bank Discount Notes |
0.081% |
3/26/2014 |
|
|
— |
|
|
43.2 |
|||||||||||||||||||
|
— |
|
|
50.0 |
Federal Home Loan Bank Discount Notes |
0.071% |
3/28/2014 |
|
|
— |
|
|
50.0 |
|||||||||||||||||||
|
— |
|
|
23.8 |
Federal Home Loan Bank Discount Notes |
0.087% |
4/2/2014 |
|
|
— |
|
|
23.8 |
|||||||||||||||||||
|
— |
|
|
100.0 |
Federal Home Loan Bank Discount Notes |
0.112% |
4/9/2014 |
|
|
— |
|
|
100.0 |
|||||||||||||||||||
|
— |
|
|
31.0 |
Federal Home Loan Bank Discount Notes |
0.091% |
4/16/2014 |
|
|
— |
|
|
31.0 |
|||||||||||||||||||
|
— |
|
|
10.3 |
Federal Home Loan Bank Discount Notes |
0.096% |
4/23/2014 |
|
|
— |
|
|
10.2 |
|||||||||||||||||||
|
— |
|
|
13.8 |
Federal Home Loan Bank Discount Notes |
0.101% |
4/25/2014 |
|
|
— |
|
|
13.8 |
|||||||||||||||||||
|
— |
|
|
46.0 |
Federal Home Loan Bank Discount Notes |
0.107%–0.122% |
5/1/2014 |
|
|
— |
|
|
46.0 |
|||||||||||||||||||
|
— |
|
|
25.0 |
Federal Home Loan Bank Discount Notes |
0.101% |
5/2/2014 |
|
|
— |
|
|
25.0 |
|||||||||||||||||||
|
— |
|
|
5.0 |
Federal Home Loan Bank Discount Notes |
0.112% |
5/9/2014 |
|
|
— |
|
|
5.0 |
|||||||||||||||||||
|
— |
|
|
16.0 |
Federal Home Loan Bank Discount Notes |
0.112% |
5/14/2014 |
|
|
— |
|
|
16.0 |
|||||||||||||||||||
|
— |
|
|
20.0 |
Federal Home Loan Bank Discount Notes |
0.122% |
5/16/2014 |
|
|
— |
|
|
20.0 |
|||||||||||||||||||
|
— |
|
|
55.1 |
Federal Home Loan Bank Discount Notes |
0.122%–0.127% |
5/28/2014 |
|
|
— |
|
|
55.1 |
|||||||||||||||||||
|
— |
|
|
20.0 |
Federal Home Loan Bank Discount Notes |
0.137% |
6/25/2014 |
|
|
— |
|
|
20.0 |
|||||||||||||||||||
|
— |
|
|
3.0 |
Federal Home Loan Bank Discount Notes |
0.122% |
7/7/2014 |
|
|
— |
|
|
3.0 |
|||||||||||||||||||
|
20.0 |
|
|
— |
Federal Home Loan Bank Discount Notes |
0.041% |
1/5/2015 |
|
|
20.0 |
|
|
— |
|||||||||||||||||||
|
19.0 |
|
|
— |
Federal Home Loan Bank Discount Notes |
0.047% |
1/7/2015 |
|
|
19.0 |
|
|
— |
|||||||||||||||||||
|
50.0 |
|
|
— |
Federal Home Loan Bank Discount Notes |
0.093% |
1/9/2015 |
|
|
50.0 |
|
|
— |
|||||||||||||||||||
|
40.0 |
|
|
— |
Federal Home Loan Bank Discount Notes |
0.076% |
1/13/2015 |
|
|
40.0 |
|
|
— |
|||||||||||||||||||
|
30.0 |
|
|
— |
Federal Home Loan Bank Discount Notes |
0.025% |
1/16/2015 |
|
|
30.0 |
|
|
— |
|||||||||||||||||||
|
50.0 |
|
|
— |
Federal Home Loan Bank Discount Notes |
0.061% |
1/21/2015 |
|
|
50.0 |
|
|
— |
|||||||||||||||||||
|
21.8 |
|
|
— |
Federal Home Loan Bank Discount Notes |
0.101% |
1/23/2015 |
|
|
21.7 |
|
|
— |
|||||||||||||||||||
|
50.0 |
|
|
— |
Federal Home Loan Bank Discount Notes |
0.086% |
1/27/2015 |
|
|
50.0 |
|
|
— |
|||||||||||||||||||
|
8.0 |
|
|
— |
Federal Home Loan Bank Discount Notes |
0.071% |
1/28/2015 |
|
|
8.0 |
|
|
— |
|||||||||||||||||||
|
50.0 |
|
|
— |
Federal Home Loan Bank Discount Notes |
0.061% |
1/30/2015 |
|
|
50.0 |
|
|
— |
|||||||||||||||||||
|
58.0 |
|
|
— |
Federal Home Loan Bank Discount Notes |
0.074% |
2/4/2015 |
|
|
58.0 |
|
|
— |
|||||||||||||||||||
|
45.0 |
|
|
— |
Federal Home Loan Bank Discount Notes |
0.101% |
2/6/2015 |
|
|
45.0 |
|
|
— |
|||||||||||||||||||
|
56.0 |
|
|
— |
Federal Home Loan Bank Discount Notes |
0.101% |
2/13/2015 |
|
|
56.0 |
|
|
— |
|||||||||||||||||||
|
29.5 |
|
|
— |
Federal Home Loan Bank Discount Notes |
0.096% |
2/20/2015 |
|
|
29.5 |
|
|
— |
|||||||||||||||||||
|
20.6 |
|
|
— |
Federal Home Loan Bank Discount Notes |
0.107% |
2/23/2015 |
|
|
20.6 |
|
|
— |
|||||||||||||||||||
|
22.0 |
|
|
— |
Federal Home Loan Bank Discount Notes |
0.094% |
3/4/2015 |
|
|
22.0 |
|
|
— |
|||||||||||||||||||
|
16.7 |
|
|
— |
Federal Home Loan Bank Discount Notes |
0.112% |
3/6/2015 |
|
|
16.7 |
|
|
— |
|||||||||||||||||||
184Prospectus ¡ TIAA Real Estate Account |
Consolidated schedules of investments continued
TIAA Real Estate Account
(Dollar values shown in millions)
|
|
|
|
|
|
|
|
|
|
|
|
|
||||||||||||||||||||
Principal |
Issuer |
Yield(4) |
Maturity |
Fair Value at |
||||||||||||||||||||||||||||
2014 |
2013 |
2014 |
2013 |
|||||||||||||||||||||||||||||
|
||||||||||||||||||||||||||||||||
|
$ |
|
11.5 |
|
|
$ |
|
— |
Federal Home Loan Bank Discount Notes |
0.073% |
3/9/2015 |
|
|
$ |
|
11.5 |
|
|
$ |
|
— |
|||||||||||
|
31.3 |
|
|
— |
Federal Home Loan Bank Discount Notes |
0.112% |
3/11/2015 |
|
|
31.3 |
|
|
— |
|||||||||||||||||||
|
7.0 |
|
|
— |
Federal Home Loan Bank Discount Notes |
0.071% |
3/17/2015 |
|
|
7.0 |
|
|
— |
|||||||||||||||||||
|
27.0 |
|
|
— |
Federal Home Loan Bank Discount Notes |
0.067% |
3/27/2015 |
|
|
27.0 |
|
|
— |
|||||||||||||||||||
|
15.0 |
|
|
— |
Federal Home Loan Bank Discount Notes |
0.096%–0.122% |
3/30/2015 |
|
|
15.0 |
|
|
— |
|||||||||||||||||||
|
29.2 |
|
|
— |
Federal Home Loan Bank Discount Notes |
0.101% |
4/17/2015 |
|
|
29.2 |
|
|
— |
|||||||||||||||||||
|
7.0 |
|
|
— |
Federal Home Loan Bank Discount Notes |
0.101% |
4/24/2015 |
|
|
7.0 |
|
|
— |
|||||||||||||||||||
|
30.1 |
|
|
— |
Federal Home Loan Bank Discount Notes |
0.152% |
4/29/2015 |
|
|
30.1 |
|
|
— |
|||||||||||||||||||
|
20.0 |
|
|
— |
Federal Home Loan Bank Discount Notes |
0.116% |
5/20/2015 |
|
|
20.0 |
|
|
— |
|||||||||||||||||||
|
20.0 |
|
|
— |
Federal Home Loan Bank Discount Notes |
0.142% |
7/30/2015 |
|
|
20.0 |
|
|
— |
|||||||||||||||||||
|
20.0 |
|
|
— |
Federal Home Loan Bank Discount Notes |
0.162% |
8/20/2015 |
|
|
20.0 |
|
|
— |
|||||||||||||||||||
|
8.2 |
|
|
— |
Federal Home Loan Bank Discount Notes |
0.132%–0.162% |
8/21/2015 |
|
|
8.2 |
|
|
— |
|||||||||||||||||||
|
48.8 |
|
|
— |
Federal Home Loan Bank Discount Notes |
0.152% |
8/28/2015 |
|
|
48.8 |
|
|
— |
|||||||||||||||||||
|
20.0 |
|
|
— |
Federal Home Loan Bank Discount Notes |
0.168% |
9/4/2015 |
|
|
20.0 |
|
|
— |
|||||||||||||||||||
|
21.5 |
|
|
— |
Federal Home Loan Bank Discount Notes |
0.162% |
9/8/2015 |
|
|
21.5 |
|
|
— |
|||||||||||||||||||
|
14.0 |
|
|
— |
Federal Home Loan Bank Discount Notes |
0.162% |
9/9/2015 |
|
|
14.0 |
|
|
— |
|||||||||||||||||||
|
— |
|
|
40.0 |
Freddie Mac Discount Notes |
0.061% |
1/6/2014 |
|
|
— |
|
|
40.0 |
|||||||||||||||||||
|
— |
|
|
25.1 |
Freddie Mac Discount Notes |
0.046%–0.086% |
1/13/2014 |
|
|
— |
|
|
25.1 |
|||||||||||||||||||
|
— |
|
|
32.9 |
Freddie Mac Discount Notes |
0.046% |
1/21/2014 |
|
|
— |
|
|
32.9 |
|||||||||||||||||||
|
— |
|
|
51.2 |
Freddie Mac Discount Notes |
0.035%–0.051% |
1/22/2014 |
|
|
— |
|
|
51.2 |
|||||||||||||||||||
|
— |
|
|
13.2 |
Freddie Mac Discount Notes |
0.147% |
1/23/2014 |
|
|
— |
|
|
13.2 |
|||||||||||||||||||
|
— |
|
|
26.0 |
Freddie Mac Discount Notes |
0.058%–0.127% |
2/4/2014 |
|
|
— |
|
|
26.0 |
|||||||||||||||||||
|
— |
|
|
11.3 |
Freddie Mac Discount Notes |
0.086% |
2/14/2014 |
|
|
— |
|
|
11.3 |
|||||||||||||||||||
|
— |
|
|
62.8 |
Freddie Mac Discount Notes |
0.061%–0.066% |
3/10/2014 |
|
|
— |
|
|
62.7 |
|||||||||||||||||||
|
— |
|
|
24.5 |
Freddie Mac Discount Notes |
0.086% |
3/11/2014 |
|
|
— |
|
|
24.4 |
|||||||||||||||||||
|
— |
|
|
30.0 |
Freddie Mac Discount Notes |
0.081% |
3/17/2014 |
|
|
— |
|
|
30.0 |
|||||||||||||||||||
|
— |
|
|
33.0 |
Freddie Mac Discount Notes |
0.064% |
3/24/2014 |
|
|
— |
|
|
33.0 |
|||||||||||||||||||
|
— |
|
|
15.0 |
Freddie Mac Discount Notes |
0.061% |
4/4/2014 |
|
|
— |
|
|
15.0 |
|||||||||||||||||||
|
— |
|
|
33.0 |
Freddie Mac Discount Notes |
0.091% |
4/7/2014 |
|
|
— |
|
|
33.0 |
|||||||||||||||||||
|
— |
|
|
30.0 |
Freddie Mac Discount Notes |
0.106% |
4/14/2014 |
|
|
— |
|
|
30.0 |
|||||||||||||||||||
|
— |
|
|
32.9 |
Freddie Mac Discount Notes |
0.096%–0.101% |
4/21/2014 |
|
|
— |
|
|
32.9 |
|||||||||||||||||||
|
— |
|
|
42.5 |
Freddie Mac Discount Notes |
0.096%–0.112% |
4/24/2014 |
|
|
— |
|
|
42.5 |
|||||||||||||||||||
|
— |
|
|
6.0 |
Freddie Mac Discount Notes |
0.101% |
4/28/2014 |
|
|
— |
|
|
6.0 |
|||||||||||||||||||
|
— |
|
|
12.8 |
Freddie Mac Discount Notes |
0.096% |
5/1/2014 |
|
|
— |
|
|
12.8 |
|||||||||||||||||||
|
— |
|
|
25.0 |
Freddie Mac Discount Notes |
0.112% |
5/2/2014 |
|
|
— |
|
|
25.0 |
|||||||||||||||||||
|
— |
|
|
50.7 |
Freddie Mac Discount Notes |
0.091%–0.101% |
5/6/2014 |
|
|
— |
|
|
50.6 |
|||||||||||||||||||
|
— |
|
|
21.2 |
Freddie Mac Discount Notes |
0.107% |
5/12/2014 |
|
|
— |
|
|
21.1 |
|||||||||||||||||||
|
— |
|
|
27.3 |
Freddie Mac Discount Notes |
0.101%–0.122% |
5/21/2014 |
|
|
— |
|
|
27.2 |
|||||||||||||||||||
|
— |
|
|
19.6 |
Freddie Mac Discount Notes |
0.101% |
6/4/2014 |
|
|
— |
|
|
19.6 |
|||||||||||||||||||
|
— |
|
|
18.5 |
Freddie Mac Discount Notes |
0.101% |
6/5/2014 |
|
|
— |
|
|
18.5 |
|||||||||||||||||||
|
— |
|
|
6.0 |
Freddie Mac Discount Notes |
0.127% |
6/9/2014 |
|
|
— |
|
|
6.0 |
|||||||||||||||||||
|
— |
|
|
18.8 |
Freddie Mac Discount Notes |
0.131% |
6/16/2014 |
|
|
— |
|
|
18.7 |
|||||||||||||||||||
|
— |
|
|
15.9 |
Freddie Mac Discount Notes |
0.117% |
7/1/2014 |
|
|
— |
|
|
15.9 |
|||||||||||||||||||
|
— |
|
|
7.1 |
Freddie Mac Discount Notes |
0.132% |
7/11/2014 |
|
|
— |
|
|
7.1 |
|||||||||||||||||||
|
— |
|
|
25.0 |
Freddie Mac Discount Notes |
0.134% |
8/1/2014 |
|
|
— |
|
|
25.0 |
|||||||||||||||||||
|
— |
|
|
7.3 |
Freddie Mac Discount Notes |
0.132% |
9/3/2014 |
|
|
— |
|
|
7.3 |
|||||||||||||||||||
TIAA Real Estate Account ¡ Prospectus185 |
Consolidated schedules of investments continued
TIAA Real Estate Account
(Dollar values shown in millions)
|
|
|
|
|
|
|
|
|
|
|
|
|
||||||||||||||||||||
Principal |
Issuer |
Yield(4) |
Maturity |
Fair Value at |
||||||||||||||||||||||||||||
2014 |
2013 |
2014 |
2013 |
|||||||||||||||||||||||||||||
|
||||||||||||||||||||||||||||||||
|
$ |
|
10.3 |
|
|
$ |
|
— |
Freddie Mac Discount Notes |
0.081%–0.096% |
1/8/2015 |
|
|
$ |
|
10.3 |
|
|
$ |
|
— |
|||||||||||
|
43.0 |
|
|
— |
Freddie Mac Discount Notes |
0.038%–0.091% |
1/12/2015 |
|
|
43.0 |
|
|
— |
|||||||||||||||||||
|
30.8 |
|
|
— |
Freddie Mac Discount Notes |
0.101% |
1/26/2015 |
|
|
30.8 |
|
|
— |
|||||||||||||||||||
|
37.0 |
|
|
— |
Freddie Mac Discount Notes |
0.061% |
1/29/2015 |
|
|
37.0 |
|
|
— |
|||||||||||||||||||
|
16.5 |
|
|
— |
Freddie Mac Discount Notes |
0.096%–0.107% |
2/10/2015 |
|
|
16.5 |
|
|
— |
|||||||||||||||||||
|
22.9 |
|
|
— |
Freddie Mac Discount Notes |
0.080%–0.094% |
3/16/2015 |
|
|
22.9 |
|
|
— |
|||||||||||||||||||
|
11.8 |
|
|
— |
Freddie Mac Discount Notes |
0.112% |
3/17/2015 |
|
|
11.8 |
|
|
— |
|||||||||||||||||||
|
17.1 |
|
|
— |
Freddie Mac Discount Notes |
0.081%–0.107% |
3/19/2015 |
|
|
17.1 |
|
|
— |
|||||||||||||||||||
|
19.6 |
|
|
— |
Freddie Mac Discount Notes |
0.061% |
3/24/2015 |
|
|
19.5 |
|
|
— |
|||||||||||||||||||
|
18.0 |
|
|
— |
Freddie Mac Discount Notes |
0.132% |
3/25/2015 |
|
|
18.0 |
|
|
— |
|||||||||||||||||||
|
16.2 |
|
|
— |
Freddie Mac Discount Notes |
0.122% |
4/1/2015 |
|
|
16.2 |
|
|
— |
|||||||||||||||||||
|
27.2 |
|
|
— |
Freddie Mac Discount Notes |
0.127%–0.142% |
4/2/2015 |
|
|
27.2 |
|
|
— |
|||||||||||||||||||
|
20.9 |
|
|
— |
Freddie Mac Discount Notes |
0.066% |
4/6/2015 |
|
|
20.9 |
|
|
— |
|||||||||||||||||||
|
16.2 |
|
|
— |
Freddie Mac Discount Notes |
0.096%–0.142% |
4/7/2015 |
|
|
16.2 |
|
|
— |
|||||||||||||||||||
|
4.4 |
|
|
— |
Freddie Mac Discount Notes |
0.096% |
4/9/2015 |
|
|
4.4 |
|
|
— |
|||||||||||||||||||
|
29.8 |
|
|
— |
Freddie Mac Discount Notes |
0.101% |
4/14/2015 |
|
|
29.8 |
|
|
— |
|||||||||||||||||||
|
13.6 |
|
|
— |
Freddie Mac Discount Notes |
0.096% |
4/16/2015 |
|
|
13.6 |
|
|
— |
|||||||||||||||||||
|
11.0 |
|
|
— |
Freddie Mac Discount Notes |
0.107% |
4/21/2015 |
|
|
11.0 |
|
|
— |
|||||||||||||||||||
|
15.0 |
|
|
— |
Freddie Mac Discount Notes |
0.096% |
4/22/2015 |
|
|
15.0 |
|
|
— |
|||||||||||||||||||
|
20.0 |
|
|
— |
Freddie Mac Discount Notes |
0.096% |
4/23/2015 |
|
|
20.0 |
|
|
— |
|||||||||||||||||||
|
13.7 |
|
|
— |
Freddie Mac Discount Notes |
0.101% |
4/24/2015 |
|
|
13.7 |
|
|
— |
|||||||||||||||||||
|
20.0 |
|
|
— |
Freddie Mac Discount Notes |
0.101% |
5/11/2015 |
|
|
20.0 |
|
|
— |
|||||||||||||||||||
|
8.8 |
|
|
— |
Freddie Mac Discount Notes |
0.112% |
5/27/2015 |
|
|
8.8 |
|
|
— |
|||||||||||||||||||
|
41.0 |
|
|
— |
Freddie Mac Discount Notes |
0.147% |
6/15/2015 |
|
|
41.0 |
|
|
— |
|||||||||||||||||||
|
15.0 |
|
|
— |
Freddie Mac Discount Notes |
0.137% |
6/16/2015 |
|
|
15.0 |
|
|
— |
|||||||||||||||||||
|
6.9 |
|
|
— |
Freddie Mac Discount Notes |
0.101% |
7/21/2015 |
|
|
6.9 |
|
|
— |
|||||||||||||||||||
|
24.0 |
|
|
— |
Freddie Mac Discount Notes |
0.159% |
7/22/2015 |
|
|
24.0 |
|
|
— |
|||||||||||||||||||
|
|
|
|
|
|
|
|
|
|
|
||||||||||||||||||||||
TOTAL GOVERNMENT AGENCY NOTES |
|
|
|
|
|
|
|
|
||||||||||||||||||||||||
|
(Cost $2,369.6 and $1,989.0) |
|
|
|
|
|
|
$ |
|
2,369.9 |
|
|
$ |
|
1,989.1 |
||||||||||||||||||
|
|
|
|
|
|
|
|
|
|
|
||||||||||||||||||||||
UNITED STATES TREASURY SECURITIES—6.6% and 5.9% |
|
|
|
|
|
|
||||||||||||||||||||||||||
|
— |
|
|
17.0 |
United States Treasury Bills |
0.052% |
1/2/2014 |
|
|
— |
|
|
17.0 |
|||||||||||||||||||
|
— |
|
|
26.6 |
United States Treasury Bills |
0.031%–0.069% |
1/9/2014 |
|
|
— |
|
|
26.6 |
|||||||||||||||||||
|
— |
|
|
30.0 |
United States Treasury Bills |
0.046%–0.048% |
1/16/2014 |
|
|
— |
|
|
30.0 |
|||||||||||||||||||
|
— |
|
|
4.0 |
United States Treasury Bills |
0.035% |
1/23/2014 |
|
|
— |
|
|
4.0 |
|||||||||||||||||||
|
— |
|
|
30.0 |
United States Treasury Bills |
0.071% |
1/30/2014 |
|
|
— |
|
|
30.0 |
|||||||||||||||||||
|
— |
|
|
17.0 |
United States Treasury Bills |
0.071% |
3/6/2014 |
|
|
— |
|
|
17.0 |
|||||||||||||||||||
|
— |
|
|
59.0 |
United States Treasury Bills |
0.054%–0.061% |
3/13/2014 |
|
|
— |
|
|
59.0 |
|||||||||||||||||||
|
— |
|
|
50.0 |
United States Treasury Bills |
0.030%–0.043% |
3/20/2014 |
|
|
— |
|
|
50.0 |
|||||||||||||||||||
|
— |
|
|
4.0 |
United States Treasury Bills |
0.068% |
4/3/2014 |
|
|
— |
|
|
4.0 |
|||||||||||||||||||
|
— |
|
|
50.0 |
United States Treasury Bills |
0.079%–0.089% |
6/26/2014 |
|
|
— |
|
|
50.0 |
|||||||||||||||||||
|
— |
|
|
206.0 |
United States Treasury Bills |
0.102%–0.108% |
7/24/2014 |
|
|
— |
|
|
205.9 |
|||||||||||||||||||
|
— |
|
|
49.3 |
United States Treasury Bills |
0.091%–0.097% |
8/21/2014 |
|
|
— |
|
|
49.2 |
|||||||||||||||||||
|
— |
|
|
50.0 |
United States Treasury Bills |
0.093% |
9/18/2014 |
|
|
— |
|
|
50.0 |
|||||||||||||||||||
|
— |
|
|
6.4 |
United States Treasury Bills |
0.030%–0.117% |
11/13/2014 |
|
|
— |
|
|
6.4 |
|||||||||||||||||||
186Prospectus ¡ TIAA Real Estate Account |
Consolidated schedules of investments continued
TIAA Real Estate Account
(Dollar values shown in millions)
|
|
|
|
|
|
|
|
|
|
|
|
|
||||||||||||||||||||
Principal |
Issuer |
Yield(4) |
Maturity |
Fair Value at |
||||||||||||||||||||||||||||
2014 |
2013 |
2014 |
2013 |
|||||||||||||||||||||||||||||
|
||||||||||||||||||||||||||||||||
|
$ |
|
— |
|
|
$ |
|
25.0 |
United States Treasury Bills |
0.085%–0.135% |
12/11/2014 |
|
|
$ |
|
— |
|
|
$ |
|
25.0 |
|||||||||||
|
24.0 |
|
|
— |
United States Treasury Bills |
0.041% |
1/2/2015 |
|
|
24.0 |
|
|
— |
|||||||||||||||||||
|
4.0 |
|
|
— |
United States Treasury Bills |
0.035% |
1/15/2015 |
|
|
4.0 |
|
|
— |
|||||||||||||||||||
|
45.8 |
|
|
— |
United States Treasury Bills |
0.020%–0.040% |
1/22/2015 |
|
|
45.8 |
|
|
— |
|||||||||||||||||||
|
19.4 |
|
|
— |
United States Treasury Bills |
0.038%–0.051% |
2/12/2015 |
|
|
19.4 |
|
|
— |
|||||||||||||||||||
|
30.0 |
|
|
— |
United States Treasury Bills |
0.044% |
2/19/2015 |
|
|
30.0 |
|
|
— |
|||||||||||||||||||
|
17.2 |
|
|
— |
United States Treasury Bills |
0.020%–0.030% |
2/26/2015 |
|
|
17.2 |
|
|
— |
|||||||||||||||||||
|
43.6 |
|
|
— |
United States Treasury Bills |
0.020%–0.032% |
3/5/2015 |
|
|
43.6 |
|
|
— |
|||||||||||||||||||
|
30.0 |
|
|
— |
United States Treasury Bills |
0.042% |
3/12/2015 |
|
|
30.0 |
|
|
— |
|||||||||||||||||||
|
16.0 |
|
|
— |
United States Treasury Bills |
0.030% |
3/26/2015 |
|
|
16.0 |
|
|
— |
|||||||||||||||||||
|
7.2 |
|
|
— |
United States Treasury Bills |
0.028%–0.044% |
4/2/2015 |
|
|
7.2 |
|
|
— |
|||||||||||||||||||
|
36.6 |
|
|
— |
United States Treasury Bills |
0.037% |
4/9/2015 |
|
|
36.6 |
|
|
— |
|||||||||||||||||||
|
41.2 |
|
|
— |
United States Treasury Bills |
0.056%–0.057% |
5/7/2015 |
|
|
41.2 |
|
|
— |
|||||||||||||||||||
|
53.9 |
|
|
— |
United States Treasury Bills |
0.044%–0.071% |
5/28/2015 |
|
|
53.9 |
|
|
— |
|||||||||||||||||||
|
8.5 |
|
|
— |
United States Treasury Bills |
0.076% |
6/4/2015 |
|
|
8.4 |
|
|
— |
|||||||||||||||||||
|
196.0 |
|
|
— |
United States Treasury Bills |
0.071%–0.100% |
6/25/2015 |
|
|
195.9 |
|
|
— |
|||||||||||||||||||
|
121.0 |
|
|
— |
United States Treasury Bills |
0.105%–0.112% |
7/23/2015 |
|
|
120.9 |
|
|
— |
|||||||||||||||||||
|
35.0 |
|
|
— |
United States Treasury Bills |
0.092%–0.178% |
8/20/2015 |
|
|
35.0 |
|
|
— |
|||||||||||||||||||
|
50.0 |
|
|
— |
United States Treasury Bills |
0.078% |
9/17/2015 |
|
|
49.9 |
|
|
— |
|||||||||||||||||||
|
117.0 |
|
|
— |
United States Treasury Bills |
0.099%–0.101% |
10/15/2015 |
|
|
116.8 |
|
|
— |
|||||||||||||||||||
|
— |
|
|
56.4 |
United States Treasury Notes |
0.055%–0.113% |
1/31/2014 |
|
|
— |
|
|
56.4 |
|||||||||||||||||||
|
— |
|
|
17.7 |
United States Treasury Notes |
0.052%–0.152% |
3/31/2014 |
|
|
— |
|
|
17.7 |
|||||||||||||||||||
|
— |
|
|
25.0 |
United States Treasury Notes |
0.053% |
4/15/2014 |
|
|
— |
|
|
25.1 |
|||||||||||||||||||
|
— |
|
|
77.0 |
United States Treasury Notes |
0.097%–0.150% |
4/30/2014 |
|
|
— |
|
|
77.0 |
|||||||||||||||||||
|
— |
|
|
24.9 |
United States Treasury Notes |
0.082%–0.123% |
5/15/2014 |
|
|
— |
|
|
24.9 |
|||||||||||||||||||
|
— |
|
|
100.0 |
United States Treasury Notes |
0.076%–0.136% |
6/30/2014 |
|
|
— |
|
|
100.1 |
|||||||||||||||||||
|
— |
|
|
100.0 |
United States Treasury Notes |
0.124%–0.147% |
7/15/2014 |
|
|
— |
|
|
100.3 |
|||||||||||||||||||
|
— |
|
|
54.8 |
United States Treasury Notes |
0.121%–0.139% |
7/31/2014 |
|
|
— |
|
|
54.8 |
|||||||||||||||||||
|
— |
|
|
50.0 |
United States Treasury Notes |
0.152%–0.167% |
8/15/2014 |
|
|
— |
|
|
50.1 |
|||||||||||||||||||
|
1.0 |
|
|
— |
United States Treasury Notes |
0.107% |
1/15/2015 |
|
|
1.0 |
|
|
— |
|||||||||||||||||||
|
24.0 |
|
|
— |
United States Treasury Notes |
0.066% |
4/15/2015 |
|
|
24.0 |
|
|
— |
|||||||||||||||||||
|
9.2 |
|
|
— |
United States Treasury Notes |
0.051% |
4/23/2015 |
|
|
9.2 |
|
|
— |
|||||||||||||||||||
|
40.0 |
|
|
— |
United States Treasury Notes |
0.045% |
4/30/2015 |
|
|
40.0 |
|
|
— |
|||||||||||||||||||
|
41.3 |
|
|
— |
United States Treasury Notes |
0.061%–0.062% |
5/14/2015 |
|
|
41.3 |
|
|
— |
|||||||||||||||||||
|
50.0 |
|
|
— |
United States Treasury Notes |
0.118% |
5/15/2015 |
|
|
50.0 |
|
|
— |
|||||||||||||||||||
|
100.0 |
|
|
— |
United States Treasury Notes |
0.063% |
5/21/2015 |
|
|
100.0 |
|
|
— |
|||||||||||||||||||
|
19.6 |
|
|
— |
United States Treasury Notes |
0.080% |
6/15/2015 |
|
|
19.6 |
|
|
— |
|||||||||||||||||||
|
30.0 |
|
|
— |
United States Treasury Notes |
0.152% |
6/30/2015 |
|
|
30.0 |
|
|
— |
|||||||||||||||||||
|
50.0 |
|
|
— |
United States Treasury Notes |
0.126%–0.129% |
7/15/2015 |
|
|
50.0 |
|
|
— |
|||||||||||||||||||
|
24.0 |
|
|
— |
United States Treasury Notes |
0.135% |
7/31/2015 |
|
|
24.2 |
|
|
— |
|||||||||||||||||||
|
26.0 |
|
|
— |
United States Treasury Notes |
0.093% |
7/31/2015 |
|
|
26.0 |
|
|
— |
|||||||||||||||||||
|
50.0 |
|
|
— |
United States Treasury Notes |
0.106%–0.113% |
8/31/2015 |
|
|
50.1 |
|
|
— |
|||||||||||||||||||
|
50.0 |
|
|
— |
United States Treasury Notes |
0.122% |
9/15/2015 |
|
|
50.0 |
|
|
— |
|||||||||||||||||||
|
50.0 |
|
|
— |
United States Treasury Notes |
0.000% |
9/30/2015 |
|
|
50.0 |
|
|
— |
|||||||||||||||||||
|
|
|
|
|
|
|
|
|
|
|
||||||||||||||||||||||
|
|
|
|
|
|
|
|
|
|
|
|
|||||||||||||||||||||
TIAA Real Estate Account ¡ Prospectus187 |
Consolidated schedules of investments continued
TIAA Real Estate Account
(Dollar values shown in millions)
|
|
|
|
|
|
|
|
|
|
|
|
|
||||||||||||||||||||
Principal |
Issuer |
Yield(4) |
Maturity |
Fair Value at |
||||||||||||||||||||||||||||
2014 |
2013 |
2014 |
2013 |
|||||||||||||||||||||||||||||
|
||||||||||||||||||||||||||||||||
TOTAL UNITED STATES TREASURY SECURITIES |
|
|
|
|
|
|
|
|
||||||||||||||||||||||||
|
(Cost $1,461.5 and $1,130.3) |
|
|
|
|
|
|
$ |
|
1,461.2 |
|
|
$ |
|
1,130.5 |
||||||||||||||||||
|
|
|
|
|
|
|
|
|
|
|
||||||||||||||||||||||
TOTAL OTHER MARKETABLE SECURITIES |
|
|
|
|
|
|
|
|
||||||||||||||||||||||||
|
(Cost $3,831.1 and $3,119.3) |
|
|
|
|
|
|
$ |
|
3,831.1 |
|
|
$ |
|
3,119.6 |
||||||||||||||||||
|
|
|
|
|
|
|
|
|
|
|
||||||||||||||||||||||
TOTAL MARKETABLE SECURITIES |
|
|
|
|
|
|
|
|
||||||||||||||||||||||||
|
(Cost $5,231.3 and $4,503.6) |
|
|
|
|
|
|
$ |
|
5,649.5 |
|
|
$ |
|
4,618.9 |
||||||||||||||||||
|
|
|
|
|
|
|
|
|
|
|
||||||||||||||||||||||
TOTAL INVESTMENTS |
|
|
|
|
|
|
|
|
||||||||||||||||||||||||
|
(Cost $19,123.8 and $17,649.0) |
|
|
|
|
|
|
$ |
|
22,168.1 |
|
|
$ |
|
19,109.6 |
||||||||||||||||||
|
|
|
|
|
|
|
|
|
|
|
||||||||||||||||||||||
(1) |
The investment has a mortgage loan payable outstanding, as indicated in Note 9. |
||
(2) |
The fair value reflects the Account’s interest in the joint venture and is net of debt. |
||
(3) |
Properties within this investment are located throughout the United States. |
||
(4) |
Yield represents the annualized yield. |
||
(5) |
The market value reflects the final settlement due to the Account. The property investment held within the joint venture was sold during the quarter ended December 31, 2012. |
||
(6) |
Increase in ownership percentage of 0.1% from December 31, 2013 was due to contract agreement with seller. |
||
(7) |
Investment was formerly named Ten & Twenty Westport Road. |
||
(8) |
The land held within Four Oaks Place was sold to the Four Oaks Place LP joint venture during the quarter ended September 30, 2014. |
||
(9) |
Four assets held within the Houston Apartment Portfolio were sold during the quarter ended December 31, 2014. |
||
(10) |
The investment was sold on February 12, 2015. |
188Prospectus ¡ TIAA Real Estate Account |
REPORT OF INDEPENDENT REGISTERED PUBLIC
ACCOUNTING FIRM
To the Participants of the TIAA Real Estate Account and the Board of Trustees of Teachers Insurance and Annuity Association of America:
In our opinion, the accompanying consolidated statements of assets and liabilities, including the consolidated schedules of investments, and the related consolidated statements of operations, of changes in net assets and of cash flows, present fairly, in all material respects, the financial position of the TIAA Real Estate Account and its subsidiaries (the “Account”) at December 31, 2014 and 2013, the results of their operations, the changes in their net assets and their cash flows for each of the three years in the period ended December 31, 2014 in conformity with accounting principles generally accepted in the United States of America. These financial statements are the responsibility of the Account’s management. Our responsibility is to express an opinion on these financial statements based on our audits. We conducted our audits of these financial statements in accordance with the standards of the Public Company Accounting Oversight Board (United States). Those standards require that we plan and perform the audit to obtain reasonable assurance about whether the financial statements are free of material misstatement. An audit includes examining, on a test basis, evidence supporting the amounts and disclosures in the financial statements, assessing the accounting principles used and significant estimates made by management, and evaluating the overall financial statement presentation. We believe that our audits provide a reasonable basis for our opinion.
/s/ PricewaterhouseCoopers LLP
Charlotte, North Carolina
March 6, 2015
TIAA Real Estate Account ¡ Prospectus189 |
Pro forma condensed statement of assets and liabilities (unaudited)
TIAA Real Estate Account
|
|
|
|
|
|
|
|||||||||||||||
(in millions) |
As of December 31, 2014 |
||||||||||||||||||||
Historical |
Adjustments |
Pro Forma |
|||||||||||||||||||
|
|||||||||||||||||||||
|
ASSETS |
|
|
|
|
|
|
|||||||||||||||
|
Real estate properties and Real estate joint ventures and limited partnerships, at fair value |
|
$ |
|
16,518.6 |
$ |
|
191.0 |
(a) |
|
|
$ |
|
16,709.6 |
||||||||
|
Marketable securities |
|
|
5,649.5 |
|
|
— |
|
|
5,649.5 |
||||||||||||
|
Other |
|
|
240.6 |
— |
|
240.6 |
|||||||||||||||
|
|||||||||||||||||||||
|
TOTAL ASSETS |
|
|
22,408.7 |
|
191.0 |
|
22,599.7 |
||||||||||||||
|
|||||||||||||||||||||
|
Mortgage notes payable |
|
|
2,373.8 |
|
|
— |
|
|
2,373.8 |
||||||||||||
|
Accrued real estate property level expenses and taxes |
|
|
165.5 |
|
|
— |
|
|
165.5 |
||||||||||||
|
Other |
|
|
40.4 |
|
|
— |
|
|
40.4 |
||||||||||||
|
|||||||||||||||||||||
|
TOTAL LIABILITIES |
|
|
2,579.7 |
|
|
— |
|
|
2,579.7 |
||||||||||||
|
|||||||||||||||||||||
|
NET ASSETS |
|
|
$ |
|
19,829.0 |
|
$ |
|
191.0 |
|
$ |
|
20,020.0 |
||||||||
|
|||||||||||||||||||||
Pro forma condensed statement of operations (unaudited)
TIAA Real Estate Account
|
|
|
|
|
|
|
|||||||||||||||
For the Year Ended December 31, 2014 |
|||||||||||||||||||||
Historical |
Adjustments |
Pro Forma |
|||||||||||||||||||
|
|||||||||||||||||||||
|
Rental income |
|
|
$ |
|
897.8 |
|
$ |
|
28.5 |
(b) |
|
|
$ |
|
926.3 |
||||||
|
|||||||||||||||||||||
|
Operating expenses |
|
|
208.0 |
8.5 |
(b) |
|
|
216.5 |
|||||||||||||
|
Real estate taxes |
|
|
134.1 |
5.2 |
(b) |
|
|
139.3 |
|||||||||||||
|
Interest expense |
|
|
98.7 |
|
|
— |
|
|
98.7 |
||||||||||||
|
|||||||||||||||||||||
|
Total real estate property expenses and taxes |
|
|
440.8 |
|
13.7 |
|
454.5 |
||||||||||||||
|
|||||||||||||||||||||
|
Real estate income, net |
|
|
457.0 |
|
14.8 |
|
471.8 |
||||||||||||||
|
Income from real estate joint ventures and limited partnerships |
|
|
148.1 |
1.4 |
(c) |
|
|
149.5 |
|||||||||||||
|
Interest and dividends |
|
|
47.7 |
|
|
— |
|
|
47.7 |
||||||||||||
|
|||||||||||||||||||||
|
TOTAL INCOME, NET |
|
|
652.8 |
|
16.2 |
|
669.0 |
||||||||||||||
|
EXPENSES |
|
|
163.0 |
3.3 |
(d) |
|
|
166.3 |
|||||||||||||
|
|||||||||||||||||||||
|
INVESTMENT INCOME, NET |
|
|
489.8 |
|
12.9 |
|
502.7 |
||||||||||||||
|
REALIZED AND UNREALIZED GAINS |
|
|
1,628.4 |
|
|
— |
|
|
1,628.4 |
||||||||||||
|
|||||||||||||||||||||
|
NET INCREASE IN NET ASSETS RESULTING FROM OPERATIONS |
|
|
$ |
|
2,118.2 |
|
$ |
|
12.9 |
|
$ |
|
2,131.1 |
||||||||
|
|||||||||||||||||||||
190Prospectus ¡ TIAA Real Estate Account |
Notes to pro forma condensed financial statements (unaudited)
TIAA Real Estate Account
Note 1—Purpose and Assumptions
As required by the Securities and Exchange Commission under Regulation S-X Article 11-01(5), these pro forma condensed financial statements of the TIAA Real Estate Account (“Account”) have been prepared because the Account has made significant purchases of real estate property investments during the period from January 1, 2014 through the date of this prospectus. During 2014, the Account purchased 13 wholly owned real estate investments: two retail, four apartment, three office and four industrial investments. Two of the industrial investments, The Woodley and Ontario Mills Industrial Portfolio, were newly constructed with no historical leasing activity. In addition, Northwest Houston Industrial Portfolio and Park 10 Distribution Center were purchased in one transaction and are consolidated in one audited financial statement. In January 2015, the Account acquired one wholly owned office property. In addition, the Account invested in two joint venture investments during 2014: one retail property and one office property.
Various assumptions have been made in order to prepare these pro forma condensed financial statements. The pro forma condensed statement of operations for the year ended December 31, 2014 has been prepared assuming real estate property investments purchased during the period from January 1, 2014 through the date of this prospectus were purchased as of January 1, 2014.
Note 2—Pro Forma Adjustments
The following pro forma adjustments were made in preparing the pro forma condensed financial statements to reflect the purpose described in Note 1.
Pro forma Condensed Statement of Assets and Liabilities:
(a) |
To record the cost of real estate property investments purchased during the period from January 1, 2015 through the date of this prospectus. |
|||||||||||||||||||||||||||||||||||||||||||||||||||||||||||||||||||||||||||||||||||||||||||||||||
|
||||||||||||||||||||||||||||||||||||||||||||||||||||||||||||||||||||||||||||||||||||||||||||||||||
Pro forma Condensed Statement of Operations:
|
||||||||||||||||||||||||||||||||||||||||||||||||||||||||||||||||||||||||||||||||||||||||||||||||||
|
(b) |
To record the rental income and real estate property level expenses of the real estate properties purchased during the period from January 1, 2014 through the date of this prospectus, assuming such properties were owned for the entire year ended December 31, 2014. |
|||||||||||||||||||||||||||||||||||||||||||||||||||||||||||||||||||||||||||||||||||||||||||||||||
|
||||||||||||||||||||||||||||||||||||||||||||||||||||||||||||||||||||||||||||||||||||||||||||||||||
(c) |
To record income for the joint ventures purchased during the period from January 1, 2014 through the date of this prospectus assuming the joint venture interests were owned for the entire year ended December 31, 2014. |
|||||||||||||||||||||||||||||||||||||||||||||||||||||||||||||||||||||||||||||||||||||||||||||||||
|
||||||||||||||||||||||||||||||||||||||||||||||||||||||||||||||||||||||||||||||||||||||||||||||||||
(d) |
To record additional investment advisory expense charges which would have been incurred during the year ended December 31, 2014, based on the gross investment amounts involved and assuming the real estate property investments purchased during the period from January 1, 2014 through the date of this prospectus had been purchased as of January 1, 2014. |
|||||||||||||||||||||||||||||||||||||||||||||||||||||||||||||||||||||||||||||||||||||||||||||||||
TIAA Real Estate Account ¡ Prospectus191 |
401 West 14th Street, New York, New York
Independent auditors’ report
To the Management of Teachers Insurance and Annuity Association of America
We have audited the accompanying statement of revenues and certain expenses of 401 West 14th Street (the “Property”), as described in Note A, for the year ended December 31, 2013, and the related notes to the financial statement.
Management’s Responsibility for the Financial Statements
Management is responsible for the preparation and fair presentation of the financial statement in accordance with accounting principles generally accepted in the United States of America; this includes the design, implementation, and maintenance of internal control relevant to the preparation and fair presentation of a financial statement that is free from material misstatement, whether due to fraud or error.
Auditors’ Responsibility
Our responsibility is to express an opinion on the financial statement based on our audit. We conducted our audit in accordance with auditing standards generally accepted in the United States of America. Those standards require that we plan and perform the audit to obtain reasonable assurance about whether the financial statement is free of material misstatement.
An audit involves performing procedures to obtain audit evidence about the amounts and disclosures in the financial statement. The procedures selected depend on the auditors’ judgment, including the assessment of the risks of material misstatement of the financial statement, whether due to fraud or error. In making those risk assessments, the auditor considers internal control relevant to the entity’s preparation and fair presentation of the financial statement in order to design audit procedures that are appropriate in the circumstances, but not for the purpose of expressing an opinion on the effectiveness of the entity’s internal control. Accordingly, we express no such opinion. An audit also includes evaluating the appropriateness of accounting policies used and the reasonableness of significant accounting estimates made by management, as well as evaluating the overall presentation of the financial statement.
We believe that the audit evidence we have obtained is sufficient and appropriate to provide a basis for our audit opinion.
Opinion
In our opinion, the financial statement referred to above presents fairly, in all material respects, the revenues and certain expenses of the Property, as described in Note A, for the year ended December 31, 2013, in conformity with accounting principles generally accepted in the United States of America.
192Prospectus ¡ TIAA Real Estate Account |
Emphasis of Matter
The accompanying statement of revenues and certain expenses was prepared for the purpose of complying with Rule 3-14 of Regulation S-X promulgated by the Securities and Exchange Commission and, as described in Note A, is not intended to be a complete presentation of the Property’s revenues and expenses.

AGH, LLC
March 10, 2014
TIAA Real Estate Account ¡ Prospectus193 |
401 West 14th Street, New York, New York
Statements of revenues and certain expenses
|
|
|
|
|
||||||||||
|
For The |
For The |
||||||||||||
|
||||||||||||||
|
REVENUES |
|
|
|
|
||||||||||
|
Rental income |
|
|
$ |
|
8,500,596 |
|
|
$ |
|
698,714 |
||||
|
Reimbursement income |
|
|
1,265,004 |
|
|
150,735 |
||||||||
|
Other operating income |
|
|
8,729 |
|
|
6,399 |
||||||||
|
||||||||||||||
|
Total revenues |
|
|
9,774,329 |
|
|
855,848 |
||||||||
|
||||||||||||||
|
CERTAIN EXPENSES |
|
|
|
|
||||||||||
|
General and administrative |
|
|
72,220 |
|
|
23,057 |
||||||||
|
Insurance |
|
|
86,209 |
|
|
7,494 |
||||||||
|
Interest expense |
|
|
3,348,398 |
|
|
283,119 |
||||||||
|
Management fees |
|
296,948 |
|
|
26,399 |
|||||||||
|
Real estate taxes |
|
|
1,045,257 |
|
|
117,351 |
||||||||
|
Repairs and maintenance |
|
|
180,016 |
|
|
9,925 |
||||||||
|
Salaries and wages |
|
|
65,237 |
|
|
5,892 |
||||||||
|
Utilities |
|
|
374,057 |
|
|
51,210 |
||||||||
|
||||||||||||||
|
Total certain expenses |
|
|
5,468,342 |
|
|
524,447 |
||||||||
|
||||||||||||||
|
Revenues in Excess of Certain Expenses |
|
|
$ |
|
4,305,987 |
|
|
$ |
|
331,401 |
||||
|
||||||||||||||
Note A—Organization and Basis of Presentation
The statement of revenues and certain expenses (the “financial statement”) for the year ended December 31, 2013 relates to the operations of the Property. The Property, located in New York, New York, consists of 33,489 square feet of office space and 28,710 square feet of multi-story retail and was 100% leased by four tenants as of December 31, 2013 and January 31, 2014, respectively. TIAA-CREF Global Separate Real Estate Company LLC, a subsidiary of TIAA-CREF, purchased a 42.1875% interest in 401 West 14th Street Associates LLC (the “Company”). The Company is the sole member of 401 West 14th Street Mezz LLC (“401 Mezz”). 401 Mezz is the sole member of 401 West 14th Street Fee LLC, which owns the Property.
The accompanying financial statement is presented in conformity with Rule 3-14 of Regulation S-X promulgated by the Securities and Exchange Commission. Accordingly, the financial statement is not representative of the actual operations for the period presented, as certain expenses which may not be comparable to the expenses expected to be incurred in the future operations of the Property have been excluded. Expenses excluded consist of depreciation, amortization, income taxes and certain other expenses not directly related to the future operations of the Property.
The statement of revenues and certain expenses for the period ended January 31, 2014 is unaudited. However, in the opinion of management, all adjustments (consisting solely of normal recurring adjustments) necessary for the fair presentation of this statement of revenues and certain expenses for the
194Prospectus ¡ TIAA Real Estate Account |
See Independent Auditors’ Report |
401 West 14th Street, New York, New York
interim period on the basis described above have been included. The results for such an interim period are not necessarily indicative of the results for the entire year.
Note B—Summary of Significant Accounting Policies
Use of estimates
The preparation of the financial statement in conformity with accounting principles generally accepted in the United States requires management to make estimates and assumptions that affect various amounts reported in the financial statement and accompanying notes. Actual results could differ from those estimates.
Revenue recognition
Rental income from the operating leases, which includes scheduled increases over the lease term, is recognized on a straight-line basis. For the year ended December 31, 2013 and the period ended January 31, 2014, income recognized on a straight-line basis is less than income that would have accrued in accordance with the lease terms by approximately $106,776 and $29,767, respectively.
Note C—Future Rental Income
Available space in the Property is leased to four tenants under non-cancellable operating leases that expire on various dates through January 2023. The leases provide for increases in future minimum rental payments. Also, certain leases require reimbursement of common area maintenance charges, certain operating expenses, and real estate taxes.
The minimum future rental income from these leases as of December 31, 2013 is as follows:
|
|
|
|||||
|
|||||||
|
2014 |
|
|
$ |
|
8,821,914 |
||
|
2015 |
|
|
9,005,492 |
||||
|
2016 |
|
|
9,073,474 |
||||
|
2017 |
|
|
9,242,273 |
||||
|
2018 |
|
|
8,517,379 |
||||
|
Thereafter |
|
|
20,325,055 |
||||
|
|||||||
|
|
$ |
|
64,985,587 |
|||
|
|||||||
Note D—Concentration of Revenue
The Property earned approximately 70% of rental income from two tenants during the year ended December 31, 2013 and the period ended January 31, 2014. The loss of these tenants could have a significant negative impact on the Property’s operations.
See Independent Auditors’ Report |
TIAA Real Estate Account ¡ Prospectus195 |
401 West 14th Street, New York, New York
Note E—Related Party Transactions
The Property is under a property management agreement with an affiliate of certain members of the Company. For the year ended December 31, 2013 and the period ended January 31, 2014, the Company incurred $296,948 and $26,399 in management fees, respectively. The Company also reimbursed the affiliate $65,237 and $5,892 for the cost of salaries and wages incurred by the affiliate in connection with the operation of the Property for the year ended December 31, 2013 and for the period ended January 31, 2014, respectively.
Note F—Interest Expense
The Property is subject to a mortgage note payable and interest rate swap agreement that mature on May 30, 2019. Interest accrues at 3.73% per annum and totaled $3,348,398 for the year ended December 31, 2013 and $283,119 for the period ended January 31, 2014. The note and interest rate swap agreement are considered part of the ongoing operations of the Property and thus, the related interest expense has been included in the financial statement.
Note G—Subsequent Events
Subsequent events have been evaluated through March 10, 2014, the date the financial statement was available for issuance. Management has determined that there are no subsequent events that require disclosure under Financial Accounting Standards Board Accounting Standards Codification Topic 855, Subsequent Events.
196Prospectus ¡ TIAA Real Estate Account |
See Independent Auditors’ Report |
Landover Logistics Center, Landover, Maryland
Independent Auditor’s Report
To the Board of Directors and Stockholders TIAA-CREF Landover Logistics Center
We have audited the accompanying Statement of Revenue and Certain Operating Expenses (the “financial statement”) of Landover Logistics Center located in Landover, MD (the “Property”) for the year ended December 31, 2013, and the related notes to the financial statement.
Management’s Responsibility for the Financial Statement
Management of TIAA-CREF is responsible for the preparation and fair presentation of the financial statement in conformity with U.S. generally accepted accounting principles; this includes the design, implementation, and maintenance of internal control relevant to the preparation and fair presentation of the financial statement that are free from material misstatement, whether due to fraud or error.
Auditor’s Responsibility
Our responsibility is to express an opinion on the financial statement based on our audit. We conducted our audit in accordance with auditing standards generally accepted in the United States of America. Those standards require that we plan and perform the audit to obtain reasonable assurance about whether the financial statement is free of material misstatement.
An audit involves performing procedures to obtain audit evidence about the amounts and disclosures in the financial statement, whether due to fraud or error. In making those risk assessments, the auditor considers internal control relevant to the entity’s preparation and fair presentation of the financial statement in order to design audit procedures that are appropriate in the circumstances, but not for the purpose of expressing an opinion on the effectiveness of the entity’s internal control. Accordingly, we express no such opinion. An audit also includes evaluating the appropriateness of accounting policies used and the reasonableness of significant accounting estimates made by management, as well as evaluating the overall presentation of the financial statement.
We believe that the audit evidence we have obtained is sufficient and appropriate to provide a basis for our audit opinion.
Opinion
In our opinion, the financial statement referred to above presents fairly, in all material respects, the revenue and certain operating expenses described in Note 1 to the financial statement of Landover Logistics Center for the year ended December 31, 2013, in conformity with U.S. generally accepted accounting principles.
TIAA Real Estate Account ¡ Prospectus197 |
Other Matter
As described in Note 1 to the financial statement, the Statement of Revenue and Certain Operating Expenses has been prepared for the purpose of complying with the rules and regulations of the Securities and Exchange Commission for inclusion in registration statements of TIAA Real Estate Account and is not intended to be a complete presentation of the Property’s revenue and expenses. Our opinion is not modified with respect to this matter.

Charlotte, North Carolina
February 12, 2015
198Prospectus ¡ TIAA Real Estate Account |
Landover Logistics Center, Landover, Maryland
Statement of revenue and certain operating expenses
|
|
|
|
|
||||||||||
|
Year Ended |
Period from |
||||||||||||
|
||||||||||||||
|
REVENUE |
|
|
|
|
||||||||||
|
Cell tower revenue |
|
|
$ |
|
26,251 |
|
|
$ |
|
4,153 |
||||
|
||||||||||||||
|
Total revenue |
|
|
26,251 |
|
|
4,153 |
||||||||
|
||||||||||||||
|
CERTAIN OPERATING EXPENSES |
|
|
|
|
||||||||||
|
Repairs and maintenance |
|
|
255 |
|
|
— |
||||||||
|
Real estate taxes |
|
|
222,655 |
|
|
70,730 |
||||||||
|
||||||||||||||
|
Total certain operating expenses |
|
|
222,910 |
|
|
70,730 |
||||||||
|
||||||||||||||
|
Revenue in excess of certain operating expenses |
|
|
$ |
|
(196,659 |
) |
|
|
|
$ |
|
(66,577 |
) |
|
|
||||||||||||||
See Notes to statement of revenue and certain operating expenses
Note 1—Organization and basis of presentation
The accompanying Statement of Revenue and Certain Operating Expenses (the financial statement) for the year ended December 31, 2013 and the two months ended February 28, 2014 (unaudited), relate to the operations of Landover Logistics Center located in Landover, Maryland acquired from CRP DMT Landover, L.L.C., an unaffiliated entity.
The accompanying financial statement was prepared for the purpose of complying with Rule 3-14 of Regulation S-X of the Securities and Exchange Commission for the acquisition of real estate properties. The Statement of Revenue and Certain Operating Expenses is not representative of the actual operations for the periods presented, as certain expenses, which may not be comparable to the expenses expected to be incurred in the future operations of the Property, have been excluded. Expenses excluded generally consist of interest and debt related costs, depreciation and amortization expense, interest income, income taxes and certain other expenses not directly related to the future operations of the Property. Therefore, the Statement of Revenue and Certain Operating Expenses may not be comparable to a statement of operations for Landover Logistics Center after its acquisition by the Company. Except as noted above, management of TIAA-CREF are not aware of any material factors relating to Landover Logistics Center for the year ended December 31, 2013 or the period from January 1, 2014 through February 28, 2014 (unaudited), that would cause the reported financial information not to be indicative of future operating results.
Note 2—Summary of significant accounting policies
Basis of accounting
The Statement of Revenue and Certain Operating Expenses has been prepared using the accrual method of accounting on the basis of presentation described in
See Independent Auditors’ Report |
TIAA Real Estate Account ¡ Prospectus199 |
Landover Logistics Center, Landover, Maryland
Note 1. As such, revenue is recorded when earned and expenses are recognized when incurred.
Revenue recognition
Rental income from the operating lease, which includes scheduled increases over the lease term, is recognized on a straight-line basis. For the year ended December 31, 2013, income recognized on a straight-line basis is greater than income that would have accrued in accordance with the lease terms by approximately $1,293. For the period ended February 28, 2014 income recognized on a straight-line basis is greater than income that would have accrued in accordance with the lease terms by approximately $91.
Property operations
Certain operating expenses represent the direct expenses of operating Landover Logistics Center and consist primarily of repairs and maintenance, utilities, real estate taxes, property insurance, general and administrative and other operating expenses that are expected to continue in the ongoing operation of Landover Logistics Center.
Use of estimates
The preparation of the accompanying Statement of Revenue and Certain Operating Expenses in accordance with the accounting principles generally accepted in the United States requires management of TIAA-CREF to make certain estimates and assumptions that the reported amounts of revenue and certain operating expenses during the reporting periods. Actual results could differ from those estimates.
Note 3—Future rent payments
Approximate minimum future rents required under the cell tower lease in effect at December 31, 2013 are as follows:
|
|
|
|||||
|
|||||||
|
2014 |
|
|
$ |
|
25,707 |
||
|
2015 |
|
|
26,478 |
||||
|
2016 |
|
|
27,347 |
||||
|
2017 |
|
|
28,091 |
||||
|
2018 |
|
|
28,934 |
||||
|
Thereafter |
|
|
259,609 |
||||
|
|||||||
|
Total |
|
|
$ |
|
396,166 |
||
|
|||||||
Note 4—Concentrations
The Property earned 100% of revenue from the cell tower site agreement during the year ended December 31, 2013.
200Prospectus ¡ TIAA Real Estate Account |
See Independent Auditors’ Report |
Landover Logistics Center, Landover, Maryland
Note 5—Subsequent events
Events that occur after December 31, 2013 but before the financial statement was available to be issued must be evaluated for recognition or disclosure. The effects of subsequent events that provide evidence about conditions that existed at December 31, 2013 are recognized in the accompanying financial statement. Subsequent events which provide evidence about conditions that existed after December 31, 2013 require disclosure in the accompanying notes. Management evaluated the activity of the Property through February 12, 2015 (the date the financial statement was available to be issued) and concluded that no subsequent events have occurred that would require recognition in the Statement of Revenue and Certain Operating Expenses and related footnotes.
See Independent Auditors’ Report |
TIAA Real Estate Account ¡ Prospectus201 |
Township Apartments, Redwood City, California
Statement of revenue and certain operating expenses
|
|
|
|||||
|
Three Month |
||||||
|
|||||||
|
REVENUE |
|
|
|||||
|
Net rental revenue |
|
|
$ |
|
114,242 |
||
|
Other |
|
|
4,323 |
||||
|
|||||||
|
Total revenue |
|
|
118,565 |
||||
|
|||||||
|
CERTAIN OPERATING EXPENSES |
|
|
|||||
|
Real estate taxes |
|
|
45,026 |
||||
|
Insurance |
|
|
20,962 |
||||
|
Utilities |
|
|
2,437 |
||||
|
Repairs and maintenance |
|
|
33,840 |
||||
|
Property operating expenses |
|
|
122,993 |
||||
|
Management fees |
|
|
13,800 |
||||
|
|||||||
|
Total certain operating expenses |
|
|
239,058 |
||||
|
|||||||
|
Excess of certain operating expenses over Revenue |
|
|
$ |
|
(120,493 |
) |
|
|
|||||||
Notes to statement of revenue and certain operating expenses
Three month period ended March 31, 2014
Note 1—Organization and Basis of Presentation
The accompanying Statement of Revenue and Certain Operating Expenses for the three month period ending March 31, 2014, relates to the operations of Township Apartments located in Redwood City, California. The accompanying Statement of Revenue and Certain Operating Expenses was prepared for the purpose of complying with Rule 3-14 of Regulation S-X of the Securities and Exchange Commission for the acquisition of real estate properties. The Statement of Revenue and Certain Operating Expenses is not representative of the actual operations for the period presented, as certain operating expenses, which may not be comparable to the expenses to be incurred in the future operations of the Property, have been excluded. Expenses excluded generally consist of interest and debt related costs, depreciated and amortization expense, interest income, income taxes and certain other expenses not directly related to the future operations of the Property. Therefore, the Statement of Revenue and Certain Operating Expenses may not be comparable to a statement of operations for Township Apartments after its acquisition by the Company. Except as noted above, management of the Sellers of Township Apartments are not aware of any material factors relating to Township Apartments for the three month period ending March 31, 2014 that would cause the reported financial information not to be indicative of future operating results.
202Prospectus ¡ TIAA Real Estate Account |
See Independent Auditors’ Report |
Township Apartments, Redwood City, California
Note 2—Summary of Significant Accounting Policies
Basis of accounting
The Statement of Revenue and Certain Operating Expenses has been prepared using the accrual method of accounting on the basis of presentation described in Note 1. As such, revenue is recorded when earned and expenses are recognized when incurred.
Property operations
Certain operating expenses represent the direct expenses of operating Township Apartments and consist primarily of repairs and maintenance, utilities, real estate taxes, property insurance, general and administrative and other operating expenses that are expected to continue in the ongoing operation of Township Apartments.
Use of estimates
The preparation of the accompanying Statement of Revenue and Certain Operating Expenses in accordance with the accounting principles generally accepted in the United States requires management of the Sellers of Township Apartments to make certain estimates and assumptions that the reported amounts of revenue and certain expenses during the reporting period. Actual results could differ from those estimates.
Note 3—Management Fee
The Property was charged a monthly management fee of $4,600.
Note 4—Subsequent Events
Events that occur after March 31, 2014 but before the Statement of Revenue and Certain Operating Expenses was available to be issued must be evaluated for recognition or disclosure. The effects of subsequent events that provide evidence about conditions that existed at March 31, 2014 are recognized in the accompanying Statement of Revenue and Certain Operating Expenses. Subsequent events which provide evidence about conditions that existed after March 31, 2014 require disclosure in the accompanying notes. Management evaluated the activity of the Property through February 3, 2015 (the date the Statement of Revenue and Certain Operating Expenses was available to be issued) and concluded that no subsequent events have occurred that would require recognition in the Statement of Revenue and Certain Operating Expenses or disclosure in the Notes to Statement of Revenue and Certain Operating Expenses.
See Independent Auditors’ Report |
TIAA Real Estate Account ¡ Prospectus203 |
200 Middlefield Road, Menlo Park, California
Independent auditors’ report
To the Management of Teachers Insurance and Annuity Association of America
We have audited the accompanying statement of revenues and certain expenses of 200 Middlefield Road (the “Property”), as described in Note A, for the year ended December 31, 2013, and the related notes to the financial statement.
Management’s Responsibility for the Financial Statement
Management is responsible for the preparation and fair presentation of the financial statement in accordance with accounting principles generally accepted in the United States of America; this includes the design, implementation, and maintenance of internal control relevant to the preparation and fair presentation of a financial statement that is free from material misstatement, whether due to fraud or error.
Auditors’ Responsibility
Our responsibility is to express an opinion on the financial statement based on our audit. We conducted our audit in accordance with auditing standards generally accepted in the United States of America. Those standards require that we plan and perform the audit to obtain reasonable assurance about whether the financial statement is free of material misstatement.
An audit involves performing procedures to obtain audit evidence about the amounts and disclosures in the financial statement. The procedures selected depend on the auditors’ judgment, including the assessment of the risks of material misstatement of the financial statement, whether due to fraud or error. In making those risk assessments, the auditor considers internal control relevant to the entity’s preparation and fair presentation of the financial statement in order to design audit procedures that are appropriate in the circumstances, but not for the purpose of expressing an opinion on the effectiveness of the entity’s internal control. Accordingly, we express no such opinion. An audit also includes evaluating the appropriateness of accounting policies used and the reasonableness of significant accounting estimates made by management, as well as evaluating the overall presentation of the financial statement.
We believe that the audit evidence we have obtained is sufficient and appropriate to provide a basis for our audit opinion.
Opinion
In our opinion, the financial statement referred to above presents fairly, in all material respects, the revenues and certain expenses of the Property, as described in Note A, for the year ended December 31, 2013, in conformity with accounting principles generally accepted in the United States of America.
204Prospectus ¡ TIAA Real Estate Account |
Emphasis of Matter
The accompanying statement of revenues and certain expenses was prepared for the purpose of complying with Rule 3-14 of Regulation S-X promulgated by the Securities and Exchange Commission and, as described in Note A, is not intended to be a complete presentation of the Property’s revenues and expenses.
AGH, LLC
June 4, 2014
TIAA Real Estate Account ¡ Prospectus205 |
200 Middlefield Road, Menlo Park, California
Statements of revenues and certain expenses
|
|
|
|
|
||||||||||
|
For The |
For The |
||||||||||||
|
||||||||||||||
|
REVENUES |
|
|
|
|
||||||||||
|
Rental income |
|
|
$ |
|
1,797,379 |
|
|
$ |
|
463,212 |
||||
|
Reimbursement income |
|
|
273,039 |
|
|
71,630 |
||||||||
|
||||||||||||||
|
Total revenues |
|
|
2,070,418 |
|
|
534,842 |
||||||||
|
||||||||||||||
|
CERTAIN EXPENSES |
|
|
|
|
||||||||||
|
Cleaning |
|
|
8,737 |
|
|
1,755 |
||||||||
|
Insurance |
|
|
81,137 |
|
|
22,411 |
||||||||
|
Management fees |
|
|
59,133 |
|
|
22,689 |
||||||||
|
Real estate taxes |
|
|
324,995 |
|
|
57,118 |
||||||||
|
Repairs and maintenance |
|
|
53,992 |
|
|
13,865 |
||||||||
|
Utilities |
|
|
70,095 |
|
|
12,439 |
||||||||
|
||||||||||||||
|
Total certain expenses |
|
|
598,089 |
|
|
130,277 |
||||||||
|
||||||||||||||
|
Revenues in Excess of Certain Expenses |
|
|
$ |
|
1,472,329 |
|
|
$ |
|
404,565 |
||||
|
||||||||||||||
See Independent Auditors’ Report and Accompanying Notes
Notes to statements of revenues and certain expenses
Note A—Organization and Basis of Presentation
The statement of revenues and certain expenses (the “financial statement”) for the year ended December 31, 2013 relates to the operations of the Property. The Property, located in Menlo Park, California, consists of 41,933 square feet of office space which was 100% committed to four tenants as of December 31, 2013 and March 31, 2014 under fully executed lease agreements. As of December 31, 2013 one tenant occupied 53% of the space at the Property and as of March 31, 2014, two tenants occupied 65% of the space at the Property. The remaining tenant leases will commence at various dates in 2014 upon completion of their respective tenant improvements during 2014.
The accompanying financial statement is presented in conformity with Rule 3-14 of Regulation S-X promulgated by the Securities and Exchange Commission. Accordingly, the financial statement is not representative of the actual operations for the period presented, as certain expenses which may not be comparable to the expenses expected to be incurred in the future operations of the Property have been excluded. Expenses excluded consist of depreciation, amortization, income taxes and certain other expenses not directly related to the future operations of the Property.
The statement of revenues and certain expenses for the period ended March 31, 2014 is unaudited. However, in the opinion of management, all adjustments (consisting solely of normal recurring adjustments) necessary for the fair presentation of this statement of revenues and certain expenses for the interim period on the basis described above have been included. The results for such an interim period are not necessarily indicative of the results for the entire year.
206Prospectus ¡ TIAA Real Estate Account |
See Independent Auditors’ Report |
200 Middlefield Road, Menlo Park, California
Note B—Summary of Significant Accounting Policies
Use of estimates
The preparation of the financial statement in conformity with accounting principles generally accepted in the United States requires management to make estimates and assumptions that affect various amounts reported in the financial statement and accompanying notes. Actual results could differ from those estimates.
Revenue recognition
Rental income from the operating leases, which includes scheduled increases over the lease term, is recognized on a straight-line basis. For the year ended December 31, 2013 and the period ended March 31, 2014, income recognized on a straight-line basis is more than income that would have accrued in accordance with the lease terms by approximately $592,084 and $61,448, respectively.
Note C—Future Rental Income
Available space at the Property is leased to four tenants under non-cancellable operating leases that expire on various dates through March 2023. The leases provide for increases in future minimum rental payments. Also, certain leases require reimbursement of common area maintenance charges, certain operating expenses, and real estate taxes.
The minimum future rental income from these leases as of December 31, 2013 is as follows:
|
|
|
|||||
|
|||||||
|
2014 |
|
|
$ |
|
2,461,454 |
||
|
2015 |
|
|
2,991,432 |
||||
|
2016 |
|
|
3,081,175 |
||||
|
2017 |
|
|
3,173,610 |
||||
|
2018 |
|
|
3,268,819 |
||||
|
Thereafter |
|
|
11,249,803 |
||||
|
|||||||
|
|
$ |
|
26,226,293 |
|||
|
|||||||
Note D—Concentration of Revenue
The Property earned 100% of rental income from one tenant during the year ended December 31, 2013 and 97% from one tenant during the period ended March 31, 2014. The loss of this tenant could have a significant negative impact on the Property’s operations.
Note E—Related Party Transactions
The Property is under a property management agreement with an affiliate of the Property’s owner. For the year ended December 31, 2013 and the period
See Independent Auditors’ Report |
TIAA Real Estate Account ¡ Prospectus207 |
200 Middlefield Road, Menlo Park, California
ended March 31, 2014, the Company incurred $59,133 and $22,689 in management fees, respectively.
Note F—Subsequent Events
Subsequent events have been evaluated through June 4, 2014, the date the financial statement was available for issuance. Management has determined that there are no subsequent events that require disclosure under Financial Accounting Standards Board Accounting Standards Codification Topic 855, Subsequent Events.
208Prospectus ¡ TIAA Real Estate Account |
See Independent Auditors’ Report |
55 Second Street, San Francisco, California
Independent auditors’ report
To the Board of Directors and Stockholders TIAA-CREF, Inc.
We have audited the accompanying statement of revenues and certain direct operating expenses of 55 Second Street, San Francisco, California (the “Property”) for the year ended December 31, 2013, and the related notes to this statement.
Management’s Responsibility for the Statement
Management is responsible for the preparation and fair presentation of this statement of revenues and certain direct operating expenses in accordance with accounting principles generally accepted in the United States of America; this includes the design, implementation and maintenance of internal control relevant to the preparation and fair presentation of this statement of revenues and certain direct operating expenses that is free from material misstatement, whether due to fraud or error.
Auditors’ Responsibility
Our responsibility is to express an opinion on the statement of revenues and certain direct operating expenses for the year ended December 31, 2013, based on our audit. We conducted our audit in accordance with auditing standards generally accepted in the United States of America. Those standards require that we plan and perform the audit to obtain reasonable assurance about whether the 2013 statement of revenues and certain direct operating expenses is free from material misstatement.
An audit involves performing procedures to obtain audit evidence about the amounts and disclosures in the statement of revenues and certain direct operating expenses. The procedures selected depend on the auditor’s judgment, including the assessment of the risks of material misstatement of the statement of revenues and certain direct operating expenses, whether due to fraud or error. In making those risk assessments, the auditor considers internal control relevant to the entity’s preparation and fair presentation of the statement of revenues and certain direct operating expenses in order to design audit procedures that are appropriate in the circumstances, but not for the purpose of expressing an opinion on the effectiveness of the entity’s internal control. Accordingly, we express no such opinion. An audit also includes evaluating the appropriateness of accounting policies used and the reasonableness of significant accounting estimates made by management, as well as evaluating the overall presentation of the statement of revenues and certain direct operating expenses.
We believe that the audit evidence we have obtained is sufficient and appropriate to provide a basis for our audit opinion.
TIAA Real Estate Account ¡ Prospectus209 |
Opinion
In our opinion, the statement referred to above presents fairly, in all material respects, the revenues and certain direct operating expenses of the Property described in Note 1 to the statement for the year ended December 31, 2013, in conformity with accounting principles generally accepted in the United States of America.
Basis of Accounting
As described in Note 1, the statement of revenues and certain direct operating expenses has been prepared for the purpose of complying with the rules and regulations of the Securities and Exchange Commission for inclusion in the Registration Statement on Form S-1 of the TIAA Real Estate Account and is not intended to be a complete presentation of the Property’s revenues and expenses. Our opinion is not modified with respect to that matter.

October 20, 2014
210Prospectus ¡ TIAA Real Estate Account |
55 Second Street, San Francisco, California
Statements of revenues and certain direct operating expenses
|
|
|
|
|
||||||||||
|
Year Ended |
Three Months |
||||||||||||
|
||||||||||||||
|
REVENUES |
|
|
|
|
||||||||||
|
Rental income |
|
|
$ |
|
11,166,627 |
|
|
$ |
|
3,319,862 |
||||
|
Expense reimbursement revenue |
|
|
4,716,774 |
|
|
1,154,546 |
||||||||
|
Parking income - net |
|
|
277,104 |
|
|
53,484 |
||||||||
|
Other income |
|
|
74,765 |
|
|
19,538 |
||||||||
|
||||||||||||||
|
|
|
|
16,235,270 |
|
|
4,547,430 |
||||||||
|
||||||||||||||
|
CERTAIN DIRECT OPERATING EXPENSES |
|
|
|
|
||||||||||
|
Administrative |
|
|
285,450 |
|
|
57,846 |
||||||||
|
Payroll |
|
|
861,761 |
|
|
224,364 |
||||||||
|
Cleaning expense |
|
|
1,142,476 |
|
|
283,111 |
||||||||
|
Utilities |
|
|
575,747 |
|
|
90,751 |
||||||||
|
Repairs and maintenance |
|
|
361,381 |
|
|
88,966 |
||||||||
|
Security |
|
|
390,616 |
|
|
97,107 |
||||||||
|
Insurance |
|
|
470,242 |
|
|
117,861 |
||||||||
|
Real estate taxes |
|
|
1,936,606 |
|
|
492,803 |
||||||||
|
Management fees |
|
|
389,134 |
|
|
94,849 |
||||||||
|
||||||||||||||
|
|
6,413,413 |
|
|
1,547,658 |
|||||||||
|
||||||||||||||
|
Revenues in excess of certain direct operating expenses |
|
|
$ |
|
9,821,857 |
|
|
$ |
|
2,999,772 |
||||
|
||||||||||||||
See accompanying notes to the statements.
Notes to statements of revenues and certain direct operating expenses
1—Organization and Basis of Presentation
The statements of revenues and certain direct operating expenses relate to the operations of 55 Second Street, San Francisco, California (the “Property”). The Property consists of a 25-story, 379,328-square-foot office tower and is 97% occupied as of December 31, 2013.
The accompanying statements of revenues and certain direct operating expenses are presented in accordance with Rule 3-14 of Regulation S-X promulgated under the Securities Act of 1933, as amended. Accordingly, the statements are not representative of the actual operations for the periods presented, as revenues and certain direct operating expenses, which may not be directly attributable to the revenues and expenses expected to be incurred in the future operations of the Property, have been excluded. Such items include depreciation, amortization and interest expense.
The statement of revenues and certain direct operating expenses for the three months ended March 31, 2014 is condensed. However, in the opinion of management, all adjustments (consisting solely of normal recurring adjustments) necessary for the fair presentation of revenues and certain direct operating expenses for the interim period on the basis described above have been
See Independent Auditors’ Report |
TIAA Real Estate Account ¡ Prospectus211 |
55 Second Street, San Francisco, California
included. The results for such an interim period are not necessarily indicative of the results for the entire year.
2—Summary of Significant Accounting Policies
Use of estimates
The preparation of a statement of revenues and certain direct operating expenses in conformity with accounting principles generally accepted in the United States of America requires management to make estimates and assumptions that affect various amounts reported in the statement and accompanying notes. Actual results could differ from those estimates.
Revenue recognition
Leases are classified as operating leases. Scheduled rent increases are recognized on a straight-line basis over the lease terms.
Subsequent events
Subsequent events were evaluated through October 20, 2014, the date the statements of revenues and certain direct operating expenses were available to be issued.
3—Related Party Transactions
The Property is managed by an affiliate of one of the owners of the Property. For the year ended December 31, 2013, the Property reimbursed the affiliate $835,862 for salaries and wages and other overhead costs.
4—Operating Leases
Space in the Property is leased to tenants under various operating leases. Most of these agreements include renewal options and provisions for additional rent based on property taxes and common area maintenance. Included in rental income for the year ended December 31, 2013 is a straight-line rent payable adjustment of $163,593. Included in rental income for the three months ended March 31, 2014 is a straight-line rent receivable adjustment of $395,980.
212Prospectus ¡ TIAA Real Estate Account |
See Independent Auditors’ Report |
55 Second Street, San Francisco, California
Approximate minimum future rents due under the operating leases are as follows:
|
|
|
|||||
Year Ending |
|||||||
|
|||||||
|
2014 |
|
|
$ |
|
11,475,000 |
||
|
2015 |
|
|
10,680,000 |
||||
|
2016 |
|
|
11,020,000 |
||||
|
2017 |
|
|
6,965,000 |
||||
|
2018 |
|
|
5,807,000 |
||||
|
Thereafter |
|
|
32,128,000 |
||||
|
|||||||
|
|
$ |
|
78,075,000 |
|||
|
|||||||
During the year ended December 31, 2013, two tenants accounted for approximately 33% and 31% of rental income.
5—Contingency
The Property’s previous owner was named in a property encroachment litigation claim by the owner of an adjacent building. This claim was dismissed by the court on statute of limitations grounds and is subject to appeal. In addition, the owner of the adjacent building claims that the property encroachment is a continuing nuisance, causing excess rainwater runoff onto his property. This is an ongoing claim and is pending. As successor property owner, the TIAA Real Estate Account will likely be named in the continuing nuisance litigation. While the resolution of this matter cannot be predicted with certainty, management believes the final outcome of such matter will not have a material, adverse effect on the Property or to the TIAA Real Estate Account.
See Independent Auditors’ Report |
TIAA Real Estate Account ¡ Prospectus213 |
The Louis at 14th, Washington, D.C.
Independent auditors’ report
To the Management of Teachers Insurance and Annuity Association of America
We have audited the accompanying statement of revenues and certain expenses of Louis at 14th (the “Property”), as described in Note A, for the year ended December 31, 2013, and the related notes to the financial statement.
Management’s Responsibility for the Financial Statements
Management is responsible for the preparation and fair presentation of the financial statement in accordance with accounting principles generally accepted in the United States of America; this includes the design, implementation, and maintenance of internal control relevant to the preparation and fair presentation of a financial statement that is free from material misstatement, whether due to fraud or error.
Auditors’ Responsibility
Our responsibility is to express an opinion on the financial statement based on our audit. We conducted our audit in accordance with auditing standards generally accepted in the United States of America. Those standards require that we plan and perform the audit to obtain reasonable assurance about whether the financial statement is free of material misstatement.
An audit involves performing procedures to obtain audit evidence about the amounts and disclosures in the financial statement. The procedures selected depend on the auditors’ judgment, including the assessment of the risks of material misstatement of the financial statement, whether due to fraud or error. In making those risk assessments, the auditor considers internal control relevant to the entity’s preparation and fair presentation of the financial statement in order to design audit procedures that are appropriate in the circumstances, but not for the purpose of expressing an opinion on the effectiveness of the entity’s internal control. Accordingly, we express no such opinion. An audit also includes evaluating the appropriateness of accounting policies used and the reasonableness of significant accounting estimates made by management, as well as evaluating the overall presentation of the financial statement.
We believe that the audit evidence we have obtained is sufficient and appropriate to provide a basis for our audit opinion.
Opinion
In our opinion, the financial statement referred to above presents fairly, in all material respects, the revenues and certain expenses of the Property, as described in Note A, for the year ended December 31, 2013, in conformity with accounting principles generally accepted in the United States of America.
214Prospectus ¡ TIAA Real Estate Account |
Emphasis of Matter
The accompanying statement of revenues and certain expenses was prepared for the purpose of complying with Rule 3-14 of Regulation S-X promulgated by the Securities and Exchange Commission and, as described in Note A, is not intended to be a complete presentation of the Property’s revenues and expenses.
AGH, LLC
September 8, 2014
TIAA Real Estate Account ¡ Prospectus215 |
The Louis at 14th, Washington, D.C.
Statements of revenues and certain expenses
|
|
|
|
|
||||||||||
|
For The |
For The |
||||||||||||
|
||||||||||||||
|
REVENUES |
|
|
|
|
||||||||||
|
Rental income |
|
|
$ |
|
125,052 |
|
|
$ |
|
105,916 |
||||
|
Reimbursement income |
|
|
15,448 |
|
|
12,108 |
||||||||
|
||||||||||||||
|
Total revenues |
|
|
140,500 |
|
|
118,024 |
||||||||
|
||||||||||||||
|
CERTAIN EXPENSES |
|
|
|
|
||||||||||
|
General and administrative |
|
|
5,937 |
|
|
12,781 |
||||||||
|
Ground rent |
|
|
21,140 |
|
|
30,186 |
||||||||
|
Management fees |
|
|
42,000 |
|
|
14,000 |
||||||||
|
Real estate taxes |
|
|
16,080 |
|
|
9,703 |
||||||||
|
Repairs and maintenance |
|
|
22,998 |
|
|
25,448 |
||||||||
|
Utilities |
|
|
4,538 |
|
|
6,123 |
||||||||
|
||||||||||||||
|
Total certain expenses |
|
|
112,693 |
|
|
98,241 |
||||||||
|
||||||||||||||
|
Revenues in Excess of Certain Expenses |
|
|
$ |
|
27,807 |
|
|
$ |
|
19,783 |
||||
|
||||||||||||||
See Independent Auditors’ Report and Accompanying Notes
Notes to statements of revenues and certain expenses
Note A—Organization and Basis of Presentation
Louis at 14th (the “Property”), located in Washington, D.C., commenced development in 2013 and was substantially complete on May 9, 2014 consisting of 43,641 square feet of retail space and 184,128 square feet of residential space. None of the Property’s residential space was occupied and the Property’s retail space was 13% and 48% occupied as of December 31, 2013 and April 30, 2014, respectively. The statements of revenues and certain expenses (the “financial statements”) for the year ended December 31, 2013 and for the period from January 1, 2014 to April 30, 2014 relate to the retail operations of the Property.
The accompanying financial statements are presented in conformity with Rule 3-14 of Regulation S-X promulgated by the Securities and Exchange Commission. Accordingly, the financial statements are not representative of the actual operations for the periods presented, as certain expenses which may not be comparable to the expenses expected to be incurred in the future operations of the Property have been excluded. Expenses excluded consist of depreciation, amortization, income taxes, expenses capitalized to construction in progress, ground rent escalations extending beyond the existing retail tenants’ lease terms, and certain other expenses not directly related to the future operations of the Property.
The statement of revenues and certain expenses for the period from January 1, 2014 to April 30, 2014 is unaudited. However, in the opinion of management, all adjustments (consisting solely of normal recurring adjustments)
216Prospectus ¡ TIAA Real Estate Account |
See Independent Auditors’ Report |
The Louis at 14th, Washington, D.C.
necessary for the fair presentation of this statement of revenues and certain expenses for the interim period on the basis described above have been included. The results for such an interim period are not necessarily indicative of the results for the entire year.
Note B—Summary of Significant Accounting Policies
Use of estimates
The preparation of the financial statement in conformity with accounting principles generally accepted in the United States requires management to make estimates and assumptions that affect various amounts reported in the financial statement and accompanying notes. Actual results could differ from those estimates.
Revenue recognition
Rental income from the retail leases, which includes scheduled increases over the lease term, is recognized on a straight-line basis. For the year ended December 31, 2013 income recognized on a straight-line basis is $10,498 greater than income that would have accrued in accordance with the lease payment terms. For the period from January 1, 2014 to April 30, 2014, income recognized on a straight-line basis is $10,670 (unaudited) greater than income that would have accrued in accordance with the lease payment terms.
Note C—Future Rental Payments
Available retail space in the Property is leased to several tenants under non-cancellable operating leases, which began and that expire on various dates through July 2024. The leases provide for increases in future minimum rental payments. Also, certain leases require reimbursement of common area maintenance charges, certain operating expenses, and real estate taxes.
The minimum future rental payments from these leases as of December 31, 2013 are as follows:
|
|
|
|||||
|
|||||||
|
2014 |
|
|
$ |
|
1,129,275 |
||
|
2015 |
|
|
1,754,235 |
||||
|
2016 |
|
|
1,774,195 |
||||
|
2017 |
|
|
1,792,979 |
||||
|
2018 |
|
|
1,810,606 |
||||
|
Thereafter |
|
|
10,599,348 |
||||
|
|||||||
|
|
$ |
|
18,860,638 |
|||
|
|||||||
Note D—Ground Lease
A portion of the land on which the Property is situated is subject to a ground lease with escalating rent payments through the lease expiration on October 31, 2109. Ground rent expense at December 31, 2013 was allocated to the Property
See Independent Auditors’ Report |
TIAA Real Estate Account ¡ Prospectus217 |
The Louis at 14th, Washington, D.C.
based on the Property’s occupancy percentage multiplied by the total straight-line ground rent expense incurred during the period in which the retail tenants’ income lease terms were effective.
The minimum future rental expense from this lease as of December 31, 2013 is as follows:
|
|
|
|||||
|
|||||||
|
2014 |
|
|
$ |
|
905,335 |
||
|
2015 |
|
|
1,090,634 |
||||
|
2016 |
|
|
1,130,397 |
||||
|
2017 |
|
|
1,164,309 |
||||
|
2018 |
|
|
1,199,239 |
||||
|
Thereafter |
|
|
419,703,338 |
||||
|
|||||||
|
|
$ |
|
425,193,252 |
|||
|
|||||||
Note E—Subsequent Events
Subsequent events have been evaluated through September 8, 2014, the date the financial statement was available for issuance. Management has identified the following subsequent event that requires disclosure under Financial Accounting Standards Board Accounting Standards Codification Topic 855, Subsequent Events:
Construction of the Property was substantially complete on May 9, 2014.
218Prospectus ¡ TIAA Real Estate Account |
See Independent Auditors’ Report |
Plaza America, Reston, Virginia
Independent auditors’ report
To the Board of Directors and Stockholders TIAA-CREF, Inc.
We have audited the accompanying statement of revenues and certain direct operating expenses of The Plaza America Shopping Center, Reston, Virginia (the “Property”) for the year ended December 31, 2013, and the related notes to this statement.
Management’s Responsibility for the Statement
Management is responsible for the preparation and fair presentation of this statement of revenues and certain direct operating expenses in accordance with accounting principles generally accepted in the United States of America; this includes the design, implementation and maintenance of internal control relevant to the preparation and fair presentation of this statement of revenues and certain direct operating expenses that is free from material misstatement, whether due to fraud or error.
Auditors’ Responsibility
Our responsibility is to express an opinion on the statement of revenues and certain direct operating expenses for the year ended December 31, 2013, based on our audit. We conducted our audit in accordance with auditing standards generally accepted in the United States of America. Those standards require that we plan and perform the audit to obtain reasonable assurance about whether the 2013 statement of revenues and certain direct operating expenses is free from material misstatement.
An audit involves performing procedures to obtain audit evidence about the amounts and disclosures in the statement of revenues and certain direct operating expenses. The procedures selected depend on the auditor’s judgment, including the assessment of the risks of material misstatement of the statement of revenues and certain direct operating expenses, whether due to fraud or error. In making those risk assessments, the auditor considers internal control relevant to the entity’s preparation and fair presentation of the statement of revenues and certain direct operating expenses in order to design audit procedures that are appropriate in the circumstances, but not for the purpose of expressing an opinion on the effectiveness of the entity’s internal control. Accordingly, we express no such opinion. An audit also includes evaluating the appropriateness of accounting policies used and the reasonableness of significant accounting estimates made by management, as well as evaluating the overall presentation of the statement of revenues and certain direct operating expenses.
We believe that the audit evidence we have obtained is sufficient and appropriate to provide a basis for our audit opinion.
TIAA Real Estate Account ¡ Prospectus219 |
Opinion
In our opinion, the statement referred to above presents fairly, in all material respects, the revenues and certain direct operating expenses of the Property described in Note 1 to the statement for the year ended December 31, 2013, in conformity with accounting principles generally accepted in the United States of America.
Basis of Accounting
As described in Note 1, the statement of revenues and certain direct operating expenses has been prepared for the purpose of complying with the rules and regulations of the Securities and Exchange Commission for inclusion in the Registration Statement on Form S-1 of the TIAA Real Estate Account and is not intended to be a complete presentation of the Property’s revenues and expenses. Our opinion is not modified with respect to that matter.
October 20, 2014
220Prospectus ¡ TIAA Real Estate Account |
Plaza America, Reston, Virginia
Statements of revenues and certain direct operating expenses
|
|
|
|
|
||||||||||
|
For The |
For The |
||||||||||||
|
||||||||||||||
|
REVENUES |
|
|
|
|
||||||||||
|
Rental income |
|
|
$ |
|
4,719,877 |
|
|
$ |
|
1,042,404 |
||||
|
Percentage rent income |
|
|
275,101 |
|
|
— |
||||||||
|
Expense reimbursement revenue |
|
|
1,504,400 |
|
|
273,942 |
||||||||
|
Other income |
|
|
5,337 |
|
|
17,090 |
||||||||
|
||||||||||||||
|
|
|
|
6,504,715 |
|
|
1,333,436 |
||||||||
|
||||||||||||||
|
CERTAIN DIRECT OPERATING EXPENSES |
|
|
|
|
||||||||||
|
Management fees |
|
|
195,163 |
|
|
48,176 |
||||||||
|
Administrative expenses |
|
|
81,080 |
|
|
29,863 |
||||||||
|
Utilities |
|
|
32,627 |
|
|
9,491 |
||||||||
|
Grounds and landscaping |
|
|
118,417 |
|
|
32,396 |
||||||||
|
Payroll |
|
|
66,902 |
|
|
17,480 |
||||||||
|
Repairs and maintenance |
|
|
412,070 |
|
|
161,776 |
||||||||
|
Insurance |
|
|
21,107 |
|
|
5,355 |
||||||||
|
Real estate taxes |
|
|
750,802 |
|
|
197,085 |
||||||||
|
||||||||||||||
|
|
|
|
1,678,168 |
|
|
501,622 |
||||||||
|
||||||||||||||
|
Revenues in excess of certain direct operating expenses |
|
|
$ |
|
4,826,547 |
|
|
$ |
|
831,814 |
||||
|
||||||||||||||
See accompanying notes to the statements.
Notes to statements of revenues and certain direct operating expenses
1—Organization and Basis of Presentation
The statements of revenues and certain direct operating expenses relate to the operations of The Plaza America Shopping Center, located at 11610-11694 Plaza America Drive, Reston, Virginia (the “Property”). The Property consists of a 164,398 square foot open air retail shopping center and is 93% occupied at December 31, 2013 and March 31, 2014.
The accompanying statements of revenues and certain direct operating expenses are presented in accordance with Rule 3-14 of Regulation S-X promulgated under the Securities Act of 1933, as amended. Accordingly, the statements are not representative of the actual operations for the periods presented, as revenues and certain direct operating expenses, which may not be directly attributable to the revenues and expenses expected to be incurred in the future operations of the Property, have been excluded. Such items include depreciation, amortization, interest expense and income taxes.
The statement of revenues and certain direct operating expenses for the three months ended March 31, 2014 is condensed. However, in the opinion of management, all adjustments (consisting solely of normal recurring adjustments) necessary for the fair presentation of revenues and certain direct operating expenses for the interim period on the basis described above have been
See Independent Auditors’ Report |
TIAA Real Estate Account ¡ Prospectus221 |
Plaza America, Reston, Virginia
included. The results for such an interim period are not necessarily indicative of the results for the entire year.
2—Summary of Significant Accounting Policies
Use of estimates
The preparation of a statement of revenues and certain direct operating expenses in conformity with accounting principles generally accepted in the United States of America requires management to make estimates and assumptions that affect various amounts reported in the statement and accompanying notes. Actual results could differ from those estimates.
Revenue recognition
Leases are classified as operating leases. Scheduled rent increases and deferred rent concessions are recognized on a straight-line basis over the lease terms.
Subsequent events
Subsequent events were evaluated through October 20, 2014, the date the statements of revenues and certain direct operating expenses were available to be issued.
3—Related Party Transactions
The Property is managed by an affiliate of one of its owners. Pursuant to the agreement between the parties, the affiliate is entitled to receive an annual management fee of three percent of gross operating revenue, as defined in the agreement. For the year ended December 31, 2013 and for the three months ended March 31, 2014, the Property incurred $195,163 and $48,176, respectively, of management fees to this affiliate.
In addition, the affiliate is entitled to receive a leasing override fee for services provided to acquire new tenant leases, or to renew or expand current tenant leases, not to exceed a term of ten years. The affiliate receives one percent of the gross rentals from such leases, as defined in the agreement. Leasing override fees are deferred and amortized over the life of the lease.
4—Operating Leases
Space in the Property is leased to tenants under various noncancelable operating leases. Most of these agreements include renewal options and provisions for additional rent based on property taxes and common area maintenance. Included in rental income for the year ended December 31, 2013 and for the three months ended March 31, 2014 is a straight-line rent receivable adjustment of $128,206 and $28,168, respectively.
222Prospectus ¡ TIAA Real Estate Account |
See Independent Auditors’ Report |
Plaza America, Reston, Virginia
Approximate minimum future rents due under the retail leases are as follows:
|
|
|
|||||
Year Ending |
|
|
|||||
|
|||||||
|
2014 |
|
|
$ |
|
4,441,000 |
||
|
2015 |
|
|
4,369,000 |
||||
|
2016 |
|
|
3,586,000 |
||||
|
2017 |
|
|
3,040,000 |
||||
|
2018 |
|
|
3,021,000 |
||||
|
Thereafter |
|
|
14,405,000 |
||||
|
|||||||
|
|
$ |
|
32,862,000 |
|||
|
|||||||
See Independent Auditors’ Report |
TIAA Real Estate Account ¡ Prospectus223 |
Northwest Houston Industrial Portfolio,
Houston, Texas
Independent auditors’ report
To the Management of Teachers Insurance and Annuity Association of America
We have audited the accompanying statement of revenues and certain expenses of Northwest Houston Industrial Portfolio (the “Property”), as described in Note A, for the year ended December 31, 2013, and the related notes to the financial statement.
Management’s Responsibility for the Financial Statements
Management is responsible for the preparation and fair presentation of the financial statement in accordance with accounting principles generally accepted in the United States of America; this includes the design, implementation, and maintenance of internal control relevant to the preparation and fair presentation of a financial statement that is free from material misstatement, whether due to fraud or error.
Auditors’ Responsibility
Our responsibility is to express an opinion on the financial statement based on our audit. We conducted our audit in accordance with auditing standards generally accepted in the United States of America. Those standards require that we plan and perform the audit to obtain reasonable assurance about whether the financial statement is free of material misstatement.
An audit involves performing procedures to obtain audit evidence about the amounts and disclosures in the financial statement. The procedures selected depend on the auditors’ judgment, including the assessment of the risks of material misstatement of the financial statement, whether due to fraud or error. In making those risk assessments, the auditor considers internal control relevant to the entity’s preparation and fair presentation of the financial statement in order to design audit procedures that are appropriate in the circumstances, but not for the purpose of expressing an opinion on the effectiveness of the entity’s internal control. Accordingly, we express no such opinion. An audit also includes evaluating the appropriateness of accounting policies used and the reasonableness of significant accounting estimates made by management, as well as evaluating the overall presentation of the financial statement.
We believe that the audit evidence we have obtained is sufficient and appropriate to provide a basis for our audit opinion.
Opinion
In our opinion, the financial statement referred to above presents fairly, in all material respects, the revenues and certain expenses of the Property, as
224Prospectus ¡ TIAA Real Estate Account |
described in Note A, for the year ended December 31, 2013, in conformity with accounting principles generally accepted in the United States of America.
Emphasis of Matter
The accompanying statement of revenues and certain expenses was prepared for the purpose of complying with Rule 3-14 of Regulation S-X promulgated by the Securities and Exchange Commission and, as described in Note A, is not intended to be a complete presentation of the Property’s revenues and expenses.
AGH, LLC
October 30, 2014
TIAA Real Estate Account ¡ Prospectus225 |
Northwest Houston Industrial Portfolio, Houston, Texas
Statements of revenues and certain expenses
|
|
|
|
|
||||||||||
|
For The |
For The |
||||||||||||
|
||||||||||||||
|
REVENUES |
|
|
|
|
||||||||||
|
Rental income |
|
|
$ |
|
4,086,905 |
|
|
$ |
|
1,039,753 |
||||
|
Reimbursement income |
|
|
1,731,372 |
|
|
423,938 |
||||||||
|
Other operating income |
|
|
309 |
|
|
6,996 |
||||||||
|
||||||||||||||
|
Total revenues |
|
|
5,818,586 |
|
|
1,470,687 |
||||||||
|
||||||||||||||
|
CERTAIN EXPENSES |
|
|
|
|
||||||||||
|
Bad debt expense |
|
|
4,546 |
|
|
— |
||||||||
|
General and administrative |
|
|
75,569 |
|
|
10,969 |
||||||||
|
Insurance |
|
|
197,688 |
|
|
43,807 |
||||||||
|
Management fees |
|
171,265 |
|
|
44,545 |
|||||||||
|
Real estate taxes |
|
|
982,775 |
|
|
228,618 |
||||||||
|
Repairs and maintenance |
|
|
270,324 |
|
|
58,770 |
||||||||
|
Utilities |
|
|
169,273 |
|
|
49,246 |
||||||||
|
||||||||||||||
|
Total certain expenses |
|
|
1,871,440 |
|
|
435,955 |
||||||||
|
||||||||||||||
|
Revenues in Excess of Certain Expenses |
|
|
$ |
|
3,947,146 |
|
|
$ |
|
1,034,732 |
||||
|
||||||||||||||
Note A—Organization and Basis of Presentation
The statement of revenues and certain expenses (the “financial statement”) for the year ended December 31, 2013 relates to the operations of the Property. The Property, located in Houston, Texas, consists of a 7-building industrial park containing approximately 1,163,550 square feet. The Property was approximately 99% leased at December 31, 2013 and March 31, 2014.
The accompanying financial statement is presented in conformity with Rule 3-14 of Regulation S-X promulgated by the Securities and Exchange Commission. Accordingly, the financial statement is not representative of the actual operations for the period presented, as certain expenses which may not be comparable to the expenses expected to be incurred in the future operations of the Property have been excluded. Expenses excluded consist of depreciation, amortization, income taxes and certain other expenses not directly related to the future operations of the Property.
The statement of revenues and certain expenses for the period ended March 31, 2014 is unaudited. However, in the opinion of management, all adjustments (consisting solely of normal recurring adjustments) necessary for the fair presentation of this statement of revenues and certain expenses for the interim period on the basis described above have been included. The results for such an interim period are not necessarily indicative of the results for the entire year.
226Prospectus ¡ TIAA Real Estate Account |
See Independent Auditors’ Report |
Northwest Houston Industrial Portfolio, Houston, Texas
Note B–Summary of significant accounting policies
Use of estimates
The preparation of the financial statement in conformity with accounting principles generally accepted in the United States requires management to make estimates and assumptions that affect various amounts reported in the financial statement and accompanying notes. Actual results could differ from those estimates.
Revenue recognition
Rental income from the operating leases, which includes scheduled increases over the lease term, is recognized on a straight-line basis. For the year ended December 31, 2013 and the period ended March 31, 2014, income recognized on a straight-line basis is more (less) than income that would have accrued in accordance with the lease terms by approximately $23,262 and ($6,536), respectively.
Note C—Concentration of Revenue
The Property earned approximately 46% of rental income from four tenants during the year ended December 31, 2013 and the period ended March 31, 2014. The loss of these tenants could have a significant negative impact on the Property’s operations.
Note D—Future Rental Income
Available space in the Property is leased to 22 tenants under non-cancellable operating leases that expire on various dates through 2018. The leases provide for increases in future minimum rental payments. Also, certain leases require reimbursement of common area maintenance charges, certain operating expenses, and real estate taxes.
The minimum future rental income from these leases as of December 31, 2013 is as follows:
|
|
|
|||||
|
|||||||
|
2014 |
|
|
$ |
|
3,914,593 |
||
|
2015 |
|
|
2,477,974 |
||||
|
2016 |
|
|
1,203,944 |
||||
|
2017 |
|
|
442,542 |
||||
|
2018 |
|
|
312,601 |
||||
|
|||||||
|
|
|
|
$ |
|
8,351,654 |
||
|
|||||||
Note E—Subsequent Events
Subsequent events have been evaluated through October 30, 2014, the date the financial statement was available for issuance. Management has determined that there are no subsequent events that require disclosure under Financial Accounting Standards Board Accounting Standards Codification Topic 855, Subsequent Events.
See Independent Auditors’ Report |
TIAA Real Estate Account ¡ Prospectus227 |
Southside at McEwen, Franklin, Tennessee
Independent auditor’s report
To the Board of Directors and Stockholders TIAA-CREF, Inc. Southside at McEwen
We have audited the accompanying statement of revenue and certain operating expenses (the “financial statements”) of Southside at McEwen (the “Property”) located in Nashville, TN for the year ended December 31, 2013 and the period from January 1, 2014 to April 30, 2014, and the related notes to the financial statements.
Management’s Responsibility for the Financial Statements
Management of the sellers of Southside at McEwen is responsible for the preparation and fair presentation of the financial statements in conformity with U.S. generally accepted accounting principles; this includes the design, implementation, and maintenance of internal control relevant to the preparation and fair presentation of the statements of revenues and certain operating expenses that are free from material misstatement, whether due to fraud or error.
Auditor’s Responsibility
Our responsibility is to express an opinion on the financial statements based on our audit. We conducted our audit in accordance with auditing standards generally accepted in the United States of America. Those standards require that we plan and perform the audit to obtain reasonable assurance about whether the financial statements are free of material misstatement.
An audit involves performing procedures to obtain audit evidence about the amounts and disclosures in the financial statements. The procedures selected depend on the auditor’s judgment, including the assessment of the risks of material misstatement of the financial statements, whether due to fraud or error. In making those risk assessments, the auditor considers internal control relevant to the entity’s preparation and fair presentation of the financial statements in order to design audit procedures that are appropriate in the circumstances, but not for the purpose of expressing an opinion on the effectiveness of the entity’s internal control. Accordingly, we express no such opinion. An audit includes evaluating the appropriateness of accounting policies used and the reasonableness of significant accounting estimates made by management, as well as evaluating the overall presentation of the financial statements.
We believe that the audit evidence we have obtained is sufficient and appropriate to provide a basis for our audit opinion.
Opinion
In our opinion, the financial statements referred to above presents fairly, in all material respects, the revenues and certain operating expenses described in Note 1 to the financial statements of Southside at McEwen for the year ended
228Prospectus ¡ TIAA Real Estate Account |
December 31, 2013 and the four month period ended April 30, 2014, in conformity with U.S. generally accepted accounting principles.
Other Matter
As described in Note 1 to the financial statements, the statements of revenue and certain operating expenses have been prepared for the purpose of complying with the rules and regulations of the Securities and Exchange Commission for inclusion in the TIAA Real Estate Account S-1, and are not intended to be a complete presentation of the Property’s revenue and expenses. Our opinion is not modified with respect to this matter.
Charlotte, North Carolina
January 12, 2015
TIAA Real Estate Account ¡ Prospectus229 |
Southside at McEwen, Franklin, Tennessee
Statements of revenue and certain operating expenses
|
|
|
|
|
||||||||||
|
Year Ended |
Period from |
||||||||||||
|
||||||||||||||
|
REVENUE |
|
|
|
|
||||||||||
|
Net rental revenue |
|
|
$ |
|
2,187,364 |
|
|
$ |
|
739,546 |
||||
|
Common area maintenance |
|
|
244,556 |
|
|
69,926 |
||||||||
|
Insurance reimbursement |
|
|
624 |
|
|
379 |
||||||||
|
Tax reimbursement |
|
|
178,700 |
|
|
100,354 |
||||||||
|
Other revenue |
|
|
63,633 |
|
|
— |
||||||||
|
||||||||||||||
|
Total revenue |
|
|
2,674,877 |
|
|
910,205 |
||||||||
|
||||||||||||||
|
CERTAIN OPERATING EXPENSES |
|
|
|
|
||||||||||
|
Insurance |
|
|
19,812 |
|
|
8,680 |
||||||||
|
Property operating expenses |
|
|
352,805 |
|
|
105,572 |
||||||||
|
Repairs and maintenance |
|
|
103,730 |
|
|
40,778 |
||||||||
|
Real estate taxes |
|
|
234,437 |
|
|
77,807 |
||||||||
|
||||||||||||||
|
Total certain operating expenses |
|
|
710,784 |
|
|
232,837 |
||||||||
|
||||||||||||||
|
Revenue in excess of certain operating expenses |
|
|
$ |
|
1,964,093 |
|
|
$ |
|
677,368 |
||||
|
||||||||||||||
See Notes to Statements of Revenue and Certain Operating Expenses.
Notes to statements of revenue and certain operating expenses
Year Ended December 31, 2013 and Period from January 1, 2014 to April 30, 2014
Note 1—Organization and Basis of Presentation
The accompanying statements of revenue and certain operating expenses (the financial statements) for the year ended December 31, 2013 and the four months ended April 30, 2014, relate to the operations of Southside at McEwen located in Nashville, Tennessee, acquired from Amstar, an unaffiliated entity.
The accompanying financial statements were prepared for the purpose of complying with Rule 3-14 of Regulation S-X of the Securities and Exchange Commission for the acquisition of real estate properties. The statements of revenue and certain operating expenses are not representative of the actual operations for the periods presented, as certain expenses, which may not be comparable to the expenses expected to be incurred in the future operations of the Property, have been excluded. Expenses excluded generally consist of interest and debt related costs, depreciation and amortization expense, interest income, income taxes and certain other expenses not directly related to the future operations of the Property. Therefore, the statements of revenue and certain operating expenses may not be comparable to a statement of operations for Southside at McEwen after its acquisition by the Company. Except as noted above, management of the sellers of Southside at McEwen are not aware of any material factors relating to Southside at McEwen for the year ended December 31, 2013 or the period from January 1, 2014 to April 30, 2014, that would cause the reported financial information not to be indicative of future operating results.
230Prospectus ¡ TIAA Real Estate Account |
See Independent Auditors’ Report |
Southside at McEwen, Franklin, Tennessee
Note 2—Summary of Significant Accounting Policies
Basis of accounting
The statements of revenue and certain operating expenses have been prepared using the accrual method of accounting on the basis of presentation described in Note 1. As such, revenue is recorded when earned and expenses are recognized when incurred.
Revenue recognition
Rental income from the operating leases, which includes scheduled increases over the lease term, is recognized on a straight-line basis. For the year ended December 31, 2013, income recognized on a straight-line basis is greater than income that would have accrued in accordance with the lease terms by approximately $596,148. For the period ended April 30, 2014 income recognized on a straight-line basis is greater than income that would have accrued in accordance with the lease terms by approximately $87,866.
Property operations
Certain operating expenses represent the direct expenses of operating Southside at McEwen and consist primarily of repairs and maintenance, utilities, real estate taxes, property insurance, general and administrative and other operating expenses that are expected to continue in the ongoing operation of Southside at McEwen.
Use of estimates
The preparation of the accompanying statements of revenue and certain operating expenses in accordance with the accounting principles generally accepted in the United States requires management of the sellers of Southside at McEwen to make certain estimates and assumptions that the reported amounts of revenue and certain expenses during the reporting periods. Actual results could differ from those estimates.
Note 3—Future Rent Payments
Space in the Properties is rented to tenants under non-cancelable operating leases. Approximate minimum future rents required under the leases in effect at April 30, 2014 are as follows:
See Independent Auditors’ Report |
TIAA Real Estate Account ¡ Prospectus231 |
Southside at McEwen, Franklin, Tennessee
|
|
|
|||||
|
|||||||
|
For the period May 1, 2014—December 31, 2014 |
|
|
$ |
|
1,538,801 |
||
|
For the year ended December 31, 2015 |
|
|
2,212,426 |
||||
|
For the year ended December 31, 2016 |
|
|
2,301,423 |
||||
|
For the year ended December 31, 2017 |
|
|
2,380,288 |
||||
|
For the year ended December 31, 2018 |
|
|
1,993,292 |
||||
|
For the year ended December 31, 2019 |
|
|
1,858,780 |
||||
|
Thereafter |
|
|
14,203,786 |
||||
|
|||||||
|
Total |
|
|
$ |
|
26,488,796 |
||
|
|||||||
Note 4—Management Fee
The Property was charged a management fee totaling the greater of 3.5% of total gross income or $3,000 per calendar month.
Note 5—Concentrations
The Property earned 61% and 50% of rent revenue from two tenants during the year ended December 31, 2013 and the period from January 1, 2014 to April 30, 2014, respectively.
Note 6—Subsequent Events
Events that occur after April 30, 2014 but before the financial statements were available to be issued must be evaluated for recognition or disclosure. The effects of subsequent events that provide evidence about conditions that existed at April 30, 2014 are recognized in the accompanying financial statements. Subsequent events which provide evidence about conditions that existed after April 30, 2014 require disclosure in the accompanying notes. Management evaluated the activity of the Property through January 12, 2015 (the date the financial statements were available to be issued) and concluded that no subsequent events have occurred that would require recognition in the financial statements or disclosure in the Notes to Statements of Revenue and Certain Operating Expenses.
232Prospectus ¡ TIAA Real Estate Account |
See Independent Auditors’ Report |
Foundry Square II, San Francisco, California
Report of independent certified public accountants
To the Management of Teachers Insurance and Annuity Association of America:
We have audited the accompanying statement of revenue and certain expenses (the Financial Statement) of Foundry Square II (the Property) located in San Francisco, California for the year ended December 31, 2013 and the related notes to the financial statements.
Management’s responsibility for the Financial Statement
Management is responsible for the preparation and fair presentation of this Financial Statement in accordance with accounting principles generally accepted in the United States of America; this includes the design, implementation, and maintenance of internal control relevant to the preparation and fair presentation of the Financial Statement that is free from material misstatement, whether due to fraud or error.
Auditor’s responsibility
Our responsibility is to express an opinion on this Financial Statement based on our audit. We conducted our audit in accordance with auditing standards generally accepted in the United States of America. Those standards require that we plan and perform the audit to obtain reasonable assurance about whether this Financial Statement is free from material misstatement.
An audit involves performing procedures to obtain audit evidence about the amounts and disclosures in the Financial Statement. The procedures selected depend on the auditor’s judgment, including the assessment of the risks of material misstatement of the Financial Statement, whether due to fraud or error. In making those risk assessments, the auditor considers internal control relevant to the entity’s preparation and fair presentation of the Financial Statement in order to design audit procedures that are appropriate in the circumstances, but not for the purpose of expressing an opinion on the effectiveness of the entity’s internal control. Accordingly, we express no such opinion. An audit also includes evaluating the appropriateness of accounting policies used and the reasonableness of significant accounting estimates made by management, as well as evaluating the overall presentation of the Financial Statement.
We believe that the audit evidence we have obtained is sufficient and appropriate to provide a basis for our audit opinion.
Opinion
In our opinion, the Financial Statement referred to above presents fairly, in all material respects, the revenue and certain expenses described in Note 1 of Foundry Square II for the year ended December 31, 2013 in accordance with accounting principles generally accepted in the United States of America.
TIAA Real Estate Account ¡ Prospectus233 |
Emphasis of Matter
We draw attention to Note 1 to the Financial Statement, which describes that the accompanying Financial Statement was prepared for the purpose of complying with Rule 3-14 of the Securities and Exchange Commission Regulation S-X (for inclusion in the Registration Statement on Form S-1 of the TIAA Real Estate Account) and is not intended to be a complete presentation of the Property’s revenue and expenses.

Charlotte, North Carolina
September 26, 2014
234Prospectus ¡ TIAA Real Estate Account |
Foundry Square II, San Francisco, California
Statements of revenues and certain expenses
|
|
|
|
|
||||||||||
|
For the |
For the |
||||||||||||
|
||||||||||||||
|
REVENUES |
|
|
|
|
||||||||||
|
Rental income |
|
|
$ |
|
15,235,277 |
|
|
$ |
|
9,642,862 |
||||
|
Recovery income |
|
|
2,994,905 |
|
|
1,689,435 |
||||||||
|
Other income |
|
|
77,303 |
|
|
60,209 |
||||||||
|
||||||||||||||
|
Total Revenues |
|
|
18,307,485 |
|
|
11,392,506 |
||||||||
|
||||||||||||||
|
CERTAIN EXPENSES |
|
|
|
|
||||||||||
|
Interest |
|
|
6,534,000 |
|
|
3,811,500 |
||||||||
|
Real estate taxes |
|
|
3,017,765 |
|
|
1,791,927 |
||||||||
|
Repairs and maintenance |
|
|
2,167,600 |
|
|
1,297,321 |
||||||||
|
Utilities |
|
|
1,347,660 |
|
|
751,048 |
||||||||
|
Salary |
|
|
1,036,983 |
|
|
622,783 |
||||||||
|
General and administrative |
|
|
892,797 |
|
|
515,451 |
||||||||
|
Management fees |
|
|
543,490 |
|
|
316,315 |
||||||||
|
||||||||||||||
|
Total certain expenses |
|
|
15,540,295 |
|
|
9,106,345 |
||||||||
|
||||||||||||||
|
Revenues in excess of certain expenses |
|
|
$ |
|
2,767,190 |
|
|
$ |
|
2,286,161 |
||||
|
||||||||||||||
See accompanying notes to statements of revenues and certain expenses
Notes to statements of revenues and certain expenses
Note 1—Organization and Basis of Presentation
The statements of revenues and certain expenses (the Financial Statement) for the year ended December 31, 2013 and for the period ended July 31, 2014 relates to the operations of Foundry Square II (the “Property”), a 10-story, 521,555 square foot office building located in San Francisco, California South Financial District and associated mortgage.
The accompanying Financial Statement is presented in conformity with Rule 3-14 of Securities and Exchange Commission Regulation S-X. Accordingly, the Financial Statement is not representative of the actual operations for the period presented, as certain expenses which may not be comparable to the expenses expected to be incurred in the future operations of the Property have been excluded. Expenses excluded consist of depreciation and amortization not directly related to the future operations of the Property.
Note 2—Summary of Significant Accounting Policies
Use of estimates
The preparation of Financial Statements in conformity with accounting principles generally accepted in the United States requires management to make estimates and assumptions that affect various amounts reported in the Financial Statements and accompanying notes. Actual results could differ from those estimates.
See Independent Auditors’ Report |
TIAA Real Estate Account ¡ Prospectus235 |
Foundry Square II, San Francisco, California
Revenue recognition
Rental income from the operating leases, which includes scheduled increases over the lease term, is recognized on a straight-line basis. For the year ended December 31, 2013, income recognized on a straight-line basis is less than income that would have accrued in accordance with the lease terms by $189,519, and for the period ended July 31, 2014, income recognized on a straight-line basis is more than income that would have accrued in accordance with the lease terms by $279,361 (unaudited).
Recovery income are amounts reimbursed by tenants for the tenants’ share of certain operating expenses based on the terms of the respective lease agreements.
Note 3—Future Rental Income
Available space in the Property is leased to tenants under non-cancellable operating leases that expire on various dates through 2020. The leases provide for increases in future minimum rental payments. Also, the leases require reimbursement of common area maintenance charges, certain operating expenses, and real estate taxes.
The minimum future rental income from these leases as of December 31, 2013 is as follows:
|
|
|
|||||
|
|||||||
|
2014 |
|
|
$ |
|
15,265,630 |
||
|
2015 |
|
|
17,502,941 |
||||
|
2016 |
|
|
15,827,174 |
||||
|
2017 |
|
|
14,324,350 |
||||
|
2018 |
|
|
12,709,932 |
||||
|
Thereafter |
|
|
8,828,931 |
||||
|
|||||||
|
|
$ |
|
84,458,958 |
|||
|
|||||||
Note 4—Tenant Concentrations
For the year ended December 31, 2013, and the seven months ended July 31, 2014, one tenant represented 39% and 43% (unaudited), respectively, of the Property’s rental income.
Note 5—Subsequent Events
The Property evaluated subsequent events through September 26, 2014, the date the Financial Statements were available to be issued.
236Prospectus ¡ TIAA Real Estate Account |
See Independent Auditors’ Report |
The Manor Apartments, Plantation, Florida
Independent auditors’ report
To the Management of Teachers Insurance and Annuity Association of America
We have audited the accompanying statement of revenues and certain expenses of The Manor (the “Property”), as described in Note A, for the year ended December 31, 2013, and the related notes to the financial statement.
Management’s Responsibility for the Financial Statement
Management is responsible for the preparation and fair presentation of the financial statement in accordance with accounting principles generally accepted in the United States of America; this includes the design, implementation, and maintenance of internal control relevant to the preparation and fair presentation of a financial statement that is free from material misstatement, whether due to fraud or error.
Auditors’ Responsibility
Our responsibility is to express an opinion on the financial statement based on our audit. We conducted our audit in accordance with auditing standards generally accepted in the United States of America. Those standards require that we plan and perform the audit to obtain reasonable assurance about whether the financial statement is free of material misstatement.
An audit involves performing procedures to obtain audit evidence about the amounts and disclosures in the financial statement. The procedures selected depend on the auditors’ judgment, including the assessment of the risks of material misstatement of the financial statement, whether due to fraud or error. In making those risk assessments, the auditor considers internal control relevant to the entity’s preparation and fair presentation of the financial statement in order to design audit procedures that are appropriate in the circumstances, but not for the purpose of expressing an opinion on the effectiveness of the entity’s internal control. Accordingly, we express no such opinion. An audit also includes evaluating the appropriateness of accounting policies used and the reasonableness of significant accounting estimates made by management, as well as evaluating the overall presentation of the financial statement.
We believe that the audit evidence we have obtained is sufficient and appropriate to provide a basis for our audit opinion.
Opinion
In our opinion, the financial statement referred to above presents fairly, in all material respects, the revenues and certain expenses of the Property, as described in Note A, for the year ended December 31, 2013, in conformity with accounting principles generally accepted in the United States of America.
TIAA Real Estate Account ¡ Prospectus237 |
Emphasis of Matter
The accompanying statement of revenues and certain expenses was prepared for the purpose of complying with Rule 3-14 of Regulation S-X promulgated by the Securities and Exchange Commission and, as described in Note A, is not intended to be a complete presentation of the Property’s revenues and expenses.
AGH, LLC
November 4, 2014
238Prospectus ¡ TIAA Real Estate Account |
The Manor Apartments, Plantation, Florida
Statements of revenues and certain expenses
|
|
|
|
|
||||||||||
|
For The |
For The |
||||||||||||
|
||||||||||||||
|
REVENUES |
|
|
|
|
||||||||||
|
Rental income |
|
|
$ |
|
67,456 |
|
|
$ |
|
1,710,574 |
||||
|
Other operating income |
|
|
17,455 |
|
|
102,565 |
||||||||
|
||||||||||||||
|
Total revenues |
|
|
84,911 |
|
|
1,813,139 |
||||||||
|
||||||||||||||
|
CERTAIN EXPENSES |
|
|
|
|
||||||||||
|
Advertising and marketing |
|
|
17,178 |
|
|
107,972 |
||||||||
|
General and administrative |
|
|
10,970 |
|
|
104,252 |
||||||||
|
Insurance |
|
|
10,979 |
|
|
126,231 |
||||||||
|
Management fees |
|
|
25,000 |
|
|
59,579 |
||||||||
|
Real estate taxes |
|
|
51,826 |
|
|
594,720 |
||||||||
|
Repairs and maintenance |
|
|
4,304 |
|
|
84,497 |
||||||||
|
Salaries and wages |
|
|
110,523 |
|
|
271,412 |
||||||||
|
Utilities |
|
|
4,881 |
|
|
159,282 |
||||||||
|
||||||||||||||
|
Total certain expenses |
|
|
235,661 |
|
|
1,507,945 |
||||||||
|
||||||||||||||
|
Net Revenues (Certain Expenses) |
|
|
$ |
|
(150,750 |
) |
|
|
|
$ |
|
305,194 |
||
|
||||||||||||||
Notes to statement of revenues and certain expenses
Note A—Organization and Basis of Presentation
The statement of revenues and certain expenses (the “financial statement”) for the year ended December 31, 2013 relates to the operations of the Property. The Property, located in the midtown business district of Plantation, Florida, consists of a 181-unit six-story building with a parking deck and 16 townhomes located in four separate, contiguous buildings. The Property’s construction was completed in November 2013. As of September 30, 2014, the Property was 95% leased.
The accompanying financial statement is presented in conformity with Rule 3-14 of Regulation S-X promulgated by the Securities and Exchange Commission. Accordingly, the financial statement is not representative of the actual operations for the period presented, as certain expenses which may not be comparable to the expenses expected to be incurred in the future operations of the Property have been excluded. Expenses excluded consist of depreciation, amortization, income taxes and certain other expenses not directly related to the future operations of the Property.
The statement of revenues and certain expenses for the period ended September 30, 2014 is unaudited. However, in the opinion of management, all adjustments (consisting solely of normal recurring adjustments) necessary for the fair presentation of this statement of revenues and certain expenses for the interim period on the basis described above have been included. The results for such an interim period are not necessarily indicative of the results for the entire year.
See Independent Auditors’ Report |
TIAA Real Estate Account ¡ Prospectus239 |
The Manor Apartments, Plantation, Florida
Note B—Summary of Significant Accounting Policies
Use of estimates
The preparation of the financial statement in conformity with accounting principles generally accepted in the United States requires management to make estimates and assumptions that affect various amounts reported in the financial statement and accompanying notes. Actual results could differ from those estimates.
Revenue recognition
Rental income from tenant leases is recognized as earned. Lease terms generally do not extend beyond one year.
Advertising and marketing costs
Advertising and marketing costs relate to branding, promotional materials and events mainly associated with the initial lease-up of the rental units. These costs are expensed as incurred.
Note C—Related Parties
The Property is under a property management agreement with an affiliate of the Property’s owners. For the year ended December 31, 2013 and the period ended September 30, 2014, the Property incurred $25,000 and $59,579 in management fees, respectively. Additionally, during the year ended December 31, 2013 and the period ended September 30, 2014, the Property paid $110,523 and $271,412 to the affiliate for the cost of salaries and wages earned, respectively.
Note D—Subsequent Events
Subsequent events have been evaluated through October 28, 2014, the date the financial statement was available for issuance. Management has determined that there are no subsequent events that require disclosure under Financial Accounting Standards Board Accounting Standards Codification Topic 855, Subsequent Events.
240Prospectus ¡ TIAA Real Estate Account |
See Independent Auditors’ Report |
21 Penn Plaza, New York, New York
Report of independent certified public accountants
To the Management of Teachers Insurance and Annuity Association of America:
We have audited the accompanying statement of revenue and certain expenses (the Financial Statement) of 21 Penn Plaza (the Property) located in New York, New York for the year ended December 31, 2013 and the related notes to the financial statements.
Management’s Responsibility for the Financial Statement
Management is responsible for the preparation and fair presentation of this Financial Statement in accordance with accounting principles generally accepted in the United States of America; this includes the design, implementation, and maintenance of internal control relevant to the preparation and fair presentation of the Financial Statement that is free from material misstatement, whether due to fraud or error.
Auditor’s Responsibility
Our responsibility is to express an opinion on this Financial Statement based on our audit. We conducted our audit in accordance with auditing standards generally accepted in the United States of America. Those standards require that we plan and perform the audit to obtain reasonable assurance about whether this Financial Statement is free from material misstatement.
An audit involves performing procedures to obtain audit evidence about the amounts and disclosures in the Financial Statement. The procedures selected depend on the auditor’s judgment, including the assessment of the risks of material misstatement of the Financial Statement, whether due to fraud or error. In making those risk assessments, the auditor considers internal control relevant to the entity’s preparation and fair presentation of the Financial Statement in order to design audit procedures that are appropriate in the circumstances, but not for the purpose of expressing an opinion on the effectiveness of the entity’s internal control. Accordingly, we express no such opinion. An audit also includes evaluating the appropriateness of accounting policies used and the reasonableness of significant accounting estimates made by management, as well as evaluating the overall presentation of the Financial Statement.
We believe that the audit evidence we have obtained is sufficient and appropriate to provide a basis for our audit opinion.
Opinion
In our opinion, the Financial Statement referred to above presents fairly, in all material respects, the revenue and certain expenses described in Note 1 of 21 Penn Plaza for the year ended December 31, 2013 in accordance with accounting principles generally accepted in the United States of America.
TIAA Real Estate Account |