Attached files
| file | filename |
|---|---|
| 10-K/A - FORM 10-K AMENDMENT NO 1 - PetroShare Corp. | petroshare_10ka.htm |
| EX-23.1 - EXHIBIT 23.1 - PetroShare Corp. | ex23x1.htm |
| EX-31.1 - EXHIBIT 31.1 - PetroShare Corp. | ex31x1.htm |
| EX-32.1 - EXHIBIT 32.1 - PetroShare Corp. | ex32x1.htm |
Exhibit 99.1
EVALUATION
PETROSHARE CORPORATION INTERESTS
PROVED DEVELOPED PRODUCING RESERVES
MOFFAT COUNTY, COLORADO
As of January 1, 2015
EVALUATION
PETROSHARE CORPORATION INTERESTS
PROVED DEVELOPED PRODUCING RESERVES
MOFFAT COUNTY, COLORADO
As of January 1, 2015
|
|
 |
CAWLEY, GILLESPIE & ASSOCIATES, INC.
Petroleum Consultants
Texas Registered Engineering Firm F-693
/s/ J. Zane Meekins, P.E.
J. ZANE MEEKINS, P.E.
EXECUTIVE VICE PRESIDENT
|
|
|
|
|
CAWLEY, GILLESPIE & ASSOCIATES, INC.
PETROLEUM CONSULTANTS
302 FORT WORTH CLUB BUILDING
306 WEST SEVENTH STREET
FORT WORTH, TEXAS 76102-4987
(817) 336-2461
March 3, 2015
Mr. Frederick J. Witsell
PetroShare Corporation
7200 S. Alton Way, Suite B220
Centennial, CO 80111
|
|
Re:
|
Evaluation Summary
PetroShare Corporation Interests
Moffat County, Colorado
Proved Developed Producing Reserves
As of January 1, 2015
|
|
|
|
|
Dear Mr. Witsell:
As requested, we are submitting our estimates of proved developed producing reserves and our forecasts of the resulting economics attributable to the above captioned interests.
Composite reserve estimates and economic forecasts for the reserves are presented in the attached tables and are summarized below:
|
|
||||||||
|
Proved
Developed
Producing
|
||||||||
|
Net Reserves
|
||||||||
|
Oil
|
- Mbbl |
0.2
|
||||||
|
Gas
|
- MMcf |
0.0
|
||||||
|
Revenue
|
||||||||
|
Oil
|
M$ |
13.4
|
||||||
|
Gas
|
M$ |
0.0
|
||||||
|
Severance Taxes
|
M$ |
0.8
|
||||||
|
Operating Expenses
|
M$ |
7.8
|
||||||
|
Investments
|
M$ |
0.0
|
||||||
|
Operating Income (BFIT)
|
M$ |
4.8
|
||||||
|
Discounted at 10.0%
|
M$ |
4.7
|
||||||
The discounted value shown above should not be construed to represent an estimate of the fair market value by Cawley, Gillespie & Associates, Inc.
Evaluation Summary
March 3, 2015
Page 2
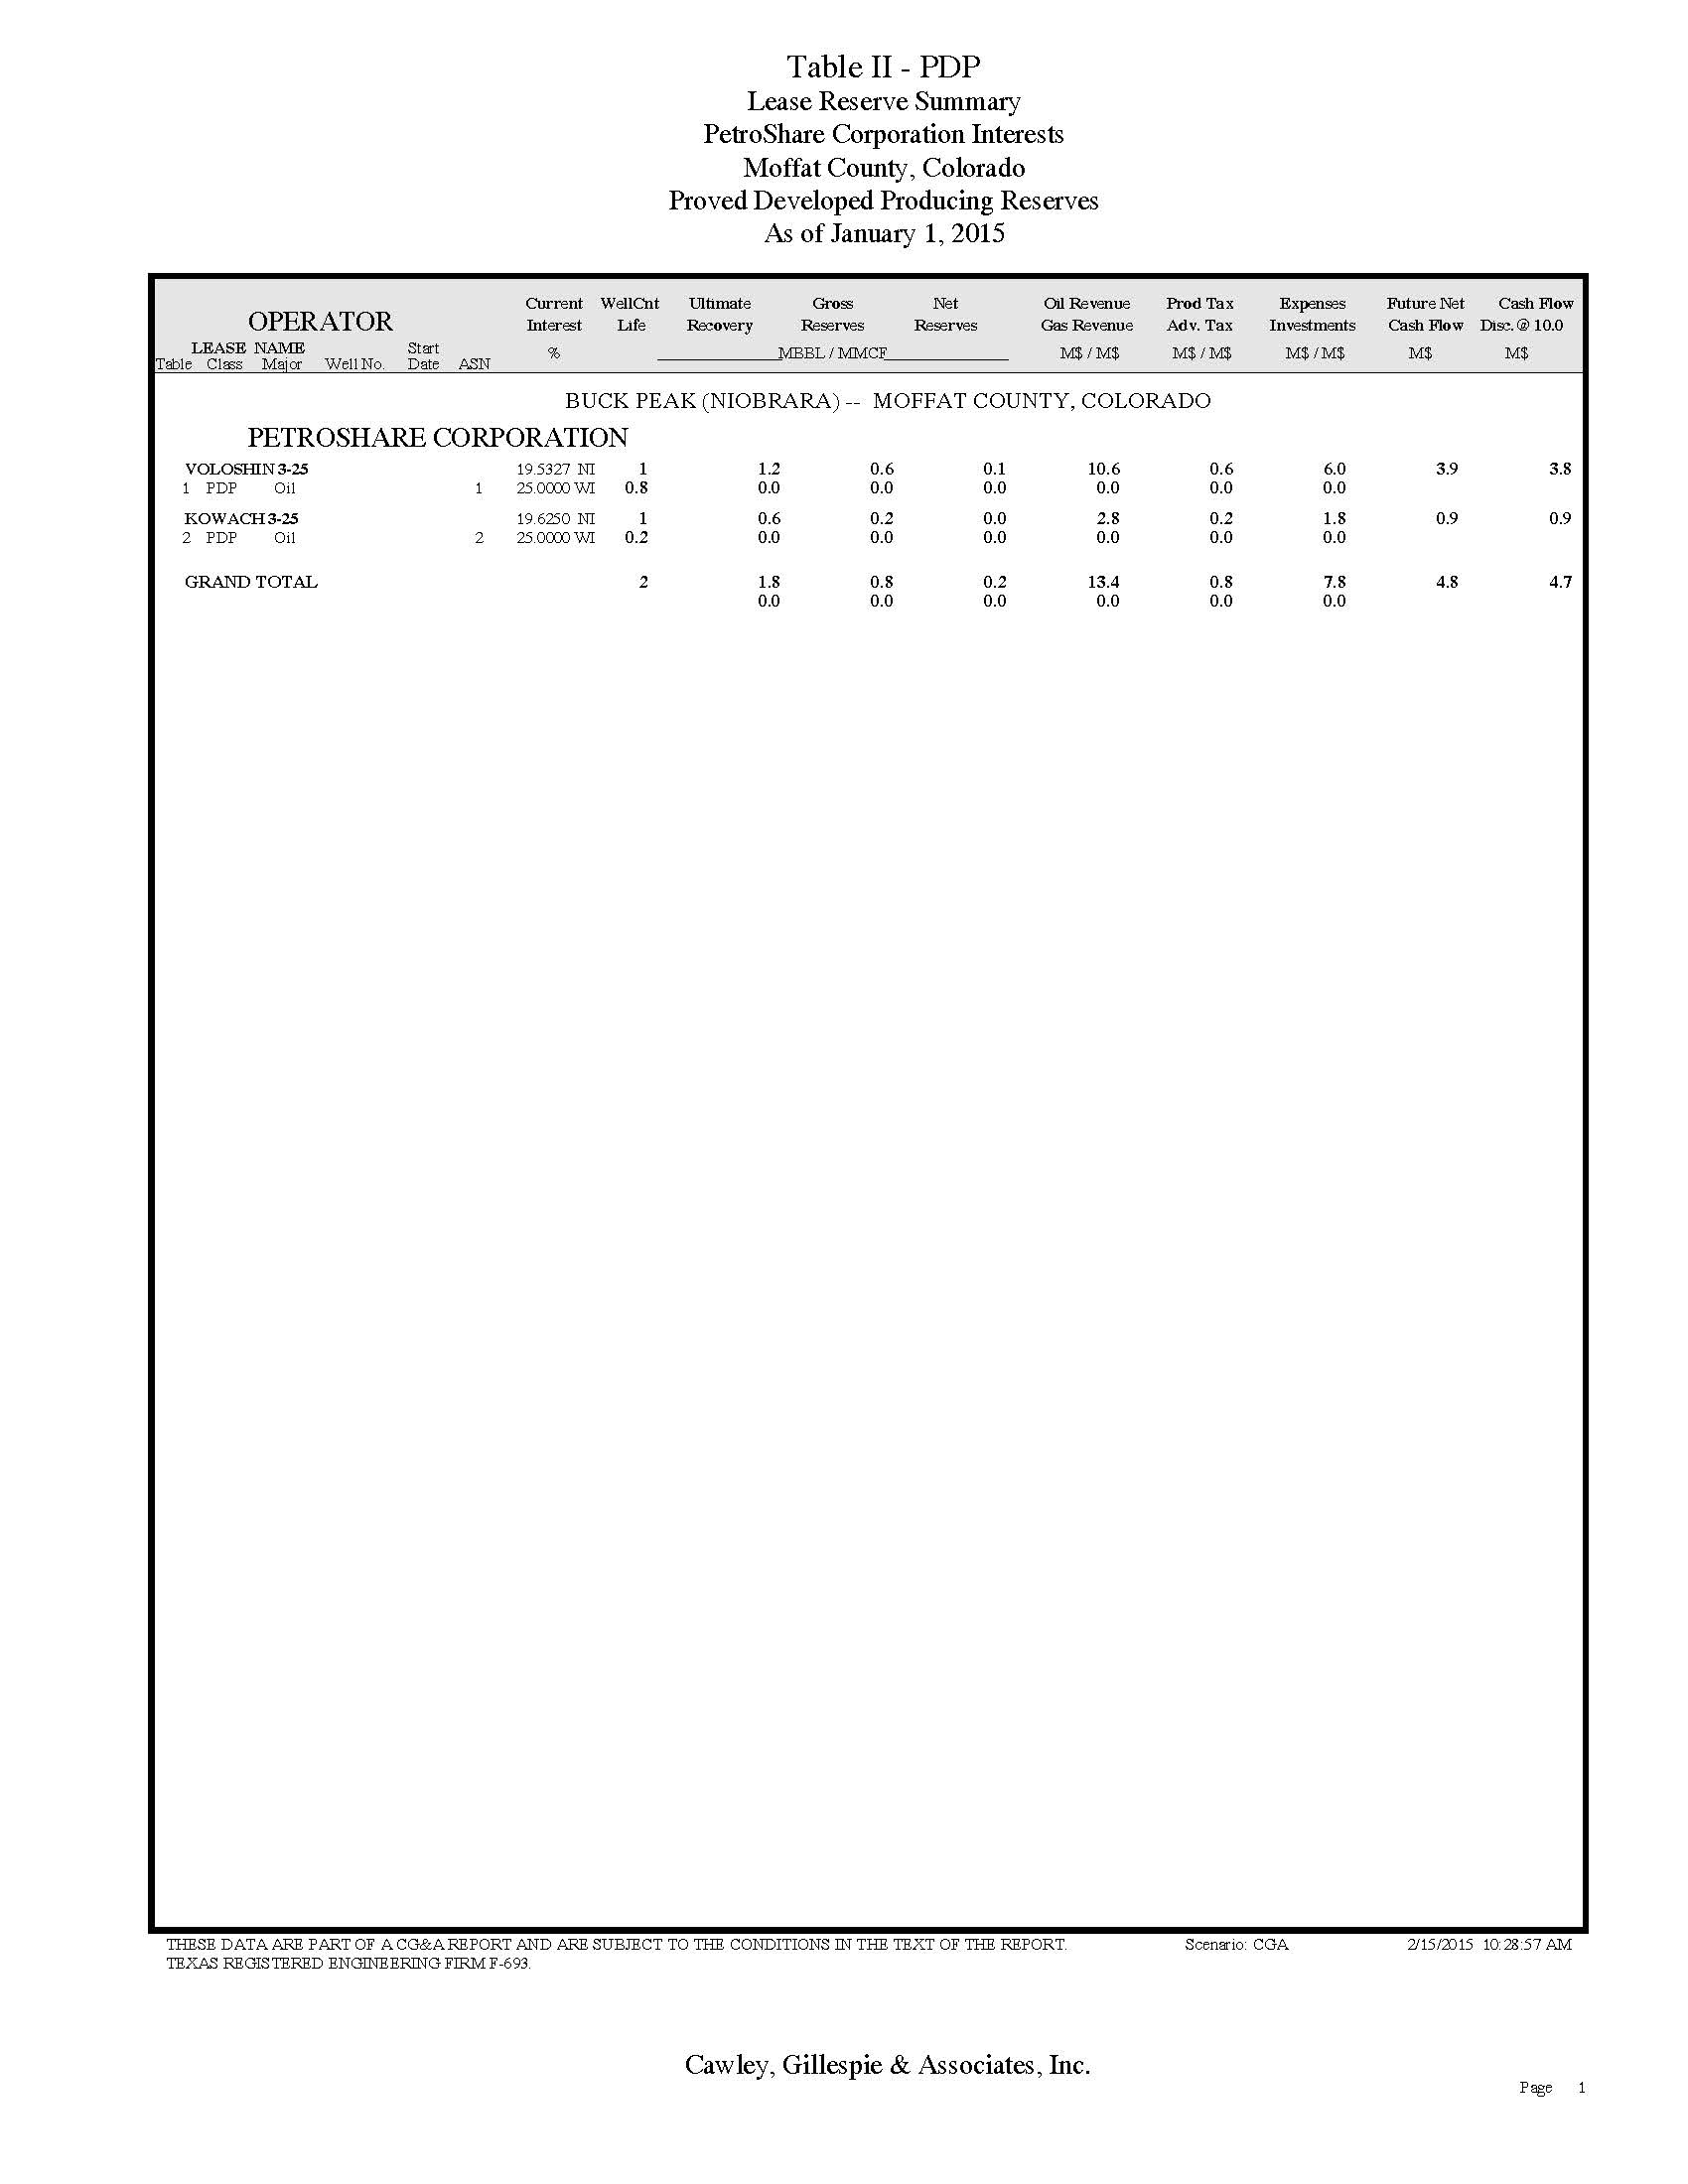
The detailed forecasts of reserves and economics are presented in the attached tables. Table I-PDP is a summary of the reserves and associated economics by reserve category. Table II-PDP is a one-line summary of the ultimate recovery, gross and net reserves, ownership, revenue, expenses, investments, net income and discounted cash flows for the individual forecasts in the Table I. Page 1 of the appendix explains the types of data in these tables.
As requested, SEC pricing of $94.99 per barrel and $4.35 per MMBtu was applied. As directed, a basis differential of -$11.00 per barrel was applied to this oil price. There are no gas sales on these properties.
As directed, operating expenses were forecast as $2,333 to $2,413 per well per month. A combined severance and ad valorem tax rate of 6.0% was applied. Expenses were not escalated. The cost of plugging and the salvage value of equipment have not been considered.
The proved reserve classifications conform to criteria of the Securities and Exchange. The reserves and economics are predicated on the regulatory agency classifications, rules, policies, laws, taxes and royalties in effect on the effective date except as noted herein. The possible effects of changes in legislation or other Federal or State restrictive actions have not been considered. All reserve estimates represent our best judgment based on data available at the time of preparation and assumptions as to future economic and regulatory conditions. It should be realized that the reserves actually recovered, the revenue derived therefrom and the actual cost incurred could be more or less than the estimated amounts.
The reserve estimates were based on interpretations of factual data furnished by PetroShare Corporation. Ownership interests were supplied by PetroShare Corporation and were accepted as furnished. To some extent, information from public records has been used to check and/or supplement these data. The basic engineering and geological data were utilized subject to third party reservations and qualifications. Nothing has come to our attention, however, that would cause us to believe that we are not justified in relying on such data. An on-site inspection of these properties has not been made nor have the wells been tested by Cawley, Gillespie & Associates, Inc.
This report was prepared for the exclusive use of PetroShare Corporation. Third parties should not rely on it without the written consent of the above and Cawley, Gillespie & Associates, Inc. Our work-papers and related data are available for inspection and review by authorized parties.
Respectfully submitted,
/s/ Cawley, Gillespie & Assoc., Inc.
CAWLEY, GILLESPIE & ASSOCIATES, INC.
Texas Registered Engineering Firm F-693
JZM:rtp

APPENDIX
Explanatory Comments
HEADINGS
Table Number Table Description
Identity of Interest Evaluated
Reserve Classification and Development Status
Operator – Property Name
Field (Reservoir) Names – County, State
FORECAST
(Columns)
|
(1) (11)
|
Calendar or Fiscal years ending on effective date.
|
|
(2) (3)
|
Gross Production (8/8th) for the years which are economical. These are expressed as thousands of barrels (Mbbl) and millions of cubic feet (MMcf) of gas at standard conditions. Total future production, cumulative production to effective date and ultimate recovery at the effective date are shown following the annual forecasts.
|
| (4) (5) | Net Production accruable to evaluated interest is calculated by multiplying the revenue interest times the gross production. These values take into account changes in interest and gas shrinkage. |
|
(6)
|
Average (volume weighted) gross liquid price per barrel before deducting production-severance taxes.
|
|
(7)
|
Average (volume weighted) gross gas price per Mcf before deducting production-severance taxes.
|
|
(8)
|
Revenue derived from oil sales -- column (4) times column (6).
|
|
(9)
|
Revenue derived from gas sales -- column (5) times column (7).
|
|
(10)
|
Total Revenue -- column (8) plus column (9) plus other miscellaneous revenue.
|
|
(12)
|
Production-severance taxes deducted from gross oil and gas revenue.
|
|
(13)
|
Ad valorem taxes.
|
|
(14)
|
Average gross wells.
|
|
(15)
|
Average net wells are gross wells times working interest.
|
|
(16)
|
Operating Expenses are direct operating expenses to the evaluated working interest, but may include items noted below.
|
|
(17)
|
Other Deductions may include operator's overhead, compression-gathering expenses, transportation costs, water disposal costs and net profits burdens. These are the share of costs payable by the evaluated expense interests and take into account any changes in interests.
|
|
(18)
|
Investments, if any, include work-overs, future drilling costs, pumping units, etc. and may be included either tangible or intangible or both, and the costs for plugging and the salvage value of equipment at abandonment may be shown as negative investments at end of life.
|
| (19) (20) | Future Net Cash Flow is column (10) less columns (12), (13), (16), (17) and (18). The data in column (19) are accumulated in column (20). Federal income taxes have not been considered. |
| (21) | Cumulative Discounted Cash Flow is calculated by discounting cash flows at specified rates. |
MISCELLANEOUS
| Life | • The economic life of the appraised property is noted below the discounted cash flow profile. |
| Interests | • Initial and final expense and revenue interests are shown below columns (18-19). |
Discounted Cash Flow
| Profile | • The cash flow discounted at six different rates are shown at the bottom of columns (20-21). Interest has been compounded once per year assuming income or payments are received at mid-year. |
| Footnotes | • The regulatory commission identification number, a brief location description, reserve evaluation method and other pertinent comments may be shown in the left-hand footnotes. Well type is noted in lower right- hand corner of table. |