Attached files
| file | filename |
|---|---|
| 8-K - FORM 8-K - EXCO RESOURCES INC | d896268d8k.htm |
| Exhibit 99.1
|
EXCO Resources, Inc.
Scotia Howard Weil Energy Conference
March 2015
|
|
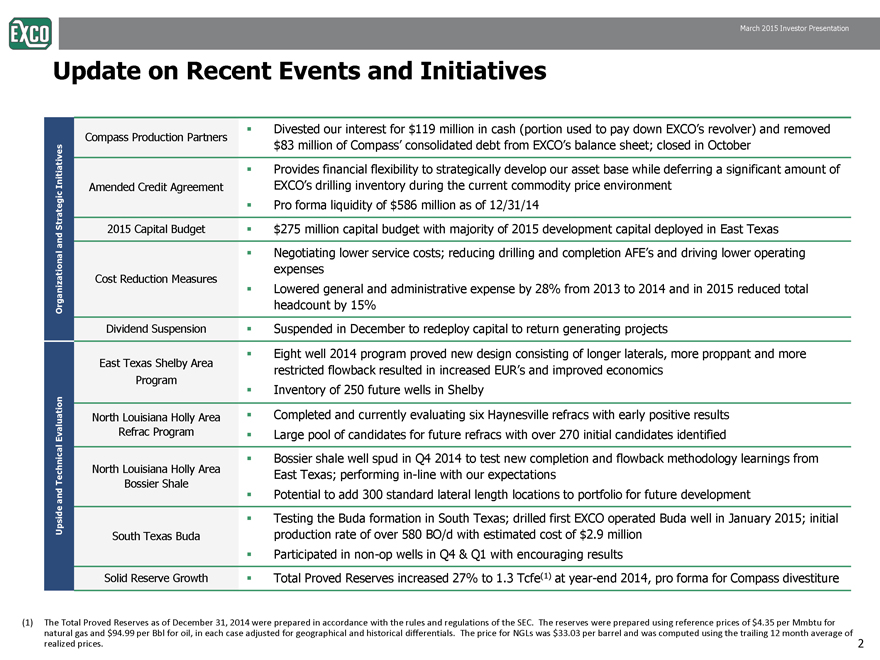
Update on Recent Events and Initiatives Initiatives
Compass Production Partners
Divested our interest for $119 million in cash (portion used to pay down EXCO’s revolver) and removed
$83 million of Compass’ consolidated debt from EXCO’s balance sheet; closed in October
Credit Agreement
Provides financial flexibility to strategically develop our asset base while deferring a significant amount of
EXCO’s drilling inventory during the current commodity price environment
zational and Strategic
Amended EXCO s Pro forma liquidity of $586 million as of 12/31/14
2015 Capital Budget $275 million capital budget with majority of 2015 development capital deployed in East Texas
Cost Reduction Measures
Negotiating lower service costs; reducing drilling and completion AFE’s and driving lower operating
expenses
Organiz
Lowered general and administrative expense by 28% from 2013 to 2014 and in 2015 reduced total
headcount by 15%
Dividend Suspension Suspended in December to redeploy capital to return generating projects
East Texas Shelby Area
P
Eight well 2014 program proved new design consisting of longer laterals, more proppant and more
restricted flowback resulted in increased EUR’s and improved economics
chnical Evaluation
Program
Inventory of 250 future wells in Shelby
North Louisiana Holly Area
Refrac Program
Completed and currently evaluating six Haynesville refracs with early positive results
Large pool of candidates for future refracs with over 270 initial candidates identified
North Louisiana Holly Area
Bossier shale well spud in Q4 2014 to test new completion and flowback methodology learnings from
E tT f i i li ith t ti
Upside and Tec
Bossier Shale
East Texas; performing in-line with our expectations
Potential to add 300 standard lateral length locations to portfolio for future development
South Texas Buda
Testing the Buda formation in South Texas; drilled first EXCO operated Buda well in January 2015; initial
production rate of over 580 BO/d with estimated cost of $2.9 million
Participated in non-op wells in Q4 & Q1 with encouraging results
2
Solid Reserve Growth Total Proved Reserves increased 27% to 1.3 Tcfe(1) at year-end 2014, pro forma for Compass divestiture
(1) The Total Proved Reserves as of December 31, 2014 were prepared in accordance with the rules and regulations of the SEC. The reserves were prepared using reference prices of $4.35 per Mmbtu for
natural gas and $94.99 per Bbl for oil, in each case adjusted for geographical and historical differentials. The price for NGLs was $33.03 per barrel and was computed using the trailing 12 month average of
realized prices.
|
|
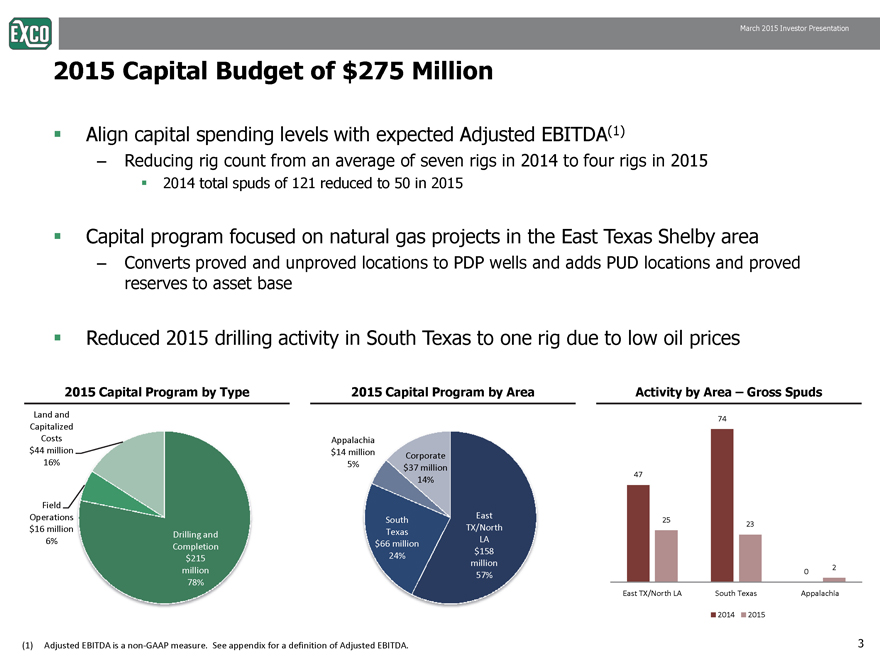
2015 Capital Budget of $275 Million
Align capital spending levels with expected Adjusted EBITDA(1)
– Reducing rig count from an average of seven rigs in 2014 to four rigs in 2015
2014 total spuds of 121 reduced to 50 in 2015
Capital program focused on natural gas projects in the East Texas Shelby area
– Converts proved and unproved locations to PDP wells and adds PUD locations and proved
reserves to asset base
Reduced 2015 drilling activity in South Texas to one rig due to low oil prices
2015 Capital Program by Type 2015 Capital Program by Area Activity by Area – Gross Spuds
|
|
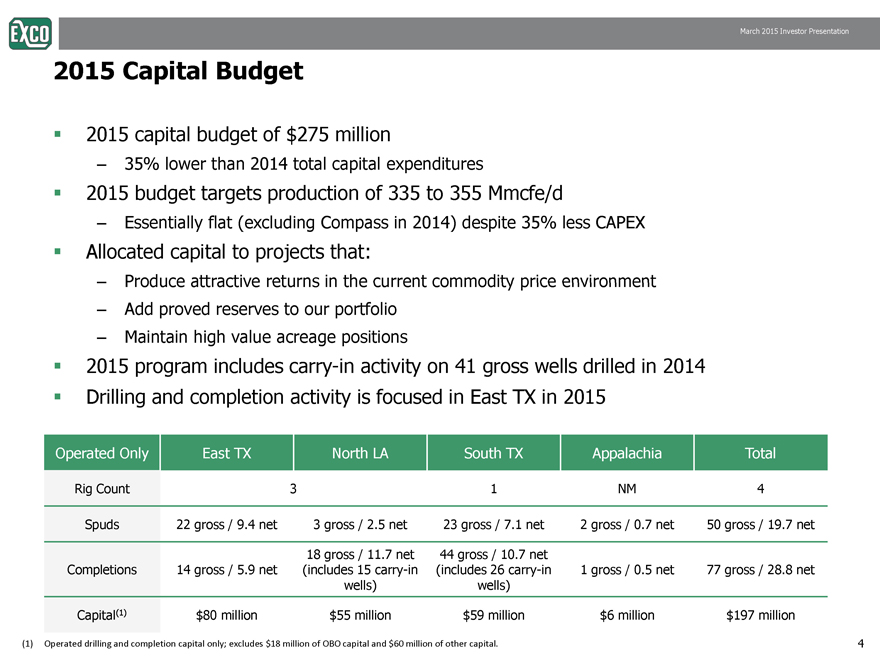
2015 Capital Budget
2015 capital budget of $275 million
– 35% lower than 2014 total capital expenditures
2015 budget targets production of 335 to 355 Mmcfe/d
– Essentially flat (excluding Compass in 2014) despite 35% less CAPEX
Allocated capital to projects that:
– Produce attractive returns in the current commodity price environment
– Add proved reserves to our portfolio
– Maintain high value acreage positions
2015 program includes carry-in activity on 41 gross wells drilled in 2014
Drilling and completion activity is focused in East TX in 2015
Operated Only East TX North LA South TX Appalachia Total
Rig Count 3 1 NM 4
Spuds 22 gross / 9.4 net 3 gross / 2.5 net 23 gross / 7.1 net 2 gross / 0.7 net 50 gross / 19.7 net
C lti 14 / 5 9 t
18 gross / 11.7 net
(i l d 15 i
44 gross / 10.7 net
(i l d 26 i 1 / 05 t 77 / 28 8 t
4
Completions gross 5.9 net includes carry-in
wells)
includes carry-in
wells)
gross 0.5 net gross 28.8 net
Capital(1) $80 million $55 million $59 million $6 million $197 million
Operated drilling and completion capital only; excludes $18 million of OBO capital and $60 million of other capital.
|
|
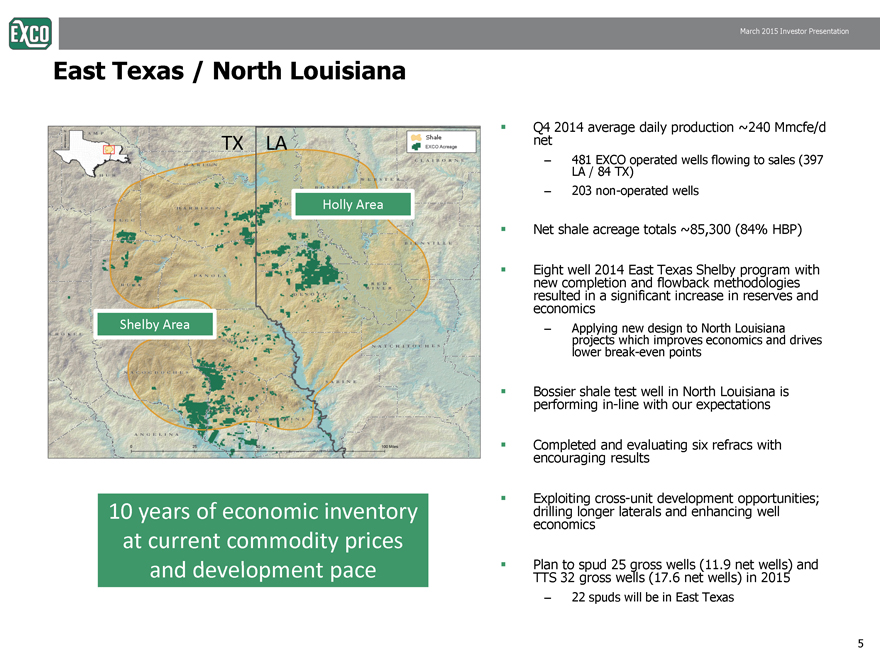
East Texas / North Louisiana
Q4 2014 average daily production ~240 Mmcfe/d
net
– 481 EXCO operated wells flowing to sales (397
LA / 84 TX)
203 non TX LA
– non-operated wells
Net shale acreage totals ~85,300 (84% HBP)
Eight well 2014 East Texas Shelby program with
new flowback Holly Area
completion and methodologies
resulted in a significant increase in reserves and
economics
– Applying new design to North Louisiana
projects which improves economics and drives
lower break-even points
Shelby Area
Bossier shale test well in North Louisiana is
performing in-line with our expectations
Completed and evaluating six refracs with
encouraging results
Exploiting cross-unit development opportunities;
drilling longer laterals and enhancing well
economics
to gross 11 9 net and
10 years of economic inventory
at current commodity prices
Plan spud 25 wells (11.9 wells) TTS 32 gross wells (17.6 net wells) in 2015
– 22 spuds will be in East Texas
5
|
|
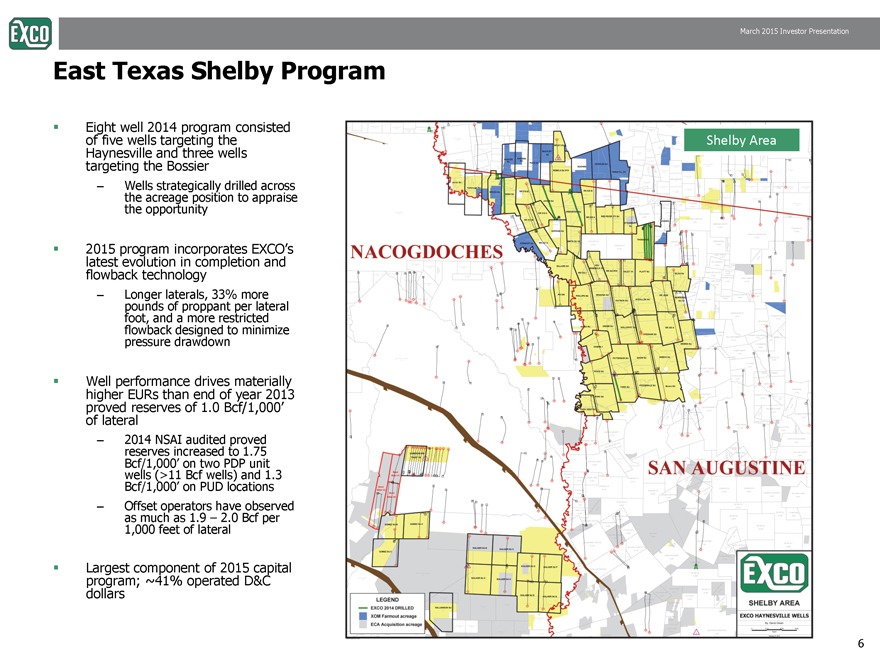
East Texas Shelby Program
Eight well 2014 program consisted
of five wells targeting the
Haynesville and three wells
targeting the Bossier
Wells drilled Shelby Area
strategically across
the acreage position to appraise
the opportunity
2015 program incorporates EXCO’s
latest evolution in completion and
flowback technology
– Longer laterals, 33% more
pounds of proppant per lateral
foot, and a more restricted
flowback designed to minimize
pressure drawdown
Well performance drives materially
higher EURs than end of year 2013
proved reserves of 1.0 Bcf/1,000’
of lateral
– 2014 NSAI audited proved
reserves increased to 1.75
Bcf/1,000’ on two PDP unit
wells (>11 Bcf wells) and 1.3
Bcf/1,000’ on PUD locations
– Offset operators have observed
as much as 1.9 – 2.0 Bcf per
1,000 feet of lateral
of capital
Largest component 2015 program; ~41% operated D&C
Dollars
| 6 |
|
|
|
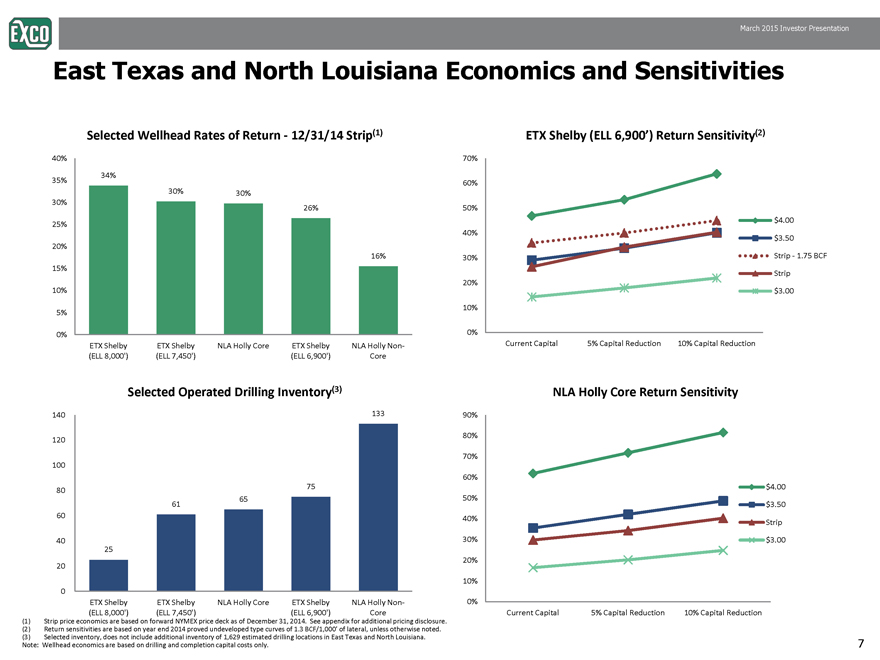
East Texas and North Louisiana Economics and Sensitivities
34% 30% 35% 40%
Selected Wellhead Rates of Return—12/31/14 Strip(1)
60% 70%
ETX Shelby (ELL 6,900’) Return Sensitivity(2)
30% 26% 16% 15% 20% 25% 30% 20% 30% 40%
50% $4.00
$3.50 Strip—1.75 BCF
Strip
0%
5%
10%
ETX Shelby
(ELL 8,000’)
ETX Shelby
(ELL 7,450’)
NLA Holly Core ETX Shelby
(ELL 6,900’)
NLA Holly Non-
Core
0%
10%
Current Capital 5% Capital Reduction 10% Capital Reduction
$3.00 133 100 120 140 Selected Operated Drilling Inventory(3) 70%
80% 90%
NLA Holly Core Return Sensitivity 25 61 65
75 20
40 60 80 20% 30% 40% 50%
60%
$4.00
$3.50
Strip
$3.00 0
ETX Shelby
(ELL 8,000’)
ETX Shelby
(ELL 7,450’)
NLA Holly Core ETX Shelby
(ELL 6,900’)
NLA Holly Non-
Core
0% 10%
Current Capital 5% Capital Reduction 10% Capital Reduction
(1) Strip price economics are based on forward NYMEX price deck as of December 31, 2014. See appendix for additional pricing disclosure.
(2) Return sensitivities are based on year end 2014 proved undeveloped type curves of 1.3 BCF/1,000’ of lateral, unless otherwise noted.
(3) Selected inventory, does not include additional inventory of 1,629 estimated drilling locations in East Texas and North Louisiana.
Note: Wellhead economics are based on drilling and completion capital costs only.
7
|
|
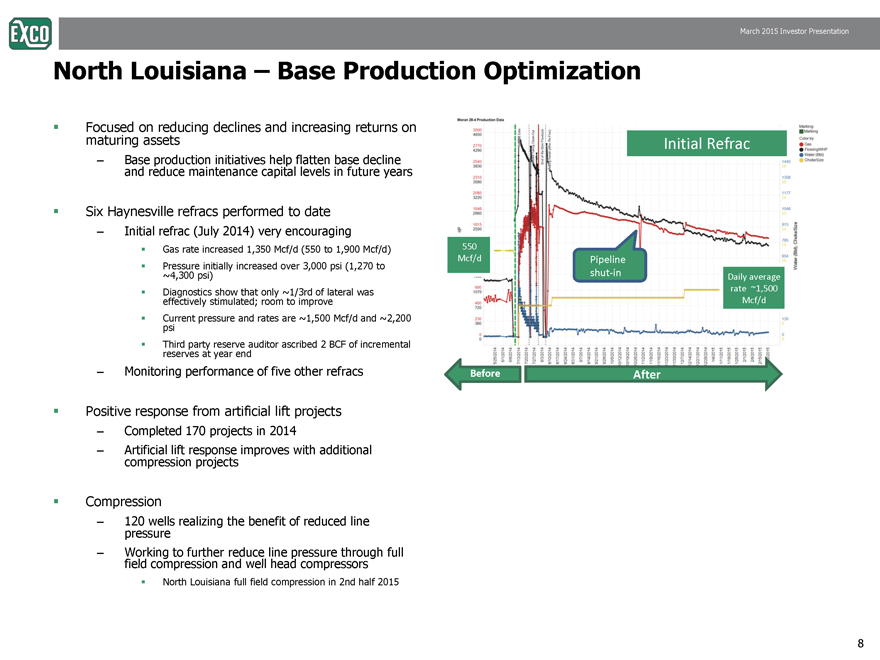
North Louisiana – Base Production Optimization
Focused on reducing declines and increasing returns on
maturing assets
– Base production initiatives help flatten base decline
and reduce maintenance capital levels in future years
Initial Refrac
Six Haynesville refracs performed to date
– Initial refrac (July 2014) very encouraging
Gas rate increased 1,350 Mcf/d (550 to 1,900 Mcf/d)
Pressure initially increased over 3,000 psi (1,270 to
~4,300 psi) Daily average
Pipeline
shut-in
550
Mcf/d
Diagnostics show that only ~1/3rd of lateral was
effectively stimulated; room to improve
Current pressure and rates are ~1,500 Mcf/d and ~2,200
psi
Third party reserve auditor ascribed 2 BCF of incremental
reserves at year end
– Monitoring performance of five other refracs
rate ~1,500
Mcf/d
g p Before After
Positive response from artificial lift projects
– Completed 170 projects in 2014
– Artificial lift response improves with additional
compression projects
Compression
– 120 wells realizing the benefit of reduced line
pressure
– Working to further reduce line pressure through full
field compression and well head compressors
North Louisiana full field compression in 2nd half 2015
8
|
|
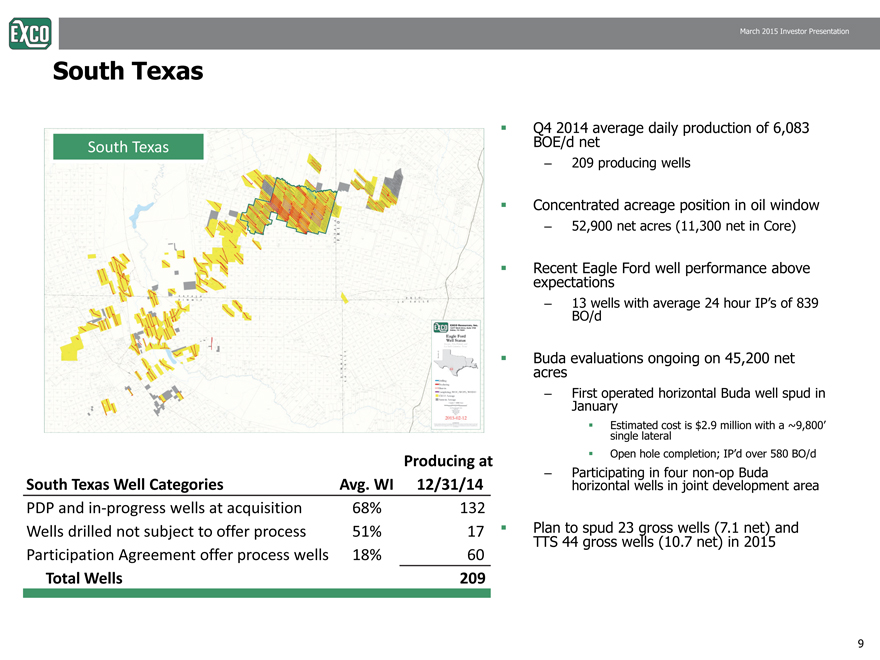
South Texas
South Texas
Q4 2014 average daily production of 6,083 BOE/d net
209 producing wells
Concentrated acreage position in oil window
52,900 net acres (11,300 net in Core)
Recent Eagle Ford well performance above expectations
13 wells with average 24 hour IP’s of 839 BO/d
Buda evaluations ongoing on 45,200 net acres
First operated horizontal Buda well spud in January
Estimated cost is $2.9 million with a ~9,800’ single lateral
Open hole completion; IP’d over 580 BO/d
Participating in four non-op Buda horizontal wells in joint development area
Plan to spud 23 gross wells (7.1 net) and TTS 44 gross wells (10.7 net) in 2015
South Texas Well Categories
PDP and in-progress wells at acquisition
Wells drilled not subject to offer process
Participation Agreement offer process wells
Total Wells
Producing at
Avg. WI
12/31/14 68% 51% 18% 132 17 60 209
9
|
|
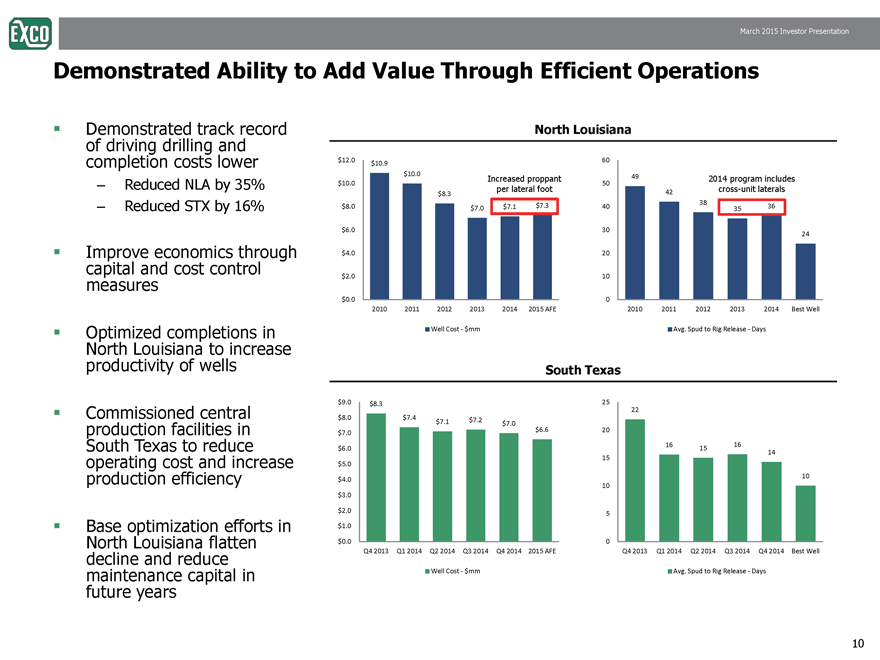
Demonstrated Ability to Add Value Through Efficient Operations
Demonstrated track record North Louisiana
of driving drilling and
completion costs lower
– 35%
49
50
60
Increased proppant
2014 program includes
cross unit laterals
$10.9
$10.0
$10.0
$12.0
Reduced NLA by – Reduced STX by 16%
Improve economics through
capital and cost control
measures
42
38
35 36
24
10
20
30
40
per lateral foot
cross-$8.3
$7.0 $7.1 $7.3
$2.0
$4.0
$6.0
$8.0
South Texas
Optimized completions in
North Louisiana to increase
productivity of wells
0
2010 2011 2012 2013 2014 Best Well
Avg. Spud to Rig Release—Days
$0.0
2010 2011 2012 2013 2014 2015 AFE
Well Cost—$mm
Commissioned central
production facilities in
South Texas to reduce
operating cost and increase
$8.3
$7.4 $7.1 $7.2 $7.0
$6.6
$5.0
$6.0
$7.0
$8.0
$9.0
22
16 15 16
14
15
20
25
p g
production efficiency
Base optimization efforts in
North Louisiana flatten
decline and reduce
$0.0
$1.0
$2.0
$3.0
$4.0
Q4 2013 Q1 2014 Q2 2014 Q3 2014 Q4 2014 2015 AFE
10
0
5
10
Q4 2013 Q1 2014 Q2 2014 Q3 2014 Q4 2014 Best Well
10
maintenance capital in
future years
Well Cost—$mm Avg. Spud to Rig Release—Days
10
|
|
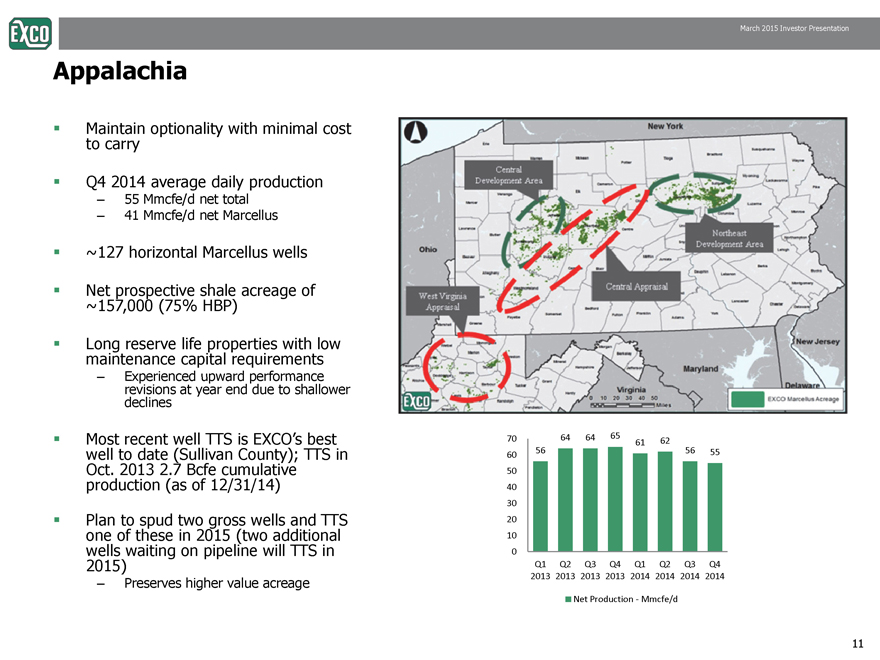
Appalachia
Maintain optionality with minimal cost
to carry
Q4 2014 average daily production
– 55 Mmcfe/d net total
– 41 Mmcfe/d net Marcellus
~127 horizontal Marcellus wells
Net prospective shale acreage of
~157,000 (75% HBP)
Long reserve life properties with low
maintenance capital requirements
– Experienced upward performance
revisions at year end due to shallower
declines
Most recent well TTS is EXCO’s best
well to date (Sullivan County); TTS in
Oct 2013 2 7 Bcfe 56
64 64 65
61 62
56 55
50
60
70
Oct. 2.7 cumulative
production (as of 12/31/14)
Plan to spud two gross wells and TTS
one of these in 2015 (two additional
wells waiting on pipeline will TTS in
2015)
0
10
20
30
40
Q1
Q2
Q3
Q4
Q1
Q2
Q3
Q4
– Preserves higher value acreage
2013
2013
2013
2013
2014
2014
2014
2014
Net Production—Mmcfe/d
11
|
|
Multi-Year Value Creation Opportunities Across EXCO’s Portfolio
Shifting development to later years enhances returns with contango commodity
prices
East Texas
– Opportunity to add additional PDP and PUD reserves; well results driving increased reserves
– Drive additional return through fine-tuning D&C program, leveraging existing infrastructure
and managing costs
North Louisiana
– Success of refrac program adds additional reserves; continue to evaluate results
– Bossier shale drilling could prove up additional locations and support an improved type curve
– Base production initiatives help flatten base decline and reduce maintenance capital levels in
future years
South Texas
– Recent well performance is supporting additional reserves over year end 2014 proved
reserves
– Buda delineation provides opportunity to add drilling locations
l h
Appalachia
– Recent well performance can drive increased EUR’s on offset locations
12
|
|
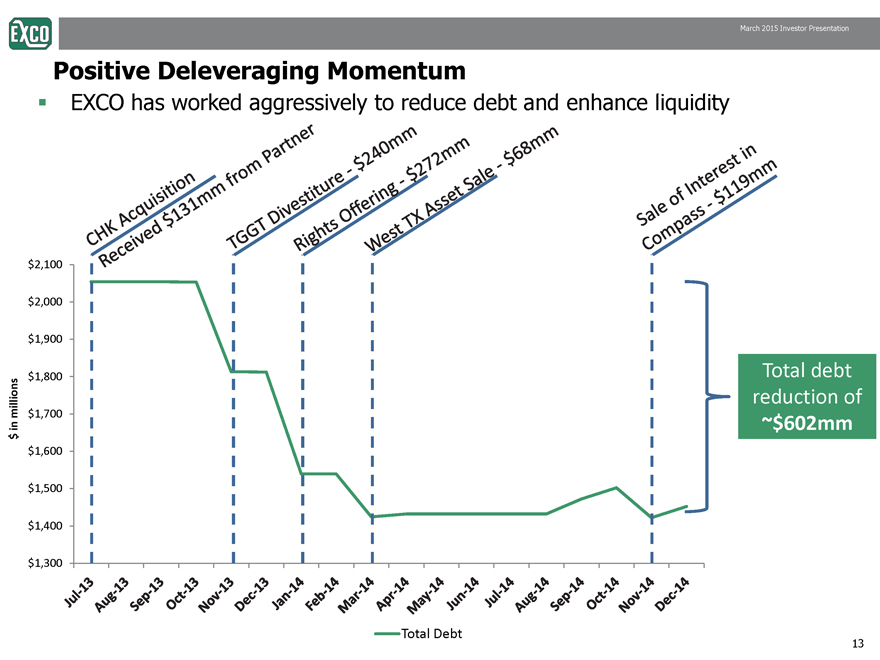
Positive Deleveraging Momentum
EXCO has worked aggressively to reduce debt and enhance liquidity
$2,100
$1 800
$1,900
$2,000
Total $1,600
$1,700
1,800
$ in millions
debt
reduction of
~$602mm
$1 300
$1,400
$1,500
1,300
Total Debt
13
|
|
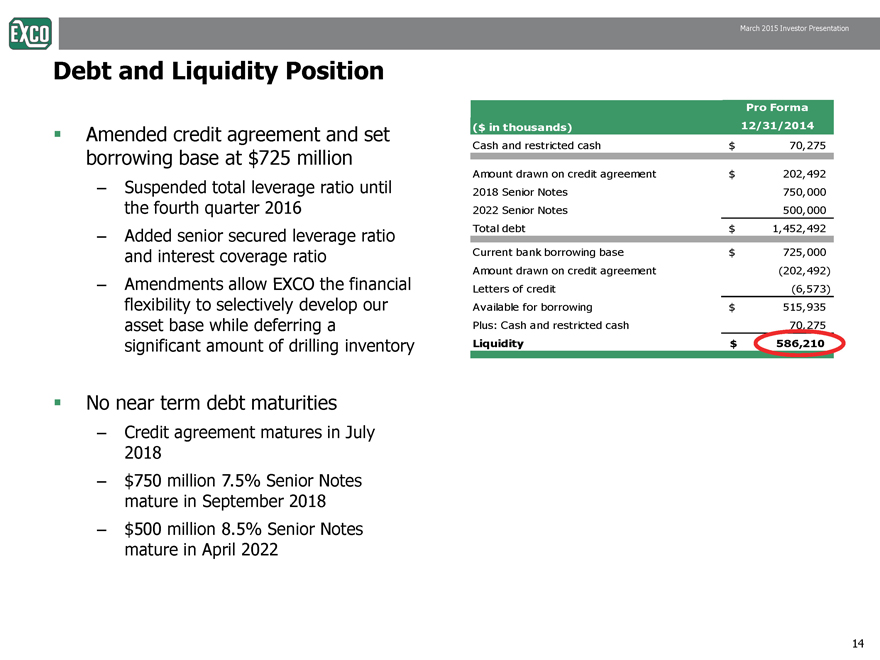
Debt and Liquidity Position
Pro Forma
($ in thousands) 12/31/2014
Cash and restricted cash $ 70,275
Amount drawn on credit agreement $ 202,492
2018 S i N 750 000
Amended credit agreement and set
borrowing base at $725 million
– until
Senior Notes 750,000
2022 Senior Notes 500,000
Total debt $ 1,452,492
Current bank borrowing base $ 725,000
Amount drawn on credit agreement (202,492)
Suspended total leverage ratio the fourth quarter 2016
– Added senior secured leverage ratio
and interest coverage ratio
financial
Letters of credit (6,573)
Available for borrowing $ 515,935
Plus: Cash and restricted cash 70,275
Liquidity $ 5 86,210
– Amendments allow EXCO the flexibility to selectively develop our
asset base while deferring a
significant amount of drilling inventory
No near term debt maturities
– Credit agreement matures in July
2018
– $750 million 7.5% Senior Notes
mature in September 2018
– $500 million 8.5% Senior Notes
mature in April 2022
14
|
|
South Texas Offer Process Update
Made first offer for seven wells in January for $15 million
– One Committed well (approximately $3 million) and six Uncertainty wells
– Offer is based on PV-10 of seven wells using current strip pricing
– Offers on Uncertainty wells do not need to be accepted by our partner
KKR has accepted EXCO’s offer for the one Committed well and two Uncertainty wells
– Total consideration of approximately $7.5 million is approximately 90% of offered PV-10
– Acquired production of approximately 200 BOPD at an attractive multiple of approximately
$37,500 per flowing barrel
– Transaction closed in March
34 additional wells are expected to be included in the offer process during the
remainder of 2015
– Not all 34 wells will meet the Committed Well criteria when the initial offer is made which
would lower the 2015 acquisition capital
– The number of offer wells that are accepted in 2015 may be lower than the 41 offer wells
EXCO has not included any offer tranches in its 2015 production and financial
forecast
15
|
|
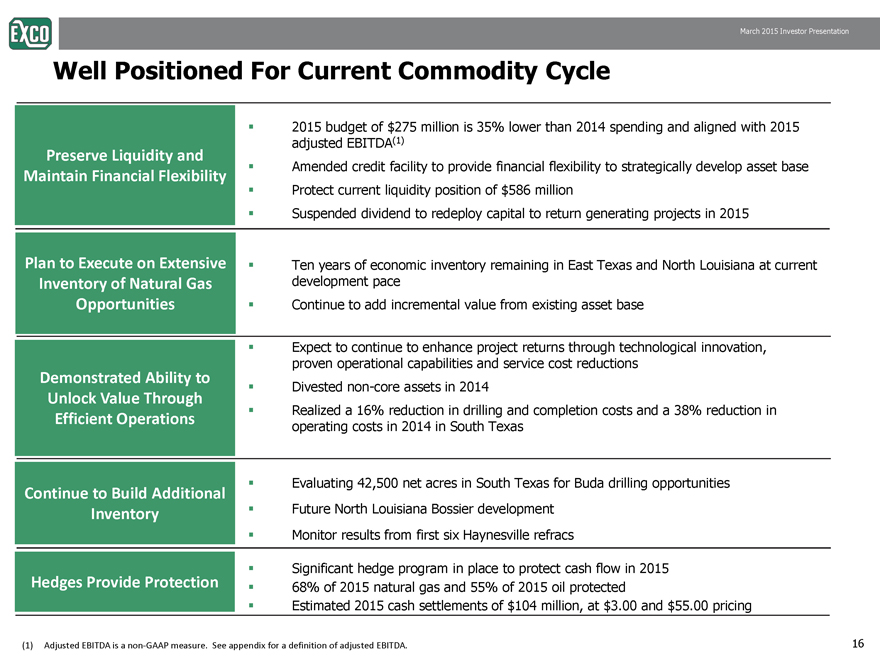
Well Positioned For Current Commodity Cycle
Preserve Liquidity and
Maintain Financial Flexibility
2015 budget of $275 million is 35% lower than 2014 spending and aligned with 2015
adjusted EBITDA(1)
Amended credit facility to provide financial flexibility to strategically develop asset base
Protect current position of $Plan to Execute on Extensive
of Natural Gas
Ten years of economic inventory remaining in East Texas and North Louisiana at current
pace
liquidity 586 million
Suspended dividend to redeploy capital to return generating projects in 2015
Inventory Opportunities
development Continue to add incremental value from existing asset base
Expect to continue to enhance project returns through technological innovation,
proven operational capabilities and service cost reductions
Demonstrated to
Divested non-core assets in 2014
Realized a 16% reduction in drilling and completion costs and a 38% reduction in
operating costs in 2014 in South Texas
Ability Unlock Value Through
Efficient Operations
Continue to Build Additional
Inventory
Evaluating 42,500 net acres in South Texas for Buda drilling opportunities
Future North Louisiana Bossier development
Monitor results from first six Haynesville refracs
2015
Hedges Provide Protection
Significant hedge program in place to protect cash flow in 68% of 2015 natural gas and 55% of 2015 oil protected
Estimated 2015 cash settlements of $104 million, at $3.00 and $55.00 pricing
Adjusted EBITDA is a non-GAAP measure. See appendix for a definition of adjusted EBITDA.
16
|
|

EXCO Resources, Inc.
Appendix
|
|
Year End 2014 Proved Reserves
1,600
1,800
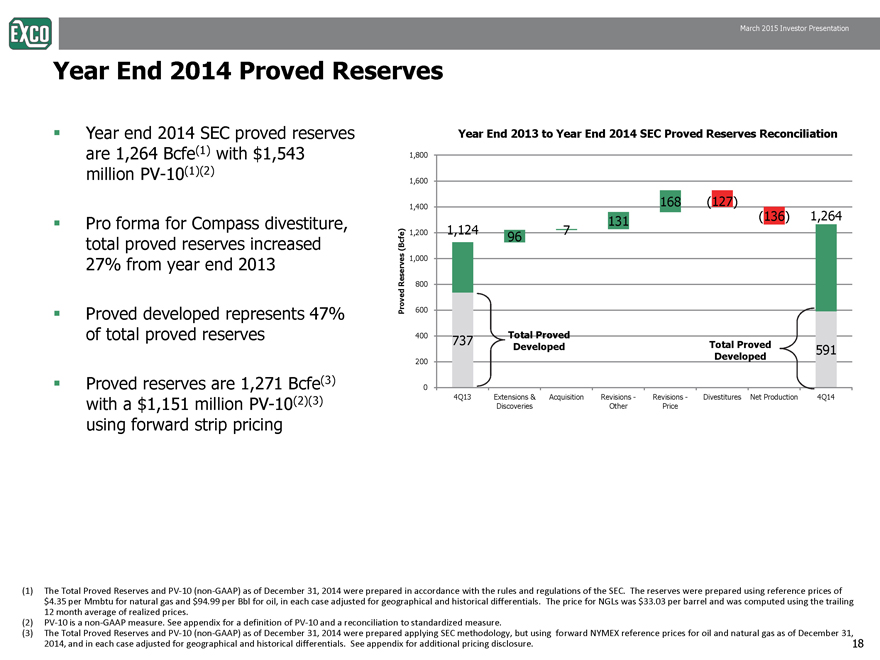
Year end 2014 SEC proved reserves Year End 2013 to Year End 2014 SEC Proved Reserves Reconciliation
are 1,264 Bcfe(1) with $1,543
million PV-10(1)(2)
1,124 96 7
131
168 (127)
(136) 1,264
800
1,000
1,200
1,400
Reserves (Bcfe)
Pro forma for Compass divestiture,
total proved reserves increased
27% from year end 2013
737
591
200
400
600
Proved R
Total Proved
Developed
Total Proved
Developed
Proved developed represents 47%
of total proved reserves
P d 1 271 B f (3)
0
4Q13 Extensions &
Discoveries
Acquisition Revisions -
Other
Revisions -
Price
Divestitures Net Production 4Q14
Proved reserves are 1,271 Bcfe(with a $1,151 million PV-10(2)(3)
using forward strip pricing
(1) The Total Proved Reserves and PV-10 (non-GAAP) as of December 31, 2014 were prepared in accordance with the rules and regulations of the SEC. The reserves were prepared using reference prices of
$4.35 per Mmbtu for natural gas and $94.99 per Bbl for oil, in each case adjusted for geographical and historical differentials. The price for NGLs was $33.03 per barrel and was computed using the trailing
12 month average of realized prices.
(2) PV-10 is a non-GAAP measure. See appendix for a definition of PV-10 and a reconciliation to standardized measure.
(3) The Total Proved Reserves and PV-10 (non-GAAP) as of December 31, 2014 were prepared applying SEC methodology, but using forward NYMEX reference prices for oil and natural gas as of December 31,
2014, and in each case adjusted for geographical and historical differentials. See appendix for additional pricing disclosure.
18
|
|
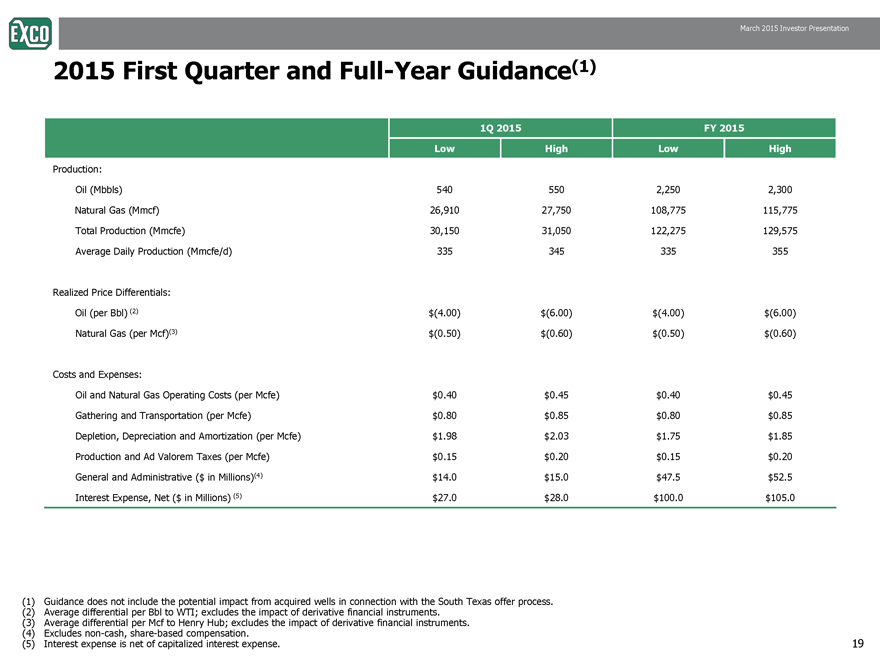
2015 First Quarter and Full-Year Guidance(1)
1Q 2015 FY 2015
Low High Low High
Production:
Oil (Mbbls) 540 550 2,250 2,300
Natural Gas (Mmcf) 26,910 27,750 108,775 115,775
Total Production (Mmcfe) 30,150 31,050 122,275 129,575
Average Daily Production (Mmcfe/d) 335 345 335 355
Realized Price Differentials:
Oil (per Bbl) (2) $(4.00) $(6.00) $(4.00) $(6.00)
Natural Gas (per Mcf)(3) $(0.50) $(0.60) $(0.50) $(0.60)
Costs and Expenses:
Oil and Natural Gas Operating Costs (per Mcfe) $0.40 $0.45 $0.40 $0.45
Gathering and Transportation (per Mcfe) $0.80 $0.85 $0.80 $0.85
Depletion, Depreciation and Amortization (per Mcfe) $1.98 $2.03 $1.75 $1.85
Production and Ad Valorem Taxes (per Mcfe) $0.15 $0.20 $0.15 $0.20
General and Administrative ($ in Millions)(4) $14.0 $15.0 $47.5 $52.5
Interest Expense, Net ($ in Millions) (5) $27.0 $28.0 $100.0 $105.0
(1) Guidance does not include the potential impact from acquired wells in connection with the South Texas offer process.
(2) Average differential per Bbl to WTI; excludes the impact of derivative financial instruments.
(3) Average differential per Mcf to Henry Hub; excludes the impact of derivative financial instruments.
(4) Excludes non-cash, share-based compensation.
(5) Interest expense is net of capitalized interest expense.
19
|
|
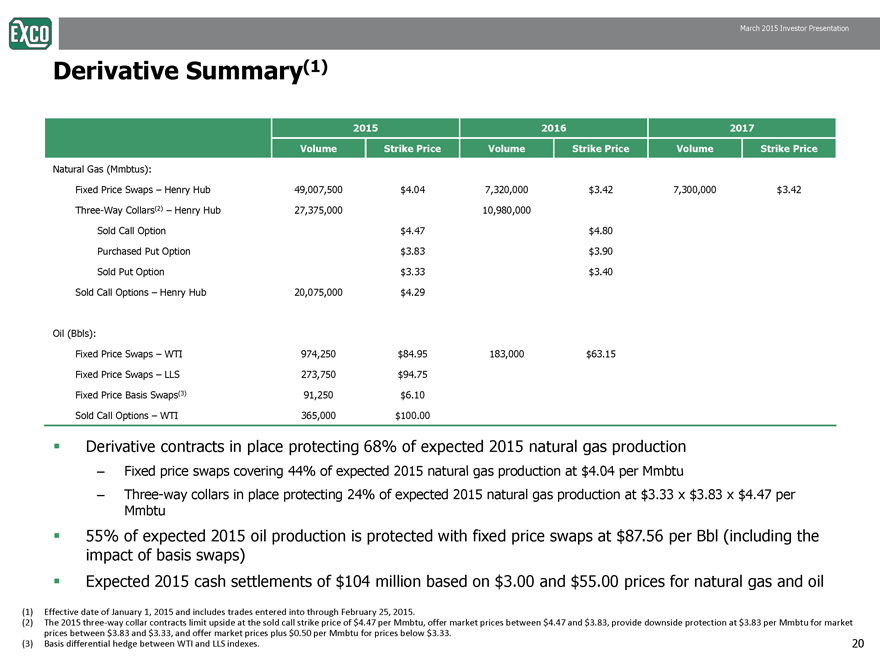
Derivative Summary(1)
2015 2016 2017
Volume Strike Price Volume Strike Price Volume Strike Price
Natural Gas (Mmbtus):
Fixed Price Swaps – Henry Hub 49,007,500 $4.04 7,320,000 $3.42 7,300,000 $3.42
Three-Way Collars(2) – Henry Hub 27,375,000 10,980,000
Sold Call Option $4.47 $4.80
Purchased Put Option $3.83 $3.90
Sold Put Option $3.33 $3.40
Sold Call Options – Henry Hub 20,075,000 $4.29
Oil (Bbls):
Fixed Price Swaps – WTI 974,250 $84.95 183,000 $63.15
Fixed Price Swaps – LLS 273,750 $94.75
Fixed Price Basis Swaps(3) 91,250 $6.10
Sold Call Options – WTI 365,000 $100.00
Derivative contracts in place protecting 68% of expected 2015 natural gas production
– Fixed price swaps covering 44% of expected 2015 natural gas production at $4.04 per Mmbtu
– Three-way collars in place protecting 24% of expected 2015 natural gas production at $3.33 x $3.83 x $4.47 per
Mmbtu
55% of expected 2015 oil production is protected with fixed price swaps at $87.56 per Bbl (including the
impact of basis swaps)
Expected 2015 cash settlements of $104 million based on $3.00 and $55.00 prices for natural gas and oil
(1) Effective date of January 1, 2015 and includes trades entered into through February 25, 2015.
(2) The 2015 three-way collar contracts limit upside at the sold call strike price of $4.47 per Mmbtu, offer market prices between $4.47 and $3.83, provide downside protection at $3.83 per Mmbtu for market
prices between $3.83 and $3.33, and offer market prices plus $0.50 per Mmbtu for prices below $3.33.
(3) Basis differential hedge between WTI and LLS indexes.
20
|
|
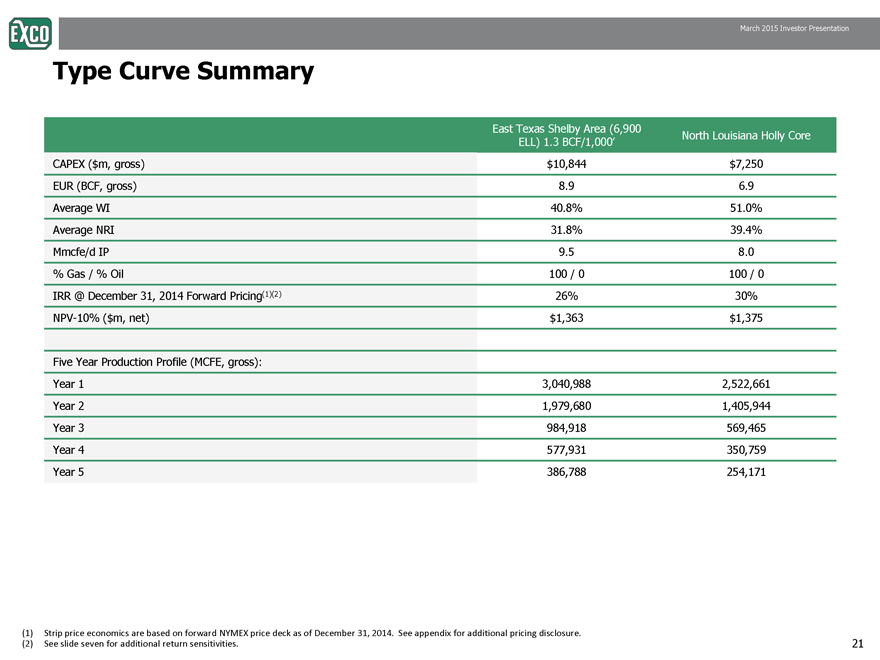
Type Curve Summary
East Texas Shelby Area (6,900
ELL) 1.3 BCF/1,000’ North Louisiana Holly Core
CAPEX ($m, gross) $10,844 $7,250
EUR (BCF, gross) 8.9 6.9
Average WI 40.8% 51.0%
Average NRI 31.8% 39.4%
Mmcfe/d IP 9.5 8.0
% Gas / % Oil 100 / 0 100 / 0
IRR @ December 31, 2014 Forward Pricing(1)(2) 26% 30%
NPV-10% ($m, net) $1,363 $1,375
Five Year Production Profile (MCFE, gross):
Year 1 3,040,988 2,522,661
Year 2 1,979,680 1,405,944
Year 3 984,918 569,465
Year 4 577,931 350,759
Year 5 386,788 254,171
(1) Strip price economics are based on forward NYMEX price deck as of December 31, 2014. See appendix for additional pricing disclosure.
(2) See slide seven for additional return sensitivities.
21
|
|
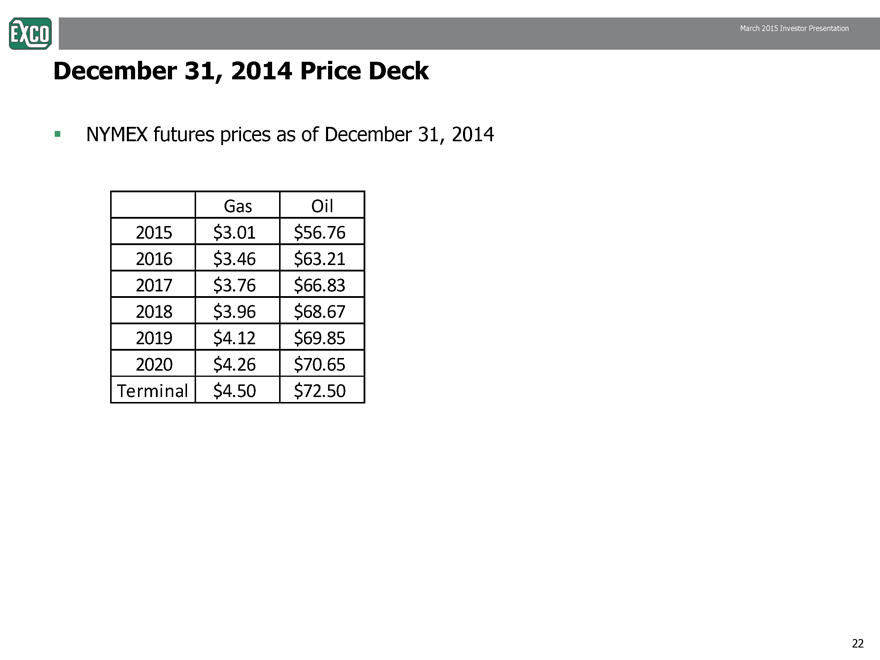
December 31, 2014 Price Deck
NYMEX futures prices as of December 31, 2014
Gas Oil
2015 $3.01 $56.76
2016 $3.46 $63.21
2017 $3.76 $66.83
2018 $3.96 $68.67
2019 $4.12 $69.85
2020 $4.26 $70.65
Terminal $4.50 $72.50
22
|
|
Forward Looking Statements
This presentation contains forward-looking statements, as defined in Section 27A of the Securities Act of 1933, as amended, or the Securities Act, and Section 21E of the Securities Exchange Act of 1934, as amended, or the Exchange Act.
These forward-looking statements relate to, among other things, the following:
our future financial and operating performance and results;
our business strategy;
market prices;
our future use of derivative financial instruments; and
our plans and forecasts.
We have based these forward-looking statements on our current assumptions, expectations and projections about future events.
We use the words “may,” “expect,” “anticipate,” “estimate,” “believe,” “continue,” “intend,” “plan,” “potential,” “project,” “budget” and other similar words to identify forward-looking statements. The statements that contain these words
should be read carefully because they discuss future expectations, contain projections of results of operations or our financial condition and/or state other “forward-looking” information. We do not undertake any obligation to update or
revise any forward-looking statements, except as required by applicable securities laws. These statements also involve risks and uncertainties that could cause our actual results or financial condition to materially differ from our expectations
in this presentation, including, but not limited to:
fluctuations in the prices of oil, natural gas and natural gas liquids;
the availability of oil, natural gas and natural gas liquids;
future capital requirements and availability of financing;
our ability to meet our current and future debt service obligations, including our ability to maintain compliance with our debt covenants;
disruption of credit and capital markets and the ability of financial institutions to honor their commitments;
estimates of reserves and economic assumptions, including estimates related to acquisitions of oil and natural gas properties;
geological concentration of our reserves;
risks associated with drilling and operating wells;
exploratory risks, including those related to our activities in shale formations;
discovery, acquisition, development and replacement of oil and natural gas reserves;
cash flow and liquidity;
timing and amount of future production of oil and natural gas;
availability of drilling and production equipment;
availability of water and other materials for drilling and completion activities;
marketing of oil and natural gas;
political and economic conditions and events in oil-producing and natural gas-producing countries;
title to our properties;
litigation;
competition;
our ability to attract and retain key personnel, including our search for a chief executive officer;
general economic conditions, including costs associated with drilling and operations of our properties;
environmental or other governmental regulations, including legislation to reduce emissions of greenhouse gases, legislation of derivative financial instruments, regulation of hydraulic fracture stimulation and elimination of income
tax incentives available to our industry;
receipt and collectability of amounts owed to us by purchasers of our production and counterparties to our derivative financial instruments;
decisions whether or not to enter into derivative financial instruments;
potential acts of terrorism;
our ability to manage joint ventures with third parties, including the resolution of any material disagreements and our partners’ ability to satisfy obligations under these arrangements;
actions of third party co-owners of interests in properties in which we also own an interest;
fluctuations in interest rates; and
our ability to effectively integrate companies and properties that we acquire.
We believe that it is important to communicate our expectations of future performance to our investors. However, events may occur in the future that we are unable to accurately predict, or over which we have no control. We caution users
of the financial statements not to place undue reliance on a forward-looking statement. When considering our forward-looking statements, keep in mind the cautionary statements and the risk factors included in our Annual Report on Form
10-K for the year ended December 31, 2013, filed with the Securities and Exchange Commission, or the SEC, on February 26, 2014 and after February 25, 2015 our annual Report on Form 10-K for the year ended December 31, 2014, and
our other periodic filings with the SEC.
Our revenues, operating results and financial condition substantially depend on prevailing prices for oil and natural gas and the availability of capital from our credit agreement, or the EXCO Resources Credit Agreement. Declines in oil or
natural gas prices may have a material adverse effect on our financial condition, liquidity, results of operations, the amount of oil or natural gas that we can produce economically and the ability to fund our operations. Historically, oil and
natural gas prices and markets have been volatile, with prices fluctuating widely, and they are likely to continue to be volatile.
23
|
|
Proved Reserves, PV-10, EBITDA and Adjusted EBITDA
Proved Reserves and PV-10 (Non-GAAP)
The PV-10 data used in the slide was based on reference prices using the simple average of the spot prices for the trailing 12 month period using the first day of each month beginning on January 1, 2014 and ending on December 1, 2014,
of $4.35 per Mmbtu for natural gas and $94.99 per Bbl for oil, in each case adjusted for geographical and historical differentials. The price for NGLs was $33.03 per barrel and was computed on the trailing 12 month average of realized
prices. Market prices for oil, natural gas and NGLs are volatile (see the forward looking statements slide for additional risk factors). We believe that PV-10, while not a financial measure in accordance with generally accepted accounting
principles in the United States (“GAAP”), is an important financial measure used by investors and independent oil and natural gas producers for evaluating the relative significance of oil and natural gas properties and acquisitions due to tax
characteristics which can differ significantly among comparable companies. The total Standardized Measure, a measure recognized under GAAP, as of December 31, 2014 was $1.5 billion. The Standardized Measure represents the PV-10
after giving effect to income taxes, and is calculated in accordance with the Financial Accounting Standards Board (“FASB”) Accounting Standards Codification (“ASC”) 932, Extractive Activities, Oil and Gas (“ASC 932”). Our existing net
loss carryforwards eliminated estimated future income taxes for the 31 2014 costs PV 10 these operating year ended December 31, 2014. The amount of estimated future plugging and abandonment costs, the PV-of costs and the Standardized Measure
were determined by us. We do not designate our derivative financial instruments as hedges and accordingly, do not include the impact of derivative financial instruments when computing the Standardized Measure.
Reconciliation of PV-10 (Non-GAAP) to Standardized Measure (GAAP)
There is no difference in Standardized Measure (GAAP) and PV-10 (Non-GAAP) for all years presented as the impacts of net operating loss carry-forwards eliminated future income taxes.
EBITDA and Adjusted EBITDA
Earnings before interest, taxes, depreciation, depletion and amortization, or “EBITDA” represents net income adjusted to exclude interest expense, income taxes and depletion, depreciation and amortization. “Adjusted EBITDA” represents
EBITDA adjusted to exclude other operating items impacting comparability, accretion of discount on asset retirement obligations, non-cash changes in the fair value of derivatives, non-cash impairments of assets, stock-based compensation
and income or losses from equity method investments. We have presented EBITDA and Adjusted EBITDA because they are a widely used measure by investors, analysts and rating agencies for valuations, peer comparisons and investment
recommendations. In addition, similar measures are used in covenant calculations required under our credit agreement, the indenture governing our 7.5% senior notes due September 15, 2018 (“2018 Notes”), and the indenture governing
our 8.5% senior notes due April 15, 2022 (“2022 Notes”). Compliance with the liquidity and debt incurrence covenants included in these agreements is considered material to us. Our computations of EBITDA and Adjusted EBITDA may
differ from computations of similarly titled measures of other companies due to differences in the inclusion or exclusion of items in our computations as compared to those of others. EBITDA and Adjusted EBITDA are measures that are not
prescribed by GAAP. EBITDA and Adjusted EBITDA specifically exclude changes in working capital, capital expenditures and other items that are set forth on a cash flow statement presentation of a company’s operating, investing and
financing activities. As such, we encourage investors not to use these measures as substitutes for the determination of net income, net cash provided by operating activities or other similar GAAP measures. The calculation of EBITDA and
Adjusted EBITDA as presented herein differ in certain respects from the calculation of comparable measures in the EXCO Resources Credit Agreement, the indenture governing our 2018 Notes and the indenture governing our 2022 Notes.
24
|
|
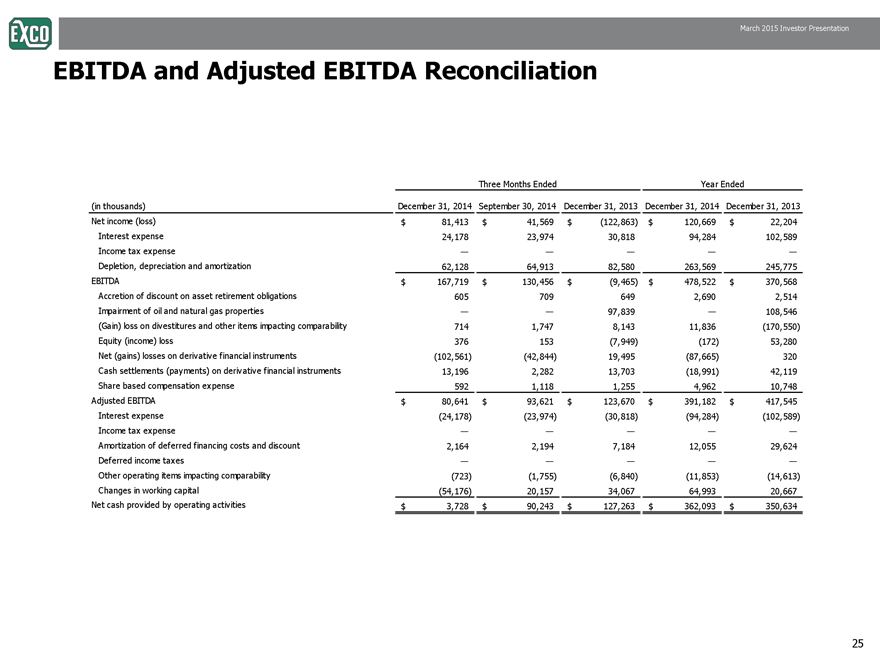
EBITDA and Adjusted EBITDA Reconciliation
Three Months Ended Year Ended
(in thousands) December 31, 2014 September 30, 2014 December 31, 2013 December 31, 2014 December 31, 2013
Net income (loss) $ 81,413 $ 4 1,569 $ (122,863) $ 120,669 $ 22,204
Interest expense 24,178 23,974 30,818 94,284 102,589
Income tax expense
Depletion, depreciation and amortization 62,128 64,913 82,580 263,569 245,775
EBITDA $ 167,719 $ 1 30,456 $ (9,465) $ 478,522 $ 370,568
Accretion of discount on asset retirement obligations 605 709 649 2,690 2,514
Impairment of oil and natural gas properties — — 97,839 — 108,546
(Gain) loss on divestitures and other items impacting comparability 714 1,747 8,143 11,836 (170,550)
Equity (income) loss 376 153 (7,949) (172) 53,280
Net (gains) losses on derivative financial instruments (102,561) (42,844) 19,495 (87,665) 320
Cash settlements (payments) on derivative financial instruments 13,196 2,282 13,703 (18,991) 42,119
Share based compensation expense 592 1,118 1,255 4,962 10,748
Adjusted EBITDA $ 80,641 $ 9 3,621 $ 123,670 $ 391,182 $ 417,545
Interest expense (24,178) (23,974) (30,818) (94,284) (102,589)
Income tax expense
Amortization of deferred financing costs and discount 2,164 2,194 7,184 12,055 29,624
Deferred income taxes
Other operating items impacting comparability (723) (1,755) (6,840) (11,853) (14,613)
Changes in working capital (54,176) 20,157 34,067 64,993 20,667
Net cash provided by operating activities $ 3,728 $ 90,243 $ 127,263 $ 362,093 $ 350,634
25