Attached files
UNITED STATES
SECURITIES AND EXCHANGE COMMISSION
Washington, D.C. 20549
______________________________
FORM 10-K
______________________________
x | ANNUAL REPORT PURSUANT TO SECTION 13 OR 15(d) OF THE SECURITIES EXCHANGE ACT OF 1934 |
For the Fiscal Year Ended December 31, 2016
OR
o | TRANSITION REPORT PURSUANT TO SECTION 13 OR 15(d) OF THE SECURITIES EXCHANGE ACT OF 1934 |
For the transition period from to
Commission File Number 001-32743
______________________________
EXCO RESOURCES, INC.
(Exact name of registrant as specified in its charter)
______________________________
Texas | 74-1492779 | |
(State or other jurisdiction of incorporation or organization) | (I.R.S. Employer Identification No.) | |
12377 Merit Drive Suite 1700 Dallas, Texas | 75251 | |
(Address of principal executive offices) | (Zip Code) | |
Registrant’s telephone number, including area code: (214) 368-2084
Securities registered pursuant to Section 12(b) of the Act:
Title of each class | Name of each exchange on which registered | |
Common Shares, $0.001 par value | New York Stock Exchange | |
Securities registered pursuant to Section 12(g) of the Act:
None
(Title of class)
______________________________
Indicate by check mark if the registrant is a well-known seasoned issuer, as defined in Rule 405 of the Securities
Act. YES o NO x
Indicate by check mark if the registrant is not required to file reports pursuant to Section 13 or Section 15(d) of the Act. YES o NO x
Indicate by check mark whether the registrant (1) has filed all reports required to be filed by Section 13 or 15(d) of the Securities Exchange Act of 1934 during the preceding 12 months (or for such shorter period that the registrant was required to file such reports), and (2) has been subject to such filing requirements for the past 90 days. YES x NO o
Indicate by check mark whether the registrant has submitted electronically and posted on its corporate website, if any, every Interactive Data File required to be submitted and posted pursuant to Rule 405 of Regulation S-T (§232.405 of this chapter) during the preceding 12 months (or for such shorter period that the registrant is required to submit and post such files). YES x NO o
Indicate by check mark if disclosure of delinquent filers pursuant to Item 405 of Regulation S-K (§229.405 of this chapter) is not contained herein, and will not be contained, to the best of registrant's knowledge, in definitive proxy or information statements incorporated by reference in Part III of this Form10-K or any amendment to this Form 10-K. x
Indicate by check mark whether the registrant is a large accelerated filer, an accelerated filer, a non-accelerated filer, or a smaller reporting company. See the definitions of “large accelerated filer,” “accelerated filer” and “smaller reporting company” in Rule 12b-2 of the Exchange Act. (Check one):
Large accelerated filer | o | Accelerated filer | x | |||
Non-accelerated filer | o (Do not check if a smaller reporting company) | Smaller reporting company | o | |||
Indicate by check mark whether the registrant is a shell company (as defined in Rule 12b-2 of the Exchange Act). YES o NO x
As of March 10, 2017, the registrant had 282,821,519 outstanding common shares, par value $0.001 per share, which is its only class of common shares. As of the last business day of the registrant's most recently completed second fiscal quarter, the aggregate market value of the registrant's common shares held by non-affiliates was approximately $181,081,000.
______________________________
DOCUMENTS INCORPORATED BY REFERENCE
Portions of the registrant's Definitive Proxy Statement on Schedule 14A to be furnished to shareholders in connection with its 2017 Annual Meeting of Shareholders are incorporated by reference in Part III, Items 10-14 of this Annual Report on Form 10-K.
EXCO RESOURCES, INC.
TABLE OF CONTENTS
1
EXCO RESOURCES, INC.
PART I
Item 1. Business
General
Unless the context requires otherwise, references in this Annual Report on Form 10-K to “EXCO,” “EXCO Resources,” “Company,” “we,” “us,” and “our” are to EXCO Resources, Inc. and its consolidated subsidiaries.
We have provided definitions of terms commonly used in the oil and natural gas industry in the “Glossary of selected oil and natural gas terms” section of this Annual Report on Form 10-K.
We are an independent oil and natural gas company engaged in the exploration, exploitation, acquisition, development and production of onshore U.S. oil and natural gas properties with a focus on shale resource plays. Our principal operations are conducted in certain key U.S. oil and natural gas areas including Texas, Louisiana and the Appalachia region.
Our business strategy
Our primary strategy focuses on the exploitation and development of our shale resource plays and the pursuit of leasing and acquisition opportunities. We plan to carry out this strategy by executing on a strategic plan that incorporates the following three core objectives: (i) restructuring the balance sheet to enhance our capital structure and extend structural liquidity; (ii) transforming ourselves into the lowest cost producer; and (iii) optimizing and repositioning our portfolio. We believe this strategy will allow us to create long-term value for our shareholders. The three core objectives and the Company's recent accomplishments are detailed below:
Restructuring the balance sheet to enhance our capital structure and extend structural liquidity
We remain committed to improving our financial flexibility and enhancing our capital structure. In March 2017, we closed a series of transactions intended to improved our capital structure and liquidity, including the issuance of $300.0 million in aggregate principal amount of senior secured 1.5 lien notes due March 20, 2022 ("1.5 Lien Notes"), exchange of $682.8 million in aggregate principal amount of our existing senior secured second lien term loans due October 26, 2020 ("Second Lien Term Loans") for a like amount of senior 1.75 lien term loans due October 26, 2020 ("1.75 Lien Term Loans"), and the issuance of warrants to purchase our common shares. The 1.5 Lien Notes and 1.75 Lien Term Loans provide us the option, subject to certain limitations, to pay interest in cash, common shares, or additional indebtedness. The 1.5 Lien Notes were issued to affiliates of Fairfax Financial Holdings Limited ("Fairfax"), Energy Strategic Advisory Services, LLC ("ESAS") and Oaktree Capital Management, LP ("Oaktree"), as well as an unaffiliated lender.
The proceeds from the issuance of the 1.5 Lien Notes were primarily utilized to repay the outstanding indebtedness under our credit agreement ("EXCO Resources Credit Agreement"). The EXCO Resources Credit Agreement was amended to reduce the borrowing base to $150.0 million, permit the issuance of the 1.5 Lien Notes and the exchange of Second Lien Term Loans, and modify certain financial covenants. As a result of these transactions, our cash and restricted cash plus the unused borrowing base under the EXCO Resources Credit Agreement ("Liquidity"), improved from $66.4 million as of December 31, 2016 to $181.4 million on a pro forma basis after incorporating the impact of the transactions as of December 31, 2016. The optionality for the method of interest payments on the 1.5 Lien Notes and 1.75 Lien Term Loans has the potential to reduce annual cash interest payments by approximately $109.3 million if we elect to pay interest through the issuance of common shares, subject to certain restrictions. See further discussion of these transactions as part of "Item 7. Management's Discussion and Analysis of Financial Results" and "Note 18. Subsequent Events" to the Notes to our Consolidated Financial Statements.
During 2016, we completed a cash tender offer for our outstanding unsecured notes ("Tender Offer") that resulted in the repurchase of an aggregate of $101.3 million in principal amount of the senior unsecured notes due April 15, 2022 (“2022 Notes”) for an aggregate purchase price of $40.0 million. In addition, we repurchased an aggregate of $26.4 million and $51.4 million in principal amount of our senior unsecured notes due September 15, 2018 (“2018 Notes”) and 2022 Notes, respectively, with an aggregate of $13.3 million in cash through open market repurchases during 2016.
We renegotiated certain commercial contracts including a sales contract in North Louisiana, effective January 1, 2016, that improved the rate per Mcf of natural gas and extended the term of the contracts. In South Texas, we renegotiated a sales
2
contract that improved our realized price on oil production. We remain committed to continuing our efforts to restructure certain of our gathering and transportation contracts that were not successfully renegotiated during 2016.
Transforming ourselves into the lowest cost producer
We continue to exercise fiscal discipline to transform ourselves into the lowest cost producer. Lease operating expenses decreased by 36% in 2016 compared to 2015 primarily due to the renegotiation of saltwater disposal contracts, modifications to chemical programs, enhanced use of well site automation, optimization of work schedules and less workover activity. In the Appalachia region, we divested our conventional assets, which had the highest lease operating expenses per Mcfe in our portfolio. The divestitures contributed to reduction in field employee headcount in the region of approximately 85% since December 31, 2015. Our cost reduction efforts have resulted in a decrease in total employee headcount across the portfolio of approximately 40% since December 31, 2015 and approximately 70% since December 31, 2014. The reductions in headcount and other initiatives have resulted in significant decreases in general and administrative expenses compared to prior years.
Our operational team is dedicated to the continuous improvement and innovation of well designs in order to maximize our return on capital. We reduced our drilling and completion costs through modifications to well designs, renegotiated contracts with vendors, and other efficiencies. In addition, we improved our well performance through the use of extended laterals and increased use of proppant while reducing both capital and operating costs.
Our drilling program in North Louisiana achieved strong results, further confirming that our enhanced completion methods have proven to be effective and increase the potential for higher rates of return on our undeveloped locations. We drilled three gross wells in North Louisiana with lateral lengths of approximately 4,300 feet during 2016 featuring completion methods that included the use of approximately 2,700 lbs of proppant per lateral foot for an average cost of $5.9 million, representing a 13% decrease compared to wells drilled in this region with similar lateral lengths in prior year despite increased proppant use. We also drilled three gross wells in North Louisiana during 2016 with lateral lengths of approximately 7,600 feet featuring completion methods that included the use of approximately 2,650 lbs of proppant per lateral foot for an average cost of approximately $8.8 million. Our development plans for 2017 include increased proppant levels and we are evaluating plans to further extend our lateral lengths.
The average drilling and completion costs for the wells we turned-to-sales in East Texas during 2016 were approximately $9.3 million, a decrease of approximately 20% compared to the wells drilled in this region in 2015. Our two most recent wells turned-to-sales in the southern area of our East Texas region continue to exceed expectations and resulted in a 73% increase to an average EUR of 2.6 Bcf per 1,000 lateral feet as compared to December 31, 2015.
Optimizing and repositioning the portfolio
We have implemented a disciplined capital allocation approach to ensure the highest and best use of capital, including the completion of a series of asset divestitures as part of our portfolio optimization initiative. Our use of capital is allocated based on the highest risk adjusted rates of return, including both the development of our oil and natural gas properties and liability management initiatives.
In May 2016, we closed a sale of certain non-core undeveloped acreage in South Texas. In July 2016, we closed a sale of our interests in shallow conventional assets located in Pennsylvania and retained an overriding royalty interest. In October 2016, we closed a sale of our interests in shallow conventional assets located primarily in West Virginia. EXCO retained all rights to other formations below the conventional depths in the Appalachia region including the Marcellus and Utica shales. We are evaluating other divestitures of assets, including our assets in South Texas, to generate capital that can be deployed to projects with high rates of return. Our technical team is performing an evaluation of prospective locations in our portfolio, including the dry gas window of the Utica shale in Pennsylvania and the Bossier shale in North Louisiana. We believe that significant upside exists to apply advanced completion techniques that have been effective in other formations based on our technical analysis and the recent success of nearby operators.
We continue to evaluate opportunities to add undeveloped locations in core areas that meet our strategic objectives at a low cost. We are able to leverage our technical expertise and economies of scale to maximize our returns in these areas.
Our strengths
High quality asset base in attractive regions
3
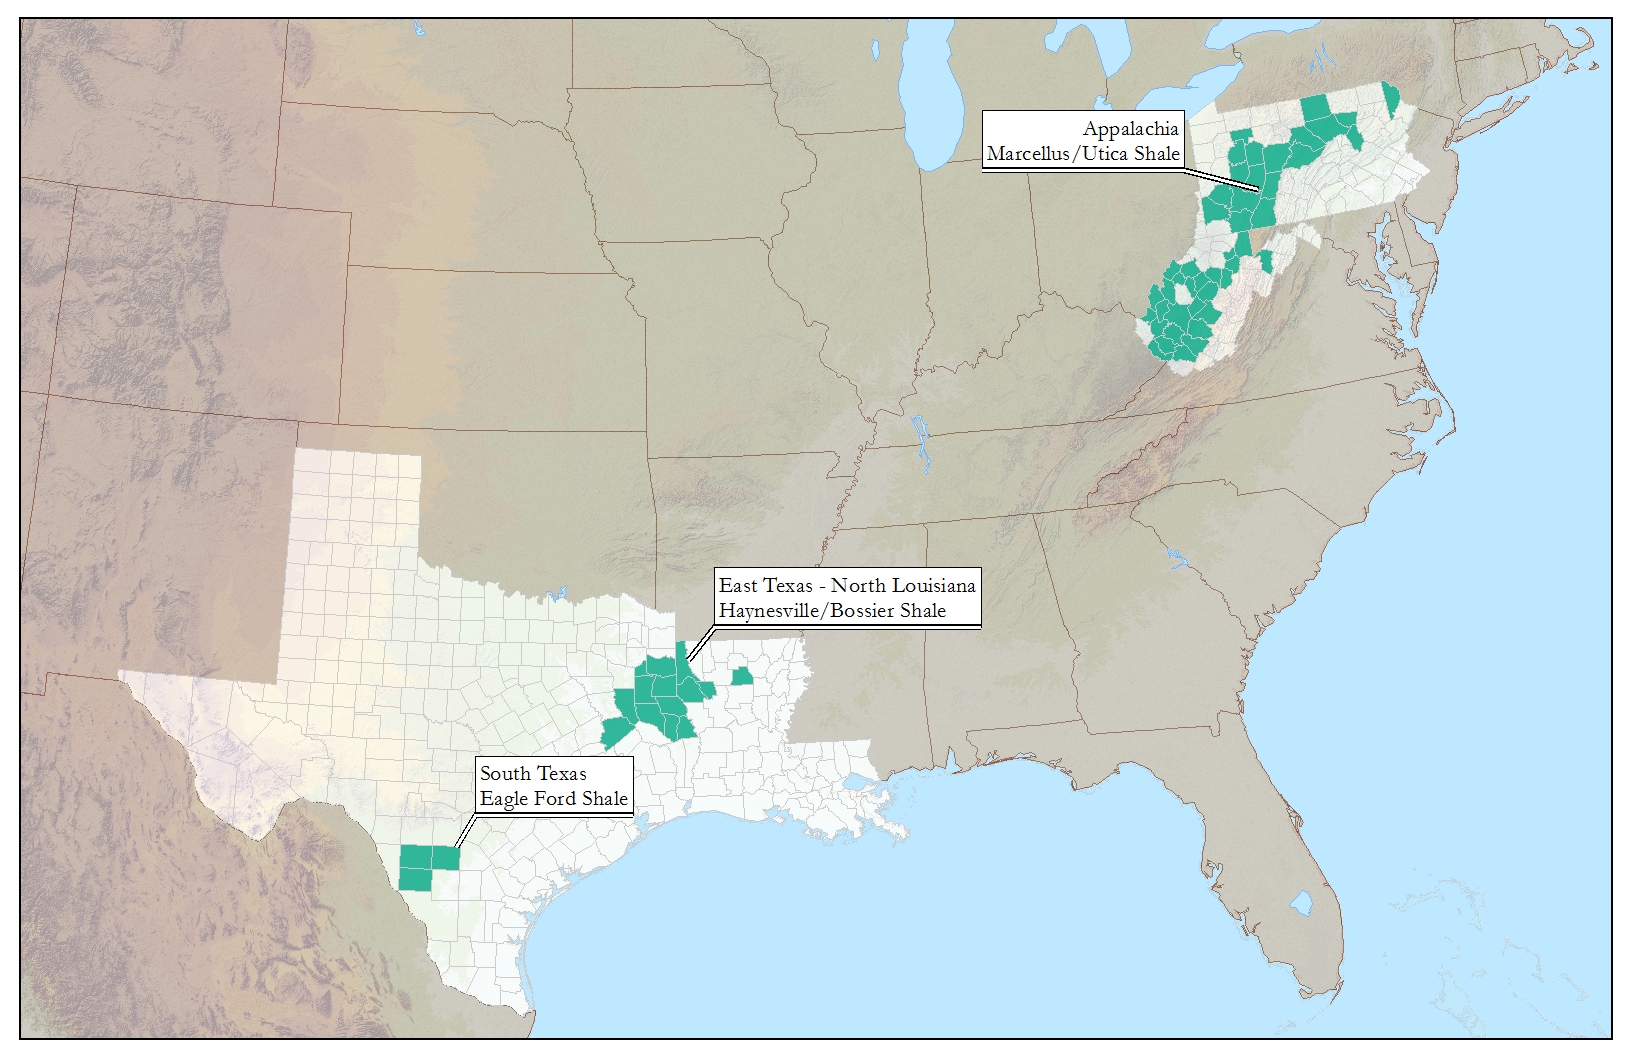
Our core areas have an extensive inventory of drilling opportunities that provide us the option to allocate capital to enhance our returns in various commodity price environments. In addition, a significant portion of our acreage is held-by-production, which allows us to develop these properties within an optimum time frame. We hold significant acreage positions in three prominent oil and natural gas regions in the United States:
• | East Texas and North Louisiana - we currently hold approximately 82,100 net acres in the Haynesville and Bossier shales; |
• | South Texas - we currently hold approximately 49,300 net acres in the Eagle Ford shale; and |
• | Appalachia - we currently hold approximately 127,000 net acres prospective for the Marcellus shale and approximately 40,000 net acres prospective for the Utica shale predominantly located in the dry gas window. |
Our properties are generally characterized by:
• | multi-year inventory of development drilling and exploitation projects; |
• | high drilling success rates; |
• | significant unproved reserves and resources; and |
• | long reserve lives. |
We have extensive amounts of technical and operational expertise within the Haynesville and Bossier shales. We have accumulated significant amounts of contiguous acreage and are one of the largest operators within this region. Our economies of scale and operational expertise have allowed us to efficiently develop our assets and minimize our costs through greater utilization of multi-well pads and existing infrastructure and facilities.
We have applied our technical and operational expertise from other shale plays to our development of the Eagle Ford shale. We have realized significant improvements in our drilling performance, and the optimization of our well design has yielded strong results.
Our position in the Marcellus and Utica shales requires low maintenance capital as a substantial portion of our acreage is held-by-production, which gives us flexibility to control the timing of our development activities in the region.
Operational control
We operate a significant portion of our properties, which allows us to manage our operating costs and better control capital expenditures as well as the timing of development and exploitation activities. Therefore, we are able to allocate our capital to the most attractive projects based on commodity prices, rates of return and industry trends. As of December 31, 2016, we operated 868 of our 1,155 gross wells, or wells representing approximately 95% of our proved developed producing reserves. We have continued to demonstrate improved drilling and completion results in our operated areas while maintaining low capital and operating costs.
Skilled technical personnel and experienced team
We have developed a workforce of highly skilled technical and operational personnel who have been successful in developing our shale resources. We leverage our technical expertise to exploit our asset base in an efficient and cost-effective manner. We believe our technical expertise gives us a competitive advantage in our key operating areas.
Our management team has extensive industry experience in acquiring, exploring, exploiting and developing oil and natural gas properties. In addition, we have a services and investment agreement with ESAS to assist in the development and execution of our business plan. ESAS is owned by Bluescape Energy Recapitalization and Restructuring Fund III LP, which is directed by its general partner, Bluescape Energy Partners III GP LLC ("Bluescape").
Plans for 2017
Our plans for the first quarter of 2017 focus primarily on the appraisal, exploitation and development of projects with the highest rates of return in our portfolio, including the Haynesville and Bossier shales in North Louisiana. The wells included as part of our first quarter 2017 plans will feature a modified well design that builds on the success of the results from our 2016 development program in the North Louisiana and East Texas regions, including the use of extended laterals and more proppant. The completion methods will include extended laterals of up to 7,500 feet and an average of 3,500 lbs of proppant per lateral foot. We will continue to focus on operational initiatives to enhance our well designs, optimize our base production and
4
maximize the recoveries from our properties. In addition, we plan to participate in non-operated wells in the Haynesville and Bossier shales in North Louisiana and East Texas, and the Utica shale in Appalachia during 2017. We are currently incorporating the impact of the recent financing transactions into our development plans for the remainder of 2017. Furthermore, we will continue to evaluate and pursue accretive leasing and acquisition opportunities to increase our drilling inventory.
Summary of geographic areas of operations
The following tables set forth summary operating information attributable to our principal geographic areas of operation as of December 31, 2016:
Areas | Total Proved Reserves (Bcfe) (1) | PV-10 (in millions) (1) (2) | Average daily net production (Mmcfe) (3) | |||||||
North Louisiana | 222,143 | $ | 87.1 | 140 | ||||||
East Texas | 77,639 | 70.4 | 57 | |||||||
South Texas | 68,019 | 123.4 | 24 | |||||||
Appalachia and other | 108,926 | 30.0 | 33 | |||||||
Total | 476,727 | $ | 310.9 | 254 | ||||||
Areas | Total gross acreage | Total net acreage | ||||
North Louisiana | 102,200 | 50,800 | ||||
East Texas | 120,000 | 45,500 | ||||
South Texas | 101,600 | 49,300 | ||||
Appalachia and other | 410,000 | 184,100 | ||||
Total | 733,800 | 329,700 | ||||
(1) | The total Proved Reserves and PV-10 as of December 31, 2016 were prepared in accordance with the rules and regulations of the Securities and Exchange Commission ("SEC"). The estimated future plugging and abandonment costs necessary to compute PV-10 were computed internally. |
(2) | The PV-10 data used in this table was based on reference prices using the simple average of the spot prices for the trailing 12 month period using the first day of each month beginning on January 1, 2016 and ending on December 1, 2016, of $2.48 per Mmbtu for natural gas and $42.75 per Bbl for oil, in each case adjusted for geographical and historical differentials. Market prices for oil and natural gas are volatile (see “Item 1A. Risk Factors - Risks Relating to Our Business”). We believe that PV-10, while not a financial measure in accordance with generally accepted accounting principles in the United States ("GAAP"), is an important financial measure used by investors and independent oil and natural gas producers for evaluating the relative significance of oil and natural gas properties and acquisitions due to tax characteristics which can differ significantly among comparable companies. The total Standardized Measure, a measure recognized under GAAP, as of December 31, 2016 was $310.9 million. The Standardized Measure represents the PV-10 after giving effect to income taxes, and is calculated in accordance with the Financial Accounting Standards Board ("FASB") Accounting Standards Codification ("ASC") 932, Extractive Activities, Oil and Gas ("ASC 932"). Our tax basis in the associated properties exceeded the pre-tax cash inflows and, as a result, there is no difference in Standardized Measure and PV-10 for all years presented. The amount of estimated future plugging and abandonment costs, the PV-10 of these costs and the Standardized Measure were determined by us. We do not designate our derivative financial instruments as hedges and accordingly, do not include the impact of derivative financial instruments when computing the Standardized Measure. |
(3) | The average daily net production rate was calculated based on the average daily rate during the final month of the year ended December 31, 2016. |
5
Our development and exploitation project areas
East Texas and North Louisiana
Our operations in East Texas and North Louisiana are focused on the Haynesville and Bossier shales, which are primarily located in Shelby, Harrison, Panola, San Augustine and Nacogdoches Counties in Texas and DeSoto and Caddo Parishes in Louisiana. Our acreage in this region is predominantly held-by-production. The Haynesville shale is located at depths of 12,000 to 14,500 feet and is being developed with horizontal wells that typically have 4,500 to 7,500 foot laterals. Recent operators in the region have been developing the Haynesville and Bossier shales using enhanced completion methods including longer laterals of up to 10,000 feet. The lateral lengths of future wells to be drilled in this region are dependent on factors including our acreage position and nearby existing wells. These enhanced completion methods have proven to be effective and have resulted in improved recoveries in the region. The Bossier shale lies just above certain portions of the Haynesville shale and also contains rich deposits of natural gas. The geographic position of our properties in the Haynesville and Bossier shales provides us access to nearby markets with favorable natural gas price indices compared to the rest of the country.
North Louisiana
Our position in the Holly area of North Louisiana consists of 29,100 net acres in DeSoto Parish and 8,500 net acres in Caddo Parish, which are all held-by-production. At December 31, 2016, we had a total of 416 gross (208.7 net) operated horizontal wells flowing to sales. Our development activities in North Louisiana during 2016 featured a modified Haynesville shale well design, which featured enhanced completion methods including the use of more proppant and longer laterals. We drilled and turned-to-sales 6 gross (5.2 net) operated wells in the Haynesville shale during 2016 including 3 gross (2.7 net) cross-unit wells with lateral lengths of approximately 7,600 feet and an average of 2,650 lbs of proppant per lateral foot. Including non-operated volumes, our average natural gas production was approximately 140 net Mmcfe per day during December 2016. The improved performance of the Haynesville shale wells turned-to-sales during 2016 in our Holly area of North Louisiana resulted in a 13% increase in the EUR to an average of 2.3 Bcf per 1,000 lateral feet compared to prior year.
In the North Louisiana region, average drilling and completion costs per well during 2016 were approximately $5.9 million for standard lateral wells and approximately $8.8 million for extended lateral wells, achieving a significant decrease in drilling and completion costs on a per foot basis from prior year, despite larger completion designs. Our extended lateral wells
6
drilled in 2016 had average lateral lengths of approximately 7,600 feet and represent some of our longest laterals drilled-to-date in the region.
We plan to drill 5 gross (3.9 net) wells during the first quarter of 2017 that will be completed and turned-to-sales in the second and third quarters of 2017. This includes 4 gross (3.0 net) wells in the Haynesville shale with lateral lengths ranging from 4,500 feet to 7,500 feet and 1 gross (0.8 net) well in the Bossier shale with a lateral length of 7,500 feet. The completion design of these wells will include 3,500 lbs of proppant per lateral foot. The cost per well for the wells drilled during the first quarter 2017 is expected to be $6.8 million to $9.3 million in the Haynesville shale based on the lateral length and $11.2 million in the Bossier shale. We will evaluate the results of the Bossier shale well featuring enhanced completion methods to assess the potential for future development of our inventory of Bossier shale locations in North Louisiana. Our development plans in this region subsequent to the first quarter 2017 may feature drilling extended lateral length wells up to 10,000 feet.
East Texas
Our operations in East Texas are focused on the Haynesville and Bossier shales. Our acreage is primarily located in Harrison, Panola, Shelby, San Augustine and Nacogdoches Counties in Texas and is predominantly held-by-production. The Haynesville and Bossier shales in East Texas are being developed with horizontal wells that typically have 6,000 to 7,500 foot laterals. Our position in the Shelby area of East Texas primarily consists of 31,400 net acres and includes approximately 10,000 net acres subject to continuous drilling obligations. We plan to drill, or participate with another operator in drilling, on the acreage subject to the continuous drilling obligation in the future to hold the acreage. Excluding the acreage subject to the continuous drilling obligation, approximately 91% of our net acres are held-by-production in the Shelby area.
As of December 31, 2016, we had a total of 105 gross (47.3 net) operated horizontal wells flowing to sales. We completed and turned-to-sales 8 gross (3.6 net) wells in the area during 2016, which included 5 gross (2.2 net) operated wells in the Haynesville shale and 3 gross (1.4 net) operated wells in the Bossier shale. Including non-operated volumes, our average natural gas production was approximately 57 net Mmcfe per day during December 2016. Our average drilling and completion costs decreased from $11.6 million in 2015 to $9.3 million in 2016 despite larger completion designs.
Our development activities in the East Texas region during the first quarter of 2017 will primarily include the participation in wells operated by others. This includes the development of a well by a third-party that will satisfy our continuous drilling obligation on certain acreage in the southern portion of the region. The most recent two wells drilled on our acreage in the southern portion of the region continue to exhibit strong performance and resulted in an average EUR of 2.6 Bcf per 1,000 lateral feet, which represents a 73% increase from the prior year.
South Texas
Our position in this region includes 49,300 net acres, of which approximately 95% is held-by-production, that cover portions of Zavala, Dimmit and Frio Counties in Texas. Our acreage in the Eagle Ford shale is in the oil window and averages 375 feet in gross thickness at true vertical depths ranging from 5,400 to 6,800 feet. Our lateral lengths range from 5,000 to 9,000 feet and the total measured depth averages 14,600 feet. Our acreage in the area also includes additional upside in formations such as the Austin Chalk, Buda, Georgetown and Pearsall formations.
As of December 31, 2016, we had a total of 228 gross (99.4 net) operated horizontal wells flowing to sales. Including non-operated volumes, our average oil production in South Texas was approximately 4,100 net barrels of oil equivalent per day during December 2016. We were able to significantly reduce our operating costs in the region during 2016 through the execution of several initiatives such as reductions in service costs with certain key vendors, including saltwater disposal costs and chemical treating programs. In addition, we successfully renegotiated a sales contract in this region during 2016 that improved our net realized price for the related oil production. We are evaluating the potential divestiture of our properties in South Texas and do not anticipate allocating development capital to this region during 2017.
7
Appalachia
Our operations in the Appalachia region have primarily included testing and selectively developing the Marcellus shale with horizontal drilling. We currently hold approximately 181,100 net acres in the Appalachia region, with approximately 127,000 of these net acres prospective for the Marcellus shale. Our acreage in the region includes 40,000 net acres prospective for the dry gas window of the Utica shale in Pennsylvania and we are currently assessing its potential. Drilling, completion and production activities in Pennsylvania target the Marcellus shale as well as deeper formations including the Utica shale at depths ranging from 5,000 to more than 12,000 feet. Approximately 90% of our acreage is held-by-production, which allows us to control the timing of the development of this region.
As of December 31, 2016, we operated a total of 116 gross (41.4 net) horizontal wells in the Marcellus shale. During 2016, we divested our shallow conventional assets in the region and retained all rights to other formations below the conventional depths including the Marcellus and Utica shales. Including non-operated volumes, our production in the Appalachia region was approximately 33 net Mmcfe per day during December 2016. We turned-to-sales 1 gross (0.4 net) operated Marcellus shale well in Lycoming County, Pennsylvania during 2016. In recent years, we have limited our development of the Marcellus shale due to wide regional natural gas price differentials. These differentials began to narrow in late 2016 and have the potential to be favorably impacted by the expansion of infrastructure and other sources of demand for natural gas in the Northeast region as early as 2018. We have an extensive inventory of undeveloped locations prospective for the Marcellus and Utica shales that have potential to provide attractive rates of return in an improved commodity price environment. We plan to participate in certain appraisal wells with other operators in the Utica shale during 2017.
We have effectively managed our base production declines as a result of increased automation and surveillance equipment to reduce downtime as well as artificial lift installations. During 2016, we divested our conventional assets in the Appalachia region, which had the highest lease operating expenses per Mcfe in our portfolio. As a result of these divestitures and other reductions in our workforce, our field employee count in the area decreased by 85% from 87 employees as of December 31, 2015 to 13 employees as of December 31, 2016.
Our hydraulic fracturing activities
Oil and natural gas may be recovered from our properties through the use of sophisticated drilling and hydraulic fracturing techniques. Hydraulic fracturing involves the injection of water, sand, gel and chemicals under pressure into formations to fracture the surrounding rock and stimulate production. Our hydraulic fracturing activities are primarily focused in the Eagle Ford shale in South Texas, Haynesville and Bossier shales in East Texas and North Louisiana and Marcellus shale in the Appalachia region. Predominantly all of our Proved Reserves are associated with shale assets in these areas.
Although the cost of each well will vary, the costs associated with hydraulic fracturing activities on average represent the following portions of the total costs of drilling and completing a well: 35-40% in the Haynesville and Bossier shale formation; 30-40% in the Eagle Ford shale formation; and 25-35% in the Marcellus shale formation. These costs may increase in future periods as a result of higher levels of proppant utilized in the completion of our shale wells.
We review best practices and industry standards to comply with regulatory requirements in the protection of potable water sources when drilling and completing our wells. Protective practices include, but are not limited to, setting multiple strings of protection pipe across potable water sources and cementing these pipe strings to surface, continuously monitoring the hydraulic fracturing process in real time and disposing of non-recycled produced fluids in authorized disposal wells at depths below the potable water sources. In addition, we actively seek methods to minimize the environmental impact of our hydraulic fracturing operations in all of our operating areas. For example, we use discharge water from a local paper plant as a key water source for our fracture stimulation operations in North Louisiana. We recycle flowback fluids when economically feasible.
For more information on the risks of hydraulic fracturing, see “Item 1A. Risk Factors - Our business exposes us to liability and extensive regulation on environmental matters, which could result in substantial expenditures” and “Item 1A. Risk Factors - Federal, state and local legislation and regulatory initiatives relating to hydraulic fracturing could result in increased costs and additional operating restrictions or delays.”
Our oil and natural gas reserves
Our Proved Reserves as of December 31, 2016 were approximately 476.7 Bcfe, of which approximately 63% were located in the Haynesville/Bossier shales, 23% in the Marcellus shale and 14% in the Eagle Ford shale.
8
The following table summarizes Proved Reserves as of December 31, 2016, 2015 and 2014. This information was prepared in accordance with the rules and regulations of the SEC. The comparability of our reserves is impacted by commodity prices, purchases and sales of reserves in place, production, revisions of previous estimates, changes in our development plans, and discoveries and extensions. See "Management's discussion and analysis of oil and natural gas reserves" for a summary of the changes in our Proved Reserves.
As of December 31, | ||||||||||||
2016 (3) | 2015 | 2014 | ||||||||||
Oil (Mbbls) | ||||||||||||
Developed | 10,168 | 12,056 | 14,429 | |||||||||
Undeveloped | — | 8,383 | 3,258 | |||||||||
Total | 10,168 | 20,439 | 17,687 | |||||||||
Natural gas (Mmcf) | ||||||||||||
Developed | 415,719 | 364,932 | 504,636 | |||||||||
Undeveloped | — | 419,742 | 653,038 | |||||||||
Total | 415,719 | 784,674 | 1,157,674 | |||||||||
Equivalent reserves (Mmcfe) | ||||||||||||
Developed | 476,727 | 437,268 | 591,210 | |||||||||
Undeveloped | — | 470,040 | 672,586 | |||||||||
Total | 476,727 | 907,308 | 1,263,796 | |||||||||
PV-10 (in millions) (1) | ||||||||||||
Developed | $ | 310.9 | $ | 359.4 | $ | 1,117.6 | ||||||
Undeveloped | — | 42.7 | 425.0 | |||||||||
Total | $ | 310.9 | $ | 402.1 | $ | 1,542.6 | ||||||
Standardized Measure (in millions) (2) | $ | 310.9 | $ | 402.1 | $ | 1,542.6 | ||||||
(1) | The PV-10 is based on the following average spot prices, in each case adjusted for historical differentials. Prices presented on the table below are the trailing 12 month simple average spot price at the first of the month for natural gas at Henry Hub and West Texas Intermediate ("WTI") crude oil at Cushing, Oklahoma. |
Average spot prices | ||||||||
Oil (per Bbl) | Natural gas (per Mmbtu) | |||||||
December 31, 2016 | $ | 42.75 | $ | 2.48 | ||||
December 31, 2015 | 50.28 | 2.59 | ||||||
December 31, 2014 | 94.99 | 4.35 | ||||||
(2) | There is no difference in Standardized Measure and PV-10 for all years presented as our tax basis in the associated properties exceeded the pre-tax cash inflows. We believe that PV-10, while not a financial measure in accordance with GAAP, is an important financial measure used by investors and independent oil and natural gas producers for evaluating the relative significance of oil and natural gas properties and acquisitions due to tax characteristics, which can differ significantly among comparable companies. The Standardized Measure represents the PV-10 after giving effect to income taxes, and is calculated in accordance with ASC 932. |
(3) | All of our Proved Undeveloped Reserves were reclassified to unproved during the first quarter of 2016 due to the uncertainty regarding the financing required to develop these reserves that existed on March 31, 2016. These reserves remained classified as unproved due to our inability to meet the Reasonable Certainty criteria for recording Proved Undeveloped Reserves, as prescribed under the SEC requirements, as the uncertainty regarding our availability of capital required to develop these reserves still existed at December 31, 2016. A significant amount of our Proved Undeveloped |
9
Reserves that were reclassified to unproved remain economic at current prices, and we may report Proved Undeveloped Reserves in future filings if we determine we have the financial capability to execute a development plan.
Management has established, and is responsible for, internal controls designed to provide reasonable assurance that the estimates of Proved Reserves are computed and reported in accordance with rules and regulations promulgated by the SEC as well as established industry practices used by independent engineering firms and our peers. These internal controls include documented process workflows, qualified professional engineering and geological personnel with specific reservoir experience. Our internal audit function routinely tests our processes and controls. We also retain outside independent engineering firms to prepare estimates of our Proved Reserves. Senior management reviews and approves our reserve estimates, whether prepared internally or by third parties. Our Strategic Development and Reserves Director oversaw our outside independent engineering firms, Netherland, Sewell & Associates, Inc. ("NSAI"), and Ryder Scott Company, L.P. ("Ryder Scott") in connection with the preparation of their estimates of our Proved Reserves as of December 31, 2016. We also regularly communicate with our outside independent engineering firms throughout the year regarding technical and operational matters critical to our reserve estimations. Our Strategic Development and Reserves Director has over 12 years of experience in the oil and natural gas industry with a focus on reserves valuation. He is a graduate of the University of Oklahoma with dual degrees in Energy Management and Finance. In addition, he is an active participant in industry reserves seminars and professional industry groups. Our Chief Operating Officer and our Strategic Development and Reserves Director, with input from other members of senior management, are responsible for the selection of our third-party engineering firms and review the reports generated by such firms. Our Chief Operating Officer has over 25 years of experience in the oil and natural gas industry and is a graduate of Texas Tech University with a degree in Petroleum Engineering. During his career, he has had multiple responsibilities in technical or leadership roles including asset management, drilling and completions, production engineering, reservoir engineering and reserves management, economic evaluations and field development in U.S. onshore and international projects. The third-party engineering reports are also provided to our audit committee.
Our estimated Proved Reserves and future net cash flows for our shale properties in all regions except South Texas were prepared by NSAI as of December 31, 2016, 2015 and 2014. Our estimated Proved Reserves and future net cash flows for our shale properties in the South Texas region were prepared by Ryder Scott as of December 31, 2016, 2015 and 2014. During 2016, we sold substantially all of our remaining non-shale properties. The estimates of Proved Reserves and future net cash flows for our non-shale properties as of December 31, 2015 and 2014 were prepared by Lee Keeling and Associates, Inc. ("Lee Keeling").
NSAI, Ryder Scott and Lee Keeling are independent petroleum engineering firms that perform a variety of reserve engineering and valuation assessments for public and private companies, financial institutions and institutional investors. NSAI, Ryder Scott and Lee Keeling have performed these services for over 50 years. Our internal technical employees responsible for reserve estimates and interaction with our independent engineers include employees and corporate officers with petroleum and other engineering degrees and relevant industry experience.
Estimates of oil and natural gas reserves are projections based on a process involving an independent third party engineering firm's communication with EXCO's engineers and geologists, the collection of any and all required geological, geophysical, engineering and economic data, and such firm's complete external preparation of all required estimates and are forward-looking in nature. These reports rely on various assumptions, including definitions and economic assumptions required by the SEC, including the use of constant oil and natural gas pricing, use of current and constant operating costs and capital costs. We also make assumptions relating to availability of funds and timing of capital expenditures for development of our Proved Undeveloped Reserves. These reports should not be construed as the current market value of our Proved Reserves. The process of estimating oil and natural gas reserves is also dependent on geological, engineering and economic data for each reservoir. Because of the uncertainties inherent in the interpretation of this data, we cannot ensure that the Proved Reserves will ultimately be realized. Our actual results could differ materially. See “Note 17. Supplemental information relating to oil and natural gas producing activities (unaudited)” in the Notes to our Consolidated Financial Statements for additional information regarding our oil and natural gas reserves and the Standardized Measure.
NSAI, Ryder Scott and Lee Keeling also examined our estimates with respect to reserve categorization, using the definitions for Proved Reserves set forth in SEC Regulation S-X Rule 4-10(a) and SEC staff interpretations and guidance. In preparing an estimate of our Proved Reserves and future net cash flows attributable to our interests, NSAI, Ryder Scott and Lee Keeling did not independently verify the accuracy and completeness of information and data furnished by us with respect to ownership interests, oil and natural gas production, well test data, historical costs of operation and development, product prices, or any agreements relating to current and future operations of the properties and sales of production. However, if in the course of the examination anything came to the attention of NSAI, Ryder Scott or Lee Keeling, which brought into question the validity or sufficiency of any such information or data, NSAI, Ryder Scott or Lee Keeling did not rely on such information or
10
data until they had satisfactorily resolved their questions relating thereto or had independently verified such information or data. NSAI, Ryder Scott and Lee Keeling determined that their estimates of Proved Reserves conform to the guidelines of the SEC, including the criteria of Reasonable Certainty, as it pertains to expectations about the recoverability of Proved Reserves in future years, under existing economic and operating conditions, consistent with the definition in Rule 4-10(a)(24) of SEC Regulation S-X.
Management's discussion and analysis of oil and natural gas reserves
The following discussion and analysis of our proved oil and natural gas reserves and changes in our Proved Reserves is intended to provide additional guidance on the operational activities, transactions, economic and other factors which significantly impacted our estimate of Proved Reserves as of December 31, 2016 and changes in our Proved Reserves during 2016. This discussion and analysis should be read in conjunction with “Note 17. Supplemental information relating to oil and natural gas producing activities (unaudited)” and in “Item 1A. Risk Factors” addressing the uncertainties inherent in the estimation of oil and natural gas reserves elsewhere in this Annual Report on Form 10-K. The following table summarizes the changes in our Proved Reserves from January 1, 2016 to December 31, 2016.
Oil (Mbbls) | Natural gas (Mmcf) | Equivalent natural gas (Mmcfe) | |||||||
Proved Developed Reserves | 10,168 | 415,719 | 476,727 | ||||||
Proved Undeveloped Reserves | — | — | — | ||||||
Total Proved Reserves | 10,168 | 415,719 | 476,727 | ||||||
The changes in reserves for the year are as follows: | |||||||||
January 1, 2016 | 20,439 | 784,674 | 907,308 | ||||||
Purchases of reserves in place | — | 552 | 552 | ||||||
Discoveries and extensions | — | 16,381 | 16,381 | ||||||
Revisions of previous estimates (1): | |||||||||
Changes in price | (2,061 | ) | (55,748 | ) | (68,114 | ) | |||
Other factors | (5,165 | ) | (208,714 | ) | (239,704 | ) | |||
Sales of reserves in place | (1,276 | ) | (27,597 | ) | (35,253 | ) | |||
Production | (1,769 | ) | (93,829 | ) | (104,443 | ) | |||
December 31, 2016 | 10,168 | 415,719 | 476,727 | ||||||
(1) | Revisions of previous estimates include both reserves in place at the beginning of the year and acquisitions and divestitures, if any, during the year. We reclassified 427.6 Bcfe of Proved Undeveloped Reserves to unproved due to the uncertainty regarding the financing required to develop these reserves. As a result of our inability to meet the Reasonable Certainty criteria for recording Proved Undeveloped Reserves as prescribed under the SEC requirements, we did not record any Proved Undeveloped Reserves at December 31, 2016. This decrease was partially offset by approximately 187.9 Bcfe of upward revisions due to performance and other factors. |
Discoveries and extensions
Proved Reserve additions from discoveries and extensions in 2016 were 16.4 Bcfe, primarily due to 14.9 Bcfe of discoveries and extensions from our East Texas region. The discoveries and extensions in the East Texas region were due to the development of our Shelby area and consist of both the Haynesville and Bossier shales.
Revisions of previous estimates
Our revisions of previous estimates included downward revisions to our Proved Reserve quantities of 239.7 Bcfe. These downward revisions were primarily the result of 427.6 Bcfe of our Proved Undeveloped Reserves that were reclassified to unproved during the first quarter of 2016 due to the uncertainty regarding the financing required to develop these reserves that existed on March 31, 2016. These reserves remained classified as unproved since the uncertainty regarding our availability of capital required to develop these reserves still existed at December 31, 2016.
The decrease in commodity prices contributed to 68.1 Bcfe of the downward revisions, which shortened the economic life of certain producing properties when using prices prescribed by the SEC. This change in price was primarily driven by the decrease in the trailing 12 month average of oil and natural gas prices. The trailing 12 month average oil price decreased from
11
$50.28 per Bbl for the year ended December 31, 2015 to $42.75 per Bbl for the year ended December 31, 2016 and the trailing 12 month average natural gas price decreased from $2.59 per Mmbtu for the year ended December 31, 2015 to $2.48 per Mmbtu for the year ended December 31, 2016.
These decreases were partially offset by 187.9 Bcfe of upward revisions due to performance and other factors. This included 99.0 Bcfe of upward revisions in the Marcellus shale primarily due to narrower regional differentials, reductions in our operating expenses, and improved performance as wells have exhibited shallower declines than previously forecasted. The upward revision also reflects a reduction in operating expenses in other areas, primarily North Louisiana and South Texas, which increased our reserves by 51.4 Bcfe and 23.9 Bcfe, respectively. Lower operating costs were primarily the result of various cost reduction efforts, including significant reductions in labor costs, chemical treatment costs and saltwater disposal costs. Reductions in our operating costs extended the economic life of certain properties and resulted in upward revisions to our reserve quantities. In addition, the improved performance of certain Haynesville shale wells turned-to-sales in North Louisiana during 2016 resulted in upward revisions. These wells featured enhanced completion methods including more proppant per lateral foot.
Sales of reserves in place
Sales of reserves in place consisted primarily of divestitures of our shallow conventional assets in Appalachia and the transfer of a portion of our interests in certain producing wells to a joint venture partner in South Texas. See "Note 3. Acquisitions, divestitures and other significant events" in the Notes to our Consolidated Financial Statements for additional information. The reserve quantities attributable to sales of reserves in place were calculated based on our estimates and assumptions as of the respective divestiture dates.
Oil and natural gas production
Total oil and natural gas production in 2016 was 104.4 Bcfe, which included approximately 3.4 Bcfe in production from extensions and discoveries that were not reflected in our Proved Reserves at January 1, 2016.
Proved Undeveloped Reserves
The following table summarizes the changes in our Proved Undeveloped Reserves for the year ended December 31, 2016:
Mmcfe | ||
Proved Undeveloped Reserves at January 1, 2016 | 470,040 | |
Proved Undeveloped Reserves transferred to developed (1) | (42,393 | ) |
Proved Undeveloped Reserves transferred to unproved (2) | (427,647 | ) |
Proved Undeveloped Reserves at December 31, 2016 | — | |
(1) | Approximately 61% and 39% of the Proved Undeveloped Reserves transferred to Proved Developed Reserves were in the North Louisiana and East Texas regions, respectively. Capital costs incurred to convert Proved Undeveloped Reserves to Proved Developed Reserves were $47.6 million during 2016. The Proved Undeveloped Reserves transferred to Proved Developed Reserves in the East Texas region primarily relate to wells drilled in this region in 2015 that were completed in early 2016. The transfers to Proved Developed Reserves presented in this table were based on the Proved Undeveloped Reserves at the beginning of the year prior to any revisions. |
(2) | All of our Proved Undeveloped Reserves were reclassified to unproved during the first quarter of 2016 due to the uncertainty regarding the financing required to develop these reserves that existed on March 31, 2016. These reserves remained classified as unproved due to our inability to meet the Reasonable Certainty criteria for recording Proved Undeveloped Reserves, as prescribed under the SEC requirements, as the uncertainty regarding our availability of capital required to develop these reserves still existed at December 31, 2016. A significant amount of our Proved Undeveloped Reserves that were reclassified to unproved remain economic at current prices, and we may report Proved Undeveloped Reserves in future filings if we determine we have the financial capability to execute a development plan. The transfers to unproved presented in this table were based on Proved Undeveloped Reserves at the beginning of the year prior to any revisions. |
12
Impacts of changes in reserves on depletion rate and statements of operations in 2016
Our depletion rate decreased to $0.71 per Mcfe in 2016 from $1.72 per Mcfe in 2015. The decrease was primarily due to the impairments of our oil and natural gas properties during 2016 and 2015, which lowered our depletable base.
Our production, prices and expenses
The following table summarizes revenues, net production, average sales price per unit and costs and expenses associated with the production of oil and natural gas. Certain reclassifications have been made to prior period information to conform to current period presentation.
Year Ended December 31, | ||||||||||||
(in thousands, except production and per unit amounts) | 2016 | 2015 | 2014 | |||||||||
Revenues, production and prices: | ||||||||||||
Oil: | ||||||||||||
Revenue | $ | 67,317 | $ | 102,787 | $ | 196,316 | ||||||
Production sold (Mbbls) | 1,769 | 2,342 | 2,236 | |||||||||
Average sales price per Bbl | $ | 38.05 | $ | 43.89 | $ | 87.80 | ||||||
Natural gas: | ||||||||||||
Revenue | $ | 181,332 | $ | 226,471 | $ | 464,668 | ||||||
Production sold (Mmcf) | 93,829 | 109,926 | 122,324 | |||||||||
Average sales price per Mcf | $ | 1.93 | $ | 2.06 | $ | 3.80 | ||||||
Costs and expenses: | ||||||||||||
Oil and natural gas operating costs per Mcfe | $ | 0.33 | $ | 0.43 | $ | 0.47 | ||||||
We had three fields that exceeded 15% of our total Proved Reserves as of December 31, 2016. The Holly field in North Louisiana, Marcellus shale in Appalachia and Shelby field in East Texas represented approximately 47%, 23% and 16% of our total Proved Reserves, respectively. The following table provides additional information related to our Holly, Shelby and Marcellus shale fields:
Year Ended December 31, | |||||||||||
2016 | 2015 | 2014 | |||||||||
Holly field: | |||||||||||
Natural gas production sold (Mmcf) | 55,290 | 73,863 | 82,299 | ||||||||
Average price per Mcf | $ | 2.00 | $ | 2.18 | $ | 4.03 | |||||
Oil and natural gas operating costs per Mcf | 0.23 | 0.22 | 0.22 | ||||||||
Marcellus shale: | |||||||||||
Natural gas production sold (Mmcf) | 10,851 | 12,133 | 16,374 | ||||||||
Average price per Mcf | $ | 1.50 | $ | 1.39 | $ | 2.86 | |||||
Oil and natural gas operating costs per Mcf | 0.12 | 0.22 | 0.19 | ||||||||
Shelby field: | |||||||||||
Natural gas production sold (Mmcf) | 24,278 | 18,047 | 10,314 | ||||||||
Average price per Mcf | $ | 2.25 | $ | 2.50 | $ | 3.90 | |||||
Oil and natural gas operating costs per Mcf | 0.22 | 0.30 | 0.33 | ||||||||
Our interest in productive wells
The following table quantifies information regarding productive wells (wells that are currently producing oil or natural gas or are capable of production), including temporarily shut-in wells. The number of total gross oil and natural gas wells excludes any multiple completions. Gross wells refer to the total number of physical wells in which we hold a working interest, regardless of our percentage interest. A net well is not a physical well, but is a concept that reflects the actual total working interests we hold in all wells. We compute the number of net wells by totaling the percentage interests we hold in all our gross wells.
13
At December 31, 2016 | ||||||||||||||||||
Gross wells (1) | Net wells | |||||||||||||||||
Oil | Natural gas | Total | Oil | Natural gas | Total | |||||||||||||
Producing region: | ||||||||||||||||||
North Louisiana | — | 616 | 616 | — | 220.4 | 220.4 | ||||||||||||
East Texas | — | 147 | 147 | — | 51.0 | 51.0 | ||||||||||||
South Texas | 246 | 1 | 247 | 102.2 | 0.1 | 102.3 | ||||||||||||
Appalachia and other | 1 | 144 | 145 | — | 43.1 | 43.1 | ||||||||||||
Total | 247 | 908 | 1,155 | 102.2 | 314.6 | 416.8 | ||||||||||||
(1) | As of December 31, 2016, we did not hold any interests in well with multiple completions. |
As of December 31, 2016, we operated 868 gross (398.1 net) wells, which represented approximately 95% of our proved developed producing reserves.
Our drilling activities
Our drilling activities are primarily focused on horizontal drilling in shale plays, particularly in the Haynesville, Bossier, Eagle Ford and Marcellus shales. The following tables summarize our approximate gross and net interests in the operated wells we drilled during the periods indicated and refer to the number of wells completed during the period, regardless of when drilling was initiated.
Development wells | ||||||||||||||||||
Gross | Net | |||||||||||||||||
Productive | Dry | Total | Productive | Dry | Total | |||||||||||||
Year ended December 31, 2016 (1) | 15 | — | 15 | 9.2 | — | 9.2 | ||||||||||||
Year ended December 31, 2015 (2) | 63 | — | 63 | 25.3 | — | 25.3 | ||||||||||||
Year ended December 31, 2014 | 98 | — | 98 | 29.6 | — | 29.6 | ||||||||||||
Exploratory wells | ||||||||||||||||||
Gross | Net | |||||||||||||||||
Productive | Dry | Total | Productive | Dry | Total | |||||||||||||
Year ended December 31, 2016 | — | — | — | — | — | — | ||||||||||||
Year ended December 31, 2015 (2) | 5 | — | 5 | 3.9 | — | 3.9 | ||||||||||||
Year ended December 31, 2014 | — | — | — | — | — | — | ||||||||||||
(1) | Our development wells in 2016 primarily included the Haynesville and Bossier shales in the Shelby area of East Texas and the Haynesville shale in the Holly area of North Louisiana. |
(2) | Our development wells in 2015 included the Haynesville and Bossier shales in the Shelby area of East Texas and the Holly area of North Louisiana. Our development wells also included the Eagle Ford shale in our core area in Zavala and Frio Counties, Texas. We completed one gross exploratory well in the Bossier shale in the North Louisiana region and four gross exploratory wells in the Buda formation in the South Texas region. |
14
Our developed and undeveloped acreage
Developed acreage includes those acres spaced or assignable to producing wells or wells capable of producing. Undeveloped acreage represents those acres that do not currently have completed wells capable of producing commercial quantities of oil or natural gas, regardless of whether the acreage contains Proved Reserves. The definitions of gross acres and net acres conform to how we determine gross wells and net wells. The following table sets forth our developed and undeveloped acreage:
At December 31, 2016 | ||||||||||||
Developed | Undeveloped | |||||||||||
Area | Gross | Net | Gross | Net | ||||||||
North Louisiana | 82,900 | 35,900 | 19,300 | 14,900 | ||||||||
East Texas | 48,600 | 21,900 | 71,400 | 23,600 | ||||||||
South Texas | 95,500 | 46,400 | 6,100 | 2,900 | ||||||||
Appalachia and other | 42,000 | 15,900 | 368,000 | 168,200 | ||||||||
Total | 269,000 | 120,100 | 464,800 | 209,600 | ||||||||
The primary terms of our oil and natural gas leases expire at various dates. Most of our undeveloped acreage is held-by-production, which means that these leases are active as long as we produce oil or natural gas from the acreage or comply with certain lease terms. Upon ceasing production, these leases will expire. We have approximately 4,600, 8,800 and 480 net acres with lease expirations in 2017, 2018 and 2019, respectively. The majority of this acreage with lease expirations is located in the Appalachia region. In addition, we have approximately 10,000 net acres located in the Shelby area of East Texas that are subject to continuous drilling obligations, and we plan to drill on the acreage in the future to hold the acreage. Predominantly all of our expiring acreage is located within our shale resource plays.
The held-by-production acreage in many cases represents potential additional drilling opportunities through down-spacing and drilling of proved undeveloped and unproved locations in the same formation(s) already producing, as well as other non-producing formations, in a given oil or natural gas field without the necessity of purchasing additional leases or producing properties.
Our significant customers
In 2016, sales to BG Energy Merchants LLC, and subsequently to Shell Energy North America US, LP, and Chesapeake Energy Marketing Inc. accounted for approximately 24% and 32%, respectively, of our total consolidated revenues. BG Energy Merchants LLC was a subsidiary of BG Group, plc ("BG Group") until the acquisition of BG Group by Royal Dutch Shell, plc ("Shell") in February 2016. Chesapeake Energy Marketing Inc. is a subsidiary of Chesapeake Energy Corporation ("Chesapeake"). We are managing our credit risk as a result of the current commodity price environment through the attainment of financial assurances from certain customers. The loss of any significant customer may cause a temporary interruption in sales of, or lower price for, our oil and natural gas production.
Competition
The oil and natural gas industry is highly competitive, particularly with respect to acquiring prospective oil and natural gas properties and oil and natural gas reserves. We encounter strong competition from other independent operators and from major oil companies in acquiring properties, contracting for drilling equipment and securing trained personnel. Many of these competitors have substantially greater financial, managerial, technological and other resources than we do. Many of these companies not only engage in the acquisition, exploration, development, and production of oil and natural gas, but also have refining operations, market refined products and their own drilling rigs and oilfield services.
The oil and natural gas industry has periodically experienced shortages of drilling rigs, equipment, pipe and personnel, which have delayed development drilling and other exploitation activities and have caused significant price increases and operational delays. We may experience difficulties in obtaining drilling rigs and other services in certain areas as well as an increase in the cost for these services and related material and equipment. We are unable to predict when, or if, supply or demand imbalances may occur or how these market-driven factors impact prices, which affects our development and exploitation programs. Competition also exists for hiring experienced personnel, particularly in petroleum engineering, geoscience, accounting and financial reporting, tax and land professions. In addition, the market for oil and natural gas properties is competitive. We are often outbid by competitors in our attempts to lease or acquire properties. The oil and natural
15
gas industry also faces competition from alternative fuel sources, including other fossil fuels such as coal and renewable energy sources such as wind and solar power. Competitive conditions may be affected by future legislation and regulations as the U.S. develops new energy and climate-related policies. All of these challenges could make it more difficult to execute our growth strategy or result in an increase in our costs.
Applicable laws and regulations
General
The oil and natural gas industry is extensively regulated by numerous federal, state and local authorities. Laws, orders and regulations affecting the oil and natural gas industry are under constant review for amendment or expansion, which could increase the regulatory burden and financial sanctions for noncompliance. Although the regulatory burden on the oil and natural gas industry increases our cost of doing business and, consequently, affects our profitability, we believe these burdens do not affect us any differently or to any greater or lesser extent than they affect others in our industry with similar types, quantities and locations of production.
The following is a summary of the more significant existing environmental, safety and other laws and regulations to which our business operations are subject and with which compliance may have a material adverse effect on our capital expenditures, earnings or competitive position.
Production regulation
Our operations are subject to a number of regulations at the federal, state and local levels. These regulations require, among other things, permits for the drilling of wells, drilling bonds and reports concerning operations. Many states, counties and municipalities in which we operate also regulate one or more of the following:
• | the location of wells; |
• | the method of drilling, completing and operating wells; |
• | the surface use and restoration of properties upon which wells are drilled; |
• | the plugging and abandoning of wells; |
• | notice to surface owners and other third parties; and |
• | produced water and waste disposal. |
State laws regulate the size and shape of drilling and spacing units or proration units governing the pooling of oil and natural gas properties. Horizontal wells drilled in shale formations, as distinguished from vertical wells, utilize multilateral wells and stacked laterals, all of which are also subject to well spacing, density and proration requirements of the Texas Railroad Commission that could adversely impact our ability to maximize the efficiency of our horizontal wells related to reservoir drainage over time. Some states, including Louisiana and Texas, allow forced pooling or integration of tracts to facilitate exploration while other states rely on voluntary pooling of lands and leases. In some instances, forced pooling or unitization may be implemented by third parties and may reduce our interest in the unitized properties. In addition, state conservation laws establish maximum rates of production from oil and natural gas wells and generally prohibit the venting or flaring of natural gas and require that oil and natural gas be produced in a prorated, equitable system. These laws and regulations may limit the amount of oil and natural gas we can produce from our wells or limit the number of wells or the locations at which we can drill. Moreover, most states generally impose a production, ad valorem or severance tax with respect to the production and sale of oil and natural gas within its jurisdiction. Many local authorities also impose an ad valorem tax on the minerals in place. States do not generally regulate wellhead prices or engage in other, similar direct economic regulation, but there can be no assurance they will not do so in the future.
Our operations are subject to numerous stringent federal and state statutes and regulations governing the discharge of materials into the environment or otherwise relating to environmental protection, some of which carry substantial administrative, civil and criminal penalties, as well as potential injunctive relief, for failure to comply. These laws and regulations may require the acquisition of a permit before drilling commences, restrict the types, quantities and concentrations of various substances that can be released into the environment in connection with drilling, production and transportation of oil and natural gas, govern the sourcing, storage and disposal of water used or produced in the drilling and completion process, restrict or prohibit drilling activities in certain areas and on certain lands lying within wetlands and other protected areas, require closing earthen impoundments and impose liabilities for pollution resulting from operations or failure to comply with regulatory filings.
16
Statutes, rules and regulations that apply to the exploration and production of oil and natural gas are often reviewed, amended, expanded and reinterpreted, making the prediction of future costs or the impact of regulatory compliance to new laws and statutes difficult. The regulatory burden on the oil and natural gas industry increases its cost of doing business and, consequently, adversely affects its (and our) profitability.
FERC and CFTC matters
The availability, terms and cost of downstream transportation significantly affect sales of natural gas and oil. The interstate transportation of natural gas, including regulation of the terms, conditions and rates for interstate transportation and storage of natural gas, is subject to federal regulation by the Federal Energy Regulatory Commission (“FERC”) under the Natural Gas Act (“NGA”). Transportation rates under the NGA must be just and reasonable. Since 1985, FERC has implemented regulations intended to increase competition within the natural gas industry by requiring that interstate natural gas transportation be made available on an open-access, not unduly discriminatory basis. FERC’s jurisdiction under the NGA excludes gathering and distribution of natural gas, therefore, gathering and distribution of natural gas are subject to regulation by individual state laws. State regulations also govern the rates and terms for access to, and transportation of natural gas on, intrastate pipeline facilities (while intrastate pipelines may from time to time provide specific services that are subject to limited regulation by FERC). The interstate transportation of oil, including regulation of the rates, terms and conditions of service, is subject to federal regulation by FERC under the Interstate Commerce Act. Rates for such oil transportation must be just and reasonable and not unduly discriminatory. Oil transportation that is not federally regulated is left to state regulation.
The federal government recently ended its decades-old prohibition of exports of crude oil produced in the lower 48 states of the U.S. It is too recent an event to determine the impact this regulatory change may have on our operations or our sales of oil. The general perception in the industry is that ending the prohibition on exports of oil produced in the U.S. may have a positive impact on U.S. producers.
Wholesale prices for natural gas and oil are not currently regulated and are determined by the market. We cannot predict, however, whether new legislation to regulate the price of energy commodities might be proposed, what proposals, if any, might actually be enacted by Congress or the various state legislatures, and what effect, if any, the proposals might have on the operations of the underlying properties.
Under the Energy Policy Act of 2005, FERC possesses regulatory oversight over natural gas markets, including the purchase, sale and transportation activities of natural gas market participants other than intrastate pipelines. The Commodity Futures Trading Commission (“CFTC”) also holds authority to monitor markets and enforce anti-market manipulation regulations with respect to the physical and financial (futures, options and swaps) energy commodities market pursuant to the Commodity Exchange Act and the Dodd Frank Wall Street Reform and Consumer Protection Act of 2010 (“Dodd Frank Act”). With regard to our physical sales of natural gas and oil, our gathering of any of these energy commodities, and any related hedging activities that we undertake, we are required to observe these anti-market manipulation laws and related regulations enforced by FERC and/or the CFTC. These agencies hold substantial enforcement authority, including the ability to assess civil penalties of up to $1 million per day per violation, to order disgorgement of profits and to recommend criminal penalties. Should we violate the anti-market manipulation laws and regulations, we could also be subject to related third party damage claims by, among others, sellers, royalty owners and taxing authorities.
Federal, state or tribal oil and natural gas leases
In the event we conduct operations on federal, state or tribal oil and natural gas leases, these operations must comply with numerous regulatory restrictions, including various nondiscrimination statutes, royalty and related valuation requirements, and certain of these operations must be conducted pursuant to certain on-site security regulations and other appropriate permits issued by the Bureau of Land Management, Bureau of Ocean Energy Management, Bureau of Safety and Environmental Enforcement or other appropriate federal, state or tribal agencies.
Surface Damage Acts
In addition, a number of states and some tribal nations have enacted surface damage statutes (“SDAs”). These laws are designed to compensate for damage caused by mineral development. Most SDAs contain entry notification and negotiation requirements to facilitate contact between operators and surface owners/users. Most also contain binding requirements for payments by the operator to surface owners/users in connection with exploration and operating activities in addition to bonding requirements to compensate for damages to the surface as a result of such activities. Costs and delays associated with SDAs could impair operational effectiveness and increase development costs.
17
Other regulatory matters relating to our pipeline and gathering system assets and rail transportation
The pipelines we use to gather and transport our oil and natural gas are subject to regulation by the U.S. Department of Transportation (“DOT”) under the Hazardous Liquid Pipeline Safety Act of 1979, as amended (“HLPSA”) with respect to oil, and the Natural Gas Pipeline Safety Act of 1968, as amended (“NGPSA”) with respect to natural gas. The HLPSA and NGPSA govern the design, installation, testing, construction, operation, replacement and management of natural gas and hazardous liquids pipeline facilities, including pipelines transporting crude oil. Where applicable, the HLPSA and NGPSA also require us and other pipeline operators to comply with regulations issued pursuant to these acts that are designed to permit access to and allow copying of records and to make certain reports available and provide information as required by the Secretary of Transportation.
The Pipeline Safety Act of 1992, as reauthorized and amended (“Pipeline Safety Act”) mandates requirements in the way that the energy industry ensures the safety and integrity of its pipelines. The law applies to natural gas and hazardous liquids pipelines, including some gathering pipelines. Central to the law are the requirements it places on each pipeline operator to prepare and implement an “integrity management program.” The Pipeline Safety Act mandates a number of other requirements, including increased penalties for violations of safety standards and qualification programs for employees who perform sensitive tasks. The DOT has established a number of rules carrying out the provisions of this act. The DOT Pipeline and Hazardous Materials Safety Administration (“PHMSA”) has established a new risk-based approach to determine which gathering pipelines are subject to regulation, and what safety standards regulated pipelines must meet. We could incur significant expenses as a result of these laws and regulations.
The Pipeline Safety, Regulatory Certainty, and Job Creation Act of 2011 was signed into law on January 3, 2012. This law includes a number of provisions affecting pipeline owners and operators that became effective upon approval, including increased civil penalties for violators of pipeline regulations and additional reporting requirements. Most of the changes do not impact gathering lines. The legislation requires the PHMSA to issue or revise certain regulations and to conduct various reviews, studies and evaluations. In addition, the PHMSA in August 2011 issued an Advance Notice of Proposed Rulemaking (“ANPR”) regarding pipeline safety. As described in the ANPR, PHMSA is considering regulations regarding, among other things, the designation of additional high consequence areas along pipelines, minimum requirements for leak detection systems, installation of emergency flow restricting devices, and revision of valve spacing requirements. If revisions to gathering line regulations are enacted by PHMSA as a result of such ANPR, we could incur significant expenses. In October 2015, the PHMSA issued proposed new safety regulations for hazardous liquid pipelines, including a requirement that all hazardous liquid pipelines have a system for detecting leaks and that operators establish a timeline for inspections of affected pipelines following extreme weather events or natural disasters.
Any transportation of the Company’s crude oil or natural gas liquids by rail is also subject to regulation by the DOT’s PHMSA and the DOT’s Federal Railroad Administration (“FRA”) under the Hazardous Materials Regulations at 49 CFR Parts 171-180 (“HMR”), including Emergency Orders by the FRA and new regulations being proposed by the PHMSA, arising due to the consequences of train accidents and the increase in the rail transportation of flammable liquids.
In September 2013, the PHMSA issued a final rule updating its regulations to increase the maximum civil penalty from $100,000 to $200,000 for each violation for each day the violation continues, and to increase from $1,000,000 to $2,000,000 the limitation that the maximum administrative civil penalty may not exceed for any related series of violations.
U.S. federal taxation
Federal income tax laws significantly affect our operations. The principal provisions that affect us are those that permit us, subject to certain limitations, to deduct as incurred, rather than to capitalize and amortize, our share of the domestic “intangible drilling and development costs” and to claim depletion on a portion of our domestic oil and natural gas properties (up to an aggregate of 1,000 Bbls per day of domestic crude oil and/or equivalent units of domestic natural gas). Further, the federal government may adopt tax laws and/or regulations that will possibly materially adversely affect us. Some possible measures that have been proposed in the past include the repeal or elimination of percentage depletion and the immediate deduction or write-offs of intangible drilling costs. Because of the speculative nature of such measures at this time, we are unable to determine what effect, if any, future proposals would have on product demand or our results of operations.
U.S. environmental regulations
The exploration, development and production of oil and natural gas, including the operation of saltwater injection and disposal wells, are subject to various federal, state and local environmental laws and regulations. These laws and regulations
18
can increase the costs of planning, designing, installing and operating oil and natural gas wells. Federal environmental statutes to which our domestic activities are subject include, but are not limited to:
• | the Oil Pollution Act of 1990 (“OPA”); |
• | the Clean Water Act of 1972 (“CWA”); |
• | the Rivers and Harbors Act of 1899; |
• | the Comprehensive Environmental Response, Compensation and Liability Act, as amended (“CERCLA”); |
• | the Resource Conservation and Recovery Act (“RCRA”); |
• | the Clean Air Act (“CAA”); |
• | the Safe Drinking Water Act (“SDWA”); |
• | the Toxic Substances Control Act of 1976 ("TSCA"); |
• | the Endangered Species Act of 1973 (the "ESA"); and |
• | the National Environment Policy Act of 1969 (the "NEPA") |
These laws and their implementing regulations, as well as analogous state and local laws and regulations, generally restrict pollutants emitted to the air, discharges to surface waters, and disposal or other releases to surface and below ground soils and groundwater.
In general, the oil and natural gas exploration and production industry has been the subject of increasing scrutiny and regulation by environmental authorities. For example, the United States Environmental Protection Agency (“EPA”) has identified environmental compliance by the energy extraction section as one of its enforcement initiatives for fiscal years 2017-2019.
Our domestic activities are subject to regulations promulgated under federal statutes and comparable state statutes. We also are subject to regulations governing the handling, transportation, storage and disposal of naturally occurring radioactive materials that are found in our oil and natural gas operations and other materials generated by our operations. Administrative, civil and criminal penalties, as well as injunctive relief, may be imposed for non-compliance with environmental laws and regulations. Additionally, these laws and regulations may require the acquisition of permits or other governmental authorizations before we undertake certain activities, limit or prohibit other activities because of protected areas or species, restrict the types of substances used in our drilling operations, impose certain substantial liabilities for the investigation and clean-up of pollution, impose certain reporting requirements, regulate remedial plugging operations to prevent future contamination, and require substantial expenditures for compliance. We cannot predict what effect future regulation or legislation, enforcement policies, and claims for damages to property, employees, other persons and the environment resulting from our operations could have on our activities.
Under the CWA, which was amended and augmented by OPA, our release or threatened release of oil or hazardous substances into or upon waters of the United States, adjoining shorelines and wetlands and offshore areas could result in our being held responsible for: (1) the costs of removing or remediating a release; (2) administrative, civil or criminal fines or penalties; or (3) specified damages, such as loss of use, property damage and natural resource damages. The scope of our liability could be extensive depending upon the circumstances of the release. Liability can be joint and several and without regard to fault. The CWA imposes restrictions and permitting requirements for discharges of pollutants as well as certain discharges of dredged or fill material into waters of the United States, including certain wetlands, which may apply to various of our construction activities, as well as requirements to develop Spill Prevention Control and Countermeasure Plans and Facility Response Plans to address potential discharges of oil into or upon waters of the United States and adjoining shorelines. State laws governing discharges to water also may impose restrictions and require varying civil, criminal and administrative penalties and impose liabilities in the case of a discharge of petroleum or its derivatives, or other hazardous substances, into state waters. The EPA has issued final rules outlining its position on the federal jurisdictional reach over waters of the United States. This interpretation by the EPA may constitute an expansion of federal jurisdiction over waters of the United States. The rule was stayed nationwide by the U.S. Sixth Circuit Court of Appeals in October 2015 as that appellate court and several other courts hear lawsuits opposing implementation of the rule. In January 2017, the United States Supreme Court accepted review of the rule to determine whether jurisdiction rests with the federal district or appellate courts. Litigation surrounding this rule is ongoing. In February 2017, President Trump issued an executive order directing the agencies to begin the process of rescinding or revising the rule.
CERCLA, often referred to as Superfund, and comparable state statutes, impose liability that is generally joint and several and that is retroactive for costs of investigation and remediation and for natural resource damages, without regard to fault or the legality of the original conduct, on specified classes of persons for the release of a “hazardous substance” or under state law, other specified substances, into the environment. So-called potentially responsible parties (“PRPs”) include the current and certain past owners and operators of a facility where there has been a release or threat of release of a hazardous
19
substance and persons who disposed of or arranged for the disposal of hazardous substances found at a site. CERCLA also authorizes the EPA and, in some cases, third parties to take actions in response to threats to the public health or the environment and to seek to recover from the PRPs the cost of such action. Liability can arise from conditions on properties where operations are conducted, even under circumstances where such operations were performed by third parties not under our control, and/or from conditions at third party disposal facilities where materials from operations were sent. Although CERCLA currently exempts petroleum (including oil and natural gas) from the definition of hazardous substance, some similar state statutes do not provide such an exemption. We cannot ensure that this exemption will be preserved in any future amendments of the act. Such amendments could have a material impact on our costs or operations. Additionally, our operations may involve the use or handling of other materials that may be classified as hazardous substances under CERCLA or regulated under similar state statutes. We may also be the owner or operator of sites on which hazardous substances have been released.
Oil and natural gas exploration and production, and possibly other activities, have been conducted at a majority of our properties by previous owners and operators. Materials from these operations remain on some of the properties and in certain instances may require remediation. In some instances, we have agreed to indemnify the sellers of producing properties from whom we have acquired reserves against certain liabilities for environmental claims associated with the properties. We do not believe the costs to be incurred by us for compliance and remediating previously or currently owned or operated properties will be material, but we cannot guarantee that result.
RCRA and comparable state and local programs impose requirements on the management, generation, treatment, storage, disposal and remediation of both hazardous and nonhazardous solid wastes. Although we believe we utilize operating and waste disposal practices that are standard in the industry, hydrocarbons or other solid wastes may have been disposed or released on or under the properties we own or lease, in addition to the locations where such wastes have been taken for disposal. In addition, many of these properties have been owned or operated by third parties. We have not had control over such parties' treatment of hydrocarbons or other solid wastes and the manner in which such substances may have been disposed or released. We also generate hazardous and non-hazardous solid waste in our routine operations. It is possible that certain wastes generated by our operations, which are currently exempt from “hazardous waste” regulations under RCRA, may in the future be designated as “hazardous waste” under RCRA or other applicable state statutes and become subject to more rigorous and costly management and disposal requirements; these wastes may not be exempt under current applicable state statutes. For example, following the filing of a lawsuit in the U.S. District Court for the District of Columbia in May 2016 by several non-governmental environmental groups against the EPA for the agency’s failure to timely assess its RCRA Subtitle D criteria regulations for oil and gas wastes, the EPA and the environmental groups entered into an agreement that was finalized in a consent decree issued by the District Court on December 28, 2016. Under the decree, the EPA is required to propose no later than March 15, 2019, a rulemaking for revision of certain Subtitle D criteria regulations pertaining to oil and gas wastes or sign a determination that revision of the regulations is not necessary. If the EPA proposes a rulemaking for revised oil and gas waste regulations, the Consent Decree requires that the EPA take final action following notice and comment rulemaking no later than July 15, 2021. Non-exempt waste is subject to more rigorous and costly disposal requirements. A loss of the RCRA exclusion for drilling fluids, produced waters and related wastes could result in a significant increase in our costs to manage and dispose of waste.
Our operations are subject to local, state and federal regulations for the control of emissions from sources of air pollution. The CAA and analogous state and local laws require certain new and modified sources of air pollutants to obtain permits prior to commencing construction or operation. Smaller sources may qualify for exemption from permit requirements or for more streamlined permitting, for example, through qualifications for permits by rule, standard permits or general permits. Major sources of air pollutants are subject to more stringent, federally imposed requirements including additional operating permits. Federal and state laws designed to control hazardous (i.e., toxic) air pollutants may require installation of additional controls. Administrative enforcement actions for failure to comply strictly with air pollution regulations or permits are generally resolved by payment of monetary fines and correction of any identified deficiencies. Alternatively, regulatory agencies could bring lawsuits for civil penalties or require us to suspend or forgo construction, modification or operation of certain air emission sources.
On April 17, 2012, the EPA issued final rules to subject oil and natural gas productions, storage, processing and transmission operations to regulation under the New Source Performance Standards (“NSPS”), and National Emission Standards for Hazardous Air Pollutants (“NESHAPS”), programs under the CAA, and to impose new and amended requirements under both programs. The EPA rules include NSPS standards for completions of hydraulically fractured natural gas wells. Beginning January 1, 2015, operators must capture the natural gas and make it available for use or sale, which can be done through the use of green completions. The standards are applicable to new hydraulically fractured wells and also existing wells that are refractured. Further, the finalized regulations also establish specific new requirements, which became effective in 2012, for emissions from compressors, controllers, dehydrators, storage tanks, natural gas processing plants and certain other
20
equipment. These rules may require changes to our operations, including the installation of new equipment to control emissions. We continuously evaluate the effect these rules and amendments will have on our business.
The EPA has adopted rules to regulate methane emissions, including from new and modified oil and gas production sources and natural gas processing and transmission sources, and has announced its intention to regulate methane emissions from existing oil and gas sources. The status of future regulation remains unclear but if adopted could require changes to our operations, including the installation of new emission control equipment. Simultaneously with the methane rules, EPA adopted new rules governing the aggregating of multiple surface sites into a single-source of air quality permitting purposes, a change which could impact the applicability of permitting requirement to our operations and subject certain operations to additional regulatory requirements. We continuously evaluate the effect of these rules on our operations.
In the absence of comprehensive federal legislation on greenhouse gas (“GHG”) emission control, the EPA attempted to require the permitting of GHG emissions. Although the Supreme Court struck down the permitting requirements, it upheld the EPA’s authority to control GHG emissions when a permit is required due to emissions of other pollutants. These permitting provisions, to the extent applicable to our operations, could require us to implement emission controls or other measures to reduce GHG emissions and we could incur additional costs to satisfy those requirements. In addition, GHG regulations could have an adverse effect on demand for the oil and natural gas we produce.
In addition, the EPA requires the reporting of GHG emissions from specified large GHG emission sources including onshore and offshore oil and natural gas production facilities and onshore oil and natural gas processing, transmission, storage and distribution facilities, which may include facilities we operate. Reporting of GHG emissions from such facilities is required on an annual basis. We will continue to incur costs associated with this reporting obligation.
Additionally, in December 2015, the United States joined the international community at the 21st Conference of the Parties of the United Nations Framework Convention on Climate Change in Paris, France that prepared an agreement requiring member countries to review and "represent a progression" in their intended nationally determined contributions, which set GHG emission reduction goals every five years beginning in 2020. This “Paris Agreement” was signed by the United States in April 2016 and entered into force in November 2016. The United States is one of more than 120 nations having ratified or otherwise consented to the agreement; however, this agreement does not create any binding obligations for nations to limit their GHG emissions but, rather, includes pledges to voluntarily limit or reduce future emissions. It remains unclear how the commitment of the United States to the Paris Agreement will be treated by the new administration.
In late 2016, the Bureau of Land Management adopted rules governing flaring and venting on public and tribal lands, which could require additional equipment and emissions controls as well as inspection requirements. These rules have been challenged in court and remain in litigation. Additionally, the US House of Representatives has passed a resolution under the Congressional Review Act disapproving the rules; Senate action remains pending. If allowed to stand, these additional regulations on our air emissions is likely to result in increased compliance costs and additional operating restrictions on our business.
ESA was established to protect endangered and threatened species. Pursuant to that act, if a species is listed as threatened or endangered, restrictions may be imposed on activities adversely affecting that species’ habitat. Similar protections are offered to migratory birds under the Migratory Bird Treaty Act. The U.S. Fish and Wildlife Service must also designate the species’ critical habitat and suitable habitat as part of the effort to ensure survival of the species. A critical habitat or suitable habitat designation could result in further material restrictions to land use and may materially delay or prohibit land access for oil and natural gas development. If we were to have a portion of our leases designated as critical or suitable habitat, it may adversely impact the value of the affected leases.
Oil and natural gas exploration and production activities on federal lands may be subject to the NEPA, which requires federal agencies, including the Department of the Interior, to evaluate major agency actions having the potential to significantly impact the environment. In the course of such evaluations, an agency will prepare an Environmental Assessment that assesses the potential direct, indirect and cumulative impacts of a proposed project and, if necessary, will prepare a more detailed Environmental Impact Statement that may be made available for public review and comment. Depending on the mitigation strategies recommended in the Environmental Assessments or Environmental Impact Statement, we could incur added costs, which may be significant. Reviews and decisions under NEPA are also subject to protest, appeal or litigation, any or all of which may delay or halt projects. To the extent that our exploration and development plans include leases on federal lands, the NEPA requirements have the potential to delay or impose additional conditions upon the development of oil and natural gas projects.
Hydraulic fracturing activities
21
Over the past few years, there has been an increased focus on environmental aspects of hydraulic fracturing activities in the United States. While hydraulic fracturing is typically regulated by state oil and natural gas commissions in the United States, there have recently been a number of regulatory initiatives at the federal and local levels as well as by other state agencies.
Nearly all of our exploration and production operations depend on the use of hydraulic fracturing to enhance production from oil and natural gas wells. Hydraulic fracturing involves the injection of water, sand and chemicals under pressure into formations to fracture the surrounding rock and stimulate production. Our hydraulic fracturing activities are focused in our shale plays in South Texas, East Texas, North Louisiana and Appalachia. Predominantly all of our undeveloped properties would not be economical without the use of hydraulic fracturing to stimulate production from the well.
Currently, most hydraulic fracturing activities are regulated at the state level, as the SDWA currently exempts from regulation the injection of fluids or propping agents (other than diesel fuels) for hydraulic fracturing operations. Congress has periodically considered legislation to amend the federal SDWA to remove the exemption from regulation and permitting that is applicable to hydraulic fracturing operations and to require reporting and disclosure of chemicals used by the oil and natural gas industry in the hydraulic fracturing process. Sponsors of bills previously introduced before the Senate and House of Representatives have asserted that chemicals used in the fracturing process could adversely affect drinking water supplies. Many states have considered or adopted legislation regulating hydraulic fracturing, including the disclosure of chemicals used in the process or the prohibition of certain hydraulic fracturing activities. These bills, or similar legislation, if adopted, could increase the possibility of litigation and establish an additional level of regulation at the federal level that could lead to operational delays or increased operating costs and could result in additional regulatory burdens, making it more difficult to perform hydraulic fracturing and increasing our costs of compliance.
In addition, the EPA has recently been taking action to assert federal regulatory authority over hydraulic fracturing using diesel under the SDWA's Underground Injection Control Program and has issued guidance regarding its authority over the permitting of these activities. Additionally, in December 2016, the EPA released its final report on the potential impacts of hydraulic fracturing on drinking water resources, concluding that “water cycle” activities associated with hydraulic fracturing may impact drinking water resources “under some circumstances,” including water withdrawals for fracturing in times or areas of low water availability; surface spills during the management of fracturing fluids, chemicals or produced water; injection of fracturing fluids into wells with inadequate mechanical integrity; injection of fracturing fluids directly into groundwater resources; discharge of inadequately treated fracturing wastewater to surface waters; and disposal or storage of fracturing wastewater in unlined pits. Further, in June 2016, the EPA published an effluent limit guideline final rule prohibiting the discharge of wastewater from onshore unconventional oil and natural gas extraction facilities to publicly owned wastewater treatment plants. In 2014, the EPA published an advanced notice of public rulemaking regarding TSCA reporting of the chemical substances and mixture used in hydraulic fracturing.
The Bureau of Land Management published a final rule that established new or more stringent standards relating to hydraulic fracturing on federal and tribal lands but, in June 2016 a Wyoming federal judge struck down this final rule, finding that the Bureau of Land Management lacked authority to promulgate the rule, and that decision is currently being appealed by the federal government. This litigation remains on appeal.
Local regulations, which may be preempted by state and federal regulations, have included the following which may extend to all operations including those beyond hydraulic fracturing:
• | noise control ordinances; |
• | traffic control ordinances; |
• | limitations on the hours of operations; and |
• | mandatory reporting of accidents, spills and pressure test failures. |
If in the course of our routine oil and natural gas operations, surface spills and leaks occur, including casing leaks of oil or other materials, we may incur penalties and costs for waste handling, investigation and remediation and third party actions for damages. Moreover, we are only able to directly control the operations of the wells that we operate. Notwithstanding our lack of control over wells owned by us but operated by others, the failure of the operator to comply with applicable environmental regulations may be attributable to us and may impose legal liabilities upon us.
If substantial liabilities to third parties or governmental entities are incurred, the payment of such claims may reduce or eliminate the funds available for project investment or result in loss of our properties. Although we maintain insurance coverage we consider to be customary in the industry, we are not fully insured against all of these risks, either because
22
insurance is not available or because of high premiums. Accordingly, we may be subject to liability or may lose substantial portions of properties due to hazards that cannot be insured against or have not been insured against due to prohibitive premiums or for other reasons. The imposition of any of these liabilities or compliance obligations on us may have a material adverse effect on our financial condition and results of operations.
We do not anticipate that we will be required in the near future to expend amounts that are material in relation to our total capital expenditures program complying with current environmental laws and regulations. As these laws and regulations are frequently changed and are subject to interpretation, our assessment regarding the cost of compliance or the extent of liability risks may change in the future.
OSHA and other regulations
To the extent not preempted by other applicable laws, we are subject to the requirements of the federal OSHA and comparable state statutes, where applicable. The OSHA hazard communication standard, the EPA community right-to-know regulations under the Title III of CERCLA and similar state statutes, where applicable, require that we maintain and/or disclose information about hazardous materials used or produced in our operations. We believe that we are in substantial compliance with these applicable requirements and with other OSHA and comparable state requirements.
Title to our properties
When we acquire developed properties we conduct a title investigation, which will most often include either reviewing or obtaining a title opinion. However, when we acquire undeveloped properties, as is common industry practice, we usually conduct little or no investigation of title other than a preliminary review of local real property and/or mineral records. We will conduct title investigations and, in most cases, obtain a title opinion of local counsel for the drill site before we begin drilling operations. We believe that the methods we utilize for investigating title prior to acquiring any property are consistent with practices customary in the oil and natural gas industry and that our practices are adequately designed to enable us to acquire marketable title to properties. However, some title risks cannot be avoided, despite the use of customary industry practices.
Our properties are generally burdened by:
• | customary royalty and overriding royalty interests; |
• | liens incident to operating agreements; and |
• | liens for current taxes and other burdens and minor encumbrances, easements and restrictions. |
We believe that none of these burdens materially detract from the value of our properties or materially interfere with property used in the operation of our business. In addition to the foregoing listed burdens, substantially all of our properties are pledged as collateral under the EXCO Resources Credit Agreement, 1.5 Lien Notes, 1.75 Lien Term Loans and the Second Lien Term Loans.
Operational factors and insurance
Oil and natural gas exploration and development involves a high degree of risk. In the event of explosions, environmental damage, or other accidents such as well fires, blowouts, equipment failure and human error, substantial liabilities to third parties or governmental entities may be incurred, the satisfaction of which could substantially reduce available cash and possibly result in the loss of oil and natural gas properties. As is common in the oil and natural gas industry, we are not fully insured against all risks associated with our business either because such insurance is not available or because we believe the premium costs are prohibitive. A loss not fully covered by insurance could have a materially adverse effect on our operating results, financial position or cash flows. For further discussion on risks see “Item 1A. Risk Factors - We are exposed to operating hazards and uninsured risks that could adversely impact our results of operations and cash flows.”
We currently carry automobile liability, general liability and excess liability insurance with a combined annual limit of $101 million per occurrence and in the aggregate. These insurance policies contain maximum policy limits and deductibles ranging from $1,000 to $25,000 that must be met prior to recovery, and are subject to customary exclusions and limitations. Our automobile and general liability insurance covers us and our subsidiaries for third-party claims and liabilities arising out of lease operations and related activities. The excess liability insurance is in addition to, and is triggered if; the automobile and general liability insurance per occurrence limit is reached. Further, we currently carry $45 million of pollution coverage, $25 million of well control (blowout) coverage and property insurance in the amount of $178 million in respect of wellhead, surface equipment, tanks, miscellaneous items and scheduled oil lease roads coverage with deductibles ranging from $100,000 to $500,000.
23
We require our third-party contractors to sign master service agreements in which they generally agree to indemnify us for the injury and death of the service provider's employees as well as contractors and subcontractors that are hired by the service provider. Similarly, we agree to indemnify our third-party contractors against claims made by our employees and our other contractors. Additionally, each party generally is responsible for damage to its own property.
Our third-party contractors that perform hydraulic fracturing operations for us sign master service agreements containing the indemnification provisions noted above. We do not currently have any insurance policies in effect that are intended to provide coverage for losses solely related to hydraulic fracturing operations. We believe that our general liability, excess liability and pollution insurance policies would cover third-party claims related to hydraulic fracturing operations and associated legal expenses, in accordance with, and subject to, the terms of such policies. However, these policies generally will not cover fines and penalties. Further, these policies may not cover the costs and expenses related to government-mandated environmental clean-up responsibilities, or may do so on a limited basis.
Our employees
As of December 31, 2016, we employed 183 persons. None of our employees are represented by unions or covered by collective bargaining agreements. To date, we have not experienced any strikes or work stoppages due to labor problems, and we consider our relations with our employees to be satisfactory. We also utilize the services of independent consultants and contractors.
Forward-looking statements
This Annual Report on Form 10-K contains forward-looking statements, as defined in Section 27A of the Securities Act of 1933, as amended ("Securities Act") and Section 21E of the Securities Exchange Act of 1934, as amended ("the Exchange Act"). These forward-looking statements relate to, among other things, the following:
• | our future financial and operating performance and results; |
• | our business strategy; |
• | market prices; |
• | our future use of derivative financial instruments; and |
• | our plans and forecasts. |
We have based these forward-looking statements on our current assumptions, expectations and projections about future events. We use the words “may,” “expect,” “anticipate,” “estimate,” “believe,” “continue,” “intend,” “plan,” “potential,” “project,” “budget” and other similar words to identify forward-looking statements. The statements that contain these words should be read carefully because they discuss future expectations, contain projections of results of operations or our financial condition and/or state other “forward-looking” information. We do not undertake any obligation to update or revise any forward-looking statements, except as required by applicable securities laws. These statements also involve risks and uncertainties that could cause our actual results or financial condition to materially differ from our expectations in this Annual Report on Form 10-K and the documents incorporated herein by reference, including, but not limited to:
• | fluctuations in the prices of oil and natural gas; |
• | the availability of oil and natural gas; |
• | future capital requirements and availability of financing, including limitations on our ability to incur certain types of indebtedness under our debt agreements and to refinance or replace existing debt obligations as they mature; |
• | our ability to meet our current and future debt service obligations, including our ability to maintain compliance with our debt covenants; |
• | disruption of credit and capital markets and the ability of financial institutions to honor their commitments; |
• | estimates of reserves and economic assumptions, including estimates related to acquisitions and dispositions of oil and natural gas properties; |
• | geological concentration of our reserves; |
• | risks associated with drilling and operating wells; |
• | exploratory risks, including those related to our activities in shale formations; |
• | discovery, acquisition, development and replacement of oil and natural gas reserves; |
• | outcome of divestitures of non-core assets, including the potential sale of our assets in the South Texas region; |
• | cash flow and Liquidity; |
24
• | our ability to enter into transactions as a result of our credit rating, including derivatives with financial institutions and services with vendors; |
• | timing and amount of future production of oil and natural gas; |
• | availability of drilling and production equipment; |
• | availability of water, sand and other materials for drilling and completion activities; |
• | marketing of oil and natural gas; |
• | political and economic conditions and events in oil-producing and natural gas-producing countries; |
• | title to our properties; |
• | litigation; |
• | competition; |
• | our ability to attract and retain key personnel; |
• | general economic conditions, including costs associated with drilling and operations of our properties; |
• | our ability to comply with the listing requirements of, and maintain the listing of our common shares on, the New York Stock Exchange ("NYSE"); |
• | environmental or other governmental regulations, including legislation to reduce emissions of greenhouse gases, legislation of derivative financial instruments, regulation of hydraulic fracture stimulation and elimination of income tax incentives available to our industry; |
• | receipt and collectability of amounts owed to us by purchasers of our production and counterparties to our derivative financial instruments; |
• | decisions whether or not to enter into derivative financial instruments; |
• | potential acts of terrorism; |
• | our ability to manage joint ventures with third parties, including the resolution of any material disagreements and our partners’ ability to satisfy obligations under these arrangements; |
• | actions of third party co-owners of interests in properties in which we also own an interest; |
• | fluctuations in interest rates; |
• | our ability to effectively integrate companies and properties that we acquire; |
• | our ability to execute our business strategies and other corporate actions; |
• | outcome of shareholder approvals related to the warrants and issuance of common shares in connection with the 1.5 Lien Notes and 1.75 Lien Term Loans; |
• | decisions and our ability to pay interest on the 1.5 Lien Notes and 1.75 Lien Term Loans in cash, common shares or additional indebtedness; and |
• | our ability to continue as a going concern. |
We believe that it is important to communicate our expectations of future performance to our investors. However, events may occur in the future that we are unable to accurately predict, or over which we have no control. We caution users of the financial statements not to place undue reliance on any forward-looking statements. When considering our forward-looking statements, keep in mind the risk factors and other cautionary statements in this Annual Report on Form 10-K. The risk factors noted in this Annual Report on Form 10-K provide examples of risks, uncertainties and events that may cause our actual results to differ materially from those contained in any forward-looking statement. Please see “Risk Factors” for a discussion of certain risks related to our business, indebtedness and common shares.
Our revenues, operating results and financial condition depend substantially on prevailing prices for oil and natural gas and the availability of capital from the EXCO Resources Credit Agreement and other sources. Declines in oil or natural gas prices may have a material adverse effect on our financial condition, Liquidity, results of operations, the amount of oil or natural gas that we can produce economically and the ability to fund our operations. Historically, oil and natural gas prices and markets have been volatile, with prices fluctuating widely, and they are likely to continue to be volatile.
Glossary of selected oil and natural gas terms
The following are abbreviations and definitions of terms commonly used in the oil and natural gas industry and this Annual Report on Form 10-K.
2-D seismic. Geophysical data that depicts the subsurface strata in two dimensions.
3-D seismic. Geophysical data that depicts the subsurface strata in three dimensions. 3-D seismic typically provides a more detailed and accurate interpretation of the subsurface strata than 2-D seismic.
Appraisal wells. Wells drilled to convert an area or sub-region from the resource to the reserves category.
Analogous reservoir. Analogous reservoirs, as used in resources assessments, have similar rock and fluid properties, reservoir conditions (depth, temperature, and pressure) and drive mechanisms, but are typically at a more advanced
25
stage of development than the reservoir of interest and thus may provide concepts to assist in the interpretation of more limited data and estimation of recovery. When used to support proved reserves, an “analogous reservoir” refers to a reservoir that shares the following characteristics with the reservoir of interest: (i) same geological formation (but not necessarily in pressure communication with the reservoir of interest); (ii) same environment of deposition; (iii) similar geological structure; and (iv) same drive mechanism.
Bbl. One stock tank barrel, or 42 U.S. gallons liquid volume, used in reference to oil, NGLs or other liquid hydrocarbons.
Bbtu. One billion British thermal units.
Bcf. One billion cubic feet of natural gas.
Bcfe. One billion cubic feet equivalent calculated by converting one Bbl of oil or NGLs to six Mcf of natural gas. This ratio of Bbl to Mcf is commonly used in the oil and natural gas industry and represents the approximate energy equivalent of natural gas to oil or NGLs, and does not represent the sales price equivalency of natural gas to oil or NGLs. Currently the sales price of a Bbl or NGL is significantly higher than the sales price of six Mcf of natural gas.
Btu. British thermal unit, which is the heat required to raise the temperature of a one pound mass of water from 58.5 to 59.5 degrees Fahrenheit.
Completion. The installation of permanent equipment for the production of oil or natural gas, or, in the case of a dry hole, the reporting to the appropriate authority that the well has been abandoned.
Deterministic method. The method of estimating reserves or resources when a single value for each parameter (from the geoscience, engineering, or economic data) in the reserves calculation is used in the reserves estimation procedure.
Developed acreage. The number of acres which are allocated or assignable to producing wells or wells capable of production.
Development well. A well drilled within the proved area of an oil or natural gas reservoir to the depth of a stratigraphic horizon known to be productive.
Dry hole; Dry well. A well found to be incapable of producing either oil or natural gas in sufficient quantities to justify completion as an oil or natural gas well.
Economically producible. As it relates to a resource, a resource which generates revenue that exceeds, or is reasonably expected to exceed, the costs of the operation.
Estimated ultimate recovery (EUR). Estimated ultimate recovery is the sum of reserves remaining as of a given date and cumulative production as of that date.
Exploitation. The continuing development of a known producing formation in a previously discovered field. To maximize the ultimate recovery of oil or natural gas from the field by development wells, secondary recovery equipment or other suitable processes and technology.
Exploratory well. An exploratory well is a well drilled to find a new field or to find a new reservoir in a field previously found to be productive of oil or natural gas in another reservoir. Generally, an exploratory well is any well that is not a development well, a service well, or a stratigraphic test well.
Farmout. An assignment of an interest in a drilling location and related acreage conditional upon the drilling of a well on that location.
Formation. A succession of sedimentary beds that were deposited under the same general geologic conditions.
Fracture stimulation. A stimulation treatment routinely performed involving the injection of water, sand and chemicals under pressure to stimulate hydrocarbon production.
Full cost pool. The full cost pool consists of all costs associated with property acquisition, exploration, and development activities for a company using the full cost method of accounting. Additionally, any internal costs that can be directly identified with acquisition, exploration and development activities are included. Any costs related to production, general corporate overhead or similar activities are not included.
Gross acres or gross wells. The total acres or wells, as the case may be, in which a working interest is owned.
Held-by-production. A provision in an oil, natural gas and mineral lease that perpetuates a company's right to operate a property or concession as long as the property or concession produces a minimum paying quantity of oil or natural gas.
Horizontal wells. Wells drilled at angles greater than 70 degrees from vertical.
Initial production rate. Generally, the maximum 24 hour production volume from a well.
26
Mbbl. One thousand stock tank barrels.
Mcf. One thousand cubic feet of natural gas.
Mcfe. One thousand cubic feet equivalent calculated by converting one Bbl of oil or NGLs to six Mcf of natural gas.
Mmbbl. One million stock tank barrels.
Mmbtu. One million British thermal units.
Mmcf. One million cubic feet of natural gas.
Mmcf/d. One million cubic feet of natural gas per day.
Mmcfe. One million cubic feet of natural gas equivalent calculated by converting one Bbl of oil or NGLs to six Mcf of natural gas. This ratio of Bbl to Mcf is commonly used in the oil and natural gas industry and represents the approximate energy equivalent of natural gas to oil or NGLs, and does not represent the sales price equivalency of natural gas to oil or NGLs. Currently the sales price of a Bbl or NGL is significantly higher than the sales price of six Mcf of natural gas.
Mmcfe/d. One million cubic feet of natural gas equivalent per day calculated by converting one Bbl of oil or NGLs to six Mcf of natural gas.
Net acres or net wells. Exists when the sum of fractional ownership interests owned in gross acres or gross wells equals one. We compute the number of net wells by totaling the percentage interest we hold in all our gross wells.
NYMEX. New York Mercantile Exchange.
NGLs. The combination of ethane, propane, butane and natural gasolines that when removed from natural gas become liquid under various levels of higher pressure and lower temperature.
Overriding royalty interest. An interest in an oil and/or natural gas property entitling the owner to a share of oil and natural gas production free of the costs of production.
Pad drilling. The drilling of multiple wells from the same site.
Play. A term applied to a portion of the exploration and production cycle following the identification by geologists and geophysicists of areas with potential oil and natural gas reserves.
Present value of estimated future net revenues or PV-10. The present value of estimated future net revenues is an estimate of future net revenues from a property at the date indicated, without giving effect to derivative financial instrument activities, after deducting production and ad valorem taxes, future capital costs, abandonment costs and operating expenses, but before deducting future income taxes. The future net revenues have been discounted at an annual rate of 10% to determine their “present value.” The present value is shown to indicate the effect of time on the value of the net revenue stream and should not be construed as being the fair market value of the properties. Estimates have been made using constant oil and natural gas prices and operating and capital costs at the date indicated, at its acquisition date, or as otherwise indicated.
Probabilistic method. The method of estimation of reserves or resources when the full range of values that could reasonably occur for each unknown parameter (from the geoscience and engineering data) is used to generate a full range of possible outcomes and their associated probabilities of occurrence.
Productive well. A productive well is a well that is not a dry well.
Proved Developed Reserves. These reserves are reserves of any category that can be expected to be recovered: (i) through existing wells with existing equipment and operating methods or in which the cost of the required equipment is relatively minor compared to the cost of a new well; and (ii) through installed extraction equipment and infrastructure operational at the time of the reserves estimate if the extraction is by means not involving a well.
Proved Reserves. Proved oil and natural gas reserves are those quantities of oil and natural gas, which, by analysis of geoscience and engineering data, can be estimated with Reasonable Certainty to be economically producible from a given date forward, from known reservoirs, and under existing economic conditions, operating methods, and government regulations, prior to the time at which contracts providing the right to operate expire, unless evidence indicates that renewal is reasonably certain, regardless of whether deterministic or probabilistic methods are used for the estimation. The project to extract the hydrocarbons must have commenced or the operator must be reasonably certain that it will commence the project within a reasonable time.
The area of the reservoir considered as proved includes: (i) the area identified by drilling and limited by fluid contacts, if any, and (ii) adjacent undrilled portions of the reservoir that can, with Reasonable Certainty, be judged to be continuous with it and to contain economically producible oil or gas on the basis of available geoscience and engineering data.
27
In the absence of data on fluid contacts, proved quantities in a reservoir are limited by the lowest known hydrocarbons (LKH) as seen in a well penetration unless geoscience, engineering, or performance data and reliable technology establishes a lower contact with Reasonable Certainty. Where direct observation from well penetrations has defined a highest known oil (HKO) elevation and the potential exists for an associated gas cap, proved oil reserves may be assigned in the structurally higher portions of the reservoir only if geoscience, engineering, or performance data and reliable technology establish the higher contact with Reasonable Certainty.
Reserves which can be produced economically through application of improved recovery techniques (including, but not limited to, fluid injection) are included in the proved classification when: (i) successful testing by a pilot project in an area of the reservoir with properties no more favorable than in the reservoir as a whole, the operation of an installed program in the reservoir or an analogous reservoir, or other evidence using reliable technology establishes the Reasonable Certainty of the engineering analysis on which the project or program was based; and (ii) the project has been approved for development by all necessary parties and entities, including governmental entities.
Existing economic conditions include prices and costs at which economic producibility from a reservoir is to be determined. The price shall be the average price during the 12-month period prior to the ending date of the period covered by the report, determined as an unweighted arithmetic average of the first-day-of-the-month price for each month within such period, unless prices are defined by contractual arrangements, excluding escalations based upon future conditions.
Proved Undeveloped Reserves. Reserves of any category that are expected to be recovered from new wells on undrilled acreage, or from existing wells where a relatively major expenditure is required for recompletion.
Reserves on undrilled acreage shall be limited to those directly offsetting development spacing areas that are reasonably certain of production when drilled, unless evidence using reliable technology exists that establishes Reasonable Certainty of economic producibility at greater distances. Undrilled locations can be classified as having undeveloped reserves only if a development plan has been adopted indicating that they are scheduled to be drilled within five years, unless the specific circumstances justify a longer time.
Under no circumstances shall estimates for undeveloped reserves be attributable to any acreage for which an application of fluid injection or other improved recovery technique is contemplated, unless such techniques have been proved effective by actual projects in the same reservoir or an analogous reservoir or by other evidence using reliable technology establishing Reasonable Certainty.
Recompletion. An operation within an existing well bore to make the well produce oil and/or natural gas from a different, separately producible zone other than the zone from which the well had been producing.
Reasonable Certainty. If deterministic methods are used, Reasonable Certainty means a high degree of confidence that the quantities will be recovered. If probabilistic methods are used, there should be at least a 90% probability that the quantities actually recovered will equal or exceed the estimate. A high degree of confidence exists if the quantity is much more likely to be achieved than not, and, as changes due to increased availability of geoscience (geological, geophysical, and geochemical), engineering, and economic data are made to EUR with time, reasonably certain EUR is much more likely to increase or remain constant than to decrease.
Reservoir. A porous and permeable underground formation containing a natural accumulation of producible oil and/or natural gas that is confined by impermeable rock or water barriers and is individual and separate from other reservoirs.
Resources. Resources are quantities of oil and natural gas estimated to exist in naturally occurring accumulations. A portion of the resources may be estimated to be recoverable, and another portion may be considered to be unrecoverable. Resources include both discovered and undiscovered accumulations.
Royalty interest. An interest in an oil and/or natural gas property entitling the owner to a share of oil and natural gas production free of the costs of production.
Shale. Fine-grained sedimentary rock composed mostly of consolidated clay or mud. Shale is the most frequently occurring sedimentary rock.
Shut-in well. A producing well that has been closed down temporarily for, among other things, economics, cleaning out, building up pressure, lack of a market or lack of equipment.
Spud. To start the well drilling process.
Standardized Measure of discounted future net cash flows or the Standardized Measure. Under the Standardized Measure, future cash flows are estimated by applying the simple average spot prices for the trailing 12 month period using the first day of each month beginning on January 1 and ending on December 1 of each respective year, adjusted for price differentials, to the estimated future production of year-end Proved Reserves. Future cash inflows are reduced
28
by estimated future production and development costs based on period-end and future plugging and abandonment costs to determine pre-tax cash inflows. Future income taxes are computed by applying the statutory tax rate to the excess of pre-tax cash inflows over our tax basis in the associated properties. Future net cash inflows after income taxes are discounted using a 10% annual discount rate to arrive at the Standardized Measure.
Stock tank barrel. 42 U.S. gallons liquid volume.
Tcf. One trillion cubic feet of natural gas.
Tcfe. One trillion cubic feet equivalent calculated by converting one Bbl of oil or NGLs to six Mcf of natural gas. This ratio of Bbl to Mcf is commonly used in the oil and natural gas industry and represents the approximate energy equivalent of natural gas to oil or NGLs, and does not represent the sales price equivalency of natural gas to oil or NGLs. Currently the sales price of a Bbl or NGL is significantly higher than the sales price for six Mcf of natural gas.
Undeveloped acreage. Leased acreage on which wells have not been drilled or completed to a point that would permit the production of economic quantities of oil and natural gas regardless of whether such acreage contains Proved Reserves.
Working interest. The operating interest that gives the owner the right to drill, produce and conduct activities on the property and a share of production.
Workovers. Operations on a producing well to restore or increase production.
Available information
We make available, free of charge, our Annual Report on Form 10-K, Quarterly Reports on Form 10-Q, Current Reports on Form 8-K and amendments to these reports on our website at www.excoresources.com as soon as reasonably practicable after those reports and other information are electronically filed with, or furnished to, the SEC.
Item 1A. | Risk Factors |
The risk factors noted in this section and other factors noted throughout this Annual Report on Form 10-K, including those risks identified in “Item 7. Management's Discussion and Analysis of Financial Condition and Results of Operations” describe examples of risks, uncertainties and events that may cause our actual results to differ materially from those contained in any forward-looking statement.
If one or more of these risks or uncertainties materialize, or if underlying assumptions prove incorrect, actual outcomes may vary materially from those included in this Annual Report on Form 10-K.
Risks Relating to Our Business
Oil and natural gas prices, which are subject to fluctuations, have declined substantially from historical highs and may remain depressed for the foreseeable future. The depression in oil and natural gas prices has, and is expected to continue to, adversely affect our revenues as well as our ability to maintain or increase our borrowing capacity, repay current or future indebtedness and obtain additional capital on attractive terms.
Our future financial condition, access to capital, cash flow and results of operations depend upon the prices we receive for our oil and natural gas. We are particularly dependent on prices for natural gas. Historically, oil and natural gas prices have been volatile and are subject to fluctuations in response to changes in supply and demand, market uncertainty and a variety of additional factors that are beyond our control, including, but not limited to:
• | the domestic and foreign supply of oil and natural gas; |
• | weather conditions; |
• | the price and quantity of imports of oil and natural gas; |
• | political conditions and events in other oil-producing and natural gas-producing countries, including embargoes, hostilities in the Middle East and other sustained military campaigns, and acts of terrorism or sabotage; |
• | the actions of the OPEC; |
• | domestic government regulation, legislation and policies; |
• | the level of global oil and natural gas inventories; |
• | technological advances affecting energy consumption; |
• | the price and availability of alternative fuels and other energy sources; and |
• | overall economic conditions. |
29
Oil and natural gas prices declined sharply during the latter half of 2014 and continued to decline throughout 2015 and into 2016. Although oil and natural gas prices rose throughout the majority of 2016, prices of oil and natural gas have historically been extremely volatile and we expect this volatility to continue. Oil and natural gas prices in 2017 have begun to recover compared to their levels in 2015 and 2016; however, they may never return to historical highs or remain at a level that allows us to economically operate our business.
During 2016, the NYMEX price for natural gas fluctuated from a high of $3.93 per Mmbtu to a low of $1.64 per Mmbtu, while the NYMEX WTI crude oil price ranged from a high of $54.06 per Bbl to a low of $26.21 per Bbl. For the five years ended December 31, 2016, the NYMEX Henry Hub natural gas price ranged from a high of $6.15 per Mmbtu to a low of $1.64 per Mmbtu, while the NYMEX WTI crude oil price ranged from a high of $110.53 per Bbl to a low of $26.21 per Bbl.
On December 31, 2016, the spot market price for natural gas at Henry Hub was $3.72 per Mmbtu, a 59% increase from December 31, 2015. On December 31, 2016, the spot market price for crude oil at Cushing was $53.72 per Bbl, a 45% increase from December 31, 2015. For 2016, our average realized prices (before the impact of derivative financial instruments) for oil and natural gas were $38.05 per Bbl and $1.93 per Mcf, respectively, compared with 2015 average realized prices of $43.89 per Bbl and $2.06 per Mcf, respectively.
Our revenues, cash flow and profitability, as well as our ability to maintain or increase our borrowing capacity, to repay current or future indebtedness and to obtain additional capital on attractive terms, depend substantially upon oil and natural gas prices. Compared to earlier years, the lower average prices realized for oil and natural gas in 2016 and 2015, coupled with the slow recovery in financial markets that has significantly limited and increased the cost of capital, have compelled most oil and natural gas producers, including us, to reduce levels of exploration, drilling and production activity. This has had a significant effect on our capital resources, Liquidity and operating results. Any sustained reductions in oil and natural gas prices will directly affect our revenues and can indirectly impact expected production by changing the amount of funds available to us to reinvest in exploration and development activities. Further reductions in oil and natural gas prices could also reduce the quantities of reserves that are commercially recoverable. Depressed oil and natural gas prices and reductions in our reserves has had other adverse consequences, including downward redeterminations of the availability of borrowings under the EXCO Resources Credit Agreement. The borrowing base under the EXCO Resources Credit Agreement is currently set at $150.0 million, and if oil and natural gas prices do not continue to improve, the lenders under the EXCO Resources Credit Agreement may further reduce our borrowing base which would further restrict our Liquidity. Additionally, further or continued declines in prices could result in additional non-cash charges to earnings due to impairments to our oil and natural gas properties.
In light of the depressed commodity price environment, there is risk that, among other things:
• | third parties’ confidence in our commercial or financial ability to explore and produce oil and natural gas could erode, which could impact our ability to execute on our business strategy; |
• | it may become more difficult to retain, attract or replace key employees; |
• | employees could be distracted from performance of their duties or more easily attracted to other career opportunities; and |
• | our suppliers, hedge counterparties, vendors and service providers could renegotiate the terms of our arrangements, terminate their relationship with us or require financial assurances from us. |
The occurrence of certain of these events may have a material adverse effect on our business, results of operations and financial condition.
Changes in the differential between NYMEX or other benchmark prices of oil and natural gas and the reference or regional index price used to price our actual oil and natural gas sales could have a material adverse effect on our results of operations and financial condition.
The reference or regional index prices that we use to price our oil and natural gas sales sometimes reflect a discount to the relevant benchmark prices, such as NYMEX. The difference between the benchmark price and the price we reference in our sales contracts is called a differential. We cannot accurately predict oil and natural gas differentials. Changes in differentials between the benchmark price for oil and natural gas and the reference or regional index price we reference in our sales contracts could have a material adverse effect on our results of operations and financial condition. We have experienced significant volatility in our price differentials including crude oil production from the Eagle Ford shale and natural gas production from certain areas in Appalachia. Our crude oil production from the Eagle Ford shale is currently sold at a price based on the WTI index plus or minus the differential to indices correlated to the Louisiana Light Sweet index. During 2016, the monthly average of this differential ranged from a high of WTI plus $2.34 per barrel to a low of WTI plus $1.12 per barrel.
30
Our natural gas production from the Marcellus shale in Northeast Pennsylvania is sold at a price based on a Platts index that represents value into the Transco Leidy Pipeline. Due to the increased production in this region without an offsetting increase in pipeline capacity or infrastructure to the Northeast United States markets, this differential in 2016 ranged from a low of NYMEX less $0.62 per Mmbtu to a high of NYMEX less $2.08 per Mmbtu. These differentials vary depending on factors such as supply, demand, pipeline capacity, infrastructure and weather.
We may encounter obstacles to marketing our oil and natural gas, which could adversely impact our revenues.
Our ability to market our oil and natural gas production will depend upon the availability and capacity of gathering systems, pipelines and other transportation facilities. We are primarily dependent upon third parties to transport our production. Transportation space on the gathering systems and pipelines we utilize is occasionally limited or unavailable due to repairs, outages caused by accidents or other events, or improvements to facilities or due to space being utilized by other companies that have priority transportation agreements. We have experienced production curtailments in our producing regions resulting from capacity restraints, offsetting fracturing stimulation operations and short term shutdowns of certain pipelines for maintenance purposes. As we have increased our knowledge of our shale properties, we have begun to shut in production on adjacent wells when conducting completion operations. Due to the high production capabilities of these wells, these volumes can be significant. Our access to transportation options can also be affected by U.S. federal and state regulation of oil and natural gas production and transportation, general economic conditions and changes in supply and demand. These factors and the availability of markets are beyond our control. If market factors dramatically change, the impact on our revenues could be substantial and could adversely affect our ability to produce and market oil and natural gas and the value of our common shares.
We have entered into marketing agreements with third parties to sell a significant percentage of our anticipated oil and natural gas production in the East Texas, North Louisiana and South Texas regions. If these third parties are unable or otherwise fail to market the oil and natural gas we produce, we would be required to find alternate means to market our production, which could increase our costs or reduce the revenues we might obtain from the sale of our oil and natural gas production, either of which could have a material adverse effect on our business, results of operations or financial condition.
We may experience a financial loss if any of our significant customers fail to pay us for our oil or natural gas or reduce the volume of oil and natural gas that they purchase from us.
Our ability to collect payments from the sale of oil and natural gas to our customers depends on the payment ability of our customer base, which includes several significant customers. If any one or more of our significant customers fails to pay us for any reason, we could experience a material loss. We are managing our credit risk as a result of the current commodity price environment through the attainment of financial assurances from certain customers. In addition, if any of our significant customers cease to purchase our oil or natural gas or reduce the volume of the oil or natural gas that they purchase from us, the loss or reduction could have a detrimental effect on our production volumes and may cause a temporary interruption in sales of, or a lower price for, our oil and natural gas.
Market conditions or operational impediments, such as lack of available transportation or infrastructure, may hinder our production or adversely impact our ability to receive market prices for our production or to achieve expected drilling results.
Market conditions or the unavailability of satisfactory oil and natural gas transportation arrangements or infrastructure may hinder our access to oil and natural gas markets or delay our production. The availability of a ready market for our oil and natural gas production depends on a number of factors, including the demand for and supply of oil and natural gas and the proximity of reserves to pipelines and terminal facilities. Our ability to market our production depends, in substantial part, on the availability and capacity of gathering systems, pipelines, processing facilities and oil and condensate trucking operations owned and operated by third-parties. Our failure to obtain these services on acceptable terms could have a material adverse effect on our business. We may be required to shut in wells due to lack of a market or inadequacy or unavailability of crude oil or natural gas pipelines, gathering systems or trucking capacity. A portion of our production may also be interrupted, or shut in, from time to time for numerous other reasons, including as a result of accidents, excessive pressures, maintenance, weather, field labor issues or other disruptions of service. Curtailments and disruptions may last from a few days to several months, and we have no control over when or if third-party facilities are restored.
In the past we have experienced production curtailments due to infrastructure and market constraints in the Eagle Ford shale formation, which have caused oil production to be shut in and natural gas production to be shut in or flared. Any significant curtailment in gathering, processing or pipeline system capacity, significant delay in the construction of necessary facilities or lack of availability of transportation would interfere with our ability to market our oil and natural gas production, and could have a material adverse effect on our cash flow and results of operations.
31
We have entered into significant natural gas firm transportation and marketing agreements primarily in East Texas and North Louisiana that require us to pay fixed amounts of money to the shippers or marketers regardless of quantities actually shipped or marketed. If we are unable to deliver the necessary quantities of natural gas, our results of operations and Liquidity could be adversely affected.
We have entered into significant natural gas firm transportation contracts primarily in East Texas and North Louisiana that require us to pay fixed amounts of money to the shippers regardless of quantities actually shipped. The use of firm transportation agreements allows us priority space in a shippers’ pipeline. Historically, we have paid significant amounts for the unused portion of these firm transportation agreements and expect to continue incurring significant costs for unused firm transportation in the future.
We have entered into an agreement to deliver an aggregate minimum volume commitment of natural gas production from the Holly and Shelby fields to certain gathering systems over a five-year period ending on December 1, 2018. If there is a shortfall to the minimum volume commitment in any year, then we are severally responsible with a joint venture partner to pay fixed amounts of money to the gatherer regardless of quantities actually produced in to the systems. For the twelve months ended December 1, 2016, our net share of the shortfall was $14.1 million.
In addition, we have also entered into a marketing agreement with respect to our Haynesville production whereby we are required to deliver a minimum amount of natural gas from the Haynesville shale. We will be required to make material expenditures for these agreements if we fail to deliver the required quantities of natural gas in the future.
We anticipate the deliveries of natural gas in future periods will not meet the minimum quantities set forth in certain of these agreements and will require us to make payments for the shortfall below the minimum quantities. In the event the quantities delivered under these arrangements are significantly below the minimum volumes within the agreements, it could adversely affect our business, financial condition and results of operations.
There are risks associated with our drilling activity that could impact our results of operations and financial condition. Our ability to develop properties in new or emerging formations may be subject to more uncertainties than drilling in areas that are more developed or have a longer history of established production.
Our drilling involves numerous risks, including the risk that we will not encounter commercially productive oil or natural gas reservoirs. We must incur significant expenditures to identify and acquire properties and to drill and complete wells. Additionally, seismic and other technology does not allow us to know conclusively prior to drilling a well that oil or natural gas is present or economically producible. The costs of drilling and completing wells are often uncertain, and drilling operations may be curtailed, delayed or canceled as a result of a variety of factors, including unexpected drilling conditions, pressure or irregularities in formations, equipment failures or accidents, weather conditions and shortages or delays in the delivery of equipment. We have experienced some delays in contracting for drilling rigs, obtaining fracture stimulation crews and materials, which result in increased costs to drill wells. Also, we may experience issues with the availability of water and sand used in our drilling and hydraulic fracturing activities. All of these risks could adversely affect our results of operations and financial condition.
The results of our drilling in new or emerging formations, including our properties in shale formations, are more uncertain initially than drilling results in areas that are developed, have established production or where we have a longer history of operation. Because new or emerging formations have limited or no production history, we are less able to use past drilling results in those areas to help predict future drilling results. Our experience with horizontal drilling in these areas to date, as well as the industry’s drilling and production history, while growing, is limited. The ultimate success of these drilling and completion techniques will be better evaluated over time as more wells are drilled and production profiles are better established. We have implemented several initiatives to manage our base production and minimize the decline from our shale properties. If these initiatives are not successful and we are required to incur significant expenditures to manage our base production, this could negatively impact our production and cash flows from operations.
If our drilling results are less than anticipated or we are unable to execute our drilling program because of capital constraints, lease expirations, and/or natural gas and oil prices decline, our investment in these areas may not be as attractive as we anticipate and we could incur material impairments of undeveloped properties and the value of our undeveloped acreage could decline in the future, which could have a material adverse effect on our business and results of operations.
Certain of our undeveloped leasehold assets are subject to leases that will expire over the next several years unless production is established on the acreage.
32
Leases on oil and natural gas properties typically have a term after which they expire unless, prior to expiration, a well is drilled and production of hydrocarbons in paying quantities is established. If our leases expire and we are unable to renew the leases, we will lose our right to develop the related properties. While we seek to actively manage our leasehold inventory through drilling wells to hold the leasehold acreage that we believe is material to our operations, our drilling plans for these areas are subject to change.
We conduct a substantial portion of our operations through joint ventures, and our failure to continue such joint ventures or resolve any material disagreements with our partners could have a material adverse effect on the success of these operations, our financial condition and our results of operations. Furthermore, the actions taken by other working interest owners could prevent or alter our development plans.
We conduct a substantial portion of our operations through joint ventures with third parties, principally Shell. We may also enter into other joint venture arrangements in the future. In many instances we depend on these third parties for elements of these arrangements that are important to the success of the joint venture, such as agreed payments of substantial development costs pertaining to the joint venture and their share of other costs of the joint venture. The performance of these third party obligations or the ability of third parties to meet their obligations under these arrangements is outside our control. If these parties do not meet or satisfy their obligations under these arrangements, the performance and success of these arrangements, and their value to us, may be adversely affected. If our current or future joint venture partners are unable to meet their obligations, we may be forced to undertake the obligations ourselves and/or incur additional expenses in order to have some other party perform such obligations. In such cases we may also be required to enforce our rights, which may cause disputes among our joint venture partners and us. If any of these events occur, they may adversely impact us, our financial performance and results of operations, these joint ventures and/or our ability to enter into future joint ventures.
Such joint venture arrangements may involve risks not otherwise present when exploring and developing properties directly, including, for example:
• | our joint venture partners may share certain approval rights over major decisions; |
• | the possibility that our joint venture partners might become insolvent or bankrupt, leaving us liable for their shares of joint venture liabilities; |
• | the possibility that we may incur liabilities as a result of an action taken by our joint venture partners; |
• | joint venture partners may be in a position to take action contrary to our instructions or requests or contrary to our policies or objectives; |
• | disputes between us and our joint venture partners may result in litigation or arbitration that would increase our expenses, delay or terminate projects and prevent our officers and directors from focusing their time and effort on our business; |
• | that under certain joint venture arrangements, neither joint venture partner may have the power to control the venture, and an impasse could be reached that might have a negative influence on our investment in the joint venture; and |
• | our joint venture partners may decide to terminate their relationship with us in any joint venture company or sell their interest in any of these companies and we may be unable to replace such joint venture partner or raise the necessary financing to purchase such joint venture partner’s interest. |
The failure to continue some of our joint ventures or to resolve disagreements with our joint venture partners could adversely affect our ability to transact the business that is the subject of such joint venture, which would in turn negatively affect our financial condition and results of operations.
The owners of working interests may not consent to the development of certain properties that we operate which may require us to assume their share of the working interest during the development and a period after the well is on production. This may require us to expend additional capital not already anticipated as part of our development plans and assume additional risks associated with the development and future performance of the properties. The owners of working interests in certain properties that we operate may also hold rights within the respective operating agreements that could prevent us from performing additional development activities on the properties such as recompletions and other workovers without their consent.
We may be unable to obtain additional financing to implement our growth strategy.
The growth of our business requires substantial capital on a continuing basis. Due to the amount of debt we have incurred and the restrictive covenants in the agreements governing our indebtedness related to the incurrence of additional
33
indebtedness, as well as factors related to the depressed commodity price environment, we anticipate that it will be difficult for us in the foreseeable future to obtain additional equity or debt financing or to obtain additional secured financing other than purchase money indebtedness. In addition, the borrowing base under the EXCO Resources Credit Agreement has been substantially reduced in recent years and is currently set at $150.0 million. If we are unable to obtain additional capital on satisfactory terms and conditions or at all, we may lose opportunities to acquire oil and natural gas properties and businesses and, therefore, be unable to implement our growth strategy.
We may be unable to acquire or develop additional reserves, which would reduce our revenues and access to capital.
Our success depends upon our ability to find, develop or acquire additional oil and natural gas reserves that are profitable to produce. Factors that may hinder our ability to acquire or develop additional oil and natural gas reserves include competition, access to capital, prevailing oil and natural gas prices and the number and attractiveness of properties for sale. If we are unable to conduct successful development activities or acquire properties containing Proved Reserves, our total Proved Reserves will generally decline as a result of production. Also, our production will generally decline. In addition, if our reserves and production decline, then the amount we are able to borrow under the EXCO Resources Credit Agreement will also decline. We may be unable to locate additional reserves, drill economically productive wells or acquire properties containing Proved Reserves.
Acquisitions, development drilling and exploratory drilling are the main methods of replacing reserves. However, development and exploratory drilling operations may not result in any increases in reserves for various reasons. Our future oil and natural gas production depends on our success in finding or acquiring additional reserves. If we fail to replace reserves through drilling or acquisitions, our level of production and cash flows will be adversely affected. Throughout 2016 we reduced our development activities and suspended drilling in certain regions, which caused our production to decline and negatively impacted our ability to replace our reserves, which in turn negatively impacted our operating results.
Competition in our industry is intense and we may be unable to compete in acquiring properties, contracting for drilling equipment and hiring experienced personnel.
The oil and natural gas industry is highly competitive. We encounter strong competition from other independent operators and from major oil companies in acquiring properties, contracting for drilling equipment and securing trained personnel. Many of these competitors have greater financial and technical resources and a larger headcount than we do. As a result, our competitors may be able to pay more for desirable leases, or to evaluate, bid for and purchase a greater number of properties or prospects than our financial or personnel resources will permit.
The oil and natural gas industry has periodically experienced shortages of drilling rigs, equipment, pipe and personnel, which has delayed development drilling and other exploitation activities and has caused significant expense/cost increases. We may experience difficulties in obtaining drilling rigs and other services in certain areas as well as an increase in the cost for these services and related material and equipment. We are unable to predict when, or if, such shortages may again occur or how such shortages and price increases will affect our development and exploitation program. The oil and gas industry has recently experienced an increase in demand for drilling and completion services as a result of the improved commodity price environment and more efficient and effective development techniques. The domestic U.S. onshore rig count increased from 375 in May 2016 to 634 in December 2016. Furthermore, oil and gas companies have increased the average amount of proppant utilized in the hydraulic fracturing process to enhance recoveries from the wells. As a result, the increased demand for drilling rigs and proppant could result in increased costs to develop our oil and gas properties.
Competition has also been strong in hiring experienced personnel, particularly in petroleum engineering, geoscience, accounting and financial reporting, tax and land professions. In addition, competition is strong for attractive oil and natural gas producing properties, oil and natural gas companies, and undeveloped leases and drilling rights. We are often outbid by competitors in our attempts to acquire properties or companies. All of these challenges could make it more difficult to execute our growth strategy.
34
We may not identify all risks associated with the acquisition of oil and natural gas properties, and any indemnification we receive from sellers may be insufficient to protect us from such risks, which may result in unexpected liabilities and costs to us.
Generally, it is not feasible for us to review in detail every individual property involved in an acquisition. Any future acquisitions will require an assessment of recoverable reserves, title, future oil and natural gas prices, operating costs, potential environmental hazards and liabilities, other liabilities and similar factors. Ordinarily, our review efforts are focused on the higher-valued properties. Even a detailed review of properties and records may not reveal existing or potential problems, nor will it permit us to become sufficiently familiar with the properties to fully assess their deficiencies and capabilities. We do not inspect every well that we acquire. Potential problems, such as deficiencies in the mechanical integrity of equipment or environmental conditions that may require significant remedial expenditures, are not necessarily observable even when we inspect a well. Any unidentified problems from acquisitions could result in material liabilities and costs that could negatively impact our financial condition and results of operations.
Even if we are able to identify problems with an acquisition, the seller may be unwilling or unable to provide effective contractual protection or indemnify us against all or part of these problems. Even if a seller agrees to provide indemnification, the indemnification may not be fully enforceable and may be limited by floors and caps on such indemnification.
We may not correctly evaluate reserve data or the exploitation potential of properties as we engage in our acquisition, exploration, development and exploitation activities.
Our future success will depend on the success of our acquisition, exploration, development and exploitation activities. Our decisions to purchase, explore, develop or otherwise exploit properties or prospects will depend in part on the evaluation of data obtained from production reports and engineering studies, geophysical and geological analyses and seismic and other information, the results of which are often inconclusive and subject to various interpretations. These decisions could significantly reduce our ability to generate cash needed to service our debt and fund our capital program and other working capital requirements.
We may be unable to successfully integrate the operations of acquisitions with our operations and we may not realize all the anticipated benefits of any acquisitions.
Integration of our acquisitions with our business and operations has been a complex, time consuming and costly process. Failure to successfully assimilate our past or future acquisitions could adversely affect our financial condition and results of operations.
Our acquisitions involve numerous risks, including:
• | operating a significantly larger combined organization and adding operations; |
• | difficulties in the assimilation of the assets and operations of the acquired business, especially if the assets acquired are in a new business segment or geographic area; |
• | the risk that oil and natural gas reserves acquired may not be of the anticipated magnitude or may not be developed as anticipated; |
• | the loss of significant key employees from the acquired business; |
• | the diversion of management’s attention from other business concerns; |
• | the failure to realize expected profitability or growth; |
• | the failure to realize expected synergies and cost savings; |
• | coordinating geographically disparate organizations, systems and facilities; and |
• | coordinating or consolidating corporate and administrative functions. |
Further, unexpected costs and challenges may arise whenever businesses with different operations or management are combined, and we may experience unanticipated delays in realizing the benefits of an acquisition. If we consummate any future acquisitions, our capitalization and results of operations may change significantly, and you may not have the opportunity to evaluate the economic, financial and other relevant information that we will consider in evaluating future acquisitions.
Our estimates of oil and natural gas reserves involve inherent uncertainty, which could materially affect the quantity and value of our reported reserves, our financial condition and the value of our common shares.
Numerous uncertainties are inherent in estimating quantities of Proved Reserves, including many factors beyond our control. This Annual Report on Form 10-K contains estimates of our Proved Reserves and the PV-10 and Standardized Measure
35
of our Proved Reserves. These estimates are based upon reports of our independent petroleum engineers. These reports rely upon various assumptions, including assumptions required by the SEC as to oil and natural gas prices, drilling and operating expenses, capital expenditures, taxes and availability of funds. These estimates should not be construed as the current market value of our estimated Proved Reserves.
The process of estimating oil and natural gas reserves is complex, requiring significant decisions and assumptions in the evaluation of available geological, engineering and economic data for each reservoir. As a result, the estimates are inherently imprecise evaluations of reserve quantities and future net revenue and such estimates prepared by different engineers or by the same engineers at different times, may vary substantially.
Our actual future production, revenues, taxes, development expenditures, operating expenses and quantities of recoverable oil and natural gas reserves may vary substantially from those we have assumed in the estimates. Any significant variance in our assumptions could materially affect the quantity and value of reserves, the amount of PV-10 and Standardized Measure described in this Annual Report on Form 10-K, and our financial condition. In addition, our reserves, the amount of PV-10 and Standardized Measure may be revised downward or upward, based upon production history, results of future exploitation and development activities, prevailing oil and natural gas prices, decisions and assumptions made by engineers and other factors. A material decline in prices paid for our production can adversely impact the estimated volumes and values of our reserves. Similarly, a decline in market prices for oil or natural gas may adversely affect our PV-10 and Standardized Measure. Any of these negative effects on our reserves or PV-10 and Standardized Measure may negatively affect the value of our common shares.
Continuing impairments of our asset values could have a substantial negative effect on our results of operations and net worth.
We follow the full cost method of accounting for our oil and natural gas properties. Depending upon oil and natural gas prices in the future, and at the end of each quarterly and annual period when we are required to test the carrying value of our assets using full cost accounting rules, we may be required to record an impairment to the value of our oil and natural gas properties if the present value of the after-tax future cash flows from our oil and natural gas properties falls below the net book value of these properties. We have in the past experienced, and may experience in the future, ceiling test impairments with respect to our oil and natural gas properties.
Our evaluation of impairment is based upon estimates of Proved Reserves. The value of our Proved Reserves may be lowered in future periods as a result of a decline in prices of oil and natural gas, a downward revision of our oil and natural gas reserves or other factors. As a result, our evaluation of impairment for future periods is subject to uncertainties inherent in estimating quantities of Proved Reserves, in projecting the future rates of production and in the timing of development activities. The accuracy of any reserve estimate is a function of the quality of available data and of engineering and geological interpretation and judgment. Because several of these factors are beyond our control, we cannot accurately predict or control the amount of ceiling test impairments in future periods. Future ceiling test impairments could negatively affect our results of operations and net worth.
For the years ended December 31, 2016 and 2015, we recognized impairments of $160.8 million and $1.2 billion to our proved oil and natural gas properties and for the year ended December 31, 2014, we did not recognize any impairments to our proved oil and natural gas properties. We may have additional impairments of our oil and natural gas properties in future periods if the cost of our unamortized proved oil and natural gas properties exceeds the limitation under the full cost method of accounting. The possibility and amount of any future impairment is difficult to predict, and will depend, in part, upon future oil and natural gas prices to be utilized in the ceiling test, estimates of proved reserves and future capital expenditures and operating costs.
We also test goodwill for impairment annually or when circumstances indicate that an impairment may exist. If the book value of our reporting unit exceeds the estimated fair value of the reporting unit, an impairment charge will occur, which would negatively impact our results of operations and net worth. As a result of our testing of goodwill for impairment, we did not record an impairment charge for the years ended December 31, 2016, 2015 and 2014.
We are exposed to operating hazards and uninsured risks that could adversely impact our results of operations and cash flow.
Our operations are subject to the risks inherent in the oil and natural gas industry, including the risks of:
• | fires, explosions and blowouts; |
36
• | pipe failures; |
• | abnormally pressured formations; and |
• | environmental accidents such as oil spills, natural gas leaks, ruptures or discharges of toxic gases, brine or well fluids into the environment (including groundwater contamination). |
We have in the past experienced some of these events during our drilling, production and midstream operations. These events may result in substantial losses to us from:
• | injury or loss of life; |
• | severe damage to or destruction of property, natural resources and equipment; |
• | pollution or other environmental damage; |
• | environmental clean-up responsibilities; |
• | regulatory investigation; |
• | penalties and suspension of operations; or |
• | attorneys’ fees and other expenses incurred in the prosecution or defense of litigation. |
As is customary in our industry, we maintain insurance against some, but not all, of these risks. Our insurance may not be adequate to cover these potential losses or liabilities. Furthermore, insurance coverage may not continue to be available at commercially acceptable premium levels or at all. Due to cost considerations, from time to time we have declined to obtain coverage for certain drilling activities. We do not carry business interruption insurance. Losses and liabilities arising from uninsured or under-insured events could require us to make large unbudgeted cash expenditures that could adversely impact our results of operations and cash flow.
We are subject to complex federal, state, local and other laws and regulations that could adversely affect the cost, manner or feasibility of conducting our operations.
Our oil and natural gas development and production operations are subject to complex and stringent laws and regulations. In order to conduct our operations in compliance with these laws and regulations, we must obtain and maintain numerous permits, approvals and certificates from various federal, state and local governmental authorities. We may incur substantial costs in order to comply with these existing laws and regulations. In addition, our costs of compliance may increase if existing laws and regulations are revised or reinterpreted, or if new laws and regulations become applicable to our operations. Our business is subject to federal, state and local laws and regulations as interpreted and enforced by governmental authorities possessing jurisdiction over various aspects of the exploration for, production and sale of, oil and natural gas. Failure to comply with such laws and regulations, as interpreted and enforced, could have a material adverse effect on our business, financial condition and results of operations. For additional information, see “Item 1. Business - Applicable Laws and Regulations.”
Our business exposes us to liability and extensive regulation on environmental matters, which could result in substantial expenditures and could negatively impact production.
Our operations are subject to numerous complex U.S. federal, state and local laws and regulations relating to the protection of the environment, including those governing the discharge of materials into the water and air, the generation, management and disposal of hazardous substances and wastes and the clean-up of contaminated sites. Laws, rules and regulations protecting the environment have changed frequently and the changes often include increasingly stringent requirements.
In general, the oil and natural gas exploration and production industry has been the subject of increasing scrutiny and regulation by environmental authorities. For example, the EPA has identified environmental compliance by the energy extraction section as one of its enforcement initiatives for fiscal years 2017 - 2019. This initiative was identified during the prior administration and it is unclear whether the new administration will continue with the ongoing initiatives.
Compliance with environmental laws and regulations often increases our cost of doing business and, in turn, decreases our profitability. Failure to comply with these laws and regulations may result in the assessment of administrative, civil and criminal penalties, the incurrence of investigatory or remedial obligations as well as associated natural resource damages, or the issuance of injunctive relief. Any changes that result in more stringent or costly waste handling, storage, transport, disposal or cleanup requirements could require us to make significant expenditures to maintain compliance, and may otherwise have a material adverse effect on our earnings, results of operations, competitive position or financial condition. Changes to the requirements for drilling, completing, operating, and abandoning wells and related facilities could have similar adverse effects on us.
37
In addition, we could incur substantial expenditures complying with environmental laws and regulations, including future environmental laws and regulations which may be more stringent than those currently in effect. For example, the regulation of GHG emissions by the EPA or by various states in the areas in which we conduct business could have an adverse effect on our operations and demand for our oil and natural gas production. Moreover, the EPA has shown a general increased scrutiny on the oil and gas industry through its regulations under the CAA, SDWA, RCRA, TSCA and CWA.
The environmental laws and regulations to which we are subject may, among other things:
• | require us to apply for and receive a permit before drilling commences or certain associated facilities are developed; |
• | restrict the types, quantities and concentrations of substances that can be released into the environment in connection with drilling, hydraulic fracturing, and production activities; |
• | limit or prohibit drilling activities on certain lands lying within wilderness, wetlands and other “waters of the United States,” threatened and endangered species habitats and other protected areas; |
• | require remedial measures to mitigate pollution from current or former operations, such as cleaning up spills, dismantling abandoned facilities, pit closure or plugging abandoned wells; |
• | require additional control and monitoring devices on equipment; and |
• | impose substantial liabilities for pollution resulting from our operations. |
Our operations may be impacted by recent or changing regulatory standards. For example, the EPA recently issued effluent limitation guidelines limiting our ability to dispose of waste water from hydraulic fracturing activities into publicly owned wastewater treatment systems. The EPA and state regulators are also reviewing the practices for the disposal of solid waste in surface impoundments from exploration and production facilities under Subtitle D of RCRA and may continue to refine those requirements. The EPA and state regulators are also expanding National Pollutant Discharge Elimination System permitting for storm water discharges at drilling sites. In addition, on May 19, 2014, the EPA issued an Advanced Notice of Proposed Rulemaking seeking comment on the types of chemical mixtures used in hydraulic fracturing fluid which might be reported under the TSCA. This may require more extensive reporting obligations for oil and gas exploration activities that use hydraulic fracturing.
Changes in regulation can also occur at a state or local level. For example, the State of Pennsylvania Department of Environmental Protection is updating oil and gas regulations which include more stringent permitting requirements, waste handling disposal and water restoration requirements. Some localities, for example in Texas, are enacting water usage restrictions that may impact oil and gas exploration. In addition, some states have considered, and notably California has adopted, a state specific GHG regulatory program that may limit GHG emissions or may require costs in association with the control of GHG emissions.
The implementation of climate change regulations could result in increased operating costs and reduced demand for our oil and natural gas production.
GHG regulations could require us to incur increased operating costs and could have an adverse effect on demand for our oil and natural gas production.
In the absence of comprehensive federal legislation on GHG emission control, the EPA attempted to require the permitting of GHG emissions. Although the U.S. Supreme Court struck down GHG permitting requirements for GHG as a stand-alone pollutant, it upheld the EPA’s authority to control GHG emissions when a source has to secure a major source permit to control the emissions of other criteria pollutants. These permitting provisions, to the extent applicable to our operations, could require us to implement emission controls or other measures to reduce GHG emissions and we could incur additional costs to satisfy those requirements. Additionally, the EPA established GHG reporting requirements for a broad range of sources, including in the petroleum and natural gas industry, requiring those sources to monitor, maintain records on, and annually report their GHG emissions. Although this rule does not limit the amount of GHGs that can be emitted, it requires us to incur costs to monitor record and report GHG emissions associated with our operations.
As part of a move to reduce GHG emissions, the EPA has issued new rules limiting methane emissions from new or modified oil and gas sources. The rules amend the air emissions rules for the oil and natural gas sources and natural gas processing and transmission sources to include new standards for methane. Simultaneously with the methane rules, EPA adopted new rules governing the aggregating of multiple surface sites into a single-source of air quality permitting purposes. The grouping together of sources may cause a group of sources to be treated as a “major source” and face enhanced regulation under federal environmental laws, including the CAA.
38
Federal, state and local legislation and regulatory initiatives relating to hydraulic fracturing could result in increased costs and additional operating restrictions or delays.
Hydraulic fracturing involves the injection of water, sand and chemicals under pressure into rock formations to stimulate natural gas production. Most hydraulic fracturing (other than hydraulic fracturing using diesel) is exempted from regulation under the SDWA. Congress has considered legislation to amend the federal SDWA to remove the exemption from regulation and permitting that is applicable to hydraulic fracturing operations and require reporting and disclosure of chemicals used by the oil and natural gas industry in the hydraulic fracturing process. Many states have adopted or are considering legislation regulating hydraulic fracturing, including the disclosure of chemicals used in the process. Such bills or similar legislation, if adopted, could increase the possibility of litigation and establish an additional level of regulation that could lead to operational delays or increased operating costs and could result in additional regulatory burdens, making it more difficult to perform hydraulic fracturing and increasing our costs of compliance. At the state and local levels, some jurisdictions have adopted, and others are considering adopting, requirements that could impose more stringent permitting, public disclosure or well construction requirements on hydraulic fracturing activities, as well as bans on hydraulic fracturing activities. In the event that new or more stringent state or local legal restrictions relating to the hydraulic fracturing process are adopted in areas where we have properties, we could incur potentially significant added costs to comply with such requirements, experience delays or curtailment in the pursuit of exploration, development or production activities, and perhaps even be precluded from drilling wells.
In addition, the EPA has asserted federal regulatory authority over hydraulic fracturing using diesel under the SDWA’s Underground Injection Control Program (“UIC”) and has issued guidance regarding its authority over the permitting of these activities. Additionally, in December 2016, the EPA released its final report on the potential impacts of hydraulic fracturing on drinking water resources, concluding that “water cycle” activities associated with hydraulic fracturing may impact drinking water resources “under some circumstances,” including water withdrawals for fracturing in times or areas of low water availability; surface spills during the management of fracturing fluids, chemicals or produced water; injection of fracturing fluids into wells with inadequate mechanical integrity; injection of fracturing fluids directly into groundwater resources; discharge of inadequately treated fracturing wastewater to surface waters; and disposal or storage of fracturing wastewater in unlined pits. Further, in June 2016, the EPA published an effluent limit guideline final rule prohibiting the discharge of wastewater from onshore unconventional oil and natural gas extraction facilities to publicly owned wastewater treatment plants. In 2014, the EPA published an advanced notice of public rulemaking regarding TSCA reporting of the chemical substances and mixture used in hydraulic fracturing. If this assessment results in additional regulatory scrutiny, it could make it difficult to perform hydraulic fracturing and increase our costs of compliance and doing business. Consequently, these studies and initiatives could spur further legislative or regulatory action regarding hydraulic fracturing or similar production operations.
These new initiatives related to hydraulic fracturing may increase our cost of disposal and impact our business operations and could cause our hydraulic fracturing activities to become subject to additional permit requirements or operations restrictions which could lead to permitting delays and potential increases in costs. Restrictions on hydraulic fracturing could reduce the amount of oil and natural gas that we ultimately are able to produce.
The EPA has adopted rules to limit air emissions from oil and gas operations, subjecting oil and natural gas production, processing, transmission and storage operations to regulation under the NSPS and NESHAPS programs under the CAA. The EPA rules include NSPS standards for completions of hydraulically fractured natural gas wells. Before January 1, 2015, these standards require owners/operators to reduce VOC emissions from natural gas not sent to the gathering line during well completion either by flaring, using a completion combustion device, or by capturing the natural gas using green completions with a completion combustion device. Beginning January 1, 2015, operators must capture the natural gas and make it available for use or sale, which can be done through the use of green completions. The standards are applicable to newly fractured wells and also existing wells that are refractured. Further, the finalized regulations also establish specific new requirements, effective in 2012, for emissions from compressors, controllers, dehydrators, storage tanks, natural gas processing plants and certain other equipment. The implementation of these new requirements may result in increased operating and compliance costs, increased regulatory burdens and delays in our operations. There may also be further refinement to existing NSPS standards for VOCs as data is gathered about the implementation of those requirements.
Our use of derivative financial instruments is subject to risks that our counterparties may default on their contractual obligations to us and may cause us to forego additional future profits or result in us making cash payments.
To reduce our exposure to changes in the prices of oil and natural gas, we have entered into, and may in the future enter into, derivative financial instrument arrangements for a portion of our oil and natural gas production. The agreements that we have entered into generally have the effect of providing us with a fixed price for a portion of our expected future oil and natural
39
gas production over a fixed period of time. Our derivative financial instruments are subject to mark-to-market accounting treatment. The change in the fair market value of these instruments is reported as a non-cash item in our consolidated statements of operations each quarter, which typically results in significant variability in our net income or loss. Derivative financial instruments expose us to the risk of financial loss and may limit our ability to benefit from increases in oil and natural gas prices in some circumstances, including the following:
• | market prices may exceed the prices which we are contracted to receive, resulting in our need to make significant cash payments; |
• | there may be a change in the expected differential between the underlying price in the derivative financial instrument agreement and actual prices received; or |
• | the counterparty to the derivative financial instrument contract may default on its contractual obligations to us. |
Our use of derivative financial instruments could have the effect of reducing our revenues and the value of our securities. During the years ended December 31, 2016 and 2015, our cash receipts from settlements of our derivative financial instrument contracts totaled $39.1 million and $128.8 million, respectively. For the year ended December 31, 2016, a $1.00 increase in the average commodity price per Mcfe would have resulted in an increase in cash settlement payments (or a decrease in settlements received) of approximately $60.0 million for oil and natural gas swaps. As of December 31, 2016, our oil and natural gas derivative financial instrument contracts were in the net liability position of $27.7 million. The ultimate settlement amount of these unrealized derivative financial instrument contracts is dependent on future commodity prices. We may incur significant realized and unrealized losses in the future from our use of derivative financial instruments to the extent market prices increase and our derivatives contracts remain in place.
We operate in a litigious environment.
Any constituent could bring suit regarding our existing or planned operations or allege a violation of an existing contract. Any such action could delay when planned operations can actually commence or could cause a halt to existing production until such alleged violations are resolved by the courts. Not only could we incur significant legal and support expenses in defending our rights, but halting existing production or delaying planned operations could impact our future operations and financial condition. In addition, we are defendants in numerous cases involving claims by landowners for surface or subsurface damages arising from our operations and for claims by unleased mineral owners and royalty owners for unpaid or underpaid revenues customary in our business. We incur costs in defending these claims and from time to time must pay damages or other amounts due. Such legal disputes can also distract management and other personnel from their primary responsibilities.
During the third quarter of 2016, we terminated our sales and transportation contracts with Enterprise Products Operating LLC (“Enterprise”) and Acadian Gas Pipeline System (“Acadian”), respectively, as a result of Enterprise failing to pay and cure monies owed to EXCO for July 2016 natural gas sales. Enterprise filed an amended petition alleging that we could not terminate the parties’ agreements despite Enterprise's uncured payment default under the gas sales agreement, and further alleged that we were in breach of the firm transportation agreements. On October 17, 2016, we filed a counterclaim asserting that Enterprise was the breaching party because it improperly withheld payment for natural gas we delivered to it and the amounts owed by Enterprise exceeded the amounts owed by us to Acadian. For additional information, see “Item 3. Legal Proceedings" and "Note 8. Commitments and Contingencies” in the Notes to our Consolidated Financial Statements.
Our business could be negatively impacted by security threats, including cybersecurity threats, and other disruptions.
As an oil and natural gas production company, we face various security threats, including cybersecurity threats to gain unauthorized access to sensitive information or to render data or systems unusable; threats to the safety of our employees; threats to the security of our facilities and infrastructure or third party facilities and infrastructure, such as processing plants and pipelines; and threats from terrorist acts. Although we utilize various procedures and controls to monitor these threats and mitigate our exposure to such threats, there can be no assurance that these procedures and controls will be sufficient in preventing security threats from materializing. If any of these events were to materialize, they could lead to losses of sensitive information, critical infrastructure, personnel or capabilities essential to our operations and could have a material adverse effect on our reputation, financial position, results of operations or cash flows. Cybersecurity attacks in particular are evolving and include but are not limited to, malicious software, attempts to gain unauthorized access to data, and other electronic security breaches that could lead to disruptions in critical systems, unauthorized release of confidential or otherwise protected information and corruption of data. These events could damage our reputation and lead to financial losses from remedial actions, loss of business or potential liability.
40
There are inherent limitations in all internal control over financial reporting, and misstatements due to error or fraud may occur and not be detected.
While we have taken actions designed to address compliance with the internal control, disclosure control and other requirements of the Sarbanes-Oxley Act of 2002, as amended, and the rules and regulations promulgated by the SEC implementing these requirements, there are inherent limitations in our ability to control all circumstances. Our management, including our chief financial officer and chief accounting officer, do not expect that our internal controls and disclosure controls will prevent all errors and all fraud. A control system, no matter how well conceived and operated, can provide only reasonable, not absolute, assurance that the objectives of the control system are met. In addition, the design of a control system must reflect the fact that there are resource constraints and the benefit of controls must be relative to their costs. Because of the inherent limitations in all control systems, no evaluation of controls can provide absolute assurance that all control issues and instances of fraud, if any, in our company have been detected. These inherent limitations include the realities that judgments in decision-making can be faulty and that breakdowns can occur because of simple errors or mistakes. Further, controls can be circumvented by individual acts of some persons, by collusion of two or more persons, or by management override of the controls. The design of any system of controls also is based in part upon certain assumptions about the likelihood of future events, and there can be no assurance that any design will succeed in achieving its stated goals under all potential future conditions. Over time, a control may be inadequate because of changes in conditions, such as growth of our company or increased transaction volume, or the degree of compliance with the policies or procedures may deteriorate. Because of inherent limitations in a cost-effective control system, misstatements due to error or fraud may occur and not be detected.
We have engaged in transactions with related persons and may do so in the future. The terms of such transactions and the resolution of any conflicts that may arise may not always be in our or our shareholders’ best interests.
We have engaged in transactions and may continue to engage in transactions with related persons. As described in our filings with the SEC, these transactions include, among others, issuances of securities to affiliates of certain of our directors, strategic consulting services provided to us by an affiliate of a director and the issuance of secured indebtedness by us payable to related parties.
Most recently, we completed the offering of the 1.5 Lien Notes and the exchange of the Second Lien Term Loans for the 1.75 Lien Term Loans, including the issuance of warrants to (i) the investors of the 1.5 Lien Notes (the “Financing Warrants”), (ii) certain investors of the 1.5 Lien Notes that agreed to receive warrants in lieu of cash paid for fees (the “Commitment Fee Warrants”), and (iii) certain exchanging holders of the Second Lien Term Loans (the “Amendment Fee Warrants,” and collectively with the Financing Warrants and the Commitment Fee Warrants, the “2017 Warrants”). Certain of our directors have relationships with entities that hold substantial amounts of the 1.5 Lien Notes, 1.75 Lien Term Loans and 2017 Warrants, including:
• | Samuel Mitchell, a member of our Board of Directors, serves as a Managing Director of Hamblin Watsa Investment Counsel Ltd. ("Hamblin Watsa"), the investment manager of Fairfax and certain affiliates thereof, and certain affiliates of Fairfax hold, directly or indirectly, $151.0 million in aggregate principal amount of 1.5 Lien Notes and $412.1 million in aggregate principal amount of 1.75 Lien Term Loans, as well as Financing Warrants representing the right to purchase an aggregate of 162,365,599 common shares at an exercise price equal to $0.93 per share, Commitment Fee Warrants representing the right to purchase an aggregate of 6,471,433 common shares at an exercise price equal to $0.01 per share and Amendment Fee Warrants representing the right to purchase an aggregate of 19,412,035 common shares at an exercise price equal to $0.01 per share. Fairfax is also the beneficial owner of approximately 9.9% of our outstanding common shares. |
• | C. John Wilder, a member of our Board of Directors, serves as the sole manager of Bluescape, the parent of ESAS. ESAS holds $70.0 million in aggregate principal amount of 1.5 Lien Notes and $47.9 million in aggregate principal amount of 1.75 Lien Term Loans, as well as Financing Warrants representing the right to purchase an aggregate of 75,268,818 common shares at an exercise price equal to $0.93 per share. ESAS is also the beneficial owner of approximately 6.6% of our outstanding common shares and the party to our services and investment agreement. ESAS received a consent fee of $1.6 million in cash for exchanging its interest in the Exchanger Term Loan, and a commitment fee of $2.1 million in cash in connection with the issuance of the 1.5 Lien Notes. |
• | B. James Ford, a member of our Board of Directors, serves as a Senior Adviser of Oaktree. Certain affiliates of Oaktree hold, directly or indirectly, $39.5 million in aggregate principal amount of 1.5 Lien Notes, Financing Warrants representing the right to purchase an aggregate of 42,473,119 common shares at an exercise price equal to $0.93 per share, and a commitment fee of $1.2 million in cash. Oaktree is also the beneficial owner of approximately 11.0% of our outstanding common shares. |
41
These entities may also acquire additional common shares to the extent we make interest payments in our common shares. As a result, there may be an actual or apparent conflict of interest between the duties of these members of our Board of Directors to our company and their duties to Fairfax, ESAS or Oaktree, as applicable, including, among other things, with respect to the fairness of the terms of the offering of the 1.5 Lien Notes, the exchange of the Second Lien Term Loans for 1.75 Lien Term Loans and the issuance of the 2017 Warrants. These transactions were approved by a special committee of the Board of Directors consisting of the sole disinterested member of the Board of Directors. The Board of Directors, during the pending of review and negotiations of terms, authorized and approved the transactions based on the recommendation of the special committee.
Despite the approval of the terms of these transactions or any other related party transactions, there can be no assurance that any actual or potential conflicts of interest between the members of our Board of Directors and their related parties will be resolved in a manner that does not adversely affect our business, financial condition or results of operations. In addition, any actual or perceived conflict of interest may have a negative impact on the value of our common shares.
Our ability to use net operating loss carryovers to reduce future tax payments may be limited.
Our net operating loss and other tax attribute carryovers ("NOLs") may be limited if we undergo an ownership change. Generally, an ownership change occurs if certain persons or groups increase their aggregate ownership in us by more than 50 percentage points looking back over a rolling three-year period. If an ownership change occurs, our ability to use our NOLs to reduce income taxes is limited to an annual amount, or the Section 382 limitation, equal to the fair market value of our common shares immediately prior to the ownership change multiplied by the long term tax-exempt interest rate, which is published monthly by the Internal Revenue Service ("IRS").
In the event of an ownership change, NOLs can be used to offset taxable income for years within a carryforward period subject to the Section 382 limitation. Any excess NOLs that exceed the Section 382 limitation in any year will continue to be allowed as carryforwards for the remainder of the carryforward period. Whether or not an ownership change occurs, the carryforward period for NOLs is 20 years from the year in which the losses giving rise to the NOLs were incurred. If the carryforward period for any NOL were to expire before that NOL had been fully utilized, the unused portion of that NOL would be lost. Our use of new NOLs arising after the date of an ownership change would not be affected by the Section 382 limitation (unless there is another ownership change after the new NOLs arise). NOLs available for utilization as of December 31, 2016 were approximately $2.2 billion.
As of December 31, 2016, the cumulative ownership change utilized in the calculation of the Section 382 limitation was approximately 21%. The following transactions have the potential to significantly impact the ownership change in future periods:
• | the payment of interest through the issuance of common shares to certain holders of the 1.5 Lien Notes and 1.75 Lien Term Loans; |
• | the exercise of the 2017 Warrants; and |
• | the exercise of warrants issued to ESAS in connection with the services and investment agreement. |
We cannot predict the timing and extent of issuances of common shares as a result of these transactions, and the agreements governing the 1.5 Lien Notes, 1.75 Lien Term Loans and 2017 Warrants contain certain limitations on our ability to issue our common shares as interest payments on the 1.5 Lien Notes and 1.75 Lien Term Loans or upon the exercise of the 2017 Warrants. Prior to December 31, 2018, we may elect to make interest payments on the 1.5 Lien Notes and 1.75 Lien Term Loans in our common shares in our sole discretion, subject to certain restrictions. Subsequent to December 31, 2018, we may be required to make interest payments in cash if we meet certain liquidity thresholds. In addition, the agreements governing the 2017 Warrants contain exercise limitations that limit a holder from exercising a 2017 Warrant if, as a result of such exercise, such warrant holder’s affiliates and any person subject to aggregation with such warrant holder or its affiliates under Sections 13(d) and 14(d) of the Exchange Act would beneficially own (as defined in Rules 13d-3 or 13d-5 under the Exchange Act, except that for purposes of this clause, such holder shall be deemed to have “beneficial ownership” of all shares that any such holder has the right to acquire, whether such right is exercisable immediately or only after the passage of time), directly or indirectly, more than 50% of the total voting power of the voting capital stock of the Company or any of its direct or indirect parent entities (or their successors by merger, consolidation or purchase of all or substantially all of their assets).
Despite the limitations contained in these agreements, the issuance of a significant amount of common shares to certain parties as a result of these transactions may result in an ownership change by more than 50 percentage points over a rolling
42
three-year period. If an ownership change occurs and our NOLs are subject to the Section 382 limitation, this could adversely impact our future cash flows if we have taxable income and are not able to offset it through the utilization of our NOLs.
We currently have negative shareholders’ equity, which could adversely affect our financial condition and otherwise adversely impact our business and growth prospects.
We have recently experienced losses as a result of the recent decline in oil and natural gas prices, and, as of December 31, 2016, we had negative shareholders’ equity of $871.9 million, which means that our total liabilities exceeded our total assets. We may not be able to return to profitability in the near future, or at all, and the continuing existence of negative shareholders’ equity may limit our ability to obtain future debt or equity financing or to pay future dividends or other distributions. If we are unable to obtain financing in the future, it could have a negative effect on our operations and our Liquidity.
The Consolidated Financial Statements included herein contain disclosures that express substantial doubt about our ability to continue as a going concern, indicating the possibility that we may not be able to operate in the future.
The Consolidated Financial Statements included herein have been prepared on a going concern basis, which contemplates the realization of assets and the satisfaction of liabilities and other commitments in the normal course of business. Our Liquidity and ability to maintain compliance with debt covenants have been negatively impacted by the prolonged depressed oil and natural gas price environment, levels of indebtedness, and gathering, transportation and certain other commercial contracts. As of December 31, 2016, we had $9.1 million in cash and cash equivalents, $46.2 million of availability under the EXCO Resources Credit Agreement and a working capital deficit of $147.7 million.
Management’s plans are intended to mitigate risks related to our ability to continue as a going concern; however, our ability to execute these plans is conditioned upon factors including the shareholder approval to permit the issuance of common shares to pay interest on the 1.5 Lien Notes and 1.75 Lien Term Loans. There is no assurance any such transactions will occur. As a result of the impact of the aforementioned factors on our financial results and condition, we anticipate that we may not be able to comply with the financial covenants under the EXCO Resources Credit Agreement for the twelve-month period following the date of these Consolidated Financial Statements.
If we are not able to comply with our debt covenants or do not have sufficient Liquidity to conduct our business operations in future periods, we may be required, but unable, to refinance all or part of our existing debt, seek covenant relief from our lenders, sell assets, incur additional indebtedness, or issue equity on terms acceptable to us, if at all, and may be required to surrender assets pursuant to the security provisions of the EXCO Resources Credit Agreement. Therefore, our ability to continue our planned principal business operations would be dependent on the actions of our lenders or obtaining additional debt and/or equity financing to repay outstanding indebtedness under the EXCO Resources Credit Agreement. These factors raise substantial doubt about our ability to continue as a going concern. See further discussion regarding our ability to continue as a going concern and management's plans to mitigate these conditions as part of "Note 1. Organization and basis of presentation" in the Notes to our Consolidated Financial Statements.
Risks relating to our indebtedness
Our ability to make interest payments in our common shares on the 1.5 Lien Notes and 1.75 Lien Term Loans, and our ability to issue the common shares underlying the 2017 Warrants, is subject to our receipt of certain shareholder approvals. If we are unable to obtain these shareholder approvals, we will be subject to interest rate penalties and we may be unable to afford to make interest payments on our outstanding indebtedness or to continue our operations and may be forced into bankruptcy, which would have a material adverse effect on our financial condition.
We recently closed the offering of the 1.5 Lien Notes, the exchange of the Second Lien Term Loans for the 1.75 Lien Term Loans and the issuance of the 2017 Warrants. Subject to the satisfaction of certain conditions, the indenture governing the 1.5 Lien Notes and the credit agreement governing the 1.75 Lien Term Loans allow us to elect, at our option through December 31, 2018 and subject to the satisfaction of certain criteria thereafter, to pay interest on the 1.5 Lien Notes and the 1.75 Lien Term Loans by issuing our common shares. Our ability to make these interest payments in our common shares, and to issue the common shares underlying the warrants, is dependent on us obtaining shareholder approval.
In addition, our amended and restated certificate of formation currently provides that we are authorized to issue up to 780,000,000 million common shares, of which 282,973,605 were outstanding, 14,293,850 were reserved for issuance under our 2005 Amended and Restated Long-Term Incentive Plan, 80,000,000 were reserved for issuance upon the exercise of warrants
43
held by ESAS and 2,365,589 were reserved for issuance upon the exercise of outstanding stock options, in each case as of December 31, 2016. Accordingly, in order for us to make interest payments on the 1.5 Lien Notes and 1.75 Lien Term Loans in our common shares and to issue the common shares underlying the 2017 Warrants, we plan to seek shareholder approval to amend our charter to increase the number of shares authorized for issuance or approval to execute a reverse stock split, without a proportionate reduction in authorized shares.
Our Liquidity is currently significantly constrained and a principal purpose of offering the 1.5 Lien Notes and exchanging the Second Lien Term Loans for 1.75 Lien Term Loans was to alleviate the substantial cash interest payment burden related to the Second Lien Term Loans by restructuring a portion of our indebtedness to allow interest payments in our common shares. If we are not able to make interest payments in our common shares on the 1.5 Lien Notes and the 1.75 Lien Term Loans, we will be forced to continue to make cash interest payments on our 2018 Notes, 2022 Notes and the Exchange Term Loan, as well as to make cash interest payments or interest payments in additional indebtedness on our 1.5 Lien Notes and 1.75 Lien Term Loans. In addition, if we fail to obtain the shareholder approvals described above by the end of the month following the six month anniversary of closing, the cash interest rate on the 1.5 Lien Notes will increase from 8% per annum to 15% per annum and the payment-in-kind interest rate on the 1.5 Lien Notes will increase from 11% per annum to 20% per annum. Based on our estimates, if we are not able to make interest payments on the 1.5 Lien Notes and 1.75 Lien Term Loans in our common shares, we are not expected to comply with certain debt covenants under the EXCO Resources Credit Agreement and our liquidity is not expected to be sufficient to support the interest payments due under our outstanding indebtedness and for us to continue to conduct our business operations on an ongoing basis.
If we cannot make scheduled payments on our debt, we will be in default and holders of our indebtedness, including holders of the 2018 Notes, 2022 Notes, 1.5 Lien Notes, 1.75 Lien Term Loans and remaining holders of the Exchange Term Loan, could declare all outstanding principal and interest to be due and payable, the lenders under the EXCO Resources Credit Agreement could terminate their commitments to loan money, our secured lenders could foreclose against the assets securing their borrowings and we could be forced into bankruptcy or liquidation, any of which would have a material adverse effect on our financial condition.
We have a substantial amount of indebtedness, which may adversely affect our cash flow and our ability to operate our business, remain in compliance with debt covenants and make payments on our debt.
As of December 31, 2016, after giving pro forma effect to the issuance of the 1.5 Lien Notes and the exchange of the Second Lien Term Loans for 1.75 Lien Term Loans, we had approximately $1.2 billion of aggregate principal indebtedness, and no indebtedness subject to variable interest rates. Our total cash interest payments on an annual basis, excluding amortization of deferred financing costs and assuming we do not face interest rate penalties on the 1.5 Lien Notes related to the failure to receive certain shareholder approvals, based on currently available interest rates would be approximately $127.3 million. If we make interest payments on the 1.5 Lien Notes and 1.75 Lien Term Loans in our common shares, our total cash interest payments, based on the same conditions above, would be approximately $18.0 million. In each case, our total interest payments, includes the annual cash payments of $2.2 million on the $17.2 million in aggregate principal amount of our Exchange Term Loan that remains outstanding following the exchange of our Second Lien Term Loans for the 1.75 Lien Term Loans, which is not considered to be interest expense in accordance with GAAP. See "Note 5. Debt" in the Notes to our Consolidated Financial Statements for additional information and the accounting treatment of the Exchange Term Loan.
Our level of debt could have important consequences, including the following:
• | it may be more difficult for us to satisfy our obligations with respect to our indebtedness, and any failure to comply with the obligations of any of our debt agreements, including financial and other restrictive covenants, could result in an event of default under the EXCO Resources Credit Agreement, 1.5 Lien Notes, 1.75 Lien Term Loans, Exchange Term Loan, the indenture governing the 2018 Notes and 2022 Notes ("Unsecured Notes Indenture"), and the agreements governing our other indebtedness; |
• | we may issue a substantial number of our common shares as payments for the interest due under the 1.5 Lien Notes and the 1.75 Lien Term Loans; |
• | we may have difficulty borrowing money in the future for acquisitions, capital expenditures or to meet our operating expenses or other general corporate obligations; |
• | the amount of our interest expense may increase because certain of our borrowings are at variable rates of interest; |
• | we will need to use a substantial portion of our cash flows to pay principal and interest on our debt, which will reduce the amount of money we have for operations, working capital, capital expenditures, expansion, acquisitions or general corporate or other business activities; |
• | we may have a higher level of debt than some of our competitors, which may put us at a competitive disadvantage; |
44
• | we may be more vulnerable to economic downturns and adverse developments in our industry or the economy in general, especially declines in oil and natural gas prices; |
• | when oil and natural gas prices decline, our ability to maintain compliance with our financial covenants becomes more difficult and our borrowing base is subject to reductions, which may reduce or eliminate our ability to fund our operations; and |
• | our debt level could limit our flexibility in planning for, or reacting to, changes in our business and the industry in which we operate. |
Our ability to meet our expenses and debt obligations will depend on our future performance, which will be affected by financial, business, economic, regulatory and other factors. We will be unable to control many of these factors, such as economic conditions and governmental regulation. The current low commodity price environment has had a significant, adverse impact on our business, including substantially reduced cash flows from operations due to the decline in oil and natural gas prices and the roll off of our hedging arrangements. While we were not in default under our existing debt instruments at December 31, 2016, our ability to service our debt, including the 2018 Notes, 2022 Notes, 1.5 Lien Notes, 1.75 Lien Term Loans and Exchange Term Loan, and fund our operations is at risk in a sustained continuation of the current commodity price environment. In addition, our ability to service our debt is substantially dependent on our ability to make interest payments on the 1.5 Lien Notes and 1.75 Lien Term Loans in our common shares, which is in turn dependent on our ability to obtain certain approvals by our shareholders. If we are not able to obtain the shareholder approvals necessary to make interest payments on the 1.5 Lien Notes and 1.75 Lien Term Loans in our common shares, we would need some additional form of debt restructuring, capital raising or asset sale in order to fund our operations and meet our substantial debt service obligations. Our management is actively pursuing additional strategies to improve our liquidity and reduce our future debt service obligations, though there can be no assurance that we will be able to execute any of these strategies.
We may incur more debt, which may intensify the risks described above, including our ability to service our indebtedness.
Together with our subsidiaries, we may incur more debt in the future in connection with our exploration, exploitation, development, acquisitions of undeveloped acreage and producing properties, including issuances of additional 1.5 Lien Notes and 1.75 Lien Term Loans in lieu of making interest payments on the 1.5 Lien Notes and 1.75 Lien Term Loans in cash or our common shares. The restrictions in our debt agreements on our incurrence of additional indebtedness are subject to a number of qualifications and exceptions, and under certain circumstances, indebtedness incurred in compliance with these restrictions could be substantial. Also, these restrictions do not prevent us from incurring obligations that do not constitute indebtedness. To the extent new indebtedness is added to our current indebtedness, the risks described above could substantially increase. Significant additions of undeveloped acreage financed with debt may result in increased indebtedness without any corresponding increase in borrowing base, which could curtail drilling and development of this acreage or could cause us to not comply with our debt covenants.
To service our indebtedness, fund our planned capital expenditure programs and fund acquisitions, we will require a significant amount of cash. Our ability to generate cash depends on many factors beyond our control, and any failure to meet our debt obligations could harm our business, financial condition and results of operations.
Our ability to make payments on our indebtedness and to fund planned capital expenditures will depend on our ability to generate cash flow from operations and other resources in the future. This, to a certain extent, is subject to general economic, financial, competitive, legislative, regulatory and other factors that are beyond our control, including the prices that we receive for oil and natural gas.
Our business may not generate sufficient cash flow from operations and future borrowings may not be available to us in an amount sufficient to enable us to pay our indebtedness to fund planned capital expenditures or to fund our other Liquidity needs. If our cash flow and capital resources are insufficient to fund our debt obligations and capital expenditure programs, we may be forced to sell assets, issue additional equity or debt securities or restructure our debt. These remedies may not be available on commercially reasonable terms, or at all. In addition, any failure to make scheduled payments of interest and principal on our outstanding indebtedness would likely result in a reduction of our credit rating, which could harm our ability to incur additional indebtedness on acceptable terms. Our cash flow and capital resources may be insufficient for payment of interest on and principal of our debt in the future, which could cause us to default on our obligations and could impair our Liquidity.
Our borrowing base under the EXCO Resources Credit Agreement is subject to semi-annual redetermination, with the next scheduled redetermination set to occur in November 2017. The borrowing base redetermination process considers assumptions related to future commodity prices; therefore, our borrowing capacity could be negatively impacted by further declines in oil and natural gas prices. If our borrowing base were to be reduced to a level which was less than the current
45
borrowings, we would be required to reduce our borrowings to a level sufficient to cure any deficiency. We may be required to sell assets or seek alternative debt or equity which may not be available at commercially reasonable terms, if at all.
If we cannot make scheduled payments on our debt, we will be in default and holders of the 2018 Notes, 2022 Notes, 1.5 Lien Notes, 1.75 Lien Term Loans and Exchange Term Loan could declare all outstanding principal and interest to be due and payable, the lenders under the EXCO Resources Credit Agreement could terminate their commitments to loan money, our secured lenders could foreclose against the assets securing their borrowings and we could be forced into bankruptcy or liquidation. Our inability to generate sufficient cash flows to satisfy our debt obligations, or to refinance our indebtedness on commercially reasonable terms or at all, would materially and adversely affect our financial position and results of operations.
Restrictive debt covenants could limit our growth and our ability to finance our operations, fund our capital needs, respond to changing conditions and engage in other business activities that may be in our best interests.
The EXCO Resources Credit Agreement, the Unsecured Notes Indenture, the 1.5 Lien Notes, the 1.75 Lien Term Loans and the Exchange Term Loan contain a number of significant covenants that, among other things, restrict our ability to:
• | dispose of assets; |
• | incur or guarantee additional indebtedness and issue certain types of preferred shares; |
• | pay dividends on our capital stock; |
• | create liens on our assets; |
• | enter into sale or leaseback transactions; |
• | enter into specified investments or acquisitions; |
• | repurchase, redeem or retire our capital stock or subordinated debt; |
• | merge or consolidate, or transfer all or substantially all of our assets and the assets of our subsidiaries; |
• | engage in specified transactions with subsidiaries and affiliates; or |
• | pursue other corporate activities. |
Also, the EXCO Resources Credit Agreement requires us to maintain compliance with certain financial covenants. Our ability to comply with these financial covenants may be affected by events beyond our control, and, as a result, we may be unable to meet these financial covenants. These financial covenants could limit our ability to obtain future financings, make needed capital expenditures, withstand a future downturn in our business or the economy in general or otherwise conduct necessary corporate activities. We may also be prevented from taking advantage of business opportunities that arise because of the limitations imposed on us by the restrictive covenants under the EXCO Resources Credit Agreement, the Unsecured Notes Indenture, the indenture governing the 1.5 Lien Notes, the credit agreement governing the 1.75 Lien Term Loans and the term loan agreement governing the Exchange Term Loan. A breach of any of these covenants or our inability to comply with the required financial covenants could result in an event of default under the applicable indebtedness. When oil and/or natural gas prices decline for an extended period of time or when our Liquidity is constrained, our ability to comply with these covenants becomes more difficult. Although we are currently in compliance with these covenants, if oil and gas prices continue to decline, we may default on one or more of these covenants. Such a default, if not cured or waived, may allow the creditors to accelerate the related indebtedness and could result in acceleration of any other indebtedness to which a cross-acceleration or cross-default provision applies.
An event of default under the Unsecured Notes Indenture, the indenture governing the 1.5 Lien Notes, the credit agreement governing the 1.75 Lien Term Loans or the term loan agreement governing the Exchange Term Loan would permit the lenders under the EXCO Resources Credit Agreement to terminate all commitments to extend further credit under the agreement. Furthermore, if we were unable to repay the amounts due and payable under the EXCO Resources Credit Agreement, those lenders could proceed against the collateral granted to them to secure that indebtedness. In the event that our lenders or noteholders accelerate the repayment of our borrowings, we and our subsidiaries may not have sufficient assets to repay that indebtedness. As a result of these restrictions, we may be:
• | limited in how we conduct our business; |
• | unable to raise additional debt or equity financing during general economic, business or industry downturns; or |
• | unable to compete effectively or to take advantage of new business opportunities. |
Our short-term Liquidity is constrained and could severely impact our cash flow and our development of properties.
Currently, our principal sources of Liquidity are cash flows from operations and borrowings under the EXCO Resources Credit Agreement. On March 15, 2017, our borrowing base under the EXCO Resources Credit Agreement was reduced to $150.0 million. In addition, our ability to make interest payments on the 1.5 Lien Notes and 1.75 Lien Term Loans in our
46
common shares is currently subject to the receipt of certain shareholder approvals. If our borrowing base is materially reduced or we are no longer able to draw on the EXCO Resources Credit Agreement, or if we are unable to obtain the necessary shareholder approvals to make interest payments on the 1.5 Lien Notes and 1.75 Lien Term Loans in our common shares or generate sufficient cash flow from operations, we may not be able to fund our operations and drilling activities or pay the interest on our debt, which would result in us defaulting under our various debt instruments and may force us to seek bankruptcy protection or pursue other restructuring alternatives.
We may not be able to repurchase or repay our indebtedness upon a change of control.
If we experience certain kinds of changes of control, we may be required to offer to repurchase or repay all or a portion of our existing indebtedness, including the 2018 Notes, 2022 Notes, 1.5 Lien Notes, 1.75 Lien Term Loans and the Exchange Term Loan. We may not be able to repurchase or repay our indebtedness following a change of control because we may not have sufficient financial resources or sufficient access to financing.
A lowering or withdrawal of the ratings assigned to our debt securities by rating agencies may increase our future borrowing costs and reduce our access to capital.
Each of our 2018 Notes, 2022 Notes, 1.5 Lien Notes, 1.75 Lien Term Loans and Exchange Term Loan currently has a non-investment grade rating, and any rating assigned could be lowered or withdrawn entirely by a rating agency if, in that rating agency’s judgment, future circumstances relating to the basis of the rating, such as adverse changes, so warrant. Consequently, real or anticipated changes in the credit ratings of our 2018 Notes, 2022 Notes, 1.5 Lien Notes, 1.75 Lien Term Loans or Exchange Term Loan will generally affect the market value of such debt.
Any future lowering of our ratings likely would make it more difficult or more expensive for us to obtain additional debt financing and may increase the cost of debt financing. In addition, if any credit rating initially assigned to the 2018 Notes, 2022 Notes, 1.5 Lien Notes, 1.75 Lien Term Loans or Exchange Term Loan is subsequently lowered or withdrawn for any reason, it may have an adverse effect on the market price of such notes.
The credit risk of financial institutions could adversely affect us.
We have exposure to different counterparties, and we have entered into transactions with counterparties in the financial services industry, including commercial banks, investment banks, insurance companies and other institutions. These transactions expose us to credit risk in the event of default of our counterparty. Deterioration in the credit markets may impact the credit ratings of our current and potential counterparties and affect their ability to fulfill their existing obligations to us and their willingness to enter into future transactions with us. We have exposure to financial institutions in the form of derivative transactions in connection with our hedges and insurance companies in the form of claims under our policies. In addition, if any lender under the EXCO Resources Credit Agreement is unable to fund its commitment, our Liquidity will be reduced by an amount up to the aggregate amount of such lender’s commitment under the credit agreement.
Risks Relating to Our Common Shares
Our common shareholders may experience significant dilution in the future, particularly if we make interest payments on the 1.5 Lien Notes and the 1.75 Lien Term Loans in our common shares or if the 2017 Warrants are exercised.
We may in the future issue additional common shares or other securities convertible into, or exchangeable for, our common shares at prices that may not be the same price as holders of our common shares paid for their shares, including common shares that may be issued as interest payments under the 1.5 Lien Notes and the 1.75 Lien Term Loans, or upon the exercise of the 2017 Warrants, the warrants held by ESAS or our other derivative securities. We are currently authorized to issue up to 780,000,000 common shares and 10,000,000 preferred shares with such designations, preferences and rights as determined by our Board of Directors, and, as described above, we plan to seek shareholder approval to amend our charter to increase the number of shares authorized for issuance or approval to execute a reverse stock split, without a proportionate reduction of authorized shares. The issuance of additional common shares may substantially dilute the ownership interests of our existing shareholders.
As described herein, a principal purpose of offering the 1.5 Lien Notes and exchanging the Second Lien Term Loans for 1.75 Lien Term Loans was to alleviate the substantial cash interest payment burden related to the Second Lien Term Loans by restructuring a portion of our indebtedness to allow interest payments in our common shares.
47
The issuance of our common shares as interest payments under the 1.5 Lien Notes or upon the exercise of the 2017 Warrants will dilute the percentage ownership interest of our existing shareholders and could negatively impact the market price of our common shares. Even if we do not make interest payments in our common shares and the 2017 Warrants are not exercised, the existence of the payment-in-kind interest payment feature of the 1.5 Lien Notes and the 1.75 Lien Term Loans and the 2017 Warrants may depress the price of our common shares. Furthermore, when we elect to make interest payments in our common shares, the number of common shares issued will be dependent on the market price of our common shares. If our common share price decreases, we will have to issue a greater number of common shares to make interest payments on the 1.5 Lien Notes and 1.75 Lien Term Loans, which in turn could further depress the price of our common shares.
The following table depicts EXCO's outstanding common shares as of December 31, 2016 and the warrants issued on March 15, 2017 in connection with the issuance of the 1.5 Lien Notes and recent exchange transactions:
Warrants (1) | Common shares (2) | |||||||||
(in thousands, except price) | Exercise price | Outstanding amount | Outstanding amount | |||||||
Amendment Fee Warrants | $ | 0.01 | 19,883 | |||||||
Commitment Fee Warrants | $ | 0.01 | 6,471 | |||||||
Financing Warrants | $ | 0.93 | 322,581 | |||||||
Common shares, net of treasury shares | 282,974 | |||||||||
(1) | The exercisability of the warrants within this table are subject to conditions including the receipt of certain shareholder approvals. The amount of actual common shares purchased by the exercise of the Financing Warrants could be significantly lower than the amount depicted in this table depending on the holder's election of either a cash or cashless exercise. The warrants previously issued to ESAS in connection with a services and investment agreement are excluded due to the time and performance based contingencies required for vesting. |
(2) | The common shares within this table exclude the potential dilution attributable to the common shares that could be issued to pay interest on the 1.5 Lien Notes and 1.75 Lien Term Loans. If we elect to pay interest on the 1.5 Lien Notes and 1.75 Lien Term Loans solely in common shares, we would issue approximately 242 million common shares on an annual basis assuming a constant share price consistent with the closing price of $0.56 for EXCO's common shares as of February 28, 2017. The amount of shares issued to pay interest on the 1.5 Lien Notes and 1.75 Lien Term Loans may significantly differ from this amount due to factors such as fluctuations in the price of EXCO's common shares, our decisions on the method of interest payments, and limitations on the ability to pay interest in common shares within the indenture governing the 1.5 Lien Notes and credit agreement governing the 1.75 Lien Term Loans. |
The table above is based on assumptions that may not accurately reflect future conditions and is intended to show the maximum dilutive impact of the issuance of our common shares as interest payments under the 1.5 Lien Notes and 1.75 Lien Term Loans and upon the exercise of the 2017 Warrants. The ultimate impact of dilution will be substantially dependent on whether and to what extent we elect to make interest payments on the 1.5 Lien Notes and 1.75 Lien Term Loans in our common shares and whether the holders of the 2017 Warrants elect to exercise such 2017 Warrants, each of which will depend on a number of factors, including prevailing market conditions, available cash and the price per share of our common shares.
In connection with the offering of the 1.5 Lien Notes, the exchange of our Second Lien Term Loans for 1.75 Lien Term Loans and the issuance of the 2017 Warrants, we entered into a registration rights agreement with the holders of the 1.5 Lien Notes, 1.75 Lien Term Loans and 2017 Warrants. Pursuant to the registration rights agreement, we agreed, subject to certain limitations, to register the resale of all of the common shares we may issue as interest payments under the 1.5 Lien Notes and the 1.75 Lien Term Loans, as well as all of the common shares underlying the 2017 Warrants. The sale of these common shares, which represents more than the total number of common shares we currently have outstanding, into the public market, or the perception that these sales may occur, could substantially reduce the market price of our common shares. This could also impair our ability to raise additional capital through the sale of our securities.
Our common share price may fluctuate significantly.
Our common shares currently trade on the NYSE but an active trading market for our common shares may not be sustained. The market price of our common shares could fluctuate significantly as a result of:
• | dilutive issuances of our common shares, including common shares issued as interest payments under the 1.5 Lien Notes and 1.75 Lien Term Loans or upon exercise of the 2017 Warrants; |
• | announcements relating to our business or the business of our competitors; |
48
• | changes in expectations as to our future financial performance or changes in financial estimates of public market analysis; |
• | actual or anticipated quarterly variations in our operating results; |
• | conditions generally affecting the oil and natural gas industry; |
• | the success of our operating strategy; and |
• | the operating and share price performance of other comparable companies. |
Many of these factors are beyond our control and we cannot predict their potential effects on the price of our common shares. In addition, the stock markets in general can experience considerable price and volume fluctuations.
If we fail to comply with the continued listing standards of the NYSE, it may result in a delisting of our common shares from the NYSE.
Our common shares are currently and have been listed for trading on the NYSE, and the continued listing of our common shares on the NYSE is subject to our compliance with a number of listing standards. To maintain compliance with these continued listing standards, the Company is required, among other things, to maintain an average closing price of $1.00 or more over a consecutive 30 trading-day period. On January 16, 2017, we received a notice from the NYSE that the average closing price of our common shares over the prior 30 consecutive trading days was below $1.00 per share, and, as a result, the price per share of the common shares was below the minimum average closing price required to maintain listing on the NYSE. The notice stated that we had six months to regain compliance with the NYSE continued listing standards, or until July 16, 2017, or the NYSE would initiate procedures to suspend and delist the common shares. We have notified the NYSE of our intent to cure this noncompliance and are currently exploring options for regaining compliance, including a potential reverse share split. If we effect a reverse share split, the common shares will be deemed to be in compliance with NYSE standards if, promptly after the reverse share split, the price per common share exceeds $1.00 per share and remains above that level for at least the following 30 trading days.
Our amended and restated certificate of formation permits us to issue preferred shares that may restrict a takeover attempt that you may favor.
Our amended and restated certificate of formation permits our board to issue up to 10,000,000 preferred shares and to establish by resolution one or more series of preferred shares and the powers, designations, preferences and participating, optional or other special rights of each series of preferred shares. The preferred shares may be issued on terms that are unfavorable to the holders of our common shares, including the grant of superior voting rights, the grant of preferences in favor of preferred shareholders in the payment of dividends and upon our liquidation and the designation of conversion rights that entitle holders of our preferred shares to convert their shares into common shares on terms that are dilutive to holders of our common shares. The issuance of preferred shares in future offerings may make a takeover or change in control more difficult.
Our amended and restated certificate of formation contains a provision waiving the duty of a member of our Board of Directors to present corporate opportunities to us, which could adversely affect our shareholders.
Pursuant to our services and investment agreement with ESAS, we amended and restated our certificate of formation to provide that C. John Wilder, the Executive Chairman of our Board of Directors, is not required to present corporate opportunities to us. As a result of the waiver, Mr. Wilder and certain of his affiliates have the ability to engage in the same or similar lines of business as us and will not be obligated to, among other things, offer us an opportunity to participate in any business opportunities that involve any aspect of the energy business or industry that are presented or become known to Mr. Wilder and certain of his affiliates. These potential conflicts of interest could have a material adverse effect on our business, financial condition and results of operations if attractive corporate opportunities are allocated by Mr. Wilder to himself or his affiliates instead of to us.
We have a number of large shareholders that have significant influence over matters requiring shareholder approval because of their ownership of our common shares, and the ownership of our common shares may become significantly concentrated in the future.
As of December 31, 2016, we had two shareholders that, directly or through certain affiliates, each beneficially owned more than 5% of our outstanding common shares, and two shareholders that, directly or through certain affiliates, each beneficially owned more than 10% of our outstanding common shares.
In addition, certain affiliates of Fairfax hold, directly or indirectly, $151.0 million in aggregate principal amount of 1.5 Lien Notes, $412.1 million in aggregate principal amount of 1.75 Lien Term Loans and 2017 Warrants representing the right to
49
purchase 188,249,067 common shares, making such affiliates of Fairfax the largest holder of the 1.5 Lien Notes, 1.75 Lien Term Loans and 2017 Warrants. As a result, if we make interest payments on the 1.5 Lien Notes and 1.75 Lien Term Loans in our common shares, and Fairfax’s affiliates choose to exercise all or a portion of their 2017 Warrants, the ownership of our common shares could become significantly concentrated in such affiliates of Fairfax. Furthermore, any of these future issuances of common shares to Fairfax’s affiliates would dilute the common share ownership of our public shareholders, further increasing the relative percentage of our outstanding common shares held by Fairfax’s affiliates.
Shareholders and/or their affiliates that have significant beneficial ownership of our common shares have substantial influence regarding matters submitted for shareholder approval, including proposals regarding:
• | any merger, consolidation or sale of all or substantially all of our assets; |
• | the election of members of our Board of Directors; and |
• | any amendment to our amended and restated certificate of formation. |
The current or increased ownership position of any of these shareholders and/or their respective affiliates could delay, deter or prevent a change of control or adversely affect the price that investors might be willing to pay in the future for our common shares. The interests of these shareholders and/or their respective affiliates may significantly differ from the interests of our other shareholders and they may vote the common shares they beneficially own in ways with which our other shareholders disagree.
In the future, we may seek bankruptcy protection, which may harm our business and place our equity holders at significant risk of losing all of their interests in our business.
If we are not able to generate sufficient cash flows in the future to finance our business or our Liquidity and capital resources are further constrained, including if we are unable to obtain the shareholder approvals necessary to make interest payments under the 1.5 Lien Notes and 1.75 Lien Term Loans with our common shares, a filing under Chapter 11 of the Bankruptcy Code may be unavoidable. Seeking bankruptcy protection could have a material adverse effect on our business, financial condition, results of operations and Liquidity. So long as a proceeding related to a Chapter 11 bankruptcy is ongoing, our senior management would be required to spend a significant amount of time and effort dealing with the reorganization instead of focusing exclusively on our business operations. Bankruptcy protection also might make it more difficult to retain management and other key personnel necessary to the success and growth of our business. In addition, the longer a proceeding related to a bankruptcy continues, the more likely it is that our customers and suppliers would lose confidence in our ability to reorganize our businesses successfully and would seek to establish alternative commercial relationships or request financial assurances such as letters of credit and cash deposits.
Additionally, we have a significant amount of indebtedness that is senior to our existing common shares in our capital structure. As a result, we believe that seeking bankruptcy protection could cause our common shares to be canceled, resulting in a limited recovery for shareholders, if any, and place equity holders at significant risk of losing all of their interests in our business.
Item 1B. | Unresolved Staff Comments |
Not applicable.
Item 2. | Properties |
Corporate offices
We lease office space in Dallas, Texas and Cranberry Township, Pennsylvania. We also have small offices for technical and field operations in Texas, Louisiana and Pennsylvania. The table below summarizes our material corporate leases.
Location | Approximate square footage | Approximate monthly payment | Expiration | ||||||
Dallas, Texas (1) | 155,000 | $ | 249,000 | May 31, 2025 | |||||
Cranberry Township, Pennsylvania | 15,400 | $ | 27,000 | December 31, 2017 | |||||
50
(1) | The office lease in Dallas, Texas contains a right on our behalf to terminate the lease agreement early on June 30, 2020 or June 30, 2022. |
Other
We have described our oil and natural gas properties, oil and natural gas reserves, acreage, wells, production and drilling activity in “Item 1. Business” of this Annual Report on Form 10-K.
Item 3. | Legal Proceedings |
In the ordinary course of business, we are periodically a party to various litigation matters. During the third quarter of 2016, we terminated our sales and transportation contracts with Enterprise and Acadian, respectively. Under the parties’ sales and transportation agreements, Enterprise owed us for July 2016 natural gas sales, and we owed Acadian for July 2016 transportation fees. The amount owed to us by Enterprise exceeded the amount owed by us to Acadian. We notified Enterprise in writing of its failure to pay and gave Enterprise opportunity to cure. When Enterprise failed to cure, we gave written notice to Enterprise and Acadian that we were terminating the sales and transportation agreements. Enterprise subsequently filed an amended petition at Enterprise Products Operating LLC and Acadian Gas Pipeline System v. EXCO Operating Company, LP, EXCO Partners OLP GP, LLC, Raider Marketing, LP, and Raider Marketing GP, LLC No. 2016-60848 157th Judicial District, Harris County, Texas. The amended petition alleges that we could not terminate the parties’ agreements despite Enterprise's uncured payment default under the gas sales agreement, and further alleged that we were in breach of the firm transportation agreements. On October 17, 2016, we filed a counterclaim asserting that Enterprise was the breaching party because it improperly withheld payment for natural gas we delivered to it and the amounts owed by Enterprise exceeded the amounts owed by us to Acadian. We are also seeking a declaration that we properly terminated the contracts with Enterprise and Acadian, as well as payment of the amounts owed to us under the agreements. This case is currently set for trial for October 2, 2017.
Item 4. | Mine Safety Disclosures |
Not applicable.
PART II
Item 5. | Market for the Registrant's Common Equity, Related Stockholder Matters and Issuer Purchases of Equity Securities |
Market information for our common shares
Our common shares trade on the NYSE under the symbol “XCO.” The following table sets forth, for the periods indicated, the high and low sales prices per share of our common share as reported by the NYSE:
Price per share | ||||||||
High | Low | |||||||
2016 | ||||||||
First Quarter | $ | 1.94 | $ | 0.70 | ||||
Second Quarter | 1.91 | 0.51 | ||||||
Third Quarter | 1.42 | 0.90 | ||||||
Fourth Quarter | 1.26 | 0.85 | ||||||
2015 | ||||||||
First Quarter | $ | 2.54 | $ | 1.29 | ||||
Second Quarter | 2.26 | 1.16 | ||||||
Third Quarter | 1.17 | 0.48 | ||||||
Fourth Quarter | 1.40 | 0.74 | ||||||
51
Our shareholders
According to our transfer agent, Continental Stock Transfer & Trust Company, there were 127 holders of record of our common shares on December 31, 2016 (including nominee holders such as banks and brokerage firms who hold shares for beneficial holders and holders of restricted shares).
NYSE compliance
Our common shares are currently and have been listed for trading on the NYSE, and the continued listing of our common shares on the NYSE is subject to our compliance with a number of listing standards. To maintain compliance with these continued listing standards, the Company is required to maintain an average closing price of $1.00 or more over a consecutive 30 trading-day period.
On January 16, 2017, we received a notice from the NYSE that the average closing price of our common shares over the prior 30 consecutive trading days was below $1.00 per share, and, as a result, the price per share of the common shares was below the minimum average closing price required to maintain listing on the NYSE. The notice stated that we had six months to regain compliance with the NYSE continued listing standards, or until July 16, 2017, or the NYSE would initiate procedures to suspend and delist the common shares.
We notified the NYSE of our intent to cure this noncompliance and are currently exploring options for regaining compliance, including a potential reverse share split of our common shares.
Our dividend policy
On December 15, 2014, our Board of Directors suspended our cash dividend to provide additional funds to reinvest into the Company. The indentures governing our 2018 Notes, 2022 Notes and 1.5 Lien Notes and the credit agreement governing the 1.75 Lien Term Loans, contain covenants that limit our ability to pay dividends. In addition, we are currently prohibited from paying cash dividends on our common shares under Texas law because we have negative shareholders’ equity. Any future declaration of dividends, as well as the establishment of record and payment dates, will depend on, among other things, our earnings, capital requirements, financial condition, prospects and other factors our Board of Directors may deem relevant.
Issuer repurchases of common shares
The following table details our repurchases of common shares for the three months ended December 31, 2016:
Period | Total Number of Shares Purchased | Average Price Paid Per Share | Total Number of Shares Purchased as Part of Publicly Announced Plans or Programs | Maximum Approximate Dollar Value of Shares that May Yet Be Purchased Under the Plans or Programs (in millions) (1) | ||||||||||
October 1 - October 31 | — | $ | — | — | $ | 192.5 | ||||||||
November 1 - November 30 | — | — | — | 192.5 | ||||||||||
December 1 - December 31 | — | — | — | 192.5 | ||||||||||
Total | — | — | — | |||||||||||
(1) | On July 19, 2010, we announced a $200.0 million share repurchase program. |
Item 6. | Selected Financial Data |
The following table presents our selected historical financial and operating data. This financial data should be read in conjunction with “Item 7. Management's Discussion and Analysis of Financial Condition and Results of Operations,” our consolidated financial statements, the notes to our consolidated financial statements and the other financial information included in this Annual Report on Form 10-K. This information does not replace the consolidated financial statements. Certain reclassifications have been made to prior period information to conform to current period presentation.
Selected consolidated financial and operating data
52
Year Ended December 31, | ||||||||||||||||||||
(in thousands, except per share amounts) | 2016 | 2015 | 2014 | 2013 | 2012 | |||||||||||||||
Statement of operations data (1): | ||||||||||||||||||||
Revenues: | ||||||||||||||||||||
Oil and natural gas | $ | 248,649 | $ | 329,258 | $ | 660,984 | $ | 634,644 | $ | 546,609 | ||||||||||
Purchased natural gas and marketing | 22,352 | 26,442 | 34,933 | 28,446 | — | |||||||||||||||
Total revenues | 271,001 | 355,700 | 695,917 | 663,090 | 546,609 | |||||||||||||||
Cost and expenses: | ||||||||||||||||||||
Oil and natural gas production | 49,989 | 76,533 | 94,326 | 83,248 | 104,610 | |||||||||||||||
Gathering and transportation | 106,460 | 99,321 | 101,574 | 100,645 | 102,875 | |||||||||||||||
Purchased natural gas | 23,557 | 27,369 | 35,648 | 28,781 | — | |||||||||||||||
Depletion, depreciation and amortization | 75,982 | 215,426 | 263,569 | 245,775 | 303,156 | |||||||||||||||
Impairment of oil and natural gas properties | 160,813 | 1,215,370 | — | 108,546 | 1,346,749 | |||||||||||||||
Accretion of discount on asset retirement obligations | 2,210 | 2,277 | 2,690 | 2,514 | 3,887 | |||||||||||||||
General and administrative (2) | 48,700 | 58,818 | 65,920 | 91,878 | 83,818 | |||||||||||||||
Other operating items (3) | 24,239 | 461 | 5,315 | (177,518 | ) | 17,029 | ||||||||||||||
Total cost and expenses | 491,950 | 1,695,575 | 569,042 | 483,869 | 1,962,124 | |||||||||||||||
Operating income (loss) | (220,949 | ) | (1,339,875 | ) | 126,875 | 179,221 | (1,415,515 | ) | ||||||||||||
Other income (expense): | ||||||||||||||||||||
Interest expense, net | (70,438 | ) | (106,082 | ) | (94,284 | ) | (102,589 | ) | (73,492 | ) | ||||||||||
Gain (loss) on derivative financial instruments (4) | (34,137 | ) | 75,869 | 87,665 | (320 | ) | 66,133 | |||||||||||||
Gain on restructuring and extinguishment of debt (5) | 119,457 | 193,276 | — | — | — | |||||||||||||||
Other income (expense) | 43 | 122 | 241 | (828 | ) | 969 | ||||||||||||||
Equity income (loss) (6) | (16,432 | ) | (15,691 | ) | 172 | (53,280 | ) | 28,620 | ||||||||||||
Total other income (expense) | (1,507 | ) | 147,494 | (6,206 | ) | (157,017 | ) | 22,230 | ||||||||||||
Income (loss) before income taxes | (222,456 | ) | (1,192,381 | ) | 120,669 | 22,204 | (1,393,285 | ) | ||||||||||||
Income tax expense | 2,802 | — | — | — | — | |||||||||||||||
Net income (loss) | $ | (225,258 | ) | $ | (1,192,381 | ) | $ | 120,669 | $ | 22,204 | $ | (1,393,285 | ) | |||||||
Basic net income (loss) per share | $ | (0.81 | ) | $ | (4.36 | ) | $ | 0.45 | $ | 0.10 | $ | (6.50 | ) | |||||||
Diluted net income (loss) per share | $ | (0.81 | ) | $ | (4.36 | ) | $ | 0.45 | $ | 0.10 | $ | (6.50 | ) | |||||||
Cash dividends declared per share | $ | — | $ | — | $ | 0.15 | $ | 0.20 | $ | 0.16 | ||||||||||
Weighted average common shares and common share equivalents outstanding: | ||||||||||||||||||||
Basic | 279,287 | 273,621 | 268,258 | 215,011 | 214,321 | |||||||||||||||
Diluted | 279,287 | 273,621 | 268,376 | 230,912 | 214,321 | |||||||||||||||
Statement of cash flow data: | ||||||||||||||||||||
Net cash provided by (used in): | ||||||||||||||||||||
Operating activities | $ | (414 | ) | $ | 134,027 | $ | 362,093 | $ | 350,634 | $ | 514,786 | |||||||||
Investing activities | (55,009 | ) | (300,833 | ) | (221,588 | ) | (252,478 | ) | (427,094 | ) | ||||||||||
Financing activities | 52,244 | 132,748 | (144,683 | ) | (93,317 | ) | (74,045 | ) | ||||||||||||
Balance sheet data: | ||||||||||||||||||||
Current assets | $ | 110,617 | $ | 149,801 | $ | 330,766 | $ | 305,854 | $ | 361,866 | ||||||||||
Total assets | 661,414 | 954,126 | 2,304,942 | 2,399,836 | 2,313,072 | |||||||||||||||
Current liabilities | 258,363 | 252,919 | 329,436 | 349,170 | 237,931 | |||||||||||||||
Long-term debt | 1,258,538 | 1,320,279 | 1,430,516 | 1,850,120 | 1,838,312 | |||||||||||||||
Shareholders' equity | (871,906 | ) | (662,323 | ) | 510,004 | 147,905 | 149,393 | |||||||||||||
Total liabilities and shareholders' equity | 661,414 | 954,126 | 2,304,942 | 2,399,836 | 2,313,072 | |||||||||||||||
53
(1) | We have completed numerous acquisitions and dispositions which impact the comparability of the selected financial data between periods. |
(2) | Equity-based compensation included in general and administrative expenses was $14.8 million, $7.2 million, $5.0 million, $10.7 million and $8.9 million for the years ended December 31, 2016, 2015, 2014, 2013 and 2012, respectively. |
(3) | The net loss during 2016 was primarily due to the settlement of the litigation with our joint venture partner. See "Note 3. Acquisitions, divestitures and other significant events" in the Notes to our Consolidated Financial Statements for additional information. During 2013, we recognized a gain on the contribution of properties to Compass Production Partners, L.P. ("Compass"). |
(4) | We do not designate our derivative financial instruments as hedges and, as a result, the changes in the fair value of our derivative financial instruments are recognized in our Consolidated Statements of Operations. See "Note 2. Summary of significant accounting policies" in the Notes to our Consolidated Financial Statements for a description of this accounting method. |
(5) | During 2016, we recognized a net gain on extinguishment of debt due to open market repurchases of a portion of the 2018 Notes and 2022 Notes and Tender Offer that resulted in the repurchase of a portion of the 2022 Notes. During 2015, we recognized a gain on restructuring and extinguishment of debt as a result of repurchasing a portion of our 2018 Notes and 2022 Notes in exchange for the holders of such notes agreeing to act as lenders in connection with the Exchange Term Loan. In addition, we repurchased a portion of the 2018 Notes in open market purchases which resulted in a net gain on extinguishment of debt. See "Note 5. Debt" in the Notes to our Consolidated Financial Statements for further discussion. |
(6) | On November 15, 2013, we sold our equity interest in TGGT Holdings, LLC ("TGGT") to Azure in exchange for cash proceeds and an equity interest in Azure Midstream Holdings LLC ("Azure"). We report our equity interest acquired in Azure using the cost method of accounting. |
Item 7. | Management’s Discussion and Analysis of Financial Condition and Results of Operations |
The following management's discussion and analysis of our financial condition and results of operations should be read in conjunction with our financial statements and the related notes to those statements included elsewhere in this Annual Report on Form 10-K. In addition to historical financial information, the following management's discussion and analysis contains forward-looking statements that involve risks, uncertainties and assumptions. Our results and the timing of selected events may differ materially from those anticipated in these forward-looking statements as a result of many factors, including those discussed under “Item 1A. Risk Factors” and elsewhere in this Annual Report on Form 10-K.
Overview and history
We are an independent oil and natural gas company engaged in the exploration, exploitation, acquisition, development and production of onshore U.S. oil and natural gas properties with a focus on shale resource plays. Our principal operations are conducted in certain key U.S. oil and natural gas areas including Texas, Louisiana and the Appalachia region.
Our primary strategy focuses on the exploitation and development of our shale resource plays and the pursuit of leasing and acquisition opportunities. We plan to carry out this strategy by executing on a strategic plan that incorporates the following three core objectives: (i) restructuring the balance sheet to enhance our capital structure and extend structural Liquidity; (ii) transforming EXCO into the lowest cost producer; and (iii) optimizing and repositioning our portfolio. We believe this strategy will allow us to create long-term value for our shareholders.
Like all oil and natural gas exploration and production companies, we face the challenge of natural production declines. We attempt to offset the impact of this natural decline by implementing drilling and exploitation projects to identify and develop additional reserves and adding reserves through leasing and undeveloped acreage acquisition opportunities. Our financial condition has been negatively impacted by the prolonged depressed oil and natural gas price environment, levels of indebtedness, and gathering, transportation and certain other commercial contracts.
Recent developments
1.5 Lien Notes and 1.75 Lien Term Loans
In March 2017, we closed a series of transactions intended to significantly improve our capital structure. This includes the issuance of $300.0 million in aggregate principal amount of 1.5 Lien Notes, the exchange of $682.8 million in aggregate principal amount of the Second Lien Term Loans for a like amount of 1.75 Lien Term Loans and issuance of warrants to purchase our common shares. The 1.5 Lien Notes and 1.75 Lien Term Loans provide us the option, subject to certain limitations, to pay interest in cash, common shares, or additional indebtedness. The transaction fees paid to the lenders included
54
a combination of cash and warrants to purchase our common shares. The 1.5 Lien Notes were issued to affiliates of Fairfax, ESAS and Oaktree, as well as an unaffiliated lender.
The proceeds from the 1.5 Lien Notes were primarily utilized to repay outstanding indebtedness under the EXCO Resources Credit Agreement. The EXCO Resources Credit Agreement was amended to reduce the borrowing base to $150.0 million, permit the issuance of the 1.5 Lien Notes and the exchange of Second Lien Term Loans, and modify certain financial covenants. The next borrowing base redetermination for the EXCO Resources Credit Agreement is scheduled to occur on or around November 1, 2017. See further discussion of these transactions as part of "Note 18. Subsequent Events" to the Notes to our Consolidated Financial Statements.
Board of Directors
On February 27, 2017, Wilbur L. Ross, Jr. resigned from our Board of Directors and each of its committees upon the confirmation of his appointment as the U.S. Secretary of Commerce. Effective March 1, 2017, Stephen J. Toy, Senior Managing Director and Co-Head of WL Ross, and Anthony R. Horton, Chief Financial Officer and Treasurer of Energy Future Holdings Corp., were appointed to our Board of Directors.
Divestitures
We executed a series of non-core asset divestitures as part of our objective to optimize and reposition our portfolio. On October 3, 2016, we closed the sale of our interests in shallow conventional assets located primarily in West Virginia for approximately $4.5 million, subject to customary post-closing purchase price adjustments. For the nine months ended September 30, 2016, the divested assets produced approximately 4 Mmcfe per day and the revenues less direct operating expenses, excluding general and administrative costs, generated net income of $0.7 million. The asset retirement obligations related to the divested wells were $9.7 million on October 3, 2016.
On July 1, 2016, we closed the sale of our interests in shallow conventional assets located in Pennsylvania and received an overriding royalty interest in each well. For the six months ended June 30, 2016, the divested assets produced approximately 6 Mmcfe per day and the revenues less direct operating expenses, excluding general and administrative costs, generated a net loss of less than $0.1 million. The asset retirement obligations related to the divested wells were $22.6 million on July 1, 2016.
On May 6, 2016, we closed a sale of certain non-core undeveloped acreage in South Texas and our interests in four producing wells for $11.5 million, subject to customary post-closing purchase price adjustments.
See "Note 3. Acquisitions, divestitures and other significant events" in the Notes to our Consolidated Financial Statements for additional information.
Natural gas sales and firm transportation contract litigation
During the third quarter of 2016, Raider Marketing, LP ("Raider"), a wholly owned subsidiary of EXCO, terminated its sales and transportation contracts with Enterprise and Acadian, respectively. We transported natural gas produced from our operated wells in North Louisiana through Acadian, and Enterprise was a purchaser of certain volumes of our natural gas, until we terminated the contracts. The termination of these contracts is currently subject to litigation. See "Note 8. Commitments and contingencies" in the Notes to our Consolidated Financial Statements and "Item 3. Legal Proceedings" for additional information.
Tender Offer and note repurchases
On August 24, 2016, we completed the Tender Offer that resulted in the repurchase of an aggregate of $101.3 million in principal amount of our 2022 Notes for an aggregate purchase price of $40.0 million. See "Note 5. Debt" in the Notes to our Consolidated Financial Statements for a more detailed discussion of the Tender Offer. During the year ended December 31, 2016, through the Tender Offer and a series of open market purchases, we repurchased an aggregate of $26.4 million and $152.7 million in principal amount of our 2018 Notes and 2022 Notes, respectively, with an aggregate of $53.3 million in cash. These repurchases resulted in a net gain on extinguishment of debt of $119.5 million for the year ended December 31, 2016, respectively. In conjunction with the Tender Offer, we solicited consents from the holders of the 2022 Notes to amend certain terms of the indenture governing the 2022 Notes. Following the consummation of the consent solicitation, we entered into a supplemental indenture governing the 2022 Notes to amend the definition of "Credit Facilities" to include debt securities as a permitted form of additional secured indebtedness, in addition to the term loans and other credit facilities currently permitted.
55
Settlement of Participation Agreement litigation
In July 2013, we entered into a participation agreement with a joint venture partner for the development of certain assets in the Eagle Ford shale ("Participation Agreement"). As described in "Note 3. Acquisitions, divestitures and other significant events" in the Notes to our Consolidated Financial Statements, we were in a dispute subject to litigation over the offer and the acceptance process with our joint venture partner. On July 25, 2016, we settled the litigation with our joint venture partner, and the litigation was thereafter dismissed after a final judgment order was entered in response to the parties’ joint motion to dismiss the case with prejudice. Among other things, the settlement provided a full release for any claims, rights, demands, damages and causes of action that either party has asserted or could have asserted for any breach of the Participation Agreement. As part of the settlement, the parties amended and restated the Participation Agreement to (i) eliminate our requirement to offer to purchase our joint venture partner's interests in certain wells each quarter, (ii) eliminate our requirement to convey a portion of our working interest to our joint venture partner upon commencing development of future locations, (iii) terminate the area of mutual interest, which required either party acquiring an interest in non-producing acreage included in certain areas to provide notice of the acquisition to the non-acquiring party and allowed the non-acquiring party to acquire a proportionate share in such acquired interest, (iv) provide that EXCO transfer to its joint venture partner a portion of its interests in certain producing wells and certain undeveloped locations in South Texas, effective May 1, 2016 and (v) modify or eliminate certain other provisions. The Participation Agreement was terminated on December 1, 2016 upon final settlement of the agreement. See "Note 3. Acquisitions, divestitures and other significant events" in the Notes to our Consolidated Financial Statements for additional information.
Critical accounting estimates
The process of preparing financial statements in conformity with GAAP requires us to make estimates and assumptions to determine reported amounts of certain assets, liabilities, revenues, expenses and related disclosures. We have identified the most critical accounting policies used in the preparation of our consolidated financial statements. We determined the critical policies by considering accounting policies that involve the most complex or subjective decisions or assessments. We identified our most critical accounting policies to be those related to our estimates of Proved Reserves, derivative financial instruments, business combinations, equity-based compensation, oil and natural gas properties, goodwill, revenue recognition, asset retirement obligations and income taxes.
The following is a discussion of our most critical accounting estimates, judgments and uncertainties that are inherent in our application of GAAP. For a more complete discussion of our accounting policies see "Note 2. Summary of significant accounting policies" in the Notes to our Consolidated Financial Statements.
Estimates of Proved Reserves
The Proved Reserves data included in this Annual Report on Form 10-K was prepared in accordance with SEC guidelines. The accuracy of a reserve estimate is a function of:
• | the quality and quantity of available data; |
• | the interpretation of this data; |
• | the accuracy of various mandated economic assumptions; and |
• | the technical qualifications, experience and judgment of the persons preparing the estimates. |
Because these estimates depend on many assumptions, all of which may substantially differ from actual results, reserve estimates may be different from the quantities of oil and natural gas that are ultimately recovered. In addition, results of drilling, testing and production after the date of an estimate may justify material revisions to the estimate. The assumptions used for our shale properties including reservoir characteristics and performance are subject to further refinement as additional production history is accumulated.
You should not assume that the present value of future net cash flows represents the current market value of our estimated Proved Reserves. In accordance with the SEC's requirements, we based the estimated discounted future net cash flows from Proved Reserves according to the requirements in the SEC's Release No. 33-8995 Modernization of Oil and Gas Reporting. Actual future prices and costs may be materially higher or lower than the prices and costs used in the preparation of the estimate. Further, the mandated discount rate of 10% may not be an accurate assumption of future interest rates or cost of capital.
Proved Reserve quantities directly and materially impact depletion expense. If the Proved Reserves decline, then the rate at which we record depletion expense increases, reducing net income. A decline in the estimate of Proved Reserves may result
56
from lower market prices, making it uneconomical to drill or produce from higher cost fields. In addition, a decline in Proved Reserves may impact the outcome of our assessment of our oil and natural gas properties and require an impairment of the carrying value of our oil and natural gas properties.
Business combinations
When we acquire assets that qualify as a business, we use FASB ASC 805-10, Business Combinations ("ASC 805-10") to record our acquisitions of oil and natural gas properties or entities. ASC 805-10 requires that acquired assets, identifiable intangible assets and liabilities be recorded at their fair value, with any excess purchase price being recognized as goodwill. Application of ASC 805-10 requires significant estimates to be made by management using information available at the time of acquisition. Since these estimates require the use of significant judgment, actual results could vary as the estimates are subject to changes as new information becomes available.
Derivative financial instruments
We use derivative financial instruments to manage price fluctuations, protect our investments and achieve a more predictable cash flow. The estimates of the fair values of our derivative financial instruments require judgment. The fair value of our derivative financial instruments is determined by quoted futures prices, utilization of the credit-adjusted risk-free rate curves and the implied rates of volatility. We do not designate our derivative financial instruments as hedging instruments for financial accounting purposes and, as a result, we recognize the change in the respective instruments’ fair value in earnings. When prices for oil and natural gas are volatile, a significant portion of the effect of our derivative financial instrument management activities consists of non-cash income or expense due to changes in the fair value of our derivative financial instruments.
Equity-based compensation
Our equity-based compensation includes share-based compensation to employees which we account for in accordance with FASB ASC Topic 718, Compensation-Stock Compensation ("ASC 718") and equity-based compensation for warrants issued to ESAS which we account for in accordance with FASB ASC Topic 505-50, Equity-Based Payments to Non-Employees ("ASC 505-50").
ASC 718 requires share-based compensation to employees to be recognized in our Consolidated Statements of Operations based on their estimated fair values. Estimating the grant date fair value of our share-based compensation requires management to make assumptions and to apply judgment in estimating the fair value. These assumptions and judgments include estimating the volatility of our share price, dividend yields, expected term, forfeiture rates and other company-specific inputs. ASC 505-50 requires the warrants to be re-measured each interim reporting period until the completion of the services under the agreement and an adjustment is recorded in our Consolidated Statements of Operations. The fair value of the warrants is dependent on factors such as our share price, historical volatility, risk-free rate and performance relative to our peer group.
Changes in these assumptions could materially affect the estimate of the fair value. If actual results are not consistent with the assumptions used, the equity-based compensation expense reported in our financial statements may not be representative of the actual economic impact of the equity-based compensation.
Oil and natural gas properties
The accounting for, and disclosure of, oil and natural gas producing activities require that we choose between two GAAP alternatives: the full cost method or the successful efforts method. We use the full cost method of accounting, which involves capitalizing all acquisition, exploration, exploitation and development costs of oil and natural gas properties. Once we incur costs, they are recorded in the depletable pool of proved properties or in unproved properties, collectively, the full cost pool. Our unproved property costs are not subject to depletion. We review our unproved oil and natural gas property costs on a quarterly basis to assess for impairment or the need to transfer unproved costs to proved properties as a result of extension or discoveries from drilling operations or determination that no Proved Reserves are attributable to such costs. In determining whether such costs should be impaired or transferred, we evaluate lease expiration dates, recent drilling results, future development plans and current market values. Our undeveloped properties are predominantly held-by-production, which reduces the risk of impairment as a result of lease expirations.
We capitalize interest on the costs related to the acquisition of undeveloped acreage in accordance with FASB ASC 835-20, Capitalization of Interest. When the unproved property costs are moved to proved developed and undeveloped oil and natural gas properties, or the properties are sold, we cease capitalizing interest related to these properties.
57
We calculate depletion using the unit-of-production method. Under this method, the sum of the full cost pool, excluding the book value of unproved properties, and all estimated future development costs less estimated salvage value are divided by the total estimated quantities of Proved Reserves. This rate is applied to our total production for the quarter, and the appropriate expense is recorded. We capitalize the portion of general and administrative costs, including share-based compensation, that is attributable to our acquisition, exploration, exploitation and development activities.
Sales, dispositions and other oil and natural gas property retirements are accounted for as adjustments to the full cost pool, with no recognition of gain or loss, unless the disposition would significantly alter the amortization rate and/or the relationship between capitalized costs and Proved Reserves.
Pursuant to Rule 4-10(c)(4) of Regulation S-X, at the end of each quarterly period, companies that use the full cost method of accounting for their oil and natural gas properties must compute a limitation on capitalized costs ("ceiling test"). The ceiling test involves comparing the net book value of the full cost pool, after taxes, to the full cost ceiling limitation defined below. In the event the full cost ceiling limitation is less than the full cost pool, we are required to record a ceiling test impairment of our oil and natural gas properties. The full cost ceiling limitation is computed as the sum of the present value of estimated future net revenues from our Proved Reserves by applying the average price as prescribed by the SEC Release No. 33-8995, less estimated future expenditures (based on current costs) to develop and produce the Proved Reserves, discounted at 10%, plus the cost of properties not being amortized and the lower of cost or estimated fair value of unproved properties included in the costs being amortized, net of income tax effects.
The ceiling test is computed using the simple average spot price for the trailing 12 month period using the first day of each month. Each of the reference prices for oil and natural gas are further adjusted for quality factors and regional differentials to derive estimated future net revenues. Under full cost accounting rules, any ceiling test impairments of oil and natural gas properties may not be reversed in subsequent periods. Since we do not designate our derivative financial instruments as hedging instruments, we are not allowed to use the impacts of the derivative financial instruments in our ceiling test computations.
The evaluation of impairment of our oil and natural gas properties includes estimates of Proved Reserves. There are numerous uncertainties inherent in estimating quantities of Proved Reserves, in projecting the future rates of production and in the timing of development activities. The accuracy of any reserve estimate is a function of the quality of available data and of engineering and geological interpretation and judgment. Results of drilling, testing and production subsequent to the date of the estimate may justify revisions of such estimate. Accordingly, reserve estimates often differ from the quantities of oil and natural gas that are ultimately recovered.
Goodwill
In accordance with FASB ASC 350-20, Intangibles-Goodwill and Other, goodwill is not amortized, but is tested for impairment on an annual basis as of December 31, or more frequently as impairment indicators arise. Impairment tests involve the use of estimates related to the fair market value of the business operations with which goodwill is associated. Losses, if any, resulting from impairment tests will be reflected in operating income or loss in the Consolidated Statements of Operations.
We apply a two-part, equally weighted approach in determining the fair value of our business as part of the goodwill impairment test. We perform an income approach, which uses a discounted cash flow model to value our business, and a market approach, in which our value is determined using trading metrics and transaction multiples of peer companies. The discounted cash flow model used in the income approach requires us to make various judgmental assumptions about future production, revenues, operating and capital expenditures, discount rates and other inputs which are based on our budgets, business plans, economic projections and anticipated future cash flows. The market approach requires us to make assumptions regarding the identifications of comparable companies and transactions as well as the future performance of ourselves and the comparable companies. As part of the determination of the fair value of our reporting unit, we corroborate the results of the valuation model through a comparison to our enterprise value that is calculated as the combined market capitalization of our equity plus the fair value of our debt. Due to the changing market conditions, it is possible that inputs and assumptions used in the valuation may change in the future, which could materially affect the estimate of the fair value of our business.
Revenue recognition and natural gas imbalances
We use the sales method of accounting for oil and natural gas revenues. We record sales revenue based on an estimate of the volumes delivered at estimated prices as determined by the applicable sales agreement. We estimate our sales volumes primarily on company-measured volume readings. We then adjust our oil and natural gas sales in subsequent periods based on
58
the data received from our purchasers that reflects actual volumes and prices received. Historically, these differences have been immaterial. Natural gas imbalances at December 31, 2016, 2015 and 2014 were not significant.
Asset retirement obligations
We follow FASB ASC 410-20, Asset Retirement Obligations ("ASC 410-20") to account for legal obligations associated with the retirement of long-lived assets. ASC 410-20 requires these obligations be recognized at their estimated fair value at the time that the obligations are incurred. The costs of plugging and abandoning oil and natural gas properties fluctuate with costs associated with the industry. Our calculation of asset retirement obligations uses numerous assumptions and judgments, including the ultimate settlement amounts, inflation factors, credit adjusted discount rates, timing of settlement, and changes in the legal, regulatory, environmental and political environments. We periodically assess the estimated costs of our asset retirement obligations and adjust the liability according to these estimates.
Income taxes
Income taxes are accounted for in accordance with FASB ASC 740, Income Taxes. Deferred taxes are recorded to reflect the tax benefits and consequences of future years' differences between the tax basis of assets and liabilities and their financial reporting basis. We must make certain estimates related to the reversal of temporary differences, and actual results could vary from those estimates. We assess, using all available positive and negative evidence, the likelihood that the deferred tax assets will be recovered from future taxable income. Examples of positive and negative evidence include historical taxable income or losses, forecasted income or losses, the estimated timing of the reversals of existing temporary differences as well as prudent and feasible tax planning strategies. We record a valuation allowance to reduce deferred tax assets if it is more likely than not that some portion or all of the deferred tax assets will not be realized. As of December 31, 2016, we continued to have a full valuation allowance against our net deferred tax assets. A significant amount of judgment is also required in determining the amount of unrecognized tax benefit to record for uncertain tax positions. We consider the amounts and probabilities of the outcomes that could be realized upon ultimate settlement of an uncertain tax position using the facts, circumstances and information available at the reporting date to establish the appropriate amount of unrecognized tax benefit. We currently do not have any uncertain tax positions recorded as of December 31, 2016.
59
Our results of operations
A summary of key financial data for the years ended December 31, 2016, 2015 and 2014 related to our results of operations is presented below:
Year Ended December 31, | Year to year change | |||||||||||||||||||
(dollars in thousands, except per unit prices) | 2016 | 2015 | 2014 | 2016-2015 | 2015-2014 | |||||||||||||||
Production: | ||||||||||||||||||||
Oil (Mbbls) | 1,769 | 2,342 | 2,236 | (573 | ) | 106 | ||||||||||||||
Natural gas (Mmcf) | 93,829 | 109,926 | 122,324 | (16,097 | ) | (12,398 | ) | |||||||||||||
Total production (Mmcfe) (1) | 104,443 | 123,978 | 135,740 | (19,535 | ) | (11,762 | ) | |||||||||||||
Average daily production (Mmcfe) | 285 | 340 | 372 | (55 | ) | (32 | ) | |||||||||||||
Revenues before derivative financial instrument activities: | ||||||||||||||||||||
Oil | $ | 67,317 | $ | 102,787 | $ | 196,316 | $ | (35,470 | ) | $ | (93,529 | ) | ||||||||
Natural gas | 181,332 | 226,471 | 464,668 | (45,139 | ) | (238,197 | ) | |||||||||||||
Total oil and natural gas revenues | 248,649 | 329,258 | 660,984 | (80,609 | ) | (331,726 | ) | |||||||||||||
Purchased natural gas and marketing | 22,352 | 26,442 | 34,933 | (4,090 | ) | (8,491 | ) | |||||||||||||
Total revenues | $ | 271,001 | $ | 355,700 | $ | 695,917 | $ | (84,699 | ) | $ | (340,217 | ) | ||||||||
Oil and natural gas derivative financial instruments: | ||||||||||||||||||||
Gain (loss) on derivative financial instruments | $ | (34,137 | ) | $ | 75,869 | $ | 87,665 | $ | (110,006 | ) | $ | (11,796 | ) | |||||||
Average sales price (before cash settlements of derivative financial instruments): | ||||||||||||||||||||
Oil (per Bbl) | $ | 38.05 | $ | 43.89 | $ | 87.80 | $ | (5.84 | ) | $ | (43.91 | ) | ||||||||
Natural gas (per Mcf) | 1.93 | 2.06 | 3.80 | (0.13 | ) | (1.74 | ) | |||||||||||||
Natural gas equivalent (per Mcfe) | 2.38 | 2.66 | 4.87 | (0.28 | ) | (2.21 | ) | |||||||||||||
Costs and expenses: | ||||||||||||||||||||
Oil and natural gas operating costs | $ | 34,609 | $ | 53,903 | $ | 64,467 | $ | (19,294 | ) | $ | (10,564 | ) | ||||||||
Production and ad valorem taxes | 15,380 | 22,630 | 29,859 | (7,250 | ) | (7,229 | ) | |||||||||||||
Gathering and transportation | 106,460 | 99,321 | 101,574 | 7,139 | (2,253 | ) | ||||||||||||||
Purchased natural gas | 23,557 | 27,369 | 35,648 | (3,812 | ) | (8,279 | ) | |||||||||||||
Depletion | 74,482 | 213,302 | 258,266 | (138,820 | ) | (44,964 | ) | |||||||||||||
Depreciation and amortization | 1,500 | 2,124 | 5,303 | (624 | ) | (3,179 | ) | |||||||||||||
General and administrative (2) | 48,700 | 58,818 | 65,920 | (10,118 | ) | (7,102 | ) | |||||||||||||
Interest expense, net (3) | 70,438 | 106,082 | 94,284 | (35,644 | ) | 11,798 | ||||||||||||||
Costs and expenses (per Mcfe): | ||||||||||||||||||||
Oil and natural gas operating costs | $ | 0.33 | $ | 0.43 | $ | 0.47 | $ | (0.10 | ) | $ | (0.04 | ) | ||||||||
Production and ad valorem taxes | 0.15 | 0.18 | 0.22 | (0.03 | ) | (0.04 | ) | |||||||||||||
Gathering and transportation | 1.02 | 0.80 | 0.75 | 0.22 | 0.05 | |||||||||||||||
Depletion | 0.71 | 1.72 | 1.90 | (1.01 | ) | (0.18 | ) | |||||||||||||
Depreciation and amortization | 0.01 | 0.02 | 0.04 | (0.01 | ) | (0.02 | ) | |||||||||||||
Net income (loss) (4) | $ | (225,258 | ) | $ | (1,192,381 | ) | $ | 120,669 | $ | 967,123 | $ | (1,313,050 | ) | |||||||
(1) | Mmcfe is calculated by converting one barrel of oil into six Mcf of natural gas. |
(2) | Equity-based compensation expense included in general and administrative expenses was $14.8 million, $7.2 million and $5.0 million for the years ended December 31, 2016, 2015 and 2014, respectively. |
(3) | Interest expense, net excludes cash payments on the Exchange Term Loan, which are not considered interest expense per FASB ASC 470-60, Troubled Debt Restructuring by Debtors ("ASC 470-60"). See "Note 5. Debt" in the Notes to our Consolidated Financial Statements for additional information and the accounting treatment of the Exchange Term Loan. |
(4) | Net losses for the years ended December 31, 2016 and 2015 included impairments of oil and natural gas properties of $160.8 million and $1.2 billion, respectively. See "Note 2. Summary of significant accounting policies" in the Notes to our Consolidated Financial Statements for further discussion. Net losses for the years ended December 31, 2016 and 2015 included net gains on restructuring and extinguishment of debt of $119.5 million and $193.3 million, respectively. |
60
The following is a discussion of our financial condition and results of operations for the years ended December 31, 2016, 2015 and 2014.
The comparability of our results of operations for 2016, 2015 and 2014 was affected by:
• | fluctuations in oil and natural gas prices, which impact our oil and natural gas reserves, revenues, cash flows and net income or loss; |
• | impairments of our oil and natural gas properties during 2016 and 2015; |
• | asset impairments and other non-recurring costs, including the settlement of the litigation with our Eagle Ford shale joint venture partner during 2016; |
• | mark-to-market gains and losses from our derivative financial instruments; |
• | changes in Proved Reserves and production volumes and their impact on depletion; |
• | the sale of our shallow conventional assets in Appalachia during 2016 and the sale of Compass during 2014; |
• | the impact of declining natural gas production volumes from our reduced drilling activities in certain shale formations; |
• | significant changes in our capital structure as a result of debt financing transactions, including the issuance of the Second Lien Term Loans and repurchases and exchanges of our 2018 Notes and 2022 Notes in 2015 and 2016, and the rights offering and related private placement of our common shares ("Rights Offering") in 2014; |
• | gain on restructuring of debt and accounting treatment for the debt exchange transactions during the fourth quarter of 2015; |
• | changes in general and administrative expenses as a result of the services and investment agreement with ESAS during 2015 and 2016, and legal and advisory fees incurred in connection with the restructuring of our balance sheet and gathering and firm transportation contracts in 2016; and |
• | the reductions in our workforce that occurred during 2016, 2015 and 2014. |
General
The availability of a ready market and the prices for oil and natural gas are dependent upon a number of factors that are beyond our control. These factors include, among other things:
• | supply and demand for oil and natural gas and expectations regarding supply and demand; |
• | the level of domestic and international production; |
• | the availability of imported oil and natural gas; |
• | federal regulations applicable to the export of, and construction of export facilities for natural gas; |
• | political and economic conditions and events in foreign oil and natural gas producing nations, including embargoes, continued hostilities in the Middle East and other sustained military campaigns, and acts of terrorism or sabotage; |
• | the ability of members of the Organization of Petroleum Exporting Countries to agree to and maintain oil price and production controls; |
• | the cost and availability of transportation and pipeline systems with adequate capacity; |
• | the cost and availability of other competitive fuels; |
• | fluctuating and seasonal demand for oil, natural gas and refined products; |
• | concerns about global warming or other conservation initiatives and the extent of governmental price controls and regulation of production; |
• | regional price differentials and quality differentials of oil and natural gas; |
• | the availability of refining capacity; |
• | technological advances affecting oil and natural gas production and consumption; |
• | weather conditions and natural disasters; |
• | foreign and domestic government relations; and |
• | overall domestic and global economic conditions. |
Accordingly, in light of the many uncertainties affecting the supply and demand for oil, natural gas and refined petroleum products, we cannot accurately predict the prices or marketability of oil and natural gas from any producing well in which we have or may acquire an interest.
Marketing arrangements
On August 19, 2016, we formed Raider through an internal merger to provide marketing services to EXCO and pursue independent business opportunities. Raider is a wholly owned subsidiary of EXCO and is the contractual counterparty by
61
operation of Texas law to all of EXCO's gathering, transportation and marketing contracts in Texas and Louisiana. Raider purchases and resells natural gas from third-party producers as well as oil and natural gas from operated wells in Texas and Louisiana, and charges a fee for marketing services to certain working interest owners in the related wells.
We produce oil and natural gas. We do not refine or process the oil or natural gas we produce. We sell the majority of the oil we produce under contracts using market sensitive pricing. The majority of our oil contracts are based on NYMEX pricing, which is typically calculated as the average of the daily closing prices of oil to be delivered one month in the future. We also sell a portion of our oil at F.O.B. field prices posted by the principal purchaser of oil where our producing properties are located. Our sales contracts are of a type common within the industry, and we usually negotiate a separate contract for each area. Generally, we sell our oil to purchasers and refiners near the areas of our producing properties.
We sell the majority of our natural gas under individually negotiated gas purchase contracts using market sensitive pricing. Our sales contracts vary in length from spot market sales of a single day to term agreements that may extend for a year or more. Our natural gas customers include utilities, natural gas marketing companies and a variety of commercial and industrial end users. The natural gas purchase contracts define the terms and conditions unique to each of these sales. The price received for natural gas sold on the spot market varies daily, reflecting changing market conditions.
We may be unable to market all of the oil or natural gas we produce. If our oil and natural gas can be marketed, we may be unable to negotiate favorable pricing and contractual terms. Changes in oil or natural gas prices may significantly affect our revenues, cash flows, the value of our oil and natural gas properties and the estimates of recoverable oil and natural gas reserves. Further, significant declines in the prices of oil or natural gas may have a material adverse effect on our business and on our financial condition.
We engage in oil and natural gas production activities in geographic regions where, from time to time, the supply of oil or natural gas available for delivery exceeds the demand. If this occurs, companies purchasing oil or natural gas in these areas may reduce the amount of oil or natural gas that they purchase from us. If we cannot locate other buyers for our production or for any of our oil or natural gas reserves, we may shut in our oil or natural gas wells for certain periods of time. Furthermore, we may shut in our oil and natural gas wells if regional market prices decrease to a level that is uneconomical to produce. If this occurs, we may incur additional payment obligations under our oil and natural gas leases and, under certain circumstances, the oil and natural gas leases might be terminated. Economic conditions, particularly depressed oil and natural gas prices, may negatively impact the Liquidity and creditworthiness of our purchasers and may expose us to risk with respect to the ability to collect payments for the oil and natural gas we deliver.
Presentation of results of operations
Our discussion of production, revenues and direct operating expenses is based on our producing regions. For the year ended December 31, 2014, our results from Compass are included in Appalachia and other region in the tables below. The operating results of Compass represent our proportionate interest from its formation on February 14, 2013 to the closing of the sale of our interest on October 31, 2014.
Oil and natural gas production, revenues and prices
The following table presents our production, revenue and average sales prices for the years ended December 31, 2016 and 2015:
Year Ended December 31, | |||||||||||||||||||||||||||||||||
2016 | 2015 | Year to year change | |||||||||||||||||||||||||||||||
(dollars in thousands, except per unit rate) | Production (Mmcfe) | Revenue | $/Mcfe | Production (Mmcfe) | Revenue | $/Mcfe | Production (Mmcfe) | Revenue | $/Mcfe | ||||||||||||||||||||||||
Producing region: | |||||||||||||||||||||||||||||||||
North Louisiana | 55,314 | $ | 110,755 | $ | 2.00 | 73,896 | $ | 160,612 | $ | 2.17 | (18,582 | ) | $ | (49,857 | ) | $ | (0.17 | ) | |||||||||||||||
East Texas | 24,454 | 54,944 | 2.25 | 18,275 | 45,656 | 2.50 | 6,179 | 9,288 | (0.25 | ) | |||||||||||||||||||||||
South Texas | 11,471 | 62,037 | 5.41 | 15,220 | 96,008 | 6.31 | (3,749 | ) | (33,971 | ) | (0.90 | ) | |||||||||||||||||||||
Appalachia and other | 13,204 | 20,913 | 1.58 | 16,587 | 26,982 | 1.63 | (3,383 | ) | (6,069 | ) | (0.05 | ) | |||||||||||||||||||||
Total | 104,443 | $ | 248,649 | $ | 2.38 | 123,978 | $ | 329,258 | $ | 2.66 | (19,535 | ) | $ | (80,609 | ) | $ | (0.28 | ) | |||||||||||||||
62
Production for the year ended December 31, 2016 decreased by 19.5 Bcfe, or 16%, as compared with 2015. The decrease in our production was primarily attributable to a reduction in our capital expenditures of 72% compared to prior year in response to the lower oil and natural gas price environment. Significant components of the changes in production included:
• | decreased production of 18.6 Bcfe for the year ended December 31, 2016 in the North Louisiana region primarily due to production declines partially offset by additional volumes from the wells turned-to-sales during 2016. |
• | increased production of 6.2 Bcfe for the year ended December 31, 2016 in the East Texas region primarily due to additional volumes from wells turned-to-sales during late 2015 and early 2016. |
• | decreased production of 3.7 Bcfe for the year ended December 31, 2016 in the South Texas region primarily due to production declines and the transfer of a portion of our interests in certain producing wells to a joint venture partner. We have not turned a well to sales in the region since late 2015 and the transfer of our interests was the result of the litigation settlement with a joint venture partner that is described in more detail in "Note 3. Acquisitions, divestitures and other significant events" in the Notes to our Consolidated Financial Statements. |
• | decreased production of 3.4 Bcfe for the year ended December 31, 2016 in the Appalachia region primarily due to the sale of our interests in shallow conventional assets located in Pennsylvania and West Virginia in 2016 and production declines. |
Oil and natural gas revenues for the year ended December 31, 2016 decreased by $80.6 million, or 24%, as compared with 2015. The decrease in revenues was primarily the result of decreases in oil and natural gas production and prices. Our average natural gas sales price decreased 6% to $1.93 per Mcf for the year ended December 31, 2016 from $2.06 per Mcf for the year ended December 31, 2015, primarily due to lower market prices. Our average sales price of oil per Bbl decreased 13% to $38.05 per Bbl for the year ended December 31, 2016 from $43.89 per Bbl for the year ended December 31, 2015, primarily due to lower market prices.
The following table and discussion presents our production, revenue and average sales prices for the years ended December 31, 2015 and 2014:
Year Ended December 31, | |||||||||||||||||||||||||||||||||
2015 | 2014 | Year to year change | |||||||||||||||||||||||||||||||
(dollars in thousands, except per unit rate) | Production (Mmcfe) | Revenue | $/Mcfe | Production (Mmcfe) | Revenue | $/Mcfe | Production (Mmcfe) | Revenue | $/Mcfe | ||||||||||||||||||||||||
Producing region: | |||||||||||||||||||||||||||||||||
North Louisiana | 73,896 | $ | 160,612 | $ | 2.17 | 82,327 | $ | 330,451 | $ | 4.01 | (8,431 | ) | $ | (169,839 | ) | $ | (1.84 | ) | |||||||||||||||
East Texas | 18,275 | 45,656 | 2.50 | 10,589 | 41,338 | 3.90 | 7,686 | 4,318 | (1.40 | ) | |||||||||||||||||||||||
South Texas | 15,220 | 96,008 | 6.31 | 13,713 | 176,022 | 12.84 | 1,507 | (80,014 | ) | (6.53 | ) | ||||||||||||||||||||||
Appalachia and other | 16,587 | 26,982 | 1.63 | 29,111 | 113,173 | 3.89 | (12,524 | ) | (86,191 | ) | (2.26 | ) | |||||||||||||||||||||
Total | 123,978 | $ | 329,258 | $ | 2.66 | 135,740 | $ | 660,984 | $ | 4.87 | (11,762 | ) | $ | (331,726 | ) | $ | (2.21 | ) | |||||||||||||||
Production for the year ended December 31, 2015 decreased by 11.8 Bcfe, or 9%, as compared with 2014. Significant components of the changes in production were a result of:
• | decreased production of 8.4 Bcfe for the year ended December 31, 2015 in the North Louisiana region primarily due to production declines in excess of additional volumes from wells turned-to-sales. |
• | increased production of 7.7 Bcfe for the year ended December 31, 2015 in the East Texas region due to additional development as we resumed our drilling program in this region during 2014 and this region was the primary focus of our 2015 development program. |
• | increased production of 1.5 Bcfe for the year ended December 31, 2015 in the South Texas region due to additional volumes from wells turned-to-sales in the Eagle Ford shale and Buda formation. |
• | decreased production of 12.5 Bcfe for the year ended December 31, 2015 primarily due to a decrease of 7.8 Bcfe due to the sale of our interest in Compass during the fourth quarter of 2014 and a decrease of 4.7 Bcfe in the Appalachia region as a result of production declines. Production in Appalachia for the year ended December 31, 2015 was impacted by approximately 1.1 Bcfe shut-in due to low regional natural gas prices and a reduction of volumes of 0.3 Bcfe due to a pipeline disruption in Northeast Pennsylvania. |
Oil and natural gas revenues for the year ended December 31, 2015 decreased by $331.7 million, or 50%, as compared with 2014. The decrease in revenues was primarily the result of a decrease in oil and natural gas prices as well as decreased production consistent with our reduced development program. Our average natural gas sales price decreased 46% to $2.06 per
63
Mcf for the year ended December 31, 2015 from $3.80 per Mcf for the year ended December 31, 2014, primarily due to lower market prices. Our average sales price of oil per Bbl decreased 50% to $43.89 per Bbl for the year ended December 31, 2015 from $87.80 per Bbl for the year ended December 31, 2014, primarily due to lower market prices. The impact of lower market prices was partially offset by improved differentials in the South Texas region due to a renegotiated sales contract which resulted in a higher realized price for the related oil production.
Purchased natural gas and marketing revenues
Purchased natural gas and marketing revenues include revenues we receive as a result of selling natural gas purchased from third parties and marketing fees we receive from third parties. Purchased natural gas and marketing revenues for the year ended December 31, 2016 decreased by $4.1 million, or 15%, as compared with 2015, primarily due to lower volumes sold partially offset by marketing fees charged to third parties beginning in September 2016. Purchased natural gas and marketing revenues for the year ended December 31, 2015 decreased by $8.5 million, or 24%, as compared to 2014, primarily due to lower sales prices.
Oil and natural gas operating costs
The following tables and discussion present our oil and natural gas operating costs for the years ended December 31, 2016, 2015, and 2014.
Year Ended December 31, | ||||||||||||||||||||||||||||||||||||
2016 | 2015 | Year to year change | ||||||||||||||||||||||||||||||||||
(in thousands) | Lease operating expenses | Workovers and other | Total | Lease operating expenses | Workovers and other | Total | Lease operating expenses | Workovers and other | Total | |||||||||||||||||||||||||||
Producing region: | ||||||||||||||||||||||||||||||||||||
North Louisiana | $ | 11,467 | $ | 1,050 | $ | 12,517 | $ | 13,342 | $ | 2,798 | $ | 16,140 | $ | (1,875 | ) | $ | (1,748 | ) | $ | (3,623 | ) | |||||||||||||||
East Texas | 5,082 | 596 | 5,678 | 4,097 | 1,426 | 5,523 | 985 | (830 | ) | 155 | ||||||||||||||||||||||||||
South Texas | 11,405 | 246 | 11,651 | 18,768 | 2,007 | 20,775 | (7,363 | ) | (1,761 | ) | (9,124 | ) | ||||||||||||||||||||||||
Appalachia and other | 4,692 | 71 | 4,763 | 10,850 | 615 | 11,465 | (6,158 | ) | (544 | ) | (6,702 | ) | ||||||||||||||||||||||||
Total | $ | 32,646 | $ | 1,963 | $ | 34,609 | $ | 47,057 | $ | 6,846 | $ | 53,903 | $ | (14,411 | ) | $ | (4,883 | ) | $ | (19,294 | ) | |||||||||||||||
Year Ended December 31, | ||||||||||||||||||||||||||||||||||||
2016 | 2015 | Year to year change | ||||||||||||||||||||||||||||||||||
(per Mcfe) | Lease operating expenses | Workovers and other | Total | Lease operating expenses | Workovers and other | Total | Lease operating expenses | Workovers and other | Total | |||||||||||||||||||||||||||
Producing region: | ||||||||||||||||||||||||||||||||||||
North Louisiana | $ | 0.21 | $ | 0.02 | $ | 0.23 | $ | 0.18 | $ | 0.04 | $ | 0.22 | $ | 0.03 | $ | (0.02 | ) | $ | 0.01 | |||||||||||||||||
East Texas | 0.21 | 0.02 | 0.23 | 0.22 | 0.08 | 0.30 | (0.01 | ) | (0.06 | ) | (0.07 | ) | ||||||||||||||||||||||||
South Texas | 0.99 | 0.02 | 1.01 | 1.23 | 0.13 | 1.36 | (0.24 | ) | (0.11 | ) | (0.35 | ) | ||||||||||||||||||||||||
Appalachia and other | 0.36 | 0.01 | 0.37 | 0.65 | 0.04 | 0.69 | (0.29 | ) | (0.03 | ) | (0.32 | ) | ||||||||||||||||||||||||
Total | $ | 0.31 | $ | 0.02 | $ | 0.33 | $ | 0.38 | $ | 0.05 | $ | 0.43 | $ | (0.07 | ) | $ | (0.03 | ) | $ | (0.10 | ) | |||||||||||||||
Oil and natural gas operating costs for the year ended December 31, 2016 decreased by $19.3 million, or 36%, as compared with 2015. The decrease was primarily due to cost reduction efforts, including significant reductions in labor costs, repair and maintenance costs, chemical treatment costs, workover activity and saltwater disposal costs. Reduced labor costs were primarily due to significant reductions in our workforce in 2015 and 2016. The sale of our conventional assets in Appalachia in 2016 also contributed to lower oil and natural gas operating costs in the region, including the associated reductions in our workforce. On a consolidated basis, our net share of labor costs for the year ended December 31, 2016 decreased by $4.6 million, or 51%, as compared with 2015. The reduction in saltwater disposal costs is primarily due to the renegotiation of contracts and more cost-efficient disposal methods.
Oil and natural gas operating costs for the year ended December 31, 2016 were $0.33 per Mcfe compared to $0.43 per Mcfe for the year ended December 31, 2015. The decrease in oil and natural operating costs per Mcfe was primarily due to our cost reduction efforts and the sale of our interests in shallow conventional assets in Appalachia, which had the highest lease operating expenses per Mcfe in our portfolio.
64
Year Ended December 31, | ||||||||||||||||||||||||||||||||||||
2015 | 2014 | Year to year change | ||||||||||||||||||||||||||||||||||
(in thousands) | Lease operating expenses | Workovers and other | Total | Lease operating expenses | Workovers and other | Total | Lease operating expenses | Workovers and other | Total | |||||||||||||||||||||||||||
Producing region: | ||||||||||||||||||||||||||||||||||||
North Louisiana | $ | 13,342 | $ | 2,798 | $ | 16,140 | $ | 14,741 | $ | 3,539 | $ | 18,280 | $ | (1,399 | ) | $ | (741 | ) | $ | (2,140 | ) | |||||||||||||||
East Texas | 4,097 | 1,426 | 5,523 | 3,315 | 276 | 3,591 | 782 | 1,150 | 1,932 | |||||||||||||||||||||||||||
South Texas | 18,768 | 2,007 | 20,775 | 15,242 | 396 | 15,638 | 3,526 | 1,611 | 5,137 | |||||||||||||||||||||||||||
Appalachia and other | 10,850 | 615 | 11,465 | 25,210 | 1,748 | 26,958 | (14,360 | ) | (1,133 | ) | (15,493 | ) | ||||||||||||||||||||||||
Total | $ | 47,057 | $ | 6,846 | $ | 53,903 | $ | 58,508 | $ | 5,959 | $ | 64,467 | $ | (11,451 | ) | $ | 887 | $ | (10,564 | ) | ||||||||||||||||
Year Ended December 31, | ||||||||||||||||||||||||||||||||||||
2015 | 2014 | Year to year change | ||||||||||||||||||||||||||||||||||
(per Mcfe) | Lease operating expenses | Workovers and other | Total | Lease operating expenses | Workovers and other | Total | Lease operating expenses | Workovers and other | Total | |||||||||||||||||||||||||||
Producing region: | ||||||||||||||||||||||||||||||||||||
North Louisiana | $ | 0.18 | $ | 0.04 | $ | 0.22 | $ | 0.18 | $ | 0.04 | $ | 0.22 | $ | — | $ | — | $ | — | ||||||||||||||||||
East Texas | 0.22 | 0.08 | 0.30 | 0.31 | 0.03 | 0.34 | (0.09 | ) | 0.05 | (0.04 | ) | |||||||||||||||||||||||||
South Texas | 1.23 | 0.13 | 1.36 | 1.11 | 0.03 | 1.14 | 0.12 | 0.10 | 0.22 | |||||||||||||||||||||||||||
Appalachia and other | 0.65 | 0.04 | 0.69 | 0.87 | 0.06 | 0.93 | (0.22 | ) | (0.02 | ) | (0.24 | ) | ||||||||||||||||||||||||
Total | $ | 0.38 | $ | 0.05 | $ | 0.43 | $ | 0.43 | $ | 0.04 | $ | 0.47 | $ | (0.05 | ) | $ | 0.01 | $ | (0.04 | ) | ||||||||||||||||
Oil and natural gas operating costs for the year ended December 31, 2015 decreased by $10.6 million, or 16%, as compared with 2014. The decrease was primarily due to the sale of our interest in Compass in the fourth quarter of 2014 and cost reduction efforts, including significant reductions in workforce, in the North Louisiana and Appalachia regions. These decreases were partially offset by higher oil and natural gas operating costs in the East Texas and South Texas regions as a result of additional producing wells compared to prior periods. The decrease in oil and natural operating costs per Mcfe was primarily due to the sale of our interest in Compass which had a higher average cost per Mcfe compared to the average for the rest of our properties.
Oil and natural gas operating costs for the year ended December 31, 2015 were $0.43 per Mcfe compared to $0.47 per Mcfe for the year ended December 31, 2014. The decrease in oil and natural operating costs per Mcfe was primarily due to the sale of our interest in Compass, which had a higher average cost per Mcfe compared to the average for the rest of our properties, and cost reduction efforts across our producing regions.
Gathering and transportation
Gathering and transportation expenses for the year ended December 31, 2016 increased by $7.1 million, or 7%, as compared with 2015. The increase was primarily due to gathering expenses in connection with taking our gas in-kind from certain third-party operated wells in the North Louisiana region, and higher variable gathering costs on volumes from wells turned-to-sales in North Louisiana. Gathering and transportation expenses were $1.02 per Mcfe for the year ended December 31, 2016, as compared to $0.80 per Mcfe for the year ended December 31, 2015. The increase was primarily due to lower volumes in relation to fixed costs under gathering and firm transportation contracts in the East Texas and North Louisiana regions.
As discussed in "Note 8. Commitments and Contingencies" in the Notes to our Consolidated Financial Statements, we terminated certain sales and firm transportation agreements during the third quarter of 2016 that are currently subject to litigation. The termination of these contracts will not be reflected in our financial results until the litigation is resolved and it is deemed to be realized in accordance with GAAP.
Gathering and transportation expenses for the year ended December 31, 2015 decreased by $2.3 million, or 2%, as compared with 2014. The decrease was primarily due to reduced rates on a renegotiated firm transportation contract in the North Louisiana region, sale of our interest in Compass and decreased production in Appalachia. These decreases were partially offset by additional expenses incurred as a result of a shortfall under a minimum volume commitment for gathering services in the East Texas and North Louisiana regions. Gathering and transportation expenses were $0.80 per Mcfe for the year
65
ended December 31, 2015, as compared to $0.75 per Mcfe for the year ended December 31, 2014. The increase was primarily due to lower volumes in relation to fixed costs under firm transportation contracts in the North Louisiana region.
Purchased natural gas expenses
Purchased natural gas expenses are purchases of natural gas from third parties plus the related costs of transportation. Purchased natural gas expenses for the year ended December 31, 2016 decreased by $3.8 million, or 14%, as compared with 2015, primarily due to lower volumes purchased. Purchased natural gas expenses for the year ended December 31, 2015 decreased by $8.3 million, or 23%, as compared with 2014, primarily due to lower purchase prices.
Production and ad valorem taxes
Year Ended December 31, | |||||||||||||||||||||||||||||||||
2016 | 2015 | 2014 | |||||||||||||||||||||||||||||||
(in thousands, except per unit rate) | Production and ad valorem taxes | % of revenue | Taxes $/Mcfe | Production and ad valorem taxes | % of revenue | Taxes $/Mcfe | Production and ad valorem taxes | % of revenue | Taxes $/Mcfe | ||||||||||||||||||||||||
Producing region: | |||||||||||||||||||||||||||||||||
North Louisiana | $ | 7,482 | 6.8 | % | $ | 0.14 | $ | 10,027 | 6.2 | % | $ | 0.14 | $ | 9,581 | 2.9 | % | $ | 0.12 | |||||||||||||||
East Texas | 1,467 | 2.7 | % | 0.06 | 1,059 | 2.3 | % | 0.06 | 451 | 1.1 | % | 0.04 | |||||||||||||||||||||
South Texas | 5,709 | 9.2 | % | 0.50 | 10,216 | 10.6 | % | 0.67 | 13,406 | 7.6 | % | 0.98 | |||||||||||||||||||||
Appalachia and other | 722 | 3.5 | % | 0.05 | 1,328 | 4.9 | % | 0.08 | 6,421 | 5.7 | % | 0.22 | |||||||||||||||||||||
Total | $ | 15,380 | 6.2 | % | $ | 0.15 | $ | 22,630 | 6.9 | % | $ | 0.18 | $ | 29,859 | 4.5 | % | $ | 0.22 | |||||||||||||||
Production and ad valorem taxes for the year ended December 31, 2016 decreased by $7.3 million, or 32%, as compared with 2015. The decrease was primarily due to lower production volumes, lower commodity prices, and lower ad valorem taxes in South Texas. The lower commodity prices primarily impacted properties located in Texas because production taxes are based on a fixed percentage of gross value of production sold. Production and ad valorem taxes for the year ended December 31, 2015 decreased by $7.2 million, or 24%, as compared with 2014. The decrease was primarily due to lower production volumes and lower commodity prices.
Production and ad valorem tax rates per Mcfe were $0.15, $0.18 and $0.22 for 2016, 2015 and 2014, respectively. The rate per Mcfe decreased from 2015 to 2016 primarily due to lower ad valorem taxes in South Texas. The rate per Mcfe decreased from 2014 to 2015 due to the sale of our interest in Compass in the fourth quarter of 2014 which had higher average production and ad valorem taxes per Mcfe compared to the average for the rest of our properties.
In our North Louisiana and East Texas regions, we currently receive severance tax holidays on certain horizontal wells which reduce the effective rate of these taxes. Our horizontal wells in the state of Louisiana are eligible for an exemption from severance taxes for the earlier of two years from the date of first production or until payout of qualified costs. In July 2015, the state of Louisiana decreased its severance tax rate for wells that do not receive exemptions from $0.163 to $0.158 per Mcf. In July 2016, the effective severance tax rate decreased to $0.098 per Mcf. Our horizontal natural gas wells in the state of Texas are eligible for an exemption from severance taxes for up to ten years of production or until the cumulative value of the tax reduction equals 50% of the drilling and completion costs incurred for the well.
Production and ad valorem taxes are set by state and local governments and vary as to the tax rate and the value to which that rate is applied. In Louisiana, where a substantial percentage of our production is derived, severance taxes are levied on a per Mcf basis. Therefore, the resulting dollar value of production is not sensitive to changes in prices for natural gas, except for holiday exemptions, if any. In our other operating areas, particularly Texas, production taxes are based on a fixed percentage of gross value of production sold. As such, our realized severance and ad valorem tax rates may become more sensitive to prices, except for wells that receive holiday exemptions, if any. The Commonwealth of Pennsylvania requires an impact fee to be paid on all unconventional wells spud based on a price tier calculation for a period of 15 years. Multiple pieces of legislation have been introduced in both the Pennsylvania House and the Senate that propose a severance tax at varying rates on the production of oil and natural gas. This severance tax would likely be in addition to the impact fee and could have an impact on our production taxes in future periods. There is no certainty that this legislation will be passed nor is it possible to quantify the impact at this time.
Depletion, depreciation and amortization
66
Depletion, depreciation and amortization for the year ended December 31, 2016 decreased as compared with 2015 primarily due to a decrease in depletion expense of $138.8 million, or 65%. On a per Mcfe basis, the depletion rate for the year ended December 31, 2016 was $0.71 per Mcfe, compared with $1.72 per Mcfe in 2015. The decrease in depletion expense was primarily due to a decrease in production and the depletion rate. The decrease in the depletion rate was primarily due to the impairments of our oil and natural gas properties during 2016 and 2015, which lowered our depletable base.
Depletion, depreciation and amortization for the year ended December 31, 2015 decreased as compared with 2014 primarily due to a decrease in depletion expense of $45.0 million, or 17%. On a per Mcfe basis, the depletion rate for the year ended December 31, 2015 was $1.72 per Mcfe, compared with $1.90 per Mcfe in 2014. The decrease in depletion expense was primarily due to a decrease in production and depletion rate. The decrease in the depletion rate was primarily due to the impairments of our oil and natural gas properties during 2015, which lowered our depletable base.
Impairment of oil and natural gas properties
For the year ended December 31, 2016, we recorded impairments to our oil and natural gas properties of $160.8 million primarily due to the decline in oil and natural gas prices. The trailing twelve month reference price of $2.48 per Mmbtu for natural gas and $42.75 per Bbl of oil for the year ended December 31, 2016 decreased from $2.59 per Mmbtu for natural gas and $50.28 per Bbl of oil for the year ended December 31, 2015. For the year ended December 31, 2015, we recorded impairments to our oil and natural gas properties of $1.2 billion primarily due to the significant decline in oil and natural gas prices partially offset by upward revisions in the oil and natural gas reserves primarily as a result of performance and other factors. For the year ended December 31, 2014, we did not record impairments to our oil and natural gas properties.
Oil and natural gas prices are volatile and we may incur additional impairments during 2017 if future oil and natural gas prices result in a decrease in the trailing twelve-month reference prices compared to December 31, 2016. For the first quarter 2017, the trailing twelve month reference prices expected to be utilized in our first quarter 2017 ceiling test calculation are approximately $2.73 per Mmbtu for natural gas and $47.61 per Bbl of oil, representing an increase of 10% and 11% for the price of natural gas and oil, respectively, from December 31, 2016. Furthermore, the risk of impairment in future periods would be reduced if we are able to demonstrate that we have the ability to finance a development plan and record upward revisions to our Proved Undeveloped Reserves. The possibility and amount of any future impairment is difficult to predict, and will depend, in part, upon future oil and natural gas prices to be utilized in the ceiling test, estimates of Proved Reserves and future capital expenditures and operating costs.
General and administrative
The following table presents our general and administrative expenses for the years ended December 31, 2016, 2015 and 2014:
Year Ended December 31, | Year to year change | |||||||||||||||||||
(in thousands, except per unit rate) | 2016 | 2015 | 2014 | 2016-2015 | 2015-2014 | |||||||||||||||
General and administrative costs: | ||||||||||||||||||||
Gross general and administrative expense | $ | 58,002 | $ | 87,788 | $ | 109,499 | $ | (29,786 | ) | $ | (21,711 | ) | ||||||||
Technical services and service agreement charges | (7,132 | ) | (15,884 | ) | (24,747 | ) | 8,752 | 8,863 | ||||||||||||
Operator overhead reimbursements | (13,703 | ) | (13,126 | ) | (13,507 | ) | (577 | ) | 381 | |||||||||||
Capitalized salaries | (3,245 | ) | (7,158 | ) | (10,287 | ) | 3,913 | 3,129 | ||||||||||||
General and administrative expense, excluding equity-based compensation | 33,922 | 51,620 | 60,958 | (17,698 | ) | (9,338 | ) | |||||||||||||
Gross equity-based compensation | 15,530 | 10,626 | 10,460 | 4,904 | 166 | |||||||||||||||
Capitalized equity-based compensation | (752 | ) | (3,428 | ) | (5,498 | ) | 2,676 | 2,070 | ||||||||||||
General and administrative expense | $ | 48,700 | $ | 58,818 | $ | 65,920 | $ | (10,118 | ) | $ | (7,102 | ) | ||||||||
General and administrative expenses for the year ended December 31, 2016 decreased by $10.1 million, or 17%, compared with 2015. Significant components of the changes in general and administrative expense for the year ended December 31, 2016 compared to 2015 were a result of:
67
• | decreased personnel costs of $29.8 million for the year ended December 31, 2016 compared to the same period in the prior year, primarily due to reductions in our workforce and employee benefits, including the suspension of the 401(K) employer match. The Company reinstated its matching program effective January 1, 2017 in which it will match 100% of employee contributions up to a maximum of 3% of each employee's pay. As a result of a reduced employee headcount and lower contribution rate as compared to prior periods, we expect the total employer contributions, net of forfeitures, to be less than $0.3 million. |
• | increased professional and legal fees of $6.7 million for the year ended December 31, 2016 compared to the same period in the prior year, primarily related to the legal and advisory fees incurred in connection with the strategic initiatives focused on restructuring our balance sheet and gathering and transportation contracts; |
• | decreased various other gross general and administrative expenses of $6.7 million for the year ended December 31, 2016 compared to the same period in the prior year. These decreases reflect our efforts to reduce our general and administrative costs throughout the organization. |
• | decreased technical services and service agreement recoveries of $8.8 million for the year ended December 31, 2016 compared to the same period in the prior year. These decreases were primarily a result of reduced headcount and lower recoveries in connection with the transition service agreement with Compass that terminated in April 2015. |
• | decreased capitalized salaries of $3.9 million and capitalized equity-based compensation of $2.7 million for the year ended December 31, 2016 compared to the same period in the prior year, primarily as a result of reduced employee headcount; and |
• | increased equity-based compensation of $4.9 million for the year ended December 31, 2016 compared to the same period in the prior year. The increase was primarily due to $8.1 million of additional compensation expense related to the warrants issued to ESAS in 2015. The fair value of the warrants is dependent on factors such as our share price, historical volatility, risk-free rate and performance relative to our peer group. The expense related to warrants is re-measured and adjusted each interim reporting period; therefore, our general and administrative expenses in future periods could be volatile based on the aforementioned factors. The increase in our equity-based compensation expense was partially offset by lower equity-based compensation to employees as a result of reductions in our workforce. |
General and administrative expenses for the year ended December 31, 2015 decreased by $7.1 million, or 11%, compared with 2014. Significant components of the changes in general and administrative expense for the year ended December 31, 2015 compared to 2014 were a result of:
• | decreased personnel costs of $17.5 million for the year ended December 31, 2015 compared to the same period in the prior year. The decrease is primarily the result of reductions in our workforce that occurred during the second quarter of 2014 and the first and fourth quarters of 2015. These decreases were offset by higher severance costs paid in 2015 of $5.3 million as compared to $2.2 million in 2014. |
• | increased consulting and contract labor costs of $3.2 million for the year ended December 31, 2015 compared to the same period in the prior year. The increase primarily related to service fees to ESAS totaling $2.7 million and the accrual of the annual incentive payment to ESAS of $1.8 million as a result of EXCO's performance rank during 2015. This was partially offset by less reliance on consulting and contract labor as part of our cost reduction initiatives. |
• | decreased various other gross general and administrative expenses of $7.4 million for the year ended December 31, 2015 compared to the same period in the prior year. These decreases reflect our efforts to reduce our general and administrative costs such as office expenses, professional fees, travel and software licenses. |
• | decreased technical services and service agreement recoveries of $8.9 million for the year ended December 31, 2015 compared to the same period in the prior year. These decreases were primarily a result of reduced headcount and lower recoveries in connection with the transition service agreement with Compass that terminated in April 2015. |
• | decreased capitalized salaries of $3.1 million and capitalized equity-based compensation of $2.1 million for the year ended December 31, 2015 compared to the same period in the prior year. These decreases were primarily a result of a reduction in employee headcount; and |
• | increased equity-based compensation of $0.2 million for the year ended December 31, 2015 compared to the same period in the prior year. The increase was primarily due to $3.2 million of additional compensation expense related to the warrants issued to ESAS in 2015. This was offset by lower equity-based compensation to employees as a result of the reductions in our workforce. |
Other operating items
Other operating items were net losses of $24.2 million, $0.5 million and $5.3 million for the years ended December 31, 2016, 2015 and 2014, respectively. The net loss for the year ended December 31, 2016 was primarily due to the settlement of the litigation with our joint venture partner in the Eagle Ford shale. See "Note 3. Acquisitions, divestitures and other significant
68
events" in the Notes to our Consolidated Financial Statements for additional information. The net loss for the year ended December 31, 2015 primarily consisted of legal expenses and other assessments partially offset by income from surface acreage that we own in the South Texas region. The net loss for the year ended December 31, 2014 primarily consisted of legal expenses.
Interest expense, net
The following table presents our interest expense for the years ended December 31, 2016, 2015 and 2014:
Year Ended December 31, | Year to year change | |||||||||||||||||||
(in thousands) | 2016 | 2015 | 2014 | 2016-2015 | 2015-2014 | |||||||||||||||
Interest expense, net: | ||||||||||||||||||||
2018 Notes | $ | 10,612 | $ | 50,381 | $ | 57,585 | $ | (39,769 | ) | $ | (7,204 | ) | ||||||||
2022 Notes | 12,294 | 38,338 | 30,104 | (26,044 | ) | 8,234 | ||||||||||||||
EXCO Resources Credit Agreement | 5,909 | 6,747 | 16,368 | (838 | ) | (9,621 | ) | |||||||||||||
Fairfax Term Loan | 37,611 | 6,764 | — | 30,847 | 6,764 | |||||||||||||||
Amortization of deferred financing costs | 8,989 | 15,729 | 7,939 | (6,740 | ) | 7,790 | ||||||||||||||
Capitalized interest | (5,213 | ) | (12,040 | ) | (20,060 | ) | 6,827 | 8,020 | ||||||||||||
Other | 236 | 163 | 2,348 | 73 | (2,185 | ) | ||||||||||||||
Total interest expense, net | $ | 70,438 | $ | 106,082 | $ | 94,284 | $ | (35,644 | ) | $ | 11,798 | |||||||||
Interest expense, net for the year ended December 31, 2016 decreased $35.6 million from 2015. Significant components of the changes in interest expense, net for the year ended December 31, 2016 compared to 2015 were a result of:
• | decreased interest expense due to lower outstanding balances on the 2018 Notes and 2022 Notes from debt restructuring activities and note repurchases in 2015 and 2016. |
• | decreased amortization of deferred financing costs primarily due to lower acceleration of deferred financing costs associated with the reductions in our borrowing base in 2016 as compared to 2015. |
• | increased interest expense from the 12.5% senior secured second lien term loan with certain affiliates of Fairfax in the aggregate principal amount of $300.0 million ("Fairfax Term Loan"), which closed in the fourth quarter of 2015; and |
• | decreased capitalized interest primarily related to lower balances of unproved oil and natural gas properties and suspension of our drilling and development program in certain areas. |
As discussed in more detail in "Note 5. Debt" in the Notes to our Consolidated Financial Statements, in the fourth quarter of 2015, we closed the Exchange Term Loan and used the proceeds to repurchase a portion of the outstanding 2018 Notes and 2022 Notes in exchange for the holders of such notes agreeing to act as lenders in connection with the Exchange Term Loan. The exchange was accounted for as a troubled debt restructuring pursuant to ASC 470-60. As such, all cash payments under the terms of the Exchange Term Loan, whether designated as interest or as principal amount, will reduce the carrying amount and no interest expense, in accordance with GAAP, will be recognized. This will result in a significantly lower interest expense than the contractual interest payments throughout the term of the Exchange Term Loan.
Interest expense, net for the year ended December 31, 2015 increased $11.8 million from the same period in 2014. Significant components of the changes in interest expense, net for the year ended December 31, 2015 compared to 2014 were a result of:
• | decreased interest expense on the 2018 Notes due to a lower outstanding balance resulting from debt restructuring and note repurchases in the fourth quarter of 2015. |
• | increased interest expense on the 2022 Notes as a result of the 2022 Notes only accruing a partial year's worth of interest in 2014. This was partially offset by the reduction in the outstanding balance as a result of our debt restructuring activities in the fourth quarter of 2015. |
• | decreased interest expense related to the EXCO Resources Credit Agreement due to a lower average outstanding balance in 2015 as compared to 2014 and due to the acceleration of the unamortized discount on the term loan under the EXCO Resources Credit Agreement upon repayment in April 2014. |
• | additional interest from the Fairfax Term Loan which closed in the fourth quarter of 2015. |
• | decreased interest expense related to the credit agreement with Compass as a result of the sale of our remaining interest in Compass in the fourth quarter of 2014. |
69
• | increased amortization of deferred financing costs primarily due to the acceleration of deferred financing costs of $8.7 million associated with the reductions in our borrowing base under the EXCO Resources Credit Agreement throughout 2015; and |
• | decreased capitalized interest primarily related to lower balances of unproved oil and natural gas properties. |
Gain (loss) on derivative financial instruments
Our oil and natural gas derivative financial instruments resulted in a net loss of $34.1 million, net gains of $75.9 million and $87.7 million for the years ended December 31, 2016, 2015 and 2014, respectively. Based on the nature of our derivative contracts, decreases in the related commodity price typically result in increases to the value of our derivatives contracts. The significant fluctuations demonstrate the high volatility in oil and natural gas prices between each of the periods. The ultimate settlement amount of the unrealized portion of the derivative financial instruments is dependent on future commodity prices.
The following table presents our natural gas prices, before and after the impact of the cash settlement of our derivative financial instruments.
Year Ended December 31, | Year to year change | |||||||||||||||||||
Average realized pricing: | 2016 | 2015 | 2014 | 2016-2015 | 2015-2014 | |||||||||||||||
Natural gas (per Mcf): | ||||||||||||||||||||
Net price, excluding derivatives | $ | 1.93 | $ | 2.06 | $ | 3.80 | $ | (0.13 | ) | $ | (1.74 | ) | ||||||||
Cash receipts (payments) on derivatives | 0.24 | 0.74 | (0.18 | ) | (0.50 | ) | 0.92 | |||||||||||||
Net price, including derivatives | $ | 2.17 | $ | 2.80 | $ | 3.62 | $ | (0.63 | ) | $ | (0.82 | ) | ||||||||
Oil (per Bbl): | ||||||||||||||||||||
Net price, excluding derivatives | $ | 38.05 | $ | 43.89 | $ | 87.80 | $ | (5.84 | ) | $ | (43.91 | ) | ||||||||
Cash receipts on derivatives | 9.24 | 20.12 | 1.09 | (10.88 | ) | 19.03 | ||||||||||||||
Net price, including derivatives | $ | 47.29 | $ | 64.01 | $ | 88.89 | $ | (16.72 | ) | $ | (24.88 | ) | ||||||||
Natural gas equivalent (per Mcfe): | ||||||||||||||||||||
Net price, excluding derivatives | $ | 2.38 | $ | 2.66 | $ | 4.87 | $ | (0.28 | ) | $ | (2.21 | ) | ||||||||
Cash receipts (payments) on derivatives | 0.37 | 1.04 | (0.14 | ) | (0.67 | ) | 1.18 | |||||||||||||
Net price, including derivatives | $ | 2.75 | $ | 3.70 | $ | 4.73 | $ | (0.95 | ) | $ | (1.03 | ) | ||||||||
Our total cash receipts for 2016 were $39.1 million, or $0.37 per Mcfe, compared to $128.8 million, or $1.04 per Mcfe, in 2015 and cash payments of $19.0 million, or $0.14 per Mcfe, in 2014. The differences between the cash receipts during 2016 and 2015 were primarily due to lower volumes hedged and lower strike prices during 2016. The differences between the cash receipts during 2015 and 2014 were primarily due to lower commodity prices in 2015.
Gain on restructuring and extinguishment of debt
For the year ended December 31, 2016, we recorded a net gain on extinguishment of debt of $119.5 million. The net gain was primarily due to the repurchases of an aggregate of $179.1 million in principal amount of the 2018 Notes and 2022 Notes with an aggregate of $53.3 million in cash through the Tender Offer and open market repurchases.
For the year ended December 31, 2015, we recorded a net gain of $193.3 million. We repurchased a portion of the outstanding 2018 Notes and 2022 Notes in exchange for the holders of such notes agreeing to act as lenders in connection with the Exchange Term Loan which resulted in a net gain of $165.1 million. Additionally, in the fourth quarter of 2015, we repurchased $40.8 million in principal of the 2018 Notes through open market repurchases with $12.0 million in cash resulting in a $28.2 million net gain on extinguishment of debt.
The net gains included an acceleration of the related deferred financing costs and notes discount, as well as direct costs associated with the transactions.
Equity income (loss)
Our equity income (loss) was a net loss of $16.4 million and $15.7 million and net income of $0.2 million for the years ended December 31, 2016, 2015 and 2014, respectively. Our equity loss for the year ended December 31, 2016 was primarily comprised of:
70
• | impairments of $9.6 million to our midstream investments in the Appalachia region and the East Texas and North Louisiana regions; |
• | an impairment of $1.7 million to our investment that serves as the operator and owns an interest in our Appalachia assets ("OPCO"); and |
• | net loss of $2.8 million for the year ended December 31, 2016 from our equity method investment that owns and manages certain surface acreage in the North Louisiana region primarily due to its impairment of certain assets. |
The impairments were recorded to reduce the carrying values to the fair values. For additional discussion of our impairments, see "Note 6. Fair value measurements" in the Notes to our Consolidated Financial Statements.
Our equity loss for the year ended December 31, 2015 was primarily due to other than temporary impairments of our midstream investments in the Appalachia region and the East Texas and North Louisiana regions. The impairments were recorded to reduce the carrying values to the fair values.
Income taxes
The following table presents a reconciliation of our income tax provision (benefit) for the years ended December 31, 2016, 2015 and 2014:
Year Ended December 31, | ||||||||||||
(in thousands) | 2016 | 2015 | 2014 | |||||||||
Federal income taxes (benefit) provision at statutory rate of 35% | $ | (77,860 | ) | $ | (417,333 | ) | $ | 42,234 | ||||
Increases (reductions) resulting from: | ||||||||||||
Adjustments to the valuation allowance | 83,264 | 459,843 | (64,757 | ) | ||||||||
Non-deductible compensation | 4,631 | 2,399 | 3,409 | |||||||||
State taxes net of federal benefit | (7,248 | ) | (45,009 | ) | 3,464 | |||||||
State tax rate change | — | — | 15,496 | |||||||||
Other | 15 | 100 | 154 | |||||||||
Total income tax provision | $ | 2,802 | $ | — | $ | — | ||||||
During the year ended December 31, 2016, we recognized deferred income tax expense of $2.8 million related to a deferred tax liability for tax deductible goodwill. During the year ended December 31, 2016, the book basis of goodwill exceeded the tax basis that caused the previous book and tax basis differences to change from a deferred tax asset to a deferred tax liability. The deferred tax liability related to goodwill is considered to have an indefinite life based on the nature of the underlying asset and cannot be offset under GAAP with a deferred tax asset with a definite life, such as NOLs. However, the deferred income tax expense is not expected to result in cash payments of income taxes in the foreseeable future.
During years ended 2015 and 2014, both federal and state income tax expense or tax benefit were reduced to zero by a corresponding increase or decrease to the valuation allowance previously recognized against net deferred tax assets. The net result was no income tax provision for years ended December 31, 2015 and 2014. The utilization of our NOLs to offset taxable income in future periods may be limited if we undergo an ownership change based on the criteria in Section 382 of the Internal Revenue Code. See further information as part of "Item 1A. Risk Factors - Our ability to use net operating loss carryovers to reduce future tax payments may be limited."
As of December 31, 2016, 2015 and 2014, there were no unrecognized tax benefits, including interest and penalties, that would be required to be recognized in our financial statements.
Our Liquidity, capital resources and capital commitments
Overview
Our primary sources of capital resources and Liquidity are internally generated cash flows from operations, borrowing capacity under the EXCO Resources Credit Agreement, dispositions of non-strategic assets, joint ventures and capital markets when conditions are favorable. Factors that could impact our Liquidity, capital resources and capital commitments include the following:
71
• | the level of planned drilling activities; |
• | the results of our ongoing drilling programs; |
• | our ability to fund, finance or repay indebtedness, including the EXCO Resources Credit Agreement and 2018 Notes that mature in July and September 2018, respectively; |
• | the integration of acquisitions of oil and natural gas properties or other assets; |
• | our ability to effectively manage operating, general and administrative expenses and capital expenditure programs; |
• | reduced oil and natural gas revenues resulting from, among other things, depressed oil and natural gas prices and lower production from reductions to our drilling and development activities; |
• | our ability to mitigate commodity price volatility with derivative financial instruments; |
• | our ability to meet minimum volume commitments under firm transportation agreements and other fixed commitments as well as our ability to restructure these contracts; |
• | potential acquisitions and/or dispositions of oil and natural gas properties or other assets, including the potential sale of our South Texas assets; |
• | limitations on our ability to incur certain types of indebtedness in accordance with our debt agreements; |
• | our ability to pay interest on our outstanding indebtedness, including decisions to pay interest on the 1.5 Lien Notes and 1.75 Lien Term Loans in cash, common shares or additional indebtedness; |
• | the outcome of the shareholder approval process to permit the issuance of common shares and exercisability of warrants in connection with the issuance and payment of interest on the 1.5 Lien Notes and 1.75 Lien Term Loans; |
• | reductions to our borrowing base; |
• | requirements to provide certain vendors and other parties with letters of credit as a result of our credit quality, which reduce the amount of available borrowings under the EXCO Resources Credit Agreement; |
• | additional debt restructuring activities including the repurchase of indebtedness or issuance of equity in exchange for indebtedness; |
• | our ability to maintain compliance with debt covenants; and |
• | the potential outcome of litigation related to certain natural gas sales and firm transportation contracts. |
Recent events affecting Liquidity
In response to the low commodity price environment during 2016, we limited our development activities to preserve our capital resources and Liquidity. In addition, we implemented further cost reduction initiatives to mitigate the impact of low commodity prices on our cash flows. We executed transactions to improve our capital structure and Liquidity as part of our comprehensive restructuring process, including the repurchase of additional indebtedness during 2016 and the issuance of 1.5 Lien Notes and 1.75 Lien Term Loans during 2017. During the year ended December 31, 2016, through the Tender Offer and a series of open market repurchases, we repurchased an aggregate of $26.4 million and $152.7 million in principal amount of the 2018 Notes and 2022 Notes, respectively, with an aggregate of $53.3 million in cash. As a result, we reduced the principal amounts outstanding under our 2018 Notes and 2022 Notes to $131.6 million and $70.2 million, respectively.
In March 2017, we closed a series of transactions that significantly improved our capital structure, including the issuance of $300.0 million in aggregate principal amount of 1.5 Lien Notes and the exchange of $682.8 million in aggregate principal amount of the Second Lien Term Loans for 1.75 Lien Term Loans. The transaction fees paid to the lenders included a combination of cash and warrants to purchase our common shares. The 1.5 Lien Notes and 1.75 Lien Term Loans provide us the option, subject to certain limitations, to pay interest in cash, common shares, or additional indebtedness. We will be permitted to pay interest on the 1.5 Lien Notes and 1.75 Lien Term Loans through the issuance of common shares or additional indebtedness, subject to certain restrictions, in our sole discretion through December 31, 2018. Thereafter, the amount of interest paid through the issuance of common shares or additional indebtedness may be limited if our liquidity, as defined in the agreements, is greater than certain thresholds. The amount of PIK Payments made in additional 1.5 Lien Notes or 1.75 Lien Term Loans is subject to incurrence covenants within our debt agreements that limit our aggregate secured indebtedness to $1.2 billion.
The proceeds from the issuance of the 1.5 Lien Notes were utilized to repay outstanding indebtedness under the EXCO Resources Credit Agreement. The EXCO Resources Credit Agreement was amended to reduce the borrowing base to $150.0 million, permit the issuance of the 1.5 Lien Notes and the exchanges of Second Lien Term Loans, and modify certain financial covenants. The next borrowing base redetermination for the EXCO Resources Credit Agreement is scheduled to occur on or around November 1, 2017. The lenders party to the EXCO Resources Credit Agreement have considerable discretion in setting our borrowing base, and we are unable to predict the outcome of any future redeterminations.
As a result of these transactions, our Liquidity improved from $66.4 million as of December 31, 2016 to $181.4 million on a pro forma basis as if the aforementioned transactions had occurred on December 31, 2016. The optionality for the method of interest payments on the 1.5 Lien Notes and 1.75 Lien Term Loans has the potential to reduce annual cash interest payments
72
by $109.3 million if we elect to pay interest through the issuance of common shares or additional indebtedness, subject to certain restrictions. See further discussion of these transactions as part of "Note 18. Subsequent Events" to the Notes to our Consolidated Financial Statements.
We plan to pursue additional transactions to improve our capital structure including the issuance of equity in exchange for indebtedness, repurchase of indebtedness, and potential divestitures including our properties in South Texas. In the event we divest our South Texas assets, we would not be able to request borrowings from the lenders under the EXCO Resources Credit Agreement that would result in their aggregate exposure to exceed $100.0 million, including letters of credit, until the next redetermination.
The following table presents information relating to our Liquidity and outstanding debt as of December 31, 2016 and on a pro forma basis as if the aforementioned transactions had occurred on December 31, 2016. The pro forma information is not considered to be complete and excludes impact of all other transactions subsequent to December 31, 2016:
(in thousands) | December 31, 2016 | Pro forma | ||||||
EXCO Resources Credit Agreement | $ | 228,592 | $ | — | ||||
1.5 Lien Notes | — | 300,000 | ||||||
1.75 Lien Term Loans | — | 682,754 | ||||||
Exchange Term Loan (1) | 400,000 | 17,246 | ||||||
Fairfax Term Loan | 300,000 | — | ||||||
2018 Notes (2) | 131,576 | 131,576 | ||||||
2022 Notes | 70,169 | 70,169 | ||||||
Total debt (3) | $ | 1,130,337 | $ | 1,201,745 | ||||
Net debt | $ | 1,110,119 | $ | 1,160,183 | ||||
Borrowing base (4) | $ | 285,000 | $ | 150,000 | ||||
Unused borrowing base (5) | $ | 46,222 | $ | 139,814 | ||||
Cash (6) | $ | 20,218 | $ | 41,562 | ||||
Unused borrowing base plus cash | $ | 66,440 | $ | 181,376 | ||||
(1) | Amount presented is the outstanding principal balance and excludes $190.5 million of deferred reductions to carrying value at December 31, 2016. See "Note 5. Debt" in the Notes to our Consolidated Financial Statements for additional information. |
(2) | Excludes unamortized discount of $0.5 million at December 31, 2016. |
(3) | Excludes unamortized deferred financing costs of $11.8 million at December 31, 2016. |
(4) | The borrowing base under the EXCO Resources Credit Agreement was $325.0 million as of December 31, 2016. We could not request borrowings from the lenders under the EXCO Resources Credit Agreement that would result in their aggregate exposure to exceed $285.0 million, including letters of credit, until the effective date of the next redetermination. Therefore, we incorporated the limitation on the aggregate exposure of the lenders to the borrowing base in the table above as it was more representative of our available borrowing capacity under the EXCO Resources Credit Agreement. On March 15, 2017, the EXCO Resources Credit Agreement was amended and the borrowing base was redetermined to $150.0 million in connection with the issuance of the 1.5 Lien Notes and the exchange of Second Lien Term Loans for 1.75 Lien Term Loans. |
(5) | Net of $10.2 million in letters of credit as of December 31, 2016. |
(6) | Includes restricted cash of $11.2 million at December 31, 2016. Pro forma cash was reduced by $13.1 million of cash paid to lenders under the 1.5 Lien Notes and 1.75 Lien Term Loans electing to receive cash in lieu of warrants, $12.0 million of estimated transaction fees and expenses associated with the financing transactions, and repayments of additional borrowings of $25.0 million under the EXCO Resources Credit Agreement subsequent to December 31, 2016. |
Credit agreements and long-term debt
As of December 31, 2016, our consolidated debt consisted of the EXCO Resources Credit Agreement, 2018 Notes, 2022 Notes and the Second Lien Term Loans. On March 15, 2017, we issued 1.5 Lien Notes and exchanged certain Second Lien Term Loans for 1.75 Lien Term Loans. See "Note 5. Debt" and "Note 18. Subsequent Events" in the Notes to our Consolidated Financial Statements for a further description of each agreement.
73
As of December 31, 2016, we were in compliance with the following financial covenants (each as defined in the EXCO Resources Credit Agreement):
• | our Consolidated Current Ratio of 1.03 to 1.0 exceeded the minimum of at least 1.0 to 1.0 as of the end of any fiscal quarter. The consolidated current assets utilized in this ratio include unused commitments under the EXCO Resources Credit Agreement. As of December 31, 2016, the unused commitments were based on the Company's borrowing base of $325.0 million; |
• | our ratio of consolidated EBITDAX to consolidated interest expense ("Interest Coverage Ratio"), of 1.47 to 1.0 exceeded the minimum of at least 1.25 to 1.0 as of the end of any fiscal quarter. The consolidated interest expense utilized in the Interest Coverage Ratio is calculated in accordance with GAAP; therefore, this excludes cash payments under the terms of the Exchange Term Loan, whether designated as interest or as principal amount, that reduce the carrying amount and are not recognized as interest expense. See further details on the accounting for the Exchange Term Loan in "Note 5. Debt" in the Notes to our Consolidated Financial Statements; and |
• | our ratio of senior secured indebtedness to consolidated EBITDAX ("Senior Secured Indebtedness Ratio") of 2.45 to 1.0 did not exceed the maximum of 2.5 to 1.0 as of the end of any fiscal quarter. Senior secured indebtedness utilized in the Senior Secured Indebtedness Ratio excludes the Second Lien Term Loans and any other indebtedness subordinated to the EXCO Resources Credit Agreement. |
On March 15, 2017, we amended the EXCO Resources Credit Agreement that included modifications to our financial covenants. The amended financial covenants include the following:
• | our cash (as defined in the credit agreement) plus unused commitments under the EXCO Resources Credit Agreement cannot be less than (i) $50.0 million as of the end of a fiscal month and (ii) $70.0 million as of the end of a fiscal quarter ("Minimum Liquidity Test"); |
• | our Interest Coverage Ratio must exceed a minimum of 1.75 to 1.0 for the fiscal quarter ending September 30, 2017 and 2.0 to 1.0 for fiscal quarters thereafter. The consolidated EBITDAX and consolidated interest expense utilized in this ratio are based on the most recent fiscal quarter ended multiplied by 4.0 as of September 30, 2017, the most recent two fiscal quarters ended multiplied by 2.0 as of December 31, 2017, the most recent three fiscal quarters ended multiplied by 4/3 as of March 31, 2018, and the trailing twelve month period for fiscal quarters ending thereafter. The definition of consolidated interest expense was modified to include cash interest payments that are accounted for as reductions in the carrying amount of indebtedness in accordance with FASB ASC 470-60. Consolidated interest expense is limited to payments in cash, and excludes payments in common shares or additional indebtedness on the 1.5 Lien Notes and 1.75 Lien Term Loans; and |
• | our ratio of aggregate revolving credit exposure to consolidated EBITDAX ("Aggregate Revolving Credit Exposure Ratio") cannot exceed 1.2 to 1.0 as of the end of any fiscal quarter. Aggregate revolving credit exposure utilized in the Aggregate Revolving Credit Exposure Ratio includes borrowings and letters of credit under the EXCO Resources Credit Agreement. |
In addition, the EXCO Resources Credit Agreement requires us to furnish our audited financial statements within 90 days after the fiscal year end without a going concern or like qualification. The requirement that such financial statements be delivered without a going concern qualification has been waived for financial statements relating to the 2016 fiscal year.
The payment of interest in common shares on the 1.5 Lien Notes and 1.75 Lien Term Loans is expected to improve our Liquidity and future cash flows. The exercisability of the warrants and our ability to pay interest in common shares is restricted until the requisite shareholder approval is obtained to permit the transactions. If we do not receive the requisite shareholder vote to approve the issuance of common shares in connection with the 1.5 Lien Notes and 1.75 Lien Term Loans, then we may be required to pay interest in cash that would further restrict our Liquidity and ability to comply with debt covenants.
The consolidated interest expense utilized in the Interest Coverage Ratio is limited to payments in cash, and excludes payments in common shares or additional indebtedness on the 1.5 Lien Notes and 1.75 Lien Term Loans. Therefore, the receipt of shareholder approval to pay interest through the issuance of common shares is integral to our ability to maintain compliance with this covenant. Furthermore, our ability to maintain compliance with the other financial covenants under the EXCO Resources Credit Agreement would be negatively impacted if we are not able to pay interest in common shares.
We intend to seek approval for these transactions through our annual meeting of shareholders or at a special meeting of shareholders called for such purpose within the period required by the 1.5 Lien Notes and 1.75 Lien Term Loans. The requisite shareholder approval to permit the issuance of common shares associated with the transactions requires the affirmative vote of a majority of the votes cast by the holders of our outstanding common shares. The requisite shareholder approval to amend its charter to increase the number of shares authorized for issuance or approval to execute a reverse stock split, without a proportionate reduction of authorized shares, at the discretion of the Board of Directors, requires that holders of at least two-
74
thirds of outstanding shares approve the proposal. However, we may waive the requirement within the 1.5 Lien Notes and 1.75 Lien Notes to obtain shareholder approval to amend our charter at our sole discretion. Certain of our related parties and members of our Board of Directors hold approximately 46% of the total common shares outstanding as of December 31, 2016. The issuance of the 1.5 Lien Notes and the exchange transactions involving the 1.75 Lien Term Loans were approved by a special committee of the Board of Directors consisting of the sole disinterested member of the Board of Directors. The Board of Directors authorized and approved the transactions based on the recommendation of the special committee. However, there is no assurance that the proposals will be approved. Therefore, the receipt of shareholder approval was deemed to be outside of our control in accordance with FASB ASC 205-40, Going Concern and our ability to pay interest in common shares was not factored into our analysis regarding our ability to continue as a going concern. As a result of the impact of the aforementioned factors on our financial results and condition, it is probable that we will not meet the minimum requirement under the Interest Coverage Ratio for the twelve-month period following the date of these Consolidated Financial Statements.
If we are not able to comply with our debt covenants or do not have sufficient Liquidity to conduct our business operations in future periods, we may be required, but unable, to refinance all or part of our existing debt, seek covenant relief from our lenders, sell assets, incur additional indebtedness, or issue equity on terms acceptable to us, if at all, and may be required to surrender assets pursuant to the security provisions of the EXCO Resources Credit Agreement. Therefore, our ability to continue our planned principal business operations would be dependent on the actions of our lenders or obtaining additional debt and/or equity financing to repay outstanding indebtedness under the EXCO Resources Credit Agreement. These factors raise substantial doubt about our ability to continue as a going concern.
If the requisite shareholder approval is obtained, we may elect to pay interest on the 1.5 Lien Notes and 1.75 Lien Term Loans in common shares at our sole discretion until December 31, 2018. If this occurs, our plans would be to pay interest on the 1.5 Lien Notes and 1.75 Lien Term Loans in common shares during this period and we would expect to have sufficient Liquidity and maintain compliance with our debt covenants for the twelve-month period following the date of these Consolidated Financial Statements. In addition, we are evaluating the potential divestiture of our assets in South Texas to further improve our Liquidity. There is no assurance any such transactions will occur.
The 1.5 Lien Notes, 1.75 Lien Term Loans and the indentures governing the 2018 Notes and 2022 Notes contain incurrence covenants that restrict our ability to incur additional indebtedness, incur liens to secure any such additional indebtedness or pledge assets. These incurrence covenants include limitations on our indebtedness that are based, in part, on the greater of a monetary threshold or the value of our assets. Our ability to incur additional indebtedness could be limited to the extent that low oil and natural gas prices negatively impact the value of our assets. See further details on the limitations on our ability to incur additional indebtedness as described in "Note 5. Debt" and "Note 18. Subsequent Events" in the Notes to our Consolidated Financial Statements.
Historical sources and uses of funds
Net increases (decreases) in cash are summarized as follows:
Year Ended December 31, | ||||||||||||
(in thousands) | 2016 | 2015 | 2014 | |||||||||
Net cash provided by (used in) operating activities | $ | (414 | ) | $ | 134,027 | $ | 362,093 | |||||
Net cash used in investing activities | (55,009 | ) | (300,833 | ) | (221,588 | ) | ||||||
Net cash provided by (used in) financing activities | 52,244 | 132,748 | (144,683 | ) | ||||||||
Net decrease in cash | $ | (3,179 | ) | $ | (34,058 | ) | $ | (4,178 | ) | |||
Operating activities
The primary factors impacting our cash flows from operating activities generally include: (i) levels of production from our oil and natural gas properties, (ii) prices we receive from sales of oil and natural gas production, including settlement proceeds or payments related to our oil and natural gas derivatives, (iii) operating costs of our oil and natural gas properties, (iv) costs of our general and administrative activities and (v) interest expense. Our cash flows from operating activities have historically been impacted by fluctuations in oil and natural gas prices and our production volumes.
75
For the year ended December 31, 2016, our net cash used in operating activities was $0.4 million as compared to net cash provided by operating activities of $134.0 million for the year ended December 31, 2015. The decrease was primarily attributable to lower revenues from decreased production and lower average oil and natural gas prices in 2016. In addition, the decrease was due to lower cash receipts on derivative contracts of $39.1 million for the year ended December 31, 2016 compared to $128.8 million for the year ended December 31, 2015. Working capital conversions contributed to a $35.3 million decrease in cash flows from operations for the year ended December 31, 2016, primarily due to the timing of collections of accounts receivable for oil and natural gas sales, and costs incurred for our development program in late 2015 that were paid in early 2016.
For the year ended December 31, 2015, our net cash provided by operating activities was $134.0 million as compared to $362.1 million for the year ended December 31, 2014. The decrease was primarily attributable to lower revenues from decreased production and lower average oil and natural gas prices. In addition, the decrease was due to changes in accounts payable resulting from lower advance billings to other working interest owners in the Eagle Ford shale as well as lower revenues payable to other owners. The decrease was partially offset by cash receipts of $128.8 million on derivative contracts for the year ended December 31, 2015 compared to cash payments of $19.0 million for the year ended December 31, 2014.
Investing activities
Our investing activities consist primarily of drilling and development expenditures, acquisitions and divestitures. Future acquisitions are dependent on oil and natural gas prices, availability of attractive acreage and other oil and natural gas properties, acceptable rates of return, availability of borrowing capacity under the EXCO Resources Credit Agreement and availability of other sources of capital.
For the year ended December 31, 2016, our net cash used in investing activities was $55.0 million that primarily consisted of $79.4 million of completion activities in the East Texas region and development activities in the North Louisiana region. This was partially offset by $14.3 million of proceeds received primarily from the sale of certain non-core undeveloped acreage in South Texas and our interests in four producing wells and the sale of our shallow conventional assets in Appalachia.
For the year ended December 31, 2015, our net cash used in investing activities was $300.8 million primarily due to our drilling and completion activities in the East Texas, North Louisiana and South Texas regions. The cash used in investing activities for the year ended December 31, 2015 included a significant amount of expenditures related to the wells drilled in 2014.
For the year ended December 31, 2014, our net cash used in investing activities was $221.6 million which consisted of $391.8 million of drilling and development activities in the North Louisiana, South Texas and East Texas regions. This was partially offset by $118.8 million of proceeds received from the sale of our interest in Compass and approximately $68.2 million of proceeds received from the sale of our interest in certain non-operated assets in the Permian Basin.
Financing activities
For the year ended December 31, 2016, our net cash provided by financing activities was $52.2 million primarily due to $161.1 million in net borrowings under the EXCO Resources Credit Agreement partially offset by payments of $50.7 million on the Exchange Term Loan, which reduced its carrying value, and an aggregate of $53.3 million of cash payments used to repurchase a portion of our 2018 Notes and 2022 Notes. On March 29, 2016, we borrowed our remaining unused commitments of $232.4 million under the EXCO Resources Credit Agreement to secure our Liquidity. Prior to the completion of the borrowing base redetermination process on March 29, 2016, we repaid the entire $232.4 million. The borrowing and subsequent repayment both occurred on the same day.
For the year ended December 31, 2015, our net cash provided by financing activities was $132.7 million primarily due to $300.0 million of proceeds received from the Fairfax Term Loan and $165.0 million in borrowings under the EXCO Resources Credit Agreement. We used the proceeds from the Fairfax Term Loan to repay the outstanding indebtedness under the EXCO Resources Credit Agreement. The issuance of the Exchange Term Loan and the related retirements of the 2018 and 2022 Notes were conducted simultaneously with the same creditors and did not impact our cash flows from financing activities. In addition, we used cash to pay $20.9 million of deferred financing costs primarily related to recent debt restructuring activities, repurchase a portion of the 2018 Notes for $12.0 million and a cash payment of $8.8 million that reduced the carrying value of the Exchange Term Loan.
For the year ended December 31, 2014, our net cash used in financing activities was $144.7 million primarily due to $859.9 million in net payments of outstanding indebtedness under the EXCO Resources Credit Agreement, $41.1 million of dividend payments and $10.3 million of deferred financing costs primarily related to issuance of the 2022 Notes. This was
76
offset by $500.0 million of gross proceeds received from issuance of the 2022 Notes and approximately $272.9 million of gross proceeds received from the Rights Offering.
Capital expenditures
During 2016, our capital expenditures, including oil and natural gas property acquisitions, totaled $79.4 million, of which $62.3 million was related to drilling and completion activities. Our development program during 2016 included an operated drilling rig for a portion of the year focused on the Haynesville shale in our core area in Desoto Parish, Louisiana, to drill and complete 6 gross (5.2 net) wells. The wells drilled in 2016 featured a modified Haynesville shale well design which included enhanced completion methods, including the use of more proppant and longer laterals. We also completed 8 gross (3.6 net) wells in the Haynesville and Bossier shales in the Shelby area of East Texas. Our cost reduction efforts have resulted in consistent decreases in our well costs over the past three years despite the use of enhanced drilling and completion techniques that attributed to improved well performance.
During 2015, our capital expenditures, including oil and natural gas property acquisitions, totaled $284.8 million, of which $228.5 million was related to drilling and development activities. Our development program during 2015 included an average of three operated drilling rigs focused primarily on the Haynesville and Bossier shales in the Shelby area of East Texas. Our development activities in North Louisiana during 2015 included limited drilling as well as completion activities in Caddo and DeSoto Parishes, Louisiana. Our development program in the South Texas region included an average of one operated drilling rig focused on the Eagle Ford shale and the Buda formation. Our capital expenditures in the South Texas region also included the leasing of acreage in Zavala County, Texas. As a result of the decline in oil prices, we suspended our drilling in the South Texas region in the fourth quarter of 2015. We drilled an appraisal well in the Marcellus shale in Northeast Pennsylvania which is expected to be turned-to-sales in 2017 as it is currently awaiting construction of a gathering line.
During 2014, our capital expenditures, including oil and natural gas property acquisitions, totaled $434.8 million, of which $356.3 million was related to drilling and development activities. Our development program during 2014 primarily focused on our properties in the Haynesville, Bossier and Eagle Ford shales. During 2014, we operated three to six operated drilling rigs in the Haynesville and Bossier shales focused on our core area in DeSoto Parish, Louisiana and the Shelby area of East Texas. Our capital expenditures in this region also included re-fracture stimulation treatments on 5 gross (2.8 net) mature Haynesville shale wells. Our development program in the Eagle Ford shale focused on our core area in Zavala County, Texas and limited drilling outside our core area as part of a farmout agreement. We operated two to five operated drilling rigs in South Texas during 2014. We also installed pumping units on 87 gross (45.6 net) wells in the region to optimize our production.
The following table presents our capital expenditures for the years ended December 31, 2016, 2015 and 2014.
Year Ended December 31, | ||||||||||||
(in thousands) | 2016 | 2015 | 2014 | |||||||||
Capital expenditures: | ||||||||||||
Lease purchases and seismic | $ | 767 | $ | 13,364 | $ | 10,477 | ||||||
Development capital expenditures | 62,328 | 228,545 | 356,344 | |||||||||
Field operations, gathering and water pipelines | 667 | 6,672 | 20,256 | |||||||||
Corporate and other | 14,637 | 28,602 | 37,198 | |||||||||
Total capital expenditures excluding oil and natural gas property acquisitions | 78,399 | 277,183 | 424,275 | |||||||||
Oil and natural gas property acquisitions | 1,031 | 7,608 | 10,562 | |||||||||
Total capital expenditures including oil and natural gas property acquisitions | $ | 79,430 | $ | 284,791 | $ | 434,837 | ||||||
2017 plans
Our drilling and completion activities during the first quarter of 2017 will focus on projects with the highest rates of return in our portfolio including the development of our Haynesville and Bossier shale assets. Our estimated capital expenditures for the first quarter of 2017 are $26.0 million, of which approximately $13.0 million is allocated to drilling and completion activities for operated wells in North Louisiana. The development program during the first quarter of 2017 will continue to build on the successful modifications to our well design, which includes drilling Haynesville shale wells with lateral lengths ranging from 4,500 feet to 7,500 feet and enhanced completions using an average of 3,500 lbs of proppant per lateral foot. The wells are located primarily in the Holly area of Desoto and Caddo parishes in North Louisiana. Our drilling and completion activities during the first quarter of 2017 also include the testing and development of our Bossier shale in North Louisiana using our enhanced completion methods. The wells drilled during the first quarter of 2017 are expected to be turned-
77
to-sales in the second and third quarter of 2017. We are currently incorporating the impact of the recent financing transactions into our development plans for the remainder of 2017.
Derivative financial instruments
Our production is generally sold at prevailing market prices. However, we periodically enter into oil and natural gas derivative contracts for a portion of our production to mitigate the impact of commodity price fluctuations and achieve a more predictable cash flow associated with our operations. These transactions limit our exposure to declines in prices, but also limit the benefits we would realize if oil and natural gas prices increase.
Our derivative financial instruments are comprised of oil and natural gas swap and collar contracts. As of December 31, 2016, we had derivative financial instruments in place for the volumes and prices shown below:
NYMEX gas volume - Bbtu | Weighted average contract price per Mmbtu | NYMEX oil volume - Mbbl | Weighted average contract price per Bbl | |||||||||||
Swaps: | ||||||||||||||
2017 | 38,300 | $ | 3.02 | 183 | $ | 50.00 | ||||||||
2018 | 3,650 | 3.15 | — | — | ||||||||||
Collars: | ||||||||||||||
2017 | 10,950 | — | ||||||||||||
Sold call | $ | 3.28 | $ | — | ||||||||||
Purchased put | 2.87 | — | ||||||||||||
See further details on our derivative financial instruments in "Note 4. Derivative financial instruments" and "Note 6. Fair value measurements" in the Notes to our Consolidated Financial Statements.
Off-balance sheet arrangements
As of December 31, 2016, we had no arrangements or any guarantees of off-balance sheet debt to third parties.
Contractual obligations and commercial commitments
The following table presents our contractual obligations and commercial commitments as of December 31, 2016 and does not include those of our equity method investments. Subsequent to December 31, 2016, we closed a series of transactions including the issuance of 1.5 Lien Notes and exchanges of Second Lien Term Loans for 1.75 Lien Term Loans. These transactions are described in detail in "Note 18. Subsequent events" in the Notes to our Consolidated Financial Statements.
Payments due by period | ||||||||||||||||||||
(in thousands) | Less than one year | One to three years | Three to five years | More than five years | Total | |||||||||||||||
EXCO Resources Credit Agreement (1) | $ | — | $ | 228,592 | $ | — | $ | — | $ | 228,592 | ||||||||||
Senior Notes (2) | — | 131,576 | — | 70,169 | 201,745 | |||||||||||||||
Exchange Term Loan (3) | — | — | 400,000 | — | 400,000 | |||||||||||||||
Fairfax Term Loan (4) | — | — | 300,000 | — | 300,000 | |||||||||||||||
Gathering and firm transportation services (5) | 117,348 | 187,176 | 78,709 | 127,750 | 510,983 | |||||||||||||||
Other fixed commitments (6) | 4,557 | 5,637 | 3,550 | — | 13,744 | |||||||||||||||
Drilling contracts (7) | 10,050 | — | — | — | 10,050 | |||||||||||||||
Operating leases and other | 4,923 | 6,956 | 1,538 | — | 13,417 | |||||||||||||||
Total contractual obligations | $ | 136,878 | $ | 559,937 | $ | 783,797 | $ | 197,919 | $ | 1,678,531 | ||||||||||
(1) | The EXCO Resources Credit Agreement matures on July 31, 2018. The interest rate grid on the revolving credit facility of the EXCO Resources Credit Agreement ranges from LIBOR plus 225 bps to 325 bps (or ABR plus 125 bps to 225 bps), depending on the percentages of drawn balances to the borrowing base. |
(2) | The 2018 Notes are due on September 15, 2018 and the 2022 Notes are due on April 15, 2022. Based on the outstanding principal balance at December 31, 2016, the annual interest obligation on the 2018 Notes and 2022 Notes is $9.9 million and $6.0 million, respectively. |
78
(3) | The Exchange Term Loan matures on October 26, 2020. The amount presented in the table above is the principal balance outstanding. The annual cash payment on the Exchange Term Loan is $50.0 million based on the interest rate of 12.5% per annum. See "Note 5. Debt" in the Notes to our Consolidated Financial Statements for additional information and the accounting treatment of the Exchange Term Loan. |
(4) | The Fairfax Term Loan matures on October 26, 2020. The annual interest obligation is $37.5 million. |
(5) | Gathering and firm transportation services reflect contracts whereby EXCO commits to transport a minimum quantity of natural gas on a gatherer's system or a shippers’ pipeline. Whether or not EXCO delivers the minimum quantity, we pay the fees as if the quantities were delivered. These expenses represent our gross commitments under these contracts and a portion of these costs will be incurred by working interest and other owners. As described in "Note 2. Summary of significant accounting policies" in the Notes to our Consolidated Financial Statements, we report these costs as gathering and transportation expenses or as a reduction in total sales price received from the purchaser. In addition, our variable rate gathering and firm transportation contracts do not have a minimum volume commitment and are not included in the table above. As such, our gathering and firm transportation services presented in the table above may not be representative of the amounts reported as gathering and transportation expenses in our Consolidated Financial Statements. |
During the third quarter of 2016, we terminated our sales and transportation contracts with Enterprise and Acadian, respectively. The termination of these contracts is currently subject to litigation. See "Note 8. Commitments and contingencies" in the Notes to our Consolidated Financial Statements for additional information.
(6) | Other fixed commitments are primarily related to minimum sales commitments under marketing contracts. |
(7) | Drilling contracts represent the contractual rate for our operated rigs through the term of the contracts as of December 31, 2016. The actual drilling costs under these contracts will be incurred by working interest owners in the development of the related properties. |
Item 7A. Quantitative and Qualitative Disclosures About Market Risk
Some of the information below contains forward-looking statements. The primary objective of the following information is to provide forward-looking quantitative and qualitative information about our potential exposure to market risks. The term “market risk” refers to the risk of loss arising from adverse changes in oil and natural gas prices, interest rates charged on borrowings and earned on cash equivalent investments, and adverse changes in the market value of marketable securities. The disclosure is not meant to be a precise indicator of expected future losses, but rather an indicator of reasonably possible losses. This forward-looking information provides an indicator of how we view and manage our ongoing market risk exposures. Our market risk sensitive instruments were entered into for hedging and investment purposes, not for trading purposes.
Commodity price risk
Our objective in entering into derivative financial instruments is to manage our exposure to commodity price fluctuations, protect our returns on investments, and achieve a more predictable cash flow in connection with our financing activities and borrowings related to these activities. These transactions limit exposure to declines in prices, but also limit the benefits we would realize if oil and natural gas prices increase. When prices for oil and natural gas are volatile, a significant portion of the effect of our derivative financial instrument management activities consists of non-cash income or expense due to changes in the fair value of our derivative financial instrument contracts. Cash losses or gains only arise from payments made or received on monthly settlements of contracts or if we terminate a contract prior to its expiration. Our credit rating and financial condition may restrict our ability to enter into certain types of derivative financial instruments and limit the maturity of the contracts with counterparties. We have historically entered into derivative financial instruments with the financial institutions that are lenders under the EXCO Resources Credit Agreement. Therefore, our ability to enter into derivative financial instruments may be limited beyond the maturity of the EXCO Resources Credit Agreement in July 2018. We are currently evaluating alternatives to enter into derivative financial instruments beyond this date, which may include counterparties that are not lenders under the EXCO Resources Credit Agreement. These alternatives may include agreements with counterparties on a secured or unsecured basis. If we enter into derivative financial instruments that require us to post collateral, this could further constrain our liquidity.
Our most significant market risk exposure is in the pricing applicable to our oil and natural gas production. Realized pricing is primarily driven by the prevailing worldwide price for crude oil and spot market prices for natural gas. Pricing for oil and natural gas production is volatile.
Our use of derivative financial instruments could have the effect of reducing our revenues and the value of our securities. For the year ended December 31, 2016, a $1.00 increase in the average commodity price per Mcfe would have resulted in an increase in cash settlement payments (or a decrease in settlements received) of approximately $60.0 million for our oil and natural gas swap contracts. The ultimate settlement amount of our outstanding derivative financial instrument contracts is
79
dependent on future commodity prices. We may incur significant unrealized losses in the future from our use of derivative financial instruments to the extent market prices increase and our derivatives contracts remain in place.
Interest rate risk
At December 31, 2016, our exposure to interest rate changes related primarily to borrowings under the EXCO Resources Credit Agreement. The interest rates per annum on the 2018 Notes, 2022 Notes and the Second Lien Term Loans are fixed at 7.5%, 8.5% and 12.5%, respectively. Interest is payable on borrowings under the EXCO Resources Credit Agreement based on a floating rate as more fully described in "Note 5. Debt" in the Notes to our Consolidated Financial Statements. At December 31, 2016, we had approximately $228.6 million in outstanding borrowings under the EXCO Resources Credit Agreement. A 1% increase in interest rates (100 bps) based on the variable borrowings as of December 31, 2016 would result in an increase in our interest expense of approximately $2.3 million per year. The interest we pay on these borrowings is set periodically based upon market rates. Subsequent to December 31, 2016 and concurrently with the closing of the 1.5 Lien Notes, we repaid the entire amount outstanding under the EXCO Resources Credit Agreement.
80
Item 8. | Financial Statements and Supplementary Data |
EXCO Resources, Inc.
Index to Consolidated Financial Statements
Contents
81
Management's Report on Internal Control Over Financial Reporting
To the Board of Directors and Shareholders of
EXCO Resources, Inc.:
Management is responsible for establishing and maintaining adequate internal control over financial reporting (as defined in Rule 13a-15(f) under the Securities Exchange Act of 1934, as amended). Our internal control over financial reporting is designed to provide reasonable assurance to management and our Board of Directors regarding the preparation and fair presentation of published financial statements. Because of its inherent limitations, internal control over financial reporting may not prevent or detect misstatements. Therefore, even those systems determined to be effective can provide only reasonable assurance with respect to financial statement preparation and presentation. Management assessed the effectiveness of our internal control over financial reporting as of December 31, 2016. In making this assessment, management used the criteria set forth by the Committee of Sponsoring Organizations of the Treadway Commission ("COSO") in Internal Control-Integrated Framework (2013). Based on management's assessment, management believes that, as of December 31, 2016, our internal control over financial reporting was effective based on those criteria.
The effectiveness of EXCO Resources, Inc.'s internal control over financial reporting as of December 31, 2016 has been audited by KPMG LLP, an independent registered public accounting firm, as stated in their report which appears herein.
By: | /s/ Harold L. Hickey | By: | /s/ Tyler Farquharson | |
Title: | Chief Executive Officer and President | Title: | Vice President, Chief Financial Officer and Treasurer | |
Dallas, Texas | ||||
March 16, 2017 | ||||
82
Report of Independent Registered Public Accounting Firm
The Board of Directors and Shareholders
EXCO Resources, Inc.:
We have audited the accompanying consolidated balance sheets of EXCO Resources, Inc. and subsidiaries as of December 31, 2016 and 2015, and the related consolidated statements of operations, cash flows, and changes in shareholders’ equity for each of the years in the three-year period ended December 31, 2016. We also have audited EXCO Resources, Inc.’s internal control over financial reporting as of December 31, 2016, based on criteria established in Internal Control - Integrated Framework (2013) issued by the Committee of Sponsoring Organizations of the Treadway Commission (COSO). EXCO Resources, Inc.’s management is responsible for these consolidated financial statements, for maintaining effective internal control over financial reporting, and for its assessment of the effectiveness of internal control over financial reporting, included in the accompanying Management’s Report on Internal Control Over Financial Reporting. Our responsibility is to express an opinion on these consolidated financial statements and an opinion on the Company’s internal control over financial reporting based on our audits.
We conducted our audits in accordance with the standards of the Public Company Accounting Oversight Board (United States). Those standards require that we plan and perform the audits to obtain reasonable assurance about whether the financial statements are free of material misstatement and whether effective internal control over financial reporting was maintained in all material respects. Our audits of the consolidated financial statements included examining, on a test basis, evidence supporting the amounts and disclosures in the financial statements, assessing the accounting principles used and significant estimates made by management, and evaluating the overall financial statement presentation. Our audit of internal control over financial reporting included obtaining an understanding of internal control over financial reporting, assessing the risk that a material weakness exists, and testing and evaluating the design and operating effectiveness of internal control based on the assessed risk. Our audits also included performing such other procedures as we considered necessary in the circumstances. We believe that our audits provide a reasonable basis for our opinions.
A company’s internal control over financial reporting is a process designed to provide reasonable assurance regarding the reliability of financial reporting and the preparation of financial statements for external purposes in accordance with generally accepted accounting principles. A company’s internal control over financial reporting includes those policies and procedures that (1) pertain to the maintenance of records that, in reasonable detail, accurately and fairly reflect the transactions and dispositions of the assets of the company; (2) provide reasonable assurance that transactions are recorded as necessary to permit preparation of financial statements in accordance with generally accepted accounting principles, and that receipts and expenditures of the company are being made only in accordance with authorizations of management and directors of the company; and (3) provide reasonable assurance regarding prevention or timely detection of unauthorized acquisition, use, or disposition of the company’s assets that could have a material effect on the financial statements.
Because of its inherent limitations, internal control over financial reporting may not prevent or detect misstatements. Also, projections of any evaluation of effectiveness to future periods are subject to the risk that controls may become inadequate because of changes in conditions, or that the degree of compliance with the policies or procedures may deteriorate.
In our opinion, the consolidated financial statements referred to above present fairly, in all material respects, the financial position of EXCO Resources, Inc. and subsidiaries as of December 31, 2016 and 2015, and the results of its operations and its cash flows for each of the years in the three-year period ended December 31, 2016, in conformity with U.S. generally accepted accounting principles. Also in our opinion, EXCO Resources, Inc. maintained, in all material respects, effective internal control over financial reporting as of December 31, 2016, based on criteria established in Internal Control - Integrated Framework (2013) issued by the Committee of Sponsoring Organizations of the Treadway Commission
The accompanying consolidated financial statements have been prepared assuming that the Company will continue as a going concern. As discussed in Note 1 to the consolidated financial statements, probable failure to comply with a financial covenant in its credit facility as well as significant liquidity needs, raise substantial doubt about its ability to continue as a going concern. Management’s plans in regard to these matters are also described in Note 1. The consolidated financial statements do not include any adjustments that might result from the outcome of this uncertainty.
/s/ KPMG LLP
Dallas, Texas
March 16, 2017
83
EXCO RESOURCES, INC.
CONSOLIDATED BALANCE SHEETS
(in thousands) | December 31, 2016 | December 31, 2015 | ||||||
Assets | ||||||||
Current assets: | ||||||||
Cash and cash equivalents | $ | 9,068 | $ | 12,247 | ||||
Restricted cash | 11,150 | 21,220 | ||||||
Accounts receivable, net: | ||||||||
Oil and natural gas | 52,674 | 37,236 | ||||||
Joint interest | 25,905 | 22,095 | ||||||
Other | 3,813 | 8,894 | ||||||
Derivative financial instruments | — | 39,499 | ||||||
Inventory and other | 8,007 | 8,610 | ||||||
Total current assets | 110,617 | 149,801 | ||||||
Equity investments | 24,365 | 40,797 | ||||||
Oil and natural gas properties (full cost accounting method): | ||||||||
Unproved oil and natural gas properties and development costs not being amortized | 97,080 | 115,377 | ||||||
Proved developed and undeveloped oil and natural gas properties | 2,939,923 | 3,070,430 | ||||||
Accumulated depletion | (2,702,245 | ) | (2,627,763 | ) | ||||
Oil and natural gas properties, net | 334,758 | 558,044 | ||||||
Other property and equipment, net | 23,661 | 27,812 | ||||||
Deferred financing costs, net | 4,376 | 8,408 | ||||||
Derivative financial instruments | 482 | 6,109 | ||||||
Goodwill | 163,155 | 163,155 | ||||||
Total assets | $ | 661,414 | $ | 954,126 | ||||
Liabilities and shareholders’ equity | ||||||||
Current liabilities: | ||||||||
Accounts payable and accrued liabilities | $ | 54,762 | $ | 88,049 | ||||
Revenues and royalties payable | 120,845 | 106,163 | ||||||
Accrued interest payable | 4,701 | 7,846 | ||||||
Current portion of asset retirement obligations | 344 | 845 | ||||||
Income taxes payable | — | — | ||||||
Derivative financial instruments | 27,711 | 16 | ||||||
Current portion of long-term debt | 50,000 | 50,000 | ||||||
Total current liabilities | 258,363 | 252,919 | ||||||
Long-term debt | 1,258,538 | 1,320,279 | ||||||
Deferred income taxes | 2,802 | — | ||||||
Derivative financial instruments | 464 | — | ||||||
Asset retirement obligations and other long-term liabilities | 13,153 | 43,251 | ||||||
Commitments and contingencies | — | — | ||||||
Shareholders’ equity: | ||||||||
Common shares, $0.001 par value; 780,000,000 authorized shares; 283,568,268 shares issued and 282,973,605 shares outstanding at December 31, 2016; 283,633,996 shares issued and 283,039,333 shares outstanding at December 31, 2015 | 284 | 276 | ||||||
Additional paid-in capital | 3,537,815 | 3,522,153 | ||||||
Accumulated deficit | (4,402,373 | ) | (4,177,120 | ) | ||||
Treasury shares, at cost; 594,663 at December 31, 2016 and 2015 | (7,632 | ) | (7,632 | ) | ||||
Total shareholders’ equity | (871,906 | ) | (662,323 | ) | ||||
Total liabilities and shareholders’ equity | $ | 661,414 | $ | 954,126 | ||||
See accompanying notes.
84
EXCO RESOURCES, INC.
CONSOLIDATED STATEMENTS OF OPERATIONS
Year Ended December 31, | ||||||||||||
(in thousands, except per share data) | 2016 | 2015 | 2014 | |||||||||
Revenues: | ||||||||||||
Oil | $ | 67,317 | $ | 102,787 | $ | 196,316 | ||||||
Natural gas | 181,332 | 226,471 | 464,668 | |||||||||
Purchased natural gas and marketing | 22,352 | 26,442 | 34,933 | |||||||||
Total revenues | 271,001 | 355,700 | 695,917 | |||||||||
Costs and expenses: | ||||||||||||
Oil and natural gas operating costs | 34,609 | 53,903 | 64,467 | |||||||||
Production and ad valorem taxes | 15,380 | 22,630 | 29,859 | |||||||||
Gathering and transportation | 106,460 | 99,321 | 101,574 | |||||||||
Purchased natural gas | 23,557 | 27,369 | 35,648 | |||||||||
Depletion, depreciation and amortization | 75,982 | 215,426 | 263,569 | |||||||||
Impairment of oil and natural gas properties | 160,813 | 1,215,370 | — | |||||||||
Accretion of discount on asset retirement obligations | 2,210 | 2,277 | 2,690 | |||||||||
General and administrative | 48,700 | 58,818 | 65,920 | |||||||||
Other operating items | 24,239 | 461 | 5,315 | |||||||||
Total costs and expenses | 491,950 | 1,695,575 | 569,042 | |||||||||
Operating income (loss) | (220,949 | ) | (1,339,875 | ) | 126,875 | |||||||
Other income (expense): | ||||||||||||
Interest expense, net | (70,438 | ) | (106,082 | ) | (94,284 | ) | ||||||
Gain (loss) on derivative financial instruments | (34,137 | ) | 75,869 | 87,665 | ||||||||
Gain on restructuring and extinguishment of debt | 119,457 | 193,276 | — | |||||||||
Other income | 43 | 122 | 241 | |||||||||
Equity income (loss) | (16,432 | ) | (15,691 | ) | 172 | |||||||
Total other income (expense) | (1,507 | ) | 147,494 | (6,206 | ) | |||||||
Income (loss) before income taxes | (222,456 | ) | (1,192,381 | ) | 120,669 | |||||||
Income tax expense | 2,802 | — | — | |||||||||
Net income (loss) | $ | (225,258 | ) | $ | (1,192,381 | ) | $ | 120,669 | ||||
Earnings (loss) per common share: | ||||||||||||
Basic: | ||||||||||||
Net income (loss) | $ | (0.81 | ) | $ | (4.36 | ) | $ | 0.45 | ||||
Weighted average common shares outstanding | 279,287 | 273,621 | 268,258 | |||||||||
Diluted: | ||||||||||||
Net income (loss) | $ | (0.81 | ) | $ | (4.36 | ) | $ | 0.45 | ||||
Weighted average common shares and common share equivalents outstanding | 279,287 | 273,621 | 268,376 | |||||||||
See accompanying notes.
85
EXCO RESOURCES, INC.
CONSOLIDATED STATEMENTS OF CASH FLOWS
Year Ended December 31, | ||||||||||||
(in thousands) | 2016 | 2015 | 2014 | |||||||||
Operating Activities: | ||||||||||||
Net income (loss) | $ | (225,258 | ) | $ | (1,192,381 | ) | $ | 120,669 | ||||
Adjustments to reconcile net income (loss) to net cash provided by (used in) operating activities: | ||||||||||||
Deferred income tax expense | 2,802 | — | — | |||||||||
Depletion, depreciation and amortization | 75,982 | 215,426 | 263,569 | |||||||||
Equity-based compensation expense | 14,778 | 7,198 | 4,962 | |||||||||
Accretion of discount on asset retirement obligations | 2,210 | 2,277 | 2,690 | |||||||||
Impairment of oil and natural gas properties | 160,813 | 1,215,370 | — | |||||||||
(Income) loss from equity investments | 16,432 | 15,691 | (172 | ) | ||||||||
(Gain) loss on derivative financial instruments | 34,137 | (75,869 | ) | (87,665 | ) | |||||||
Cash receipts (payments) of derivative financial instruments | 39,149 | 128,800 | (18,991 | ) | ||||||||
Amortization of deferred financing costs and discount on debt issuance | 9,256 | 16,994 | 12,055 | |||||||||
Other non-operating items | 24,073 | (32 | ) | (17 | ) | |||||||
Gain on restructuring and extinguishment of debt | (119,457 | ) | (193,276 | ) | — | |||||||
Effect of changes in: | ||||||||||||
Restricted cash with related party | 2,100 | (2,100 | ) | — | ||||||||
Accounts receivable | (19,763 | ) | 88,610 | 52,007 | ||||||||
Other current assets | (1,716 | ) | 434 | (2,609 | ) | |||||||
Accounts payable and other current liabilities | (15,952 | ) | (93,115 | ) | 15,595 | |||||||
Net cash provided by (used in) operating activities | (414 | ) | 134,027 | 362,093 | ||||||||
Investing Activities: | ||||||||||||
Additions to oil and natural gas properties, gathering assets and equipment | (79,393 | ) | (317,590 | ) | (391,776 | ) | ||||||
Property acquisitions | (1,032 | ) | (7,608 | ) | (10,790 | ) | ||||||
Proceeds from disposition of property and equipment | 14,349 | 7,397 | 187,655 | |||||||||
Restricted cash | 7,970 | 4,850 | (3,400 | ) | ||||||||
Net changes in advances to joint ventures | 3,097 | 10,663 | (5,026 | ) | ||||||||
Equity investments and other | — | 1,455 | 1,749 | |||||||||
Net cash used in investing activities | (55,009 | ) | (300,833 | ) | (221,588 | ) | ||||||
Financing Activities: | ||||||||||||
Borrowings under credit agreements | 404,897 | 165,000 | 100,000 | |||||||||
Repayments under credit agreements | (243,797 | ) | (300,000 | ) | (964,970 | ) | ||||||
Proceeds received from issuance of 2022 Notes | — | — | 500,000 | |||||||||
Repurchases of senior unsecured notes | (53,298 | ) | (12,008 | ) | — | |||||||
Proceeds received from issuance of Fairfax Term Loan | — | 300,000 | — | |||||||||
Payments on Exchange Term Loan | (50,695 | ) | (8,827 | ) | — | |||||||
Proceeds from issuance of common shares, net | — | 9,693 | 271,773 | |||||||||
Payments of common share dividends | (91 | ) | (164 | ) | (41,060 | ) | ||||||
Deferred financing costs and other | (4,772 | ) | (20,946 | ) | (10,426 | ) | ||||||
Net cash provided by (used in) financing activities | 52,244 | 132,748 | (144,683 | ) | ||||||||
Net decrease in cash | (3,179 | ) | (34,058 | ) | (4,178 | ) | ||||||
Cash at beginning of period | 12,247 | 46,305 | 50,483 | |||||||||
Cash at end of period | $ | 9,068 | $ | 12,247 | $ | 46,305 | ||||||
Supplemental Cash Flow Information: | ||||||||||||
Cash interest payments | $ | 68,134 | $ | 117,463 | $ | 91,735 | ||||||
Income tax payments | — | — | — | |||||||||
Supplemental non-cash investing and financing activities: | ||||||||||||
Capitalized equity-based compensation | $ | 752 | $ | 3,428 | $ | 5,498 | ||||||
Capitalized interest | 5,213 | 12,040 | 20,060 | |||||||||
Debt eliminated upon sale of Compass | — | — | (83,246 | ) | ||||||||
See accompanying notes.
86
EXCO RESOURCES, INC.
CONSOLIDATED STATEMENTS OF CHANGES IN SHAREHOLDERS’ EQUITY
Common Shares | Subscription Rights | Treasury Shares | Additional paid-in capital | Accumulated deficit | Total shareholders’ equity | ||||||||||||||||||||||||||||
(in thousands) | Shares | Amount | Shares | Amount | Shares | Amount | |||||||||||||||||||||||||||
Balance at December 31, 2013 | 218,783 | $ | 215 | 54,575 | $ | 55 | (539 | ) | $ | (7,479 | ) | $ | 3,219,748 | $ | (3,064,634 | ) | $ | 147,905 | |||||||||||||||
Issuance of common shares | 54,582 | 55 | (54,575 | ) | (55 | ) | — | — | 272,008 | — | 272,008 | ||||||||||||||||||||||
Equity-based compensation | — | — | — | — | — | — | 10,453 | — | 10,453 | ||||||||||||||||||||||||
Restricted shares issued, net of cancellations | 987 | — | — | — | — | — | — | — | — | ||||||||||||||||||||||||
Common share dividends | — | — | — | — | — | — | — | (40,895 | ) | (40,895 | ) | ||||||||||||||||||||||
Treasury share repurchases | — | — | — | — | (39 | ) | (136 | ) | — | — | (136 | ) | |||||||||||||||||||||
Net income | — | — | — | — | — | — | — | 120,669 | 120,669 | ||||||||||||||||||||||||
Balance at December 31, 2014 | 274,352 | $ | 270 | — | $ | — | (578 | ) | $ | (7,615 | ) | $ | 3,502,209 | $ | (2,984,860 | ) | $ | 510,004 | |||||||||||||||
Issuance of common shares | 5,882 | 6 | — | — | — | — | 9,838 | — | 9,844 | ||||||||||||||||||||||||
Equity-based compensation | — | — | — | — | — | — | 10,106 | — | 10,106 | ||||||||||||||||||||||||
Restricted shares issued, net of cancellations | 3,400 | — | — | — | — | — | — | — | — | ||||||||||||||||||||||||
Common share dividends | — | — | — | — | — | — | — | 121 | 121 | ||||||||||||||||||||||||
Treasury share repurchases | — | — | — | — | (17 | ) | (17 | ) | — | — | (17 | ) | |||||||||||||||||||||
Net loss | — | — | — | — | — | — | — | (1,192,381 | ) | (1,192,381 | ) | ||||||||||||||||||||||
Balance at December 31, 2015 | 283,634 | $ | 276 | — | $ | — | (595 | ) | $ | (7,632 | ) | $ | 3,522,153 | $ | (4,177,120 | ) | $ | (662,323 | ) | ||||||||||||||
Issuance of common shares | 243 | — | — | — | — | — | — | — | — | ||||||||||||||||||||||||
Equity-based compensation | — | — | — | — | — | — | 15,662 | — | 15,662 | ||||||||||||||||||||||||
Restricted shares issued, net of cancellations | (309 | ) | 8 | — | — | — | — | — | — | 8 | |||||||||||||||||||||||
Common share dividends | — | — | — | — | — | — | — | 5 | 5 | ||||||||||||||||||||||||
Treasury share repurchases | — | — | — | — | — | — | — | — | — | ||||||||||||||||||||||||
Net loss | — | — | — | — | — | — | — | (225,258 | ) | (225,258 | ) | ||||||||||||||||||||||
Balance at December 31, 2016 | 283,568 | $ | 284 | — | $ | — | (595 | ) | $ | (7,632 | ) | $ | 3,537,815 | $ | (4,402,373 | ) | $ | (871,906 | ) | ||||||||||||||
See accompanying notes.
87
EXCO RESOURCES, INC.
NOTES TO CONSOLIDATED FINANCIAL STATEMENTS
1. | Organization and basis of presentation |
Unless the context requires otherwise, references in this Annual Report on Form 10-K to “EXCO,” “EXCO Resources,” “Company,” “we,” “us,” and “our” are to EXCO Resources, Inc. and its consolidated subsidiaries.
We are an independent oil and natural gas company engaged in the exploration, exploitation, acquisition, development and production of onshore U.S. oil and natural gas properties with a focus on shale resource plays. Our principal operations are conducted in certain key U.S. oil and natural gas areas including Texas, Louisiana and the Appalachia region. The following is a brief discussion of our producing regions.
•East Texas and North Louisiana
The East Texas and North Louisiana regions are primarily comprised of our Haynesville and Bossier shale assets. We have a joint venture with a wholly owned subsidiary of Royal Dutch Shell, plc, ("Shell") covering an undivided 50% interest in the majority of our Haynesville and Bossier shale assets in East Texas and North Louisiana. The East Texas and North Louisiana regions also include certain assets outside of the joint venture in the Haynesville and Bossier shales. We serve as the operator for most of our properties in the East Texas and North Louisiana regions.
•South Texas
The South Texas region is primarily comprised of our Eagle Ford shale assets. We serve as the operator for most of our properties in the South Texas region. We are currently evaluating the potential divestiture of our properties in South Texas; however, no assurance can be given as to outcome or timing of such transaction.
•Appalachia
The Appalachia region is primarily comprised of Marcellus shale assets following the divestitures of substantially all of our shallow conventional assets during 2016. We have a joint venture with Shell covering our Marcellus shale assets in the Appalachia region ("Appalachia JV"). EXCO and Shell each own an undivided 50% interest in the Appalachia JV and a 49.75% working interest in the Appalachia JV's properties. The remaining 0.5% working interest is held by a jointly owned operating entity ("OPCO") that operates the Appalachia JV's properties. We own a 50% interest in OPCO.
The accompanying Consolidated Balance Sheets as of December 31, 2016 and 2015, Consolidated Statements of Operations, Consolidated Statements of Cash Flows and Consolidated Statements of Changes in Shareholders’ Equity for the years ended December 31, 2016, 2015 and 2014 are for EXCO and its subsidiaries. The consolidated financial statements and related footnotes are presented in accordance with generally accepted accounting principles in the United States ("GAAP"). Certain reclassifications have been made to prior period information to conform to current period presentation.
Going Concern Assessment and Management’s Plans
These Consolidated Financial Statements have been prepared on a going concern basis, which contemplates the realization of assets and the satisfaction of liabilities and other commitments in the normal course of business. Our liquidity and ability to maintain compliance with debt covenants have been negatively impacted by the prolonged depressed oil and natural gas price environment, levels of indebtedness, and gathering, transportation and certain other commercial contracts. We define liquidity as cash and restricted cash plus the unused borrowing base under our credit agreement ("Liquidity"). As of December 31, 2016, the Company had $9.1 million in cash and cash equivalents, $46.2 million of availability under its credit agreement ("EXCO Resources Credit Agreement") and a working capital deficit of $147.7 million.
On March 15, 2017, we closed a series of transactions intended to improve our Liquidity and capital structure. This included the issuance of $300.0 million in aggregate principal amount of senior secured 1.5 lien notes due March 20, 2022 ("1.5 Lien Notes") and the exchange of $682.8 million in aggregate principal amount of our senior secured second lien term loans due October 26, 2020 ("Second Lien Term Loans") for a like amount of senior 1.75 lien term loans due October 26, 2020 ("1.75 Lien Term Loans"). The 1.5 Lien Notes and 1.75 Lien Term Loans provide us the option to pay interest in cash or, subject to certain limitations, common shares or additional indebtedness ("PIK Payments"). The proceeds from the issuance of the 1.5 Lien Notes were primarily utilized to repay the outstanding indebtedness under the EXCO Resources Credit Agreement. The EXCO Resources Credit Agreement was amended to reduce the borrowing base to $150.0 million, permit the issuance of the
88
1.5 Lien Notes and the exchanges of Second Lien Term Loans, and modify certain financial covenants. See further discussion of these transactions as part of "Note 18. Subsequent Events".
The payment of interest in common shares on the 1.5 Lien Notes and 1.75 Lien Term Loans would improve our Liquidity and future cash flows. Our ability to pay interest in common shares is restricted until the shareholder approval is obtained to permit the issuance of common shares in connection with the transactions. The amount of PIK Payments made in additional 1.5 Lien Notes or 1.75 Lien Term Loans is subject to incurrence covenants within our debt agreements that limit our aggregate secured indebtedness to $1.2 billion. If we do not receive the shareholder vote to approve the issuance of common shares in connection with the 1.5 Lien Notes and 1.75 Lien Term Loans, then we may be required to pay interest in cash that would further restrict our Liquidity and ability to comply with debt covenants. Furthermore, if the shareholder approval is not obtained by September 30, 2017, subject to certain extensions, the interest rate for cash and PIK Payments on the 1.5 Lien Notes will significantly increase.
The modified covenants in the EXCO Resources Credit Agreement include a requirement for our ratio of consolidated EBITDAX to consolidated interest expense ("Interest Coverage Ratio") to exceed a minimum of 1.75 to 1.0 for the fiscal quarter ending September 30, 2017 and 2.0 to 1.0 for fiscal quarters thereafter. The definition of consolidated interest expense utilized in the Interest Coverage Ratio excludes payments in common shares or additional indebtedness on the 1.5 Lien Notes and 1.75 Lien Term Loans. The consolidated EBITDAX and consolidated interest expense utilized in this calculation are annualized beginning with the fiscal quarter ending September 30, 2017. Therefore, the receipt of shareholder approval to pay interest through the issuance of common shares is essential to our ability to maintain compliance with this covenant. Furthermore, our ability to maintain compliance with other financial covenants under the EXCO Resources Credit Agreement would be negatively impacted if we are not able to pay interest in common shares.
We intend to seek approval for these transactions through our annual meeting of shareholders or at a special meeting of shareholders called for such purpose within the period required by the 1.5 Lien Notes and 1.75 Lien Term Loans. The shareholder approval to permit the issuance of common shares associated with the transactions requires the affirmative vote of a majority of the votes cast by the holders of our outstanding common shares. The shareholder approval to amend our charter to increase the number of shares authorized for issuance or approval to execute a reverse stock split, without a proportionate reduction of authorized shares, at the discretion of the Board of Directors, requires that holders of at least two-thirds of outstanding shares approve the proposal. However, we may waive the requirement within the 1.5 Lien Notes and 1.75 Lien Notes to obtain shareholder approval to amend our charter at our sole discretion. Certain of our related parties and members of our Board of Directors hold approximately 46% of the total common shares outstanding as of December 31, 2016. The issuance of the 1.5 Lien Notes and the exchange transactions involving the 1.75 Lien Term Loans were approved by a special committee of the Board of Directors consisting of the sole disinterested member of the Board of Directors. The Board of Directors authorized and approved the transactions based on the recommendation of the special committee. However, there is no assurance that the proposals will be approved. Therefore, the receipt of shareholder approval was deemed to be outside of our control in accordance with Financial Accounting Standards Board ("FASB") Accounting Standards Codification ("ASC") 205-40, Going Concern and our ability to pay interest in common shares was not factored into our analysis regarding our ability to continue as a going concern. If we are not able to obtain shareholder approval to permit the transactions, and are not able to pay interest in common shares, it is probable that we will not meet the minimum requirement under the Interest Coverage Ratio for the twelve-month period following the date of these Consolidated Financial Statements.
If we are not able to comply with our debt covenants or do not have sufficient Liquidity to conduct our business operations in future periods, we may be required, but unable, to refinance all or part of our existing debt, seek covenant relief from our lenders, sell assets, incur additional indebtedness, or issue equity on terms acceptable to us, if at all, and may be required to surrender assets pursuant to the security provisions of the EXCO Resources Credit Agreement. Therefore, our ability to continue our planned principal business operations would be dependent on the actions of our lenders or obtaining additional debt and/or equity financing to repay outstanding indebtedness under the EXCO Resources Credit Agreement. These factors raise substantial doubt about our ability to continue as a going concern.
If the shareholder approval is obtained, we may elect to pay interest on the 1.5 Lien Notes and 1.75 Lien Term Loans in common shares at our sole discretion until December 31, 2018. If this occurs, our plans would be to pay interest on the 1.5 Lien Notes and 1.75 Lien Term Loans in common shares during this period and we expect that we would have sufficient Liquidity and maintain compliance with our debt covenants for the twelve-month period following the date of these Consolidated Financial Statements. In addition, we are evaluating the potential divestiture of our assets in South Texas to further improve our Liquidity. There is no assurance any such transactions will occur.
The accompanying Consolidated Financial Statements do not include any adjustments to reflect the possible future effects of this uncertainty on the recoverability or classification of recorded asset amounts or the amounts or classification of liabilities.
89
Revisions of prior period information
On August 19, 2016, we formed Raider Marketing, LP ("Raider") through an internal merger to provide marketing services to EXCO and pursue independent business opportunities. Raider is a wholly owned subsidiary of EXCO and is the contractual counterparty by operation of Texas law to all of EXCO's gathering, transportation and marketing contracts in Texas and Louisiana. In connection with the formation of Raider and the Company's plans to pursue additional marketing opportunities, we have revised our presentation of third party natural gas purchases and sales to report these costs and revenues on a gross basis in the accompanying statements of operations in accordance with FASB ASC 605, Revenue Recognition, beginning in the third quarter of 2016. Third party purchases and sales are now reported gross as "Purchased natural gas" expenses and "Purchased natural gas and marketing" revenues, respectively. Purchased natural gas and marketing revenues include revenue we receive as a result of selling natural gas that we purchase from third parties and marketing fees we receive from third parties. Purchased natural gas expenses include purchases from third parties plus an allocation of transportation costs. The transportation costs allocated to the third party purchases relate to our firm transportation agreements with unutilized commitments; therefore, the utilization of this transportation reduces the unutilized commitments that would have otherwise been allocated to our net share of production and incurred by EXCO.
We previously reported these transactions on a net basis in the financial statements due to the materiality associated with the income or loss generated from these purchases and sales, and the historical insignificance of the Company's marketing activities involving the purchases and sales of third party natural gas to our operations. The net effect of these revisions did not impact our previously reported net income or loss, shareholders’ equity or cash flows. The Company evaluated the materiality of the revisions based on ASC 250, Accounting Changes and Error Corrections, and concluded the revisions to be immaterial corrections of an error.
The following table reflects the revisions to the following annual periods:
Year ended | ||||||||
(in thousands) | December 31, 2015 | December 31, 2014 | ||||||
Natural gas revenues, previously reported | $ | 225,544 | $ | 463,953 | ||||
Revision of third party natural gas purchases and sales | 927 | 715 | ||||||
Natural gas revenues, as currently reported | $ | 226,471 | $ | 464,668 | ||||
Purchased natural gas and marketing revenues | $ | 26,442 | $ | 34,933 | ||||
Purchased natural gas expenses | $ | 27,369 | $ | 35,648 | ||||
2. | Summary of significant accounting policies |
Principles of consolidation
We consolidate all of our subsidiaries in the accompanying Consolidated Balance Sheets as of December 31, 2016 and 2015 and the Consolidated Statements of Operations, Consolidated Statements of Cash Flows and Changes in Shareholders' Equity for the years ended December 31, 2016, 2015 and 2014. Investments in unconsolidated affiliates in which we are able to exercise significant influence are accounted for using the equity method. We use the cost method of accounting for investments in unconsolidated affiliates in which we are not able to exercise significant influence. All intercompany transactions and accounts have been eliminated.
We report our interests in oil and natural gas properties using the proportional consolidation method of accounting. We reported our 25.5% interest in Compass Production Partners, L.P. ("Compass") using proportional consolidation for the period from its formation on February 14, 2013 to the sale of our interests on October 31, 2014. See further discussion in "Note 3. Acquisitions, divestitures and other significant events."
90
Management estimates
In preparing the consolidated financial statements in conformity with GAAP, we are required to make estimates and assumptions that affect the reported amounts of assets, liabilities, revenues and expenses during the reporting periods. The more significant estimates pertain to proved oil and natural gas reserve volumes, future development costs, asset retirement obligations, equity-based compensation, estimates relating to oil and natural gas revenues and expenses, accrued liabilities, the fair market value of assets and liabilities acquired in business combinations, derivatives and goodwill. Actual results may differ from management's estimates.
Cash equivalents
We consider all highly liquid investments with maturities of three months or less when purchased, to be cash equivalents.
Restricted cash
The restricted cash on our balance sheet is principally comprised of our share of an evergreen escrow account with Shell that is used to fund our share of development operations in East Texas and North Louisiana. Funds held in this escrow account are restricted and can be used primarily for drilling and operations in East Texas and North Louisiana. The restricted cash balance at December 31, 2015 also included accrued fees payable to Energy Strategic Advisory Services LLC ("ESAS") which were paid during 2016 upon completion of ESAS's entire first year of service and required investment with EXCO. See "Note 13. Related party transactions" for further discussion of the services and investment agreement with ESAS.
Concentration of credit risk and accounts receivable
Financial instruments that potentially subject us to a concentration of credit risk consist principally of cash, trade receivables and our derivative financial instruments. We place our cash with financial institutions which we believe have sufficient credit quality to minimize risk of loss. We sell oil and natural gas to various customers. In addition, we participate with other parties in the drilling, completion and operation of oil and natural gas wells. The majority of our accounts receivable are due from either purchasers of oil or natural gas or participants in oil and natural gas wells for which we serve as the operator. We have the right to offset future revenues against unpaid charges related to wells which we operate. Oil and natural gas receivables are generally uncollateralized. The allowance for doubtful accounts was immaterial at both December 31, 2016 and 2015. We place our derivative financial instruments with financial institutions that we believe have high credit ratings. To mitigate our risk of loss due to default, we have entered into master netting agreements with our counterparties on our derivative financial instruments that allow us to offset our asset position with our liability position in the event of a default by the counterparty.
For the years ended December 31, 2016, 2015 and 2014, sales to BG Energy Merchants LLC, and subsequently to Shell Energy North America US, LP, accounted for approximately 24%, 20% and 34%, respectively, of total consolidated revenues. BG Energy Merchants LLC was a subsidiary of BG Group, plc ("BG Group") until the acquisition of BG Group by Shell in early 2016. For the years ended December 31, 2016, 2015 and 2014, Chesapeake Energy Marketing Inc. accounted for approximately 32%, 38% and 31% respectively, of total consolidated revenues. Chesapeake Energy Marketing Inc. is a subsidiary of Chesapeake Energy Corporation ("Chesapeake").
Derivative financial instruments
We use derivative financial instruments to mitigate the impacts of commodity price fluctuations, protect our returns on investments and achieve a more predictable cash flow. FASB ASC, Topic 815, Derivatives and Hedging, ("ASC 815"), requires that every derivative instrument (including certain derivative instruments embedded in other contracts) be recorded on the balance sheet as either an asset or liability measured at its estimated fair value. ASC 815 requires that changes in the derivative's estimated fair value be recognized in earnings unless specific hedge accounting criteria are met, or exemptions for normal purchases and normal sales as permitted by ASC 815 exist. We do not designate our derivative financial instruments as hedging instruments and, as a result, recognize the change in a derivative's estimated fair value in earnings as a component of other income or expense. Our derivative financial instruments are not held for trading purposes.
91
Oil and natural gas properties
The accounting for, and disclosure of, oil and natural gas producing activities require that we choose between two GAAP alternatives: the full cost method or the successful efforts method. We use the full cost method of accounting, which involves capitalizing all acquisition, exploration, exploitation and development costs of oil and natural gas properties. Once we incur costs, they are recorded in the depletable pool of proved properties or in unproved properties, collectively, the full cost pool. Our unproved property costs, which include unproved oil and natural gas properties, properties under development and major development projects, collectively totaled $97.1 million and $115.4 million as of December 31, 2016 and 2015, respectively, and are not subject to depletion. We review our unproved oil and natural gas property costs on a quarterly basis to assess for impairment or the need to transfer unproved costs to proved properties as a result of extension or discoveries from drilling operations or determination that no Proved Reserves are attributable to such costs. In determining whether such costs should be impaired or transferred, we evaluate lease expiration dates, recent drilling results, future development plans and current market values. Our undeveloped properties are predominantly held-by-production, which reduces the risk of impairment as a result of lease expirations. There were no impairments of unproved properties during 2016 and 2014 and we impaired $88.1 million of unproved properties during 2015. The impairment was recorded to reflect the estimated fair value of our undeveloped properties as a result of the decline in oil and natural gas prices. The impairment also included certain expiring acreage that was no longer part of our drilling plans. See "Note 6. Fair value measurements" for further discussion.
We capitalize interest on the costs related to the acquisition of undeveloped acreage in accordance with FASB ASC 835-20, Capitalization of Interest. When the unproved property costs are moved to proved developed and undeveloped oil and natural gas properties, or the properties are sold, we cease capitalizing interest related to these properties.
We calculate depletion using the unit-of-production method. Under this method, the sum of the full cost pool, excluding the book value of unproved properties, and all estimated future development costs less estimated salvage value are divided by the total estimated quantities of Proved Reserves. This rate is applied to our total production for the quarter, and the appropriate expense is recorded. We capitalize the portion of general and administrative costs, including share-based compensation, that is attributable to our acquisition, exploration, exploitation and development activities.
Sales, dispositions and other oil and natural gas property retirements are accounted for as adjustments to the full cost pool, with no recognition of gain or loss, unless the disposition would significantly alter the relationship between capitalized costs and Proved Reserves.
Pursuant to Rule 4-10(c)(4) of Regulation S-X, at the end of each quarterly period, companies that use the full cost method of accounting for their oil and natural gas properties must compute a limitation on capitalized costs ("ceiling test"). The ceiling test involves comparing the net book value of the full cost pool, after taxes, to the full cost ceiling limitation defined below. In the event the full cost ceiling limitation is less than the full cost pool, we are required to record a ceiling test impairment of our oil and natural gas properties. The full cost ceiling limitation is computed as the sum of the present value of estimated future net revenues from our Proved Reserves by applying the average price as prescribed by the SEC Release No. 33-8995, less estimated future expenditures (based on current costs) to develop and produce the Proved Reserves, discounted at 10%, plus the cost of properties not being amortized and the lower of cost or estimated fair value of unproved properties included in the costs being amortized, net of income tax effects.
The ceiling test for each period presented was based on the following average spot prices, in each case adjusted for quality factors and regional differentials to derive estimated future net revenues. Prices presented in the table below are the trailing 12 month simple average spot prices at the first of the month for natural gas at Henry Hub ("HH") and West Texas Intermediate ("WTI") crude oil at Cushing, Oklahoma. The fluctuations demonstrate the volatility in oil and natural gas prices between each of the periods and have a significant impact on our ceiling test limitation.
Average spot prices | ||||||||
Oil (per Bbl) | Natural gas (per Mmbtu) | |||||||
December 31, 2016 | $ | 42.75 | $ | 2.48 | ||||
December 31, 2015 | 50.28 | 2.59 | ||||||
December 31, 2014 | 94.99 | 4.35 | ||||||
For the year ended December 31, 2016, we recognized impairments to our proved oil and natural gas properties of $160.8 million. The impairments were primarily due to the decline in oil and natural gas prices. Furthermore, the fixed costs associated with certain gathering and transportation contracts continue to have a significant impact on the present value of our Proved Reserves. For the year ended December 31, 2015, we recognized impairments to our proved oil and natural gas
92
properties of $1.2 billion. The impairments were primarily due to the decline in oil and natural gas prices partially offset by upward revisions in the oil and natural gas reserves primarily as a result of modifications to our well design in the North Louisiana and East Texas regions. For the year ended December 31, 2014, we did not recognize an impairment to our proved oil and natural gas properties.
All of our Proved Undeveloped Reserves were reclassified to unproved during the first quarter of 2016 due to the uncertainty regarding the financing required to develop these reserves that existed on March 31, 2016. These reserves remained classified as unproved due to our inability to meet the Reasonable Certainty criteria for recording Proved Undeveloped Reserves, as prescribed under the SEC requirements, as the uncertainty regarding our availability of capital required to develop these reserves still existed at December 31, 2016. A significant amount of our Proved Undeveloped Reserves that were reclassified to unproved remain economic at current prices, and we may report Proved Undeveloped Reserves in future filings if we determine we have the financial capability to execute a development plan.
Under full cost accounting rules, any ceiling test impairments of oil and natural gas properties may not be reversed in subsequent periods. Since we do not designate our derivative financial instruments as hedging instruments, we are not allowed to use the impacts of the derivative financial instruments in our ceiling test computations.
The evaluation of impairment of our oil and natural gas properties includes estimates of Proved Reserves. There are numerous uncertainties inherent in estimating quantities of Proved Reserves, in projecting the future rates of production and in the timing of development activities. The accuracy of any reserve estimate is a function of the quality of available data and of engineering and geological interpretation and judgment. Results of drilling, testing and production subsequent to the date of the estimate may justify revisions of such estimate. Accordingly, reserve estimates often differ from the quantities of oil and natural gas that are ultimately recovered.
Other property and equipment
Other property and equipment is primarily comprised of office, field and other equipment which are capitalized at cost and depreciated on a straight line basis over their estimated useful lives ranging from 3 to 15 years and the surface acreage we own in our South Texas region.
Goodwill
In accordance with FASB ASC 350-20, Intangibles-Goodwill and Other ("ASC 350-20"), goodwill is not amortized, but is tested for impairment on an annual basis, or more frequently as impairment indicators arise. Impairment tests, which involve the use of estimates related to the fair market value of the business operations with which goodwill is associated, are performed as of December 31 of each year. Losses, if any, resulting from impairment tests will be reflected in operating income or loss in the Consolidated Statements of Operations.
We apply a two-part, equally weighted approach in determining the fair value of our business as part of the goodwill impairment test. We perform an income approach, which uses a discounted cash flow model to value our business, and a market approach, in which our value is determined using trading metrics and transaction multiples of peer companies. As part of the determination of the fair value of our reporting unit, we corroborate the results of the valuation model through a comparison to our enterprise value that is calculated as the combined market capitalization of our equity plus the fair value of our debt.
As a result of testing, the fair value of our business significantly exceeded the carrying value of net assets at December 31, 2016 and we did not record an impairment charge for the periods ending December 31, 2016, 2015 or 2014.
Asset retirement obligations
We apply FASB ASC 410-20, Asset Retirement and Environmental Obligations ("ASC 410-20") to account for estimated future plugging and abandonment costs. ASC 410-20 requires legal obligations associated with the retirement of long-lived assets to be recognized at their estimated fair value at the time that the obligations are incurred. Upon initial recognition of a liability, that cost is capitalized as part of the related long-lived asset and allocated to expense over the useful life of the asset. Our asset retirement obligations primarily represent the present value of the estimated amount we will incur to plug, abandon and remediate our proved producing properties at the end of their productive lives, in accordance with applicable state laws.
93
The following is a reconciliation of our asset retirement obligations for the periods indicated:
December 31, | ||||||||||||
(in thousands) | 2016 | 2015 | 2014 | |||||||||
Asset retirement obligations at beginning of period | $ | 41,648 | $ | 36,755 | $ | 42,954 | ||||||
Activity during the period: | ||||||||||||
Liabilities incurred during the period | — | 881 | 576 | |||||||||
Revisions in estimated assumptions | 175 | 3,215 | — | |||||||||
Liabilities settled during the period | (140 | ) | (293 | ) | (33 | ) | ||||||
Adjustment to liability due to acquisitions | 1 | 180 | 107 | |||||||||
Adjustment to liability due to divestitures (1) | (32,605 | ) | (1,367 | ) | (9,539 | ) | ||||||
Accretion of discount | 2,210 | 2,277 | 2,690 | |||||||||
Asset retirement obligations at end of period | 11,289 | 41,648 | 36,755 | |||||||||
Less current portion | 344 | 845 | 1,769 | |||||||||
Long-term portion | $ | 10,945 | $ | 40,803 | $ | 34,986 | ||||||
(1) | For the year ended December 31, 2016, the adjustment to liability due to divestitures consisted primarily of $22.6 million and $9.7 million from the sales of our conventional assets located in Pennsylvania and West Virginia, respectively. For the year ended December 31, 2014, the adjustment to liability due to divestitures consisted primarily of $9.4 million from the sale of our interest in Compass. |
Our asset retirement obligations are determined using discounted cash flow methodologies based on inputs and assumptions developed by management. We do not have any assets that are legally restricted for purposes of settling asset retirement obligations.
Revenue recognition and gas imbalances
We use the sales method of accounting for oil and natural gas revenues. Under the sales method, revenues are recognized based on actual volumes of oil and natural gas sold to purchasers. Gas imbalances at December 31, 2016, 2015 and 2014 were not significant.
Gathering and transportation
We generally sell oil and natural gas under two types of agreements which are common in our industry. Both types of agreements include a transportation charge. One is a net-back arrangement, under which we sell oil or natural gas at the wellhead and collect a price, net of the transportation incurred by the purchaser. In this case, we record sales at the price received from the purchaser, net of the transportation costs. Under the other arrangement, we sell oil or natural gas at a specific delivery point, pay transportation to a third party and receive proceeds from the purchaser with no transportation deduction. In this case, we record the transportation cost as gathering and transportation expense. As such, our computed realized prices, before the impact of derivative financial instruments, include revenues which are reported under two separate bases. Gathering and transportation expenses totaled $106.5 million, $99.3 million and $101.6 million for the years ended December 31, 2016, 2015 and 2014, respectively.
Capitalization of internal costs
As part of our proved developed oil and natural gas properties, we capitalize a portion of salaries and related share-based compensation for employees who are directly involved in the acquisition, appraisal, exploration, exploitation and development of oil and natural gas properties. During the years ended December 31, 2016, 2015 and 2014, we capitalized $4.0 million, $10.6 million and $15.8 million, respectively. The capitalized amounts include $0.8 million, $3.4 million and $5.5 million of share-based compensation for the years ended December 31, 2016, 2015 and 2014, respectively.
Overhead reimbursement fees
We have classified fees from overhead charges billed to working interest owners of $13.7 million, $13.1 million and $13.5 million for the years ended December 31, 2016, 2015 and 2014, respectively, as a reduction of general and administrative
94
expenses in the accompanying Consolidated Statements of Operations. We classified our share of these charges as oil and natural gas production costs in the amount of $5.8 million, $5.7 million and $6.4 million for the years ended December 31, 2016, 2015 and 2014, respectively.
In addition, we have agreements with Shell that allow us to bill each other certain personnel costs and related fees incurred on behalf of the joint ventures in the East Texas, North Louisiana and Appalachia regions. In connection with the formation of Compass, we entered into an agreement to perform certain operational, managerial, and administrative services. Compass reimbursed us for costs incurred in connection with the performance of these services based on an agreed upon service fee. As a result of the Compass sale, this agreement was terminated on October 31, 2014 and we entered into a customary transition services agreement pursuant to which EXCO provided certain transition services to Compass until April 2015. For the years ended December 31, 2016, 2015 and 2014, general and administrative expenses were reduced by $7.1 million, $15.9 million and $24.7 million, respectively, for recoveries of fees for our personnel and services provided to our joint ventures and other partners. These recoveries are net of fees charged to us by Shell for their personnel and services.
Environmental costs
Environmental costs that relate to current operations are expensed as incurred. Remediation costs that relate to an existing condition caused by past operations are accrued when it is probable that those costs will be incurred and can be reasonably estimated based upon evaluations of currently available facts related to each site.
Income taxes
Income taxes are accounted for in accordance with FASB ASC 740, Income Taxes ("ASC 740"), under which deferred income taxes are recognized for the future tax effects of temporary differences between the financial statement carrying amounts and the tax basis of existing assets and liabilities using the enacted statutory tax rates in effect at year-end. The effect on deferred taxes for a change in tax rates is recognized in earnings in the period that includes the enactment date. A valuation allowance for deferred tax assets is recorded when it is more likely than not that the benefit from the deferred tax asset will not be realized.
Earnings per share
We account for earnings per share in accordance with FASB ASC 260-10, Earnings Per Share ("ASC 260-10"). ASC 260-10 requires companies to present two calculations of earnings per share ("EPS"): basic and diluted. Basic EPS is based on the weighted average number of common shares outstanding during the period, excluding stock options, restricted share units, restricted share awards and warrants. Diluted EPS is computed in the same manner as basic EPS after assuming the issuance of common shares for all potentially dilutive common share equivalents, which include stock options, restricted share units, restricted share awards and warrants, whether exercisable or not.
Equity-based compensation
Our equity-based compensation includes share-based compensation to employees which we account for in accordance with FASB ASC Topic 718, Compensation-Stock Compensation ("ASC 718") and equity-based compensation for warrants issued to ESAS which we account for in accordance with FASB ASC Topic 505-50, Equity-Based Payments to Non-Employees ("ASC 505-50").
ASC 718 requires all share-based payments to employees, including grants of employee stock options, restricted share units and restricted share awards, to be recognized in our Consolidated Statements of Operations based on their estimated fair values. We recognize expense on a straight-line basis over the vesting period of the option, restricted share unit or restricted share award. We capitalize part of our share-based compensation that is attributable to our acquisition, exploration, exploitation and development activities.
Our 2005 Amended and Restated Long-Term Incentive Plan ("2005 Incentive Plan") provides for the granting of options and other equity incentive awards of our common shares in accordance with terms within the agreements. New shares will be issued for any options exercised or awards granted. Under the 2005 Incentive Plan, we have only issued stock options, restricted share units and restricted share awards, although the plan allows for other share-based awards.
The measurement of the warrants is accounted for in accordance with ASC 505-50, which requires the warrants to be re-measured each interim reporting period until the completion of the services under the agreement and an adjustment is recorded
95
in our Consolidated Statements of Operations included as equity-based compensation expense. See "Note 11. Equity-based compensation" for additional information on the warrants issued to ESAS.
Recent accounting pronouncements
In February 2016, the FASB issued Accounting Standards Update ("ASU") No. 2016-02, Leases (Topic 842) ("ASU 2016-02"). The main difference between the current requirement under GAAP and ASU 2016-02 is the recognition of lease assets and lease liabilities by lessees for those leases classified as operating leases. ASU 2016-02 requires that a lessee recognize in the statement of financial position a liability to make lease payments (the lease liability) and a right-of-use asset representing its right to use the underlying asset for the lease term (other than leases that meet the definition of a short-term lease). The liability will be equal to the present value of lease payments. The asset will be based on the liability, subject to adjustment, such as for initial direct costs. For income statement purposes, the FASB retained a dual model, requiring leases to be classified as either operating or finance. Operating leases will result in straight-line expense (similar to current operating leases) while finance leases will result in a front-loaded expense pattern (similar to current capital leases). Classification will be based on criteria that are largely similar to those applied in current lease accounting. For lessors, the guidance modifies the classification criteria and the accounting for sales-type and direct financing leases. ASU 2016-02 is effective for annual and interim periods beginning after December 15, 2018 and early adoption is permitted. ASU 2016-02 must be adopted using a modified retrospective transition, and provides for certain practical expedients. These transactions will require application of the new guidance at the beginning of the earliest comparative period presented. We are currently assessing the potential impact of ASU 2016-02 and expect it will have a material impact on our consolidated financial condition and results of operations upon adoption.
In March 2016, the FASB issued ASU No. 2016-07, Investments - Equity Method and Joint Ventures (Topic 323): Simplifying the Transition to the Equity Method of Accounting ("ASU 2016-07"). ASU 2016-07 eliminates the requirement that when an investment qualifies for use of the equity method as a result of an increase in the level of ownership interest or degree of influence, an investor must adjust the investment, results of operations and retained earnings retroactively on a step-by-step basis as if the equity method had been in effect during all previous periods that the investment had been held. Therefore, upon qualifying for the equity method of accounting, no retroactive adjustment of the investment is required. ASU 2016-07 is effective for annual and interim periods beginning after December 15, 2016 and early adoption is permitted. We do not currently have significant investments that are accounted for by a method other than the equity method and do not expect ASU 2016-07 to have a significant impact on our consolidated financial condition and results of operations.
In March 2016, the FASB issued ASU No. 2016-09, Compensation - Stock Compensation (Topic 718): Improvements to Employee Share-Based Payment Accounting ("ASU 2016-09"). ASU 2016-09 simplifies several aspects of the accounting for employee share-based payment transactions, including the accounting for income taxes, forfeitures, and statutory tax withholding requirements, as well as classification in the statement of cash flows. ASU 2016-07 is effective for annual and interim periods beginning after December 15, 2016 and early adoption is permitted. ASU 2016-07 did not have an impact on our financial condition and results of operations upon adoption in the fourth quarter of 2016. The Company will continue with its current practice of estimating forfeitures instead of accounting for forfeitures when they occur, as allowed by ASU 2016-07.
In August 2016, the FASB issued ASU No. 2016-15, Statement of Cash Flows (Topic 230): Classification of Certain Cash Receipts and Cash Payments ("ASU 2016-15"). ASU 2016-15 reduces diversity in practice in how certain transactions are classified in the statement of cash flows. The amendments in ASU 2016-15 provide guidance on specific cash flow issues including debt prepayment or debt extinguishment costs, settlement of zero-coupon debt instruments or other debt instruments with coupon interest rates that are insignificant in relation to the effective interest rate of the borrowing, contingent consideration payments made after a business combination, proceeds from the settlement of insurance claims, proceeds from the settlement of corporate-owned life insurance policies and distributions received from equity method investees. ASU 2016-15 is effective for annual and interim periods beginning after December 15, 2017. We are currently assessing the potential impact of ASU 2016-15 on our consolidated financial condition and results of operations.
In October 2016, the FASB issued ASU No. 2016-16, Income Taxes (Topic 740): Intra-Entity Transfers of Assets Other Than Inventory ("ASU 2016-16"). The amendments in this update require that an entity recognize the income tax consequences of an intra-entity transfer of an asset other than inventory when the transfer occurs. Consequently, the amendments in this update eliminate the exception for an intra-entity transfer of an asset other than inventory. ASU 2016-16 is effective for annual and interim periods beginning after December 15, 2017 and early adoption is permitted. We are currently assessing the potential impact of ASU 2016-16 on our consolidated financial condition and results of operations.
96
In November 2016, the FASB issued ASU No. 2016-18, Statement of Cash Flows (Topic 230): Restricted Cash (a consensus of the FASB Emerging Issues Task Force) ("ASU 2016-18"). The amendments in this update require that a statement of cash flows explain the change during the period in total cash, cash equivalents and amounts generally described as restricted cash or restricted cash equivalents. Therefore, amounts generally described as restricted cash and restricted cash equivalents should be included with cash and cash equivalents when reconciling the beginning-of-period and end-of-period total amounts shown on the statement of cash flows. ASU 2016-18 is effective for annual and interim periods beginning after December 15, 2017 and early adoption is permitted. We believe the impact of the adoption of this ASU will change the presentation of our beginning and ending cash balances on our Consolidated Statements of Cash Flows and eliminate the presentation of changes in restricted cash balances from investing and operating activities on our Consolidated Statements of Cash Flows.
In January 2017, the FASB issued Accounting Standards Update ("ASU") No. 2017-01, Business Combinations (Topic 805): Clarifying the Definition of a Business ("ASU 2017-07"). ASU 2017-01 is effective for annual and interim periods beginning after December 15, 2017. Under ASU 2017-01, an entity must first determine whether substantially all of the fair value of the gross assets acquired is concentrated in a single identifiable asset or a group of similar assets. If this threshold is met, the set is not a business. If it's not met, the entity then evaluates whether the set meets the requirement that a business include, at a minimum, an input and a substantive process that together significantly contribute to the ability to create outputs. We are currently assessing the potential impact of ASU 2017-01 on our consolidated financial condition and results of operations.
In January 2017, the FASB issued ASU No. 2017-04, Intangibles - Goodwill and Other (Topic 350): Simplifying the Test for Goodwill Impairment ("ASU 2017-04"). ASU 2017-04 eliminates Step 2 of the goodwill impairment test. Instead, an entity should perform its annual or interim goodwill impairment test by comparing the fair value of a reporting unit with its carrying amount. An entity should recognize an impairment charge for the amount by which the carrying amount exceeds the reporting unit’s fair value; however, the loss recognized should not exceed the total amount of goodwill allocated to that reporting unit. An entity still has the option to perform the qualitative assessment for a reporting unit to determine if the quantitative impairment test is necessary. ASU 2017-04 is effective for annual and interim periods beginning after December 15, 2019 and early adoption is permitted for interim or annual goodwill impairment tests performed after January 1, 2017. We are currently assessing the impact of ASU 2017-04 and date of adoption.
Revenue from Contracts with Customers (Topic 606)
In May 2014, the FASB issued ASU No. 2014-09, Revenue from Contracts with Customers (Topic 606) ("ASU 2014-09"). The FASB and the International Accounting Standards Board ("IASB") jointly issued this comprehensive new revenue recognition standard that will supersede nearly all existing revenue recognition guidance under GAAP. The core principle of the guidance is that an entity should recognize revenue to depict the transfer of promised goods or services to customers in an amount that reflects the consideration to which the entity expects to be entitled in exchange for those goods or services. In doing so, companies will need to use more judgment and make more estimates than under currently applicable guidance, including identifying performance obligations in the contract, estimating the amount of variable consideration to include in the transaction price and allocating the transaction price to each separate performance obligation. ASU 2014-09 is effective for annual and interim periods beginning after December 15, 2016 and permits the use of either the retrospective or cumulative effect transition method.
In March 2016, the FASB issued ASU No. 2016-08, Revenue from Contracts with Customers (Topic 606): Principal versus Agent Considerations (Reporting Revenue Gross versus Net) ("ASU 2016-08"). ASU 2016-08 does not change the core principle of Topic 606 but clarifies the implementation guidance on principal versus agent considerations. ASU 2016-08 is effective for annual and interim periods beginning after December 15, 2017.
In April 2016, the FASB issued ASU No. 2016-10, Revenue from Contracts with Customers (Topic 606): Identifying Performance Obligations and Licensing ("ASU 2016-10"). ASU 2016-10 does not change the core principle of Topic 606 but clarifies the following two aspects of Topic 606: identifying performance obligations and the licensing implementation guidance, while retaining the related principles for those areas. ASU 2016-10 is effective for annual and interim periods beginning after December 15, 2017.
97
In May 2016, the FASB issued ASU No. 2016-11, Revenue Recognition (Topic 605) and Derivatives and Hedging (Topic 815): Rescission of SEC Guidance Because of Accounting Standards Updates 2014-09 and 2014-16 Pursuant to Staff Announcements at the March 3, 2016 EITF Meeting ("ASU 2016-11"). The SEC Staff is rescinding the following SEC Staff Observer comments that are codified in Topic 605, Revenue Recognition, and Topic 932, Extractive Activities-Oil and Gas, effective upon adoption of Topic 606. Specifically, registrants should not rely on the following SEC Staff Observer comments upon adoption of Topic 606: a) Revenue and Expense Recognition for Freight Services in Process which is codified in 605-20-S99-2; b) Accounting for Shipping and Handling Fees and Costs, which is codified in paragraph 605-45-S99-1; c) Accounting for Consideration Given by a Vendor to a Customer, which is codified in paragraph 605-50-S99-1 and d) Accounting for Gas-Balancing Arrangements (that is, use of the “entitlements method”), which is codified in paragraph 932-10-S99-5. We do not use the entitlements method of accounting and are not impacted by this specific SEC Staff Observer comment; however, we are assessing the potential impact of other SEC Staff Observer comments included in ASU 2016-11 on our consolidated financial condition and results of operations.
In May 2016, the FASB issued ASU No. 2016-12, Revenue from Contracts with Customers (Topic 606): Narrow-Scope Improvements and Practical Expedients ("ASU 2016-12"). ASU 2016-12 does not change the core principle of Topic 606 but improves the following aspects of Topic 606: assessing collectability, presentation of sales taxes, noncash considerations, completed contracts and contract modifications at transaction. ASU 2016-12 is effective for annual and interim periods beginning after December 15, 2017.
We are currently assessing the impact of ASU 2014-09 and the related updates and clarifications and are performing a review of the new guidance. We intend to adopt ASU 2014-09 and the related updates for the interim and annual periods beginning after December 15, 2017. During 2017, we plan to assess our contracts and consider the method of adoption. We are currently unable to quantify the impact the standard will have on our consolidated financial condition and results of operations; however, based on our preliminary analysis, we do not believe this standard will have a material impact, if any, on our consolidated financial condition and results of operations.
3. | Acquisitions, divestitures and other significant events |
2016 Divestitures
South Texas transaction
On May 6, 2016, we closed a sale of certain non-core undeveloped acreage in South Texas and our interests in four producing wells for $11.5 million, after final purchase price adjustments. Proceeds from the sale were used to reduce indebtedness under the EXCO Resources Credit Agreement.
Conventional asset divestitures
On July 1, 2016, we closed the sale of our interests in shallow conventional assets located in Pennsylvania and received an overriding royalty interest in each well. In addition, we retained all rights to other formations below the conventional depths in this region including the Marcellus and Utica shales. For the six months ended June 30, 2016, the divested assets produced approximately 6 Mmcfe per day and the revenues less direct operating expenses, excluding general and administrative costs, generated a net loss of less than $0.1 million. The asset retirement obligations related to the divested wells were $22.6 million on July 1, 2016.
On October 3, 2016, we closed the sale of our interests in shallow conventional assets located primarily in West Virginia for approximately $4.5 million, subject to customary post-closing purchase price adjustments. We retained all rights to other formations below the conventional depths in this region including the Marcellus and Utica shales. For the nine months ended September 30, 2016, the divested assets produced approximately 4 Mmcfe per day and the revenues less direct operating expenses, excluding general and administrative costs, generated net income of $0.7 million. The asset retirement obligations related to the divested wells were $9.7 million on October 3, 2016.
In conjunction with the sales of our shallow conventional assets in Pennsylvania and West Virginia, the Company's field employee count in the Appalachia region has been reduced by 85% since December 31, 2015.
The divestitures of our interests during 2016 did not significantly alter the relationship between our capitalized costs and Proved Reserves and were accounted for as an adjustment of capitalized costs with no gain or loss recognized in accordance with Rule 4-10(c)(6)(i) of Regulation S-X.
2015 Acquisitions and termination of Participation Agreement
98
In July 2013, we entered into a participation agreement with a joint venture partner for the development of certain assets in the Eagle Ford shale ("Participation Agreement"). The Participation Agreement required us to offer to purchase our joint venture partner's working interest in wells that have been on production for at least one year. The offers were made on a quarterly basis for a group of wells based on prices defined in the Participation Agreement, subject to specific well criteria and return hurdles.
We closed the first acquisition of our joint venture partner's interest in 3 gross (1.4 net) wells on March 11, 2015 for a total purchase price of $7.6 million.
During the fourth quarter of 2015, our Eagle Ford joint venture partner purported to accept our offer under the Participation Agreement to purchase interests in 21 gross (10.3 net) wells for $42.7 million, subject to purchase price adjustments subsequent to the effective date of June 30, 2015. We notified our joint venture partner that we did not intend to close this acquisition as our partner's purported acceptance had not been received in a timely manner under the terms of the Participation Agreement, and our joint venture partner filed a petition for injunctive relief and damages alleging that, among other things, we breached our obligation under the Participation Agreement. In addition, subsequent offers were also in dispute for various reasons.
On July 25, 2016, we settled the litigation with our joint venture partner, and the litigation was thereafter dismissed after a final judgment order was entered in response to the parties’ joint motion to dismiss the case with prejudice. Among other things, the settlement provided a full release for any claims, rights, demands, damages and causes of action that either party has asserted or could have asserted for any breach of the Participation Agreement. As part of the settlement, the parties amended and restated the Participation Agreement to (i) eliminate our requirement to offer to purchase our joint venture partner's interests in certain wells each quarter, (ii) eliminate our requirement to convey a portion of our working interest to our joint venture partner upon commencing development of future locations, (iii) terminate the area of mutual interest, which required either party acquiring an interest in non-producing acreage included in certain areas to provide notice of the acquisition to the non-acquiring party and allowed the non-acquiring party to acquire a proportionate share in such acquired interest, (iv) provide that EXCO transfer to its joint venture partner a portion of its interests in certain producing wells and certain undeveloped locations in South Texas (“Transferred Interests”), effective May 1, 2016 and (v) modify or eliminate certain other provisions. The Participation Agreement was terminated on December 1, 2016 upon final settlement of the agreement.
We recorded a loss in "Other operating items" in the Consolidated Statements of Operations, and a corresponding credit to the "Proved developed and undeveloped oil and natural gas properties" in our Consolidated Balance Sheet during 2016. The fair value of the Transferred Interests was $23.2 million as of July 25, 2016 based on a discounted cash flow model of the estimated reserves using NYMEX forward strip prices. See "Note 6. Fair value measurements" for additional information. The net production from the Transferred Interests was approximately 350 Bbls of oil per day during June 2016.
2014 Divestitures
Permian Basin transaction
On March 24, 2014, we closed a purchase and sale agreement with a private party for the sale of our interest in certain non-operated assets in the Permian Basin including producing wells and undeveloped acreage for approximately $68.2 million, after final purchase price adjustments. The effective date of the transaction was January 1, 2014. Proceeds from the sale were used to reduce indebtedness under the EXCO Resources Credit Agreement.
Compass divestiture
On October 31, 2014, we closed the sale of our entire interest in Compass to Harbinger Group, Inc. ("HGI") for $118.8 million in cash. We used a portion of the proceeds to reduce indebtedness under the EXCO Resources Credit Agreement. Prior to the closing of the sale, we reported our 25.5% interest in Compass using proportional consolidation. Our consolidated assets and liabilities were reduced by our proportionate share of Compass's net assets of $31.4 million which included our proportionate share of the Compass's indebtedness of $83.2 million on October 31, 2014.
The sale of our interest in Compass did not significantly alter the relationship between our capitalized costs and Proved Reserves and was accounted for as an adjustment of capitalized costs with no gain or loss recognized in accordance with Rule 4-10(c)(6)(i) of Regulation S-X. As a result, our capitalized costs were further reduced by $87.4 million. Following the closing, EXCO was no longer required to offer acquisition opportunities to Compass or any of its affiliates.
99
4. | Derivative financial instruments |
Our primary objective in entering into derivative financial instruments is to manage our exposure to commodity price fluctuations, protect our returns on investments and achieve a more predictable cash flow from operations. These transactions limit exposure to declines in commodity prices, but also limit the benefits we would realize if commodity prices increase. When prices for oil and natural gas are volatile, a significant portion of the effect of our derivative financial instrument management activities consists of non-cash income or expense due to changes in the fair value of our derivative financial instruments. Cash losses or gains only arise from payments made or received on monthly settlements of contracts or if we terminate a contract prior to its expiration. We do not designate our derivative financial instruments as hedging instruments for financial accounting purposes and, as a result, we recognize the change in the respective instruments’ fair value in earnings.
The table below outlines the classification of our derivative financial instruments on our Consolidated Balance Sheets and their financial impact on our Consolidated Statements of Operations.
Fair Value of Derivative Financial Instruments
(in thousands) | December 31, 2016 | December 31, 2015 | ||||||
Derivative financial instruments - Current assets | $ | — | $ | 39,499 | ||||
Derivative financial instruments - Long-term assets | 482 | 6,109 | ||||||
Derivative financial instruments - Current liabilities | (27,711 | ) | (16 | ) | ||||
Derivative financial instruments - Long-term liabilities | (464 | ) | — | |||||
Net derivative financial instruments | $ | (27,693 | ) | $ | 45,592 | |||
The Effect of Derivative Financial Instruments
Year Ended December 31, | ||||||||||||
(in thousands) | 2016 | 2015 | 2014 | |||||||||
Gain (loss) on derivative financial instruments | $ | (34,137 | ) | $ | 75,869 | $ | 87,665 | |||||
Settlements in the normal course of maturities of our derivative financial instrument contracts result in cash receipts from, or cash disbursements to, our derivative contract counterparties. Changes in the fair value of our derivative financial instrument contracts, which includes both cash settlements and non-cash changes in fair value, are included in earnings with a corresponding increase or decrease in the Consolidated Balance Sheets' fair value amounts.
Our oil and natural gas derivative instruments are comprised of the following instruments:
Swaps: These contracts allow us to receive a fixed price and pay a floating market price to the counterparty for the hedged commodity.
Collars: A collar is a combination of options including a sold call and a purchased put. These contracts allow us to participate in the upside of commodity prices to the ceiling of the call option and provide us with downside protection through the put option. If the market price is below the strike price of the purchased put at the time of settlement then the counterparty pays us the excess. If the market price is above the strike price of the sold call at the time of settlement, we pay the counterparty the excess. These transactions were conducted contemporaneously with a single counterparty and resulted in a net cashless transaction.
In the fourth quarter of 2016, a counterparty exercised its option under swaption contracts and entered into swap contracts covering 7,300 Bbtu of natural gas at an average price of $2.76 per Mmbtu during 2017. The swaption contract gave our trading counterparty the right, but not the obligation, to enter into a swap contract for an agreed quantity of oil or natural gas from us at a certain time and fixed price in the future.
We place our derivative financial instruments with the financial institutions that are lenders under the EXCO Resources Credit Agreement that we believe have high quality credit ratings. To mitigate our risk of loss due to default, we have entered into master netting agreements with counterparties to our derivative financial instruments that allow us to offset our asset position with our liability position in the event of a default by the counterparty. Our credit rating and financial condition may restrict our ability to enter into certain types of derivative financial instruments and limit the maturity of the contracts with counterparties. We have historically entered into derivative financial instruments with the financial institutions that are lenders
100
under the EXCO Resources Credit Agreement. Therefore, our ability to enter into derivative financial instruments may be limited beyond the maturity of the EXCO Resources Credit Agreement in July 2018. We are currently evaluating alternatives to enter into derivative financial instruments beyond this date, which may include counterparties that are not lenders under the EXCO Resources Credit Agreement. These alternatives may include agreements with counterparties on a secured or unsecured basis. If we enter into derivative financial instruments that require us to post collateral, this could further constrain our liquidity. Our derivative contracts also contain rights that could result in the early termination of our derivative contracts and cash payments to our counterparties due to an event of default under the EXCO Resources Credit Agreement.
The following table presents the volumes and fair value of our oil and natural gas derivative financial instruments as of December 31, 2016:
(dollars in thousands, except prices) | Volume Bbtu/Mbbl | Weighted average strike price per Mmbtu/Bbl | Fair value at December 31, 2016 | ||||||||
Natural gas: | |||||||||||
Swaps: | |||||||||||
2017 | 38,300 | 3.02 | (21,986 | ) | |||||||
2018 | 3,650 | 3.15 | 18 | ||||||||
Collars: | |||||||||||
2017 | 10,950 | $ | (4,652 | ) | |||||||
Sold call | 3.28 | ||||||||||
Purchased put | 2.87 | ||||||||||
Total natural gas | $ | (26,620 | ) | ||||||||
Oil: | |||||||||||
Swaps: | |||||||||||
2017 | 183 | $ | 50.00 | $ | (1,073 | ) | |||||
Total oil | $ | (1,073 | ) | ||||||||
Total oil and natural gas derivative financial instruments | $ | (27,693 | ) | ||||||||
At December 31, 2015, we had outstanding swap contracts covering 49,370 Bbtu of natural gas and 915 Mbbls of oil.
At December 31, 2016, the average forward NYMEX WTI oil price per Bbl for the calendar year 2017 was $56.19 and the average forward NYMEX HH natural gas prices per Mmbtu for the calendar years 2017 and 2018 were $3.61 and $3.14, respectively.
Our derivative financial instruments covered approximately 57% and 68% of production volumes for the years ended December 31, 2016 and 2015.
5. | Debt |
The carrying value of our total debt is summarized as follows:
(in thousands) | December 31, 2016 | December 31, 2015 | ||||||
EXCO Resources Credit Agreement | $ | 228,592 | $ | 67,492 | ||||
Exchange Term Loan | 590,477 | 641,172 | ||||||
Fairfax Term Loan | 300,000 | 300,000 | ||||||
2018 Notes | 131,576 | 158,015 | ||||||
Unamortized discount on 2018 Notes | (520 | ) | (932 | ) | ||||
2022 Notes | 70,169 | 222,826 | ||||||
Deferred financing costs, net | (11,756 | ) | (18,294 | ) | ||||
Total debt, net | 1,308,538 | 1,370,279 | ||||||
Less amounts due within one year | 50,000 | 50,000 | ||||||
Total debt due after one year | $ | 1,258,538 | $ | 1,320,279 | ||||
101
December 31, 2016 | ||||||||||||||||
(in thousands) | Carrying value | Deferred reduction in carrying value | Unamortized discount/deferred financing costs | Principal balance | ||||||||||||
EXCO Resources Credit Agreement | $ | 228,592 | $ | — | $ | — | $ | 228,592 | ||||||||
Exchange Term Loan | 590,477 | (190,477 | ) | — | 400,000 | |||||||||||
Fairfax Term Loan | 300,000 | — | — | 300,000 | ||||||||||||
2018 Notes | 131,056 | — | 520 | 131,576 | ||||||||||||
2022 Notes | 70,169 | — | — | 70,169 | ||||||||||||
Deferred financing costs, net | (11,756 | ) | — | 11,756 | — | |||||||||||
Total debt | $ | 1,308,538 | $ | (190,477 | ) | $ | 12,276 | $ | 1,130,337 | |||||||
Terms and conditions of each of these debt obligations are discussed below.
Recent Transactions
On March 15, 2017, we closed a series of transactions that consisted of (i) the issuance of 1.5 Lien Notes, (ii) exchange of $682.8 million in aggregate principal amount of our outstanding Second Lien Term Loans for a like principal amount of 1.75 Lien Term Loans and (iii) the issuance of warrants to the investors of the 1.5 Lien Notes and certain holders of the 1.75 Lien Term Loan. Under the terms of the indenture governing the 1.5 Lien Notes and the agreement governing the 1.75 Lien Term Loans, we may, under certain circumstances, make interest payments on the 1.5 Lien Notes and the 1.75 Lien Term Loans in cash, common shares or additional indebtedness. In connection with the closing of these transactions, the EXCO Resources Credit Agreement was amended to reduce the borrowing base to $150.0 million, permit the issuance of the 1.5 Lien Notes and the exchanges of Second Lien Term Loans, and modify certain financial covenants. See further discussion of these transactions as part of "Note 18. Subsequent Events".
Tender Offer and open market repurchases
On August 24, 2016, we completed a cash tender offer for our outstanding senior unsecured notes ("Tender Offer") that resulted in the repurchase of an aggregate of $101.3 million in principal amount of the 2022 Notes for an aggregate purchase price of $40.0 million. Holders of the 2022 Notes that were accepted for payment in the Tender Offer also received accumulated and unpaid interest. The Tender Offer was funded with the borrowings under the EXCO Resources Credit Agreement.
For the year ended December 31, 2016, we repurchased an aggregate of $26.4 million and $152.7 million in principal amount of the senior unsecured notes due September 15, 2018 ("2018 Notes") and senior unsecured notes due April 15, 2022 (“2022 Notes”), respectively, with an aggregate of $53.3 million in cash through the Tender Offer and open market repurchases. These repurchases resulted in a net gain on extinguishment of debt of $119.5 million for the year ended December 31, 2016.
EXCO Resources Credit Agreement
As of December 31, 2016, the EXCO Resources Credit Agreement had $228.6 million of outstanding indebtedness and a borrowing base of $325.0 million. The Company's available borrowing capacity was $46.2 million as of December 31, 2016 since we were not permitted to request borrowings from the lenders under the EXCO Resources Credit Agreement that would result in their aggregate exposure to exceed $285.0 million, including letters of credit, until the effective date of the next redetermination.
The maturity date of the EXCO Resources Credit Agreement is July 31, 2018. The interest rate grid for the revolving commitment under the EXCO Resources Credit Agreement ranges from London Interbank Offered Rate ("LIBOR") plus 225 bps to 325 bps (or alternate base rate ("ABR") plus 125 bps to 225 bps), depending on our borrowing base usage. On December 31, 2016, our interest rate was approximately 3.5%.
As of December 31, 2016, we were in compliance with the financial covenants (defined in the EXCO Resources Credit Agreement), which required that we:
102
• | maintain a Consolidated Current Ratio of at least 1.0 to 1.0 as of the end of any fiscal quarter. The consolidated current assets utilized in this ratio include unused commitments under the EXCO Resources Credit Agreement. As of December 31, 2016, the unused commitments were based on the Company's borrowing base of $325.0 million; |
• | maintain a ratio of consolidated EBITDAX to consolidated interest expense ("Interest Coverage Ratio") of at least 1.25 to 1.0 as of the end of any fiscal quarter. The consolidated interest expense utilized in the Interest Coverage Ratio is calculated in accordance with GAAP; therefore, this excludes cash payments under the terms of the Exchange Term Loan (as defined below), whether designated as interest or as principal amount, that reduce the carrying amount and are not recognized as interest expense; and |
• | not permit a Senior Secured Indebtedness Ratio to be greater than 2.5 to 1.0 as of the end of any fiscal quarter. Senior secured indebtedness utilized in the Senior Secured Indebtedness Ratio excludes the Second Lien Term Loans and any other secured indebtedness subordinated to the EXCO Resources Credit Agreement. |
These financial covenants were modified in connection with the amendment to the EXCO Resources Credit Agreement on March 15, 2017. Borrowings under the EXCO Resources Credit Agreement are collateralized by first lien mortgages providing a security interest of not less than 80% of the engineered value, as defined in the agreement, in our oil and natural gas properties covered by the borrowing base. We are permitted to have derivative financial instruments covering no more than 100% of forecasted production from total Proved Reserves, as defined in the agreement, for any month during the first two years of the forthcoming five-year period, 90% of forecasted production from total Proved Reserves for any month during the third year of the forthcoming five-year period and 85% of forecasted production from total Proved Reserves for any month during the fourth and fifth years of the forthcoming five-year period.
Second Lien Term Loans
On October 26, 2015, we closed a 12.5% senior secured second lien term loan with certain affiliates of Fairfax Financial Holdings Limited ("Fairfax") in the aggregate principal amount of $300.0 million ("Fairfax Term Loan"). We also closed a 12.5% senior secured second lien term loan with certain unsecured noteholders in the aggregate principal amount of $291.3 million on October 26, 2015 and $108.7 million on November 4, 2015 (“Exchange Term Loan"). The proceeds from the Exchange Term Loan were used to repurchase a portion of the outstanding 2018 Notes and 2022 Notes in exchange for the holders of such notes agreeing to act as lenders in connection with the Exchange Term Loan. The exchange was accounted for as a troubled debt restructuring pursuant to FASB ASC 470-60, Troubled Debt Restructuring by Debtors. The future undiscounted cash flows from the Exchange Term Loan through its maturity were less than the carrying amounts of the retired 2018 Notes and 2022 Notes. As a result, the carrying amount of the Exchange Term Loan is equal to the total undiscounted future cash payments, including interest and principal. All cash payments under the terms of the Exchange Term Loan, whether designated as interest or as principal amount, will reduce the carrying amount and no interest expense will be recognized. As such, our reported interest expense will be less than the contractual payments throughout the term of the Exchange Term Loan.
The Second Lien Term Loans mature on October 26, 2020 with interest payable on the last day in each calendar quarter. The Second Lien Term Loans are guaranteed by substantially all of EXCO’s subsidiaries, with the exception of certain non-guarantor subsidiaries and our jointly held equity investments with Shell, and are secured by second-priority liens on substantially all of EXCO’s assets securing the indebtedness under the EXCO Resources Credit Agreement. The Second Lien Term Loans rank (i) junior to the debt under the EXCO Resources Credit Agreement and any other priority lien obligations, (ii) pari passu to one another and (iii) effectively senior to all of our existing and future unsecured senior indebtedness, including the 2018 Notes and the 2022 Notes, to the extent of the value of collateral.
The agreements governing the Second Lien Term Loans contain covenants that, subject to certain exceptions, limit our ability and the ability of our restricted subsidiaries to, among other things:
• | pay dividends or make other distributions or redeem or repurchase our common shares; |
• | prepay, redeem or repurchase certain debt; |
• | enter into agreements restricting the subsidiary guarantors’ ability to pay dividends to us or another subsidiary guarantor, make loans or advances to us or transfer assets to us; |
• | engage in asset sales or substantially alter the business that we conduct, unless the proceeds are utilized to prepay the Second Lien Term Loans, reduce priority lien indebtedness, or reinvest in the acquisition or development of oil and gas properties; |
• | enter into transactions with affiliates; |
• | consolidate, merge or dispose of assets; |
• | incur liens; and |
• | enter into sale/leaseback transactions. |
103
In addition, the term loan agreement governing the Exchange Term Loan prohibited us from incurring, among other things and subject to certain exceptions:
• | debt under credit facilities, as defined in the term loan credit agreement governing the Exchange Term Loan, in excess of the greatest of (i) $375.0 million plus an amount equal to six and two-thirds percent of the aggregate principal amount of our outstanding indebtedness under the EXCO Resources Credit Agreement for over-advances to protect collateral, (ii) the borrowing base under the EXCO Resources Credit Agreement and (iii) 30% of modified adjusted consolidated net tangible assets (as defined in the agreement); |
• | second lien debt in excess of $700.0 million; and |
• | unsecured debt where on the date of such incurrence or after giving effect to such incurrence, our consolidated coverage ratio (as defined in the agreement) is or would be less than 2.25 to 1.0. |
The term loan agreement governing the Fairfax Term Loan prohibited us from incurring, among other things and subject to certain exceptions:
• | debt under credit facilities, as defined in the term loan credit agreement governing the Fairfax Term Loan, in excess of $375.0 million plus an amount equal to six and two-thirds percent of the aggregate principal amount of our outstanding indebtedness under the EXCO Resources Credit Agreement for over-advances to protect collateral, provided that such indebtedness may not exceed $500.0 million, unless we obtain consent from the administrative agent; |
• | second lien debt, other than the Exchange Term Loan, in an amount to be agreed upon with the administrative agent; |
• | junior lien debt, unless such debt is being used to refinance the 2018 Notes or the 2022 Notes or the terms and conditions of such junior lien debt are approved by the administrative agent; and |
• | unsecured debt, unless we obtain consent from the administrative agent. |
In addition, under the term loan credit agreement governing the Fairfax Term Loan, a change of control constitutes an event of default, which, subject to certain limitations, may allow the Fairfax Term Loan lenders to declare the Fairfax Term Loan to be due and payable, in whole or in part, including accrued but unpaid interest thereon, plus an amount equal to all interest payments that would have accrued through the Fairfax Term Loan maturity date. Under the term loan credit agreement governing the Exchange Term Loan, in the event of a change of control EXCO is required to offer to repurchase the Exchange Term Loan at 101% of the face value of the Exchange Term Loan.
In connection with the Second Lien Term Loans, on October 26, 2015, EXCO entered into an intercreditor agreement governing the relationship between EXCO’s lenders and the holders of any other lien obligations that EXCO may issue in the future and a collateral trust agreement governing the administration and maintenance of the collateral securing the Second Lien Term Loans.
The holders of the Fairfax Term Loan and holders of $382.8 million of the Exchange Term Loan consented to the exchange for 1.75 Lien Term Loans that closed on March 15, 2017. As a result, the aggregate principal amount outstanding under the Exchange Term Loan was reduced to $17.2 million subsequent to the exchange transactions. The credit agreement governing the Exchange Term Loan was amended to eliminate substantially all of the restrictive covenants and events of default included in the agreement.
2018 Notes
The 2018 Notes are guaranteed on a senior unsecured basis by a majority of EXCO’s subsidiaries, with the exception of certain non-guarantor subsidiaries and our jointly-held equity investments with Shell. Our equity investments, other than OPCO, have been designated as unrestricted subsidiaries under the indenture governing the 2018 Notes.
During 2015, EXCO repurchased an aggregate $551.2 million of the 2018 Notes in exchange for certain holders of the 2018 Notes to act as lenders under the Exchange Term Loan. Additionally, as of December 31, 2016, we had repurchased a total of $67.2 million in principal amount of the 2018 Notes for an aggregate of $18.8 million in a series of open market repurchases. As a result of the repurchases, the aggregate principal amount of outstanding 2018 Notes was reduced to $131.6 million as of December 31, 2016. Interest accrues at 7.5% per annum and is payable semi-annually in arrears on March 15 and September 15 of each year.
The indenture governing the 2018 Notes contains covenants, which may limit our ability and the ability of our restricted subsidiaries to:
• | incur or guarantee additional debt and issue certain types of preferred shares; |
104
• | pay dividends on our capital stock or redeem, repurchase or retire our capital stock or subordinated debt; |
• | make certain investments; |
• | create liens on our assets; |
• | enter into sale/leaseback transactions; |
• | create restrictions on the ability of our restricted subsidiaries to pay dividends or make other payments to us; |
• | engage in transactions with our affiliates; |
• | transfer or issue shares of stock of subsidiaries; |
• | transfer or sell assets; and |
• | consolidate, merge or transfer all or substantially all of our assets and the assets of our subsidiaries. |
On November 25, 2015, the Company obtained the requisite consents to amend the indenture governing the 2018 Notes. Following the receipt of the requisite consents, EXCO entered into a supplemental indenture which, among other things, eliminated the reduction in the amount of secured indebtedness permitted under the EXCO Resources Credit Agreement upon principal payments which results in a permanent reduction in borrowing capacity of EXCO. As a result, the amount of secured indebtedness permitted under the EXCO Resources Credit Agreement cannot exceed the greater of $1.2 billion or a calculation based on the value of our assets.
2022 Notes
The 2022 Notes were issued at 100.0% of the principal amount and bear interest at a rate of 8.5% per annum, payable in arrears on April 15 and October 15 of each year. During 2015, EXCO repurchased an aggregate $277.2 million in principal amount of the 2022 Notes in exchange for certain holders of the 2022 Notes becoming lenders under the Exchange Term Loan. On August 24, 2016, we completed the Tender Offer that resulted in the repurchases of an aggregate of $101.3 million in principal amount of the 2022 Notes for an aggregate purchase price of $40.0 million. As of December 31, 2016, through the Tender Offer and a series of open market repurchases, we had repurchased a total of $152.7 million in principal amount of the 2022 Notes for an aggregate of $46.5 million. As a result of the repurchases, the aggregate principal amount of outstanding 2022 Notes was reduced to $70.2 million as of December 31, 2016.
In conjunction with the Tender Offer, we solicited consents from the registered holders of the 2022 Notes to amend certain terms of the indenture governing the 2022 Notes. Following the consummation of the consent solicitation, we entered into a supplemental indenture governing the 2022 Notes to amend the definition of “Credit Facilities” to include debt securities as a permitted form of additional secured indebtedness, in addition to the term loans and other credit facilities currently permitted.
The 2022 Notes rank equally in right of payment to any existing and future senior unsecured indebtedness of the Company (including the 2018 Notes) and are guaranteed on a senior unsecured basis by EXCO’s consolidated subsidiaries that are guarantors of the indebtedness under the EXCO Resources Credit Agreement. The 2022 Notes were issued under the same base indenture governing the 2018 Notes and the supplemental indenture governing the 2022 Notes contains similar covenants to those in the supplemental indenture governing the 2018 Notes.
6. | Fair value measurements |
We value our derivatives and other financial instruments according to FASB ASC 820, Fair Value Measurements and Disclosures ("ASC 820"), which defines fair value as the exchange price that would be received for an asset or paid to transfer a liability ("exit price") in the principal or most advantageous market for the asset or liability in an orderly transaction between market participants on the measurement date.
We categorize the inputs used in measuring fair value into a three-tier fair value hierarchy. These tiers include:
Level 1 – Observable inputs, such as quoted market prices in active markets, for substantially identical assets and liabilities.
Level 2 – Observable inputs other than quoted prices within Level 1 for similar assets and liabilities. These include quoted prices in markets that are not active or other inputs that are observable or can be corroborated by observable market data. If the asset or liability has a specified or contractual term, the input must be observable for substantially the full term of the asset or liability.
Level 3 – Unobservable inputs that are supported by little or no market activity, generally requiring development of fair value assumptions by management.
Fair value of derivative financial instruments
105
The fair value of our derivative financial instruments may be different from the settlement value based on company-specific inputs, such as credit rating, futures markets and forward curves, and readily available buyers or sellers. During the years ended December 31, 2016 and 2015 there were no changes in the fair value level classifications. The following table presents a summary of the estimated fair value of our derivative financial instruments as of December 31, 2016 and 2015.
December 31, 2016 | ||||||||||||||||
(in thousands) | Level 1 | Level 2 | Level 3 | Total | ||||||||||||
Oil and natural gas derivative financial instruments | $ | — | $ | (27,693 | ) | $ | — | $ | (27,693 | ) | ||||||
December 31, 2015 | ||||||||||||||||
(in thousands) | Level 1 | Level 2 | Level 3 | Total | ||||||||||||
Oil and natural gas derivative financial instruments | $ | — | $ | 45,592 | $ | — | $ | 45,592 | ||||||||
We evaluate derivative assets and liabilities in accordance with master netting agreements with the derivative counterparties, but report them on a gross basis on our Consolidated Balance Sheets. Net derivative asset values are determined primarily by quoted futures prices and utilization of the counterparties’ credit-adjusted risk-free rate curves and net derivative liabilities are determined by utilization of our credit-adjusted risk-free rate curve. The credit-adjusted risk-free rates of our counterparties are based on an independent market-quoted credit default swap rate curve for the counterparties’ debt plus the LIBOR curve as of the end of the reporting period. Our credit-adjusted risk-free rate is based on the blended rate of independent market-quoted credit default swap rate curves for companies that have the same credit rating as us plus the LIBOR curve as of the end of the reporting period.
The valuation of our commodity price derivatives, represented by oil and natural gas swaps and collar contracts, is discussed below.
Oil derivatives. Our oil derivatives are swap contracts for notional barrels of oil at fixed NYMEX oil index prices. The asset and liability values attributable to our oil derivatives as of the end of the reporting period are based on (i) the contracted notional volumes, (ii) independent active NYMEX futures price quotes for oil index prices, and (iii) the applicable credit-adjusted risk-free rate curve, as described above.
Natural gas derivatives. Our natural gas derivatives consisted of swap and collar contracts for notional Mmbtus of natural gas at posted price indexes, including NYMEX HH swap and option contracts. The asset and liability values attributable to our natural gas derivatives as of the end of the reporting period are based on (i) the contracted notional volumes, (ii) independent active NYMEX futures price quotes for natural gas, (iii) the applicable credit-adjusted risk-free rate curve, as described above, and (iv) the implied rates of volatility inherent in the option contracts. The implied rates of volatility were determined based on the average of historical HH natural gas prices.
See further details on the fair value of our derivative financial instruments in “Note 4. Derivative financial instruments”.
Fair value of other financial instruments
Our financial instruments include cash and cash equivalents, accounts receivable and payable and accrued liabilities. The carrying amount of these instruments approximates fair value because of their short-term nature.
The carrying values of our borrowings under the revolving commitment of the EXCO Resources Credit Agreement approximates fair value, as it is subject to short-term floating interest rates that approximate the rates available to us for those periods.
The estimated fair values of our 2018 Notes, 2022 Notes, Exchange Term Loan and Fairfax Term Loan are presented below. The estimated fair values of the 2018 Notes and 2022 Notes have been calculated based on quoted prices in active markets. The estimated fair values of the Exchange Term Loan and the Fairfax Term Loan have been calculated based on quoted prices obtained from third-party pricing sources and are classified as Level 2.
106
December 31, 2016 | ||||||||||||||||
(in thousands) | Level 1 | Level 2 | Level 3 | Total | ||||||||||||
2018 Notes | $ | 79,028 | $ | — | $ | — | $ | 79,028 | ||||||||
2022 Notes | 35,260 | — | — | 35,260 | ||||||||||||
Exchange Term Loan | — | 294,000 | — | 294,000 | ||||||||||||
Fairfax Term Loan | — | 222,000 | — | 222,000 | ||||||||||||
December 31, 2015 | ||||||||||||||||
(in thousands) | Level 1 | Level 2 | Level 3 | Total | ||||||||||||
2018 Notes | $ | 43,170 | $ | — | $ | — | $ | 43,170 | ||||||||
2022 Notes | 48,376 | — | — | 48,376 | ||||||||||||
Exchange Term Loan | — | 278,000 | — | 278,000 | ||||||||||||
Fairfax Term Loan | — | 208,500 | — | 208,500 | ||||||||||||
Other fair value measurements
During 2016, we impaired $4.9 million of our investment in a midstream company in the East Texas and North Louisiana regions that we account for under the cost method of accounting. The estimated fair value of our cost method investment was determined based on transaction multiples for similar companies. We also impaired $4.7 million of our equity method investment in a midstream company in the Appalachia region and $1.7 million of our equity method investment in OPCO. The estimated fair value of our equity method investment in a midstream company in the Appalachia region was determined based on transaction multiples of peer companies and a discounted cash flow model from our internally generated oil and natural gas reserves for the related properties. The estimated fair value of OPCO was determined based on trading metrics of peer companies. The impairments of our cost and equity method investments were primarily a result of limited development activity in the regions. The impairments were recorded to reduce the carrying values to the fair values and were considered to be Level 3 within the fair value hierarchy.
As discussed in "Note 3. Acquisitions, divestitures and other significant events", we recorded a $23.2 million loss in "Other operating items" in our Consolidated Statements of Operations during 2016 and a corresponding credit to our "Proved developed and undeveloped oil and natural gas properties" in our balance sheet related to the settlement of litigation with a joint venture partner in the Eagle Ford shale. The fair market value of the properties transferred pursuant to the settlement was determined using a discounted cash flow model of the estimated reserves. The estimated quantities of reserves utilized assumptions based on our internal geological, engineering and financial data. We utilized NYMEX forward strip prices to value the reserves, then applied various discount rates depending on the classification of reserves and other risk characteristics. The fair value measurements utilized included significant unobservable inputs that are considered to be Level 3 within the fair value hierarchy. These unobservable inputs include management's estimates of reserve quantities, commodity prices, operating costs, development costs, discount factors and other risk factors applied to the future cash flows.
As discussed in "Note 2. Summary of significant accounting policies", we assess our unproved oil and natural gas properties for potential impairment due to an other than temporary trend that would negatively impact the fair value. During the year ended December 31, 2015, we impaired approximately $88.1 million of unproved properties to reduce the carrying value to the fair value. These impairment charges were transferred to the depletable portion of the full cost pool. We calculated the estimated fair value of our unproved properties based on the average cost per undeveloped acre or the discounted cash flow models from our internally generated oil and natural gas reserves as of December 31, 2015. The pricing utilized in the discounted cash flow models was based on NYMEX futures, adjusted for basis differentials. Our oil and natural gas properties were further discounted based on the classification of the underlying reserves and management's assessment of recoverability. The fair value measurements utilized included significant unobservable inputs that were considered to be Level 3 within the fair value hierarchy. These unobservable inputs include management's estimates of reserve quantities, commodity prices, operating costs, development costs, discount factors and other risk factors applied to the future cash flows. The average cost per undeveloped acre was based on recent comparable market transactions in each region.
7. | Environmental regulation |
Various federal, state and local laws and regulations covering discharge of materials into the environment, or otherwise relating to the protection of the environment, may affect our operations and the costs of our oil and natural gas exploitation, development and production operations. We do not anticipate that we will be required in the foreseeable future to expend amounts material in relation to the financial statements taken as a whole by reason of environmental laws and regulations.
107
Because these laws and regulations are constantly being changed, we are unable to predict the conditions and other factors over which we do not exercise control that may give rise to environmental liabilities affecting us.
8. | Commitments and contingencies |
The following table presents our future minimum obligations under our commercial commitments as of December 31, 2016. The commitments do not include those of our equity method investments.
(in thousands) | Gathering and firm transportation services | Other fixed commitments | Drilling contracts | Operating leases and other | Total | |||||||||||||||
2017 | $ | 117,348 | $ | 4,557 | $ | 10,050 | $ | 4,923 | $ | 136,878 | ||||||||||
2018 | 113,628 | 3,222 | — | 3,808 | 120,658 | |||||||||||||||
2019 | 73,548 | 2,415 | — | 3,148 | 79,111 | |||||||||||||||
2020 | 45,403 | 1,949 | — | 1,538 | 48,890 | |||||||||||||||
2021 | 33,306 | 1,601 | — | — | 34,907 | |||||||||||||||
Thereafter | 127,750 | — | — | — | 127,750 | |||||||||||||||
Total | $ | 510,983 | $ | 13,744 | $ | 10,050 | $ | 13,417 | $ | 548,194 | ||||||||||
Gathering and firm transportation services
We have entered into firm transportation and gathering agreements with pipeline companies to facilitate sales from our East Texas and North Louisiana production. Gathering and firm transportation services presented in the tables within this footnote represent our gross commitments under these contracts, and a portion of these costs will be incurred by working interest and other owners. We report these costs as gathering and transportation expenses or as a reduction in total sales price received from the purchaser. In addition, our variable rate firm transportation and gathering agreements do not have a minimum volume commitment and are not included in the tables within this footnote. As such, our gathering and firm transportation services presented in the table above may not be representative of the amounts reported as gathering and transportation expenses in our Consolidated Financial Statements.
At December 31, 2016, our firm transportation and gathering agreements covered the following gross volumes of natural gas:
(in Bcf) | Firm transportation services | Gathering services | ||||
2017 | 269 | 110 | ||||
2018 | 269 | 100 | ||||
2019 | 269 | — | ||||
2020 | 177 | — | ||||
2021 | 146 | — | ||||
Thereafter | 560 | — | ||||
Total | 1,690 | 210 | ||||
Natural gas sales and firm transportation contract litigation
During the third quarter of 2016, we terminated our sales and transportation contracts with Enterprise Products Operating LLC (“Enterprise”) and Acadian Gas Pipeline System (“Acadian”), respectively. We transported natural gas produced from our operated wells in North Louisiana through Acadian, and Enterprise was a purchaser of certain volumes of our natural gas, until we terminated the contracts. Enterprise and Acadian are part of the corporate family of Enterprise Products Partners L.P. (“EPD”). Acadian is an indirect, wholly-owned subsidiary of EPD that owns and operates the Acadian natural gas pipeline system. The agreement with Acadian provided for the firm transportation of 150,000 Mmbtu/day and 175,000 Mmbtu/day of natural gas at reservation fees of $0.25 and $0.20, respectively. In addition, the sales contract with Enterprise contemplated that we could, subject to certain limitations and exclusions, sell 75,000 Mmbtu/day of natural gas at a $0.25 reduction from market index prices. The primary term for these contracts had been through October 31, 2025. The fees described represent our gross commitments and a portion of these costs is allocated to working interest and other owners. The Acadian firm transportation agreement is accounted for as gathering and transportation expenses, and the Enterprise sales contract is accounted for as a reduction in the total sales price within revenues.
108
Under the parties’ sales and transportation agreements, Enterprise owed us for July 2016 natural gas sales, and we owed Acadian for July 2016 transportation fees. The amount owed to us by Enterprise exceeded the amount owed by us to Acadian. We notified Enterprise in writing of its failure to pay and gave Enterprise opportunity to cure. When Enterprise failed to cure, we gave written notice to Enterprise and Acadian that we were terminating the sales and transportation agreements. Enterprise and Acadian subsequently filed an action in Harris County, Texas, against us alleging that we could not terminate the parties’ agreements despite Enterprise's uncured payment default under the natural gas sales agreement, and further alleged that we were in breach of the firm transportation agreements. On October 17, 2016, we filed a counterclaim asserting that Enterprise was the breaching party because it improperly withheld payment for natural gas we delivered to it and the amounts owed by Enterprise exceeded the amounts owed by us to Acadian. We are also seeking a declaration that we properly terminated the contracts with Enterprise and Acadian. We cannot currently estimate or predict the outcome of the litigation but we plan to vigorously defend our right to terminate the contracts and to seek the amounts owed to us for delivered natural gas.
We are no longer selling natural gas under the Enterprise sales contract or transporting natural gas under the Acadian firm transportation contract effective as of the termination date. The Company is accounting for these contracts in accordance with FASB ASC 450 ("ASC 450"), Contingencies, which states a contingency that might result in a gain should not be reflected until it is realized or realizable. There is a rebuttable presumption that a claim subject to litigation does not meet the criteria to be realized or realizable; therefore, the termination of these contracts will not be reflected in our financial results until the litigation is resolved. Upon resolution of the litigation, we will adjust the previously recognized amounts to reflect the outcome of the litigation. As of December 31, 2016, we recorded a $6.4 million receivable related to the net amounts owed by Enterprise prior to the termination of the contracts and an accrual of $10.5 million for costs subsequent to the termination of the contract in accordance with the guidance related to contingencies in ASC 450.
Other commitments
We lease our offices and certain equipment. Our rental expenses were approximately $2.6 million, $3.4 million and $5.1 million for the years ended December 31, 2016, 2015 and 2014, respectively. We have also entered into drilling rig contracts primarily to develop our assets in the East Texas and North Louisiana regions. The actual drilling costs under these contracts will be incurred by working interest owners in the development of the related properties. These contracts are short-term in nature and are dependent on our planned drilling program.
Our other fixed commitments primarily consist of marketing contracts in which we are obligated to pay the buyer a fee if we fail to deliver minimum quantities of natural gas.
In the ordinary course of business, we are periodically a party to lawsuits. From time to time, oil and natural gas producers, including EXCO, have been named in various lawsuits alleging underpayment of royalties and the allocation of production costs in connection with oil and natural gas sold. We have reserved our estimated exposure and do not believe it was material to our current, or future, financial position or results of operations.
We believe that we have properly reflected any potential exposure in our financial position when determined to be both probable and estimable. See further discussion of the litigation related to the Participation Agreement as part of "Item 1A. Risk Factors", "Item 3. Legal Proceedings" and "Item 7. Management's Discussion and Analysis".
9. | Employee benefit plans |
We sponsor a 401(k) plan for our employees and matched 100% of employee contributions during 2015 and 2014. Our matching program was suspended during 2016 in response to depressed oil and natural gas prices which have negatively impacted our business and operations. The Company reinstated its matching program effective January 1, 2017 in which it will match 100% of employee contributions up to a maximum of 3% of each employee's pay. Our matching contributions were $5.2 million and $7.1 million for the years ended December 31, 2015 and 2014, respectively.
10. | Earnings per share |
The following table presents the basic and diluted earnings (loss) per share computations for the years ended December 31, 2016, 2015 and 2014:
109
Year Ended December 31, | ||||||||||||
(in thousands, except per share data) | 2016 | 2015 | 2014 | |||||||||
Basic net income (loss) per common share: | ||||||||||||
Net income (loss) | $ | (225,258 | ) | $ | (1,192,381 | ) | $ | 120,669 | ||||
Weighted average common shares outstanding | 279,287 | 273,621 | 268,258 | |||||||||
Net income (loss) per basic common share | $ | (0.81 | ) | $ | (4.36 | ) | $ | 0.45 | ||||
Diluted net income (loss) per common share: | ||||||||||||
Net income (loss) | $ | (225,258 | ) | $ | (1,192,381 | ) | $ | 120,669 | ||||
Weighted average common shares outstanding | 279,287 | 273,621 | 268,258 | |||||||||
Dilutive effect of: | ||||||||||||
Stock options | — | — | — | |||||||||
Restricted shares and restricted share units | — | — | 118 | |||||||||
Warrants | — | — | — | |||||||||
Weighted average common shares and common share equivalents outstanding | 279,287 | 273,621 | 268,376 | |||||||||
Net income (loss) per diluted common share | $ | (0.81 | ) | $ | (4.36 | ) | $ | 0.45 | ||||
The computation of diluted EPS excluded 76,463,063, 39,544,192 and 14,316,409 antidilutive common share equivalents for the years ended December 31, 2016, 2015 and 2014, respectively. Our antidilutive share equivalents during 2016 and 2015 included warrants issued to ESAS. See "Note 11. Equity-based compensation" for additional information on the warrants issued to ESAS. The issuance of warrants and potential for interest payments in the Company's common shares related to the 1.5 Lien Notes and 1.75 Lien Term Loans could materially change the number of common shares or potential common shares outstanding. See further discussion of the warrants and potential common shares to be issued in connection with the 1.5 Lien Notes and 1.75 Lien Term Loans in "Note 18. Subsequent Events."
11.Equity-based compensation
Stock options and awards
Description of plan
Our 2005 Incentive Plan is a shareholder-approved plan authorizing the issuance of up to 45,500,000 restricted shares, restricted share units and stock options. As of December 31, 2016 and 2015, there were 14,293,850 and 17,773,172 shares, respectively, available for issuance under the 2005 Incentive Plan. Option grants and restricted share grants count as one share and 1.74 shares, respectively, against the total number of shares available for grant. The holders of restricted shares, excluding restricted share units ("RSU") discussed below, have voting rights, and upon vesting, the right to receive all accrued and unpaid dividends.
Stock options
Our outstanding stock option expiration dates range from 5 to 10 years following the date of grant and have a weighted average remaining life of 3.3 years. Pursuant to the 2005 Incentive Plan, 25% of the options vest immediately with an additional 25% to vest on each of the next three anniversaries of the date of the grant.
110
The following table summarizes stock option activity related to our employees under the 2005 Incentive Plan for the years ended December 31, 2016, 2015 and 2014:
Stock Options | Weighted average exercise price per share | Weighted average remaining terms (in years) | Aggregate intrinsic value | |||||||||||
Options outstanding at December 31, 2013 | 11,711,743 | $ | 12.69 | |||||||||||
Granted | 141,525 | 5.24 | ||||||||||||
Forfeitures | (1,700,250 | ) | 12.71 | |||||||||||
Exercised | (2,500 | ) | 5.22 | |||||||||||
Options outstanding at December 31, 2014 | 10,150,518 | 12.58 | ||||||||||||
Granted | — | — | ||||||||||||
Forfeitures | (4,538,858 | ) | 12.30 | |||||||||||
Exercised | — | — | ||||||||||||
Options outstanding at December 31, 2015 | 5,611,660 | 12.81 | ||||||||||||
Granted | — | — | ||||||||||||
Forfeitures | (3,230,734 | ) | 12.86 | |||||||||||
Exercised | — | — | ||||||||||||
Options outstanding at December 31, 2016 | 2,380,926 | $ | 12.74 | 3.3 | $ | — | ||||||||
Options exercisable at December 31, 2016 | 2,365,589 | $ | 12.79 | 3.3 | $ | — | ||||||||
The weighted average fair value of stock options on the date of the grant during the year ended December 31, 2014 was $2.23.
The fair value of each option grant is estimated on the date of grant using the Black-Scholes option pricing model. The exercise price of the options is based on the fair market value of the common shares on the date of grant. No options were granted during 2016 or 2015. The following assumptions were used for the options included in the table above, for the year ended December 31:
2014 | ||
Expected life | 7.5 years | |
Risk-free rate of return | 2.25 - 2.61 % | |
Volatility | 59.46 - 59.61 % | |
Dividend yield | 3.36 - 4.34 % | |
Expected life was determined based on EXCO's exercise history. Risk-free rate of return is a rate of a similar term U.S. Treasury zero coupon bond. Volatility was determined based on the weighted average of historical volatility of our common shares. Dividend yield was determined based on EXCO's expected annual dividend and the market price of our common stock on the date of grant.
Service-based restricted share awards
Our service-based restricted share awards are valued at the closing price of our common shares on the date of grant and vest over a range of one to five years. A summary of our service-based restricted share activity for the years ended December 31, 2016, 2015 and 2014 are as follows:
111
Shares | Weighted average grant date fair value per share | |||||||
Non-vested shares outstanding at December 31, 2013 | 1,928,314 | $ | 9.26 | |||||
Granted | 1,339,782 | 5.20 | ||||||
Vested | (1,109,866 | ) | 9.79 | |||||
Forfeited | (280,301 | ) | 6.89 | |||||
Non-vested shares outstanding at December 31, 2014 | 1,877,929 | $ | 6.40 | |||||
Granted | 4,414,470 | 1.05 | ||||||
Vested | (847,446 | ) | 6.80 | |||||
Forfeited | (903,383 | ) | 3.17 | |||||
Non-vested shares outstanding at December 31, 2015 | 4,541,570 | $ | 1.77 | |||||
Granted | 1,487,309 | 1.22 | ||||||
Vested | (2,171,186 | ) | 1.71 | |||||
Forfeited | (1,670,073 | ) | 2.02 | |||||
Non-vested shares outstanding at December 31, 2016 | 2,187,620 | $ | 1.27 | |||||
Market-based restricted share awards
On August 13, 2013, EXCO’s officers were granted a market-based restricted share award with vesting dependent on the Company's common share price achieving certain price targets. There were 164,200 shares outstanding on December 31, 2016, including 82,100 shares that will be vested following any 30 consecutive trading days in which the company’s common stock equals or exceeds $10.00 per share, and 82,100 shares will be vested following any 30 consecutive trading days in which the Company’s common shares equals or exceeds $15.00 per share ("Target Price Awards"). The shares expire on August 13, 2018 and are subject to vesting provisions depending on when the target price attainment date occurs. No such awards were granted in 2016, 2015 or 2014 and no awards have vested to date.
During 2016 and 2014, we granted RSUs to our officers and certain employees that have vesting percentages between 0% and 200% depending on EXCO's total shareholder return in comparison to an identified peer group. Our market-based restricted share units are valued on the date of grant and vest over a range of three years, subject to the achievement of certain criteria. Total compensation expense is recognized over the vesting period using the straight-line method.
The Company has discretion to convert certain vested awarded units, if any, into a cash payment equal to the fair market value of a share of common stock, multiplied by the number of vested units, or the number of whole shares of common stock equal to the number of vested units, if any. These RSUs met the criteria for equity classification per ASC 718, however we will assess the classification of these RSUs throughout their life, and if it becomes probable that the Company will settle the awards in cash, we will reclassify the award to a liability.
The grant date fair values of our market-based restricted share awards and restricted share units were determined using a Monte Carlo model which uses company-specific inputs to generate different stock price paths. The range of assumptions used in the Monte Carlo model for the RSUs granted in 2016 and 2014 are as follows:
Assumption | 2016 | 2014 | ||
Risk-free rate of return | 0.45 - 0.71 % | 0.90 % | ||
Volatility | 119.83 % | 48.73 % | ||
Dividend yield | 0.00 % | 3.46 % | ||
A summary of our market-based restricted share activity for the years ended December 31, 2016 is as follows:
112
Target Price Awards | RSUs | |||||||||||||
Shares | Weighted average grant date fair value per share | Shares | Weighted average grant date fair value per share | |||||||||||
Non-vested shares/units outstanding at December 31, 2015 | 290,200 | $ | 6.36 | 546,878 | $ | 7.33 | ||||||||
Granted (1) | — | — | 6,848,934 | 1.63 | ||||||||||
Vested | — | — | — | — | ||||||||||
Forfeited | (126,000 | ) | 6.36 | (2,335,440 | ) | 2.46 | ||||||||
Non-vested shares/units outstanding at December 31, 2016 | 164,200 | $ | 6.36 | 5,060,372 | $ | 1.85 | ||||||||
(1) | RSUs granted reflect the number of units granted. The actual payout of the shares granted in 2016 may be between 0% and 150% of the RSUs granted. The Company has discretion to convert vested awards into a cash payment equal to the fair market value of a share of common stock, multiplied by the number of vested units, or the number of whole shares of common stock equal to the number of vested units, if any. |
Liability-classified awards
During 2015, EXCO’s officers were granted 2,496,250 performance-based share units ("PSU") as a part of its equity compensation program. Each participant is eligible to vest in and receive a number of PSUs, ranging from 0% to 200% of the target number of PSUs granted, based on the attainment of total shareholder return goals on the period commencing on and including the date of grant and ending on the third anniversary of the grant date. Each PSU represents a non-equity unit with a conversion value equal to the fair market value of a share of EXCO’s common stock. Under the terms of the agreements, the Company is required to convert vested PSUs into a cash payment in an aggregate amount equal to the number of vested PSUs multiplied by the fair market value of a share of common stock as of the vesting date, less applicable withholdings and deductions, as soon as administratively practicable following the determination that the vesting conditions have been achieved.
A summary of the PSUs for the year ended December 31, 2016 is as follows:
Shares | Weighted average fair value per share | ||||||
Non-vested units outstanding at December 31, 2015 | 2,115,000 | $ | 2.39 | ||||
Granted | — | — | |||||
Vested | — | — | |||||
Forfeited | (1,085,000 | ) | 2.12 | ||||
Non-vested units outstanding at December 31, 2016 | 1,030,000 | $ | 1.66 | ||||
The PSUs are considered liability-classified awards because of the cash-settlement feature. At December 31, 2016, we recorded a liability of $0.4 million related to the PSUs included in the "Asset retirement obligations and other long-term liabilities" line item on our Consolidated Balance Sheets. Compensation costs associated with the PSUs are re-measured each interim reporting period and an adjustment is recorded in the "General and administrative expenses" line item in our Consolidated Statements of Operations.
The fair values of the PSUs were determined using a Monte Carlo model. The ranges for the assumptions used in the Monte Carlo model for the PSUs during 2016 and 2015 are as follows:
Assumption | 2016 | 2015 | ||
Risk-free rate of return | 0.72 - 1.02 % | 0.85 - 1.18 % | ||
Volatility | 114.41 - 150.91 % | 62.58 - 95.79 % | ||
Dividend yield | 0.00 % | 0.00 % | ||
Warrants
On September 8, 2015, EXCO issued warrants to ESAS in four tranches to purchase an aggregate of 80,000,000 common shares. The warrants were issued as an additional performance incentive under the services and investment agreement which is described in more detail in "Note 13. Related party transactions". The table below lists the number of common shares issuable upon exercise of the warrants at each exercise price and the term of the warrants.
113
Tranche | Number of shares issuable | Exercise Price | Term | |||
Tranche A | 15,000,000 | $2.75 | April 30, 2019 | |||
Tranche B | 20,000,000 | $4.00 | March 31, 2020 | |||
Tranche C | 20,000,000 | $7.00 | March 31, 2021 | |||
Tranche D | 25,000,000 | $10.00 | March 31, 2021 | |||
The warrants will vest on March 31, 2019 and their exercisability is subject to EXCO’s common share price achieving certain performance hurdles as compared to the peer group. If EXCO’s performance rank is in the bottom half of the peer group, then the warrants will be forfeited and void. The number of the exercisable shares under the warrants increases linearly from 32,000,000 to 80,000,000 as EXCO’s performance rank increases from the 50th to 75th percentile, as compared to the peer group. If EXCO’s performance rank is in the 75th percentile or above, then all 80,000,000 warrants will be exercisable. The performance measurement period began on March 31, 2015 and will end on March 31, 2019.
Prior to March 31, 2019, if EXCO terminates the agreement for any reason other than for cause (as defined in the agreement), or ESAS terminates the agreement for cause (as defined in the agreement), then all of the warrants will fully vest and become exercisable. Prior to March 31, 2019, if ESAS terminates the agreement for any reason other than for cause, or EXCO terminates the agreement for cause, then each of the warrants will be canceled and forfeited.
In accordance with ASC 718, the grant date of the warrants was established upon approval of EXCO’s shareholders and the closing of the services and investment agreement which occurred on September 8, 2015. The fair value of the warrants is dependent on factors such as our share price, historical volatility, risk-free rate and performance relative to our peer group and is determined using a Monte Carlo model. The table below shows the aggregate estimated fair value of the warrants as of December 31, 2016:
Tranche | Number of shares issuable | Estimated fair value per warrant | Estimated fair value (in millions) | |||
Tranche A | 15,000,000 | $0.45 | $6.8 | |||
Tranche B | 20,000,000 | $0.52 | 10.4 | |||
Tranche C | 20,000,000 | $0.52 | 10.4 | |||
Tranche D | 25,000,000 | $0.48 | 12.0 | |||
$39.6 | ||||||
The fair values of the warrants were determined using a Monte Carlo model. The ranges for the assumptions used in the Monte Carlo model for the warrants during 2016 and 2015 are as follows:
Assumption | 2016 | 2015 | ||
Risk-free rate of return | 0.69 - 1.76 % | 1.05 - 1.80 % | ||
Volatility | 100.98 - 137.25 % | 75.18 - 86.13 % | ||
Dividend yield | 0.00 % | 0.00 % | ||
Compensation costs
All of our stock options, restricted shares and PSUs are accounted for in accordance with ASC 718 and are classified as equity except for the PSUs. As required by ASC 718, the granting of options and awards to our employees under the 2005 Incentive Plan are share-based payment transactions and are to be treated as compensation expense by us with a corresponding increase to additional paid-in capital.
Total share-based compensation to employees to be recognized on unvested options, restricted share awards and RSUs as of December 31, 2016 was $7.9 million and will be recognized over a weighted average period of 1.8 years.
The measurement of the warrants is accounted for in accordance with ASC 505-50, which requires the warrants to be re-measured each interim reporting period until the completion of the services under the agreement and an adjustment is recorded in the statement of operations within equity-based compensation expense. For the years ended December 31, 2016 and 2015, we recognized equity-based compensation related to the warrants of $11.3 million and $3.2 million, respectively.
114
The following is a reconciliation of our compensation expense for the years ended December 31, 2016, 2015 and 2014:
Year Ended December 31, | ||||||||||||
(in thousands) | 2016 | 2015 | 2014 | |||||||||
Equity-based compensation expense (1) | $ | 14,778 | $ | 7,198 | $ | 4,962 | ||||||
Equity-based compensation capitalized | 752 | 3,428 | 5,498 | |||||||||
Total equity-based compensation (2) | $ | 15,530 | $ | 10,626 | $ | 10,460 | ||||||
(1) | Equity-based compensation expense includes share-based compensation to employees and equity-based compensation for warrants issued to ESAS in 2015. Equity-based compensation expense also includes $0.7 million and $0.5 million of share-based compensation related to the Company's Management Incentive Plan payable in fully-vested restricted shares for the years ended December 31, 2016 and 2015, respectively. |
(2) | Total equity-based compensation does not include compensation expense on liability-classified awards which was not significant in any period presented. |
We did not recognize a tax benefit attributable to our equity-based compensation for the years ended December 31, 2016, 2015 and 2014.
12. | Income taxes |
The income tax provision attributable to our income (loss) before income taxes for the years ended December 31, 2016, 2015 and 2014, consisted of the following:
Year ended December 31, | ||||||||||||
(in thousands) | 2016 | 2015 | 2014 | |||||||||
Current: | ||||||||||||
Federal | $ | — | $ | — | $ | — | ||||||
State | — | — | — | |||||||||
Total current income tax (benefit) | $ | — | $ | — | $ | — | ||||||
Deferred: | ||||||||||||
Federal | $ | (73,214 | ) | $ | (414,834 | ) | $ | 45,797 | ||||
State | (7,248 | ) | (45,009 | ) | 18,960 | |||||||
Valuation allowance | 83,264 | 459,843 | (64,757 | ) | ||||||||
Total deferred income tax (benefit) | 2,802 | — | — | |||||||||
Total income tax (benefit) | $ | 2,802 | $ | — | $ | — | ||||||
We have net operating loss carryforwards ("NOLs") for United States income tax purposes that have been generated from our operations. Our NOLs are scheduled to expire if not utilized between 2028 and 2036. As a result of the repurchase of a portion of our senior unsecured notes during 2015 and 2016, we had cancellation of debt income for tax purposes. We reduced our NOLs by the amount of cancellation of debt income of approximately $125.8 million and $538.0 million during 2016 and 2015, respectively. The utilization of our NOLs to offset taxable income in future periods may be limited if we undergo an ownership change based on the criteria in Section 382 of the Internal Revenue Code. See further information as part of "Item 1A. Risk Factors - Our ability to use net operating loss carryovers to reduce future tax payments may be limited."
NOLs and alternative minimum tax credits available for utilization as of December 31, 2016 were approximately $2.2 billion and $1.5 million, respectively. We generated a net capital loss of approximately $105.6 million during the year ended December 31, 2014 as a result of the sale of our interest in Compass.
Deferred income taxes reflect the net tax effects of temporary differences between the carrying amounts of assets and liabilities for financial reporting purposes and the amounts used for income tax purposes. Significant components of our deferred tax liabilities and assets are as follows:
115
(in thousands) | December 31, 2016 | December 31, 2015 | ||||||
Non-current deferred tax assets: | ||||||||
Net operating loss and AMT credits carryforwards | $ | 863,164 | $ | 689,441 | ||||
Capital loss carryforwards | 40,356 | 40,356 | ||||||
Equity-based compensation | 20,181 | 17,372 | ||||||
Oil and natural gas properties, gathering assets, and equipment | 254,751 | 356,471 | ||||||
Debt restructuring | 99,934 | 122,900 | ||||||
Goodwill | — | 1,308 | ||||||
Derivative financial instruments | 7,031 | — | ||||||
Investment in partnerships | 82,069 | 76,099 | ||||||
Other | 2,473 | 3,387 | ||||||
Total non-current deferred tax assets | 1,369,959 | 1,307,334 | ||||||
Valuation allowance | (1,369,959 | ) | (1,286,695 | ) | ||||
Total non-current deferred tax assets | — | 20,639 | ||||||
Non-current deferred tax liabilities: | ||||||||
Goodwill | $ | (2,802 | ) | $ | — | |||
Derivative financial instruments | — | (20,639 | ) | |||||
Total non-current deferred tax liabilities | (2,802 | ) | (20,639 | ) | ||||
Net non-current deferred tax assets (liabilities) | $ | (2,802 | ) | $ | — | |||
A reconciliation of our income tax provision (benefit) computed by applying the statutory United States federal income tax rate to our income (loss) before income taxes for the years ended December 31, 2016, 2015 and 2014 is presented in the following table:
Year Ended December 31, | ||||||||||||
(in thousands) | 2016 | 2015 | 2014 | |||||||||
Federal income taxes (benefit) provision at statutory rate of 35% | $ | (77,860 | ) | $ | (417,333 | ) | $ | 42,234 | ||||
Increases (reductions) resulting from: | ||||||||||||
Adjustments to the valuation allowance | 83,264 | 459,843 | (64,757 | ) | ||||||||
Non-deductible compensation | 4,631 | 2,399 | 3,409 | |||||||||
State taxes net of federal benefit | (7,248 | ) | (45,009 | ) | 3,464 | |||||||
State tax rate change | — | — | 15,496 | |||||||||
Other | 15 | 100 | 154 | |||||||||
Total income tax provision | $ | 2,802 | $ | — | $ | — | ||||||
During the year ended December 31, 2016, we recognized deferred income tax expense of $2.8 million related to a deferred tax liability for tax deductible goodwill. During the year ended December 31, 2016, the book basis of goodwill exceeded the tax basis that caused the previous book and tax basis differences to change from a deferred tax asset to a deferred tax liability. The deferred tax liability related to goodwill is considered to have an indefinite life based on the nature of the underlying asset and cannot be offset under GAAP with a deferred tax asset with a definite life, such as NOLs. However, the deferred income tax expense is not expected to result in cash payments of income taxes in the foreseeable future.
During years ended 2015 and 2014, both federal and state income tax expense or tax benefit were reduced to zero by a corresponding increase or decrease to the valuation allowance previously recognized against net deferred tax assets. The net result was no income tax provision for years ended December 31, 2015 and 2014.
We adopted the provisions of ASC 740-10 on January 1, 2007. As a result of the implementation of ASC 740-10, the Company did not recognize any liabilities for unrecognized tax benefits. As of December 31, 2016, 2015 and 2014, the Company's policy is to recognize interest related to unrecognized tax benefits of interest expense and penalties in operating expenses. The Company has not accrued any interest or penalties relating to unrecognized tax benefits in the consolidated financial statements.
116
We file a corporate consolidated income tax return for U.S. federal income tax purposes and file income tax returns in various states. With few exceptions, we are no longer subject to U.S. federal and state and local examinations by tax authorities for years before 2007.
13. | Related party transactions |
OPCO
OPCO serves as the operator of our wells in the Appalachia JV and we advance funds to OPCO on an as needed basis. We did not advance any funds to OPCO during the years ended December 31, 2016, 2015 or 2014. OPCO may distribute any excess cash equally between us and Shell when its operating cash flows are sufficient to meet its capital requirements. There are service agreements between us and OPCO whereby we provide administrative and technical services for which we are reimbursed. For the years ended December 31, 2016, 2015 and 2014 these transactions included the following:
Year Ended December 31, | |||||||||
(in thousands) | 2016 | 2015 | 2014 | ||||||
Amounts received from OPCO | 15,016 | 30,577 | 53,002 | ||||||
As of December 31, 2016 and 2015, the amounts owed under the service agreements were as follows:
(in thousands) | December 31, 2016 | December 31, 2015 | ||||||
Amounts due to EXCO (1) | $ | 618 | $ | 1,733 | ||||
Amounts due from EXCO (1) | 13,624 | 10,410 | ||||||
(1) | Advances to OPCO are recorded in "Inventory and other" on our Consolidated Balance Sheets. Any amounts we owe to OPCO are netted against the advance until the advances are utilized. If the advances are fully utilized, we record amounts owed in "Accounts payable and accrued liabilities" on our Consolidated Balance Sheets. |
ESAS
On March 31, 2015, we entered into a four year services and investment agreement with ESAS. ESAS is owned by Bluescape Energy Recapitalization and Restructuring Fund III LP, which is directed by its general partner, Bluescape Energy Partners III GP LLC ("Bluescape"). As part of this agreement, ESAS provides us with certain strategic advisory services, including the development and execution of a strategic improvement plan. On September 8, 2015, we closed the services and investment agreement with ESAS and C. John Wilder, Executive Chairman of Bluescape, was appointed as a member of our Board of Directors and as Executive Chairman of the Board of Directors.
On September 8, 2015, ESAS completed the purchase of 5,882,353 common shares from EXCO, par value $0.001 per share, at a price per share of $1.70, pursuant to the agreement. In addition, ESAS purchased additional 12,464,130 of common shares during the fourth quarter of 2015, completing its obligation to purchase at least $13.5 million of common shares through open market purchases. As of December 31, 2016, ESAS was the beneficial owner of approximately 6.6% of our outstanding common shares.
As consideration for the services to be provided under the agreement, EXCO pays ESAS a monthly fee of $300,000 and an annual incentive payment of up to $2.4 million per year that is based on EXCO’s common share price achieving certain performance hurdles as compared to a peer group. The monthly fees were held in escrow until one year following the closing of the agreement and reported as "Restricted cash" on our Consolidated Balance Sheets.
If EXCO’s performance rank is below the 50th percentile of the peer group, then the incentive payment will be zero. The incentive payment increases linearly from $1.0 million to $2.4 million as EXCO’s performance rank increases from the 50th to 75th percentile, as compared to the peer group. If EXCO’s performance rank is in the 75th percentile or above, then the incentive payment will be $2.4 million.
For the years ended December 31, 2016 and 2015, these transactions included the following:
117
Year Ended December 31, | ||||||
(in thousands) | 2016 | 2015 | ||||
Amounts paid to ESAS (1) | 8,401 | — | ||||
(1) | Amounts paid to ESAS in 2016 consisted of (i) the monthly fees including fees previously held in escrow and (ii) a $2.4 million annual incentive payment as a result of EXCO achieving a performance rank above the 75th percentile of the peer group. |
As of December 31, 2016 and 2015, the amounts due to ESAS for the services performed under the services and investment agreements were as follows:
(in thousands) | December 31, 2016 | December 31, 2015 | ||||||
Amounts due to ESAS (1) | $ | 300 | $ | 4,500 | ||||
(1) | Amounts due to ESAS are recorded in "Accounts payable and accrued liabilities" in our Consolidated Balance Sheets. The amount at December 31, 2015 includes an accrual for the annual incentive payment of $1.8 million. We did not make an accrual for the annual incentive payment at December 31, 2016 as a result of EXCO's performance rank. |
As an additional performance incentive under the services and investment agreement, EXCO issued warrants to ESAS in four tranches to purchase an aggregate of 80,000,000 common shares. See "Note 11. Equity-based compensation" for further discussion of the warrants.
In the first quarter of 2016, ESAS entered into an agreement with an unaffiliated lender under the Exchange Term Loan, pursuant to which the lender made periodic payments to ESAS or received periodic payments from ESAS based on changes in the market value of the Exchange Term Loan, and the lender made periodic payments to ESAS based on the interest rate of the Exchange Term Loan. As of December 31, 2016, the agreement effectively provided ESAS with the economic consequences of ownership of approximately $47.9 million in principal amount of the Exchange Term Loan without direct ownership of, or consent rights with respect to, the Exchange Term Loan. In January 2016, ESAS irrevocably purchased and assumed all the rights and obligations from this unaffiliated lender and became a direct lender under a portion of the Exchange Term Loan. On March 15, 2017, ESAS exchanged its interests in the Exchange Term Loan for a like amount of the 1.75 Lien Term Loans and received a consent fee of $1.6 million in cash. Furthermore, ESAS is an investor of the 1.5 Lien Notes and holds $70.0 million in aggregate principal amount. In connection with the issuance of the 1.5 Lien Notes, ESAS received warrants representing the right to purchase an aggregate of 75,268,818 common shares at an exercise price equal to $0.93 per share and a commitment fee of $2.1 million in cash. See "Note 18. Subsequent Events" for additional information.
As described above, ESAS is a wholly owned subsidiary of Bluescape, and C. John Wilder, the Executive Chairman of our Board of Directors, is Bluescape’s Executive Chairman. As Bluescape’s Executive Chairman, Mr. Wilder has the power to direct the affairs of Bluescape and, indirectly, ESAS, and may be deemed to share ESAS’s interest in the 1.5 Lien Notes, 1.75 Lien Term Loans and our common shares.
Fairfax
Hamblin Watsa Investment Counsel Ltd. (“Hamblin Watsa”), the investment manager of Fairfax and certain affiliates thereof, was the administrative agent of the Fairfax Term Loan and certain affiliates of Fairfax were lenders under the Fairfax Term Loan. Samuel A. Mitchell, a member of our Board of Directors, is a Managing Director of Hamblin Watsa and a member of Hamblin Watsa’s investment committee, which consists of seven members that manage the investment portfolio of Fairfax. As an administrative agent of the Fairfax Term Loan, Fairfax received a one-time fee of $6.0 million from EXCO upon closing. In addition, certain affiliates of Fairfax were lenders under a portion of the Exchange Term Loan. As of December 31, 2016, affiliates of Fairfax were the record holders of approximately $112.1 million in principal amount of the Exchange Term Loan.
For the years ended December 31, 2016 and 2015, Fairfax received $49.9 million and $6.9 million, respectively, of interest payments under the Second Lien Term Loans. At December 31, 2016, Fairfax was the beneficial owner of approximately 9.9% of our outstanding common shares. See “Note 5. Debt” and "Note 18. Subsequent Events" for additional information.
On March 15, 2017, Fairfax exchanged its interests in the Fairfax Term Loan and the Exchange Term Loan for the 1.75 Lien Term Loan and received warrants representing the right to purchase an aggregate of 19,412,035 common shares at an exercise price equal to $0.01 per share. Furthermore, Fairfax is an investor of the 1.5 Lien Notes and holds $151.0 million in aggregate principal amount. In connection with the issuance of the 1.5 Lien Notes, Fairfax received warrants representing the
118
right to purchase an aggregate of 162,365,599 common shares at an exercise price equal to $0.93 per share and additional warrants representing the right to purchase an aggregate of 6,471,433 common shares at an exercise price equal to $0.01 per share.
Oaktree
Oaktree Capital Management, LP ("Oaktree"), is an investor of the 1.5 Lien Notes and holds $39.5 million in aggregate principal amount. In connection with the issuance of the 1.5 Lien Notes, Oaktree received warrants representing the right to purchase an aggregate of 42,473,119 common shares at an exercise price equal to $0.93 per share and a commitment fee of $1.2 million in cash. B. James Ford, a member of our Board of Directors, serves as a Senior Adviser of Oaktree. At December 31, 2016, Oaktree was the beneficial owner of approximately 11.0% of our outstanding common shares.
Rights offering
As discussed in "Note 14. Rights offering and other equity transactions", we entered into investment agreements and closed a related private placement of our common shares with certain affiliates of WL Ross & Co. LLC ("WL Ross") and Hamblin Watsa. Wilbur L. Ross, Jr., the Chairman and Chief Executive Officer of WL Ross, and Samuel A. Mitchell, Managing Director of Hamblin Watsa, both of whom served on EXCO's Board of Directors during 2016. On February 27, 2017, Mr. Ross resigned from our Board of Directors and each of its committees, upon the confirmation of his appointment as the U.S. Secretary of Commerce. Mr. Ross was replaced by Stephen J. Toy, Senior Managing Director and Co-Head of WL Ross.
14. | Rights Offering and other equity transactions |
On December 19, 2013, the Company granted subscription rights to holders of common shares which entitled the holder to purchase 0.25 of a share of our common stock for each share of common stock owned by such holders. Each subscription right entitled the holder to a basic subscription right and an over-subscription privilege. The basic subscription right entitled the holder to purchase 0.25 of a share of the Company’s common shares at a subscription price equal to $5.00 per share of common stock. The over-subscription privilege entitled the holders who exercised their basic subscription rights in full (including in respect of subscription rights purchased from others) to purchase any or all shares of our common shares that other rights holders did not purchase through the purchase of their basic subscription rights at a subscription price equal to $5.00 per share of our common shares. The subscription rights expired if they were not exercised by January 9, 2014.
The Company entered into two investment agreements ("Investment Agreements") in connection with the rights offering, each dated as of December 17, 2013, one with certain affiliates of WL Ross and one with Hamblin Watsa pursuant to which, subject to the terms and conditions thereof, each of them has severally agreed to subscribe for and purchase, in a private placement, its respective pro rata portion of shares under the basic subscription right and all unsubscribed shares under the over-subscription privilege subject to pro rata allocation among the subscription rights holders who have elected to exercise their over-subscription privilege.
The rights offering and related transactions under the Investment Agreements closed on January 17, 2014 ("Rights Offering") which resulted in the issuance of 54,574,734 shares for proceeds of $272.9 million. We used the proceeds to pay indebtedness under the EXCO Resources Credit Agreement. WL Ross and Hamblin Watsa purchased 19,599,973 and 6,726,712 shares, respectively, pursuant to their basic subscription rights and the over-subscription privilege.
Preferred Shares
We canceled all classes of our preferred shares in 2014. We have 10,000,000 preferred shares authorized with no preferred shares issued and outstanding. Our issued and outstanding shares of capital stock consist solely of common shares.
15. | Condensed consolidating financial statements |
As of December 31, 2016, the majority of EXCO’s subsidiaries were guarantors under the EXCO Resources Credit Agreement, the indentures governing the 2018 Notes and 2022 Notes and the agreements governing the Second Lien Term Loans. On March 15, 2017, we closed the 1.5 Lien Notes and 1.75 Lien Term Loan which are guaranteed by the same subsidiaries as the EXCO Resources Credit Agreement, Second Lien Term Loans, 2018 Notes and the 2022 Notes. All of our unrestricted subsidiaries under the Second Lien Term Loans and the indentures governing the 2018 Notes and 2022 Notes are considered non-guarantor subsidiaries.
Set forth below are condensed consolidating financial statements of EXCO, the guarantor subsidiaries and the non-guarantor subsidiaries. The 2018 Notes, 2022 Notes, the Second Lien Term Loans, and subsequently the 1.5 Lien Notes and
119
1.75 Lien Term Loans, which were issued by EXCO Resources, Inc., are jointly and severally guaranteed by substantially all of our subsidiaries (referred to as Guarantor Subsidiaries). For purposes of this footnote, EXCO Resources, Inc. is referred to as Resources to distinguish it from the Guarantor Subsidiaries. Each of the Guarantor Subsidiaries is a 100% owned subsidiary of Resources and the guarantees are unconditional as they relate to the assets of the Guarantor Subsidiaries.
The following financial information presents consolidating financial statements, which include:
• | Resources; |
• | the Guarantor Subsidiaries; |
• | the Non-Guarantor Subsidiaries; |
• | elimination entries necessary to consolidate Resources, the Guarantor Subsidiaries and the Non-Guarantor Subsidiaries; and |
• | EXCO on a consolidated basis. |
Investments in subsidiaries are accounted for using the equity method of accounting for the disclosures within this footnote. The financial information for the Guarantor Subsidiaries and the Non-Guarantor Subsidiaries is presented on a combined basis. The elimination entries primarily eliminate investments in subsidiaries and intercompany balances and transactions.
120
EXCO RESOURCES, INC.
CONDENSED CONSOLIDATING BALANCE SHEET
December 31, 2016
(in thousands) | Resources | Guarantor Subsidiaries | Non-Guarantor Subsidiaries | Eliminations | Consolidated | |||||||||||||||
Assets | ||||||||||||||||||||
Current assets: | ||||||||||||||||||||
Cash and cash equivalents | $ | 24,610 | $ | (15,542 | ) | $ | — | $ | — | $ | 9,068 | |||||||||
Restricted cash | — | 11,150 | — | — | 11,150 | |||||||||||||||
Other current assets | 6,463 | 83,936 | — | — | 90,399 | |||||||||||||||
Total current assets | 31,073 | 79,544 | — | — | 110,617 | |||||||||||||||
Equity investments | — | — | 24,365 | — | 24,365 | |||||||||||||||
Oil and natural gas properties (full cost accounting method): | ||||||||||||||||||||
Unproved oil and natural gas properties and development costs not being amortized | — | 97,080 | — | — | 97,080 | |||||||||||||||
Proved developed and undeveloped oil and natural gas properties | 331,823 | 2,608,100 | — | — | 2,939,923 | |||||||||||||||
Accumulated depletion | (330,776 | ) | (2,371,469 | ) | — | — | (2,702,245 | ) | ||||||||||||
Oil and natural gas properties, net | 1,047 | 333,711 | — | — | 334,758 | |||||||||||||||
Other property and equipment, net | 568 | 23,093 | — | — | 23,661 | |||||||||||||||
Investments in and advances to affiliates, net | 430,168 | — | — | (430,168 | ) | — | ||||||||||||||
Deferred financing costs, net | 4,376 | — | — | — | 4,376 | |||||||||||||||
Derivative financial instruments | 482 | — | — | — | 482 | |||||||||||||||
Goodwill | 13,293 | 149,862 | — | — | 163,155 | |||||||||||||||
Total assets | $ | 481,007 | $ | 586,210 | $ | 24,365 | $ | (430,168 | ) | $ | 661,414 | |||||||||
Liabilities and shareholders' equity | ||||||||||||||||||||
Current liabilities | $ | 90,671 | $ | 167,692 | $ | — | $ | — | $ | 258,363 | ||||||||||
Long-term debt | 1,258,538 | — | — | — | 1,258,538 | |||||||||||||||
Other long-term liabilities | 3,704 | 12,715 | — | — | 16,419 | |||||||||||||||
Payable to parent | — | 2,337,585 | — | (2,337,585 | ) | — | ||||||||||||||
Total shareholders' equity | (871,906 | ) | (1,931,782 | ) | 24,365 | 1,907,417 | (871,906 | ) | ||||||||||||
Total liabilities and shareholders' equity | $ | 481,007 | $ | 586,210 | $ | 24,365 | $ | (430,168 | ) | $ | 661,414 | |||||||||
121
EXCO RESOURCES, INC.
CONDENSED CONSOLIDATING BALANCE SHEET
December 31, 2015
(in thousands) | Resources | Guarantor Subsidiaries | Non-Guarantor Subsidiaries | Eliminations | Consolidated | |||||||||||||||
Assets | ||||||||||||||||||||
Current assets: | ||||||||||||||||||||
Cash and cash equivalents | $ | 34,296 | $ | (22,049 | ) | $ | — | $ | — | $ | 12,247 | |||||||||
Restricted cash | 2,100 | 19,120 | — | — | 21,220 | |||||||||||||||
Other current assets | 51,133 | 65,201 | — | — | 116,334 | |||||||||||||||
Total current assets | 87,529 | 62,272 | — | — | 149,801 | |||||||||||||||
Equity investments | — | — | 40,797 | — | 40,797 | |||||||||||||||
Oil and natural gas properties (full cost accounting method): | ||||||||||||||||||||
Unproved oil and natural gas properties and development costs not being amortized | — | 115,377 | — | — | 115,377 | |||||||||||||||
Proved developed and undeveloped oil and natural gas properties | 330,775 | 2,739,655 | — | — | 3,070,430 | |||||||||||||||
Accumulated depletion | (330,775 | ) | (2,296,988 | ) | — | — | (2,627,763 | ) | ||||||||||||
Oil and natural gas properties, net | — | 558,044 | — | — | 558,044 | |||||||||||||||
Other property and equipment, net | 749 | 27,063 | — | — | 27,812 | |||||||||||||||
Investments in and advances to affiliates, net | 616,940 | — | — | (616,940 | ) | — | ||||||||||||||
Deferred financing costs, net | 8,408 | — | — | — | 8,408 | |||||||||||||||
Derivative financial instruments | 6,109 | — | — | — | 6,109 | |||||||||||||||
Goodwill | 13,293 | 149,862 | — | — | 163,155 | |||||||||||||||
Total assets | $ | 733,028 | $ | 797,241 | $ | 40,797 | $ | (616,940 | ) | $ | 954,126 | |||||||||
Liabilities and shareholders' equity | ||||||||||||||||||||
Current liabilities | $ | 74,472 | $ | 178,447 | $ | — | $ | — | $ | 252,919 | ||||||||||
Long-term debt | 1,320,279 | — | — | — | 1,320,279 | |||||||||||||||
Other long-term liabilities | 600 | 42,651 | — | — | 43,251 | |||||||||||||||
Payable to parent | — | 2,276,594 | — | (2,276,594 | ) | — | ||||||||||||||
Total shareholders' equity | (662,323 | ) | (1,700,451 | ) | 40,797 | 1,659,654 | (662,323 | ) | ||||||||||||
Total liabilities and shareholders' equity | $ | 733,028 | $ | 797,241 | $ | 40,797 | $ | (616,940 | ) | $ | 954,126 | |||||||||
122
EXCO RESOURCES, INC.
CONDENSED CONSOLIDATING STATEMENT OF OPERATIONS
For the year ended December 31, 2016
(in thousands) | Resources | Guarantor Subsidiaries | Non-Guarantor Subsidiaries | Eliminations | Consolidated | |||||||||||||||
Revenues: | ||||||||||||||||||||
Oil and natural gas | $ | — | $ | 248,649 | $ | — | $ | — | $ | 248,649 | ||||||||||
Purchased natural gas and marketing | — | 22,352 | — | — | 22,352 | |||||||||||||||
Total revenues | — | 271,001 | — | — | 271,001 | |||||||||||||||
Costs and expenses: | ||||||||||||||||||||
Oil and natural gas production | 4 | 49,985 | — | — | 49,989 | |||||||||||||||
Gathering and transportation | — | 106,460 | — | — | 106,460 | |||||||||||||||
Purchased natural gas | — | 23,557 | — | — | 23,557 | |||||||||||||||
Depletion, depreciation and amortization | 381 | 75,601 | — | — | 75,982 | |||||||||||||||
Impairment of oil and natural gas properties | 838 | 159,975 | — | — | 160,813 | |||||||||||||||
Accretion of discount on asset retirement obligations | — | 2,210 | — | — | 2,210 | |||||||||||||||
General and administrative | (11,254 | ) | 59,954 | — | — | 48,700 | ||||||||||||||
Other operating items | (385 | ) | 24,624 | — | — | 24,239 | ||||||||||||||
Total costs and expenses | (10,416 | ) | 502,366 | — | — | 491,950 | ||||||||||||||
Operating income (loss) | 10,416 | (231,365 | ) | — | — | (220,949 | ) | |||||||||||||
Other income (expense): | ||||||||||||||||||||
Interest expense, net | (70,438 | ) | — | — | — | (70,438 | ) | |||||||||||||
Loss on derivative financial instruments | (34,137 | ) | — | — | — | (34,137 | ) | |||||||||||||
Gain on extinguishment of debt | 119,457 | — | — | — | 119,457 | |||||||||||||||
Other income | 9 | 34 | — | — | 43 | |||||||||||||||
Equity loss | — | — | (16,432 | ) | — | (16,432 | ) | |||||||||||||
Net loss from consolidated subsidiaries | (247,763 | ) | — | — | 247,763 | — | ||||||||||||||
Total other income (expense) | (232,872 | ) | 34 | (16,432 | ) | 247,763 | (1,507 | ) | ||||||||||||
Loss before income taxes | (222,456 | ) | (231,331 | ) | (16,432 | ) | 247,763 | (222,456 | ) | |||||||||||
Income tax expense | 2,802 | — | — | — | 2,802 | |||||||||||||||
Net loss | $ | (225,258 | ) | $ | (231,331 | ) | $ | (16,432 | ) | $ | 247,763 | $ | (225,258 | ) | ||||||
123
EXCO RESOURCES, INC.
CONDENSED CONSOLIDATING STATEMENT OF OPERATIONS
For the year ended December 31, 2015
(in thousands) | Resources | Guarantor Subsidiaries | Non-Guarantor Subsidiaries | Eliminations | Consolidated | |||||||||||||||
Revenues: | ||||||||||||||||||||
Oil and natural gas | $ | 4 | $ | 329,254 | $ | — | $ | — | $ | 329,258 | ||||||||||
Purchased natural gas and marketing | — | 26,442 | — | — | 26,442 | |||||||||||||||
Total revenues | 4 | 355,696 | — | — | 355,700 | |||||||||||||||
Costs and expenses: | ||||||||||||||||||||
Oil and natural gas production | 37 | 76,496 | — | — | 76,533 | |||||||||||||||
Gathering and transportation | — | 99,321 | — | — | 99,321 | |||||||||||||||
Purchased natural gas | — | 27,369 | — | — | 27,369 | |||||||||||||||
Depletion, depreciation and amortization | 943 | 214,483 | — | — | 215,426 | |||||||||||||||
Impairment of oil and natural gas properties | 9,316 | 1,206,054 | — | — | 1,215,370 | |||||||||||||||
Accretion of discount on asset retirement obligations | 4 | 2,273 | — | — | 2,277 | |||||||||||||||
General and administrative | (4,313 | ) | 63,131 | — | — | 58,818 | ||||||||||||||
Other operating items | 1,646 | (1,185 | ) | — | — | 461 | ||||||||||||||
Total costs and expenses | 7,633 | 1,687,942 | — | — | 1,695,575 | |||||||||||||||
Operating loss | (7,629 | ) | (1,332,246 | ) | — | — | (1,339,875 | ) | ||||||||||||
Other income (expense): | ||||||||||||||||||||
Interest expense, net | (106,082 | ) | — | — | — | (106,082 | ) | |||||||||||||
Gain on derivative financial instruments | 75,869 | — | — | — | 75,869 | |||||||||||||||
Gain on restructuring and extinguishment of debt | 193,276 | — | — | — | 193,276 | |||||||||||||||
Other income | 87 | 35 | — | — | 122 | |||||||||||||||
Equity loss | — | — | (15,691 | ) | — | (15,691 | ) | |||||||||||||
Net loss from consolidated subsidiaries | (1,347,902 | ) | — | — | 1,347,902 | — | ||||||||||||||
Total other income (expense) | (1,184,752 | ) | 35 | (15,691 | ) | 1,347,902 | 147,494 | |||||||||||||
Loss before income taxes | (1,192,381 | ) | (1,332,211 | ) | (15,691 | ) | 1,347,902 | (1,192,381 | ) | |||||||||||
Income tax expense | — | — | — | — | — | |||||||||||||||
Net loss | $ | (1,192,381 | ) | $ | (1,332,211 | ) | $ | (15,691 | ) | $ | 1,347,902 | $ | (1,192,381 | ) | ||||||
124
EXCO RESOURCES, INC.
CONDENSED CONSOLIDATING STATEMENT OF OPERATIONS
For the year ended December 31, 2014
(in thousands) | Resources | Guarantor Subsidiaries | Non-Guarantor Subsidiaries | Eliminations | Consolidated | |||||||||||||||
Revenues: | ||||||||||||||||||||
Oil and natural gas | $ | 3,649 | $ | 615,604 | $ | 41,731 | $ | — | $ | 660,984 | ||||||||||
Purchased natural gas and marketing | — | 34,933 | — | — | 34,933 | |||||||||||||||
Total revenues | 3,649 | 650,537 | 41,731 | — | 695,917 | |||||||||||||||
Costs and expenses: | ||||||||||||||||||||
Oil and natural gas production | 394 | 77,334 | 16,598 | — | 94,326 | |||||||||||||||
Gathering and transportation | — | 97,784 | 3,790 | — | 101,574 | |||||||||||||||
Purchased natural gas | — | 35,648 | — | — | 35,648 | |||||||||||||||
Depletion, depreciation and amortization | 3,174 | 244,761 | 15,634 | — | 263,569 | |||||||||||||||
Impairment of oil and natural gas properties | — | — | — | — | — | |||||||||||||||
Accretion of discount on asset retirement obligations | 16 | 2,107 | 567 | — | 2,690 | |||||||||||||||
General and administrative | (3,342 | ) | 66,686 | 2,576 | — | 65,920 | ||||||||||||||
Other operating items | (134 | ) | 5,459 | (10 | ) | — | 5,315 | |||||||||||||
Total costs and expenses | 108 | 529,779 | 39,155 | — | 569,042 | |||||||||||||||
Operating income | 3,541 | 120,758 | 2,576 | — | 126,875 | |||||||||||||||
Other income (expense): | ||||||||||||||||||||
Interest expense, net | (92,049 | ) | — | (2,235 | ) | — | (94,284 | ) | ||||||||||||
Gain on derivative financial instruments | 87,565 | — | 100 | — | 87,665 | |||||||||||||||
Other income | 226 | — | 15 | — | 241 | |||||||||||||||
Equity income | — | — | 172 | — | 172 | |||||||||||||||
Net earnings from consolidated subsidiaries | 121,386 | — | — | (121,386 | ) | — | ||||||||||||||
Total other income (expense) | 117,128 | — | (1,948 | ) | (121,386 | ) | (6,206 | ) | ||||||||||||
Income before income taxes | 120,669 | 120,758 | 628 | (121,386 | ) | 120,669 | ||||||||||||||
Income tax expense | — | — | — | — | — | |||||||||||||||
Net income | $ | 120,669 | $ | 120,758 | $ | 628 | $ | (121,386 | ) | $ | 120,669 | |||||||||
125
EXCO RESOURCES, INC.
CONDENSED CONSOLIDATING STATEMENT OF CASH FLOWS
For the year ended December 31, 2016
(in thousands) | Resources | Guarantor Subsidiaries | Non-Guarantor Subsidiaries | Eliminations | Consolidated | |||||||||||||||
Operating Activities: | ||||||||||||||||||||
Net cash provided by (used in) operating activities | $ | 572 | $ | (986 | ) | $ | — | $ | — | $ | (414 | ) | ||||||||
Investing Activities: | ||||||||||||||||||||
Additions to oil and natural gas properties, gathering assets and equipment and property acquisitions | (1,521 | ) | (78,904 | ) | — | — | (80,425 | ) | ||||||||||||
Proceeds from disposition of property and equipment | 10 | 14,339 | — | — | 14,349 | |||||||||||||||
Restricted cash | — | 7,970 | — | — | 7,970 | |||||||||||||||
Net changes in advances to joint ventures | — | 3,097 | — | — | 3,097 | |||||||||||||||
Advances/investments with affiliates | (60,991 | ) | 60,991 | — | — | — | ||||||||||||||
Net cash provided by (used in) investing activities | (62,502 | ) | 7,493 | — | — | (55,009 | ) | |||||||||||||
Financing Activities: | ||||||||||||||||||||
Borrowings under credit agreements | 404,897 | — | — | — | 404,897 | |||||||||||||||
Repayments under credit agreements | (243,797 | ) | — | — | — | (243,797 | ) | |||||||||||||
Repurchases of senior unsecured notes | (53,298 | ) | — | — | — | (53,298 | ) | |||||||||||||
Payments on Exchange Term Loan | (50,695 | ) | — | — | — | (50,695 | ) | |||||||||||||
Payments of common share dividends | (91 | ) | — | — | — | (91 | ) | |||||||||||||
Deferred financing costs and other | (4,772 | ) | — | — | — | (4,772 | ) | |||||||||||||
Net cash provided by financing activities | 52,244 | — | — | — | 52,244 | |||||||||||||||
Net increase (decrease) in cash | (9,686 | ) | 6,507 | — | — | (3,179 | ) | |||||||||||||
Cash at beginning of period | 34,296 | (22,049 | ) | — | — | 12,247 | ||||||||||||||
Cash at end of period | $ | 24,610 | $ | (15,542 | ) | $ | — | $ | — | $ | 9,068 | |||||||||
126
EXCO RESOURCES, INC.
CONDENSED CONSOLIDATING STATEMENT OF CASH FLOWS
For the year ended December 31, 2015
(in thousands) | Resources | Guarantor Subsidiaries | Non-Guarantor Subsidiaries | Eliminations | Consolidated | |||||||||||||||
Operating Activities: | ||||||||||||||||||||
Net cash provided by operating activities | $ | 34,532 | $ | 99,495 | $ | — | $ | — | $ | 134,027 | ||||||||||
Investing Activities: | ||||||||||||||||||||
Additions to oil and natural gas properties, gathering assets and equipment and property acquisitions | (2,601 | ) | (322,597 | ) | — | — | (325,198 | ) | ||||||||||||
Proceeds from disposition of property and equipment | 686 | 6,711 | — | — | 7,397 | |||||||||||||||
Restricted cash | — | 4,850 | — | — | 4,850 | |||||||||||||||
Net changes in advances to joint ventures | — | 10,663 | — | — | 10,663 | |||||||||||||||
Equity investments and other | — | 1,455 | — | — | 1,455 | |||||||||||||||
Advances/investments with affiliates | (217,906 | ) | 217,906 | — | — | — | ||||||||||||||
Net cash used in investing activities | (219,821 | ) | (81,012 | ) | — | — | (300,833 | ) | ||||||||||||
Financing Activities: | ||||||||||||||||||||
Borrowings under credit agreements | 165,000 | — | — | — | 165,000 | |||||||||||||||
Repayments under credit agreements | (300,000 | ) | — | — | — | (300,000 | ) | |||||||||||||
Proceeds received from issuance of Fairfax Term Loan | 300,000 | — | — | — | 300,000 | |||||||||||||||
Repurchases of senior unsecured notes | (12,008 | ) | — | — | — | (12,008 | ) | |||||||||||||
Payment on Exchange Term Loan | (8,827 | ) | — | — | — | (8,827 | ) | |||||||||||||
Proceeds from issuance of common shares, net | 9,693 | — | — | — | 9,693 | |||||||||||||||
Payments of common share dividends | (164 | ) | — | — | — | (164 | ) | |||||||||||||
Deferred financing costs and other | (20,946 | ) | — | — | — | (20,946 | ) | |||||||||||||
Net cash used in financing activities | 132,748 | — | — | — | 132,748 | |||||||||||||||
Net increase (decrease) in cash | (52,541 | ) | 18,483 | — | — | (34,058 | ) | |||||||||||||
Cash at beginning of period | 86,837 | (40,532 | ) | — | — | 46,305 | ||||||||||||||
Cash at end of period | $ | 34,296 | $ | (22,049 | ) | $ | — | $ | — | $ | 12,247 | |||||||||
127
EXCO RESOURCES, INC.
CONDENSED CONSOLIDATING STATEMENT OF CASH FLOWS
For the year ended December 31, 2014
(in thousands) | Resources | Guarantor Subsidiaries | Non-guarantor subsidiaries | Eliminations | Consolidated | |||||||||||||||
Operating Activities: | ||||||||||||||||||||
Net cash provided by (used in) operating activities | $ | (84,067 | ) | $ | 428,029 | $ | 18,131 | $ | — | $ | 362,093 | |||||||||
Investing Activities: | ||||||||||||||||||||
Additions to oil and natural gas properties, gathering assets and equipment | (2,531 | ) | (395,974 | ) | (4,061 | ) | — | (402,566 | ) | |||||||||||
Proceeds from disposition of property and equipment | 99,612 | 95,594 | (7,551 | ) | — | 187,655 | ||||||||||||||
Restricted cash | — | (3,400 | ) | — | — | (3,400 | ) | |||||||||||||
Net changes in advances to joint ventures | — | (5,026 | ) | — | — | (5,026 | ) | |||||||||||||
Distributions from Compass | 5,856 | — | — | (5,856 | ) | — | ||||||||||||||
Equity investments and other | — | 1,749 | — | — | 1,749 | |||||||||||||||
Advances/investments with affiliates | 125,612 | (125,612 | ) | — | — | — | ||||||||||||||
Net cash provided by (used in) investing activities | 228,549 | (432,669 | ) | (11,612 | ) | (5,856 | ) | (221,588 | ) | |||||||||||
Financing Activities: | ||||||||||||||||||||
Borrowings under the credit agreements | 100,000 | — | — | — | 100,000 | |||||||||||||||
Repayments under the credit agreements | (959,874 | ) | — | (5,096 | ) | — | (964,970 | ) | ||||||||||||
Proceeds received from issuance of 2022 Notes | 500,000 | — | — | — | 500,000 | |||||||||||||||
Proceeds from issuance of common shares, net | 271,773 | — | — | — | 271,773 | |||||||||||||||
Payments of common share dividends | (41,060 | ) | — | — | — | (41,060 | ) | |||||||||||||
Compass cash distribution | — | — | (5,856 | ) | 5,856 | — | ||||||||||||||
Deferred financing costs and other | (10,324 | ) | — | (102 | ) | — | (10,426 | ) | ||||||||||||
Net cash used in financing activities | (139,485 | ) | — | (11,054 | ) | 5,856 | (144,683 | ) | ||||||||||||
Net increase (decrease) in cash | 4,997 | (4,640 | ) | (4,535 | ) | — | (4,178 | ) | ||||||||||||
Cash at beginning of period | 81,840 | (35,892 | ) | 4,535 | — | 50,483 | ||||||||||||||
Cash at end of period | $ | 86,837 | $ | (40,532 | ) | $ | — | $ | — | $ | 46,305 | |||||||||
128
16. | Quarterly financial data (unaudited) |
The following are summarized quarterly financial data for the years ended December 31, 2016 and 2015:
Quarter | ||||||||||||||||
(in thousands, except per share amounts) | 1st | 2nd | 3rd | 4th | ||||||||||||
2016 | ||||||||||||||||
Total revenues | $ | 56,090 | $ | 58,791 | $ | 77,186 | $ | 78,934 | ||||||||
Operating income (loss) (1) | (164,698 | ) | (72,997 | ) | 4,142 | 12,604 | ||||||||||
Net income (loss) (2) | $ | (130,148 | ) | $ | (111,347 | ) | $ | 50,936 | $ | (34,699 | ) | |||||
Basic earnings (loss) per share: | ||||||||||||||||
Net income (loss) | $ | (0.47 | ) | $ | (0.40 | ) | $ | 0.18 | $ | (0.12 | ) | |||||
Weighted average shares | 278,357 | 278,783 | 279,873 | 280,119 | ||||||||||||
Diluted earnings (loss) per share: | ||||||||||||||||
Net income (loss) | $ | (0.47 | ) | $ | (0.40 | ) | $ | 0.18 | $ | (0.12 | ) | |||||
Weighted average shares | 278,357 | 278,783 | 281,045 | 280,119 | ||||||||||||
2015 | ||||||||||||||||
Total revenues | $ | 94,038 | $ | 100,604 | $ | 90,517 | $ | 70,541 | ||||||||
Operating loss (3) | (313,618 | ) | (421,465 | ) | (363,975 | ) | (240,817 | ) | ||||||||
Net loss (4) | $ | (318,112 | ) | $ | (454,155 | ) | $ | (354,519 | ) | $ | (65,595 | ) | ||||
Basic loss per share: | ||||||||||||||||
Net loss | $ | (1.17 | ) | $ | (1.67 | ) | $ | (1.30 | ) | $ | (0.24 | ) | ||||
Weighted average shares | 271,522 | 271,549 | 273,348 | 277,995 | ||||||||||||
Diluted loss per share: | ||||||||||||||||
Net loss | $ | (1.17 | ) | $ | (1.67 | ) | $ | (1.30 | ) | $ | (0.24 | ) | ||||
Weighted average shares | 271,522 | 271,549 | 273,348 | 277,995 | ||||||||||||
(1) | Operating loss for the first and second quarter of 2016 includes $134.6 million and $26.2 million, respectively, of impairments of oil and natural gas properties. See "Note 2. Summary of significant accounting policies" for further discussion. |
(2) | Net income (loss) for the first, second and third quarter of 2016 includes $45.1 million, $16.8 million and $57.4 million net gains on extinguishment of debt. See "Note 5. Debt" for further discussion. |
(3) | Operating loss for the first, second, third and fourth quarter of 2015 includes $276.3 million, $394.3 million, $339.4 million and $205.3 million, respectively, of impairments of oil and natural gas properties. See "Note 2. Summary of significant accounting policies" for further discussion. |
(4) | Net loss for the fourth quarter of 2015 includes a $193.3 million net gain on restructuring and extinguishment of debt. See "Note 5. Debt" for further discussion. |
17. | Supplemental information relating to oil and natural gas producing activities (unaudited) |
The following supplemental information relating to our oil and natural gas producing activities for the years ended December 31, 2016, 2015 and 2014 is presented in accordance with ASC 932, Extractive Activities, Oil and Gas.
129
Presented below are costs incurred in oil and natural gas property acquisition, exploration and development activities:
(in thousands, except per unit amounts) | Amount | |||
2016: | ||||
Proved property acquisition costs | $ | 638 | ||
Unproved property acquisition costs | 393 | |||
Total property acquisition costs | 1,031 | |||
Development | 62,328 | |||
Exploration costs | — | |||
Lease acquisitions and other | 760 | |||
Capitalized asset retirement costs | — | |||
Depletion per Boe | $ | 4.28 | ||
Depletion per Mcfe | $ | 0.71 | ||
2015: | ||||
Proved property acquisition costs | $ | 7,608 | ||
Unproved property acquisition costs | — | |||
Total property acquisition costs | 7,608 | |||
Development | 215,239 | |||
Exploration costs (1) | 13,306 | |||
Lease acquisitions and other | 13,017 | |||
Capitalized asset retirement costs | 881 | |||
Depletion per Boe | $ | 10.32 | ||
Depletion per Mcfe | $ | 1.72 | ||
2014: | ||||
Proved property acquisition costs | $ | 10,562 | ||
Unproved property acquisition costs | — | |||
Total property acquisition costs | 10,562 | |||
Development | 354,199 | |||
Exploration costs (2) | 5,906 | |||
Lease acquisitions and other | 9,681 | |||
Capitalized asset retirement costs | 576 | |||
Depletion per Boe | $ | 11.42 | ||
Depletion per Mcfe | $ | 1.90 | ||
(1) | Exploration costs in 2015 primarily relate to the wells drilled in the Buda formation in South Texas. |
(2) | Exploration costs in 2014 include $5.9 million in the Bossier shale in North Louisiana. |
We retain independent engineering firms to prepare or audit annual year-end estimates of our future net recoverable oil and natural gas reserves. The estimated proved net recoverable reserves we show below include only those quantities that we expect to be commercially recoverable at prices and costs in effect at the balance sheet dates under existing regulatory practices and with conventional equipment and operating methods. Proved Developed Reserves represent only those reserves that we may recover through existing wells. Proved Undeveloped Reserves include those reserves that we may recover from new wells on undrilled acreage or from existing wells on which we must make a relatively major expenditure for recompletion or secondary recovery operations. All of our reserves are located onshore in the continental United States of America.
Discounted future cash flow estimates like those shown below are not intended to represent estimates of the fair value of our oil and natural gas properties. Estimates of fair value should also consider unproved reserves, anticipated future oil and natural gas prices, interest rates, changes in development and production costs and risks associated with future production. Because of these and other considerations, any estimate of fair value is subjective and imprecise.
130
Oil (Mbbls) | Natural Gas (Mmcf) | Mmcfe (10) | |||||||
December 31, 2013 | 15,378 | 1,031,977 | 1,124,245 | ||||||
Purchase of reserves in place (1) | — | 7,316 | 7,316 | ||||||
Discoveries and extensions (2) | 4,164 | 70,544 | 95,528 | ||||||
Revisions of previous estimates: | |||||||||
Changes in price | 45 | 168,064 | 168,334 | ||||||
Other factors (3) | 1,737 | 120,802 | 131,224 | ||||||
Sales of reserves in place (4) | (1,401 | ) | (118,705 | ) | (127,111 | ) | |||
Production | (2,236 | ) | (122,324 | ) | (135,740 | ) | |||
December 31, 2014 | 17,687 | 1,157,674 | 1,263,796 | ||||||
Purchase of reserves in place (5) | 459 | 122 | 2,876 | ||||||
Discoveries and extensions (6) | 7,602 | 152,473 | 198,085 | ||||||
Revisions of previous estimates: | |||||||||
Changes in price | (2,821 | ) | (598,865 | ) | (615,791 | ) | |||
Other factors (7) | (145 | ) | 184,641 | 183,771 | |||||
Sales of reserves in place | (1 | ) | (1,445 | ) | (1,451 | ) | |||
Production | (2,342 | ) | (109,926 | ) | (123,978 | ) | |||
December 31, 2015 | 20,439 | 784,674 | 907,308 | ||||||
Purchase of reserves in place | — | 552 | 552 | ||||||
Discoveries and extensions (8) | — | 16,381 | 16,381 | ||||||
Revisions of previous estimates: | |||||||||
Changes in price | (2,061 | ) | (55,748 | ) | (68,114 | ) | |||
Other factors (9) | (5,165 | ) | (208,714 | ) | (239,704 | ) | |||
Sales of reserves in place | (1,276 | ) | (27,597 | ) | (35,253 | ) | |||
Production | (1,769 | ) | (93,829 | ) | (104,443 | ) | |||
December 31, 2016 | 10,168 | 415,719 | 476,727 | ||||||
Estimated Quantities of Proved Developed and Proved Undeveloped Reserves
Oil (Mbbls) | Natural Gas (Mmcf) | Mmcfe | |||||||
Proved developed: | |||||||||
December 31, 2016 | 10,168 | 415,719 | 476,727 | ||||||
December 31, 2015 | 12,056 | 364,932 | 437,268 | ||||||
December 31, 2014 | 14,429 | 504,636 | 591,210 | ||||||
Proved undeveloped: | |||||||||
December 31, 2016 | — | — | — | ||||||
December 31, 2015 | 8,383 | 419,742 | 470,040 | ||||||
December 31, 2014 | 3,258 | 653,038 | 672,586 | ||||||
(1) | Purchases of reserves in place in 2014 consist primarily of our acquisition of certain proved developed producing properties in the Shelby area of East Texas. |
(2) | New discoveries and extensions in 2014 included 48.7 Bcfe in the Haynesville shale, 26.1 Bcfe in the Eagle Ford Shale and 19.7 Bcfe in the Bossier shale. The discoveries and extensions within the Haynesville and Bossier shales primarily related to our development of properties within the Shelby area of East Texas. |
(3) | Total revisions due to Other factors include upward revisions of approximately 67.1 Bcfe in the Shelby area, approximately 45.9 Bcfe in the Appalachia region, and approximately 5.8 Bcfe in the Holly area. The upward revisions were primarily due to improved well performance resulting from enhanced well designs and completion techniques. |
(4) | Sales of reserves in place in 2014 consist primarily of the sale of our entire interest in Compass. |
(5) | Purchases of reserves in place include the acquisition of certain proved developed producing properties in the Eagle Ford shale in connection with the Participation Agreement. |
131
(6) | New discoveries and extensions in 2015 include 84.9 Bcfe and 41.0 Bcfe in the Haynesville shale and Bossier shale, respectively, related to our development of properties within the Shelby area of East Texas. Additionally, extensions and discoveries in 2015 included 24.7 Bcfe in the in the Haynesville shale related to the development of the Holly area in North Louisiana and 47.5 Bcfe in the Eagle Ford shale. |
(7) | Total revisions due to Other factors include upward revisions of approximately 152.2 Bcfe in the North Louisiana Holly area and are primarily due to modifications in the well design to incorporate more proppant and longer laterals. The upward revisions also included 36.7 Bcfe from our East Texas region primarily due to strong results in both the Haynesville and Bossier shales based on our enhanced completion methods. The upward revisions also reflect a reduction in capital costs and operating expenses. |
(8) | New discoveries and extensions in 2016 include 14.9 Bcfe in the Haynesville and Bossier shales related to our development of properties within the Shelby area of East Texas. |
(9) | Total revisions due to Other factors include downward revisions of approximately 427.6 Bcfe as a result of the reclassification of our Proved Undeveloped Reserves to unproved during the first quarter of 2016 due to the uncertainty regarding the financing required to develop these reserves that existed on March 31, 2016. These reserves remained reclassified in unproved due to our inability to meet the Reasonable Certainty criteria for recording Proved Undeveloped Reserves, as prescribed under the SEC requirements, as the uncertainty regarding our ability of capital required to develop these reserves still existed at December 31, 2016. This was offset by approximately 99.0 Bcfe of upward revisions in the Marcellus shale primarily due to the narrowing of regional price differentials, reductions in our operating expenses, and improved well performance due to shallower declines than previously forecasted. The upward revision also reflects a reduction in operating expenses in other areas, primarily North Louisiana and South Texas, which increased our reserves by 51.4 Bcfe and 23.9 Bcfe, respectively. Lower operating costs were primarily the result of various cost reduction efforts, including significant reductions in labor costs, chemical treatment costs and saltwater disposal costs. Reductions in our operating costs extend the economic life of certain properties and resulted in upward revisions to our reserve quantities. In addition, the upward revisions in North Louisiana reflect improved performance of certain Haynesville shale wells that the Company turned-to-sales during 2016. These wells featured enhanced completion methods including more proppant per lateral foot. |
(10) | The above reserves do not include our equity interest in OPCO, which was not significant in any period presented. |
Standardized measure of discounted future net cash flows
We have summarized the Standardized Measure related to our proved oil and natural gas reserves. We have based the following summary on a valuation of Proved Reserves using discounted cash flows based on prices as prescribed by the SEC, costs and economic conditions and a 10% discount rate. The additions to Proved Reserves from the purchase of reserves in place, and new discoveries and extensions could vary significantly from year to year; additionally, the impact of changes to reflect current prices and costs of reserves proved in prior years could also be significant. Furthermore, our ability to demonstrate that we have the financing available to fund a development program with Reasonable Certainty could have a significant impact on our Proved Undeveloped Reserves. Accordingly, the information presented below should not be viewed as an estimate of the fair value of our oil and natural gas properties, nor should it be indicative of any trends.
132
(in thousands) | Amount | |||
Year ended December 31, 2016: | ||||
Future cash inflows | $ | 1,216,855 | ||
Future production costs | 705,873 | |||
Future development costs (1) | 39,956 | |||
Future income taxes | — | |||
Future net cash flows | 471,026 | |||
Discount of future net cash flows at 10% per annum | 160,095 | |||
Standardized measure of discounted future net cash flows | $ | 310,931 | ||
Year ended December 31, 2015: | ||||
Future cash inflows | $ | 2,684,362 | ||
Future production costs | 1,280,795 | |||
Future development costs | 641,768 | |||
Future income taxes | — | |||
Future net cash flows | 761,799 | |||
Discount of future net cash flows at 10% per annum | 359,666 | |||
Standardized measure of discounted future net cash flows | $ | 402,133 | ||
Year ended December 31, 2014: | ||||
Future cash inflows | $ | 6,097,207 | ||
Future production costs | 2,094,796 | |||
Future development costs | 1,124,873 | |||
Future income taxes | — | |||
Future net cash flows | 2,877,538 | |||
Discount of future net cash flows at 10% per annum | 1,334,951 | |||
Standardized measure of discounted future net cash flows | $ | 1,542,587 | ||
(1) | All of our Proved Undeveloped Reserves were reclassified to unproved during 2016 due to the uncertainty regarding the financing required to develop these reserves. As such, future development costs at December 31, 2016 consist primarily of estimated future plugging and abandonment costs. |
During recent years, prices paid for oil and natural gas have fluctuated significantly. The reference prices at December 31, 2016, 2015 and 2014 used in the above table, were $42.75, $50.28 and $94.99 per Bbl of oil, respectively, and $2.48, $2.59 and $4.35 per Mmbtu of natural gas, respectively. Each of the reference prices for oil and natural gas were adjusted for quality factors and regional differentials. These prices reflect the SEC rules requiring the use of simple average of the first day of the month price for the previous 12 month period for natural gas at Henry Hub and West Texas Intermediate crude oil at Cushing, Oklahoma.
133
The following are the principal sources of change in the Standardized Measure:
(in thousands) | Amount | |||
Year ended December 31, 2016: | ||||
Sales and transfers of oil and natural gas produced | $ | (92,200 | ) | |
Net changes in prices and production costs | (260,335 | ) | ||
Extensions and discoveries, net of future development and production costs | 16,258 | |||
Development costs during the period | 46,499 | |||
Changes in estimated future development costs | 384,644 | |||
Revisions of previous quantity estimates | (180,367 | ) | ||
Sales of reserves in place | (11,814 | ) | ||
Purchase of reserves in place | 347 | |||
Accretion of discount | 40,213 | |||
Changes in timing and other | (34,447 | ) | ||
Net change in income taxes | — | |||
Net change | $ | (91,202 | ) | |
Year ended December 31, 2015: | ||||
Sales and transfers of oil and natural gas produced | $ | (153,404 | ) | |
Net changes in prices and production costs | (1,438,023 | ) | ||
Extensions and discoveries, net of future development and production costs | 99,818 | |||
Development costs during the period | 109,895 | |||
Changes in estimated future development costs | 407,780 | |||
Revisions of previous quantity estimates | (232,325 | ) | ||
Sales of reserves in place | (1,632 | ) | ||
Purchase of reserves in place | 6,892 | |||
Accretion of discount | 126,533 | |||
Changes in timing and other | (65,988 | ) | ||
Net change in income taxes | — | |||
Net change | $ | (1,140,454 | ) | |
Year ended December 31, 2014: | ||||
Sales and transfers of oil and natural gas produced | $ | (465,084 | ) | |
Net changes in prices and production costs | 280,659 | |||
Extensions and discoveries, net of future development and production costs | 196,796 | |||
Development costs during the period | 189,155 | |||
Changes in estimated future development costs | (254,737 | ) | ||
Revisions of previous quantity estimates | 412,296 | |||
Sales of reserves in place | (148,226 | ) | ||
Purchase of reserves in place | 13,507 | |||
Accretion of discount | 125,227 | |||
Changes in timing and other | (59,279 | ) | ||
Net change in income taxes | — | |||
Net change | $ | 290,314 | ||
Costs not subject to amortization
The following table summarizes the categories of costs comprising the amount of unproved properties not subject to amortization by the year in which such costs were incurred. There are no individually significant properties or significant development projects included in costs not being amortized. A significant portion of our acreage is held-by-production, which allows us to develop these properties within an optimum time frame.
134
(in thousands) | Total | 2016 | 2015 | 2014 | 2013 and prior | |||||||||||||||
Property acquisition costs | $ | 61,757 | $ | 899 | $ | 11,121 | $ | 7,862 | $ | 41,875 | ||||||||||
Exploration and development | 3,410 | 3,410 | — | — | — | |||||||||||||||
Capitalized interest | 31,913 | 5,213 | 8,464 | 8,604 | 9,632 | |||||||||||||||
Total | $ | 97,080 | $ | 9,522 | $ | 19,585 | $ | 16,466 | $ | 51,507 | ||||||||||
18. | Subsequent events |
1.5 Lien Notes
On March 15, 2017, we issued an aggregate of $300.0 million of 1.5 Lien Notes to affiliates of Fairfax, Bluescape and Oaktree, and an unaffiliated investor. The 1.5 Lien Notes bear interest at a cash interest rate of 8% per annum, or, if we elect to make interest payments on the 1.5 Lien Notes with our common shares or, in certain circumstances, by issuing additional 1.5 Lien Notes, at an interest rate of 11% per annum. Interest is payable bi-annually beginning on September 20, 2017. Investors were issued, at their election, either: (a) warrants to purchase our common shares at an exercise price of $0.01 ("Commitment Fee Warrants"), or (b) cash. This resulted in the payments of $4.5 million in cash and the issuance of 6,471,433 Commitment Fee Warrants. In addition, investors were issued 322,580,655 warrants to purchase our common shares at an exercise price of $0.93 per share ("Financing Warrants"). The proceeds from the issuance of the 1.5 Lien Notes were primarily used to repay the outstanding indebtedness under the EXCO Resources Credit Agreement.
The 1.5 Lien Notes are jointly and severally guaranteed by all of the our subsidiaries that guarantee our indebtedness under the EXCO Resources Credit Agreement and the Second Lien Term Loans, and are secured by first priority liens on substantially all of our assets and such guarantors. The 1.5 Lien Notes rank pari passu in right of payment with one another and all of our other existing and future senior indebtedness, including debt under the EXCO Resources Credit Agreement, the 1.75 Lien Term Loans, the Second Lien Term Loans and the 2018 Notes and 2022 Notes. However, as a result of the debt under the EXCO Resources Credit Agreement having a priority claim to the collateral securing the 1.5 Lien Notes, the 1.5 Lien Notes are (i) effectively junior to debt under the EXCO Resources Credit Agreement and any other priority lien obligations, (ii) pari passu with one another, (iii) effectively senior to the 1.75 Lien Term Loans, the Second Lien Term Loans and any third lien obligations and (iv) effectively senior to all of our existing and future unsecured senior indebtedness, including the 2018 Notes and 2022 Notes, in each case to the extent of the collateral.
1.75 Lien Term Loans and the Second Lien Term Loan Exchange
On March 15, 2017, in connection with the issuance of the 1.5 Lien Notes, we closed an exchange of an aggregate of $682.8 million of 1.75 Lien Term Loans for an aggregate of $682.8 million of Second Lien Term Loans ("Second Lien Term Loan Exchange"). Exchanging Second Lien Term Loan lenders were issued, at their election, either: (a) warrants to purchase our common shares at an exercise price of $0.01 ("Amendment Fee Warrants," collectively referred to as the "2017 Warrants" with the Commitment Fee Warrants and Financing Warrants) or (b) cash. This resulted in the payments of $8.6 million in cash and the issuance of 19,883,077 Amendment Fee Warrants.
The 1.75 Lien Term Loans bear interest at a cash rate of 12.5% per annum, or, if we elect to pay interest on the 1.75 Lien Term Loans with our common shares or, in certain circumstances, by issuing additional 1.75 Lien Term Loans, at an interest rate of 15.0% per annum. The 1.75 Lien Term Loans are jointly and severally guaranteed by all of our subsidiaries that guarantee the indebtedness under the EXCO Resources Credit Agreement and the Second Lien Term Loans, and are secured by first priority liens on substantially all of our assets and such guarantors. The 1.75 Lien Term Loans rank pari passu in right of payment with one another and all of our other existing and future senior indebtedness, including debt under the EXCO Resources Credit Agreement, the 1.5 Lien Notes, the Second Lien Term Loans and the 2018 Notes and 2022 Notes. However, as a result of the debt under the EXCO Resources Credit Agreement and the 1.5 Lien Notes having a priority claim to the collateral securing the 1.75 Lien Term Loans, the 1.75 Lien Term Loans rank (i) effectively junior to debt under the EXCO Resources Credit Agreement, the 1.5 Lien Notes and any other priority lien obligations, (ii) pari passu with one another, (iii) effectively senior to the Second Lien Term Loans and any third lien obligations and (iv) effectively senior to all of our existing and future unsecured senior indebtedness, including the 2018 Notes and 2022 Notes, in each case to the extent of the collateral.
By participating in the Second Lien Term Loan Exchange, each exchanging lender was deemed to consent to an amendment to the Second Lien Term Loans that eliminated substantially all of the restrictive covenants and events of default in the agreements governing the Second Lien Term Loans.
135
In connection with the issuance of the 1.5 Lien Notes and the Second Lien Term Loan Exchange, we entered into a new intercreditor agreement governing the relationship between EXCO’s lenders and the holders of any other lien obligations that EXCO may issue in the future with respect to the collateral securing such obligations and certain other matters.
PIK Payments Under the 1.5 Lien Notes and the 1.75 Lien Term Loans
The indenture governing the 1.5 Lien Notes and the agreement governing the 1.75 Lien Term Loans allow us to make PIK Payments subject to certain limitations. Under the indenture governing the 1.5 Lien Notes and the agreement governing the 1.75 Lien Term Loans, the price of our common shares for determining PIK Payments is based on the trailing 20-day volume weighted average price calculated on the third trading day prior to the interest payment date. Our ability to issue common shares for the PIK Payments is restricted and subject to certain conditions, including the following: (i) we shall have obtained the requisite shareholder approvals related to proposals to permit the issuances of common shares represented by the 2017 Warrants and PIK Payments for purposes of the rules of the New York Stock Exchange ("NYSE"), and amend our charter to increase its authorized common shares or execute a reverse stock split, without a proportionate reduction of authorized shares, at the discretion of the Board of Directors (collectively referred to as "Requisite Shareholder Approval"); however, we may waive the requirement within the 1.5 Lien Notes and 1.75 Lien Term Loans to obtain shareholder approval to amend our charter at our sole discretion, and (ii) the issuance of common shares does not result in a beneficial owner, directly or indirectly, owning more than 50% of the outstanding common stock, and (iii) the common shares issued in connection with the PIK Payments shall be registered under an effective registration statement under the Securities Act. If the Requisite Shareholder Approvals are not obtained by September 30, 2017, subject to certain extensions, the cash interest on the 1.5 Lien Notes shall accrue at a rate of 15.0% per annum and the interest rate for PIK Payments shall accrue at a rate of 20.0% per annum. The amount of PIK Payments made in additional 1.5 Lien Notes or 1.75 Lien Term Loans is subject to incurrence covenants within our debt agreements that limit our aggregate secured indebtedness to $1.2 billion.
Prior to December 31, 2018, we may make PIK Payments on the 1.5 Lien Notes and the 1.75 Lien Term Loans in our sole discretion. After December 31, 2018, we are only permitted to make PIK Payments in the following percentages of interest due based on our liquidity, which, for the purposes of 1.5 Lien Notes and 1.75 Lien Term Loans, is defined as (i) the sum of (a) our unrestricted cash and cash equivalents and (b) any amounts available to be borrowed under the EXCO Resources Credit Agreement (to the extent then available) less (ii) the face amount of any letters of credit outstanding under the EXCO Resources Credit Agreement:
Liquidity Level | PIK Payment Percentage | |
Less than $150 million | 100% | |
$150 million or greater but less than $175 million | 75% | |
$175 million or greater but less than $200 million | 50% | |
$200 million or greater but less than $225 million | 25% | |
$225 million or greater | —% | |
Covenants, events of default and other material provisions
The covenants and events of default under the indenture governing the 1.5 Lien Notes and the agreement governing the 1.75 Lien Term Loans are substantially similar to those under the Second Lien Term Loans prior to giving effect to the amendment to the Second Lien Term Loans resulting from the Second Lien Term Loan Exchange. Subject to certain exceptions, the covenants under the indenture governing the 1.5 Lien Notes and the agreement governing the 1.75 Lien Term Loans limit our ability and the ability of our subsidiary guarantors to, among other things:
• | pay dividends or make other distributions or redeem or repurchase our capital stock; |
• | prepay, redeem or repurchase certain debt; |
• | enter into agreements restricting the subsidiary guarantors’ ability to pay dividends to us or another subsidiary guarantor, make loans or advances to us or transfer assets to us; |
• | engage in asset sales or substantially alter the business that we conduct; |
• | enter into transactions with affiliates; |
• | consolidate, merge or dispose of assets; |
• | incur indebtedness and liens; and |
• | enter into sale/leaseback transactions. |
136
In addition, the indenture governing the 1.5 Lien Notes includes restrictions on our ability to incur additional indebtedness, including debt under the EXCO Resources Credit Agreement in excess of $150.0 million, among other things and subject to certain restrictions. We may incur debt under the EXCO Resources Credit Agreement up to $200.0 million if we obtain consent from holders of a majority in principal amount of the 1.5 Lien Notes.
An event of default under the indenture governing the 1.5 Lien Notes will cause both the cash interest rate and PIK payment interest rate to increase by an additional 2% per annum. The indenture governing the 1.5 Lien Notes also provides that, upon a change of control, the holders of the 1.5 Lien Notes will have the right to require us to repurchase their 1.5 Lien Notes at 101% of the aggregate principal amount outstanding, plus accrued and unpaid interest.
Warrants
Subject to certain exceptions, the 2017 Warrants may not be exercised unless and until the Requisite Shareholder Approval is obtained. In addition, subject to certain exceptions and limitations, the 2017 Warrants may not be exercised if, as a result of such exercise, the holder of such 2017 Warrant or its affiliates would beneficially own, directly or indirectly, more than 50% of our outstanding common shares.
Each of the 2017 Warrants has an exercise term of 5 years from the date that the Requisite Shareholder Approvals are obtained and may be exercised by cash or cashless exercise, provided that we may require cashless exercise if the cash exercise of any 2017 Warrant would negatively impact our ability to utilize net operating losses for U.S. federal income tax purposes. The 2017 Warrants also contain anti-dilution protection in the event we issue common shares for consideration less than the market value of our common shares or exercise price of the 2017 Warrants.
Amendment to EXCO Resources Credit Agreement
Concurrently with the issuance of the 1.5 Lien Notes and as a condition precedent thereto, we amended the EXCO Resources Credit Agreement to, among other things, permit the issuance of the 1.5 Lien Notes and the exchanges of Second Lien Term Loans, reduce the borrowing base thereunder to $150.0 million and modify certain financial covenants. The next borrowing base redetermination for the EXCO Resources Credit Agreement is scheduled to occur on or around November 1, 2017. In the event we divest our South Texas assets, we would not be able to request borrowings from the lenders under the EXCO Resources Credit Agreement that would result in their aggregate exposure to exceed $100.0 million, including letters of credit, until the next redetermination. The amended financial covenants include the following:
• | our cash (as defined in the agreement) plus unused commitments under the EXCO Resources Credit Agreement cannot be less than (i) $50.0 million as of the end of a fiscal month and (ii) $70.0 million as of the end of a fiscal quarter ("Minimum Liquidity Test"); |
• | our Interest Coverage Ratio must exceed a minimum of 1.75 to 1.0 for the fiscal quarter ending September 30, 2017 and 2.0 to 1.0 for fiscal quarters thereafter. The consolidated EBITDAX and consolidated interest expense utilized in this ratio are based on the most recent fiscal quarter ended multiplied by 4.0 as of September 30, 2017, the most recent two fiscal quarters ended multiplied by 2.0 as of December 31, 2017, the most recent three fiscal quarters ended multiplied by 4/3 as of March 31, 2018, and the trailing twelve month period for fiscal quarters ending thereafter. The definition of consolidated interest expense was modified to include cash interest payments that are accounted for as reductions in the carrying amount of indebtedness in accordance with FASB ASC 470-60. Consolidated interest expense is limited to payments in cash, and excludes PIK Payments on the 1.5 Lien Notes and 1.75 Lien Term Loans; and |
• | our ratio of aggregate revolving credit exposure to consolidated EBITDAX ("Aggregate Revolving Credit Exposure Ratio") cannot exceed 1.2 to 1.0 as of the end of any fiscal quarter. Aggregate revolving credit exposure utilized in the Aggregate Revolving Credit Exposure Ratio includes borrowings and letters of credit under the EXCO Resources Credit Agreement. |
In addition, the EXCO Resources Credit Agreement requires us to furnish our audited financial statements within 90 days after the fiscal year end without a going concern or like qualification. The requirement that such financial statements be delivered without a going concern qualification has been waived for financial statements relating to the 2016 fiscal year.
The amendment also permits optional payments for existing senior unsecured notes provided, after giving pro forma effect to any such prepayment, repayment, exchange, redemption, defeasance or repurchase, (i) the sum of the unused commitments under the EXCO Resources Credit Agreement plus unrestricted cash and cash equivalents is equal to or greater than $100.0 million and (ii) the repurchase in cash of existing senior unsecured notes does not exceed $75.0 million in the aggregate.
137
Additional Information Concerning the 1.5 Lien Notes and the Second Lien Term Loan Exchange
The foregoing description of the indenture governing the 1.5 Lien Notes, the agreement governing the 1.75 Lien Term Loans, the amendment to the EXCO Resources Credit Agreement, and the intercreditor agreement does not purport to be complete, and is qualified by reference to indenture governing the 1.5 Lien Notes, the agreement governing 1.75 Lien Term Loans, the amendment to the EXCO Resources Credit Agreement, and the intercreditor agreement, which were filed as exhibits to our Current Report on Form 8-K, dated March 15, 2017 and filed with the SEC on March 15, 2017.
Item 9. Changes in and Disagreements With Accountants on Accounting and Financial Disclosure
None.
Item 9A. Controls and Procedures
Disclosure controls and procedures. Pursuant to Rule 13a-15(b) under the Exchange Act, EXCO's management has evaluated, under the supervision and with the participation of our principal executive officer and principal financial officer, the effectiveness of the design and operation of our disclosure controls and procedures (as defined in Rules 13a-15(e) and 15d-15(e) of the Exchange Act), as of the end of the period covered by this report. Based on this evaluation, our principal executive officer and principal financial officer have concluded that EXCO's disclosure controls and procedures were effective as of December 31, 2016 to ensure that information that is required to be disclosed by EXCO in the reports it files or submits under the Exchange Act is (i) recorded, processed, summarized and reported, within the time periods specified in the SEC's rules and forms and (ii) accumulated and communicated to EXCO's management, including our principal executive officer and principal financial officer, as appropriate to allow timely decisions regarding required disclosure.
Management's report on internal control over financial reporting. EXCO's management is responsible for establishing and maintaining adequate internal control over financial reporting (as defined in Rule 13a-15(f) or 15d-15(f) of the Exchange Act). Management assessed the effectiveness of our internal control over financial reporting as of December 31, 2016, using criteria established in Internal Control-Integrated Framework (2013) issued by the Committee of Sponsoring Organizations of the Treadway Commission (COSO). Even an effective internal control system, no matter how well designed, has inherent limitations, including the possibility of human error and circumvention or overriding of controls and therefore can provide only reasonable assurance with respect to reliable financial reporting. Furthermore, the effectiveness of an internal control system in future periods can change with conditions. Management's annual report of internal control over financial reporting and the audit report on our internal control over financial reporting of our independent registered public accounting firm, KPMG LLP, are included in Item 8 of this Annual Report on Form 10-K and are incorporated by reference herein.
Changes in internal control over financial reporting. There were no changes in EXCO's internal control over financial reporting that occurred during the quarter ended December 31, 2016 that have materially affected, or are reasonably likely to materially affect, EXCO's internal control over financial reporting.
Item 9B. Other Information
None.
138
PART III
Item 10. Directors, Executive Officers and Corporate Governance
The information required in response to this Item 10 is incorporated herein by reference to our Definitive Proxy Statement to be filed with the SEC pursuant to Regulation 14A of the Exchange Act not later than 120 days after the end of the fiscal year covered by this Annual Report on Form 10-K.
Item 11. Executive Compensation
The information required in response to this Item 11 is incorporated herein by reference to our Definitive Proxy Statement to be filed with the SEC pursuant to Regulation 14A of the Exchange Act not later than 120 days after the end of the fiscal year covered by this Annual Report on Form 10-K.
Item 12. Security Ownership of Certain Beneficial Owners and Management and Related Stockholder Matters
The information required in response to this Item 12 is incorporated herein by reference to our Definitive Proxy Statement to be filed with the SEC pursuant to Regulation 14A of the Exchange Act not later than 120 days after the end of the fiscal year covered by this Annual Report on Form 10-K.
Item 13. Certain Relationships and Related Transactions and Director Independence
The information required in response to this Item 13 is incorporated herein by reference to our Definitive Proxy Statement to be filed with the SEC pursuant to Regulation 14A of the Exchange Act not later than 120 days after the end of the fiscal year covered by this Annual Report on Form 10-K.
Item 14. Principal Accountant Fees and Services
The information required in response to this Item 14 is incorporated herein by reference to our Definitive Proxy Statement to be filed with the SEC pursuant to Regulation 14A of the Exchange Act not later than 120 days after the end of the fiscal year covered by this Annual Report on Form 10-K.
PART IV
Item 15. Exhibits and Financial Statement Schedules
(a)(1) See Part II, Item 8. Financial Statements and Supplementary Data of this Annual Report on Form 10-K.
(a)(2) None.
(a)(3) See "Index to Exhibits" for a description of our exhibits.
(b) See "Index to Exhibits" for a description of our exhibits.
(c) None.
139
SIGNATURES
Pursuant to the requirements of Section 13 or 15(d) of the Securities Exchange Act of 1934, the registrant has duly caused this report to be signed on its behalf by the undersigned thereunto duly authorized.
Date: | March 16, 2017 | EXCO RESOURCES, INC. | |
(Registrant) | |||
/s/ Harold L. Hickey | |||
Harold L. Hickey | |||
Chief Executive Officer and President | |||
(Principal Executive Officer) | |||
140
Pursuant to the requirements of the Securities Exchange Act of 1934, this report has been signed below by the following persons on behalf of the registrant and in the capacities and on the dates indicated.
Date: | March 16, 2017 | /s/ Harold L. Hickey | |
Harold L. Hickey | |||
Chief Executive Officer and President | |||
(Principal Executive Officer) | |||
/s/ Tyler Farquharson | |||
Tyler Farquharson | |||
Vice President, Chief Financial Officer and Treasurer | |||
(Principal Financial Officer) | |||
/s/ Brian N. Gaebe | |||
Brian N. Gaebe | |||
Chief Accounting Officer and Corporate Controller | |||
(Principal Accounting Officer) | |||
/s/ C. John Wilder | |||
C. John Wilder | |||
Executive Chairman | |||
/s/ B. James Ford | |||
B. James Ford | |||
Director | |||
/s/ Samuel A. Mitchell | |||
Samuel A. Mitchell | |||
Director | |||
/s/ Anthony R. Horton | |||
Anthony R. Horton | |||
Director | |||
/s/ Robert L. Stillwell | |||
Robert L. Stillwell | |||
Director | |||
141
INDEX TO EXHIBITS
Exhibit
Number | Description of Exhibits |
3.1 | Amended and Restated Certificate of Formation of EXCO Resources, Inc., as amended through November 16, 2015, filed as an Exhibit to EXCO’s Current Report on Form 8-K, dated November 16, 2015 and filed on November 17, 2015 and incorporated by reference herein. |
3.2 | Third Amended and Restated Bylaws of EXCO Resources, Inc., filed as an Exhibit to EXCO’s Current Report on Form 8-K, dated September 8, 2015 and filed on September 9, 2015 and incorporated by reference herein. |
4.1 | Indenture, dated September 15, 2010, by and between EXCO Resources, Inc. and Wilmington Trust Company, as trustee, filed as an Exhibit to EXCO’s Current Report on Form 8-K (File No. 001-32743), dated September 10, 2010 and filed on September 15, 2010 and incorporated by reference herein. |
4.2 | First Supplemental Indenture, dated September 15, 2010, by and among EXCO Resources, Inc., certain of its subsidiaries and Wilmington Trust Company, as trustee, including the form of 7.500% Senior Notes due 2018, filed as an Exhibit to EXCO’s Current Report on Form 8-K (File No. 001-32743), dated September 10, 2010 and filed on September 15, 2010 and incorporated by reference herein. |
4.3 | Second Supplemental Indenture, dated as of February 12, 2013, by and among EXCO Resources, Inc., EXCO/HGI JV Assets, LLC, EXCO Holding MLP, Inc. and Wilmington Trust Company, as trustee, filed as an Exhibit to EXCO's Current Report on Form 8-K, dated February 12, 2013 and filed on February 19, 2013 and incorporated by reference herein. |
4.4 | Third Supplemental Indenture, dated April 16, 2014, by and among EXCO Resources, Inc., certain of its subsidiaries and Wilmington Trust Company, as trustee, including the form of 8.500% Senior Notes due 2022, filed as an Exhibit to EXCO’s Current Report on Form 8-K, dated April 11, 2014 and filed on April 16, 2014 and incorporated by reference herein. |
4.5 | Fourth Supplemental Indenture, dated May 12, 2014, by and among EXCO Resources, Inc., EXCO Land Company, LLC and Wilmington Trust Company, as trustee, filed as an Exhibit to EXCO's Quarterly Report on Form 10-Q for the Quarter Ended June 30, 2014 and filed on July 30, 2014 and incorporated by reference herein. |
4.6 | Fifth Supplemental Indenture, dated November 24, 2015, by and among EXCO Resources, Inc., certain of its subsidiaries, and Wilmington Trust Company, as trustee, filed as an Exhibit to EXCO’s Current Report on Form 8-K, dated November 24, 2015 and filed on November 25, 2015 and incorporated by reference herein. |
4.7 | Sixth Supplemental Indenture, dated August 9, 2016, by and among EXCO Resources, Inc., certain of its subsidiaries, and Wilmington Trust Company, as trustee, filed as an Exhibit to EXCO's Current Report on Form 8-K, dated August 9, 2016 and filed on August 10, 2016 and incorporated by reference herein. |
4.8 | Specimen Stock Certificate for EXCO’s common stock, filed as an Exhibit to EXCO’s Registration Statement on Form S-3, filed on December 17, 2013 and incorporated by reference herein. |
4.9 | First Amended and Restated Registration Rights Agreement dated as of December 30, 2005, by and among EXCO Holdings Inc. and the Initial Holders (as defined therein), filed as an Exhibit to EXCO’s Amendment No. 1 to its Registration Statement on Form S-l (File No. 333-129935), filed on January 6, 2006 and incorporated by reference herein. |
4.10 | Registration Rights Agreement, dated March 28, 2007, by and among EXCO Resources, Inc. and the other parties thereto with respect to the 7.0% Cumulative Convertible Perpetual Preferred Stock and the Hybrid Preferred Stock, filed as an Exhibit to EXCO’s Current Report on Form 8-K (File No. 001-32743) dated March 28, 2007 and filed on April 2, 2007 and incorporated by reference herein. |
4.11 | Registration Rights Agreement, dated March 28, 2007, by and among EXCO Resources, Inc. and the other parties thereto with respect to the Hybrid Preferred Stock, filed as an Exhibit to EXCO’s Current Report on Form 8-K (File No. 001-32743) dated March 28, 2007 and filed on April 2, 2007 and incorporated by reference herein. |
4.12 | Joinder Agreement to Registration Rights Agreement, dated January 17, 2014, by and among EXCO Resources, Inc. and WLR IV Exco AIV One, L.P., WLR IV Exco AIV Two, L.P., WLR IV Exco AIV Three, L.P., WLR IV |
142
Exco AIV Four, L.P., WLR IV Exco AIV Five, L.P., WLR IV Exco AIV Six, L.P., WLR Select Co-Investment XCO AIV, L.P., WLR/GS Master Co-Investment XCO AIV, L.P. and WLR IV Parallel ESC, L.P, filed as an Exhibit to EXCO’s Current Report on Form 8-K, dated January 17, 2014 and filed on January 21, 2014 and incorporated by reference herein.
4.13 | Joinder Agreement to Registration Rights Agreement, dated January 17, 2014, by and among EXCO Resources, Inc. and Advent Syndicate 780, Clearwater Insurance Company, Northbridge General Insurance Company, Odyssey Reinsurance Company, Clearwater Select Insurance Company, Riverstone Insurance Limited, Zenith Insurance Company and Fairfax Master Trust Fund, filed as an Exhibit to EXCO’s Current Report on Form 8-K, dated January 17, 2014 and filed on January 21, 2014 and incorporated by reference herein. |
4.14 | Warrant, dated as of March 31, 2015, filed as an Exhibit to EXCO’s Current Report on Form 8-K, dated March 31, 2015 and filed on April 2, 2015 and incorporated by reference herein. |
4.15 | Warrant, dated as of March 31, 2015, filed as an Exhibit to EXCO’s Current Report on Form 8-K, dated March 31, 2015 and filed on April 2, 2015 and incorporated by reference herein. |
4.16 | Warrant, dated as of March 31, 2015, filed as an Exhibit to EXCO’s Current Report on Form 8-K, dated March 31, 2015 and filed on April 2, 2015 and incorporated by reference herein. |
4.17 | Warrant, dated as of March 31, 2015, filed as an Exhibit to EXCO’s Current Report on Form 8-K, dated March 31, 2015 and filed on April 2, 2015 and incorporated by reference herein. |
4.18 | Registration Rights Agreement, dated as of April 21, 2015, by and between EXCO Resources, Inc. and Energy Strategic Advisory Services LLC, filed as an Exhibit to EXCO’s Current Report on Form 8-K, dated April 21, 2015 and filed on April 27, 2015 and incorporated by reference herein. |
10.1 | Amended and Restated 2005 Long-Term Incentive Plan, filed as an Exhibit to EXCO’s Current Report on Form 8-K (File No. 001-32743), dated November 14, 2007 and filed on November 16, 2007 and incorporated by reference herein.* |
10.2 | Form of Incentive Stock Option Agreement for the EXCO Resources, Inc. Amended and Restated 2005 Long-Term Incentive Plan, filed as an Exhibit to EXCO’s Current Report on Form 8-K (File No. 001-32743), dated November 14, 2007 and filed on November 16, 2007 and incorporated by reference herein.* |
10.3 | Form of Nonqualified Stock Option Agreement for the EXCO Resources, Inc. Amended and Restated 2005 Long-Term Incentive Plan, filed as an Exhibit to EXCO’s Current Report on Form 8-K (File No. 001-32743), dated November 14, 2007 and filed on November 16, 2007 and incorporated by reference herein.* |
10.4 | Form of Restricted Stock Award Agreement for the EXCO Resources, Inc. Amended and Restated 2005 Long-Term Incentive Plan, filed as an Exhibit to EXCO’s Current Report on Form 8-K (File No. 001-32743), dated August 4, 2011 and filed on August 10, 2011 and incorporated by reference herein.* |
10.5 | Form of Restricted Stock Award Agreement for Named Executive Officers for the EXCO Resources, Inc. Amended and Restated 2005 Long-Term Incentive Plan, filed as an Exhibit to EXCO's Quarterly Report on Form 10-Q for the Quarter Ended June 30, 2015 filed on July 27, 2015 and incorporated by reference herein.* |
10.6 | Form of Performance-Based Restricted Stock Unit Agreement for the EXCO Resources, Inc. Amended and Restated 2005 Long-Term Incentive Plan, filed as an Exhibit to EXCO’s Current Report on Form 8-K, dated June 30, 2014 and filed on July 3, 2014 and incorporated by reference herein.* |
10.7 | Form of Performance-Based Share Unit Agreement for the EXCO Resources, Inc. Amended and Restated 2005 Long-Term Incentive Plan, filed as an Exhibit to EXCO’s Current Report on Form 8-K, dated July 1, 2015 and filed on July 8, 2015 and incorporated by reference herein.* |
10.8 | Form of Performance-Based Share Unit Agreement for Named Executive Officers for the EXCO Resources, Inc. Amended and Restated 2005 Long-Term Incentive Plan, filed as an Exhibit to EXCO’s Current Report on Form 8-K, dated July 1, 2015 and filed on July 8, 2015 and incorporated by reference herein.* |
143
10.9 | Form of Performance-Based Share Unit Agreement for the EXCO Resources, Inc. Amended and Restated 2005 Long-Term Incentive Plan, filed as an Exhibit to EXCO’s Current Report on Form 8-K, dated July 1, 2016 and filed on July 6, 2016 and incorporated by reference herein.* |
10.10 | Form of Performance-Based Share Unit Agreement for Named Executive Officers for the EXCO Resources, Inc. Amended and Restated 2005 Long-Term Incentive Plan, filed as an Exhibit to EXCO’s Current Report on Form 8-K, dated July 1, 2016 and filed on July 6, 2016 and incorporated by reference herein.* |
10.11 | Fourth Amended and Restated EXCO Resources, Inc. Severance Plan, filed as an Exhibit to EXCO’s Current Report on Form 8-K (File No. 001-32743), dated March 16, 2011 and filed on March 22, 2011 and incorporated by reference herein.* |
10.12 | Amended and Restated 2007 Director Plan of EXCO Resources, Inc., filed as an Exhibit to EXCO’s Current Report on Form 8-K (File No. 001-32743), dated November 14, 2007 and filed on November 16, 2007 and incorporated by reference herein.* |
10.13 | Amendment Number One to the Amended and Restated 2007 Director Plan of EXCO Resources, Inc., filed as an Exhibit to EXCO’s Annual Report on Form 10-K (File No. 001-32743) for 2009 filed on February 24, 2010 and incorporated by reference herein.* |
10.14 | Amendment Number Two to the Amended and Restated 2007 Director Plan of EXCO Resources, Inc., effective as of May 22, 2014, filed as an Exhibit to EXCO’s Current Report on Form 8-K, dated May 22, 2014 and filed on May 29, 2014 and incorporated by reference herein.* |
10.15 | Amendment Number Three to the Amended and Restated 2007 Director Plan of EXCO Resources, Inc., effective as of December 4, 2015, filed as an Exhibit to EXCO’s Current Report on Form 8-K, dated December 4, 2015 and filed on December 10, 2015 and incorporated by reference herein.* |
10.16 | Letter Agreement, dated March 28, 2007, with OCM Principal Opportunities Fund IV, L.P. and OCM EXCO Holdings, LLC, filed as an Exhibit to EXCO’s Current Report on Form 8-K (File No. 001-32743), dated March 28, 2007 and filed on April 2, 2007 and incorporated by reference herein. |
10.17 | Amendment Number One to the EXCO Resources, Inc. Amended and Restated 2005 Long-Term Incentive Plan, filed as an exhibit to EXCO’s Current Report on Form 8-K (File No. 001-32743), dated June 4, 2009 and filed on June 10, 2009 and incorporated by reference herein.* |
10.18 | Amendment Number Two to the EXCO Resources, Inc. Amended and Restated 2005 Long-Term Incentive Plan, dated as of October 6, 2011, filed as an Exhibit to EXCO’s Current Report on Form 8-K (File No. 001-32743), dated October 6, 2011 and filed on October 7, 2011 and incorporated by reference herein.* |
10.19 | Amendment Number Three to the EXCO Resources, Inc. Amended and Restated 2005 Long-Term Incentive Plan, dated as of June 11, 2013, filed as an Exhibit to EXCO's Current Report on Form 8-K, dated June 11, 2013 and filed on June 12, 2013 and incorporated by reference herein.* |
10.20 | Form of Restricted Stock Award Agreement, filed as an Exhibit to EXCO's Quarterly Report on Form 10-Q for the Quarter Ended June 30, 2013 filed on August 7, 2013 and incorporated by reference herein.* |
10.21 | Joint Development Agreement, dated August 14, 2009, by and among BG US Production Company, LLC, EXCO Operating Company, LP and EXCO Production Company, LP, filed as an Exhibit to EXCO’s Current Report on Form 8-K (File No. 001-32743), dated August 11, 2009 and filed on August 17, 2009 and incorporated by reference herein. |
10.22 | Amendment to Joint Development Agreement, dated February 1, 2011, by and among BG US Production Company, LLC and EXCO Operating Company, LP, filed as an Exhibit to EXCO’s Annual Report on Form 10-K (File No. 001-32743) for 2010 filed February 24, 2011 and incorporated by reference herein. |
10.23 | Amendment to Joint Development Agreement, dated October 14, 2014, by and among BG US Production Company, LLC and EXCO Operating Company, LP, filed as an Exhibit to EXCO's Annual Report on Form 10-K for 2014 filed on February 25, 2015 and incorporated by reference herein. |
144
10.24 | Joint Development Agreement, dated as of June 1, 2010, by and among EXCO Production Company (PA), LLC, EXCO Production Company (WV), LLC, BG Production Company, (PA), LLC, BG Production Company, (WV), LLC and EXCO Resources (PA), LLC, filed as an Exhibit to EXCO’s Current Report on Form 8-K (File No. 001-32743), dated June 1, 2010 and filed on June 7, 2010 and incorporated by reference herein. |
10.25 | Amendment to Joint Development Agreement, dated February 4, 2011, by and among EXCO Production Company (PA), LLC, EXCO Production Company (WV), LLC, BG Production Company, (PA), LLC, BG Production Company, (WV), LLC and EXCO Resources (PA), LLC, filed as an Exhibit to EXCO’s Annual Report on Form 10-K (File No. 001-32743) for 2010 filed February 24, 2011 and incorporated by reference herein. |
10.26 | Amendment to Joint Development Agreement, dated October 14, 2014, by and among EXCO Production Company (PA), LLC, EXCO Production Company (WV), LLC, BG Production Company, (PA), LLC, BG Production Company, (WV), LLC and EXCO Resources (PA), LLC, filed as an Exhibit to EXCO's Annual Report on Form 10-K for 2014 filed on February 25, 2015 and incorporated by reference herein. |
10.27 | Second Amended and Restated Limited Liability Company Agreement of EXCO Resources (PA), LLC, dated June 1, 2010, by and among EXCO Holding (PA), Inc., BG US Production Company, LLC and EXCO Resources (PA), LLC, filed as an Exhibit to EXCO’s Current Report on Form 8-K (File No. 001-32743), dated June 1, 2010 and filed on June 7, 2010 and incorporated by reference herein. |
10.28 | Amendment to Second Amended and Restated Limited Liability Company Agreement of EXCO Resources (PA), LLC, dated October 14, 2014, by and among EXCO Holding (PA), Inc., BG US Production Company, LLC and EXCO Resources (PA), LLC, filed as an Exhibit to EXCO's Annual Report on Form 10-K for 2014 filed on February 25, 2015 and incorporated by reference herein. |
10.29 | Second Amended and Restated Limited Liability Company Agreement of Appalachia Midstream, LLC, dated June 1, 2010, by and among EXCO Holding (PA), Inc., BG US Production Company, LLC and Appalachia Midstream, LLC, filed as an Exhibit to EXCO’s Current Report on Form 8-K (File No. 001-32743), dated June 1, 2010 and filed on June 7, 2010 and incorporated by reference herein. |
10.30 | Amendment to Second Amended and Restated Limited Liability Company Agreement of Appalachia Midstream, LLC (n/k/a EXCO Appalachia Midstream, LLC), dated October 14, 2014, by and among EXCO Holding (PA), Inc., BG US Production Company, LLC and EXCO Appalachia Midstream, LLC, filed as an Exhibit to EXCO's Annual Report on Form 10-K for 2014 filed on February 25, 2015 and incorporated by reference herein. |
10.31 | Letter Agreement, dated June 1, 2010 and effective as of May 9, 2010, by and between EXCO Holding (PA), Inc. and BG US Production Company, LLC, filed as an Exhibit to EXCO’s Current Report on Form 8-K (File No. 001-32743), dated June 1, 2010 and filed on June 7, 2010 and incorporated by reference herein. |
10.32 | Guaranty, dated May 9, 2010, by BG Energy Holdings Limited in favor of EXCO Holding (PA), Inc., EXCO Production Company (PA), LLC and EXCO Production Company (WV), LLC, filed as an Exhibit to EXCO’s Current Report on Form 8-K (File No. 001-32743), dated June 1, 2010 and filed on June 7, 2010 and incorporated by reference herein. |
10.33 | Performance Guaranty, dated May 9, 2010, by EXCO Resources, Inc. in favor of BG US Production Company, LLC, filed as an Exhibit to EXCO’s Current Report on Form 8-K (File No. 001-32743), dated June 1, 2010 and filed on June 7, 2010 and incorporated by reference herein. |
10.34 | Guaranty, dated June 1, 2010, by BG North America, LLC in favor of (i) EXCO Production Company (PA), LLC, EXCO Production Company (WV), LLC and EXCO Resources (PA), LLC; and (ii) EXCO Resources (PA), LLC and EXCO Holding (PA), Inc, filed as an Exhibit to EXCO’s Current Report on Form 8-K (File No. 001-32743), dated June 1, 2010 and filed on June 7, 2010 and incorporated by reference herein. |
10.35 | Guaranty, dated June 1, 2010, by EXCO Resources, Inc., in favor of: (i) BG Production Company (PA), LLC, BG Production Company (WV), LLC and EXCO Resources (PA), LLC; and (ii) EXCO Resources (PA), LLC and BG US Production Company, LLC, filed as an Exhibit to EXCO’s Current Report on Form 8-K (File No. 001-32743), dated June 1, 2010 and filed on June 7, 2010 and incorporated by reference herein. |
10.36 | Amended and Restated Credit Agreement, dated as of July 31, 2013, among EXCO Resources, Inc., as Borrower, certain subsidiaries of Borrower, as Guarantors, the lender parties thereto, and JPMorgan Chase Bank, N.A., as |
145
Administrative Agent, filed as an Exhibit to EXCO's Current Report on Form 8-K, dated as of August 19, 2013 and filed on August 23, 2013 and incorporated by reference herein.
10.37 | First Amendment to Amended and Restated Credit Agreement, dated as of August 28, 2013, among EXCO Resources, Inc., as Borrower, certain subsidiaries of Borrower, as Guarantors, the lender parties thereto, and JPMorgan Chase Bank, N.A., as Administrative Agent, filed as an Exhibit to EXCO's Current Report on Form 8-K, dated as of August 28, 2013 and filed on September 4, 2013 and incorporated by reference herein. |
10.38 | Second Amendment to Amended and Restated Credit Agreement, dated as of July 14, 2014, by and among EXCO Resources, Inc., as Borrower, certain subsidiaries of Borrower, as Guarantors, the Lenders party thereto, and JPMorgan Chase Bank, N.A., as Administrative Agent, filed as an Exhibit to EXCO's Current Report on Form 8-K, dated as of July 14, 2014 and filed on July 18, 2014 and incorporated by reference herein. |
10.39 | Third Amendment to Amended and Restated Credit Agreement, dated as of October 21, 2014, by and among EXCO Resources, Inc., as Borrower, certain subsidiaries of Borrower, as Guarantors, the Lenders party thereto, and JPMorgan Chase Bank, N.A., as Administrative Agent, filed as an Exhibit to EXCO’s Current Report on Form 8-K, dated October 21, 2014 and filed on October 27, 2014 and incorporated by reference herein. |
10.40 | Fourth Amendment to Amended and Restated Credit Agreement, dated as of February 6, 2015, among EXCO Resources, Inc., as Borrower, certain subsidiaries of Borrower, as Guarantors, the lender parties thereto, and JPMorgan Chase Bank, N.A., as Administrative Agent, filed as an Exhibit to EXCO's Current Report Form 8-K, dated as of February 6, 2015 and filed on February 12, 2015 and incorporated by reference herein. |
10.41 | Fifth Amendment to Amended and Restated Credit Agreement, dated July 27, 2015, among EXCO Resources, Inc., as Borrower, certain subsidiaries of Borrower, as Guarantors, the lender parties thereto, and JPMorgan Chase Bank, N.A., as Administrative Agent, filed as an Exhibit to EXCO's Current Report on Form 8-K, dated as of July 27, 2015 and filed July 28, 2015 and incorporated by reference herein. |
10.42 | Sixth Amendment to Amended and Restated Credit Agreement, dated as of October 19, 2015, among EXCO Resources, Inc., as Borrower, certain subsidiaries of Borrower, as Guarantors, the lender parties thereto, and JPMorgan Chase Bank, N.A., as Administrative Agent, filed as an Exhibit to EXCO's Current Report on Form 8-K, dated as of October 19, 2015 and filed on October 22, 2015 and incorporated by reference herein. |
10.43 | Limited Consent, dated as of September 1, 2016, among EXCO Resources, Inc., as Borrower, certain subsidiaries of Borrower, as Guarantors, the lender parties thereto, and JPMorgan Chase Bank, N.A., as Administrative Agent, filed as an Exhibit to EXCO’s Quarterly Report on Form 10-Q for the Quarter Ended September 30, 2016 filed on November 2, 2016 and incorporated by reference herein. |
10.44 | Limited Consent, dated as of December 30, 2016, among EXCO Resources, Inc., as Borrower, certain subsidiaries of Borrower, as Guarantors, the lender parties thereto, and JPMorgan Chase Bank, N.A., as Administrative Agent, filed as an Exhibit to EXCO's Current Report on Form 8- K, dated as of December 30, 2016 and filed on January 6, 2017 and incorporated by reference herein. |
10.45 | Term Loan Credit Agreement, dated as of October 19, 2015, by and among EXCO Resources, Inc., as Borrower, certain subsidiaries of Borrower, as Guarantors, the lenders party thereto, Hamblin Watsa Investment Counsel Ltd., as Administrative Agent, and Wilmington Trust, National Association, as Collateral Trustee, filed as an Exhibit to EXCO’s Current Report on Form 8-K, dated as of October 19, 2015 and filed on October 22, 2015 and incorporated by reference herein. |
10.46 | Term Loan Credit Agreement, dated as of October 19, 2015, by and among EXCO Resources, Inc., as Borrower, certain subsidiaries of Borrower, as Guarantors, the lenders party thereto, and Wilmington Trust, National Association, as Administrative Agent and Collateral Trustee, filed as an Exhibit to EXCO’s Current Report on Form 8-K, dated as of October 19, 2015 and filed on October 22, 2015 and incorporated by reference herein. |
10.47 | Form of Joinder Agreement to Term Loan Credit Agreement, filed as an Exhibit to EXCO’s Current Report on Form 8-K, dated as of November 4, 2015 and filed on November 11, 2015 and incorporated by reference herein. |
10.48 | Intercreditor Agreement, dated as of October 26, 2015, by and among EXCO Resources, Inc., JPMorgan Chase Bank, N.A., as Priority Lien Agent, and Wilmington Trust, National Association, as Second Lien Collateral Agent, filed as an Exhibit to EXCO’s Current Report on Form 8-K, dated as of October 26, 2015 and filed on October 27, 2015 and incorporated by reference herein. |
146
10.49 | Intercreditor Joinder, dated as of October 26, 2015, filed as an Exhibit to EXCO’s Current Report on Form 8-K, dated as of October 26, 2015 and filed on October 27, 2015 and incorporated by reference herein. |
10.50 | Collateral Trust Agreement, dated as of October 26, 2015, by and among EXCO Resources, Inc., the grantors and guarantors from time to time party thereto, Hamblin Watsa Investment Counsel Ltd., as Administrative Agent of the second lien credit agreement, the other parity lien debt representatives from time to time party thereto, and Wilmington Trust, National Association, as Collateral Trustee, filed as an Exhibit to EXCO’s Current Report on Form 8-K, dated as of October 26, 2015 and filed on October 27, 2015 and incorporated by reference herein. |
10.51 | Collateral Trust Joinder, dated as of October 26, 2015, filed as an Exhibit to EXCO’s Current Report on Form 8-K, dated as of October 26, 2015 and filed on October 27, 2015 and incorporated by reference herein. |
10.52 | Form of Note Purchase Agreement, filed as an Exhibit to EXCO’s Current Report on Form 8-K, dated as of October 19, 2015 and filed on October 22, 2015 and incorporated by reference herein. |
10.53 | Form of Follow-on Note Purchase Agreement, filed as an Exhibit to EXCO’s Current Report on Form 8-K, dated as of October 30, 2015 and filed on November 2, 2015 and incorporated by reference herein. |
10.54 | Amended and Restated Participation Agreement, dated July 25, 2016, by and among Admiral A Holding L.P., TE Admiral A Holding L.P., Colt Admiral A Holding L.P. and EXCO Operating Company, LP., filed as an Exhibit to EXCO’s Current Report on Form 8-K, dated July 25, 2016 and filed on July 27, 2016 and incorporated by reference herein. |
10.55 | Form of Director Indemnification Agreement, filed as an Exhibit to EXCO’s Current Report on Form 8-K (File No. 001-32743), dated November 10, 2010 and filed on November 12, 2010 and incorporated by reference herein. |
10.56 | MVC Letter Agreement, dated November 15, 2013, among BG US Production Company, LLC, BG US Gathering Company, LLC, EXCO Operating Company, LP, Azure Midstream Energy LLC (formerly known as TGGT Holdings, LLC) and TGG Pipeline, Ltd, filed as an Exhibit to EXCO’s Current Report on Form 8-K, dated November 15, 2013 and filed on November 21, 2013 and incorporated by reference herein. |
10.57 | EXCO Resources, Inc. 2015 Management Incentive Plan, dated March 4, 2015, filed as an Exhibit to EXCO’s Current Report on Form 8-K, dated March 4, 2015 and filed on March 10, 2015 and incorporated by reference herein.* |
10.58 | EXCO Resources, Inc. 2016 Management Incentive Plan, dated April 20, 2016, filed as an Exhibit to EXCO’s Current Report on Form 8-K, dated April 20, 2016 and filed on April 26, 2016 and incorporated by reference herein.* |
10.59 | Retention Agreement, dated May 14, 2015, by and between Harold H. Jameson and EXCO Resources, Inc., filed as an Exhibit to EXCO’s Current Report on Form 8-K, dated May 14, 2015 and filed on May 20, 2015 and incorporated by reference herein.* |
10.60 | Amended and Restated Retention Agreement, dated May 14, 2015, by and between Harold L. Hickey and EXCO Resources, Inc., filed as an Exhibit to EXCO’s Current Report on Form 8-K, dated May 14, 2015 and filed on May 20, 2015 and incorporated by reference herein.* |
10.61 | Services and Investment Agreement, dated as of March 31, 2015, by and among EXCO Resources, Inc. and Energy Strategic Advisory Services LLC, filed as an Exhibit to Amendment No. 1 to EXCO’s Current Report on Form 8-K/A, dated March 31, 2015 and filed on May 26, 2015 and incorporated by reference herein. |
10.62 | Acknowledgment of Amendment to Services and Investment Agreement, dated as of May 26, 2015, by and between EXCO Resources, Inc. and Energy Strategic Advisory Services LLC, filed as an Exhibit to EXCO’s Current Report on Form 8-K, dated May 26, 2015 and filed on June 1, 2015 and incorporated by reference herein. |
10.63 | Amendment No. 2 to Services and Investment Agreement, dated as of September 8, 2015, by and between EXCO Resources, Inc. and Energy Strategic Advisory Services LLC, filed as an Exhibit to EXCO’s Current Report on Form 8-K, dated September 8, 2015 and filed on September 9, 2015 and incorporated by reference herein. |
147
10.64 | Nomination Letter Agreement, dated as of September 8, 2015, by and between EXCO Resources, Inc. and Energy Strategic Advisory Services LLC, filed as an Exhibit to EXCO’s Current Report on Form 8-K, dated September 8, 2015 and filed on September 9, 2015 and incorporated by reference herein. |
14.1 | Code of Ethics for the Chief Executive Officer and Senior Financial Officers, filed as an Exhibit to EXCO's Amendment No. 1 to its Registration Statement on Form S-1 (File No. 333-129935) filed January 6, 2006 and incorporated by reference herein. |
14.2 | Code of Business Conduct and Ethics for Directors, Officers and Employees, filed as an Exhibit to EXCO's Amendment No. 1 to its Registration Statement on Form S-1 (File No. 333-129935) filed January 6, 2006 and incorporated by reference herein. |
14.3 | Amendment No. 1 to EXCO Resources, Inc. Code of Business Conduct and Ethics for Directors, Officers and Employees, filed as an Exhibit to EXCO's Current Report on Form 8-K (File No. 001-32743), dated November 8, 2006 and filed on November 9, 2006 and incorporated by reference herein. |
21.1 | Subsidiaries of registrant, filed herewith. |
23.1 | Consent of KPMG LLP, filed herewith. |
23.2 | Consent of Lee Keeling and Associates, Inc., filed herewith. |
23.3 | Consent of Netherland, Sewell & Associates, Inc., filed herewith. |
23.4 | Consent of Ryder Scott Company, L.P., filed herewith. |
31.1 | Certification pursuant to Section 302 of the Sarbanes-Oxley Act of 2002 of Principal Executive Officer of EXCO Resources, Inc., filed herewith. |
31.2 | Certification pursuant to Section 302 of the Sarbanes-Oxley Act of 2002 of Principal Financial Officer of EXCO Resources, Inc., filed herewith. |
32.1 | Certification pursuant to Section 906 of the Sarbanes-Oxley Act of 2002 of Principal Executive Officer and Principal Financial Officer of EXCO Resources, Inc., filed herewith. |
99.1 | 2016 Report of Netherland, Sewell & Associates, Inc., filed herewith. |
99.2 | 2016 Report of Ryder Scott Company, L.P., filed herewith. |
101.INS | XBRL Instance Document. |
101.SCH | XBRL Taxonomy Extension Schema Document. |
101.CAL | XBRL Taxonomy Calculation Linkbase Document. |
101.DEF | XBRL Taxonomy Definition Linkbase Document. |
101.LAB | XBRL Taxonomy Label Linkbase Document. |
101.PRE | XBRL Taxonomy Presentation Linkbase Document. |
* | These exhibits are management contracts. |
148