Attached files
| file | filename |
|---|---|
| EXCEL - IDEA: XBRL DOCUMENT - United States Commodity Index Funds Trust | Financial_Report.xls |
| EX-31.1 - EXHIBIT 31.1 - United States Commodity Index Funds Trust | v402380_ex31-1.htm |
| EX-23.1 - EXHIBIT 23.1 - United States Commodity Index Funds Trust | v402380_ex23-1.htm |
| EX-14.1 - EXHIBIT 14.1 - United States Commodity Index Funds Trust | v402380_ex14-1.htm |
| EX-32.2 - EXHIBIT 32.2 - United States Commodity Index Funds Trust | v402380_ex32-2.htm |
| EX-31.2 - EXHIBIT 31.2 - United States Commodity Index Funds Trust | v402380_ex31-2.htm |
| EX-32.1 - EXHIBIT 32.1 - United States Commodity Index Funds Trust | v402380_ex32-1.htm |
UNITED STATES
SECURITIES AND EXCHANGE COMMISSION
Washington, D.C. 20549
FORM 10-K
| x | Annual report pursuant to Section 13 or 15(d) of the Securities Exchange Act of 1934 for the fiscal year ended December 31, 2014. |
or
| ¨ | Transition report pursuant to Section 13 or 15(d) of the Securities Exchange Act of 1934 for the transition period from to . |
Commission file number: 001-34833
United States Commodity Index Funds Trust
(Exact name of registrant as specified in its charter)
| Delaware | 27-1537655 | |
|
(State or other jurisdiction of incorporation or organization) |
(I.R.S. Employer Identification No.) |
1999 Harrison Street, Suite 1530
Oakland, California 94612
(Address of principal executive offices) (Zip code)
(510) 522-9600
(Registrant’s telephone number, including area code)
Securities registered pursuant to Section 12(b) of the Act:
| Shares of United States Agriculture Index Fund | NYSE Arca, Inc. | |
| Shares of United States Commodity Index Fund | NYSE Arca, Inc. | |
| Shares of United States Copper Index Fund | NYSE Arca, Inc. | |
| Shares of United States Metals Index Fund | NYSE Arca, Inc. | |
| (Title of each class) | (Name of exchange on which registered) |
Securities registered pursuant to Section 12(g) of the Act: None
Indicate by check mark if the registrant is a well-known seasoned issuer, as defined in Rule 405 of the Securities Act. ¨ Yes x No
Indicate by check mark if the registrant is not required to file reports pursuant to Section 13 or Section 15(d) of the Act. ¨ Yes x No
Indicate by check mark whether the registrant (1) has filed all reports required to be filed by Section 13 or 15(d) of the Securities Exchange Act of 1934 during the preceding 12 months (or for such shorter period that the registrant was required to file such reports), and (2) has been subject to such filing requirements for the past 90 days. x Yes ¨ No
Indicate by check mark whether the registrant has submitted electronically and posted on its corporate Website, if any, every Interactive Data File required to be submitted and posted pursuant to Rule 405 of Regulation S-T (§232.405 of this chapter) during the preceding 12 months (or for such shorter period that the registrant was required to submit and post such files). x Yes ¨ No
Indicate by check mark if disclosure of delinquent filers pursuant to Item 405 of Regulation S-K (§229.405 of this chapter) is not contained herein, and will not be contained, to the best of registrant’s knowledge, in definitive proxy or information statements incorporated by reference in Part III of this Form 10-K or any amendment to this Form 10-K. x
Indicate by check mark whether the registrant is a large accelerated filer, an accelerated filer, a non-accelerated filer, or a smaller reporting company. See the definitions of “large accelerated filer,” “accelerated filer” and “smaller reporting company” in Rule 12b-2 of the Exchange Act.
| Large accelerated filer ¨ | Accelerated filer x | |
| Non-accelerated filer ¨ | Smaller reporting company ¨ | |
| (Do not check if a smaller reporting company) | ||
Indicate by check mark whether the registrant is a shell company (as defined in Rule 12b-2 of the Exchange Act). ¨ Yes x No
The aggregate market value of the shares of each series of the registrant held by non-affiliates as of June 30, 2014 and the number of outstanding shares of each series of the registrant as of March 11, 2015 are included in the table below:
| Aggregate Market Value of Each Series’ Shares Held by Non-Affiliates as of June 30, 2014 | Number of Outstanding Shares as of March 11, 2015 | |||||||
| United States Agriculture Index Fund | $ | 2,561,872 | 100,000 | |||||
| United States Commodity Index Fund | 657,726,697 | 15,150,000 | ||||||
| United States Copper Index Fund | 4,285,143 | 100,000 | ||||||
| United States Metals Index Fund | 2,339,883 | 50,000 | ||||||
| Total | $ | 666,913,595 | 15,400,000 | |||||
DOCUMENTS INCORPORATED BY REFERENCE:
None.
UNITED STATES COMMODITY INDEX FUNDS TRUST
Table of Contents
| Item 1. | Business. |
What is the Trust and the Trust Series?
The United States Commodity Index Funds Trust (the “Trust”) is a Delaware statutory trust formed on December 21, 2009. The Trust is a series trust formed pursuant to the Delaware Statutory Trust Act and is organized into four separate series (each series, a “Trust Series” and collectively, the “Trust Series”). As of December 31, 2014, the Trust includes the United States Commodity Index Fund (“USCI”), a commodity pool formed on April 1, 2010 and first made available to the public on August 10, 2010, the United States Copper Index Fund (“CPER”), a commodity pool formed on November 26, 2010 and first made available to the public on November 15, 2011, the United States Agriculture Index Fund (“USAG”), a commodity pool formed on November 26, 2010 and first made available to the public on April 13, 2012 and the United States Metals Index Fund (“USMI”), a commodity pool formed on November 26, 2010 and first made available to the public on June 19, 2012. On January 30, 2015, USCF as the sponsor of the Trust and its series USMI announced that its officers and members had authorized a plan to (i) liquidate USMI, (ii) terminate the continuous offering of USMI, and (iii) deregister USMI under the Securities Exchange Act of 1934, as amended (the “Exchange Act”), and therefore, terminate the Trust’s obligation to include USMI on its periodic and current reports with the Securities and Exchange Commission (“SEC”). USCF has submitted written notice to the NYSE Arca, Inc. (“NYSE Arca”) of its decision to liquidate USMI, terminate the offering and to terminate USMI’s obligations under the Exchange Act.
Shares of USMI will cease trading on the NYSE Arca and will be closed to purchase by investors as of the close of regular trading on the NYSE Arca on March 18, 2015 (the “Closing Date”). On March 18, 2015, USMI will cease accepting orders for Creation Baskets and Redemption Baskets. The Trust will file a post-effective amendment to the registration statement on behalf of USMI to terminate the offering of registered and unsold shares of USMI. The post-effective amendment to the registration statement will be effective on March 18, 2015.
Shareholders may sell shares of USMI prior to the Closing Date and customary brokerage charges, or Redemption Basket charges, as the case may be, may apply to these transactions. From March 18, 2015 through about March 25, 2015 (the “Liquidation Date”) there is no assurance that there will be a market for shares of USMI. Between the Closing Date and the Liquidation Date, USMI will be in the process of closing down and liquidating its portfolio. This process will result in USMI increasing its cash holdings and, as a consequence, not tracking its index, the SummerHaven Metals Index Total ReturnSM, which may not be consistent with USMI’s investment objective and strategy.
On or about the Liquidation Date, USMI will liquidate its assets and distribute cash pro rata to all remaining shareholders who have not previously redeemed or exchanged their shares. These distributions are taxable events. Once the distributions are complete, USMI will terminate.
USCF has determined that USMI could not continue its business and operations in an economically efficient manner due to USMI’s inability to attract sufficient assets, thereby hindering its ability to operate efficiently.
USCF intends to file a post-effective amendment on behalf of the Trust and USMI to terminate the offering of the registered and unsold shares of USMI. The NYSE Arca will file a Form 25 with the SEC to affect the withdrawal of the listing of USMI from the NYSE Arca. Delisting from the NYSE Arca will become effective 10 days after the filing date of the Form 25. Provided that USMI continues to meet the applicable legal requirements, USCF intends to file a Form 15 on behalf of the Trust and USMI with the SEC in early April 2015 to suspend the Trust’s duty to include USMI on its reports under Sections 13(a) and 15(d) of the Exchange Act. USMI expects the termination of registration will become effective 90 days after the date of the filing of the Form 15 with the SEC.
The Trust and Trust Series maintain their main business offices at 1999 Harrison Street, Suite 1530, Oakland, CA 94612. USCI, CPER and USAG each issues shares (“shares”) that may be purchased and sold on the NYSE Arca. The Trust and each Trust Series operate pursuant to the terms of the Trust’s Third Amended and Restated Declaration of Trust and Trust Agreement dated as of March 22, 2013, as amended from time to time, (the “Trust Agreement”), which grants full management control to their sponsor, United States Commodity Funds LLC (“USCF”).
| 1 |
USCI’s Investment Objective
USCI invests in futures contracts for commodities that are currently traded on the New York Mercantile Exchange (the “NYMEX”), ICE Futures (“ICE Futures”), Chicago Board of Trade (“CBOT”), Chicago Mercantile Exchange (“CME”), London Metal Exchange (“LME”), Commodity Exchange, Inc. (“COMEX”) or on other foreign exchanges (the NYMEX, ICE Futures, CBOT, CME, LME, Comex and other foreign exchanges, collectively, the “Futures Exchanges”) (such futures contracts, collectively, “Futures Contracts”) and, to a lesser extent, in order to comply with regulatory requirements or in view of market conditions, other commodity-based contracts and instruments such as cash-settled options on Futures Contracts, forward contracts relating to commodities, cleared swap contracts and other nonexchange traded (“over-the-counter”) transactions that are based on the price of commodities and Futures Contracts (collectively, “Other Commodity-Related Investments”). Market conditions that USCF currently anticipates could cause USCI to invest in Other Commodity Related Investments would be those allowing USCI to obtain greater liquidity or to execute transactions with more favorable pricing. Futures Contracts and Other Commodity-Related Investments collectively are referred to as “Commodity Interests.”
The investment objective of USCI is for the daily changes in percentage terms of its shares’ per share net asset value (“NAV”) to reflect the daily changes in percentage terms of the SummerHaven Dynamic Commodity Index Total ReturnSM (the “SDCI”), less USCI’s expenses. USCF does not intend to operate USCI in a fashion such that its per share NAV will equal, in dollar terms, the spot prices of the commodities underlying the Benchmark Component Futures Contracts (as defined below) that comprise the SDCI or the prices of any particular group of Futures Contracts. USCI will not seek to achieve its stated investment objective over a period of time greater than one day. USCI believes that it is not practical to manage the portfolio to achieve such an investment goal when investing in Futures Contracts and Other Commodity-Related Investments. The SDCI is designed to reflect the performance of a diversified group of commodities. The SDCI is comprised of 14 Futures Contracts that are selected on a monthly basis from a list of 27 possible Futures Contracts. The Futures Contracts that at any given time make up the SDCI are referred to herein as “Benchmark Component Futures Contracts.” The SDCI is owned and maintained by SummerHaven Index Management, LLC (“SHIM”) and calculated and published by Bloomberg, L.P. (“Bloomberg”). USCI invests first in the current Benchmark Component Futures Contracts and other Futures Contracts intended to replicate the return on the current Benchmark Component Futures Contracts and, thereafter may hold Futures Contracts in a particular commodity other than one specified as the Benchmark Component Futures Contract, or may hold Other Commodity-Related Investments that are intended to replicate the return on the Benchmark Futures Contracts, but may fail to closely track the SDCI’s total return movements. If USCI increases in size, and due to its obligations to comply with regulatory limits or due to other market pricing or liquidity factors, USCI may invest in Futures Contract months other than the designated month specified as the Benchmark Component Futures Contract, or in Other Commodity-Related Investments, which may have the effect of increasing transaction related expenses and may result in increased tracking error.
USCI’s shares began trading on August 10, 2010. As of December 31, 2014, USCI held 657 Futures Contracts on the NYMEX, 2,553 Futures Contracts on the ICE Futures, 5,487 Futures Contracts on the CBOT, 2,861 Futures Contracts on the CME, 5,001 Futures Contracts on the LME and 430 Futures Contracts on the COMEX.
CPER’s Investment Objective
The investment objective of CPER is for the daily changes in percentage terms of its shares’ per share NAV to reflect the daily changes in percentage terms of the SummerHaven Copper Index Total ReturnSM (the “SCI”), less CPER’s expenses. USCF does not intend to operate CPER in a fashion such that its per share NAV will equal, in dollar terms, the spot prices of the commodities underlying the Benchmark Component Copper Futures Contracts (as defined below) that comprise the SCI or the prices of any particular group of Futures Contracts. CPER will not seek to achieve a stated investment objective over a period of time greater than one day. USCF believes that it is not practical to manage the portfolio to achieve such an investment goal when investing in Futures Contracts and Other Copper-Related Investments (as defined below). The SCI is designed to reflect the performance of the investment returns from a portfolio of copper futures contracts. The SCI is owned and maintained by SHIM and calculated and published by the NYSE Arca. The SCI is comprised of either two or three Eligible Copper Futures Contracts that are selected on a monthly basis based on quantitative formulas relating to the prices of the Eligible Copper Futures Contracts developed by SHIM. The Eligible Copper Futures Contracts that at any given time make up the SCI are referred to herein as “Benchmark Component Copper Futures Contracts.”
| 2 |
CPER seeks to achieve its investment objective by investing to the fullest extent possible in the Benchmark Component Copper Futures Contracts. Then, if constrained by regulatory requirements or in view of market conditions, CPER will invest next in other Eligible Copper Futures Contracts, and finally to a lesser extent, in other exchange traded futures contracts that are economically identical or substantially similar to the Benchmark Component Copper Futures Contracts if one or more other Eligible Copper Futures Contracts is not available. When CPER has invested to the fullest extent possible in exchange-traded futures contracts, CPER may then invest in other contracts and instruments based on the Benchmark Component Copper Futures Contracts, other Eligible Copper Futures Contracts or copper, such as cash-settled options, forward contracts, cleared swap contracts and swap contracts other than cleared swap contracts. Other exchange-traded futures contracts that are economically identical or substantially similar to the Benchmark Component Copper Futures Contracts and other contracts and instruments based on the Benchmark Component Copper Futures Contracts, are collectively referred to collectively as “Other Copper-Related Investments,” and together with Benchmark Component Copper Futures Contracts and other Eligible Copper Futures Contracts, “Copper Interests.”
CPER’s shares began trading on November 15, 2011. As of December 31, 2014, CPER held 40 Futures Contracts on the COMEX.
USAG’s Investment Objective
The investment objective of USAG is for the daily changes in percentage terms of its shares’ per share NAV to reflect the daily changes in percentage terms of the SummerHaven Dynamic Agriculture Index Total ReturnSM (the “SDAI”), less USAG’s expenses. USCF does not intend to operate USAG in a fashion such that its per share NAV will equal, in dollar terms, the spot prices of the commodities underlying the Benchmark Component Agriculture Futures Contracts (as defined below) that comprise the SDAI or the prices of any particular group of Futures Contracts. USAG will not seek to achieve its stated investment objective over a period of time greater than one day. USCF believes that it is not practical to manage the portfolio to achieve such an investment goal when investing in Futures Contracts and Other Agriculture-Related Investments (as defined below). The SDAI is designed to reflect the performance of a diversified group of agricultural commodities. The SDAI is owned and maintained by SHIM and calculated and published by the NYSE Arca. Futures contracts for the agricultural commodities comprising the SDAI are traded on ICE Future US, ICE Futures Canada, the CBOT, the Kansas City Board of Trade (“KCBT”) and the CME and are collectively referred to herein as “Eligible Agriculture Futures Contracts.” The SDAI is comprised of 14 Eligible Agriculture Futures Contracts that are selected on a monthly basis based on quantitative formulas developed by SHIM. The Eligible Agriculture Futures Contracts that at any given time make up the SDAI are referred to herein as “Benchmark Component Agriculture Futures Contracts.” The relative weighting of the Benchmark Component Agriculture Futures Contracts will change on a monthly basis, based on quantitative formulas relating to the prices of the Benchmark Component Agriculture Futures Contracts developed by SHIM.
USAG seeks to achieve its investment objective by investing to the fullest extent possible in the Benchmark Component Agriculture Futures Contracts. Then, if constrained by regulatory requirements or in view of market conditions, USAG will invest next in other Eligible Agriculture Futures Contracts based on the same agricultural commodity as the futures contracts subject to such regulatory constraints or market conditions, and finally, to a lesser extent, in other exchange traded futures contracts that are economically identical or substantially similar to the Benchmark Component Agriculture Futures Contracts if one or more other Eligible Agriculture Futures Contracts is not available. When USAG has invested to the fullest extent possible in exchange-traded futures contracts, USAG may then invest in other contracts and instruments based on the Benchmark Component Agriculture Futures Contracts, other Eligible Agriculture Futures Contracts or the agricultural commodities included in the SDAI, such as cash-settled options, forward contracts, cleared swap contracts and swap contracts other than cleared swap contracts. Other exchange-traded futures contracts that are economically identical or substantially similar to the Benchmark Component Agriculture Futures Contracts and other contracts and instruments based on the Benchmark Component Agriculture Futures Contracts, as well as metals included in the SDAI, are collectively referred to as “Other Agriculture-Related Investments,” and together with Benchmark Component Agriculture Futures Contracts and other Eligible Agriculture Futures Contracts, “Agriculture Interests.”
USAG’s shares began trading on April 13, 2012. As of December 31, 2014, USAG held 41 Futures Contracts on the ICE Futures, 8 Futures Contracts on the CME, 2 Futures Contract on the KCBT and 31 Futures Contracts on the CBOT.
| 3 |
USMI’s Investment Objective
Prior to USMI’s cessation of trading, scheduled for March 18, 2015, the investment objective of USMI was for the daily changes in percentage terms of its shares’ per share NAV to reflect the daily changes in percentage terms of the SummerHaven Metals Index Total ReturnSM (the “SDMI”), less USMI’s expenses. The SDMI is owned and maintained by SHIM and calculated and published by the NYSE Arca. Futures contracts for the metals in the SDMI that are traded on the NYMEX, the LME and COMEX are collectively referred to herein as “Eligible Metals Futures Contracts.” The SDMI is comprised of 10 Eligible Metals Futures Contracts that are selected on a monthly basis based on quantitative formulas developed by SHIM. The Eligible Metals Futures Contracts that at any given time make up the SDMI are referred to herein as “Benchmark Component Metals Futures Contracts.” The relative weighting of the Benchmark Component Metals Futures Contracts will change on a monthly basis, based on quantitative formulas relating to the prices of the Benchmark Component Metals Futures Contracts developed by SHIM.
Other exchange-traded futures contracts that are economically identical or substantially similar to the Benchmark Component Metals Futures Contracts and other contracts and instruments based on the Benchmark Component Metals Futures Contracts are collectively referred to as “Other Metals-Related Investments,” and together with Benchmark Component Metals Futures Contracts and other Eligible Metals Futures Contracts, “Metals Interests.”
USMI’s shares began trading on June 19, 2012 and ceased trading on March 18, 2015. USMI’s assets were liquidated by March 25, 2015. As of December 31, 2014, USMI held 2 Futures Contracts on the NYMEX, 73 Futures Contracts on the LME and 12 Futures Contracts on the COMEX.
Other Defined Terms – Trust Series
The SDCI, the SCI, the SDAI and the SDMI are referred to throughout this annual report on Form 10-K collectively as the “Applicable Index” or “Indices.”
Benchmark Component Futures Contracts, Benchmark Component Copper Futures Contracts and Benchmark Component Agriculture Futures Contracts are referred to throughout this annual report on Form 10-K collectively as “Applicable Benchmark Component Futures Contracts.”
Other Commodity-Related Investments, Other Copper-Related Investments and Other Agriculture-Related Interests are referred to throughout this annual report on Form 10-K collectively as “Other Related Investments.”
Who is USCF?
USCF is a single member limited liability company that was formed in the state of Delaware on May 10, 2005. USCF maintains its main business office at 1999 Harrison Street, Suite 1530, Oakland, CA 94612. USCF is a wholly-owned subsidiary of Wainwright Holdings, Inc., a Delaware corporation (“Wainwright”). Mr. Nicholas Gerber (discussed below) controls Wainwright by virtue of his ownership of a majority of Wainwright’s shares. Wainwright is a holding company that currently holds both USCF, as well as USCF Advisers LLC, an investment adviser registered under the Investment Advisers Act of 1940, as amended. USCF Advisers LLC serves as the investment adviser for the Stock Split Index Fund, as series of the USCF ETF Trust. USCF ETF Trust is registered under the Investment Company Act of 1940, as amended (the “1940 Act”). The Board of Trustees for the USCF ETF Trust consists of different independent trustees than those independent directors who serve on the Board of Directors of USCF. USCF is a member of the National Futures Association (the “NFA”) and registered as a commodity pool operator (“CPO”) with the Commodity Futures Trading Commission (the “CFTC”) on December 1, 2005 and as a Swaps Firm on August 8, 2013.
USCF also serves as general partner of the United States Oil Fund, LP (“USO”), the United States Natural Gas Fund, LP (“UNG”), the United States 12 Month Oil Fund, LP (“USL”), the United States Gasoline Fund, LP (“UGA”), the United States Diesel-Heating Oil Fund, LP (“UHN”), the United States Short Oil Fund, LP (“DNO”), the United States 12 Month Natural Gas Fund, LP (“UNL”) and the United States Brent Oil Fund, LP (“BNO”). USO, UNG, USL, UGA, UHN, DNO, UNL and BNO are actively operating funds and all are listed on the NYSE Arca. All funds listed previously are referred to collectively herein as the “Related Public Funds.” The Related Public Funds are subject to reporting requirements under the Securities Exchange Act of 1934, as amended (the “Exchange Act”). For more information about each of the Related Public Funds, investors in the Trust Series may call 1.800.920.0259 or visit www.unitedstatescommodityfunds.com or the U.S. Securities and Exchange Commission’s (the “SEC”) website at www.sec.gov.
| 4 |
USCF is required to evaluate the credit risk of each Trust Series to the futures commission merchant (“FCM”), oversee the purchase and sale of each Trust Series’ shares by certain authorized purchasers (“Authorized Participants”), review daily positions and margin requirements of each Trust Series and manage each Trust Series’ investments. USCF also pays the fees of ALPS Distributors, Inc., which serves as the marketing agent for each Trust Series (the “Marketing Agent”), Brown Brothers Harriman & Co. (“BBH&Co.”), which serves as the administrator (the “Administrator”) and the custodian (the “Custodian”) for each Trust Series, and SummerHaven Investment Management, LLC (“SummerHaven”), which serves as the commodity trading advisor for USCI, CPER, USAG and USMI.
The business and affairs of USCF are managed by a board of directors (the “Board”), which is comprised of three management directors (the “Management Directors”), some of whom are also its executive officers, and three independent directors who meet the independent director requirements established by the NYSE Arca Equities Rules and the Sarbanes-Oxley Act of 2002. The Management Directors have the authority to manage USCF pursuant to the terms of the Fifth Amended and Restated Limited Liability Company Agreement of USCF, dated as of July 22, 2011 (as amended from time to time, the “LLC Agreement”). Through its Management Directors, USCF manages the day-to-day operations of each Trust Series. The Board has an audit committee which is made up of the three independent directors (Gordon L. Ellis, Malcolm R. Fobes III and Peter M. Robinson). For additional information relating to the audit committee, please see “Item 10. Directors, Executive Officers and Corporate Governance – Audit Committee” in this annual report on Form 10-K.
How Does Each Trust Series Operate?
An investment in the shares provides a means for diversifying an investor’s portfolio or hedging exposure to changes in commodities prices. An investment in the shares allows both retail and institutional investors to easily gain this exposure to the commodities market in a transparent, cost-effective manner.
The investment objective of each Trust Series is for the daily changes in percentage terms of its per share NAV to reflect the daily changes in percentage terms of the Applicable Index, less each Trust Series expenses. USCF does not intend to operate any Trust Series in a fashion such that its per share NAV will equal, in dollar terms, the price of the Applicable Index or the price of any particular Applicable Benchmark Component Futures Contract. USCF believes that it is not practical to manage each Trust Series’ portfolio to achieve such an investment goal when investing in the Applicable Benchmark Component Futures Contracts and Other Related Investments.
How USCI Seeks to Achieve Its Investment Objective. USCI seeks to achieve its investment objective by investing in a mix of Commodity Interests such that the daily changes in its per share NAV will closely track the daily changes in the SDCI. USCI’s positions in Commodity Interests are rebalanced on a monthly basis in order to track the changing nature of the SDCI. The portfolio rebalancing takes place during the last four business days of the month (“Rebalancing Period”). At the end of each of the days in the Rebalancing Period, one fourth of the prior month portfolio positions are replaced by equally-weighted positions reflecting the particular Benchmark Component Futures Contracts determined on the selection date, which is the fifth business day before the end of the month (“USCI’s Selection Date”). At the end of the Rebalancing Period, the SDCI will have an equal-weight position of approximately 7.14% in each of the selected Benchmark Component Futures Contracts which will be reflected in the rebalanced portfolio. After fulfilling the collateral requirements with respect to its Commodity Interests, USCI invests the remainder of its proceeds from the sale of creation baskets in short-term obligations of the United States of two years or less (“Treasuries”) or cash equivalents, and/or merely holds such assets in cash (generally in interest-bearing accounts).
How CPER Seeks to Achieve Its Investment Objective. CPER seeks to achieve its investment objective by investing to the fullest extent possible in the Benchmark Component Copper Futures Contracts. Then, if constrained by regulatory requirements or in view of market conditions, CPER will invest next in other Eligible Copper Futures Contracts, and finally to a lesser extent, in other exchange traded futures contracts that are economically identical or substantially similar to the Benchmark Component Copper Futures Contracts if one or more other Eligible Copper Futures Contracts is not available. When CPER has invested to the fullest extent possible in exchange-traded futures contracts, it may then invest in Other Copper-Related Investments. After fulfilling the collateral requirements with respect to its Copper Interests, CPER invests the remainder of its proceeds from the sale of creation baskets in Treasuries or cash equivalents, and/or merely holds such assets in cash (generally in interest-bearing accounts).
| 5 |
How USAG Seeks to Achieve Its Investment Objective. USAG seeks to achieve its investment objective by investing to the fullest extent possible in the Benchmark Component Agriculture Futures Contracts. Then, if constrained by regulatory requirements or in view of market conditions, USAG will invest next in other Eligible Agriculture Futures Contracts, and finally to a lesser extent, in other exchange traded futures contracts that are economically identical or substantially similar to the Benchmark Component Agriculture Futures Contracts if one or more other Eligible Agriculture Futures Contracts is not available. When USAG has invested to the fullest extent possible in exchange-traded futures contracts, it may then invest in Other Agriculture-Related Investments. After fulfilling the collateral requirements with respect to its Agriculture Interests, USAG will invest the remainder of its proceeds from the sale of creation baskets in Treasuries or cash equivalents, and/or merely hold such assets in cash (generally in interest-bearing accounts).
How USMI Sought to Achieve Its Investment Objective. Prior to the cessation of trading scheduled for March 18, 2015, USMI sought to achieve its investment objective by investing to the fullest extent possible in the Benchmark Component Metals Futures Contracts. After fulfilling the collateral requirements with respect to its Metals Interests, USMI invested the remainder of its proceeds from the sale of creation baskets in Treasuries or cash equivalents, and/or merely held such assets in cash (generally in interest-bearing accounts).
The anticipated dates on which USCI, USAG, and CPER’s positions in Applicable Interests will be rebalanced on a monthly basis are posted on such Trust Series’ website at www.unitedstatescommodityfunds.com, and are subject to change without notice.
USCF employs a “neutral” investment strategy in order to track changes in the Applicable Index regardless of whether the Applicable Index goes up or goes down. A Trust Series’ “neutral” investment strategy is designed to permit investors generally to purchase and sell a Trust Series’ shares for the purpose of investing indirectly in the applicable commodities market in a cost-effective manner, and/or to permit participants in the applicable commodities or other industries to hedge the risk of losses in their applicable commodity-related transactions. Accordingly, depending on the investment objective of an individual investor, the risks generally associated with investing in the commodities market and/or the risks involved in hedging may exist. In addition, an investment in a Trust Series involves the risks that the daily changes in the price of the Trust Series’ shares, in percentage terms, will not accurately track the daily changes in the Applicable Index, in percentage terms, and that daily changes in the Applicable Index, in percentage terms, will not closely correlate with daily changes in the spot prices of the applicable commodities underlying the Applicable Benchmark Component Futures Contracts, in percentage terms.
Each Trust Series’ investment objective is for the daily changes in percentage terms of its per share NAV to reflect the daily changes in percentage terms of the Applicable Index, not to have the market price of its shares match, dollar for dollar, changes in the price of the Applicable Index or the applicable commodities underlying the Applicable Benchmark Component Futures Contracts that make up the Applicable Index. Contango and backwardation may impact the total return on investment in shares of a Trust Series relative to a hypothetical direct investment in the commodities underlying the Applicable Benchmark Component Futures Contracts that make up the Applicable Index and, in the future, it is likely that the relationship between the market prices of a Trust Series’ shares and changes in the spot prices of the commodities underlying the Applicable Benchmark Component Futures Contracts that make up the Applicable Index could be impacted by contango and backwardation. It is important to note that this comparison ignores the potential costs associated with physically owning and storing commodities, which could be substantial. For a more in-depth discussion of the impact of contango and backwardation, see “Item 1A. Risk Factors” in this annual report on Form 10-K.
Furthermore, each Trust Series also purchases Treasuries and holds cash and/or cash equivalents to meet its current or potential margin or collateral requirements with respect to its investments in Applicable Interests and to hold cash not required to be used as margin or collateral. There is not expected to be any meaningful correlation between the performance of a Trust Series’ investments in Treasuries, cash or cash equivalents and the changes in the prices of commodities or Applicable Interests. While the level of interest earned on or the market price of these investments may in some respect correlate to changes in the prices of commodities, this correlation is not anticipated as part of the Trust Series’ efforts to meet its objective.
| 6 |
A Trust Series’ total portfolio composition is disclosed on the applicable Trust Series’ website on each business day that the NYSE Arca is open for trading. For a list of each of USCI’s, CPER’s and USAG’s current holdings, please see www.unitedstatescommodityfunds.com. USMI’s current holdings will be available on the same site up until the cessation of trading at the close of the NYSE Arca on March 18, 2015. The website disclosure of portfolio holdings for each Trust Series is made daily and includes, as applicable, the name and value of each Applicable Benchmark Component Futures Contract, the specific types and values of Other Related Investments and characteristics of such Other Related Investments, the name and value of each Treasury and cash equivalent, and the amount of cash held in each Trust Series, as applicable. Each Trust Series’ website is publicly accessible at no charge. Each Trust Series’ assets used for margin and collateral are held in segregated accounts pursuant to the Commodity Exchange Act (the “CEA”) and CFTC regulations.
The shares issued by a Trust Series may only be purchased by Authorized Participants and only in blocks of 50,000 shares called Creation Baskets through ALPS Distributors, Inc., as the marketing agent (the “Marketing Agent”). The amount of the purchase payment for a Creation Basket is equal to the aggregate NAV of the shares in the Creation Basket. Similarly, only Authorized Participants may redeem shares and only in blocks of 50,000 shares called Redemption Baskets. The amount of the redemption proceeds for a Redemption Basket is equal to the aggregate NAV of shares in the Redemption Basket. The purchase price for Creation Baskets and the redemption price for Redemption Baskets are the actual per share NAV calculated at the end of the business day when a request for a purchase or redemption is received by the applicable Trust Series. The NYSE Arca publishes an approximate per share NAV intra-day based on the prior day’s per share NAV and the current price of the Applicable Benchmark Component Futures Contracts, but the price of Creation Baskets and Redemption Baskets is determined based on the actual per share NAV calculated at the end of each trading day.
While each Trust Series only issues shares in Creation Baskets, shares are listed on the NYSE Arca and investors may purchase and sell shares at market prices like any security.
What is the Investment Strategy for each Trust Series?
In managing a Trust Series’ assets, USCF does not use a technical trading system that automatically issues buy and sell orders, other than to address monthly changes in the Applicable Benchmark Component Futures Contracts, on a percentage basis. Instead, each time one or more baskets are purchased or redeemed, USCF will purchase or sell Applicable Interests with an aggregate market value that approximates the amount of Treasuries and/or cash received or paid upon the purchase or redemption of the basket(s).
Each Trust Series endeavors to place trades in Applicable Interests and otherwise manage its investments so that “A” will be within plus/minus ten percent (10%) of “B”, where:
| • | A is the average daily percentage change in such Trust Series’ per share NAV for any period of 30 successive valuation days; i.e., any NYSE Arca trading day as of which the Trust Series calculates its per share NAV; and |
| • | B is the average daily percentage change in the price of the Applicable Index over the same period. |
USCF believes that market arbitrage opportunities will cause the daily changes in each Trust Series’ share price on the NYSE Arca on a percentage basis to closely track the daily changes in such Trust Series’ per share NAV on a percentage basis. USCF believes that the net effect of this expected relationship and the expected relationship described above between a Trust Series’ per share NAV and the Applicable Index will be that the daily changes in the price of a Trust Series’ shares on the NYSE Arca on a percentage basis will closely track the daily changes in the Applicable Index on a percentage basis, less such Trust Series’ expenses. While the Applicable Index is composed of Applicable Benchmark Component Futures Contracts and is therefore a measure of the prices of the applicable commodities comprising the Applicable Index for future delivery, there is nonetheless expected to be a reasonable degree of correlation between the Applicable Index and the cash or spot prices of the commodities underlying the Applicable Benchmark Component Futures Contracts.
| 7 |
Commodity Interests. The specific Commodity Interests purchased depend on various factors, including a judgment by USCF as to the appropriate diversification of USCI’s investments. While USCF has made significant investments in Benchmark Component Futures Contracts on the Futures Exchanges, for various reasons, including the ability to enter into the precise amount of exposure to the commodities market and position limits on Futures Contracts, it may also invest in economically equivalent Futures Contracts other than those that compose the Benchmark Component Futures Contracts and Other Commodity-Related Investments. To the extent that USCI invests in Other Related Investments, it would prioritize investments in contracts and instruments that are economically equivalent to the Benchmark Component Futures Contracts, including cleared swaps that satisfy such criteria, and then to a lesser extent, it would invest in other types of cleared swaps and other contracts, instruments and non-cleared swaps, such as swaps in the over-the-counter market (or more commonly referred to as the “OTC market”). If USCI is required by law or regulation, or by one of its regulators, including a Futures Exchange, to reduce its position in one or more Benchmark Component Futures Contracts to the applicable position limit or to a specified accountability level, a substantial portion of USCI’s assets could be invested in Other Commodity-Related Investments that are intended to replicate the return on the SDCI or particular Benchmark Component Futures Contracts. As USCI’s assets reach higher levels, USCI is more likely to exceed position limits, accountability levels or other regulatory limits and, as a result, it is more likely that it will invest in Other Commodity-Related Investments at such higher levels. In addition, market conditions that USCF currently anticipates could cause USCI to invest in Other Commodity-Related Investments include those allowing USCI to obtain greater liquidity or to execute transactions with more favorable pricing. See “Item 1. Business – Regulation” in this Annual Report on Form 10-K for a discussion of the potential impact of regulation on USCI’s ability to invest in OTC transactions and cleared swaps.
Copper Interests. The specific Copper Interests purchased will depend on various factors, including a judgment by USCF as to the appropriate diversification of CPER’s investments. USCF anticipates, particularly while CPER has lesser amounts of assets, that it will make significant investments in Benchmark Component Copper Futures Contracts on the COMEX. In addition, for various reasons, including the ability to enter into the precise amount of exposure to the copper market or due to market conditions regarding liquidity or pricing of differing futures contracts, it may invest in other exchange-traded futures contracts that are economically identical or substantially similar to, the Benchmark Component Copper Futures Contracts. USCF further anticipates that as CPER grows larger, due to position limits on futures contracts or other regulatory requirements limiting CPER’s holdings, and market conditions, it may also invest in Other Copper-Related Investments. To the extent that CPER invests in Other Copper-Related Investments, it would prioritize investments in contracts and instruments that are economically equivalent to the Benchmark Component Copper Futures Contracts. In considering the use of Other Copper-Related Investments, USCF anticipates that it would first make use of swaps that clear through derivatives clearing organizations that satisfy CPER’s criteria if such swaps are available with respect to the Benchmark Component Copper Futures Contracts or the copper futures contracts included in the SCI. Then, and to a lesser extent, it would invest in other types of contracts, instruments and swaps, including uncleared swaps in the OTC market. If CPER is required by law or regulation, or by one of its regulators, including the COMEX, to reduce its position in one or more Benchmark Component Copper Futures Contracts to the applicable position limit or to a specified accountability level or if market conditions dictate it would be more appropriate to invest in Other Copper-Related Investments, a substantial portion of CPER’s assets could be invested in accordance with such priority in Other Copper-Related Investments that are intended to replicate the return on the SCI or particular Benchmark Component Copper Futures Contracts. As CPER’s assets reach higher levels, CPER is more likely to exceed position limits, accountability levels or other regulatory limits and, as a result, it is more likely that it will invest in accordance with such priority in Other Copper-Related Investments at such higher levels. In addition, market conditions that USCF currently anticipates could cause CPER to invest in Other Copper-Related Investments include those allowing CPER to obtain greater liquidity or to execute transactions with more favorable pricing. See “Item 1. Business – Regulation” in this Annual Report on Form 10-K for a discussion of the potential impact of regulation on CPER’s ability to invest in OTC transactions and cleared swaps.
| 8 |
Agriculture Interests. The specific Agriculture Interests purchased will depend on various factors, including a judgment by USCF as to the appropriate diversification of USAG’s investments. USCF anticipates, particularly while USAG has lesser amounts of assets, that it will make significant investments in Benchmark Component Agriculture Futures Contracts on ICE Futures US, ICE Futures Canada, CBOT, KCBT and the CME. In addition, for various reasons, including the ability to enter into the precise amount of exposure to the agricultural commodities market or due to market conditions regarding liquidity or pricing of differing futures contracts, it may invest in other exchange-traded futures contracts that are economically identical or substantially similar to, the Benchmark Component Agriculture Futures Contracts. USCF further anticipates that as USAG grows larger, due to position limits on futures contracts or other regulatory requirements limiting USAG’s holdings, and market conditions, it may also invest in Other Agriculture-Related Investments. To the extent that USAG invests in Other Agriculture-Related Investments, it would prioritize investments in contracts and instruments that are economically equivalent to the Benchmark Component Agriculture Futures Contracts. In considering the use of Other Agriculture-Related Investments, USCF anticipates that it would first make use of swaps that clear through derivatives clearing organizations that satisfy USAG’s criteria if such swaps are available with respect to the Benchmark Component Agriculture Futures Contracts or the agricultural commodity futures contracts included in the SDAI. Then, and to a lesser extent, it would invest in other types of contracts, instruments and swaps, including uncleared swaps in the OTC market. If USAG is required by law or regulation, or by one of its regulators, including ICE Futures US, ICE Futures Canada, CBOT, KCBT or the CME, to reduce its position in one or more Benchmark Component Agriculture Futures Contracts to the applicable position limit or to a specified accountability level or if market conditions dictate it would be more appropriate to invest in Other Agriculture-Related Investments, a substantial portion of the USAG’s assets could be invested in accordance with such priority in Other Agriculture-Related Investments that are intended to replicate the return on the SDAI or particular Benchmark Component Agriculture Futures Contracts. As the USAG’s assets reach higher levels, USAG is more likely to exceed position limits, accountability levels or other regulatory limits and, as a result, it is more likely that it will invest in accordance with such priority in Other Agriculture-Related Investments at such higher levels. In addition, market conditions that USCF currently anticipates could cause USAG to invest in Other Agriculture-Related Investments include those allowing USAG to obtain greater liquidity or to execute transactions with more favorable pricing. See “Item 1. Regulation” in this Annual Report on Form 10-K for a discussion of the potential impact of regulation on USAG’s ability to invest in OTC transactions and cleared swaps.
Metals Interests. USMI has not purchased any Metals Interests since its inception of trading and does not anticipate holding any Metals Interests from the date of this annual report on Form 10-K, to USMI’s cessation of trading on the close of trading on the NYSE Arca on March 18, 2015.
USCF may not be able to fully invest a Trust Series’ assets in Applicable Benchmark Component Futures Contracts having an aggregate notional amount exactly equal to that Trust Series’ NAV. For example, as standardized contracts, the Applicable Benchmark Component Futures Contracts included in an Applicable Index are for a specified amount of a particular commodity, and the applicable Trust Series’ NAV and the proceeds from the sale of a Creation Basket in a particular Trust Series is unlikely to be an exact multiple of the amounts of those contracts. As a result, in such circumstances, a Trust Series may be better able to achieve the exact amount of exposure to changes in price of the Applicable Benchmark Component Futures Contracts through the use of Other Related Investments, such as over-the-counter contracts that have better correlation with changes in price of the Applicable Benchmark Component Futures Contracts.
Each Trust Series anticipates that, to the extent it invests in Applicable Benchmark Component Futures Contracts other than the Applicable Benchmark Component Futures Contracts and Other Related Investments that are not economically equivalent to the Applicable Benchmark Component Futures Contracts, it will enter into various non-exchange-traded derivative contracts to hedge the short-term price movements of such Applicable Benchmark Component Futures Contracts and Other Related Investments against the current Applicable Benchmark Component Futures Contracts.
USCF does not anticipate letting its Applicable Benchmark Component Futures Contracts expire and taking delivery of any commodities. Instead, USCF closes existing positions, e.g., in response to ongoing changes in the Applicable Index or if it otherwise determines it would be appropriate to do so and reinvests the proceeds in new Applicable Interests. Positions may also be closed out to meet orders for Redemption Baskets, in which case the proceeds from closing the positions will not be reinvested.
The Trust Agreement contains no restrictions on the ability of USCF to change the investment objective of any Trust Series. Notwithstanding this, USCF has no intention of changing the investment objective of any Trust Series or the manner in which it intends to achieve its investment objective. Should USCF seek to change the investment objective of a Trust Series, such change would be reflected in an amended prospectus and would provide advance notice to investors.
| 9 |
What are Futures Contracts?
Futures contracts are agreements between two parties. One party agrees to buy a commodity such as natural gas or copper from the other party at a later date at a price and quantity agreed-upon when the contract is made. Generally, futures contracts traded on the NYMEX and the COMEX are priced by floor brokers and other exchange members both through an “open outcry” of offers to purchase or sell the contracts and through an electronic, screen-based system that determines the price by matching electronically offers to purchase and sell. Futures contracts may also be based on commodity indices, in that they call for a cash payment based on the change in the value of the specified index during a specified period. Additional risks of investing in futures contracts are included in “Item 1A. Risk Factors” in this annual report on Form 10-K.
Impact of Accountability Levels, Position Limits and Price Fluctuation Limits. Futures contracts include typical and significant characteristics. Most significantly, the CFTC and U.S. designated contract markets such as the NYMEX, COMEX, CME, and CBOT have established accountability levels and position limits on the maximum net long or net short futures contracts in commodity interests that any person or group of persons under common trading control (other than as a hedge, which is not applicable to the Trust Series’ investments) may hold, own or control. The net position is the difference between an individual or firm’s open long contracts and open short contracts in any one commodity. In addition, most U.S.-based futures exchanges limit the daily price fluctuation for futures contracts. Currently, the ICE Futures imposes position and accountability limits that are similar to those imposed by U.S.-based futures exchanges and also limits the maximum daily price fluctuation, while some other non-U.S. futures exchanges have not adopted such limits.
The accountability levels for the commodities comprising an Applicable Index and other futures contracts traded on U.S.-based futures exchanges are not a fixed ceiling, but rather a threshold above which such exchanges may exercise greater scrutiny and control over an investor’s positions. As of December 31, 2014, USCI held 657 Futures Contracts on the NYMEX, 2,553 Futures Contracts on the ICE Futures, 5,487 Futures Contracts on the CBOT, 2,861 Futures Contracts on the CME, 5,001 Futures Contracts on the LME and 430 Futures Contracts on the COMEX. CPER held 40 Futures Contracts on the COMEX. USAG held 41 Futures Contracts on the ICE Futures, 8 Futures Contracts on the CME, 2 Futures Contract on the KCBT and 31 Futures Contracts on the CBOT. USMI held 2 Futures Contracts on the NYMEX, 73 Futures Contracts on the LME and 12 Futures Contracts on the COMEX. For the year ended December 31, 2014, no Trust Series exceeded accountability levels imposed by the NYMEX, COMEX, CME, CBOT, KCBT or ICE Futures.
Position limits differ from accountability levels in that they represent fixed limits on the maximum number of futures contracts that any person may hold and cannot allow such limits to be exceeded without express CFTC authority to do so. In addition to accountability levels and position limits that may apply at any time, the Futures Exchanges may impose position limits on contracts held in the last few days of trading in the near month contract to expire. It is unlikely that a Trust Series will run up against such position limits. A Trust Series does not typically hold the near month contract in its Applicable Benchmark Component Futures Contracts. In addition, each Trust Series’ investment strategy is to close out its positions during each Rebalancing Period in advance of the period right before expiration and purchase new contracts. As such, none of the Trust Series anticipates that position limits that apply to the last few days prior to a contract’s expiration will impact it. For the year ended December 31, 2014, no Trust Series exceeded position limits imposed by the NYMEX, COMEX, CME, CBOT, KCBT or ICE Futures.
On November 5, 2013, the CFTC proposed a rulemaking that would establish specific limits on speculative positions in 28 physical commodity futures and option contracts as well as swaps that are economically equivalent to such contracts in the agriculture, energy and metals markets (the “Position Limit Rules”). On the same date, the CFTC proposed another rule addressing the circumstances under which market participants would be required to aggregate their positions with other persons under common ownership or control (the “Proposed Aggregation Requirements”). Specifically, the Position Limit Rules would, among other things: identify which contracts are subject to speculative position limits; set thresholds that restrict the number of speculative positions that a person may hold in a spot month, individual month and all months combined; create an exemption for positions that constitute bona fide hedging transactions; impose responsibilities on designated contract markets (“DCMs”) and swap execution facilities (“SEFs”) to establish position limits or, in some cases, position accountability rules; and apply to both futures and swaps across four relevant venues: over-the-counter, DCMs, SEFs as well as non-U.S. located platforms. Furthermore, until such time as the Position Limit Rules are adopted, the regulatory architecture in effect prior to the adoption of the Position Limit Rules will govern transactions in commodities and related derivatives (collectively, “Referenced Contracts). Under that system, the CFTC enforces federal limits on speculation in agricultural products (e.g., corn, wheat and soy), while futures exchanges enforce position limits and accountability levels for agricultural and certain energy products (e.g., oil and natural gas). As a result, the Trust Series may be limited with respect to the size of its investments in any commodities subject to these limits. Finally, subject to certain narrow exceptions, the Position Limit Rules require the aggregation, for purposes of the position limits, of all positions in the 28 Referenced Contracts held by a single entity and its affiliates, regardless of whether such position existed on U.S. futures exchanges, non-U.S. futures exchanges, in cleared swaps or in over-the-counter swaps. Under the CFTC’s existing position limits requirements and the Position Limit Rules, a market participant is generally required to aggregate all positions for which that participant controls the trading decisions with all positions for which that participant has a ten percent (10%) or greater ownership interest in an account or position, as well as the positions of two or more persons acting pursuant to an express or implied agreement or understanding. At this time, it is unclear how the Proposed Aggregation Requirements may affect the Trust Series, but it may be substantial and adverse. By way of example, the aggregation rules in combination with the Position Limit Rules may negatively impact the ability of the Trust Series to meet its investment objectives through limits that may inhibit USCF’s ability to sell additional Creation Baskets of each Trust Series. See “The Commodity Interest Markets – Regulation” in this annual report on Form 10-K for additional information.
| 10 |
Price Volatility. The price volatility of futures contracts generally has been historically greater than that for traditional securities such as stocks and bonds. Price volatility often is greater day-to-day as opposed to intra-day. Because each Trust Series invests a significant portion of its assets in futures contracts, the assets of each Trust Series, and therefore the price of each Trust Series’ shares, may be subject to greater volatility than traditional securities.
Marking-to-Market Futures Positions. Futures contracts are marked to market at the end of each trading day and the margin required with respect to such contracts is adjusted accordingly. This process of marking-to-market is designed to prevent losses from accumulating in any futures account. Therefore, if a Trust Series’ futures positions have declined in value, such Trust Series may be required to post variation margin to cover this decline. Alternatively, if a Trust Series’ futures positions have increased in value, this increase will be credited to such Trust Series’ account.
What is the SDCI?
The SDCI was developed based upon academic research by Yale University professors Gary B. Gorton and K. Geert Rouwenhorst, and Hitotsubashi University professor Fumio Hayashi. The SDCI is designed to reflect the performance of a fully margined or collateralized portfolio of 14 commodity futures contracts with equal weights, selected each month from a universe of 27 eligible commodity futures contracts. The SDCI is rules-based and rebalanced monthly based on observable price signals. In this context, the term “rules-based” is meant to indicate that the composition of the SDCI in any given month will be determined by quantitative formulas relating to the prices of the futures contracts that relate to the commodities that are eligible to be included in the SDCI. Such formulas are not subject to adjustment based on other factors. The overall return on the SDCI is generated by two components: (i) uncollateralized returns from the commodity futures contracts comprising the SDCI and (ii) a daily fixed income return reflecting the interest earned on a hypothetical 3-month U.S. Treasury Bill collateral portfolio, calculated using the weekly auction rate for the 3-Month U.S. Treasury Bills published by the U.S. Department of the Treasury. SHIM is the owner of the SDCI.
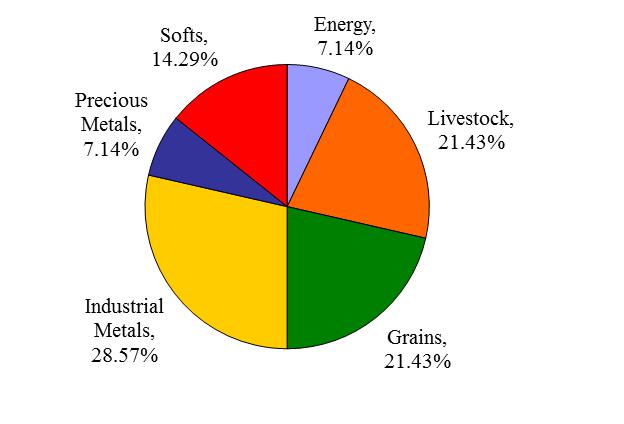
The SDCI is composed of physical non-financial commodity futures contracts with active and liquid markets traded upon futures exchanges in major industrialized countries. The futures contracts are denominated in U.S. dollars and weighted equally by notional amount. The SDCI currently reflects commodities in six commodity sectors: energy (e.g., crude oil, natural gas, heating oil, etc.), precious metals (e.g., gold, silver platinum), industrial metals (e.g., zinc, nickel, aluminum, copper, etc.), grains (e.g., wheat, corn, soybeans, etc.), softs (e.g., sugar, cotton, coffee, cocoa), and livestock (e.g., live cattle, lean hogs, feeder cattle).
Table 1 below lists the eligible commodities, the relevant futures exchange on which the futures contract is listed and quotation details. Table 2 lists the eligible futures contracts, their sector designation and maximum allowable tenor.
| 11 |
TABLE 1
| Commodity | Designated Contract | Exchange | Units | Quote | ||||
| Aluminum | High Grade Primary Aluminum | LME | 25 metric tons | USD/metric ton | ||||
| Cocoa | Cocoa | ICE-US | 10 metric tons | USD/metric ton | ||||
| Coffee | Coffee “C” | ICE-US | 37,500 lbs | U.S. cents/pound | ||||
| Copper | Copper | COMEX | 25,000 lbs | U.S. cents/pound | ||||
| Corn | Corn | CBOT | 5000 bushels | U.S. cents/bushel | ||||
| Cotton | Cotton | ICE-US | 50,000 lbs | U.S. cents/pound | ||||
| Crude Oil (WTI) | Light, Sweet Crude Oil | NYMEX | 1,000 barrels | USD/barrel | ||||
| Crude Oil (Brent) | Crude Oil | ICE-UK | 1,000 barrels | USD/barrel | ||||
| Gas Oil | Gas Oil | ICE-UK | 100 metric tons | USD/metric ton | ||||
| Gold | Gold | COMEX | 100 troy oz. | USD/troy oz. | ||||
| Heating Oil | Heating Oil | NYMEX | 42,000 gallons | U.S. cents/gallon | ||||
| Lead | Lead | LME | 25 metric tons | USD/metric ton | ||||
| Lean Hogs | Lean Hogs | CME | 40,000 lbs. | U.S. cents/pound | ||||
| Live Cattle | Live Cattle | CME | 40,000 lbs. | U.S. cents/pound | ||||
| Feeder Cattle | Feeder Cattle | CME | 50,000 lbs. | U.S. cents/pound | ||||
| Natural Gas | Henry Hub Natural Gas | NYMEX | 10,000 mmbtu | USD/mmbtu | ||||
| Nickel | Primary Nickel | LME | 6 metric tons | USD/metric ton | ||||
| Platinum | Platinum | NYMEX | 50 troy oz. | USD/troy oz. | ||||
| Silver | Silver | COMEX | 5,000 troy oz. | U.S. cents/troy oz. | ||||
| Soybeans | Soybeans | CBOT | 5,000 bushels | U.S. cents/bushel | ||||
| Soybean Meal | Soybean Meal | CBOT | 100 tons | USD/ton | ||||
| Soybean Oil | Soybean Oil | CBOT | 60,000 lbs. | U.S. cents/pound | ||||
| Sugar | World Sugar No. 11 | ICE-US | 112,000 lbs. | U.S. cents/pound | ||||
| Tin | Tin | LME | 5 metric tons | USD/metric ton | ||||
| Unleaded Gasoline | Reformulated Blendstock for Oxygen Blending | NYMEX | 42,000 gallons | U.S. cents/gallon | ||||
| Wheat | Wheat | CBOT | 5,000 bushels | U.S. cents/bushel | ||||
| Zinc | Special High Grade Zinc | LME | 25 metric tons | USD/metric ton |
TABLE 2
|
Commodity |
Commodity |
Sector | Allowed Contracts | Max. tenor |
||||||
| CO | Brent Crude | Energy | All 12 Calendar Months | 12 | ||||||
| CL | Crude Oil | Energy | All 12 Calendar Months | 12 | ||||||
| QS | Gas Oil | Energy | All 12 Calendar Months | 12 | ||||||
| HO | Heating Oil | Energy | All 12 Calendar Months | 12 | ||||||
| NG | Natural Gas | Energy | All 12 Calendar Months | 12 | ||||||
| XB | RBOB | Energy | All 12 Calendar Months | 12 | ||||||
| FC | Feeder Cattle | Livestock | Jan, Mar, Apr, May, Aug, Sep, Oct, Nov | 5 | ||||||
| LH | Lean Hogs | Livestock | Feb, Apr, Jun, Jul, Aug, Oct, Dec | 5 | ||||||
| LC | Live Cattle | Livestock | Feb, Apr, Jun, Aug, Oct, Dec | 5 | ||||||
| BO | Soybean Oil | Grains | Jan, Mar, May, Jul, Aug, Sep, Oct, Dec | 7 | ||||||
| C | Corn | Grains | Mar, May, Jul, Sep, Dec | 12 | ||||||
| S | Soybeans | Grains | Jan, Mar, May, Jul, Aug, Sep, Nov | 12 | ||||||
| SM | Soymeal | Grains | Jan, Mar, May, Jul, Aug, Sep, Oct, Dec | 7 | ||||||
| W | Wheat (Soft Red Winter) | Grains | Mar, May, Jul, Sep, Dec | 7 | ||||||
| LA | Aluminum | Industrial Metals | All 12 Calendar months | 12 | ||||||
| HG | Copper | Industrial Metals | All 12 Calendar Months | 12 | ||||||
| LL | Lead | Industrial Metals | All 12 Calendar Months | 7 | ||||||
| LN | Nickel | Industrial Metals | All 12 Calendar Months | 7 | ||||||
| LT | Tin | Industrial Metals | All 12 Calendar Months | 7 | ||||||
| LX | Zinc | Industrial Metals | All 12 Calendar Months | 7 | ||||||
| GC | Gold | Precious Metals | Feb, Apr, Jun, Aug, Oct, Dec | 12 | ||||||
| PL | Platinum | Precious Metals | Jan, Apr, Jul, Oct | 5 | ||||||
| SI | Silver | Precious Metals | Mar, May, Jul, Sep, Dec | 5 | ||||||
| CC | Cocoa | Softs | Mar, May, Jul, Sep, Dec | 7 | ||||||
| KC | Coffee | Softs | Mar, May, Jul, Sep, Dec | 7 | ||||||
| CT | Cotton | Softs | Mar, May, Jul, Dec | 7 | ||||||
| SB | Sugar | Softs | Mar, May, Jul, Oct | 7 | ||||||
| 12 |
Prior to the end of each month, SHIM determines the composition of the SDCI and provides such information to Bloomberg. Values of the SDCI are computed by Bloomberg and disseminated approximately every fifteen (15) seconds from 8:00 a.m. to 5:00 p.m., New York City time, which also publishes a daily SDCI value at approximately 5:30 p.m., New York City time, under the index ticker symbol “SDCITR:IND.” Only settlement and last-sale prices are used in the SDCI’s calculation, bids and offers are not recognized — including limit-bid and limit-offer price quotes. Where no last-sale price exists, typically in the more deferred contract months, the previous days’ settlement price is used. This means that the underlying SDCI may lag its theoretical value. This tendency to lag is evident at the end of the day when the SDCI value is based on the settlement prices of the Benchmark Component Futures Contracts, and explains why the underlying SDCI often closes at or near the high or low for the day.
Composition of the SDCI
The composition of the SDCI on any given day, as determined and published by SHIM, is determinative of the benchmark for USCI. However, it is not possible to anticipate all possible circumstances and events that may occur with respect to the SDCI and the methodology for its composition, weighting and calculation. Accordingly, a number of subjective judgments must be made in connection with the operation of the SDCI that cannot be adequately reflected in this description of the SDCI. All questions of interpretation with respect to the application of the provisions of the SDCI methodology, including any determinations that need to be made in the event of a market emergency or other extraordinary circumstances, will be resolved by SHIM.
Contract Expirations
Because the SDCI is comprised of actively traded contracts with scheduled expirations, it can be calculated only by reference to the prices of contracts for specified expiration, delivery or settlement periods, referred to as contract expirations. The contract expirations included in the SDCI for each commodity during a given year are designated by SHIM, provided that each contract must be an active contract. An active contract for this purpose is a liquid, actively-traded contract expiration, as defined or identified by the relevant trading facility or, if no such definition or identification is provided by the relevant trading facility, as defined by standard custom and practice in the industry.
If a Futures Exchange ceases trading in all contract expirations relating to a particular Futures Contract, SHIM may designate a replacement contract on the commodity. The replacement contract must satisfy the eligibility criteria for inclusion in the SDCI. To the extent practicable, the replacement is effected during the next monthly review of the composition of the SDCI. If that timing is not practicable, SHIM determines the date of the replacement based on a number of factors, including the differences between the existing Futures Contract and the replacement Futures Contract with respect to contractual specifications and contract expirations.
If a contract is eliminated and there is no replacement contract, the underlying commodity will necessarily be dropped from the SDCI. The designation of a replacement contract, or the elimination of a commodity from the SDCI because of the absence of a replacement contract, could affect the value of the SDCI, either positively or negatively, depending on the price of the contract that is eliminated and the prices of the remaining contracts. It is impossible, however, to predict the effect of these changes, if they occur, on the value of the SDCI.
| 13 |
Commodity Selection
Fourteen of the 27 eligible Futures Contracts are selected for inclusion in the SDCI for the next month, subject to the constraint that each of the six commodity sectors is represented by at least one commodity. The methodology used to select the 14 Futures Contracts is based solely on quantitative data using observable futures prices and is not subject to human bias.
Monthly commodity selection is a two-step process based upon examination of the relevant futures prices for each commodity:
1) The annualized percentage price difference between the closest-to-expiration Futures Contract and the next closest-to-expiration Futures Contract is calculated for each of the 27 eligible Futures Contracts on USCI’s Selection Date. The seven commodities with the highest percentage price difference are selected.
2) For the remaining 20 eligible commodities, the percentage price change of each commodity over the previous year is calculated, as measured by the change in the price of the closest-to-expiration Futures Contract on the Selection Date from the price of the closest-to-expiration Futures Contract a year prior to USCI’s Selection Date. The seven commodities with the highest percentage price change are selected.
When evaluating the data from the second step, all six commodity sectors must be represented. If the selection of the seven additional commodities with the highest price change fails to meet the overall diversification requirement that all six commodity sectors are represented in the SDCI, the commodity with the highest price change among the commodities of the omitted sector(s) would be substituted for the commodity with the lowest price change among the seven additional commodities.
The 14 commodities selected are included in the SDCI for the next month on an equally-weighted basis. Due to the dynamic monthly commodity selection, the sector weights will vary from approximately 7% to 43% over time, depending on the price observations each month. USCI’s Selection Date for the SDCI is the fifth business day prior to the first business day of the next calendar month.
| 14 |
The following graph shows the sector weights of the commodities selected for inclusion in the SDCI as of December 31, 2014.
USCI Sector Weightings as of December 31, 2014
Contract Selection
For each commodity selected for inclusion into the SDCI for a particular month, the SDCI selects a specific Futures Contract with a tenor (i.e., contract month) among the eligible tenors (the range of contract months) based upon the relative prices of the Futures Contracts within the eligible range of contract months. The previous notwithstanding, the contract expiration is not changed for such month if a contract remains in the SDCI, as long as the contract does not expire or enter its notice period in the subsequent month.
Portfolio Construction
The portfolio rebalancing takes place during the Rebalancing Period. At the end of each of the days in the Rebalancing Period, one fourth of the prior month portfolio positions are replaced by an equally-weighted position in the commodity contracts determined on USCI’s Selection Date. At the end of the Rebalancing Period, the SDCI takes an equal-weight position of approximately 7.14% in each of the selected commodity contracts.
SDCI Total Return Calculation
The value of the SDCI on any business day is equal to the product of (i) the value of the SDCI on the immediately preceding business day multiplied by (ii) one plus the sum of the day’s returns for another version of the SDCI known as the SummerHaven Dynamic Commodity Index Excess Return (“SDCI ER”) (explained below) and one business day’s interest from hypothetical Treasuries. The value of the SDCI is calculated and published by Bloomberg.
| 15 |
SDCI Base Level
The SDCI was set to 100 on January 2, 1991.
SDCI ER Calculation
The total return of the SDCI ER reflects the percentage change of the market values of the underlying commodity futures. During the Rebalancing Period, the SDCI changes its contract holdings during a four day period. The value of the SDCI ER at the end of a business day “t” is equal to the SDCI ER value on day “t-1” multiplied by the sum of the daily percentage price changes of each commodity future factoring in each respective commodity future’s notional holding on day “t-1”.
Rebalancing Period
During the Rebalancing Period, existing positions are replaced by new positions based on the signals used for contract selection as outlined above. At the end of the first day of the Rebalancing Period, the signals are observed and on the second day a new portfolio is constructed that is equally weighted in terms of notional positions in the newly selected contracts.
What is the SCI?
The SCI is a single-commodity index designed to be an investment benchmark for copper as an asset class. The SCI is composed of copper futures contracts on the COMEX exchange. The SCI attempts to maximize backwardation and minimize contango while utilizing contracts in liquid portions of the futures curve.
The SCI is rules-based and is rebalanced monthly based on observable price signals described below in the section “Contract Selection and Weighting.” In this context, the term “rules-based” is meant to indicate that the composition of the SCI in any given month will be determined by quantitative formulas relating to the prices of the futures contracts that are included in the SCI. Such formulas are not subject to adjustment based on other factors.
The overall return on the SCI is generated by two components: (i) uncollateralized returns from the Benchmark Component Copper Futures Contracts comprising the SCI, and (ii) a daily fixed income return reflecting the interest earned on hypothetical 3-month Treasuries, calculated using the weekly auction rate for 3-Month Treasuries published by the U.S. Department of the Treasury. SHIM is the owner of the SCI.
Table 1 below lists the Futures Exchange on which the Eligible Copper Futures Contracts are listed and quotation details. Table 2 lists the Eligible Copper Futures Contracts, their sector designation and maximum allowable tenor.
TABLE 1
| Commodity |
Designated Contract |
Exchange |
Units |
Quote | ||||||
| Copper | Copper | COMEX | 25,000 lbs | U.S. cents/pound |
TABLE 2
| Commodity Name |
Commodity |
Allowed Contracts |
Max. | |||
| Copper | HG | All 12 calendar months | 12 |
Prior to the end of each month, SHIM determines the composition of the SCI and provides such information to the NYSE Arca. Values of the SCI are computed by the NYSE Arca and disseminated approximately every fifteen (15) seconds from 8:00 a.m. to 5:00 p.m., New York City time, which also publishes a daily SCI value at approximately 5:30 p.m., New York City time, under the index ticker symbol “SCI.” Only settlement and last-sale prices are used in the SCI’s calculation, bids and offers are not recognized — including limit-bid and limit-offer price quotes. Where no last-sale price exists, typically in the more deferred contract months, the previous days’ settlement price is used. This means that the underlying SCI may lag its theoretical value. This tendency to lag is evident at the end of the day when the SCI value is based on the settlement prices of the Benchmark Component Copper Futures Contracts, and explains why the underlying SCI often closes at or near the high or low for the day.
| 16 |
Composition of the SCI
The composition of the SCI on any given day, as determined and published by SHIM, is determinative of the benchmark for CPER. Neither the index methodology for the SCI nor any set of procedures, however, are capable of anticipating all possible circumstances and events that may occur with respect to the SCI and the methodology for its composition, weighting and calculation. Accordingly, a number of subjective judgments must be made in connection with the operation of the SCI that cannot be adequately reflected in this description of the SCI. All questions of interpretation with respect to the application of the provisions of the index methodology for the SCI, including any determinations that need to be made in the event of a market emergency or other extraordinary circumstances, will be resolved by SHIM.
Contract Expirations
Because the SCI is comprised of actively traded contracts with scheduled expirations, it can be calculated only by reference to the prices of contracts for specified expiration, delivery or settlement periods, referred to as contract expirations. The contract expirations included in the SCI for each commodity during a given year are designated by SHIM, provided that each contract must be an active contract. An active contract for this purpose is a liquid, actively-traded contract expiration, as defined or identified by the relevant trading facility or, if no such definition or identification is provided by the relevant trading facility, as defined by standard custom and practice in the industry.
If a futures exchange, such as the COMEX, ceases trading in all contract expirations relating to an Eligible Copper Futures Contract, SHIM may designate a replacement contract. The replacement contract must satisfy the eligibility criteria for inclusion in the SCI. To the extent practicable, the replacement will be effected during the next monthly review of the composition of the SCI. If that timing is not practicable, SHIM will determine the date of the replacement based on a number of factors, including the differences between the existing Benchmark Component Copper Futures Contract and the replacement contract with respect to contractual specifications and contract expirations.
The designation of a replacement contract could affect the value of the SCI, either positively or negatively, depending on the price of the contract that is eliminated and the prices of the replacement contract. It is impossible, however, to predict the effect of these changes, if they occur, on the value of the SCI.
| 17 |
Contract Selection and Weighting
Weights for each of the Benchmark Component Copper Futures Contracts are determined for the next month. The methodology used to calculate the SCI weighting is based solely on quantitative data using observable futures prices and is not subject to human bias.
The monthly weighting selection is a process based upon examination of the relevant futures prices for copper:
1) On CPER’s Selection Date (“CPER’s Selection Date”):
| a) | the copper futures curve is assessed to be in either backwardation or contango (as discussed below); and |
| b) | the annualized percentage price difference between the Closest-to-Expiration Eligible Copper Futures Contract and each of the Next Four Eligible Copper Futures Contracts is calculated. For each month, the Closest-to-Expiration Eligible Copper Futures Contract and the Next Four Eligible Copper Futures Contracts are as follows: |
| Month | January | February | March | April | May | June | July | August | September | October | November | December | ||||||||||||
| Closest-to-Expiration
Eligible Futures Contract |
February | March | April | May | June | July | August | September | October | November | December | January | ||||||||||||
| Next
Four Eligible Futures Contracts |
April | May | June | July | August | September | October | November | December | January | February | March | ||||||||||||
| May | June | July | August | September | October | November | December | January | February | March | April | |||||||||||||
| June | July | August | September | October | November | December | January | February | March | April | May | |||||||||||||
| July | August | September | October | November | December | January | February | March | April | May | June | |||||||||||||
A futures curve in backwardation occurs when the price of the closest-to-expiration contract is greater than or equal to the price of the third closest-to-expiration contract. These contracts will have expirations that are approximately two months apart. A curve not in backwardation is defined as being in contango, which occurs when the price of the closest-to-expiration contract is less than the price of the third closest-to-expiration contract.
2a) Backwardation: If the copper futures curve is in backwardation on the Selection Date, the SCI takes positions in the two Eligible Copper Futures Contracts with the highest annualized percentage price difference, each weighted at 50%.
A hypothetical example is included below, with the two selected Eligible Copper Futures Contracts shaded below (the selected commodities are ranked 1 and 2):
| Copper Futures Contract | Expiration Date | Contract Price | ||
| Nearest-to-maturity | November-10 | 374.70 | ||
| Third nearest-to-maturity | January-11 | 365.20 | ||
| Eligible Copper Futures Contracts | Price | Annualized Percentage Price Difference | Ranking | |||||
| January-11 | 365.20 | 10.47 | % | 1 | ||||
| February-11 | 363.00 | 10.15 | % | 4 | ||||
| March-11 | 359.70 | 10.36 | % | 3 | ||||
| April-11 | 356.70 | 10.41 | % | 2 | ||||
2b) Contango: If the copper futures curve is in contango, then the SCI takes positions in three Eligible Copper Futures Contracts, as follows: first, the SCI takes positions in the two Eligible Copper Futures Contracts with the highest annualized percentage price difference, each weighted at 25%; then, the SCI also takes a position in the closest-to-expiration December Eligible Future Contract that has expiration more distant than the fourth of the Next Four Eligible Copper Futures Contracts for the applicable month, which position is weighted at 50%.
A hypothetical example is included below, with the next two selected Eligible Copper Futures Contracts shaded below (the selected commodities are ranked 1 – 2):
| Copper Futures Contract | Expiration Date | Contract Price | ||
| Nearest-to-maturity | November-10 | 374.00 | ||
| Third nearest-to-maturity | January-11 | 375.70 | ||
| Eligible Copper Futures Contracts | Price | Annualized Percentage Price Difference | Ranking | |||||
| January-11 | 375.70 | (1.97 | )% | 4 | ||||
| February-11 | 376.00 | (1.78 | )% | 3 | ||||
| March-11 | 376.30 | (1.59 | )% | 2 | ||||
| April-11 | 376.40 | (1.37 | )% | 1 | ||||
| 18 |
Due to the dynamic monthly weighting calculation, the individual weights will vary-over time, depending on the price observations each month. CPER’s Selection Date for the SCI is the last business day of the calendar month.
The following graph shows the weights of the Benchmark Component Copper Futures Contracts selected for inclusion in the SCI as of December 31, 2014.
SCI Contract Weights
as of December 31, 2014
Portfolio Construction
The portfolio rebalancing takes place during the Rebalancing Period. At the end of each of the days in the Rebalancing Period one fourth of the prior month portfolio positions are replaced by the new weights for the Benchmark Component Copper Futures Contracts determined on CPER’s Selection Date.
SCI Total Return Calculation
The value of the SCI on any business day is equal to the product of (i) the value of the SCI on the immediately preceding business day multiplied by (ii) one plus the sum of the day’s returns for another version of the SCI known as the SummerHaven Dynamic Copper Index Excess Return (“SCI ER”) (explained below) and one business day’s interest from the hypothetical Treasury Bill portfolio. The value of the SCI will be calculated and published by the NYSE Arca.
SCI Base Level
The SCI was set to 100 on January 2, 1991.
| 19 |
SCI ER Calculation
The total return of the SCI ER reflects the percentage change of the market values of the underlying commodity futures. During the Rebalancing Period, the SCI changes its contract holdings and weightings during a four day period. The value of the SCI ER at the end of a business day “t” is equal to the SCI ER value on day “t -1” multiplied by the sum of the daily percentage price changes of each commodity future factoring in each respective commodity future’s notional holding on day “t -1”.
Rebalancing Period
The SCI is rebalanced during the first 4 business days of each calendar month, when existing positions are placed by new positions and weightings based on the signals used for contract selection on the last business day of the prior calendar month as outlined above.
The SDAI is an agricultural sector index designed to broadly represent major agricultural commodities while overweighting the components that are assessed to be in a low inventory state and underweighting the components assessed to be in a high inventory state.
The SDAI consists of fourteen agricultural markets: soybeans, corn, soft red winter wheat, hard red winter wheat, soybean oil, soybean meal, canola, sugar, cocoa, coffee, cotton, live cattle, feeder cattle and lean hogs. Each agricultural commodity is assigned a base weight based on an assessment of market liquidity and the commodity’s overall economic importance. Each commodity is U.S. dollar based, with the exception of canola, which is quoted in Canadian dollars and converted to U.S. dollars for the purpose of the SDAI calculation.
Academic research by Professors Gorton, Rouwenhorst and Hayashi has shown that commodities in relatively low inventory states tend to have higher returns than commodities in relatively high inventory states. Furthermore, relative inventory comparisons can be estimated by the price-based signals momentum and basis. Momentum is the percentage price change in a commodity over the previous year. Basis is the annualized percentage difference between the nearest-to-maturity contract and the second nearest-to-maturity contract. Using these price-based signals, agricultural commodities determined to be in low inventory state will be weighted more heavily, and agricultural commodities in high inventory state will be weighted less heavily during any given month.
The SDAI is rules-based and rebalanced monthly based on observable price signals described above. In this context, the term “rules-based” is meant to indicate that the composition of the SDAI in any given month will be determined by quantitative formulas relating to the prices of the futures contracts that relate to the commodities that are included in the SDAI. Such formulas are not subject to adjustment based on other factors.
The overall return on the SDAI is generated by two components: (i) uncollateralized returns from the Benchmark Component Agriculture Futures Contracts comprising the SDAI and (ii) a daily fixed income return reflecting the interest earned on a hypothetical 3-month U.S. Treasury Bill collateral portfolio, calculated using the weekly auction rate for the 3-Month U.S. Treasury Bills published by the U.S Department of the Treasury. SHIM is the owner of the SDAI.
Table 1 below lists the eligible agricultural commodities, the relevant Futures Exchange on which each Benchmark Component Agriculture Futures Contract is listed and quotation details. Table 2 lists the Benchmark Component Agriculture Futures Contracts, their sector designation and maximum allowable tenor.
TABLE 1
| Commodity | Designated Contract | Exchange | Units | Quote | ||||
| Soybeans | Soybeans | CBOT | 5,000 bushels | U.S. cents/bushel | ||||
| Corn | Corn | CBOT | 5,000 bushels | U.S. cents/bushel | ||||
| Soft Red Winter Wheat | Soft Red Winter Wheat | CBOT | 5,000 bushels | U.S. cents/bushel | ||||
| Hard Red Winter Wheat | Hard Red Winter Wheat | KCBT | 5,000 bushels | U.S. cents/bushel | ||||
| Bean Oil | Bean Oil | CBOT | 60,000 lbs. | U.S. cents/pound | ||||
| Soybean Meal | Soybean Meal | CBOT | 100 tons | USD/ton | ||||
| Coffee | Coffee “C” | ICE-US | 37,500 lbs. | U.S. cents/pound | ||||
| Cocoa | Cocoa | ICE-US | 10 metric tons | USD/metric ton | ||||
| Sugar | World Sugar No. 11 | ICE-US | 112,000 lbs. | U.S. cents/pound | ||||
| Canola | Canola | ICE- CANADA | 20 tonnes | CAD/tonne | ||||
| Cotton | Cotton | ICE-US | 50,000 lbs. | U.S. cents/pound | ||||
| Feeder Cattle | Feeder Cattle | CME | 50,000 lbs. | U.S. cents/pound | ||||
| Live Cattle | Live Cattle | CME | 40,000 lbs. | U.S. cents/pound | ||||
| Lean Hogs | Lean Hogs | CME | 40,000 lbs. | U.S. cents/pound |
| 20 |
TABLE 2
| Commodity Name | Commodity Symbol | Allowed Contracts | Max. Tenor | |||
| Soybeans | S | Jan, Mar, May, July, Aug, Sep, Nov, | 12 | |||
| Corn | C | Mar, May, July, Sep, Dec | 12 | |||
| Soft Red Winter Wheat | W | Mar, May, July, Sep, Dec | 7 | |||
| Hard Red Winter Wheat | KW | Mar, May, July, Sep, Dec | 5 | |||
| Bean Oil | BO | Jan, Mar, May, July, Aug, Sep, Oct, Dec | 7 | |||
| Soybean Meal | SM | Jan, Mar, May, July, Aug, Sep, Oct, Dec | 7 | |||
| Coffee | KC | Mar, May, July, Sep, Dec | 7 | |||
| Cocoa | CC | Mar, May, July, Sep, Dec | 7 | |||
| Sugar | SB | Mar, May, July, Oct, | 7 | |||
| Canola | RS | Jan, Mar, May, July, Nov | 5 | |||
| Cotton | CT | Mar, May, July, Dec | 7 | |||
| Feeder Cattle | FC | Jan, Mar, April, May, Aug, Sep, Oct, Nov | 5 | |||
| Live Cattle | LC | Feb, April, June, Aug, Oct, Dec | 5 | |||
| Lean Hogs | LH | Feb, April, June, July, Aug, Oct, Dec | 5 |
Prior to the end of each month, SHIM determines the composition of the SDAI and provides such information to the NYSE Arca. Values of the SDAI are computed by the NYSE Arca and disseminated approximately every fifteen (15) seconds from 8:00 a.m. to 5:00 p.m., New York City time, which also publishes a daily SDAI value at approximately 5:30 p.m., New York City time, under the index ticker symbol “SDAITR”. Only settlement and last-sale prices are used in the SDAI’s calculation, bids and offers are not recognized; including limit-bid and limit-offer price quotes. Where no last-sale price exists, typically in the more deferred contract months, the previous days’ settlement price is used. This means that the underlying SDAI may lag its theoretical value. This tendency to lag is evident at the end of the day when the SDAI value is based on the settlement prices of the Benchmark Component Agriculture Futures Contracts, and explains why the underlying SDAI often closes at or near the high or low for the day.
Currency Conversion
Canola seed futures trade on the ICE Futures Canada and are denominated in Canadian dollars. Canola futures prices are divided by the USD/CAD foreign exchange spot price for purposes of index calculation and commodity weighting calculations. The USD/CAD price used for canola futures for the daily SDAI value is the 3:00 p.m. EST USD/CAD price quoted by Bloomberg under currency ticker “USDCAD F150”.
Composition of the SDAI
The composition of the SDAI on any given day, as determined and published by SHIM, is determinative of the benchmark for USAG. Neither the SDAI methodology nor any set of procedures, however, are capable of anticipating all possible circumstances and events that may occur with respect to the SDAI and the methodology for its composition, weighting and calculation. Accordingly, a number of subjective judgments must be made in connection with the operation of the SDAI that cannot be adequately reflected in this description of the SDAI. All questions of interpretation with respect to the application of the provisions of the SDAI methodology, including any determinations that need to be made in the event of a market emergency or other extraordinary circumstances, will be resolved by SHIM.
| 21 |
Contract Expirations
Because the SDAI is comprised of actively traded contracts with scheduled expirations, it can be calculated only by reference to the prices of contracts for specified expiration, delivery or settlement periods, referred to as contract expirations. The contract expirations included in the SDAI for each commodity during a given year are designated by SHIM, provided that each contract must be an active contract. An active contract for this purpose is a liquid, actively-traded contract expiration, as defined or identified by the relevant trading facility or, if no such definition or identification is provided by the relevant trading facility, as defined by standard custom and practice in the industry.
If a Futures Exchange ceases trading in all contract expirations relating to a particular Benchmark Component Agriculture Futures Contract, SHIM may designate a replacement contract on the particular agricultural commodity. The replacement contract must satisfy the eligibility criteria for inclusion in the SDAI. To the extent practicable, the replacement will be effected during the next monthly review of the composition of the SDAI. If that timing is not practicable, SHIM will determine the date of the replacement based on a number of factors, including the differences between the existing Benchmark Component Agriculture Futures Contract and the replacement contract with respect to contractual specifications and contract expirations.
If a Benchmark Component Agriculture Futures Contract is eliminated and there is no replacement contract, the underlying agricultural commodity will necessarily drop out of the SDAI. The designation of a replacement contract, or the elimination of an agricultural commodity from the SDAI because of the absence of a replacement contract, could affect the value of the SDAI, either positively or negatively, depending on the price of the contract that is eliminated and the prices of the remaining contracts. It is impossible, however, to predict the effect of these changes, if they occur, on the value of the SDAI.
Commodity Weighting
Each of the Benchmark Component Agriculture Futures Contracts will remain in the SDAI from month to month. Weights for each of the Benchmark Component Agriculture Futures Contracts in the SDAI are determined for the next month. The methodology used to calculate the SDAI weighting is based solely on quantitative data using observable futures prices and is not subject to human bias.
The monthly weighting selection is a three-step process based upon examination of the relevant futures prices for each agricultural commodity:
| 1) | The annualized percentage price difference between the closest-to-expiration Benchmark Component Agriculture Futures Contract and the next closest-to-expiration Benchmark Component Agriculture Futures Contract is calculated for each of the 14 eligible agricultural commodities on the fifth business day prior to the first business day of the next calendar month (the “USAG’s Selection Date”). The four agricultural commodities with the highest percentage price difference are selected. |
| 2) | For the remaining 10 eligible agricultural commodities, the percentage price change of each agricultural commodity over the previous year is calculated, as measured by the change in the price of the closest-to- expiration Benchmark Component Agriculture Futures Contract on the Selection Date from the price of the closest-to-expiration Benchmark Component Agriculture Futures Contract a year prior to the Selection Date. The three agricultural commodities with the highest percentage price change are selected. |
| 3) | For the seven commodities selected through basis (step 1) and momentum (step 2), each commodity weight is increased by 2% above its base weighting for the following month. For the remaining seven commodities not selected, each commodity weight is decreased by 2% below its base weighting for the following month. |
Due to the dynamic monthly agricultural commodity weighting calculation, the individual agricultural commodity weights will vary over time, depending on the price observations each month. USAG’s Selection Date for the SDAI is the fifth business day prior to the first business day of the next calendar month.
| 22 |
SDAI Commodity Weights
As of December 31, 2014
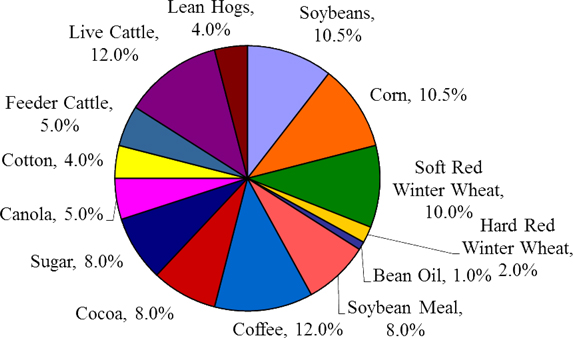
Contract Selection
For each agricultural commodity in the SDAI, the index selects a specific Benchmark Component Agriculture Futures Contract with a tenor (i.e., contract month) among the eligible tenors (the range of contract months) based upon the relative prices of the Benchmark Component Agriculture Futures Contracts within the eligible range of contract months. The previous notwithstanding, the contract expiration is not changed for that month if a Benchmark Component Agriculture Futures Contract remains in the SDAI, as long as the contract does not expire or enter its notice period in the subsequent month.
Portfolio Construction
The portfolio rebalancing takes place during the Rebalancing Period. At the end of each of the days in the last four business days of each month (the “Rebalancing Period”) one fourth of the prior month portfolio positions are replaced by the new commodity weights for the commodity contracts determined on USAG’s Selection Date.
Currency Conversion
Canola futures are denominated and quoted in Canadian dollars.
SDAI Total Return Calculation
The value of the SDAI on any business day is equal to the product of (i) the value of the SDAI on the immediately preceding business day multiplied by (ii) one plus the sum of the day’s returns for another version of the SDAI known as the SummerHaven Dynamic Agriculture Index Excess Return (“SDAI ER”) (explained below) and one business day’s interest from the hypothetical Treasury Bill portfolio. The value of the Agriculture will be calculated and published by the NYSE Arca.
| 23 |
SDAI Base Level
The SDAI was set to 100 on January 2, 1991.
SDAI ER Calculation
The total return of the SDAI ER reflects the percentage change of the market values of the underlying Benchmark Component Agriculture Futures Contracts. During the Rebalancing Period, the SDAI changes its contract holdings and weightings during a four day period. The value of the SDAI ER at the end of a business day “t” is equal to the SDAI ER value on day “t -1” multiplied by the sum of the daily percentage price changes of each commodity future factoring in each respective commodity future’s notional holding on day “t -1”.
Rebalancing Period
During the Rebalancing Period, existing positions are replaced by new positions based on the signals used for contract selection as outlined above. At the end of the first day of the Rebalancing Period, the signals are observed and on the second day a new portfolio is constructed that is equally weighted in terms of notional positions in the newly selected contracts.
What is the SDMI?
The SDMI is a metal sector index designed to broadly represent industrial and precious metals while overweighting the components that are assessed to be in a low inventory state and underweighting the components assessed to be in a high inventory state.
The SDMI consists of ten metals – six base metals and four precious metals. The base metals are aluminum, copper, zinc, nickel, tin and lead. The precious metals are gold, silver, platinum and palladium. Each metal is assigned a base weight based on an assessment of market liquidity and the metal’s overall economic importance.
Academic research by Professors Gorton, Rouwenhorst and Hayashi has shown that commodities in relatively low inventory states tend to have higher returns than commodities in relatively high inventory states. Furthermore, relative inventory comparisons can be estimated by the price-based signals momentum and basis.
Momentum is the percentage price change in a commodity over the previous year. Basis is the annualized percentage difference between the nearest-to-maturity contract and the second nearest-to-maturity contract. Using these price-based signals, metals determined to be in low inventory state will be weighted more heavily, and metals in high inventory state will be weighted less heavily during any given month.
The SDMI is rules-based and is rebalanced monthly based on observable price signals described above. In this context, the term “rules-based” is meant to indicate that the composition of the SDMI in any given month will be determined by quantitative formulas relating to the prices of the futures contracts that relate to the commodities that are included in the SDMI. Such formulas are not subject to adjustment based on other factors.
The overall return on the SDMI is generated by two components: (i) uncollateralized returns from the Benchmark Component Metals Futures Contracts comprising the SDMI, and (ii) a daily fixed income return reflecting the interest earned on a hypothetical 3-month U.S. Treasury Bill collateral portfolio, calculated using the weekly auction rate for the 3-Month U.S. Treasury Bills published by the U.S Department of the Treasury. SHIM is the owner of the SDMI.
| 24 |
Table 1 below lists the eligible metals, the relevant Futures Exchange on which each Benchmark Component Metals Futures Contract is listed and quotation details. Table 2 lists the Benchmark Component Metals Futures Contracts, their sector designation and maximum allowable tenor.
TABLE 1
|
Commodity |
Designated Contract |
Exchange |
Units |
Quote | ||||
| Aluminum | High Grade Primary Aluminum | LME | 25 metric tons | USD/metric ton | ||||
| Copper | Copper | COMEX | 25,000 lbs | U.S. cents/pound | ||||
| Lead | Lead | LME | 25 metric tons | USD/metric ton | ||||
| Nickel | Primary Nickel | LME | 6 metric tons | USD/metric ton | ||||
| Tin | Tin | LME | 5 metric tons | USD/metric ton | ||||
| Zinc | Special High Grade Zinc | LME | 25 metric tons | USD/metric ton | ||||
| Gold | Gold | COMEX | 100 troy oz. | USD/troy oz. | ||||
| Silver | Silver | COMEX | 5,000 troy oz. | U.S. cents/troy oz. | ||||
| Platinum | Platinum | NYMEX | 50 troy oz. | USD/troy oz. | ||||
| Palladium | Palladium | NYMEX | 100 troy oz. | USD/troy oz. |
TABLE 2
| Commodity Name |
Commodity |
Allowed Contracts |
Max. |
|||||
| Aluminum | LA | All 12 calendar months | 12 | |||||
| Copper | HG | All 12 calendar months | 12 | |||||
| Lead | LL | All 12 calendar months | 7 | |||||
| Nickel | LN | All 12 calendar months | 7 | |||||
| Tin | LT | All 12 calendar months | 7 | |||||
| Zinc | LX | All 12 calendar months | 7 | |||||
| Gold | GC | Feb, April, June, Aug, Oct, Dec | 12 | |||||
| Silver | SI | March, May, July, Sep, Dec | 5 | |||||
| Platinum | PL | Jan, April, July, Oct | 5 | |||||
| Palladium | PA | March, June, Sept, Dec | ||||||
Prior to the end of each month, SHIM determines the composition of the SDMI and provides such information to the NYSE Arca. Values of the SDMI are computed by the NYSE Arca and disseminated approximately every fifteen (15) seconds from 8:00 a.m. to 5:00 p.m., New York City time, which also publishes a daily SDMI value at approximately 5:30 p.m., New York City time, under the index ticker symbol “SDMITR.” Only settlement and last-sale prices are used in the SDMI’s calculation, bids and offers are not recognized; including limit-bid and limit-offer price quotes. Where no last-sale price exists, typically in the more deferred contract months, the previous days’ settlement price is used. This means that the underlying SDMI may lag its theoretical value. This tendency to lag is evident at the end of the day when the SDMI value is based on the settlement prices of the Benchmark Component Metals Futures Contracts, and explains why the underlying SDMI often closes at or near the high or low for the day.
Composition of the SDMI
The composition of the SDMI on any given day, as determined and published by SHIM, is determinative of the benchmark for USMI. Neither the SDMI methodology nor any set of procedures, however, are capable of anticipating all possible circumstances and events that may occur with respect to the SDMI and the methodology for its composition, weighting and calculation. Accordingly, a number of subjective judgments must be made in connection with the operation of the SDMI that cannot be adequately reflected in this description of the SDMI. All questions of interpretation with respect to the application of the provisions of the SDMI methodology, including any determinations that need to be made in the event of a market emergency or other extraordinary circumstances, will be resolved by SHIM.
Contract Expirations
Because the SDMI is comprised of actively traded contracts with scheduled expirations, it can be calculated only by reference to the prices of contracts for specified expiration, delivery or settlement periods, referred to as contract expirations. The contract expirations included in the SDMI for each commodity during a given year are designated by SHIM, provided that each contract must be an active contract. An active contract for this purpose is a liquid, actively-traded contract expiration, as defined or identified by the relevant trading facility or, if no such definition or identification is provided by the relevant trading facility, as defined by standard custom and practice in the industry.
| 25 |
If a Futures Exchange ceases trading in all contract expirations relating to a particular Benchmark Component Metals Futures Contract, SHIM may designate a replacement contract on the particular metal. The replacement contract must satisfy the eligibility criteria for inclusion in the SDMI. To the extent practicable, the replacement will be effected during the next monthly review of the composition of the SDMI. If that timing is not practicable, SHIM will determine the date of the replacement based on a number of factors, including the differences between the existing Benchmark Component Metals Futures Contract and the replacement contract with respect to contractual specifications and contract expirations.
If a Benchmark Component Metals Futures Contract is eliminated and there is no replacement contract, the underlying metal will necessarily drop out of the SDMI. The designation of a replacement contract, or the elimination of a metal from the SDMI because of the absence of a replacement contract, could affect the value of the SDMI, either positively or negatively, depending on the price of the contract that is eliminated and the prices of the remaining contracts. It is impossible, however, to predict the effect of these changes, if they occur, on the value of the SDMI.
Commodity Weighting
Each of the Benchmark Component Metals Futures Contracts will remain in the SDMI from month to month. Weights for each of the Benchmark Component Metals Futures Contracts are determined for the next month. The methodology used to calculate the SDMI weighting is based solely on quantitative data using observable futures prices and is not subject to human bias.
The monthly weighting selection is a three-step process based upon examination of the relevant futures prices for each metal:
| 1) | The annualized percentage price difference between the closest-to-expiration Benchmark Component Metals Futures Contract and the next closest-to-expiration Benchmark Component Metals Futures Contract is calculated for each of the 10 eligible metals on USMI’s Selection Date (“USMI’s Selection Date”). The three metals with the highest percentage price difference are selected. |
| 2) | For the remaining seven eligible metals, the percentage price change of each metal over the previous year is calculated, as measured by the change in the price of the closest-to-expiration Benchmark Component Metals Futures Contract on the Selection Date from the price of the closest-to-expiration Benchmark Component Metals Futures Contract a year prior to USMI’s Selection Date. The two metals with the highest percentage price change are selected. |
| 3) | For the five metals selected through basis (step 1) and momentum (step 2), each metal’s weight is increased by 3% above its base weighting for the following month. For the remaining five metals not selected, each metal’s weight is decreased by 3% below its base weighting for the following month. |
Due to the dynamic monthly metal weighting calculation, the individual metal weights will vary over time, depending on the price observations each month. USMI’s Selection Date for the SDMI is the fifth business day prior to the first business day of the next calendar month.
| 26 |
The following graph shows the metal weights of the metals selected for inclusion in the SDMI as of December 31, 2014.
SDMI Commodity Weightings
As of December 31, 2014
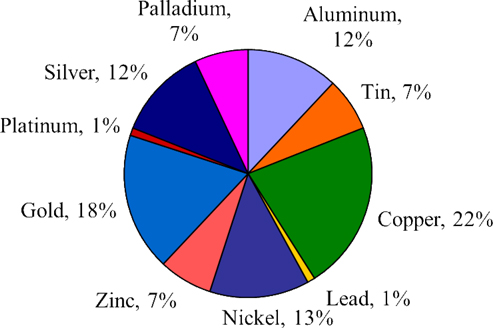
Contract Selection
For each metal in the SDMI, the index selects a specific Benchmark Component Metals Futures Contract with a tenor (i.e., contract month) among the eligible tenors (the range of contract months) based upon the relative prices of the Benchmark Component Metals Futures Contract within the eligible range of contract months. The previous notwithstanding, the contract expiration is not changed for that month if a Benchmark Component Metals Futures Contract remains in the SDMI, as long as the contract does not enter expire or enter its notice period in the subsequent month.
Portfolio Construction
The portfolio rebalancing takes place during the Rebalancing Period. At the end of each of the days in the Rebalancing Period one fourth of the prior month portfolio positions are replaced by the new metals weights for the Benchmark Component Metals Futures Contract determined on USMI’s Selection Date.
SDMI Total Return Calculation
The value of the SDMI on any business day is equal to the product of (i) the value of the SDMI on the immediately preceding business day multiplied by (ii) one plus the sum of the day’s returns for another version of the SDMI known as the SummerHaven Dynamic Metals Index Excess Return (“SDMI ER”) (explained below) and one business day’s interest from the hypothetical Treasury Bill portfolio. The value of the SDMI will be calculated and published by the NYSE Arca.
| 27 |
SDMI Base Level
The SDMI was set to 100 on January 2, 1991.
SDMI ER Calculation
The total return of the SDMI ER reflects the percentage excess change of the market values of the underlying Benchmark Component Metals Futures Contracts. During the Rebalancing Period, the SDMI changes its contract holdings and weightings during a four day period. The value of the SDMI ER at the end of a business day “t” is equal to the SDMI ER value on day “t-1” multiplied by the sum of the daily percentage price changes of each commodity future factoring in each respective commodity future’s notional holding on day “t-1”.
Rebalancing Period
During the Rebalancing Period, existing positions are replaced by new positions based on the signals used for contract selection as outlined above. At the end of the first day of the Rebalancing Period, the signals are observed and on the second day a new portfolio is constructed that is equally weighted in terms of notional positions in the newly selected contracts.
2015 Holiday Schedule for All Applicable Indices
None of the Applicable Indices will be computed on the following weekdays in 2015:
| January | 1 | |
| January | 19 | |
| February | 16 | |
| April | 3 | |
| May | 25 | |
| July | 4 | |
| September | 7 | |
| November | 26 | |
| December | 25 |
The holiday schedule is subject to change. None of the Trust Series will accept orders for Creation Baskets or Redemption Baskets on these days. USMI will cease trading at the close of trading of the NYSE Arca on March 18, 2015.
Treasuries, Cash and Cash Equivalents
Each Trust Series seeks to have the aggregate “notional” amount of the Applicable Interests it holds approximate at all times its aggregate NAV. At any given time, however, most of the Trust Series holdings are in short-term Treasuries, cash and/or cash equivalents that support such Trust Series’ positions in Applicable Interests. For example, the purchase of an Applicable Benchmark Component Futures Contract with a stated or notional amount of $10 million would not require a Trust Series to pay $10 million upon entering into the contract; rather, only a margin deposit, generally of 5% to 30% of the notional amount, would be required. To secure its obligations under Applicable Benchmark Component Futures Contracts, a Trust Series would deposit the required margin with the FCM and would separately hold its remaining assets through its Custodian in Treasuries, cash and/or cash equivalents. Such remaining assets may be used to meet future margin payments that a Trust Series is required to make on its Applicable Benchmark Component Futures Contracts. Other Related Investments typically also involve collateral requirements that represent a small fraction of their notional amounts, so most of a Trust Series’ assets dedicated to Other Related Investments will also be held in Treasuries, cash and cash equivalents.
Each of the Trust Series earns income from the Treasuries and/or cash equivalents that it purchases and on the cash it holds through the Custodian. USCF anticipates that the earned income will increase each Trust Series’ NAV. Each Trust Series applies the earned income to the acquisition of additional investments or uses it to pay its expenses. If a Trust Series reinvests the earned income, it makes investments that are consistent with its investment objective.
| 28 |
What are the Trading Policies of the Trust Series?
Liquidity
Each Trust Series invests only in Applicable Benchmark Component Futures Contracts that, in the opinion of USCF, are traded in sufficient volume to permit the ready taking and liquidation of positions in these financial interests and in over-the-counter Applicable Interests that, in the opinion of USCF, may be readily liquidated with the original counterparty or through a third party assuming a Trust Series’ position.
Spot Commodities
While certain futures contracts can be physically settled, none of the Trust Series intends to take or make physical delivery. However, a Trust Series may from time to time trade in Other Related Investments based on the spot price of the applicable commodities comprising the Applicable Index.
Leverage
USCF endeavors to have the value of a Trust Series’ Treasuries, cash and cash equivalents, whether held by a Trust Series or posted as margin or other collateral, at all times approximate the aggregate market value of its obligations under its Applicable Interests and Other Related Investments. Commodity pools’ trading positions in Futures Contracts or Other Related Investments are typically required to be secured by the deposit of margin funds that represent only a small percentage of a futures contract’s (or other commodity interest’s) entire market value. While USCF does not intend to leverage the assets of any Trust Series, it is not prohibited from doing so under the Trust Agreement.
Borrowings
Borrowings are not used by any Trust Series unless it is required to borrow money in the event of physical delivery, if it trades in cash commodities, or for short-term needs created by unexpected redemptions. None of the Trust Series plans to establish credit lines.
Over-the-Counter Derivatives (Including Spreads and Straddles)
In addition to Futures Contracts and options on Futures Contracts, derivative contracts that are tied to various commodities are entered into outside of public exchanges. These “over-the-counter” contracts are entered into between two parties in private contracts. Unlike most of the exchange-traded futures contracts or exchange-traded options on futures contracts, each party to such a contract bears the credit risk of the other party, i.e., the risk that the other party may not be able to perform its obligations under its contract. To reduce the credit risk that arises in connection with such contracts, each Trust Series may enter into an agreement with each counterparty based on the Master Agreement published by the International Swaps and Derivatives Association, Inc. that provides for the netting of its overall exposure to its counterparty.
USCF assesses or reviews, as appropriate, the creditworthiness of each potential or existing counterparty to an over-the-counter contract pursuant to guidelines approved by USCF’s Board.
Each Trust Series may enter into certain transactions where an over-the-counter component is exchanged for a corresponding futures contract (“Exchange for Risk” or “EFR” transaction). These EFR transactions may expose a Trust Series to counterparty risk during the interim period between the execution of the over-the-counter component and the exchange for a corresponding futures contract. Generally, the counterparty risk from the EFR transaction will exist only on the day of execution.
Each Trust Series may employ spreads or straddles in its trading to mitigate the differences in its investment portfolio and its goal of tracking the price of the Applicable Benchmark Component Futures Contracts. Each Trust Series would use a spread when it chooses to take simultaneous long and short positions in futures written on the same underlying asset, but with different delivery months.
During the 12 month reporting period ended December 31, 2014, each Trust Series limited its derivatives activities to Futures Contracts and EFR transactions.
Pyramiding
None of the Trust Series has, and will not employ, the technique, commonly known as pyramiding, in which the speculator uses unrealized profits on existing positions as variation margin for the purchase or sale of additional positions in the same or another commodity interest.
| 29 |
Who are the Service Providers?
In its capacity as the Custodian for each Trust Series, BBH&Co. may hold each Trust Series’ Treasuries, cash and/or cash equivalents pursuant to a custodial agreement. BBH&Co. is also the registrar and transfer agent for the shares. In addition, in its capacity as Administrator for each Trust Series, BBH&Co. performs certain administrative and accounting services for each Trust Series and prepares certain SEC, NFA and CFTC reports on behalf of each Trust Series. USCF pays BBH&Co.’s fees for these services.
BBH&Co.’s principal business address is 50 Post Office Square, Boston, MA 02110-1548. BBH&Co., a private bank founded in 1818, is neither a publicly held company nor insured by the Federal Deposit Insurance Corporation. BBH&Co. is authorized to conduct a commercial banking business in accordance with the provisions of Article IV of the New York State Banking Law, New York Banking Law §§160–181, and is subject to regulation, supervision, and examination by the New York State Department of Financial Services. BBH&Co. is also licensed to conduct a commercial banking business by the Commonwealths of Massachusetts and Pennsylvania and is subject to supervision and examination by the banking supervisors of those states.
Each Trust Series also employs ALPS Distributors, Inc. as its marketing agent (the “Marketing Agent” or “ALPS Distributors”). USCF pays the Marketing Agent an annual fee. In no event may the aggregate compensation paid to the Marketing Agent and any affiliate of USCF for distribution-related services in connection with the offering of shares exceed ten percent (10%) of the gross proceeds of the offering.
ALPS Distributors’ principal business address is 1290 Broadway, Suite 1100, Denver, CO 80203. ALPS Distributors is a broker-dealer registered with the Financial Industry Regulatory Authority (“FINRA”) and a member of the Securities Investor Protection Corporation.
The Trust on behalf of each Trust Series entered into a brokerage agreement, dated March 1, 2010 for USCI and November 18, 2011 for each of CPER, USAG and USMI, as amended from time to time, with Newedge USA, LLC (“Newedge”). On July 7, 2014, the Trust on behalf of each Trust Series entered into a Futures and Cleared Swaps Agreement with Wells Fargo Securities, LLC (“WFS”). WFS and Newedge are collectively referred to as the “Futures Commissions Merchant” or “FCM”. After July 7, 2014, most, if not all, transactions were placed with WFS. As of December 31, 2014, only a small portion of USMI futures contracts were still help with Newedge. After the liquidation of USMI occurs on or before March 25, 2015, Newedge will not hold any futures contract on behalf of any Trust Series. The agreements require the FCM to provide services to each Trust Series in connection with the purchase and sale of Futures Contracts and Other Related Investments that may be purchased and sold by or through the FCM for each Trust Series’ account. In accordance with the agreement, the FCM charges each Trust Series commissions of approximately $7 to $15 per round-turn trade, including applicable exchange and NFA fees for Futures Contracts and options on Futures Contracts. Such fees include those incurred when purchasing Futures Contracts and options on Futures Contracts when each Trust Series issues shares as a result of a Creation Basket, as well as fees incurred when selling Futures Contacts and options on Futures Contracts when each Trust Series redeems shares as a result of a Redemption Basket. Such fees are also incurred when Futures Contracts and options on Futures Contracts are purchased or redeemed for the purpose of rebalancing the portfolio. Each Trust Series also incurs commissions to brokers for the purchase and sale of Futures Contracts, Other Commodity-Related Investments or short-term obligations of the United States of two years or less (“Treasuries”).
WFS is an indirect wholly owned subsidiary of Wells Fargo & Co. and has a principal place of business at 550 Tryon Street, 6th Floor, D1086-060, Charlotte, North Carolina 28202. From each Trust Series’ commencement of trading to July 3, 2014, Newedge USA, LLC (“Newedge USA”) was a futures clearing broker for each Trust Series. Effective July 7, 2014, WFS became the futures clearing broker for each Trust Series. Both WFS and Newedge USA are registered in the U.S. with the Financial Industry Regulatory Authority as a broker-dealer and with the CFTC as a FCM. WFS and Newedge USA are members of various U.S. futures and securities exchanges.
WFS is a large broker-dealer subject to many different complex legal and regulatory requirements. As a result, certain of WFS’s regulators may from time to time conduct investigations, initiate enforcement proceedings and/or enter into settlements with WFS with respect to issues raised in various investigations. WFS complies fully with its regulators in all investigations being conducted and in all settlements it reaches. In addition, WFS is and has been subject to a variety of civil legal claims in various jurisdictions, a variety of settlement agreements and a variety of orders, awards and judgments made against it by courts and tribunals, both in regard to such claims and investigations. WFS complies fully with all settlements it reaches and all orders, awards and judgments made against it.
| 30 |
Although Wells Fargo Securities, LLC, in its capacity as broker-dealer and/or FCM, has been subject to regulatory disciplinary matters involving fines or other sanctions, as of the date hereof neither Wells Fargo Securities, LLC nor any of its principals has been the subject of any material administrative, civil or criminal action, including any action that has been pending, on appeal, or concluded within the last five years, except as follows:
AUCTION RATE SECURITIES (LEGACY WACHOVIA) Beginning in August 2008, Wachovia Securities, LLC, n/k/a Wells Fargo Advisors LLC (“Wachovia Securities”) and Wachovia Capital Markets, LLC, n/k/a Wells Fargo Securities LLC (collectively with Wachovia Securities, the “Wachovia Securities Affiliates”) entered into settlements agreements with state regulatory agencies, including the Secretary of State for the State of Missouri (as the lead state in the North American Securities Administrators Association task force investigating the marketing and sale of auction rate securities), relating to investigations of sales practice and other issues related to the sales of auction rate securities (“ARS”). Wachovia Securities also announced a settlement in principle with the Securities and Exchange Commission (“SEC”) of its similar investigation. Without admitting or denying liability, the agreements required that the Wachovia Securities Affiliates purchase certain ARS sold to customers in accounts at the Wachovia Securities Affiliates, reimburse investors who sold ARS purchased at the Wachovia Securities Affiliates for less than par, provide liquidity loans to customers at no net interest until the ARS are repurchased, offer to participate in special arbitration procedures with customers who claim consequential damages from the lack of liquidity in ARS and refund refinancing fees to certain municipal issuers who issued ARS and later refinanced those securities through the Wachovia Securities Affiliates. Without admitting or denying liability, the Wachovia Securities Affiliates also agreed to pay a total fine of $50 million to the state regulatory agencies and agreed to the entry of consent orders and Wachovia Securities agreed to entry of an injunction by the SEC.
AUCTION RATE SECURITIES (LEGACY WELLS FARGO) Beginning in November 2009, three broker-dealer subsidiaries (the “Broker-Dealer Subsidiaries”), Wells Fargo Investments, LLC, Wells Fargo Securities, LLC (as successor to Wells Fargo Brokerage Services, LLC), and Wells Fargo Institutional Securities, LLC, of Wells Fargo & Company (“Wells Fargo”) entered into settlement agreements with state securities regulators regarding the Broker-Dealers Subsidiaries’ participation in the ARS market. Under the agreements, the Broker-Dealer Subsidiaries agreed to purchase ARSs from eligible investors that bought ARS through the Broker-Dealer Subsidiaries prior to February 13, 2008 and to cease and desist from certain activities. Without admitting or denying liability, Wells Fargo Investments, LLC, agreed to pay $1.9 million in fines and penalties and the Broker-Dealer Subsidiaries agreed to reimburse investigative expenses.
ABS CDO INVESTIGATION In April of 2011, Wells Fargo Securities, LLC (f/k/a Wachovia Capital Markets, LLC) entered into a settlement with the SEC in which the firm paid $11.2 million in disgorgement and penalties and agreed to cease and desist from violating Sections 17(a)(2) and (3) of the Securities Act, in order to resolve issues arising from an investigation into Wachovia Capital Markets, LLC’s ABS CDO underwriting, marketing and pricing practices.
ASSET-BACKED COMMERCIAL PAPER INVESTIGATION On August 14, 2012, the SEC entered a settled administrative order against Wells Fargo Brokerage Services LLC (n/k/a Wells Fargo Securities, LLC) and a former sales representative concerning alleged sales practice and suitability issues related to certain 2007 sales of three asset-backed commercial paper products to institutional and municipal purchasers. Without admitting or denying the allegations, the firm agreed to a censure, a cease-and-desist order, disgorgement of $65,000 plus prejudgment interest, and a civil penalty of $6.5 million.
NATIONAL CREDIT UNION ADMINISTRATION The National Credit Union Administration, as the successor to various federal credit unions, has asserted claims against Wachovia Capital Markets, WFS’s predecessor and Wachovia Mortgage Loan Trust (“WMLT”) (as the issuer of residential mortgage-backed securities (“RMBS”)) in three separate actions pending in federal courts in Kansas (the “Kansas Action”), California (the “California Action”), and New York (the “New York Action”) as follows: National Credit Union Administration Board v. Wachovia Mortgage Loan Trust; National Credit Union Administration Board as Liquidating Agent of Western Corporate Federal Credit Union v. RBS Securities, Inc. f/k/a RBS Greenwich Capital Markets, Inc., et al.; and National Credit Union Administration Board v. Wachovia Capital Markets, LLC n/k/a Wells Fargo Securities, LLC. The Kansas Action was filed in September of 2013, the California Action was filed in July of 2011 and the New York Action was filed in June of 2011. These actions seek to recover losses associated with the credit unions’ investment in RMBS underwritten or sold by WCM and/or issued by WMLT. In the California Action, a motion to dismiss was granted, and the NCUA has appealed. In the Kansas Actions, our appeal on statute of limitations grounds was unsuccessful. WFS filed a motion to dismiss, which was denied, and the case has proceeded to discovery. In the New York Action, WFS’s motion to dismiss was denied and discovery is underway. A petition for certiorari has been filed with the Supreme Court of the United States in a companion case with regard to the applicability of the statute of repose, and a ruling from the Supreme Court on this issue could have a significant impact on these cases. The amount of losses or potential liability is not known.
| 31 |
WFS will only act as a clearing broker for each Trust Series and as such will be paid commissions for executing and clearing trades on behalf of each Trust Series. Prior to July 7, 2014, Newedge USA acted only as clearing broker for each Trust Series and as such was paid commissions for executing and clearing trades on behalf of each Trust Series. Neither WFS nor Newedge USA will act in any supervisory capacity with respect to USCF or participate in the management of USCF or a Trust Series. Neither WFS nor Newedge has passed upon the adequacy or accuracy of this annual report on Form 10-K.
Neither WFS nor Newedge USA is affiliated with USCF or the Trust Series. Therefore, neither USCF nor the Trust Series believe that there are any conflicts of interest with WFS and Newedge USA or their trading principals arising from their acting as the Trust Series’ FCM.
Currently, USCF employs SummerHaven as a commodity trading advisor. SummerHaven provides advisory services to USCF with respect to the SDCI, the SCI and the SDAI and investment decisions for each of USCI, CPER and USAG. Its advisory services include, but are not limited to, general consultation regarding the calculation and maintenance of the SDCI, the SCI and the SDAI, anticipated changes to the SDCI, the SCI and the SDAI and the nature of the SDCI’s, the SCI’s and the SDAI’s current or anticipated component securities. For these services, USCF pays fees to SummerHaven as set forth in the table below.
SummerHaven’s principal business address is 1266 East Main Street, Soundview Plaza, Fourth Floor, Stamford, CT 06902. SummerHaven is a commodity trading advisor and commodity pool operator registered with the NFA.
USCF has also entered into a licensing agreement with SummerHaven. Under this licensing agreement, SummerHaven has sub-licensed to each of USCI, CPER, USAG and USMI the use of certain names and marks, including the SDCI with respect to USCI, the SCI with respect to CPER, the SDAI with respect to USAG and the SDMI with respect to USMI, which SummerHaven licensed from SHIM, the owner of the SDCI, the SCI, the SDAI and the SDMI. For this license, USCF pays a fee to SummerHaven as set forth in the table below.
SHIM’s principal business address is 1266 East Main Street, Soundview Plaza, Fourth Floor, Stamford, CT 06902.
| 32 |
Fees of USCI, CPER, USAG and USMI
Fees and Compensation Arrangements with USCF, Non-Affiliated Service Providers and the Trustee
| Service Provider | Compensation Paid by Each Trust Series and USCF | |
| United States Commodity Funds LLC, Sponsor | Each Trust Series pays USCF a management fee based on its average daily net assets and paid monthly at an annual rate of 0.80% for USCI and 0.65% for each of CPER, USAG and USMI.(1) | |
| BBH&Co., Custodian and Administrator | Minimum amount of $75,000 annually for its custody, fund accounting and fund administration services rendered to the Trust Series and the Related Public Funds, as well as a $20,000 annual fee for its transfer agency services. In addition, an asset-based charge of (a) 0.06% for the first $500 million of the Trust Series’ and the Related Public Funds’ combined net assets, (b) 0.0465% for the Trust Series’ and the Related Public Funds’ combined net assets greater than $500 million but less than $1 billion, and (c) 0.035% once the Trust Series’ and the Related Public Funds’ combined net assets exceed $1 billion.(2) | |
| ALPS Distributors, Marketing Agent | Each Trust Series pays 0.06% on assets up to $3 billion and 0.04% on assets in excess of $3 billion.(2) | |
| WFS, FCM and Clearing Broker | Each of Trust Series pays approximately $3.50 per buy or sell; charges may vary.(3) | |
| SummerHaven, Commodity Trading Advisor |
Advisory Fee:
On behalf of USCI, USCF pays a percentage of the average daily assets of USCI that is equal to the percentage fees paid to USCF by USCI minus 0.14%, with that result multiplied by 0.5, minus 0.06%.(2) On behalf of each of CPER, USAG and USMI,(3) USCF pays a percentage of the average daily assets that is equal to the percentage fees paid to USCF by each of CPER, USAG and USMI(3) minus 0.18%, with that result multiplied by 0.5, minus 0.06%.(2)
Sublicense Fee:
For each Trust Series, USCF paid $15,000 for the calendar year 2013, plus an annual fee of 0.06% of the average daily assets of each Trust Series.(2) | |
| Wilmington Trust Company, Trustee | On behalf of the Trust, USCF pays $3,000 annually.(2) | |
| (1) | USCI, CPER, USAG or USMI, as applicable, pays this compensation. Effective May 1, 2014 and continuing through December 31, 2015, USCF has contractually agreed to lower the management fee to 0.80% per annum of average daily total net assets for USCI, and 0.65% per annum of average daily total net assets for each of CPER, USAG and USMI. Prior to May 1, 2014, USCF voluntarily waived the management fee paid by each of CPER and USAG from 0.95% per annum of average daily total net assets to 0.65% and 0.80% per annum of average daily total net assets, respectively. Effective as of May 30, 2012 through April 30, 2014, USCF voluntarily waived the management fee paid by USMI from 0.95% per annum of average daily total net assets to 0.70% per annum of average daily total net assets. The reduced fee for USMI became operational as of June 19, 2012, when USMI first became listed on the NYSE Arca. |
| (2) | USCF pays this compensation. |
| (3) | USMI will cease trading at the close of trading of the NYSE Arca on March 18, 2015. All assets will be liquidated on or before March 25, 2015. |
Asset-based fees are calculated on a daily basis (accrued at 1/365 of the applicable percentage of total net assets on that day) and paid on a monthly basis. Total net assets are calculated by taking the current market value of each Trust Series’s total assets and subtracting any liabilities.
Expenses Paid or Accrued by USCI from Inception through December 31, 2014 in Dollar Terms:
| Expenses: | Amount in Dollar Terms | |||
| Amount Paid or Accrued to USCF(4): | $ | 18,727,302 | ||
| Amount Paid or Accrued in Portfolio Brokerage Commissions: | $ | 1,685,595 | ||
| Other Amounts Paid or Accrued(5)(6): | $ | 2,462,933 | ||
| Total Expenses Paid or Accrued: | $ | 22,875,830 | ||
| Expenses Waived(4)(6): | $ | (88,304 | ) | |
| Total Expenses Paid or Accrued Including Expenses Waived(4)(6): | $ | 22,787,526 | ||
| (4) | Effective May 1, 2014 and continuing through December 31, 2015, USCF has contractually agreed to lower the management fee to 0.80% (80 basis points) per annum of average daily total net assets for USCI. |
| (5) | Includes expenses relating to legal fees, auditing fees, printing expenses and tax reporting fees. |
| (6) | USCF had voluntarily agreed to pay certain expenses typically borne by USCI to the extent that such expenses exceeded 0.15% (15 basis points) of USCI’s NAV, on an annualized basis, through March 31, 2011. As of March 31, 2011, the expense waiver was no longer in effect for USCI. |
| 33 |
Expenses Paid or Accrued by USCI from Inception through December 31, 2014 as a Percentage of Average Daily Net Assets:
| Expenses: | Amount as a Percentage of Average Daily Net Assets |
|||
| Amount Paid or Accrued to USCF(7): | 0.91% annualized | |||
| Amount Paid or Accrued in Portfolio Brokerage Commissions: | 0.08% annualized | |||
| Other Amounts Paid or Accrued(8)(9): | 0.12% annualized | |||
| Total Expenses Paid or Accrued: | 1.11% annualized | |||
| Expenses Waived(7)(9): | 0.00% annualized | |||
| Total Expenses Paid or Accrued Including Expenses Waived(7)(9): | 1.11% annualized | |||
| (7) | Effective May 1, 2014 and continuing through December 31, 2015, USCF has contractually agreed to lower the management fee to 0.80% (80 basis points) per annum of average daily total net assets for USCI. |
| (8) | Includes expenses relating to legal fees, auditing fees, printing expenses and tax reporting fees. |
| (9) | USCF had voluntarily agreed to pay certain expenses typically borne by USCI to the extent that such expenses exceeded 0.15% (15 basis points) of USCI’s NAV, on an annualized basis, through March 31, 2011. As of March 31, 2011, the expense waiver was no longer in effect for USCI. |
Other Fees. USCI also pays the fees and expenses associated with its tax accounting and reporting requirements. These fees were approximately $690,000 for the fiscal year ended December 31, 2014. In addition, USCI is responsible for paying its portion of the directors’ and officers’ liability insurance for USCI, the other Trust Series and the Related Public Funds. In addition, as of July 8, 2011, USCI became responsible for paying the fees and expenses of the independent directors who also serve as audit committee members of USCI, the other Trust Series and the Related Public Funds. USCI shares the fees and expenses on a pro rata basis with the other Trust Series and each Related Public Fund, as described above, based on the relative assets of each fund computed on a daily basis. These fees and expenses for the year ended December 31, 2014 were $567,863 for the Trust Series and the Related Public Funds. USCI’s portion of such fees and expenses was $144,809.
Expenses Paid or Accrued by CPER from Inception through December 31, 2014 in Dollar Terms:
| Expenses: | Amount in Dollar Terms | |||
| Amount Paid or Accrued to USCF(10): | $ | 58,223 | ||
| Amount Paid or Accrued in Portfolio Brokerage Commissions: | $ | 3,945 | ||
| Other Amounts Paid or Accrued(11)(12): | $ | 265,853 | ||
| Total Expenses Paid or Accrued: | $ | 328,021 | ||
| Expenses Waived(10)(11): | $ | (253,595 | ) | |
| Total Expenses Paid or Accrued Including Expenses Waived(10)(11): | $ | 74,426 | ||
| (10) | Effective May 1, 2014 and continuing through December 31, 2015, USCF has contractually agreed to lower the management fee to 0.65% (65 basis points) per annum of average daily total net assets for CPER. From May 29, 2012 through April 30, 2014, USCF voluntarily waived the management fee paid by CPER from 0.95% (95 basis points) per annum of average daily total net assets to 0.65% per annum of average daily total net assets. |
| (11) | USCF has voluntarily agreed to pay certain expenses typically borne by CPER to the extent that such expenses exceeded 0.15% (15 basis points) of CPER’s NAV, on an annualized basis, through at least May 1, 2015. USCF has no obligation to continue such payments into subsequent periods. |
| (12) | Includes expenses relating to legal fees, auditing fees, printing expenses and tax reporting fees. |
Expenses Paid or Accrued by CPER from Inception through December 31, 2014 as a Percentage of Average Daily Net Assets:
| Expenses: | Amount as a Percentage of Average Daily Net Assets |
|||
| Amount Paid or Accrued to USCF(13): | 0.70% annualized | |||
| Amount Paid or Accrued in Portfolio Brokerage Commissions: | 0.05% annualized | |||
| Other Amounts Paid or Accrued(14)(15): | 3.20% annualized | |||
| Total Expenses Paid or Accrued: | 3.95% annualized | |||
| Expenses Waived(13)(15): | (3.05)% annualized | |||
| Total Expenses Paid or Accrued Including Expenses Waived(13)(15): | 0.90% annualized | |||
| 34 |
| (13) | Effective May 1, 2014 and continuing through December 31, 2015, USCF has contractually agreed to lower the management fee to 0.65% (65 basis points) per annum of average daily total net assets for CPER. From May 29, 2012 through April 30, 2014, USCF voluntarily waived the management fee paid by CPER from 0.95% (95 basis points) per annum of average daily total net assets to 0.65% per annum of average daily total net assets. |
| (14) | Includes expenses relating to legal fees, auditing fees, printing expenses and tax reporting fees. |
| (15) | USCF has voluntarily agreed to pay certain expenses typically borne by CPER to the extent that such expenses exceeded 0.15% (15 basis points) of CPER’s NAV, on an annualized basis, through at least May 1, 2015. USCF has no obligation to continue such payments into subsequent periods. |
Other Fees. CPER also pays the fees and expenses associated with its tax accounting and reporting requirements. These fees were approximately $46,000 for the period ended December 31, 2014. In addition, CPER is responsible for paying its portion of the directors’ and officers’ liability insurance for CPER, the other Trust Series and the Related Public Funds. In addition, as of July 8, 2011, CPER became responsible for paying the fees and expenses of the independent directors who also serve as audit committee members of CPER, the other Trust Series and the Related Public Funds. CPER shares the fees and expenses on a pro rata basis with the other Trust Series and with each Related Public Fund, as described above, based on the relative assets of each fund computed on a daily basis. These fees and expenses for the year ended December 31, 2014 were $567,863 for the Trust Series and the Related Public Funds. CPER’s portion of such fees and expenses was $658.
Expenses Paid or Accrued by USAG from Inception through December 31, 2014 in Dollar Terms:
| Expenses: | Amount in Dollar Terms | |||
| Amount Paid or Accrued to USCF(16): | $ | 53,699 | ||
| Amount Paid or Accrued in Portfolio Brokerage Commissions: | $ | 6,655 | ||
| Other Amounts Paid or Accrued(17)(18): | $ | 214,867 | ||
| Total Expenses Paid or Accrued: | $ | 275,221 | ||
| Expenses Waived(16)(18): | $ | (204,962 | ) | |
| Total Expenses Paid or Accrued Including Expenses Waived(16)(18): | $ | 70,259 | ||
| (16) | Effective May 1, 2014 and continuing through December 31, 2015, USCF has contractually agreed to lower the management fee to 0.65% (65 basis points) per annum of average daily total net assets for USAG. From May 29, 2012 through April 30, 2014, USCF voluntarily waived the management fee paid by USAG from 0.95% (95 basis points) per annum of average daily total net assets to 0.80% (80 basis points) per annum of average daily total net assets. |
| (17) | Includes expenses relating to legal fees, auditing fees, printing expenses and tax reporting fees. |
| (18) | USCF has voluntarily agreed to pay certain expenses typically borne by USAG to the extent that such expenses exceeded 0.15% (15 basis points) of USAG’s NAV, on an annualized basis, through at least May 1, 2014. USCF has no obligation to continue such payments into subsequent periods. |
Expenses Paid or Accrued by USAG from Inception through December 31, 2014 as a Percentage of Average Daily Net Assets:
| Expenses: | Amount as a Percentage of Average Daily Net Assets |
|||
| Amount Paid or Accrued to USCF(19): | 0.77% annualized | |||
| Amount Paid or Accrued in Portfolio Brokerage Commissions: | 0.10% annualized | |||
| Other Amounts Paid or Accrued(20)(21): | 3.09% annualized | |||
| Total Expenses Paid or Accrued: | 3.96% annualized | |||
| Expenses Waived(19)(21): | (2.95)% annualized | |||
| Total Expenses Paid or Accrued Including Expenses Waived(19)(21): | 1.01% annualized | |||
| (19) | Effective May 1, 2014 and continuing through December 31, 2015, USCF has contractually agreed to lower the management fee to 0.65% (65 basis points) per annum of average daily total net assets for USAG. From May 29, 2012 through April 30, 2014, USCF voluntarily waived the management fee paid by USAG from 0.95% (95 basis points) per annum of average daily total net assets to 0.80% (80 basis points) per annum of average daily total net assets. |
| (20) | Includes expenses relating to legal fees, auditing fees, printing expenses and tax reporting fees. |
| (21) | USCF has voluntarily agreed to pay certain expenses typically borne by USAG to the extent that such expenses exceeded 0.15% (15 basis points) of USAG’s NAV, on an annualized basis, through at least May 1, 2014. USCF has no obligation to continue such payments into subsequent periods. |
| 35 |
Other Fees. USAG also pays the fees and expenses associated with its tax accounting and reporting requirements. These fees were approximately $41,000 for the period ended December 31, 2014. In addition, USAG is responsible for paying its portion of the directors’ and officers’ liability insurance for USAG, the other Trust Series and the Related Public Funds. In addition, as of July 8, 2011, USAG became responsible for paying the fees and expenses of the independent directors who also serve as audit committee members of USAG, the other Trust Series and the Related Public Funds. USAG shares the fees and expenses on a pro rata basis with the other Trust Series and with each Related Public Fund, as described above, based on the relative assets of each fund computed on a daily basis. These fees and expenses for the year ended December 31, 2014 were $567,863 for the Trust Series and the Related Public Funds. USAG’s portion of such fees and expenses was $569.
Expenses Paid or Accrued by USMI from Inception through December 31, 2014 in Dollar Terms:
| Expenses: | Amount in Dollar Terms | |||
| Amount Paid or Accrued to USCF(22): | $ | 43,092 | ||
| Amount Paid or Accrued in Portfolio Brokerage Commissions: | $ | 2,411 | ||
| Other Amounts Paid or Accrued(23)(24): | $ | 196,111 | ||
| Total Expenses Paid or Accrued: | $ | 241,614 | ||
| Expenses Waived(22)(24): | $ | (186,466 | ) | |
| Total Expenses Paid or Accrued Including Expenses Waived(22)(24): | $ | 55,148 | ||
| (22) | Effective May 1, 2014 and continuing through December 31, 2015, USCF has contractually agreed to lower the management fee to 0.65% (65 basis points) per annum of average daily total net assets for USMI. From June 19, 2012, when USMI listed on the NYSE Arca, through April 30, 2014, USCF voluntarily waived the management fee paid by USMI from 0.95% (95 basis points) per annum of average daily total net assets to 0.70% (70 basis points) per annum of average daily total net assets. |
| (23) | Includes expenses relating to legal fees, auditing fees, printing expenses and tax reporting fees. |
| (24) | USCF has voluntarily agreed to pay certain expenses typically borne by USMI to the extent that such expenses exceeded 0.15% (15 basis points) of USMI’s NAV, on an annualized basis, through at least May 1, 2014. USCF has no obligation to continue such payments into subsequent periods. |
Expenses Paid or Accrued by USMI from Inception through December 31, 2014 as a Percentage of Average Daily Net Assets:
| Expenses: | Amount as a Percentage of Average Daily Net Assets |
|||
| Amount Paid or Accrued to USCF(25): | 0.69% annualized | |||
| Amount Paid or Accrued in Portfolio Brokerage Commissions: | 0.04% annualized | |||
| Other Amounts Paid or Accrued(26)(28): | 3.13% annualized | |||
| Total Expenses Paid or Accrued: | 3.86% annualized | |||
| Expenses Waived(25)(27): | (2.98)% annualized | |||
| Total Expenses Paid or Accrued Including Expenses Waived(25)(27): | 0.88% annualized | |||
| (25) | Effective May 1, 2014 and continuing through December 31, 2015, USCF has contractually agreed to lower the management fee to 0.65% (65 basis points) per annum of average daily total net assets for USMI. From June 19, 2012, when USMI listed on the NYSE Arca, through April 30, 2014, USCF voluntarily waived the management fee paid by USMI from 0.95% (95 basis points) per annum of average daily total net assets to 0.70% (70 basis points) per annum of average daily total net assets. |
| 36 |
| (26) | Includes expenses relating to legal fees, auditing fees, printing expenses and tax reporting fees. |
| (27) | USCF has voluntarily agreed to pay certain expenses typically borne by USMI to the extent that such expenses exceeded 0.15% (15 basis points) of USMI’s NAV, on an annualized basis, through at least May 1, 2014. USCF has no obligation to continue such payments into subsequent periods. |
Other Fees. USMI also pays the fees and expenses associated with its tax accounting and reporting requirements. These fees were approximately $40,000 for the period ended December 31, 2014. In addition, USMI is responsible for paying its portion of the directors’ and officers’ liability insurance for USMI, the other Trust Series and the Related Public Funds. In addition, as of July 8, 2011, USMI became responsible for paying the fees and expenses of the independent directors who also serve as audit committee members of USMI, the other Trust Series and the Related Public Funds. USMI shares the fees and expenses on a pro rata basis with the Trust Series and with each Related Public Fund, as described above, based on the relative assets of each fund computed on a daily basis. These fees and expenses for the year ended December 31, 2014 were $567,863 for the Trust Series and the Related Public Funds. USMI’s portion of such fees and expenses was $548.
Form of Shares
Registered Form. Shares are issued in registered form in accordance with the Trust Agreement. The Administrator has been appointed registrar and transfer agent for the purpose of transferring shares in certificated form. The Administrator keeps a record of all shareholders and holders of the shares in certificated form in the registry (the “Register”). The beneficial interests in such shares are held in book-entry form through participants and/or accountholders in the Depository Trust Company (“DTC”).
Book Entry. Individual certificates are not issued for the shares. Instead, shares are represented by one or more global certificates, which are deposited by the Administrator with DTC and registered in the name of Cede & Co., as nominee for DTC. The global certificates evidence all of the shares outstanding at any time. Shareholders are limited to: (1) participants in DTC such as banks, brokers, dealers and trust companies (“DTC Participants”), (2) those who maintain, either directly or indirectly, a custodial relationship with a DTC Participant (“Indirect Participants”), and (3) those banks, brokers, dealers, trust companies and others who hold interests in the shares through DTC Participants or Indirect Participants, in each case who satisfy the requirements for transfers of shares. DTC Participants acting on behalf of investors holding shares through such participants’ accounts in DTC will follow the delivery practice applicable to securities eligible for DTC’s Same-Day Funds Settlement System. Shares are credited to DTC Participants’ securities accounts following confirmation of receipt of payment.
DTC. DTC has advised the Trust Series as follows: It is a limited purpose trust company organized under the laws of the State of New York and is a member of the Federal Reserve System, a “clearing corporation” within the meaning of the New York Uniform Commercial Code and a “clearing agency” registered pursuant to the provisions of Section 17A of the Exchange Act. DTC holds securities for DTC Participants and facilitates the clearance and settlement of transactions between DTC Participants through electronic book-entry changes in accounts of DTC Participants.
Inter-Series Limitation on Liability
Because the Trust was established as a Delaware statutory trust, each Trust Series will be operated so that it will be liable only for obligations attributable to such series and will not be liable for obligations of any other series or affected by losses of any other series. If any creditor or shareholder of any particular series asserts against the series a valid claim with respect to its indebtedness or shares, the creditor or shareholder will only be able to obtain recovery from the assets of that series and not from the assets of any other series or the Trust generally. The assets of each Trust Series will include only those funds and other assets that are paid to, held by or distributed to the series on account of and for the benefit of that series, including, without limitation, amounts delivered to the Trust for the purchase of shares in a series. This limitation on liability is referred to as the Inter-Series Limitation on Liability. The Inter-Series Limitation on Liability is expressly provided for under the Delaware Statutory Trust Act, which provides that if certain conditions (as set forth in Section 3804(a)) are met, then the debts of any particular series will be enforceable only against the assets of such series and not against the assets of any other series or the Trust generally. In furtherance of the Inter-Series Limitation on Liability, every party providing services to the Trust, any Trust Series or USCF on behalf of the Trust or any Trust Series, will acknowledge and consent in writing to the Inter-Series Limitation on Liability with respect to such party’s claims.
| 37 |
The existence of a Trustee should not be taken as an indication of any additional level of management or supervision over any Trust Series. To the greatest extent permissible under Delaware law, the Trustee acts in an entirely passive role, delegating all authority for the management and operation of each Trust Series and the Trust to USCF. The Trustee does not provide custodial services with respect to the assets of any Trust Series.
Calculating Per Share NAV
Each Trust Series’ per share NAV is calculated by:
| • | Taking the current market value of its total assets; | ||
| • | Subtracting any liabilities; and | ||
| • | Dividing that total by the total number of outstanding shares. |
The Administrator calculates the per share NAV of each Trust Series once each NYSE Arca trading day. The per share NAV for a normal trading day is released after 4:00 p.m. New York time. Trading during the core trading session on the NYSE Arca typically closes at 4:00 p.m. New York time. The Administrator uses the closing prices on the relevant Futures Exchanges of the Applicable Benchmark Component Futures Contracts (determined at the earlier of the close of such exchange or 2:30 p.m. New York time) for the Futures Contracts traded on the Futures Exchanges, but calculates or determines the value of all other investments of a Trust Series (including Other Related Investments) using market quotations, if available, or other information customarily used to determine the fair value of such investments as of the earlier of the close of the NYSE Arca or 4:00 p.m. New York time, in accordance with the Administrative Agency Agreement among BBH&Co., the Trust Series and USCF. “Other information” customarily used in determining fair value includes information consisting of market data in the relevant market supplied by one or more third parties including, without limitation, relevant rates, prices, yields, yield curves, volatilities, spreads, correlations or other market data in the relevant market; or information of the types described above from internal sources if that information is of the same type used by a Trust Series in the regular course of its business for the valuation of similar transactions. The information may include costs of funding, to the extent costs of funding are not and would not be a component of the other information being utilized. Third parties supplying quotations or market data may include, without limitation, dealers in the relevant markets, end-users of the relevant product, information vendors, brokers and other sources of market information.
In addition, in order to provide updated information relating to each Trust Series for use by investors and market professionals, the NYSE Arca calculates and disseminates throughout the core trading session on each trading day an updated indicative fund value. The indicative fund value is calculated by using the prior day’s closing per share NAV of a Trust Series as a base and updating that value throughout the trading day to reflect changes in the most recently reported price level of the Applicable Index as reported by Bloomberg or other reporting service. The indicative fund value share basis disseminated during NYSE Arca core trading session hours should not be viewed as an actual real time update of the per share NAV, because the per share NAV is calculated only once at the end of each trading day based upon the relevant end of day values of each Trust Series’ investments.
The indicative fund value is disseminated on a per share basis every 15 seconds during regular NYSE Arca core trading session hours of 9:30 a.m. New York time to 4:00 p.m. New York time. The normal trading hours of the Futures Exchanges vary, with some Futures Exchanges ending their trading hours before the close of the core trading session on NYSE Arca (for example, the normal trading hours of the NYMEX are 10:00 a.m. New York time to 2:30 p.m. New York time). When a Trust Series holds Applicable Benchmark Component Futures Contracts from Futures Exchanges with different trading hours than the NYSE Arca, there will be a gap in time at the beginning and/or the end of each day during which such Trust Series’ shares are traded on the NYSE Arca, but real-time Futures Exchange trading prices for Applicable Benchmark Component Futures Contracts traded on such Futures Exchanges are not available. During such gaps in time the indicative fund value will be calculated based on the end of day price of such Applicable Benchmark Component Futures Contracts from Futures Exchanges immediately preceding trading session. In addition, Other Related Investments and Treasuries held by a Trust Series will be valued by the Administrator, using rates and points received from client-approved third party vendors (such as Reuters and WM Company) and advisor quotes. These investments will not be included in the indicative fund value.
| 38 |
The NYSE Arca disseminates the indicative fund value through the facilities of CTA/CQ High Speed Lines. In addition, the indicative fund value is published on the NYSE Arca’s website and is available through on-line information services such as Bloomberg and Reuters.
Dissemination of the indicative fund value provides additional information that is not otherwise available to the public and is useful to investors and market professionals in connection with the trading of the shares of a Trust Series on the NYSE Arca. Investors and market professionals are able throughout the trading day to compare the market price of a Trust Series and the indicative fund value. If the market price of shares of a Trust Series diverges significantly from the indicative fund value, market professionals will have an incentive to execute arbitrage trades. For example, if a Trust Series appears to be trading at a discount compared to the indicative fund value, a market professional could buy shares of such Trust Series on the NYSE Arca and sell short Futures Contracts. Such arbitrage trades can tighten the tracking between the market price of such Trust Series and the indicative fund value and thus can be beneficial to all market participants.
In addition, other Futures Contracts, Other Related Investments and Treasuries held by a Trust Series are valued by the Administrator, using rates and points received from client-approved third party vendors (such as Reuters and WM Company) and advisor quotes. These investments are not included in the indicative value. The indicative fund value is based on the prior day’s per share NAV and moves up and down solely according to changes in the price of the Applicable Index as reported on Bloomberg or another reporting service.
Creation and Redemption of Shares
Each Trust Series creates and redeems shares from time to time, but only in one or more Creation Baskets or Redemption Baskets. The creation and redemption of baskets are only made in exchange for delivery to a Trust Series or the distribution by a Trust Series of the amount of Treasuries and/or cash represented by the baskets being created or redeemed, the amount of which is equal to the combined NAV of the number of shares included in the baskets being created or redeemed determined as of 4:00 p.m. New York time on the day the order to create or redeem baskets is properly received.
Authorized Participants are the only persons that may place orders to create and redeem baskets. Authorized Participants must be (1) either registered broker-dealers or other securities market participants, such as banks and other financial institutions, that are not required to register as broker-dealers to engage in securities transactions as described below, and (2) DTC Participants. To become an Authorized Participant, a person must enter into an Authorized Participant Agreement with USCF on behalf of a Trust Series. The Authorized Participant Agreement provides the procedures for the creation and redemption of baskets and for the delivery of the Treasuries and/or cash required for such creations and redemptions. The Authorized Participant Agreement and the related procedures attached thereto may be amended by USCF, without the consent of any shareholder or Authorized Participant. From July 1, 2011 through May 1, 2015, Authorized Participants pay USCI $350 for each order placed to create one or more Creation Baskets or to redeem one or more Redemption Baskets; prior to July 1, 2011, Authorized Participants paid USCI $1,000 for each order placed to create one or more Creation Baskets or to redeem one or more Redemption Baskets. From May 1, 2012 through May 1, 2015, Authorized Participants pay each of CPER and USAG $350 for each order placed to create one or more Creation Baskets or to redeem one or more Redemption Baskets (for USMI, from May 1, 2012 through March 18, 2015); prior to May 1, 2012, Authorized Participants paid $1,000 for each order placed to create one or more Creation Baskets or to redeem one or more Redemption Baskets. Authorized Participants who make deposits with a Trust Series in exchange for baskets receive no fees, commissions or other form of compensation or inducement of any kind from either the Trust or USCF, and no such person will have any obligation or responsibility to the Trust or USCF to effect any sale or resale of shares. As of December 31, 2014, 10 Authorized Participants had entered into agreements with USCF on behalf of USCI. During the year ended December 31, 2014, USCI issued 150 Creation Baskets and redeemed 39 Redemption Baskets. As of December 31, 2014, 8 Authorized Participants had entered into agreements with USCF on behalf of CPER. During the year ended December 31, 2014, CPER issued 3 Creation Baskets and redeemed 2 Redemption Baskets. As of December 31, 2014, 8 Authorized Participants had entered into agreements with USCF on behalf of USAG. During the year ended December 31, 2014, USAG did not issue any Creation Baskets and did not redeem any Redemption Baskets. As of December 31, 2014, 8 Authorized Participants had entered into agreements with USCF on behalf of USMI. During the year ended December 31, 2014, USMI did not issue any Creation Baskets and did not redeem any Redemption Baskets.
| 39 |
Certain Authorized Participants are expected to be capable of participating directly in the applicable physical commodity and the Applicable Interest markets. Some Authorized Participants or their affiliates may from time to time buy or sell applicable commodities or Applicable Interests and may profit in these instances. USCF believes that the size and operation of the applicable commodities market make it unlikely that Authorized Participants’ direct activities in the applicable commodities or securities markets will significantly affect the price of applicable commodities, Applicable Interests, or the price of shares.
Each Authorized Participant is required to be registered as a broker-dealer under the Exchange Act and is a member in good standing with FINRA, or exempt from being or otherwise not required to be registered as a broker-dealer or a member of FINRA, and qualified to act as a broker or dealer in the states or other jurisdictions where the nature of its business so requires. Certain Authorized Participants may also be regulated under federal and state banking laws and regulations. Each Authorized Participant has its own set of rules and procedures, internal controls and information barriers as it determines is appropriate in light of its own regulatory regime.
Under the Authorized Participant Agreement, USCF, and the Trust under limited circumstances, have agreed to indemnify the Authorized Participants against certain liabilities, including liabilities under the Securities Act of 1933, as amended (the “1933 Act”), and to contribute to the payments the Authorized Participants may be required to make in respect of those liabilities.
The following description of the procedures for the creation and redemption of baskets is only a summary and an investor should refer to the relevant provisions of the Trust Agreement and the form of Authorized Participant Agreement for more detail, each of which is incorporated by reference into this annual report on Form 10-K.
Creation Procedures
On any business day, an Authorized Participant may place an order with the Marketing Agent to create one or more baskets. For purposes of processing purchase and redemption orders, a “business day” means any day other than a day when the NYSE Arca, the New York Stock Exchange, or any of the Futures Exchanges upon which a Applicable Benchmark Component Futures Contract is traded is closed for regular trading. Purchase orders must be placed by 10:30 a.m. New York time or the close of regular trading on the NYSE Arca, whichever is earlier. The day on which the Marketing Agent receives a valid purchase order is referred to as the purchase order date.
By placing a purchase order, an Authorized Participant agrees to deposit Treasuries, cash or a combination of Treasuries and cash with the Trust, as described below. Prior to the delivery of baskets for a purchase order, the Authorized Participant must also have wired to the Custodian the non-refundable transaction fee due for the purchase order. Authorized Participants may not withdraw a creation request.
The manner by which creations are made is dictated by the terms of the Authorized Participant Agreement. By placing a purchase order, an Authorized Participant agrees to (1) deposit Treasuries, cash, or a combination of Treasuries and cash with the Custodian, and (2) if required by USCF in its sole discretion, enter into or arrange for a block trade, an exchange for physical or exchange for swap, or any other over-the-counter energy transaction (through itself or a designated acceptable broker) with a Trust Series for the purchase of a number and type of futures contracts at the closing settlement price for such contracts on the purchase order date. If an Authorized Participant fails to consummate (1) and (2), the order shall be cancelled. The number and type of contracts specified shall be determined by USCF, in its sole discretion, to meet a Trust Series’ investment objective and shall be purchased as a result of the Authorized Participant’s purchase of shares.
Determination of Required Deposits
The total deposit required to create each basket (“Creation Basket Deposit”) is the amount of Treasuries and/or cash that is in the same proportion to the total assets of a Trust Series (net of estimated accrued but unpaid fees, expenses and other liabilities) on the purchase order date as the number of shares to be created under the purchase order is in proportion to the total number of shares outstanding on the purchase order dates. USCF determines, directly in its sole discretion or in consultation with the Administrator, the requirements for Treasuries and cash, including the remaining maturities of the Treasuries and proportions of Treasuries and cash that may be included in deposits to create baskets. The Marketing Agent will publish an estimate of the Creation Basket Deposit requirements at the beginning of each business day. The amount of cash deposit required is the difference between the aggregate market value of the Treasuries required to be included in a Creation Basket Deposit as of 4:00 pm New York time on the date the order to purchase is properly received and the total required deposit.
| 40 |
Delivery of Required Deposits
An Authorized Participant who places a purchase order is responsible for transferring to a Trust Series’ account with the Custodian the required amount of Treasuries and/or cash by noon New York time on the third business day following the purchase order date. Upon receipt of the deposit amount, the Administrator directs DTC to credit the number of baskets ordered to the Authorized Participant’s DTC account on the third business day following the purchase order date. The expense and risk of delivery and ownership of Treasuries until such Treasuries have been received by the Custodian on behalf of each Trust Series shall be borne solely by the Authorized Participant.
Because orders to purchase baskets must be placed by 10:30 a.m., New York time, but the total payment required to create a basket during the continuous offering period will not be determined until 4:00 p.m., New York time, on the date the purchase order is received, Authorized Participants will not know the total amount of the payment required to create a basket at the time they submit an irrevocable purchase order for the basket. A Trust Series’ per share NAV and the total amount of the payment required to create a basket could rise or fall substantially between the time an irrevocable purchase order is submitted and the time the amount of the purchase price in respect thereof is determined.
Rejection of Purchase Orders
USCF acting by itself or through the Marketing Agent shall have the absolute right, but shall have no obligation, to reject any purchase order or Creation Basket Deposit if USCF determines that:
| • | the purchase order or Creation Basket Deposit is not in proper form; | ||
| • | it would not be in the best interest of the shareholders of a Trust Series; | ||
| • | due to position limits or otherwise, investment alternatives that will enable a Trust Series to meet its investment objective are not available to such Trust Series at that time; | ||
| • | the acceptance of the purchase order or the Creation Basket Deposit would have adverse tax consequences to a Trust Series or its shareholders; | ||
| • | the acceptance or receipt of which would, in the opinion of counsel to USCF, be unlawful; or | ||
| • | circumstances outside the control of USCF, the Marketing Agent or the Custodian make it, for all practical purposes, not feasible to process creations of Creation Baskets (including if USCF determines that the investments available to a Trust Series at that time will not enable it to meet its investment objective). |
None of USCF, the Marketing Agent or the Custodian will be liable for the rejection of any purchase order or Creation Basket Deposit.
Redemption Procedures
The procedures by which an Authorized Participant can redeem one or more baskets mirror the procedures for the creation of baskets. On any business day, an Authorized Participant may place an order with the Marketing Agent to redeem one or more baskets. Redemption orders must be placed by 10:30 a.m. New York time or the close of regular trading on the NYSE Arca, whichever is earlier. A redemption order so received will be effective on the date it is received in satisfactory form by the Marketing Agent (“Redemption Order Date”). The redemption procedures allow Authorized Participants to redeem baskets and do not entitle an individual shareholder to redeem any shares in an amount less than a Redemption Basket, or to redeem baskets other than through an Authorized Participant.
By placing a redemption order, an Authorized Participant agrees to deliver the baskets to be redeemed through DTC’s book-entry system to a Trust Series, as described below. Prior to the delivery of the redemption distribution for a redemption order, the Authorized Participant must also have wired to USCF’s account at the Custodian the non-refundable transaction fee due for the redemption order. An Authorized Participant may not withdraw a redemption order.
The manner by which redemptions are made is dictated by the terms of the Authorized Participant Agreement. By placing a redemption order, an Authorized Participant agrees to (1) deliver the Redemption Basket to be redeemed through DTC’s book-entry system to a Trust Series’ account with the Custodian not later than 3:00 p.m. New York time on the third business day following the effective date of the redemption order (“Redemption Distribution Date”), and (2) if required by USCF in its sole discretion, enter into or arrange for a block trade, an exchange for physical or exchange for swap, or any other over-the-counter transaction (through itself or a designated acceptable broker) with a Trust Series for the sale of a number and type of futures contracts at the closing settlement price for such contracts on the Redemption Order Date. If an Authorized Participant fails to consummate (1) and (2) above, the order shall be cancelled. The number and type of contracts specified shall be determined by USCF, in its sole discretion, to meet a Trust Series’ investment objective and shall be sold as a result of the Authorized Participant’s sale of shares.
| 41 |
Determination of Redemption Distribution
The redemption distribution from a Trust Series consists of a transfer to the redeeming Authorized Participant of an amount of Treasuries and/or cash that is in the same proportion to the total assets of such Trust Series (net of estimated accrued but unpaid fees, expenses and other liabilities) on the date the order to redeem is properly received as the number of shares to be redeemed under the redemption order is in proportion to the total number of shares outstanding on the date the order is received. USCF, directly or in consultation with the Administrator, determines the requirements for Treasuries and cash, including the remaining maturities of the Treasuries and proportions of Treasuries and cash, that may be included in distributions to redeem baskets. The Marketing Agent will publish an estimate of the redemption distribution per basket as of the beginning of each business day.
Delivery of Redemption Distribution
The redemption distribution due from a Trust Series will be delivered to the Authorized Participant on the third business day following the redemption order date if, by 3:00 p.m., New York time on such third business day, such Trust Series’ DTC account has been credited with the baskets to be redeemed. If such Trust Series’ DTC account has not been credited with all of the baskets to be redeemed by such time, the redemption distribution will be delivered to the extent of whole baskets received. Any remainder of the redemption distribution will be delivered on the next business day to the extent of remaining whole baskets received if USCF receives the fee applicable to the extension of the redemption distribution date which USCF may, from time to time, determine and the remaining baskets to be redeemed are credited to a Trust Series’ DTC account by 3:00 p.m., New York time on such next business day. Any further outstanding amount of the redemption order shall be cancelled. Pursuant to information from USCF, the Custodian will also be authorized to deliver the redemption distribution notwithstanding that the baskets to be redeemed are not credited to a Trust Series’ DTC account by 3:00 p.m., New York time on the third business day following the redemption order date if the Authorized Participant has collateralized its obligation to deliver the baskets through DTC’s book-entry system on such terms as USCF may from time to time determine.
Suspension or Rejection of Redemption Orders
USCF may, in its discretion, suspend the right of redemption, or postpone the redemption settlement date, (1) for any period during which the NYSE Arca or any of the Futures Exchanges upon which an Applicable Benchmark Component Futures Contract is traded is closed other than customary weekend or holiday closings, or trading on the NYSE Arca or the Futures Exchanges is suspended or restricted, (2) for any period during which an emergency exists as a result of which delivery, disposal or evaluation of Treasuries is not reasonably practicable, or (3) for such other period as USCF determines to be necessary for the protection of the shareholders. For example, USCF may determine that it is necessary to suspend redemptions to allow for the orderly liquidation of a Trust Series’ assets at an appropriate value to fund a redemption. If USCF has difficulty liquidating a Trust Series’ positions, e.g., because of a market disruption event in the futures markets or an unanticipated delay in the liquidation of a position in an over the counter contract, it may be appropriate to suspend redemptions until such time as such circumstances are rectified. None of USCF, the Marketing Agent, the Administrator or the Custodian will be liable to any person or in any way for any loss or damages that may result from any such suspension or postponement.
Redemption orders must be made in whole baskets. USCF will reject a redemption order if the order is not in proper form, as described in the Authorized Participant Agreement, or the fulfillment of the order in the opinion of its counsel may be illegal under applicable laws and regulations, or if circumstances outside the control of USCF, the Marketing Agent or the Custodian make it for all practical purposes not feasible for the shares to be delivered under the Redemption Order. USCF may also reject a redemption order if the number of shares being redeemed would reduce the remaining outstanding shares to 100,000 shares (i.e., two baskets) or less.
| 42 |
Creation and Redemption Transaction Fee
To compensate each Trust Series for its expenses in connection with the creation and redemption of baskets, an Authorized Participant is required to pay a transaction fee to each Trust Series per order to create or redeem baskets, regardless of the number of baskets in such order. From July 1, 2011 through December 31, 2014 (and continuing at least through May 1, 2015), Authorized Participants pay USCI $350 for each order placed to create one or more Creation Baskets or to redeem one or more Redemption Baskets; prior to July 1, 2011, Authorized Participants paid USCI $1,000 for each order placed to create one or more Creation Baskets or to redeem one or more Redemption Baskets. From May 1, 2012 through December 31, 2014 (and continuing at least through May 1, 2015), Authorized Participants pay each of CPER and USAG $350 for each order placed to create one or more Creation Baskets or to redeem one or more Redemption Baskets (from May 1, 2012 continuing through March 18, 2015 for USMI); prior to May 1, 2012, Authorized Participants paid $1,000 for each order placed to create one or more Creation Baskets or to redeem one or more Redemption Baskets. The transaction fee may be reduced, increased or otherwise changed by USCF. USCF shall notify DTC of any change in the transaction fee and will not implement any increase in the fee for the redemption of baskets until 30 days after the date of the notice.
Tax Responsibility
Authorized Participants are responsible for any transfer tax, sales or use tax, stamp tax, recording tax, value added tax or similar tax or governmental charge applicable to the creation or redemption of baskets, regardless of whether or not such tax or charge is imposed directly on the Authorized Participant, and agree to indemnify USCF and each Trust Series if they are required by law to pay any such tax, together with any applicable penalties, additions to tax and interest thereon.
Secondary Market Transactions
As noted, each Trust Series creates and redeems shares from time to time, but only in one or more Creation Baskets or Redemption Baskets. The creation and redemption of baskets are only made in exchange for delivery to a Trust Series or the distribution by a Trust Series of the amount of Treasuries and/or cash equal to the aggregate NAV of the number of shares included in the baskets being created or redeemed determined on the day the order to create or redeem baskets is properly received.
As discussed above, Authorized Participants are the only persons that may place orders to create and redeem baskets. Authorized Participants must be registered broker-dealers or other securities market participants, such as banks and other financial institutions that are not required to register as broker-dealers to engage in securities transactions. An Authorized Participant is under no obligation to create or redeem baskets, and an Authorized Participant is under no obligation to offer to the public shares of any baskets it does create. Authorized Participants that do offer to the public shares from the baskets they create will do so at per-share offering prices that are expected to reflect, among other factors, the trading price of the shares on the NYSE Arca, the NAV of a Trust Series’ shares at the time the Authorized Participant purchased the Creation Baskets, the per share NAV of the shares at the time of the offer of the shares to the public, the supply of and demand for shares at the time of sale, and the liquidity of the Applicable Benchmark Component Futures Contract market and the market for Other Related Investments. Baskets are generally redeemed when the price per share is at a discount to the per share NAV.
Shares initially comprising the same basket but offered by Authorized Participants to the public at different times may have different offering prices. An order for one or more baskets may be placed by an Authorized Participant on behalf of multiple clients. Authorized Participants who make deposits with a Trust Series in exchange for baskets receive no fees, commissions or other forms of compensation or inducement of any kind from either a Trust Series or USCF and no such person has any obligation or responsibility to USCF or a Trust Series to effect any sale or resale of shares. Shares trade in the secondary market on the NYSE Arca. Shares may trade in the secondary market at prices that are lower or higher relative to their per share NAV. The amount of the discount or premium in the trading price relative to the per share NAV may be influenced by various factors, including the number of investors who seek to purchase or sell shares in the secondary market and the liquidity of the Applicable Benchmark Component Futures Contract market and the market for Other Related Investments. While the shares trade during the core trading session on the NYSE Arca until 4:00 p.m. New York time, liquidity in the market for Applicable Benchmark Component Futures Contracts and Other Related Investments may be reduced after the close of the Futures Exchanges upon which the Applicable Benchmark Component Futures Contracts are traded. As a result, during this time, trading spreads, and the resulting premium or discount, on the shares may widen.
| 43 |
Who is the Trustee?
The sole Trustee of the Trust is Wilmington Trust Company, a Delaware trust company (the “Trustee”). The Trustee’s principal offices are located at 1100 North Market Street, Wilmington, Delaware 19890-0001. The Trustee is unaffiliated with USCF. The Trustee’s duties and liabilities with respect to the offering of shares and the management of the Trust and each Trust Series are limited to its express obligations under the Trust Agreement.
The Trustee will accept service of legal process on the Trust in the State of Delaware and will make certain filings under the Delaware Statutory Trust Act. The Trustee does not owe any other duties to the Trust, USCF or the shareholders. The Trustee is permitted to resign upon at least sixty (60) days’ notice to USCF. If no successor trustee has been appointed by USCF within such sixty-day period, the Trustee may, at the expense of the Trust, petition a court to appoint a successor. The Trustee is entitled to reasonable compensation for its services from USCF or an affiliate of USCF (including the Trust), and is indemnified by USCF against any expenses it incurs relating to or arising out of the formation, operation or termination of the Trust, or any action or inaction of the Trustee under the Trust Agreement, except to the extent that such expenses result from the gross negligence or willful misconduct of the Trustee. USCF has the discretion to replace the Trustee.
Under the Trust Agreement, the Trustee has delegated to USCF the exclusive management and control of all aspects of the business of the Trust and the Trust Series. The Trustee has no duty or liability to supervise or monitor the performance of USCF, nor does the Trustee have any liability for the acts or omissions of USCF.
Because the Trustee has no authority over the operation of the Trust, the Trustee itself is not registered in any capacity with the CFTC.
Investments
USCF applies substantially all of a Trust Series’ assets in Applicable Benchmark Component Futures Contracts and Other Related Investments, short-term Treasuries, cash and cash equivalents. When a Trust Series purchases Applicable Benchmark Component Futures Contracts and certain Other Related Investments that are exchange-traded, a Trust Series is required to deposit with the FCM on behalf of the exchange a portion of the value of the contract or other interest as security to ensure payment for the obligation under the Applicable Interests at maturity. This deposit is known as initial margin. Counterparties in transactions in over-the-counter Applicable Interests generally impose similar collateral requirements on a Trust Series. USCF invests a Trust Series’ assets that remain after margin and collateral is posted in Treasuries, cash and/or cash equivalents. Subject to these margin and collateral requirements, USCF has sole authority to determine the percentage of assets that will be:
| • | held as margin or collateral with FCMs or other custodians; | ||
| • | used for other investments; and | ||
| • | held in bank accounts to pay current obligations and as reserves. |
In general, a Trust Series posts between 5% to 30% of the notional amount of an Applicable Interest as initial margin when entering into such Applicable Interest. Ongoing margin and collateral payments will generally be required for both exchange-traded and over-the-counter Applicable Interests based on changes in the value of the Applicable Interests. Furthermore, ongoing collateral requirements with respect to over-the-counter Applicable Interests are negotiated by the parties, and may be affected by overall market volatility, volatility of the underlying commodity or index, the ability of the counterparty to hedge its exposure under the Applicable Interest, and each party’s creditworthiness. In light of the differing requirements for initial payments under exchange-traded and over-the-counter Applicable Interests and the fluctuating nature of ongoing margin and collateral payments, it is not possible to estimate what portion of a Trust Series’ assets will be posted as margin or collateral at any given time. The Treasuries, cash and cash equivalents held by a Trust Series constitute reserves that are available to meet ongoing margin and collateral requirements. All income is used for a Trust Series’ benefit.
An FCM, counterparty, government agency or commodity exchange could increase margin or collateral requirements applicable to a Trust Series to hold trading positions at any time. Moreover, margin is merely a security deposit and has no bearing on the profit or loss potential for any positions held.
| 44 |
Each Trust Series’ assets posted as margin for Futures Contracts will be held in segregated accounts pursuant to CEA and CFTC regulations. Collateral posted in connection with over-the-counter contracts held with a Trust Series’ FCM will be similarly segregated and if held with other counterparties will be segregated pursuant to a contract between such Trust Series and its counterparties.
If a Trust Series enters into a swap agreement, it must post both collateral and independent amounts to its swap counterparty(ies). The amount of collateral The Trust Series posts changes according to the amounts owed by the Trust Series to its counterparty on a given swap transaction, while independent amounts are fixed amounts posted by the Trust Series at the start of a swap transaction. Collateral and independent amounts posted to swap counterparties will be held by a third party custodian.
The Commodity Interest Markets
General
The CEA governs the regulation of commodity interest transactions, markets and intermediaries. The CEA provides for varying degrees of regulation of commodity interest transactions depending upon: (1) the type of instrument being traded (e.g., contracts for future delivery, options, swaps or spot contracts), (2) the type of commodity underlying the instrument (distinctions are made between instruments based on agricultural commodities, energy and metals commodities and financial commodities), (3) the nature of the parties to the transaction (retail, eligible contract participant, or eligible commercial entity), (4) whether the transaction is entered into on a principal-to-principal or intermediated basis, (5) the type of market on which the transaction occurs, and (6) whether the transaction is subject to clearing through a clearing organization.
The offer and sale of shares of each Trust Series as well as shares of each Related Public Fund, is registered under the Securities Act. Each Trust Series and the Related Public Funds are subject to the requirements of the Securities Act, the Exchange Act and the rules and regulations adopted thereunder as administered by the SEC. The Firm’s participation in the distribution of shares are regulated as described above, as well as by the self regulatory association, FINRA.
Futures Contracts
A futures contract is a standardized contract traded on, or subject to the rules of, an exchange that calls for the future delivery of a specified quantity and type of a commodity at a specified time and place. Futures contracts are traded on a wide variety of commodities, including agricultural products, bonds, stock indices, interest rates, currencies, energy and metals. The size and terms of futures contracts on a particular commodity are identical and are not subject to any negotiation, other than with respect to price and the number of contracts traded between the buyer and seller.
The contractual obligations of a buyer or seller may generally be satisfied by taking or making physical delivery of the underlying commodity or by making an offsetting sale or purchase of an identical futures contract on the same or linked exchange before the designated date of delivery. The difference between the price at which the futures contract is purchased or sold and the price paid for the offsetting sale or purchase, after allowance for brokerage commissions, constitutes the profit or loss to the trader. Some futures contracts, such as stock index contracts, settle in cash (reflecting the difference between the contract purchase/sale price and the contract settlement price) rather than by delivery of the underlying commodity.
In market terminology, a trader who purchases a futures contract is long in the market and a trader who sells a futures contract is short in the market. Before a trader closes out his long or short position by an offsetting sale or purchase, his outstanding contracts are known as open trades or open positions. The aggregate amount of open positions held by traders in a particular contract is referred to as the open interest in such contract.
Forward Contracts
A forward contract is a contractual obligation to purchase or sell a specified quantity of a commodity at or before a specified date in the future at a specified price and, therefore, is economically similar to a futures contract. Unlike futures contracts, however, forward contracts are typically traded in the OTC markets and are not standardized contracts. Forward contracts for a given commodity are generally available for various amounts and maturities and are subject to individual negotiation between the parties involved. Moreover, generally there is no direct means of offsetting or closing out a forward contract by taking an offsetting position as one would a futures contract on a U.S. exchange. If a trader desires to close out a forward contract position, he generally will establish an opposite position in the contract but will settle and recognize the profit or loss on both positions simultaneously on the delivery date. Thus, unlike in the futures contract market where a trader who has offset positions will recognize profit or loss immediately, in the forward market a trader with a position that has been offset at a profit will generally not receive such profit until the delivery date, and likewise a trader with a position that has been offset at a loss will generally not have to pay money until the delivery date. In recent years, however, the terms of forward contracts have become more standardized, and in some instances such contracts now provide a right of offset or cash settlement as an alternative to making or taking delivery of the underlying commodity.
| 45 |
In general, the CFTC does not regulate the interbank and forward foreign currency markets with respect to transactions in contracts between certain sophisticated counterparties such as a Trust Series or between certain regulated institutions and retail investors. Although U.S. banks are regulated in various ways by the Federal Reserve Board, the Comptroller of the Currency and other U.S. federal and state banking officials, banking authorities do not regulate the forward markets to the same extent that the swap markets are regulated by the CFTC and SEC. At a minimum, over-the-counter currency forwards, options and swaps will be subject to heightened recordkeeping, reporting and business conduct standards.
Regulation exempts both foreign exchange swaps and foreign exchange forwards from the definition of “swap” and, by extension, additional regulatory requirements (such as clearing and margin). The final determination does not extend to other foreign exchange derivatives, such as foreign exchange options, currency swaps, and non-deliverable forwards.
While the U.S. government does not currently impose any restrictions on the movements of currencies, it could choose to do so. The imposition or relaxation of exchange controls in various jurisdictions could significantly affect the market for that and other jurisdictions’ currencies. Trading in the interbank market also exposes the Trust Series to a risk of default since failure of a bank with which a Trust Series had entered into a forward contract would likely result in a default and thus possibly substantial losses to the Trust Series.
Options on Futures Contracts
Options on futures contracts are standardized contracts traded on an exchange. An option on a futures contract gives the buyer of the option the right, but not the obligation, to take a position at a specified price (the striking, strike, or exercise price) in the underlying futures contract or underlying interest. The buyer of a call option acquires the right, but not the obligation, to purchase or take a long position in the underlying interest, and the buyer of a put option acquires the right, but not the obligation, to sell or take a short position in the underlying interest.
The seller, or writer, of an option is obligated to take a position in the underlying interest at a specified price opposite to the option buyer if the option is exercised. The seller of a call option must stand ready to take a short position in the underlying interest at the strike price if the buyer should exercise the option. The seller of a put option, on the other hand, must stand ready to take a long position in the underlying interest at the strike price.
A call option is said to be in-the-money if the strike price is below current market levels and out-of-the-money if the strike price is above current market levels. Conversely, a put option is said to be in-the-money if the strike price is above the current market levels and out-of-the-money if the strike price is below current market levels.
Options have limited life spans, usually tied to the delivery or settlement date of the underlying interest. Some options, however, expire significantly in advance of such date. The purchase price of an option is referred to as its premium, which consists of its intrinsic value (which is related to the underlying market value) plus its time value. As an option nears its expiration date, the time value shrinks and the market and intrinsic values move into parity. An option that is out-of-the-money and not offset by the time it expires becomes worthless. On certain exchanges, in-the-money options are automatically exercised on their expiration date, but on others unexercised options simply become worthless after their expiration date.
Regardless of how much the market swings, the most an option buyer can lose is the option premium. The option buyer deposits his premium with his broker, and the money goes to the option seller. Option sellers, on the other hand, face risks similar to participants in the futures markets. For example, since the seller of a call option is assigned a short futures position if the option is exercised, his risk is the same as someone who initially sold a futures contract. Because no one can predict exactly how the market will move, the option seller posts margin to demonstrate his ability to meet any potential contractual obligations.
| 46 |
Options on Forward Contracts or Commodities
Options on forward contracts or commodities operate in a manner similar to options on futures contracts. An option on a forward contract or commodity gives the buyer of the option the right, but not the obligation, to take a position at a specified price in the underlying forward contract or commodity. However, unlike options on futures contracts, options on forward contracts or on commodities are individually negotiated contracts between counterparties and are typically traded in the OTC market. Therefore, options on forward contracts and physical commodities possess many of the same characteristics of forward contracts with respect to offsetting positions and credit risk that are described above.
Swap Contracts
Swap transactions generally involve contracts between two parties to exchange a stream of payments computed by reference to a notional amount and the price of the asset that is the subject of the swap. Swap contracts are principally traded off-exchange, although certain swap contracts are also being traded in electronic trading facilities and cleared through clearing organizations.
Swaps are usually entered into on a net basis, that is, the two payment streams are netted out in a cash settlement on the payment date or dates specified in the agreement, with the parties receiving or paying, as the case may be, only the net amount of the two payments. Swaps do not generally involve the delivery of underlying assets or principal. Accordingly, the risk of loss with respect to swaps is generally limited to the net amount of payments that the party is contractually obligated to make. In some swap transactions one or both parties may require collateral deposits from the counterparty to support that counterparty’s obligation under the swap agreement. If the counterparty to such a swap defaults, the risk of loss consists of the net amount of payments that the party is contractually entitled to receive less any collateral deposits it is holding.
Some swap transactions are cleared through central counterparties. These transactions, known as cleared swaps, involve two counterparties first agreeing to the terms of a swap transaction, then submitting the transaction to a clearing house that acts as the central counterparty. Once accepted by the clearing house, the original swap transaction is novated and the central counterparty becomes the counterparty to a trade with each of the original parties based upon the trade terms determined in the original transaction. In this manner each individual swap counterparty reduces its risk of loss due to counterparty nonperformance because the clearing house acts as the counterparty to each transaction.
Regulations require that certain transactions ultimately falling within the definition of “swap” be executed on organized exchanges or “swap execution facilities” and cleared through regulated clearing organizations (“derivative clearing organizations” (“DCOs”)), if the CFTC mandates the central clearing of a particular contract. As of June 10, 2013, swap dealers, major swap participants, commodity pools, certain private funds and entities predominantly engaged in financial activities were required to clear certain credit default swaps and interest rate swaps. As a result, if a Trust Series enters into or has entered into certain interest rate and credit default swaps, such swaps will be required to be centrally cleared. Determination on other types of swaps are expected in the future, and, when finalized, could require each Trust Series to centrally clear certain over-the-counter instruments presently entered into and settled on a bi-lateral basis. If a swap is required to be cleared, the initial margin will be set by the clearing organizations, subject to certain regulatory requirements and guidelines. Initial and variation margin requirements for swap dealers and major swap participants who enter into uncleared swaps and capital requirements for swap dealers and major swap participants who enter into both cleared and uncleared trades will be set by the CFTC, the SEC or the applicable “Prudential Regulator.”
On April 9, 2013, the CFTC’s Division of Market Oversight issued a letter granting time-limited no-action relief to non-swap dealer, non-major swap participant counterparties from the real-time, regular and historical swap reporting requirements (under Part 43, Part 45 and Part 46 of the CFTC’s regulations, respectively). The regular reporting requirements (Part 45 of the CFTC regulations) for interest rate and credit swaps of a financial entity (including a commodity pool such as each Trust Series) began on April 10, 2013. For a financial entity (including a commodity pool such as each Trust Series), regular reporting requirements for equity, foreign exchange and other commodity swaps (including swaps on agricultural and energy futures contracts) began on May 29, 2013 and reporting of all historical swaps for all asset classes began on September 30, 2013.
| 47 |
Regulation imposes requirements on swap dealers and major swap participants with respect to the treatment of collateral posted by their counterparties to margin, guarantee, or secure uncleared swaps. In other words, the rule places restrictions on what swap dealers and major swap participants can do with collateral posted by the Trust Series in connection with uncleared swaps.
Regulation
Futures exchanges in the United States are subject to varying degrees of regulation under the CEA depending on whether such exchange is a designated contract market, exempt board of trade or electronic trading facility. Clearing organizations are also subject to the CEA and the rules and regulations adopted thereunder and administered by the CFTC. The CFTC is the governmental agency charged with responsibility for regulation of futures exchanges and commodity interest trading conducted on those exchanges. The CFTC’s function is to implement the CEA’s objectives of preventing price manipulation and excessive speculation and promoting orderly and efficient commodity interest markets. In addition, the various exchanges and clearing organizations themselves exercise regulatory and supervisory authority over their member firms.
The CFTC also regulates the activities of “commodity trading advisors” and “commodity pool operators” and the CFTC has adopted regulations with respect to certain of such persons’ activities. Pursuant to its authority, the CFTC requires a CPO, such as USCF, to keep accurate, current and orderly records with respect to each pool it operates. The CFTC may suspend, modify or terminate the registration of any registrant for failure to comply with CFTC rules or regulations. Suspension, restriction or termination of USCF’s registration as a CPO would prevent it, until such time (if any) as such registration were to be reinstated, from managing, and might result in the termination of, the Trust Series or the Related Public Funds.
The CEA also gives the states certain powers to enforce its provisions and the regulations of the CFTC.
Under certain circumstances, the CEA grants shareholders the right to institute a reparations proceeding before the CFTC against USCF (as a registered commodity pool operator), as well as those of their respective employees who are required to be registered under the CEA. Shareholders may also be able to maintain a private right of action for certain violations of the CEA.
Pursuant to authority in the CEA, the NFA has been formed and registered with the CFTC as a registered futures association. The NFA is the only self regulatory association for commodities professionals other than the exchanges. As such, the NFA promulgates rules governing the conduct of commodity professionals and disciplines those professionals that do not comply with such standards. The CFTC has delegated to the NFA responsibility for the registration of commodity pool operation. USCF is a member of the NFA. As a member of the NFA, USCF is subject to NFA standards relating to fair trade practices, financial condition, and consumer protection. The CFTC is prohibited by statute from regulating trading on foreign commodity exchanges and markets.
The CEA requires all FCMs, such as USCI’s, CPER’s, USAG’s or USMI’s clearing brokers, to meet and maintain specified fitness and financial requirements, to segregate customer funds from proprietary funds and account separately for all customers’ funds and positions, and to maintain specified books and records open to inspection by the staff of the CFTC. The CFTC has similar authority over introducing brokers, or persons who solicit or accept orders for commodity interest trades but who do not accept margin deposits for the execution of trades. The CEA authorizes the CFTC to regulate trading by FCMs and by their officers and directors, permits the CFTC to require action by exchanges in the event of market emergencies, and establishes an administrative procedure under which customers may institute complaints for damages arising from alleged violations of the CEA. The CEA also gives the states powers to enforce its provisions and the regulations of the CFTC.
The regulations of the CFTC and the NFA prohibit any representation by a person registered with the CFTC or by any member of the NFA, that registration with the CFTC, or membership in the NFA, in any respect indicates that the CFTC or the NFA, as the case may be, has approved or endorsed that person or that person’s trading program or objectives. The registrations and memberships of the parties described in this summary must not be considered as constituting any such approval or endorsement. Likewise, no futures exchange has given or will give any similar approval or endorsement.
| 48 |
Regulations require enhanced customer protections, risk management programs, internal monitoring and controls, capital and liquidity standards, customer disclosures and auditing and examination programs for FCMs. The rules are intended to afford greater assurances to market participants that customer segregated funds and secured amounts are protected, customers are provided with appropriate notice of the risks of futures trading and of the FCMs with which they may choose to do business, FCMs are monitoring and managing risks in a robust manner, the capital and liquidity of FCMs are strengthened to safeguard the continued operations, and the auditing and examination programs of the CFTC and the self-regulatory organizations are monitoring the activities of FCMs in a thorough manner.
Each Trust Series’ investors are afforded prescribed rights for reparations under the CEA against USCF (as a registered commodity pool operator), as well as its respective employees who are required to be registered under the CEA. Investors may also be able to maintain a private right of action for violations of the CEA. The CFTC has adopted rules implementing the reparation provisions of the CEA, which provide that any person may file a complaint for a reparations award with the CFTC for violation of the CEA against a floor broker or a FCM, introducing broker, commodity trading advisor, CPO, and their respective associated persons.
The regulation of commodity interest trading in the United States and other countries is an evolving area of the law. The various statements made in this summary are subject to modification by legislative action and changes in the rules and regulations of the CFTC, the NFA, the futures exchanges, clearing organizations and other regulatory bodies.
Futures Contracts and Position Limits
The CFTC is prohibited by statute from regulating trading on non-U.S. futures exchanges and markets. The CFTC, however, has adopted regulations relating to the marketing of non-U.S. futures contracts in the United States. These regulations permit certain contracts traded on non-U.S. exchanges to be offered and sold in the United States.
On November 5, 2013, the CFTC proposed a rulemaking that would establish specific limits on speculative positions in 28 physical commodity futures and option contracts as well as swaps that are economically equivalent to such contracts in the agriculture, energy and metals markets (the “Position Limit Rules”). On the same date, the CFTC proposed another rule addressing the circumstances under which market participants would be required to aggregate their positions with other persons under common ownership or control (the “Proposed Aggregation Requirements”). Specifically, the Position Limit Rules would, among other things: identify which contracts are subject to speculative position limits; set thresholds that restrict the number of speculative positions that a person may hold in a spot month, individual month and all months combined; create an exemption for positions that constitute bona fide hedging transactions; impose responsibilities on DCMs and SEFs to establish position limits or, in some cases, position accountability rules; and apply to both futures and swaps across four relevant venues: OTC, DCMs, SEFs as well as non-U.S. located platforms. Furthermore, until such time as the Position Limit Rules are adopted, the regulatory architecture in effect prior to the adoption of the Position Limit Rules will govern transactions in commodities and related derivatives (collectively, “Referenced Contracts”). Under that system, the CFTC enforces federal limits on speculation in agricultural products (e.g., corn, wheat and soy), while futures exchanges enforce position limits and accountability levels for agricultural and certain energy products (e.g., oil and natural gas). As a result, the Trust Series may be limited with respect to the size of its investments in any commodities subject to these limits. Finally, subject to certain narrow exceptions, the Position Limit Rules require the aggregation, for purposes of the position limits, of all positions in the 28 Referenced Contracts held by a single entity and its affiliates, regardless of whether such position existed on U.S. futures exchanges, non-U.S. futures exchanges, in cleared swaps or in over-the-counter swaps. Under the CFTC’s existing position limits requirements and the Position Limit Rules, a market participant is generally required to aggregate all positions for which that participant controls the trading decisions with all positions for which that participant has a ten percent (10%) or greater ownership interest in an account or position, as well as the positions of two or more persons acting pursuant to an express or implied agreement or understanding. At this time, it is unclear how the Proposed Aggregation Requirements may affect a Trust Series, but it may be substantial and adverse. By way of example, the Proposed Aggregation Requirements in combination with the Position Limit Rules may negatively impact the ability of a Trust Series to meet its investment objectives through limits that may inhibit USCF’s ability to sell additional Creation Baskets of a Trust Series.
Based on its current understanding of the final position limit regulations, USCF does not anticipate significant negative impact on the ability of the Trust Series to achieve their investment objectives.
| 49 |
Commodity Margin
Original or initial margin is the minimum amount of funds that must be deposited by a commodity interest trader with the trader’s broker to initiate and maintain an open position in futures contracts. Maintenance margin is the amount (generally less than the original margin) to which a trader’s account may decline before he must deliver additional margin. A margin deposit is like a cash performance bond. It helps assure the trader’s performance of the futures contracts that he or she purchases or sells. Futures contracts are customarily bought and sold on initial margin that represents a very small percentage (ranging upward from 5%) of the aggregate purchase or sales price of the contract. Because of such low margin requirements, price fluctuations occurring in the futures markets may create profits and losses that, in relation to the amount invested, are greater than are customary in other forms of investment or speculation. As discussed below, adverse price changes in the futures contract may result in margin requirements that greatly exceed the initial margin. In addition, the amount of margin required in connection with a particular futures contract is set from time to time by the exchange on which the contract is traded and may be modified from time to time by the exchange during the term of the contract.
Brokerage firms, such as the Trust Series’ clearing brokers, carrying accounts for traders in commodity interest contracts may not accept lower, and generally require higher, amounts of margin as a matter of policy to further protect themselves. The clearing brokers require a Trust Series to make margin deposits equal to exchange minimum levels for all commodity interest contracts. This requirement may be altered from time to time in the clearing brokers’ discretion.
Regulators have not yet finalized the Dodd-Frank Act rules regarding initial margin levels for over-the-counter derivatives. It is possible that such levels may be higher than those for futures contracts. Also, initial margin requirements for non-cleared swaps will be subject to higher margin requirements than cleared swaps. And, under pending rule proposals, a Trust Series may be required to post, but not be entitled to receive, initial and variation margin in respect of non-cleared swaps. Until such time as the regulators finalize these margin rules, trading in the OTC markets where no clearing facility is provided generally will not require margin per se. Rather, it will involve the extension of credit between counterparties-that is secured by transfers of credit support and/or independent amounts. Credit support is transferred between counterparties in respect of the open over-the-counter derivatives entered into between them, while independent amounts are fixed amounts posted by one or both counterparties at the execution of a particular over-the-counter transaction.
When a trader purchases an option, there is no margin requirement; however, the option premium must be paid in full. When a trader sells an option, on the other hand, he or she is required to deposit margin in an amount determined by the margin requirements established for the underlying interest and, in addition, an amount substantially equal to the current premium for the option. The margin requirements imposed on the selling of options, although adjusted to reflect the probability that out-of-the-money options will not be exercised, can in fact be higher than those imposed in dealing in the futures markets directly. Complicated margin requirements apply to spreads and conversions, which are complex trading strategies in which a trader acquires a mixture of options positions and positions in the underlying interest.
Margin requirements are computed each day by a trader’s clearing broker. When the market value of a particular open commodity interest position changes to a point where the margin on deposit does not satisfy maintenance margin requirements, a margin call is made by the broker. If the margin call is not met within a reasonable time, the broker may close out the trader’s position. With respect to a Trust Series’ trading, a Trust Series (and not its investors personally) is subject to margin calls.
Regulations impose requirements on swap dealers and major swap participants with respect to the treatment of collateral posted by their counterparties to margin, guarantee, or secure uncleared swaps. In other words, the rule places restrictions on what swap dealers and major swap participants can do with collateral posted by the Trust Series in connection with uncleared swaps.
| 50 |
Finally, many major U.S. exchanges have passed certain cross margining arrangements involving procedures pursuant to which the futures and options positions held in an account would, in the case of some accounts, be aggregated and margin requirements would be assessed on a portfolio basis, measuring the total risk of the combined positions.
General Regulation Applicable to the Trust and Each Trust Series
On August 12, 2013, the CFTC issued final rules establishing compliance obligations for commodity pool operators (“CPOs”) of investment companies registered under the Investment Company Act of 1940, as amended (the “1940 Act”) that are required to register due to recent changes to CFTC Regulation 4.5. The final rules were issued in a CFTC release entitled “Harmonization of Compliance Obligations for Registered Investment Companies Required to Register as Commodity Pool Operators.” For entities that are registered with both the CFTC and the SEC, the CFTC will accept the SEC’s disclosure, reporting and recordkeeping regime as substituted compliance for substantially all of Part 4 of the CFTC’s regulations, so long as they comply with comparable requirements under the SEC’s statutory and regulatory compliance regime. Thus, the final rules (the “Harmonization Rules”) allow dually registered entities to meet certain CFTC regulatory requirements for CPOs by complying with SEC rules to which they are already subject. Although the Trust and each Trust Series is not a registered investment company under the Investment Company Act, the Harmonization Rules amended certain CFTC disclosure rules to make the requirements for all CPOs to periodically update their disclosure documents consistent with those of the SEC. This change will decrease the burden to the Trust and each Trust Series and USCF of having to comply with inconsistent regulatory requirements. It is not known whether the CFTC will make additional amendments to its disclosure, reporting and recordkeeping rules to further harmonize these obligations with those of the SEC as they apply to the Trust and each Trust Series and USCF, but any such further rule changes could result in additional operating efficiencies for the Trust and each Trust Series and USCF.
On July 23, 2014, the SEC adopted final rules governing the structure and operation of money market funds, in a release adopting amendments to Rule 2a-7 under the 1940 Act. The new rules will require institutional prime money market funds to price their shares using market-based values instead of the amortized cost method (i.e., to use a “floating NAV”). In addition, all money market funds will be able, and in certain cases will be required, to impose liquidity fees and temporarily suspend redemptions during periods of market stress, subject to certain board findings. Finally, the SEC also revised certain diversification provisions of Rule 2a-7, as well as provisions relating to stress testing. The Trust and each Trust Series currently invests in money market funds, as well as Treasuries with a maturity date of two years or less, as an investment for assets not used for margin or collateral in the Futures Contracts. It is unclear at this time what impact of money market reform would have on the Trust and each Trust Series’ ability to hedge risk, however, the imposition of a floating NAV could cause the Trust and each Trust Series to limit remaining assets solely in Treasuries and cash.
With regard to any other rules that the CFTC or SEC may adopt in the future, the effect of any such regulatory changes on the Trust and each Trust Series is impossible to predict, but it could be substantial and adverse.
SEC Reports
The Trust makes available, free of charge, on its website, its annual reports on Form 10-K, its quarterly reports on Form 10-Q, its current reports on Form 8-K and amendments to these reports filed or furnished pursuant to Section 13(a) or 15(d) of the Exchange Act as soon as reasonably practicable after these forms are filed with, or furnished to, the SEC. These reports are also available from the SEC though its website at: www.sec.gov.
CFTC Reports
The Trust also makes available its monthly reports and its annual reports required to be prepared and filed with the NFA under the CFTC regulations.
| 51 |
Intellectual Property
USCF owns trademark registrations for USCI and Design (U.S. Reg. No. 4437230) for “fund investment services,” in use since September 30, 2012, USCI UNITED STATES COMMODITY INDEX FUND (U.S. Reg. No. 4005166) for “fund investment services,” in use since August 10, 2010, and USCI UNITED STATES COMMODITY INDEX FUND and Design (U.S. Reg. No. 4005167) for “fund investment services,” in use since August 10, 2010. USCF owns trademark registrations for CPER UNITED STATES COPPER INDEX FUND (and Design) (U.S. Reg. No. 4440922) for “Financial investment services in the field of copper futures contracts, cash-settled options on copper futures contracts, forward contracts for copper, over-the-counter transactions based on the price of copper, and indices based on the foregoing,” in use since September 30, 2012, CPER UNITED STATES COPPER INDEX FUND (and Mining Design) (U.S. Reg. no. 4304002) for “fund investment services,” in use since November 15, 2011, UNITED STATES COPPER INDEX FUND (U.S. Reg. No. 4270057) for “fund investment services,” in use since November 15, 2011, and THE FIRST COPPER ETF, (U.S. Reg. No. 4472746), filed on February 28, 2013. USCF owns trademark registrations for UNITED STATES AGRICULTURE INDEX FUND (U.S. Reg. No. 4270059 for “fund investment services,” in use since April 13, 2012, USAG UNITED STATES AGRICULTURE INDEX FUND & Design (U.S. Reg. No. 4304003) for “fund investment services,” in use since April 13, 2012, and USAG UNITED STATES AGRICULTURE INDEX FUND (and Leaf Design) (U.S. Reg. No. 4440921) for “Financial investment services in the field of agriculture futures contracts, cash-settled options on agriculture futures contracts, forward contracts for agriculture, over-the-counter transactions based on the price of agriculture, and indices based on the foregoing,” in use since June 28, 2012. USCF owns trademark registrations for UNITED STATES METALS INDEX FUND (U.S. Reg. No. 4270058) for “fund investment services,” in use since June 20, 2012, USMI UNITED STATES METALS INDEX FUND & Design (U.S. Reg. No. 4255313) for “fund investment services,” in use since June 20, 2012, and USMI UNITED STATES METALS INDEX FUND (and Design) (U.S. Reg. No. 4440931) for “Financial investment services in the field of metal futures contracts, cash-settled options on metal futures contracts, forward contracts for metal, over-the-counter transactions based on the price of metal, and indices based on the foregoing,” in use since September 30, 2012. USCF relies upon these trademarks through which it markets its services and strives to build and maintain brand recognition in the market and among current and potential investors. So long as USCF continues to use these trademarks to identify its services, without challenge from any third party, and properly maintains and renews the trademark registrations under applicable laws, rules and regulations, it will continue to have indefinite protection for these trademarks under current laws, rules and regulations.
USCF owns trademark registrations for UNITED STATES COMMODITY FUNDS (U.S. Reg. No. 3600670) for “fund investment services,” in use since June 24, 2008, USCF (U.S. Reg. No. 3638987) for “fund investment services,” in use since June 24, 2008, and USCF UNITED STATES COMMODITY FUNDS LLC & Design (U.S. Reg. No. 4304004) for “fund investment services,” in use since June 24, 2008. USCF relies upon these trademarks through which it markets its services and strives to build and maintain brand recognition in the market and among current and potential investors. So long as USCF continues to use these trademarks to identify its services, without challenge from any third party, and properly maintains and renews the trademark registrations under applicable laws, rules and regulations; it will continue to have indefinite protection for these trademarks under current laws, rules and regulations. USCF has been granted two patents Nos. 7,739,186 and 8,019,675, for systems and methods for an exchange traded fund (ETF) that tracks the price of one or more commodities.
| Item 1A. | Risk Factors. |
The following risk factors should be read in connection with the other information included in this annual report on Form 10-K, including Management’s Discussion and Analysis of Financial Condition and Results of Operations and financial statements and the related notes.
Each Trust Series’ investment objective is for the daily percentage change in the net asset value (“NAV”) per share to reflect the daily percentage changes of the Applicable Index, less the Trust Series’ expenses. Each Trust Series seeks to achieve its investment objective by investing in a combination of Futures Contracts and Other Commodity-Related Investments such that the daily changes in its NAV, measured in percentage terms, will closely track the changes in the daily price of the Applicable Index, also measured in percentage terms. Each Trust Series’ investment strategy is designed to provide investors with a cost-effective way to invest indirectly in various commodities and to hedge against movements in the spot price of applicable commodities. An investment in a Trust Series therefore, involves investment risk and correlation risk, or the risk that investors purchasing shares to hedge against movements in the price of commodities will have an efficient hedge only if the return from their shares closely correlates with the return of the Applicable Index. In addition to investment risk and correlation risk, an investment in a Trust Series involves tax risks, over-the-counter risks, and other risks.
| 52 |
Investment Risk
The NAV of a Trust Series shares relates directly to the value of its assets invested in accordance with the Applicable Index and other assets held by a Trust Series and fluctuations in the prices of these assets could materially adversely affect an investment in a Trust Series’ shares.
The net assets of each Trust Series consist primarily of investments in Futures Contracts and, to a lesser extent, in Other Commodity-Related Investments. The NAV of a Trust Series’ shares relates directly to the value of these assets (less liabilities, including accrued but unpaid expenses), which in turn relates to the market price of the commodities which comprise the Applicable Index.
Economic conditions. The demand for commodities, in general, correlates closely with general economic growth rates. The occurrence of recessions or other periods of low or negative economic growth will typically have a direct adverse impact on commodity prices. Other factors that affect general economic conditions in the world or in a major region, such as changes in population growth rates, periods of civil unrest, government austerity programs, or currency exchange rate fluctuations, can also impact the demand for commodities. Sovereign debt downgrades, defaults, inability to access debt markets due to credit or legal constraints, liquidity crises, the breakup or restructuring of fiscal, monetary, or political systems such as the European Union, and other events or conditions that impair the functioning of financial markets and institutions also may adversely impact the demand for commodities.
Other demand-related factors. Other factors may affect the demand for certain commodities and therefore their price. For example, with respect to energy commodities, such factors may include technological improvements in energy efficiency; seasonal weather patterns, which affect the demand for commodities associated with heating and cooling; increased competitiveness of alternative energy sources that have so far generally not been competitive with such commodity without the benefit of government subsidies or mandates; and changes in technology or consumer preferences that alter fuel choices, such as toward alternative fueled vehicles. With respect to agricultural commodities, changes in consumer preference may lead to demand for a commodity such as grains.
Other supply-related factors. Commodities prices also vary depending on a number of factors affecting supply. For example, increased supply from the development of hybrid crops (such as corn and soybeans) and technologies for efficient farming tends to reduce prices in such commodity to the extent such supply increases are not offset by commensurate growth in demand. Similarly, increases in industry manufacturing capacity may impact the supply of a particular crop. World food supply levels can also be affected by factors that reduce available supplies, such as embargoes, the occurrence of wars, hostile actions, natural disasters, disruptions in competitors’ operations, or unexpected unavailability of distribution channels that may disrupt supplies. Technological change can also alter the relative costs for companies to produce, and process and distribute a commodity, which in turn may affect the supply of and demand of such commodity.
Other market factors. The supply of and demand for agricultural and other commodities may also be impacted by changes in interest rates, inflation, and other local or regional market conditions.
Correlation Risk
Investors purchasing shares to hedge against movements in the price of commodities will have an efficient hedge only if the return from their shares closely correlates with the return from the Applicable Index, which in turn, correlates with the price of commodities that comprise the Applicable Index. Investing in shares of a Trust Series for hedging purposes involves the following risks:
| · | The market price at which the investor buys or sells shares may be significantly more or less than NAV. |
| · | Daily percentage changes in NAV may not closely correlate with daily percentage changes in the price of the Applicable Benchmark. |
| · | Daily percentage changes in the prices of the Applicable Benchmark may not closely correlate with daily percentage changes in the price of the commodities that comprise the Applicable Index. |
| 53 |
The market price at which investors buy or sell shares may be significantly more or less than NAV.
Each Trust Series’ NAV per share will change throughout the day as fluctuations occur in the market value of such Trust Series’ portfolio investments. The public trading price at which an investor buys or sells shares during the day from their broker may be different from the NAV of the shares. Price differences may relate primarily to supply and demand forces at work in the secondary trading market for shares that are closely related to, but not identical to, the same forces influencing the prices of the commodities comprising the Applicable Index and the Applicable Index at any point in time. USCF expects that exploitation of certain arbitrage opportunities by Authorized Participants and their clients and customers will tend to cause the public trading price to track NAV per share closely over time, but there can be no assurance of that.
The NAV of a Trust Series’ shares may also be influenced by non-concurrent trading hours between the NYSE Arca and the various futures exchanges on which a commodity comprising the Applicable Index is traded. While the shares trade on the NYSE Arca from 9:30 a.m. to 4:00 p.m. Eastern Time, the trading hours for the futures exchanges on commodities trade may not necessarily coincide during all of this time. For example, while the shares trade on the NYSE Arca until 4:00 p.m. Eastern Time, liquidity in the global light sweet crude market will be reduced after the close of the NYMEX at 2:30 p.m. Eastern Time. As a result, during periods when the NYSE Arca is open and the futures exchanges on which sweet, light crude oil is traded are closed, trading spreads and the resulting premium or discount on the shares may widen and, therefore, increase the difference between the price of the shares and the NAV of the shares.
Daily percentage changes in a Trust Series’ NAV may not correlate with daily percentage changes in the price of the Applicable Index.
It is possible that the daily percentage changes in a Trust Series’ NAV per share may not closely correlate to daily percentage changes in the price of the Applicable Index. Non-correlation may be attributable to disruptions in the market for a particular commodity, the imposition of position or accountability limits by regulators or exchanges, or other extraordinary circumstances. As a Trust Series approaches or reaches position limits with respect to a Benchmark Component Futures Contract or other Futures Contracts or in view of market conditions, a Trust Series may begin investing in Other Commodity-Related Investments. In addition, a Trust Series is not able to replicate exactly the changes in the price of the Applicable Index because the total return generated by a Trust Series is reduced by expenses and transaction costs, including those incurred in connection with a Trust Series’ trading activities, and increased by interest income from a Trust Series’ holdings of Treasury securities. Tracking the Applicable Index requires trading of a Trust Series’ portfolio with a view to tracking the Applicable Index over time and is dependent upon the skills of USCF and its trading principals, among other factors.
Daily percentage changes in the price of the Benchmark Component Futures Contract may not correlate with daily percentage changes in the spot price of the corresponding commodity.
The correlation between changes in prices of a Benchmark Component Futures Contract and the spot price of the corresponding commodity may at times be only approximate. The degree of imperfection of correlation depends upon circumstances such as variations in the speculative commodities market, supply of and demand for Futures Contracts (including the Benchmark Component Futures Contract) and Other Commodity-Related Investments, and technical influences in futures trading.
| 54 |
The price relationship between each Applicable Index at any point in time and the Futures Contracts that will become the Applicable Benchmark Component Futures Contracts on the next rebalancing date will vary and may impact both a Trust Series’ total return and the degree to which its total return tracks that of commodity price indices.
The design of each Applicable Index is such that every month it is made up of different Applicable Benchmark Component Futures Contracts, and a Trust Series’ investment must be rebalanced on an ongoing basis to reflect the changing composition of the Applicable Index. In the event of a commodity futures market where near month contracts to expire trade at a higher price than next month contracts to expire, a situation referred to as “backwardation,” then absent the impact of the overall movement in commodity prices, the value of the Applicable Index would tend to rise as it approaches expiration. As a result, a Trust Series may benefit because it would be selling more expensive contracts and buying less expensive ones on an ongoing basis. Conversely, in the event of a commodity futures market where near month contracts trade at a lower price than next month contracts, a situation referred to as “contango,” then absent the impact of the overall movement in commodity prices, the value of the Applicable Index would tend to decline as it approaches expiration. As a result, a Trust Series’ total return may be lower than might otherwise be the case because it would be selling less expensive contracts and buying more expensive ones. The impact of backwardation and contango may cause the total return of a Trust Series to vary significantly from the total return of other price references, such as the spot price of the commodities comprising the Applicable Index. In the event of a prolonged period of contango, and absent the impact of rising or falling commodity prices, this could have a significant negative impact on a Trust Series’ NAV and total return.
Accountability levels, position limits, and daily price fluctuation limits set by the exchanges have the potential to cause tracking error, which could cause the price of shares to substantially vary from the Applicable Index.
Designated contract markets, such as the NYMEX and ICE Futures, have established accountability levels and position limits on the maximum net long or net short futures contracts in commodity interests that any person or group of persons under common trading control (other than as a hedge, which an investment by a Trust Series is not) may hold, own or control. In addition to accountability levels and position limits, the NYMEX and ICE Futures also set daily price fluctuation limits on futures contracts. The daily price fluctuation limit establishes the maximum amount that the price of a futures contract may vary either up or down from the previous day’s settlement price. Once the daily price fluctuation limit has been reached in a particular futures contract, no trades may be made at a price beyond that limit.
On November 5, 2013, the CFTC proposed a rulemaking that would establish specific limits on speculative positions in 28 physical commodity futures and option contracts as well as swaps that are economically equivalent to such contracts in the agriculture, energy and metals markets (the “Position Limit Rules”). On the same date, the CFTC proposed another rule addressing the circumstances under which market participants would be required to aggregate their positions with other persons under common ownership or control (the “Proposed Aggregation Requirements”). Specifically, the Position Limit Rules, among other things: identify which contracts are subject to speculative position limits; set thresholds that restrict the number of speculative positions that a person may hold in a spot month, individual month, and all months combined; create an exemption for positions that constitute bona fide hedging transactions; impose responsibilities on DCMs and SEFs to establish position limits or, in some cases, position accountability rules; and apply to both futures and swaps across four relevant venues – OTC, DCMs, SEFs as well as non-U.S. located trading platforms.
Until such time as the Position Limit Rules are adopted, the regulatory architecture in effect prior to the adoption of the Position Limit Rules will govern transactions in commodities and related derivatives (collectively, “Referenced Contracts”). Under that system, the CFTC enforces federal limits on speculation in agricultural products (e.g., corn, wheat and soy), while futures exchanges enforce position limits and accountability levels for agricultural and certain energy products (e.g., oil and natural gas). As a result, a Trust Series may be limited with respect to the size of its investments in a Futures Contracts and Other Commodity-Related Investment subject to these limits. Finally, subject to certain narrow exceptions, the Position Limit Rules require the aggregation, for purposes of the position limits, of all positions in the 28 Referenced Contracts held by a single entity and its affiliates, regardless of whether such position existed on U.S. futures exchanges, non-U.S. futures exchanges, in cleared swaps or in over-the-counter swaps. Under the CFTC’s existing position limits requirements and the Position Limit Rules, a market participant is generally required to aggregate all positions for which that participant controls the trading decisions with all positions for which that participant has a ten percent (10%) or greater ownership interest in an account or position, as well as the positions of two or more persons acting pursuant to an express or implied agreement or understanding. At this time, it is unclear how the Proposed Aggregation Requirements may affect a Trust Series, but it may be substantial and adverse. By way of example, the Proposed Aggregation Requirements in combination with the Position Limit Rules may negatively impact the ability of a Trust Series to meet its investment objectives through limits that may inhibit USCF’s ability to sell additional Creation Baskets of a Trust Series.
All of these limits may potentially cause a tracking error between the price of a Trust Series’ shares and the Applicable Index. This may in turn prevent investors from being able to effectively use a Trust Series as a way to hedge against commodity-related losses or as a way to indirectly invest in a commodity.
| 55 |
None of the Trust Series have limited the size of their offering and each Trust Series is committed to utilizing substantially all of its proceeds to purchase Futures Contracts and Other Commodity-Related Investments. If a Trust Series encounters accountability levels, position limits, or price fluctuation limits for Futures Contracts on the NYMEX or ICE Futures, it may then, if permitted under applicable regulatory requirements, purchase Futures Contracts on other exchanges that trade the listed applicable commodity futures. In addition, if a Trust Series exceeds accountability levels on either the NYMEX or ICE Futures and is required by such exchanges to reduce its holdings, such reduction could potentially cause a tracking error between the price of a Trust Series’ shares and the Applicable Index.
Tax Risk
An investor’s tax liability may exceed the amount of distributions, if any, on its shares.
Cash or property will be distributed at the sole discretion of USCF. USCF has not and does not currently intend to make cash or other distributions with respect to shares. Investors will be required to pay U.S. federal income tax and, in some cases, state, local, or foreign income tax, on their allocable share of a Trust Series’ taxable income, without regard to whether they receive distributions or the amount of any distributions. Therefore, the tax liability of an investor with respect to its shares may exceed the amount of cash or value of property (if any) distributed.
An investor’s allocable share of taxable income or loss may differ from its economic income or loss on its shares.
Due to the application of the assumptions and conventions applied by a Trust Series in making allocations for tax purposes and other factors, an investor’s allocable share of a Trust Series’ income, gain, deduction or loss may be different than its economic profit or loss from its shares for a taxable year. This difference could be temporary or permanent and, if permanent, could result in it being taxed on amounts in excess of its economic income.
Items of income, gain, deduction, loss and credit with respect to shares could be reallocated if the U.S. Internal Revenue Service (“IRS”) does not accept the assumptions and conventions applied by a Trust Series in allocating those items, with potential adverse consequences for an investor.
The U.S. tax rules pertaining to entities taxed as partnerships are complex and their application to large, publicly traded entities such as the Trust Series’ is in many respects uncertain. The Trust Series apply certain assumptions and conventions in an attempt to comply with the intent of the applicable rules and to report taxable income, gains, deductions, losses and credits in a manner that properly reflects shareholders’ economic gains and losses. These assumptions and conventions may not fully comply with all aspects of the Internal Revenue Code (the “Code”) and applicable Treasury Regulations, however, and it is possible that the IRS will successfully challenge a Trust Series’ allocation methods and require a Trust Series to reallocate items of income, gain, deduction, loss or credit in a manner that adversely affects investors. If this occurs, investors may be required to file an amended tax return and to pay additional taxes plus deficiency interest.
Each Trust Series could be treated as a corporation for federal income tax purposes, which may substantially reduce the value of the shares.
The Trust, on behalf of each Trust Series, has received an opinion of counsel that, under current U.S. federal income tax laws, each Trust Series will be treated as a partnership that is not taxable as a corporation for U.S. federal income tax purposes, provided that (i) at least 90 percent of the Trust Series’ annual gross income consists of “qualifying income” as defined in the Code, (ii) the Trust and each Trust Series is organized and operated in accordance with its governing agreements and applicable law and (iii) the Trust and each Trust Series does not elect to be taxed as a corporation for federal income tax purposes. Although USCF anticipates that each Trust Series has satisfied and will continue to satisfy the “qualifying income” requirement for all of its taxable years, that result cannot be assured. No Trust Series has requested and nor will any Trust Series request any ruling from the IRS with respect to its classification as a partnership not taxable as a corporation for federal income tax purposes. If the IRS were to successfully assert that a Trust Series is taxable as a corporation for federal income tax purposes in any taxable year, rather than passing through its income, gains, losses and deductions proportionately to shareholders, the Trust Series would be subject to tax on its net income for the year at corporate tax rates. In addition, although USCF does not currently intend to make distributions with respect to shares, any distributions would be taxable to Shareholders as dividend income. Taxation of the Trust and each Trust Series as a corporation could materially reduce the after-tax return on an investment in shares and could substantially reduce the value of the shares.
| 56 |
The Trust is organized as a Delaware statutory trust, but each Trust Series is taxed as a limited partnership in accordance with the provisions of the Trust Agreement and applicable state law, and therefore, each Trust Series has a more complex tax treatment than traditional mutual funds.
The Trust is organized as a Delaware statutory trust, but each Trust Series is taxed as a limited partnership in accordance with the provisions of the Trust Agreement and applicable state law. No U.S. federal income tax is paid by any Trust Series on its income. Instead, each Trust Series will furnish shareholders each year with tax information on IRS Schedule K-1 (Form 1065) and each U.S. shareholder is required to report on its U.S. federal income tax return its allocable share of the income, gain, loss and deduction of each Trust Series. This must be reported without regard to the amount (if any) of cash or property the shareholder receives as a distribution from an applicable Trust Series during the taxable year. A shareholder, therefore, may be allocated income or gain by a Trust Series but receive no cash distribution with which to pay the tax liability resulting from the allocation, or may receive a distribution that is insufficient to pay such liability.
Over-the-Counter Contract Risk
Currently, over-the-counter transactions are subject to changing regulation.
A portion of each Trust Series’ assets may be used to trade over-the-counter Commodity Interests, such as forward contracts or swap or spot contracts. Over-the-counter contracts are typically contracts traded on a principal-to-principal, non-cleared basis through dealer markets that are dominated by major money center and investment banks and other institutions. The markets for over-the-counter contracts rely upon the integrity of market participants in lieu of the additional regulation imposed by the CFTC on participants in the futures markets. While certain regulations adopted over the past two years are intended to provide additional protections to participants in the OTC market, the current regulation of the over-the-counter contracts could expose a Trust Series in certain circumstances to significant losses in the event of trading abuses or financial failure by participants. As a result of such regulations, if the Trust on behalf of a Trust Series, enters into or has entered into certain interest rate and credit default swaps, such swaps will be required to be centrally cleared. Determination on other types of swaps are expected in the future, and, when finalized, could require a Trust Series to centrally clear certain over-the-counter instruments presently entered into and settled on a bi-lateral basis. See “Item 1. Business – Regulation” for a discussion of how the OTC market will be subject to much more extensive regulatory oversight.
Each Trust Series will be subject to credit risk with respect to counterparties to over-the-counter contracts entered into by the Trust on behalf of a Trust Series or held by special purpose or structured vehicles.
Each Trust Series faces the risk of non-performance by the counterparties to the over-the-counter contracts. Unlike in futures contracts, the counterparty to these contracts is generally a single bank or other financial institution, rather than a clearing organization backed by a group of financial institutions. As a result, there will be greater counterparty credit risk in these transactions. A counterparty may not be able to meet its obligations to a Trust Series, in which case the Trust Series could suffer significant losses on these contracts.
If a counterparty becomes bankrupt or otherwise fails to perform its obligations due to financial difficulties, a Trust Series may experience significant delays in obtaining any recovery in a bankruptcy or other reorganization proceeding. The Trust on behalf of a Trust Series may obtain only limited recovery or may obtain no recovery in such circumstances.
Valuing over-the-counter derivatives may be less certain that actively traded financial instruments.
In general, valuing over-the-counter derivatives is less certain than valuing actively traded financial instruments such as exchange traded futures contracts and securities or cleared swaps because the price and terms on which such over-the-counter derivatives are entered into or can be terminated are individually negotiated, and those prices and terms may not reflect the best price or terms available from other sources. In addition, while market makers and dealers generally quote indicative prices or terms for entering into or terminating over-the-counter contracts, they typically are not contractually obligated to do so, particularly if they are not a party to the transaction. As a result, it may be difficult to obtain an independent value for an outstanding over-the-counter derivatives transaction.
| 57 |
Other Risks
Certain of a Trust Series’ investments could be illiquid, which could cause large losses to investors at any time or from time to time.
Futures positions cannot always be liquidated at the desired price. It is difficult to execute a trade at a specific price when there is a relatively small volume of buy and sell orders in a market. A market disruption, such as a foreign government taking political actions that disrupt the market for its currency, its crude oil production or exports, or another major export, can also make it difficult to liquidate a position. Because both Futures Contracts and Other Commodity-Related Investments may be illiquid, a Trust Series’ Commodity Interests may be more difficult to liquidate at favorable prices in periods of illiquid markets and losses may be incurred during the period in which positions are being liquidated. The large size of the positions that a Trust Series may acquire increases the risk of illiquidity both by making its positions more difficult to liquidate and by potentially increasing losses while trying to do so.
Over-the-counter contracts that are not subject to clearing may be even less marketable than futures contracts because they are not traded on an exchange, do not have uniform terms and conditions, and are entered into based upon the creditworthiness of the parties and the availability of credit support, such as collateral, and in general, they are not transferable without the consent of the counterparty. These conditions make such contracts less liquid than standardized futures contracts traded on a commodities exchange and could adversely impact a Trust Series’ ability to realize the full value of such contracts. In addition, even if collateral is used to reduce counterparty credit risk, sudden changes in the value of over-the-counter transactions may leave a party open to financial risk due to a counterparty default since the collateral held may not cover a party’s exposure on the transaction in such situations.
Each Trust Series is not actively managed and tracks the Applicable Index during periods in which the price of the Benchmark Component Futures Contracts are flat or declining, as well as when the price is rising.
Each Trust Series is not actively managed by conventional methods. Accordingly, if a Trust Series’ investments in Related Interests are declining in value, the Trust Series will not close out such positions except in connection with paying the proceeds to an Authorized Participant upon the redemption of basket or closing out futures positions in connection with the monthly change in the Benchmark Component Futures Contracts. USCF will seek to cause the NAV of each Trust Series’ shares to track the Applicable Index during periods in which the price is flat or declining as well as when the price is rising.
The NYSE Arca may halt trading in a Trust Series’ shares, which would adversely impact an investor’s ability to sell shares.
As of the date of this Annual Report on Form 10-K, each Trust Series’ shares are listed for trading on the NYSE Arca under the market symbols “USCI”, “CPER” and “USAG” and “USMI.” Trading in shares may be halted due to market conditions or, in light of NYSE Arca rules and procedures, for reasons that, in the view of the NYSE Arca, make trading in shares inadvisable. In addition, trading is subject to trading halts caused by extraordinary market volatility pursuant to “circuit breaker” rules that require trading to be halted for a specified period based on a specified market decline. Additionally, there can be no assurance that the requirements necessary to maintain the listing of a Trust Series’ shares will continue to be met or will remain unchanged.
The lack of an active trading market for a Trust Series’ shares may result in losses on an investor’s investment in a Trust Series at the time the investor sells the shares.
Although each Trust Series’ shares are listed and traded on the NYSE Arca, there can be no guarantee that an active trading market for the shares will be maintained. If an investor needs to sell shares at a time when no active trading market for them exists, the price the investor receives upon sale of the shares, assuming they were able to be sold, likely would be lower than if an active market existed.
| 58 |
USCF is leanly staffed and relies heavily on key personnel to manage the Trust, each Trust Series and other funds.
USCF was formed to be the sponsor and manager of investment vehicles such as the Trust and each Trust Series and has been managing such investment vehicles since April 2006. In managing and directing the day-to-day activities and affairs of the Trust and each Trust Series, USCF relies heavily on Messrs. Nicholas D. Gerber, Howard Mah and John Hyland. On October 13, 2014, Mr. Hyland tendered his resignation to USCF effective May 1, 2015. In order to ensure an orderly transition, Mr. Hyland will remain as the Chief Investment Officer of USCF until May 1, 2015. On January 14, 2015, Mr. Mah tendered his resignation to USCF to be effective no later than July 15, 2015. Due to the resignations of Messrs. Hyland and Mah, Mr. Gerber has assumed a more active role in the day-to-day activities of USCF, the Trust, each Trust Series and the Related Public Funds, as well as USCF Advisers LLC, USCF ETF Trust and its series the Stock Split Index Fund (USCF Advisers LLC, the USCF ETF Trust and its series the Stock Split Index Fund are affiliated companies of USCF and the Related Public Funds). On January 26, 2015, Mr. Gerber became the Chief Executive Officer, President and Secretary of Concierge Technologies, Inc. (“Concierge”), a company unaffiliated with USCF, other than through ownership by common control. Concierge is a publicly traded company whose stock is listed under the ticker symbol “CNGC.” None of the employees of USCF are employees of Concierge. The management of USCF intends to find replacements for Messrs. Hyland and Mah prior to their departure. However, there is a risk that if suitable replacements for Messrs. Hyland and Mah are not found prior to Mr. Hyland’s or Mr. Mah’s departure, such departures may have a material adverse effect on the management, operations and/or financial results of the Trust and each Trust Series. The potential magnitude of such an adverse impact would be greater if Mr. Gerber’s increased responsibilities, as a result of his new position with Concierge made it more difficult for him to adequately assume directing the day-to-day activities of USCF, the Trust, each Trust Series and the Related Public Funds particularly if suitable replacements for Messrs. Hyland and Mah are not found.
SummerHaven is leanly staffed and relies heavily on key personnel to manage advisory activities.
SummerHaven is leanly staffed and relies heavily on key personnel to manage advisory activities. In providing trading advisory services to each Trust Series with respect to its Applicable Index, SummerHaven relies heavily on Messrs. Kurt Nelson and Ashraf Rizvi and Dr. K. Geert Rouwenhorst. Messrs. Nelson and Rizvi, and Dr. Rouwenhorst intend to allocate their time to managing the assets of each Trust Series in a manner that they deem appropriate. If such key personnel of SummerHaven were to leave or be unable to carry out their present responsibilities, it may have an adverse effect on the management of SummerHaven.
The Fifth Amended and Restated Limited Liability Company Agreement of USCF (the “LLC Agreement”) provides limited authority to the Non-Management Directors, and any Director of USCF may be removed by USCF’s parent company, which is a closely-held private company where the majority of shares has historically been voted by one person.
USCF’s Board of Directors currently consists of three Management Directors, each of whom are shareholders of USCF’s parent, Wainwright Holdings, Inc. (“Wainwright”), and three Non-Management Directors, each of whom are considered independent for purposes of applicable NYSE Arca and SEC rules. Under USCF’s LLC Agreement, the Non-Management Directors have only such authority as the Management Directors expressly confer upon them, which means that the Non-Management Directors may have less authority to control the actions of the Management Directors than is typically the case with the independent members of a company’s Board of Directors. In addition, any Director may be removed by written consent of Wainwright, which is the sole member of USCF. Wainwright is a privately held company in which the majority of shares are held by or on behalf of Nicholas D. Gerber and his immediate family members (the “Gerber Family”). Historically, shares of Wainwright have been voted by, and on behalf of, the Gerber Family by Nicholas D. Gerber, and it is anticipated that such trend will continue in the future. Accordingly, although USCF is governed by the USCF Board of Directors, which consists of both Management Directors and Non-Management Directors, pursuant to the LLC Agreement, it is possible for Mr. Gerber to exercise his control of Wainwright to effect the removal of any Director (including the Non-Management Directors which comprise the Audit Committee) and to replace that Director with another Director. Having control in one person could have a negative impact on USCF and each Trust Series, including their regulatory obligations.
There is a risk that a Trust Series will not earn trading gains sufficient to compensate for the fees and expenses that it must pay and as such a Trust Series may not earn any profit.
Each Trust Series pays brokerage charges of approximately 0.10% of average total net assets based on brokerage fees of $3.50 per buy or sell, management fees of 0.95% of NAV on its average net assets (before any applicable voluntary or contractual expense waivers), and over-the-counter spreads and extraordinary expenses (e.g., subsequent offering expenses, other expenses not in the ordinary course of business, including the indemnification of any person against liabilities and obligations to the extent permitted by law and required under the Trust Agreement and under agreements entered into by USCF on each Trust Series’ behalf and the bringing and defending of actions at law or in equity and otherwise engaging in the conduct of litigation and the incurring of legal expenses and the settlement of claims and litigation) that cannot be quantified.
These fees and expenses must be paid in all cases regardless of whether each Trust Series’ activities are profitable. Accordingly, each Trust Series must earn trading gains sufficient to compensate for these fees and expenses before it can earn any profit.
| 59 |
Fewer representative commodities may result in greater Applicable Index volatility.
Each Applicable Index is concentrated in terms of the number of commodities represented. Investors should be aware that other commodities indices are more diversified in terms of both the number and variety of commodities included. Concentration in fewer commodities may result in a greater degree of volatility in an Applicable Index and the NAV of a Trust Series which tracks an Applicable Index under specific market conditions and over time.
Regulation of the commodity interests and energy markets is extensive and constantly changing; future regulatory developments are impossible to predict but may significantly and adversely affect a Trust Series.
The futures markets are subject to comprehensive statutes, regulations, and margin requirements. In addition, the CFTC and futures exchanges are authorized to take extraordinary actions in the event of a market emergency, including, for example, the retroactive implementation of speculative position limits or higher margin requirements, the establishment of daily price limits and the suspension of trading. Regulation of commodity interest transactions in the United States is a rapidly changing area of law and is subject to ongoing modification by governmental and judicial action. Considerable regulatory attention has been focused on non-traditional investment pools that are publicly distributed in the United States. In addition, various national governments outside of the United States have expressed concern regarding the disruptive effects of speculative trading in the energy markets and the need to regulate the derivatives markets in general. The effect of any future regulatory change on a Trust Series is impossible to predict, but it could be substantial and adverse. For a more detailed discussion of the regulations to be imposed by the CFTC and the SEC and the potential impacts thereof on a Trust Series, please see “Item 1. Business – Regulation” in this annual report on Form 10-K.
An investment in a Trust Series may provide little or no diversification benefits. Thus, in a declining market, a Trust Series may have no gains to offset losses from other investments, and an investor may suffer losses on an investment in such Trust Series while incurring losses with respect to other asset classes.
Historically, Futures Contracts and Other Commodity-Related Investments have generally been non-correlated to the performance of other asset classes such as stocks and bonds. Non-correlation means that there is a low statistically valid relationship between the performance of futures and other commodity interest transactions, on the one hand, and stocks or bonds, on the other hand.
However, there can be no assurance that such non-correlation will continue during future periods. If, contrary to historic patterns, a Trust Series’ performance were to move in the same general direction as the financial markets, investors will obtain little or no diversification benefits from an investment in such Trust Series’ shares. In such a case, a Trust Series may have no gains to offset losses from other investments, and investors may suffer losses on their investment in such Trust Series at the same time they incur losses with respect to other investments.
Variables such as drought, floods, weather, embargoes, tariffs and other political events may have a larger impact on commodity prices and commodity-linked instruments, including Futures Contracts and Other Commodity-Related Investments, than on traditional securities. These additional variables may create additional investment risks that subject a Trust Series’ investments to greater volatility than investments in traditional securities.
Non-correlation should not be confused with negative correlation, where the performance of two asset classes would be opposite of each other. There is no historical evidence that the spot price of a commodity and prices of other financial assets, such as stocks and bonds, are negatively correlated. In the absence of negative correlation, a Trust Series cannot be expected to be automatically profitable during unfavorable periods for the stock market, or vice versa.
| 60 |
The Trust is not a registered investment company so shareholders do not have the protections of the Investment Company Act of 1940, as amended (the “1940 Act”).
The Trust is not an investment company subject to the 1940 Act. Accordingly, investors do not have the protections afforded by that statute, which, for example, requires investment companies to have a majority of disinterested directors and regulates the relationship between the investment company and its investment manager.
Trading in international markets could expose a Trust Series to credit and regulatory risk.
Each Trust Series invests primarily in Futures Contracts, a significant portion of which are traded on United States exchanges, including the NYMEX. However, a portion of a Trust Series’ trades may take place on markets and exchanges outside the United States. Some non-U.S. markets present risks because they are not subject to the same degree of regulation as their U.S. counterparts. Trading in non-U.S. markets also leaves a Trust Series susceptible to swings in the value of the local currency against the U.S. dollar. Additionally, trading on non-U.S. exchanges is subject to the risks presented by exchange controls, expropriation, increased tax burdens and exposure to local economic declines and political instability. An adverse development with respect to any of these variables could reduce the profit or increase the loss earned on trades in the affected international markets.
Each Trust Series and USCF may have conflicts of interest, which may permit them to favor their own interests to the detriment of shareholders.
Each Trust Series is subject to actual and potential inherent conflicts involving USCF, various commodity futures brokers and any Authorized Participants. USCF’s officers, directors and employees do not devote their time exclusively to a Trust Series. These persons are directors, officers or employees of other entities that may compete with each Trust Series for their services. They could have a conflict between their responsibilities to a Trust Series and to those other entities. As a result of these and other relationships, parties involved with a Trust Series have a financial incentive to act in a manner other than in the best interests of such Trust Series and the shareholders. USCF has not established any formal procedure to resolve conflicts of interest. Consequently, investors are dependent on the good faith of the respective parties subject to such conflicts of interest to resolve them equitably. Although USCF attempts to monitor these conflicts, it is extremely difficult, if not impossible, for USCF to ensure that these conflicts do not, in fact, result in adverse consequences to the shareholders.
A Trust Series may also be subject to certain conflicts with respect to the FCM, including, but not limited to, conflicts that result from receiving greater amounts of compensation from other clients, or purchasing opposite or competing positions on behalf of third party accounts traded through the FCM. In addition, USCF’s principals, officers, directors or employees may trade futures and related contracts for their own account. A conflict of interest may exist if their trades are in the same markets and at the same time as a Trust Series trades using the clearing broker to be used by such Trust Series. A potential conflict also may occur if USCF’s principals, officers, directors or employees trade their accounts more aggressively or take positions in their accounts which are opposite, or ahead of, the positions taken by a Trust Series.
The Trust Series, USCF and SummerHaven may have conflicts of interest, which may cause them to favor their own interests to the detriment of shareholders.
The Trust Series, USCF and SummerHaven may have inherent conflicts to the extent USCF and SummerHaven attempt to maintain each Trust Series’ asset size in order to preserve its fee income and this may not always be consistent with such Trust Series’ objective of having the value of its shares’ NAV track changes in the value of an Applicable Index.
USCF’s and SummerHaven’s officers, directors and employees do not devote their time exclusively to each Trust Series. For example, USCF’s directors, officers and employees act in such capacity for other entities, including the Related Public Funds, that may compete with each Trust Series for their services. They could have a conflict between their responsibilities to each Trust Series and to the Related Public Funds.
USCF has sole current authority to manage the investments and operations of each Trust Series. It has delegated management of each Trust Series’ investments in its Applicable Interests to its trading advisor, SummerHaven. This authority to manage the investments and operations of each Trust Series may allow either USCF or SummerHaven to act in a way that furthers its own interests in conflict with the best interests of investors. Shareholders have very limited voting rights, which will limit the ability to influence matters such as amending the Trust Agreement, changing a Trust Series’ basic investment objective, dissolving a Trust Series, or selling or distributing a Trust Series’ assets.
| 61 |
Shareholders have only very limited voting rights and have the power to replace USCF only under specific circumstances. Shareholders do not participate in the management of a Trust Series and do not control USCF, so they do not have any influence over basic matters that affect each Trust Series. In addition, each Trust Series could terminate at any time and cause the liquidation and potential loss of an investment and could upset the overall maturity and timing of an investment portfolio.
Shareholders have very limited voting rights with respect to each Trust Series’ affairs. Shareholders may elect a replacement sponsor only if USCF resigns voluntarily or loses its corporate charter. Shareholders are not permitted to participate in the management or control of any Trust Series or the conduct of its business. Shareholders must therefore rely upon the duties and judgment of USCF to manage each Trust Series’ affairs.
Each Trust Series may terminate at any time, regardless of whether such Trust Series has incurred losses, subject to the terms of the Trust Agreement. For example, the dissolution or resignation of USCF would cause any Trust Series to terminate unless, within 90 days of the event, shareholders holding shares representing at least 66 2/3% of the outstanding shares of all of the Trust Series elect to continue the Trust and appoint a successor sponsor. In addition, USCF may terminate any Trust Series if it determines that such Trust Series’ aggregate net assets in relation to its operating expenses make the continued operation of such Trust Series unreasonable or imprudent. However, no level of losses will require USCF to terminate a Trust Series. A Trust Series’ termination would result in the liquidation of its assets and the distribution of the proceeds thereof, first to creditors and then to the shareholders in accordance with their positive book capital account balances, after giving effect to all contributions, distributions and allocations for all periods, and each Trust Series could incur losses in liquidating its assets in connection with a termination. Termination could also negatively affect the overall maturity and timing of an investment portfolio.
A Trust Series could terminate at any time and cause the liquidation and potential loss of an investor’s investment and could upset the overall maturity and timing of an investor’s investment portfolio.
A Trust Series could terminate at any time, regardless of whether that Trust Series has incurred losses, subject to the terms of the Trust Agreement. In particular, unforeseen circumstances, including the death, adjudication of incompetence, bankruptcy, dissolution, or removal of USCF as the sponsor of the Trust could cause the Trust Series to terminate unless a successor is appointed in accordance with the Trust Agreement. However, no level of losses will require USCF to terminate a Trust Series. A Trust Series’ termination would cause the liquidation and potential loss of an investor’s investment. Termination could also negatively affect the overall maturity and timing of an investor’s investment portfolio.
The Trust Series do not expect to make cash distributions.
No Trust Series has previously made any cash distributions and intends to reinvest any realized gains in additional Commodity Interests rather than distributing cash to limited partners. Therefore, unlike mutual funds, commodity pools or other investment pools that actively manage their investments in an attempt to realize income and gains from their investing activities and distribute such income and gains to their investors, a Trust Series generally does not expect to distribute cash. An investor should not invest in a Trust Series if the investor will need cash distributions from the Trust Series to pay taxes on its share of income and gains of a Trust Series, if any, or for any other reason. Nonetheless, although a Trust Series does not intend to make cash distributions, the income earned from its investments held directly or posted as margin may reach levels that merit distribution, e.g., at levels where such income is not necessary to support its underlying investments in Commodity Interests and investors adversely react to being taxed on such income without receiving distributions that could be used to pay such tax. If this income becomes significant then cash distributions may be made.
| 62 |
An unanticipated number of redemption requests during a short period of time could have an adverse effect on a Trust Series’ NAV.
If a substantial number of requests for redemption of Redemption Baskets are received by a Trust Series during a relatively short period of time, such Trust Series may not be able to satisfy the requests from the Trust Series assets not committed to trading. As a consequence, it could be necessary to liquidate positions in a Trust Series’ trading positions before the time that the trading strategies would otherwise dictate liquidation.
Proposed Money Market Reform
On July 23, 2014, the SEC adopted final rules governing the structure and operation of money market funds, in a release adopting amendments to Rule 2a-7 under the 1940 Act. The new rules will require institutional prime money market funds to price their shares using market-based values instead of the amortized cost method (i.e., to use a “floating NAV”). In addition, all money market funds will be able, and in certain cases will be required, to impose liquidity fees and temporarily suspend redemptions during periods of market stress, subject to certain board findings. Finally, the SEC also revised certain diversification provisions of Rule 2a-7, as well as provisions relating to stress testing. Currently, each Trust Series may invest in money market funds, as well as Treasuries with a maturity date of two years or less, as an investment for assets not used for margin or collateral in the Futures Contracts. It is unclear at this time what impact of money market reform would have on such Trust Series’ ability to hedge risk, however, the imposition of a floating NAV could cause a Trust Series to limit remaining assets solely in Treasuries and cash.
The failure or bankruptcy of a clearing broker or the Trust Series’ Custodian could result in a substantial loss of the Trust Series’ assets and could impair the Trust Series in its ability to execute trades.
Under CFTC regulations, a clearing broker maintains customers’ assets in a bulk segregated account. If a clearing broker fails to do so, or even if the customers’ funds are segregated by the clearing broker but the clearing broker is unable to satisfy a substantial deficit in a customer account, the clearing broker’s other customers may be subject to risk of a substantial loss of their funds in the event of that clearing broker’s bankruptcy. In that event, the clearing broker’s customers, such as a Trust Series, are entitled to recover, even in respect of property specifically traceable to them, only a proportional share of all property available for distribution to all of that clearing broker’s customers. The bankruptcy of a clearing broker could result in the complete loss of a Trust Series’s assets posted with the clearing broker, although the majority of a Trust Series’ assets are held in Treasuries, cash and/or cash equivalents with the Custodian and would not be impacted by the bankruptcy of a clearing broker. The Trust Series may also be subject to the risk of the failure of, or delay in performance by, any exchanges and markets and their clearing organizations, if any, on which commodity interest contracts are traded.
In addition, to the extent a Trust Series’ clearing broker is required to post a Trust Series’ assets as margin to a clearinghouse, the margin will be maintained in an omnibus account containing the margin of all the clearing broker’s customers. If a Trust Series’ clearing broker defaults to a clearinghouse because of a default by one of the clearing broker’s other customers or otherwise, then the clearinghouse can look to all of the margin in the omnibus account, including margin posted by a Trust Series and any other non-defaulting customers of the clearing broker to satisfy the obligations of the clearing broker.
From time to time, clearing brokers may be subject to legal or regulatory proceedings in the ordinary course of their business. A clearing broker’s involvement in costly or time-consuming legal proceedings may divert financial resources or personnel away from the clearing broker’s trading operations, which could impair the clearing broker’s ability to successfully execute and clear a Trust Series’ trades.
In addition, the majority of a Trust Series’ assets are held in Treasuries, cash and/or cash equivalents with the Custodian. The insolvency of the Custodian could result in a complete loss of a Trust Series’ assets held by that Custodian, which, at any given time, would likely comprise a substantial portion of such Trust Series’ total assets.
| 63 |
The liability of SummerHaven is limited, and the value of the shares may be adversely affected if USCF and any Trust Series are required to indemnify SummerHaven.
Under the licensing agreement and advisory agreement between SummerHaven and USCF, neither SummerHaven and its affiliates, nor any of their respective officers, directors, shareholders, members, partners, employees and any person who controls SummerHaven is liable to USCF or any Trust Series absent willful misconduct, gross negligence, bad faith, or material breaches of applicable law or the applicable agreement on the part of SummerHaven. In addition, SummerHaven and its members, directors, officers, shareholders, employees, representatives, agents, attorneys, service providers, successors and assigns have the right to be indemnified, defended and held harmless from and against any and all claims, liabilities, obligations, judgments, causes of action, costs and expenses (including reasonable attorneys’ fees) (collectively, “Losses”) in connection with or arising out of the licensing agreement or advisory agreement, unless such Losses result from any willful misconduct, gross negligence or bad faith on the part of SummerHaven, or a material breach by SummerHaven of applicable law or the applicable agreement. Furthermore, SummerHaven will not be liable to USCF or any Trust Series for any indirect, incidental, special or consequential damages, even if SummerHaven or an authorized representative of SummerHaven has been advised of the possibility of such damages.
The liability of USCF and the Trustee are limited, and the value of the shares will be adversely affected if any Trust Series is required to indemnify the Trustee or USCF.
Under the Trust Agreement, the Trustee and USCF are not liable, and have the right to be indemnified, for any liability or expense incurred absent gross negligence or willful misconduct on the part of the Trustee or USCF or breach by USCF of the Trust Agreement, as the case may be. As a result, USCF may require the assets of any Trust Series to be sold in order to cover losses or liability suffered by it or by the Trustee. Any sale of that kind would reduce the NAV of such Trust Series and the value of its shares.
Although the shares of each Trust Series are limited liability investments, certain circumstances such as bankruptcy or indemnification of a Trust Series by a shareholder will increase the shareholder’s liability.
The shares of each Trust Series are limited liability investments; shareholders may not lose more than the amount that they invest plus any profits recognized on their investment. However, shareholders could be required, as a matter of bankruptcy law, to return to the estate of a Trust Series any distribution they received at a time when such Trust Series was in fact insolvent or in violation of its Trust Agreement. In addition, a number of states do not have “statutory trust” statutes such as the Delaware statutes under which the Trust has been formed in the State of Delaware. It is possible that a court in such state could hold that, due to the absence of any statutory provision to the contrary in such jurisdiction, the shareholders, although entitled under Delaware law to the same limitation on personal liability as stockholders in a private corporation for profit organized under the laws of the State of Delaware, are not so entitled in such state. Finally, in the event the Trust or any Trust Series is made a party to any claim, dispute, demand or litigation or otherwise incurs any liability or expense as a result of or in connection with any shareholder’s (or assignee’s) obligations or liabilities unrelated to the business of the Trust or such Trust Series, as applicable, such shareholder (or assignees cumulatively) is required under the Trust Agreement to indemnify the Trust or such Trust Series, as applicable, for all such liability and expense incurred, including attorneys’ and accountants’ fees.
Investors cannot be assured of the continuation of the agreement between SummerHaven and USCF for use of an Applicable Index, and discontinuance of an Applicable Index may be detrimental to a Trust Series.
Investors cannot be assured that the agreement between SummerHaven and USCF for use of an Applicable Index will continue for any length of time. Should the agreement between SummerHaven and USCF for use of an Applicable Index be terminated, USCF will be required to find a replacement index, which may have an adverse affect on a Trust Series.
Investors cannot be assured of SummerHaven’s continued services, and discontinuance may be detrimental to a Trust Series.
Investors cannot be assured that SummerHaven will be willing or able to continue to service each Trust Series for any length of time. SummerHaven was formed for the purpose of providing investment advisory services, and provides these services to each Trust Series on a contractual basis pursuant to a licensing agreement and an advisory agreement. If SummerHaven discontinues its activities on behalf of any Trust Series, such Trust Series may be adversely affected. If SummerHaven’s registration with the CFTC or membership in the NFA were revoked or suspended, SummerHaven would no longer be able to provide services to any Trust Series.
| 64 |
All of the Trust Series are series of the Trust and, as a result, a court could potentially conclude that the assets and liabilities of one Trust Series are not segregated from those of another Trust Series, thereby potentially exposing assets in one Trust Series to the liabilities of another Trust Series.
Each Trust Series is a series of a Delaware statutory trust and not itself a separate legal entity. The Delaware Statutory Trust Act provides that if certain provisions are included in the formation and governing documents of a statutory trust organized in series and if separate and distinct records are maintained for any series and the assets associated with that series are held in separate and distinct records and are accounted for in such separate and distinct records separately from the other assets of the statutory trust, or any series thereof, then the debts, liabilities, obligations and expenses incurred by a particular series are enforceable against the assets of such series only, and not against the assets of the statutory trust generally or any other series thereof. Conversely, none of the debts, liabilities, obligations and expenses incurred with respect to any other series thereof shall be enforceable against the assets of such series. USCF is not aware of any court case that has interpreted this Inter-Series Limitation on Liability or provided any guidance as to what is required for compliance. USCF intends to maintain separate and distinct records for each Trust Series and account for each Trust Series separately from any other Trust Series, but it is possible a court could conclude that the methods used do not satisfy the Delaware Statutory Trust Act, which would potentially expose assets in one series to the liabilities of another Trust Series.
USCF and the Trustee are not obligated to prosecute any action, suit or other proceeding in respect of any Trust Series property.
Neither USCF nor the Trustee is obligated to, although each may in its respective discretion, prosecute any action, suit or other proceeding in respect of any Trust Series property. The Trust Agreement does not confer upon shareholders the right to prosecute any such action, suit or other proceeding.
Third parties may infringe upon or otherwise violate intellectual property rights or assert that USCF has infringed or otherwise violated their intellectual property rights, which may result in significant costs and diverted attention.
It is possible that third parties might utilize a Trust Series’ intellectual property or technology, including the use of its business methods, trademarks and trading program software, without permission. USCF has a patent for each Trust Series’ business method and has registered its trademarks. The Trust Series do not currently have any proprietary software. However, if it obtains proprietary software in the future, any unauthorized use of a Trust Series’ proprietary software and other technology could also adversely affect its competitive advantage. The Trust Series may not have adequate resources to implement procedures for monitoring unauthorized uses of its patents, trademarks, proprietary software and other technology. Also, third parties may independently develop business methods, trademarks or proprietary software and other technology similar to that of USCF or claim that USCF has violated their intellectual property rights, including their copyrights, trademark rights, trade names, trade secrets and patent rights. As a result, USCF may have to litigate in the future to protect its trade secrets, determine the validity and scope of other parties’ proprietary rights, defend itself against claims that it has infringed or otherwise violated other parties’ rights, or defend itself against claims that its rights are invalid. Any litigation of this type, even if USCF is successful and regardless of the merits, may result in significant costs, divert its resources from the Trust Series, or require it to change its proprietary software and other technology or enter into royalty or licensing agreements.
| Item 1B. | Unresolved Staff Comments. |
Not applicable.
| Item 2. | Properties. |
Not applicable.
| Item 3. | Legal Proceedings. |
Although each of the Trust Series may, from time to time, be involved in litigation arising out of its operations in the normal course of business or otherwise, none of the Trust Series is currently a party to any pending material legal proceedings.
| 65 |
| Item 4. | Mine Safety Disclosures. |
Not applicable.
| Item 5. | Market for Registrant’s Common Equity, Related Stockholder Matters and Issuer Purchases of Equity Securities. |
Price Range of Shares
USCI’s shares have traded on the NYSE Arca under the symbol “USCI” since August 10, 2010. CPER’s shares have traded on the NYSE Arca under the symbol “CPER” since November 15, 2011. USAG’s shares have traded on the NYSE Arca under the symbol “USAG” since April 13, 2012. USMI’s shares have traded on the NYSE Arca under the symbol “USMI” from June 19, 2012 through March 18, 2015. The following tables set forth the range of reported high and low sales prices of the shares as reported on the NYSE Arca for the periods indicated below for each of USCI, CPER, USAG and USMI.
USCI
| High | Low | |||||||
| Fiscal year 2014 | ||||||||
| First quarter | $ | 58.92 | $ | 54.84 | ||||
| Second quarter | $ | 61.21 | $ | 58.16 | ||||
| Third quarter | $ | 60.70 | $ | 55.09 | ||||
| Fourth quarter | $ | 55.47 | $ | 48.29 | ||||
| High | Low | |||||||
| Fiscal year 2013 | ||||||||
| First quarter | $ | 60.61 | $ | 57.01 | ||||
| Second quarter | $ | 56.94 | $ | 53.50 | ||||
| Third quarter | $ | 57.40 | $ | 53.67 | ||||
| Fourth quarter | $ | 56.76 | $ | 54.86 | ||||
As of December 31, 2014, USCI had approximately 41,166 holders of shares.
CPER
| High | Low | |||||||
| Fiscal year 2014 | ||||||||
| First quarter | $ | 22.90 | $ | 19.82 | ||||
| Second quarter | $ | 21.48 | $ | 20.24 | ||||
| Third quarter | $ | 22.21 | $ | 20.30 | ||||
| Fourth quarter | $ | 20.85 | $ | 18.91 | ||||
| High | Low | |||||||
| Fiscal year 2013 | ||||||||
| First quarter | $ | 26.38 | $ | 23.62 | ||||
| Second quarter | $ | 24.00 | $ | 20.84 | ||||
| Third quarter | $ | 22.89 | $ | 20.83 | ||||
| Fourth quarter | $ | 22.90 | $ | 21.40 | ||||
As of December 31, 2014, CPER had approximately 400 holders of shares.
| 66 |
USAG
| High | Low | |||||||
| Fiscal year 2014 | ||||||||
| First quarter | $ | 26.25 | $ | 22.07 | ||||
| Second quarter | $ | 26.92 | $ | 25.00 | ||||
| Third quarter | $ | 24.76 | $ | 22.37 | ||||
| Fourth quarter | $ | 23.51 | $ | 21.84 | ||||
| High | Low | |||||||
| Fiscal year 2013 | ||||||||
| First quarter | $ | 25.60 | $ | 19.09 | ||||
| Second quarter | $ | 24.14 | $ | 23.38 | ||||
| Third quarter | $ | 24.14 | $ | 22.61 | ||||
| Fourth quarter | $ | 23.63 | $ | 22.35 | ||||
As of December 31, 2014, USAG had approximately 100 holders of shares.
USMI
| High | Low | |||||||
| Fiscal year 2014 | ||||||||
| First quarter | $ | 22.47 | $ | 20.92 | ||||
| Second quarter | $ | 23.40 | $ | 21.20 | ||||
| Third quarter | $ | 23.88 | $ | 21.05 | ||||
| Fourth quarter | $ | 22.00 | $ | 19.33 | ||||
| High | Low | |||||||
| Fiscal year 2013 | ||||||||
| First quarter | $ | 27.52 | $ | 25.13 | ||||
| Second quarter | $ | 25.70 | $ | 20.74 | ||||
| Third quarter | $ | 23.31 | $ | 20.74 | ||||
| Fourth quarter | $ | 22.25 | $ | 19.50 | ||||
As of December 31, 2014, USMI had approximately 38 holders of shares.
Dividends
None of the Trust Series has made, and does not currently intend to make, cash distributions to its shareholders.
Issuer Purchases of Equity Securities
None of the Trust Series purchases shares directly from its shareholders; however, in connection with the redemption of baskets held by Authorized Participants, USCI redeemed 39 baskets (comprising 1,950,000 shares) during the year ended December 31, 2014 and CPER redeemed 2 basket (comprising 100,000 shares) during the year ended December 31, 2014. USAG and USMI did not redeem any baskets during the year ended December 31, 2014.
| Item 6. | Selected Financial Data. |
Financial Highlights for USCI (for the years ended December 31, 2014, 2013, 2012, 2011 and 2010)
(Dollar amounts in 000’s except for per share information)
| Year ended December 31, 2014 | Year ended December 31, 2013 | Year ended December 31, 2012 | Year ended December 31, 2011 | Year ended December 31, 2010* | ||||||||||||||||
| Total assets | $ | 753,942 | $ | 513,723 | $ | 488,827 | $ | 351,492 | $ | 103,138 | ||||||||||
| Net realized and unrealized gain (loss) on futures transactions, inclusive of commissions | $ | (135,557 | ) | $ | (17,220 | ) | $ | (3,774 | ) | $ | (64,083 | ) | $ | 10,667 | ||||||
| Net income (loss) | $ | (141,838 | ) | $ | (22,367 | ) | $ | (8,099 | ) | $ | (68,101 | ) | $ | 10,521 | ||||||
| Weighted-average shares | 12,419,041 | 9,051,370 | 7,120,765 | 6,141,384 | 674,325 | |||||||||||||||
| Net income (loss) per share | $ | (7.82 | ) | $ | (2.39 | ) | $ | (0.02 | ) | $ | (5.90 | ) | $ | 14.37 | ||||||
| Net income (loss) per weighted average share | $ | (11.42 | ) | $ | (2.47 | ) | $ | (1.14 | ) | $ | (11.09 | ) | $ | 15.60 | ||||||
| Cash and cash equivalents at end of year | $ | 711,985 | $ | 474,124 | $ | 430,800 | $ | 310,492 | $ | 87,443 | ||||||||||
| * | The commencement of operations of USCI was August 10, 2010. |
| 67 |
Financial Highlights for CPER (for the years ended December 31, 2014, 2013, 2012, 2011 and 2010)
(Dollar amounts in 000’s except for per share information)
| Year ended December 31, 2014 | Year ended December 31, 2013 | Year ended December 31, 2012 | Year ended December 31, 2011* | Year ended December 31, 2010** | ||||||||||||||||
| Total assets | $ | 2,912 | $ | 2,379 | $ | 2,645 | $ | 2,462 | $ | 1 | ||||||||||
| Net realized and unrealized gain (loss) on futures transactions, inclusive of commissions | $ | (383 | ) | $ | (233 | ) | $ | 133 | $ | (49 | ) | $ | — | |||||||
| Net income (loss) | $ | (405 | ) | $ | (251 | ) | $ | 111 | $ | (53 | ) | $ | — | |||||||
| Weighted-average shares | 150,411 | 100,000 | 100,410 | 100,019 | — | |||||||||||||||
| Net income (loss) per share | $ | (3.82 | ) | $ | (2.51 | ) | $ | 0.96 | $ | (0.53 | ) | $ | — | |||||||
| Net income (loss) per weighted average share | $ | (2.69 | ) | $ | (2.51 | ) | $ | 1.11 | $ | (0.53 | ) | $ | — | |||||||
| Cash and cash equivalents at end of year | $ | 2,729 | $ | 2,041 | $ | 2,109 | $ | 2,114 | $ | 1 | ||||||||||
| * | The commencement of operations of CPER was November 15, 2011. | |
| ** | The inception of CPER was November 10, 2010. | |
Financial Highlights for USAG (for the years ended December 31, 2014, 2013, 2012, 2011 and 2010)
(Dollar amounts in 000’s except for per share information)
| Year ended December 31, 2014 | Year ended December 31, 2013 | Year ended December 31, 2012* | Year ended December 31, 2011 | Year ended December 31, 2010** | ||||||||||||||||
| Total assets | $ | 2,338 | $ | 2,366 | $ | 2,638 | $ | 1 | $ | 1 | ||||||||||
| Net realized and unrealized gain (loss) on futures transactions, inclusive of commissions | $ | 36 | $ | (255 | ) | $ | 209 | $ | — | $ | — | |||||||||
| Net income (loss) | $ | 18 | $ | (277 | ) | $ | 193 | $ | — | $ | — | |||||||||
| Weighted-average shares | 100,000 | 100,000 | 113,320 | — | — | |||||||||||||||
| Net income (loss) per share | $ | 0.18 | $ | (2.77 | ) | $ | 0.56 | $ | — | $ | — | |||||||||
| Net income (loss) per weighted average share | $ | 0.18 | $ | (2.77 | ) | $ | 1.70 | $ | — | $ | — | |||||||||
| Cash and cash equivalents at end of year | $ | 2,142 | $ | 2,099 | $ | 2,000 | $ | 1 | $ | 1 | ||||||||||
| * | The commencement of operations of USAG was April 13, 2012. | |
| ** | The inception of USAG was November 10, 2010. | |
| 68 |
Financial Highlights for USMI (for the years ended December 31, 2014, 2013, 2012, 2011 and 2010)
(Dollar amounts in 000’s except for per share information)
| Year ended December 31, 2014 | Year ended December 31, 2013 | Year ended December 31, 2012* | Year ended December 31, 2011 | Year ended December 31, 2010** | ||||||||||||||||
| Total assets | $ | 2,022 | $ | 2,284 | $ | 2,710 | $ | 1 | $ | 1 | ||||||||||
| Net realized and unrealized gain (loss) on futures transactions, inclusive of commissions | $ | (198 | ) | $ | (384 | ) | $ | 194 | $ | — | $ | — | ||||||||
| Net income (loss) | $ | (216 | ) | $ | (404 | ) | $ | 183 | $ | — | $ | — | ||||||||
| Weighted-average shares | 100,000 | 107,534 | 111,239 | — | — | |||||||||||||||
| Net income (loss) per share | $ | (2.15 | ) | $ | (4.50 | ) | $ | 1.47 | $ | — | $ | — | ||||||||
| Net income (loss) per weighted average share | $ | (2.16 | ) | $ | (3.75 | ) | $ | 1.65 | $ | — | $ | — | ||||||||
| Cash and cash equivalents at end of year | $ | 1,802 | $ | 1,919 | $ | 2,137 | $ | 1 | $ | 1 | ||||||||||
| * | The commencement of operations of USMI was June 19, 2012. | |
| ** | The inception of USMI was November 10, 2010. | |
| Item 7. | Management’s Discussion and Analysis of Financial Condition and Results of Operations. |
The following discussion should be read in conjunction with the financial statements and the notes thereto of the Trust included elsewhere in this annual report on Form 10-K.
Forward-Looking Information
This annual report on Form 10-K, including this “Management’s Discussion and Analysis of Financial Condition and Results of Operations,” contains forward-looking statements regarding the plans and objectives of management for future operations. This information may involve known and unknown risks, uncertainties and other factors that may cause the Trust’s actual results, performance or achievements to be materially different from future results, performance or achievements expressed or implied by any forward-looking statements. Forward-looking statements, which involve assumptions and describe the Trust’s future plans, strategies and expectations, are generally identifiable by use of the words “may,” “will,” “should,” “expect,” “anticipate,” “estimate,” “believe,” “intend” or “project,” the negative of these words, other variations on these words or comparable terminology. These forward-looking statements are based on assumptions that may be incorrect, and the Trust cannot assure investors that the projections included in these forward-looking statements will come to pass. The Trust’s actual results could differ materially from those expressed or implied by the forward-looking statements as a result of various factors.
The Trust has based the forward-looking statements included in this annual report on Form 10-K on information available to it on the date of this annual report on Form 10-K, and the Trust assumes no obligation to update any such forward-looking statements. Although the Trust undertakes no obligation to revise or update any forward-looking statements, whether as a result of new information, future events or otherwise, investors are advised to consult any additional disclosures that the Trust may make directly to them or through reports that the Trust in the future files with the SEC, including annual reports on Form 10-K, quarterly reports on Form 10-Q and current reports on Form 8-K.
Introduction
Each Trust Series is a commodity pool that issues shares representing fractional undivided beneficial interests in such Trust Series that may be purchased and sold on the NYSE Arca. The Trust Series are series of the Trust, a Delaware statutory trust formed on December 21, 2009.
United States Commodity Index Fund
USCI invests in Futures Contracts for commodities that are traded on the Futures Exchanges and, to a lesser extent, in order to comply with regulatory requirements or in view of market conditions, Other Commodity-Related Investments. Market conditions that USCF currently anticipates could cause USCI to invest in Other Commodity Related Investments would be those allowing USCI to obtain greater liquidity or to execute transactions with more favorable pricing.
| 69 |
The investment objective of USCI is for the daily changes in percentage terms of its shares’ per share NAV to reflect the daily changes in percentage terms of the SDCI, less USCI’s expenses. USCF does not intend to operate USCI in a fashion such that its per share NAV will equal, in dollar terms, the spot prices of the commodities underlying the Benchmark Component Futures Contracts that comprise the SDCI or the prices of any particular group of Futures Contracts. The SDCI is comprised of 14 Futures Contracts that are selected on a monthly basis from a list of 27 possible Futures Contracts. USCI invests first in the current Benchmark Component Futures Contracts and other Futures Contracts intended to replicate the return on the current Benchmark Component Futures Contracts and, thereafter may hold Futures Contracts in a particular commodity other than one specified as the Benchmark Component Futures Contract, or may hold Other Commodity-Related Investments that may fail to closely track the SDCI’s total return movements. If USCI increases in size, and due to its obligations to comply with regulatory limits or due to other market pricing or liquidity factors, USCI may invest in Futures Contract months other than the designated month specified as the Benchmark Component Futures Contract, or in Other Commodity-Related Investments, which may have the effect of increasing transaction related expenses and may result in increased tracking error.
USCI seeks to achieve its investment objective by investing in Futures Contracts and Other Commodity-Related Investments such that daily changes in its per share NAV closely track the daily changes in the price of the SDCI. USCI’s positions in Commodity Interests are rebalanced on a monthly basis in order to track the changing nature of the SDCI. If Futures Contracts relating to a particular commodity remain in the SDCI from one month to the next, such Futures Contracts are rebalanced to the 7.14% target weight. Specifically, on the Selection Date, it will be determined if a current Benchmark Component Futures Contract will be replaced by a new Futures Contract in either the same or different underlying commodity as a Benchmark Component Futures Contract for the following month, in which case USCI’s investments would have to be changed accordingly. In order that USCI’s trading does not unduly cause extraordinary market movements, and to make it more difficult for third parties to profit by trading based on market movements that could be expected from changes in the Benchmark Component Futures Contracts, USCI’s investments typically are not rebalanced entirely on a single day, but rather typically rebalanced over a period of four days. After fulfilling the margin and collateral requirements with respect to its Commodity Interests, USCF invests the remainder of USCI’s proceeds from the sale of shares in Treasuries or cash equivalents, and/or merely hold such assets in cash (generally in interest-bearing accounts). As of December 31, 2014, USCI held 657 Futures Contracts on the NYMEX, 2,553 Futures Contracts on the ICE Futures, 5,487 Futures Contracts on the CBOT, 2,861 Futures Contracts on the CME, 5,001 Futures Contracts on the LME and 430 Futures Contracts on the COMEX.
United States Copper Index Fund
CPER invests in Futures Contracts for commodities that are traded on the COMEX and, to a lesser extent, in order to comply with regulatory requirements or in view of market conditions, Other Copper-Related Investments. Market conditions that USCF currently anticipates could cause CPER to invest in Other Copper-Related Investments would be those allowing CPER to obtain greater liquidity or to execute transactions with more favorable pricing.
The investment objective of CPER is for the daily changes in percentage terms of its shares’ per share NAV to reflect the daily changes in percentage terms of the SCI, less CPER’s expenses. USCF does not intend to operate CPER in a fashion such that its per share NAV will equal, in dollar terms, the spot prices of the commodities underlying the Benchmark Component Copper Futures Contracts that comprise the SCI or the prices of any particular group of Futures Contracts. The SCI is designed to reflect the performance of the investment returns form a portfolio of copper futures contracts. The SCI is owned and maintained by SHIM and calculated and published by the NYSE Arca. The SCI is comprised of either two or three Eligible Copper Futures Contracts that are selected on a monthly basis based on quantitative formulas relating to the prices of the Eligible Copper Futures Contracts developed by SHIM. The Eligible Copper Futures Contracts that at any given time make up the SCI are referred to herein as “Benchmark Component Copper Futures Contracts.”
CPER seeks to achieve its investment objective by investing to the fullest extent possible in the Benchmark Component Copper Futures Contracts. Then, if constrained by regulatory requirements or in view of market conditions, CPER will invest next in other Eligible Copper Futures Contracts, and finally to a lesser extent, in other exchange traded futures contracts that are economically identical or substantially similar to the Benchmark Component Copper Futures Contracts if one or more other Eligible Copper Futures Contracts is not available. When CPER has invested to the fullest extent possible in exchange-traded futures contracts, CPER may then invest in Other Copper-Related Investments. As of December 31, 2014, CPER held 40 Futures Contracts on the COMEX.
| 70 |
United States Agriculture Index Fund
USAG invests in Futures Contracts for commodities that are traded on ICE Futures US, ICE Futures Canada, CBOT, KCBT and the CME, and to a lesser extent, in order to comply with regulatory requirements or in view of market conditions, Other Agriculture-Related Investments. Market conditions that USCF currently anticipates could cause USAG to invest in Other Agriculture-Related Investments would be those allowing USAG to obtain greater liquidity or to execute transactions with more favorable pricing.
The investment objective of USAG is for the daily changes in percentage terms of its shares’ per share NAV to reflect the daily changes in percentage terms of the SDAI, less USAG’s expenses. USCF does not intend to operate USAG in a fashion such that its per share NAV will equal, in dollar terms, the spot prices of the commodities underlying the Benchmark Component Futures Contracts that comprise the SDAI or the prices of any particular group of Futures Contracts. The SDAI is designed to reflect the performance of a diversified group of agricultural commodities. The SDAI is comprised of 14 Eligible Agriculture Futures Contracts that are selected on a monthly basis based on quantitative formulas developed by SHIM. The Eligible Agriculture Futures Contracts that at any given time make up the SDAI are referred to herein as “Benchmark Component Agriculture Futures Contracts.”
USAG seeks to achieve its investment objective by investing to the fullest extent possible in Benchmark Component Agriculture Futures Contracts. Then, if constrained by regulatory requirements or in view of market conditions, USAG will invest next in other Eligible Agriculture Futures Contracts based on the same agricultural commodity as the futures contracts subject to such regulatory constraints or market conditions, and finally, to a lesser extent, in other exchange traded futures contracts that are economically identical or substantially similar to the Benchmark Component Agriculture Futures Contracts, if one or more Eligible Agriculture Futures Contracts is not available. When USAG has invested to the fullest extent possible in exchange-traded futures contracts, USAG may then invest in Other Agriculture-Related Interests. As of December 31, 2014, USAG held 41 Futures Contracts on the ICE Futures, 8 Futures Contracts on the CME, 2 Futures Contract on the KCBT and 31 Futures Contracts on the CBOT.
United States Metals Index Fund
On January 30, 2015, USCF as the sponsor of the Trust and its series USMI announced that its officers and members had authorized a plan to (i) liquidate USMI, (ii) terminate the continuous offering of USMI, and (iii) deregister USMI under the Exchange Act, and therefore, terminate the Trust’s obligation to include USMI on its periodic and current reports with the SEC. USCF has submitted written notice to the NYSE Arca of its decision to liquidate USMI, terminate the offering and to terminate USMI’s obligations under the Exchange Act.
Shares of USMI will cease trading on the NYSE Arca, Inc. and will be closed to purchase by investors as of the close of regular trading on the NYSE Arca on March 18, 2015 (the “Closing Date”). On March 18, 2015, USMI will cease accepting orders for Creation Baskets and Redemption Baskets. The Trust will file a post-effective amendment to the registration statement on behalf of USMI to terminate the offering of registered and unsold shares of USMI. The post-effective amendment to the registration statement will be effective on March 18, 2015.
Shareholders may sell shares of USMI prior to the Closing Date and customary brokerage charges, or Redemption Basket charges, as the case may be, may apply to these transactions. From March 18, 2015 through about March 25, 2015 (the “Liquidation Date”) there is no assurance that there will be a market for shares of USMI. Between the Closing Date and the Liquidation Date, USMI will be in the process of closing down and liquidating its portfolio. This process will result in USMI increasing its cash holdings and, as a consequence, not tracking its index, the SummerHaven Metals Index Total ReturnSM, which may not be consistent with USMI’s investment objective and strategy.
On or about the Liquidation Date, USMI will liquidate its assets and distribute cash pro rata to all remaining shareholders who have not previously redeemed or exchanged their shares. These distributions are taxable events. Once the distributions are complete, USMI will terminate.
| 71 |
USCF has determined that USMI could not continue its business and operations in an economically efficient manner due to USMI’s inability to attract sufficient assets, thereby hindering its ability to operate efficiently.
USCF intends to file a post-effective amendment on behalf of the Trust and USMI to terminate the offering of the registered and unsold shares of USMI. The NYSE Arca will file a Form 25 with the SEC to affect the withdrawal of the listing of USMI from the NYSE Arca. Delisting from the NYSE Arca will become effective 10 days after the filing date of the Form 25. Provided that USMI continues to meet the applicable legal requirements, USCF intends to file a Form 15 on behalf of the Trust and USMI with the SEC in early April 2015 to suspend the Trust’s duty to include USMI on its reports under Sections 13(a) and 15(d) of the Exchange Act. USMI expects the termination of registration will become effective 90 days after the date of the filing of the Form 15 with the SEC.
USMI invests in Futures Contracts for commodities that are traded on the NYMEX, the LME and the COMEX, and to a lesser extent, in order to comply with regulatory requirements or in view of market conditions, Other Metals-Related Investments. Market conditions that USCF currently anticipates could cause USMI to invest in Other Agriculture-Related Investments would be those allowing USMI to obtain greater liquidity or to execute transactions with more favorable pricing.
The investment objective of USMI is for the daily changes in percentage terms of its shares’ per share NAV to reflect the daily changes in percentage terms of the SDMI, less USMI’s expenses. USCF does not intend to operate USMI in a fashion such that its per share NAV will equal, in dollar terms, the spot prices of the commodities underlying the Benchmark Component Futures Contracts that comprise the SDMI or the prices of any particular group of Futures Contracts. The SDMI is designed to reflect the performance of a diversified group of metals. The SDMI is comprised of 10 Eligible Metals Futures Contracts that are selected on a monthly basis based on quantitative formulas developed by SHIM. The Eligible Metals Futures Contracts that at any given time make up the SDMI are referred to herein as “Benchmark Component Metals Futures Contracts.”
USMI seeks to achieve its investment objective by investing to the fullest extent possible in the Benchmark Component Metals Futures Contracts. Then, if constrained by regulatory requirements or in view of market conditions, USMI will invest next in other Eligible Metals Futures Contracts, and finally to a lesser extent, in other exchange traded futures contracts that are economically identical or substantially similar to the Benchmark Component Metals Futures Contracts if one or more other Eligible Metals Futures Contracts is not available. When USMI has invested to the fullest extent possible in exchange-traded futures contracts, USMI may then invest in other Eligible Metals Futures Contracts. As of December 31, 2014, USMI held 2 Futures Contracts on the NYMEX, 73 Futures Contracts on the LME and 12 Futures Contracts on the COMEX.
Regulation of Commodity Interests
The regulation of commodity interest trading in the United States and other countries is an evolving area of the law. The various statements made in this summary are subject to modification by legislative action and changes in the rules and regulations of the CFTC, the NFA, the SEC, the futures exchanges, clearing organizations and other regulatory bodies. Pending final resolution of all applicable regulatory requirements, some examples of how new rules and regulations could impact the Trust Series are discussed in “Item 1. Business” and “Item 1A. Risk Factors” in this annual report on Form 10-K.
Commodity Markets
Commodity Futures Price Movements
Year Ended December 31, 2014
As measured by the four major diversified commodity indexes listed below, commodity futures prices exhibited a downward trend during the year ended December 31, 2014. The table below compares the total returns of the SDCI to the three major diversified commodity indexes over this time period.
| SummerHaven Dynamic Commodity Index Total ReturnSM(“SDCI”)(1) | (12.10 | )% | ||
| S&P GSCI Commodity Index (GSCI®) Total Return(2) | (33.06 | )% | ||
| Bloomberg Commodity Index Total Return(2) | (17.01 | )% | ||
| Deutsche Bank Liquid Commodity Index-Optimum Yield Total ReturnTM(2) | (25.94 | )% |
(1) The inception date for the SummerHaven Dynamic Commodity Index Total ReturnSM is December 2009.
(2) Source: Bloomberg
| 72 |
The value of the SDCI as of January 1, 2014 was 1,678.73. As of December 31, 2014, the value of the SDCI was 1475.681, down approximately 12.10% over the year.
The return of approximately (12.10)% on the SDCI listed above is a hypothetical return only and could not actually be achieved by an investor holding Futures Contracts due to the impact of trading costs and other expenses. USCI’s per share NAV began the year at $56.06 and ended the year at $48.24 on December 31, 2014, a decrease of approximately 13.95% over the year. USCI’s per share NAV reached its high for the year on June 26, 2014 at $61.13 and reached its low for the year on December 31, 2014 at $48.24. See “Tracking Each Trust Series’ Benchmark” below for information about how expenses and income affect USCI’s NAV.
Copper Markets
Copper Futures Price Movements
Year Ended December 31, 2014
As measured by the two major copper indexes, copper futures prices exhibited a downward trend during the year ended December 31, 2014. The table below compares the total returns of the SCI to the Bloomberg Copper Sub index Total Return over this time period.
| SummerHaven Copper Index Total ReturnTM(“SCI”)(1) | (15.88 | )% | ||
| Bloomberg Copper Sub Index Total Return(2) | (16.55 | )% |
(1) The inception date for the SummerHaven Copper Index Total ReturnTM is November 2010.
(2) Source: Bloomberg
The value of the SCI as of January 1, 2014 was 1,114.30. As of December 31, 2014, the value of the SCI was 937.330, down approximately 15.88% over the year.
The return of approximately (15.88)% on the SCI listed above is a hypothetical return only and could not actually be achieved by an investor holding Futures Contracts due to the impact of trading costs and other expenses. CPER’s per share NAV began the year at $22.92 and ended the year at $19.10 on December 31, 2014, a decrease of approximately 16.67% over the year. CPER’s per share NAV reached its high for the year on January 2, 2014 at $22.82 and reached its low for the year on December 26, 2014 at $19.03. See “Tracking Each Trust Series’ Benchmark” for information about how expenses and income affect CPER’s NAV.
Agriculture Markets
Agriculture Futures Price Movements
Year Ended December 31, 2014
As measured by the four major agriculture indexes listed below, agriculture futures prices exhibited moderate daily swings along with an upward trend during the year ended December 31, 2014. The table below compares the total returns of the SDAI to the three major agriculture indexes over this time period.
| SummerHaven Dynamic Agriculture Index Total ReturnSM(“SDAI”)(1) | 1.78 | % | ||
| S&P GSCI® Agriculture Index Total Return(2) | (10.73 | )% | ||
| Bloomberg Agriculture Sub index Total ReturnSM(2) | (9.22 | )% | ||
| Deutsche Bank Liquid Commodity Index-Optimum Yield Agriculture ReturnTM(2) | (14.00 | )% |
(1) The inception date for the SummerHaven Dynamic Agriculture Index Total ReturnSM is September 2010.
(2) Source: Bloomberg
The value of the SDAI as of January 1, 2014 was 324.11. As of December 31, 2014, the value of the SDAI was 329.880, up approximately 1.78% over the year.
| 73 |
The return of approximately 1.78% on the SDAI listed above is a hypothetical return only and could not actually be achieved by an investor holding Futures Contracts due to the impact of trading costs and other expenses. USAG’s per share NAV began the year at $22.79 and ended the year at $22.97 on December 31, 2014, an increase of approximately 0.79% over the period. USAG’s per share NAV reached its high for the period on April 29, 2014 at $27.02 and reached its low for the period on September 25, 2014 at $22.54. See “Tracking Each Trust Series’ Benchmark” below for information about how expenses and income affect USAG’s per share NAV.
Metals Markets
Metals Futures Price Movements
Year Ended December 31, 2014
As measured by the four major metals indexes listed below, metals futures prices exhibited moderate daily swings along with a downward trend during the year ended December 31, 2014. The table below compares the total returns of the SDMI to the three major metals indexes over this time period.
| SummerHaven Metals Index Total ReturnSM(“SDMI”)(1) | (8.47 | )% | ||
| Rogers International Commodity Index®-Metals Total Return(2) | (8.74 | )% | ||
| Bloomberg Industrial Metals Sub index Total Return(2) | (6.87 | )% | ||
| Deutsche Bank Liquid Commodity Index-Optimum Yield Industrials Metals Total ReturnTM(2) | (3.70 | )% |
(1) The inception date for the SummerHaven Metals Index Total ReturnSM is September 2010.
(2) Source: Bloomberg
The value of the SDMI as of January 1, 2014 was 727.17. As of December 31, 2014, the value of the SDMI was 665.580, down approximately 8.47% over the year.
The return of approximately (8.47)% on the SDMI listed above is a hypothetical return only and could not actually be achieved by an investor holding Futures Contracts due to the impact of trading costs and other expenses. USMI’s per share NAV began the year at $21.97 and ended at $19.82 on December 31, 2014, a decrease of approximately 9.79% over the period. USMI’s per share NAV reached its high for the period on July 11, 2014 at $23.87 and reached its low for the period on December 29, 2014 at $19.80. See “Tracking Each Trust Series’ Benchmark” below for information about how expenses and income affect USMI’s per share NAV.
Valuation of Futures Contracts and the Computation of the Per Share NAV
Each Trust Series’ NAV is calculated once each NYSE Arca trading day. The per share NAV for a particular trading day is released after 4:00 p.m. New York time. Trading during the core trading session on the NYSE Arca typically closes at 4:00 p.m. New York time. The Trust Series’ Administrator uses the closing prices on the relevant Futures Exchanges of the Applicable Benchmark Component Futures Contracts (determined at the earlier of the close of such exchange or 2:30 p.m. New York time) for the contracts held on the Futures Exchanges, but calculates or determines the value of all other investments of such Trust Series using market quotations, if available, or other information customarily used to determine the fair value of such investments.
Results of Operations
On July 30, 2010, USCI received a notice of effectiveness from the SEC for its registration of 50,000,000 shares on Form S-1 with the SEC. On August 10, 2010, USCI listed its shares on the NYSE Arca under the ticker symbol “USCI.” USCI established its initial offering per share NAV by setting the price at $50.00 and issued 100,000 shares to the initial Authorized Participant, Merrill Lynch Professional Clearing Corp., in exchange for $5,000,000 in cash on August 10, 2010. USCI commenced investment operations on August 10, 2010 by purchasing Futures Contracts traded on the Futures Exchanges. In order to satisfy NYSE Arca listing standards that at least 100,000 shares be outstanding at the beginning of the trading day on the NYSE Arca, USCF purchased the initial Creation Basket from the initial Authorized Participant at the initial offering price. The $1,000 fee that would otherwise be charged to the Authorized Participant in connection with an order to create or redeem was waived in connection with the initial Creation Basket. USCF agreed not to resell the shares comprising such basket except that it may require the initial Authorized Participant to repurchase all of these shares at a per share price equal to USCI’s per share NAV within five days following written notice from USCF, subject to the conditions that: (i) on the date of repurchase, the initial Authorized Participant must immediately redeem these shares in accordance with the terms of the Authorized Participant Agreement and (ii) immediately following such redemption at least 100,000 shares of USCI remain outstanding. USCF held such initial Creation Basket until September 3, 2010, at which time the initial Authorized Participant repurchased the shares comprising such basket in accordance with the specified conditions noted above. On September 14, 2011, USCF redeemed the 20 Sponsor Shares of USCI, and on September 19, 2011, USCF purchased five shares of USCI in the open market.
| 74 |
Since its initial offering of 50,000,000 shares, USCI has not registered any subsequent offerings of its shares. As of December 31, 2014, USCI had issued 21,150,000 shares, 14,700,000 of which were outstanding. As of December 31, 2014, there were 28,850,000 shares registered but not yet issued. More shares may have been issued by USCI than are outstanding due to the redemption of shares.
In connection with the Second Amended and Restated Trust Agreement dated November 10, 2010, USMI, USAG and CPER were designated as three additional series of the Trust. Following the designation of the additional series, an initial capital contribution of $3,000 was transferred from USCF to the Trust. On November 10, 2010, the Trust transferred $1,000 to each of USMI, USAG and CPER, which was deemed a capital contribution to each series. On November 14, 2011, USCF received 40 Sponsor Shares of CPER in exchange for the previously received capital contribution, representing a beneficial interest in CPER. On December 7, 2011, USCF redeemed the 40 Sponsor Shares of CPER and purchased 40 shares of CPER in the open market. On April 13, 2012, USCF received 40 Sponsor Shares of USAG in exchange for the previously received capital contribution, representing a beneficial interest in USAG. On June 28, 2012, USCF redeemed the 40 Sponsor shares of USAG and on October 3, 2012, purchased 5 shares of USAG on the open market. On June 19, 2012, USCF received 40 Sponsor Shares of USMI in exchange for the previously received capital contribution, representing a beneficial interest in USMI. On August 27, 2012, USCF redeemed the 40 Sponsor shares of USMI and on September 4, 2013 purchased 5 shares on the open market.
CPER, USAG and USMI received notice of effectiveness from the SEC for its registration of 30,000,000 CPER shares, 20,000,000 USAG shares and 20,000,000 USMI shares on September 6, 2011. The order to permit listing CPER, USMI and USAG on the NYSE Arca was received on October 20, 2011. On November 15, 2011, CPER listed its shares on the NYSE Arca under the ticker symbol “CPER.” CPER established its initial offering per share NAV by setting the price at $25.00 and issued 100,000 shares to the initial Authorized Participant, Merrill Lynch Professional Clearing Corp., in exchange for $2,500,000 in cash on November 15, 2011. The $1,000 fee that would otherwise be charged to the Authorized Participant in connection with an order to create or redeem was waived in connection with the initial Creation Basket.
Since its initial offering of 30,000,000 shares, CPER has not registered any subsequent offerings of its shares. As of December 31, 2014, CPER had issued 300,000 shares, 150,000 of which were outstanding. As of December, 31, 2014, there were 29,700,000 shares registered but not yet issued. More shares may have been issued by CPER than are outstanding due to the redemption of shares.
On April 13, 2012, USAG listed its shares on the NYSE Arca under the ticker symbol “USAG.” USAG established its initial per share NAV by setting the price at $25.00. On April 14, 2012, USCF purchased 2 initial Creation Baskets of USAG. In accordance with applicable requirements of Regulation M under the Securities Exchange Act of 1934, no Creation Baskets were offered to Authorized Participants nor were the shares listed on the NYSE Arca until five business days had elapsed from the date of USCF’s purchase of the initial Creation Basket on April 4, 2012. The fee that would have otherwise been charged in connection with an order to create or redeem was waived in connection with the initial Creation Basket.
Since its initial offering of 20,000,000 shares, USAG has not registered any subsequent offerings of its shares. As of December 31, 2014, USAG had issued 200,000 shares, 100,000 of which were outstanding. As of December, 31, 2014, there were 19,800,000 shares registered but not yet issued. More shares may have been issued by USAG than are outstanding due to the redemption of shares.
On June 19, 2012, USMI listed its shares on the NYSE Arca under the ticker symbol “USMI.” USMI established its initial per share NAV by setting the price at $25.00. On June 11, 2012, USCF purchased two initial Creation Baskets of USMI. In accordance with applicable requirements of Regulation M under the Securities Exchange Act of 1934, no Creation Baskets were offered to Authorized Participants nor were the shares listed on the NYSE Arca until five business days had elapsed from the date of USCF’s purchase of the initial Creation Basket on June 11, 2012. The fee that would have otherwise been charged in connection with an order to create or redeem was waived in connection with the initial Creation Basket. On August 29, 2012, USCF redeemed one of two initial Creation Baskets of USMI, leaving its holdings to 50,000 shares.
| 75 |
Since its initial offering of 20,000,000 shares, USMI has not registered any subsequent offerings of its shares. As of December 31, 2014, USMI had issued 200,000 shares, 100,000 of which were outstanding. As of December, 31, 2014, there were 19,800,000 shares registered but not yet issued. More shares may have been issued by USMI than are outstanding due to the redemption of shares. On January 30, 2015, USCF as the sponsor of the Trust and its series USMI announced that its officers and members had authorized a plan to (i) liquidate USMI, (ii) terminate the continuous offering of USMI, and (iii) deregister USMI under the Exchange Act, and therefore, terminate the Trust’s obligation to include USMI on its periodic and current reports with the SEC. USCF has submitted written notice to the NYSE Arca, Inc. (“NYSE Arca”) of its decision to liquidate USMI, terminate the offering and to terminate USMI’s obligations under the Exchange Act.
Shares of USMI will cease trading on the NYSE Arca and will be closed to purchase by investors as of the close of regular trading on the NYSE Arca on March 18, 2015 (the “Closing Date”). On March 18, 2015, USMI will cease accepting orders for Creation Baskets and Redemption Baskets. The Trust will file a post-effective amendment to the registration statement on behalf of USMI to terminate the offering of registered and unsold shares of USMI. The post-effective amendment to the registration statement will be effective on March 18, 2015.
Shareholders may sell shares of USMI prior to the Closing Date and customary brokerage charges, or Redemption Basket charges, as the case may be, may apply to these transactions. From March 18, 2015 through about March 25, 2015 (the “Liquidation Date”) there is no assurance that there will be a market for shares of USMI. Between the Closing Date and the Liquidation Date, USMI will be in the process of closing down and liquidating its portfolio. This process will result in USMI increasing its cash holdings and, as a consequence, not tracking its index, the SummerHaven Metals Index Total ReturnSM, which may not be consistent with USMI’s investment objective and strategy.
On or about the Liquidation Date, USMI will liquidate its assets and distribute cash pro rata to all remaining shareholders who have not previously redeemed or exchanged their shares. These distributions are taxable events. Once the distributions are complete, USMI will terminate.
Unlike funds that are registered under the 1940 Act, shares that have been redeemed by the Trust Series cannot be resold. As a result, each Trust Series contemplates that additional offerings of its shares will be registered with the SEC in the future in anticipation of additional issuances and redemptions.
As of December 31, 2014, USCI had the following Authorized Participants: Citadel Securities LLC, Credit Suisse Securities (USA) LLC, Goldman Sachs & Company, Jefferies & Company Inc., JP Morgan Securities Inc., Merrill Lynch Professional Clearing Corp., Morgan Stanley & Co. LLC, NewEdge USA LLC, RBC Capital Markets LLC and Virtu Financial BD LLC.
As of December 31, 2014, CPER, USAG and USMI had the following Authorized Participants: Credit Suisse Securities (USA) LLC, Goldman Sachs & Company, Jefferies & Company Inc., JP Morgan Securities Inc., Merrill Lynch Professional Clearing Corp., NewEdge USA LLC, RBC Capital Markets LLC and Virtu Financial BD LLC.
| 76 |
For the Year Ended December 31, 2014 Compared to the Year Ended December 31, 2013; and for the Year Ended December 31, 2013, Compared to the Year Ended December 31, 2012
USCI
| For the Year
ended December 31, 2014 | For the Year ended December 31, 2013 | For the Year ended December 31, 2012 | ||||||||||
| Per share NAV, end of period | $ | 48.24 | $ | 56.06 | $ | 58.45 | ||||||
| Average daily total net assets | $ | 702,058,268 | $ | 509,704,914 | $ | 428,436,180 | ||||||
| Cash deposits and investments in Treasuries and money market funds | $ | 792,207,276 | $ | 494,440,076 | $ | 491,119,704 | ||||||
| Dividend and interest income earned on Treasuries, cash and/or cash equivalents | $ | 323,118 | $ | 265,555 | $ | 278,476 | ||||||
| Annualized yield based on average daily total net assets | 0.05 | % | 0.05 | % | 0.07 | % | ||||||
| Percentage of cash assets held as overnight deposits and investments in Treasuries at custodian | 89.87 | % | 95.89 | % | 87.72 | % | ||||||
| Percentage of cash assets held as investments in Treasuries and margin deposits for Futures Contracts | 10.13 | % | 4.11 | % | 12.28 | % | ||||||
| Total unrealized gain (loss) on Futures Contracts | $ | (38,267,159 | ) | $ | 10,789,747 | $ | (5,220,900 | ) | ||||
| Management fee | $ | 5,887,414 | $ | 4,842,197 | $ | 4,070,144 | ||||||
| Total fees and other expenses excluding management fees | $ | 1,394,071 | $ | 978,267 | $ | 856,041 | ||||||
| Fees and expenses related to the registration or offering of additional shares | $ | 850 | $ | 850 | $ | 800 | ||||||
| Total commissions accrued to brokers | $ | 653,625 | $ | 390,945 | $ | 310,109 | ||||||
| Total commissions as annualized percentage of average total net assets | 0.09 | % | 0.08 | % | 0.07 | % | ||||||
| Commissions accrued as a result of rebalancing | $ | 614,322 | $ | 376,294 | $ | 296,759 | ||||||
| Percentage of commissions accrued as a result of rebalancing | 93.99 | % | 96.25 | % | 95.70 | % | ||||||
| Commissions accrued as a result of creation and redemption activity | $ | 39,303 | $ | 14,651 | $ | 13,350 | ||||||
| Percentage of commissions accrued as a result of creation and redemption activity | 6.01 | % | 3.75 | % | 4.30 | % | ||||||
Portfolio Expenses. The Trust Series’ expenses consist of investment management fees, brokerage fees and commissions, certain offering costs, licensing fees, the fees and expenses of the independent directors of USCF and expenses relating to tax accounting and reporting requirements. The management fee that each Trust Series pays to USCF is calculated as a percentage of the total net assets of each Trust Series. The fee is accrued daily and paid monthly.
The decrease in the per share NAV for December 31, 2014, compared to the year ended December 31, 2013; and for the year ended December 31, 2013, compared to the year ended December 31, 2012, were primarily due to the decrease in values of the Futures Contracts held by USCI.
The increase in cash deposits and investments in Treasuries and money market funds for December 31, 2014, compared to year ended December 31, 2013; and for the year ended December 31, 2013, compared to the year ended December 31, 2012, was the result of USCI’s larger size as measured by total net assets.
The increase in dividend and interest income earned on Treasuries, cash and/or cash equivalents for December 31, 2014, compared to year ended December 31, 2013; was primarily due to USCI’s larger size as measured by total net assets. Average daily total net assets increased for December 31, 2013, compared to December 31, 2012, was similar.
The increase in total fees and expenses excluding management fees for December 31, 2014, compared to the year ended December 31, 2013; and for the year ended December 31, 2013, compared to the year ended December 31, 2012, was due to an increase in USCI’s commissions resulting from USCI’s larger size as represented by total net assets as well as the transition trades due to change of FCM.
The increase in USCI’s total commissions accrued to brokers for December 31, 2014, compared to the year ended December 31, 2013; and for the year ended December 31, 2013, compared to December 31, 2012, was primarily due to an increase in USCI’s total net assets (due to net creations) as well as an increase in the number of contracts traded due to the transition from one FCM to another.
| 77 |
CPER
| For the Year ended December 31, 2014 | For the Year ended December 31, 2013 | For the Year ended December 31, 2012 | ||||||||||
| Per share NAV, end of period | $ | 19.10 | $ | 22.92 | $ | 25.43 | ||||||
| Average daily total net assets | $ | 3,151,177 | $ | 2,296,522 | $ | 2,552,489 | ||||||
| Cash deposits and investments in Treasuries and money market funds | $ | 3,066,521 | $ | 2,166,695 | $ | 2,541,590 | ||||||
| Dividend and interest income earned on Treasuries, cash and/or cash equivalents | $ | 1,455 | $ | 1,260 | $ | 1,607 | ||||||
| Annualized yield based on average daily total net assets | 0.05 | % | 0.05 | % | 0.06 | % | ||||||
| Percentage of cash assets held as overnight deposits and investments in Treasuries at custodian | 89.01 | % | 94.19 | % | 82.98 | % | ||||||
| Percentage of cash assets held as investments in Treasuries and margin deposits for Futures Contracts | 10.99 | % | 5.81 | % | 17.02 | % | ||||||
| Total unrealized gain (loss) on Futures Contracts | $ | (197,525 | ) | $ | 130,163 | $ | 6,575 | |||||
| Management fee | $ | 20,483 | $ | 14,927 | $ | 19,823 | ||||||
| Total fees and other expenses excluding management fees | $ | 68,468 | $ | 86,632 | $ | 101,564 | ||||||
| Total amount of the expense waiver | $ | 62,989 | $ | 81,789 | $ | 96,364 | ||||||
| Expenses before allowance for the expense waiver | $ | 88,951 | $ | 101,559 | $ | 121,387 | ||||||
| Expenses after allowance for the expense waiver | $ | 25,962 | $ | 19,770 | $ | 25,023 | ||||||
| Fees and expenses related to the registration or offering of additional shares | $ | — | $ | — | $ | — | ||||||
| Total commissions accrued to brokers | $ | 1,896 | $ | 916 | $ | 956 | ||||||
| Total commissions as annualized percentage of average total net assets | 0.06 | % | 0.04 | % | 0.04 | % | ||||||
| Commissions accrued as a result of rebalancing | $ | 1,382 | $ | 916 | $ | 799 | ||||||
| Percentage of commissions accrued as a result of rebalancing | 72.89 | % | 100 | % | 83.58 | % | ||||||
| Commissions accrued as a result of creation and redemption activity | $ | 514 | $ | — | $ | 157 | ||||||
| Percentage of commissions accrued as a result of creation and redemption activity | 27.11 | % | — | % | 16.42 | % | ||||||
Portfolio Expenses. The Trust Series’ expenses consist of investment management fees, brokerage fees and commissions, certain offering costs, licensing fees, the fees and expenses of the independent directors of USCF and expenses relating to tax accounting and reporting requirements. The management fee that each Trust Series pays to USCF is calculated as a percentage of the total net assets of each Trust Series. The fee is accrued daily and paid monthly.
The decrease in the per share NAV for December 31, 2014, compared to the year ended December 31, 2013; and for the year ended December 31, 2013, compared to the year ended December 31, 2012, were primarily due to the decrease in values of the Futures Contracts held by CPER.
The increase in cash deposits and investments in Treasuries and money market funds for December 31, 2014, compared to year ended December 31, 2013, was the result of CPER’s larger size; whereas the decrease in cash deposits and investments in Treasuries and money market funds for the year ended December 31, 2013, compared to the year ended December 31, 2012, was the result of CPER’s smaller size as measured by total net assets.
The dividend and interest income earned on Treasuries, cash and/or cash equivalents for December 31, 2014, compared to year ended December 31, 2013; was similar. The dividend and interest income earned on Treasuries, cash and/or cash equivalents for December 31, 2013, compared to December 31, 2012, was similar.
The decrease in total gross fees and expenses excluding management fees for December 31, 2014, compared to the year ended December 31, 2013; and for the year ended December 31, 2013, compared to the year ended December 31, 2012, was primarily due to an decrease in certain CPER’s operating expenses.
The increase in CPER’s total commissions accrued to brokers for December 31, 2014, compared to the year ended December 31, 2013; and for the year ended December 31, 2013, compared to December 31, 2012, the slight decrease in total commissions accrued to brokers were primarily due to the total number of contracts traded as well as the transition trades due to change of FCM.
| 78 |
USAG
| For the Year ended December 31, 2014 | For the Year ended December 31, 2013 | For the Year ended December 31, 2012 | ||||||||||
| Per share NAV, end of period | $ | 22.97 | $ | 22.79 | $ | 25.56 | ||||||
| Average daily total net assets | $ | 2,441,385 | $ | 2,389,364 | $ | 2,948,838 | ||||||
| Cash deposits and investments in Treasuries and money market funds | $ | 2,365,241 | $ | 2,328,626 | $ | 2,679,845 | ||||||
| Dividend and interest income earned on Treasuries, cash and/or cash equivalents | $ | 1,176 | $ | 1,328 | $ | 1,573 | ||||||
| Annualized yield based on average daily total net assets | 0.05 | % | 0.06 | % | 0.07 | % | ||||||
| Percentage of cash assets held as overnight deposits and investments in Treasuries at custodian | 90.58 | % | 90.12 | % | 74.65 | % | ||||||
| Percentage of cash assets held as investments in Treasuries and margin deposits for Futures Contracts | 9.42 | % | 9.88 | % | 25.35 | % | ||||||
| Total unrealized gain (loss) on Futures Contracts | $ | (66,576 | ) | $ | (44,553 | ) | $ | (119,155 | ) | |||
| Management fee | $ | 17,092 | $ | 19,115 | $ | 17,492 | ||||||
| Total fees and other expenses excluding management fees | $ | 50,816 | $ | 87,824 | $ | 82,882 | ||||||
| Total amount of the expense waiver | $ | 46,339 | $ | 81,772 | $ | 76,851 | ||||||
| Expenses before allowance for the expense waiver | $ | 67,908 | $ | 106,939 | $ | 100,374 | ||||||
| Expenses after allowance for the expense waiver | $ | 21,569 | $ | 25,167 | $ | 23,523 | ||||||
| Fees and expenses related to the registration or offering of additional shares | $ | — | $ | — | $ | — | ||||||
| Total commissions accrued to brokers | $ | 2,020 | $ | 2,003 | $ | 2,632 | ||||||
| Total commissions as annualized percentage of average total net assets | 0.08 | % | 0.08 | % | 0.12 | % | ||||||
| Commissions accrued as a result of rebalancing | $ | 2,020 | $ | 2,003 | $ | 2,090 | ||||||
| Percentage of commissions accrued as a result of rebalancing | 100 | % | 100 | % | 79.41 | % | ||||||
| Commissions accrued as a result of creation and redemption activity | $ | — | $ | — | $ | 542 | ||||||
| Percentage of commissions accrued as a result of creation and redemption activity | — | % | — | % | 20.59 | % | ||||||
Portfolio Expenses. The Trust Series’ expenses consist of investment management fees, brokerage fees and commissions, certain offering costs, licensing fees, the fees and expenses of the independent directors of USCF and expenses relating to tax accounting and reporting requirements. The management fee that each Trust Series pays to USCF is calculated as a percentage of the total net assets of each Trust Series. The fee is accrued daily and paid monthly.
The slight increase in the per share NAV for USAG for December 31, 2014, compared to the year ended December 31, 2013; and decrease in the per share NAV for the year ended December 31, 2013, compared to the year ended December 31, 2012, were primarily due to an increase or decrease in values of the Futures Contracts held by USAG.
The slight increase in cash deposits and investments in Treasuries and money market funds for December 31, 2014, compared to year ended December 31, 2013, was the result of USAG’s increased size as measured by total net assets; and the decrease for the year ended December 31, 2013, compared to the year ended December 31, 2012, was the result of USAG’s smaller size as measured by total net assets.
USAG’s dividend and interest income earned on Treasuries, cash and/or cash equivalents for December 31, 2014, compared to year ended December 31, 2013; and for December 31, 2013 was similar. The dividend and interest income earned on Treasuries, cash and/or cash equivalents for December 31, 2013, compared to year ended December 31, 2012 was similar.
The decrease in gross total fees and expenses excluding management fees for December 31, 2014, compared to the year ended December 31, 2013, was primarily due to a decrease in certain of USAG’s operating expenses; and the increase in gross total fees and expenses excluding management fees for the year ended December 31, 2013, compared to the year ended December 31, 2012, was primarily due the fact that USAG had a full year of operations for year ended December 31, 2013.
USAG’s total commissions accrued to brokers for December 31, 2014, compared to the year ended December 31, 2013 remained static; and for the year ended December 31, 2013, compared to December 31, 2012, the increase was primarily a result of the higher number of contracts traded.
| 79 |
USMI
| For the Year ended December 31, 2014 | For the Year ended December 31, 2013 | For the Year ended December 31, 2012 | ||||||||||
| Per share NAV, end of period | $ | 19.82 | $ | 21.97 | $ | 26.47 | ||||||
| Average daily total net assets | $ | 2,216,973 | $ | 2,519,632 | $ | 2,849,399 | ||||||
| Cash deposits and investments in Treasuries and money market funds | $ | 2,120,591 | $ | 2,248,304 | $ | 2,605,049 | ||||||
| Dividend and interest income earned on Treasuries, cash and/or cash equivalents | $ | 1,015 | $ | 1,299 | $ | 1,270 | ||||||
| Annualized yield based on average daily total net assets | 0.05 | % | 0.05 | % | 0.08 | % | ||||||
| Percentage of cash assets held as overnight deposits and investments in Treasuries at custodian | 85.00 | % | 85.34 | % | 82.03 | % | ||||||
| Percentage of cash assets held as investments in Treasuries and margin deposits for Futures Contracts | 15.00 | % | 14.66 | % | 17.97 | % | ||||||
| Total unrealized gain (loss) on Futures Contracts | $ | (136,564 | ) | $ | (46,293 | ) | $ | 46,058 | ||||
| Management fee | $ | 14,774 | $ | 17,637 | $ | 10,681 | ||||||
| Total fees and other expenses excluding management fees | $ | 48,747 | $ | 87,302 | $ | 62,473 | ||||||
| Total amount of the expense waiver | $ | 44,985 | $ | 82,165 | $ | 59,316 | ||||||
| Expenses before allowance for the expense waiver | $ | 63,521 | $ | 104,939 | $ | 73,154 | ||||||
| Expenses after allowance for the expense waiver | $ | 18,536 | $ | 22,774 | $ | 13,838 | ||||||
| Fees and expenses related to the registration or offering of additional shares | $ | — | $ | — | $ | — | ||||||
| Total commissions accrued to brokers | $ | 826 | $ | 871 | $ | 714 | ||||||
| Total commissions as annualized percentage of average total net assets | 0.04 | % | 0.03 | % | 0.05 | % | ||||||
| Commissions accrued as a result of rebalancing | $ | 826 | $ | 774 | $ | 512 | ||||||
| Percentage of commissions accrued as a result of rebalancing | 100 | % | 88.86 | % | 71.71 | % | ||||||
| Commissions accrued as a result of creation and redemption activity | $ | — | $ | 97 | $ | 202 | ||||||
| Percentage of commissions accrued as a result of creation and redemption activity | — | % | 11.14 | % | 28.29 | % | ||||||
Portfolio Expenses. The Trust Series’ expenses consist of investment management fees, brokerage fees and commissions, certain offering costs, licensing fees, the fees and expenses of the independent directors of USCF and expenses relating to tax accounting and reporting requirements. The management fee that each Trust Series pays to USCF is calculated as a percentage of the total net assets of each Trust Series. The fee is accrued daily and paid monthly.
The decrease in the per share NAV for USMI for December 31, 2014, compared to the year ended December 31, 2013; and decrease in the per share NAV for the year ended December 31, 2013, compared to the year ended December 31, 2012, were primarily due to a decrease in values of the Futures Contracts held by USMI.
The decrease in cash deposits and investments in Treasuries and money market funds for December 31, 2014, compared to year ended December 31, 2013; and for the year ended December 31, 2013, compared to the year ended December 31, 2012, was the result of USMI’s smaller size as measured by total net assets.
USMI’s dividend and interest income earned on Treasuries, cash and/or cash equivalents for December 31, 2014, compared to year ended December 31, 2013 was similar; and for December 31, 2013, compared to December 31, 2012, the amount of interest income earned by USMI as a percentage of average total net assets were similar.
The decrease in gross total fees and expenses excluding management fees for December 31, 2014, compared to the year ended December 31, 2013, was primarily due to a decrease in certain of USMI’s operating expenses; and the increase in gross total fees and expenses excluding management fees for the year ended December 31, 2013, compared to the year ended December 31, 2012, was primarily due the fact that USMI had a full year of operations for year ended December 31, 2013.
USMI’s total commissions accrued to brokers for December 31, 2014, compared to the year ended December 31, 2013 remained static; and for the year ended December 31, 2013, compared to December 31, 2012, the increase was primarily a result of the higher number of contracts traded.
| 80 |
For the Three Months Ended December 31, 2014 Compared to the Three Months Ended December 31, 2013; and for the Three Months Ended December 31, 2013 Compared to the Three Months Ended December 31, 2012
USCI
| For the three months ended December 31, 2014 | For the three months ended December 31, 2013 | For the three months ended December 31, 2012 | ||||||||||
| Average daily total net assets | $ | 817,200,303 | $ | 508,589,477 | $ | 484,122,909 | ||||||
| Dividend and interest income earned on Treasuries, cash and/or cash equivalents | $ | 89,995 | $ | 59,083 | $ | 100,972 | ||||||
| Annualized yield based on average daily total net assets | 0.04 | % | 0.05 | % | 0.08 | % | ||||||
| Management fee | $ | 1,647,834 | $ | 1,217,828 | $ | 1,156,075 | ||||||
| Total fees and other expenses excluding management fees | $ | 485,590 | $ | 252,406 | $ | 171,863 | ||||||
| Fees and expenses related to the registration or offering of additional shares | $ | — | $ | — | $ | — | ||||||
| Total commissions accrued to brokers | $ | 207,424 | $ | 106,806 | $ | 85,901 | ||||||
| Total commissions as annualized percentage of average total net assets | 0.10 | % | 0.08 | % | 0.07 | % | ||||||
| Commissions accrued as a result of rebalancing | $ | 200,561 | $ | 100,298 | $ | 83,352 | ||||||
| Percentage of commissions accrued as a result of rebalancing | 96.69 | % | 93.91 | % | 97.03 | % | ||||||
| Commissions accrued as a result of creation and redemption activity | $ | 6,863 | $ | 6,508 | $ | 2,549 | ||||||
| Percentage of commissions accrued as a result of creation and redemption activity | 3.31 | % | 6.09 | % | 2.97 | % | ||||||
The increase in USCI’s average daily total net assets for the three months ended December 31, 2014, compared to the three months ended December 31, 2013; and for the three months ended December 31, 2013, compared to the three months ended December 31, 2012, were primarily due to an increase in size due to net creations.
The increase in USCI’S dividend and interest income earned on Treasuries, cash and/or cash equivalents for December 31, 2014, compared to the three months ended December 31, 2013; and for the three months ended December 31, 2013, compared to the three months ended December 31, 2012, was primarily due to USCI’s larger size as measured by total net assets.
The increase in USCI’s total fees and expenses excluding management fees for the three months ended December 31, 2014, compared to the three months ended December 31, 2013; and for the three months ended December 31, 2013, compared to the three months ended December 31, 2012, was due to an increase in USCI’s commissions resulting from USCI’s larger size as represented by total net assets.
The increase in USCI’s total commissions accrued to brokers for the year ended December 31, 2014, compared to the year ended December 31, 2013; and for the three months ended December 31, 2013, compared to the three months December 31, 2012, was primarily due to an increase in USCI’s total net assets (due to net creations) as well as an increase in the number of contracts traded during the rebalancing periods.
| 81 |
CPER
| For the three months ended December 31, 2014 | For the three months ended December 31, 2013 | For the three months ended December 31, 2012 | ||||||||||
| Average daily total net assets | $ | 3,015,303 | $ | 2,217,614 | $ | 2,515,754 | ||||||
| Dividend and interest income earned on Treasuries, cash and/or cash equivalents | $ | 340 | $ | 270 | $ | 514 | ||||||
| Annualized yield based on average daily total net assets | 0.04 | % | 0.05 | % | 0.08 | % | ||||||
| Management fee | $ | 4,940 | $ | 3,633 | $ | 4,111 | ||||||
| Total fees and other expenses excluding management fees | $ | 16,751 | $ | 15,951 | $ | 33,217 | ||||||
| Fees and expenses related to the registration or offering of additional shares | $ | — | $ | — | $ | — | ||||||
| Total amount of the expense waiver | $ | 15,611 | $ | 14,618 | $ | 31,459 | ||||||
| Expenses before allowance for the expense waiver | $ | 21,691 | $ | 19,584 | $ | 37,328 | ||||||
| Expenses after allowance for the expense waiver | $ | 6,080 | $ | 4,966 | $ | 5,869 | ||||||
| Total commissions accrued to brokers | $ | 225 | $ | 367 | $ | 359 | ||||||
| Total commissions as annualized percentage of average total net assets | 0.03 | % | 0.07 | % | 0.06 | % | ||||||
| Commissions accrued as a result of rebalancing | $ | 225 | $ | 367 | $ | 359 | ||||||
| Percentage of commissions accrued as a result of rebalancing | 100 | % | 100 | % | 100 | % | ||||||
| Commissions accrued as a result of creation and redemption activity | $ | — | $ | — | $ | — | ||||||
| Percentage of commissions accrued as a result of creation and redemption activity | — | % | — | % | — | % | ||||||
The increase in CPER’s average daily total net assets for the three months ended December 31, 2014, compared to the three months ended December 31, 2013; and for the three months ended December 31, 2013, compared to the three months ended December 31, 2012, were primarily due to an increase in size due to net creation.
The dividend and interest income earned on Treasuries, cash and/or cash equivalents for the three months ended December 31, 2014, compared to year ended December 31, 2013, was similar. The dividend and interest income earned on Treasuries, cash and/or cash equivalents for December 31, 2013, compared to December 31, 2012, was similar.
The slight increase in total gross fees and expenses excluding management fees for the three months ended December 31, 2014, compared to the three months ended December 31, 2013, was primarily due to an increase in certain CPER’s operating expenses; and for the three months ended December 31, 2013, compared to the three months ended December 31, 2012, the decrease in total gross fees and expenses excluding management fees was primarily due to a decrease in certain of CPER’s operating expenses.
CPER’s total commissions accrued to brokers for the three months ended December 31, 2014, compared to the three months ended December 31, 2013; and for the three months ended December 31, 2013, compared to December 31, 2012, were similar and primarily due to the total number of contracts traded.
| 82 |
USAG
| For the three months ended December 31, 2014 | For the three months ended December 31, 2013 | For the three months ended December 31, 2012 | ||||||||||
| Average daily total net assets | $ | 2,352,554 | $ | 2,337,457 | $ | 2,653,902 | ||||||
| Dividend and interest income earned on Treasuries, cash and/or cash equivalents | $ | 267 | $ | 292 | $ | 559 | ||||||
| Annualized yield based on average daily total net assets | 0.05 | % | 0.05 | % | 0.08 | % | ||||||
| Management fee | $ | 3,855 | $ | 4,713 | $ | 5,337 | ||||||
| Total fees and other expenses excluding management fees | $ | 22,974 | $ | 6,132 | $ | 32,086 | ||||||
| Fees and expenses related to the registration or offering of additional shares | $ | — | $ | — | $ | — | ||||||
| Total amount of the expense waiver | $ | 21,749 | $ | 4,637 | $ | 30,132 | ||||||
| Expenses before allowance for the expense waiver | $ | 26,829 | $ | 10,845 | $ | 37,423 | ||||||
| Expenses after allowance for the expense waiver | $ | 5,080 | $ | 6,208 | $ | 7,291 | ||||||
| Total commissions accrued to brokers | $ | 555 | $ | 479 | $ | 558 | ||||||
| Total commissions as annualized percentage of average total net assets | 0.09 | % | 0.08 | % | 0.08 | % | ||||||
| Commissions accrued as a result of rebalancing | $ | 555 | $ | 479 | $ | 558 | ||||||
| Percentage of commissions accrued as a result of rebalancing | 100 | % | 100 | % | 100 | % | ||||||
| Commissions accrued as a result of creation and redemption activity | $ | — | $ | — | $ | — | ||||||
| Percentage of commissions accrued as a result of creation and redemption activity | — | % | — | % | — | % | ||||||
USAG’s average daily total net assets for the three months ended December 31, 2014, compared to the three months ended December 31, 2013, was similar; and for the three months ended December 31, 2013, compared to the three months ended December 31, 2012, USAG’s average daily total net assets decreased was primarily due to an decrease in values of the Futures Contracts held by USAG.
USAG’s dividend and interest income earned on Treasuries, cash and/or cash equivalents for the three months ended December 31, 2014, compared to year ended December 31, 2013, was similar; and for the three months ended December 31, 2013, compared to December 31, 2012, was similar.
The increase in total gross fees and expenses excluding management fees for the three months ended December 31, 2014, compared to the three months ended December 31, 2013, was primarily due to an increase in certain USAG’s operating expenses; and for the three months ended December 31, 2013, compared to the three months ended December 31, 2012, the decrease in total gross fees and expenses excluding management fees was primarily due to a decrease in certain of USAG’s operating expenses.
USAG’s total commissions accrued to brokers for the three months ended December 31, 2014, compared to the three months ended December 31, 2013; and for the three months ended December 31, 2013, compared to December 31, 2012, were similar and primarily due to the total number of contracts traded.
| 83 |
USMI
| For the three months ended December 31, 2014 | For the three months ended December 31, 2013 | For the three months ended December 31, 2012 | ||||||||||
| Average daily total net assets | $ | 2,090,881 | $ | 2,220,427 | $ | 2,637,101 | ||||||
| Dividend and interest income earned on Treasuries, cash and/or cash equivalents | $ | 246 | $ | 252 | $ | 570 | ||||||
| Annualized yield based on average daily total net assets | 0.05 | % | 0.05 | % | 0.09 | % | ||||||
| Management fee | $ | 3,425 | $ | 3,917 | $ | 4,640 | ||||||
| Total fees and other expenses excluding management fees | $ | 21,753 | $ | 6,182 | $ | 31,766 | ||||||
| Fees and expenses related to the registration or offering of additional shares | $ | — | $ | — | $ | — | ||||||
| Total amount of the expense waiver | $ | 20,968 | $ | 4,987 | $ | 30,139 | ||||||
| Expenses before allowance for the expense waiver | $ | 25,178 | $ | 10,099 | $ | 36,406 | ||||||
| Expenses after allowance for the expense waiver | $ | 4,210 | $ | 5,112 | $ | 6,267 | ||||||
| Total commissions accrued to brokers | $ | 192 | $ | 228 | $ | 238 | ||||||
| Total commissions as annualized percentage of average total net assets | 0.04 | % | 0.04 | % | 0.04 | % | ||||||
| Commissions accrued as a result of rebalancing | $ | 192 | $ | 228 | $ | 238 | ||||||
| Percentage of commissions accrued as a result of rebalancing | 100 | % | 100 | % | 100 | % | ||||||
| Commissions accrued as a result of creation and redemption activity | $ | — | $ | — | $ | — | ||||||
| Percentage of commissions accrued as a result of creation and redemption activity | — | % | — | % | — | % | ||||||
The decrease in USMI’s average daily total net assets for the three months ended December 31, 2014, compared to the three months ended December 31, 2013; and for the three months ended December 31, 2013, compared to the three months ended December 31, 2012, were primarily due to a decrease in values of the Futures Contracts held by USMI.
USMI’s dividend and interest income earned on Treasuries, cash and/or cash equivalents for the three months ended December 31, 2014, compared to year ended December 31, 2013, was similar; and the dividend and interest income earned on Treasuries, cash and/or cash equivalents for December 31, 2013, compared to December 31, 2012, was similar.
The increase in total gross fees and expenses excluding management fees for the three months ended December 31, 2014, compared to the three months ended December 31, 2013, was primarily due to an increase in certain USMI’s operating expenses; and for the three months ended December 31, 2013, compared to the three months ended December 31, 2012, the slight decrease in total gross fees and expenses excluding management fees was primarily due to a decrease in certain USMI’s operating expenses.
USMI’s total commissions accrued to brokers for the three months ended December 31, 2014, compared to the three months ended December 31, 2013; and for the three months ended December 31, 2013, compared to December 31, 2012, were similar and primarily due to the total number of contracts traded.
Portfolio Holdings for USCI
During the year ended December 31, 2014, USCI’s portfolio held at all times Futures Contracts based on at least fourteen different commodities. Due to changes in the composition of the SDCI, each month the list of Benchmark Component Futures Contracts held by USCI changed (see the section “The SDCI” below). The table below lists the Benchmark Component Futures Contracts held during the year ended December 31, 2014.
| 84 |
Benchmark Component Futures Contracts for USCI
| Commodities | 1/1/2014 | 2/1/2014 | 3/1/2014 | 4/1/2014 | 5/1/2014 | 6/1/2014 | 7/1/2014 | 8/1/2014 | 9/1/2014 | 10/1/2014 | 11/1/2014 | 12/1/2014 | |||||||||||||
| Crude Oil (Brent) | · | · | · | · | · | ||||||||||||||||||||
| Crude Oil (WTI) | · | · | · | · | · | · | · | · | · | ||||||||||||||||
| Gas Oil | · | · | · | · | |||||||||||||||||||||
| Heating Oil | · | · | · | · | · | ||||||||||||||||||||
| Natural Gas | · | · | · | · | · | · | · | · | · | ||||||||||||||||
| Unleaded Gasoline | · | · | · | · | · | · | · | · | · | · | · | · | |||||||||||||
| Feeder Cattle | · | · | · | · | · | · | · | · | · | · | · | · | |||||||||||||
| Lean Hogs | · | · | · | · | · | · | · | · | · | · | · | ||||||||||||||
| Live Cattle | · | · | · | · | · | · | · | · | · | · | · | · | |||||||||||||
| Corn | · | · | · | · | · | · | |||||||||||||||||||
| Soybeans | |||||||||||||||||||||||||
| Soybean Meal | · | · | · | · | · | · | · | · | · | · | · | · | |||||||||||||
| Soybean Oil | · | ||||||||||||||||||||||||
| Wheat | · | · | · | · | · | · | · | · | · | · | · | · | |||||||||||||
| Aluminum | · | · | · | · | · | · | · | · | |||||||||||||||||
| Copper | · | · | · | · | · | · | · | ||||||||||||||||||
| Lead | · | · | · | · | · | ||||||||||||||||||||
| Nickel | · | · | |||||||||||||||||||||||
| Tin | |||||||||||||||||||||||||
| Zinc | · | · | · | · | · | · | · | · | · | · | · | · | |||||||||||||
| Gold | · | · | |||||||||||||||||||||||
| Platinum | · | · | · | · | · | · | · | · | · | · | |||||||||||||||
| Silver | · | · | · | · | · | · | · | · | · | · | · | · | |||||||||||||
| Cocoa | · | · | · | · | · | · | · | · | · | · | |||||||||||||||
| Coffee | · | · | · | · | · | · | · | · | · | · | · | · | |||||||||||||
| Cotton | |||||||||||||||||||||||||
| Sugar | · | · | · | · | · | · | · | · | · | · | · | · |
— = Component
The table below reflects the same listing of monthly Benchmark Component Futures Contracts as the tables above with two changes. First, the table below includes a column showing the change in the spot price of each of the 27 commodities for the year ended December 31, 2014. Second, while the tables above list the order of the commodities alphabetically (first by which of the six sectors a commodity falls into and then within each sector), the table below lists the commodities from the commodity that had the highest positive change in spot price to the commodity that had the lowest positive change or largest negative change in spot price. Investors are cautioned that the change in the spot price of a given commodity does not represent the actual return that USCI might have earned on any holdings in futures contracts based on that commodity. This is due to two factors. First, the return on a futures contract may be higher, or lower, than the change in the spot price of the commodity due to the impact of backwardation or contango. Second, USCI may not have owned any such futures contract for the entire time period represented in the table below. Thus, USCI’s total actual return on its holdings in any of the commodities shown below may be higher, or lower, than the actual change in the spot price of the particular commodity.
| 85 |
Benchmark Component Futures Contracts for USCI
| YTD Price | ||||||||||||||||||||||||||||
| Commodities | 1/1/2014 | 2/1/2014 | 3/1/2014 | 4/1/2014 | 5/1/2014 | 6/1/2014 | 7/1/2014 | 8/1/2014 | 9/1/2014 | 10/1/2014 | 11/1/2014 | 12/1/2014 | Performance | |||||||||||||||
| Crude Oil (Brent) | · | · | · | · | · | (31.70 | )% | |||||||||||||||||||||
| Crude Oil (WTI) | · | · | · | · | · | · | · | · | · | (40.00 | )% | |||||||||||||||||
| Gas Oil | · | · | · | · | (45.80 | )% | ||||||||||||||||||||||
| Heating Oil | · | · | · | · | · | (45.90 | )% | |||||||||||||||||||||
| Natural Gas | · | · | · | · | · | · | · | · | · | (48.30 | )% | |||||||||||||||||
| Unleaded Gasoline | · | · | · | · | · | · | · | · | · | · | · | · | (48.50 | )% | ||||||||||||||
| Feeder Cattle | · | · | · | · | · | · | · | · | · | · | · | · | 31.60 | % | ||||||||||||||
| Lean Hogs | · | · | · | · | · | · | · | · | · | · | · | 23.20 | % | |||||||||||||||
| Live Cattle | · | · | · | · | · | · | · | · | · | · | · | · | (4.90 | )% | ||||||||||||||
| Corn | · | · | · | · | · | · | (2.60 | )% | ||||||||||||||||||||
| Soybeans | (5.90 | )% | ||||||||||||||||||||||||||
| Soybean Meal | · | · | · | · | · | · | · | · | · | · | · | · | (16.70 | )% | ||||||||||||||
| Soybean Oil | · | (17.60 | )% | |||||||||||||||||||||||||
| Wheat | · | · | · | · | · | · | · | · | · | · | · | · | (22.30 | )% | ||||||||||||||
| Aluminum | · | · | · | · | · | · | · | · | 9.00 | % | ||||||||||||||||||
| Copper | · | · | · | · | · | · | · | 6.00 | % | |||||||||||||||||||
| Lead | · | · | · | · | · | 4.10 | % | |||||||||||||||||||||
| Nickel | · | · | (12.90 | )% | ||||||||||||||||||||||||
| Tin | (15.80 | )% | ||||||||||||||||||||||||||
| Zinc | · | · | · | · | · | · | · | · | · | · | · | · | (16.80 | )% | ||||||||||||||
| Gold | · | · | (1.50 | )% | ||||||||||||||||||||||||
| Platinum | · | · | · | · | · | · | · | · | · | · | (11.80 | )% | ||||||||||||||||
| Silver | · | · | · | · | · | · | · | · | · | · | · | · | (19.50 | )% | ||||||||||||||
| Cocoa | · | · | · | · | · | · | · | · | · | · | 50.50 | % | ||||||||||||||||
| Coffee | · | · | · | · | · | · | · | · | · | · | · | · | 7.40 | % | ||||||||||||||
| Cotton | (11.50 | )% | ||||||||||||||||||||||||||
| Sugar | · | · | · | · | · | · | · | · | · | · | · | · | (28.80 | )% | ||||||||||||||
• = Component
Source: Bloomberg
Tracking each Trust Series’ Benchmark
USCF seeks to manage each Trust Series’ portfolio such that changes in its average daily per share NAV, on a percentage basis, closely track the changes in the price of the Applicable Index, also on a percentage basis. Specifically, USCF seeks to manage the portfolio such that over any rolling period of 30-valuation days, the average daily change in a Trust Series’ per share NAV is within a range of 90% to 110% (0.9 to 1.1) of the average daily change in the price of the Applicable Index. As an example, if the average daily movement of the price of the Applicable Index for a particular 30-valuation day time period was 0.50% per day, USCF would attempt to manage the portfolio such that the average daily movement of the per share NAV during that same time period fell between 0.45% and 0.55% (i.e., between 0.9 and 1.1 of the Applicable Index’s results). Each Trust Series’ portfolio management goals do not include trying to make the nominal price of its per share NAV equal to the nominal price of the Applicable Index, the nominal price of any particular commodity Futures Contract or the spot price for any particular commodity. USCF believes that it is not practical to manage the portfolio to achieve such an investment goal when investing in listed Futures Contracts and Other Related Investments.
USCI
For the 30 valuation days ended December 31, 2014, the simple average daily change in the SDCI was (0.360)%, while the simple average daily change in the per share NAV of USCI over the same time period was (0.391)%. The average daily difference was (0.031)% (or (3.1) basis points, where 1 basis point equals 1/100 of 1%). As a percentage of the daily movement of the SDCI, the average error in daily tracking by the per share NAV was (5.08)%, meaning that over this time period USCI’s tracking error was within the plus or minus 10% range established as its benchmark tracking goal. The first chart below shows the daily movement of USCI’s per share NAV versus the daily movement of the SDCI for the 30-valuation day period ended December 31, 2014, the last trading day in December. The second chart below shows the monthly total returns of USCI as compared to the monthly value of the Benchmark Component Futures Contracts for the three years ended December 31, 2014.
Since the commencement of the offering of USCI’s shares to the public on August 10, 2010 to December 31, 2014, the simple average daily change in the SDCI was 0.000%, while the simple average daily change in the per share NAV of USCI over the same time period was 0.006%. The average daily difference was (0.00600)% (or (0.6) basis points, where 1 basis point equals 1/100 of 1%). As a percentage of the daily movement of the SDCI, the average error in daily tracking by the per share NAV was (10.05)%, meaning that over this time period USCI’s tracking error was not within the plus or minus 10% range established as its benchmark tracking goal.
| 86 |
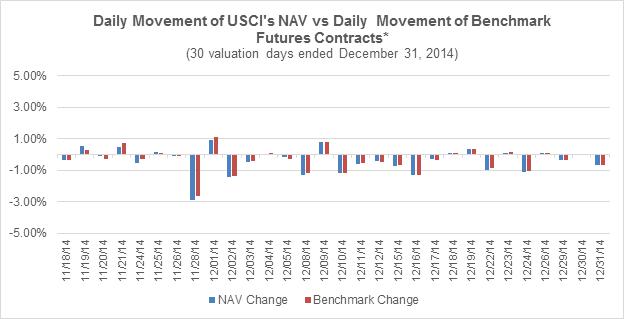
*PAST PERFORMANCE IS NOT NECESSARILY INDICATIVE OF FUTURE RESULTS
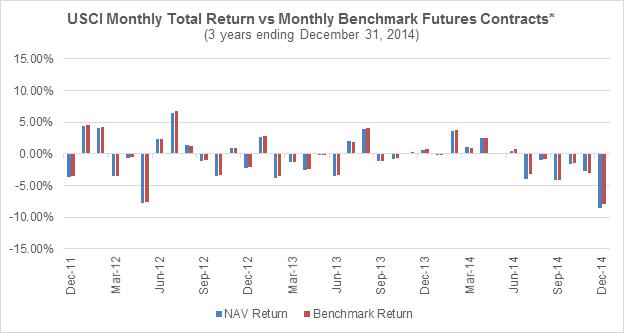
*PAST PERFORMANCE IS NOT NECESSARILY INDICATIVE OF FUTURE RESULTS
An alternative tracking measurement of the return performance of USCI versus the return of the SDCI can be calculated by comparing the actual return of USCI, measured by changes in its NAV, versus the expected changes in its NAV under the assumption that USCI’s returns had been exactly the same as the daily changes in the price of the SDCI.
| 87 |
For the year ended December 31, 2014, the actual total return of USCI as measured by changes in its per share NAV was (13.95)%. This is based on an initial per share NAV of $56.06 on December 31, 2013 and an ending per share NAV as of December 31, 2014 of $48.24. During this time period, USCI made no distributions to its shareholders. However, if USCI’s daily changes in its per share NAV had instead exactly tracked the changes in the daily return of the SDCI, USCI would have had an estimated per share NAV of $49.28 as of December 31, 2014, for a total return over the relevant time period of (12.09)%. The difference between the actual per share NAV total return of USCI of (13.95)% and the expected total return based on the SDCI of (12.09)% was an error over the time period of (1.86)%, which is to say that USCI’s actual total return underperformed the SDCI result by that percentage. USCF believes that a portion of the difference between the actual total return and the expected SDCI total return can be attributed to the net impact of the expenses that USCI pays, offset in part by the income that USCI collects on its cash and cash equivalent holdings. During the year ended December 31, 2014, USCI earned interest income of $323,118, which is equivalent to a weighted average income rate of approximately 0.05% for such period. In addition, during the year ended December 31, 2014, USCI also collected $23,400 from its Authorized Participants for creating or redeeming baskets of shares. This income also contributed to USCI’s actual total return. However, if the total assets of USCI continue to increase, USCF believes that the impact on actual total returns of these fees from creations and redemptions will diminish as a percentage of the actual total return. During the year ended December 31, 2014, USCI incurred total expenses of $7,281,485. Income from interest and Authorized Participant collections net of expenses was $(6,934,967), which is equivalent to a weighted average net income rate of approximately (0.99)% for the year ended December 31, 2014.
By comparison, for the year ended December 31, 2013, the actual total return of USCI as measured by changes in its per share NAV was (4.09)%. This was based on an initial per share NAV of $58.45 on December 31, 2012 and an ending per share NAV as of December 31, 2013 of $56.06. During this time period, USCI made no distributions to its shareholders. However, if USCI’s daily changes in its per share NAV had instead exactly tracked the changes in the daily return of the SDCI, USCI would have had an estimated per share NAV of $56.83 as of December 31, 2013, for a total return over the relevant time period of (2.77)%. The difference between the actual per share NAV total return of USCI of (4.09)% and the expected total return based on the SDCI of (2.79)% was an error over the time period of (1.32)%, which is to say that USCI’s actual total return underperformed the SDCI result by that percentage. USCF believes that a portion of the difference between the actual total return and the expected SDCI total return can be attributed to the net impact of the expenses that USCI paid, offset in part by the income that USCI collected on its cash and cash equivalent holdings. During the year ended December 31, 2013, USCI earned interest income of $265,555, which is equivalent to a weighted average income rate of approximately 0.05% for such period. In addition, during the year ended December 31, 2013, USCI also collected $15,750 from its Authorized Participants for creating or redeeming baskets of shares. This income also contributed to USCI’s actual total return. However, if the total assets of USCI continue to increase, USCF believes that the impact on actual total returns of these fees from creations and redemptions will diminish as a percentage of the actual total return. During the year ended December 31, 2013, USCI incurred total expenses of $5,820,464. Income from interest and Authorized Participant collections net of expenses was $(5,539,159), which is equivalent to a weighted average net income rate of approximately (1.09)% for the year ended December 31, 2013.
By comparison, for the year ended December 31, 2012, the actual total return of USCI as measured by changes in its per share NAV was (0.03)%. This was based on an initial per share NAV of $58.47 on December 31, 2011 and an ending per share NAV as of December 31, 2012 of $58.45. During this time period, USCI made no distributions to its shareholders. However, if USCI’s daily changes in its per share NAV had instead exactly tracked the changes in the daily return of the SDCI, USCI would have had an estimated per share NAV of $59.27 as of December 31, 2012, for a total return over the relevant time period of 1.37%. The difference between the actual per share NAV total return of USCI of (0.03)% and the expected total return based on the SDCI of 1.37% was an error over the time period of (1.40)%, which is to say that USCI’s actual total return underperformed the SDCI result by that percentage. USCF believes that a portion of the difference between the actual total return and the expected SDCI total return can be attributed to the net impact of the expenses that USCI paid, offset in part by the income that USCI collected on its cash and cash equivalent holdings. During the year ended December 31, 2012, USCI earned interest income of $278,476, which is equivalent to a weighted average income rate of approximately 0.07% for such period. In addition, during the year ended December 31, 2012, USCI also collected $12,950 from its Authorized Participants for creating or redeeming baskets of shares. This income also contributed to USCI’s actual total return. However, if the total assets of USCI continue to increase, USCF believes that the impact on actual total returns of these fees from creations and redemptions will diminish as a percentage of the actual total return. During the year ended December 31, 2012, USCI incurred total expenses of $4,926,185. Income from interest and Authorized Participant collections net of expenses was $(4,634,759), which is equivalent to a weighted average net income rate of approximately (1.08)% for the year ended December 31, 2012.
| 88 |
CPER
For the 30 valuation days ended December 31, 2014, the simple average daily change in the SCI was (0.218)%, while the simple average daily change in the per share NAV of CPER over the same time period was (0.229)%. The average daily difference was (0.011)% (or (1.1) basis points, where 1 basis point equals 1/100 of 1%). As a percentage of the daily movement of the SCI, the average error in daily tracking by the per share NAV was (1.53)%, meaning that over this time period CPER’s tracking error was within the plus or minus 10% range established as its benchmark tracking goal. The first chart below shows the daily movement of CPER’s per share NAV versus the daily movement of the SCI for the 30-valuation day period ended December 31, 2014, the last trading day in December. The second chart below shows the monthly total returns of CPER as compared to the monthly value of the Benchmark Component Copper Futures Contracts for the three years ended December 31, 2014.
Since the commencement of the offering of CPER’s shares to the public on November 15, 2011 to December 31, 2014, the simple average daily change in the SCI was (0.03)%, while the simple average daily change in the per share NAV of CPER over the same time period was (0.02)%. The average daily difference was (0.0040)% (or (0.4) basis points, where 1 basis point equals 1/100 of 1%). As a percentage of the daily movement of the SCI, the average error in daily tracking by the per share NAV was (4.93)%, meaning that over this time period CPER’s tracking error was within the plus or minus 10% range established as its benchmark tracking goal.
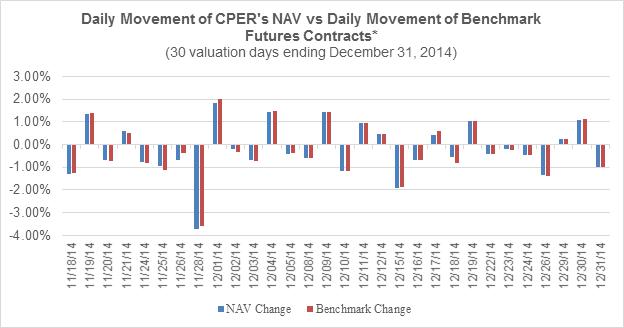
*PAST PERFORMANCE IS NOT NECESSARILY INDICATIVE OF FUTURE RESULTS
| 89 |
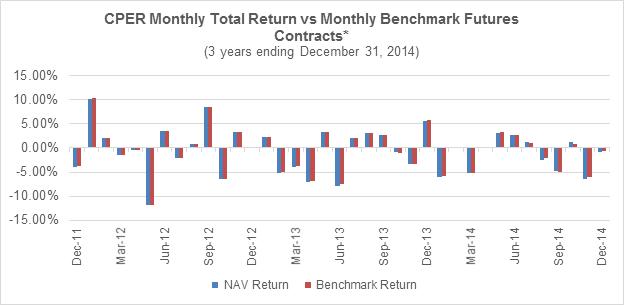
*PAST PERFORMANCE IS NOT NECESSARILY INDICATIVE OF FUTURE RESULTS
An alternative tracking measurement of the return performance of CPER versus the return of the SCI can be calculated by comparing the actual return of CPER, measured by changes in its per share NAV, versus the expected changes in its per share NAV under the assumption that CPER’s returns had been exactly the same as the daily changes in the price of the SCI.
For the year ended December 31, 2014, the actual total return of CPER as measured by changes in its per share NAV was (16.67)%. This is based on an initial per share NAV of $22.92 on December 31, 2013 and an ending per share NAV as of December 31, 2014 of $19.10. During this time period, CPER made no distributions to its shareholders. However, if CPER’s daily changes in its per share NAV had instead exactly tracked the changes in the daily return of the SCI, CPER would have had an estimated per share NAV of $19.28 as of December 31, 2014, for a total return over the relevant time period of (15.88)%. The difference between the actual per share NAV total return of CPER of (16.67)% and the expected total return based on the SCI of (15.88)% was an error over the time period of (0.79)%, which is to say that CPER’s actual total return underperformed the SCI result by that percentage. USCF believes that a portion of the difference between the actual total return and the expected SCI total return can be attributed to the net impact of the expenses that CPER pays, offset in part by the income that CPER collects on its cash and cash equivalent holdings. During the year ended December 31, 2014, CPER earned interest income of $1,455, which is equivalent to a weighted average income rate of approximately 0.05% for such period. During the year ended December 31, 2014, CPER collected $1,750 in fees from its Authorized Participants for creating or redeeming baskets of shares. During the year ended December 31, 2014, CPER incurred net expenses of $25,962. Income from interest and Authorized Participant collections net of expenses was $(22,757), which is equivalent to a weighted average net income rate of approximately (0.72)% for the year ended December 31, 2014.
By comparison, for the year ended December 31, 2013, the actual total return of CPER as measured by changes in its per share NAV was (9.87)%. This was based on an initial per share NAV of $25.43 on December 31, 2012 and an ending per share NAV as of December 31, 2013 of $22.92. During this time period, CPER made no distributions to its shareholders. However, if CPER’s daily changes in its per share NAV had instead exactly tracked the changes in the daily return of the SCI, CPER would have had an estimated per share NAV of $23.17 as of December 31, 2013, for a total return over the relevant time period of (8.89)%. The difference between the actual per share NAV total return of CPER of (9.87)% and the expected total return based on the SCI of (8.89)% was an error over the time period of (0.98)%, which is to say that CPER’s actual total return underperformed the SCI result by that percentage. USCF believes that a portion of the difference between the actual total return and the expected SCI total return can be attributed to the net impact of the expenses that CPER paid, offset in part by the income that CPER collected on its cash and cash equivalent holdings. During the year ended December 31, 2013, CPER earned interest income of $1,260, which is equivalent to a weighted average income rate of approximately 0.05% for such period. During the year ended December 31, 2013, CPER did not collect any fees from its Authorized Participants for creating or redeeming baskets of shares. During the year ended December 31, 2013, CPER incurred net expenses of $19,770. Income from interest and Authorized Participant collections net of expenses was $(18,510), which is equivalent to a weighted average net income rate of approximately (0.81)% for the year ended December 31, 2013.
| 90 |
By comparison, for the year ended December 31, 2012, the actual total return of CPER as measured by changes in its per share NAV was 3.92%. This was based on an initial per share NAV of $24.47 on December 31, 2011 and an ending per share NAV as of December 31, 2012 of $25.43. During this time period, CPER made no distributions to its shareholders. However, if CPER’s daily changes in its per share NAV had instead exactly tracked the changes in the daily return of the SCI, CPER would have had an estimated per share NAV of $25.70 as of December 31, 2012, for a total return over the relevant time period of 5.03%. The difference between the actual per share NAV total return of CPER of 3.92% and the expected total return based on the SCI of 5.03% was an error over the time period of (1.11)%, which is to say that CPER’s actual total return underperformed the SCI result by that percentage. USCF believes that a portion of the difference between the actual total return and the expected SCI total return can be attributed to the net impact of the expenses that CPER paid, offset in part by the income that CPER collected on its cash and cash equivalent holdings. During the year ended December 31, 2012, CPER earned interest income of $1,607, which is equivalent to a weighted average income rate of approximately 0.06% for such period. In addition, during the year ended December 31, 2012, CPER also collected $1,350 from its Authorized Participants for creating or redeeming baskets of shares. During the year ended December 31, 2012, CPER incurred net expenses of $25,023. Income from interest and Authorized Participant collections net of expenses was $(22,066), which is equivalent to a weighted average net income rate of approximately (0.86)% for the year ended December 31, 2012.
USAG
For the 30-valuation days ended December 31, 2014, the simple average daily change in the SDAI was (0.117)%, while the simple average daily change in the per share NAV of USAG over the same time period was (0.119)%. The average daily difference was (0.002)% (or (0.2)% basis points, where 1 basis point equals 1/100 of 1%). As a percentage of the daily movement of the SDAI, the average error in daily tracking by the per share NAV was 1.11%, meaning that over this time period USAG’s tracking error was within the plus or minus 10% range established as its benchmark tracking goal. The first chart below shows the daily movement of USAG’s per share NAV versus the daily movement of the SDAI for the 30-valuation day period ended December 31, 2014, the last trading day in December. The second chart below shows the monthly total returns of USAG as compared to the monthly value of the Benchmark Component Agriculture Futures Contracts for the two years ended December 31, 2014.
Since the commencement of the offering of USAG’s shares to the public on April 13, 2012 to December 31, 2014, the simple average daily change in the SDAI was 0.006%, while the simple average daily change in the per share NAV of USAG over the same time period was (0.01)%. The average daily difference was (0.0040)% (or (0.4) basis points, where 1 basis point equals 1/100 of 1%). As a percentage of the daily movement of the SDAI, the average error in daily tracking by the per share NAV was 7.54%, meaning that over this time period USAG’s tracking error was within the plus or minus 10% range established as its benchmark tracking goal.
| 91 |
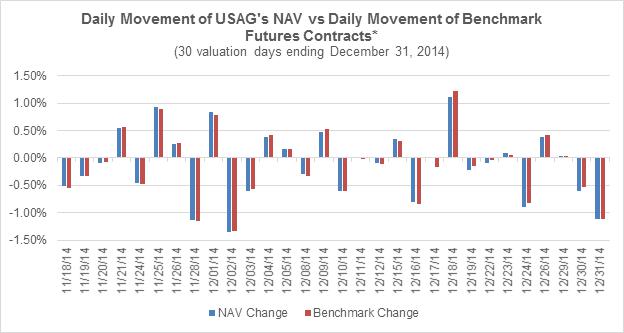
*PAST PERFORMANCE IS NOT NECESSARILY INDICATIVE OF FUTURE RESULTS
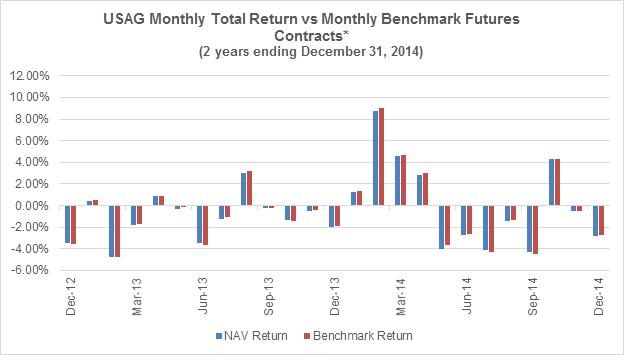
*PAST PERFORMANCE IS NOT NECESSARILY INDICATIVE OF FUTURE RESULTS
An alternative tracking measurement of the return performance of USAG versus the return of the SDAI can be calculated by comparing the actual return of USAG, measured by changes in its per share NAV, versus the expected changes in its per share NAV under the assumption that USAG’s returns had been exactly the same as the daily changes in the price of the SDAI.
| 92 |
For the year ended December 31, 2014, the actual total return of USAG as measured by changes in its per share NAV was 2.76%. This is based on an initial per share NAV of $22.79 on December 31, 2013 and an ending per share NAV as of December 31, 2014 of $22.97. During this time period, USAG made no distributions to its shareholders. However, if USAG’s daily changes in its per share NAV had instead exactly tracked the changes in the daily total return of the SDAI, USAG would have had an estimated per share NAV of $23.60 as of December 31, 2014, for a total return over the relevant time period of 3.55%. The difference between the actual per share NAV total return of USAG of 2.76% and the expected total return based on the SDAI of 3.55% was an error over the time period of (0.99)%, which is to say that USAG’s actual total return underperformed the SDAI result by that percentage. USCF believes that a portion of the difference between the actual total return and the expected SDAI total return can be attributed to the net impact of the expenses that USAG pays, offset in part by the income that USAG collects on its cash and cash equivalent holdings. During the year ended December 31, 2014, USAG earned interest income of $1,176, which is equivalent to a weighted average income rate of approximately 0.05% for such period. During the year ended December 31, 2014, USAG did not collect from its Authorized Participants for creating or redeeming baskets of shares. However, if the total assets of USAG continue to increase, USCF believes that the impact on actual total returns of these fees from creations and redemptions will diminish as a percentage of the actual total return. During the year ended December 31, 2014, USAG incurred net expenses of $21,569. Income from interest and Authorized Participant collections net of expenses was $(20,393), which is equivalent to a weighted average net income rate of approximately (0.84)% for the year ended December 31, 2014.
By comparison, for the period ended December 31, 2013, the actual total return of USAG as measured by changes in its per share NAV was (10.84)%. This was based on an initial per share NAV of $25.56 on December 31, 2012 and an ending per share NAV as of December 31, 2013 of $22.79. During this time period, USAG made no distributions to its shareholders. However, if USAG’s daily changes in its per share NAV had instead exactly tracked the changes in the daily total return of the SDAI, USAG would have had an estimated per share NAV of $22.97 as of December 31, 2013, for a total return over the relevant time period of (10.13)%. The difference between the actual per share NAV total return of USAG of (10.84)% and the expected total return based on the SDAI of (10.13)% was an error over the time period of (0.71)%, which is to say that USAG’s actual total return underperformed the SDAI result by that percentage. USCF believes that a portion of the difference between the actual total return and the expected SDAI total return can be attributed to the net impact of the expenses that USAG pays, offset in part by the income that USAG collects on its cash and cash equivalent holdings. During the year ended December 31, 2013, USAG earned interest income of $1,328, which is equivalent to a weighted average income rate of approximately 0.06% for such period. During the year ended December 31, 2013, USAG did not collect any from its Authorized Participants for creating or redeeming baskets of shares. However, if the total assets of USAG continue to increase, USCF believes that the impact on actual total returns of these fees from creations and redemptions will diminish as a percentage of the actual total return. During the year ended December 31, 2013, USAG incurred net expenses of $25,167. Income from interest and Authorized Participant collections net of expenses was $(23,839), which is equivalent to a weighted average net income rate of approximately (1.00)% for the year ended December 31, 2013.
By comparison, for the period ended December 31, 2012, the actual total return of USAG as measured by changes in its per share NAV was 2.24%. This was based on an initial per share NAV of $25.00 on April 13, 2012 and an ending per share NAV as of December 31, 2012 of $25.56. During this time period, USAG made no distributions to its shareholders. However, if USAG’s daily changes in its per share NAV had instead exactly tracked the changes in the daily total return of the SDAI, USAG would have had an estimated per share NAV of $25.80 as of December 31, 2012, for a total return over the relevant time period of 3.20%. The difference between the actual per share NAV total return of USAG of 2.24% and the expected total return based on the SDAI of 3.20% was an error over the time period of (0.96)%, which is to say that USAG’s actual total return underperformed the SDAI result by that percentage. USCF believes that a portion of the difference between the actual total return and the expected SDAI total return can be attributed to the net impact of the expenses that USAG pays, offset in part by the income that USAG collects on its cash and cash equivalent holdings. During the period ended December 31, 2012, USAG earned interest income of $1,573, which is equivalent to a weighted average income rate of approximately 0.07% for such period. In addition, during the period ended December 31, 2012, USAG also collected $2,700 from its Authorized Participants for creating or redeeming baskets of shares. This income also contributed to USAG’s actual total return. However, if the total assets of USAG continue to increase, USCF believes that the impact on actual total returns of these fees from creations and redemptions will diminish as a percentage of the actual total return. During the period ended December 31, 2012, USAG incurred net expenses of $23,523. Income from interest and Authorized Participant collections net of expenses was $(19,250), which is equivalent to a weighted average net income rate of approximately (0.91)% for the period ended December 31, 2012.
| 93 |
USMI
For the 30-valuation days ended December 31, 2014, the simple average daily change in the SDMI was (0.170)%, while the simple average daily change in the per share NAV of USMI over the same time period was (0.180)%. The average daily difference was (0.009)% (or (0.9) basis points, where 1 basis point equals 1/100 of 1%). As a percentage of the daily movement of the SDMI, the average error in daily tracking by the per share NAV was (5.57)%, meaning that over this time period USMI’s tracking error was within the plus or minus 10% range established as its benchmark tracking goal. The first chart below shows the daily movement of USMI’s per share NAV versus the daily movement of the SDMI for the 30-valuation day period ended December 31, 2014, the last trading day in December. The second chart below shows the monthly total returns of USMI as compared to the monthly value of the Benchmark Component Metals Futures Contracts for the two years ended December 31, 2014.
Since the commencement of the offering of USMI’s shares to the public on June 19, 2012 to December 31, 2014, the simple average daily change in the SDMI was (0.027)%, while the simple average daily change in the per share NAV of USMI over the same time period was (0.03)%. The average daily difference was (0.0050)% (or (0.5) basis points, where 1 basis point equals 1/100 of 1%). As a percentage of the daily movement of the SDMI, the average error in daily tracking by the per share NAV was (3.54)% meaning that over this time period USMI’s tracking error was within the plus or minus 10% range established as its benchmark tracking goal.
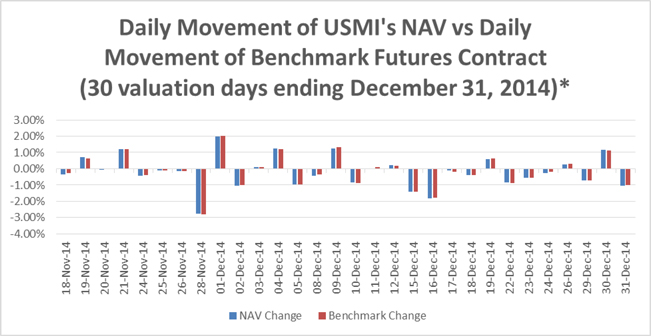
*PAST PERFORMANCE IS NOT NECESSARILY INDICATIVE OF FUTURE RESULTS
| 94 |
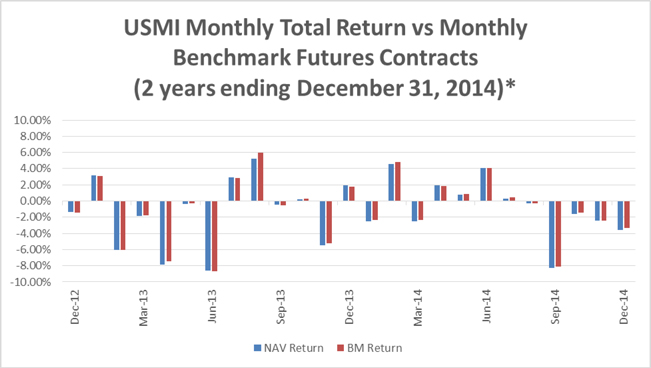
*PAST PERFORMANCE IS NOT NECESSARILY INDICATIVE OF FUTURE RESULTS
An alternative tracking measurement of the return performance of USMI versus the return of the SDMI can be calculated by comparing the actual return of USMI, measured by changes in its per share NAV, versus the expected changes in its per share NAV under the assumption that USMI’s returns had been exactly the same as the daily changes in the price of the SDMI.
For the year ended December 31, 2014, the actual total return of USMI as measured by changes in its per share NAV was (9.79)%. This is based on an initial per share NAV of $21.97 on December 31, 2013 and an ending per share NAV as of December 31, 2014 of $19.82. During this time period, USMI made no distributions to its shareholders. However, if USMI’s daily changes in its per share NAV had instead exactly tracked the changes in the daily total return of the SDMI, USMI would have had an estimated per share NAV of $20.43 as of December 31, 2014, for a total return over the relevant time period of (7.01)%. The difference between the actual per share NAV total return of USMI of (9.79)% and the expected total return based on the SDMI of (7.01)% was an error over the time period of (2.78)% which is to say that USMI’s actual total return underperformed the SDMI result by that percentage. USCF believes that a portion of the difference between the actual total return and the expected SDMI total return can be attributed to the net impact of the expenses that USMI pays, offset in part by the income that USMI collects on its cash and cash equivalent holdings. During the year ended December 31, 2014, USMI earned interest income of $1,015, which is equivalent to a weighted average income rate of approximately 0.05% for such period. During the year ended December 31, 2014, USMI did not collect from its Authorized Participants for creating or redeeming baskets of shares. However, if the total assets of USMI continue to increase, USCF believes that the impact on actual total returns of these fees from creations and redemptions will diminish as a percentage of the actual total return. During the year ended December 31, 2014, USMI incurred net expenses of $18,536. Income from interest and Authorized Participant collections net of expenses was $(17,521), which is equivalent to a weighted average net income rate of approximately (0.79)% for the year ended December 31, 2014.
| 95 |
By comparison, for the period ended December 31, 2013, the actual total return of USMI as measured by changes in its per share NAV was (17.00)%. This was based on an initial per share NAV of $26.47 on December 31, 2012 and an ending per share NAV as of December 31, 2013 of $21.97. During this time period, USMI made no distributions to its shareholders. However, if USMI’s daily changes in its per share NAV had instead exactly tracked the changes in the daily total return of the SDMI, USMI would have had an estimated per share NAV of $22.23 as of December 31, 2013, for a total return over the relevant time period of (16.00)%. The difference between the actual per share NAV total return of USMI of (17.00)% and the expected total return based on the SDMI of (16.00)% was an error over the time period of (1.00)% which is to say that USMI’s actual total return underperformed the SDMI result by that percentage. USCF believes that a portion of the difference between the actual total return and the expected SDMI total return can be attributed to the net impact of the expenses that USMI pays, offset in part by the income that USMI collects on its cash and cash equivalent holdings. During the year ended December 31, 2013, USMI earned interest income of $1,299, which is equivalent to a weighted average income rate of approximately 0.05% for such period. In addition, during the year ended December 31, 2013, USMI also collected $1,350 from its Authorized Participants for creating or redeeming baskets of shares. This income also contributed to USMI’s actual total return. However, if the total assets of USMI continue to increase, USCF believes that the impact on actual total returns of these fees from creations and redemptions will diminish as a percentage of the actual total return. During the year ended December 31, 2013, USMI incurred net expenses of $22,774. Income from interest and Authorized Participant collections net of expenses was $(20,125), which is equivalent to a weighted average net income rate of approximately (0.80)% for the year ended December 31, 2013.
By comparison, for the period ended December 31, 2012, the actual total return of USMI as measured by changes in its per share NAV was 5.88%. This was based on an initial per share NAV of $25.00 on June 19, 2012 and an ending per share NAV as of December 31, 2012 of $26.47. During this time period, USMI made no distributions to its shareholders. However, if USMI’s daily changes in its per share NAV had instead exactly tracked the changes in the daily total return of the SDMI, USMI would have had an estimated per share NAV of $26.57 as of December 31, 2012, for a total return over the relevant time period of 6.28%. The difference between the actual per share NAV total return of USMI of 5.88% and the expected total return based on the SDMI of 6.28% was an error over the time period of (0.40)% which is to say that USMI’s actual total return underperformed the SDMI result by that percentage. USCF believes that a portion of the difference between the actual total return and the expected SDMI total return can be attributed to the net impact of the expenses that USMI pays, offset in part by the income that USMI collects on its cash and cash equivalent holdings. During the period ended December 31, 2012, USMI earned interest income of $1,270, which is equivalent to a weighted average income rate of approximately 0.08% for such period. In addition, during the period ended December 31, 2012, USMI also collected $1,350 from its Authorized Participants for creating or redeeming baskets of shares. This income also contributed to USMI’s actual total return. However, if the total assets of USMI continue to increase, USCF believes that the impact on actual total returns of these fees from creations and redemptions will diminish as a percentage of the actual total return. During the period ended December 31, 2012, USMI incurred net expenses of $13,838. Income from interest and Authorized Participant collections net of expenses was $(11,218), which is equivalent to a weighted average net income rate of approximately (0.74)% for the period ended December 31, 2012.
Factors That Can Impact Ability to Track the Applicable Benchmark Component Futures Contract
There are currently three factors that have impacted or are most likely to impact a Trust Series’ ability to accurately track its Applicable Benchmark Component Futures Contract.
First, a Trust Series may buy or sell its holdings in the then current Applicable Benchmark Component Futures Contracts at a price other than the closing settlement price of that contract on the day during which such Trust Series executes the trade. In that case, a Trust Series may pay a price that is higher, or lower, than that of the Applicable Benchmark Component Futures Contracts, which could cause the changes in the daily per share NAV of a Trust Series to either be too high or too low relative to the daily changes in the price of the Applicable Benchmark Component Futures Contract. During the year ended December 31, 2014, USCF attempted to minimize the effect of these transactions by seeking to execute its purchase or sale of the Applicable Benchmark Component Futures Contracts at, or as close as possible to, the end of the day settlement price. However, it may not always be possible for a Trust Series to obtain the closing settlement price and there is no assurance that failure to obtain the closing settlement price in the future will not adversely impact a Trust Series’ attempt to track the Applicable Benchmark Component Futures Contract over time.
| 96 |
Second, each Trust Series incurs expenses primarily composed of the management fees, brokerage commissions for the buying and selling of futures contracts, and other expenses. The impact of these expenses tends to cause daily changes in the per share NAV of such Trust Series to track slightly lower than daily changes in the price of the Applicable Benchmark Component Futures Contract. At the same time, each Trust Series earns interest income on its cash, cash equivalents and Treasuries. A Trust Series is not required to distribute any portion of its income to its shareholders and none of the Trust Series made any distributions to shareholders during the year ended December 31, 2014. Interest payments, and any other income, were retained within the portfolio and added to each Trust Series’ NAV. At the same time, each Trust Series incurred expenses for its management fee, brokerage commissions and other expenses (including ongoing registration fees). The calculation of each Applicable Benchmark Component Futures Contract includes an interest portion, calculated daily using the 90-Day U.S. Treasury Bill’s total return, but does not include an expense component. When a Trust Series’ income exceeds the sum of its expenses by the yield on the 90-Day U.S. Treasury Bill, such Trust Series realizes a net yield that tends to cause daily changes in the per share NAV of such Trust Series to track slightly higher than daily changes in the price of the Applicable Benchmark Component Futures Contract. If this net yield is lower than the yield on the 90-Day U.S. Treasury Bill, that tends to cause daily changes in the per share NAV of such Trust Series to track slightly lower than daily changes in the price of the Applicable Benchmark Component Futures Contract. During the year ended December 31, 2014, USCI earned, on an annualized basis, approximately 0.05% on its cash holdings. It also incurred cash expenses on an annualized basis of (0.84)% for management fees, approximately (0.09)% in brokerage commission costs related to the purchase and sale of Futures Contracts, and approximately (0.11)% for other expenses. The foregoing fees and expenses resulted in a net yield on an annualized basis of approximately (0.99)% and affected USCI’s ability to track its benchmark. During the year ended December 31, 2014, CPER earned, on an annualized basis, approximately 0.05% on its cash holdings. It also incurred cash expenses on an annualized basis of approximately (0.65)% for management fees, approximately (0.06)% in brokerage commission costs related to the purchase and sale of Futures Contracts, and approximately (0.12)% for other net expenses. The foregoing fees and expenses resulted in a net yield on an annualized basis of approximately (0.78)% and affected CPER’s ability to track its benchmark. During the year ended December 31, 2014, USAG earned, on an annualized basis, approximately 0.05% on its cash holdings. It also incurred cash expenses on an annualized basis of approximately (0.70)% for management fees, approximately (0.08)% in brokerage commission costs related to the purchase and sale of Futures Contracts, and approximately (0.11)% for other net expenses. The foregoing fees and expenses resulted in a net yield on an annualized basis of approximately (0.84)% and affected USAG’s ability to track its benchmark. During the year ended December 31, 2014, USMI earned, on an annualized basis, approximately 0.05% on its cash holdings. It also incurred cash expenses on an annualized basis of approximately (0.67)% for management fees, approximately (0.04)% in brokerage commission costs related to the purchase and sale of Futures Contracts, and approximately (0.13)% for other net expenses. The foregoing fees and expenses resulted in a net yield on an annualized basis of approximately (0.79)% and affected USMI’s ability to track its benchmark. If this net yield is lower than the yield on the 90-Day U.S. Treasury Bill, that tends to cause daily changes in the per share NAV of such Trust Series to track slightly lower than daily changes in the price of the Applicable Benchmark Component Futures Contract. If short-term interest rates rise above the current levels, the level of deviation created by the yield would decrease. Conversely, if short-term interest rates were to decline, the amount of error created by the yield would increase. When short-term yields drop to a level lower than the combined expenses of the management fee and the brokerage commissions, then the tracking error becomes a negative number and would tend to cause the daily returns of the per share NAV to underperform the daily returns of the Applicable Benchmark Component Futures Contract. USCF anticipates that interest rates will continue to remain at historical lows and, therefore, it is anticipated that fees and expenses paid by each Trust Series will continue to be higher than interest earned by each Trust Series. As such, USCF anticipates that each Trust Series will continue to underperform tracking the Applicable Benchmark Component Futures Contract until such a time when interest earned at least equals or exceeds the fees and expenses paid by each Trust Series.
Third, a Trust Series may hold Futures Contracts in a particular commodity other than the one specified as the Applicable Benchmark Component Futures Contract, or may hold Other Related Investments in its portfolio that may fail to closely track the Applicable Benchmark Component Futures Contract’s total return movements. Taking USCI as an example, assume for a given month one of the Benchmark Component Futures Contracts is the NYMEX WTI physically settled Futures Contract, trading under the symbol “CL,” for the contract month of November 2014. It is possible that USCI could hold a NYMEX WTI financially settled Futures Contract, trading under the symbol “WS,” for the contract month of November 2014. Alternatively, and using the same example, USCI could hold the ICE WTI financially settled Futures Contract, also for the contract month of November 2014. As a third example, USCI could hold the NYMEX WTI physically settled Futures Contract, trading under the symbol “CL,” but for a contract month other than November 2014. During the year ended December 31, 2014, no Trust Series held any Other Related Investments.
Finally, a Trust Series could hold Other-Related Investments. In any of these cases, the error in tracking the Applicable Benchmark Component Futures Contract could result in daily changes in the per share NAV of a Trust Series that are either too high, or too low, relative to the daily changes in the price of the Applicable Benchmark Component Futures Contract. During the year ended December 31, 2014, none of the Trust Series held any Other-Related Investments, but did, at times, hold Futures Contracts that were in months other than the months specified as the Applicable Benchmark Component Futures Contract. If any Trust Series increases in size, and due to its obligations to comply with regulatory limits or due to other market pricing or liquidity factors, such Trust Series may invest in Futures Contract months other than the designated month specified as the Applicable Benchmark Component Futures Contract, or in Other-Related Investments, which may have the effect of increasing transaction related expenses and may result in increased tracking error.
| 97 |
Hypothetical Performance of Each Applicable Index
SDCI
The table and chart below show the hypothetical performance of the SDCI from December 31, 2004 through December 31, 2014.
HYPOTHETICAL PERFORMANCE RESULTS HAVE MANY INHERENT LIMITATIONS, SOME OF WHICH ARE DESCRIBED BELOW. NO REPRESENTATION IS BEING MADE THAT USCI WILL OR IS LIKELY TO ACHIEVE PROFITS OR LOSSES SIMILAR TO THOSE SHOWN. IN FACT, THERE ARE FREQUENTLY SHARP DIFFERENCES BETWEEN HYPOTHETICAL PERFORMANCE RESULTS AND THE ACTUAL RESULTS ACHIEVED BY ANY PARTICULAR TRADING PROGRAM.
ONE OF THE LIMITATIONS OF HYPOTHETICAL PERFORMANCE RESULTS IS THAT THEY ARE GENERALLY PREPARED WITH THE BENEFIT OF HINDSIGHT. IN ADDITION, HYPOTHETICAL TRADING DOES NOT INVOLVE FINANCIAL RISK, AND NO HYPOTHETICAL TRADING RECORD CAN COMPLETELY ACCOUNT FOR THE IMPACT OF FINANCIAL RISK IN ACTUAL TRADING.
FOR EXAMPLE, THE ABILITY TO WITHSTAND LOSSES OR TO ADHERE TO A PARTICULAR TRADING PROGRAM IN SPITE OF TRADING LOSSES ARE MATERIAL POINTS WHICH CAN ALSO ADVERSELY AFFECT ACTUAL TRADING RESULTS. THERE ARE NUMEROUS OTHER FACTORS RELATED TO THE MARKETS IN GENERAL OR TO THE IMPLEMENTATION OF ANY SPECIFIC TRADING PROGRAM WHICH CANNOT BE FULLY ACCOUNTED FOR IN THE PREPARATION OF HYPOTHETICAL PERFORMANCE RESULTS AND ALL OF WHICH CAN ADVERSELY AFFECT ACTUAL TRADING RESULTS.
Since the SDCI was launched on December 18, 2009, there is only actual performance history of the SDCI from that date to the present. This data is available for periods prior to December 18, 2009. However, the components of the SDCI and the weighting of the components of the SDCI are established each month based on purely quantitative data that is not subject to revision based on other external factors. As a result, the table below reflects how the SDCI would have performed from December 31, 2004 through December 31, 2014 had it been in effect during such time period. The performance data does not reflect any reinvestment or distribution of profits, commission charges, management fees or other expenses that would have been incurred in connection with operating and managing a commodity pool designed to track the SDCI. Such fees and expenses would reduce the performance returns shown in the table below.
Hypothetical Performance Results* for the period
from December 31, 2004 through December 31, 2014
| Year | Ending Level* | Annual Return | ||||||
| 2004 | 592.26 | 23.58 | % | |||||
| 2005 | 781.94 | 32.03 | % | |||||
| 2006 | 1,115.82 | 42.70 | % | |||||
| 2007 | 1,518.71 | 36.11 | % | |||||
| 2008 | 1,175.77 | (22.58 | )% | |||||
| 2009 | 1,532.84 | 30.37 | % | |||||
| 2010 | 1,852.04 | 20.82 | % | |||||
| 2011 | 1,703.23 | (8.03 | )% | |||||
| 2012 | 1,726.55 | 1.37 | % | |||||
| 2013 | 1,678.73 | (2.77 | )% | |||||
| 2014 | 1,475.68 | (12.10 | )% | |||||
* The “base level” for the SDCI was set at 100 on January 2, 1991. The “Ending Level” represents the value of the components of the SDCI on the last trading day of each year and is used to illustrate the cumulative performance of the SDCI.
| 98 |
PAST PERFORMANCE IS NOT NECESSARILY INDICATIVE OF FUTURE RESULTS
SummerHaven Dynamic Commodity IndexSM (“SDCI”) Year-Over-Year
Hypothetical Total Returns (12/31/04-12/31/2014)*
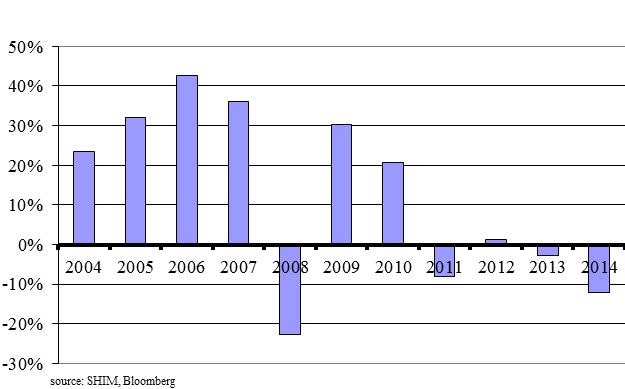
PAST PERFORMANCE IS NOT NECESSARILY INDICATIVE OF FUTURE RESULTS
The following table and chart compare the hypothetical total return of the SDCI in comparison with the actual total return of three major indexes for the period from December 31, 1997 to December 31, 2014.
| Hypothetical and Historical Results for the period from December 31, 1997 through December 31, 2014 | ||||||||||||||||
| BCOM TR | S&P GSCI TR | DB LCI OY TR | SDCI | |||||||||||||
| Total return | 36 | % | 6 | % | 232 | % | 556 | % | ||||||||
| Average annual return (total) | 3.97 | % | 4.52 | % | 9.97 | % | 13.79 | % | ||||||||
| Annualized volatility | 16.86 | % | 23.30 | % | 19.21 | % | 15.58 | % | ||||||||
| Annualized Sharpe ratio | 0.10 | 0.09 | 0.39 | 0.72 | ||||||||||||
Source: SHIM, Bloomberg
*PAST PERFORMANCE IS NOT NECESSARILY INDICATIVE OF FUTURE RESULTS
The table immediately above shows the performance of the SDCI from December 31, 1997 through December 31, 2014 in comparison with three traditional commodities indices: the S&P GSCI Commodity Index (GSCI®) Total Return, Bloomberg Commodity Index Total ReturnSM, and the Deutsche Bank Liquid Commodity Index-Optimum Yield Total ReturnTM. The S&P GSCI® Commodity Index Total Return is a composite index of commodity sector returns representing an unleveraged, long-only investment in commodity futures that is broadly diversified across the spectrum of commodities. The Bloomberg Commodity Index Total ReturnSM is currently composed of futures contracts on a diversified basket of commodities traded on U.S. exchanges. The Deutsche Bank Liquid Commodity Index-Optimum Yield Total ReturnTM is designed to reflect the performance of certain wheat, corn, light sweet crude oil, heating oil, gold and aluminum futures contracts plus the returns from investing in 3-month U.S. Treasury Bills. The data for the SDCI Total Return Index is derived by using the SDCI’s calculation methodology with historical prices for the futures contracts comprising the SDCI. The information about each of the indices comes from publicly-available material about such indices but is not designed to provide a thorough overview of the methodology of each index.
| 99 |
None of the indices has an investment objective identical to the SDCI. As a result, there are inherent limitations in comparing the performance of such indices against the SDCI. For more information about these indices and their methodologies, please refer to the material published by the sponsors of each such index which may be found on their websites. USCI is not responsible for any information found on such websites, and such information is not part of this annual report on Form 10-K.
In the table above, “Total Return” refers to the return of the relevant index from December 31, 1997 to December 31, 2014; “Annualized Volatility” is a measure of the amount of variation or fluctuation in the returns of the relevant index. Annualized Volatility is calculated by taking the monthly standard deviation of the relevant index’s return and multiplying it by the square root of 12; and “Annualized Sharpe Ratio” is a measure of the total return of each relevant index adjusted by the risk-free interest rate (the 90-Day U.S. Treasury Bill yield) and the volatility of each index. Many investors consider volatility to be a measure of risk, and lower volatility of investment returns is considered a positive investment attribute as opposed to higher volatility. Annualized Sharpe Ratio is a standard measure for investors to compare two different investments or indexes that have different levels of volatility. If two indexes have the same total return, but one has lower Annualized Volatility, then its Annualized Sharpe Ratio will be higher. The higher the Annualized Sharpe Ratio, the better the risk-adjusted performance. Annualized Sharpe Ratio is calculated by taking the average monthly total return of the relevant index and subtracting the then current yield on the 90-Day U.S. Treasury Bill. The annualized return of this series is then divided by the Annualized Volatility of this series, and this result is the Annualized Sharpe Ratio for the relevant index. A higher Sharpe Ratio is not a guarantee that one investment or index will in the future produce better risk adjustment total returns, but USCF believes it is a useful tool for investors to consider when making investment decisions.
| 100 |
Ten Year Comparison of Index Returns of the BCOM TR, S&P GSCI TR,
DB LCI OY TR, and the Hypothetical Returns of the SDCI
(12/31/04-12/31/14)
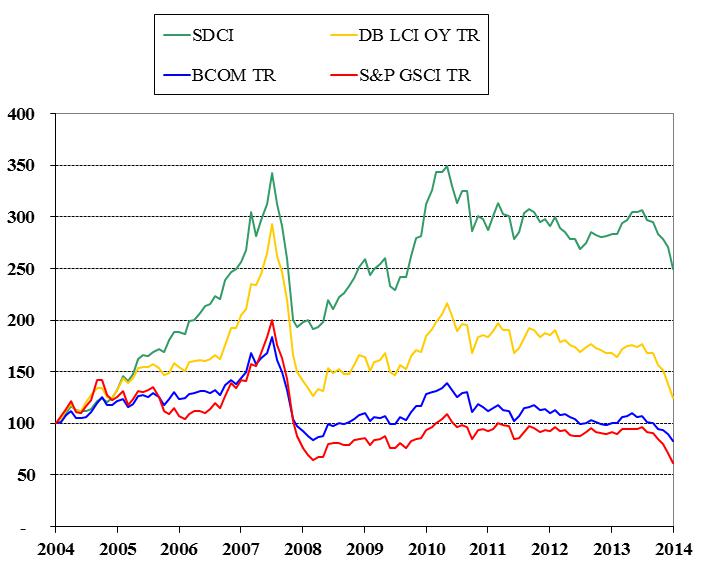
PAST PERFORMANCE IS NOT NECESSARILY INDICATIVE OF FUTURE RESULTS
| 101 |
The following chart compares the hypothetical total return of the SDCI in comparison with the actual total return of three major indexes over a five year period.
Five Year Comparison of Index Returns of the BCOM TR, S&P GSCI TR,
DB LCI OY TR, and the Hypothetical Returns of the SDCI
(12/31/08-12/31/14)
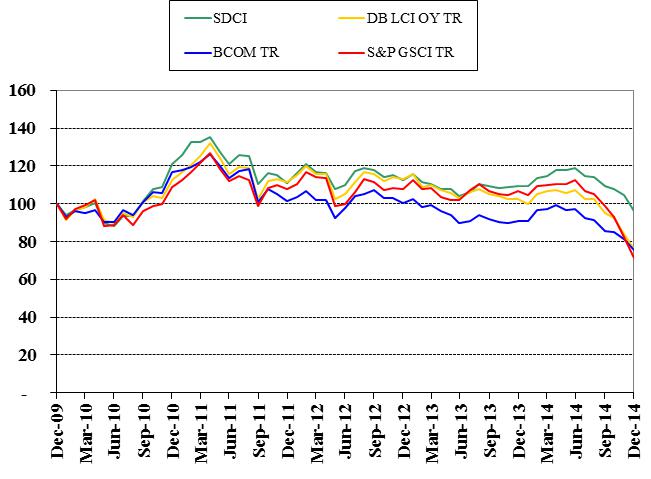
PAST PERFORMANCE IS NOT NECESSARILY INDICATIVE OF FUTURE RESULTS
SCI
The table and chart below show the hypothetical performance of the SCI from December 31, 2004 through December 31, 2014.
HYPOTHETICAL PERFORMANCE RESULTS HAVE MANY INHERENT LIMITATIONS, SOME OF WHICH ARE DESCRIBED BELOW. NO REPRESENTATION IS BEING MADE THAT CPER WILL OR IS LIKELY TO ACHIEVE PROFITS OR LOSSES SIMILAR TO THOSE SHOWN. IN FACT, THERE ARE FREQUENTLY SHARP DIFFERENCES BETWEEN HYPOTHETICAL PERFORMANCE RESULTS AND THE ACTUAL RESULTS ACHIEVED BY ANY PARTICULAR TRADING PROGRAM.
ONE OF THE LIMITATIONS OF HYPOTHETICAL PERFORMANCE RESULTS IS THAT THEY ARE GENERALLY PREPARED WITH THE BENEFIT OF HINDSIGHT. IN ADDITION, HYPOTHETICAL TRADING DOES NOT INVOLVE FINANCIAL RISK, AND NO HYPOTHETICAL TRADING RECORD CAN COMPLETELY ACCOUNT FOR THE IMPACT OF FINANCIAL RISK IN ACTUAL TRADING. FOR EXAMPLE, THE ABILITY TO WITHSTAND LOSSES OR TO ADHERE TO A PARTICULAR TRADING PROGRAM IN SPITE OF TRADING LOSSES ARE MATERIAL POINTS WHICH CAN ALSO ADVERSELY AFFECT ACTUAL TRADING RESULTS. THERE ARE NUMEROUS OTHER FACTORS RELATED TO THE MARKETS IN GENERAL OR TO THE IMPLEMENTATION OF ANY SPECIFIC TRADING PROGRAM WHICH CANNOT BE FULLY ACCOUNTED FOR IN THE PREPARATION OF HYPOTHETICAL PERFORMANCE RESULTS AND ALL OF WHICH CAN ADVERSELY AFFECT ACTUAL TRADING RESULTS.
| 102 |
Since the SCI was launched on November 4, 2010, there is no actual performance history of the SCI to present. However, the components of the SCI and the weighting of the components of the SCI are established each month based on purely quantitative data that is not subject to revisions based on other external factors. This data is available for periods prior to November 4, 2010. As a result, the table below reflects how the SCI would have performed from December 31, 2004 through December 31, 2014 had it been in effect during such time period. The performance data does not reflect any reinvestment or distribution profits, commission charges, management fees or other expenses that would have been incurred in connection with operating and managing a commodity pool designed to track the SCI. Such fees and expenses would reduce the performance returns shown in the table below.
Hypothetical Performance Results for the SCI for the period
from December 31, 2004 through December 31, 2014
| Year | Ending Level* | Annual Return | ||||||
| 2004 | 310.819 | 48.40 | % | |||||
| 2005 | 550.909 | 77.24 | % | |||||
| 2006 | 911.128 | 65.39 | % | |||||
| 2007 | 1,059.165 | 16.25 | % | |||||
| 2008 | 497.182 | (53.06 | )% | |||||
| 2009 | 1,153.122 | 131.93 | % | |||||
| 2010 | 1,491.949 | 29.38 | % | |||||
| 2011 | 1,164.510 | (21.95 | )% | |||||
| 2012 | 1,123.15 | 5.04 | % | |||||
| 2013 | 1,114.30 | (8.90 | )% | |||||
| 2014 | 937.33 | (15.88 | )% | |||||
| * | The “base level” for the SCI was set at 100 on January 2, 1991. The “Ending Level” represents the value of the components of the SCI on the last trading day of each year and is used to illustrate the cumulative performance of the SCI. |
PAST PERFORMANCE IS NOT NECESSARILY INDICATIVE OF FUTURE RESULTS
| 103 |
SCI Year-Over-Year
Hypothetical Total Returns (12/31/04-12/31/14)
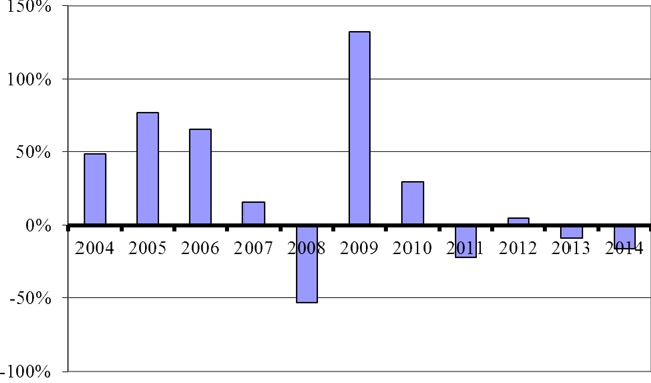
source: SHIM, Bloomberg
PAST PERFORMANCE IS NOT NECESSARILY INDICATIVE OF FUTURE RESULTS
The following table compares the hypothetical total return of the SCI in comparison with the actual total return a major index and spot copper prices (less storage cost) from December 31, 1997 through December 31, 2014.
| Hypothetical and Historical Results for the period from December 31, 1997 through December 31, 2014 | ||||||||||||
| BCOM HG TR | Spot Copper (less storage) | SCI TR | ||||||||||
| Total return | 306 | % | 130 | % | 499 | % | ||||||
| Average annual return (total) | 15.63 | % | 11.61 | % | 18.65 | % | ||||||
| Annualized volatility | 27.43 | % | 26.42 | % | 26.79 | % | ||||||
| Annualized Sharpe ratio | 0.48 | 0.35 | 0.60 | |||||||||
Source: SHIM, Bloomberg
PAST PERFORMANCE IS NOT NECESSARILY INDICATIVE OF FUTURE RESULTS
The table above shows the performance of the SCI from December 31, 1997 through December 31, 2014 in comparison with a traditional commodity index and spot copper prices: the Bloomberg Copper Sub index Total ReturnSM and spot copper prices less warehouse storage rents. The Bloomberg Copper Sub index Total ReturnSM includes the contract in the Bloomberg Commodity Index Total Return that relates to a single commodity, copper (currently the Copper High Grade futures contract traded on the COMEX). The data for the SCI is derived by using the SCI’s calculation methodology with historical prices for the futures contracts comprising the SCI. The information about the index above comes from publicly-available material about such index but is not designed to provide a thorough overview of the methodology of such index. The index noted above does not have investment objectives identical to the SCI. As a result, there are inherent limitations in comparing such performance against the SCI. For more information about the index and its methodologies, please refer to the material published by the sponsor of the Bloomberg Copper Sub index Total Return which may be found on its website. USCF is not responsible for any information found on such website, and such information is not part of this annual report on Form 10-K.
| 104 |
In the table above, “Total Return” refers to the return of the relevant index from December 31, 1997 to December 31, 2014; “Annualized Volatility” is a measure of the amount of variation or fluctuation in the returns of the relevant index. Annualized Volatility is calculated by taking the monthly standard deviation of the relevant index’s return and multiplying it by the square root of 12; and “Annualized Sharpe Ratio” is a measure of the total return of each relevant index adjusted by the risk-free interest rate (the 90-Day U.S. Treasury Bill yield) and the volatility of each index. Many investors consider volatility to be a measure of risk, and lower volatility of investment returns is considered a positive investment attribute as opposed to higher volatility. Annualized Sharpe Ratio is a standard measure for investors to compare two different investments or indexes that have different levels of volatility. If two indexes have the same total return, but one has lower Annualized Volatility, then its Annualized Sharpe Ratio will be higher. The higher the Annualized Sharpe Ratio, the better the risk-adjusted performance. Annualized Sharpe Ratio is calculated by taking the average monthly total return of the relevant index and subtracting the then current yield on the 90-Day U.S. Treasury Bill. The annualized return of this series is then divided by the Annualized Volatility of this series, and this result is the Annualized Sharpe Ratio for the relevant index. A higher Sharpe Ratio is not a guarantee that one investment or index will in the future produce better risk adjustment total returns, but USCF believes it is a useful tool for investors to consider when making investment decisions.
| 105 |
The following chart compares the hypothetical total return of the SCI in comparison with the actual return of three major indexes over a ten year period.
10 Year Comparison of Index Returns of the S&P GSCI Copper TR,
BCOM HG TR, Spot Copper price, Spot Copper Price less Storage Cost, and
the Hypothetical Returns of the SCI (12/31/04-12/31/14)
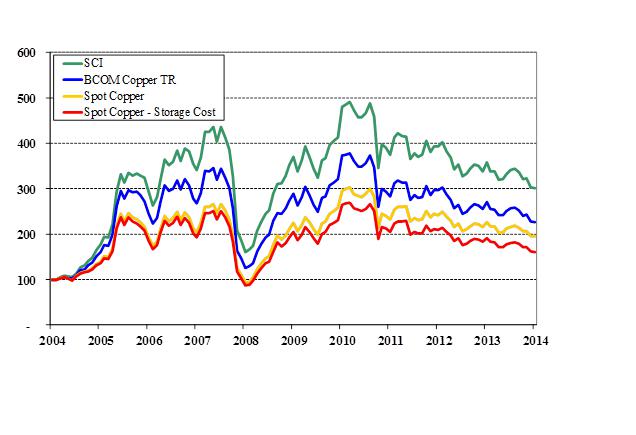
Source: SHIM, Bloomberg, LME
PAST PERFORMANCE IS NOT NECESSARILY INDICATIVE OF FUTURE RESULTS
| 106 |
The following chart compares the hypothetical total return of the SCI in comparison with the actual total return of two major indices and spot copper prices (less storage cost) over a five year period.
Five Year Comparison of Index Returns of the S&P GSCI Copper TR,
BCOM HG TR, Spot Copper price, Spot Copper Price less Storage
Cost, and the Hypothetical Returns of the SCI (12/31/09-12/31/14)
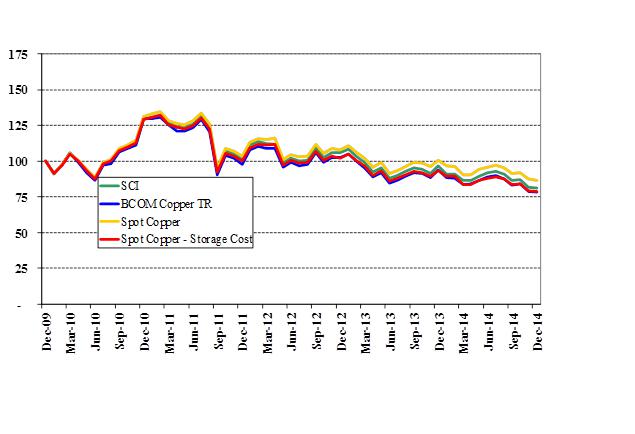
Source: SHIM, Bloomberg, LME
PAST PERFORMANCE IS NOT NECESSARILY INDICATIVE OF FUTURE RESULTS
| 107 |
SDAI
The table and chart below show the hypothetical performance of the SDAI from December 31, 2004 through December 31, 2014.
HYPOTHETICAL PERFORMANCE RESULTS HAVE MANY INHERENT LIMITATIONS, SOME OF WHICH ARE DESCRIBED BELOW. NO REPRESENTATION IS BEING MADE THAT USAG WILL OR IS LIKELY TO ACHIEVE PROFITS OR LOSSES SIMILAR TO THOSE SHOWN. IN FACT, THERE ARE FREQUENTLY SHARP DIFFERENCES BETWEEN HYPOTHETICAL PERFORMANCE RESULTS AND THE ACTUAL RESULTS ACHIEVED BY ANY PARTICULAR TRADING PROGRAM.
ONE OF THE LIMITATIONS OF HYPOTHETICAL PERFORMANCE RESULTS IS THAT THEY ARE GENERALLY PREPARED WITH THE BENEFIT OF HINDSIGHT. IN ADDITION, HYPOTHETICAL TRADING DOES NOT INVOLVE FINANCIAL RISK, AND NO HYPOTHETICAL TRADING RECORD CAN COMPLETELY ACCOUNT FOR THE IMPACT OF FINANCIAL RISK IN ACTUAL TRADING. FOR EXAMPLE, THE ABILITY TO WITHSTAND LOSSES OR TO ADHERE TO A PARTICULAR TRADING PROGRAM IN SPITE OF TRADING LOSSES ARE MATERIAL POINTS WHICH CAN ALSO ADVERSELY AFFECT ACTUAL TRADING RESULTS. THERE ARE NUMEROUS OTHER FACTORS RELATED TO THE MARKETS IN GENERAL OR TO THE IMPLEMENTATION OF ANY SPECIFIC TRADING PROGRAM WHICH CANNOT BE FULLY ACCOUNTED FOR IN THE PREPARATION OF HYPOTHETICAL PERFORMANCE RESULTS AND ALL OF WHICH CAN ADVERSELY AFFECT ACTUAL TRADING RESULTS.
Since the SDAI was launched on September 23, 2010, there is only actual performance history of the SDAI from that date to the present. However, the components of the SDAI and the weighting of the components of the SDAI are established each month based on purely quantitative data that is not subject to revisions based on other external factors. This data is available for periods prior to September 23, 2010. As a result, the table below reflects how the SDAI would have performed from December 31, 2004 through December 31, 2014 had it been in effect during such time period. The performance data does not reflect any reinvestment or distribution of profits, commission charges, management fees or other expenses that would have been incurred in connection with operating and managing a commodity pool designed to track the SDAI. Such fees and expenses would reduce the performance returns shown in the table below.
Hypothetical Performance Results for the period
from December 31, 2004 through December 31, 2014
| Year | Ending Level* | Annual Return | ||||||
| 2004 | 213.353 | 5.88 | % | |||||
| 2005 | 231.652 | 8.58 | % | |||||
| 2006 | 259.773 | 12.14 | % | |||||
| 2007 | 315.849 | 21.59 | % | |||||
| 2008 | 261.024 | (17.36 | )% | |||||
| 2009 | 282.237 | 8.13 | % | |||||
| 2010 | 377.898 | 33.89 | % | |||||
| 2011 | 348.780 | (7.71 | )% | |||||
| 2012 | 360.61 | 3.21 | % | |||||
| 2013 | 324.11 | (10.12 | )% | |||||
| 2014 | 329.880 | 1.78 | % | |||||
| * | The “base level” for the SDAI was set at 100 on January 2, 1991. The “Ending Level” represents the value of the components of the Index on the last trading day of each year and is used to illustrate the cumulative performance of the Index. |
PAST PERFORMANCE IS NOT NECESSARILY INDICATIVE OF FUTURE RESULTS
| 108 |
Summerhaven Dynamic Agriculture Index Year-Over-Year
Hypothetical Total Returns (12/31/04-12/31/14)
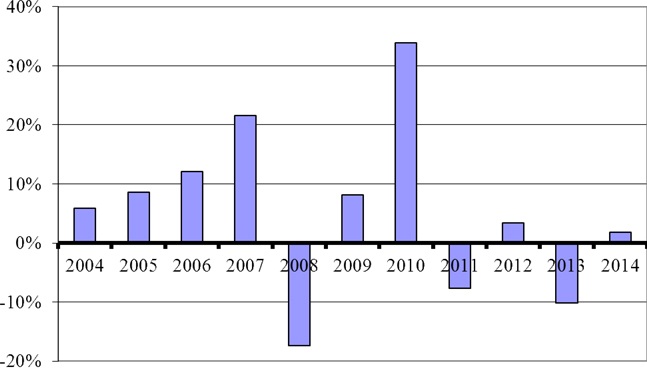
source: SHIM, Bloomberg
PAST PERFORMANCE IS NOT NECESSARILY INDICATIVE OF FUTURE RESULTS
The following table and chart compare the hypothetical total return of the SDAI in comparison with the actual total return of three major indexes from December 31, 1997 through December 31, 2014.
| Hypothetical and Historical Results for the period from December 31, 1997 through December 31, 2014 | ||||||||||||||||
| BCOM AG TR | S&P GSCI Ag TR | DB LCI OY Ag TR | SDAI | |||||||||||||
| Total return | (28 | )% | (57 | )% | (10 | )% | 53 | % | ||||||||
| Average annual return (total) | (0.39 | )% | (3.45 | )% | 0.43 | % | 3.40 | % | ||||||||
| Annualized volatility | 20.49 | % | 21.22 | % | 19.56 | % | 15.40 | % | ||||||||
| Annualized Sharpe ratio | (0.12 | ) | (0.25 | ) | (0.08 | ) | 0.08 | |||||||||
The table above shows the performance of the SDAI from December 31, 1997 through December 31, 2014 in comparison with three traditional agricultural commodities indices: the S&P GSCI® Agriculture Index Total Return, Bloomberg Agriculture Sub index Total ReturnSM, and the Deutsche Bank Liquid Commodity Index-Optimum Yield Agriculture Total ReturnTM. The S&P GSCI® Agriculture Index Total Return comprises the commodities: Wheat (Chicago and Kansas), Corn, Soybeans, Cotton, Sugar, Coffee, and Cocoa, and is part of a series of sub-indices representing components of the S&P GSCI. The Bloomberg Agriculture Sub index Total ReturnSM is currently composed of seven futures contracts on agricultural commodities traded on U.S. exchanges. The Deutsche Bank Liquid Commodity Index-Optimum Yield Agriculture Total ReturnTM is designed to reflect the performance of certain corn, wheat, soybean and sugar futures contracts plus the returns from investing in 3 month U.S. Treasury Bills. The data for the SDAI is derived by using the SDAI’s calculation methodology with historical prices for the futures contracts comprising the SDAI. The information about each of the indices comes from publicly-available material about such indices but is not designed to provide a thorough overview of the methodology of each index. None of the indices have investment objectives identical to the SDAI. As a result, there are inherent limitations in comparing the performance of such indices against the SDAI. For more information about these indices and their methodologies, please refer to the material published by the sponsors of each such index which may be found on their websites. USAG is not responsible for any information found on such website, and such information is not part of this annual report on Form 10-K.
| 109 |
In the table above, “Total Return” refers to the return of the relevant index from December 31, 1997 through December 31, 2014; “Annualized Volatility” is a measure of the amount of variation or fluctuation in the returns of the relevant index. Annualized Volatility is calculated by taking the monthly standard deviation of the relevant index’s return and multiplying it by the square root of 12; and “Annualized Sharpe Ratio” is a measure of the total return of each relevant index adjusted by the risk-free interest rate (the 90 Day U.S. Treasury Bill yield) and the volatility of each index. Many investors consider volatility to be a measure of risk, and lower volatility of investment returns is considered a positive investment attribute as opposed to higher volatility. Annualized Sharpe Ratio is a standard measure for investors to compare two different investments or indexes that have different levels of volatility. If two indexes have the same total return, but one has lower Annualized Volatility, then its Annualized Sharpe Ratio will be higher. The higher the Annualized Sharpe Ratio, the better the risk-adjusted performance. Annualized Sharpe Ratio is calculated by taking the average monthly total return of the relevant index and subtracting the then current yield on the 90 Day U.S. Treasury Bill. The annualized return of this series is then divided by the Annualized Volatility of this series, and this result is the Annualized Sharpe Ratio for the relevant index. A higher Sharpe Ratio is not a guarantee that one investment or index will in the future produce better risk adjustment total returns, but USCF believes it is a useful tool for investors to consider when making investment decisions.
10 Year Comparison of Index Returns of the BCOM AG TR, S&P GSCI Ag TR,
DB LCI OY Ag TR, and the Hypothetical Returns of the SDAI
(12/31/04-12/31/14)
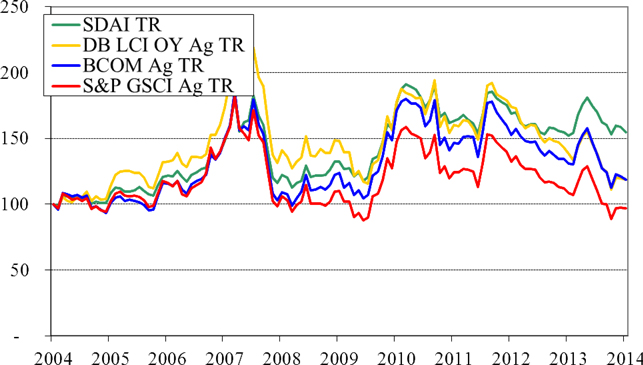
Source: SHIM, Bloomberg
PAST PERFORMANCE IS NOT NECESSARILY INDICATIVE OF FUTURE RESULTS
| 110 |
The following chart compares the hypothetical total return of the SDAI in comparison with the actual total return of three major indexes over a five year period.
Five Year Comparison of Index Returns of the BCOM AG TR, S&P GSCI Ag TR,
DB LCI OY Ag TR, and the Hypothetical Returns of the SDAI
(12/31/09-12/31/2014)
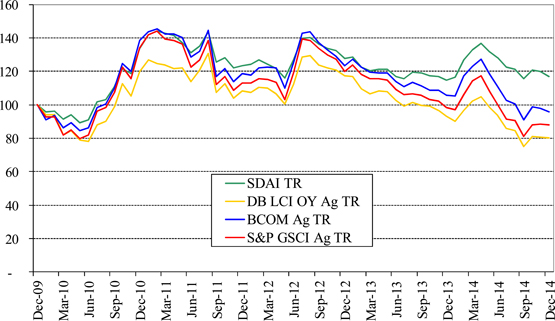
PAST PERFORMANCE IS NOT NECESSARILY INDICATIVE OF FUTURE RESULTS
| 111 |
SDMI
The table and chart below show the hypothetical performance of the SDMI from December 31, 2004 through December 31, 2014.
HYPOTHETICAL PERFORMANCE RESULTS HAVE MANY INHERENT LIMITATIONS, SOME OF WHICH ARE DESCRIBED BELOW. NO REPRESENTATION IS BEING MADE THAT USMI WILL OR IS LIKELY TO ACHIEVE PROFITS OR LOSSES SIMILAR TO THOSE SHOWN. IN FACT, THERE ARE FREQUENTLY SHARP DIFFERENCES BETWEEN HYPOTHETICAL PERFORMANCE RESULTS AND THE ACTUAL RESULTS ACHIEVED BY ANY PARTICULAR TRADING PROGRAM.
ONE OF THE LIMITATIONS OF HYPOTHETICAL PERFORMANCE RESULTS IS THAT THEY ARE GENERALLY PREPARED WITH THE BENEFIT OF HINDSIGHT. IN ADDITION, HYPOTHETICAL TRADING DOES NOT INVOLVE FINANCIAL RISK, AND NO HYPOTHETICAL TRADING RECORD CAN COMPLETELY ACCOUNT FOR THE IMPACT OF FINANCIAL RISK IN ACTUAL TRADING. FOR EXAMPLE, THE ABILITY TO WITHSTAND LOSSES OR TO ADHERE TO A PARTICULAR TRADING PROGRAM IN SPITE OF TRADING LOSSES ARE MATERIAL POINTS WHICH CAN ALSO ADVERSELY AFFECT ACTUAL TRADING RESULTS. THERE ARE NUMEROUS OTHER FACTORS RELATED TO THE MARKETS IN GENERAL OR TO THE IMPLEMENTATION OF ANY SPECIFIC TRADING PROGRAM WHICH CANNOT BE FULLY ACCOUNTED FOR IN THE PREPARATION OF HYPOTHETICAL PERFORMANCE RESULTS AND ALL OF WHICH CAN ADVERSELY AFFECT ACTUAL TRADING RESULTS.
Since the SDMI was launched on September 23, 2010, there is no actual performance history of the SDMI to present. However, the components of the SDMI and the weighting of the components of the SDMI are established each month based on purely quantitative data that is not subject to revisions based on other external factors. This data is available for periods prior to September 23, 2010. As a result, the table below reflects how the SDMI would have performed from December 31, 2004 through December 31, 2014 had it been in effect during such time period. The performance data does not reflect any reinvestment or distribution of profits, commission charges, management fees or other expenses that would have been incurred in connection with operating and managing a commodity pool designed to track the SDMI. Such fees and expenses would reduce the performance returns shown in the table below.
Hypothetical Performance Results for the period
from December 31, 2004 through December 31, 2014
| Year | Ending Level* | Annual Return | ||||||
| 2004 | 262.652 | 23.42 | % | |||||
| 2005 | 347.386 | 32.26 | % | |||||
| 2006 | 589.403 | 69.67 | % | |||||
| 2007 | 669.439 | 13.58 | % | |||||
| 2008 | 425.151 | (36.49 | )% | |||||
| 2009 | 735.929 | 73.10 | % | |||||
| 2010 | 975.580 | 32.56 | % | |||||
| 2011 | 823.695 | (15.57 | )% | |||||
| 2012 | 865.68 | 5.10 | % | |||||
| 2013 | 727.17 | (16.00 | )% | |||||
| 2014 | 665.580 | (8.47 | )% | |||||
| * | The “base level” for the SDMI was set at 100 on January 2, 1991. The “Ending Level” represents the value of the components of the Index on the last trading day of each year and is used to illustrate the cumulative performance of the Index. |
PAST PERFORMANCE IS NOT NECESSARILY INDICATIVE OF FUTURE RESULTS
| 112 |
Summerhaven Dynamic Metals Index Total Return Year-Over-Year
Hypothetical Total Returns (12/31/04-12/31/2014)
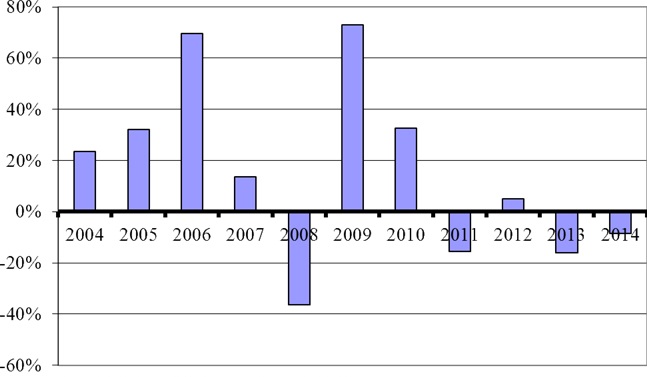
source: SHIM, Bloomberg
PAST PERFORMANCE IS NOT NECESSARILY INDICATIVE OF FUTURE RESULTS
The following table and chart compare the hypothetical total return of the SDMI in comparison with the actual total return of three major indexes between December 31, 1997 and December 31, 2014.
| Hypothetical and Historical Results for the period from December 31, 1997 through December 31, 2014 | ||||||||||||||||
| JJM | RICI Metals TR | DB LCI OY Industrial Metals TR | SDMI TR | |||||||||||||
| Total return | 124 | % | 283 | % | 195 | % | 428 | % | ||||||||
| Average annual return (total) | 9.88 | % | 11.50 | % | 11.96 | % | 13.97 | % | ||||||||
| Annualized volatility | 22.35 | % | 18.27 | % | 21.14 | % | 19.23 | % | ||||||||
| Annualized Sharpe ratio | 0.33 | 0.50 | 0.45 | 0.60 | ||||||||||||
PAST PERFORMANCE IS NOT NECESSARILY INDICATIVE OF FUTURE RESULTS
The table above shows the performance of the SDMI from December 31, 1997 through December 31, 2014 in comparison with three traditional metals indices: the Rogers International Commodity Index®–Metals Total Return, Bloomberg Industrial Metals Sub index Total ReturnSM (“JJM”), and the Deutsche Bank Liquid Commodity Index-Optimum Yield Industrial Metals Total ReturnTM. The Rogers International Commodity Index®–Metals Total Return is an index of ten metals commodity futures contracts, representing commodities consumed in the global economy and is a sub-index of the Rogers International Commodity Index. The Bloomberg Industrial Metals Sub index Total ReturnSM is currently composed of four futures contracts on industrial metals, three of which (aluminum, nickel and zinc) are traded on the LME and the other of which (copper) is traded on the COMEX division of the NYMEX. The Deutsche Bank Liquid Commodity Index-Optimum Yield Industrial Metals Total ReturnTM is designed to reflect the performance of certain futures contracts on aluminum, copper and zinc. The data for the SDMI Total Return Index is derived by using the SDMI’s calculation methodology with historical prices for the futures contracts comprising the SDMI. The information about each of the indices comes from publicly-available material about such indices but is not designed to provide a thorough overview of the methodology of each index. None of the indices have investment objectives identical to the SDMI. As a result, there are inherent limitations in comparing the performance of such indices against the SDMI. For more information about these indices and their methodologies, please refer to the material published by the sponsors of each such index which may be found on their websites. USMI is not responsible for any information found on such websites, and such information is not part of this annual report on Form 10-K.
| 113 |
In the table above, “Total Return” refers to the return of the relevant index from December 31, 1997 to December 31, 2014; “Annualized Volatility” is a measure of the amount of variation or fluctuation in the returns of the relevant index. Annualized Volatility is calculated by taking the monthly standard deviation of the relevant index’s return and multiplying it by the square root of 12; and “Annualized Sharpe Ratio” is a measure of the total return of each relevant index adjusted by the risk-free interest rate (the 90 Day U.S. Treasury Bill yield) and the volatility of each index. Many investors consider volatility to be a measure of risk, and lower volatility of investment returns is considered a positive investment attribute as opposed to higher volatility. Annualized Sharpe Ratio is a standard measure for investors to compare two different investments or indexes that have different levels of volatility. If two indexes have the same total return, but one has lower Annualized Volatility, then its Annualized Sharpe Ratio will be higher. The higher the Annualized Sharpe Ratio, the better the risk-adjusted performance. Annualized Sharpe Ratio is calculated by taking the average monthly total return of the relevant index and subtracting the then current yield on the 90 Day U.S. Treasury Bill. The annualized return of this series is then divided by the Annualized Volatility of this series, and this result is the Annualized Sharpe Ratio for the relevant index. A higher Sharpe Ratio is not a guarantee that one investment or index will in the future produce better risk adjustment total returns, but USCF believes it is a useful tool for investors to consider when making investment decisions.
| 114 |
10 Year Comparison of Index Returns of the JJM,
RICI Metals TR, DB LCI OY IM TR, and the Hypothetical Returns of the SDMI
(12/31/04-12/31/14)
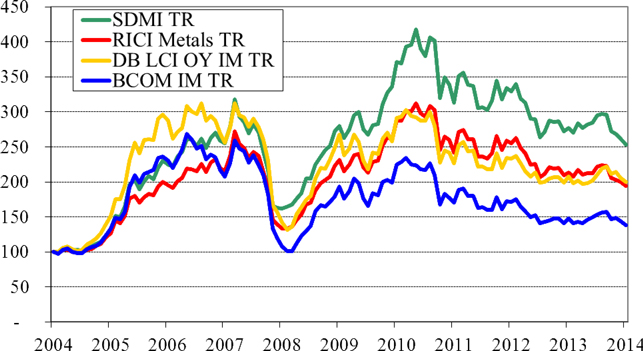
Source: SHIM, Bloomberg
PAST PERFORMANCE IS NOT NECESSARILY INDICATIVE OF FUTURE RESULTS
| 115 |
The following chart compares the hypothetical total return of the SDMI in comparison with the actual total return of three major indexes over a five year period.
Five Year Comparison of Index Returns of the JJM,
RICI Metals TR, DB LCI OY IM TR, and the Hypothetical Returns of the SDMI
(12/31/09-12/31/14)
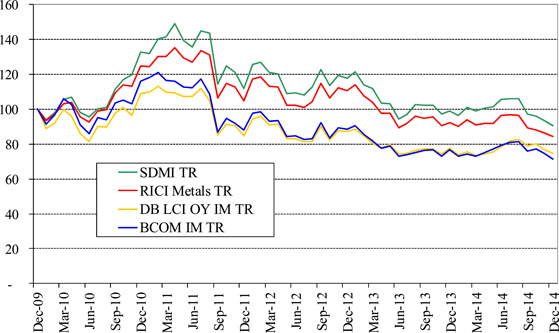
Source: SHIM, Bloomberg
PAST PERFORMANCE IS NOT NECESSARILY INDICATIVE OF FUTURE RESULTS
Critical Accounting Policies
Preparation of the financial statements and related disclosures in compliance with accounting principles generally accepted in the United States of America requires the application of appropriate accounting rules and guidance, as well as the use of estimates. The Trust’s application of these policies involves judgments and actual results may differ from the estimates used.
USCF has evaluated the nature and types of estimates that it makes in preparing the Trust’s financial statements and related disclosures and has determined that the valuation of Applicable Interests, which are not traded on a United States or internationally recognized futures exchange (such as forward contracts and over-the-counter contracts) involves a critical accounting policy. The values which are used by each Trust Series for its Futures Contracts are provided by its commodity broker who uses market prices when available, while over-the-counter contracts are valued based on the present value of estimated future cash flows that would be received from or paid to a third party in settlement of these derivative contracts prior to their delivery date and valued on a daily basis. In addition, each Trust Series estimates interest income on a daily basis using prevailing rates earned on its cash and cash equivalents. These estimates are adjusted to the actual amount received on a monthly basis and the difference, if any, is not considered material.
| 116 |
Liquidity and Capital Resources
None of the Trust Series has made, and does not anticipate making, use of borrowings or other lines of credit to meet its obligations. Each Trust Series has met, and it is anticipated that each Trust Series will continue to meet, its liquidity needs in the normal course of business from the proceeds of the sale of its investments, or from the Treasuries, cash and/or cash equivalents that it intends to hold at all times. Each Trust Series’ liquidity needs include: redeeming shares, providing margin deposits for its existing Futures Contracts or the purchase of additional Futures Contracts and posting collateral for its over-the-counter Applicable Interests, respectively, if applicable, and, except as noted below, payment of its expenses, summarized below under “Contractual Obligations.”
Each Trust Series currently generates cash primarily from: (i) the sale of Creation Baskets and (ii) income earned on Treasuries, cash and/or cash equivalents. Each Trust Series has allocated substantially all of its net assets to trading in Applicable Interests. Each Trust Series invests in Applicable Interests to the fullest extent possible without being leveraged or unable to satisfy its current or potential margin or collateral obligations with respect to its investments in Applicable Interests. A significant portion of each Trust Series’ NAV is held in Treasuries, cash and cash equivalents that are used as margin and as collateral for its trading in Applicable Interests. The balance of the assets is held in each Trust Series’ account at the Custodian and in Treasuries at the FCM. Income received from any investments in money market funds and Treasuries by a Trust Series will be paid to such Trust Series. During the year ended December 31, 2014, the Trust Series’ expenses exceeded the income earned or the cash earned from the sale of Creation Baskets and the redemption of Redemption Baskets. During the year ended December 31, 2013, the Trust Series’ expenses exceeded the income each Trust Series earned and the cash earned from the sale of Creation Baskets. During the years ended December 31, 2014 and 2013, each Trust Series used income and cash holdings to pay expenses, which could cause a decline in each Trust Series’ NAV over time. To the extent expenses exceed income, each Trust Series’ NAV will be negatively impacted.
Each Trust Series’ investments in Applicable Interests may be subject to periods of illiquidity because of market conditions, regulatory considerations and other reasons. For example, most commodity exchanges limit the fluctuations in futures contract prices during a single day by regulations referred to as “daily limits.” During a single day, no trades may be executed at prices beyond the daily limit. Once the price of a futures contract has increased or decreased by an amount equal to the daily limit, positions in the contracts can neither be taken nor liquidated unless the traders are willing to effect trades at or within the specified daily limit. Such market conditions could prevent a Trust Series from promptly liquidating its positions in Futures Contracts. During the year ended December 31, 2014, none of the Trust Series was forced to purchase or liquidate any of its positions while daily limits were in effect; however, no Trust Series can predict whether such an event may occur in the future.
Prior to the initial offering of each Trust Series, all payments with respect to each Trust Series’ expenses are paid by USCF. None of the Trust Series has an obligation or intention to refund such payments made by USCF. USCF is under no obligation to pay any Trust Series’ future expenses. Since the initial offering of shares, each Trust Series has been responsible for expenses relating to: (i) management fees, (ii) brokerage fees and commissions, (iii) ongoing registration expenses in connection with offers and sales of its shares subsequent to the initial offering, (iv) other expenses, including tax reporting costs, (v) the fees of the Trustee in connection with its services as Delaware trustee of the Trust, (vi) fees and expenses of the independent directors of USCF and (vii) other extraordinary expenses not in the ordinary course of business, while USCF has been responsible for expenses relating to the fees of the Trust Series’ Marketing Agent, Administrator and Custodian, the trading advisory and licensing fees of SummerHaven and offering expenses relating to the initial offering of shares of each Trust Series. If USCF and each Trust Series are unsuccessful in raising sufficient funds to cover these respective expenses or in locating any other source of funding, one or more of the Trust Series could terminate and investors may lose all or part of their investment.
Market Risk
Trading in Applicable Interests such as Futures Contracts involves each Trust Series entering into contractual commitments to purchase or sell specified amounts of commodities at a specified date in the future. The aggregate market value of the contracts will significantly exceed each Trust Series’ future cash requirements since each Trust Series intends to close out its open positions prior to settlement. As a result, each Trust Series is generally only subject to the risk of loss arising from the change in value of the contracts. Each Trust Series considers the “fair value” of its derivative instruments to be the unrealized gain or loss on the contracts. The market risk associated with each Trust Series’ commitments to purchase a specific commodity will be limited to the aggregate market value of the contracts held.
| 117 |
Each Trust Series’ exposure to market risk depends on a number of factors, including the markets for commodities, the volatility of interest rates and foreign exchange rates, the liquidity of the Applicable Interest markets and the relationships among the contracts held by each such Trust Series. The limited experience that each Trust Series has had in utilizing its model to trade in Applicable Interests in a manner intended to track the changes in the Applicable Index, as well as drastic market occurrences, could ultimately lead to the loss of all or substantially all of an investor’s capital.
Credit Risk
When a Trust Series enters into Futures Contracts and Other Related Investments, it is exposed to the credit risk that the counterparty will not be able to meet its obligations. The counterparty for the Futures Contracts traded on the Futures Exchanges is the clearinghouse associated with the particular exchange. In general, in addition to margin required to be posted by the clearinghouse in connection with cleared trades, clearinghouses are backed by their members who may be required to share in the financial burden resulting from the nonperformance of one of their members and, therefore, this additional member support should significantly reduce credit risk. Some foreign exchanges are not backed by their clearinghouse members but may be backed by a consortium of banks or other financial institutions. Unlike in the case of exchange-traded Futures Contracts, the counterparty to an over-the-counter contract is generally a single bank or other financial institution. As a result, there will be greater counterparty credit risk in over-the-counter transactions. There can be no assurance that any counterparty, clearinghouse, or their members or their financial backers will satisfy their obligations to a Trust Series in such circumstances.
USCF attempts to manage the credit risk of each Trust Series by following various trading limitations and policies. In particular, each Trust Series generally posts margin and/or holds liquid assets that are approximately equal to the market value of its obligations to counterparties under the Futures Contracts and Other Related Investments it holds. USCF has implemented procedures that include, but are not limited to, executing and clearing trades and entering into over-the-counter transactions only with creditworthy parties and/or requiring the posting of collateral or margin by such parties for the benefit of each Trust Series to limit its credit exposure. Newedge, each Trust Series’ commodity broker, or any other broker that may be retained by a Trust Series in the future, when acting as the Trust Series’ FCM in accepting orders to purchase or sell Futures Contracts on United States exchanges, is required by CFTC regulations to separately account for and segregate as belonging to a Trust Series, all assets of a Trust Series relating to domestic Futures Contracts trading. These FCMs are not allowed to commingle a Trust Series’ assets with their other assets. In addition, the CFTC requires commodity brokers to hold in a secure account a Trust Series’ assets related to foreign Futures Contracts trading. During the year ended December 31, 2014, the only foreign exchanges on which USCI made investments were the ICE Futures, which is a London based futures exchange, and the LME, which is a London based metal commodities exchange. Those Futures Contracts are denominated in U.S. dollars. During the year ended December 31, 2014, CPER did not make investments on any foreign exchanges. During the year ended December 31, 2014, the only foreign exchange on which USAG made investments was the ICE Futures. Those Futures Contracts are denominated in Canadian dollars and U.S. dollars. During the year ended December 31, 2014, the only foreign exchange on which USMI made investments was the LME. Those Futures Contracts are denominated in U.S. dollars.
If, in the future, a Trust Series purchases over-the-counter contracts, see “Item 7A. Quantitative and Qualitative Disclosures About Market Risk” in this annual report on Form 10-K for a discussion of over-the-counter contracts.
As of December 31, 2014, each of USCI, CPER, USAG and USMI held cash deposits and investments in Treasuries in the amount of $792,207,276, $3,066,521, $2,365,241 and $2,120,591, respectively, with the Custodian and FCM. Some or all of these amounts may be subject to loss should the Trust Series’ Custodian and/or FCM cease operations.
Off Balance Sheet Financing
As of December 31, 2014, neither the Trust nor any Trust Series had any loan guarantee, credit support or other off-balance sheet arrangement of any kind other than agreements entered into in the normal course of business, which may include indemnification provisions relating to certain risks that service providers undertake in performing services which are in the best interests of any Trust Series. While each Trust Series’ exposure under these indemnification provisions cannot be estimated, they are not expected to have a material impact on any Trust Series’ financial position.
| 118 |
European Sovereign Debt
None of the Trust Series had direct exposure to European sovereign debt as of December 31, 2014 or had direct exposure to European sovereign debt as of the filing of this annual report on Form 10-K.
Redemption Basket Obligation
In order to meet its investment objective and pay its contractual obligations described below, each Trust Series requires liquidity to redeem shares, which redemptions must be in blocks of 50,000 shares called “Redemption Baskets.” Each Trust Series has to date satisfied this obligation by paying from the cash or cash equivalents it holds or through the sale of its Treasuries in an amount proportionate to the number of shares being redeemed. From July 1, 2011 through December 31, 2014 (and continuing at least through May 1, 2015), Authorized Participants pay USCI $350 for each order placed to create one or more Creation Baskets or to redeem one or more Redemption Baskets; prior to July 1, 2011, Authorized Participants paid USCI $1,000 for each order placed to create one or more Creation Baskets or to redeem one or more Redemption Baskets. From May 1, 2012 through December 31, 2014 (and continuing at least through May 1, 2015), Authorized Participants pay each of CPER and USAG $350 for each order placed to create one or more Creation Baskets or to redeem one or more Redemption Baskets (for USMI, the period from May 1, 2012 through March 18, 2015); prior to May 1, 2012, Authorized Participants paid $1,000 for each order placed to create one or more Creation Baskets or to redeem one or more Redemption Baskets.
Contractual Obligations
The Trust’s (and each series thereunder) primary contractual obligations are with USCF and certain other service providers. USCF, in return for its services, is entitled to a management fee calculated as a fixed percentage of a Trust Series’ NAV. Effective May 1, 2014 and continuing through December 31, 2015, USCF has contractually agreed to lower the management fee to 0.80% per annum of average daily total net assets for USCI, 0.65% per annum of average daily total net assets for CPER, 0.65% per annum of average daily total net assets for USAG and 0.65% per annum of average daily total net assets for USMI. Effective as of May 29, 2012 through April 30, 2014, USCF voluntarily waived the management fee paid by each of CPER and USAG from 0.95% to 0.65% and 0.80% per annum of average daily total net assets, respectively. Effective as of May 30, 2012 through April 30, 2015, USCF voluntarily waived the management fee paid by USMI from 0.95% to 0.70% per annum of average daily total net assets. The reduced fee for USMI became operational as of June 19, 2012, the date USMI became listed on the NYSE Arca. Ongoing fees, costs and expenses of its operation for which a Trust Series is responsible include:
| • | brokerage and other fees and commissions incurred in connection with the trading activities of each Trust Series; |
| • | expenses incurred in connection with registering additional shares of each Trust Series or offering shares of each Trust Series after the time any shares of each Trust Series have begun trading on the NYSE Arca; |
| • | the routine expenses associated with distribution, including printing and mailing, of any monthly, annual and other reports to shareholders required by applicable U.S. federal and state regulatory authorities; |
| • | payment for routine services of the Trustee, legal counsel and independent accountants; |
| • | payment for fees associated with tax accounting and reporting, routine accounting, bookkeeping, whether performed by an outside service provider or by affiliates of USCF; |
| • | costs and expenses associated with investor relations and services; |
| • | the payment of any distributions related to redemption of shares; |
| • | payment of all federal, state, local or foreign taxes payable on the income, assets or operations of each Trust Series and the preparation of all tax returns related thereto; |
| • | fees and expenses of the independent directors of USCF; and |
| • | extraordinary expenses (including, but not limited to, indemnification of any person against liabilities and obligations to the extent permitted by law and required under the Trust Agreement and the bringing and defending of actions at law or in equity and otherwise engaging in the conduct of litigation and the incurring of legal expense and the settlement of claims and litigation). |
| 119 |
While USCF has agreed to pay registration fees to the SEC, FINRA, NYSE Arca or any other regulatory agency or exchange in connection with the initial offer and sale of the shares and the legal, printing, accounting and other expenses associated with such registration, each Trust Series is responsible for any registration fees and related expenses incurred in connection with any subsequent offer and sale of its shares after the initial offering of shares.
Each Trust Series pays its own brokerage and other transaction costs. Each Trust Series pays fees to FCMs in connection with its transactions in Futures Contracts. For the year ended December 31, 2014, FCM fees were approximately 0.09% of average daily total net assets for USCI, approximately 0.06% of average daily total net assets for CPER, approximately 0.08% of average daily total net assets for USAG and approximately 0.04% of average daily total net assets for USMI. In general, transaction costs on over-the-counter Applicable Interests and on Treasuries and other short-term securities are embedded in the purchase or sale price of the instrument being purchased or sold, and may not readily be estimated. USCF had voluntarily agreed to pay certain expenses normally borne by USCI to the extent that such expenses exceeded 0.15% (15 basis points) of USCI’s NAV, on an annualized basis, through March 31, 2011. As of March 31, 2011, the expense waiver was no longer in effect for USCI. USCF has voluntarily agreed to pay certain expenses normally borne by each of CPER, USAG and USMI to the extent that such expenses exceed 0.15% (15 basis points) of each of CPER’s, USAG’s and USMI’s NAV, on an annualized basis, through at least May 1, 2015. USCF has no obligation to continue such payments into subsequent periods. This voluntary expense waiver is in addition to those amounts USCF is contractually obligated to pay as described in Note 5.
The parties cannot anticipate the amount of payments that will be required under these arrangements for future periods, as each Trust Series’ NAVs and trading levels to meet its investment objective will not be known until a future date. These agreements are effective for a specific term agreed upon by the parties with an option to renew, or, in some cases, are in effect for the duration of a Trust Series’ existence. Either party may terminate these agreements earlier for certain reasons described in the agreements.
As of December 31, 2014, USCI’s portfolio consisted of 16,989 Futures Contracts traded on the Futures Exchanges, CPER’s portfolio consisted of 40 Futures Contracts traded on the COMEX, USAG’s portfolio consisted of 82 Futures Contracts traded on the Futures Exchanges and USMI’s portfolio consisted of 87 Futures Contracts traded on the Futures Exchanges. For a list of each of USCI’s, CPER’s, USAG’s and USMI’s current holdings, please see www.unitedstatescommodityfunds.com. See “Portfolio Holdings” for a complete list of Futures Contracts held by each of USCI, CPER, USAG and USMI during the year ended December 31, 2014.
| Item 7A. | Quantitative and Qualitative Disclosures About Market Risk. |
Over-the-Counter Derivatives (Including Spreads and Straddles)
Each Trust Series may purchase over-the-counter contracts (“OTC Contracts”). Unlike most exchange-traded futures contracts or exchange-traded options on such futures, each party to an OTC Contract bears the credit risk that the other party may not be able to perform its obligations under its contract.
The Trust, on behalf of each Trust Series, may enter into certain transactions where an over-the-counter component is exchanged for a corresponding futures contract (“Exchange for Risk” or “EFR” transaction). These EFR transactions may expose a Trust Series to counterparty risk during the interim period between the execution of the over-the-counter component and the exchange for a corresponding futures contract. Generally, the counterparty risk from the EFR transaction will exist only on the day of execution.
Swap transactions, like other financial transactions, involves a variety of significant risks. The specific risks presented by a particular swap transaction necessarily depend upon the terms and circumstances of the transaction. In general, however, all swap transactions involve some combination of market risk, credit risk, counterparty risk, funding risk, liquidity risk and operational risk.
Highly customized swap transactions in particular may increase liquidity risk, which may result in a suspension of redemptions. Highly leveraged transactions may experience substantial gains or losses in value as a result of relatively small changes in the value or level of an underlying or related market factor.
| 120 |
In evaluating the risks and contractual obligations associated with a particular swap transaction, it is important to consider that a swap transaction may be modified or terminated only by mutual consent of the original parties and subject to agreement on individually negotiated terms. Therefore, it may not be possible for USCF to modify, terminate or offset a Trust Series’ obligations or its exposure to the risks associated with a transaction prior to its scheduled termination date. To reduce the credit risk that arises in connection with such contracts, a Trust Series will generally enter into an agreement with each counterparty based on the Master Agreement published by ISDA that provides for the netting of its overall exposure to its counterparty if the counterparty is unable to meet its obligations to the Trust Series due to the occurrence of a specified event, such as the insolvency of the counterparty.
A Trust Series assesses or reviews, as appropriate, the creditworthiness of each potential or existing counterparty to an OTC Contract pursuant to guidelines approved by USCF’s Board. Furthermore, USCF on behalf of a Trust Series only enters into OTC Contracts with counterparties who are, or are affiliates of, (a) banks regulated by a United States federal bank regulator, (b) broker-dealers regulated by the SEC, (c) insurance companies domiciled in the United States, or (d) producers, users or traders of energy, whether or not regulated by the CFTC. Any entity acting as a counterparty shall be regulated in either the United States or the United Kingdom unless otherwise approved by the Board after consultation with its legal counsel. Existing counterparties are also reviewed periodically by USCF. A Trust Series will also require that the counterparty be highly rated and/or provide collateral or other credit support. Even if collateral is used to reduce counterparty credit risk, sudden changes in the value of OTC transactions may leave a party open to financial risk due to a counterparty default since the collateral held may not cover a party’s exposure on the transaction in such situations.
In general, valuing OTC derivatives is less certain than valuing actively traded financial instruments such as exchange-traded futures contracts and securities or cleared swaps because the price and terms on which such OTC derivatives are entered into or can be terminated are individually negotiated, and those prices and terms may not reflect the best price or terms available from other sources. In addition, while market makers and dealers generally quote indicative prices or terms for entering into or terminating OTC Contracts, they typically are not contractually obligated to do so, particularly if they are not a party to the transaction. As a result, it may be difficult to obtain an independent value for an outstanding OTC derivatives transaction.
During the 12 month reporting period ended December 31, 2014, each Trust Series limited its over-the-counter activities to EFR transactions.
Each Trust Series anticipates that the use of Other Related Investments together with its investments in Futures Contracts will produce price and total return results that closely track the investment goals of such Trust Series. However, there can be no assurance of this. OTC Contracts may result in higher transaction-related expenses than the brokerage commissions paid in connection with the purchase of Futures Contracts, which may impact a Trust Series’ ability to successfully track its Applicable Index.
| 121 |
| Item 8. | Financial Statements and Supplementary Data. |
United States Commodity Index Funds Trust
Index to Financial Statements
| 122 |
Management’s Annual Report on Internal Control Over Financial Reporting.
USCF assessed the effectiveness of the Trust’s and each Trust Series’ internal control over financial reporting as of December 31, 2014. In making this assessment, it used the criteria set forth by the Committee of Sponsoring Organizations of the Treadway Commission in Internal Control Integrated Framework. Based on the assessment, USCF believes that, as of December 31, 2014, the internal control over financial reporting for the Trust and each Trust Series is effective.
| 123 |
Attestation Report of Registered Public Accounting Firm.
Report of Independent Registered Public Accounting Firm
Auditors’ Report on Internal Control over Financial Reporting
To the Sponsor of
United States Commodity Index Funds Trust
We have audited the internal control over financial reporting of the United States Commodity Index Funds Trust (the “Trust”), the United States Commodity Index Fund, the United States Copper Index Fund, the United States Agriculture Index Fund and the United States Metals Index Fund (collectively, the “Series”) as of December 31, 2014, based on criteria established in Internal Control — Integrated Framework issued by the Committee of Sponsoring Organizations of the Treadway Commission. The Trust’s and the Series’ management is responsible for maintaining effective internal control over financial reporting and for its assessment of the effectiveness of internal control over financial reporting, included in the accompanying Management’s Annual Report on Internal Control Over Financial Reporting. Our responsibility is to express an opinion on the Trust’s and the Series’ internal control over financial reporting based on our audit.
We conducted our audit in accordance with the standards of the Public Company Accounting Oversight Board (United States). Those standards require that we plan and perform the audit to obtain reasonable assurance about whether effective internal control over financial reporting was maintained in all material respects. Our audit of internal control over financial reporting included obtaining an understanding of internal control over financial reporting, assessing the risk that a material weakness exists, and testing and evaluating the design and operating effectiveness of internal control based on the assessed risk. Our audit also included performing such other procedures as we considered necessary in the circumstances. We believe that our audit provides a reasonable basis for our opinion.
An entity’s internal control over financial reporting is a process designed to provide reasonable assurance regarding the reliability of financial reporting and the preparation of financial statements for external purposes in accordance with accounting principles generally accepted in the United States of America. An entity’s internal control over financial reporting includes those policies and procedures that (1) pertain to the maintenance of records that, in reasonable detail, accurately and fairly reflect the transactions and dispositions of the assets of the entity; (2) provide reasonable assurance that transactions are recorded as necessary to permit preparation of financial statements in accordance with generally accepted accounting principles, and that receipts and expenditures of the entity are being made only in accordance with authorizations of management and directors of the entity; and (3) provide reasonable assurance regarding prevention or timely detection of unauthorized acquisition, use, or disposition of the entity’s assets that could have a material effect on the financial statements.
Because of its inherent limitations, internal control over financial reporting may not prevent or detect misstatements. Also, projections of any evaluation of the effectiveness to future periods are subject to the risk that the controls may become inadequate because of changes in conditions, or that the degree of compliance with the policies or procedures may deteriorate.
In our opinion, the Trust and the Series maintained, in all material respects, effective internal control over financial reporting as of December 31, 2014, based on the criteria established in Internal Control — Integrated Framework issued by the Committee of Sponsoring Organizations of the Treadway Commission.
We have also audited, in accordance with the standards of the Public Company Accounting Oversight Board (United States), the financial statements as of and for the year ended December 31, 2014, of the Trust and the Series and our report dated March 16, 2015 expressed an unqualified opinion on those financial statements.
/s/ Spicer Jeffries LLP
Greenwood Village, Colorado
March 16, 2015
| 124 |
Report of Independent Registered Public Accounting Firm
To the Sponsor of
United States Commodity Index Funds Trust
We have audited the accompanying statements of financial condition of the United States Commodity Index Funds Trust (the “Trust”), the United States Commodity Index Fund, the United States Copper Index Fund, the United States Agriculture Index Fund and the United States Metals Index Fund (collectively, the “Series”), in total and for the Series as of December 31, 2014 and 2013, including the schedule of investments as of December 31, 2014 and 2013, and the related statements of operations, changes in capital and changes in shares outstanding and cash flows for the years ended December 31, 2014, 2013 and 2012. These financial statements are the responsibility of the Trust’s management. Our responsibility is to express an opinion on these financial statements based on our audits.
We conducted our audits in accordance with standards of the Public Company Accounting Oversight Board (United States). Those standards require that we plan and perform the audits to obtain reasonable assurance about whether the financial statements are free of material misstatement. An audit includes examining, on a test basis, evidence supporting the amounts and disclosures in the financial statements. An audit also includes assessing the accounting principles used and significant estimates made by management, as well as evaluating the overall financial statement presentation. We believe that our audits provide a reasonable basis for our opinion.
In our opinion, the financial statements referred to above present fairly, in all material respects, the financial position of the United States Commodity Index Funds Trust, the United States Commodity Index Fund, the United States Copper Index Fund, the United States Agriculture Index Fund and the United States Metals Index Fund as of December 31, 2014 and 2013, and the results of their operations and their cash flows for the years ended December 31, 2014, 2013 and 2012, in conformity with accounting principles generally accepted in the United States of America.
We also have audited, in accordance with standards of the Public Company Accounting Oversight Board (United States), the Trust’s and the Series’ internal control over financial reporting as of December 31, 2014, based on criteria established in Internal Control — Integrated Framework issued by the Committee of Sponsoring Organizations of the Treadway Commission and our report dated March 16, 2015 expressed an unqualified opinion on the Trust’s and the Series’ internal control over financial reporting.
/s/ Spicer Jeffries LLP
Greenwood Village, Colorado
March 16, 2015
| 125 |
United States Commodity Index Funds Trust
Statements of Financial Condition
At December 31, 2014 and 2013
United States Commodity Index Fund
| 2014 | 2013 | |||||||
| Assets | ||||||||
| Cash and cash equivalents (Notes 2 and 6) | $ | 711,984,950 | $ | 474,123,523 | ||||
| Equity in trading accounts: | ||||||||
| Cash and cash equivalents | 80,222,326 | 20,316,553 | ||||||
| Unrealized gain (loss) on open commodity futures contracts | (38,267,159 | ) | 10,789,747 | |||||
| Receivable for shares sold | — | 8,491,911 | ||||||
| Interest receivable | 1,261 | 1,261 | ||||||
| ETF transaction fees receivable | 1,050 | 350 | ||||||
| Total assets | $ | 753,942,428 | $ | 513,723,345 | ||||
| Liabilities and Capital | ||||||||
| Payable for shares redeemed | $ | 43,736,649 | $ | — | ||||
| Management fees payable (Note 4) | 531,781 | 403,494 | ||||||
| Professional fees payable | 494,705 | 343,663 | ||||||
| Brokerage commissions payable | 42,815 | 22,815 | ||||||
| Directors' fees and insurance payable | 15,638 | 8,199 | ||||||
| Registration fees payable | — | 152 | ||||||
| Total liabilities | 44,821,588 | 778,323 | ||||||
| Commitments and Contingencies (Notes 4, 5 and 6) | ||||||||
| Capital | ||||||||
| Sponsor | — | — | ||||||
| Shareholders | 709,120,840 | 512,945,022 | ||||||
| Total Capital | 709,120,840 | 512,945,022 | ||||||
| Total liabilities and capital | $ | 753,942,428 | $ | 513,723,345 | ||||
| Shares outstanding | 14,700,000 | 9,150,000 | ||||||
| Net asset value per share | $ | 48.24 | $ | 56.06 | ||||
| Market value per share | $ | 48.29 | $ | 56.08 | ||||
See accompanying notes to financial statements.
| 126 |
United States Commodity Index Funds Trust
Statements of Financial Condition
At December 31, 2014 and 2013
United States Copper Index Fund
| 2014 | 2013 | |||||||
| Assets | ||||||||
| Cash and cash equivalents (Notes 2 and 6) | $ | 2,729,373 | $ | 2,040,735 | ||||
| Equity in trading accounts: | ||||||||
| Cash and cash equivalents | 337,148 | 125,960 | ||||||
| Unrealized gain (loss) on open commodity futures contracts | (197,525 | ) | 130,163 | |||||
| Receivable from Sponsor (Note 4) | 42,830 | 81,789 | ||||||
| Interest receivable | 25 | 25 | ||||||
| Total assets | $ | 2,911,851 | $ | 2,378,672 | ||||
| Liabilities and Capital | ||||||||
| Management fees payable (Note 4) | $ | 1,612 | $ | 1,229 | ||||
| Professional fees payable | 44,577 | 85,228 | ||||||
| Directors' fees and insurance payable | 35 | 16 | ||||||
| Total liabilities | 46,224 | 86,473 | ||||||
| Commitments and Contingencies (Notes 4, 5 and 6) | ||||||||
| Capital | ||||||||
| Sponsor | — | — | ||||||
| Shareholders | 2,865,627 | 2,292,199 | ||||||
| Total Capital | 2,865,627 | 2,292,199 | ||||||
| Total liabilities and capital | $ | 2,911,851 | $ | 2,378,672 | ||||
| Shares outstanding | 150,000 | 100,000 | ||||||
| Net asset value per share | $ | 19.10 | $ | 22.92 | ||||
| Market value per share | $ | 19.02 | $ | 22.90 | ||||
See accompanying notes to financial statements.
| 127 |
United States Commodity Index Funds Trust
Statements of Financial Condition
At December 31, 2014 and 2013
United States Agriculture Index Fund
| 2014 | 2013 | |||||||
| Assets | ||||||||
| Cash and cash equivalents (Notes 2 and 6) | $ | 2,142,415 | $ | 2,098,545 | ||||
| Equity in trading accounts: | ||||||||
| Cash and cash equivalents | 222,826 | 230,081 | ||||||
| Unrealized gain (loss) on open commodity futures contracts | (66,576 | ) | (44,533 | ) | ||||
| Receivable from Sponsor (Note 4) | 39,139 | 81,772 | ||||||
| Interest receivable | 46 | 46 | ||||||
| Total assets | $ | 2,337,850 | $ | 2,365,911 | ||||
| Liabilities and Capital | ||||||||
| Management fees payable (Note 4) | $ | 1,294 | $ | 1,570 | ||||
| Professional fees payable | 39,850 | 85,350 | ||||||
| Directors' fees and insurance payable | 104 | 52 | ||||||
| Total liabilities | 41,248 | 86,972 | ||||||
| Commitments and Contingencies (Notes 4, 5 and 6) | ||||||||
| Capital | ||||||||
| Sponsor | — | — | ||||||
| Shareholders | 2,296,602 | 2,278,939 | ||||||
| Total Capital | 2,296,602 | 2,278,939 | ||||||
| Total liabilities and capital | $ | 2,337,850 | $ | 2,365,911 | ||||
| Shares outstanding | 100,000 | 100,000 | ||||||
| Net asset value per share | $ | 22.97 | $ | 22.79 | ||||
| Market value per share | $ | 22.57 | $ | 22.35 | ||||
See accompanying notes to financial statements.
| 128 |
United States Commodity Index Funds Trust
Statements of Financial Condition
At December 31, 2014 and 2013
United States Metals Index Fund
| 2014 | 2013 | |||||||
| Assets | ||||||||
| Cash and cash equivalents (Notes 2 and 6) | $ | 1,802,435 | $ | 1,918,706 | ||||
| Equity in trading accounts: | ||||||||
| Cash and cash equivalents | 318,156 | 329,598 | ||||||
| Unrealized gain (loss) on open commodity futures contracts | (136,564 | ) | (46,293 | ) | ||||
| Receivable from Sponsor (Note 4) | 37,785 | 82,165 | ||||||
| Interest receivable | 11 | 11 | ||||||
| Total assets | $ | 2,021,823 | $ | 2,284,187 | ||||
| Liabilities and Capital | ||||||||
| Management fees payable (Note 4) | $ | 1,128 | $ | 1,297 | ||||
| Professional fees payable | 38,996 | 85,632 | ||||||
| Directors' fees and insurance payable | 79 | 36 | ||||||
| Total liabilities | 40,203 | 86,965 | ||||||
| Commitments and Contingencies (Notes 4, 5 and 6) | ||||||||
| Capital | ||||||||
| Sponsor | — | — | ||||||
| Shareholders | 1,981,620 | 2,197,222 | ||||||
| Total Capital | 1,981,620 | 2,197,222 | ||||||
| Total liabilities and capital | $ | 2,021,823 | $ | 2,284,187 | ||||
| Shares outstanding | 100,000 | 100,000 | ||||||
| Net asset value per share | $ | 19.82 | $ | 21.97 | ||||
| Market value per share | $ | 19.55 | $ | 21.02 | ||||
See accompanying notes to financial statements.
| 129 |
United States Commodity Index Funds Trust
Statements of Financial Condition
At December 31, 2014 and 2013
United States Commodity Index Funds Trust
| 2014 | 2013 | |||||||
| Assets | ||||||||
| Cash and cash equivalents (Notes 2 and 6) | $ | 718,659,173 | $ | 480,181,509 | ||||
| Equity in trading accounts: | ||||||||
| Cash and cash equivalents | 81,100,456 | 21,002,192 | ||||||
| Unrealized gain (loss) on open commodity futures contracts | (38,667,824 | ) | 10,829,084 | |||||
| Receivable for shares sold | — | 8,491,911 | ||||||
| Receivable from Sponsor (Note 4) | 119,754 | 245,726 | ||||||
| Interest receivable | 1,343 | 1,343 | ||||||
| ETF transaction fees receivable | 1,050 | 350 | ||||||
| Total assets | $ | 761,213,952 | $ | 520,752,115 | ||||
| Liabilities and Capital | ||||||||
| Payable for shares redeemed | $ | 43,736,649 | $ | - | ||||
| Management fees payable (Note 4) | 535,815 | 407,590 | ||||||
| Professional fees payable | 618,128 | 599,873 | ||||||
| Brokerage commissions payable | 42,815 | 22,815 | ||||||
| Directors' fees and insurance payable | 15,856 | 8,303 | ||||||
| Registration fees payable | — | 152 | ||||||
| Total liabilities | 44,949,263 | 1,038,733 | ||||||
| Commitments and Contingencies (Notes 4, 5 and 6) | ||||||||
| Capital | ||||||||
| Sponsor | — | — | ||||||
| Shareholders | 716,264,689 | 519,713,382 | ||||||
| Total Capital | 716,264,689 | 519,713,382 | ||||||
| Total liabilities and capital | $ | 761,213,952 | $ | 520,752,115 | ||||
| Shares outstanding | 15,050,000 | 9,450,000 | ||||||
See accompanying notes to financial statements.
| 130 |
United States Commodity Index Funds Trust
Schedule of Investments
At December 31, 2014
United States Commodity Index Fund
| Unrealized | ||||||||||||
| Gain (Loss) | ||||||||||||
| on Open | ||||||||||||
| Number of | Commodity | % of | ||||||||||
| Contracts | Contracts | Capital | ||||||||||
| Open Futures Contracts - Long | ||||||||||||
| Foreign Contracts | ||||||||||||
| LME Tin Futures LT February 2015 contracts, expiring February 2015 | 531 | $ | 312,915 | 0.04 | ||||||||
| LME Tin Futures LT March 2015 contracts, expiring March 2015 | 543 | (9,354,055 | ) | (1.32 | ) | |||||||
| LME Zinc Futures LX April 2015 contracts, expiring April 2015 | 1,109 | (5,004,356 | ) | (0.71 | ) | |||||||
| ICE-US Cocoa Futures CC May 2015 contracts, expiring May 2015 | 1,763 | (127,380 | ) | (0.02 | ) | |||||||
| ICE-US Coffee-C Futures KC July 2015 contracts, expiring July 2015 | 790 | (7,584,675 | ) | (1.07 | ) | |||||||
| LME Nickel Futures LN June 2015 contracts, expiring June 2015 | 623 | (4,854,954 | ) | (0.68 | ) | |||||||
| LME Aluminum Futures LA September 2015 contracts, expiring September 2015 | 1,260 | (7,537,600 | ) | (1.06 | ) | |||||||
| 6,619 | (34,150,105 | ) | (4.82 | ) | ||||||||
| United States Contracts | ||||||||||||
| CME Lean Hogs Futures LH February 2015 contracts, expiring February 2015 | 1,578 | (5,228,900 | ) | (0.74 | ) | |||||||
| NYMEX Heating Oil Futures HO February 2015 contracts, expiring February 2015 | 657 | (315,244 | ) | (0.04 | ) | |||||||
| CBOT Soybean Meal Futures SM March 2015 contracts, expiring March 2015 | 1,422 | (1,018,360 | ) | (0.14 | ) | |||||||
| CME Feeder Cattle Futures FC March 2015 contracts, expiring March 2015 | 486 | 473,175 | 0.07 | |||||||||
| COMEX Gold Futures GC April 2015 contracts, expiring April 2015 | 430 | (629,300 | ) | (0.09 | ) | |||||||
| CME Live Cattle Futures LC April 2015 contracts, expiring April 2015 | 797 | (1,961,060 | ) | (0.28 | ) | |||||||
| CBOT Corn Futures C July 2015 contracts, expiring July 2015 | 2,395 | (1,353,613 | ) | (0.19 | ) | |||||||
| CBOT Wheat Futures W July 2015 contracts, expiring July 2015 | 1,670 | (1,096,737 | ) | (0.16 | ) | |||||||
| 9,435 | (11,130,039 | ) | (1.57 | ) | ||||||||
| Open Futures Contracts - Short* | ||||||||||||
| Foreign Contracts | ||||||||||||
| LME Tin Futures LT March 2015 contracts, expiring March 2015 | 543 | 6,639,446 | 0.94 | |||||||||
| LME Zinc Futures LX April 2015 contracts, expiring April 2015 | 168 | 24,963 | 0.00 | ** | ||||||||
| LME Nickel Futures LN June 2015 contracts, expiring June 2015 | 55 | 60,169 | 0.01 | |||||||||
| LME Aluminum Futures LA September 2015 contracts, expiring September 2015 | 169 | 288,407 | 0.04 | |||||||||
| 935 | 7,012,985 | 0.99 | ||||||||||
| Total Open Futures Contracts *** | 16,989 | $ | (38,267,159 | ) | (5.40 | ) | ||||||
See accompanying notes to financial statements.
| 131 |
United States Commodity Index Funds Trust
Schedule of Investments
At December 31, 2014
United States Commodity Index Fund (Continued)
| Principal | Market | % of | ||||||||||
| Amount | Value | Capital | ||||||||||
| Cash Equivalents | ||||||||||||
| United States Treasury Obligations | ||||||||||||
| U.S. Treasury Bills: | ||||||||||||
| 0.06%, 1/08/2015 | $ | 40,000,000 | $ | 39,999,572 | 5.64 | |||||||
| 0.06%, 1/15/2015 | 40,000,000 | 39,999,144 | 5.64 | |||||||||
| 0.05%, 1/22/2015 | 30,000,000 | 29,999,125 | 4.23 | |||||||||
| 0.06%, 1/29/2015 | 40,000,000 | 39,998,289 | 5.64 | |||||||||
| 0.05%, 2/19/2015 | 40,000,000 | 39,997,278 | 5.64 | |||||||||
| 0.05%, 3/19/2015 | 20,000,000 | 19,998,075 | 2.82 | |||||||||
| 0.05%, 4/23/2015 | 40,000,000 | 39,993,778 | 5.64 | |||||||||
| 0.06%, 4/30/2015 | 40,000,000 | 39,992,728 | 5.64 | |||||||||
| 0.05%, 5/07/2015 | 40,000,000 | 39,993,000 | 5.64 | |||||||||
| 0.06%, 5/14/2015 | 40,000,000 | 39,991,133 | 5.64 | |||||||||
| 0.07%, 5/21/2015 | 40,000,000 | 39,989,889 | 5.64 | |||||||||
| 0.07%, 5/28/2015 | 40,000,000 | 39,988,566 | 5.64 | |||||||||
| 0.08%, 6/04/2015 | 30,000,000 | 29,990,375 | 4.23 | |||||||||
| 0.11%, 6/18/2015 | 30,000,000 | 29,985,300 | 4.23 | |||||||||
| Total Cash Equivalents | $ | 509,916,252 | 71.91 | |||||||||
| * | All short contracts are offset by the same number of Futures Contracts in the corresponding long positions and are acquired solely for the purpose of reducing a long position (e.g., due to a redemption or to reflect a rebalancing of the SDCI). |
| ** | Represents less than 0.005%. |
| *** | Collateral amounted to $80,222,326 on open futures contracts. |
See accompanying notes to financial statements.
| 132 |
United States Commodity Index Funds Trust
Schedule of Investments
At December 31, 2013
United States Commodity Index Fund
| Number of Contracts | Unrealized Gain (Loss) on Open Commodity Contracts | % of Capital | ||||||||||
| Open Futures Contracts - Long | ||||||||||||
| Foreign Contracts | ||||||||||||
| LME Tin Futures LT March 2014 contracts, expiring March 2014 | 402 | $ | 4,337,905 | 0.85 | ||||||||
| LME Lead Futures LL April 2014 contracts, expiring April 2014 | 711 | 117,525 | 0.02 | |||||||||
| LME Zinc Futures LX April 2014 contracts, expiring April 2014 | 790 | 1,505,606 | 0.29 | |||||||||
| ICE-US Cocoa Futures CC May 2014 contracts, expiring May 2014 | 1,323 | 1,161,220 | 0.23 | |||||||||
| ICE Brent Crude Oil Futures CO June 2014 contracts, expiring May 2014 | 334 | 3,288,860 | 0.64 | |||||||||
| ICE-UK Gasoil Futures QS June 2014 contracts, expiring June 2014 | 394 | (160,025 | ) | (0.03 | ) | |||||||
| LME Lead Futures LL June 2014 contracts, expiring June 2014 | 662 | 42,813 | 0.01 | |||||||||
| ICE-US Cotton #2 Futures CT July 2014 contracts, expiring July 2014 | 892 | 1,753,955 | 0.34 | |||||||||
| 5,508 | 12,047,859 | 2.35 | ||||||||||
| United States Contracts | ||||||||||||
| CME Live Cattle Futures LC February 2014 contracts, expiring February 2014 | 687 | 335,850 | 0.07 | |||||||||
| CME Feeder Cattle Futures FC March 2014 contracts, expiring March 2014 | 441 | (64,763 | ) | (0.01 | ) | |||||||
| COMEX Copper Futures HG March 2014 contracts, expiring March 2014 | 434 | 1,984,638 | 0.39 | |||||||||
| NYMEX Natural Gas Futures NG April 2014 contracts, expiring March 2014 | 873 | (710,860 | ) | (0.14 | ) | |||||||
| NYMEX Platinum Futures PL April 2014 contracts, expiring April 2014 | 540 | 162,485 | 0.03 | |||||||||
| NYMEX WTI Crude Oil Futures CL April 2014 contracts, expiring March 2014 | 371 | 2,175,700 | 0.42 | |||||||||
| CBOT Soybean Meal Futures SM May 2014 contracts, expiring May 2014 | 889 | (58,640 | ) | (0.01 | ) | |||||||
| NYMEX Heating Oil Futures HO June 2014 contracts, expiring May 2014 | 289 | 1,411,965 | 0.27 | |||||||||
| CBOT Soybean Futures S November 2014 contracts, expiring November 2014 | 640 | (902,100 | ) | (0.18 | ) | |||||||
| NYMEX RBOB Gasoline Futures RB December 2014 contracts, expiring November 2014 | 336 | 237,010 | 0.05 | |||||||||
| 5,500 | 4,571,285 | 0.89 | ||||||||||
| Open Futures Contracts - Short* | ||||||||||||
| Foreign Contracts | ||||||||||||
| LME Tin Futures LT March 2014 contracts, expiring March 2014 | 402 | 645,975 | 0.13 | |||||||||
| LME Lead Futures LL April 2014 contracts, expiring April 2014 | 711 | (1,932,074 | ) | (0.38 | ) | |||||||
| LME Zinc Futures LX April 2014 contracts, expiring April 2014 | 790 | (2,435,467 | ) | (0.48 | ) | |||||||
| LME Lead Futures LL June 2014 contracts, expiring June 2014 | 662 | (2,107,831 | ) | (0.41 | ) | |||||||
| 2,565 | (5,829,397 | ) | (1.14 | ) | ||||||||
| Total Open Futures Contracts** | 13,573 | $ | 10,789,747 | 2.10 | ||||||||
See accompanying notes to financial statements.
| 133 |
United States Commodity Index Funds Trust
Schedule of Investments
At December 31, 2013
United States Commodity Index Fund (Continued)
| Principal Amount | Market Value | % of Capital | ||||||||||
| Cash Equivalents | ||||||||||||
| United States Treasury Obligations | ||||||||||||
| U.S. Treasury Bills: | ||||||||||||
| 0.05%, 1/09/2014 | $ | 55,000,000 | $ | 54,999,318 | 10.72 | |||||||
| 0.06%, 1/09/2014 | 20,000,000 | 19,999,752 | 3.90 | |||||||||
| 0.04%, 1/30/2014 | 20,000,000 | 19,999,285 | 3.90 | |||||||||
| 0.04%, 3/06/2014 | 30,200,000 | 30,197,808 | 5.89 | |||||||||
| 0.05%, 3/27/2014 | 30,000,000 | 29,996,813 | 5.85 | |||||||||
| 0.06%, 4/17/2014 | 20,000,000 | 19,996,614 | 3.90 | |||||||||
| 0.07%, 4/24/2014 | 20,000,000 | 19,995,606 | 3.90 | |||||||||
| 0.08%, 5/01/2014 | 20,000,000 | 19,995,000 | 3.90 | |||||||||
| 0.08%, 5/08/2014 | 30,000,000 | 29,991,533 | 5.85 | |||||||||
| 0.09%, 5/15/2014 | 30,000,000 | 29,989,950 | 5.84 | |||||||||
| 0.10%, 6/05/2014 | 30,000,000 | 29,987,729 | 5.84 | |||||||||
| 0.08%, 6/26/2014 | 20,000,000 | 19,992,667 | 3.90 | |||||||||
| Total Cash Equivalents | $ | 325,142,075 | 63.39 | |||||||||
| * | All short contracts are offset by the same number of Futures Contracts in the corresponding long positions and are acquired solely for the purpose of reducing a long position (e.g., due to a redemption or to reflect a rebalancing of the SDCI). |
| ** | Collateral amounted to $20,013,191 on open futures contracts. |
See accompanying notes to financial statements.
| 134 |
United States Commodity Index Funds Trust
Schedule of Investments
At December 31, 2014
United States Copper Index Fund
| Unrealized | ||||||||||||
| Gain (Loss) | ||||||||||||
| on Open | ||||||||||||
| Number of | Commodity | % of | ||||||||||
| Contracts | Contracts | Capital | ||||||||||
| Open Futures Contracts - Long* | ||||||||||||
| United States Contracts | ||||||||||||
| COMEX Copper Futures HG March 2015 contracts, expiring March 2015 | 40 | $ | (197,525 | ) | (6.89 | ) | ||||||
| Principal | Market | |||||||||||
| Amount | Value | |||||||||||
| Cash Equivalents | ||||||||||||
| United States Treasury Obligations | ||||||||||||
| U.S. Treasury Bills: | ||||||||||||
| 0.06%, 04/30/2015 | $ | 200,000 | $ | 199,964 | 6.98 | |||||||
| 0.05%, 03/19/2015 | 100,000 | 99,990 | 3.49 | |||||||||
| 0.06%, 05/14/2015 | 500,000 | 499,889 | 17.44 | |||||||||
| 0.07%, 05/21/2015 | 400,000 | 399,899 | 13.96 | |||||||||
| 0.11%, 06/18/2015 | 500,000 | 499,755 | 17.44 | |||||||||
| Total Cash Equivalents | $ | 1,699,497 | 59.31 | |||||||||
| * | Collateral amounted to $337,148 on open futures contracts. |
See accompanying notes to financial statements.
| 135 |
United States Commodity Index Funds Trust
Schedule of Investments
At December 31, 2013
United States Copper Index Fund
| Number of Contracts | Unrealized Gain (Loss) on Open Commodity Contracts | % of Capital | ||||||||||
| Open Futures Contracts - Long* | ||||||||||||
| United States Contracts | ||||||||||||
| COMEX Copper Futures HG March 2014 contracts, expiring March 2014 | 27 | $ | 130,163 | 5.68 | ||||||||
| Principal Amount | Market Value | |||||||||||
| Cash Equivalents | ||||||||||||
| United States Treasury Obligations | ||||||||||||
| U.S. Treasury Bills: | ||||||||||||
| 0.06%, 1/09/2014 | $ | 100,000 | $ | 99,999 | 4.36 | |||||||
| 0.05%, 3/06/2014 | 400,000 | 399,968 | 17.45 | |||||||||
| 0.05%, 3/27/2014 | 100,000 | 99,989 | 4.36 | |||||||||
| 0.06%, 4/17/2014 | 200,000 | 199,966 | 8.73 | |||||||||
| 0.07%, 4/24/2014 | 200,000 | 199,956 | 8.73 | |||||||||
| 0.08%, 5/01/2014 | 200,000 | 199,950 | 8.72 | |||||||||
| 0.08%, 5/08/2014 | 200,000 | 199,944 | 8.72 | |||||||||
| 0.09%, 5/15/2014 | 200,000 | 199,933 | 8.72 | |||||||||
| Total Cash Equivalents | $ | 1,599,705 | 69.79 | |||||||||
| * | Collateral amounted to $125,960 on open futures contracts. |
See accompanying notes to financial statements.
| 136 |
United States Commodity Index Funds Trust
Schedule of Investments
At December 31, 2014
United States Agriculture Index Fund
| Unrealized | ||||||||||||
| Gain (Loss) | ||||||||||||
| on Open | ||||||||||||
| Number of | Commodity | % of | ||||||||||
| Contracts | Contracts | Capital | ||||||||||
| Open Futures Contracts - Long | ||||||||||||
| Foreign Contracts | ||||||||||||
| ICE-US Cotton #2 Futures CT March 2015 contracts, expiring March 2015 | 4 | $ | (5,550 | ) | (0.24 | ) | ||||||
| ICE-Canola Futures RS May 2015 contracts, expiring May 2015 | 16 | (575 | ) | (0.03 | ) | |||||||
| ICE-US Cocoa Futures CC May 2015 contracts, expiring May 2015 | 6 | (760 | ) | (0.03 | ) | |||||||
| ICE-US Sugar #11 Futures SB May 2015 contracts, expiring April 2015 | 11 | (29,221 | ) | (1.27 | ) | |||||||
| ICE-US Coffee-C Futures KC July 2015 contracts, expiring July 2015 | 4 | (39,956 | ) | (1.74 | ) | |||||||
| 41 | (76,062 | ) | (3.31 | ) | ||||||||
| United States Contracts | ||||||||||||
| CME Lean Hogs Futures LH February 2015 contracts, expiring February 2015 | 3 | (9,840 | ) | (0.43 | ) | |||||||
| CBOT Soybean Meal Futures SM March 2015 contracts, expiring March 2015 | 5 | (3,610 | ) | (0.16 | ) | |||||||
| CBOT Wheat Futures W March 2015 contracts, expiring March 2015 | 8 | 10,025 | 0.44 | |||||||||
| CME Feeder Cattle Futures FC March 2015 contracts, expiring March 2015 | 1 | 463 | 0.02 | |||||||||
| CME Live Cattle Futures LC April 2015 contracts, expiring April 2015 | 4 | (9,690 | ) | (0.42 | ) | |||||||
| KCBOT Hard Red Winter Wheat Futures KW May 2015 contracts, expiring May 2015 | 2 | 2,838 | 0.12 | |||||||||
| CBOT Soybean Oil Futures BO July 2015 contracts, expiring July 2015 | 1 | (1,512 | ) | (0.07 | ) | |||||||
| CBOT Soybean Futures S November 2015 contracts, expiring November 2015 | 5 | 16,350 | 0.71 | |||||||||
| CBOT Corn Futures C December 2015 contracts, expiring December 2015 | 12 | 4,462 | 0.20 | |||||||||
| 41 | 9,486 | 0.41 | ||||||||||
| Total Open Futures Contracts* | 82 | $ | (66,576 | ) | (2.90 | ) | ||||||
| Principal | Market | |||||||||||
| Amount | Value | |||||||||||
| Cash Equivalents | ||||||||||||
| United States Treasury Obligations | ||||||||||||
| U.S. Treasury Bills: | ||||||||||||
| 0.05%, 3/19/2015 | $ | 100,000 | $ | 99,990 | 4.35 | |||||||
| 0.05%, 4/23/2015 | 100,000 | 99,984 | 4.35 | |||||||||
| 0.06%, 4/30/2015 | 200,000 | 199,964 | 8.71 | |||||||||
| 0.06%, 5/14/2015 | 200,000 | 199,956 | 8.71 | |||||||||
| 0.07%, 5/21/2015 | 500,000 | 499,874 | 21.77 | |||||||||
| 0.11%, 6/18/2015 | 500,000 | 499,755 | 21.76 | |||||||||
| Total Cash Equivalents | $ | 1,599,523 | 69.65 | |||||||||
| * | Collateral amounted to $222,826 on open futures contracts. |
See accompanying notes to financial statements.
| 137 |
United States Commodity Index Funds Trust
Schedule of Investments
At December 31, 2013
United States Agriculture Index Fund
| Number of Contracts | Unrealized Gain (Loss) on Open Commodity Contracts | % of Capital | ||||||||||
| Open Futures Contracts - Long | ||||||||||||
| Foreign Contracts | ||||||||||||
| ICE-Canola Futures RS March 2014 contracts, expiring March 2014 | 3 | $ | (1,951 | ) | (0.09 | ) | ||||||
| ICE-US Sugar #11 Futures SB May 2014 contracts, expiring April 2014 | 10 | (9,408 | ) | (0.41 | ) | |||||||
| ICE-US Cocoa Futures CC July 2014 contracts, expiring July 2014 | 7 | 3,380 | 0.15 | |||||||||
| ICE-US Coffee-C Futures KC July 2014 contracts, expiring July 2014 | 4 | 675 | 0.03 | |||||||||
| ICE-US Cotton #2 Futures CT July 2014 contracts, expiring July 2014 | 5 | 9,520 | 0.42 | |||||||||
| 29 | 2,216 | 0.10 | ||||||||||
| United States Contracts | ||||||||||||
| CME Live Cattle Futures LC February 2014 contracts, expiring February 2014 | 5 | 1,970 | 0.09 | |||||||||
| CBOT Soybean Oil Futures BO March 2014 contracts, expiring March 2014 | 1 | (84 | ) | 0.00 | * | |||||||
| CBOT Wheat Futures W March 2014 contracts, expiring March 2014 | 5 | (14,513 | ) | (0.64 | ) | |||||||
| CME Feeder Cattle Futures FC March 2014 contracts, expiring March 2014 | 1 | (525 | ) | (0.02 | ) | |||||||
| CME Lean Hogs Futures LH April 2014 contracts, expiring April 2014 | 5 | (5,980 | ) | (0.26 | ) | |||||||
| CBOT Soybean Meal Futures SM May 2014 contracts, expiring May 2014 | 4 | 970 | 0.04 | |||||||||
| KCBOT Hard Red Winter Wheat Futures KW May 2014 contracts, expiring May 2014 | 1 | (4,900 | ) | (0.22 | ) | |||||||
| CBOT Soybean Futures S November 2014 contracts, expiring November 2014 | 6 | (11,325 | ) | (0.50 | ) | |||||||
| CBOT Corn Futures C December 2014 contracts, expiring December 2014 | 11 | (12,362 | ) | (0.54 | ) | |||||||
| 39 | (46,749 | ) | (2.05 | ) | ||||||||
| Total Open Futures Contracts** | 68 | $ | (44,533 | ) | (1.95 | ) | ||||||
| Principal Amount | Market Value | |||||||||||
| Cash Equivalents | ||||||||||||
| United States Treasury Obligations | ||||||||||||
| U.S. Treasury Bills: | ||||||||||||
| 0.05%, 3/06/2014 | $ | 200,000 | $ | 199,984 | 8.78 | |||||||
| 0.05%, 3/27/2014 | 200,000 | 199,979 | 8.78 | |||||||||
| 0.06%, 4/17/2014 | 200,000 | 199,966 | 8.78 | |||||||||
| 0.07%, 4/24/2014 | 200,000 | 199,956 | 8.77 | |||||||||
| 0.08%, 5/01/2014 | 200,000 | 199,950 | 8.77 | |||||||||
| 0.08%, 5/08/2014 | 200,000 | 199,944 | 8.77 | |||||||||
| 0.09%, 5/15/2014 | 300,000 | 299,899 | 13.16 | |||||||||
| Total Cash Equivalents | $ | 1,499,678 | 65.81 | |||||||||
| * | Represents less than 0.005% |
| ** | Collateral amounted to $230,081 on open futures contracts. |
See accompanying notes to financial statements.
| 138 |
United States Commodity Index Funds Trust
Schedule of Investments
At December 31, 2014
United States Metals Index Fund
| Unrealized | ||||||||||||
| Gain (Loss) | ||||||||||||
| on Open | ||||||||||||
| Number of | Commodity | % of | ||||||||||
| Contracts | Contracts | Capital | ||||||||||
| Open Futures Contracts - Long | ||||||||||||
| Foreign Contracts | ||||||||||||
| LME Aluminum Futures LA January 2015 contracts, expiring January 2015 | 17 | $ | (55,588 | ) | (2.81 | ) | ||||||
| LME Tin Futures LT July February 2015 contracts, expiring February 2015 | 3 | (8,435 | ) | (0.43 | ) | |||||||
| LME Zinc Futures LX February 2015 contracts, expiring February 2015 | 11 | (34,569 | ) | (1.74 | ) | |||||||
| LME Nickel Futures LN May 2015 contracts, expiring May 2015 | 6 | (41,628 | ) | (2.10 | ) | |||||||
| LME Lead Futures LL June 2015 contracts, expiring June 2015 | 1 | (3,862 | ) | (0.19 | ) | |||||||
| LME Aluminum Futures LA January 2016 contracts, expiring January 2016 | 5 | (754 | ) | (0.04 | ) | |||||||
| 43 | (144,836 | ) | (7.31 | ) | ||||||||
| United States Contracts | ||||||||||||
| COMEX Copper Futures HG March 2015 contracts, expiring March 2015 | 6 | (36,282 | ) | (1.83 | ) | |||||||
| COMEX Silver Futures SI March 2015 contracts, expiring March 2015 | 3 | (19,775 | ) | (1.00 | ) | |||||||
| NYMEX Palladium Futures PA March 2015 contracts, expiring March 2015 | 2 | (1,615 | ) | (0.08 | ) | |||||||
| COMEX Gold Futures GC April 2015 contracts, expiring April 2015 | 3 | (5,460 | ) | (0.27 | ) | |||||||
| 14 | (63,132 | ) | (3.18 | ) | ||||||||
| Open Futures Contracts - Short* | ||||||||||||
| Foreign Contracts | ||||||||||||
| LME Aluminum Futures LA January 2015 contracts, expiring January 2015 | 17 | 35,513 | 1.79 | |||||||||
| LME Tin Futures LT July February 2015 contracts, expiring February 2015 | 2 | 3,023 | 0.15 | |||||||||
| LME Zinc Futures LX February 2015 contracts, expiring February 2015 | 8 | 28,234 | 1.43 | |||||||||
| LME Nickel Futures LN May 2015 contracts, expiring May 2015 | 3 | 4,634 | 0.23 | |||||||||
| 30 | 71,404 | 3.60 | ||||||||||
| Total Open Futures Contracts** | 87 | $ | (136,564 | ) | (6.89 | ) | ||||||
| Principal | Market | |||||||||||
| Amount | Value | |||||||||||
| Cash Equivalents | ||||||||||||
| United States Treasury Obligations | ||||||||||||
| U.S. Treasury Bills: | ||||||||||||
| 0.05%, 4/23/2015 | $ | 100,000 | $ | 99,984 | 5.04 | |||||||
| 0.06%, 4/30/2015 | 200,000 | 199,964 | 10.09 | |||||||||
| 0.06%, 5/14/2015 | 500,000 | 499,889 | 25.23 | |||||||||
| 0.07%, 5/21/2015 | 200,000 | 199,950 | 10.09 | |||||||||
| 0.11%, 6/18/2015 | 400,000 | 399,804 | 20.18 | |||||||||
| Total Cash Equivalents | $ | 1,399,591 | 70.63 | |||||||||
| * | All short contracts are offset by the same number of Futures Contracts in the corresponding long positions and are acquired solely for the purpose of reducing a long position (e.g., due to a redemption or to reflect a rebalancing of the SDMI). |
| ** | Collateral amounted to $318,158 on open futures contracts. |
See accompanying notes to financial statements.
| 139 |
United States Commodity Index Funds Trust
Schedule of Investments
At December 31, 2013
United States Metals Index Fund
| Number of Contracts | Unrealized Gain (Loss) on Open Commodity Contracts | % of Capital | ||||||||||
| Open Futures Contracts - Long | ||||||||||||
| Foreign Contracts | ||||||||||||
| LME Aluminum Futures LA January 2014 contracts, expiring January 2014 | 15 | $ | (71,431 | ) | (3.25 | ) | ||||||
| LME Zinc Futures LX January 2014 contracts, expiring January 2014 | 10 | 31,863 | 1.45 | |||||||||
| LME Nickel Futures LN March 2014 contracts, expiring March 2014 | 6 | (10,566 | ) | (0.48 | ) | |||||||
| LME Tin Futures LT March 2014 contracts, expiring March 2014 | 4 | 9,460 | 0.43 | |||||||||
| LME Lead Futures LL April 2014 contracts, expiring April 2014 | 6 | 81 | 0.00 | |||||||||
| LME Zinc Futures LX June 2014 contracts, expiring June 2014 | 5 | (3,181 | ) | (0.15 | ) | |||||||
| LME Aluminum Futures LA January 2015 contracts, expiring January 2015 | 6 | (1,844 | ) | (0.08 | ) | |||||||
| 52 | (45,618 | ) | (2.08 | ) | ||||||||
| United States Contracts | ||||||||||||
| COMEX Copper Futures HG March 2014 contracts, expiring March 2014 | 6 | 16,812 | 0.77 | |||||||||
| COMEX Silver Futures SI March 2014 contracts, expiring March 2014 | 3 | (45,885 | ) | (2.09 | ) | |||||||
| NYMEX Palladium Futures PA March 2014 contracts, expiring March 2014 | 3 | (2,960 | ) | (0.13 | ) | |||||||
| COMEX Gold Futures GC April 2014 contracts, expiring April 2014 | 3 | (1,650 | ) | (0.08 | ) | |||||||
| 15 | (33,683 | ) | (1.53 | ) | ||||||||
| Open Futures Contracts - Short* | ||||||||||||
| Foreign Contracts | ||||||||||||
| LME Aluminum Futures LA January 2014 contracts, expiring January 2014 | 15 | 27,961 | 1.27 | |||||||||
| LME Zinc Futures LX January 2014 contracts, expiring January 2014 | 10 | (3,963 | ) | (0.18 | ) | |||||||
| LME Nickel Futures LN March 2014 contracts, expiring March 2014 | 4 | 9,007 | 0.41 | |||||||||
| LME Tin Futures LT March 2014 contracts, expiring March 2014 | 3 | 10,236 | 0.47 | |||||||||
| LME Lead Futures LL April 2014 contracts, expiring April 2014 | 6 | (10,233 | ) | (0.47 | ) | |||||||
| 38 | 33,008 | 1.50 | ||||||||||
| Total Open Futures Contracts** | 105 | $ | (46,293 | ) | (2.11 | ) | ||||||
| Principal Amount | Market Value | |||||||||||
| Cash Equivalents | ||||||||||||
| United States Treasury Obligations | ||||||||||||
| U.S. Treasury Bills: | ||||||||||||
| 0.05%, 1/09/2014 | $ | 600,000 | $ | 599,992 | 27.31 | |||||||
| 0.06%, 1/09/2014 | 100,000 | 99,999 | 4.55 | |||||||||
| 0.05%, 3/27/2014 | 200,000 | 199,979 | 9.10 | |||||||||
| 0.06%, 4/17/2014 | 200,000 | 199,966 | 9.10 | |||||||||
| 0.07%, 4/24/2014 | 100,000 | 99,978 | 4.55 | |||||||||
| Total Cash Equivalents | $ | 1,199,914 | 54.61 | |||||||||
| * | All short contracts are offset by the same number of Futures Contracts in the corresponding long positions and are acquired solely for the purpose of reducing a long position (e.g., due to a redemption or to reflect a rebalancing of the SDMI). |
| ** | Collateral amounted to $329,598 on open futures contracts. |
See accompanying notes to financial statements.
| 140 |
United States Commodity Index Funds Trust
Statements of Operations
For the years ended December 31, 2014, 2013 and 2012
United States Commodity Index Fund
| Year ended | Year ended | Year ended | ||||||||||
| December 31, 2014 | December 31, 2013 | December 31, 2012 | ||||||||||
| Income | ||||||||||||
| Gain (loss) on trading of commodity futures contracts: | ||||||||||||
| Realized gain (loss) on closed positions | $ | (85,846,605 | ) | $ | (32,839,247 | ) | $ | (21,219,768 | ) | |||
| Change in unrealized gain (loss) on open positions | (49,056,906 | ) | 16,010,647 | 17,755,792 | ||||||||
| Realized gain (loss) on foreign currency transactions | 6 | 334 | — | |||||||||
| Change in unrealized gain (loss) on foreign currency translations | (1 | ) | 216 | (200 | ) | |||||||
| Interest income | 323,118 | 265,555 | 278,476 | |||||||||
| ETF transaction fees | 23,400 | 15,750 | 12,950 | |||||||||
| Total income (loss) | (134,556,988 | ) | (16,546,745 | ) | (3,172,750 | ) | ||||||
| Expenses | ||||||||||||
| Management fees (Note 4) | 5,887,414 | 4,842,197 | 4,070,144 | |||||||||
| Professional fees | 594,787 | 482,288 | 476,599 | |||||||||
| Brokerage commissions | 653,625 | 390,945 | 310,109 | |||||||||
| Directors' fees and insurance | 144,809 | 104,184 | 68,533 | |||||||||
| Registration fees | 850 | 850 | 800 | |||||||||
| Total expenses | 7,281,485 | 5,820,464 | 4,926,185 | |||||||||
| Net income (loss) | $ | (141,838,473 | ) | $ | (22,367,209 | ) | $ | (8,098,935 | ) | |||
| Net income (loss) per share | $ | (7.82 | ) | $ | (2.39 | ) | $ | (0.02 | ) | |||
| Net income (loss) per weighted average share | $ | (11.42 | ) | $ | (2.47 | ) | $ | (1.14 | ) | |||
| Weighted average shares outstanding | 12,419,041 | 9,051,370 | 7,120,765 | |||||||||
See accompanying notes to financial statements.
| 141 |
United States Commodity Index Funds Trust
Statements of Operations
For the years ended December 31, 2014, 2013 and 2012
United States Copper Index Fund
| Year ended | Year ended | Year ended | ||||||||||
| December 31, 2014 | December 31, 2013 | December 31, 2012 | ||||||||||
| Income | ||||||||||||
| Gain (loss) on trading of commodity futures contracts: | ||||||||||||
| Realized gain (loss) on closed positions | $ | (54,825 | ) | $ | (355,825 | ) | $ | 64,937 | ||||
| Change in unrealized gain (loss) on open positions | (327,688 | ) | 123,588 | 68,588 | ||||||||
| Interest income | 1,455 | 1,260 | 1,607 | |||||||||
| ETF transaction fees | 1,750 | — | 1,350 | |||||||||
| Total income (loss) | (379,308 | ) | (230,977 | ) | 136,482 | |||||||
| Expenses | ||||||||||||
| Management fees (Note 4) | 20,483 | 14,927 | 19,823 | |||||||||
| Professional fees | 65,914 | 85,228 | 100,193 | |||||||||
| Brokerage commissions | 1,896 | 916 | 956 | |||||||||
| Directors' fees and insurance | 658 | 488 | 415 | |||||||||
| Total expenses | 88,951 | 101,559 | 121,387 | |||||||||
| Expense waiver (Note 4) | (62,989 | ) | (81,789 | ) | (96,364 | ) | ||||||
| Net expenses | 25,962 | 19,770 | 25,023 | |||||||||
| Net income (loss) | $ | (405,270 | ) | $ | (250,747 | ) | $ | 111,459 | ||||
| Net income (loss) per share | $ | (3.82 | ) | $ | (2.51 | ) | $ | 0.96 | ||||
| Net income (loss) per weighted average share | $ | (2.69 | ) | $ | (2.51 | ) | $ | 1.11 | ||||
| Weighted average shares outstanding | 150,411 | 100,000 | 100,410 | |||||||||
See accompanying notes to financial statements.
| 142 |
United States Commodity Index Funds Trust
Statements of Operations
For the years ended December 31, 2014, 2013 and 2012
United States Agriculture Index Fund*
| Year ended | Year ended | Year ended | ||||||||||
| December 31, 2014 | December 31, 2013 | December 31, 2012 | ||||||||||
| Income | ||||||||||||
| Gain (loss) on trading of commodity futures contracts: | ||||||||||||
| Realized gain (loss) on closed positions | $ | 60,213 | $ | (327,353 | ) | $ | 330,608 | |||||
| Change in unrealized gain (loss) on open positions | (22,043 | ) | 74,622 | (119,155 | ) | |||||||
| Realized gain (loss) on foreign currency transactions | (129 | ) | (71 | ) | 246 | |||||||
| Realized gain (loss) on short-term investments | — | 2 | (2 | ) | ||||||||
| Change in unrealized gain (loss) on foreign currency translations | 15 | (114 | ) | 116 | ||||||||
| Interest income | 1,176 | 1,328 | 1,573 | |||||||||
| ETF transaction fees | — | — | 2,700 | |||||||||
| Total income (loss) | 39,232 | (251,586 | ) | 216,086 | ||||||||
| Expenses | ||||||||||||
| Management fees (Note 4) | 17,092 | 19,115 | 17,492 | |||||||||
| Professional fees | 48,227 | 85,350 | 80,030 | |||||||||
| Brokerage commissions | 2,020 | 2,003 | 2,632 | |||||||||
| Directors' fees and insurance | 569 | 471 | 220 | |||||||||
| Total expenses | 67,908 | 106,939 | 100,374 | |||||||||
| Expense waiver (Note 4) | (46,339 | ) | (81,772 | ) | (76,851 | ) | ||||||
| Net expenses | 21,569 | 25,167 | 23,523 | |||||||||
| Net income (loss) | $ | 17,663 | $ | (276,753 | ) | $ | 192,563 | |||||
| Net income (loss) per share | $ | 0.18 | $ | (2.77 | ) | $ | 0.56 | |||||
| Net income (loss) per weighted average share | $ | 0.18 | $ | (2.77 | ) | $ | 1.70 | |||||
| Weighted average shares outstanding | 100,000 | 100,000 | 113,320 | |||||||||
| * | The commencement of operations of the United States Agriculture Index Fund was April 13, 2012. |
See accompanying notes to financial statements.
| 143 |
United States Commodity Index Funds Trust
Statements of Operations
For the years ended December 31, 2014, 2013 and 2012
United States Metals Index Fund*
| Year ended | Year ended | Year ended | ||||||||||
| December 31, 2014 | December 31, 2013 | December 31, 2012 | ||||||||||
| Income | ||||||||||||
| Gain (loss) on trading of commodity futures contracts: | ||||||||||||
| Realized gain (loss) on closed positions | $ | (107,810 | ) | $ | (291,259 | ) | $ | 148,423 | ||||
| Change in unrealized gain (loss) on open positions | (90,271 | ) | (92,351 | ) | 46,058 | |||||||
| Realized gain (loss) on foreign currency transactions | — | 3 | — | |||||||||
| Realized gain (loss) on short-term investments | — | 2 | (5 | ) | ||||||||
| Change in unrealized gain (loss) on foreign currency translations | — | (2 | ) | (2 | ) | |||||||
| Interest income | 1,015 | 1,299 | 1,270 | |||||||||
| ETF transaction fees | — | 1,350 | 1,350 | |||||||||
| Total income (loss) | (197,066 | ) | (380,958 | ) | 197,094 | |||||||
| Expenses | ||||||||||||
| Management fees (Note 4) | 14,774 | 17,637 | 10,681 | |||||||||
| Professional fees | 47,373 | 85,938 | 61,605 | |||||||||
| Brokerage commissions | 826 | 871 | 714 | |||||||||
| Directors' fees and insurance | 548 | 493 | 154 | |||||||||
| Total expenses | 63,521 | 104,939 | 73,154 | |||||||||
| Expense waiver (Note 4) | (44,985 | ) | (82,165 | ) | (59,316 | ) | ||||||
| Net expenses | 18,536 | 22,774 | 13,838 | |||||||||
| Net income (loss) | $ | (215,602 | ) | $ | (403,732 | ) | $ | 183,256 | ||||
| Net income (loss) per share | $ | (2.15 | ) | $ | (4.50 | ) | $ | 1.47 | ||||
| Net income (loss) per weighted average share | $ | (2.16 | ) | $ | (3.75 | ) | $ | 1.65 | ||||
| Weighted average shares outstanding | 100,000 | 107,534 | 111,239 | |||||||||
| * | The commencement of operations of the United States Metals Index Fund was June 19, 2012. |
See accompanying notes to financial statements.
| 144 |
United States Commodity Index Funds Trust
Statements of Operations
For the years ended December 31, 2014, 2013 and 2012
United States Commodity Index Funds Trust
| Year ended | Year ended | Year ended | ||||||||||
| December 31, 2014 | December 31, 2013 | December 31, 2012 | ||||||||||
| Income | ||||||||||||
| Gain (loss) on trading of commodity futures contracts: | ||||||||||||
| Realized gain (loss) on closed positions | $ | (85,949,027 | ) | $ | (33,813,684 | ) | $ | (20,675,800 | ) | |||
| Change in unrealized gain (loss) on open positions | (49,496,908 | ) | 16,116,506 | 17,751,283 | ||||||||
| Realized gain (loss) on foreign currency transactions | (123 | ) | 266 | 246 | ||||||||
| Realized gain (loss) on short-term investments | — | 4 | (7 | ) | ||||||||
| Change in unrealized gain (loss) on foreign currency translations | 14 | 100 | (86 | ) | ||||||||
| Interest income | 326,764 | 269,442 | 282,926 | |||||||||
| ETF transaction fees | 25,150 | 17,100 | 18,350 | |||||||||
| Total income (loss) | (135,094,130 | ) | (17,410,266 | ) | (2,623,088 | ) | ||||||
| Expenses | ||||||||||||
| Management fees (Note 4) | 5,939,763 | 4,893,876 | 4,118,140 | |||||||||
| Professional fees | 756,301 | 738,804 | 718,427 | |||||||||
| Brokerage commissions | 658,367 | 394,735 | 314,411 | |||||||||
| Directors' fees and insurance | 146,584 | 105,636 | 69,322 | |||||||||
| Registration fees | 850 | 850 | 800 | |||||||||
| Total expenses | 7,501,865 | 6,133,901 | 5,221,100 | |||||||||
| Expense waiver (Note 4) | (154,313 | ) | (245,726 | ) | (232,531 | ) | ||||||
| Net expenses | 7,347,552 | 5,888,175 | 4,988,569 | |||||||||
| Net income (loss) | $ | (142,441,682 | ) | $ | (23,298,441 | ) | $ | (7,611,657 | ) | |||
See accompanying notes to financial statements.
| 145 |
United States Commodity Index Funds Trust
Statement of Changes in Capital
For the years ended December 31, 2014, 2013 and 2012
United States Commodity Index Fund
| Sponsor | Shareholders | Total | ||||||||||
| Balances, at December 31, 2011 | $ | — | $ | 350,849,296 | $ | 350,849,296 | ||||||
| Additions | — | 171,692,032 | 171,692,032 | |||||||||
| Redemptions | — | (26,356,666 | ) | (26,356,666 | ) | |||||||
| Net income (loss) | — | (8,098,935 | ) | (8,098,935 | ) | |||||||
| Balances, at December 31, 2012 | — | 488,085,727 | 488,085,727 | |||||||||
| Additions | — | 128,090,557 | 128,090,557 | |||||||||
| Redemptions | — | (80,864,053 | ) | (80,864,053 | ) | |||||||
| Net income (loss) | — | (22,367,209 | ) | (22,367,209 | ) | |||||||
| Balances, at December 31, 2013 | — | 512,945,022 | 512,945,022 | |||||||||
| Additions | — | 439,876,572 | 439,876,572 | |||||||||
| Redemptions | — | (101,862,281 | ) | (101,862,281 | ) | |||||||
| Net income (loss) | — | (141,838,473 | ) | (141,838,473 | ) | |||||||
| Balances, at December 31, 2014 | $ | — | $ | 709,120,840 | $ | 709,120,840 | ||||||
Statements of Changes in Shares Outstanding
For the years ended December 31, 2014, 2013 and 2012
United States Commodity Index Fund
| Sponsor | Shareholders | Total | ||||||||||
| Shares Outstanding, at December 31, 2011 | — | 6,000,000 | 6,000,000 | |||||||||
| Additions | — | 2,800,000 | 2,800,000 | |||||||||
| Redemptions | — | (450,000 | ) | (450,000 | ) | |||||||
| Shares Outstanding, at December 31, 2012 | — | 8,350,000 | 8,350,000 | |||||||||
| Additions | — | 2,250,000 | 2,250,000 | |||||||||
| Redemptions | — | (1,450,000 | ) | (1,450,000 | ) | |||||||
| Shares Outstanding, at December 31, 2013 | — | 9,150,000 | 9,150,000 | |||||||||
| Additions | — | 7,500,000 | 7,500,000 | |||||||||
| Redemptions | — | (1,950,000 | ) | (1,950,000 | ) | |||||||
| Shares Outstanding, at December 31, 2014 | — | 14,700,000 | 14,700,000 | |||||||||
| Net Asset Value Per Share: | ||||||||||||
| At December 31, 2011 | $ | 58.47 | ||||||||||
| At December 31, 2012 | $ | 58.45 | ||||||||||
| At December 31, 2013 | $ | 56.06 | ||||||||||
| At December 31, 2014 | $ | 48.24 | ||||||||||
See accompanying notes to financial statements.
| 146 |
United States Commodity Index Funds Trust
Statement of Changes in Capital
For the years ended December 31, 2014, 2013 and 2012
United States Copper Index Fund
| Sponsor | Shareholders | Total | ||||||||||
| Balances, at December 31, 2011 | $ | — | $ | 2,447,114 | $ | 2,447,114 | ||||||
| Additions | — | 1,224,883 | 1,224,883 | |||||||||
| Redemptions | — | (1,240,510 | ) | (1,240,510 | ) | |||||||
| Net income (loss) | — | 111,459 | 111,459 | |||||||||
| Balances, at December 31, 2012 | — | 2,542,946 | 2,542,946 | |||||||||
| Additions | — | - | - | |||||||||
| Redemptions | — | - | - | |||||||||
| Net income (loss) | — | (250,747 | ) | (250,747 | ) | |||||||
| Balances, at December 31, 2013 | — | 2,292,199 | 2,292,199 | |||||||||
| Additions | — | 3,118,249 | 3,118,249 | |||||||||
| Redemptions | — | (2,139,551 | ) | (2,139,551 | ) | |||||||
| Net income (loss) | — | (405,270 | ) | (405,270 | ) | |||||||
| Balances, at December 31, 2014 | $ | — | $ | 2,865,627 | $ | 2,865,627 | ||||||
Statements of Changes in Shares Outstanding
For the years ended December 31, 2014, 2013 and 2012
United States Copper Index Fund
| Sponsor | Shareholders | Total | ||||||||||
| Shares Outstanding, at December 31, 2011 | — | 100,000 | 100,000 | |||||||||
| Additions | — | 50,000 | 50,000 | |||||||||
| Redemptions | — | (50,000 | ) | (50,000 | ) | |||||||
| Shares Outstanding, at December 31, 2012 | — | 100,000 | 100,000 | |||||||||
| Additions | — | - | - | |||||||||
| Redemptions | — | - | - | |||||||||
| Shares Outstanding, at December 31, 2013 | — | 100,000 | 100,000 | |||||||||
| Additions | — | 150,000 | 150,000 | |||||||||
| Redemptions | — | (100,000 | ) | (100,000 | ) | |||||||
| Shares Outstanding, at December 31, 2014 | — | 150,000 | 150,000 | |||||||||
| Net Asset Value Per Share: | ||||||||||||
| At December 31, 2011 | $ | 24.47 | ||||||||||
| At December 31, 2012 | $ | 25.43 | ||||||||||
| At December 31, 2013 | $ | 22.92 | ||||||||||
| At December 31, 2014 | $ | 19.10 | ||||||||||
See accompanying notes to financial statements.
| 147 |
United States Commodity Index Funds Trust
Statement of Changes in Capital
For the years ended December 31, 2014, 2013 and 2012
United States Agriculture Index Fund*
| Sponsor | Shareholders | Total | ||||||||||
| Balances, at December 31, 2011 | $ | 1,000 | $ | — | $ | 1,000 | ||||||
| Additions | — | 5,085,695 | 5,085,695 | |||||||||
| Redemptions | (1,009 | ) | (2,722,557 | ) | (2,723,566 | ) | ||||||
| Net income (loss) | 9 | 192,554 | 192,563 | |||||||||
| Balances, at December 31, 2012 | — | 2,555,692 | 2,555,692 | |||||||||
| Additions | — | — | — | |||||||||
| Redemptions | — | — | — | |||||||||
| Net income (loss) | — | (276,753 | ) | (276,753 | ) | |||||||
| Balances, at December 31, 2013 | — | 2,278,939 | 2,278,939 | |||||||||
| Additions | — | — | — | |||||||||
| Redemptions | — | — | — | |||||||||
| Net income (loss) | — | 17,663 | 17,663 | |||||||||
| Balances, at December 31, 2014 | $ | — | $ | 2,296,602 | $ | 2,296,602 | ||||||
Statements of Changes in Shares Outstanding
For the years ended December 31, 2014, 2013 and 2012
United States Agriculture Index Fund*
| Sponsor | Shareholders | Total | ||||||||||
| Shares Outstanding, at December 31, 2011 | — | — | — | |||||||||
| Additions | 40 | 200,000 | 200,040 | |||||||||
| Redemptions | (40 | ) | (100,000 | ) | (100,040 | ) | ||||||
| Shares Outstanding, at December 31, 2012 | — | 100,000 | 100,000 | |||||||||
| Additions | — | — | — | |||||||||
| Redemptions | — | — | — | |||||||||
| Shares Outstanding, at December 31, 2013 | — | 100,000 | 100,000 | |||||||||
| Additions | — | - | — | |||||||||
| Redemptions | — | - | — | |||||||||
| Shares Outstanding, at December 31, 2014 | — | 100,000 | 100,000 | |||||||||
| Net Asset Value Per Share: | ||||||||||||
| At April 13, 2012* | $ | 25.00 | ||||||||||
| At December 31, 2012 | $ | 25.56 | ||||||||||
| At December 31, 2013 | $ | 22.79 | ||||||||||
| At December 31, 2014 | $ | 22.97 | ||||||||||
| * | The commencement of operations of the United States Agriculture Index Fund was April 13, 2012. |
See accompanying notes to financial statements.
| 148 |
United States Commodity Index Funds Trust
Statement of Changes in Capital
For the years ended December 31, 2014, 2013 and 2012
United States Metals Index Fund*
| Sponsor | Shareholders | Total | ||||||||||
| Balances, at December 31, 2011 | $ | 1,000 | $ | — | $ | 1,000 | ||||||
| Additions | — | 3,727,317 | 3,727,317 | |||||||||
| Redemptions | (1,026 | ) | (1,263,370 | ) | (1,264,396 | ) | ||||||
| Net income (loss) | 26 | 183,230 | 183,256 | |||||||||
| Balances, at December 31, 2012 | — | 2,647,177 | 2,647,177 | |||||||||
| Additions | — | 1,089,777 | 1,089,777 | |||||||||
| Redemptions | — | (1,136,000 | ) | (1,136,000 | ) | |||||||
| Net income (loss) | — | (403,732 | ) | (403,732 | ) | |||||||
| Balances, at December 31, 2013 | — | 2,197,222 | 2,197,222 | |||||||||
| Additions | — | — | — | |||||||||
| Redemptions | — | — | — | |||||||||
| Net income (loss) | — | (215,602 | ) | (215,602 | ) | |||||||
| Balances, at December 31, 2014 | $ | — | $ | 1,981,620 | $ | 1,981,620 | ||||||
Statements of Changes in Shares Outstanding
For the years ended December 31, 2014, 2013 and 2012
United States Metals Index Fund*
| Sponsor | Shareholders | Total | ||||||||||
| Shares Outstanding, at December 31, 2011 | — | — | — | |||||||||
| Additions | 40 | 150,000 | 150,040 | |||||||||
| Redemptions | (40 | ) | (50,000 | ) | (50,040 | ) | ||||||
| Shares Outstanding, at December 31, 2012 | — | 100,000 | 100,000 | |||||||||
| Additions | — | 50,000 | 50,000 | |||||||||
| Redemptions | — | (50,000 | ) | (50,000 | ) | |||||||
| Shares Outstanding, at December 31, 2013 | — | 100,000 | 100,000 | |||||||||
| Additions | — | — | — | |||||||||
| Redemptions | — | — | — | |||||||||
| Shares Outstanding, at December 31, 2014 | — | 100,000 | 100,000 | |||||||||
| Net Asset Value Per Share: | ||||||||||||
| At June 19, 2012* | $ | 25.00 | ||||||||||
| At December 31, 2012 | $ | 26.47 | ||||||||||
| At December 31, 2013 | $ | 21.97 | ||||||||||
| At December 31, 2014 | $ | 19.82 | ||||||||||
| * | The commencement of operations of the United States Metals Index Fund was June 19, 2012. |
See accompanying notes to financial statements.
| 149 |
United States Commodity Index Funds Trust
Statement of Changes in Capital
For the years ended December 31, 2014, 2013 and 2012
United States Commodity Index Funds Trust
| Sponsor | Shareholders | Total | ||||||||||
| Balances, at December 31, 2011 | $ | 2,000 | $ | 353,296,410 | $ | 353,298,410 | ||||||
| Additions | — | 181,729,927 | 181,729,927 | |||||||||
| Redemptions | (2,035 | ) | (31,583,103 | ) | (31,585,138 | ) | ||||||
| Net income (loss) | 35 | (7,611,692 | ) | (7,611,657 | ) | |||||||
| Balances, at December 31, 2012 | — | 495,831,542 | 495,831,542 | |||||||||
| Additions | — | 129,180,334 | 129,180,334 | |||||||||
| Redemptions | — | (82,000,053 | ) | (82,000,053 | ) | |||||||
| Net income (loss) | — | (23,298,441 | ) | (23,298,441 | ) | |||||||
| Balances, at December 31, 2013 | — | 519,713,382 | 519,713,382 | |||||||||
| Additions | — | 442,994,821 | 442,994,821 | |||||||||
| Redemptions | — | (104,001,832 | ) | (104,001,832 | ) | |||||||
| Net income (loss) | — | (142,441,682 | ) | (142,441,682 | ) | |||||||
| Balances, at December 31, 2014 | $ | — | $ | 716,264,689 | $ | 716,264,689 | ||||||
Statements of Changes in Shares Outstanding
For the years ended December 31, 2014, 2013 and 2012
United States Commodity Index Funds Trust
| Sponsor | Shareholders | Total | ||||||||||
| Shares Outstanding, at December 31, 2011 | — | 6,100,000 | 6,100,000 | |||||||||
| Additions | 80 | 3,200,000 | 3,200,080 | |||||||||
| Redemptions | (80 | ) | (650,000 | ) | (650,080 | ) | ||||||
| Shares Outstanding, at December 31, 2012 | — | 8,650,000 | 8,650,000 | |||||||||
| Additions | — | 2,300,000 | 2,300,000 | |||||||||
| Redemptions | — | (1,500,000 | ) | (1,500,000 | ) | |||||||
| Shares Outstanding, at December 31, 2013 | — | 9,450,000 | 9,450,000 | |||||||||
| Additions | — | 7,650,000 | 7,650,000 | |||||||||
| Redemptions | — | (2,050,000 | ) | (2,050,000 | ) | |||||||
| Shares Outstanding, at December 31, 2014 | — | 15,050,000 | 15,050,000 | |||||||||
See accompanying notes to financial statements.
| 150 |
United States Commodity Index Funds Trust
Statements of Cash Flows
For the years ended December 31, 2014, 2013 and 2012
United States Commodity Index Fund
| Year ended | Year ended | Year ended | ||||||||||
| December 31, 2014 | December 31, 2013 | December 31, 2012 | ||||||||||
| Cash Flows from Operating Activities: | ||||||||||||
| Net income (loss) | $ | (141,838,473 | ) | $ | (22,367,209 | ) | $ | (8,098,935 | ) | |||
| Adjustments to reconcile net income (loss) to net cash provided by (used in) operating activities: | ||||||||||||
| (Increase) decrease in commodity futures trading account - cash and cash equivalents | (59,905,773 | ) | 40,003,074 | 3,653,943 | ||||||||
| Unrealized (gain) loss on futures contracts | 49,056,906 | (16,010,647 | ) | (17,755,792 | ) | |||||||
| (Increase) decrease in interest receivable | — | (787 | ) | (329 | ) | |||||||
| (Increase) decrease in ETF transaction fees receivable | (700 | ) | — | (350 | ) | |||||||
| Increase (decrease) in management fees payable | 128,287 | 9,261 | 66,737 | |||||||||
| Increase (decrease) in professional fees payable | 151,042 | 31,367 | 43,160 | |||||||||
| Increase (decrease) in brokerage commissions payable | 20,000 | — | (3,380 | ) | ||||||||
| Increase (decrease) in directors' fees payable | 7,439 | 909 | (9,455 | ) | ||||||||
| Increase (decrease) in registration fees payable | (152 | ) | (1 | ) | — | |||||||
| Net cash provided by (used in) operating activities | (152,381,424 | ) | 1,665,967 | (22,104,401 | ) | |||||||
| Cash Flows from Financing Activities: | ||||||||||||
| Addition of shares | 448,368,483 | 122,521,532 | 168,769,146 | |||||||||
| Redemption of shares | (58,125,632 | ) | (80,864,053 | ) | (26,356,666 | ) | ||||||
| Net cash provided by (used in) financing activities | 390,242,851 | 41,657,479 | 142,412,480 | |||||||||
| Net Increase (Decrease) in Cash and Cash Equivalents | 237,861,427 | 43,323,446 | 120,308,079 | |||||||||
| Cash and Cash Equivalents, beginning of year | 474,123,523 | 430,800,077 | 310,491,998 | |||||||||
| Cash and Cash Equivalents, end of year | $ | 711,984,950 | $ | 474,123,523 | $ | 430,800,077 | ||||||
See accompanying notes to financial statements.
| 151 |
United States Commodity Index Funds Trust
Statements of Cash Flows
For the years ended December 31, 2014, 2013 and 2012
United States Copper Index Fund
| Year ended | Year ended | Year ended | ||||||||||
| December 31, 2014 | December 31, 2013 | December 31, 2012 | ||||||||||
| Cash Flows from Operating Activities: | ||||||||||||
| Net income (loss) | $ | (405,270 | ) | $ | (250,747 | ) | $ | 111,459 | ||||
| Adjustments to reconcile net income (loss) to net cash provided by (used in) operating activities: | ||||||||||||
| (Increase) decrease in commodity futures trading account - cash and cash equivalents | (211,188 | ) | 306,569 | (34,980 | ) | |||||||
| Unrealized (gain) loss on futures contracts | 327,688 | (123,588 | ) | (68,588 | ) | |||||||
| (Increase) decrease in receivable from Sponsor | 38,959 | 14,575 | (83,911 | ) | ||||||||
| (Increase) decrease in interest receivable | — | (7 | ) | (11 | ) | |||||||
| Increase (decrease) in management fees payable | 383 | (164 | ) | (593 | ) | |||||||
| Increase (decrease) in professional fees payable | (40,651 | ) | (14,965 | ) | 87,268 | |||||||
| Increase (decrease) in directors' fees and insurance payable | 19 | 1 | (17 | ) | ||||||||
| Net cash provided by (used in) operating activities | (290,060 | ) | (68,326 | ) | 10,627 | |||||||
| Cash Flows from Financing Activities: | ||||||||||||
| Addition of shares | 3,118,249 | — | 1,224,883 | |||||||||
| Redemption of shares | (2,139,551 | ) | — | (1,240,510 | ) | |||||||
| Net cash provided by (used in) financing activities | 978,698 | — | (15,627 | ) | ||||||||
| Net Increase (Decrease) in Cash and Cash Equivalents | 688,638 | (68,326 | ) | (5,000 | ) | |||||||
| Cash and Cash Equivalents, beginning of year | 2,040,735 | 2,109,061 | 2,114,061 | |||||||||
| Cash and Cash Equivalents, end of year | $ | 2,729,373 | $ | 2,040,735 | $ | 2,109,061 | ||||||
See accompanying notes to financial statements.
| 152 |
United States Commodity Index Funds Trust
Statements of Cash Flows
For the years ended December 31, 2014, 2013 and 2012
United States Agriculture Index Fund*
| Year ended | Year ended | Year ended | ||||||||||
| December 31, 2014 | December 31, 2013 | December 31, 2012 | ||||||||||
| Cash Flows from Operating Activities: | ||||||||||||
| Net income (loss) | $ | 17,663 | $ | (276,753 | ) | $ | 192,563 | |||||
| Adjustments to reconcile net income (loss) to net cash provided by (used in) operating activities: | ||||||||||||
| (Increase) decrease in commodity futures trading account - cash and cash equivalents | 7,255 | 449,326 | (679,407 | ) | ||||||||
| Unrealized (gain) loss on futures contracts | 22,043 | (74,622 | ) | 119,155 | ||||||||
| (Increase) decrease in receivable from Sponsor | 42,633 | (4,921 | ) | (76,851 | ) | |||||||
| (Increase) decrease in interest receivable | — | (14 | ) | (32 | ) | |||||||
| Increase (decrease) in management fees payable | (276 | ) | (202 | ) | 1,772 | |||||||
| Increase (decrease) in professional fees payable | (45,500 | ) | 5,320 | 80,030 | ||||||||
| Increase (decrease) in directors' fees and insurance payable | 52 | (27 | ) | 79 | ||||||||
| Net cash provided by (used in) operating activities | 43,870 | 98,107 | (362,691 | ) | ||||||||
| Cash Flows from Financing Activities: | ||||||||||||
| Addition of shares | — | — | 5,085,695 | |||||||||
| Redemption of shares | — | — | (2,723,566 | ) | ||||||||
| Net cash provided by (used in) financing activities | — | — | 2,362,129 | |||||||||
| Net Increase (decrease) in Cash and Cash Equivalents | 43,870 | 98,107 | 1,999,438 | |||||||||
| Cash and Cash Equivalents, beginning of year | 2,098,545 | 2,000,438 | 1,000 | |||||||||
| Cash and Cash Equivalents, end of year | $ | 2,142,415 | $ | 2,098,545 | $ | 2,000,438 | ||||||
* The commencement of operations of the United States Agriculture Index Fund was April 13, 2012.
See accompanying notes to financial statements.
| 153 |
United States Commodity Index Funds Trust
Statements of Cash Flows
For the years ended December 31, 2014, 2013 and 2012
United States Metals Index Fund*
| Year ended | Year ended | Year ended | ||||||||||
| December 31, 2014 | December 31, 2013 | December 31, 2012 | ||||||||||
| Cash Flows from Operating Activities: | ||||||||||||
| Net income (loss) | $ | (215,602 | ) | $ | (403,732 | ) | $ | 183,256 | ||||
| Adjustments to reconcile net income (loss) to net cash provided by (used in) operating activities: | ||||||||||||
| (Increase) decrease in commodity futures trading account - cash and cash equivalents | 11,442 | 138,467 | (468,065 | ) | ||||||||
| Unrealized (gain) loss on futures contracts | 90,271 | 92,351 | (46,058 | ) | ||||||||
| (Increase) decrease in receivable from Sponsor | 44,380 | (22,849 | ) | (59,316 | ) | |||||||
| (Increase) decrease in interest receivable | — | (4 | ) | (7 | ) | |||||||
| Increase (decrease) in management fees payable | (169 | ) | (284 | ) | 1,581 | |||||||
| Increase (decrease) in professional fees payable | (46,636 | ) | 24,027 | 61,605 | ||||||||
| Increase (decrease) in directors' fees and insurance payable | 43 | (31 | ) | 67 | ||||||||
| Net cash provided by (used in) operating activities | (116,271 | ) | (172,055 | ) | (326,937 | ) | ||||||
| Cash Flows from Financing Activities: | ||||||||||||
| Addition of shares | — | 1,089,777 | 3,727,317 | |||||||||
| Redemption of shares | — | (1,136,000 | ) | (1,264,396 | ) | |||||||
| Net cash provided by (used in) financing activities | — | (46,223 | ) | 2,462,921 | ||||||||
| Net Increase (Decrease) in Cash and Cash Equivalents | (116,271 | ) | (218,278 | ) | 2,135,984 | |||||||
| Cash and Cash Equivalents, beginning of year | 1,918,706 | 2,136,984 | 1,000 | |||||||||
| Cash and Cash Equivalents, end of year | $ | 1,802,435 | $ | 1,918,706 | $ | 2,136,984 | ||||||
* The commencement of operations of the United States Metals Index Fund was June 19, 2012.
See accompanying notes to financial statements.
| 154 |
United States Commodity Index Funds Trust
Statements of Cash Flows
For the years ended December 31, 2014, 2013 and 2012
United States Commodity Index Funds Trust
| Year ended | Year ended | Year ended | ||||||||||
| December 31, 2014 | December 31, 2013 | December 31, 2012 | ||||||||||
| Cash Flows from Operating Activities: | ||||||||||||
| Net income (loss) | $ | (142,441,682 | ) | $ | (23,298,441 | ) | $ | (7,611,657 | ) | |||
| Adjustments to reconcile net income (loss) to net cash used in operating activities: | ||||||||||||
| (Increase) decrease in commodity futures trading account - cash and cash equivalents | (60,098,264 | ) | 40,897,436 | 2,471,491 | ||||||||
| Unrealized (gain) loss on futures contracts | 49,496,908 | (16,116,506 | ) | (17,751,283 | ) | |||||||
| (Increase) decrease in receivable from Sponsor | 125,972 | (13,195 | ) | (220,078 | ) | |||||||
| (Increase) decrease in interest receivable | — | (812 | ) | (379 | ) | |||||||
| (Increase) decrease in ETF transaction fees receivable | (700 | ) | — | (350 | ) | |||||||
| Increase (decrease) in management fees payable | 128,225 | 8,611 | 69,497 | |||||||||
| Increase (decrease) in professional fees payable | 18,255 | 45,749 | 272,063 | |||||||||
| Increase (decrease) in brokerage commissions payable | 20,000 | — | (3,380 | ) | ||||||||
| Increase (decrease) in directors' fees and insurance payable | 7,553 | 852 | (9,326 | ) | ||||||||
| Increase (decrease) in registration fees payable | (152 | ) | (1 | ) | — | |||||||
| Net cash provided by (used in) operating activities | (152,743,885 | ) | 1,523,693 | (22,783,402 | ) | |||||||
| Cash Flows from Financing Activities: | ||||||||||||
| Addition of shares | 451,486,732 | 123,611,309 | 178,807,041 | |||||||||
| Redemption of shares | (60,265,183 | ) | (82,000,053 | ) | (31,585,138 | ) | ||||||
| Net cash provided by (used in) financing activities | 391,221,549 | 41,611,256 | 147,221,903 | |||||||||
| Net Increase (Decrease) in Cash and Cash Equivalents | 238,477,664 | 43,134,949 | 124,438,501 | |||||||||
| Cash and Cash Equivalents, beginning of year | 480,181,509 | 437,046,560 | 312,608,059 | |||||||||
| Cash and Cash Equivalents, end of year | $ | 718,659,173 | $ | 480,181,509 | $ | 437,046,560 | ||||||
See accompanying notes to financial statements.
| 155 |
United States Commodity Index Funds Trust
Notes to Financial Statements
For the years ended December 31, 2014, 2013 and 2012
NOTE 1 - ORGANIZATION AND BUSINESS
The United States Commodity Index Funds Trust (the “Trust”) was organized as a Delaware statutory trust on December 21, 2009. The Trust is a series trust formed pursuant to the Delaware Statutory Trust Act and includes the United States Commodity Index Fund (“USCI”), a commodity pool formed on April 1, 2010 and first made available to the public on August 10, 2010, the United States Copper Index Fund (“CPER”), a commodity pool formed on November 26, 2010 and first made available to the public on November 15, 2011, the United States Agriculture Index Fund (“USAG”), a commodity pool formed on November 26, 2010 and first made available to the public on April 13, 2012 and the United States Metals Index Fund (“USMI”), a commodity pool formed on November 26, 2010 and first made available to the public on June 19, 2012. On January 30, 2015, USCF as the sponsor of the “Trust and its series USMI announced that its officers and members had authorized a plan to (i) liquidate USMI, (ii) terminate the continuous offering of USMI, and (iii) deregister USMI under the Securities Exchange Act of 1934, as amended (the “Exchange Act”), and therefore, terminate the Trust’s obligation to include USMI on its periodic and current reports with the Securities and Exchange Commission (“SEC”). USCF has submitted written notice to the NYSE Arca, Inc. (“NYSE Arca”) of its decision to liquidate USMI, terminate the offering and to terminate USMI’s obligations under the Exchange Act.
Shares of USMI will cease trading on the NYSE Arca and will be closed to purchase by investors as of the close of regular trading on the NYSE Arca on March 18, 2015 (the “Closing Date”). On March 18, 2015, USMI will cease accepting orders for Creation Baskets and Redemption Baskets. The Trust will file a post-effective amendment to the registration statement on behalf of USMI to terminate the offering of registered and unsold shares of USMI. The post-effective amendment to the registration statement will be effective on March 18, 2015.
Shareholders may sell shares of USMI prior to the Closing Date and customary brokerage charges, or Redemption Basket charges, as the case may be, may apply to these transactions. From March 18, 2015 through about March 25, 2015 (the “Liquidation Date”) there is no assurance that there will be a market for shares of USMI. Between the Closing Date and the Liquidation Date, USMI will be in the process of closing down and liquidating its portfolio. This process will result in USMI increasing its cash holdings and, as a consequence, not tracking its index, the SummerHaven Metals Index Total ReturnSM, which may not be consistent with USMI’s investment objective and strategy.
On or about the Liquidation Date, USMI will liquidate its assets and distribute cash pro rata to all remaining shareholders who have not previously redeemed or exchanged their shares. These distributions are taxable events. Once the distributions are complete, USMI will terminate.
USCF has determined that USMI could not continue its business and operations in an economically efficient manner due to USMI’s inability to attract sufficient assets, thereby hindering its ability to operate efficiently.
USCF intends to file a post-effective amendment on behalf of the Trust and USMI to terminate the offering of the registered and unsold shares of USMI. The NYSE Arca will file a Form 25 with the SEC to affect the withdrawal of the listing of USMI from the NYSE Arca. Delisting from the NYSE Arca will become effective 10 days after the filing date of the Form 25. Provided that USMI continues to meet the applicable legal requirements, USCF intends to file a Form 15 on behalf of the Trust and USMI with the SEC in early April 2015 to suspend the Trust’s duty to include USMI on its reports under Sections 13(a) and 15(d) of the Exchange Act. USMI expects the termination of registration will become effective 90 days after the date of the filing of the Form 15 with the SEC.
USCI, CPER and USAG each issues shares (“shares”) that may be purchased and sold on the NYSE Arca. USCI, CPER, USAG and USMI are collectively referred to herein as the “Trust Series.” The Trust and each Trust Series operate pursuant to the Second Amended and Restated Declaration of Trust and Trust Agreement dated as of November 10, 2010 (the “Trust Agreement”). United States Commodity Funds LLC (“USCF”) is the sponsor of the Trust and the Trust Series and is also responsible for the management of the Trust and the Trust Series. For purposes of the financial statement presentation, unless specified otherwise, all references will be to the Trust Series.
| 156 |
USCF has the power and authority to establish and designate one or more series and to issue shares thereof, from time to time as it deems necessary or desirable. USCF has exclusive power to fix and determine the relative rights and preferences as between the shares of any series as to right of redemption, special and relative rights as to dividends and other distributions and on liquidation, conversion rights, and conditions under which the series shall have separate voting rights or no voting rights. The term for which the Trust is to exist commenced on the date of the filing of the Certificate of Trust, and the Trust and any Trust Series will exist in perpetuity, unless earlier terminated in accordance with the provisions of the Trust Agreement. Separate and distinct records must be maintained for each Trust Series and the assets associated with a Trust Series must be held in such separate and distinct records (directly or indirectly, including a nominee or otherwise) and accounted for in such separate and distinct records separately from the assets of any other Trust Series. Each Trust Series is separate from all other Trust Series created as series of the Trust in respect of the assets and liabilities allocated to that Trust Series and represents a separate investment portfolio of the Trust.
The sole Trustee of the Trust is Wilmington Trust Company (the “Trustee”), a Delaware banking corporation. The Trustee is unaffiliated with USCF. The Trustee’s duties and liabilities with respect to the offering of shares and the management of the Trust are limited to its express obligations under the Trust Agreement.
USCF is a member of the National Futures Association (the “NFA”) and became a commodity pool operator (“CPO”) registered with the Commodity Futures Trading Commission (the “CFTC”) effective December 1, 2005. The Trust and each Trust Series have a fiscal year ending on December 31.
USCF is also the general partner of the United States Oil Fund, LP (“USO”), the United States Natural Gas Fund, LP (“UNG”), the United States 12 Month Oil Fund, LP (“USL”), the United States Gasoline Fund, LP (“UGA”) and the United States Diesel-Heating Oil Fund, LP (“UHN”), which listed their limited partnership shares on the American Stock Exchange (the “AMEX”) under the ticker symbols “USO” on April 10, 2006, “UNG” on April 18, 2007, “USL” on December 6, 2007, “UGA” on February 26, 2008 and “UHN” on April 9, 2008, respectively. As a result of the acquisition of the AMEX by NYSE Euronext, each of USO’s, UNG’s, USL’s, UGA’s and UHN’s shares commenced trading on the NYSE Arca on November 25, 2008. USCF is also the general partner of the United States Short Oil Fund, LP (“DNO”), the United States 12 Month Natural Gas Fund, LP (“UNL”) and the United States Brent Oil Fund, LP (“BNO”), which listed their limited partnership shares on the NYSE Arca under the ticker symbols “DNO” on September 24, 2009, “UNL” on November 18, 2009 and “BNO” on June 2, 2010, respectively. All funds listed previously are referred to collectively herein as the “Related Public Funds.” On January 30, 2015, USCF as the sponsor of the Trust and its series USMI announced that its officers and members had authorized a plan to (i) liquidate USMI, (ii) terminate the continuous offering of USMI, and (iii) deregister USMI under the Exchange Act, and therefore, terminate the Trust’s obligation to include USMI on its periodic and current reports with the SEC. USCF has submitted written notice to the NYSE Arca of its decision to liquidate USMI, terminate the offering and to terminate USMI’s obligations under the Exchange Act.
USCF intends to file a post-effective amendment on behalf of the Trust and USMI to terminate the offering of the registered and unsold shares of USMI. The NYSE Arca will file a Form 25 with the SEC to affect the withdrawal of the listing of USMI from the NYSE Arca. Delisting from Arca will become effective 10 days after the filing date of the Form 25. Provided that USMI continues to meet the applicable legal requirements, USCF intends to file a Form 15 on behalf of the Trust and USMI with the SEC in early April 2015 to suspend the Trust’s duty to include USMI on its reports under Sections 13(a) and 15(d) of the Exchange Act. USMI expects the termination of registration will become effective 90 days after the date of the filing of the Form 15 with the SEC.
Effective as of May 1, 2012, each of USCI, CPER and USAG issue shares to certain authorized purchasers (“Authorized Participants”) by offering baskets consisting of 50,000 shares (“Creation Baskets”) through ALPS Distributors, Inc., as the marketing agent (the “Marketing Agent”). Prior to May 1, 2012, each of USCI, CPER and USAG issued shares to Authorized Participants by offering baskets consisting of 100,000 shares through the Marketing Agent. USMI was not available to the public until June 19, 2012, and from its inception of offering, issues shares to certain Authorized Participants by offering baskets consisting of 50,000 shares through the Marketing Agent. The purchase price for a Creation Basket is based upon the net asset value (“NAV”) of a share calculated shortly after the close of the core trading session on the NYSE Arca on the day the order to create the basket is properly received.
| 157 |
From July 1, 2011 through December 31, 2014 (and continuing at least through May 1, 2015), Authorized Participants pay USCI $350 for each order placed to create one or more Creation Baskets or to redeem one or more baskets (“Redemption Baskets”), consisting of 50,000 shares; prior to July 1, 2011, Authorized Participants paid USCI $1,000 for each order placed to create one or more Creation Baskets or to redeem one or more Redemption Baskets. From May 1, 2012 through December 31, 2014 (and continuing at least through May 1, 2015), Authorized Participants pay each of CPER and USAG $350 for each order placed to create one or more Creation Baskets or to redeem one or more Redemption Baskets (for USMI, from May 1, 2012 through March 18, 2015); prior to May 1, 2012, Authorized Participants paid $1,000 for each order placed to create one or more Creation Baskets or to redeem one or more Redemption Baskets. Shares may be purchased or sold on a nationally recognized securities exchange in smaller increments than a Creation Basket or Redemption Basket. Shares purchased or sold on a nationally recognized securities exchange are not purchased or sold at the per share NAV of each Trust Series but rather at market prices quoted on such exchange.
NOTE 2 - SUMMARY OF SIGNIFICANT ACCOUNTING POLICIES
Basis of Presentation
The financial statements have been prepared in conformity with GAAP as detailed in the Financial Accounting Standards Board’s (“FASB”) Accounting Standards Codification. Each Trust Series is an investment company and follows the accounting and reporting guidance in FASB Topic 946.
Revenue Recognition
Commodity futures contracts, forward contracts, physical commodities, and related options are recorded on the trade date. All such transactions are recorded on the identified cost basis and marked to market daily. Unrealized gains or losses on open contracts are reflected in the statements of financial condition and represent the difference between the original contract amount and the market value (as determined by exchange settlement prices for futures contracts and related options and cash dealer prices at a predetermined time for forward contracts, physical commodities, and their related options) as of the last business day of the year or as of the last date of the financial statements. Changes in the unrealized gains or losses between periods are reflected in the statements of operations. Each Trust Series earns interest on its assets denominated in U.S. dollars on deposit with the futures commission merchant (“FCM”) at the 90-day Treasury bill rate. In addition, each Trust Series earns income on funds held at the custodian and/or FCM at prevailing market rates earned on such investments.
Brokerage Commissions
Brokerage commissions on all open commodity futures contracts are accrued on a full-turn basis.
Income Taxes
The Trust Series are not subject to federal income taxes; each investor reports his/her allocable share of income, gain, loss deductions or credits on his/her own income tax return.
In accordance with accounting principles generally accepted in the United States of America (“GAAP”), each Trust Series is required to determine whether a tax position is more likely than not to be sustained upon examination by the applicable taxing authority, including resolution of any tax related appeals or litigation processes, based on the technical merits of the position. Each Trust Series files an income tax return in the U.S. federal jurisdiction, and may file income tax returns in various U.S. states. None of the Trust Series is subject to income tax return examinations by major taxing authorities for years before 2011. The tax benefit recognized is measured as the largest amount of benefit that has a greater than fifty percent likelihood of being realized upon ultimate settlement. De-recognition of a tax benefit previously recognized results in each Trust Series recording a tax liability that reduces net assets. However, each Trust Series’ conclusions regarding this policy may be subject to review and adjustment at a later date based on factors including, but not limited to, on-going analysis of and changes to tax laws, regulations and interpretations thereof. Each Trust Series recognizes interest accrued related to unrecognized tax benefits and penalties related to unrecognized tax benefits in income tax fees payable, if assessed. No interest expense or penalties have been recognized as of and for the year ended December 31, 2014 for any Trust Series.
| 158 |
Trust Capital and Allocation of Income and Losses
Profit or loss shall be allocated among the shareholders of each Trust Series in proportion to the number of shares each investor holds as of the close of each month. USCF may revise, alter or otherwise modify this method of allocation as described in the Trust Agreement.
Creations and Redemptions
Authorized Participants may purchase Creation Baskets or redeem Redemption Baskets only in blocks of 50,000 shares. Effective as of May 1, 2012, Authorized Participants may purchase Creation Baskets or redeem Redemption Baskets for USCI, CPER and USAG only in blocks of 50,000 shares at a price equal to the NAV of the shares calculated shortly after the close of the core trading session on the NYSE Arca on the day the order is placed. Prior to May 1, 2012, Authorized Participants could only purchase Creation Baskets or redeem Redemption Baskets for USCI, CPER and USAG in blocks of 100,000 shares. USMI was not available to the public until June 19, 2012, and from its inception of offering, Authorized Participants could only purchase Creation Baskets in blocks of 50,000 shares.
Each Trust Series receives or pays the proceeds from shares sold or redeemed within three business days after the trade date of the purchase or redemption. The amounts due from Authorized Participants are reflected in each Trust Series’ statements of financial condition as receivable for shares sold, and amounts payable to Authorized Participants upon redemption are reflected as payable for shares redeemed.
Calculation of Net Asset Value Per Share
Each Trust Series’ per share NAV is calculated on each NYSE Arca trading day by taking the current market value of its total assets, subtracting any liabilities and dividing the amount by the total number of shares issued and outstanding. Each Trust Series uses the closing prices on the relevant Futures Exchanges (as defined in Note 3 below) of the Applicable Benchmark Component Futures Contracts (as defined in Note 3 below) that at any given time make up the Applicable Index (as defined in Note 3 below) (determined at the earlier of the close of such exchange or 2:30 p.m. New York time) for the contracts traded on the Futures Exchanges, but calculates or determines the value of all other investments of each Trust Series using market quotations, if available, or other information customarily used to determine the fair value of such investments.
Net Income (Loss) Per Share
Net income (loss) per share is the difference between the per share NAV at the beginning of each period and the per share NAV at the end of each period. The weighted average number of shares outstanding was computed for purposes of disclosing net income (loss) per weighted average share. The weighted average shares are equal to the number of shares outstanding at the end of the period, adjusted proportionately for shares added and redeemed based on the amount of time the shares were outstanding during such period. As of December 31, 2014, USCF held 5 shares of USCI, 40 shares of CPER, 5 shares of USAG and 5 shares of USMI.
Offering Costs
Offering costs incurred in connection with the registration of shares prior to the commencement of the offering are borne by USCF. Offering costs incurred in connection with the registration of additional shares after the commencement of the offering are borne by each Trust Series. These costs include registration fees paid to regulatory agencies and all legal, accounting, printing and other expenses associated with such offerings. Costs borne by the Trust Series after the commencement of an offering are accounted for as a deferred charge and thereafter amortized to expense over twelve months on a straight-line basis or a shorter period if warranted.
Cash Equivalents
Cash equivalents include money market funds and overnight deposits or time deposits with original maturity dates of six months or less.
Reclassifications
Certain prior year amounts have been reclassified to conform to the current year presentation.
| 159 |
Use of Estimates
The preparation of financial statements in conformity with GAAP requires USCF to make estimates and assumptions that affect the reported amount of assets and liabilities and disclosure of contingent assets and liabilities at the date of the financial statements, and the reported amounts of the revenue and expenses during the reporting period. Actual results may differ from those estimates and assumptions.
NOTE 3 - TRUST SERIES
In connection with the execution of the First Trust Agreement on April 1, 2010, USCI was designated as the first series of the Trust. USCF contributed $1,000 to the Trust upon its formation on December 21, 2009, representing an initial contribution of capital to the Trust. Following the designation of USCI as the first series of the Trust, the initial capital contribution of $1,000 was transferred from the Trust to USCI and deemed an initial contribution to USCI. In connection with the commencement of USCI’s initial offering of shares, USCF received 20 Sponsor Shares of USCI in exchange for the previously received capital contribution, representing a beneficial ownership interest in USCI.
On July 30, 2010, USCI received a notice of effectiveness from the U.S. Securities and Exchange Commission (the “SEC”) for its registration of 50,000,000 shares on Form S-1 with the SEC. On August 10, 2010, USCI listed its shares on the NYSE Arca under the ticker symbol “USCI”. USCI established its initial per share NAV by setting the price at $50.00 and issued 100,000 shares in exchange for $5,000,000 on August 10, 2010. USCI also commenced investment operations on August 10, 2010 by purchasing Futures Contracts traded on the Futures Exchanges. In order to satisfy NYSE Arca listing standards that at least 100,000 shares be outstanding at the beginning of the trading day on the NYSE Arca, USCF purchased the initial Creation Basket from the initial Authorized Participant at the initial offering price. The $1,000 fee that would otherwise be charged to the Authorized Participant in connection with an order to create or redeem was waived in connection with the initial Creation Basket. USCF held such initial Creation Basket until September 3, 2010, at which time the initial Authorized Participant repurchased the shares comprising such basket in accordance with the specified conditions noted above. On September 14, 2011, USCF redeemed the 20 Sponsor Shares of USCI and, on September 19, 2011, USCF purchased five shares of USCI in the open market.
In connection with the Second Amended and Restated Trust Agreement dated November 10, 2010, USMI, USAG and CPER were designated as three additional series of the Trust. Following the designation of the additional series, an initial capital contribution of $3,000 was transferred from USCF to the Trust. On November 10, 2010, the Trust transferred $1,000 to each of USMI, USAG and CPER, which was deemed a capital contribution to each series. On November 14, 2011, USCF received 40 Sponsor Shares of CPER in exchange for the previously received capital contribution, representing a beneficial interest in CPER. On December 7, 2011, USCF redeemed the 40 Sponsor Shares of CPER and purchased 40 shares of CPER in the open market. On April 13, 2012, USCF received 40 Sponsor Shares of USAG in exchange for the previously received capital contribution, representing a beneficial interest in USAG. On June 28, 2012, USCF redeemed the 40 Sponsor Shares of USAG and on October 3, 2012, purchased 5 shares of USAG on the open market. On June 19, 2012, USCF received 40 Sponsor Shares of USMI in exchange for the previously received capital contribution, representing a beneficial interest in USMI. On August 27, 2012, USCF redeemed the 40 Sponsor Shares of USMI and on September 4, 2013, purchased 5 shares of USMI on the open market.
CPER, USAG and USMI received notice of effectiveness from the SEC for its registration of 30,000,000 CPER shares, 20,000,000 USAG shares and 20,000,000 USMI shares on September 6, 2011. The order to permit listing CPER, USAG and USMI on the NYSE Arca was received on October 20, 2011. On November 15, 2011, CPER listed its shares on the NYSE Arca under the ticker symbol “CPER.” CPER established its initial per share NAV by setting the price at $25.00 and issued 100,000 shares to the initial Authorized Participant, Merrill Lynch Professional Clearing Corp., in exchange for $2,500,000 in cash on November 15, 2011. The $1,000 fee that would otherwise be charged to the Authorized Participant in connection with an order to create or redeem was waived in connection with the initial Creation Basket.
| 160 |
On April 13, 2012, USAG listed its shares on the NYSE Arca under the ticker symbol “USAG.” USAG established its initial per share NAV by setting the price at $25.00. On April 14, 2012, USCF purchased 2 initial Creation Baskets of USAG. In accordance with applicable requirements of Regulation M under the Securities Exchange Act of 1934, no Creation Baskets were offered to Authorized Participants nor were the shares listed on the NYSE Arca until five business days had elapsed from the date of USCF’s purchase of the initial Creation Basket on April 4, 2012. The $1,000 fee that would have otherwise been charged in connection with an order to create or redeem was waived in connection with the initial Creation Basket.
On June 19, 2012, USMI listed its shares on the NYSE Arca under the ticker symbol “USMI.” USMI established its initial per share NAV by setting the price at $25.00. On June 11, 2012, USCF purchased two initial Creation Baskets of USMI. In accordance with applicable requirements of Regulation M under the Securities Exchange Act of 1934, no Creation Baskets were offered to Authorized Participants nor were the shares listed on the NYSE Arca until five business days had elapsed from the date of USCF’s purchase of the initial Creation Basket on June 11, 2012. The $350 fee that would have otherwise been charged in connection with an order to create or redeem was waived in connection with the initial Creation Basket. On August 29, 2012, USCF redeemed one of two initial Creation Baskets of USMI, leaving its holdings to 50,000 shares.
USCI’s Investment Objective
USCI invests in futures contracts for commodities that are currently traded on the New York Mercantile Exchange (the “NYMEX”), ICE Futures (“ICE Futures”), Chicago Board of Trade (“CBOT”), Chicago Mercantile Exchange (“CME”), London Metal Exchange (“LME”), Commodity Exchange, Inc. (“COMEX”) or on other foreign exchanges (the NYMEX, ICE Futures, CBOT, CME, LME, Comex and other foreign exchanges, collectively, the “Futures Exchanges”) (such futures contracts, collectively, “Futures Contracts”) and, to a lesser extent, in order to comply with regulatory requirements or in view of market conditions, other commodity-based contracts and instruments such as cash-settled options on Futures Contracts, forward contracts relating to commodities, cleared swap contracts and other nonexchange traded (“over-the-counter”) transactions that are based on the price of commodities and Futures Contracts (collectively, “Other Commodity-Related Investments”). Market conditions that USCF currently anticipates could cause USCI to invest in Other Commodity Related Investments would be those allowing USCI to obtain greater liquidity or to execute transactions with more favorable pricing. Futures Contracts and Other Commodity-Related Investments collectively are referred to as “Commodity Interests.”
The investment objective of USCI is for the daily changes in percentage terms of its shares’ per share Net Asset Value (“NAV”) to reflect the daily changes in percentage terms of the SummerHaven Dynamic Commodity Index Total ReturnSM (the “SDCI”), less USCI’s expenses. USCF does not intend to operate USCI in a fashion such that its per share NAV will equal, in dollar terms, the spot prices of the commodities underlying the Benchmark Component Futures Contracts (as defined below) that comprise the SDCI or the prices of any particular group of Futures Contracts. USCI will not seek to achieve its stated investment objective over a period of time greater than one day. USCI believes that it is not practical to manage the portfolio to achieve such an investment goal when investing in Futures Contracts and Other Commodity-Related Investments. The SDCI is designed to reflect the performance of a diversified group of commodities. The SDCI is comprised of 14 Futures Contracts that are selected on a monthly basis from a list of 27 possible Futures Contracts. The Futures Contracts that at any given time make up the SDCI are referred to herein as “Benchmark Component Futures Contracts.” The SDCI is owned and maintained by SummerHaven Index Management, LLC (“SHIM”) and calculated and published by Bloomberg, L.P. USCI invests first in the current Benchmark Component Futures Contracts and other Futures Contracts intended to replicate the return on the current Benchmark Component Futures Contracts and, thereafter may hold Futures Contracts in a particular commodity other than one specified as the Benchmark Component Futures Contract, or may hold Other Commodity-Related Investments that are intended to replicate the return on the Benchmark Futures Contracts, but may fail to closely track the SDCI’s total return movements. If USCI increases in size, and due to its obligations to comply with regulatory limits or due to other market pricing or liquidity factors, USCI may invest in Futures Contract months other than the designated month specified as the Benchmark Component Futures Contract, or in Other Commodity-Related Investments, which may have the effect of increasing transaction related expenses and may result in increased tracking error.
USCI’s shares began trading on August 10, 2010. As of December 31, 2014, USCI held 657 Futures Contracts on the NYMEX, 2,553 Futures Contracts on the ICE Futures, 5,487 Futures Contracts on the CBOT, 2,861 Futures Contracts on the CME, 5,001 Futures Contracts on the LME and 430 Futures Contracts on the COMEX, totaling 16,989 futures contracts.
| 161 |
CPER’s Investment Objective
The investment objective of CPER is for the daily changes in percentage terms of its shares’ per share NAV to reflect the daily changes in percentage terms of the SummerHaven Copper Index Total ReturnSM (the “SCI”), less CPER’s expenses. USCF does not intend to operate CPER in a fashion such that its per share NAV will equal, in dollar terms, the spot prices of the commodities underlying the Benchmark Component Copper Futures Contracts (as defined below) that comprise the SCI or the prices of any particular group of Futures Contracts. CPER will not seek to achieve a stated investment objective over a period of time greater than one day. USCF believes that it is not practical to manage the portfolio to achieve such an investment goal when investing in Futures Contracts and Other Copper-Related Investments (as defined below). The SCI is designed to reflect the performance of the investment returns from a portfolio of copper futures contracts. The SCI is owned and maintained by SHIM and calculated and published by the NYSE Arca. The SCI is comprised of either two or three Eligible Copper Futures Contracts that are selected on a monthly basis based on quantitative formulas relating to the prices of the Eligible Copper Futures Contracts developed by SHIM. The Eligible Copper Futures Contracts that at any given time make up the SCI are referred to herein as “Benchmark Component Copper Futures Contracts.”
CPER seeks to achieve its investment objective by investing to the fullest extent possible in the Benchmark Component Copper Futures Contracts. Then, if constrained by regulatory requirements or in view of market conditions, CPER will invest next in other Eligible Copper Futures Contracts, and finally to a lesser extent, in other exchange traded futures contracts that are economically identical or substantially similar to the Benchmark Component Copper Futures Contracts if one or more other Eligible Copper Futures Contracts is not available. When CPER has invested to the fullest extent possible in exchange-traded futures contracts, CPER may then invest in other contracts and instruments based on the Benchmark Component Copper Futures Contracts, other Eligible Copper Futures Contracts or copper, such as cash-settled options, forward contracts, cleared swap contracts and swap contracts other than cleared swap contracts. Other exchange-traded futures contracts that are economically identical or substantially similar to the Benchmark Component Copper Futures Contracts and other contracts and instruments based on the Benchmark Component Copper Futures Contracts, are collectively referred to collectively as “Other Copper-Related Investments,” and together with Benchmark Component Copper Futures Contracts and other Eligible Copper Futures Contracts, “Copper Interests.” CPER’s shares began trading on November 15, 2011. As of December 31, 2014, CPER held 40 Futures Contracts on the COMEX.
USAG’s Investment Objective
The investment objective of USAG is for the daily changes in percentage terms of its shares’ per share NAV to reflect the daily changes in percentage terms of the SummerHaven Dynamic Agriculture Index Total ReturnSM (the “SDAI”), less USAG’s expenses. USCF does not intend to operate USAG in a fashion such that its per share NAV will equal, in dollar terms, the spot prices of the commodities underlying the Benchmark Component Agriculture Futures Contracts (as defined below) that comprise the SDAI or the prices of any particular group of Futures Contracts. USAG will not seek to achieve its stated investment objective over a period of time greater than one day. USCF believes that it is not practical to manage the portfolio to achieve such an investment goal when investing in Futures Contracts and Other Agriculture-Related Investments (as defined below). The SDAI is designed to reflect the performance of a diversified group of agricultural commodities. The SDAI is owned and maintained by SHIM and calculated and published by the NYSE Arca. Futures contracts for the agricultural commodities comprising the SDAI are traded on ICE Future US, ICE Futures Canada, the CBOT, the Kansas City Board of Trade (“KCBT”) and the CME and are collectively referred to herein as “Eligible Agriculture Futures Contracts.” The SDAI is comprised of 14 Eligible Agriculture Futures Contracts that are selected on a monthly basis based on quantitative formulas developed by SHIM. The Eligible Agriculture Futures Contracts that at any given time make up the SDAI are referred to herein as “Benchmark Component Agriculture Futures Contracts.” The relative weighting of the Benchmark Component Agriculture Futures Contracts will change on a monthly basis, based on quantitative formulas relating to the prices of the Benchmark Component Agriculture Futures Contracts developed by SHIM.
| 162 |
USAG seeks to achieve its investment objective by investing to the fullest extent possible in the Benchmark Component Agriculture Futures Contracts. Then, if constrained by regulatory requirements or in view of market conditions, USAG will invest next in other Eligible Agriculture Futures Contracts based on the same agricultural commodity as the futures contracts subject to such regulatory constraints or market conditions, and finally, to a lesser extent, in other exchange traded futures contracts that are economically identical or substantially similar to the Benchmark Component Agriculture Futures Contracts if one or more other Eligible Agriculture Futures Contracts is not available. When USAG has invested to the fullest extent possible in exchange-traded futures contracts, USAG may then invest in other contracts and instruments based on the Benchmark Component Agriculture Futures Contracts, other Eligible Agriculture Futures Contracts or the agricultural commodities included in the SDAI, such as cash-settled options, forward contracts, cleared swap contracts and swap contracts other than cleared swap contracts. Other exchange-traded futures contracts that are economically identical or substantially similar to the Benchmark Component Agriculture Futures Contracts and other contracts and instruments based on the Benchmark Component Agriculture Futures Contracts, as well as metals included in the SDAI, are collectively referred to as “Other Agriculture-Related Investments,” and together with Benchmark Component Agriculture Futures Contracts and other Eligible Agriculture Futures Contracts, “Agriculture Interests.” USAG’s shares began trading on April 13, 2012. As of December 31, 2014, USAG held 41 Futures Contracts on the ICE Futures, 8 Futures Contracts on the CME, 2 Futures Contract on the KCBT and 31 Futures Contracts on the CBOT, totaling 82 futures contracts.
USMI’s Investment Objective
Prior to USMI’s cessation of trading, scheduled for March 18, 2015, the investment objective of USMI was for the daily changes in percentage terms of its shares’ per share NAV to reflect the daily changes in percentage terms of the SummerHaven Metals Index Total ReturnSM (the “SDMI”), less USMI’s expenses. The SDMI is owned and maintained by SHIM and calculated and published by the NYSE Arca. Futures contracts for the metals in the SDMI that are traded on the NYMEX, the LME and COMEX are collectively referred to herein as “Eligible Metals Futures Contracts.” The SDMI is comprised of 10 Eligible Metals Futures Contracts that are selected on a monthly basis based on quantitative formulas developed by SHIM. The Eligible Metals Futures Contracts that at any given time make up the SDMI are referred to herein as “Benchmark Component Metals Futures Contracts.” The relative weighting of the Benchmark Component Metals Futures Contracts will change on a monthly basis, based on quantitative formulas relating to the prices of the Benchmark Component Metals Futures Contracts developed by SHIM.
Other exchange-traded futures contracts that are economically identical or substantially similar to the Benchmark Component Metals Futures Contracts and other contracts and instruments based on the Benchmark Component Metals Futures Contracts are collectively referred to as “Other Metals-Related Investments,” and together with Benchmark Component Metals Futures Contracts and other Eligible Metals Futures Contracts, “Metals Interests.” USMI’s shares began trading on June 19, 2012 and ceased trading on March 18, 2015. USMI’s assets were liquidated by March 25, 2015. As of December 31, 2014, USMI held 2 Futures Contracts on the NYMEX, 73 Futures Contracts on the LME and 12 Futures Contracts on the COMEX, totaling 87 futures contracts.
Other Defined Terms – Trust Series
The SDCI, the SCI, the SDAI and the SDMI are referred to throughout these Notes to Financial Statements collectively as the “Applicable Index” or “Indices.”
Benchmark Component Futures Contracts, Benchmark Component Copper Futures Contracts, Benchmark Component Agriculture Futures Contracts and Benchmark Component Metals Futures Contracts are referred to throughout these Notes to Financial Statements collectively as “Applicable Benchmark Component Futures Contracts.”
Other Commodity-Related Investments, Other Copper-Related Investments, Other Agriculture-Related Interests and Other Metals-Related Investments are referred to throughout these Notes to Financial Statements collectively as “Other Related Investments.”
Trading Advisor and Trustee
The Trust Series’ trading advisor is SummerHaven Investment Management, LLC (“SummerHaven”), a Delaware limited liability company that is registered as a commodity trading advisor and CPO with the CFTC and is a member of the NFA. SummerHaven provides advisory services to USCF with respect to the Applicable Index of each Trust Series and the investment decisions of each Trust Series.
The Trustee accepts service of legal process on the Trust in the State of Delaware and makes certain filings under the Delaware Statutory Trust Act. The Trustee does not owe any other duties to the Trust, USCF or the shareholders.
| 163 |
NOTE 4 - FEES PAID BY EACH TRUST SERIES AND RELATED PARTY TRANSACTIONS
USCF Management Fee
Under the Trust Agreement, USCF is responsible for investing the assets of each Trust Series in accordance with the objectives and policies of each such Trust Series. In addition, USCF has arranged for one or more third parties to provide trading advisory, administrative, custody, accounting, transfer agency and other necessary services to each Trust Series. For these services, each of USCI, CPER, USAG and USMI is contractually obligated to pay USCF a fee, which is paid monthly, equal to 0.95% per annum of average daily total net assets. Effective May 1, 2014 and continuing through December 31, 2015, USCF has contractually agreed to lower the management fee to 0.80% per annum of average daily total net assets for USCI, 0.65% per annum of average daily total net assets for CPER, 0.65% per annum of average daily total net assets for USAG and 0.65% per annum of average daily total net assets for USMI. From May 29, 2012 through April 30, 2014, USCF voluntarily waived the management fee paid by each of CPER and USAG from 0.95% per annum of average daily total net assets to 0.65% and 0.80% per annum of average daily total net assets, respectively. Effective as of May 30, 2012 through April 30, 2014, USCF voluntarily waived the management fee paid by USMI from 0.95% per annum of average daily total net assets to 0.70% per annum of average daily total net assets. The reduced fee for USMI became operational as of June 19, 2012, when USMI first became listed on the NYSE Arca.
Trustee Fee
The Trustee is the Delaware trustee of the Trust. In connection with the Trustee’s services, USCF is responsible for paying the Trustee’s annual fee in the amount of $3,000.
Ongoing Registration Fees and Other Offering Expenses
Each Trust Series pays the costs and expenses associated with the ongoing registration of its shares subsequent to the initial offering. These costs include registration or other fees paid to regulatory agencies in connection with the offer and sale of shares, and all legal, accounting, printing and other expenses associated with such offer and sale. During the year ended December 31, 2014, none of the Trust Series except for USCI incurred any registration fees or other offering expenses. During the years ended December 31, 2014, 2013 and 2012, USCI incurred $850, $850 and $800 in registration fees or other offering expenses, respectively.
Directors’ Fees and Expenses
Each Trust Series is responsible for paying its portion of the directors’ fees and directors’ and officers’ liability insurance for such Trust Series and the Related Public Funds. Each Trust Series shares the fees and expenses on a pro rata basis with each other Trust Series and each Related Public Fund, as described above, based on the relative assets of each fund computed on a daily basis. These fees and expenses for the year ended December 31, 2014 amounted to a total of $567,863 for the Trust Series and the Related Public Funds. USCI’s portion of such fees and expenses for the year ended December 31, 2014 was $144,809, CPER’s portion of such fees and expenses for the year ended December 31, 2014 was $658. USAG’s portion of such fees and expenses for the year ended December 31, 2014 was $569 and USMI’s portion of such fees and expenses for the year ended December 31, 2014 was $548. For the year ended December 31, 2013, these fees and expenses were $555,465 for the Trust Series and the Related Public Funds. USCI’s portion of such fees and expenses for the year ended December 31, 2013 was $104,184, CPER’s portion of such fees and expenses for the year ended December 31, 2013 was $488, USAG’s portion of such fees and expenses for the year ended December 31, 2013 was $471 and USMI’s portion of such fees and expenses for the year ended December 31, 2013 was $493.
Investor Tax Reporting Cost
The fees and expenses associated with each Trust Series’ audit expenses and tax accounting and reporting requirements are paid by such Trust Series. These costs amounted to a total of $690,000 for the year ended December 31, 2014 for USCI, $46,000 for the year ended December 31, 2014 for CPER, $41,000 for the year ended December 31, 2014 for USAG and $40,000 for the year ended December 31, 2014 for USMI.
| 164 |
Other Expenses and Fees and Expense Waivers
In addition to the fees described above, each Trust Series pays all brokerage fees and other expenses in connection with the operation of such Trust Series, excluding costs and expenses paid by USCF as outlined in Note 5 below. In addition, USCF has voluntarily agreed to pay certain expenses normally borne by each of CPER, USAG and USMI to the extent that such expenses exceed 0.15% (15 basis points) of each of CPER’s, USAG’s and USMI’s NAV, on an annualized basis, through at least May 1, 2014. USCF has no obligation to continue such payments into subsequent periods. For the year ended December 31, 2014, USCF waived $62,989 in expenses for CPER, $46,339 for USAG and $44,985 for USMI. This voluntary expense waiver is in addition to those amounts USCF is contractually obligated to pay as described in Note 5 – Contracts and Agreements below.
NOTE 5 - CONTRACTS AND AGREEMENTS
USCF and the Trust, each on its own behalf and on behalf of each Trust Series, are party to a marketing agent agreement, dated as of July 22, 2010, as amended from time to time, with the Marketing Agent, whereby the Marketing Agent provides certain marketing services for each Trust Series as outlined in the agreement. The fee of the Marketing Agent, which is borne by USCF, is equal to 0.06% on each Trust Series’ assets up to $3 billion and 0.04% on each Trust Series’ assets in excess of $3 billion. In no event may the aggregate compensation paid to the Marketing Agent and any affiliate of USCF for distribution related services exceed 10% of the gross proceeds of each Trust Series’ offering.
The above fee does not include website construction and development, which are also borne by USCF.
USCF and the Trust, on its own behalf and on behalf of each Trust Series, are also party to a custodian agreement, dated July 22, 2010, as amended from time to time, with Brown Brothers Harriman & Co. (“BBH&Co.”), whereby BBH&Co. holds investments on behalf of each Trust Series. USCF pays the fees of the custodian, which are determined by the parties from time to time. In addition, USCF and the Trust, on its own behalf and on behalf of each Trust Series, are party to an administrative agency agreement, dated July 22, 2010, as amended from time to time, with BBH&Co., whereby BBH&Co. acts as the administrative agent, transfer agent and registrar for each Trust Series. USCF also pays the fees of BBH&Co. for its services under such agreement and such fees are determined by the parties from time to time.
Currently, USCF pays BBH&Co. for its services, in the foregoing capacities, a minimum amount of $75,000 annually for its custody, fund accounting and fund administration services rendered to each Trust Series and each of the Related Public Funds, as well as a $20,000 annual fee for its transfer agency services. In addition, USCF pays BBH&Co. an asset-based charge of: (a) 0.06% for the first $500 million of the Related Public Funds’ combined net assets, (b) 0.0465% for the Related Public Funds’ combined net assets greater than $500 million but less than $1 billion, and (c) 0.035% once the Related Public Funds’ combined net assets exceed $1 billion. The annual minimum amount will not apply if the asset-based charge for all accounts in the aggregate exceeds $75,000. USCF also pays transaction fees ranging from $7 to $15 per transaction.
The Trust on behalf of each Trust Series entered into a brokerage agreement, dated March 1, 2010 for USCI and November 18, 2011 for each of CPER, USAG and USMI, as amended from time to time, with Newedge USA, LLC (“Newedge”). On July 7, 2014, the Trust on behalf of each Trust Series entered into a Futures and Cleared Swaps Agreement with Wells Fargo Securities, LLC (“WFS”). WFS and Newedge are collectively referred to as the “Futures Commissions Merchant” or “FCM”. The agreements require the FCM to provide services to each Trust Series in connection with the purchase and sale of Futures Contracts and Other Related Investments that may be purchased and sold by or through the FCM for each Trust Series’ account. In accordance with the agreement, the FCM charges each Trust Series commissions of approximately $7 to $15 per round-turn trade, including applicable exchange and NFA fees for Futures Contracts and options on Futures Contracts. Such fees include those incurred when purchasing Futures Contracts and options on Futures Contracts when each Trust Series issues shares as a result of a Creation Basket, as well as fees incurred when selling Futures Contacts and options on Futures Contracts when each Trust Series redeems shares as a result of a Redemption Basket. Such fees are also incurred when Futures Contracts and options on Futures Contracts are purchased or redeemed for the purpose of rebalancing the portfolio. Each Trust Series also incurs commissions to brokers for the purchase and sale of Futures Contracts, Other Commodity-Related Investments or short-term obligations of the United States of two years or less (“Treasuries”).
| 165 |
USCI
| For the Year ended December 31, 2014 | For the Year ended December 31, 2013 | For the Year ended December 31, 2012 | ||||||||||
| Total commissions accrued to brokers | $ | 653,625 | $ | 390,945 | $ | 310,109 | ||||||
| Commissions accrued as a result of rebalancing | $ | 614,322 | $ | 376,294 | $ | 296,759 | ||||||
| Percentage of commissions accrued as a result of rebalancing | 93.99 | % | 96.25 | % | 95.70 | % | ||||||
| Commissions accrued as a result of creation and redemption activity | $ | 39,303 | $ | 14,651 | $ | 13,350 | ||||||
| Percentage of commissions accrued as a result of creation and redemption activity | 6.01 | % | 3.75 | % | 4.30 | % | ||||||
The increase in USCI’s total commissions accrued to brokers for the year ended December 31, 2014, compared to the years ended December 31, 2013 and 2012, was primarily a result of increased brokerage fees due to a higher number of contracts held and traded, a higher level of create activity, and transition trades due to change of FCM. As an annualized percentage of average total net assets, USCI’s figure for the year ended December 31, 2014, represents approximately 0.09% of USCI’s average total net assets. By comparison, USCI’s figure for the years ended December 31, 2013 and 2012, respectively, represented approximately 0.08% and 0.07% of USCI’s average total net assets. However, there can be no assurance that commission costs and portfolio turnover will not cause commission expenses to rise in future quarters.
CPER
| For the Year ended December 31, 2014 | For the Year ended December 31, 2013 | For the Year ended December 31, 2012 | ||||||||||
| Total commissions accrued to brokers | $ | 1,896 | $ | 916 | $ | 956 | ||||||
| Commissions accrued as a result of rebalancing | $ | 1,382 | $ | 916 | $ | 799 | ||||||
| Percentage of commissions accrued as a result of rebalancing | 72.89 | % | 100 | % | 83.58 | % | ||||||
| Commissions accrued as a result of creation and redemption activity | $ | 514 | $ | — | $ | 157 | ||||||
| Percentage of commissions accrued as a result of creation and redemption activity | 27.11 | % | — | % | 16.42 | % | ||||||
The increase in CPER’s total commissions accrued to brokers for the year ended December 31, 2014, compared to the years ended December 31, 2013 and 2012, was primarily a result of increased brokerage fees due to a higher number of contracts held and traded, a higher level of create activity, and transition trades due to change of FCM. As an annualized percentage of average total net assets, CPER’s figure for the year ended December 31, 2014, represents approximately 0.06% of CPER’s average total net assets. By comparison, CPER’s figure for the years ended December 31, 2013 and 2012, respectively, represented approximately 0.04% and 0.04% of CPER’s average total net assets. However, there can be no assurance that commission costs and portfolio turnover will not cause commission expenses to rise in future quarters.
| 166 |
USAG
| For the Year ended December 31, 2014 | For the Year ended December 31, 2013 | For the Year ended December 31, 2012 | ||||||||||
| Total commissions accrued to brokers | $ | 2,020 | $ | 2,003 | $ | 2,632 | ||||||
| Commissions accrued as a result of rebalancing | $ | 2,020 | $ | 2,003 | $ | 2,090 | ||||||
| Percentage of commissions accrued as a result of rebalancing | 100 | % | 100 | % | 79.41 | % | ||||||
| Commissions accrued as a result of creation and redemption activity | $ | — | $ | — | $ | 542 | ||||||
| Percentage of commissions accrued as a result of creation and redemption activity | — | % | — | % | 20.59 | % | ||||||
USAG’s total commissions accrued to brokers for the year ended December 31, 2014, compared to the years ended December 31, 2013 and 2012, was similar. As an annualized percentage of average total net assets, USAG’s figure for the year ended December 31, 2014, represents approximately 0.08% of USAG’s average total net assets. By comparison, USAG’s figure for the years ended December 31, 2013 and 2012, respectively, represented approximately 0.08% and 0.12% of USAG’s average total net assets. However, there can be no assurance that commission costs and portfolio turnover will not cause commission expenses to rise in future quarters.
USMI
| For the Year ended December 31, 2014 | For the Year ended December 31, 2013 | For the Year ended December 31, 2012 | ||||||||||
| Total commissions accrued to brokers | $ | 826 | $ | 871 | $ | 714 | ||||||
| Commissions accrued as a result of rebalancing | $ | 826 | $ | 774 | $ | 512 | ||||||
| Percentage of commissions accrued as a result of rebalancing | 100 | % | 88.86 | % | 71.71 | % | ||||||
| Commissions accrued as a result of creation and redemption activity | $ | — | $ | 97 | $ | 202 | ||||||
| Percentage of commissions accrued as a result of creation and redemption activity | — | % | 11.14 | % | 28.29 | % | ||||||
The decrease in USMI’s total commissions accrued to brokers for the year ended December 31, 2014, compared to the years ended December 31, 2013 and 2012, was primarily a result of decreased brokerage fees due to a lower number of contracts held and traded. As an annualized percentage of average total net assets, USMI’s figure for the year ended December 31, 2014, represents approximately 0.04% of USMI’s average total net assets. By comparison, USMI’s figure for the years ended December 31, 2013 and 2012, respectively, represented approximately 0.03% and 0.05% of CPER’s average total net assets. However, there can be no assurance that commission costs and portfolio turnover will not cause commission expenses to rise in future quarters.
| 167 |
USCF is party to an Amended Advisory Agreement, dated July 1, 2011, as amended from time to time, with SummerHaven, whereby SummerHaven provides advisory services to USCF with respect to the Applicable Index for each Trust Series and investment decisions for each Trust Series. SummerHaven’s advisory services include, but are not limited to, general consultation regarding the calculation and maintenance of the Applicable Index for each Trust Series, anticipated changes to each Applicable Index and the nature of each Applicable Index’s current or anticipated component securities. For these services, USCF pays SummerHaven a fee based on a percentage of the average total net assets of each Trust Series. For USCI, the fee is equal to the percentage fees paid to USCF minus 0.14%, with that result multiplied by 0.5, minus 0.06% to arrive at the actual fee paid. For each of CPER, USAG and USMI, the fee is equal to the percentage fees paid to USCF minus 0.18%, with that result multiplied by 0.5, minus 0.6% to arrive at the actual fee paid.
USCF is also party to an Amended Licensing Agreement, dated July 1, 2011, as amended from time to time, with SummerHaven, whereby SummerHaven sub-licensed to each Trust Series the use of certain names and marks, including the Applicable Index for each Trust Series for which SummerHaven has a sub-license from SHIM, the owner of each Applicable Index. Under the Licensing Agreement, USCF paid SummerHaven an annual fee of $15,000 per each Trust Series for the year ended December 31, 2014, plus an annual fee of 0.06% of the average daily total net assets of each Trust Series.
NOTE 6 - FINANCIAL INSTRUMENTS, OFF-BALANCE SHEET RISKS AND CONTINGENCIES
Each Trust Series engages in the trading of futures contracts and options on futures contracts and may engage in cleared swaps (collectively, “derivatives”). As such, each Trust Series is exposed to both market risk, which is the risk arising from changes in the market value of the contracts, and credit risk, which is the risk of failure by another party to perform according to the terms of a contract.
Each Trust Series may enter into futures contracts and options on futures contracts to gain exposure to changes in the value of an underlying commodity. A futures contract obligates the seller to deliver (and the purchaser to accept) the future delivery of a specified quantity and type of a commodity at a specified time and place. Some futures contracts may call for physical delivery of the asset, while others are settled in cash. The contractual obligations of a buyer or seller may generally be satisfied by taking or making physical delivery of the underlying commodity or by making an offsetting sale or purchase of an identical futures contract on the same or linked exchange before the designated date of delivery. Cleared swaps are over-the-counter agreements that are eligible to be cleared by a clearinghouse, but are not traded on an exchange. A cleared swap is created when the parties to an off-exchange over-the-counter swap transaction agree to extinguish their OTC contract and replace with a cleared swap. Cleared swaps are intended to provide the efficiencies and benefits that centralized clearing or an exchange offers to traders of futures contracts, including credit risk intermediation and the ability to offset positions initiated with different counterparties.
The purchase and sale of futures contracts and options on futures contracts require margin deposits with a FCM. Additional deposits may be necessary for any loss on contract value. The Commodity Exchange Act requires a FCM to segregate all customer transactions and assets from the FCM’s proprietary activities.
Futures contracts involve, to varying degrees, elements of market risk (specifically commodity price risk) and exposure to loss in excess of the amount of variation margin. The face or contract amounts reflect the extent of the total exposure each Trust Series has in the particular classes of instruments. Additional risks associated with the use of futures contracts are an imperfect correlation between movements in the price of the futures contracts and the market value of the underlying securities and the possibility of an illiquid market for a futures contract. Buying and selling options on futures contracts exposes investors to the risks of purchasing or selling futures contracts.
All of the Futures Contracts held by each Trust Series were exchange-traded through December 31, 2014. The risks associated with exchange-traded contracts are generally perceived to be less than those associated with over-the-counter transactions since, in over-the-counter transactions, a party must rely solely on the credit of its respective individual counterparties. When each Trust Series enters into non-exchange traded contracts (including Exchange for Risk or EFR transactions), it is subject to the credit risk associated with counterparty non-performance. The credit risk from counterparty non-performance associated with such instruments is the net unrealized gain, if any, on the transaction. Currently, each Trust Series has credit risk under its futures contracts since the sole counterparty to all domestic and foreign futures contracts is the clearinghouse for the exchange on which the relevant contracts are traded. In addition, each Trust Series bears the risk of financial failure by the clearing broker.
A Trust Series’ cash and other property, such as Treasuries, deposited with a FCM are considered commingled with all other customer funds, subject to the FCM’s segregation requirements. In the event of a FCM’s insolvency, recovery may be limited to a pro rata share of segregated funds available. It is possible that the recovered amount could be less than the total of cash and other property deposited. The insolvency of a FCM could result in the complete loss of a Trust Series’ assets posted with that FCM; however, the majority of each Trust Series’ assets are held in Treasuries, cash and/or cash equivalents with the Trust Series’ custodian and would not be impacted by the insolvency of a FCM. The failure or insolvency of the Trust Series’ custodian, however, could result in a substantial loss of each Trust Series’ assets.
| 168 |
USCF may invest a portion of each Trust Series’ cash in money market funds that seek to maintain a stable per share NAV. Each Trust Series may be exposed to any risk of loss associated with an investment in such money market funds. As of December 31, 2014 and December 31, 2013, none of the Trust Series held investments in money market funds. Each Trust Series holds cash deposits with its custodian. Pursuant to a written agreement with BBH&Co., uninvested overnight cash balances are swept to offshore branches of U.S. regulated and domiciled banks located in Toronto, Canada, London, United Kingdom, Grand Cayman, Cayman Islands and Nassau, Bahamas which are subject to U.S. regulation and regulatory oversight. As of December 31, 2014 and December 31, 2013, USCI held cash deposits and investments in Treasuries in the amounts of $792,207,276 and $494,440,076, respectively, with the custodian and FCM. As of December 31, 2014 and December 31, 2013, CPER held cash deposits and investments in Treasuries in the amounts of $3,066,521 and $2,166,695, respectively, with the custodian and FCM. As of December 31, 2014 and December 31, 2013, USAG held cash deposits and investments in Treasuries in the amounts of $2,365,241 and $2,328,626, respectively, with the custodian and FCM. As of December 31, 2014 and December 31, 2013, USMI held cash deposits and investments in Treasuries in the amounts of $2,120,591 and $2,248,304, respectively, with the custodian and FCM. Some or all of these amounts may be subject to loss should the Trust Series’ custodian and/or FCM cease operations.
For derivatives, risks arise from changes in the market value of the contracts. Theoretically, each Trust Series is exposed to market risk equal to the value of Futures Contracts purchased and unlimited liability on such contracts sold short. As both a buyer and a seller of options, each Trust Series pays or receives a premium at the outset and then bears the risk of unfavorable changes in the price of the contract underlying the option.
The Trust Series’ policy is to continuously monitor its exposure to market and counterparty risk through the use of a variety of financial, position and credit exposure reporting controls and procedures. In addition, the Trust Series or USCF have a policy of requiring review of the credit standing of each broker or counterparty with which they conduct business.
The financial instruments held by the applicable Trust Series are reported in its statements of financial condition at market or fair value, or at carrying amounts that approximate fair value, because of their highly liquid nature and short-term maturity.
NOTE 7 - FINANCIAL HIGHLIGHTS
The following tables present per share performance data and other supplemental financial data for each Trust Series for the years ended December 31, 2014, 2013 and 2012 for the shareholders. This information has been derived from information presented in the financial statements.
USCI
| Year ended December 31, 2014 | Year ended December 31, 2013 | Year ended December 31, 2012 | ||||||||||
| Per Share Operating Performance: | ||||||||||||
| Net asset value, beginning of year | $ | 56.06 | $ | 58.45 | $ | 58.47 | ||||||
| Total income (loss) | (7.23 | ) | (1.75 | ) | 0.67 | |||||||
| Net expenses | (0.59 | ) | (0.64 | ) | (0.69 | ) | ||||||
| Net increase (decrease) in net asset value | (7.82 | ) | (2.39 | ) | (0.02 | ) | ||||||
| Net asset value, end of year | $ | 48.24 | $ | 56.06 | $ | 58.45 | ||||||
| Total Return | (13.95 | )% | (4.09 | )% | (0.03 | )% | ||||||
| Ratios to Average Net Assets | ||||||||||||
| Total income (loss) | (19.17 | )% | (3.25 | )% | (0.74 | )% | ||||||
| Management fees | 0.84 | %* | 0.95 | % | 0.95 | % | ||||||
| Total expenses excluding management fees | 0.20 | % | 0.19 | % | 0.20 | % | ||||||
| Expenses waived | — | %* | — | % | — | % | ||||||
| Net expenses excluding management fees | 0.20 | % | 0.19 | % | 0.20 | % | ||||||
| Net income (loss) | (20.20 | )% | (4.39 | )% | (1.89 | )% | ||||||
| * | Effective May 1, 2014 and continuing through December 31, 2015, USCF has contractually agreed to lower the management fee to 0.80% per annum of average daily total net assets for USCI. |
| 169 |
CPER
| Year ended December 31, 2014 | Year ended December 31, 2013 | Year ended December 31, 2012 | ||||||||||
| Per Share Operating Performance: | ||||||||||||
| Net asset value, beginning of year | $ | 22.92 | $ | 25.43 | $ | 24.47 | ||||||
| Total income (loss) | (3.65 | ) | (2.31 | ) | 1.21 | |||||||
| Net expenses | (0.17 | ) | (0.20 | ) | (0.25 | ) | ||||||
| Net increase (decrease) in net asset value | (3.82 | ) | (2.51 | ) | 0.96 | |||||||
| Net asset value, end of year | $ | 19.10 | $ | 22.92 | $ | 25.43 | ||||||
| Total Return | (16.67 | )% | (9.87 | )% | 3.92 | % | ||||||
| Ratios to Average Net Assets | ||||||||||||
| Total income (loss) | (12.04 | )% | (10.06 | )% | 5.35 | % | ||||||
| Management fees | 0.65 | %* | 0.65 | %** | 0.78 | %** | ||||||
| Total expenses excluding management fees | 2.17 | % | 3.77 | % | 3.98 | % | ||||||
| Expenses waived | (2.00 | )%* | (3.56 | )%** | (3.78 | )%** | ||||||
| Net expenses excluding management fees | 0.17 | % | 0.21 | % | 0.20 | % | ||||||
| Net income (loss) | (12.86 | )% | (10.92 | )% | 4.37 | % | ||||||
| * | Effective May 1, 2014 and continuing through December 31, 2015, USCF has contractually agreed to lower the management fee to 0.65% per annum of average daily total net assets for CPER. USCF has voluntarily agreed to pay certain expenses typically borne by CPER to the extent that such expenses exceeded 0.15% (15 basis points) of CPER’s NAV, on an annualized basis, through at least May 1, 2015. USCF has no obligation to continue such payments into subsequent periods. |
| ** | Effective as of May 29, 2012 through April 30, 2014, USCF voluntarily agreed to waive the management fee paid by CPER from 0.95% to 0.65% per annum of average daily total net assets. |
USAG
| Year ended December 31, 2014 | Year ended December 31, 2013 | Year ended December 31, 2012*** | ||||||||||
| Per Share Operating Performance: | ||||||||||||
| Net asset value, beginning of year | $ | 22.79 | $ | 25.56 | $ | 25.00 | ||||||
| Total income (loss) | 0.40 | (2.52 | ) | 0.77 | ||||||||
| Net expenses | (0.22 | ) | (0.25 | ) | (0.21 | ) | ||||||
| Net increase (decrease) in net asset value | 0.18 | (2.77 | ) | 0.56 | ||||||||
| Net asset value, end of year | $ | 22.97 | $ | 22.79 | $ | 25.56 | ||||||
| Total Return | 0.79 | % | (10.84 | )% | 2.24 | % | ||||||
| Ratios to Average Net Assets | ||||||||||||
| Total income (loss) | 1.61 | % | (10.53 | )% | 7.33 | % | ||||||
| Management fees | 0.70 | %* | 0.80 | %** | 0.83 | %**^ | ||||||
| Total expenses excluding management fee | 2.08 | %† | 3.68 | % | 3.91 | %^ | ||||||
| Expenses waived | (1.90 | )%*† | (3.42 | )%** | (3.63 | )%**^ | ||||||
| Net expenses excluding management fees | 0.18 | %† | 0.25 | % | 0.28 | %^ | ||||||
| Net income (loss) | 0.72 | % | (11.58 | )% | 6.53 | % | ||||||
| 170 |
| * | Effective May 1, 2014 and continuing through December 31, 2015, USCF has contractually agreed to lower the management fee to 0.65% per annum of average daily total net assets for USAG. |
| ** | Effective as of May 30, 2012 through April 30, 2014, USCF voluntarily agreed to waive the management fee paid by USAG from 0.95% to 0.80% per annum of average daily total net assets. |
| *** | The commencement of operations of USAG was April 13, 2012. |
| † | USCF has voluntarily agreed to pay certain expenses typically borne by USAG to the extent that such expenses exceeded 0.15% (15 basis points) of USAG’s NAV, on an annualized basis, through at least May 1, 2015. USCF has no obligation to continue such payments into subsequent periods. |
| ^ | Annualized. |
USMI
| Year ended December 31, 2014 | Year ended December 31, 2013 | Year ended December 31, 2012*** | ||||||||||
| Per Share Operating Performance: | ||||||||||||
| Net asset value, beginning of year | $ | 21.97 | $ | 26.47 | $ | 25.00 | ||||||
| Total income (loss) | (1.96 | ) | (4.29 | ) | 1.59 | |||||||
| Net expenses | (0.19 | ) | (0.21 | ) | (0.12 | ) | ||||||
| Net increase (decrease) in net asset value | (2.15 | ) | (4.50 | ) | 1.47 | |||||||
| Net asset value, end of year | $ | 19.82 | $ | 21.97 | $ | 26.47 | ||||||
| Total Return | (9.79 | )% | (17.00 | )% | 5.88 | % | ||||||
| Ratios to Average Net Assets | ||||||||||||
| Total income (loss) | (8.89 | )% | (15.12 | )% | 6.92 | % | ||||||
| Management fees | 0.67 | %* | 0.70 | %** | 0.70 | %**^ | ||||||
| Total expenses excluding management fees | 2.20 | %† | 3.46 | % | 4.09 | %^ | ||||||
| Expenses waived | (2.03 | )%*† | (3.26 | )%** | (3.88 | )%**^ | ||||||
| Net expenses excluding management fees | 0.17 | %† | 0.20 | % | 0.21 | %^ | ||||||
| Net income (loss) | (9.73 | )% | (16.02 | )% | 6.43 | % | ||||||
| * | Effective May 1, 2014 and continuing through December 31, 2015, USCF has contractually agreed to lower the management fee to 0.65% per annum of average daily total net assets for USMI. |
| ** | Effective as of May 30, 2012 through April 30, 2014, USCF voluntarily agreed to waive the management fee paid by USMI from 0.95% to 0.70% per annum of average daily total net assets. |
| *** | The commencement of operations of USMI was June 19, 2012. |
| † | USCF has voluntarily agreed to pay certain expenses typically borne by USMI to the extent that such expenses exceeded 0.15% (15 basis points) of USMI’s NAV, on an annualized basis, through at least May 1, 2015. USCF has no obligation to continue such payments into subsequent periods. |
| ^ | Annualized. |
| 171 |
Total returns are calculated based on the change in value during the period. An individual shareholder’s total return and ratio may vary from the above total returns and ratios based on the timing of contributions to and withdrawals from each Trust Series.
NOTE 8 – QUARTERLY FINANCIAL DATA (Unaudited)
The following summarized (unaudited) quarterly financial information presents the results of operations and other data for the three-month periods ended March 31, June 30, September 30 and December 31, 2014 and 2013.
USCI
| First Quarter 2014 | Second Quarter 2014 | Third Quarter 2014 | Fourth Quarter 2014 | |||||||||||||
| Total income (loss) | $ | 25,462,354 | $ | 19,681,829 | $ | (75,608,920 | ) | $ | (104,092,251 | ) | ||||||
| Total expenses | 1,520,322 | 1,568,258 | 2,059,481 | 2,133,424 | ||||||||||||
| Net income (loss) | $ | 23,942,032 | $ | 18,113,571 | $ | (77,668,401 | ) | $ | (106,225,675 | ) | ||||||
| Net income (loss) per share | $ | 2.54 | $ | 1.84 | $ | (5.33 | ) | $ | (6.87 | ) | ||||||
| First Quarter 2013 | Second Quarter 2013 | Third Quarter 2013 | Fourth Quarter 2013 | |||||||||||||
| Total income (loss) | $ | (11,934,173 | ) | $ | (30,572,977 | ) | $ | 25,652,345 | $ | 308,060 | ||||||
| Total expenses | 1,389,487 | 1,502,357 | 1,458,386 | 1,470,234 | ||||||||||||
| Net income (loss) | $ | (13,323,660 | ) | $ | (32,075,334 | ) | $ | 24,193,959 | $ | (1,162,174 | ) | |||||
| Net income (loss) per share | $ | (1.45 | ) | $ | (3.49 | ) | $ | 2.65 | $ | (0.10 | ) | |||||
CPER
| First Quarter 2014 | Second Quarter 2014 | Third Quarter 2014 | Fourth Quarter 2014 | |||||||||||||
| Total income (loss) | $ | (219,581 | ) | $ | 253,801 | $ | (236,243 | ) | $ | (177,285 | ) | |||||
| Total expenses | 19,316 | 22,150 | 25,794 | 21,691 | ||||||||||||
| Expense waivers | (14,268 | ) | (13,891 | ) | (19,219 | ) | (15,611 | ) | ||||||||
| Net expenses | 5,048 | 8,259 | 6,575 | 6,080 | ||||||||||||
| Net income (loss) | $ | (224,629 | ) | $ | 245,542 | $ | (242,818 | ) | $ | (183,365 | ) | |||||
| Net income (loss) per share | $ | (2.49 | ) | $ | 1.23 | $ | (1.33 | ) | $ | (1.23 | ) | |||||
| First Quarter 2013 | Second Quarter 2013 | Third Quarter 2013 | Fourth Quarter 2013 | |||||||||||||
| Total income (loss) | $ | (169,237 | ) | $ | (270,337 | ) | $ | 173,114 | $ | 35,483 | ||||||
| Total expenses | 29,020 | 29,058 | 23,897 | 19,584 | ||||||||||||
| Expense waivers | (23,895 | ) | (24,095 | ) | (19,181 | ) | (14,618 | ) | ||||||||
| Net expenses | 5,125 | 4,963 | 4,716 | 4,966 | ||||||||||||
| Net income (loss) | $ | (174,362 | ) | $ | (275,300 | ) | $ | 168,398 | $ | 30,517 | ||||||
| Net income (loss) per share | $ | (1.74 | ) | $ | (2.76 | ) | $ | 1.69 | $ | 0.30 | ||||||
| 172 |
USAG
| First Quarter 2014 | Second Quarter 2014 | Third Quarter 2014 | Fourth Quarter 2014 | |||||||||||||
| Total income (loss) | $ | 350,343 | $ | (98,545 | ) | $ | (236,630 | ) | $ | 24,064 | ||||||
| Total expenses | 10,723 | 10,492 | 19,864 | 26,829 | ||||||||||||
| Expense waivers | (4,511 | ) | (4,502 | ) | (15,577 | ) | (21,749 | ) | ||||||||
| Net expenses | 6,212 | 5,990 | 4,287 | 5,080 | ||||||||||||
| Net income (loss) | $ | 344,131 | $ | (104,535 | ) | $ | (240,917 | ) | $ | 18,984 | ||||||
| Net income (loss) per share | $ | 3.44 | $ | (1.04 | ) | $ | (2.41 | ) | $ | 0.19 | ||||||
| First Quarter 2013 | Second Quarter 2013 | Third Quarter 2013 | Fourth Quarter 2013 | |||||||||||||
| Total income (loss) | $ | (148,371 | ) | $ | (63,796 | ) | $ | 42,904 | $ | (82,323 | ) | |||||
| Total expenses | 36,337 | 36,461 | 23,296 | 10,845 | ||||||||||||
| Expense waivers | (29,863 | ) | (30,231 | ) | (17,041 | ) | (4,637 | ) | ||||||||
| Net expenses | 6,474 | 6,230 | 6,255 | 6,208 | ||||||||||||
| Net income (loss) | $ | (154,845 | ) | $ | (70,026 | ) | $ | 36,649 | $ | (88,531 | ) | |||||
| Net income (loss) per share | $ | (1.55 | ) | $ | (0.70 | ) | $ | 0.36 | $ | (0.88 | ) | |||||
USMI
| First Quarter 2014 | Second Quarter 2014 | Third Quarter 2014 | Fourth Quarter 2014 | |||||||||||||
| Total income (loss) | $ | (8,800 | ) | $ | 156,366 | $ | (190,120 | ) | $ | (154,512 | ) | |||||
| Total expenses | 9,543 | 9,549 | 19,251 | 25,178 | ||||||||||||
| Expense waivers | (4,583 | ) | (4,638 | ) | (14,796 | ) | (20,968 | ) | ||||||||
| Net expenses | 4,960 | 4,911 | 4,455 | 4,210 | ||||||||||||
| Net income (loss) | $ | (13,760 | ) | $ | 151,455 | $ | (194,575 | ) | $ | (158,722 | ) | |||||
| Net income (loss) per share | $ | (0.14 | ) | $ | 1.52 | $ | (1.95 | ) | $ | (1.58 | ) | |||||
| First Quarter 2013 | Second Quarter 2013 | Third Quarter 2013 | Fourth Quarter 2013 | |||||||||||||
| Total income (loss) | $ | (123,970 | ) | $ | (401,340 | ) | $ | 217,637 | $ | (73,285 | ) | |||||
| Total expenses | 35,676 | 35,404 | 23,760 | 10,099 | ||||||||||||
| Expense waivers | (29,804 | ) | (30,264 | ) | (17,110 | ) | (4,987 | ) | ||||||||
| Net expenses | 5,872 | 5,140 | 6,650 | 5,112 | ||||||||||||
| Net income (loss) | $ | (129,842 | ) | $ | (406,480 | ) | $ | 210,987 | $ | (78,397 | ) | |||||
| Net income (loss) per share | $ | (1.30 | ) | $ | (4.06 | ) | $ | 1.65 | $ | (0.79 | ) | |||||
| 173 |
NOTE 9 – FAIR VALUE OF FINANCIAL INSTRUMENTS
The Trust and each Trust Series value their investments in accordance with Accounting Standards Codification 820 – Fair Value Measurements and Disclosures (“ASC 820”). ASC 820 defines fair value, establishes a framework for measuring fair value in generally accepted accounting principles, and expands disclosures about fair value measurement. The changes to past practice resulting from the application of ASC 820 relate to the definition of fair value, the methods used to measure fair value, and the expanded disclosures about fair value measurement. ASC 820 establishes a fair value hierarchy that distinguishes between: (1) market participant assumptions developed based on market data obtained from sources independent of the Trust and each Trust Series (observable inputs) and (2) the Trust’s and each Trust Series’ own assumptions about market participant assumptions developed based on the best information available under the circumstances (unobservable inputs). The three levels defined by the ASC 820 hierarchy are as follows:
Level I – Quoted prices (unadjusted) in active markets for identical assets or liabilities that the reporting entity has the ability to access at the measurement date.
Level II – Inputs other than quoted prices included within Level I that are observable for the asset or liability, either directly or indirectly. Level II assets include the following: quoted prices for similar assets or liabilities in active markets, quoted prices for identical or similar assets or liabilities in markets that are not active, inputs other than quoted prices that are observable for the asset or liability, and inputs that are derived principally from or corroborated by observable market data by correlation or other means (market-corroborated inputs).
Level III – Unobservable pricing input at the measurement date for the asset or liability. Unobservable inputs shall be used to measure fair value to the extent that observable inputs are not available.
In some instances, the inputs used to measure fair value might fall within different levels of the fair value hierarchy. The level in the fair value hierarchy within which the fair value measurement in its entirety falls shall be determined based on the lowest input level that is significant to the fair value measurement in its entirety.
The following table summarizes the valuation of USCI’s securities at December 31, 2014 using the fair value hierarchy:
| At December 31, 2014 | Total | Level I | Level II | Level III | ||||||||||||
| Short-Term Investments | $ | 509,916,252 | $ | 509,916,252 | $ | — | $ | — | ||||||||
| Exchange-Traded Futures Contracts | ||||||||||||||||
| Foreign Contracts | (27,137,120 | ) | (27,137,120 | ) | — | — | ||||||||||
| United States Contracts | (11,130,039 | ) | (11,130,039 | ) | — | — | ||||||||||
During the year ended December 31, 2014, there were no transfers between Level I and Level II.
The following table summarizes the valuation of USCI’s securities at December 31, 2013 using the fair value hierarchy:
| At December 31, 2013 | Total | Level I | Level II | Level III | ||||||||||||
| Short-Term Investments | $ | 325,142,075 | $ | 325,142,075 | $ | — | $ | — | ||||||||
| Exchange-Traded Futures Contracts | ||||||||||||||||
| Foreign Contracts | 6,218,462 | 6,218,462 | — | — | ||||||||||||
| United States Contracts | 4,571,285 | 4,571,285 | — | — | ||||||||||||
During the year ended December 31, 2014, there were no transfers between Level I and Level II.
The following table summarizes the valuation of CPER’s securities at December 31, 2014 using the fair value hierarchy:
| At December 31, 2014 | Total | Level I | Level II | Level III | ||||||||||||
| Short-Term Investments | $ | 1,699,497 | $ | 1,699,497 | $ | — | $ | — | ||||||||
| Exchange-Traded Futures Contracts | ||||||||||||||||
| United States Contracts | (197,525 | ) | (197,525 | ) | — | — | ||||||||||
During the year ended December 31, 2014, there were no transfers between Level I and Level II.
| 174 |
The following table summarizes the valuation of CPER’s securities at December 31, 2013 using the fair value hierarchy:
| At December 31, 2013 | Total | Level I | Level II | Level III | ||||||||||||
| Short-Term Investments | $ | 1,599,705 | $ | 1,599,705 | $ | — | $ | — | ||||||||
| Exchange-Traded Futures Contracts | ||||||||||||||||
| United States Contracts | 130,163 | 130,163 | — | — | ||||||||||||
During the year ended December 31, 2013, there were no transfers between Level I and Level II.
The following table summarizes the valuation of USAG’s securities at December 31, 2014 using the fair value hierarchy:
| At December 31, 2014 | Total | Level I | Level II | Level III | ||||||||||||
| Short-Term Investments | $ | 1,599,523 | $ | 1,599,523 | $ | — | $ | — | ||||||||
| Exchange-Traded Futures Contracts | ||||||||||||||||
| Foreign Contracts | (76,062 | ) | (76,062 | ) | — | — | ||||||||||
| United States Contracts | 9,486 | 9,486 | — | — | ||||||||||||
During the year ended December 31, 2014, there were no transfers between Level I and Level II.
The following table summarizes the valuation of USAG’s securities at December 31, 2013 using the fair value hierarchy:
| At December 31, 2013 | Total | Level I | Level II | Level III | ||||||||||||
| Short-Term Investments | $ | 1,499,678 | $ | 1,499,678 | $ | — | $ | — | ||||||||
| Exchange-Traded Futures Contracts | ||||||||||||||||
| Foreign Contracts | 2,216 | 2,216 | — | — | ||||||||||||
| United States Contracts | (46,749 | ) | (46,749 | ) | — | — | ||||||||||
During the year ended December 31, 2013, there were no transfers between Level I and Level II.
The following table summarizes the valuation of USMI’s securities at December 31, 2014 using the fair value hierarchy:
| At December 31, 2014 | Total | Level I | Level II | Level III | ||||||||||||
| Short-Term Investments | $ | 1,399,591 | $ | 1,399,591 | $ | — | $ | — | ||||||||
| Exchange-Traded Futures Contracts | ||||||||||||||||
| Foreign Contracts | (73,432 | ) | (73,432 | ) | — | — | ||||||||||
| United States Contracts | (63,132 | ) | (63,132 | ) | — | — | ||||||||||
During the year ended December 31, 2014, there were no transfers between Level I and Level II.
The following table summarizes the valuation of USMI’s securities at December 31, 2013 using the fair value hierarchy:
| At December 31, 2013 | Total | Level I | Level II | Level III | ||||||||||||
| Short-Term Investments | $ | 1,199,914 | $ | 1,199,914 | $ | — | $ | — | ||||||||
| Exchange-Traded Futures Contracts | ||||||||||||||||
| Foreign Contracts | (12,610 | ) | (12,610 | ) | — | — | ||||||||||
| United States Contracts | (33,683 | ) | (33,683 | ) | — | — | ||||||||||
During the year ended December 31, 2013, there were no transfers between Level I and Level II.
| 175 |
The Trust and each Trust Series have adopted the provisions of Accounting Standards Codification 815 —Derivatives and Hedging, which require presentation of qualitative disclosures about objectives and strategies for using derivatives, quantitative disclosures about fair value amounts and gains and losses on derivatives.
Fair Value of Derivative Instruments Held by USCI
| Derivatives not Accounted for as Hedging Instruments | Statements of Financial Condition Location | Fair Value At December 31, 2014 | Fair Value At December 31, 2013 | |||||||||
| Futures - Commodity Contracts | Assets | $ | (38,267,159 | ) | $ | 10,789,747 | ||||||
Fair Value of Derivative Instruments Held by CPER
| Derivatives not Accounted for as Hedging Instruments | Statements of Financial Condition Location | Fair Value At December 31, 2014 | Fair Value At December 31, 2013 | |||||||||
| Futures - Commodity Contracts | Assets | $ | (197,525 | ) | $ | 130,163 | ||||||
Fair Value of Derivative Instruments Held by USAG
| Derivatives not Accounted for as Hedging Instruments | Statements of Financial Condition Location | Fair Value At December 31, 2014 | Fair Value At December 31, 2013 | |||||||||
| Futures - Commodity Contracts | Assets | $ | (66,576 | ) | $ | (44,533 | ) | |||||
Fair Value of Derivative Instruments Held by USMI
| Derivatives not Accounted for as Hedging Instruments | Statements of Financial Condition Location | Fair Value At December 31, 2014 | Fair Value At December 31, 2013 | |||||||||
| Futures - Commodity Contracts | Assets | $ | (136,564 | ) | $ | (46,293 | ) | |||||
| 176 |
The Effect of Derivative Instruments on the Statements of Operations of USCI
| For
the year ended December 31, 2014 | For
the year ended December 31, 2013 | For
the year ended December 31, 2012 | ||||||||||||||||||||||||
| Derivatives not Accounted for as Hedging Instruments | Location of Gain (Loss) on Derivatives Recognized in Income | Realized Gain (Loss) on Derivatives Recognized in Income | Change in Unrealized Gain (Loss) on Derivatives Recognized in Income | Realized Gain (Loss) on Derivatives Recognized in Income | Change
in Unrealized Gain (Loss) on Derivatives Recognized in Income | Realized Gain (Loss) on Derivatives Recognized in Income | Change in Unrealized Gain (Loss) on Derivatives Recognized in Income | |||||||||||||||||||
| Futures
– Commodity Contracts | Realized gain (loss) on closed positions | $ | (85,846,605 | ) | $ | (32,839,247 | ) | $ | (21,219,768 | ) | ||||||||||||||||
| Change in unrealized gain (loss) on open positions | $ | (49,056,906 | ) | $ | 16,010,647 | $ | 17,755,792 | |||||||||||||||||||
The Effect of Derivative Instruments on the Statements of Operations of CPER
| For
the year ended December 31, 2014 | For
the year ended December 31, 2013 | For
the year ended December 31, 2012 | ||||||||||||||||||||||||
| Derivatives not Accounted for as Hedging Instruments | Location of Gain (Loss) on Derivatives Recognized in Income | Realized Gain (Loss) on Derivatives Recognized in Income | Change in Unrealized Gain (Loss) on Derivatives Recognized in Income | Realized
Gain (Loss) on Derivatives Recognized in Income | Change
in Unrealized Gain (Loss) on Derivatives Recognized in Income | Realized
Gain (Loss) on Derivatives Recognized in Income | Change in Unrealized Gain (Loss) on Derivatives Recognized in Income | |||||||||||||||||||
| Futures
– Commodity Contracts | Realized gain (loss) on closed positions | $ | (54,825 | ) | $ | (355,825 | ) | $ | 64,937 | |||||||||||||||||
| Change in unrealized gain (loss) on open positions | $ | (327,688 | ) | $ | 123,588 | $ | 68,588 | |||||||||||||||||||
The Effect of Derivative Instruments on the Statements of Operations of USAG
| For
the year ended December 31, 2014 | For
the year ended December 31, 2013 | For
the year ended December 31, 2012 | ||||||||||||||||||||||||
| Derivatives not Accounted for as Hedging Instruments | Location of Gain (Loss) on Derivatives Recognized in Income | Realized Gain (Loss) on Derivatives Recognized in Income | Change in Unrealized Gain (Loss) on Derivatives Recognized in Income | Realized Gain (Loss) on Derivatives Recognized in Income | Change
in Unrealized Gain (Loss) on Derivatives Recognized in Income | Realized Gain (Loss) on Derivatives Recognized in Income | Change in Unrealized Gain (Loss) on Derivatives Recognized in Income | |||||||||||||||||||
| Futures –Commodity Contracts | Realized gain (loss) on closed positions | $ | 60,213 | $ | (327,353 | ) | $ | 330,608 | ||||||||||||||||||
| Change in unrealized gain (loss) on open positions | $ | (22,043 | ) | $ | 74,622 | $ | (119,155 | ) | ||||||||||||||||||
* The commencement of operations of USAG was April 13, 2012.
The Effect of Derivative Instruments on the Statements of Operations of USMI
| For
the year ended December 31, 2014 | For
the year ended December 31, 2013 | For
the year ended December 31, 2012* | ||||||||||||||||||||||||
| Derivatives not Accounted for as Hedging Instruments | Location of Gain (Loss) on Derivatives Recognized in Income | Realized Gain (Loss) on Derivatives Recognized in Income | Change in Unrealized Gain (Loss) on Derivatives Recognized in Income | Realized Gain (Loss) on Derivatives Recognized in Income | Change
in Unrealized Gain (Loss) on Derivatives Recognized in Income | Realized Gain (Loss) on Derivatives Recognized in Income | Change in Unrealized Gain (Loss) on Derivatives Recognized in Income | |||||||||||||||||||
| Futures –Commodity Contracts | Realized gain (loss) on closed positions | $ | (107,810 | ) | $ | (291,259 | ) | $ | 148,423 | |||||||||||||||||
| Change in unrealized gain (loss) on open positions | $ | (90,271 | ) | $ | (92,351 | ) | $ | 46,058 | ||||||||||||||||||
* The commencement of operations of USMI was June 19, 2012.
| 177 |
NOTE 10 – RECENT ACCOUNTING PRONOUNCEMENTS
In December 2011, the Financial Accounting Standards Board (“FASB”) issued Accounting Standards Update (“ASU”) No. 2011-11, “Balance Sheet (Topic 210): Disclosures about Offsetting Assets and Liabilities.” The amendments in ASU No. 2011-11 require an entity to disclose information about offsetting and related arrangements to enable users of its financial statements to understand the effect of those arrangements on its financial position. ASU No. 2011-11 is effective for annual reporting periods beginning on or after January 1, 2013, and interim periods within those annual periods.
NOTE 11 – SUBSEQUENT EVENTS
The Trust and each Trust Series have performed an evaluation of subsequent events through the date the financial statements were issued. This evaluation did not result in any subsequent events that necessitated disclosures and/or adjustments, other than noted below.
On January 14, 2015, Mr. Howard Mah, Management Director, Chief Financial Officer (Principal Accounting Officer), Secretary and Treasurer of USCF, sponsor of the United States Commodity Index Funds Trust, tendered his resignation effective as soon as the Board of Directors of USCF accepts and appoints a suitable replacement, but no later than the close of business July 15, 2015. In order to ensure an orderly transition, Mr. Mah will remain as the Management Director and Chief Financial Officer (Principal Accounting Officer) of USCF until such time.
On January 26, 2015, Mr. Nicholas D. Gerber was appointed Chief Executive Officer, President and Secretary of Concierge Technologies, Inc. (“Concierge”), a supplier of mobile video recording devices through its wholly owned subsidiary Janus Cam. Concierge is not affiliated with USCF and the Related Public Funds, other than through ownership by common control. Concierge is a publicly traded company under the ticker symbol “CNGC.”
| 178 |
| Item 9. | Changes in and Disagreements With Accountants on Accounting and Financial Disclosure. |
Not applicable.
| Item 9A. | Controls and Procedures. |
Disclosure Controls and Procedures
The Trust and each Trust Series maintain disclosure controls and procedures that are designed to ensure that material information required to be disclosed in the Trust’s periodic reports filed or submitted under the Exchange Act is recorded, processed, summarized and reported within the time period specified in the SEC’s rules and forms.
The duly appointed officers of USCF, including its chief executive officer and chief financial officer, who perform functions equivalent to those of a principal executive officer and principal financial officer of the Trust if the Trust had any officers, have evaluated the effectiveness of the Trust’s and each Trust Series’ disclosure controls and procedures and have concluded that the disclosure controls and procedures of the Trust and each Trust Series have been effective as of the end of the period covered by this annual report on Form 10-K.
Management’s Annual Report on Internal Control Over Financial Reporting
The Trust and each Trust Series are responsible for establishing and maintaining adequate internal control over financial reporting. The Trust’s and each Trust Series’ internal control system is designed to provide reasonable assurance to USCF and the Board of USCF regarding the preparation and fair presentation of published financial statements. All internal control systems, no matter how well designed, have inherent limitations. Therefore, even those systems determined to be effective can provide only reasonable assurance with respect to financial statement preparation and presentation. USCF’s report on internal control over financial reporting is set forth above under the heading, “Management’s Annual Report on Internal Control Over Financial Reporting” in Item 8 of this annual report on Form 10-K.
Change in Internal Control Over Financial Reporting
There were no changes in the Trust’s or any Trust Series’ internal control over financial reporting during the last fiscal quarter that have materially affected, or are reasonably likely to materially affect, the Trust’s or any Trust Series’ internal control over financial reporting.
| Item 9B. | Other Information. |
Monthly Account Statements
Pursuant to the requirement under Rule 4.22 under the CEA, each month the Trust and each Trust Series publish account statements for the Trust Series’ shareholders, which include Statements of Income (Loss), Statements of Changes in Net Asset Value and Statements of Changes in Shares Outstanding. The account statements are furnished to the SEC on a current report on Form 8-K pursuant to Section 13 or 15(d) of the Exchange Act and posted each month on each Trust Series’ website at www.unitedstatescommodityfunds.com.
| Item 10. | Directors, Executive Officers and Corporate Governance. |
United States Commodity Funds LLC
Principals and Key Personnel of USCF. The Trust has no executive officers. Pursuant to the terms of the Trust Agreement, the Trust’s affairs are managed by USCF. The following principals of USCF serve in the below mentioned capacities:
| Name | Capacity | |
| Nicholas D. Gerber | President, Chief Executive Officer and Management Director of USCF | |
| Howard Mah | Chief Financial Officer, Secretary, Treasurer and Management Director of USCF | |
| Andrew F. Ngim | Management Director of USCF and Portfolio Manager | |
| John T. Hyland | Chief Investment Officer of USCF | |
| Carolyn M. Yu | Chief Compliance Officer of USCF | |
| John P. Love | Senior Portfolio Manager | |
| Ray W. Allen | Portfolio Manager | |
| Christopher P. Mullen | Assistant Portfolio Manager | |
| Gordon L. Ellis | Independent Director of USCF | |
| Malcolm R. Fobes | Independent Director of USCF | |
| Peter M. Robinson | Independent Director of USCF |
| 179 |
Nicholas D. Gerber, 52, President and Chief Executive Officer since June 2005. Mr. Gerber co-founded USCF in 2005 and prior to that, he co-founded Ameristock Corporation in March 1995, a California-based investment adviser registered under the Investment Advisers Act of 1940 from March 1995 until January 2013. From January 26, 2015 to the present, Mr. Gerber is also the Chief Executive Officer, President and Secretary of Concierge Technologies, Inc. (“Concierge”), a supplier of mobile video recording devices thru its wholly owned subsidiary Janus Cam. Concierge is not affiliated with USCF and the Related Public Funds, other than through ownership by common control. Concierge is a publicly traded company under the ticker symbol “CNGC.” From August 1995 to January 2013, Mr. Gerber served as Portfolio Manager of Ameristock Mutual Fund, Inc. On January 11, 2013, the Ameristock Mutual Fund, Inc. merged with and into the Drexel Hamilton Centre American Equity Fund, a series of Drexel Hamilton Mutual Funds. Drexel Hamilton Mutual Funds is not affiliated with Ameristock Corporation, the Ameristock Mutual Fund, Inc. or USCF. From the period August 2014 to the present, Mr. Gerber also serves as President (Principal Executive Officer) and Management Trustee of the USCF ETF Trust, an investment company registered under the Investment Company Act of 1940, as amended, as well as President of USCF Advisers LLC, an investment adviser registered under the Investment Advisers Act of 1940, as amended. In these roles, Mr. Gerber has gained extensive experience in evaluating and retaining third-party service providers, including custodians, accountants, transfer agents, and distributors. He has served as a Management Director of USCF since May 2005 and has been a principal of USCF listed with the CFTC and NFA since November 2005, an NFA associate member and associated person of USCF since December 2005 and a Branch Manager of USCF since May 2009. Mr. Gerber earned an MBA degree in finance from the University of San Francisco, a BA from Skidmore College and holds an NFA Series 3 registration.
Howard Mah, 50, Secretary, Chief Financial Officer and Treasurer of USCF since June 2005, May 2006 and February 2012, respectively. Mr. Mah co-founded USCF and has served as a Management Director since May 2005. He has been a principal of USCF listed with the CFTC and NFA since November 2005 and its Chief Compliance Officer from May 2006 to February 2013. From the period August 2014 to the present, Mr. Mah also serves as Chief Compliance Officer, Treasurer (Principal Accounting Officer) and Management Trustee of the USCF ETF Trust, as well as Chief Financial Officer of USCF Advisers LLC. Mr. Mah has served as Chief Compliance Officer for Ameristock Corporation which he co-founded in March 1995; Secretary of Ameristock Mutual Fund, Inc. from June 1995 to January 2013 and its Chief Compliance Officer from August 2004 to January 2013. Mr. Mah also served as a tax and finance consultant in private practice from January 1995 to December 2013. Mr. Mah earned his MBA degree in finance from the University of San Francisco and a BEd from the University of Alberta.
Andrew F. Ngim, 54, co-founded USCF in 2005 and has served as a Management Director since May 2005. Mr. Ngim has served as the portfolio manager for USCI, CPER, USAG and USMI since January 2013. Mr. Ngim also served as USCF’s Treasurer from June 2005 to February 2012. Prior to and concurrent with his services to USCF, from January 1999 to January 2013 Mr. Ngim served as a Managing Director for Ameristock Corporation which he co-founded in March 1995 and was Co-Portfolio Manager of Ameristock Mutual Fund, Inc. from January 2000 to January 2013. From the period September 2014 to the present, Mr. Ngim also serves as portfolio manager of the Stock Split Index Fund, a series of the USCF ETF Trust, as well as a Management Trustee of the USCF ETF Trust from the period of August 2014 to the present. Mr. Ngim has been a principal of USCF listed with the CFTC and NFA since November 2005. Mr. Ngim earned his BA from the University of California at Berkeley.
John T. Hyland, 55, Chief Investment Officer since January 2008. Mr. Hyland has also served as a portfolio manager for USCF from April 2006 until June 2012. He has been listed with the CFTC and NFA as an associate member and associated person of USCF since December 2005, principal and swap associated person since January 2006 and August 2013, respectively. Mr. Hyland graduated from the University of California at Berkeley, holds an NFA Series 3 registration and is a CFA Charterholder.
| 180 |
Carolyn M. Yu, 56, Chief Compliance Officer and Associate Counsel since February 2013 and August 2011, respectively. From the period August 2014 to the present, Ms. Yu also serves as Assistant Chief Compliance Officer and AML Officer of the USCF ETF Trust, as well as Chief Compliance Officer of USCF Advisers LLC. Previously, Ms. Yu served as Branch Chief with the Securities Enforcement Branch for the State of Hawaii, Department of Commerce and Consumer Affairs from February 2008 to August 2011. She has been a principal of USCF listed with the CFTC and NFA since August 2013. Ms. Yu earned her JD from Golden Gate University School of Law and a BS in business administration from San Francisco State University.
John P. Love, 43, Senior Portfolio Manager of USCF since March 2010. Prior to that, while still at USCF, he was a Portfolio Manager beginning with the launch of USO in April 2006. Mr. Love was the portfolio manager of USO from April 2006 until March 2010 and the portfolio manager for USL from December 2007 until March 2010. Mr. Love has been the portfolio manager of UNG since April 2007, and the portfolio manager of UGA, UHN, and UNL since March 2010. Mr. Love also serves as a portfolio manager of the Stock Split Index Fund, a series of the USCF ETF Trust from the period of September 2014 to the present. Mr. Love has been a principal of USCF listed with the CFTC and NFA since January 17, 2006. He has been listed with the CFTC and NFA as an associate member, associated person and swap associated person of USCF since February 25, 2015. Mr. Love was previously an associated person of USCF registered from December 1, 2005 to April 16, 2009. Mr. Love earned a BA from the University of Southern California, holds NFA Series 3 and FINRA Series 7 registrations and is a CFA Charterholder.
Ray W. Allen, 58, Portfolio Manager of USCF since January 2008. Mr. Allen was the portfolio manager of UGA from February 2008 until March 2010, the portfolio manager of UHN from April 2008 until March 2010 and the portfolio manager of UNL from November 2009 until March 2010. Mr. Allen has been the portfolio manager of DNO since September 2009, and the portfolio manager of USO and USL since March 2010 and the manager of BNO since June 2010. Mr. Allen has been a principal of USCF listed with the CFTC and NFA since March 2009 and was an associated person of USCF from March 2008 to November 2012. Mr. Allen earned a BA in economics from the University of California at Berkeley and holds an NFA Series 3 registration.
Christopher P. Mullen, 24, Assistant Portfolio Manager of USCF since September 2014. Prior to working at USCF, Mr. Mullen was an undergraduate student at Marquette University from May 2008 until May of 2012. From 2008 until July 2011, he was a full time student. While a student, Mr. Mullen also worked as a Media Relations Intern with the Milwaukee Brewers, from July 2011 until June 2012. From June 2012 until October 2012, Mr. Mullen was unemployed. Starting in October 2012 until February 2013, Mr. Mullen was employed as a Public Relations Intern for the Public Affairs Company. From February 2013 through August 2014, Mr. Mullen served as a Financial Analyst for USCF. In September 2014, Mr. Mullen was promoted to Assistant Portfolio Manager. Mr. Mullen earned his BA from Marquette University in May of 2012.
Gordon L. Ellis, 68, Independent Director of USCF since September 2005. Previously, Mr. Ellis was a founder of International Absorbents, Inc., its Class 1 Director and Chairman since July 1985 and July 1988, respectively, and Chief Executive Officer and President since November 1996. He also served as a director of Absorption Corp., a wholly-owned subsidiary of International Absorbents, Inc. International Absorbents, Inc. and Absorption Corp. were sold to a private investment banking firm in May 2010. Mr. Ellis serves as a director of the privatized firm since May 2010. Concurrent with that, he founded and has served as Chairman of Lupaka Gold Corp. since November 2000. Between, November 2000 to May 2010, Lupaka Gold Corp. was known as Kcrok Enterprises Ltd. Mr. Ellis has his Chartered Directors designation from The Director’s College (a joint venture of McMaster University and The Conference Board of Canada). He has been a principal of USCF listed with the CFTC and NFA since November 2005. Mr. Ellis is an engineer and earned an MBA in international finance.
Malcolm R. Fobes III, 50, Independent Director of USCF and Chairman of USCF’s audit committee since September 2005. He founded and is the Chairman and Chief Executive Officer of Berkshire Capital Holdings, Inc., a California-based investment adviser registered under the Investment Advisers Act of 1940 that has been sponsoring and providing portfolio management services to mutual funds since June 1997. Mr. Fobes serves as Chairman and President of The Berkshire Funds, a mutual fund investment company registered under the Investment Company Act of 1940. Since 1997, Mr. Fobes has also served as portfolio manager of the Berkshire Focus Fund, a mutual fund registered under the Investment Company Act of 1940, which concentrates its investments in the electronic technology industry. He was also contributing editor of Start a Successful Mutual Fund: The Step-by-Step Reference Guide to Make It Happen (JV Books, 1995). Mr. Fobes has been a principal of USCF listed with the CFTC and NFA since November 2005. He earned a BS in finance with a minor in economics from San Jose State University in California.
| 181 |
Peter M. Robinson, 57, Independent Director of USCF since September 2005. Mr. Robinson has been a Research Fellow since 1993 with the Hoover Institution, a public policy think tank located on the campus of Stanford University. He authored three books and has been published in the New York Times, Red Herring, and Forbes ASAP and is the editor of Can Congress Be Fixed?: Five Essays on Congressional Reform (Hoover Institution Press, 1995). Mr. Robinson has been a principal of USCF listed with the CFTC and NFA since December 2005. He earned an MBA from the Stanford University Graduate School of Business, graduated from Oxford University in 1982 after studying politics, philosophy, and economics and graduated summa cum laude from Dartmouth College in 1979.
The following are individual Principals, as that term is defined in CFTC Rule 3.1, for USCF: Nicholas Gerber, Melinda Gerber, the Nicholas and Melinda Gerber Living Trust, Howard Mah, Andrew Ngim, Peter Robinson, Gordon Ellis, Malcolm Fobes, John Love, John Hyland, Ray Allen, Carolyn Yu, Wainwright Holdings Inc. and Margaret Johnson. These individuals are Principals due to their positions, however, Nicholas Gerber and Melinda Gerber are also Principals due to their controlling stake in Wainwright. None of the Principals owns or has any other beneficial interest in any of the Trust Series other than as described in Item 12 below. John Hyland and Andrew Ngim make trading and investment decisions for each of USCI, CPER, USAG and USMI. John Love and Andrew Ngim execute trades on behalf of each of USCI, CPER, USAG and USMI. In addition, Nicholas Gerber and John Hyland are registered with the CFTC as Associated Persons of USCF and are NFA Associate Members.
SummerHaven
Background of SummerHaven
SummerHaven is a Delaware limited liability company formed on August 11, 2009. Its offices are located at Soundview Plaza, 4th Floor, 1266 East Main Street, Stamford, CT 06902, and its telephone number is (203) 352-2700. SummerHaven has been registered under the CEA as a commodity pool operator and a commodity trading advisor since October 9, 2009. SummerHaven became an NFA member effective October 9, 2009. From September 2009 to January 2010, SummerHaven was a registered investment advisor under the Investment Advisers Act of 1940. In January 2010, SummerHaven withdrew its registration since its assets under management was below $25 million. The firm’s management team has over 50 years of combined capital markets experience including commodity research and modeling, trading, investment management and risk management expertise.
Background of SummerHaven Index Management LLC
SHIM is the owner, creator and licensor of commodity indices including the SDCI, the SCI, the SDAI and the SDMI. SHIM is a Delaware limited liability company formed on August 11, 2009. It maintains its main business office at Soundview Plaza, Fourth Floor, 1266 East Main Street, Stamford, CT 06902. The firm maintains a website at www.summerhavenindex.com. The firm creates innovative commodities indices focused on providing investors with better risk-adjusted returns than traditional commodity index benchmarks. SHIM’s principals and consultants include academics who are the authors of widely cited and acclaimed papers on commodities futures investing including “Facts and Fantasies about Commodities” and “Fundamentals of Commodities Futures Returns.” The firm is led by a seasoned management team with over 50 years of collective Wall Street experience with commodities futures, capital markets, investment management, and exchange traded products.
Principals of SummerHaven
Kurt J. Nelson has been employed by SummerHaven since August 2009 as a partner. His duties include investor relations, product structuring and compliance. From September 2007 to July 2009, Mr. Nelson was employed by UBS Investment Bank as a Managing Director and supervisory committee member of the UBS Bloomberg CMCI Index and Dow-Jones UBS Commodity Index. From March 1998 to January 2007, Mr. Nelson was employed by AIG Financial Products Corp. as a Managing Director. Mr. Nelson was not employed from January 2007 to September 2007. Mr. Nelson became listed as a principal of SummerHaven effective October 1, 2009, as an associated person of SummerHaven effective October 12, 2009 and as an associate member of the NFA effective October 12, 2009. Mr. Nelson is 45 years old.
Ashraf R. Rizvi has been employed by SummerHaven since April 2009 as a partner. His duties include trading and operational management. From October 1994 to February 2008, Mr. Rizvi was employed by UBS Investment Bank as a Managing Director and Global Head of Commodities Trading. Mr. Rizvi was not employed from February 2008 to April 2009. Mr. Rizvi became listed as a principal of SummerHaven effective October 9, 2009, as an associated person of SummerHaven effective September 9, 2011 and as an associate member of the NFA effective September 9, 2011. Mr. Rizvi is 52 years old.
| 182 |
K. Geert Rouwenhorst has been employed by SummerHaven since April 2009 as a partner. His duties include research and investor relations. From July 1990 to present, Dr. Rouwenhorst has been employed by Yale School of Management as a Professor of Finance. Dr. Rouwenhorst became listed as a principal of SummerHaven effective October 8, 2009, as an associated person of SummerHaven effective September 1, 2011 and as an associate member of the NFA effective September 1, 2011. Dr. Rouwenhorst is 54 years old.
Joseph J. Schultz has been employed by SummerHaven since April 2011 as a partner. His duties include supervision of the firm’s reporting, accounting and operations. From February 2004 to April 2011, Mr. Schultz was the Chief Operating Officer and a Managing Partner at Basso Capital Management, L.P., an employee owned hedge fund sponsor which provides services to pooled investment vehicles focused primarily on convertible securities and their underlying equity shares, where he was responsible for the oversight of the firm’s day-to-day operations. From May 1997 to February 2004, Mr. Schultz was a Vice President at AIG Trading Group, a subsidiary of American International Group, Inc. which provides currency and commodity prime brokerage, back-office support, access to e-commerce trading portals, and political-economic research and consulting services for the financial services industry, where he designed systems, procedural protocol and managed the daily operations for the fixed income and foreign currency options department and hedge funds. On July 11, 2011, Mr. Schultz became listed as a principal of SummerHaven. Mr. Schultz received a B.B.A in Finance from Baruch College and is 43 years old.
Audit Committee
The Board of USCF has an audit committee which is made up of the three independent directors (Gordon L. Ellis, Malcolm R. Fobes III and Peter M. Robinson). The audit committee is governed by an audit committee charter that is posted each Trust Series’ website at www.unitedstatescommodityfunds.com. Any shareholder of a Trust Series may also obtain a printed copy of the audit committee charter, free of charge, by calling 1-800-920-0259. The Board has determined that each member of the audit committee meets the financial literacy requirements of the NYSE Arca and the audit committee charter. The Board has further determined that each of Messrs. Ellis and Fobes have accounting or related financial management expertise, as required by the NYSE Arca, such that each of them is considered an “Audit Committee Financial Expert” as such term is defined in Item 407(d)(5) of Regulation S-K.
Other Committees
Since the individuals who perform work on behalf of each Trust Series are not compensated by such Trust Series, but instead by USCF, none of the Trust Series has a compensation committee. Similarly, since the directors noted above serve on the Board of USCF, there is no nominating committee of the Board that acts on behalf of any Trust Series. USCF believes that it is necessary for each member of the Board to possess many qualities and skills. USCF further believes that all directors should possess a considerable amount of business management and educational experience. There have not been any vacancies on USCF’s Board since the commencement of operations of USCI, the first Trust Series, in August 2010; however, if such a vacancy were to occur, the members of the Board would consider a candidate’s management experience as well as his/her background, stature, conflicts of interest, integrity and ethics. In connection with this, the Board would also consider issues of diversity, such as diversity of gender, race and national origin, education, professional experience and differences in viewpoints and skills. The Board does not have a formal policy with respect to diversity; however, the Board believes that it is essential that the Board members represent diverse viewpoints.
Corporate Governance Policy
The Board of USCF has adopted a Corporate Governance Policy that applies to each Trust Series and the Related Public Funds. Each of the Trust Series has posted the text of the Corporate Governance Policy on its website at www.unitedstatescommodityfunds.com. Any shareholder of the Trust Series’ may also obtain a printed copy of the Corporate Governance Policy, free of charge, by calling 1-800-920-0259.
Code of Ethics
USCF has adopted a Code of Business Conduct and Ethics (the “Code of Ethics”) that applies to its principal executive officer, principal financial officer, principal accounting officer or controller, or persons performing similar functions, and also to each Trust Series. Each Trust Series has posted the text of the Code of Ethics on its website at www.unitedstatescommodityfunds.com. Any shareholder of the Trust Series’ may also obtain a printed copy of the Code of Ethics, free of charge, by calling 1-800-920-0259. Each of the Trust Series intends to disclose any amendments or waivers to the Code of Ethics applicable to USCF’s principal executive officer, principal financial officer, principal accounting officer or controller, or persons performing similar functions, on its website.
| 183 |
Executive Sessions of the Non-Management Directors
In accordance with the Corporate Governance Policy of USCF, the non-management directors of the Board (who are the same as the independent directors of the Board) meet separately from the other directors in regularly scheduled executive sessions, without the presence of Management Directors or executive officers of USCF. The non-management directors have designated Gordon L. Ellis to preside over each such executive session. Interested parties who wish to make their concerns known to the non-management directors may communicate directly with Mr. Ellis by writing to 475 Milan Drive, No. 103, San Jose, CA 95134-2453 or by e-mail at uscf.director@gmail.com.
Board Leadership Structure and Role in Risk Oversight
The Board of USCF is led by a Chairman, Nicholas Gerber, who is also the President and CEO of USCF. The Board’s responsibilities include: (i) the selection, evaluation, retention and succession of the Chief Executive Officer and the oversight of the selection and performance of other executive officers, (ii) understanding, reviewing and monitoring the implementation of strategic plans, annual operating plans and budgets, (iii) the selection and oversight of each Trust Series’ independent auditors and the oversight of each Trust Series’ financial statements, (iv) advising management on significant issues, (v) the review and approval of significant company actions and certain other matters, (vi) nominating directors and committee members and overseeing effective corporate governance and (vii) the consideration of other constituencies, such as USCF’s and the Trust Series customers, employees, suppliers and the communities impacted by each Trust Series. The non-management directors have designated Gordon L. Ellis as the presiding independent director. Mr. Ellis’ role as the presiding independent director includes presiding over each executive session of the non-management directors, facilitating communications by shareholders and employees with the non-management directors and may also include representing the non-management directors with respect to certain matters as to which the views of the non-management directors are sought pursuant to the Trust Series’ Corporate Governance Policy.
The Board believes that Mr. Gerber is best situated to serve as Chairman of USCF because he is the director most familiar with the business of USCF, including investing in the futures contracts and other commodity interests in order to track the benchmark futures contracts of the Trust Series and the Related Public Funds. Because of his background, he is most capable of effectively leading the discussion and execution of new strategic objectives. The independent directors of USCF are actively involved in the oversight of USCF and, because of their varied backgrounds, provide different perspectives in connection with the oversight of USCF, the Trust Series and the Related Public Funds. USCF’s independent directors bring expertise from outside USCF and the commodities industry, while Mr. Gerber brings company-specific and industry-specific experience and expertise. The Board believes that the combined role of Chairman and Chief Executive Officer facilitates information flow between USCF and the Board, including the independent directors, which is essential to effective governance.
Risk Management
The full Board is actively involved in overseeing the management and operation of USCF, including oversight of the risks that face the Trust Series and the Related Public Funds. For example, the Board has adopted an Investment Policy and a Policy for Use of Derivatives. The policies are intended to ensure that USCF takes prudent and careful action while entering into and managing investments taken by each Trust Series, including Futures Contracts or Other Related Investments such as over-the-counter swap contracts. Additionally, the policies are intended to provide assurance that there is sufficient flexibility in controlling risks and returns associated with the use of investments by each Trust Series. The policies, among other things, limit each Trust Series’ ability to have too high of a concentration of its assets in non-exchange traded futures contracts or cleared swap contracts or concentrating its investments in too few counterparties, absent prior approval from the Board. Existing counterparties are reviewed periodically by the Board to ensure that they continue to meet the criteria outlined in the policies. The Board tasks USCF with assessing risks, including market risk, credit risk, liquidity risk, cash flow risk, basis risk, legal and tax risk, settlement risk, and operational risk.
| 184 |
The Board also determines compensation payable to employees of USCF, including the portfolio managers of each of Trust Series and the Related Public Funds. The compensation of certain employees of USCF is, in part, based on the amount of assets under management by the Trust Series and the Related Public Funds. The Board feels that compensating certain employees, in part, based on the amount of assets under management is appropriate since having more assets in a fund generally reflects that investors perceive the fund’s investment objective is being met. There are certain risks that may arise as a result of a growth in assets under management. For example, if position limits are imposed on each Trust Series and the assets under management continue to increase, then a Trust Series may not be able to invest solely in the Applicable Benchmark Component Futures Contracts and may have to invest in over-the-counter swap contracts or Other Related Investments as it seeks to track its benchmark. Other Futures Contracts in which a Trust Series may invest may not track changes in the Applicable Index. Other Related Investments, including over-the-counter swap contracts, may also expose each Trust Series to increased counterparty credit risk and may be less liquid and more difficult to value than Futures Contracts. The Trust Series and the Related Public Funds ameliorate the potential credit, liquidity and valuation risks by fully collateralizing any over-the-counter swap contracts or other investments. In making compensation decisions, the Board considers whether a compensation arrangement would expose the Trust Series or the Related Public Funds to additional risks and whether the risks posed by such arrangement are consistent with the best interests of each Trust Series’ investors.
Other Information
In addition to the certifications of the Chief Executive Officer and Chief Financial Officer of USCF filed or furnished with this annual report on Form 10-K regarding the quality of each of the Trust Series’ public disclosure, each Trust Series will submit, within 30 days after filing this annual report on Form 10-K, to the NYSE Arca a certification of the Chief Executive Officer of USCF certifying that he is not aware of any violation by a Trust Series, as applicable, of NYSE Arca corporate governance listing standards.
Section 16(a) Beneficial Ownership Reporting Compliance
Section 16(a) of the Exchange Act requires directors and executive officers of USCF and persons who are beneficial owners of at least 10% of a Trust Series’ shares to file with the SEC an Initial Statement of Beneficial Ownership of Securities on Form 3 within 10 calendar days of first becoming a director, executive officer or beneficial owner of at least 10% of a Trust Series’ shares and a Statement of Changes of Beneficial Ownership of Securities on Form 4 within 2 business days of a subsequent acquisition or disposition of shares of a Trust Series. To each Trust Series’ knowledge, based upon a review of copies of reports furnished to it with respect to the fiscal year ended December 31, 2014 and upon the written representations of the directors and executive officers of USCF, all of such persons have filed all required reports.
| Item 11. | Executive Compensation. |
Compensation to USCF and Other Compensation
None of the Trust Series directly compensates any of the executive officers noted above. The executive officers noted above are compensated by USCF for the work they perform on behalf of each Trust Series and other entities controlled by USCF. None of the Trust Series reimburses USCF for, nor does it set the amount or form of any portion of, the compensation paid to the executive officers by USCF. Each Trust Series pays fees to USCF pursuant to the Trust Agreement. Each of USCI, CPER, USAG and USMI is contractually obligated to pay USCF a fee, which is paid monthly, equal to 0.95% per annum of average daily total net assets. Effective May 1, 2014 and continuing through December 31, 2015, USCF has contractually agreed to lower the management fee to 0.80% per annum of average daily total net assets for USCI, 0.65% per annum of average daily total net assets for CPER, 0.65% per annum of average daily total net assets for USAG and 0.65% per annum of average daily total net assets for USMI.
For 2014, each of USCI, CPER, USAG and USMI accrued aggregate management fees of $5,887,414, $20,483, $17,092 and $14,774, respectively.
| 185 |
Director Compensation
The following table sets forth compensation earned during the year ended December 31, 2014 by the directors of USCF. Each of USCI’s, CPER’s, USAG’s and USMI’s portion of the aggregate fees paid to the directors for the year ended December 31, 2014 was $96,747, $441, $310 and $342, respectively.
| Name | Fees Earned or Paid in Cash | Stock Awards | Option Awards | Non-Equity Incentive Plan Compensation | Change in Pension Value and Nonqualified Deferred Compensation Plan | All Other Compensation | Total | |||||||||||||||||||||
| Management Directors | ||||||||||||||||||||||||||||
| Nicholas Gerber | $ | 0 | NA | NA | NA | $ | 0 | $ | 0 | $ | 0 | |||||||||||||||||
| Andrew F. Ngim | $ | 0 | NA | NA | NA | $ | 0 | $ | 0 | $ | 0 | |||||||||||||||||
| Howard Mah | $ | 0 | NA | NA | NA | $ | 0 | $ | 0 | $ | 0 | |||||||||||||||||
| Independent Directors | ||||||||||||||||||||||||||||
| Peter M. Robinson | $ | 102,000 | NA | NA | NA | $ | 0 | $ | 0 | $ | 102,000 | |||||||||||||||||
| Gordon L. Ellis | $ | 102,000 | NA | NA | NA | $ | 0 | $ | 0 | $ | 102,000 | |||||||||||||||||
| Malcolm R. Fobes III(1) | $ | 122,000 | NA | NA | NA | $ | 0 | $ | 0 | $ | 122,000 | |||||||||||||||||
| (1) | Mr. Fobes serves as chairman of the audit committee of USCF and receives additional compensation in recognition of the additional responsibilities he has undertaken in this role. |
| Item 12. | Security Ownership of Certain Beneficial Owners and Management and Related Stockholder Matters. |
USCI
None of the directors or executive officers of USCF owns any shares of USCI, except as set forth below. In addition, USCI is not aware of any 5% holder of its shares.
| Name and Address of Beneficial Owner | Amount and Nature of Beneficial Ownership | Percent of Class as of December 31, 2014 | ||||||
| John Hyland c/o United States Commodity Funds LLC 1999 Harrison Street, Suite 1530 Oakland, California 94612 | 600 | * | 0.0066 | % | ||||
| * | The shares are held through Mr. Hyland’s USCF 401(k) account. |
CPER
None of the directors or executive officers of USCF owns any shares of CPER, except as set forth below. In addition, CPER is not aware of any 5% holder of its shares.
| 186 |
| Name and Address of Beneficial Owner | Amount and Nature of Beneficial Ownership | Percent of Class as of December 31, 2014 | ||||||
| Howard Mah c/o United States Commodity Funds LLC 1999 Harrison Street, Suite 1530 Oakland, California 94612 | 500 | * | 0.5 | % | ||||
| John Hyland c/o United States Commodity Funds LLC 1999 Harrison Street, Suite 1530 Oakland, California 94612 | 400 | ** | 0.4 | % | ||||
| * | The shares are held through Mr. Mah’s USCF 401(k) account. |
| ** | The shares are held through Mr. Hyland’s USCF 401(k) account. |
USAG
None of the directors or executive officers of USCF owns any shares of USAG, except as set forth below. In addition, USAG is not aware of any 5% holder of its shares.
| Name and Address of Beneficial Owner | Amount and Nature of Beneficial Ownership | Percent of Class as of December 31, 2014 | ||||||
| John Hyland c/o United States Commodity Funds LLC 1999 Harrison Street, Suite 1530 Oakland, California 94612 | 300 | * | 0.3 | % | ||||
| Howard Mah c/o United States Commodity Funds LLC 1999 Harrison Street, Suite 1530 Oakland, California 94612 | 300 | ** | 0.3 | % | ||||
| * | The shares are held through Mr. Hyland’s USCF 401(k) account. |
| ** | The shares are held through Mr. Mah’s USCF 401(k) account. |
USMI
None of the directors or executive officers of USCF owns any shares of USMI, except as set forth below. In addition, USMI is not aware of any 5% holder of its shares.
| Name and Address of Beneficial Owner | Amount and Nature of Beneficial Ownership | Percent of Class as of December 31, 2014 | ||||||
| John Hyland c/o United States Commodity Funds LLC 1999 Harrison Street, Suite 1530 Oakland, California 94612 | 600 | * | 0.6 | % | ||||
| Howard Mah c/o United States Commodity Funds LLC 1999 Harrison Street, Suite 1530 Oakland, California 94612 | 300 | ** | 0.3 | % | ||||
| * | The shares are held through Mr. Hyland’s USCF 401(k) account. |
| ** | The shares are held through Mr. Mah’s USCF 401(k) account. |
| 187 |
| Item 13. | Certain Relationships and Related Transactions, and Director Independence. |
Certain Relationships and Related Transactions
Each Trust Series has and will continue to have certain relationships with USCF and its affiliates. However, there have been no direct financial transactions between any Trust Series and the directors or officers of USCF that have not been disclosed herein. See “Item 11. Executive Compensation” and “Item 12. Security Ownership of Certain Beneficial Owners and Management and Related Stockholder Matters.” Any transaction with a related person that must be disclosed in accordance with SEC Regulation S-K item 404(a), including financial transactions by any Trust Series with directors or executive officers of USCF or holders of beneficial interests in USCF or any Trust Series of more than 5%, will be subject to the provisions regarding “Fiduciary Duty” as set forth in Section 5.6 of the Trust Agreement and will be reviewed and approved by the audit committee of the Board of USCF.
Director Independence
In February 2015, the Board undertook a review of the independence of the directors of USCF and considered whether any director has a material relationship or other arrangement with USCF, the Trust Series or the Related Public Funds that could compromise his ability to exercise independent judgment in carrying out his responsibilities. As a result of this review, the Board determined that each of Messrs. Fobes, Ellis and Robinson is an “independent director,” as defined under the rules of NYSE Arca.
| Item 14. | Principal Accountant Fees and Services. |
The fees for services billed to USCI by its independent auditors for the last two fiscal years are as follows:
| 2014 | 2013 | |||||||
| Audit fees | $ | 110,000 | $ | 160,000 | ||||
| Audit-related fees | - | - | ||||||
| Tax fees | - | - | ||||||
| All other fees | - | - | ||||||
| $ | 110,000 | $ | 160,000 | |||||
The fees for services billed to CPER by its independent auditors for the last two fiscal years are as follows:
| 2014 | 2013 | |||||||
| Audit fees | $ | 25,000 | $ | 25,000 | ||||
| Audit-related fees | - | - | ||||||
| Tax fees | - | - | ||||||
| All other fees | - | - | ||||||
| $ | 25,000 | $ | 25,000 | |||||
The fees for services billed to USAG by its independent auditors for the last fiscal year are as follows
| 2014 | 2013 | |||||||
| Audit fees | $ | 25,000 | $ | 25,000 | ||||
| Audit-related fees | - | - | ||||||
| Tax fees | - | - | ||||||
| All other fees | - | - | ||||||
| $ | 25,000 | $ | 25,000 | |||||
The fees for services billed to USMI by its independent auditors for the last fiscal year are as follows
| 2014 | 2013 | |||||||
| Audit fees | $ | 25,000 | $ | 25,000 | ||||
| Audit-related fees | - | - | ||||||
| Tax fees | - | - | ||||||
| All other fees | - | - | ||||||
| $ | 25,000 | $ | 25,000 | |||||
| 188 |
Audit fees consist of fees paid to Spicer Jeffries LLP for (i) the audit of each of the Trust’s and the Trust Series’ annual financial statements included in the annual report on Form 10-K, and review of financial statements included in the quarterly reports on Form 10-Q and certain of the Trust’s and the Trust Series’ current reports on Form 8-K; (ii) the audit of the Trust’s and each Trust Series’ internal control over financial reporting included in the annual report on Form 10-K; and (iii) services that are normally provided by the Independent Registered Public Accountants in connection with statutory and regulatory filings of registration statements.
Tax fees consist of fees paid to Spicer Jeffries LLP for professional services rendered in connection with tax compliance and partnership income tax return filings.
The audit committee has established policies and procedures which are intended to control the services provided by the Trust’s and the Trust Series’ independent auditors and to monitor their continuing independence. Under these policies and procedures, no audit or permitted non-audit services (including fees and terms thereof), except for the de minimis exceptions for non-audit services described in Section 10A(i)(1)(B) of the Exchange Act, may be undertaken by the Trust Series’ independent auditors unless the engagement is specifically pre-approved by the audit committee. The audit committee may form and delegate authority to subcommittees consisting of one or more members when appropriate, including the authority to grant pre-approvals of audit and permitted non-audit services, provided that decisions of such subcommittee to grant pre-approvals must be presented to the full audit committee at its next scheduled meeting.
| Item 15. | Exhibits and Financial Statement Schedules. |
| 1. | See Index to Financial Statements on page 122. |
| 2. | No financial statement schedules are filed herewith because (i) such schedules are not required or (ii) the information required has been presented in the aforementioned financial statements. |
| 3. | Exhibits required to be filed by Item 601 of Regulation S-K. |
| 189 |
Listed below are the exhibits which are filed or furnished as part of this annual report on Form 10-K (according to the number assigned to them in Item 601 of Regulation S-K):
| Exhibit Number |
Description of Document | |
| 3.1(1) | Certificate of Statutory Trust of the Registrant. | |
| 3.2(2) | Third Amended and Restated Declaration of Trust and Trust Agreement. | |
| 3.3(3) | Fifth Amended and Restated Limited Liability Company Agreement of the Sponsor. | |
| 10.1(4) | Form of Authorized Participant Agreement. | |
| 10.2(4) | Form of Marketing Agent Agreement. | |
| 10.3(4) | Amendment Agreement to Marketing Agent Agreement. | |
| 10.4(3) | Form of Custodian Agreement. | |
| 10.5(4) | Amendment Agreement to Custodian Agreement. | |
| 10.6(3) | Form of Administrative Agency Agreement. | |
| 10.7(5) | Amendment Agreement to Administrative Agency Agreement. | |
| 10.8(6) | Licensing Agreement. | |
| 10.9(6) | Advisory Agreement. | |
| 10.10(7) | Amendment No. 1 to Licensing Agreement. | |
| 10.11(7) | Amendment No. 1 to Advisory Agreement. | |
| 10.12(7) | Amendment No. 2 to Licensing Agreement. | |
| 10.13(7) | Amendment No. 2 to Advisory Agreement. | |
| 14.1(8) | Code of Ethics. | |
| 23.1(8) | Consent of Independent Registered Public Accounting Firm. | |
| 31.1(8) | Certification of Principal Executive Officer Pursuant to Rule 13a-14(a) under the Securities Exchange Act of 1934. | |
| 31.2(8) | Certification of Principal Financial Officer Pursuant to Rule 13a-14(a) under the Securities Exchange Act of 1934. | |
| 32.1(8) | Certification of Principal Executive Officer Pursuant to Section 906 of the Sarbanes-Oxley Act of 2002 (18 U. S. C. 1350). | |
| 32.2(8) | Certification of Principal Financial Officer Pursuant to Section 906 of the Sarbanes-Oxley Act of 2002 (18 U. S. C. 1350). | |
| 99.1(4) | Customer Agreement for Futures Contracts. | |
| 101.INS | XBRL Instance Document. | |
| 101.SCH | XBRL Taxonomy Extension Schema. | |
| 101.CAL | XBRL Taxonomy Extension Calculation Linkbase. | |
| 101.DEF | XBRL Taxonomy Extension Definition Linkbase. | |
| 101.LAB | XBRL Taxonomy Extension Label Linkbase. | |
| 101.PRE | XBRL Taxonomy Extension Presentation Linkbase. | |
| (1) | Incorporated by reference to the initial Registration Statement on Form S-1 (File No. 333-164024) filed on December 24, 2009. | |
| (2) | Incorporated by reference to Amendment No. 1 to the Registrant’s Registration Statement on Form S-3/A (File No. 333-187515) filed on April 10, 2013. | |
| (3) | Incorporated by reference to the Registrant’s Annual Report on Form 10-K for the year ended December 31, 2011, filed on March 15, 2012. | |
| (4) | Incorporated by reference to Amendment No. 5 to the Registrant’s Registration Statement on Form S-1/A (File No. 333-164024) filed on July 23, 2010. | |
| (5) | Incorporated by reference to Amendment No. 1 to the Registrant’s Registration Statement on Form S-1/A (File No. 333-170844) filed on August 31, 2011. | |
| (6) | Incorporated by reference to Amendment No. 4 to the Registrant’s Registration Statement on Form S-1/A (File No. 333-164024) filed on June 21, 2010. | |
| (7) | Incorporated by reference to the Registrant’s Registration Statement on Form S-1 (File No. 333-170844) filed on November 26, 2010. | |
| (8) | Filed herewith. | |
| 190 |
Pursuant to the requirements of Section 13 or 15(d) of the Securities Exchange Act of 1934, the registrant has duly caused this report to be signed on its behalf by the undersigned thereunto duly authorized.
| United States Commodity Index Funds Trust (Registrant) |
||
| By: United States Commodity Funds LLC, as Sponsor | ||
| By: | /s/ Nicholas D. Gerber | |
| Nicholas D. Gerber | ||
| President and Chief Executive Officer | ||
| (Principal executive officer) | ||
| Date: March 16, 2015 | ||
| By: | /s/ Howard Mah | |
| Howard Mah | ||
| Chief Financial Officer | ||
| (Principal financial and accounting officer) | ||
| Date: March 16, 2015 | ||
| 191 |
Pursuant to the requirements of the Securities Exchange Act of 1934, this Report has been signed below by the following persons on behalf of the Registrant in the capacities* and on the dates indicated.
| Signature | Title (Capacity) | Date | |||
| /s/ Nicholas D. Gerber | Chief Executive Officer of | March 16, 2015 | |||
| Nicholas D. Gerber | United States Commodity Funds, LLC | ||||
| (Principal Executive Officer) | |||||
| /s/ Howard Mah | Chief Financial Officer of | March 16, 2015 | |||
| Howard Mah | United States Commodity Funds, LLC | ||||
| (Principal Financial Officer) | |||||
| * | The Registrant is a trust and the persons are signing in their capacities as officers of United States Commodity Funds LLC, the Sponsor of the Registrant. |
| 192 |