Attached files
| file | filename |
|---|---|
| 8-K - FORM 8-K - BLACKSTONE MORTGAGE TRUST, INC. | d873557d8k.htm |
| EX-99.1 - EX-99.1 - BLACKSTONE MORTGAGE TRUST, INC. | d873557dex991.htm |
 Blackstone Mortgage Trust, Inc.
February 17, 2015
Full Year and Fourth Quarter 2014 Results
Exhibit 99.2
*
*
*
*
*
*
*
* |
 Blackstone Mortgage Trust
1
Fourth Quarter 2014 Highlights
Core
Earnings
of
$0.52
per
share
for
the
quarter,
a
27%
increase
from
the
fourth
quarter
of
2013,
supporting an increase in our fourth quarter dividend to $0.52 per share.
100%
floating
rate
Loan
Origination
portfolio
of
$4.4
billion
with
a
weighted
average
loan-to-
value
of
64%.
Closed
8
senior
loans
representing
total
commitments
of
$781
million,
with
one
additional
$315
million
senior loan closing immediately subsequent to quarter-end.
Funded $770 million of loan commitments, offset by $216 million of full or
partial repayments. Added
$743
million
of
financing
capacity,
bringing
total
capacity
to
$4.4
billion
with
$2.9
billion
outstanding.
GAAP
net
income
of
$0.37
per
share
includes
net
loss
of
$0.08
per
share
in
the
CT Legacy portfolio;
consolidated book value of $25.10 per share.
Information included in this presentation is as of or for the period ended December 31, 2014,
unless otherwise indicated. See Appendix for a definition of Core Earnings and a
reconciliation to GAAP net income, as well as certain per share calculations that are referenced throughout this presentation. |
 Blackstone Mortgage Trust
2
Fourth Quarter 2014 Balance Sheet, Net Income, and Core Earnings
(Dollars in Millions)
CT Legacy portfolio
($4.8)
Secured financings
($21.3)
Equity
and
other
(b)
($2.5)
($6.3)
($1.1)
Loan Origination
portfolio
$57.5
$21.5
$4.8
$0.4
$-
Interest income
Interest expense
Non-cash comp.
G&A expenses
Net results
$57.5
$-
($20.9)
Core
Earnings
(a)
Net
Income
$30.1
+
+
+
+
Convertible notes,
net
Balance
Sheet
Mgmt./Incen. fees
$2.5
$0.8
$-
$-
($5.5)
($1.1)
$1,424
$162
$2,865
$22
$4,429
(a) See Appendix for a definition of Core Earnings and a reconciliation to GAAP
net income.
(b) Includes stockholders’ equity of $1.5 billion, less the net of (i)
cash and cash equivalents of $51.8 million, (ii) accrued interest receivable, prepaid expenses,
and other assets of $36.5 million, and (iii) accounts payable, accrued expenses, and other
liabilities of $47.3 million. |
 Blackstone Mortgage Trust
3
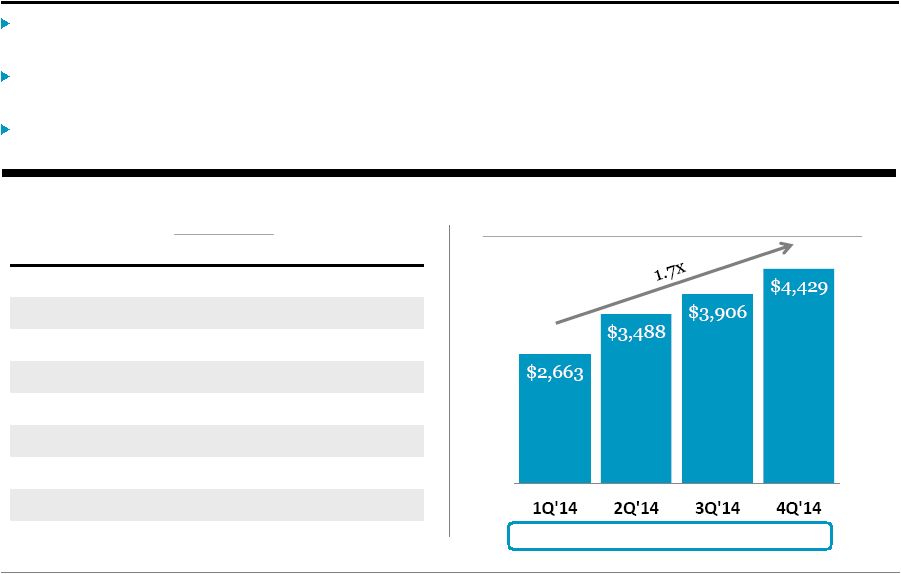
Increase
in
quarterly
Core
Earnings
of 150% during 2014.
Disciplined
issuance
of
28.3
million
shares
of
common
stock
during
2014,
resulting
in
Core
Earnings
per share growth of 27%.
Achieved
full
coverage
of
dividend
per
share
in
3Q
and
4Q
as
steady
deployment
of
capital
and
increasing
scale
drove
growth
in
Core Earnings per share.
Core Earnings and Dividend Growth
Core Earnings
(a)
(Dollars in Millions)
$0.41
$0.43
$0.43
$0.50
$0.52
Core Earnings
Per share
Loan originations of $3.4 billion during 2014 drove consistent growth in Core
Earnings per share and dividends per share.
$0.45
$0.48
$0.48
$0.50
$0.52
Dividends
Per share
(a)
See Appendix for a definition of Core Earnings and reconciliations to GAAP net income. |
 Blackstone Mortgage Trust
4
Loan Origination Portfolio
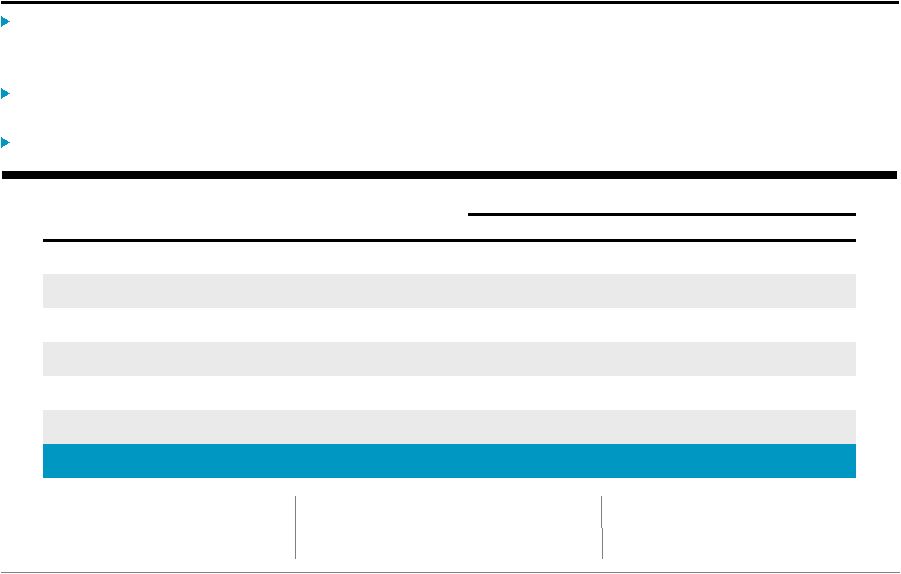
Closed
$781
million
of
loans
during
the
fourth
quarter
with
an
average
commitment
of
$121
million,
including
a
C$196
million
loan
secured
by
an
office
portfolio
in
Canada.
Total
loan
originations
for
2014
of
$3.4
billion,
bringing
cumulative
originations
since
the
May
2013
re-IPO
to $5.9 billion.
Portfolio
Gross
ROI
(a)
continues
to
remain
stable
in
the
L
+
12-13%
range
as
improved
financing
terms
have
generally balanced modestly lower portfolio asset yields.
Loan Origination Portfolio Statistics
(Dollars in Millions)
Loan Origination Portfolio
(Net
Book
Value
and
Gross
ROI
(a)
,
Dollars
in
Millions)
L+12.7% L+12.7%
L+12.9% L+12.8% Gross
ROI:
Number of loans
60
Principal balance
$4,463
Net book value
$4,429
Wtd. avg. origination loan-to-value
64%
Wtd. avg. cash coupon
L + 4.36%
Wtd. avg. all-in yield
L + 4.81%
Wtd. avg. gross return on investment
(a)
L + 12.8%
Wtd. avg. maximum maturity
(b)
3.9 yrs.
(a)
Weighted average gross return on investment (“Gross ROI”) is based on each
asset’s all-in yield, assuming current rates with no dispositions, early payments,
or defaults, and all-in cost of secured debt, assuming full leverage at the asset level
based on the maximum available leverage in place or in negotiation for each
investment, notwithstanding the amount actually borrowed. Gross ROI excludes costs related to convertible notes, management fees, and corporate-
level expenses. Gross ROI is presented solely for informational purposes and is not
representative of net income recognized in prior or future periods.
(b)
Maximum maturity assumes all extension options are exercised, however BXMT’s floating
rate loans may be repaid prior to such dates. |
 Blackstone Mortgage Trust
5
Portfolio Diversification
BXMT’s
$4.4
billion
floating
rate
portfolio
is
diversified
by
collateral
property
type
and
geographic
location,
and
is
primarily
comprised
of
senior
mortgages
and
similar
credit
quality
loans.
$316,934,052
$416,559,099
Collateral Diversification
(Net Book Value, % of Total)
Floating rate Loans
(Net Book Value, % of Total)
100.0%
Office
Multifamily
Hotel
Condo
Senior Loans
(Net Book Value, % of Total)
98.0%
Geographic Diversification
(Net Book Value, % of Total)
Other
Retail
CA
13.1%
IL
7.2%
FL
6.3%
WA
2.3%
TX
5.2%
GA
4.9%
CO
2.1%
DC
1.8%
AZ
1.6%
VA
1.5%
HI
1.1%
RI
OR
NV
0.2%
MI
0.2%
OH
0.2%
KY
0.1%
NC
0.2%
0.7%
0.9%
NY
30.5%
CAN
3.1% |
 Blackstone Mortgage Trust
6
Floating Rate Business Model
BXMT’s
LIBOR-based
(a)
lending
and
funding
business
model
generates
increasing
returns
with
rising
short-term interest rates.
All
else
equal,
a
100bp
increase
in
LIBOR
would
increase
annual
net
interest
income
by
$0.26
per
share
(b)
.
Loan Capitalization
(c)
(Principal Balance, Dollars in Millions)
Floating rate
loans
Floating rate
borrowings
Floating rate
Net investment
Income Sensitivity to LIBOR
(b)
(Dollars
of
Net
Interest
Income
per
share
(d)
)
$2.30
$2.35
$2.40
$2.45
$2.50
$2.55
$2.60
$2.65
$2.70
$2.75
$2.80
(a)
Our floating rate loans and related liabilities are indexed to the various benchmark rates
relevant in each case in terms of currency and payment frequency. Therefore the net
exposure to each benchmark rate is in direct proportion to our net assets indexed to that rate.
(b)
Gives effect to LIBOR floors for loan receivable investments. All else equal, a 10bp decrease
in LIBOR would decrease annual net interest income by $0.02 per share.
(c)
Includes only the Loan Origination portfolio with an aggregate principal balance of $4.5
billion, capitalized with $2.9 billion of secured borrowings, and with a $1.6 billion
net investment. Excludes the assets, liabilities, and equity of the CT Legacy portfolio.
(d)
Based on annualized net interest income for the quarter-ended December 31, 2014, and
shares outstanding as of December 31, 2014.
$0.26
LIBOR |
 Blackstone Mortgage Trust
7
Credit Facilities and Liquidity
$385 million
Available Borrowings
L + 2.11%
Wtd. Avg. All-in Cost of Credit Facilities
$3.4 billion
Total Credit Facility Capacity
(a) Total liquidity includes $52 million of cash and $385
million of available borrowings. Potential loan originations assumes 3.5x asset-level leverage on total
liquidity, net of $81
million of minimum liquidity requirements under applicable debt covenants.
(b) Potential borrowings represent the total amount that could
be drawn under each facility based on collateral already approved and pledged. When undrawn,
these amounts do not incur interest, but are immediately available to BXMT at its sole
discretion under the terms of each revolving credit facility.
(c) The maximum facility size for JP Morgan is composed of a
$250 million facility and a £153 million ($238 million) facility. The maximum facility size for Morgan
Stanley represents a £250 million ($389 million) facility that may be drawn in GBP or
EUR. Maximum
Collateral Asset
Debt Obligations
(b)
(Dollars in Thousands)
Facility Size
Principal Balance
Potential
Outstanding
Available
Wells Fargo
1,000,000
$
747,256
$
585,737
$
484,365
$
101,372
$
Citibank
500,000
621,025
472,080
392,455
79,625
Bank of America
500,000
557,810
441,201
389,347
51,854
JP Morgan
(c)
488,155
544,654
422,249
341,487
80,762
MetLife
500,000
476,499
366,902
305,889
61,013
Morgan Stanley
(c)
389,050
174,297
137,181
127,240
9,941
Total
3,377,205
$
3,121,541
$
2,425,350
$
2,040,783
$
384,567
$
During
the
quarter,
BXMT
closed
a
$500
million
upsize
of
an
existing
revolving
credit
facility,
bringing
total
credit
facility
capacity
to
$3.4
billion,
including
$627
million
of
GBP
and
EUR
multi-currency
facilities.
Currency-matched
financings
hedge
foreign
currency
denominated
loans
to
the
extent
of
leverage
employed.
Total
liquidity
of
$436
million
(a)
at
quarter-end,
providing
for
$1.6
billion
(a)
of
potential
loan
originations
and
fundings. |
 Blackstone Mortgage Trust
8
Asset-Specific Financings
(a)
BXMT
closed
two
additional
asset-specific
financings
totaling
$243
million
of
financing
capacity,
bringing
asset-specific
capacity
to
$981
million
and
total
financing
capacity
to
$4.4
billion
including
credit
facilities.
Opportunistic
use
of
asset-specific
financings
preserves
capacity
of
revolving
repurchase
facilities.
$981
Total
Asset-Specific
Financing
Capacity
(Dollars in Millions)
$372
•
Non-cross collateralized, with limited recourse and margin call
provisions
•
Three agreements with $325 million outstanding and $47 million of
future funding commitments
•
$429 million of collateral assets
Asset-Specific
Repurchase
Agreements
$499
•
Senior loan participations sold by BXMT
•
Four participation sales totaling $499 million
•
$636 million of whole loans financed
Loan
Participations
Sold
$110
•
Transaction structures resulting in realized sales of senior interests
•
One $110 million senior interest sold in a $144 million property
financing
•
$34 million mezzanine loan remains in BXMT’s portfolio
Non-Consolidated
Senior Interests
(a) BXMT’s balance sheet includes asset-specific financings
of $325 million classified as asset-specific repurchase agreements and $499 million classified as loan
participations sold. See pages 11-12, Consolidated and Segment Balance Sheets.
|
 Appendix
*
*
*
*
*
*
*
*
*
* |
 Blackstone Mortgage Trust
10
Loan Origination Segment Portfolio Details
The following table provides details of BXMT’s Loan Origination Segment
portfolio: (Dollars in Millions)
Origination
Date
Loan Type
Total
Commitment
Principal
Balance
Book
Value
Cash
Coupon
All-In
Yield
Maximum
Maturity
(a)
Geographic
Location
Property
Type
Origination
LTV
Loan 1
5/22/14
Senior loan
311.2
$
311.2
$
307.1
$
L + 4.00%
L + 4.34%
5/22/19
UK
Hotel
57%
Loan 2
11/21/13
Senior loan
181.0
181.0
179.8
L + 4.50%
L + 4.86%
11/9/18
NY
Condo
68%
Loan 3
12/9/14
Senior loan
210.7
163.3
161.8
L + 3.80%
L + 4.31%
12/9/19
Diversified-US
Office
65%
Loan 4
7/31/14
Senior loan
190.0
153.9
152.8
L + 3.50%
L + 4.01%
8/9/19
IL
Office
71%
Loan 5
1/7/14
Senior loan
160.0
151.8
150.6
L + 4.75%
L + 5.14%
1/7/19
Diversified-US
Other
71%
Loan 6
11/20/14
Senior loan
149.4
149.4
147.9
L + 3.40%
L + 3.62%
11/20/19
UK
Hotel
62%
Loan 7
12/17/13
Senior loan
139.8
139.8
139.1
L + 4.75%
L + 5.27%
1/9/19
NY
Office
70%
Loan 8
11/17/14
Senior loan
168.8
138.6
137.0
L + 5.50%
L + 5.96%
12/9/19
CAN
Office
53%
Loan 9
1/30/14
Senior loan
145.9
133.4
133.0
L + 4.30%
L + 4.63%
12/1/17
NY
Hotel
39%
Loan 10
6/20/14
Senior loan
137.5
120.4
119.4
L + 5.75%
L + 6.39%
6/20/16
CA
Hotel
44%
Loan 11
2/25/14
Senior loan
166.0
119.4
118.0
L + 4.40%
L + 4.81%
3/9/19
Diversified-US
Hotel
51%
Loan 12
2/20/14
Senior loan
100.0
97.7
97.4
L + 4.40%
L + 4.58%
3/9/19
NY
Office
70%
Loan 13
10/30/13
Senior loan
100.0
97.7
97.3
L + 4.38%
L + 4.61%
11/9/18
CA
Hotel
72%
Loan 14
3/4/14
Senior loan
121.4
95.1
94.0
L + 4.00%
L + 4.58%
3/4/18
UK
Office
55%
Loan 15
9/30/13
Senior loan
111.1
89.5
89.4
L + 3.70%
L + 3.83%
9/30/20
NY
Multifamily
62%
Loans 16-60
Various
Various
(b)
2,583.3
2,320.7
2,303.9
L + 4.41%
L + 4.92%
Various
Various
Various
67%
Total/Wtd. avg.
4,976.1
$
4,462.9
$
4,428.5
$
L + 4.36%
L + 4.81%
3.9 years
64%
(a) Maximum maturity date assumes all extension options
areexercised, however BXMT’s floating rate loans may be repaid prior to such dates.
(b) Includes (i) 43 senior loans with an aggregate principal
balance of $2.3 billion, (ii) one subordinate mortgage participation with a principal balance of $54 million,
and (iii) one mezzanine loan with a principal balance of $34 million resulting from
BXMT’s disposition of a non-consolidated senior interest as a financing strategy
in connection with the origination of the overall property financing.
|
 Blackstone Mortgage Trust
11
Consolidated Balance Sheet
(Dollars in Thousands, Except per Share Data)
December 31, 2014
December 31, 2013
Assets
Cash and cash equivalents
51,810
$
52,342
$
Restricted cash
11,591
10,096
Loans receivable, net
4,428,500
2,047,223
Equity investments in unconsolidated subsidiaries
10,604
22,480
Accrued interest receivable, prepaid expenses, and other assets
86,016
80,639
Total assets
4,588,521
$
2,212,780
$
Liabilities and equity
Accounts payable, accrued expenses, and other liabilities
61,013
$
97,153
$
Revolving repurchase facilities
2,040,783
863,622
Asset-specific repurchase agreements
324,553
245,731
Loan participations sold
499,433
90,000
Convertible notes, net
161,853
159,524
Total liabilities
3,087,635
1,456,030
Equity
Class A common stock, $0.01 par value
583
295
Additional paid-in capital
2,027,404
1,252,986
Accumulated other comprehensive (loss) income
(15,024)
798
Accumulated deficit
(547,592)
(536,170)
Total
Blackstone
Mortgage
Trust,
Inc.
stockholders’
equity
1,465,371
717,909
Non-controlling interests
35,515
38,841
Total equity
1,500,886
756,750
Total liabilities and equity
4,588,521
$
2,212,780
$
|
 Blackstone Mortgage Trust
12
Consolidated Balance Sheet: Segment Allocation
December 31, 2014
(Dollars in Thousands)
Loan
Origination
CT Legacy
Portfolio
Total
Assets
Cash and cash equivalents
51,810
$
-
$
51,810
$
Restricted cash
-
11,591
11,591
Loans receivable, net
4,428,500
-
4,428,500
Equity investments in unconsolidated subsidiaries
-
10,604
10,604
Accrued interest receivable, prepaid expenses, and other assets
36,531
49,485
86,016
Total assets
4,516,841
$
71,680
$
4,588,521
$
Liabilities and equity
Accounts payable, accrued expenses, and other liabilities
47,328
$
13,685
$
61,013
$
Revolving repurchase facilities
2,040,783
-
2,040,783
Asset-specific repurchase agreements
324,553
-
324,553
Loan participations sold
499,433
-
499,433
Convertible notes, net
161,853
-
161,853
Total liabilities
3,073,950
13,685
3,087,635
Equity
Total Blackstone Mortgage Trust, Inc. stockholders’equity
1,442,891
22,480
1,465,371
Non-controlling interests
-
35,515
35,515
Total equity
1,442,891
57,995
1,500,886
Total liabilities and equity
4,516,841
$
71,680
$
4,588,521
$ |
 Blackstone Mortgage Trust
13
Consolidated Statement of Operations
Three Months Ended December 31,
Year Ended December 31,
(Dollars in Thousands, Except per Share Data)
2014
2013
2014
2013
Income from loans and other investments
Interest and related income
58,258
$
26,837
$
184,766
$
53,164
$
Less: Interest and related expenses
21,446
11,525
69,143
18,017
Income from loans and other investments, net
36,812
15,312
115,623
35,147
Other expenses
Management and incentive fees
6,272
2,521
19,491
5,937
General and administrative expenses
5,876
5,408
27,799
11,505
Total other expenses
12,148
7,929
47,290
17,442
Impairments, provisions, and valuation adjustments
5,654
3,012
13,258
8,676
Loss on deconsolidation of subsidiary
(8,615)
-
(8,615)
-
Other income
-
-
-
38
Income from equity investments in
unconsolidated subsidiaries 3,742
-
28,036
-
Income before income taxes
25,445
10,395
101,012
26,419
Income tax provision
107
667
518
995
Net income
25,338
$
9,728
$
100,494
$
25,424
$
Net income attributable to non-controlling interests
(3,848)
(2,649)
(10,449)
(10,392)
Net income attributable to Blackstone Mortgage Trust, Inc.
21,490
$
7,079
$
90,045
$
15,032
$
Per share information (basic and diluted)
Weighted-average shares of common stock outstanding
58,190,324
29,364,448
48,394,478
18,520,052
Net income per share of common stock
0.37
$
0.24
$
1.86
$
0.81
$
|
 Blackstone Mortgage Trust
14
Consolidated Statement of Operations: Segment Allocation
Three Months Ended December 31, 2014
Year Ended December 31, 2014
(Dollars in Thousands)
Loan
Origination
CT Legacy
Portfolio
Total
Loan
Origination
CT Legacy
Portfolio
Total
Income from loans and other investments
Interest and related income
57,527
$
731
$
58,258
$
180,654
$
4,112
$
184,766
$
Less: Interest and related expenses
21,256
190
21,446
68,098
1,045
69,143
Income from loans and other investments, net
36,271
541
36,812
112,556
3,067
115,623
Other expenses
Management and incentive fees
6,272
-
6,272
19,491
-
19,491
General and administrative expenses
3,613
2,263
5,876
12,665
15,134
27,799
Total other expenses
9,885
2,263
12,148
32,156
15,134
47,290
Impairments, provisions, and valuation adjustments
-
5,654
5,654
-
13,258
13,258
Loss on deconsolidation of subsidiary
-
(8,615)
(8,615)
-
(8,615)
(8,615)
Income from equity investments in unconsolidated subsidiaries
-
3,742
3,742
-
28,036
28,036
Income (loss) before income taxes
26,386
(941)
25,445
80,400
20,612
101,012
Income tax provision
63
44
107
194
324
518
Net income (loss)
26,323
$
(985)
$
25,338
$
80,206
$
20,288
$
100,494
$
Net income attributable to non-controlling interests
-
(3,848)
(3,848)
-
(10,449)
(10,449)
Net
income
(loss)
attributable
to
Blackstone
Mortgage
Trust,
Inc.
26,323
$
(4,833)
$
21,490
$
80,206
$
9,839
$
90,045
$ |
 Blackstone Mortgage Trust
15
Consolidated Statement of Operations: Loan Origination Segment
Three Months Ended
(Dollars in Thousands)
December 31, 2014
September 30, 2014
$ Change
% Change
Income from loans and other investments
Interest and related income
57,527
$
49,720
$
7,807
$
15.7%
Less: Interest and related expenses
21,256
19,713
1,543
7.8%
Income from loans and other investments, net
36,271
30,007
6,264
20.9%
Other expenses
Management and incentive fees
6,272
5,412
860
15.9%
General and administrative expenses
3,613
2,705
908
33.6
%
Total other expenses
9,885
8,117
1,768
21.8%
Income before income taxes
26,386
21,890
4,496
20.5%
Income tax provision
63
-
63
N/M
Net income
26,323
$
21,890
$
4,433
$
20.3% |
 Blackstone Mortgage Trust
16
Per Share Calculations
(Dollars in Thousands, Except per Share Data)
Core Earnings
Reconciliation
Book Value per
Share:
Segment Allocation
Earnings per Share:
Segment Allocation
Three Months Ended December 31, 2014
Three Months Ended September 30, 2014
Loan
Origination
CT Legacy
Portfolio
Total
Loan
Origination
CT Legacy
Portfolio
Total
Net income (loss)
26,323
$
(4,833)
$
21,490
$
21,890
$
134
$
22,024
$
Weighted-average shares
outstanding, basic and diluted
58,190
58,190
58,190
49,211
49,211
49,211
Earnings per share, basic and diluted
0.45
$
(0.08)
$
0.37
$
0.45
$
0.00
$
0.45
$
Three Months Ended
December 31, 2014
September 30, 2014
Net income
21,490
$
22,024
$
CT Legacy Portfolio segment net loss
(income) 4,833
(134)
Amortization of discount on convertible notes
408
404
Incentive management fees
817
842
Non-cash compensation expense
2,528
1,619
Core Earnings
30,076
$
24,755
$
58,190
49,211
Core Earnings per share, basic and diluted
0.52
$
0.50
$
December 31,
2014 September 30, 2014
Loan
Origination
CT Legacy
Portfolio
Total
Loan
Origination
CT Legacy
Portfolio
Total
1,442,891
$
22,480
$
1,465,371
$
1,448,384
$
29,355
$
1,477,739
$
Shares
Class A common stock
58,270
58,270
58,270
57,680
57,680
57,680
Deferred stock units
119
119
119
113
113
113
58,389
58,389
58,389
57,793
57,793
57,793
Book value per share
24.71
$
0.39
$
25.10
$
25.06
$
0.51
$
25.57
$
Stockholders’ equity Weighted-average
shares outstanding, basic and diluted |
 Blackstone Mortgage Trust
17
Reconciliation of Net Income to Core Earnings
Three Months Ended
(Dollars in Thousands, Except per Share Data)
December 31,
2013
Mach 31,
2014
June 30,
2014
September 30,
2014
December 31,
2014
Net income
7,079
$
13,065
$
33,466
$
22,024
$
21,490
$
CT Legacy Portfolio segment net loss (income)
3,670
970
(15,508)
(134)
4,833
Amortization of discount on convertible notes
130
391
397
404
408
Unrealized
(gain)
loss
on
foreign
currency
remeasurement
(23)
32
(235)
-
-
Incentive management fees
-
-
-
842
817
Non-cash compensation expense
1,158
1,834
2,382
1,619
2,528
Core Earnings
12,014
$
16,292
$
20,502
$
24,755
$
30,076
$
Weighted-average shares outstanding, basic and diluted
29,364
37,967
47,978
49,211
58,190
Net income per share, basic and diluted
0.24
$
0.34
$
0.70
$
0.45
$
0.37
$
Core Earnings per share, basic and diluted
0.41
$
0.43
$
0.43
$
0.50
$
0.52
$
|
 Blackstone Mortgage Trust
18
Definitions
Blackstone
Mortgage
Trust,
Inc.
(“BXMT”)
discloses
Core
Earnings,
a
financial
measure
that
is
calculated
and
presented
on
the
basis
of
methodologies
other
than
in
accordance
with
generally
accepted
accounting
principles
in
the
United
States
of
America
(“GAAP”)
in
this
presentation.
Core
Earnings
is
an
adjusted
measure
that
helps
BXMT
evaluate
its
performance
excluding
the
effects
of
certain
transactions
and
GAAP
adjustments
that
it
believes
are
not
necessarily
indicative
of
its
current
loan
origination
portfolio
and
operations.
BXMT
also
uses
Core
Earnings
to
calculate
the
incentive
and
base
management
fees
due
to
its
manager
under
its
management
agreement
and,
as
such,
BXMT
believes
that
the
disclosure
of
Core
Earnings
is
useful
to
investors.
Core
Earnings
is
defined
as
GAAP
net
income
(loss),
including
realized
losses
not
otherwise
included
in
GAAP
net
income
(loss),
and
excluding
(i)
net
income
(loss)
attributable
to
the
CT
Legacy
Portfolio
segment,
(ii)
non-cash
equity
compensation
expense,
(iii)
incentive
management
fees,
(iv)
depreciation
and
amortization,
and
(v)
unrealized
gains
(losses)
or
similar
non-cash
items.
Core
Earnings
may
also
be
adjusted
from
time
to
time
to
exclude
one-time
events
pursuant
to
changes
in
GAAP
and
certain
other
non-cash
charges
as
determined
by
BXMT’s
manager,
subject
to
approval
by
a
majority
of
its
independent
directors.
Core
Earnings
does
not
represent
net
income
or
cash
generated
from
operating
activities
and
should
not
be
considered
as
an
alternative
to
GAAP
net
income,
or
an
indication
of
BXMT’s
GAAP
cash
flows
from
operations,
a
measure
of
BXMT’s
liquidity,
or
an
indication
of
funds
available
for
its
cash
needs.
In
addition,
BXMT’s
methodology
for
calculating
Core
Earnings
may
differ
from
the
methodologies
employed
by
other
companies
to
calculate
the
same
or
similar
supplemental
performance
measures,
and
accordingly,
its
reported
Core
Earnings
may
not
be
comparable
to
the
Core
Earnings
reported
by
other
companies. |
 Blackstone Mortgage Trust
19
Forward-Looking Statements
This
presentation
may
contain
forward-looking
statements
within
the
meaning
of
Section
27A
of
the
Securities
Act
of
1933,
as
amended,
and
Section
21E
of
the
Securities
Exchange
Act
of
1934,
as
amended,
which
reflect
Blackstone
Mortgage
Trust’s
current
views
with
respect
to,
among
other
things,
Blackstone
Mortgage
Trust’s
operations
and
financial
performance.
You
can
identify
these
forward-looking
statements
by
the
use
of
words
such
as
“outlook,”
“indicator,”
“believes,”
“expects,”
“potential,”
“continues,”
“may,”
“will,”
“should,”
“seeks,”
“approximately,”
“predicts,”
“intends,”
“plans,”
“estimates,”
“anticipates”
or
the
negative
version
of
these
words
or
other
comparable
words.
Such
forward-looking
statements
are
subject
to
various
risks
and
uncertainties.
Accordingly,
there
are
or
will
be
important
factors
that
could
cause
actual
outcomes
or
results
to
differ
materially
from
those
indicated
in
these
statements.
Blackstone
Mortgage
Trust
believes
these
factors
include
but
are
not
limited
to
those
described
under
the
section
entitled
“Risk
Factors”
in
its
Annual
Report
on
Form
10-K
for
the
fiscal
year
ended
December
31,
2014,
as
such
factors
may
be
updated
from
time
to
time
in
its
periodic
filings
with
the
Securities
and
Exchange
Commission
which
are
accessible
on
the
SEC’s
website
at
www.sec.gov.
These
factors
should
not
be
construed
as
exhaustive
and
should
be
read
in
conjunction
with
the
other
cautionary
statements
that
are
included
in
this
presentation
and
in
the
filings.
Blackstone
Mortgage
Trust
assumes
no
obligation
to
update
or
supplement
forward-looking
statements
that
become untrue because of subsequent events or circumstances. |