Attached files
| file | filename |
|---|---|
| 8-K - 8-K - Roadrunner Transportation Systems, Inc. | rrts-20150210x8kinvestorsp.htm |

20 57 84 17 81 122 189 218 239 20 102 63 211 92 58 111 26 29 2015 Investor Presentation

20 57 84 17 81 122 189 218 239 20 102 63 211 92 58 111 26 29 Certain statements contained in this presentation may be deemed to be "forward-looking statements" under the federal securities laws, and RRTS intends that such forward-looking statements be subject to the safe-harbor created thereby. These forward-looking statements include but are not limited to statements regarding RRTS' growth strategy, strategic plan, long-term goals and objectives, business models, business segments, acquisition strategy, acquired companies, acquisition pipeline, earnings, revenue, operating income and margin growth, avenues for enhancing earnings growth, operating initiatives, business expansion, cross-selling opportunities, service offerings, market opportunity, penetration of customers, industry, sales force, ability to capitalize on capacity constraints, margin expansion, management team, accelerated growth of acquired businesses, run-rate revenue of acquired business, and financial performance. These forward-looking statements are based on RRTS' current expectations and beliefs, as well as a number of assumptions concerning future events. These statements are subject to risks, uncertainties, assumptions and other important factors, many of which are outside of RRTS' control, that could cause actual results to differ materially from those reflected by such forward-looking statements. You are cautioned not to place undue reliance on such forward-looking statements because actual results may vary materially from those expressed or implied. All forward-looking statements are based on information available as of the date of this presentation and RRTS or the presenter of this information assumes no obligation to and expressly disclaims any obligation to, update or revise any forward-looking statements, whether as a result of new information, future events or otherwise. See "Risk Factors" in RRTS' prospectus supplement and RRTS’ other filings with the Securities and Exchange Commission for factors you should consider before buying shares of RRTS' common stock. This presentation contains non-GAAP financial measures. For a reconciliation and more information on these financial measures please see RRTS’ press release filed 2/5/15. 2 2-6-15

20 57 84 17 81 122 189 218 239 20 102 63 211 92 58 111 26 29 3 Since 2010 RRTS has Grown EBITDA at a CAGR of 37% Unparalleled acquisition strategy with a robust pipeline Strong organic growth with multiple avenues for expansion Broad geographic footprint supported by dedicated capacity network Comprehensive service offering with a scalable, variable cost structure Efficient business model generates strong FCF and high ROIC Deep leadership team with the ability to effectively manage substantial growth Leading full- service, asset-light transportation and logistics provider

20 57 84 17 81 122 189 218 239 20 102 63 211 92 58 111 26 29 4 From 2006 to 2014, CAGR in Revenue of 21% and EBITDA of 30% • Extend market share gains through cost-efficient / high-service models ― Pro forma organic growth rate of 11.5% in 2014 • Cross-sell full suite of services to increase customer penetration and enhance profitability • Strategic operational and selling initiatives to drive continuous improvements in operating ratio, maximize returns, and enhance customer value proposition • Utilize robust IT systems and highly capable personnel to optimize capacity networks and provide industry-leading data management for customers • Established reputation as a preferred buyer in a large, fragmented market results in a robust pipeline of opportunities • Continue to seek and acquire well-run, profitable companies with strong cultural fit that: ― Enhance or expand RRTS’ service offerings, solutions and geographic reach ― Provide synergistic benefit through partnership with RRTS Organic Strategies Acquisition Strategies

20 57 84 17 81 122 189 218 239 20 102 63 211 92 58 111 26 29 5 Ultimate International Origin / Destination U.S. Customs and Port Consolidation/ Deconsolidation Ultimate Domestic Origin / Destination or Outbound Location Over 35,000 Domestic Customers Complete Domestic Transportation Capabilities with Dedicated Network of 4,300 Drivers, 240 Locations, and Over 9,000 Third Party Providers 400 International Agents Worldwide State-of-the-Art Data Management Capabilities and Systems FTL / FCL LTL / LCL 20 Customs Brokers and Ability to Service Over 30 U.S. Import / Export Locations Note: LTL = less-than-truckload; LCL = less-than-container load; FTL = full truckload; FCL = full container load. TL, Consolidation & Warehousing Intermodal Dray International Ocean and Air RRTS’ Comprehensive Service Offering is Unique LTL Expedited

20 57 84 17 81 122 189 218 239 20 102 63 211 92 58 111 26 29 6 RRTS’ Differentiated Model Uniquely Positions Carrier Capabilities with Asset-Light Characteristics for High-Quality, Low-Cost Solutions for Customers RRTS Effectively Controls Capacity with Limited Capital Commitment RRTS is the carrier, capacity, and service provider for its transportation services Independent Contractors (ICs) are dedicated to RRTS Dedicated IC model is differentiated from brokers, who procure freight services on a purely transactional basis RRTS’ control of capacity drives margin expansion as industry capacity tightens Carrier vs. Broker Carrier Asset- Light RRTS operates a flexible, asset-light model allowing for a highly scalable cost structure Domestic capacity provided primarily through dedicated ICs and purchased power providers to ensure a balanced network RRTS continues to expand capacity via best-in-class recruiting and retention Enables rapid growth with low capital requirements Asset-Light vs. Asset-Based

20 57 84 17 81 122 189 218 239 20 102 63 211 92 58 111 26 29 7 Note: LTL = less-than-truckload; TL = truckload; 3PL = third-party logistics; and TMS = transportation management solutions. All segment data reflects the exclusion of corporate expenses. (1) Domestic LTL market is estimated to be $50 billion per the American Trucking Associations’ 2013 U.S. Freight Transportation Forecast. TL Logistics • Non-asset, point-to-point LTL model ―Fewer handlings ―Efficient transit times ― Limited investment in equipment and real estate • Low-cost / high-service market position yields competitive advantage • Unique model allows for expansion without traditional inefficiencies • High incremental margins yield strong return on continued LTL market share gains (1) LTL • Comprehensive global supply chain solutions • Full TMS and container management capabilities • Industry-leading IT and data management • Flexible, customizable solutions allow customers to manage freight spend based on their individual needs • Capabilities range from à la carte to complete management of transportation • Integration with broader RRTS network provides affordable access to capacity for all of TMS and allows for optimization of RRTS capacity TMS RRTS’ Capacity-Based, Asset-Light Business Models and Full Service Capabilities Provide Significant Revenue Growth with High Incremental Margins Truckload Services ― Asset-light, capacity-driven network provides customers with flexible, cost efficient solutions ― Reefer, dry and flatbed services Air and Ground Expedite – Spot bid technology uniquely supported by owned/controlled air and ground assets Intermodal Solutions ― Capacity-driven dry and refrigerated services ― Drayage and other short-run offerings Freight Consolidation and Inventory Management ― High-service consolidation and inventory management focused primarily on food products ― Over 2.5 million sq. ft. of warehouse space nationally

20 57 84 17 81 122 189 218 239 20 102 63 211 92 58 111 26 29 8 Note: LTL = less-than-truckload; TL = truckload; 3PL = third-party logistics; and TMS = transportation management solutions. All segment data reflects the exclusion of corporate expenses. (1) Based on 2014 revenue of $1,872.8 million and EBITDA of $120.8 million. Revenue (1) EBITDA (1) TL Logistics LTL TMS TL Logistics 53% LTL 31% TMS 16% TL Logistics 62% LTL 19% TMS 19%

20 57 84 17 81 122 189 218 239 20 102 63 211 92 58 111 26 29 9 • Sales efforts are supported by the Integrated Solutions sales team; designed to drive cross-selling of complete solutions across the enterprise capitalizing on individual cross-selling opportunities Investment in a Sales Force Equipped to Cross-Sell RRTS’ Capabilities Allows RRTS to Provide Each Customer Access to the Full RRTS Service Platform Penetration of Customers Utilizing Multiple Service Offerings Has Grown to 54% (1) and Acceleration Continues (1) Total revenue of customers using multiple services as a percent of total company revenue as of December 31, 2014. Over 35,000 customers and growing Over 100 LTL sales personnel Over 100 TL Logistics sales personnel and dispatchers Over 50 TMS / Global sales personnel

20 57 84 17 81 122 189 218 239 20 102 63 211 92 58 111 26 29 RRTS Continues to Maintain a Robust Pipeline of Proprietary Targets That Want to Join the Broader Platform RRTS Employs Industry-Tested Evaluation, Integration and Optimization Strategies to Mitigate Risk, Ensure Efficient Utilization of Capital and Augment Organic Growth 10 • Strong cultural fit with and expansion of management team • Complementary expansion of service offerings and geographic reach • Immediately accretive to earnings and shareholder value • Expands access to dedicated capacity base and service capabilities • Actionable opportunities for synergies, including: ― Accelerated growth and cost-efficient expansion through access to RRTS network and infrastructure ― Cross-selling opportunities across the platform ― Enhanced operational efficiencies through integration and optimization across the broader network ― Improvements in both market position and value provided to customers RRTS has successfully acquired and integrated 33 companies since 2005 and 25 since IPO in 2010 Corporate structure designed to accommodate multiple acquisitions simultaneously Strong reputation within the marketplace yields substantial proprietary opportunities RRTS Acquisition Target Criteria Since IPO in May of 2010 RRTS Has Successfully Acquired and Integrated 23 Companies Acquired Price Rev EV / EBITDA Segment Aug-10 Central Minnesota Logistics $1.0 $10.0 TL Feb-11 Morgan Southern 20.0 57.0 5.0x TL May-11 Bruenger Trucking Co. 106.0 23.0 3.0x TL Aug-11 The James Brooks Company 7.5 12.0 5.0x TL Aug-11 Prime Logistics Corporation 97.5 80.0 7.0x TL Feb-12 Capital Transportation Logistics 6.3 6.0 3-4x TMS Apr-12 D&E Transport 11.2 24.0 3-5x TL Jun-12 CTW Transport 7.5 15.0 3-5x TL Aug-12 R&M Trans/Sortino Trans 24.4 65.0 5.0x TL Aug-12 Expedited Freight Systems 10.0 19.0 5.0x LTL Nov-12 Central Cal Transportation 4.0 19.0 4.0x TL Nov-12 A&A Express 24.0 39.0 4.0x TL Dec-12 Direct Connection Transportation 1.3 8.0 TL Apr-13 Adrian Carriers, Inc. 14.3 32.5 TMS Apr-13 Wando Trucking, Inc. 9.0 13.0 TL Jul-13 Marisol International LLC 65.9 95.0 TMS Aug-13 TA Drayage 1.2 20.0 TL Sep-13 G.W. Palmer Logistics, LLC 2.5 20.0 TL Sep-13 Yes Trans, Inc. 1.2 5.0 TL Feb-14 Rich Logistics 47.3 TL Mar-14 Unitrans International 55.5 TMS Jul-14 ISI Acquisition Corp 13.0 TL Aug-14 Active Aero 118.3 TL

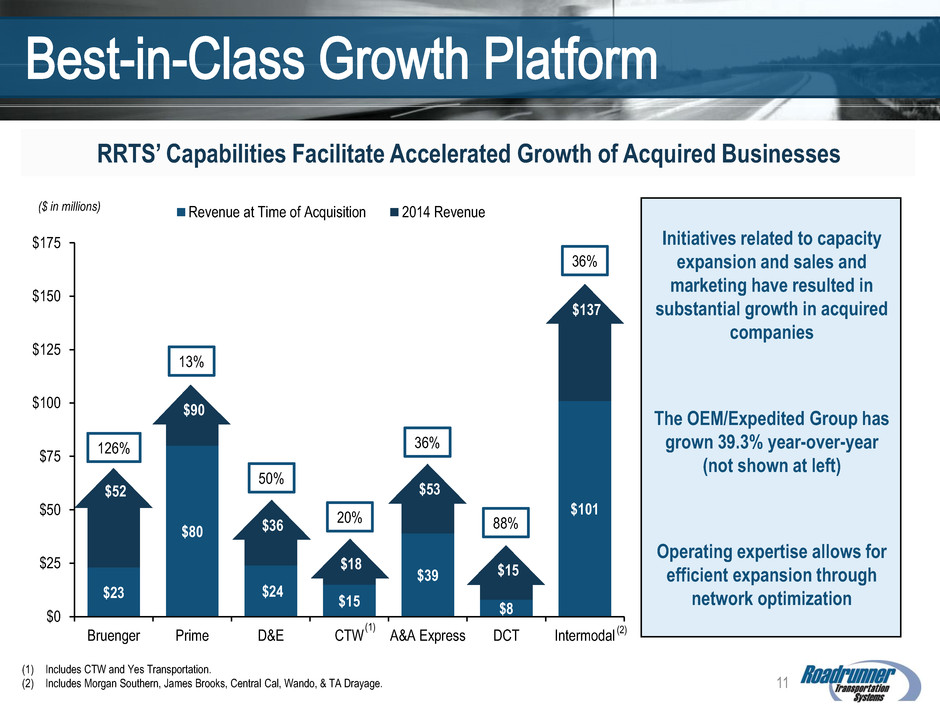
20 57 84 17 81 122 189 218 239 20 102 63 211 92 58 111 26 29 20% 88% 36% 50% 126% 13% 36% Initiatives related to capacity expansion and sales and marketing have resulted in substantial growth in acquired companies The OEM/Expedited Group has grown 39.3% year-over-year (not shown at left) Operating expertise allows for efficient expansion through network optimization 11 RRTS’ Capabilities Facilitate Accelerated Growth of Acquired Businesses ($ in millions) (2) (1) (1) Includes CTW and Yes Transportation. (2) Includes Morgan Southern, James Brooks, Central Cal, Wando, & TA Drayage. $23 $80 $24 $15 $39 $8 $101 $52 $90 $36 $18 $53 $15 $137 $0 $25 $50 $75 $100 $125 $150 $175 Bruenger Prime D&E CTW A&A Express DCT Intermodal Revenue at Time of Acquisition 2014 Revenue

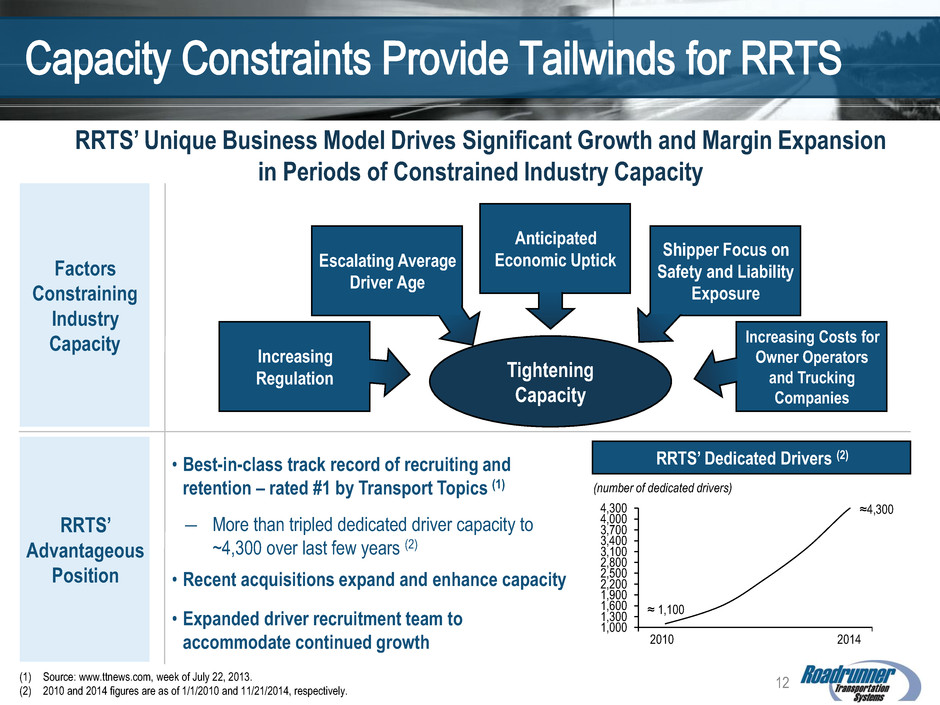
20 57 84 17 81 122 189 218 239 20 102 63 211 92 58 111 26 29 [Discuss Inclusion] 12 Average Driver Age Shipper Focus on Safety and Liability Exposure RRTS’ Unique Business Model Drives Significant Growth and Margin Expansion in Periods of Constrained Industry Capacity • Best-in-class track record of recruiting and retention – rated #1 by Transport Topics (1) ― More than tripled dedicated driver capacity to ~4,300 over last few years (2) • Recent acquisitions expand and enhance capacity • Expanded driver recruitment team to accommodate continued growth RRTS’ Dedicated Drivers (2) 1,000 1,300 1,600 1,900 2,200 2,500 2,800 3,100 3,400 3,700 4,000 4,300 2010 2014 ≈4,300 ≈ 1,100 (number of dedicated drivers) Factors Constraining Industry Capacity RRTS’ Advantageous Position (1) Source: www.ttnews.com, week of July 22, 2013. (2) 2010 and 2014 figures are as of 1/1/2010 and 11/21/2014, respectively. Tightening Capacity Increasing Regulation Anticipated Economic Uptick Increasing Costs for Owner Operators and Trucking Companies Escalating Average Driver Age Shipper Focus on Safety and Liability Exposure

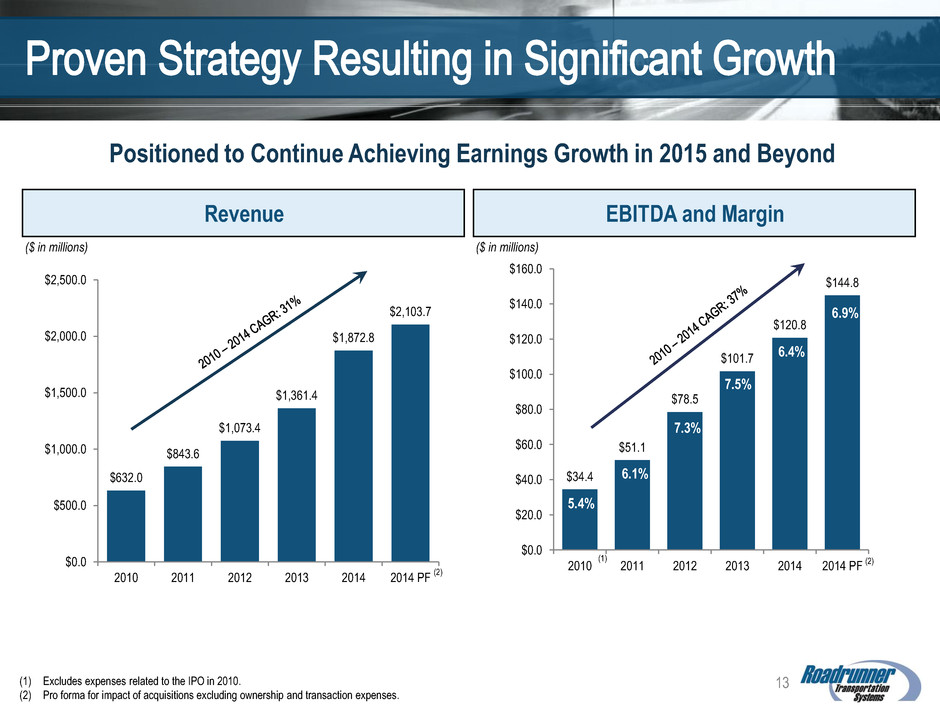
20 57 84 17 81 122 189 218 239 20 102 63 211 92 58 111 26 29 $34.4 $51.1 $78.5 $101.7 $120.8 $144.8 $0.0 $20.0 $40.0 $60.0 $80.0 $100.0 $120.0 $140.0 $160.0 2010 2011 2012 2013 2014 2014 PF $632.0 $843.6 $1,073.4 $1,361.4 $1,872.8 $2,103.7 $0.0 $500.0 $1,000.0 $1,500.0 $2,000.0 $2,500.0 2010 2011 2012 2013 2014 2014 PF 13 (1) Excludes expenses related to the IPO in 2010. (2) Pro forma for impact of acquisitions excluding ownership and transaction expenses. Positioned to Continue Achieving Earnings Growth in 2015 and Beyond EBITDA and Margin ($ in millions) Revenue ($ in millions) (1) 5.4% 6.1% 7.3% 7.5% 6.4% 6.9% (2) (2)

20 57 84 17 81 122 189 218 239 20 102 63 211 92 58 111 26 29 14 RRTS is Well Capitalized with Sufficient Capacity to Fund Near and Medium-Term Growth Initiatives Balance Sheet Strength and Free Cash Flow Characteristics Provide Flexibility to Pursue Organic Growth Initiatives and Strategic Acquisitions Capitalization ($ in millions) December 31, 2014 Net Debt (Credit Facility Less Cash) $418.7 Total Stockholders' Investment 558.8 Total Capitalization $977.4 Net Debt / Capitalization 42.8% • Business model results in substantial free cash generation and high FCF yield • Increased credit facility in July and now have a $350 million revolver to provide additional capital for acquisitions and working capital needs

20 57 84 17 81 122 189 218 239 20 102 63 211 92 58 111 26 29 RRTS’ Leadership Team is Well Equipped to Manage Substantial Growth Throughout Each Segment • Entrepreneurial culture and team with well-established track record • Proven ability to identify and assimilate strategic acquisitions, efficiently manage significant growth, and effectively control costs throughout economic cycles 15 Deep Team with Relevant Industry Experience, Strong Internal Support and Talent Years Experience Name Position Company Industry Mark DiBlasi President and Chief Executive Officer 9 36 Peter Armbruster Chief Financial Officer 25 25 Brian van Helden Chief Operating Officer 8 25 Pat McKay President Truckload Services 4 29 Kevin Charlebois President, Freight Consolidation and Inventory Management 4 27 Grant Crawford President, Less -than-Truckload 2 24 Mark Peterson Executive Vice President Sales 2 30 Tyler Tattum Vice President, Truckload Services 3 24 Ben Kirkland President, Morgan Southern 19 38 Cliff Cordes Vice President Pricing and Yield Management 2 34 Michael Humm Vice President Safety and Compliance 2 28 Bob Milane Vice President Risk Management 2 31

20 57 84 17 81 122 189 218 239 20 102 63 211 92 58 111 26 29 • Expand geographic reach ― Fragmented TL markets • Enhance value proposition for customers ― RRTS has complete TMS, TL and LTL capabilities • Add complementary services ― Enhance offering and value provided to customers • Penetrate existing customers across the platform seeking to efficiently outsource their international and domestic transportation needs • Evaluate strategic acquisitions within fragmented market to expand geographic reach • Continue to expand technological capabilities to maximize value to and retention of our customers From 2005 to date, RRTS has grown from a $150 million, single- service provider to an $844 million, full- service transportation provider Over the next 5 years, our goal is to grow the company into a multi- billion transportation company providing industry leading service with a highly attractive financial profile 2016 RRTS’ Objective is to Become a Multi-billion Dollar Transportation Solutions Provider With: • Full scope of services with a dedicated capacity network • Fully integrated, cost-efficient solutions for our customers • Market-leading growth and financial performance RRTS is a Rapidly Expanding, Comprehensive Transportation Solutions Provider with a Clear Strategy for Continued, Sustainable Growth TMS Strategy TL Logistics Strategy LTL Strategy • Further extend market share ― Leverage low-cost / high-service position • Expand into new markets ― Non-asset model allows for efficient expansion • Continued focus on strategic selling and operating initiatives ― Enhancing growth and maintaining strong incremental margins 16
