Attached files
| file | filename |
|---|---|
| EX-1.1 - EX-1.1 - TERMINIX GLOBAL HOLDINGS INC | a2222833zex-1_1.htm |
| EX-5.1 - EX-5.1 - TERMINIX GLOBAL HOLDINGS INC | a2222833zex-5_1.htm |
| EX-23.1 - EX-23.1 - TERMINIX GLOBAL HOLDINGS INC | a2222833zex-23_1.htm |
Use these links to rapidly review the document
TABLE OF CONTENTS
INDEX TO FINANCIAL STATEMENTS
As filed with the Securities and Exchange Commission on February 3, 2015
Registration No. 333-201640
UNITED STATES
SECURITIES AND EXCHANGE COMMISSION
Washington, D.C. 20549
Amendment No. 1
to
FORM S-1
REGISTRATION STATEMENT
UNDER THE
SECURITIES ACT OF 1933
ServiceMaster Global Holdings, Inc.
(Exact name of registrant as specified in its charter)
| Delaware (State or other jurisdiction of incorporation or organization) |
8741 (Primary Standard Industrial Classification Code Number) |
20-8738320 (I.R.S. Employer Identification Number) |
860 Ridge Lake Boulevard
Memphis, Tennessee 38120
(901) 597-1400
(Address, including zip code, and telephone number, including
area code, of registrant's principal executive offices)
James T. Lucke, Esq.
Senior Vice President and General Counsel
ServiceMaster Global Holdings, Inc.
860 Ridge Lake Boulevard
Memphis, Tennessee 38120
(901) 597-1400
(Name, address, including zip code, and telephone number,
including area code, of agent for service)
| with copies to: | ||
Peter J. Loughran, Esq. Debevoise & Plimpton LLP 919 Third Avenue New York, NY 10022 (212) 909-6000 |
John C. Ericson, Esq. Simpson Thacher & Bartlett LLP 425 Lexington Avenue New York, NY 10017 (212) 455-2000 |
|
Approximate date of commencement of proposed sale of the securities to the public:
As soon as practicable after this registration statement becomes effective.
If any of the securities being registered on this Form are to be offered on a delayed or continuous basis pursuant to Rule 415 under the Securities Act of 1933, check the following box: o
If this Form is filed to register additional securities for an offering pursuant to Rule 462(b) under the Securities Act, please check the following box and list the Securities Act registration statement number of the earlier effective registration statement for the same offering: o
If this Form is a post-effective amendment filed pursuant to Rule 462(c) under the Securities Act, check the following box and list the Securities Act registration statement number of the earlier effective registration statement for the same offering. o
If this Form is a post-effective amendment filed pursuant to Rule 462(d) under the Securities Act, check the following box and list the Securities Act registration statement number of the earlier effective registration statement for the same offering. o
Indicate by check mark whether the registrant is a large accelerated filer, an accelerated filer, a non-accelerated filer, or a smaller reporting company. See the definitions of "large accelerated filer," "accelerated filer" and "smaller reporting company" in Rule 12b-2 of the Exchange Act.
| Large accelerated filer o | Accelerated filer o | Non-accelerated filer ý (Do not check if a smaller reporting company) |
Smaller reporting company o |
CALCULATION OF REGISTRATION FEE
|
||||||||
| Title of Each Class of Securities to be Registered |
Amount to be Registered(1) |
Proposed Maximum Aggregate Offering Price Per Share(1)(2) |
Proposed Maximum Aggregate Offering Price(1)(2) |
Amount of Registration Fee(3) |
||||
|---|---|---|---|---|---|---|---|---|
Common stock, $0.01 par value per share |
28,750,000 | $27.79 | $798,962,500 | $92,840 | ||||
|
||||||||
- (1)
- Includes
shares/offering price of shares that may be sold upon exercise of the underwriters' option to purchase additional shares.
- (2)
- This
amount represents the proposed maximum aggregate offering price of the securities registered hereunder. These figures are estimated solely for the
purpose of calculating the amount of the registration fee pursuant to Rule 457(o) under the Securities Act of 1933. The price shown is the average of the high and low sales price for the
registrant's common stock on January 20, 2015 as reported on the New York Stock Exchange.
- (3)
- Previously paid.
The registrant hereby amends this registration statement on such date or dates as may be necessary to delay its effective date until the registrant shall file a further amendment which specifically states that this registration statement shall thereafter become effective in accordance with Section 8(a) of the Securities Act of 1933 or until this registration statement shall become effective on such date as the Securities and Exchange Commission, acting pursuant to said Section 8(a), may determine.
The information in this prospectus is not complete and may be changed. The selling stockholders may not sell these securities until the registration statement filed with the Securities and Exchange Commission is effective. This prospectus is not an offer to sell these securities and neither we nor the selling stockholders are soliciting offers to buy these securities in any state where the offer or sale is not permitted.
SUBJECT TO COMPLETION, DATED FEBRUARY 3, 2015
25,000,000 Shares
![]()
ServiceMaster Global Holdings, Inc.
Common Stock
All of the 25,000,000 shares of ServiceMaster Global Holdings, Inc. common stock are being sold by the selling stockholders identified in this prospectus. ServiceMaster Global Holdings, Inc. will not receive any of the proceeds from the sale of the shares being sold by the selling stockholders.
The common stock of ServiceMaster Global Holdings, Inc. is listed on the New York Stock Exchange under the symbol SERV. The last reported sale price of the common stock on February 2, 2015 was $28.20 per share.
Investing in our common stock involves risks. See "Risk Factors" beginning on page 23 of this prospectus.
|
||||
| |
Per Share |
Total |
||
|---|---|---|---|---|
Public offering price |
$ | $ | ||
Underwriting discounts and commissions(1) |
$ | $ | ||
Proceeds, before expenses, to the selling stockholders |
$ | $ | ||
|
||||
- (1)
- We have agreed to reimburse the underwriters for certain FINRA-related expenses. The underwriters have agreed to reimburse us in an amount of $400,000 for certain expenses of the offering. See "Underwriting (Conflicts of Interest)."
To the extent the underwriters sell more than 25,000,000 shares of common stock, the underwriters have the option to purchase up to an additional 3,750,000 shares of common stock from the selling stockholders at the offering price less the underwriting discount. ServiceMaster Global holdings, Inc. will not receive any of the proceeds from the shares of common stock sold by the selling stockholders pursuant to any exercise of the underwriters' option to purchase additional shares.
Neither the Securities and Exchange Commission nor any state securities commission has approved or disapproved of these securities or passed upon the adequacy or accuracy of this prospectus. Any representation to the contrary is a criminal offense.
The underwriters expect to deliver the shares to purchasers on or about , 2015.
Joint Book-Running Managers
| J.P. Morgan | Credit Suisse | Goldman, Sachs & Co. | Morgan Stanley |
| BofA Merrill Lynch | Jefferies | Natixis | RBC Capital Markets |
| Baird | Piper Jaffray | Ramirez & Co., Inc. |
Prospectus dated , 2015
Neither we, the selling stockholders nor the underwriters have authorized anyone to provide any information or to make any representations other than those contained in this prospectus or in any free writing prospectus we have prepared. Neither we, the selling stockholders nor the underwriters take responsibility for, nor can provide any assurance as to the reliability of, any other information that others may give you. This prospectus is an offer to sell only the shares offered hereby, but only under circumstances and in jurisdictions where it is lawful to do so. The information contained in this prospectus is current only as of its date.
i
The following summary highlights information contained elsewhere in this prospectus and does not contain all of the information that you should consider before investing in our common stock. You should read this entire prospectus, including the sections entitled "Risk Factors" and "Management's Discussion and Analysis of Financial Condition and Results of Operations" and our consolidated financial statements and the related notes to those statements, before making an investment decision.
Unless the context otherwise requires, the terms "we," "our," "us" and "ServiceMaster," as used in this prospectus, refer to ServiceMaster Global Holdings, Inc. and its consolidated subsidiaries. The term "SvM" refers to The ServiceMaster Company, LLC, our indirect wholly-owned subsidiary.
All operating and statistical data in this prospectus give effect to the TruGreen Spin-off (as defined below), unless the context otherwise requires.
Our Company
ServiceMaster is a leading provider of essential residential and commercial services, operating through an extensive service network of more than 7,000 company-owned, franchised and licensed locations. Our mission is to simplify and improve the quality of our customers' lives by delivering services that help them protect and maintain their homes or businesses, typically their most highly valued assets. We have leading market positions across the majority of the markets we serve, as measured by customer-level revenue. Our portfolio of well-recognized brands includes Terminix (termite and pest control), American Home Shield (home warranties), ServiceMaster Restore (disaster restoration), ServiceMaster Clean (janitorial), Merry Maids (residential cleaning), Furniture Medic (furniture repair) and AmeriSpec (home inspections). We serve approximately five million residential and commercial customers through an employee base of approximately 13,000 company associates and a franchise network that independently employs an estimated 33,000 additional people.
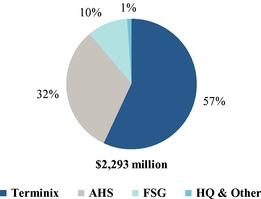
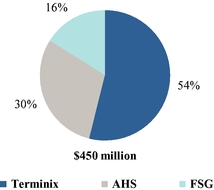
For the year ended December 31, 2013, we had revenue, Adjusted EBITDA and income from continuing operations of $2,293 million, $450 million and $42 million, respectively. For the nine months ended September 30, 2014, we had revenue, Adjusted EBITDA and income from continuing operations of $1,880 million, $443 million and $22 million, respectively. Terminix, our largest segment, represented approximately 57% and 56% of our revenue in 2013 and the nine months ended September 30, 2014, respectively. For a reconciliation of Adjusted EBITDA to net income, see "—Summary Historical Consolidated Financial and Other Operating Data."
We believe that our customers understand the financial and reputational risks associated with inadequate maintenance of their homes or businesses and that our high-quality, professional services are low-cost expenditures when compared to the alternative of failing to perform essential maintenance. We strive to be the service provider of choice and believe our customers have recognized our value proposition, as evidenced by our long-standing customer relationships and the high rate at which our customers renew their contracts from year to year. As of December 31, 2013 and September 30 2014, our Terminix termite customer retention rate was 85% and 85%, respectively, our Terminix pest control customer retention rate was 79% and 80%, respectively, and our American Home Shield segment customer retention rate was 74% and 75%, respectively.
1
We have significant size and scale, which we believe give us a number of competitive advantages. Terminix is the largest termite and pest control business in the United States, as measured by customer-level revenue, and serves approximately 2.8 million customers across 47 states and the District of Columbia through approximately 285 company-owned and 100 franchised locations. Additionally, we estimate American Home Shield to be approximately four to five times larger than its nearest competitors, as measured by revenue. American Home Shield serves approximately 1.5 million residential customers across all 50 states and the District of Columbia through a network of approximately 11,000 pre-screened independent home service contractor firms. Our Franchise Services Group serves both residential and commercial customers across all 50 states and the District of Columbia through approximately 4,000 franchised and 70 company-owned locations. We believe our significant size and scale provide a competitive advantage in our purchasing power, route density, and marketing and operating efficiencies compared to smaller local and regional competitors. Our scale also facilitates the standardization of processes, shared learning and talent development across our entire organization.
We believe our businesses are strategically positioned to benefit from a number of favorable demographic and secular trends. These trends include growth in population, household formation and new and existing home sales. In addition, we believe there is increasing demand for outsourced services, fueled by a trend toward "do-it-for-me" as a result of an aging population and shifts in household structure and behaviors, such as dual-income families and consumers with "on-the-go" lifestyles.
The outsourced market for residential and commercial termite and pest control services in the United States was approximately $7 billion in 2013, according to Specialty Products Consultants, LLC. We estimate that there are approximately 20,000 U.S. termite and pest control companies, nearly all of which have fewer than 100 employees. We believe this represents an opportunity for large, scaled players, such as Terminix, to act as consolidators in the industry. We believe our Terminix business stands to benefit from a number of positive industry drivers, including increasing government and consumer focus on health and safety in both the home and the workplace.
We estimate that the U.S. home warranty market had total revenue of approximately $2 billion in 2014. The home warranty market is characterized by low household penetration, which we estimate to be approximately 3-4%. We believe there is an opportunity for a reliable, scaled service provider with a national, pre-screened contractor network, such as American Home Shield, to increase market share and household penetration. Additionally, we believe that increasingly complex household systems and appliances may further highlight the value proposition of professional repair services, and accordingly, the coverage offered by a home warranty.
We believe that the businesses in our Franchise Services Group hold leading market positions in large and fragmented markets and that our scale and national presence create competitive advantages for us and our franchisees in these markets.
Our Reportable Segments
Our operations are organized into three reportable segments: Terminix, American Home Shield and the Franchise Services Group (which includes ServiceMaster Restore, ServiceMaster Clean, Merry Maids, Furniture Medic and AmeriSpec). The following charts show the percentage of our consolidated
2
revenue and Adjusted EBITDA for each of our reportable segments as well as for Other Operations and Headquarters for the year ended December 31, 2013:
| Revenue | Adjusted EBITDA | |
|
|
Note: Percentages exclude Other Operations and Headquarters
Terminix Segment Overview
Terminix is the leading provider of termite and pest control services in the United States, with a market share of approximately 20% for 2013, as measured by customer-level revenue. In addition, Terminix is the most recognized brand in the industry with approximately 1.5x the unaided brand awareness of our next-largest competitor, based on a study by Decision Analyst, Inc. periodically commissioned by us as part of our ongoing marketing efforts. Terminix specializes in protection against termite damage, rodents, insects and other pests, including cockroaches, spiders, wood-destroying ants, ticks, fleas and bed bugs. Our services include termite remediation, annual termite inspection and prevention treatments with damage claim guarantees, periodic pest control services and insulation services. Our recent new product introductions include mosquito control, crawlspace encapsulation and wildlife exclusion.
For the year ended December 31, 2013 and the nine months ended September 30, 2014, 56% and 54%, respectively, of our Terminix revenue was generated from pest control services, which includes mosquito control, and 39% and 41%, respectively, was generated from termite control services, which includes crawlspace encapsulation, wildlife exclusion and insulation services, with the remaining 5% in each period from distribution of pest control products. A significant portion of our Terminix revenue base is recurring, with 72% of 2013 revenue derived from services delivered through annual contracts. Additionally, as of December 31, 2013 and September 30, 2014, the retention rate for termite customers with annual contracts was 85% and 85%, respectively, and the retention rate for pest control customers with annual contracts was 79% and 80%, respectively.
We believe that the strength of the Terminix brand, along with our history of providing a high level of consistent service, allows us to enjoy a competitive advantage in attracting, retaining and growing our customer base. We believe our investments in systems and processes, such as routing and scheduling optimization, robust reporting capabilities and mobile customer management solutions, enable us to deliver a higher level of customer service when compared to smaller regional and local competitors.
Our focus on attracting and retaining customers begins with our associates in the field, who interact with our customers every day. Our associates bring a strong level of passion and commitment to the Terminix brand, as evidenced by the 11-year and 7-year average tenure of our branch managers and technicians, respectively. Our field organization is supported by dedicated customer service and call center personnel. Our culture of continuous improvement drives an intense focus on the quality of the services delivered, which we believe produces high levels of customer satisfaction and, ultimately, customer retention and referrals.
3
The Terminix national branch structure includes approximately 285 company-owned and 100 franchised locations, which serve approximately 2.8 million customers in 47 states and the District of Columbia. In 2013 and the nine months ended September 30, 2014, substantially all of Terminix revenue was generated in the United States, with less than 1% and approximately 1%, respectively, derived from international markets through subsidiaries, a joint venture and licensing arrangements. Franchise fees from Terminix franchisees represented less than 1% of Terminix revenue in 2013 and the nine months ended September 30, 2014.
For the year ended December 31, 2013 and the nine months ended September 30, 2014, Terminix recorded revenue of $1,309 million and $1,049 million, respectively, and Adjusted EBITDA of $266 million and $248 million, respectively.
- •
- #1 market position and #1 recognized brand in U.S. termite and pest control services
- •
- Track record of high customer retention rates
- •
- Passionate and committed associates focused on delivering superior customer service
- •
- Expansive scale and deep market presence across a national footprint
- •
- Effective multi-channel customer acquisition strategy
- •
- History of innovation leadership and introducing new products and services
Terminix Competitive Strengths
American Home Shield Segment Overview
American Home Shield founded the home warranty industry in 1971 and remains the leading provider of home warranty plans for household systems and appliances in the United States, with approximately 42% market share, as measured by revenue. We estimate American Home Shield to be approximately four to five times larger than its nearest competitors, as measured by revenue. We believe that, as the market leader, American Home Shield can drive increasing use of home warranties given the low industry household penetration of approximately 3-4%.
American Home Shield provides home warranty plans that cover the repair or replacement of up to 21 major household systems and appliances, including electrical, plumbing, central heating and air conditioning (HVAC) systems, water heaters, refrigerators, dishwashers and ovens/cook tops. Our warranty plans are generally structured as one-year contracts with annual renewal options and, as a result, a significant portion of our revenue base in this segment is recurring. As of December 31, 2013 and September 30, 2014, our retention rate was 74% and 75%, respectively. Of the home warranties written by American Home Shield in 2013 and the nine months ended September 30, 2014, 69% and 67%, respectively, were derived from existing contract renewals, while 18% and 20%, respectively, were derived from sales made in conjunction with existing home resale transactions and 13% and 13%, respectively, were derived from direct-to-consumer sales.
We believe that we have one of the largest contractor networks in the United States, comprised of approximately 11,000 independent home service contractor firms. We carefully screen our contractors and closely monitor their performance based on a number of criteria, including through feedback from customer satisfaction surveys. On an annual basis, our contractors respond to nearly three million service requests from approximately 1.5 million customers across all 50 states and the District of Columbia. Additionally, American Home Shield operates and takes service calls 24 hours a day, seven days a week. Furthermore, as a result of our large contractor network and sophisticated IT systems, approximately 90% of the time we successfully assign contractors to a job within 15 minutes or less.
4
For the year ended December 31, 2013 and the nine months ended September 30, 2014, American Home Shield recorded revenue of $740 million and $637 million, respectively, and Adjusted EBITDA of $145 million and $144 million, respectively.
American Home Shield Competitive Strengths
- •
- #1 market position in the industry with 42% market share, estimated to be four to five times the size of the next largest competitors
- •
- Track record of high customer retention rates
- •
- Large and pre-qualified national contractor network
- •
- Strong partnerships with leading national residential real estate firms
- •
- Core competency around direct-to-consumer marketing and lead generation
Franchise Services Group Segment Overview
ServiceMaster's Franchise Services Group consists of the ServiceMaster Restore (disaster restoration), ServiceMaster Clean (janitorial), Merry Maids (residential cleaning), Furniture Medic (furniture repair) and AmeriSpec (home inspection) businesses. Our businesses in this segment operate principally through franchisees. In 2014 we began converting company-owned Merry Maids locations to franchises. Approximately half of our revenue in this segment consists of ongoing monthly royalty fees based upon a percentage of our franchisees' customer-level revenue. We believe that each business holds a leading market position in its respective category and that our scale and national presence create competitive advantages for us in attracting and retaining franchisees. We are able to invest in best-in-class systems, training and process development, provide multiple levels of marketing support and direct new business leads to our franchisees through our relationships with major insurance carriers and national account customers. The depth of our franchisee support is evidenced by the long average tenure of our franchisees, many of whom have partnered with ServiceMaster for over 25 years.
For the year ended December 31, 2013 and the nine months ended September 30, 2014, the Franchise Services Group recorded revenue of $236 million and $189 million, respectively, and Adjusted EBITDA of $78 million and $58 million, respectively.
Franchise Services Group Competitive Strengths
- •
- Strong and trusted brands with leading market positions in their respective categories
- •
- Attractive value proposition to franchisees
- •
- Exceptional focus on customer service evidenced by strong net promoter scores, or "NPS"
- •
- Infrastructure and scale supporting our ability to service national accounts
- •
- National network and 24/7/365 service availability supports mission-critical nature of the ServiceMaster Restore business
- •
- Long-standing and strong relationships with the majority of the top 20 insurance carriers
Our Market Opportunity
Overview of Termite and Pest Control Industry
The outsourced market for residential and commercial termite and pest control services in the United States was approximately $7 billion in 2013, according to Specialty Products Consultants, LLC. We estimate that there are approximately 20,000 U.S. termite and pest control companies, nearly all of which have fewer than 100 employees.
5
Termites are responsible for an estimated $5 billion in home damage in the United States annually, according to the National Pest Management Association's 2012 survey. The termite control industry provides treatment and inspection services to residential and commercial property owners for the remediation and prevention of termite infestations. We believe homeowners value quality and reliability over price in choosing professional termite control services, as the cost of most professional treatments is well below the potential cost of inaction or ineffective treatment. As a result, we believe the demand for termite remediation services is relatively insulated from changes in consumer spending. In addition to remediation services, the termite control industry offers periodic termite inspections and preventative treatments to residential and commercial property owners in areas with high termite activity, typically through annual contracts. These annual contracts may carry guarantees that protect the property owner against the cost of structural damage caused by a termite infestation. Termites can cause significant damage to a structure before becoming visible to the untrained eye, highlighting the value proposition of professional preventative termite services. As a result, the termite control industry experiences high renewal rates on annual preventative inspection and treatment contracts, and revenues from such contracts are generally stable and recurring.
Pest infestations may damage a home or business while also carrying the risk of the spread of diseases. Moreover, for many commercial facilities, pest control is essential to regular operations and regulatory compliance (e.g., hotels, restaurants and healthcare facilities). As a result of these dynamics, the pest control industry experiences high rates of renewal for its pest inspection and treatment contracts. Pest control services are often delivered on a contracted basis through regularly scheduled service visits, which include an inspection of premises and application of pest control materials. According to the National Pest Management Association's 2014 survey, approximately 35% of U.S. households currently use a professional pest exterminator.
Both termite and pest activity are affected by weather. Termite activity peaks during the springtime "swarm," the timing and intensity of which varies based on weather. Similarly, pest activity tends to accelerate in the spring months when warmer temperatures arrive in many U.S. regions. However, the high proportion of termite and pest control services which are contracted and recurring, as well as the high renewal rates for those services, limit the effect of weather anomalies on the termite and pest control industry in any given year.
Overview of Home Warranty Industry
We estimate that the U.S. home warranty market had total revenue of approximately $1.8 billion in 2013. The home warranty market is characterized by low household penetration, which we estimate to be approximately 3-4%. The home warranty industry offers plans that protect a homeowner against costly repairs or replacement of household systems and appliances. Typically having a one-year term, coverage varies based on a menu of plan options. The most commonly covered items include electrical, plumbing, central heating and air conditioning (HVAC) systems, water heaters, refrigerators, dishwashers and ovens/cook tops. The home warranty industry is characterized by a high level of customer interaction and service requirements. This combination of a high-touch/high-service business model and the peace of mind it delivers to the customer has led to high renewal rates in the home warranty industry.
As consumer demand shifts towards more outsourced services, we believe that there is an opportunity for American Home Shield, a reliable, scaled service provider with a national, pre-screened contractor network, to increase market share and household penetration. Additionally, we believe that increasingly complex household systems and appliances may further highlight the value proposition of professional repair services and, accordingly, the coverage offered by a home warranty.
6
One of the drivers of sales of new home warranties is the number of existing homes sold in the United States, since a home warranty is often recommended by a real estate sales professional or offered by the seller of a home in conjunction with a real estate resale transaction. According to the National Association of Realtors, existing home resales, as measured in units, increased by approximately 9% in 2013. Approximately 18% of the revenue of American Home Shield for the year ended December 31, 2013 was tied directly to existing home resale transactions.
Overview of Key Franchise Services Group Industries
Disaster Restoration (ServiceMaster Restore). We estimate that the U.S. disaster restoration market is approximately $39 billion, approximately two-thirds of which is related to residential customers and the remainder related to commercial customers. Most emergency response work results from emergency situations for residential and commercial customers, such as fires and flooding. Extreme weather events and natural disasters also provide demand for emergency response work. Critical factors in the selection of an emergency response firm are the firm's reputation, relationships with insurers, available resources, proper insurance and credentials, quality of service, timeliness and responsiveness. This market is highly fragmented, with two large players, including ServiceMaster Restore, and we believe there are opportunities for growth for scaled service providers.
Janitorial (ServiceMaster Clean). We estimate that the U.S. janitorial services market was approximately $50 billion in 2013. The market is highly fragmented with more than 800,000 companies competing in the janitorial space, a significant majority of which have five or fewer employees.
Residential Cleaning (Merry Maids). We estimate that the U.S. residential professional cleaning services market was approximately $3.7 billion in 2013. Competition in this market comes mainly from local, independently owned firms, and from a few national companies.
Our Competitive Strengths
#1 Market Positions in Large, Fragmented and Growing Markets. We are the leading provider of essential residential and commercial services in the majority of markets in which we operate. Our markets are generally large, growing and highly fragmented, and we believe we have significant advantages over smaller local and regional competitors. We have spent decades developing a reputation built on reliability and superior quality and service. As a result, we enjoy high unaided brand awareness and a reputation for high-quality customer service, which serve as key drivers of our customer acquisition efforts. Our nationwide presence also allows our brands to effectively serve both local residential customers and large national commercial accounts and to capitalize on lead generation sources that include large real estate agencies, financial institutions and insurance carriers. We believe our significant size and scale also provide a competitive advantage in our purchasing power, route density, and marketing and operating efficiencies compared to smaller local and regional competitors. Our scale also facilitates the standardization of processes, shared learning and talent development across our entire organization.
Diverse Revenue Streams Across Customers and Geographies. ServiceMaster is diversified in terms of customers and geographies, and our businesses served approximately five million customers in the past 12 months. We operate in all 50 states and the District of Columbia. Our Terminix business, which accounted for 57% of our revenue in 2013, served approximately 2.8 million customers across a branch network of approximately 285 company-owned and 100 franchised locations. American Home Shield, which accounted for 32% of our revenue in 2013, responded to nearly three million service requests from approximately 1.4 million customers. Our diverse customer base and geographies help to mitigate the effect of adverse market conditions and other risks in any particular geography or customer segment we serve. We therefore believe that the size and scale of our company provide us with added protection from risk relative to our smaller local and regional competitors.
7
High-Value Service Offerings Resulting in High Retention and Recurring Revenues. We believe our high annual customer retention demonstrates the highly valued nature of the services we offer and the high level of execution and customer service that we provide. As of December 31, 2013 and September 30, 2014, our Terminix termite customer retention rate was 85% and 85%, respectively, our Terminix pest control customer retention rate was 79% and 80%, respectively, and our American Home Shield segment customer retention rate was 74% and 75%, respectively. Many of our technicians have built long-standing, personal relationships with their customers. We believe these personal bonds, often forged over decades, help to drive customer loyalty and retention. As a result of our strong retention rates and long-standing customer relationships, we enjoy significant visibility and stability in our business, and these factors limit the effect of adverse economic cycles on our revenue base. We experienced these advantages during the most recent downturn, when we were able to grow revenue in each year from 2008 to 2013.
Multi-Channel Marketing Approach Supported by Sophisticated Customer Analytic Modeling Capabilities. Our multi-channel marketing approach focuses on building the value of our brands and generating revenue by understanding the decisions customers make at each stage in the purchase of residential and commercial services. The effectiveness of our marketing efforts is demonstrated by an increase in lead generation and online sales, as well as an improvement in close rates over the last few years. For example, in our direct-to-consumer channel at American Home Shield, new home warranty lead generation, marketing yield and close rates have benefited from increased spending on marketing as well as improved digital marketing. We have also been deploying increasingly sophisticated customer analytics models that allow us to more effectively segment our prospective customers and tailor campaigns towards them. In addition, we are seeing success with newer ways of reaching and marketing to consumers via content marketing, promotions and social media channels.
Operational and Customer Service Excellence Driven by Superior People Development. We are constantly focused on improving customer service. The customer experience is at the foundation of our business model, and we believe that each employee is an extension of ServiceMaster's reputation. We employ rigorous hiring and training practices and continuously analyze our operating metrics to identify potential improvements in service and productivity. Technicians in our Terminix branches exhibit low levels of turnover, with an average tenure of seven years, creating continuity in customer relationships and ensuring the development of best practices based on on-the-ground experience. We also provide our field personnel with access to sophisticated data management and mobility tools which enable them to drive efficiencies, improve customer service and ultimately grow our customer base and profitability.
- •
- Solid revenue and Adjusted EBITDA growth through business
cycles. Our consolidated revenue and Adjusted EBITDA compound annual growth rates from 2009 through 2013 were 4% and 6%, respectively.
We believe that our strong performance through the recent economic and housing downturns is attributable to the essential nature of our services, our strong value proposition and our management's
focus on driving results.
- •
- Solid margins with attractive operating leverage and productivity improvement initiatives. Our business model enjoys inherent operating leverage stemming from route density and fixed investments in infrastructure and technology, among other factors. We have demonstrated our ability to expand our margins through a variety of initiatives, including metric-driven continuous improvement in our customer call centers, application of consistent process guidelines at the branch level, leveraging size and scale to improve the sourcing of labor and materials, and driving productivity in centralized services. We have also deployed mobility solutions and routing and scheduling systems across many of our businesses in order to enhance overall efficiency and reduce operating costs.
Resilient Financial Model with Track Record of Consistent Performance.
8
Capital-Light Business Model. Our business model is characterized by strong Adjusted EBITDA margins, negative working capital and limited capital expenditure requirements. For the nine months ended September 30, 2014 and in 2013, 2012 and 2011, our net cash provided from operating activities from continuing operations was $132 million, $208 million, $104 million and $74 million, respectively, and our property additions were $29 million, $39 million, $44 million and $52 million, respectively. Pre-Tax Unlevered Free Cash Flow was $386 million, $428 million, $364 million and $292 million for the nine months ended September 30, 2014 and in 2013, 2012 and 2011, respectively. We intend to utilize a meaningful portion of our future cash flow to repay debt. For a reconciliation of Pre-Tax Unlevered Free Cash Flow to net cash provided from operating activities from continuing operations, which we consider to be the most directly comparable GAAP financial measure, see "—Selected Historical Financial Data."
Experienced Management Team. We have assembled a management team of highly experienced leaders with significant industry expertise. Our senior leaders have track records of producing profitable growth in a wide variety of industries and economic conditions. We also believe that we have a deep bench of talent across each of our business units, including long-tenured individuals with significant expertise and knowledge of the businesses they operate. Our management team is highly focused on execution and driving growth and profitability across our company. Our compensation structure, including incentive compensation, is tied to key performance metrics and is designed to incentivize senior management to seek the long-term success of our business.
Our Strategy
Grow Our Customer Base. We are focused on the growth of our businesses through the introduction and delivery of high-value services to new and existing customers. We drive growth in recurring and new sales via three primary channels:
- •
- Direct-to-consumer through our company-owned branches;
- •
- Indirectly through partnerships with high-quality contractors in our home warranty business; and
- •
- Through trusted service providers who are franchisees.
To accelerate new customer growth, we make strategic investments in sales, marketing and advertising to drive new business leads, brand awareness and market penetration. In addition, we are executing multiple initiatives to improve customer satisfaction and service delivery, which we believe will lead to improved retention and growth in our customer base across our business segments.
Introduce New Service Offerings. We intend to continue to leverage our existing sales channels and local coverage to deliver additional value-added services to our customers. Our product development teams draw upon the experience of our technicians in the field, combined with in-house scientific expertise, to create innovative customer solutions for both our existing customer base and identified service/category adjacencies. We have a strong history of new product introductions, such as Terminix's crawlspace encapsulation, mosquito control and wildlife exclusion services, that we believe will appeal to new potential customers as well as our existing customer base. As of September 30, 2014, mosquito, wildlife exclusion and crawl space encapsulation are being offered in substantially all U.S. geographic markets where we believe substantial market opportunity exists. We are now focusing our efforts on increasing our market share in these product lines.
Expand Our Geographic Markets. Through detailed assessments of local economic conditions and demographics, we have identified target markets for expansion, both in existing markets, where we have capacity to increase our local market position, and in new markets, where we see opportunities. In addition to geographic expansion opportunities within the United States, we intend to grow our international presence through strategic franchise expansions and additional licensing agreements.
9
Grow Our Commercial Business. Our revenue from commercial customers comprised approximately 13% of our 2013 revenue. We believe we are well positioned to leverage our national coverage, brand strength and broad service offerings to target large multi-regional accounts. We believe these capabilities provide us with a meaningful competitive advantage, especially compared to smaller local and regional competitors. We recognize that many of these large accounts seek to outsource or reduce the number of vendors used for certain services, and, accordingly, we have reenergized our marketing approach in this channel. At Terminix, for example, we have hired a dedicated sales team to focus on the development of commercial sales. Our commercial expansion strategy targets industries with a demonstrated need for our services, including healthcare, manufacturing, warehouses, hotels and commercial real estate.
Enhance Our Profitability. We have and will continue to invest in initiatives designed to improve our margins and drive profitable growth. We have been able to increase productivity across our segments through actions such as continuous process improvement, targeted systems investments, sales force initiatives and technician mobility tools. We are also focusing on strategically leveraging the $1.4 billion that we have spent annually with our vendors to capitalize on purchasing power and achieve more favorable pricing and terms. In addition, we have rolled out tools and processes to centralize and systematize pricing decisions. These tools and processes enable us to optimize pricing at the geographic market and product level while creating a flexible and scalable pricing architecture that can grow with the business. We intend to leverage these investments as well as identify further opportunities to enhance profitability across our businesses.
Pursue Selective Acquisitions. Since 2008, we have completed over 200 acquisitions. We anticipate that the highly fragmented nature of our markets will continue to create opportunities for further consolidation. As we have in the past, we will continue to take advantage of tuck-in as well as strategic acquisition opportunities, particularly in underserved markets where we can enhance and expand our service capabilities. We seek to use acquisitions to cost-effectively grow our customer count and enter high-growth geographies. We may also pursue acquisitions as vehicles for strategic international expansion.
TruGreen Spin-Off
On January 14, 2014, we completed a separation transaction, or the "TruGreen Spin-off," resulting in the spin-off of the assets and certain liabilities of the business that comprises the lawn, tree and shrub care services previously conducted by ServiceMaster primarily under the TruGreen brand name, or collectively, the "TruGreen Business," through a tax-free, pro rata dividend to our stockholders. As a result of the completion of the TruGreen Spin-off, TruGreen Holding Corporation, or "New TruGreen," operates the TruGreen Business as a private independent company. The TruGreen Business experienced a significant downturn prior to the TruGreen Spin-off. From 2011 to 2013, the TruGreen Business lost 400,000 customers, or 19 percent of its customer base. The TruGreen Business's operating margins also eroded during this time frame due to production inefficiencies, higher chemical costs and inflationary pressures, compounded by lower fixed cost leverage as falling customer counts drove revenue down. The TruGreen Business experienced revenue and Adjusted EBITDA declines of 18.6 percent and 87.6 percent, respectively, from 2011 to 2013. In light of these developments, we made the decision to effect the TruGreen Spin-off, which enabled our management team to increase its focus on the Terminix, American Home Shield and Franchise Services Group segments, while providing New TruGreen, as an independently operated, private company, the time and focus required to execute a turnaround. In addition, the TruGreen Spin-off was effected to enhance our ability to complete an initial public offering of our common stock and use the net proceeds primarily to reduce our indebtedness. The historical results of the TruGreen Business, including its results of operations, cash flows and related assets and liabilities, are reported in discontinued operations for all periods presented in this prospectus.
10
We have historically incurred the cost of certain corporate-level activities which we performed on behalf of the TruGreen Business, including communications, public relations, finance and accounting, tax, treasury, internal audit, human resources operations and benefits, risk management and insurance, supply management, real estate management, marketing, facilities, information technology and other support services. Beginning with the TruGreen Spin-off, where it was practicable, employees who historically provided such services to the TruGreen Business were separated from us and transferred to New TruGreen as of the date of the TruGreen Spin-off. For certain support services for which it was not practicable to separate employees and transfer them to New TruGreen beginning with the TruGreen Spin-off, a transition services agreement was entered into pursuant to which SvM and its subsidiaries provide specified services to New TruGreen while an orderly transition of employees and other support arrangements from SvM to New TruGreen is executed. The charges for the transition services are designed to allow us to fully recover the direct costs of providing the services, plus specified margins and any out-of-pocket costs and expenses. The services provided under the transition services agreement will terminate at various specified times, and in no event later than January 14, 2016 (except for certain information technology services, which New TruGreen expects SvM to provide to New TruGreen beyond the two-year period).
As a result of the transfer of employees to New TruGreen, in combination with the fees we expect to receive under the transition services agreement, we expect an approximate $25 million reduction in annual costs.
Initial Public Offering of Common Stock
On June 25, 2014, our registration statement on Form S-1 for our initial public offering was declared effective by the U.S. Securities and Exchange Commission, or "SEC." On July 1, 2014, we completed the offering of 41,285,000 shares of our common stock at a price of $17.00 per share.
Refinancing of Indebtedness
On July 1, 2014, in connection with our initial public offering, SvM terminated its existing credit agreements governing its then-existing term loan facility, the pre-funded letter of credit facility, together, the "Old Term Facilities," and the then-existing revolving credit facility, together with the Old Term Facilities, the "Old Credit Facilities," and entered into a new credit agreement with respect to a new $1,825 million term loan facility maturing 2021, or the "Term Loan Facility," and a new $300 million revolving credit facility maturing 2019, or the "Revolving Credit Facility," and, together with the Term Loan Facility, the "Credit Facilities," with JPMorgan Chase Bank, N.A. as administrative agent, collateral agent and issuing bank, and a syndicate of lenders party thereto from time to time. Borrowings under the Term Loan Facility, together with $243 million of available cash and $120 million of net proceeds of the initial public offering, were used to repay in full the $2,187 million outstanding under the Old Term Facilities. In addition, $42 million of available cash was used to pay debt issuance costs of $24 million and to pay original issue discount of $18 million in connection with the Term Loan Facility.
On July 16, 2014, SvM used proceeds from our initial public offering to redeem $210 million of its outstanding 8 percent senior notes due 2020, or the "8% 2020 Notes," and $263 million of its outstanding 7 percent senior notes due 2020, or the "7% 2020 Notes," and collectively with the 8% 2020 Notes, the "2020 Notes." In connection with the redemption of the 8% 2020 Notes and the 7% 2020 Notes, SvM was required to pay a pre-payment premium of $17 million and $18 million, respectively, and accrued interest of $7 million and $8 million, respectively.
In connection with the partial redemption of the 8% 2020 Notes and 7% 2020 Notes and the repayment of the Old Term Facilities, we recorded a loss on extinguishment of debt of $65 million in the three and nine months ended September 30, 2014, which includes the pre-payment premiums on the 8% 2020 Notes and 7% 2020 Notes of $17 million and $18 million, respectively, and the write-off of $30 million of debt issuance costs.
11
Recent Developments
Expected Fourth Quarter and Full-Year 2014 Results
We expect full-year 2014 Adjusted EBITDA to be $554 million to $557 million and revenue to be $2,452 million to $2,457 million. Accordingly, we expect fourth quarter 2014 Adjusted EBITDA to be $111 million to $114 million and revenue to be $572 million to $577 million. Our expected fourth quarter 2014 results benefitted from strong sales of new services (wildlife exclusion and crawlspace encapsulation) and increased sales of attic insulation at Terminix as well as the success of incremental marketing investments in our direct to consumer channel at American Home Shield.
The estimated full-year and fourth quarter 2014 results are preliminary, unaudited and subject to completion, reflect management's current views and may change as a result of management's review of results and other factors, including a wide variety of significant business, economic and competitive risks and uncertainties. Such preliminary results are subject to the closing of the fourth quarter of 2014 and finalization of year-end financial and accounting procedures (which have yet to be performed) and should not be viewed as a substitute for full quarterly financial statements prepared in accordance with GAAP. We caution you that the full-year and fourth quarter 2014 estimates of revenue and Adjusted EBITDA are forward-looking statements and are not guarantees of future performance or outcomes and that actual results may differ materially from those described above. Factors that could cause actual results to differ from those described above are set forth in "Risk Factors" and "Forward-Looking Statements." You should read this information together with the financial statements and the related notes and "Management's Discussion and Analysis of Financial Condition and Results of Operations" for prior periods included elsewhere in this prospectus.
Neither our independent registered public accounting firm nor any other independent registered public accounting firm has audited, reviewed or compiled, examined or performed any procedures with respect to the estimated results, nor have they expressed any opinion or any other form of assurance on the estimated results.
Adjusted EBITDA Description and Reconciliation. For the definition of Adjusted EBITDA, see "—Summary Historical Consolidated Financial and Other Operating Data."
We use Adjusted EBITDA to facilitate operating performance comparisons from period to period. Adjusted EBITDA is a supplemental measure of our performance that is not required by, or presented in accordance with, GAAP. Adjusted EBITDA is not a measurement of our financial performance under GAAP and should not be considered as an alternative to net income or any other performance measures derived in accordance with GAAP or as an alternative to net cash provided by operating activities or any other measures of our cash flow or liquidity. Some of these limitations are further described in "—Summary Historical Consolidated Financial and Other Operating Data."
12
The following table sets forth a reconciliation of our expected fourth quarter and full-year 2014 Adjusted EBITDA to expected fourth quarter and full-year 2014 net income (loss):
(In millions)
|
Three Months Ended December 31, 2014 (unaudited) |
Year Ended December 31, 2014 (unaudited) |
||
|---|---|---|---|---|
Expected Adjusted EBITDA |
$111 - $114 | $554 - $557 | ||
Depreciation expense |
(11) | (48) | ||
Amortization expense |
(13) | (52) | ||
Non-cash impairment of software and other related costs |
— | (47) | ||
Non-cash stock-based compensation expense |
(3) | (8) | ||
Restructuring charges |
(4) | (11) | ||
Management and consulting fees |
— | (4) | ||
Consulting agreement termination fees |
— | (21) | ||
Loss from discontinued operations, net of income taxes |
(1) | (99) | ||
Provision for income taxes |
(14) - (16) | (40) - (42) | ||
Loss on extinguishment of debt |
— | (65) | ||
Interest expense |
(48) | (219) | ||
Other |
1 | 2 | ||
| | | | | |
Expected Net Income (Loss) |
$18 - $19 | $(58) - $(57) | ||
| | | | | |
| | | | | |
| | | | | |
Partial Redemption of 8% Notes
On January 16, 2015, SvM gave notice to redeem $190 million in aggregate principal amount of the 8% 2020 Notes at a redemption price of 106.0% of the principal amount thereof on February 17, 2015. SvM intends to fund the partial redemption using available cash. In connection with the partial redemption, we expect to record a loss on extinguishment of debt of approximately $13 million in the first quarter of 2015, which includes a pre-payment premium of $11 million and the write-off of approximately $2 million of debt issuance costs. After giving effect to the partial redemption of the 8% 2020 Notes, as of December 31, 2014, our cash and cash equivalents and short- and long-term marketable securities totaled approximately $294 million. We expect total net assets subject to third-party restrictions to be approximately $159 million at December 31, 2014. As of December 31, 2014, we had approximately $164 million of available borrowing capacity under the Revolving Credit Facility.
Equity Sponsors and Organizational Structure
In July 2007, SvM was acquired pursuant to a merger transaction, or the "2007 Merger," and, immediately following the completion of the 2007 Merger, all of our outstanding common stock was owned by investment funds managed by, or affiliated with, Clayton, Dubilier & Rice, LLC ("CD&R"), or the "CD&R Funds," Citigroup Private Equity LP, or "Citigroup," BAS Capital Funding Corporation, or "BAS," and JPMorgan Chase Funding Inc., or "JPMorgan." On September 30, 2010, Citigroup transferred the management responsibility for certain investment funds that owned shares of our common stock to StepStone Group LP, or "StepStone," and the investment funds managed by StepStone, the "StepStone Funds." As of December 22, 2011, we purchased from BAS 5 million shares of our common stock. On March 30, 2012, an affiliate of BAS sold 5 million shares of our common stock to Ridgemont Partners Secondary Fund I, L.P, or "Ridgemont." On July 24, 2012, BACSVM-A L.P., an affiliate of BAS, distributed 1,666,666 million shares of our common stock to Charlotte Investor IV, L.P., its sole limited partner, (together with the CD&R Funds, the StepStone Funds, JPMorgan and Citigroup Capital Partners II Employee Master Fund, L.P., an affiliate of Citigroup, the "Equity Sponsors").
13
The CD&R Funds, the StepStone Funds, JPMorgan and Ridgemont will be the selling stockholders in this offering. The CD&R Funds, StepStone Funds, JPMorgan and Ridgemont currently hold approximately 45.0%, 9.9%, 5.0% and 3.7%, respectively, of our outstanding common stock. See "Principal and Selling Stockholders."
CD&R is a private equity firm composed of a combination of financial and operating executives pursuing an investment strategy predicated on building stronger, more profitable businesses. Since its founding in 1978, CD&R has managed the investment of more than $21 billion in 63 businesses with an aggregate transaction value of more than $100 billion. CD&R has a disciplined and clearly defined investment strategy with a special focus on multi-location services and distribution businesses.
StepStone Group LP is a global private markets firm overseeing more than $60 billion of private capital allocations, including approximately $11 billion of assets under management. StepStone creates customized portfolios for investors using a highly disciplined research-focused approach that integrates fund, secondary, mezzanine and co-investments.
The following chart illustrates our ownership and organizational structure, after giving effect to this offering, assuming the underwriters do not exercise their option to purchase additional shares:
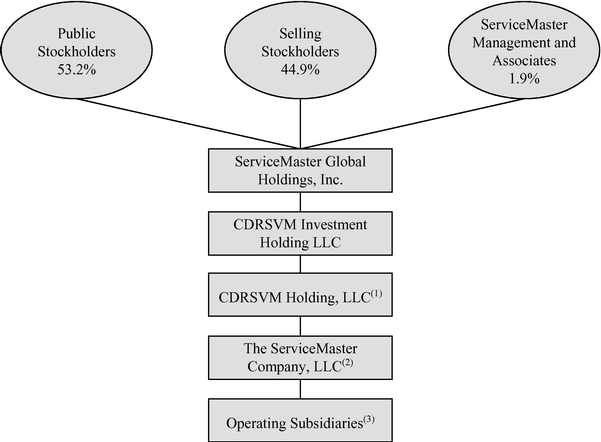
- (1)
- Guarantor
of the Credit Facilities. See "Description of Certain Indebtedness."
- (2)
- Borrower
under the Credit Facilities and issuer of the 2020 Notes and the Continuing Notes, as defined in "Description of Certain Indebtedness." See
"Description of Certain Indebtedness."
- (3)
- SvM's subsidiary The Terminix International Company Limited Partnership is a co-borrower under the Revolving Credit Facility. Certain direct and indirect domestic subsidiaries of SvM guarantee the Credit Facilities and the 2020 Notes.
14
Market and Industry Data
This prospectus includes estimates regarding market and industry data and forecasts, which are based on publicly available information, industry publications and surveys, reports from government agencies, reports by market research firms and our own estimates based on our management's knowledge of, and experience in, the residential and commercial services industry and market segments in which we compete. Third-party industry publications and forecasts generally state that the information contained therein has been obtained from sources generally believed to be reliable. Our estimates involve risks and uncertainties and are subject to change based on various factors, including those discussed under the captions "Risk Factors," "Forward-Looking Statements" and "Management's Discussion and Analysis of Financial Condition and Results of Operations."
Service Marks, Trademarks and Trade Names
We hold various service marks, trademarks and trade names, such as ServiceMaster, Terminix, American Home Shield, ServiceMaster Restore, ServiceMaster Clean, Merry Maids, Furniture Medic and AmeriSpec, that we deem particularly important to the advertising activities conducted by each of our businesses. As of September 30, 2014, we had marks that were protected by registration (either by direct registration or by treaty) in the United States and approximately 95 other countries.
* * * * *
Our corporate headquarters are located at 860 Ridge Lake Boulevard, Memphis, Tennessee, 38120. Our telephone number is (901) 597-1400.
15
Common stock offered by the selling stockholders |
25,000,000 shares | |
Option to purchase additional shares of common stock |
The underwriters have a 30-day option to purchase up to an additional 3,750,000 shares of common stock from the selling stockholders at the public offering price, less underwriting discounts and commissions. |
|
Common stock to be outstanding after this offering |
134,255,002 shares |
|
Use of proceeds |
We will not receive any proceeds from the sale of our common stock by the selling stockholders. The selling stockholders will receive all of the net proceeds and bear all commissions and discounts, if any, from the sale of our common stock pursuant to this prospectus. |
|
|
See "Use of Proceeds" and "Principal and Selling Stockholders." |
|
Dividend policy |
We do not currently anticipate paying dividends on our common stock for the foreseeable future. See "Dividend Policy." |
|
NYSE trading symbol |
"SERV" |
|
Risk factors |
See "Risk Factors" for a discussion of factors that you should consider carefully before deciding to invest in shares of our common stock. |
|
Conflicts of Interest |
JPMorgan, an affiliate of J.P. Morgan Securities LLC is one of the selling stockholders in this offering and will receive net proceeds exceeding 5% of the net proceeds of this offering. As a result it is deemed to have a "conflict of interest" with us within the meaning of Rule 5121 of the Financial Industry Regulatory Authority, or "Rule 5121." Accordingly, this offering is being made in compliance with the requirements of Rule 5121. Because the common stock to be offered has a bona fide public market, pursuant to Rule 5121, the appointment of a qualified independent underwriter is not necessary. See "Underwriting (Conflicts of Interest)." |
The number of shares of our common stock to be outstanding immediately following this offering is based on the number of our shares of common stock outstanding as of January 20, 2015, and excludes:
- •
- 4,436,269 shares of common stock issuable upon exercise of options to purchase shares outstanding as of January 20, 2015 at a
weighted average exercise price of $12.26 per share;
- •
- 425,922 shares of common stock issuable pursuant to restricted stock units or "RSUs" as of January 20, 2015; and
- •
- 7,971,137 shares of common stock reserved for future issuance following this offering under our equity plans.
16
SUMMARY HISTORICAL
CONSOLIDATED FINANCIAL AND OTHER OPERATING DATA
The following tables set forth summary historical consolidated financial and other operating data as of the dates and for the periods indicated. The summary historical consolidated financial and other operating data as of September 30, 2014 and for the nine months ended September 30, 2014 and September 30, 2013 have been derived from our unaudited condensed consolidated financial statements included in this prospectus. The summary historical consolidated financial and other operating data as of December 31, 2013 and 2012 and for each of the three years in the period ended December 31, 2013 have been derived from our audited consolidated financial statements and related notes included in this prospectus. The summary historical consolidated balance sheet data as of December 31, 2011 has been derived from our consolidated financial statements and related notes not included in this prospectus. The summary historical financial and other operating data are qualified in their entirety by, and should be read in conjunction with, our audited consolidated financial statements and related notes and our unaudited condensed consolidated financial statements and related notes and "Management's
17
Discussion and Analysis of Financial Condition and Results of Operations" and "Selected Historical Financial Data" included in this prospectus.
| |
Nine Months Ended September 30, |
Year Ended December 31, | ||||||||||||||
|---|---|---|---|---|---|---|---|---|---|---|---|---|---|---|---|---|
(In millions, except per share data)
|
2014 | 2013 | 2013 | 2012 | 2011 | |||||||||||
Operating Results: |
||||||||||||||||
Revenue |
$ | 1,880 | $ | 1,760 | $ | 2,293 | $ | 2,214 | $ | 2,105 | ||||||
Cost of services rendered and products sold |
983 | 924 | 1,220 | 1,196 | 1,125 | |||||||||||
Selling and administrative expenses |
505 | 527 | 691 | 678 | 648 | |||||||||||
Amortization expense |
39 | 38 | 51 | 58 | 83 | |||||||||||
Impairment of software and other related costs(1) |
47 | — | — | — | — | |||||||||||
Consulting agreement termination fees(2) |
21 | — | — | — | — | |||||||||||
Restructuring charges(3) |
7 | 4 | 6 | 15 | 7 | |||||||||||
Interest expense |
171 | 186 | 247 | 245 | 266 | |||||||||||
Interest and net investment income |
(7 | ) | (6 | ) | (8 | ) | (7 | ) | (11 | ) | ||||||
Loss on extinguishment of debt(4) |
65 | — | — | 55 | — | |||||||||||
| | | | | | | | | | | | | | | | | |
Income (Loss) from Continuing Operations before Income Taxes(1)(2)(3)(4) |
48 | 88 | 86 | (26 | ) | (13 | ) | |||||||||
Provision (benefit) for income taxes |
26 | 43 | 43 | (8 | ) | (6 | ) | |||||||||
Equity in losses of joint venture |
— | — | (1 | ) | — | — | ||||||||||
| | | | | | | | | | | | | | | | | |
Income (Loss) from Continuing Operations(1)(2)(3)(4) |
22 | 44 | 42 | (18 | ) | (7 | ) | |||||||||
Loss from discontinued operations, net of income taxes(5) |
(98 | ) | (533 | ) | (549 | ) | (696 | ) | 53 | |||||||
| | | | | | | | | | | | | | | | | |
Net (Loss) Income(1)(2)(3)(4)(5) |
$ | (76 | ) | $ | (489 | ) | $ | (507 | ) | $ | (714 | ) | $ | 46 | ||
| | | | | | | | | | | | | | | | | |
| | | | | | | | | | | | | | | | | |
| | | | | | | | | | | | | | | | | |
Weighted average shares outstanding: |
||||||||||||||||
Basic |
105.8 | 91.6 | 91.6 | 91.9 | 92.0 | |||||||||||
Diluted |
106.7 | 92.4 | 92.2 | 91.9 | 92.0 | |||||||||||
Basic and Diluted Earnings (Loss) Per Share—Continuing Operations |
$ | 0.20 | $ | 0.48 | $ | 0.46 | $ | (0.20 | ) | $ | (0.08 | ) | ||||
Financial Position (as of period end): |
||||||||||||||||
Total assets |
$ | 5,112 | $ | 5,905 | $ | 6,415 | $ | 7,156 | ||||||||
Cash and cash equivalents |
275 | 484 | 418 | 330 | ||||||||||||
Total long-term debt |
3,059 | 3,906 | 3,924 | 3,859 | ||||||||||||
Total shareholders' equity(1)(2)(3)(4)(5) |
327 | 23 | 535 | 1,234 | ||||||||||||
Other Financial Data: |
||||||||||||||||
Capital expenditures |
$ | 29 | $ | 38 | $ | 39 | $ | 44 | $ | 52 | ||||||
Adjusted EBITDA(6) |
443 | 361 | 450 | 413 | 397 | |||||||||||
Ratio of total debt to annual Adjusted EBITDA(6) |
8.68 | 9.50 | 9.72 | |||||||||||||
Ratio of annual Adjusted EBITDA to interest expense(6) |
1.82 | 1.68 | 1.49 | |||||||||||||
- (1)
- We
recorded an impairment charge of $47 million ($28 million, net of tax) in the nine months ended September 30, 2014 relating to our
decision to abandon our efforts to deploy a new operating system at American Home Shield. See Note 1 to our unaudited condensed consolidated financial statements included in this prospectus for
further details.
- (2)
- On July 1, 2014, in connection with the completion of our initial public offering, we paid the Equity Sponsors aggregate fees of $21 million in connection with the termination of our consulting agreements with them, which was recorded in the nine months ended September 30, 2014. See
18
Note 15 to our unaudited condensed consolidated financial statements included in this prospectus for further details.
- (3)
- See
Note 8 to our audited consolidated financial statements and Note 3 to our unaudited condensed consolidated financial statements included
in this prospectus for further details.
- (4)
- A
loss on extinguishment of debt of $65 million ($41 million, net of taxes) was recorded in the nine months ended September 30, 2014
related to the partial redemption of the 8% 2020 Notes and the 7% 2020 Notes on July 16, 2014. See Note 10 to our unaudited condensed consolidated financial statements included in this
prospectus for further details. The 2012 results include a $55 million ($35 million, net of tax) loss on extinguishment of debt related to the redemption of the remaining
$996 million aggregate principal amount of SvM's 10.75% senior notes maturing in 2015, or the "2015 Notes," and repayment of $276 million of outstanding borrowings under the Old Term
Facilities.
- (5)
- On
January 14, 2014, we completed the TruGreen Spin-off, resulting in the spin-off of the assets and certain liabilities of the TruGreen Business
through a tax-free, pro rata dividend to our stockholders. As a result of the TruGreen Spin-off, we were required to perform an interim impairment analysis as of January 14, 2014 on the
TruGreen trade name. This interim impairment analysis resulted in a pre-tax non-cash trade name impairment charge of $139 million ($84 million, net of tax) to reduce the carrying value
of the TruGreen trade name to its estimated fair value.
- In
2013, 2012 and 2011, we recorded pre-tax non-cash impairment charges of $673 million ($521 million, net of tax),
$909 million ($764 million, net of tax) and $37 million ($22 million, net of tax), respectively, associated with the goodwill and trade name at the TruGreen Business in
(loss) income from discontinued operations, net of income taxes. See Note 7 to our audited consolidated financial statements for further details.
- In
2011, in conjunction with the decision to dispose of our commercial landscaping business, we recorded a pre-tax non-cash impairment charge of
$34 million to reduce the carrying value of the commercial landscaping business's assets to their estimated fair value less cost to sell in accordance with applicable accounting standards. Upon
completion of such sale in 2011 we recorded a pre-tax loss on sale of $6 million.
- (6)
- We
use Adjusted EBITDA to facilitate operating performance comparisons from period to period. Adjusted EBITDA is a supplemental measure of our performance
that is not required by, or presented in accordance with, accounting principles generally accepted in the United States of America, or "GAAP." Adjusted EBITDA is not a measurement of our financial
performance under GAAP and should not be considered as an alternative to net income or any other performance measures derived in accordance with GAAP or as an alternative to net cash provided by
operating activities or any other measures of our cash flow or liquidity. "Adjusted EBITDA" means net income (loss) before: income (loss) from discontinued operations, net of income taxes; provision
(benefit) for income taxes; gain (loss) on extinguishment of debt; interest expense; depreciation and amortization expense; non-cash goodwill and trade name impairment; residual value guarantee
charge; non-cash impairment of software and other related costs; non-cash impairment of property and equipment; non-cash stock-based compensation expense; restructuring charges; management and
consulting fees; consulting agreement termination fees; non-cash effects attributable to the application of purchase accounting and other non-operating expenses.
- We believe Adjusted EBITDA facilitates company-to-company operating performance comparisons by backing out potential differences caused by variations in capital structures (affecting net interest income and expense), taxation and the age and book depreciation of facilities and equipment (affecting relative depreciation expense), which may vary for different companies for reasons
19
unrelated to operating performance. In addition, we exclude residual value guarantee charges that do not result in additional cash payments to exit the facility at the end of the lease term.
- Adjusted
EBITDA is not necessarily comparable to other similarly titled financial measures of other companies due to the potential
inconsistencies in the methods of calculation.
- Adjusted
EBITDA has limitations as an analytical tool, and should not be considered in isolation or as a substitute for analyzing our results as
reported under GAAP. Some of these limitations are:
- •
- Adjusted EBITDA does not reflect changes in, or cash requirements for, our working capital needs;
- •
- Adjusted EBITDA does not reflect our interest expense, or the cash requirements necessary to service interest or
principal payments on our debt;
- •
- Adjusted EBITDA does not reflect our tax expense or the cash requirements to pay our taxes;
- •
- Adjusted EBITDA does not reflect historical capital expenditures or future requirements for capital expenditures or
contractual commitments;
- •
- Although depreciation and amortization are non-cash charges, the assets being depreciated and amortized will often have
to be replaced in the future, and Adjusted EBITDA does not reflect any cash requirements for such replacements; and
- •
- Other companies in our industries may calculate Adjusted EBITDA differently, limiting its usefulness as a comparative
measure.
- The following table sets forth Adjusted EBITDA for each of our reportable segments and Other Operations and Headquarters and reconciles the total Adjusted EBITDA to Net (Loss) Income for
20
the periods presented, which we consider to be the most directly comparable GAAP financial measure, to Adjusted EBITDA:
| |
Nine Months Ended September 30, |
Year Ended December 31, | ||||||||||||||
|---|---|---|---|---|---|---|---|---|---|---|---|---|---|---|---|---|
(In millions)
|
2014 | 2013 | 2013 | 2012 | 2011 | |||||||||||
Adjusted EBITDA: |
||||||||||||||||
Terminix |
$ | 248 | $ | 223 | $ | 266 | $ | 266 | $ | 249 | ||||||
American Home Shield |
144 | 114 | 145 | 117 | 107 | |||||||||||
Franchise Services Group |
58 | 57 | 78 | 70 | 75 | |||||||||||
| | | | | | | | | | | | | | | | | |
Reportable Segment Adjusted EBITDA |
$ | 450 | $ | 395 | $ | 489 | $ | 453 | $ | 431 | ||||||
Other Operations and Headquarters(a) |
(7 | ) | (34 | ) | (39 | ) | (40 | ) | (34 | ) | ||||||
| | | | | | | | | | | | | | | | | |
Total Adjusted EBITDA |
$ | 443 | $ | 361 | $ | 450 | $ | 413 | $ | 397 | ||||||
| | | | | | | | | | | | | | | | | |
| | | | | | | | | | | | | | | | | |
| | | | | | | | | | | | | | | | | |
Depreciation and amortization expense |
(76 | ) | (74 | ) | $ | (99 | ) | $ | (100 | ) | $ | (121 | ) | |||
Non-cash impairment of software and other related costs(b) |
(47 | ) | — | — | — | — | ||||||||||
Non-cash impairment of property and equipment(c) |
— | — | — | (9 | ) | — | ||||||||||
Non-cash stock-based compensation expense(d) |
(5 | ) | (3 | ) | (4 | ) | (7 | ) | (8 | ) | ||||||
Restructuring charges(e) |
(7 | ) | (4 | ) | (6 | ) | (15 | ) | (7 | ) | ||||||
Management and consulting fees(f) |
(4 | ) | (5 | ) | (7 | ) | (7 | ) | (8 | ) | ||||||
Consulting agreement termination fees(g) |
(21 | ) | — | — | — | — | ||||||||||
Loss (income) from discontinued operations, net of income taxes(h) |
(98 | ) | (533 | ) | (549 | ) | (696 | ) | 53 | |||||||
Benefit (provision) for income taxes |
(26 | ) | (43 | ) | (43 | ) | 8 | 6 | ||||||||
Loss on extinguishment of debt(i) |
(65 | ) | — | — | (55 | ) | — | |||||||||
Interest expense |
(171 | ) | (186 | ) | (247 | ) | (245 | ) | (266 | ) | ||||||
Other(j) |
— | (1 | ) | (2 | ) | (1 | ) | — | ||||||||
| | | | | | | | | | | | | | | | | |
Net (Loss) Income |
$ | (76 | ) | $ | (489 | ) | $ | (507 | ) | $ | (714 | ) | $ | 46 | ||
| | | | | | | | | | | | | | | | | |
| | | | | | | | | | | | | | | | | |
| | | | | | | | | | | | | | | | | |
- (a)
- Represents
unallocated corporate expenses.
- (b)
- Represents
the impairment of software and other related costs described in footnote (1) above. We exclude non-cash impairments from Adjusted EBITDA
because we believe doing so is useful to investors in aiding period-to-period comparability.
- (c)
- For
2012, primarily represents a $3 million impairment of licensed intellectual property and a $1 million impairment of abandoned real estate
at Terminix, and a $4 million impairment of certain internally developed software at Merry Maids recorded in 2012 for which there were no similar impairments recorded in 2013. We exclude
non-cash impairments of property and equipment from Adjusted EBITDA because we believe doing so is useful to investors in aiding period-to-period comparability.
- (d)
- Represents
the non-cash expense of our equity-based compensation. We exclude this expense from Adjusted EBITDA primarily because it is a non-cash expense
and because it is not used by management to assess ongoing operational performance. We believe excluding this expense from Adjusted EBITDA is useful to investors in aiding period-to-period
comparability.
- (e)
- Represents the restructuring charges described in footnote (3) above, which include restructuring charges related primarily to the impact of a branch optimization project at Terminix and an initiative to enhance capabilities and reduce costs in our centers of excellence
21
at Other Operations and Headquarters. Our centers of excellence are functions at our headquarters that provide company-wide administrative services for our operations. We exclude these restructuring charges from Adjusted EBITDA because we believe they do not reflect our ongoing operations and because we believe doing so is useful to investors in aiding period-to-period comparability.
- (f)
- Represents
the amounts paid to certain of our Equity Sponsors under the consulting agreements described in "Certain Relationships and Related Party
Transactions—Consulting Agreements." We exclude these amounts from Adjusted EBITDA primarily because they are not reflective of ongoing operating results and because they are not used by
management to assess ongoing operational performance. In addition, we have excluded these amounts from Adjusted EBITDA because the consulting agreements terminated in connection with our initial
public offering.
- (g)
- Represents
the consulting agreement termination fees described in footnote (2) above. We exclude these amounts from Adjusted EBITDA because we
believe doing so is useful to investors in aiding period-to-period comparability.
- (h)
- Represents
our loss in connection with the spin-off of the TruGreen Business in 2014 and the disposition of our commercial landscaping business in 2011,
including the non-cash impairment charges and the loss on sale described in footnote (5) above. We exclude these amounts from Adjusted EBITDA because these charges are not part of our ongoing
operations and we believe doing so is useful to investors in aiding period-to-period comparability.
- (i)
- Represents
the loss on extinguishment of debt described in footnote (4) above. We believe excluding this expense from Adjusted EBITDA is useful to
investors in aiding period-to-period comparability.
- (j)
- Represents administrative expenses of ServiceMaster and interest expense of ServiceMaster related to a note payable due to SvM. Although we expect to incur similar expenses in the future, we exclude these expenses from the calculation of Adjusted EBITDA in order to present Adjusted EBITDA on a basis consistent with Adjusted EBITDA as previously reported by SvM, which is familiar to holders of SvM's indebtedness.
22
Investing in our common stock involves a high degree of risk. You should consider and read carefully all of the risks and uncertainties described below, as well as other information included in this prospectus, including our audited consolidated financial statements and related notes appearing at the end of this prospectus, before making an investment decision. The risks described below are not the only ones facing us. The occurrence of any of the following risks or additional risks and uncertainties not presently known to us or that we currently believe to be immaterial could materially and adversely affect our business, financial position, results of operations or cash flows. In such case, the trading price of our common stock could decline, and you may lose all or part of your investment. This prospectus also contains forward-looking statements and estimates that involve risks and uncertainties. Our actual results could differ materially from those anticipated in the forward-looking statements as a result of specific factors, including the risks and uncertainties described below.
Risks Related to Our Business and Our Industry
Weakening in general economic conditions, especially as they may affect home sales, unemployment or consumer confidence or spending levels, may adversely impact our business, financial position, results of operations and cash flows.
A substantial portion of our results of operations is dependent upon spending by consumers. Deterioration in general economic conditions and consumer confidence, particularly in California, Texas and Florida, which collectively represented approximately one-third of our revenue in 2013 and the nine months ended September 20, 2014 in our Terminix and American Home Shield segments, could affect the demand for our services. Consumer spending and confidence tend to decline during times of declining economic conditions. A worsening of macroeconomic indicators, including weak home sales, higher home foreclosures, declining consumer confidence or rising unemployment rates, could adversely affect consumer spending levels, reduce the demand for our services and adversely impact our business, financial position, results of operations and cash flows. These factors could also negatively impact the timing or the ultimate collection of accounts receivable, which would adversely impact our business, financial position, results of operations and cash flows.
We may not successfully implement our business strategies, including achieving our growth objectives.
We may not be able to fully implement our business strategies or realize, in whole or in part within the expected time frames, the anticipated benefits of our various growth or other initiatives. Our various business strategies and initiatives, including growth of our customer base, introduction of new service offerings, geographic expansion, growth of our commercial business and enhancement of profitability, are subject to significant business, economic and competitive uncertainties and contingencies, many of which are beyond our control.
In addition, we may incur certain costs to achieve efficiency improvements and growth in our business and we may not meet anticipated implementation timetables or stay within budgeted costs. As these efficiency improvement and growth initiatives are undertaken, we may not fully achieve our expected cost savings and efficiency improvements or growth rates, or these initiatives could adversely impact our customer retention or our operations. Also, our business strategies may change from time to time in light of our ability to implement our new business initiatives, competitive pressures, economic uncertainties or developments, or other factors.
23
Adverse credit and financial market events and conditions could, among other things, impede access to or increase the cost of financing or cause our commercial and governmental customers to incur liquidity issues that could lead to some of our services not being purchased or being cancelled, or result in reduced revenue and lower Adjusted EBITDA, any of which could have an adverse impact on our business, financial position, results of operations and cash flows.
Disruptions in credit or financial markets could, among other things, lead to impairment charges, make it more difficult for us to obtain, or increase our cost of obtaining, financing for our operations or investments or to refinance our indebtedness, cause our lenders to depart from prior credit industry practice and not give technical or other waivers under our Credit Facilities to the extent we may seek them in the future, thereby causing SvM to be in default under one or more of our Credit Facilities. These disruptions also could cause our commercial customers to encounter liquidity issues that could lead to some of our services being cancelled or reduced, or that could result in an increase in the time it takes our customers to pay us, or that could lead to a decrease in pricing for our services and products, any of which could adversely affect our accounts receivable, among other things, and, in turn, increase our working capital needs. Volatile swings in the commercial real estate segment could also impact the demand for our services as landlords cut back on services provided to their tenants. In addition, adverse developments at federal, state and local levels associated with budget deficits resulting from economic conditions could result in federal, state and local governments decreasing their purchasing of our products or services and/or increasing taxes or other fees on businesses, including us, to generate more tax revenues, which could negatively impact spending by commercial customers and municipalities on our services.
Our market segments are highly competitive. Competition could reduce our share of the market segments served by us and adversely impact our reputation, business, financial position, results of operations and cash flows.
We operate in highly competitive market segments. Changes in the source and intensity of competition in the market segments served by us impact the demand for our services and may also result in additional pricing pressures. The relatively low capital cost of entry into certain of our business categories has led to strong competitive market segments, including competition from smaller regional and local owner-operated companies. Regional and local competitors operating in a limited geographic area may have lower labor, employee benefits and overhead costs. The principal methods of competition in our businesses include name recognition, quality and speed of service, customer satisfaction, reputation and pricing. We may be unable to compete successfully against current or future competitors, and the competitive pressures that we face may result in reduced market segment share, reduced pricing or adversely impact our reputation, business, financial position, results of operations and cash flows.
Weather conditions and seasonality affect the demand for our services and our results of operations and cash flows.
The demand for our services and our results of operations are affected by weather conditions, including, without limitation, potential impacts, if any, from climate change, known and unknown, and by the seasonal nature of our termite and pest control services, home inspection services, home warranties and disaster restoration services. Adverse weather conditions (e.g., cooler temperatures or droughts), whether created by climate change factors or otherwise, can impede the development of the termite swarm and lead to lower demand for our termite remediation services. For example, colder weather conditions in early 2014 adversely affected our traditional termite revenue in the nine months ended September 30, 2014. Severe winter storms can also impact our home cleaning business if personnel cannot travel to service locations due to hazardous road conditions. In addition, extreme temperatures can lead to an increase in service requests related to household systems and appliances in
24
our American Home Shield business, resulting in higher claim frequency and costs and lower profitability. These or other weather conditions could adversely impact our business, financial position, results of operations and cash flows.
Increases in raw material prices, fuel prices and other operating costs could adversely impact our business, financial position, results of operations and cash flows.
Our financial performance is affected by the level of our operating expenses, such as fuel, chemicals, refrigerants, appliances and equipment, parts, raw materials, wages and salaries, employee benefits, health care, vehicle maintenance, self-insurance costs and other insurance premiums as well as various regulatory compliance costs, all of which may be subject to inflationary pressures. In particular, our financial performance is adversely affected by increases in these operating costs. In recent years, fuel prices have fluctuated widely, and previous increases in fuel prices increased our costs of operating vehicles and equipment. Although in the first few weeks of 2015 fuel prices have decreased significantly, there can be no assurances that rates will not return to historical levels. We cannot predict what effect global events or any future Middle East, Russia or other crisis could have on fuel prices, but it is possible that such events could lead to higher fuel prices. With respect to fuel, our Terminix fleet, which consumes approximately 11 million gallons annually, has been negatively impacted by significant increases in fuel prices in the past and could be negatively impacted in the future. Although we hedge a significant portion of our fuel costs, we do not hedge all of those costs. In 2014, we estimate we have used approximately 11 million gallons of fuel. As of September 30, 2014, a ten percent change in fuel prices would result in a change of approximately $4 million in our 2014 fuel cost before considering the impact of fuel swap contracts. Fuel price increases can also result in increases in the cost of chemicals and other materials used in our business. We cannot predict the extent to which we may experience future increases in costs of fuel, chemicals, refrigerants, appliances and equipment, parts, raw materials, wages and salaries, employee benefits, health care, vehicle, self-insurance costs and other insurance premiums as well as various regulatory compliance costs and other operating costs. To the extent such costs increase, we may be prevented, in whole or in part, from passing these cost increases through to our existing and prospective customers, and the rates we pay to our subcontractors and suppliers may increase, any of which could have a material adverse impact on our business, financial position, results of operations and cash flows.
We may not be able to attract and retain qualified key executives or transition smoothly to new leadership, which could adversely impact us and our businesses and inhibit our ability to operate and grow successfully.
The execution of our business strategy and our financial performance will continue to depend in significant part on our executive management team and other key management personnel. Any inability to attract in a timely manner other qualified key executives, retain our leadership team and recruit other important personnel could have a material adverse impact on our business, financial position, results of operations and cash flows.
Our franchisees and third-party distributors and vendors could take actions that could harm our business.
For the nine months ended September 30, 2014 and the year ended December 31, 2013, $106 million and $137 million, respectively, of our consolidated revenue was received in the form of franchise revenues. Accordingly, our financial results are dependent in part upon the operational and financial success of our franchisees. Our franchisees, third-party distributors and vendors are contractually obligated to operate their businesses in accordance with the standards set forth in our agreements with them. Each franchising brand also provides training and support to franchisees. However, franchisees, third-party distributors and vendors are independent third parties that we do not control, and who own, operate and oversee the daily operations of their businesses. As a result, the ultimate success of any franchise operation rests with the franchisee. If franchisees do not successfully
25
operate their businesses in a manner consistent with required standards, royalty payments to us will be adversely affected and our brands' image and reputation could be harmed, which in turn could adversely impact our business, financial position, results of operations and cash flows. Similarly, if third-party distributors, vendors and franchisees do not successfully operate their businesses in a manner consistent with required laws, standards and regulations, we could be subject to claims from regulators or legal claims for the actions or omissions of such third-party distributors, vendors and franchisees. In addition, our relationship with our franchisees, third-party distributors and vendors could become strained (including resulting in litigation) as we impose new standards or assert more rigorous enforcement practices of the existing required standards. These strains in our relationships or claims could have a material adverse impact on our reputation, business, financial position, results of operations and cash flows.
From time to time, we receive communications from our franchisees regarding complaints, disputes or questions about our practices and standards in relation to our franchised operations and certain economic terms of our franchise arrangements. If franchisees or groups representing franchisees were to bring legal proceedings against us, we would vigorously defend against the claims in any such proceeding, but our reputation, business, financial position, results of operations and cash flows could be materially adversely impacted and the price of our common stock could decline.
Disruptions or failures in our information technology systems could create liability for us or limit our ability to effectively monitor, operate and control our operations and adversely impact our reputation, business, financial position, results of operations and cash flows.
Our information technology systems facilitate our ability to monitor, operate and control our operations. Changes or modifications to our information technology systems could cause disruption to our operations or cause challenges with respect to our compliance with laws, regulations or other applicable standards. As the development and implementation of our information technology systems (including our operating systems) evolve, we may elect to modify, replace or abandon certain technology initiatives, which could result in write-downs. For example, in February 2014, American Home Shield ceased efforts to deploy a new operating system that had been intended to improve customer relationship management capabilities and enhance its operations. We recorded an impairment charge of $47 million in the nine months ended September 30, 2014 relating to this decision.
Any disruption in, capacity limitations, instability or failure to operate as expected of, our information technology systems, could, depending on the magnitude of the problem, adversely impact our business, financial position, results of operations and cash flows, including by limiting our capacity to monitor, operate and control our operations effectively. Failures of our information technology systems could also lead to violations of privacy laws, regulations, trade guidelines or practices related to our customers and associates. If our disaster recovery plans do not work as anticipated, or if the third-party vendors to which we have outsourced certain information technology, contact center or other services fail to fulfill their obligations to us, our operations may be adversely impacted, and any of these circumstances could adversely impact our reputation, business, financial position, results of operations and cash flows.
Changes in the services we deliver or the products we use could impact our reputation, business, financial position, results of operations and cash flows and our future plans.
Our financial performance is affected by changes in the services and products we offer our customers. For example, Terminix recently introduced new products relating to mosquito control, crawlspace encapsulation and wildlife exclusion. There can be no assurance that our new strategies or product offerings will succeed in increasing revenue and growing profitability. An unsuccessful execution of new strategies, including the rollout or adjustment of our new services or products or sales and marketing plans, could cause us to re-evaluate or change our business strategies and could have a
26
material adverse impact on our reputation, business, financial position, results of operations and cash flows and our future plans.
If we fail to protect the security of personal information about our customers, associates and third parties, we could be subject to interruption of our business operations, private litigation, reputational damage and costly penalties.
We rely on, among other things, commercially available systems, software, tools and monitoring to provide security for processing, transmission and storage of confidential information of customers, associates and third parties, such as payment card and personal information. The systems currently used for transmission and approval of payment card transactions, and the technology utilized in payment cards themselves, all of which can put payment card data at risk, are central to meeting standards set by the payment card industry, or "PCI." We continue to evaluate and modify our systems and protocols for PCI compliance purposes, and such PCI standards may change from time to time. Activities by third parties, advances in computer and software capabilities and encryption technology, new tools and discoveries and other events or developments may facilitate or result in a compromise or breach of our systems. Any compromises, breaches or errors in applications related to our systems or failures to comply with standards set by the PCI could cause damage to our reputation and interruptions in our operations, including our customers' ability to pay for our services and products by credit card or their willingness to purchase our services and products and could result in a violation of applicable laws, regulations, orders, industry standards or agreements and subject us to costs, penalties and liabilities which could have a material adverse impact on our reputation, business, financial position, results of operations and cash flows.
We may not be able to adequately protect our intellectual property and other proprietary rights that are material to our business.
Our ability to compete effectively depends in part on our rights to service marks, trademarks, trade names and other intellectual property rights we own or license, particularly our registered brand names, ServiceMaster, Terminix, American Home Shield, ServiceMaster Restore, ServiceMaster Clean, Merry Maids, Furniture Medic and AmeriSpec. We have not sought to register or protect every one of our marks either in the United States or in every country in which they are or may be used. Furthermore, because of the differences in foreign trademark, patent and other intellectual property or proprietary rights laws, we may not receive the same protection in other countries as we would in the United States. If we are unable to protect our proprietary information and brand names, we could suffer a material adverse impact on our reputation, business, financial position, results of operations and cash flows. Litigation may be necessary to enforce our intellectual property rights and protect our proprietary information, or to defend against claims by third parties that our products, services or activities infringe their intellectual property rights.
Future acquisitions or other strategic transactions could impact our reputation, business, financial position, results of operations and cash flows.
We may pursue strategic transactions in the future, which could involve acquisitions or dispositions of businesses or assets. Any future strategic transaction could involve integration or implementation challenges, business disruption or other risks, or change our business profile significantly. Any inability on our part to consolidate and manage growth from acquired businesses or successfully implement other strategic transactions could have an adverse impact on our reputation, business, financial position, results of operations and cash flows. Any acquisition that we make may not provide us with the benefits that were anticipated when entering into such acquisition. The process of integrating an acquired business may create unforeseen difficulties and expenses, including the diversion of resources needed to integrate new businesses, technologies, products, personnel or systems; the inability to retain associates,
27
customers and suppliers; the assumption of actual or contingent liabilities (including those relating to the environment); failure to effectively and timely adopt and adhere to our internal control processes and other policies; write-offs or impairment charges relating to goodwill and other intangible assets; unanticipated liabilities relating to acquired businesses; and potential expense associated with litigation with sellers of such businesses. Any future disposition transactions could also impact our business and may subject us to various risks, including failure to obtain appropriate value for the disposed businesses, post-closing claims being levied against us and disruption to our other businesses during the sale process or thereafter.
Laws and government regulations applicable to our businesses and lawsuits, enforcement actions and other claims by third parties or governmental authorities could increase our legal and regulatory expenses, and impact our business, financial position, results of operations and cash flows.
Our businesses are subject to significant international, federal, state, provincial and local laws and regulations. These laws and regulations include laws relating to consumer protection, wage and hour requirements, franchising, the employment of immigrants, labor relations, permitting and licensing, building code requirements, workers' safety, the environment, insurance and home warranties, employee benefits, marketing (including, without limitation, telemarketing) and advertising, the application and use of pesticides and other chemicals. In particular, we anticipate that various international, federal, state, provincial and local governing bodies may propose additional legislation and regulation that may be detrimental to our business or may substantially increase our operating costs, including increases in the minimum wage, environmental regulations related to chemical use, climate change, equipment efficiency standards, refrigerant production and use and other environmental matters; other consumer protection laws or regulations; health care coverage; or "do-not-knock," "do-not-mail," "do-not-leave" or other marketing regulations. It is difficult to predict the future impact of the broad and expanding legislative and regulatory requirements affecting our businesses and changes to such requirements may adversely affect our business, financial position, results of operations and cash flows. In addition, if we were to fail to comply with any applicable law or regulation, we could be subject to substantial fines or damages, be involved in lawsuits, enforcement actions and other claims by third parties or governmental authorities, suffer losses to our reputation, suffer the loss of licenses or incur penalties that may affect how our business is operated, which, in turn, could have a material adverse impact on our business, financial position, results of operations and cash flows.
In April 2014, the Bureau of Consumer Financial Protection, or the "CFPB," issued a Civil Investigative Demand, or the "CID," to American Home Shield seeking documents and information to determine whether home warranty providers or other unnamed persons have engaged or are engaging in unlawful acts and practices in connection with referral arrangements and relationships in violation of the Real Estate Settlement Procedures Act and its implementing regulation, or "RESPA," and other laws enforceable by the CFPB. American Home Shield believes that it has complied with RESPA and other laws applicable to American Home Shield's home warranty business. If the CFPB determines to bring an enforcement action, it could include demands for money penalties, changes to certain of American Home Shield's business practices and customer restitution or disgorgement.
Public perceptions that the products we use and the services we deliver are not environmentally friendly or safe may adversely impact the demand for our services.
In providing our services, we use, among other things, pesticides and other chemicals. Public perception that the products we use and the services we deliver are not environmentally friendly or safe or are harmful to humans or animals, whether justified or not, or our improper application of these chemicals, could reduce demand for our services, increase regulation or government restrictions or actions, result in fines or penalties, impair our reputation, involve us in litigation, damage our brand
28
names and otherwise have a material adverse impact on our business, financial position, results of operations and cash flows.
We may be required to recognize additional impairment charges.
We have significant amounts of goodwill and intangible assets, such as trade names, and have incurred impairment charges in 2013 and earlier periods with respect to goodwill and intangible assets. In the first quarter of 2014, we incurred impairment charges with respect to fixed assets, and we have also incurred impairment charges in the past in connection with our disposition activities. In accordance with applicable accounting standards, goodwill and intangible assets that are not amortized are subject to assessment for impairment by applying a fair-value based test annually, or more frequently if there are indicators of impairment, including:
- •
- significant adverse changes in the business climate, including economic or financial conditions;
- •
- significant adverse changes in expected operating results;
- •
- adverse actions or assessments by regulators;
- •
- unanticipated competition;
- •
- loss of key personnel; and
- •
- a current expectation that it is more likely than not that a reporting unit or intangible asset will be sold or otherwise disposed of.
In each of the past three years based on lower projected revenue and operating results for TruGreen, we recorded pre-tax non-cash impairment charges to reduce the carrying value of TruGreen's goodwill and the TruGreen trade name, respectively, as a result of our interim or annual impairment testing of indefinite-lived intangible assets. These charges were $417 million and $256 million, respectively in 2013, and $790 million and $119 million, respectively, in 2012.
As a result of the TruGreen Spin-off, we performed an interim impairment analysis as of January 14, 2014 on the TruGreen trade name. The assumptions were based on the TruGreen Business as a standalone company, and resulted in an impairment charge of $139 million during the first quarter of 2014.
In February 2014, American Home Shield ceased efforts to deploy a new operating system that had been intended to improve customer relationship management capabilities and enhance its operations. We recorded an impairment charge of $47 million in the nine months ended September 30, 2014 relating to this decision.
Based upon future economic and financial market conditions, the operating performance of our reporting units and other factors, including those listed above, we may incur impairment charges in the future. It is possible that such impairment, if required, could be material. Any future impairment charges that we are required to record could have a material adverse impact on our results of operations.
Compliance with, or violation of, environmental, health and safety laws and regulations, including laws pertaining to the use of pesticides could result in significant costs that adversely impact our reputation, business, financial position, results of operations and cash flows.
International, federal, state, provincial and local laws and regulations relating to environmental, health and safety matters affect us in several ways. In the United States, products containing pesticides generally must be registered with the U.S. Environmental Protection Agency, or the "EPA," and similar state agencies before they can be sold or applied. The failure to obtain or the cancellation of any such registration, or the withdrawal from the market place of such pesticides, could have an adverse effect
29
on our business, the severity of which would depend on the products involved, whether other products could be substituted and whether our competitors were similarly affected. The pesticides we use are manufactured by independent third parties and are evaluated by the EPA as part of its ongoing exposure risk assessment. The EPA may decide that a pesticide we use will be limited or will not be re-registered for use in the United States. We cannot predict the outcome or the severity of the effect of the EPA's continuing evaluations.
In addition, the use of certain pesticide products is regulated by various international, federal, state, provincial and local environmental and public health agencies. Although we strive to comply with such regulations and have processes in place designed to achieve compliance, given our dispersed locations, distributed operations and numerous associates, we may be unable to prevent violations of these or other regulations from occurring. Even if we are able to comply with all such regulations and obtain all necessary registrations and licenses, the pesticides or other products we apply or use, or the manner in which we apply or use them, could be alleged to cause injury to the environment, to people or to animals, or such products could be banned in certain circumstances. The regulations may also apply to third-party vendors who are hired to repair or remediate property and who may fail to comply with environmental laws, health and safety regulations and subject us to risk of legal exposure. The costs of compliance, non-compliance, remediation, combating unfavorable public perceptions or defending products liability lawsuits could have a material adverse impact on our reputation, business, financial position, results of operations and cash flows.
International, federal, state, provincial and local agencies regulate the disposal, handling and storage of waste, discharges from our facilities and the investigation and clean-up of contaminated sites. We could incur significant costs, including investigation and clean-up costs, fines, penalties and civil or criminal sanctions and claims by third parties for property damage and personal injury, as a result of violations of, or liabilities under, these laws and regulations. In addition, potentially significant expenditures could be required to comply with environmental, health and safety laws and regulations, including requirements that may be adopted or imposed in the future.
We are subject to various restrictive covenants that could adversely impact our business, financial position, results of operations and cash flows.
From time to time, we enter into noncompetition agreements or other restrictive covenants (e.g., exclusivity, take or pay and non-solicitation), including in connection with business dispositions or strategic contracts, that restrict us from entering into lines of business or operating in certain geographic areas into which we may desire to expand our business. We also are subject to various non-solicitation and no-hire covenants that may restrict our ability to solicit potential customers or associates. If we do not comply with such restrictive covenants, or if a dispute arises regarding the scope and interpretation thereof, litigation could ensue, which could have an adverse impact on our business, financial position, results of operations and cash flows. Further, to the extent that such restrictive covenants prevent us from taking advantage of business opportunities, our business, financial position, results of operations and cash flows may be adversely impacted.
Our business process outsourcing initiatives have increased our reliance on third-party contractors and may expose our business to harm upon the termination or disruption of our third-party contractor relationships.
Our strategy to increase profitability, in part, by reducing our costs of operations includes the implementation of certain business process outsourcing initiatives. Any disruption, termination or substandard performance of these outsourced services, including possible breaches by third-party vendors of their agreements with us, could adversely affect our brands, reputation, customer relationships, financial position, results of operations and cash flows. Also, to the extent a third-party outsourcing provider relationship is terminated, there is a risk that we may not be able to enter into a similar agreement with an alternate provider in a timely manner or on terms that we consider
30
favorable, and even if we find an alternate provider, or choose to insource such services, there are significant risks associated with any transitioning activities. In addition, to the extent we decide to terminate outsourcing services and insource such services, there is a risk that we may not have the capabilities to perform these services internally, resulting in a disruption to our business, which could adversely impact our reputation, business, financial position, results of operations and cash flows. We could incur costs, including personnel and equipment costs, to insource previously outsourced services like these, and these costs could adversely affect our results of operations and cash flows.
In addition, when a third-party provider relationship is terminated, there is a risk of disputes or litigation and that we may not be able to enter into a similar agreement with an alternate provider in a timely manner or on terms that we consider favorable, and even if we find an alternate provider, there are significant risks associated with any transitioning activities.
Our future success depends on our ability to attract, retain and maintain positive relations with trained workers and third-party contractors.
Our future success and financial performance depend substantially on our ability to attract, train and retain workers, attract and retain third-party contractors and ensure third-party contractor compliance with our policies and standards. Our ability to conduct our operations is in part impacted by our ability to increase our labor force, including on a seasonal basis, which may be adversely impacted by a number of factors. In the event of a labor shortage, we could experience difficulty in delivering our services in a high-quality or timely manner and could be forced to increase wages in order to attract and retain associates, which would result in higher operating costs and reduced profitability. New decisions and rules by the National Labor Relations Board, including "expedited elections" and restrictions on appeals, could lead to increased organizing activities at our subsidiaries or franchisees. If these labor organizing activities were successful, it could further increase labor costs, decrease operating efficiency and productivity in the future, or otherwise disrupt or negatively impact our operations. In addition, potential competition from key associates who leave ServiceMaster could impact our ability to maintain our market segment share in certain geographic areas.
Risks Related to Our Substantial Indebtedness
We have substantial indebtedness and may incur substantial additional indebtedness, which could adversely affect our financial health and our ability to obtain financing in the future, react to changes in our business and satisfy our obligations.
As of September 30, 2014, we had approximately $3.1 billion of total long-term consolidated indebtedness outstanding. On July 1, 2014, in connection with our initial public offering, SvM terminated its existing credit agreements governing the Old Credit Facilities and entered into the Credit Facilities. As of September 30, 2014, SvM had $161 million of available borrowing capacity under the Revolving Credit Facility. In addition, we are able to incur additional indebtedness in the future, subject to the limitations contained in the agreements governing our indebtedness. Our substantial indebtedness could have important consequences to you. Because of our substantial indebtedness:
- •
- our ability to engage in acquisitions without raising additional equity or obtaining additional debt financing is limited;
- •
- our ability to obtain additional financing for working capital, capital expenditures, acquisitions, debt service requirements or
general corporate purposes and our ability to satisfy our obligations with respect to our indebtedness may be impaired in the future;
- •
- a large portion of our cash flow from operations must be dedicated to the payment of principal and interest on our indebtedness, thereby reducing the funds available to us for other purposes;
31
- •
- we are exposed to the risk of increased interest rates because a portion of our borrowings are or will be at variable rates of
interest;
- •
- it may be more difficult for us to satisfy our obligations to our creditors, resulting in possible defaults on, and acceleration of,
such indebtedness;
- •
- we may be more vulnerable to general adverse economic and industry conditions;
- •
- we may be at a competitive disadvantage compared to our competitors with proportionately less indebtedness or with comparable
indebtedness on more favorable terms and, as a result, they may be better positioned to withstand economic downturns;
- •
- our ability to refinance indebtedness may be limited or the associated costs may increase;
- •
- our flexibility to adjust to changing market conditions and ability to withstand competitive pressures could be limited; and
- •
- we may be prevented from carrying out capital spending and restructurings that are necessary or important to our growth strategy and efforts to improve operating margins of our businesses.
Increases in interest rates would increase the cost of servicing our indebtedness and could reduce our profitability.
A significant portion of our outstanding indebtedness, including indebtedness incurred under the Credit Facilities, bears interest at variable rates. As a result, increases in interest rates would increase the cost of servicing our indebtedness and could materially reduce our profitability and cash flows. As of September 30, 2014, each one percentage point change in interest rates would result in an approximately $15 million change in the annual interest expense on our Term Loan Facility after considering the impact of the effective interest rate swaps. Assuming all revolving loans were fully drawn as of September 30, 2014, each one percentage point change in interest rates would result in an approximately $3 million change in annual interest expense on our Revolving Credit Facility. The impact of increases in interest rates could be more significant for us than it would be for some other companies because of our substantial indebtedness.
A lowering or withdrawal of the ratings, outlook or watch assigned to our debt securities by rating agencies may increase our future borrowing costs and reduce our access to capital.
Our indebtedness currently has a non-investment grade rating, and any rating, outlook or watch assigned could be lowered or withdrawn entirely by a rating agency if, in that rating agency's judgment, current or future circumstances relating to the basis of the rating, outlook, or watch such as adverse changes to our business, so warrant. Any future lowering of our ratings, outlook or watch likely would make it more difficult or more expensive for us to obtain additional debt financing.
The agreements and instruments governing our indebtedness contain restrictions and limitations that could significantly impact our ability to operate our business.
The Credit Facilities and the indenture governing our 2020 Notes contain covenants that, among other things, restrict the ability of SvM and its subsidiaries to:
- •
- incur additional indebtedness (including guarantees of other indebtedness);
- •
- pay dividends to ServiceMaster, redeem stock, or make other restricted payments, including investments and, in the case of the
Revolving Credit Facility, make acquisitions;
- •
- prepay, repurchase or amend the terms of certain outstanding indebtedness;
- •
- enter into certain types of transactions with affiliates;
32
- •
- transfer or sell assets;
- •
- create liens;
- •
- merge, consolidate or sell all or substantially all of our assets; and
- •
- enter into agreements restricting dividends or other distributions by subsidiaries to SvM.
The restrictions in the indenture governing the 2020 Notes, the Credit Facilities and the instruments governing SvM's other indebtedness may prevent us from taking actions that we believe would be in the best interest of our business and may make it difficult for us to execute our business strategy successfully or effectively compete with companies that are not similarly restricted. We may also incur future debt obligations that might subject us to additional restrictive covenants that could affect our financial and operational flexibility. We may be unable to refinance our indebtedness, at maturity or otherwise, on terms acceptable to us, or at all.
The ability of SvM to comply with the covenants and restrictions contained in the Credit Facilities, the indenture governing the 2020 Notes, and the instruments governing our other indebtedness may be affected by economic, financial and industry conditions beyond our control including credit or capital market disruptions. The breach of any of these covenants or restrictions could result in a default that would permit the applicable lenders or noteholders, as the case may be, to declare all amounts outstanding thereunder to be due and payable, together with accrued and unpaid interest. If we are unable to repay indebtedness, lenders having secured obligations, such as the lenders under the Credit Facilities, could proceed against the collateral securing the indebtedness. In any such case, we may be unable to borrow under the Credit Facilities and may not be able to repay the amounts due under such facilities or our other outstanding indebtedness. This could have serious consequences to our financial position and results of operations and could cause us to become bankrupt or insolvent.
Our ability to generate the significant amount of cash needed to pay interest and principal on our indebtedness and our ability to refinance all or a portion of our indebtedness or obtain additional financing depends on many factors beyond our control.
ServiceMaster and SvM are each holding companies, and as such they have no independent operations or material assets other than ownership of equity interests in their respective subsidiaries. ServiceMaster and SvM each depend on their respective subsidiaries to distribute funds to them so that they may pay obligations and expenses, including satisfying obligations with respect to indebtedness. Our ability to make scheduled payments on, or to refinance our obligations under, our indebtedness depends on the financial and operating performance of our subsidiaries, and their ability to make distributions and dividends to us, which, in turn, depends on their results of operations, cash flows, cash requirements, financial position and general business conditions and any legal and regulatory restrictions on the payment of dividends to which they may be subject, many of which may be beyond our control.
There are third-party restrictions on the ability of certain of our subsidiaries to transfer funds to us. If we cannot receive sufficient distributions from our subsidiaries, we may not be able to meet our obligations to fund general corporate expenses or service our debt obligations. These restrictions are related to regulatory requirements at American Home Shield and to a subsidiary borrowing arrangement at The ServiceMaster Acceptance Company Limited Partnership, or "SMAC." The payment of ordinary and extraordinary dividends by our home warranty and similar subsidiaries (through which we conduct our American Home Shield business) are subject to significant regulatory restrictions under the laws and regulations of the states in which they operate. Among other things, such laws and regulations require certain such subsidiaries to maintain minimum capital and net worth requirements and may limit the amount of ordinary and extraordinary dividends and other payments that these subsidiaries can pay to us. As of September 30, 2014, the total net assets subject to these
33
third-party restrictions was $184 million. Such limitations were in effect through the end of 2014, and similar limitations are expected to be in effect in 2015.
We may be unable to maintain a level of cash flows from operating activities sufficient to permit us to pay the principal and interest on our indebtedness. If our cash flow and capital resources are insufficient to fund our debt service obligations, we may be forced to reduce or delay capital expenditures, sell assets, seek to obtain additional equity capital or restructure our indebtedness. In the future, our cash flow and capital resources may not be sufficient for payments of interest on and principal of our indebtedness, and such alternative measures may not be successful and may not permit us to meet our scheduled debt service obligations.
The $1,807 million of outstanding borrowings under the Term Facilities, after including the unamortized portion of the original issue discount paid, have a maturity date of July 1, 2021. The Revolving Credit Facility is also scheduled to mature on July 1, 2021. The 8% 2020 Notes will mature on February 15, 2020, and the 7% 2020 Notes will mature on August 15, 2020. We may be unable to refinance any of our indebtedness or obtain additional financing, particularly because of our high levels of indebtedness. Market disruptions, such as those experienced in 2008 and 2009, as well as our significant indebtedness levels, may increase our cost of borrowing or adversely affect our ability to refinance our obligations as they become due. If we are unable to refinance our indebtedness or access additional credit, or if short-term or long-term borrowing costs dramatically increase, our ability to finance current operations and meet our short-term and long-term obligations could be adversely affected.
If our subsidiary, SvM, cannot make scheduled payments on its indebtedness, it will be in default, holders of the 2020 Notes could declare all outstanding principal and interest to be due and payable, the lenders under the Credit Facilities could terminate their commitments to loan money, the secured lenders could foreclose against the assets securing their borrowings and we could be forced into bankruptcy or liquidation.
Risks Related to Our Common Stock and This Offering
ServiceMaster is a holding company with no operations of its own, and it depends on its subsidiaries for cash to fund all of its operations and expenses, including to make future dividend payments, if any.
ServiceMaster's operations are conducted entirely through our subsidiaries, and our ability to generate cash to fund our operations and expenses, to pay dividends or to meet debt service obligations is highly dependent on the earnings and the receipt of funds from our subsidiaries through dividends or intercompany loans. Deterioration in the financial condition, earnings or cash flow of SvM and its subsidiaries for any reason could limit or impair their ability to pay such distributions. Additionally, to the extent that ServiceMaster needs funds, and its subsidiaries are restricted from making such distributions under applicable law or regulation or under the terms of our financing arrangements, or are otherwise unable to provide such funds, it could materially adversely affect our business, financial condition, results of operations or prospects.
For example, there are third-party restrictions on the ability of certain of our subsidiaries to transfer funds to us. If we cannot receive sufficient distributions from our subsidiaries, we may not be able to meet our obligations to fund general corporate expenses or service our debt obligations. These restrictions are related to regulatory requirements at American Home Shield and to a subsidiary borrowing arrangement at SMAC. The payment of ordinary and extraordinary dividends by our home warranty and similar subsidiaries (through which we conduct our American Home Shield business) are subject to significant regulatory restrictions under the laws and regulations of the states in which they operate. Among other things, such laws and regulations require certain such subsidiaries to maintain minimum capital and net worth requirements and may limit the amount of ordinary and extraordinary dividends and other payments that these subsidiaries can pay to us. As of September 30, 2014, the total
34
net assets subject to these third-party restrictions was $184 million. Such limitations were in effect through the end of 2014, and similar limitations are expected to be in effect in 2015.
Further, the terms of the indenture governing the 2020 Notes and the agreements governing the Credit Facilities significantly restrict the ability of our subsidiaries to pay dividends, make loans or otherwise transfer assets to ServiceMaster. Furthermore, our subsidiaries are permitted under the terms of the Credit Facilities and other indebtedness to incur additional indebtedness that may restrict or prohibit the making of distributions, the payment of dividends or the making of loans by such subsidiaries to us. In addition, Delaware law may impose requirements that may restrict our ability to pay dividends to holders of our common stock.
We do not currently expect to declare or pay dividends on our common stock for the foreseeable future. Payments of dividends, if any, will be at the sole discretion of our board of directors after taking into account various factors, including general and economic conditions, our financial condition and operating results, our available cash and current and anticipated cash needs, capital requirements, contractual, legal, tax and regulatory restrictions and implications of the payment of dividends by us to our stockholders or by our subsidiaries (including SvM) to us, and such other factors as our board of directors may deem relevant. In addition, Delaware law may impose requirements that may restrict our ability to pay dividends to holders of our common stock. To the extent that we determine in the future to pay dividends on our common stock, none of our subsidiaries will be obligated to make funds available to us for the payment of dividends.
The market price of our common stock may be volatile and could decline after this offering.
Volatility in the market price of our common stock may prevent you from being able to sell your shares at or above the price you paid for your shares. The market price of our common stock may fluctuate significantly. Among the factors that could affect our stock price are:
- •
- industry or general market conditions;
- •
- domestic and international economic factors unrelated to our performance;
- •
- changes in our customers' preferences;
- •
- new regulatory pronouncements and changes in regulatory guidelines;
- •
- lawsuits, enforcement actions and other claims by third parties or governmental authorities;
- •
- actual or anticipated fluctuations in our quarterly operating results;
- •
- changes in securities analysts' estimates of our financial performance or lack of research coverage and reports by industry analysts;
- •
- action by institutional stockholders or other large stockholders (including the Equity Sponsors), including additional future sales of
our common stock;
- •
- failure to meet any guidance given by us or any change in any guidance given by us, or changes by us in our guidance practices;
- •
- announcements by us of significant impairment charges;
- •
- speculation in the press or investment community;
- •
- investor perception of us and our industry;
- •
- changes in market valuations or earnings of similar companies;
- •
- announcements by us or our competitors of significant contracts, acquisitions, dispositions or strategic partnerships;
35
- •
- war, terrorist acts and epidemic disease;
- •
- any future sales of our common stock or other securities; and
- •
- additions or departures of key personnel.
The stock markets have experienced extreme volatility in recent years that has been unrelated to the operating performance of particular companies. These broad market fluctuations may adversely affect the market price of our common stock. In the past, following periods of volatility in the market price of a company's securities, class action litigation has often been instituted against the affected company. Any litigation of this type brought against us could result in substantial costs and a diversion of our management's attention and resources, which would harm our business, operating results and financial condition.
Future sales of shares by existing stockholders could cause our stock price to decline.
Sales of substantial amounts of our common stock in the public market following this offering, or the perception that these sales could occur, could cause the market price of our common stock to decline. These sales, or the possibility that these sales may occur, also might make it more difficult for us to sell equity securities in the future at a time and at a price that we deem appropriate.
As of January 20, 2015, we had 134,255,002 outstanding shares of common stock. Of these shares, all of the 41,285,000 shares of common stock sold in our initial public offering are, and the 25,000,000 shares of common stock to be sold in this offering will be, freely transferable without restriction or further registration under the Securities Act of 1933, as amended, or the "Securities Act," except for any shares held by "affiliates," as that term is defined in Rule 144 under the Securities Act, or "Rule 144." In July 2014, we filed a registration statement on Form S-8 under the Securities Act to register the shares of common stock to be issued under our equity compensation plans and, as a result, all shares of common stock acquired upon exercise of (i) stock options granted under these plans and (ii) other equity-based awards granted under the Omnibus Incentive Plan (as defined below), including approximately 600,000 shares of our common stock that have been sold in the public market through the exercise of stock options as of January 20, 2015, are freely tradable under the Securities Act, subject to the terms of the lock-up agreements, unless purchased by our affiliates. As of January 20, 2015, there were stock options outstanding to purchase a total of 4,436,269 shares of our common stock and there were 425,922 shares of our common stock subject to restricted stock units. In addition, 7,971,137 shares of our common stock are reserved for future issuances under our Omnibus Incentive Plan.
The remaining shares of our common stock outstanding as of January 20, 2015 are restricted securities within the meaning of Rule 144 under the Securities Act, but will be eligible for resale subject to applicable volume, means of sale, holding period and other limitations of Rule 144 under the Securities Act or pursuant to an exception from registration under Rule 701 under the Securities Act, or "Rule 701" subject to the lock-up agreements to be entered into by us, our executive officers and directors, and the selling stockholders in this offering.
In connection with this offering, we, our executive officers and directors, and the selling stockholders in this offering will sign lock-up agreements under which, subject to certain exceptions, we and they will agree not to offer or sell, directly or indirectly, any shares of our common stock or any securities convertible into or exercisable or exchangeable for shares of our common stock for a period of 90 days after the date of this prospectus, subject to possible extension under certain circumstances, except with the prior written consent of J.P. Morgan Securities LLC and Credit Suisse Securities (USA) LLC. See "Underwriting (Conflicts of Interest)." Following the expiration of this 90-day lock-up period, the shares of our common stock subject to the underwriters' lock-up agreements will be eligible for future sale, subject to the applicable volume, manner of sale, holding period and other limitations
36
of Rule 144 under the Securities Act or pursuant to an exception from registration under Rule 701 under the Securities Act. See "Shares Available for Future Sale" for a discussion of the shares of common stock that may be sold into the public market in the future. In addition, our significant stockholders may distribute shares that they hold to their investors who themselves may then sell into the public market following the expiration of the lock-up period. Such sales may not be subject to the volume, manner of sale, holding period and other limitations of Rule 144 under the Securities Act. As resale restrictions end, the market price of our common stock could decline if the holders of those shares sell them or are perceived by the market as intending to sell them. Furthermore, certain of the Equity Sponsors will have the right to require us to register shares of common stock for resale in some circumstances.
In the future, we may issue additional shares of common stock or other equity or debt securities convertible into or exercisable or exchangeable for shares of our common stock in connection with a financing, acquisition, litigation settlement or employee arrangement or otherwise. Any of these issuances could result in substantial dilution to our existing stockholders and could cause the trading price of our common stock to decline.
If securities or industry analysts do not publish research or publish misleading or unfavorable research about our business, our stock price and trading volume could decline.
The trading market for our common stock depends in part on the research and reports that securities or industry analysts publish about us or our business. If one or more of the analysts that covers our common stock downgrades our stock or publishes misleading or unfavorable research about our business, our stock price would likely decline. If one or more of the analysts ceases coverage of our common stock or fails to publish reports on us regularly, demand for our common stock could decrease, which could cause our common stock price or trading volume to decline.
A few significant stockholders will have significant influence over us and may not always exercise their influence in a way that benefits our public stockholders.
Following the completion of this offering, we anticipate that the CD&R Funds and the StepStone Funds will own approximately 31.8% and 7.0%, respectively, of the outstanding shares of our common stock assuming that the underwriters do not exercise their option to purchase additional shares. In connection with our initial public offering, in June 2014, we and the Equity Sponsors entered into an amendment and restatement to our then-existing stockholders agreement, or the "amended stockholders agreement," pursuant to which the CD&R Funds and the StepStone Funds agreed to vote in favor of one another's designees to our board of directors, among other matters. As a result, the CD&R Funds and the StepStone Funds will continue to exercise significant influence over all matters requiring stockholder approval for the foreseeable future, including approval of significant corporate transactions, which may reduce the market price of our common stock.
Even though following the completion of this offering, the CD&R Funds and the StepStone Funds will no longer collectively beneficial own more than 50% of our outstanding common stock, they will likely still be able to assert significant influence over our board of directors and certain corporate actions. Following the consummation of this offering, the CD&R Funds will continue to have the right to designate for nomination for election at least 30% of the total number of directors comprising the board so long as the CD&R Funds own at least 30% but less than 40% of our common stock, and at least 20% of the total number of directors comprising the board so long as the CD&R Funds own at least 20% but less than 30% of our common stock. Following the consummation of this offering, the StepStone Funds will continue to have the right to designate for nomination for election one director so long as the StepStone Funds own at least 5% of our common stock.
37
Because the CD&R Funds' and the StepStone Funds' interests may differ from your interests, actions the CD&R Funds and the StepStone Funds take as our controlling stockholders or as significant stockholders may not be favorable to you. For example, the concentration of ownership held by the CD&R Funds and the StepStone Funds could delay, defer or prevent a change of control of us or impede a merger, takeover or other business combination which another stockholder may otherwise view favorably. Other potential conflicts could arise, for example, over matters such as employee retention or recruiting, or our dividend policy.
Under our amended and restated certificate of incorporation, the CD&R Funds and the StepStone Funds and their respective affiliates and, in some circumstances, any of our directors and officers who is also a director, officer, employee, member or partner of the CD&R Funds and the StepStone Funds and their respective affiliates, have no obligation to offer us corporate opportunities.
The policies relating to corporate opportunities and transactions with the CD&R Funds and the StepStone Funds set forth in our second amended and restated certificate of incorporation, or "amended and restated certificate of incorporation," address potential conflicts of interest between ServiceMaster, on the one hand, and the CD&R Funds and the StepStone Funds and their respective officers, directors, employees, members or partners who are directors or officers of our company, on the other hand. In accordance with those policies, the CD&R Funds and the StepStone Funds may pursue corporate opportunities, including acquisition opportunities that may be complementary to our business, without offering those opportunities to us. By becoming a stockholder in ServiceMaster, you will be deemed to have notice of and have consented to these provisions of our amended and restated certificate of incorporation. Although these provisions are designed to resolve conflicts between us and the CD&R Funds and the StepStone Funds and their respective affiliates fairly, conflicts may not be so resolved.
Future offerings of debt or equity securities which would rank senior to our common stock may adversely affect the market price of our common stock.
If, in the future, we decide to issue debt or equity securities that rank senior to our common stock, it is likely that such securities will be governed by an indenture or other instrument containing covenants restricting our operating flexibility. Additionally, any convertible or exchangeable securities that we issue in the future may have rights, preferences and privileges more favorable than those of our common stock and may result in dilution to owners of our common stock. We and, indirectly, our stockholders, will bear the cost of issuing and servicing such securities. Because our decision to issue debt or equity securities in any future offering will depend on market conditions and other factors beyond our control, we cannot predict or estimate the amount, timing or nature of our future offerings. Thus, holders of our common stock will bear the risk of our future offerings reducing the market price of our common stock and diluting the value of their stock holdings in us.
Fulfilling our obligations incident to being a public company, including with respect to the requirements of and related rules under the Sarbanes-Oxley Act of 2002, is expensive and time-consuming, and any delays or difficulties in satisfying these obligations could have a material adverse effect on our future results of operations and our stock price.
Our initial public offering was completed on July 1, 2014. As a public company, we are subject to the reporting and corporate governance requirements, under the listing standards of the New York Stock Exchange, or the "NYSE," and the Sarbanes-Oxley Act of 2002, that apply to issuers of listed equity, which impose certain significant compliance costs and obligations upon us. The changes necessitated by being a publicly listed company require a significant commitment of additional resources and management oversight which increase our operating costs. Other expenses associated with being a public company include increases in auditing, accounting and legal fees and expenses,
38
investor relations expenses, increased directors' fees and director and officer liability insurance costs, registrar and transfer agent fees and listing fees, as well as other expenses. As a public company, we are required, among other things, to define and expand the roles and the duties of our board of directors and its committees and institute more comprehensive compliance and investor relations functions. Failure to comply with the Sarbanes-Oxley Act of 2002 could potentially subject us to sanctions or investigations by the SEC, the NYSE or other regulatory authorities.
Anti-takeover provisions in our amended and restated certificate of incorporation and amended and restated by-laws could discourage, delay or prevent a change of control of our company and may affect the trading price of our common stock.
Our amended and restated certificate of incorporation and amended and restated by-laws include a number of provisions that may discourage, delay or prevent a change in our management or control over us that stockholders may consider favorable. For example, our amended and restated certificate of incorporation and amended and restated by-laws collectively:
- •
- authorize the issuance of "blank check" preferred stock that could be issued by our board of directors to thwart a takeover attempt;
- •
- provide for a classified board of directors, which divides our board of directors into three classes, with members of each class
serving staggered three-year terms, which prevents stockholders from electing an entirely new board of directors at an annual meeting;
- •
- limit the ability of stockholders to remove directors;
- •
- provide that vacancies on our board of directors, including vacancies resulting from an enlargement of our board of directors, may be
filled only by a majority vote of directors then in office;
- •
- prohibit stockholders from calling special meetings of stockholders;
- •
- prohibit stockholder action by written consent, thereby requiring all actions to be taken at a meeting of the stockholders;
- •
- establish advance notice requirements for nominations of candidates for election as directors or to bring other business before an
annual meeting of our stockholders; and
- •
- require the approval of holders of at least 662/3% of the outstanding shares of our common stock to amend our amended and restated by-laws and certain provisions of our amended and restated certificate of incorporation.
These provisions may prevent our stockholders from receiving the benefit from any premium to the market price of our common stock offered by a bidder in a takeover context. Even in the absence of a takeover attempt, the existence of these provisions may adversely affect the prevailing market price of our common stock if the provisions are viewed as discouraging takeover attempts in the future.
Our amended and restated certificate of incorporation and amended and restated by-laws may also make it difficult for stockholders to replace or remove our management. Furthermore, the existence of the foregoing provisions, as well as the significant amount of common stock that the CD&R Funds and the StepStone Funds will own following this offering, could limit the price that investors might be willing to pay in the future for shares of our common stock. These provisions may facilitate management entrenchment that may delay, deter, render more difficult or prevent a change in our control, which may not be in the best interests of our stockholders.
39
We do not intend to pay dividends on our common stock and, consequently, your ability to achieve a return on your investment will depend on appreciation in the price of our common stock.
We do not intend to declare and pay dividends on our common stock for the foreseeable future. We currently intend to use our future earnings, if any, to repay debt, to fund our growth, to develop our business, for working capital needs and general corporate purposes. Therefore, you are not likely to receive any dividends on your common stock for the foreseeable future and the success of an investment in shares of our common stock will depend upon any future appreciation in their value. There is no guarantee that shares of our common stock will appreciate in value or even maintain the price at which our stockholders have purchased their shares. In addition, ServiceMaster's operations are conducted almost entirely through our subsidiaries. As such, to the extent that we determine in the future to pay dividends on our common stock, none of our subsidiaries will be obligated to make funds available to ServiceMaster for the payment of dividends. Further, the indenture governing the 2020 Notes and the agreements governing our Credit Facilities significantly restrict the ability of our subsidiaries to pay dividends or otherwise transfer assets to us. In addition, the payment of ordinary and extraordinary dividends by our subsidiaries that are regulated as insurance, home service, or similar companies is subject to applicable state law limitations, and Delaware law may impose additional requirements that may restrict our ability to pay dividends to holders of our common stock.
Upon completion of this offering, we will no longer be a "controlled company" within the meaning of the NYSE rules. However, we may continue to rely on exemptions from certain corporate governance requirements during a one-year transition period.
After the completion of this offering, the CD&R Funds and the StepStone Funds will no longer control a majority of the voting power of our outstanding common stock. Accordingly, we will no longer be a "controlled company" within the meaning of the NYSE corporate governance standards. Consequently, the NYSE rules will require that we (i) have a majority of independent directors to our board of directors within one year of the date we no longer qualify as a "controlled company"; (ii) have at least one independent director on each of the Compensation and Nominating and Corporate Governance committees on the date we no longer qualify as a "controlled company," at least a majority of independent directors on each of the Compensation and Nominating and Corporate Governance committees within 90 days of such date and Compensation and Nominating and Corporate Governance committees composed entirely of independent directors within one year of such date and (iii) perform an annual performance evaluation of the Nominating and Corporate Governance and Compensation Committees. During this transition period, we may continue to utilize the available exemptions from certain corporate governance requirements as permitted by the NYSE rules. Accordingly, during the transition period you will not have the same protections afforded to stockholders of companies that are subject to all of the corporate governance requirements of the NYSE.
Our amended and restated certificate of incorporation designates the Court of Chancery of the State of Delaware as the exclusive forum for certain litigation that may be initiated by our stockholders, which could limit our stockholders' ability to obtain a favorable judicial forum for disputes with us.
Our amended and restated certificate of incorporation provides that the Court of Chancery of the State of Delaware is the sole and exclusive forum for (i) any derivative action or proceeding brought on our behalf, (ii) any action asserting a claim of breach of a fiduciary duty owed to us or our stockholders by any of our directors, officers, employees or agents, (iii) any action asserting a claim against us arising under the General Corporation Law of the State of Delaware, or the "DGCL," or (iv) any action asserting a claim against us that is governed by the internal affairs doctrine. By becoming a stockholder in our company, you will be deemed to have notice of and have consented to the provisions of our amended and restated certificate of incorporation related to choice of forum. The
40
choice of forum provision in our amended and restated certificate of incorporation may limit our stockholders' ability to obtain a favorable judicial forum for disputes with us.
Risks Related to the TruGreen Spin-off
If the TruGreen Spin-off were ultimately determined to be a taxable transaction for U.S. federal income tax purposes, then we could be subject to significant tax liability.
In connection with the TruGreen Spin-off we received an opinion of tax counsel with respect to the tax-free nature of the TruGreen Spin-off to ServiceMaster, TruGreen and ServiceMaster's stockholders under Section 355 and related provisions of the Internal Revenue Code of 1986, as amended, or the "Code." The opinion relied on an Internal Revenue Service, or "IRS," private letter ruling as to matters covered by the ruling. The tax opinion was based on, among other things, certain assumptions and representations as to factual matters made by us, which, if incorrect or inaccurate in any material respect, would jeopardize the conclusions reached by tax counsel in its opinion. The opinion is not binding on the IRS or the courts, and the IRS or the courts may not agree with the opinion. If the TruGreen Spin-off were ultimately determined not to be tax-free, we could be liable for the U.S. federal income taxes imposed as a result of the transaction. Furthermore, events subsequent to the TruGreen Spin-off could cause us to recognize a taxable gain in connection therewith. In addition, as is customary with tax-free spin-off transactions, we and the Equity Sponsors are limited in our ability to pursue certain strategic transactions with respect to SvM.
Federal and state fraudulent transfer laws and Delaware corporate law may permit a court to void the TruGreen Spin-off, which would adversely affect our financial condition and our results of operations.
In connection with the TruGreen Spin-off, we undertook several corporate restructuring transactions which, along with the contributions and distributions to be made as part of the spin-off, may be subject to challenge under federal and state fraudulent conveyance and transfer laws as well as under Delaware corporate law.
Under applicable laws, any transaction, contribution or distribution completed as part of the spin-off could be voided as a fraudulent transfer or conveyance if, among other things, the transferor received less than reasonably equivalent value or fair consideration in return and was insolvent or rendered insolvent by reason of the transfer.
We cannot be certain as to the standards a court would use to determine whether or not any entity involved in the spin-off was insolvent at the relevant time. In general, however, a court would look at various facts and circumstances related to the entity in question, including evaluation of whether or not:
- •
- the sum of its debts, including contingent and unliquidated liabilities, was greater than the fair saleable value of all of its
assets;
- •
- the present fair saleable value of its assets was less than the amount that would be required to pay its probable liability on its
existing debts, including contingent liabilities, as they become absolute and mature; or
- •
- it could not pay its debts as they became due.
If a court were to find that any transaction, contribution or distribution involved in the spin-off was a fraudulent transfer or conveyance, the court could void the transaction, contribution or distribution. In addition, the spin-off could also be voided if a court were to find that the spin-off was not a legal dividend under Delaware corporate law. The resulting complications, costs and expenses of either finding could materially adversely affect our business, financial condition and results of operations.
41
Our directors and officers may have actual or potential conflicts of interest because of their equity ownership in New TruGreen.
Our directors and officers may own shares of New TruGreen's common stock or be affiliated with certain equity owners of New TruGreen. This ownership may create, or may create the appearance of, conflicts of interest when these directors and officers are faced with decisions that could have different implications for us and New TruGreen. In connection with the TruGreen Spin-off, we entered into a transition services agreement with New TruGreen under which we will provide a range of support services to New TruGreen for a limited period of time. Potential conflicts of interest could arise in connection with the resolution of any dispute that may arise between us and New TruGreen regarding the terms of the transition services agreement or other agreements governing the TruGreen Spin-off and the relationship thereafter between the companies.
42
This prospectus contains forward-looking statements and cautionary statements. Some of the forward-looking statements can be identified by the use of forward-looking terms such as "believes," "expects," "may," "will," "shall," "should," "would," "could," "seeks," "aims," "projects," "is optimistic," "intends," "plans," "estimates," "anticipates" or other comparable terms. Forward-looking statements include, without limitation, all matters that are not historical facts. They appear in a number of places throughout this prospectus and include, without limitation, statements regarding our intentions, beliefs, assumptions or current expectations concerning, among other things, our expected revenue and Adjusted EBITDA ranges for 2014; financial position; results of operations; cash flows; prospects; commodities trends; growth strategies or expectations; customer retention; the continuation of acquisitions, including the integration of any acquired company and risks relating to any such acquired company; fuel prices; estimates of future amortization expense for intangible assets; attraction and retention of key personnel; the impact of fuel swaps; the valuation of marketable securities; estimates of accruals for self-insured claims related to workers' compensation, auto and general liability risks; estimates of accruals for home warranty claims; estimates of future payments under operating and capital leases; the outcome (by judgment or settlement) and costs of legal or administrative proceedings, including, without limitation, collective, representative or class action litigation; and the impact of prevailing economic conditions.
Forward-looking statements are subject to known and unknown risks and uncertainties, many of which may be beyond our control. We caution you that forward-looking statements are not guarantees of future performance or outcomes and that actual performance and outcomes, including, without limitation, our actual results of operations, financial condition and liquidity, and the development of the market segments in which we operate, may differ materially from those made in or suggested by the forward-looking statements contained in this prospectus. In addition, even if our results of operations, financial condition and cash flows, and the development of the market segments in which we operate, are consistent with the forward-looking statements contained in this prospectus, those results or developments may not be indicative of results or developments in subsequent periods. A number of important factors, including, without limitation, the risks and uncertainties discussed in "Risk Factors" and "Management's Discussion and Analysis of Financial Condition and Results of Operations" in this prospectus, could cause actual results and outcomes to differ materially from those reflected in the forward-looking statements. Additional factors that could cause actual results and outcomes to differ from those reflected in forward-looking statements include, without limitation:
- •
- weakening general economic conditions, especially as they may affect home sales, unemployment and consumer confidence or spending
levels;
- •
- our ability to successfully implement our business strategies;
- •
- adverse credit and financial markets impeding access, increasing financing costs or causing our customers to incur liquidity issues
leading to some of our services not being purchased or cancelled;
- •
- cyber security breaches, disruptions or failures in our information technology systems and our failure to protect the security of
personal information about our customers;
- •
- our ability to attract and retain key personnel, including our ability to attract, retain and maintain positive relations with trained
workers and third-party contractors;
- •
- increases in prices for fuel and raw materials, and in minimum wage levels;
- •
- changes in the source and intensity of competition in our market segments;
- •
- adverse weather conditions;
43
- •
- our franchisees and third-party distributors and vendors taking actions that harm our business;
- •
- changes in our services or products;
- •
- our recognition of future impairment charges;
- •
- our ability to protect our intellectual property and other material proprietary rights;
- •
- negative reputational and financial impacts resulting from future acquisitions, dispositions or strategic transactions;
- •
- laws and governmental regulations increasing our legal and regulatory expenses;
- •
- lawsuits, enforcement actions and other claims by third parties or governmental authorities;
- •
- compliance with, or violation of, environmental, health and safety laws and regulations;
- •
- increases in interest rates increasing the cost of servicing our substantial indebtedness;
- •
- increased borrowing costs due to lowering or withdrawal of the ratings, outlook or watch assigned to our debt securities;
- •
- restrictions contained in our debt agreements;
- •
- our ability to refinance all or a portion of our indebtedness or obtain additional financing; and
- •
- other factors described in this prospectus and from time to time in documents that we file with the SEC.
You should read this prospectus completely and with the understanding that actual future results may be materially different from expectations. All forward-looking statements made in this prospectus are qualified by these cautionary statements. These forward-looking statements are made only as of the date of this prospectus, and we do not undertake any obligation, other than as may be required by law, to update or revise any forward-looking or cautionary statements to reflect changes in assumptions, the occurrence of events, unanticipated or otherwise, and changes in future operating results over time or otherwise.
Comparisons of results for current and any prior periods are not intended to express any future trends, or indications of future performance, unless expressed as such, and should only be viewed as historical data.
44
The selling stockholders will receive all of the net proceeds from the sale of shares of our common stock offered by them pursuant to this prospectus. We will not receive any proceeds from the sale of these shares of our common stock. The selling stockholders will bear any underwriting commissions and discounts attributable to their sale of our common stock and we will bear the remaining expenses as required by the amended and restated registration rights agreement, or the "registration rights agreement." See "Principal and Selling Stockholders."
45
Our common stock is listed on the NYSE under the symbol "SERV". Our common stock began to trade on the NYSE on June 26, 2014.
On February 2, 2015, the last quoted price per share of our common stock on the NYSE was $28.20. As of January 20, 2015, there were approximately 86 registered holders of our common stock.
The following table sets forth the high and low sales prices per share of our common stock as reported on the NYSE:
| |
High Sales Price | Low Sales Price | |||||
|---|---|---|---|---|---|---|---|
2014 |
|||||||
Second Quarter (beginning June 26, 2014) |
$ | 19.75 | $ | 17.08 | |||
Third Quarter |
$ | 25.23 | $ | 17.05 | |||
Fourth Quarter |
$ | 28.20 | $ | 20.32 | |||
2015 |
|||||||
First Quarter (through February 2, 2015) |
$ | 28.43 | $ | 25.98 | |||
46
We do not intend to declare or pay dividends on our common stock for the foreseeable future. We currently intend to use our future earnings, if any, to repay debt, to fund our growth, to develop our business, for working capital needs and general corporate purposes. Our ability to pay dividends to holders of our common stock is significantly limited as a practical matter by the Credit Facilities and the indenture governing the 2020 Notes, insofar as we may seek to pay dividends out of funds made available to us by SvM or its subsidiaries, because SvM's debt instruments directly or indirectly restrict SvM's ability to pay dividends or make loans to us. Any future determination to pay dividends on our common stock is subject to the discretion of our board of directors and will depend upon various factors, including our results of operations, financial condition, liquidity requirements, capital requirements, level of indebtedness, contractual restrictions with respect to payment of dividends, restrictions imposed by applicable law, general business conditions and other factors that our board of directors may deem relevant. See "Description of Certain Indebtedness" for a description of restrictions on our ability to pay dividends under our debt instruments.
47
The following table sets forth our cash and cash equivalents and our consolidated capitalization as of September 30, 2014.
You should read the following table in conjunction with the sections entitled "Use of Proceeds," "Selected Historical Financial Data," "Management's Discussion and Analysis of Financial Condition and Results of Operations" and our audited consolidated financial statements and related notes appearing in this prospectus.
| |
As of September 30, 2014 |
|||
|---|---|---|---|---|
(In millions)
|
Actual | |||
Cash and cash equivalents(1)(2) |
$ | 275 | ||
| | | | | |
| | | | | |
| | | | | |
Long-term debt: |
||||
Term Loan Facility(3) |
$ | 1,825 | ||
Revolving Credit Facility(4) |
— | |||
8% 2020 Notes(2)(5) |
390 | |||
7% 2020 Notes |
488 | |||
Continuing Notes(6) |
357 | |||
Vehicle capital leases(7) |
36 | |||
Other long-term debt(8) |
39 | |||
Less current portion |
(39 | ) | ||
| | | | | |
Total long-term debt |
$ | 3,096 | ||
Total shareholders' equity |
327 | |||
| | | | | |
Total capitalization |
$ | 3,423 | ||
| | | | | |
| | | | | |
| | | | | |
- (1)
- Our
cash and cash equivalents and short- and long-term marketable securities totaled $387 million as of September 30, 2014. As of
September 30, 2014, the total net assets subject to third-party restrictions was $184 million. See "Management's Discussion and Analysis of Financial Condition and Results of
Operations—Liquidity and Capital Resources—Limitations on Distributions and Dividends by Subsidiaries" for our discussion of restricted net assets.
- (2)
- On
January 16, 2015, SvM gave notice of partial redemption to redeem $190 million aggregate principal amount of the 8% 2020 Notes at a
redemption price of 106.0% of the principal amount thereof on February 17, 2015. SvM intends to fund the partial redemption using available cash. In connection with the partial redemption, we
expect to record a loss on extinguishment of debt of approximately $13 million in the first quarter of 2015, which includes a pre-payment premium of $11 million and the write-off of
approximately $2 million of debt issuance costs. After giving effect to the partial redemption of the 8% 2020 Notes, as of December 31, 2014, our cash and cash equivalents and short- and
long-term marketable securities totaled approximately $294 million. We expect total net assets subject to third-party restrictions to be approximately $159 million at December 31, 2014.
- (3)
- Excludes
$18 million in unamortized original issue discount paid as part of the Term Loan Facility as described in "Description of Certain
Indebtedness."
- (4)
- As
of September 30, 2014, we had available borrowing capacity under the Revolving Credit Facility of $161 million. As of December 31,
2014, we had approximately $164 million of available borrowing capacity under the Revolving Credit Facility.
- (5)
- Excludes
$1 million in unamortized premium received on the sale of $100 million aggregate principal amount of such notes.
- (6)
- Excludes
$60 million in discounts related to the application of purchase accounting in the 2007 Merger. See "Description of Certain Indebtedness" for
the definition of Continuing Notes.
- (7)
- SvM
has entered into a fleet management services agreement, or the "Fleet Agreement," which, among other things, allows SvM to obtain fleet vehicles through
a leasing program. All leases under the Fleet Agreement are capital leases for accounting purposes. The lease rental payments include an interest component calculated using a variable rate based on
one-month London inter-bank offered rate, or "LIBOR," plus other contractual adjustments and a borrowing margin totaling 2.45%.
- (8)
- Our other long-term debt includes (i) capital leases and (ii) certain other indebtedness.
48
SELECTED HISTORICAL FINANCIAL DATA
The following tables set forth selected historical financial data as of the dates and for the periods indicated. The selected historical consolidated financial data as of September 30, 2014 and for the nine months ended September 30, 2014 and September 30, 2013 have been derived from our unaudited condensed consolidated financial statements included in this prospectus. The selected historical financial data as of December 31, 2013 and 2012 and for each of the three years in the period ended December 31, 2013 have been derived from our audited consolidated financial statements and related notes included in this prospectus. The selected historical financial data as of December 31, 2011, 2010 and 2009 and for the years ended December 31, 2010 and 2009 have been derived from our consolidated financial statements and related notes not included in this prospectus. The selected historical financial data are qualified in their entirety by, and should be read in conjunction with, "Management's Discussion and Analysis of Financial Condition and Results of Operations" and our consolidated financial statements and related notes included in this prospectus.
| |
Nine Months Ended September 30, |
Year Ended December 31, | ||||||||||||||||||||
|---|---|---|---|---|---|---|---|---|---|---|---|---|---|---|---|---|---|---|---|---|---|---|
(In millions, except per share data)
|
2014 | 2013 | 2013 | 2012 | 2011 | 2010 | 2009 | |||||||||||||||
Operating Results: |
||||||||||||||||||||||
Revenue |
$ | 1,880 | $ | 1760 | $ | 2,293 | $ | 2,214 | $ | 2,105 | $ | 2,031 | $ | 1,929 | ||||||||
Cost of services rendered and products sold |
983 | 924 | 1,220 | 1,196 | 1,125 | 1,095 | 1,032 | |||||||||||||||
Selling and administrative expenses |
505 | 527 | 691 | 678 | 648 | 643 | 599 | |||||||||||||||
Goodwill and trade name impairment(1) |
— | — | — | — | — | — | 5 | |||||||||||||||
Impairment of software and other related costs(2) |
47 | — | — | — | — | — | — | |||||||||||||||
Consulting agreement termination fees(3) |
21 | — | — | — | — | — | — | |||||||||||||||
Interest expense |
171 | 186 | 247 | 245 | 266 | 280 | 293 | |||||||||||||||
Loss (gain) on extinguishment of debt(4) |
65 | — | — | 55 | — | — | (52 | ) | ||||||||||||||
Income (Loss) from Continuing Operations(1)(2)(3)(4)(5) |
22 | 44 | 42 | (18 | ) | (7 | ) | (47 | ) | (26 | ) | |||||||||||
Cash dividends per share |
$ | — | $ | — | $ | — | $ | — | $ | — | $ | — | $ | — | ||||||||
Weighted average shares outstanding: |
||||||||||||||||||||||
Basic |
105.8 | 91.6 | 91.6 | 91.9 | 92.0 | 91.9 | 91.9 | |||||||||||||||
Diluted |
106.7 | 92.4 | 92.2 | 91.9 | 92.0 | 91.9 | 91.9 | |||||||||||||||
Basic and Diluted Earnings (Loss) Per Share—Continuing Operations |
$ | 0.20 | $ | 0.48 | $ | 0.46 | $ | (0.20 | ) | $ | (0.08 | ) | $ | (0.51 | ) | $ | (0.28 | ) | ||||
Financial Position (as of period end): |
||||||||||||||||||||||
Total assets |
$ | 5,112 | $ | 5,905 | $ | 6,415 | $ | 7,156 | $ | 7,106 | $ | 7,151 | ||||||||||
Total long-term debt |
3,059 | 3,906 | 3,924 | 3,859 | 3,877 | 3,893 | ||||||||||||||||
Total shareholders' equity(1)(2)(3)(4)(5) |
327 | 23 | 535 | 1,234 | 1,246 | 1,240 | ||||||||||||||||
Cash Flow Data: |
||||||||||||||||||||||
Net cash provided from operating activities from continuing operations |
$ | 132 | $ | 127 | $ | 208 | $ | 104 | $ | 74 | $ | 38 | $ | 2 | ||||||||
Net cash used for investing activities from continuing operations |
(51 | ) | (81 | ) | (70 | ) | (85 | ) | (80 | ) | (73 | ) | (38 | ) | ||||||||
Net cash used for financing activities from continuing operations |
(274 | ) | (60 | ) | (78 | ) | (14 | ) | (110 | ) | (45 | ) | (256 | ) | ||||||||
Other Financial Data: |
||||||||||||||||||||||
Adjusted EBITDA(6) |
$ | 443 | $ | 361 | $ | 450 | $ | 413 | $ | 397 | $ | 354 | $ | 351 | ||||||||
Adjusted EBITDA Margin(7) |
23.6 | % | 20.5 | % | 19.6 | % | 18.7 | % | 18.9 | % | 17.4 | % | 18.2 | % | ||||||||
Pre-Tax Unlevered Free Cash Flow(8) |
$ | 386 | $ | 322 | $ | 428 | $ | 364 | $ | 292 | $ | 275 | $ | 294 | ||||||||
- (1)
- In
2009, we recorded a pre-tax non-cash impairment charge of $5 million to reduce the carrying value of trade names as a result of our annual
impairment testing of goodwill and indefinite-lived intangible assets. There were no similar impairment charges included in continuing operations in 2010 through 2013.
- (2)
- Represents
the impairment of software and other related costs described in Note 1 to our unaudited condensed consolidated financial statements
included in this prospectus.
- (3)
- Represents consulting agreement termination fees described in Note 15 to our unaudited condensed consolidated financial statements included in this prospectus.
49
- (4)
- For
the nine months ended September 30, 2014, represents a loss on extinguishment of debt as described in Note 10 to our unaudited condensed
consolidated financial statements included in this prospectus.
- For
2012, represents a loss on extinguishment of debt related to the redemption of the remaining $996 million aggregate principal amount
of the 2015 Notes and repayment of $276 million of outstanding borrowings under the Old Term Facilities.
- For
2009, represents a gain on extinguishment of debt related to the completion of open market purchases of $100 million in face value of
the 2015 Notes.
- (5)
- The
nine months ended September 30, 2014 and 2013 results include restructuring charges of $7 million and $4 million, respectively, as
described in Note 3 to our unaudited condensed consolidated financial statements included in this prospectus. The 2013, 2012 and 2011 results include restructuring charges of $6 million,
$15 million and $7 million, respectively, as described in Note 8 to our audited consolidated financial statements included in this prospectus.
- The
2010 and 2009 results include restructuring charges of $5 million and $18 million, respectively. For 2010 and 2009, these
charges included lease termination and severance costs related to a branch optimization project at Terminix; reserve adjustments, severance, employee retention, consulting and other costs associated
with previous restructuring initiatives; severance, employee retention, legal fees and other costs associated with the 2007 Merger; and, for 2009, transition fees, employee retention and severance
costs and consulting and other costs related to the information technology outsourcing initiative.
- (6)
- For
our definition of Adjusted EBITDA, see "Prospectus Summary—Summary Historical Consolidated Financial and Other Operating Data."
- The following table reconciles Adjusted EBITDA to Net (Loss) Income for the periods presented, which we consider to be the most directly comparable GAAP financial measure to Adjusted
50
EBITDA. For information on certain of the adjustments set forth in the table, see "Prospectus Summary—Summary Historical Consolidated Financial and Other Operating Data."
| |
Nine Months Ended September 30, |
Year Ended December 31, | ||||||||||||||||||||
|---|---|---|---|---|---|---|---|---|---|---|---|---|---|---|---|---|---|---|---|---|---|---|
(In millions)
|
2014 | 2013 | 2013 | 2012 | 2011 | 2010 | 2009 | |||||||||||||||
Adjusted EBITDA: |
||||||||||||||||||||||
Terminix |
$ | 248 | $ | 223 | $ | 266 | $ | 266 | $ | 249 | $ | 223 | $ | 212 | ||||||||
American Home Shield |
144 | 114 | 145 | 117 | 107 | 90 | 92 | |||||||||||||||
Franchise Services Group |
58 | 57 | 78 | 70 | 75 | 76 | 70 | |||||||||||||||
| | | | | | | | | | | | | | | | | | | | | | | |
Reportable Segment Adjusted EBITDA |
$ | 450 | $ | 395 | $ | 489 | $ | 453 | $ | 431 | $ | 389 | $ | 374 | ||||||||
Other Operations and Headquarters(a) |
(7 | ) | (34 | ) | (39 | ) | (40 | ) | (34 | ) | (35 | ) | (23 | ) | ||||||||
| | | | | | | | | | | | | | | | | | | | | | | |
Total Adjusted EBITDA |
$ | 443 | $ | 361 | $ | 450 | $ | 413 | $ | 397 | $ | 354 | $ | 351 | ||||||||
| | | | | | | | | | | | | | | | | | | | | | | |
| | | | | | | | | | | | | | | | | | | | | | | |
| | | | | | | | | | | | | | | | | | | | | | | |
Depreciation and amortization expense |
(76 | ) | (74 | ) | (99 | ) | (100 | ) | (121 | ) | (130 | ) | (127 | ) | ||||||||
Non-cash goodwill and trade name impairment |
— | — | — | — | — | — | (5 | ) | ||||||||||||||
Non-cash impairment of software and other related costs |
(47 | ) | — | — | — | — | — | — | ||||||||||||||
Residual value guarantee charge |
— | — | — | — | — | (1 | ) | (1 | ) | |||||||||||||
Non-cash impairment of property and equipment |
— | — | — | (9 | ) | — | — | — | ||||||||||||||
Non-cash stock-based compensation expense |
(5 | ) | (3 | ) | (4 | ) | (7 | ) | (8 | ) | (9 | ) | (8 | ) | ||||||||
Restructuring charges |
(7 | ) | (4 | ) | (6 | ) | (15 | ) | (7 | ) | (5 | ) | (18 | ) | ||||||||
Management and consulting fees |
(4 | ) | (5 | ) | (7 | ) | (7 | ) | (8 | ) | (8 | ) | (8 | ) | ||||||||
Consulting agreement termination fees |
(21 | ) | — | — | — | — | — | — | ||||||||||||||
Loss (income) from discontinued operations, net of income taxes |
(98 | ) | (533 | ) | (549 | ) | (696 | ) | 53 | 37 | 47 | |||||||||||
Benefit (provision) for income taxes |
(26 | ) | (43 | ) | (43 | ) | 8 | 6 | 32 | 30 | ||||||||||||
Loss on extinguishment of debt |
(65 | ) | — | — | (55 | ) | — | — | 52 | |||||||||||||
Interest expense |
(171 | ) | (186 | ) | (247 | ) | (245 | ) | (266 | ) | (280 | ) | (293 | ) | ||||||||
Other |
— | (1 | ) | (2 | ) | (1 | ) | — | — | 2 | ||||||||||||
| | | | | | | | | | | | | | | | | | | | | | | |
Net (Loss) Income |
$ | (76 | ) | $ | (489 | ) | $ | (507 | ) | $ | (714 | ) | $ | 46 | $ | (10 | ) | $ | 22 | |||
| | | | | | | | | | | | | | | | | | | | | | | |
| | | | | | | | | | | | | | | | | | | | | | | |
| | | | | | | | | | | | | | | | | | | | | | | |
- (a)
- Represents unallocated corporate expenses.
- (7)
- Adjusted
EBITDA margin is defined as Adjusted EBITDA as a percentage of revenue.
- (8)
- Pre-Tax
Unlevered Free Cash Flow is not a measurement of our financial performance or liquidity under GAAP and does not purport to be an alternative to net
cash provided from operating activities from continuing operations or any other performance or liquidity measures derived in accordance with GAAP.
- Management
believes Pre-Tax Unlevered Free Cash Flow is useful as a supplemental measure of our liquidity. Management uses Pre-Tax Unlevered
Free Cash Flow to facilitate company-to-company cash flow comparisons by removing potential differences caused by variations in capital structures (affecting interest payments and payments made or
received in connection with debt issuances and debt retirements), as well as payments for taxation, restructuring, and management and consulting fees, which may vary from company to company for
reasons unrelated to operating performance.
- "Pre-Tax Unlevered Free Cash Flow" means (i) net cash provided from operating activities from continuing operations before: cash paid for interest expense; call premium paid on retirement of debt; premium received on issuance of debt; cash paid for income taxes, net of refunds; cash paid for restructuring charges; and cash paid for management and consulting fees, (ii) less property additions.
51
- Pre-Tax
Unlevered Free Cash Flow has limitations as an analytical tool and should not be considered in isolation or as a substitute for
analyzing our results as reported under GAAP. Some of these limitations are:
- •
- Pre-Tax Unlevered Free Cash Flow does not reflect cash payments to service interest, make principal payments on our debt
or make payments for other financing activities;
- •
- Pre-Tax Unlevered Free Cash Flow does not reflect cash payments for taxes;
- •
- Pre-Tax Unlevered Free Cash Flow does not reflect cash payments for restructuring charges or management and consulting
fees; and
- •
- Other companies in our industries may calculate Pre-Tax Unlevered Free Cash Flow or similarly titled non-GAAP financial
measures differently, limiting is usefulness as a comparative measure.
- The following table reconciles net cash provided from operating activities from continuing operations, which we consider to be the most directly comparable GAAP measure, to Pre-Tax Unlevered Free Cash Flow using data derived from our audited consolidated financial statements for the periods indicated:
| |
Nine Months Ended |
Year Ended December 31, | ||||||||||||||||||||
|---|---|---|---|---|---|---|---|---|---|---|---|---|---|---|---|---|---|---|---|---|---|---|
(In millions)
|
2014 | 2013 | 2013 | 2012 | 2011 | 2010 | 2009 | |||||||||||||||
Net Cash Provided from Operating Activities from Continuing Operations |
$ | 132 | $ | 127 | $ | 208 | $ | 104 | $ | 74 | $ | 38 | $ | 2 | ||||||||
Cash paid for interest expense |
199 | 207 | 232 | 233 | 244 | 261 | 294 | |||||||||||||||
Call premium paid on retirement of debt |
35 | — | — | 43 | — | — | — | |||||||||||||||
Premium received on issuance of debt |
— | — | — | (3 | ) | — | — | — | ||||||||||||||
Cash paid for income taxes, net of refunds |
11 | 12 | 9 | 9 | 12 | 13 | 1 | |||||||||||||||
Cash paid for restructuring charges |
7 | 7 | 9 | 15 | 6 | 3 | 16 | |||||||||||||||
Cash paid for management and consulting fees(a) |
4 | 5 | 7 | 7 | 8 | 8 | 8 | |||||||||||||||
Cash paid for consulting agreement termination fees |
21 | — | — | — | — | — | — | |||||||||||||||
Cash paid for impairment of software and other related costs |
3 | — | — | — | — | — | — | |||||||||||||||
Gain on sale of marketable securities |
4 | 1 | 2 | — | — | — | — | |||||||||||||||
Property additions |
(29 | ) | (38 | ) | (39 | ) | (44 | ) | (52 | ) | (48 | ) | (27 | ) | ||||||||
| | | | | | | | | | | | | | | | | | | | | | | |
Pre-Tax Unlevered Free Cash Flow |
386 | 322 | $ | 428 | $ | 364 | $ | 292 | $ | 275 | $ | 294 | ||||||||||
| | | | | | | | | | | | | | | | | | | | | | | |
| | | | | | | | | | | | | | | | | | | | | | | |
| | | | | | | | | | | | | | | | | | | | | | | |
- (a)
- Represents the amounts paid to certain of our Equity Sponsors under the consulting agreements described in "Certain Relationships and Related Party Transactions—Consulting Agreements."
52
MANAGEMENT'S DISCUSSION AND ANALYSIS OF FINANCIAL CONDITION
AND RESULTS OF OPERATIONS
The following information should be read in conjunction with "Selected Historical Financial Data," "Summary Historical Consolidated Financial and Other Operating Data," our audited consolidated financial statements and related notes and our unaudited condensed consolidated financial statements and related notes included in this prospectus. The following discussion may contain forward-looking statements that reflect our plans, estimates and beliefs. Our actual results could differ materially from those discussed in these forward-looking statements. Factors that could cause or contribute to these differences include those factors discussed below and elsewhere in this prospectus, particularly in "Risk Factors" and "Forward-Looking Statements."
Overview
Our core services include termite and pest control, home warranties, disaster restoration, janitorial, residential cleaning, furniture repair and home inspection under the following leading brands: Terminix, American Home Shield, ServiceMaster Restore, ServiceMaster Clean, Merry Maids, Furniture Medic and AmeriSpec. Our operations for the historical periods presented in this prospectus are organized into three reportable segments: Terminix, American Home Shield and Franchise Services Group.
Key Business Metrics
We focus on a variety of indicators and key financial and operating metrics to monitor the financial condition and performance of the continuing operations of our businesses. These metrics include:
- •
- revenue,
- •
- operating expenses,
- •
- Adjusted EBITDA,
- •
- net (loss) income,
- •
- earnings per share,
- •
- customer retention rates, and
- •
- customer counts growth.
To the extent applicable, these financial measures are evaluated with and without impairment, restructuring and other charges that management believes are not indicative of the earnings capabilities of our businesses. We also focus on measures designed to optimize cash flow, including the management of working capital and capital expenditures.
Revenue. Our revenue results are primarily a function of the volume and pricing of the services and products provided to our customers by our businesses as well as the mix of services and products provided across our businesses. The volume of our revenue in Terminix and American Home Shield, and in our company-owned branches in the Franchise Services Group, is impacted by new unit sales, the retention of our existing customers and tuck-in acquisitions. We expect to continue our tuck-in acquisition program at Terminix at levels consistent with prior periods. Revenue results in the remainder of our Franchise Services Group are driven principally by royalty fees earned from our franchisees. We serve both residential and commercial customers, principally in the United States. In 2013 and the nine months ended September 30, 2014, approximately 98% of our revenue was generated by sales in the United States.
53
Operating Expenses. In addition to the impact of changes in our revenue results, our operating results are affected by, among other things, the level of our operating expenses. A number of our operating expenses are subject to inflationary pressures, such as fuel, chemicals, raw materials, wages and salaries, employee benefits and health care, vehicles, self-insurance costs and other insurance premiums, as well as various regulatory compliance costs.
We have historically hedged a significant portion of our annual fuel consumption of approximately 11 million gallons. Fuel costs for 2013, after the impact of the hedges and after adjusting for the impact of year over year changes in the number of gallons used, were comparable to 2012. We estimate that fuel prices have not significantly increased our fuel costs for 2014 compared to 2013.
After adjusting for the impact of year over year changes in the number of covered employees, health care and related costs for 2013 were comparable to 2012. We estimate to have incurred incremental aggregate health care costs in 2014 as compared to 2013 as a result of continued inflation in the cost of health care services and due to certain provisions of the Patient Protection and Affordable Care Act.
Adjusted EBITDA. We evaluate performance and allocate resources based primarily on Adjusted EBITDA. We define Adjusted EBITDA as net income (loss) before: income (loss) from discontinued operations, net of income taxes; provision (benefit) for income taxes; gain (loss) on extinguishment of debt; interest expense; depreciation and amortization expense; non-cash goodwill and trade name impairment; non-cash impairment of software and other related costs; non-cash impairment of property and equipment; non-cash stock-based compensation expense; restructuring charges; management and consulting fees; consulting agreement termination fees; non-cash effects attributable to the application of purchase accounting; and other non-operating expenses. We believe Adjusted EBITDA is useful for investors, analysts and other interested parties as it facilitates company-to-company operating performance comparisons by excluding potential differences caused by variations in capital structures, taxation, the age and book depreciation of facilities and equipment, restructuring initiatives, consulting agreements and equity-based, long-term incentive plans.
Net (Loss) Income and Earnings Per Share. Basic (loss) earnings per share is computed by dividing net income (loss) by the weighted average number of shares of common stock outstanding. Diluted (loss) earnings per share is computed by dividing net income (loss) by the weighted-average number of shares of common stock outstanding during the period, increased to include the number of shares of common stock that would have been outstanding had potential dilutive shares of common stock been issued. The dilutive effect of stock options and restricted stock units are reflected in diluted net income (loss) per share by applying the treasury stock method. The presentation of net (loss) income and (loss) earnings per share provides GAAP measures of performance which are useful for investors, analysts and other interested parties in company-to-company operating performance comparisons.
Customer Retention Rates and Customer Counts Growth. We report our customer retention rates and growth in customer counts for our two largest revenue generating businesses in order to track the performance of those businesses. Customer counts represent our recurring customer base and include customers with active contracts for recurring services. At Terminix, these services are primarily delivered on an annual, quarterly or monthly frequency. Retention rates are calculated as the ratio of ending customer counts to the sum of beginning customer counts, new sales and acquired accounts for the applicable period. These measures are presented on a rolling, twelve-month basis in order to avoid seasonal anomalies. See "—Segment Review."
Seasonality
We have seasonality in our business, which drives fluctuations in revenue and Adjusted EBITDA for interim periods. In 2013, approximately 22 percent, 28 percent, 27 percent and 23 percent of our
54
revenue and approximately 23 percent, 29 percent, 28 percent and 20 percent of our Adjusted EBITDA was recognized in the first, second, third and fourth quarters, respectively.
Effect of Weather Conditions
The demand for our services and our results of operations are also affected by weather conditions, including the seasonal nature of our termite and pest control services, home inspection services and disaster restoration services. Weather conditions which have a potentially unfavorable impact to our business include cooler temperatures or droughts which can impede the development of termite swarms and lead to lower demand for our termite control services; severe winter storms which can impact our home cleaning business if we cannot travel to service locations due to hazardous road conditions; and extreme temperatures which can lead to an increase in service requests related to household systems and appliances, resulting in higher claim frequency and costs. Weather conditions which have a potentially favorable impact to our business include mild winters which can lead to higher demand for termite and pest control services; mild winters or summers which can lead to lower household systems and appliance claim frequency; and severe storms which can lead to an increase in demand for disaster restoration services.
We believe colder weather conditions in early 2014 adversely affected our traditional termite revenue in the nine months ended September 30, 2014.
Conversely, contract claims expense in our American Home Shield segment decreased $27 million in the year ended December 31, 2013 as compared to the year ended December 31, 2012 (including a favorable adjustment to reserves for prior year contract claims of $4 million recorded in 2013). This favorable outcome was driven, in part, by an increase in the service fee charged to our customers for service visits and, to a lesser extent, by cooler summer temperatures in 2013 as compared to 2012. Contract claims expense in our American Home Shield segment also decreased in the nine months ended September 30, 2013, as compared to the nine months ended September 30, 2013, in part, we believe, due to cooler temperatures in 2014 compared to 2013.
Initial Public Offering
On June 25, 2014, our registration statement on Form S-1 for our initial public offering was declared effective by the SEC. On July 1, 2014, we completed the offering of 41,285,000 shares of our common stock at a price of $17.00 per share. See Note 1 to our unaudited condensed consolidated financial statements included in this prospectus for more information about our use of these proceeds of the offering.
Refinancing of Indebtedness
On July 1, 2014, in connection with our initial public offering, SvM terminated the Old Credit Facilities and entered into the Term Loan Facility and the Revolving Credit Facility. Borrowings under the Term Loan Facility, together with $243 million of available cash and $120 million of net proceeds of the initial public offering, were used to repay in full the $2,187 million outstanding under the Old Term Facilities. In addition, $42 million of available cash was used to pay debt issuance costs of $24 million and to pay original issue discount of $18 million in connection with the Term Loan Facility.
On July 16, 2014, SvM used proceeds from the initial public offering to redeem $210 million of its outstanding 8% 2020 Notes and $263 million of its 7% 2020 Notes. In connection with the redemption of the 8% 2020 Notes and the 7% 2020 Notes, SvM was required to pay a pre-payment premium of $17 million and $18 million, respectively, and accrued interest of $7 million and $8 million, respectively.
In connection with the partial redemption of the 8% 2020 Notes and 7% 2020 Notes and the repayment of the Old Term Facilities, we recorded a loss on extinguishment of debt of $65 million in
55
the nine months ended September 30, 2014, which included the pre-payment premiums on the 8% 2020 Notes and 7% 2020 Notes of $17 million and $18 million, respectively, and the write-off of $30 million of debt issuance costs.
TruGreen Spin-off
On January 14, 2014, we completed the TruGreen Spin-off. As a result of the completion of the TruGreen Spin-off, New TruGreen operates the TruGreen Business as a private independent company. In connection with the TruGreen Spin-off, SvM and TruGreen Limited Partnership, an indirect wholly-owned subsidiary of New TruGreen, or "TGLP," entered into a transition services agreement pursuant to which SvM and its subsidiaries provide TGLP with specified communications, public relations, finance and accounting, tax, treasury, internal audit, human resources operations and benefits, risk management and insurance, supply management, real estate management, marketing, facilities, information technology and other support services. The charges for the transition services allow us to fully recover the allocated direct costs of providing the services, plus specified margins and any out-of-pocket costs and expenses. The services provided under the transition services agreement will terminate at various specified times, and in no event later than January 14, 2016 (except for certain information technology services, which SvM expects to provide to TGLP beyond the two-year period). TGLP may terminate the transition services agreement (or certain services under the transition services agreement) for convenience upon 90-days written notice, in which case TGLP will be required to reimburse SvM for early termination costs.
Beginning with the TruGreen Spin-off, where it was practicable, employees who historically provided such services to the TruGreen Business were separated from us and transferred to New TruGreen as of the date of the TruGreen Spin-off. For certain support services for which it was not practicable to separate employees and transfer them to New TruGreen beginning with the TruGreen Spin-off, a transition services agreement was entered into pursuant to which SvM and its subsidiaries provide specified services to New TruGreen while an orderly transition of employees and other support arrangements from SvM to New TruGreen is executed. As a result of the transfer of employees to New TruGreen, in combination with the fees we expect to receive under the transition services agreement, we expect an approximate $25 million reduction in annual costs.
In addition, we, SvM, New TruGreen and TGLP entered into (1) a separation and distribution agreement containing key provisions relating to the separation of the TruGreen Business and the distribution of New TruGreen common stock to our stockholders (including relating to specified TruGreen legal matters with respect to which we have agreed to retain liability, as well as insurance coverage, non-competition, indemnification and other matters), (2) an employee matters agreement allocating liabilities and responsibilities relating to employee benefit plans and programs and other related matters and (3) a tax matters agreement governing the respective rights, responsibilities and obligations of the parties thereto with respect to taxes, including allocating liabilities for income taxes attributable to New TruGreen and its subsidiaries generally to SvM for tax periods (or portions thereof) ending on or before January 14, 2014 and generally to New TruGreen for tax periods (or portions thereof) beginning after that date.
Under this transition services agreement, in the nine months ended September 30, 2014, SvM recorded $27 million of fees due from TGLP, which is included, net of costs incurred, in Selling and administrative expenses in our unaudited condensed consolidated statement of operations and comprehensive (loss) income. As of September 30, 2014, all amounts owed by TGLP under this agreement have been paid.
During the nine months ended September 30, 2014, SvM processed certain of TGLP's accounts payable transactions. Through this process, in the nine months ended September 30, 2014, $96 million was paid on TGLP's behalf, of which $94 million was repaid by TGLP. As of September 30, 2014, SvM
56
recorded a $2 million receivable due from TGLP, which is included in Receivables on the unaudited condensed consolidated statement of financial position.
Results of Operations
Nine Months Ended September 30, 2014 and 2013
| |
Nine Months Ended September 30, |
Increase (Decrease) |
% of Revenue | |||||||||||||
|---|---|---|---|---|---|---|---|---|---|---|---|---|---|---|---|---|
(In millions)
|
2014 | 2013 | 2014 vs. 2013 | 2014 | 2013 | |||||||||||
Revenue |
$ | 1,880 | $ | 1,760 | 7 | % | 100 | % | 100 | % | ||||||
Cost of services rendered and products sold |
983 | 924 | 6 | 52 | 52 | |||||||||||
Selling and administrative expenses |
505 | 527 | (4 | ) | 27 | 30 | ||||||||||
Amortization expense |
39 | 38 | 3 | 2 | 2 | |||||||||||
Impairment of software and other related costs |
47 | — | * | 2 | — | |||||||||||
Consulting agreement termination fees |
21 | — | * | 1 | — | |||||||||||
Restructuring charges |
7 | 4 | 81 | — | — | |||||||||||
Interest expense |
171 | 186 | (8 | ) | 9 | 11 | ||||||||||
Interest and net investment income |
(7 | ) | (6 | ) | 12 | — | — | |||||||||
Loss on extinguishment of debt |
65 | — | * | 3 | — | |||||||||||
Income from Continuing Operations before Income Taxes |
48 | 88 | (45 | ) | 3 | 5 | ||||||||||
Provision for income taxes |
26 | 43 | (40 | ) | 1 | 2 | ||||||||||
Income from Continuing Operations |
22 | 44 | (51 | ) | 1 | 3 | ||||||||||
Loss from discontinued operations, net of income taxes |
(98 | ) | (533 | ) | * | (5 | ) | (30 | ) | |||||||
Net Loss |
$ | (76 | ) | $ | (489 | ) | * | (4 | )% | (28 | )% | |||||
| | | | | | | | | | | | | | | | | |
| | | | | | | | | | | | | | | | | |
| | | | | | | | | | | | | | | | | |
- *
- not meaningful
Revenue
We reported revenue of $1,880 million and $1,760 million for the nine months ended September 30, 2014 and 2013, respectively. A summary of changes in revenue for each of our reportable segments and Other Operations and Headquarters is included in the tables below. See "—Segment Review" for a discussion of the drivers of the year-over-year changes.
(In millions)
|
Terminix | American Home Shield |
Franchise Services Group |
Other Operations and Headquarters |
Total | |||||||||||
|---|---|---|---|---|---|---|---|---|---|---|---|---|---|---|---|---|
Nine Months Ended September 30, 2013 |
$ | 1,012 | $ | 568 | $ | 175 | $ | 6 | $ | 1,760 | ||||||
Pest Control |
20 | — | — | — | 20 | |||||||||||
Termite(1) |
20 | — | — | — | 20 | |||||||||||
Home Warranties(2) |
— | 69 | — | — | 69 | |||||||||||
Franchise-Related Revenue |
— | — | 14 | — | 14 | |||||||||||
Other |
(3 | ) | — | — | (1 | ) | (4 | ) | ||||||||
| | | | | | | | | | | | | | | | | |
Nine Months Ended September 30, 2014 |
$ | 1,049 | $ | 637 | $ | 189 | $ | 5 | $ | 1,880 | ||||||
| | | | | | | | | | | | | | | | | |
| | | | | | | | | | | | | | | | | |
| | | | | | | | | | | | | | | | | |
- (1)
- Includes
wildlife exclusion, crawl space encapsulation and attic insulation products, which are managed as a component of our termite line of business.
- (2)
- Includes approximately $41 million for the nine months ended September 30, 2014, as a result of the acquisition of HSA on February 28, 2014.
57
Cost of Services Rendered and Products Sold
We reported cost of services rendered and products sold of $983 million and $924 million for the nine months ended September 30, 2014 and 2013, respectively. The following tables provide a summary of changes in cost of services rendered and products sold for each of our reportable segments and Other Operations and Headquarters:
(In millions)
|
Terminix | American Home Shield |
Franchise Services Group |
Other Operations and Headquarters |
Total | |||||||||||
|---|---|---|---|---|---|---|---|---|---|---|---|---|---|---|---|---|
Nine Months Ended September 30, 2013 |
$ | 556 | $ | 283 | $ | 75 | $ | 10 | $ | 924 | ||||||
Impact of change in revenue |
16 | 33 | 12 | — | 61 | |||||||||||
Damage claims |
4 | — | — | — | 4 | |||||||||||
Contract claims |
— | (7 | ) | — | — | (7 | ) | |||||||||
Insurance program |
— | — | — | 3 | 3 | |||||||||||
Other |
(1 | ) | 2 | — | (3 | ) | (2 | ) | ||||||||
| | | | | | | | | | | | | | | | | |
Nine Months Ended September 30, 2014 |
$ | 575 | $ | 311 | $ | 87 | $ | 10 | $ | 983 | ||||||
| | | | | | | | | | | | | | | | | |
| | | | | | | | | | | | | | | | | |
| | | | | | | | | | | | | | | | | |
The increase in damage claims at Terminix was primarily driven by higher claim payments. The decrease in contract claims at American Home Shield was primarily driven by lower claims costs due, in part, to an increase in the service fee charged to our customers for service visits and, to a lesser extent, mild weather conditions, offset, in part, by the impact of favorable adjustments to reserves for prior year contract claims of $1 million and $5 million in the nine months ended September 30, 2014 and 2013, respectively. The increased expense in our automobile, general liability and workers' compensation insurance program was driven by adverse claims trends.
Selling and Administrative Expenses
We reported selling and administrative expenses of $505 million and $527 million for the nine months ended September 30, 2014 and 2013, respectively. For the nine months ended September 30, 2014 and 2013, selling and administrative expenses comprised general and administrative expenses of $205 million and $241 million, respectively, and selling and marketing expenses of $300 million and $286 million, respectively. The following tables provide a summary of changes in selling and administrative expenses for each of our reportable segments and Other Operations and Headquarters:
(In millions)
|
Terminix | American Home Shield |
Franchise Services Group |
Other Operations and Headquarters |
Total | |||||||||||
|---|---|---|---|---|---|---|---|---|---|---|---|---|---|---|---|---|
Nine Months Ended September 30, 2013 |
$ | 254 | $ | 178 | $ | 44 | $ | 51 | $ | 527 | ||||||
Cost reduction initiatives |
(5 | ) | — | — | — | (5 | ) | |||||||||
HSA selling and administrative expenses |
— | 13 | — | — | 13 | |||||||||||
Sales costs |
2 | — | — | — | 2 | |||||||||||
Marketing costs |
— | 6 | — | — | 6 | |||||||||||
Technology costs |
— | (6 | ) | — | — | (6 | ) | |||||||||
Key executive separation charges |
(3 | ) | (2 | ) | — | — | (5 | ) | ||||||||
Tax-related reserves |
— | 3 | — | — | 3 | |||||||||||
Centers of excellence |
— | — | — | (31 | ) | (31 | ) | |||||||||
Management and consulting fees |
— | — | — | (2 | ) | (2 | ) | |||||||||
Stock-based compensation expense |
— | — | — | 2 | 2 | |||||||||||
Other |
— | — | 1 | — | 1 | |||||||||||
| | | | | | | | | | | | | | | | | |
Nine Months Ended September 30, 2014 |
$ | 248 | $ | 192 | $ | 45 | $ | 20 | $ | 505 | ||||||
| | | | | | | | | | | | | | | | | |
| | | | | | | | | | | | | | | | | |
| | | | | | | | | | | | | | | | | |
58
The decrease in selling and administrative expenses at Terminix was driven by overhead cost reductions achieved in the nine months ended September 30, 2014 and a reduction in key executive transition charges, offset, in part, by higher sales costs. The increase in selling and administrative expenses at American Home Shield primarily included the addition of administrative costs as a result of the HSA acquisition and incremental marketing investments in our direct to consumer channel, offset, in part, by lower technology costs driven by the decision in the first quarter of 2014 to abandon its efforts to deploy a new operating system and a reduction in key executive separation charges. Additionally, a $3 million reduction in tax-related reserves was recorded at American Home Shield in the nine months ended September 30, 2013 for which there was no similar adjustment recorded in the nine months ended September 30, 2014.
The decrease in selling and administrative expenses at Other Operations and Headquarters primarily included decreased costs in our centers of excellence driven by the transition of certain costs to New TruGreen, cost reductions pursuant to the termination of consulting agreements with our Equity Sponsors and other cost reductions achieved in the nine months ended September 30, 2014, offset, in part, by an increase in stock-based compensation expense driven by grants of options and RSUs.
Amortization Expense
During the nine months ended September 30, 2014, our portfolio of intangible assets has remained relatively stable, and, as a result, amortization expense was $39 million and $38 million in the nine months ended September 30, 2014 and 2013, respectively.
Impairment of Software and Other Related Costs
We recorded an impairment charge of $47 million in the nine months ended September 30, 2014 relating to American Home Shield's decision, in the first quarter of 2014, to abandon its efforts to deploy a new operating system. This decision will allow us to more effectively focus our energy and resources on driving growth and serving our customers. Included in this charge are the impairment of the capitalized software of $45 million and the recognition of the remaining liabilities associated with the termination of lease, maintenance and hosting agreements totaling $2 million.
Consulting Agreement Termination Fees
On July 1, 2014, in connection with the completion of our initial public offering, we paid the Equity Sponsors aggregate fees of $21 million in connection with the termination of the consulting agreements, which was recorded in the nine months ended September 30, 2014. See Note 15 to our unaudited condensed consolidated financial statements included in this prospectus.
59
Restructuring Charges
We incurred restructuring charges of $7 million and $4 million for the nine months ended September 30, 2014 and 2013, respectively. Restructuring charges were comprised of the following:
| |
Nine Months Ended September 30, |
||||||
|---|---|---|---|---|---|---|---|
(In millions)
|
2014 | 2013 | |||||
Terminix branch optimization(1) |
$ | 2 | $ | 1 | |||
Franchise services group reorganization(2) |
1 | — | |||||
Centers of excellence initiative(3) |
4 | 3 | |||||
| | | | | | | | |
Total restructuring charges |
$ | 7 | $ | 4 | |||
| | | | | | | | |
| | | | | | | | |
| | | | | | | | |
- (1)
- For
the nine months ended September 30, 2014, these charges included lease termination and severance costs. For the nine months ended
September 30, 2013, these charges included lease termination costs.
- (2)
- For
the nine months ended September 30, 2014, these charges included severance costs.
- (3)
- Represents restructuring charges related to an initiative to enhance capabilities and reduce costs in our headquarters functions that provide company-wide administrative services for our operations that we refer to as centers of excellence. For the nine months ended September 30, 2014, these charges included professional fees of $1 million and severance and other costs of $3 million. For the nine months ended September 30, 2013, these charges included professional fees of $2 million and severance and other costs of $1 million.
Interest Expense
Interest expense was $171 million and $186 million for the nine months ended September 30, 2014 and 2013, respectively. The decrease in interest expense was driven by the refinancing of the Old Term Facilities on July 1, 2014 and the partial redemption of the 8% 2020 Notes and the 7% 2020 Notes on July 16, 2014. See Note 10 to our unaudited condensed consolidated financial statements included in this prospectus.
We have entered into multiple interest rate swap agreements as further discussed in Note 10 to our unaudited condensed consolidated financial statements included in this prospectus. As of September 30, 2014, each one percentage point change in interest rates would result in an approximate $15 million change in the annual interest expense on our Term Loan Facility after considering the impact of the effective interest rate swaps.
60
Interest and Net Investment Income
Interest and net investment income was $7 million and $6 million for the nine months ended September 30, 2014 and 2013, respectively, and was comprised of the following:
| |
Nine Months Ended September 30, |
||||||
|---|---|---|---|---|---|---|---|
(In millions)
|
2014 | 2013 | |||||
Realized gains(1) |
$ | 6 | $ | 4 | |||
Deferred compensation trust(2) |
— | 1 | |||||
Other(3) |
1 | 1 | |||||
| | | | | | | | |
Total interest and net investment income |
$ | 7 | $ | 6 | |||
| | | | | | | | |
| | | | | | | | |
| | | | | | | | |
- (1)
- Represents
the net investment gains and the interest and dividend income realized on the American Home Shield investment portfolio.
- (2)
- Represents
investment income resulting from a change in the market value of investments within an employee deferred compensation trust (for which there is a
corresponding and offsetting change in compensation expense within income from continuing operations before income taxes).
- (3)
- Includes interest income on other cash balances.
Loss on Extinguishment of Debt
A loss on extinguishment of debt of $65 million was recorded in the nine months ended September 30, 2014 related to the partial redemption of the 8% 2020 Notes and the 7% 2020 Notes on July 16, 2014. See Note 10 to our unaudited condensed consolidated financial statements included in this prospectus.
Income from Continuing Operations before Income Taxes
Income from continuing operations before income taxes was $48 million and $88 million for the nine months ended September 30, 2014 and 2013, respectively. The decrease in income from continuing operations before income taxes primarily reflects the net effect of year-over-year changes in the following items:
(In millions)
|
Nine Months Ended September 30, 2014 Compared to September 30, 2013 |
|||
|---|---|---|---|---|
Reportable segments and Other Operations and Headquarters(1) |
82 | |||
Interest expense(2) |
15 | |||
Loss on extinguishment of debt(3) |
(65 | ) | ||
Consulting agreement termination fees(4) |
(21 | ) | ||
Impairment of software and other related costs(5) |
(47 | ) | ||
Other(6) |
(4 | ) | ||
| | | | | |
Decrease in income from continuing operations before income taxes |
(40 | ) | ||
| | | | | |
| | | | | |
| | | | | |
- (1)
- Represents
the net change in Adjusted EBITDA as described in "—Segment Review."
- (2)
- Represents the net change in interest expense as described in "—Interest Expense."
61
- (3)
- Represents
the $65 million loss on extinguishment of debt recorded in the nine months ended September 30, 2014 as described in
"—Loss on Extinguishment of Debt."
- (4)
- Represents
the consulting agreement termination fees of $21 million recorded in the nine months ended September 30, 2014 as described in
"—Consulting Agreement Termination Fees."
- (5)
- Represents
a $47 million impairment of software and other related costs at American Home Shield recorded in the nine months ended
September 30, 2014 as described in "—Impairment of Software and Other Related Costs."
- (6)
- Primarily represents the net change in restructuring charges, management and consulting fees, stock-based compensation and amortization.
Provision for Income Taxes
The effective tax rate on income from continuing operations was 54.3 percent for the nine months ended September 30, 2014 compared to 49.3 percent for the nine months ended September 30, 2013. The effective tax rate on income from continuing operations for the nine months ended September 30, 2014 was affected by various discrete events, including an adjustment to deferred state taxes resulting from a change in our state apportionment factors primarily attributable to the TruGreen Spin-off. The effective tax rate on income from continuing operations for the nine months ended September 30, 2013 was affected by the reclassification of the TruGreen Business to discontinued operations and the resulting impact on the allocation of the full year effective tax rate on income from continuing operations to interim periods.
Net Income (Loss)
Net loss was $76 million for the nine months ended September 30, 2014 compared to a net loss of $489 million for the nine months ended September 30, 2013. The $413 million reduction in net loss was primarily driven by a $435 million reduction in loss from discontinued operations, net of tax, and a $17 million reduction in provision for income taxes, offset, in part, by a $40 million decrease in income from continuing operations before income taxes.
62
Years Ended December 31, 2013, 2012 and 2011
| |
|
|
|
Increase (Decrease) | ||||||||||||
|---|---|---|---|---|---|---|---|---|---|---|---|---|---|---|---|---|
| |
Year ended December 31, | |||||||||||||||
| |
2013 vs. 2012 |
2012 vs. 2011 |
||||||||||||||
(In millions)
|
2013 | 2012 | 2011 | |||||||||||||
Revenue |
$ | 2,293 | $ | 2,214 | $ | 2,105 | 3.6 | % | 5.2 | % | ||||||
Cost of services rendered and products sold |
1,220 | 1,196 | 1,125 | 2.0 | 6.3 | |||||||||||
Selling and administrative expenses |
691 | 678 | 648 | 2.0 | 4.6 | |||||||||||
Amortization expense |
51 | 58 | 83 | (13.0 | ) | (29.9 | ) | |||||||||
Restructuring charges |
6 | 15 | 7 | (59.3 | ) | 111.9 | ||||||||||
Interest expense |
247 | 245 | 266 | 0.8 | (7.8 | ) | ||||||||||
Interest and net investment income |
(8 | ) | (7 | ) | (11 | ) | 9.3 | (32.2 | ) | |||||||
Loss on extinguishment of debt |
— | 55 | — | * | * | |||||||||||
| | | | | | | | | | | | | | | | | |
Income (Loss) from Continuing Operations before Income Taxes |
86 | (26 | ) | (13 | ) | * | * | |||||||||
Provision (benefit) for income taxes |
43 | (8 | ) | (6 | ) | * | * | |||||||||
Equity in losses of joint venture |
(1 | ) | — | — | * | * | ||||||||||
| | | | | | | | | | | | | | | | | |
Income (Loss) from Continuing Operations |
42 | (18 | ) | (7 | ) | * | * | |||||||||
(Loss) income from discontinued operations, net of income taxes |
(549 | ) | (696 | ) | 53 | * | * | |||||||||
| | | | | | | | | | | | | | | | | |
Net (Loss) Income |
$ | (507 | ) | $ | (714 | ) | $ | 46 | * | * | ||||||
| | | | | | | | | | | | | | | | | |
| | | | | | | | | | | | | | | | | |
| | | | | | | | | | | | | | | | | |
- *
- not meaningful
| |
% of Revenue | |||||||||
|---|---|---|---|---|---|---|---|---|---|---|
| |
Year ended December 31, | |||||||||
(In millions)
|
2013 | 2012 | 2011 | |||||||
Revenue |
100.0 | % | 100.0 | % | 100.0 | % | ||||
Cost of services rendered and products sold |
53.2 | 54.0 | 53.4 | |||||||
Selling and administrative expenses |
30.2 | 30.6 | 30.8 | |||||||
Amortization expense |
2.2 | 2.6 | 4.0 | |||||||
Restructuring charges |
0.3 | 0.7 | 0.3 | |||||||
Interest expense |
10.8 | 11.1 | 12.6 | |||||||
Interest and net investment income |
(0.4 | ) | (0.3 | ) | (0.5 | ) | ||||
Loss on extinguishment of debt |
— | 2.5 | — | |||||||
| | | | | | | | | | | |
Income (Loss) from Continuing Operations before Income Taxes |
3.7 | (1.2 | ) | (0.6 | ) | |||||
Provision (benefit) for income taxes |
1.9 | (0.4 | ) | (0.3 | ) | |||||
Equity in losses of joint venture |
* | * | * | |||||||
| | | | | | | | | | | |
Income (Loss) from Continuing Operations |
1.8 | (0.8 | ) | (0.3 | ) | |||||
(Loss) income from discontinued operations, net of income taxes |
(24.0 | ) | (31.4 | ) | 2.5 | |||||
| | | | | | | | | | | |
Net (Loss) Income |
(22.1 | )% | (32.2 | )% | 2.2 | % | ||||
| | | | | | | | | | | |
| | | | | | | | | | | |
| | | | | | | | | | | |
- *
- not meaningful
Revenue
We reported revenue of $2,293 million for the year ended December 31, 2013, $2,214 million for the year ended December 31, 2012 and $2,105 million for the year ended December 31, 2011. A summary of changes in revenue for each of our reportable segments and Other Operations and
63
Headquarters is included in the table below. See "—Segment Review" for a discussion of the drivers of the year-over-year changes.
(In millions)
|
Terminix | American Home Shield |
Franchise Services Group |
Other Operations and Headquarters |
Total | |||||||||||
|---|---|---|---|---|---|---|---|---|---|---|---|---|---|---|---|---|
Year ended December 31, 2011 |
$ | 1,193 | $ | 687 | $ | 220 | $ | 5 | $ | 2,105 | ||||||
Pest Control |
44 | — | — | — | 44 | |||||||||||
Termite |
17 | — | — | — | 17 | |||||||||||
Home Warranties |
— | 34 | — | — | 34 | |||||||||||
Franchise-Related Revenue |
— | — | 1 | — | 1 | |||||||||||
Other |
11 | — | — | 2 | 13 | |||||||||||
| | | | | | | | | | | | | | | | | |
Year ended December 31, 2012 |
$ | 1,265 | $ | 721 | $ | 221 | $ | 7 | $ | 2,214 | ||||||
| | | | | | | | | | | | | | | | | |
| | | | | | | | | | | | | | | | | |
| | | | | | | | | | | | | | | | | |
Pest Control |
31 | — | — | — | 31 | |||||||||||
Termite |
9 | — | — | — | 9 | |||||||||||
Home Warranties |
— | 19 | — | — | 19 | |||||||||||
Franchise-Related Revenue |
— | — | 15 | — | 15 | |||||||||||
Other |
4 | — | — | 1 | 5 | |||||||||||
| | | | | | | | | | | | | | | | | |
Year ended December 31, 2013 |
$ | 1,309 | $ | 740 | $ | 236 | $ | 8 | $ | 2,293 | ||||||
| | | | | | | | | | | | | | | | | |
| | | | | | | | | | | | | | | | | |
| | | | | | | | | | | | | | | | | |
Cost of Services Rendered and Products Sold
We reported cost of services rendered and products sold of $1,220 million for the year ended December 31, 2013, $1,196 million for the year ended December 31, 2012, and $1,125 million for the year ended December 31, 2011. The following table provides a summary of changes in cost of services rendered and products sold for each of our reportable segments and Other Operations and Headquarters: See "—Segment Review" for a discussion of the drivers of the year-over-year changes.
(In millions)
|
Terminix | American Home Shield |
Franchise Services Group |
Other Operations and Headquarters |
Total | |||||||||||
|---|---|---|---|---|---|---|---|---|---|---|---|---|---|---|---|---|
Year ended December 31, 2011 |
$ | 657 | $ | 377 | $ | 98 | $ | (7 | ) | $ | 1,125 | |||||
Change in revenue |
39 | 21 | 3 | — | 63 | |||||||||||
Contract claims |
— | (15 | ) | — | — | (15 | ) | |||||||||
Insurance program |
— | — | — | 10 | 10 | |||||||||||
Impairment of property and equipment(1) |
5 | — | 4 | — | 9 | |||||||||||
Other |
3 | — | — | 1 | 4 | |||||||||||
| | | | | | | | | | | | | | | | | |
Year ended December 31, 2012 |
$ | 704 | $ | 383 | $ | 105 | $ | 4 | $ | 1,196 | ||||||
| | | | | | | | | | | | | | | | | |
| | | | | | | | | | | | | | | | | |
| | | | | | | | | | | | | | | | | |
Change in revenue |
30 | 10 | 7 | — | 47 | |||||||||||
Bad debt |
3 | — | — | — | 3 | |||||||||||
Legal |
7 | — | — | — | 7 | |||||||||||
Contract claims |
— | (27 | ) | — | — | (27 | ) | |||||||||
Insurance program |
— | — | — | 4 | 4 | |||||||||||
Impairment of property and equipment(1) |
(5 | ) | — | (4 | ) | — | (9 | ) | ||||||||
Other |
4 | 1 | (7 | ) | 1 | (1 | ) | |||||||||
| | | | | | | | | | | | | | | | | |
Year ended December 31, 2013 |
$ | 743 | $ | 367 | $ | 101 | $ | 9 | $ | 1,220 | ||||||
| | | | | | | | | | | | | | | | | |
| | | | | | | | | | | | | | | | | |
| | | | | | | | | | | | | | | | | |
- (1)
- Represents a $3 million impairment of licensed intellectual property and a $1 million impairment of abandoned real estate at Terminix and a $4 million impairment of certain internally developed
64
software at Merry Maids recorded in 2012 for which there were no similar impairments recorded in 2013. We exclude non-cash impairments of property and equipment from Adjusted EBITDA because we believe doing so is useful to investors in aiding period-to-period comparability.
Selling and Administrative Expenses
Selling and administrative expenses comprised general and administrative expenses of $314 million and $322 million and selling and marketing expenses of $377 million and $356 million for the year ended December 31, 2013 and 2012, respectively, and increased $13 million to $691 million for the year ended December 31, 2013 compared to $678 million for the year ended December 31, 2012. At American Home Shield, a $3 million reduction in tax-related reserves was recorded in 2013, and a $5 million increase in tax-related reserves was recorded in 2012. Additionally, key executive transition charges of $9 million and $3 million were recorded in 2013 and 2012, respectively. The remaining increase of $15 million primarily reflected increased investments in sales and marketing at Terminix; and increased sales and marketing and higher technology costs at American Home Shield; offset, in part, by lower incentive compensation expense at Terminix; lower provisions for certain legal matters at American Home Shield; and cost reductions in our centers of excellence realized through recent initiatives discussed further under "—Restructuring Charges" below.
Selling and administrative expenses comprised general and administrative expenses of $322 million and $301 million and selling and marketing expenses of $356 million and $347 million for the year ended December 31, 2012 and 2011, respectively, and increased $30 million to $678 million for the year ended December 31, 2012 compared to $648 million for the year ended December 31, 2011. At American Home Shield, a $5 million increase in tax-related reserves was recorded in 2012. In the Franchise Services Group, a $1 million gain resulting from the sale of ten company-owned branches to existing and new franchisees was recorded in 2011. Additionally, key executive transition charges of $3 million and $6 million were recorded in 2012 and 2011, respectively. The remaining increase of $29 million primarily reflected increased investments in sales and marketing and higher incentive compensation expense at Terminix; and higher provisions for certain legal matters and increased investments to drive improvements in service delivery at American Home Shield; offset, in part, by a reduction in sales and marketing costs at American Home Shield.
Amortization Expense
Amortization expense was $51 million, $58 million and $83 million for the years ended December 31, 2013, 2012 and 2011, respectively. The decreases are a result of certain finite lived intangible assets recorded in connection with the 2007 Merger being fully amortized.
65
Restructuring Charges
We incurred restructuring charges of $6 million, $15 million and $7 million for the years ended December 31, 2013, 2012 and 2011, respectively. Restructuring charges were comprised of the following:
| |
Year ended December 31, | |||||||||
|---|---|---|---|---|---|---|---|---|---|---|
(In millions)
|
2013 | 2012 | 2011 | |||||||
Terminix branch optimization(1) |
$ | 2 | $ | 4 | $ | 4 | ||||
American Home Shield reorganization(2) |
— | 1 | — | |||||||
Franchise Services Group reorganization(2) |
— | 1 | — | |||||||
Centers of excellence initiative(3) |
4 | 9 | 3 | |||||||
| | | | | | | | | | | |
Total restructuring charges |
$ | 6 | $ | 15 | $ | 7 | ||||
| | | | | | | | | | | |
| | | | | | | | | | | |
| | | | | | | | | | | |
- (1)
- For
the years ended December 31, 2013 and 2012, these charges included severance costs of $1 million, and for the years ended
December 31, 2013, 2012 and 2011, these charges included lease termination costs of $1 million, $3 million and $4 million, respectively.
- (2)
- These
charges included severance costs.
- (3)
- Represents restructuring charges related to an initiative to enhance capabilities and reduce costs in our headquarters functions that provide company-wide administrative services for our operations that we refer to as centers of excellence. For the years ended December 31, 2013, 2012 and 2011, these charges included severance and other costs of $1 million, $4 million and $2 million, respectively, and professional fees of $3 million, $5 million and $1 million, respectively.
Interest Expense
Interest expense totaled $247 million, $245 million and $266 million for the years ended December 31, 2013, 2012 and 2011, respectively. The increase in 2013 compared to 2012 is primarily due to an increase in our average long-term debt balance. The decrease in 2012 compared to 2011 is primarily due to decreases in our weighted average interest rate and average long-term debt balance.
Interest and Net Investment Income
Interest and net investment income totaled $8 million, $7 million and $11 million for the years ended December 31, 2013, 2012 and 2011, respectively, and was comprised of the following:
| |
Year ended December 31, |
|||||||||
|---|---|---|---|---|---|---|---|---|---|---|
(In millions)
|
2013 | 2012 | 2011 | |||||||
Realized gains(1) |
$ | 5 | $ | 6 | $ | 10 | ||||
Deferred compensation trust(2) |
2 | 1 | — | |||||||
Other(3) |
1 | — | 1 | |||||||
| | | | | | | | | | | |
Interest and net investment income |
$ | 8 | $ | 7 | $ | 11 | ||||
| | | | | | | | | | | |
| | | | | | | | | | | |
| | | | | | | | | | | |
- (1)
- Represents
the net investment gains and the interest and dividend income realized on the American Home Shield investment portfolio.
- (2)
- Represents investment income (loss) resulting from a change in the market value of investments within an employee deferred compensation trust (for which there is a
66
corresponding and offsetting change in compensation expense within income from continuing operations before income taxes).
- (3)
- Includes interest income on other cash balances and, in 2012, a $3 million charge for the impairment of a loan related to a prior business disposition.
Loss on Extinguishment of Debt
The loss on extinguishment of debt of $55 million for the year ended December 31, 2012 is due to the redemption of $996 million aggregate principal amount of the 2015 Notes and repayment of $276 million of outstanding borrowings under the Old Term Facilities. There were no debt extinguishments by us in 2013 or 2011.
Income (Loss) from Continuing Operations
Income from continuing operations before income taxes was $86 million for the year ended December 31, 2013. Loss from continuing operations before income taxes was $26 million for the year ended December 31, 2012 and $13 million for the year ended December 31, 2011.
The improvement in income from continuing operations before income taxes for 2013 compared to 2012 of $112 million and increase in loss from continuing operations before income taxes for 2012 compared to 2011 of $13 million primarily reflect the net effect of year over year changes in the following items:
(In millions)
|
2013 Compared to 2012 |
2012 Compared to 2011 |
|||||
|---|---|---|---|---|---|---|---|
Loss on extinguishment of debt(1) |
55 | (55 | ) | ||||
Segment results(2) |
37 | 16 | |||||
Restructuring charges(3) |
9 | (8 | ) | ||||
Non-cash impairment of property and equipment(4) |
9 | (9 | ) | ||||
Interest expense(5) |
(2 | ) | 21 | ||||
Depreciation and amortization expense(6) |
1 | 21 | |||||
Other |
3 | 1 | |||||
| | | | | | | | |
|
$ | 112 | $ | (13 | ) | ||
| | | | | | | | |
| | | | | | | | |
| | | | | | | | |
- (1)
- Represents
the loss on extinguishment of debt recorded in 2012 related to the redemption of $996 million aggregate principal amount of the 2015 Notes
and repayment of $276 million of outstanding borrowings under the Old Term Facilities. There were no debt extinguishments in 2013 or 2011.
- (2)
- Represents
the net change in Adjusted EBITDA as described in "—Segment Review." Includes key executive transition charges of $9 million,
$3 million and $6 million recorded in 2013, 2012 and 2011, respectively, as described in "—Segment Review." Additionally, at American Home Shield, a $3 million
reduction in tax-related reserves was recorded in 2013, and a $5 million increase in tax-related reserves was recorded in 2012.
- (3)
- Represents the net change in restructuring charges related primarily to the impact of a branch optimization project at Terminix, a reorganization of leadership at American Home Shield and our Franchise Services Group and an initiative to enhance capabilities and reduce costs in our centers of excellence. Our centers of excellence are functions at our headquarters that provide company-wide administrative services for our operations. See Note 8 to our audited consolidated financial statements included in this prospectus.
67
- (4)
- Primarily
represents a $3 million impairment of licensed intellectual property and a $1 million impairment of abandoned real estate at
Terminix, and a $4 million impairment of certain internally developed software at our Franchise Services Group recorded in 2012 for which there were no similar impairments recorded in 2013 or
2011.
- (5)
- The
increase in 2013 compared to 2012 is primarily due to an increase in our average long-term debt balance. The decrease in 2012 compared to 2011 is
primarily due to decreases in our weighted average interest rate and average long-term debt balance.
- (6)
- The decrease is primarily driven by decreased amortization of intangible assets as a result of certain finite lived intangible assets recorded in connection with the 2007 Merger being fully amortized, offset, in part, by increased depreciation of property and equipment as a result of property additions.
Provision (Benefit) for Income Taxes
The effective tax rate on income (loss) from continuing operations was a provision of 50.1 percent for the year ended December 31, 2013, and a benefit of 30.5 percent and 43.8 percent for the years ended December 31, 2012 and 2011, respectively. For a reconciliation of our effective tax rates to the statutory rate see Note 5 to our audited consolidated financial statements included in this prospectus.
Net (Loss) Income
Net loss for the year ended December 31, 2013 was $507 million compared to a net loss of $714 million for the year ended December 31, 2012 and net income of $46 million for the year ended December 31, 2011. The $207 million improvement for 2013 compared to 2012 was primarily driven by a $112 million improvement in income (loss) from continuing operations before income taxes and a $147 million reduction in loss from discontinued operations, net of tax, offset, in part, by a $51 million increase in provision (benefit) for income taxes. The $760 million decrease for 2012 compared to 2011 was primarily driven by a $13 million reduction in income (loss) from continuing operations before income taxes and a $749 million increase in loss from discontinued operations, net of tax, offset, in part, by a $2 million reduction in provision (benefit) for income taxes.
Segment Review
The following business segment reviews should be read in conjunction with the required footnote disclosures presented in the notes to our audited consolidated financial statements and our unaudited condensed consolidated financial statements included in this prospectus.
68
Revenue and Adjusted EBITDA by reportable segment and for Other Operations and Headquarters are as follows:
| |
|
|
Increase (Decrease) |
|
|
|
Increase (Decrease) |
||||||||||||||||||
|---|---|---|---|---|---|---|---|---|---|---|---|---|---|---|---|---|---|---|---|---|---|---|---|---|---|
| |
Nine months ended September 30, |
Year ended December 31, |
|||||||||||||||||||||||
| |
2014 vs. 2013 |
2013 vs. 2012 |
2012 vs. 2011 |
||||||||||||||||||||||
(In millions)
|
2014 | 2013 | 2013 | 2012 | 2011 | ||||||||||||||||||||
Revenue: |
|||||||||||||||||||||||||
Terminix |
$ | 1,049 | $ | 1,012 | 4 | % | $ | 1,309 | $ | 1,265 | $ | 1,193 | 3.5 | % | 6.1 | % | |||||||||
American Home Shield |
637 | 568 | 12 | % | 740 | 721 | 687 | 2.7 | % | 5.0 | % | ||||||||||||||
Franchise Services Group |
189 | 175 | 8 | % | 236 | 221 | 220 | 6.3 | % | 0.8 | % | ||||||||||||||
Other Operations and Headquarters |
5 | 6 | (13 | )% | 8 | 7 | 5 | 22.1 | % | 14.1 | % | ||||||||||||||
| | | | | | | | | | | | | | | | | | | | | | | | | | |
Total Revenue: |
$ | 1,880 | $ | 1,760 | 7 | % | $ | 2,293 | $ | 2,214 | $ | 2,105 | 3.6 | % | 5.2 | % | |||||||||
| | | | | | | | | | | | | | | | | | | | | | | | | | |
| | | | | | | | | | | | | | | | | | | | | | | | | | |
| | | | | | | | | | | | | | | | | | | | | | | | | | |
Adjusted EBITDA(1): |
|||||||||||||||||||||||||
Terminix |
$ | 248 | $ | 223 | 11 | % | $ | 266 | $ | 266 | $ | 249 | 0.3 | % | 6.6 | % | |||||||||
American Home Shield |
144 | 114 | 26 | % | 145 | 117 | 107 | 24.4 | % | 9.4 | % | ||||||||||||||
Franchise Services Group |
58 | 57 | 2 | % | 78 | 70 | 75 | 11.7 | % | (6.2 | )% | ||||||||||||||
| | | | | | | | | | | | | | | | | | | | | | | | | | |
Reportable Segment Adjusted EBITDA |
$ | 450 | $ | 395 | 14 | % | $ | 489 | $ | 453 | $ | 431 | 8.3 | % | 5.1 | % | |||||||||
Other Operations and Headquarters(2) |
(7 | ) | (34 | ) | 79 | % | (39 | ) | (40 | ) | (34 | ) | 1.4 | % | (17.3 | )% | |||||||||
| | | | | | | | | | | | | | | | | | | | | | | | | | |
Total Adjusted EBITDA |
$ | 443 | $ | 361 | 23 | % | $ | 450 | $ | 413 | $ | 397 | 8.9 | % | 4.1 | % | |||||||||
| | | | | | | | | | | | | | | | | | | | | | | | | | |
| | | | | | | | | | | | | | | | | | | | | | | | | | |
| | | | | | | | | | | | | | | | | | | | | | | | | | |
- (1)
- For
our definition of Adjusted EBITDA and a reconciliation thereof to net (loss) income, see "Prospectus Summary—Summary Historical Consolidated
Financial and Other Operating Data."
- (2)
- Represents unallocated corporate expenses.
The table below presents selected operating metrics related to customer counts and customer retention for our Terminix and American Home Shield segments.
| |
As of September 30, |
As of December 31, |
||||||||||||||
|---|---|---|---|---|---|---|---|---|---|---|---|---|---|---|---|---|
| |
2014 | 2013 | 2013 | 2012 | 2011 | |||||||||||
Terminix— |
||||||||||||||||
(Reduction) Growth in Pest Control Customers |
0.2 | % | (1.1 | )% | (1.6 | )% | 0.8 | % | 6.4 | % | ||||||
Pest Control Customer Retention Rate |
80.2 | % | 79.4 | % | 79.3 | % | 79.3 | % | 80.6 | % | ||||||
Reduction in Termite Customers |
(2.6 | )% | (2.4 | )% | (2.3 | )% | (1.4 | )% | (1.0 | )% | ||||||
Termite Customer Retention Rate |
84.7 | % | 85.3 | % | 85.1 | % | 85.6 | % | 86.1 | % | ||||||
American Home Shield— |
||||||||||||||||
Growth (Reduction) in Home Warranties(1) |
13.4 | % | (0.4 | )% | 0.3 | % | (3.0 | )% | 1.6 | % | ||||||
Customer Retention Rate(1) |
75.4 | % | 74.0 | % | 74.3 | % | 73.3 | % | 75.1 | % | ||||||
- (1)
- As of September 30, 2014, excluding the impact of the HSA acquisition, the growth in home warranties and the customer retention rate for our American Home Shield segment was 3.4 percent and 75.7 percent, respectively.
Terminix Segment
Nine Months Ended September 30, 2014 compared to Nine Months Ended September 30, 2013
The Terminix segment, which provides termite and pest control services to residential and commercial customers and distributes pest control products, reported a 3.7 percent increase in revenue and a 10.9 percent increase in Adjusted EBITDA for the nine months ended September 30, 2014 compared to the nine months ended September 30, 2013.
69
Revenue
Revenue by service line is as follows:
| |
Nine Months Ended September 30, |
% of Revenue |
||||||||
|---|---|---|---|---|---|---|---|---|---|---|
(In millions)
|
2014 | 2013 | 2014 | |||||||
Pest Control |
$ | 569 | $ | 549 | 54 | % | ||||
Termite |
428 | 408 | 41 | % | ||||||
Other |
51 | 54 | 5 | % | ||||||
| | | | | | | | | | | |
Total revenue |
$ | 1,049 | $ | 1,012 | 100 | % | ||||
| | | | | | | | | | | |
| | | | | | | | | | | |
| | | | | | | | | | | |
Pest control revenue increased 3.6 percent compared to the nine months ended September 30, 2013, reflecting improved price realization, the introduction of a new mosquito service and a favorable product mix. Pest control customer counts as of September 30, 2014 were comparable to September 30, 2013, driven by a decrease in new unit sales, offset by an 80 basis points, or "bps," increase in the customer retention rate and an increase in acquisitions.
Termite revenue, including the wildlife exclusion, crawl space encapsulation and attic insulation products which are managed as a component of our termite line of business, increased 4.8 percent compared to the nine months ended September 30, 2013. Termite renewal revenue comprised 53 percent of total termite revenue, while the remainder consisted of termite new unit revenue. The increase in termite revenue reflects introductions of new products (wildlife exclusion and crawlspace encapsulation), increased sales of attic insulation and improved price realization, offset, in part, by a decrease in traditional termite sales driven by mild weather conditions. Termite customer counts decreased 2.6 percent compared to September 30, 2013, driven by a decrease in traditional new unit sales and acquisitions and a 60 bps decrease in the customer retention rate, offset, in part, by the introduction of new products.
As of September 30, 2014, mosquito, wildlife exclusion and crawl space encapsulation are being offered in substantially all geographic markets where we believe substantial market opportunity exists. We are now focusing our efforts on increasing our market share in these product lines.
Adjusted EBITDA
The following table provides a summary of changes in the segment's Adjusted EBITDA for the nine months ended September 30, 2014 compared to the nine months ended September 30, 2013:
(In millions)
|
|
|||
|---|---|---|---|---|
Nine Months Ended September 30, 2013 |
$ | 223 | ||
Impact of change in revenue |
21 | |||
Damage claims |
(4 | ) | ||
Selling and administrative expenses |
6 | |||
Other |
2 | |||
| | | | | |
Nine Months Ended September 30, 2014 |
$ | 248 | ||
| | | | | |
| | | | | |
| | | | | |
The increase in damage claims was primarily driven by higher claim payments. The decrease in selling and administrative expenses was driven by overhead cost reductions achieved in the nine months ended September 30, 2014 and a reduction in key executive transition charges, offset, in part, by higher sales costs.
70
Year ended December 31, 2013 Compared to Year Ended December 31, 2012
The Terminix segment reported a 3.5 percent increase in revenue and a 0.3 percent increase in Adjusted EBITDA for the year ended December 31, 2013 compared to 2012.
Revenue
Revenue by service line is as follows:
| |
Year ended December 31, | % of Revenue |
||||||||
|---|---|---|---|---|---|---|---|---|---|---|
(In millions)
|
2013 | 2012 | 2013 | |||||||
Pest Control |
$ | 731 | $ | 700 | 55.9 | % | ||||
Termite |
508 | 499 | 38.8 | % | ||||||
Other |
70 | 66 | 5.3 | % | ||||||
| | | | | | | | | | | |
Total revenue |
$ | 1,309 | $ | 1,265 | 100.0 | % | ||||
| | | | | | | | | | | |
| | | | | | | | | | | |
| | | | | | | | | | | |
Pest control revenue increased 4.4 percent compared to 2012, reflecting improved price realization, offset, in part, by a 0.4 percent decrease in average pest control customer counts. Absolute pest control customer counts decreased 1.6 percent compared to 2012, driven by a decrease in new unit sales and acquisitions. The pest control customer retention rate was comparable to 2012.
Termite revenue increased 1.8 percent compared to 2012. Termite renewal revenue comprised 52 percent of total termite revenue, while the remainder consisted of termite new unit revenue. The increase in termite revenue reflected an increase in non-renewable sales, the introduction of a new product (crawlspace encapsulation), increased sales of attic insulation and improved price realization, offset, in part, by a 2.1 percent decrease in average customer counts. Absolute termite customer counts declined 2.3 percent compared to 2012, driven by a decrease in traditional new unit sales and a 50 bps decrease in the customer retention rate. Traditional termite new unit sales were adversely impacted by continued softness in demand for termite control services in 2013. Termite activity is unpredictable in its nature. Factors that can impact termite activity include conducive weather conditions and consumer awareness of termite swarms.
Product distribution revenue, which has lower margins than pest or termite revenue, increased $4 million compared to 2012.
We will continue to make investments to transform our customers' experiences through a combination of new technology and improved processes to, among other things, maintain or improve our high retention rates in our pest control and termite service lines.
Adjusted EBITDA
The following table provides a summary of changes in the segment's Adjusted EBITDA for the year ended December 31, 2013 compared with the year ended December 31, 2012:
(In millions)
|
|
|||
|---|---|---|---|---|
Year ended December 31, 2012 |
$ | 266 | ||
Change in revenue |
14 | |||
Bad debt |
(3 | ) | ||
Legal |
(7 | ) | ||
Selling and administrative expenses |
(3 | ) | ||
Key executive transition charges |
(1 | ) | ||
| | | | | |
Year ended December 31, 2013 |
$ | 266 | ||
| | | | | |
| | | | | |
| | | | | |
71
The increase in bad debt expense was driven by aging of commercial accounts and the increase in legal expense was driven by increased provisions for certain legal matters. The increase in selling and administrative expenses was primarily driven by increased investments in sales and marketing, offset, in part, by lower incentive compensation expense. Key executive transition charges of $1 million were recorded in 2013, which included recruiting costs and a signing bonus related to the hiring of the new President of Terminix.
Year ended December 31, 2012 Compared to Year Ended December 31, 2011
The Terminix segment reported a 6.1 percent increase in revenue and a 6.6 percent increase in Adjusted EBITDA for the year ended December 31, 2012 compared to 2011.
Revenue
Revenue by service line is as follows:
| |
Year ended December 31, |
% of Revenue |
||||||||
|---|---|---|---|---|---|---|---|---|---|---|
(In millions)
|
2012 | 2011 | 2012 | |||||||
Pest Control |
$ | 700 | $ | 656 | 55.4 | % | ||||
Termite |
499 | 482 | 39.5 | % | ||||||
Other |
66 | 55 | 5.1 | % | ||||||
| | | | | | | | | | | |
Total revenue |
$ | 1,265 | $ | 1,193 | 100.0 | % | ||||
| | | | | | | | | | | |
| | | | | | | | | | | |
| | | | | | | | | | | |
Pest control revenue increased 6.8 percent compared to 2011, reflecting a 4.2 percent increase in average customer counts, a $12 million increase in other pest revenue, primarily bed bug services, and improved price realization. Absolute pest control customer counts increased 0.8 percent compared to 2011, driven by new unit sales and acquisitions, offset, in part, by a 130 bps decrease in the customer retention rate.
Termite revenue increased 3.5 percent compared to 2011. Termite renewal revenue comprised 55 percent of total termite revenue, while the remainder consisted of termite new unit revenue. The increase in termite revenue reflected improved price realization and an increase in non-renewable sales, offset, in part, by a 1.1 percent decrease in average customer counts. Absolute termite customer counts declined 1.4 percent compared to 2011, driven by a 50 bps decrease in the customer retention rate.
Product distribution revenue, which has lower margins than pest or termite revenue, increased $10 million compared to 2011.
Adjusted EBITDA
The following table provides a summary of changes in the segment's Adjusted EBITDA for the year ended December 31, 2012 compared with the year ended December 31, 2011:
(In millions)
|
|
|||
|---|---|---|---|---|
Year ended December 31, 2011 |
$ | 249 | ||
Change in revenue |
33 | |||
Selling and administrative expenses |
(19 | ) | ||
Other |
3 | |||
| | | | | |
Year ended December 31, 2012 |
$ | 266 | ||
| | | | | |
| | | | | |
| | | | | |
The increase in selling and administrative expenses was primarily driven by increased investments in sales and marketing and higher incentive compensation expense.
72
American Home Shield Segment
Nine Months Ended September 30, 2014 compared to Nine Months Ended September 30, 2013
The American Home Shield segment, which provides home warranties for household systems and appliances, reported a 12.2 percent increase in revenue and a 26.0 percent increase in Adjusted EBITDA for the nine months ended September 30, 2014 compared to the nine months ended September 30, 2013. On February 28, 2014, we acquired Home Security of America, Inc., or, "HSA," a company with 2013 revenue of approximately $62 million. The HSA acquisition contributed approximately $41 million in revenue in the nine months ended September 30, 2014.
Revenue
As of September 30, 2014 compared to September 30, 2013, customer counts increased 13.4 percent, and the customer retention rate increased 140 bps. Excluding HSA, for the same period, customer counts increased 3.4 percent, and the customer retention rate increased 170 bps. The revenue results reflect the impact of the HSA acquisition, the 3.4 percent increase in customer counts, a favorable product mix and an increase due to differences between years in the expected timing of contract claims. American Home Shield recognizes revenue over the contract period in proportion to expected direct costs.
Adjusted EBITDA
The following table provides a summary of changes in the segment's Adjusted EBITDA for the nine months ended September 30, 2014 compared to the nine months ended September 30, 2013:
(In millions)
|
|
|||
|---|---|---|---|---|
Nine Months Ended September 30, 2013 |
$ | 114 | ||
Impact of change in revenue |
36 | |||
Contract claims |
7 | |||
Selling and administrative expenses |
(10 | ) | ||
Tax-related reserves |
(3 | ) | ||
Interest and net investment income |
2 | |||
Other |
(2 | ) | ||
| | | | | |
Nine Months Ended September 30, 2014 |
$ | 144 | ||
| | | | | |
| | | | | |
| | | | | |
The decrease in contract claims was primarily driven by lower claims costs due, in part, to an increase in the service fee charged to our customers for service visits and, to a lesser extent, mild weather conditions, offset, in part, by the impact of favorable adjustments to reserves for prior year contract claims of $1 million and $5 million in the nine months ended September 30, 2014 and 2013, respectively. The increase in selling and administrative expenses primarily included the addition of administrative costs as a result of the acquisition of HSA and incremental marketing investments in our direct to consumer channel, offset, in part, by lower technology costs driven by the decision in the first quarter of 2014 to abandon efforts to deploy a new operating system and a reduction in key executive transition charges.
In the nine months ended September 30, 2014 and 2013, the segment's Adjusted EBITDA included interest and net investment income from the American Home Shield investment portfolio of $6 million and $4 million, respectively. Additionally, a $3 million reduction in tax-related reserves was recorded in the nine months ended September 30, 2013 for which there was no similar adjustment recorded in the nine months ended September 30, 2014.
73
Impairment of Software and Other Related Costs
In February 2014, American Home Shield made the decision to abandon its efforts to deploy a new operating system. This decision will allow us to more effectively focus our energy and resources on driving growth and serving our customers. Important factors that led to this decision include:
- •
- the ongoing operational costs of the new operating system would have been high;
- •
- enhancements to our existing operating system enabled it to support our needs;
- •
- certain planned benefits of the new operating system can be achieved through other means; and
- •
- reallocating resources to areas that will allow us to focus on growing our business.
We recorded an impairment charge of $47 million in the nine months ended September 30, 2014 relating to this decision.
Year ended December 31, 2013 Compared to Year Ended December 31, 2012
The American Home Shield segment reported a 2.7 percent increase in revenue and a 24.4 percent increase in Adjusted EBITDA for the year ended December 31, 2013 compared to 2012.
Revenue
The revenue results reflect improved price realization, offset, in part, by a 1.5 percent decrease in average customer counts. Absolute customer counts increased 0.3 percent compared to 2012, driven by an increase in new unit sales and a 100 bps increase in the customer retention rate.
Adjusted EBITDA
The following table provides a summary of changes in the segment's Adjusted EBITDA for the year ended December 31, 2013 compared with the year ended December 31, 2012:
(In millions)
|
|
|||
|---|---|---|---|---|
Year ended December 31, 2012 |
$ | 117 | ||
Change in revenue |
9 | |||
Contract claims |
27 | |||
Tax-related reserves |
8 | |||
Selling and administrative expenses |
(14 | ) | ||
Key executive transition charges |
1 | |||
Interest and net investment income |
(1 | ) | ||
Other |
(2 | ) | ||
| | | | | |
Year ended December 31, 2013 |
$ | 145 | ||
| | | | | |
| | | | | |
| | | | | |
Contract claims expense decreased $27 million in the year ended December 31, 2013 as compared to the year ended December 31, 2012 (including a favorable adjustment to reserves for prior year contract claims of $4 million recorded in 2013). This favorable outcome was driven, in part, by an increase in the service fee charged to our customers for service visits and, to a lesser extent, by cooler summer temperatures in 2013 as compared to 2012.
A $3 million reduction in tax-related reserves was recorded in 2013, and a $5 million increase in tax-related reserves was recorded in 2012. The increase in selling and administrative expenses primarily included increased investments in sales and marketing to drive future growth, principally in our direct-to-consumer channel, and higher technology costs, offset, in part, by lower provisions for certain legal matters.
74
Key executive transition charges of $1 million were recorded in 2012, which included recruiting costs and a signing bonus related to the hiring of the new President of American Home Shield and separation charges related to the retirement of the former President of American Home Shield. Interest and net investment income from the American Home Shield investment portfolio of $5 million and $6 million was recorded in 2013 and 2012, respectively.
Year ended December 31, 2012 Compared to Year Ended December 31, 2011
The American Home Shield segment reported a 5.0 percent increase in revenue and a 9.4 percent increase in Adjusted EBITDA for the year ended December 31, 2012 compared to 2011.
Revenue
The revenue results reflected improved price realization, offset, in part, by a 0.9 percent decrease in average customer counts. Absolute customer counts decreased 3.0 percent compared to 2011, driven by a decrease in new unit sales and a 180 bps decrease in the customer retention rate.
Adjusted EBITDA
The following table provides a summary of changes in the segment's Adjusted EBITDA for the year ended December 31, 2012 compared with the year ended December 31, 2011:
(In millions)
|
|
|||
|---|---|---|---|---|
Year ended December 31, 2011 |
$ | 107 | ||
Change in revenue |
13 | |||
Contract claims |
15 | |||
Tax-related reserves |
(5 | ) | ||
Selling and administrative expenses |
(9 | ) | ||
Key executive transition charges |
(1 | ) | ||
Interest and net investment income |
(4 | ) | ||
Other |
1 | |||
| | | | | |
Year ended December 31, 2012 |
$ | 117 | ||
| | | | | |
| | | | | |
| | | | | |
A $5 million increase in tax-related reserves was recorded in 2012. The increase in selling and administrative expenses primarily included higher provisions for certain legal matters and increased investments to drive improvements in service delivery, offset, in part, by a reduction in sales and marketing costs.
Key executive transition charges of $1 million were recorded in 2012, which included recruiting costs and a signing bonus related to the hiring of the new President of American Home Shield and separation charges related to the retirement of the former President of American Home Shield. Interest and net investment income from the American Home Shield investment portfolio of $6 million and $10 million was recorded in 2012 and 2011, respectively.
Franchise Services Group Segment
Nine Months Ended September 30, 2014 compared to Nine Months Ended September 30, 2013
The Franchise Services Group segment, which consists of the ServiceMaster Restore (disaster restoration), ServiceMaster Clean (janitorial), Merry Maids (residential cleaning), Furniture Medic (furniture repair) and AmeriSpec (home inspection) businesses, reported an 8.0 percent increase in revenue and a 1.5 percent increase in Adjusted EBITDA for the nine months ended September 30, 2014 compared to the nine months ended September 30, 2013.
75
Revenue
Revenue by service line is as follows:
| |
Nine Months Ended September 30, |
% of Revenue |
||||||||
|---|---|---|---|---|---|---|---|---|---|---|
(In millions)
|
2014 | 2013 | 2014 | |||||||
Royalty Fees |
$ | 90 | $ | 86 | 48 | % | ||||
Company-Owned Merry Maids Branches |
47 | 47 | 25 | % | ||||||
Janitorial National Accounts |
25 | 17 | 13 | % | ||||||
Sales of Products |
17 | 16 | 9 | % | ||||||
Other |
10 | 8 | 5 | % | ||||||
| | | | | | | | | | | |
Total revenue |
$ | 189 | $ | 175 | 100 | % | ||||
| | | | | | | | | | | |
| | | | | | | | | | | |
| | | | | | | | | | | |
Royalty fees increased 4.4 percent compared to the nine months ended September 30, 2013, primarily driven by increases in disaster restoration services. Revenue from company-owned Merry Maids branches decreased 1.5 percent compared to the nine months ended September 30, 2013 with customer counts down 5.9 percent compared to September 30, 2013. Revenue from janitorial national accounts increased 51.2 percent compared to the nine months ended September 30, 2013, driven by strong sales activity. Sales of products to franchisees increased 6.3 percent compared to the nine months ended September 30, 2013, driven by high franchisee demand for equipment.
Adjusted EBITDA
The following table provides a summary of changes in the segment's Adjusted EBITDA for the nine months ended September 30, 2014 compared to the nine months ended September 30, 2013:
(In millions)
|
|
|||
|---|---|---|---|---|
Nine Months Ended September 30, 2013 |
$ | 57 | ||
Impact of change in revenue |
2 | |||
Selling and administrative expenses |
(1 | ) | ||
Nine Months Ended September 30, 2014 |
$ | 58 | ||
| | | | | |
| | | | | |
| | | | | |
The nominal impact of the increase in revenue on Adjusted EBITDA was a result of increases in relatively low margin revenue from janitorial national accounts and sales of products.
Year ended December 31, 2013 Compared to Year Ended December 31, 2012
The Franchise Services Group segment reported a 6.3 percent increase in revenue and an 11.7 percent increase in Adjusted EBITDA for the year ended December 31, 2013 compared to 2012.
76
Revenue
Revenue by service line is as follows:
| |
Year ended December 31, |
% of Revenue |
||||||||
|---|---|---|---|---|---|---|---|---|---|---|
(In millions)
|
2013 | 2012 | 2013 | |||||||
Royalty Fees |
$ | 118 | $ | 114 | 49.9 | % | ||||
Company-Owned Merry Maids Branches |
63 | 60 | 26.8 | % | ||||||
Janitorial National Accounts |
23 | 17 | 9.6 | % | ||||||
Sales of Products |
21 | 21 | 9.1 | % | ||||||
Other |
11 | 9 | 4.6 | % | ||||||
| | | | | | | | | | | |
Total revenue |
$ | 236 | $ | 221 | 100.0 | % | ||||
| | | | | | | | | | | |
| | | | | | | | | | | |
| | | | | | | | | | | |
Royalty fees increased 3.3 percent compared to 2012, primarily driven by increases in disaster restoration services. Revenue from company-owned Merry Maids branches increased 4.3 percent compared to 2012, reflecting a 5.3 percent increase in average customer counts and improved price realization, offset, in part, by a decline in non-recurring services. Revenue from janitorial national accounts increased 35.1 percent compared to 2012, driven by strong sales activity.
Adjusted EBITDA
The following table provides a summary of changes in the segment's Adjusted EBITDA for the year ended December 31, 2013 compared with the year ended December 31, 2012:
(In millions)
|
|
|||
|---|---|---|---|---|
Year ended December 31, 2012 |
$ | 70 | ||
Impact of change in revenue |
7 | |||
Key executive transition charges |
1 | |||
| | | | | |
Year ended December 31, 2013 |
$ | 78 | ||
| | | | | |
| | | | | |
| | | | | |
The impact of the increase in revenue was driven by the increase in royalty fees and relatively low margin revenue from janitorial national accounts.
Key executive transition charges of $1 million were recorded in 2012, which included relocation costs related to the hiring of the new President of the Franchise Services Group and separation charges related to the retirement of the former President of the Franchise Services Group.
Year ended December 31, 2012 Compared to Year Ended December 31, 2011
The Franchise Services Group segment reported a 0.8 percent increase in revenue and a 6.2 percent decrease in Adjusted EBITDA for the year ended December 31, 2012 compared to 2011.
77
Revenue
Revenue by service line is as follows:
| |
Year ended December 31, |
% of Revenue |
||||||||
|---|---|---|---|---|---|---|---|---|---|---|
(In millions)
|
2012 | 2011 | 2012 | |||||||
Royalty Fees |
$ | 114 | $ | 114 | 51.4 | % | ||||
Company-Owned Merry Maids Branches |
60 | 61 | 27.4 | % | ||||||
Janitorial National Accounts |
17 | 13 | 7.6 | % | ||||||
Sales of Products |
21 | 24 | 9.7 | % | ||||||
Other |
9 | 8 | 3.9 | % | ||||||
| | | | | | | | | | | |
Total revenue |
$ | 221 | $ | 220 | 100.0 | % | ||||
| | | | | | | | | | | |
| | | | | | | | | | | |
| | | | | | | | | | | |
Revenue from company-owned Merry Maids branches decreased 0.8 percent compared to 2011, reflecting a $5 million reduction in revenue driven by the sale of ten company-owned branches to existing and new franchisees in the fourth quarter of 2011, offset, in part, by improved price realization and, as adjusted for branch dispositions in 2011, a 7.3 percent increase in average customer counts. Revenue from janitorial national accounts increased 32.7 percent compared to 2011, driven by strong sales activity. Sales of products to franchisees decreased 8.3 percent compared to 2011, driven by lower franchisee demand for equipment.
Adjusted EBITDA
The following table provides a summary of changes in the segment's Adjusted EBITDA for the year ended December 31, 2012 compared with the year ended December 31, 2011:
(In millions)
|
|
|||
|---|---|---|---|---|
Year ended December 31, 2011 |
$ | 75 | ||
Impact of change in revenue |
(2 | ) | ||
Gain on sale |
(1 | ) | ||
Other |
(2 | ) | ||
| | | | | |
Year ended December 31, 2012 |
$ | 70 | ||
| | | | | |
| | | | | |
| | | | | |
The impact of the increase in revenue was driven by decreases in royalty fees and sales of products to franchisees, offset, in part, by the increase in relatively low margin revenue from janitorial national accounts.
Key executive transition charges of $1 million were recorded in each of the years ended December 31, 2012 and 2011 which included recruiting, relocation costs and a signing bonus related to the hiring of a new President of our Franchise Services Group in 2011 and separation charges related to the retirement of the former President of our Franchise Services Group in 2012 and the resignation of the former President of Merry Maids in 2011. Additionally, a $1 million gain resulting from the sale of ten company-owned branches to existing and new franchisees was recorded in 2011.
Other Operations and Headquarters
Nine Months Ended September 30, 2014 compared to Nine Months Ended September 30, 2013
The following section discusses results for our Other Operations and Headquarters functions, which includes SMAC and our headquarters functions. Other Operations and Headquarters reported a $27 million increase in Adjusted EBITDA for the nine months ended September 30, 2014 compared to the nine months ended September 30, 2013.
78
Adjusted EBITDA
The following table provides a summary of changes in Other Operations and Headquarters' Adjusted EBITDA for the nine months ended September 30, 2014 compared to the nine months ended September 30, 2013:
(In millions)
|
|
|||
|---|---|---|---|---|
Nine Months Ended September 30, 2013 |
$ | (34 | ) | |
Insurance program |
(3 | ) | ||
Selling and administrative expenses |
31 | |||
Other |
(1 | ) | ||
| | | | | |
Nine Months Ended September 30, 2014 |
$ | (7 | ) | |
| | | | | |
| | | | | |
| | | | | |
The increased expense in our automobile, general liability and workers' compensation insurance program was driven by adverse claims trends. The decrease in selling and administrative expenses primarily included decreased costs in our centers of excellence driven by the transfer of employees to New TruGreen in combination with fees received under the transition services agreement with New TruGreen and other cost reductions achieved in the nine months ended September 30, 2014.
Year ended December 31, 2013 Compared to Year Ended December 31, 2012
Other Operations and Headquarters reported a 1.4 percent decrease in Adjusted EBITDA for the year ended December 31, 2013 compared to 2012.
Adjusted EBITDA
The following table provides a summary of changes in Other Operations and Headquarters' Adjusted EBITDA for the year ended December 31, 2013 compared with the year ended December 31, 2012:
(In millions)
|
|
|||
|---|---|---|---|---|
Year ended December 31, 2012 |
$ | (40 | ) | |
Insurance program |
(4 | ) | ||
Selling and administrative expenses |
9 | |||
Key executive transition charges |
(7 | ) | ||
Interest and net investment income |
2 | |||
Other |
1 | |||
| | | | | |
Year ended December 31, 2013 |
$ | (39 | ) | |
| | | | | |
| | | | | |
| | | | | |
The increased expenses in our automobile, general liability and workers' compensation insurance program were driven by adverse claims trends. The decrease in selling and administrative expenses primarily included decreased costs in our centers of excellence driven by cost reductions realized through recent initiatives.
Key executive transition charges of $8 million and $1 million were recorded in 2013 and 2012, respectively, which included recruiting costs and signing bonuses for Robert J. Gillette, our Chief Executive Officer, or "CEO," Alan J. M. Haughie, our Chief Financial Officer, or "CFO," and other key executives and separation charges related to the resignation of our former CEO and other key executives. Additionally, interest and net investment income of $3 million and $1 million was recorded in 2013 and 2012, respectively.
Year ended December 31, 2012 Compared to Year Ended December 31, 2011
Other Operations and Headquarters reported a 17.3 percent decrease in Adjusted EBITDA for the year ended December 31, 2012 compared to 2011.
79
Adjusted EBITDA
The following table provides a summary of changes in Other Operations and Headquarters' Adjusted EBITDA for the year ended December 31, 2013 compared with the year ended December 31, 2012:
(In millions)
|
|
|||
|---|---|---|---|---|
Year ended December 31, 2011 |
$ | (34 | ) | |
Insurance program |
(10 | ) | ||
Key executive transition charges |
4 | |||
| | | | | |
Year ended December 31, 2012 |
$ | (40 | ) | |
| | | | | |
| | | | | |
| | | | | |
The increased expenses in our automobile, general liability and workers' compensation insurance program were driven by the reversal, in 2011, of claims reserves driven by favorable claims experience. Key executive transition charges of $1 million and $5 million were recorded in 2012 and 2011, respectively, and interest and net investment income of $1 million was recorded in 2012 and 2011.
Discontinued Operations
TruGreen Spin-off
On January 14, 2014, we completed the TruGreen Spin-off resulting in the spin-off of the TruGreen Business through a tax-free, pro rata dividend to our stockholders. As a result of the completion of the TruGreen Spin-off, New TruGreen operates the TruGreen Business as a private independent company.
The TruGreen Business experienced a significant downturn in recent years. From 2011 to 2013, the TruGreen Business lost 400,000 customers, or 19 percent of its customer base. The TruGreen Business's operating margins also eroded during this time frame due to production inefficiencies, higher chemical costs and inflationary pressures, compounded by lower fixed cost leverage as falling customer counts drove revenue down. The TruGreen Business experienced revenue and Adjusted EBITDA declines of 18.6 percent and 87.6 percent, respectively, from 2011 to 2013. In light of these developments, we made the decision to effect the TruGreen Spin-off, which enabled our management team to increase its focus on the Terminix, American Home Shield and Franchise Services Group segments, while providing New TruGreen, as an independently-operated, private company, the time and focus required to execute a turnaround. In addition, the TruGreen Spin-off was effected to enhance our ability to complete an initial public offering of our common stock and use the net proceeds primarily to reduce our indebtedness.
As a result of the TruGreen Spin-off, we were required to perform an interim impairment analysis as of January 14, 2014 on the TruGreen trade name. The assumptions were developed with the view of the TruGreen Business as a stand-alone company, resulting in an increase in the assumed discount rate of 350 bps as compared to the discount rate used in the October 1, 2013 impairment test for the TruGreen trade name. This interim impairment analysis resulted in a pre-tax non-cash trade name impairment charge of $139 million ($84 million, net of tax) to reduce the carrying value of the TruGreen trade name to its estimated fair value. This impairment charge was recorded in Loss from discontinued operations, net of income taxes, in the nine months ended September 30, 2014.
Other Dispositions
In the first quarter of 2011, we concluded that TruGreen LandCare did not fit within our long-term strategic plans and committed to a plan to sell the business. On April 21, 2011, we entered into a purchase agreement to sell the TruGreen LandCare business, and the disposition was effective as of April 30, 2011.
80
Financial Information for Discontinued Operations
Loss from discontinued operations, net of income taxes, for all periods presented includes the operating results of the TruGreen Business and the previously sold businesses.
The operating results of discontinued operations are as follows:
| |
Nine months ended September 30, |
Year ended December 31, | ||||||||||||||
|---|---|---|---|---|---|---|---|---|---|---|---|---|---|---|---|---|
(In millions)
|
2014 | 2013 | 2013 | 2012 | 2011 | |||||||||||
Revenue |
$ | 6 | $ | 715 | $ | 896 | $ | 979 | $ | 1,177 | ||||||
(Loss) income before income taxes(1)(2) |
(160 | ) | (695 | ) | (716 | ) | (803 | ) | 92 | |||||||
(Benefit) provision for income taxes(1)(2) |
(62 | ) | (162 | ) | (167 | ) | (107 | ) | 37 | |||||||
| | | | | | | | | | | | | | | | | |
(Loss) income, net of income taxes(1)(2) |
(98 | ) | (533 | ) | (549 | ) | (696 | ) | 55 | |||||||
Gain (loss) on sale, net of income taxes |
— | — | — | — | (2 | ) | ||||||||||
| | | | | | | | | | | | | | | | | |
(Loss) income from discontinued operations, net of income taxes(1)(2) |
$ | (98 | ) | $ | (533 | ) | $ | (549 | ) | $ | (696 | ) | $ | 53 | ||
| | | | | | | | | | | | | | | | | |
| | | | | | | | | | | | | | | | | |
| | | | | | | | | | | | | | | | | |
- (1)
- In
the nine months ended September 30, 2014, the TruGreen Business recorded a pre-tax non-cash trade name impairment charge of $139 million
($84 million, net of tax) in discontinued operations, net of income taxes. In the nine months ended September 30, 2013, the TruGreen Business recorded a pre-tax non-cash goodwill and
trade name impairment charge of $673 million ($521 million, net of tax) in discontinued operations, net of income taxes. During 2013, 2012 and 2011, we recorded pre-tax non-cash
impairment charges of $673 million ($521 million, net of tax), $909 million ($764 million, net of tax) and $37 million ($22 million, net of tax),
respectively, associated with the goodwill and trade name at the TruGreen Business in (loss) income from discontinued operations, net of income taxes.
- (2)
- As a result of the decision to sell TruGreen LandCare, a $34 million impairment charge ($21 million, net of tax) was recorded in loss from discontinued operations, net of income taxes, in the first quarter of 2011 to reduce the carrying value of TruGreen LandCare's assets to their estimated fair value less cost to sell in accordance with applicable accounting standards. Upon completion of the sale in 2011, a $6 million loss on sale ($2 million, net of tax) was recorded.
Year ended December 31, 2013 Compared to Year Ended December 31, 2012
The TruGreen Business reported revenue of $896 million in 2013, an 8.5 percent decrease compared to 2012. Revenue from residential lawn service customers, which was 82 percent of the TruGreen Business's revenue in 2013, decreased 8.8 percent compared to 2012, reflecting an 8.9 percent decline in average residential full program customer counts and inefficiencies in service delivery caused, in part, by integration issues with newly implemented technology, offset, in part, by improved price realization. Absolute customer counts declined 7.9 percent compared to 2012, driven by a 250 bps decrease in the residential full program customer retention rate, offset, in part, by new unit sales. The TruGreen Business's revenue also reflected a $14 million decrease in revenue from commercial customers compared to 2012.
Loss before incomes taxes for the TruGreen Business was $714 million in 2013 compared to $802 million in 2012. Non-cash impairment charges of $673 million and $909 million were recorded in 2013 and 2012, respectively. Key executive transition charges of $1 million were recorded in each of the years 2013 and 2012, which included recruiting costs and a signing bonus related to the hiring of David Alexander, the President of TruGreen, and separation charges related to the resignation in 2012 of Thomas Brackett, a former President of TruGreen. Additionally, restructuring charges of $15 million and $3 million were recorded in 2013 and 2012, respectively, which, in 2013, primarily represented expenses we incurred directly related to the TruGreen Spin-off. The remaining decline in income before income taxes of $136 million primarily reflected the impact of lower revenue; labor, chemical and vehicle inefficiency driven, in part, by integration issues with newly implemented technology; higher bad
81
debt expense; higher sales staffing levels; higher costs related to telephone and information technology systems; and increased investments in sales tools.
Year ended December 31, 2012 Compared to Year Ended December 31, 2011
The TruGreen Business reported revenue of $979 million in 2012, an 11.1 percent decrease compared to 2011. Revenue from residential lawn service customers decreased 13.0 percent compared to 2011, reflecting an 11.3 percent decline in average residential full program customer counts and a steep decline in less than full program sales, offset, in part, by improved price realization. Absolute customer counts declined 12.2 percent compared to 2011, driven by a decrease in new unit sales and acquisitions, offset, in part, by a 120 bps increase in the residential full program customer retention rate. The decrease in new unit sales was significantly impacted by changes in the TruGreen Business's product offerings and the rebalancing of its sales channel mix. The TruGreen Business's revenue also reflected a $14 million increase in revenue from commercial customers compared to 2011, offset, in part, by a $14 million decrease in third-party revenue, primarily sales of ice melt products, compared to 2011.
Loss before income taxes for the TruGreen Business was $802 million in 2012 compared to income before income taxes of $132 million in 2012. Non-cash impairment charges of $909 million and $37 million were recorded in 2012 and 2011, respectively. Key executive transition charges of $1 million were recorded in each of the years 2012 and 2011, which included recruiting costs related to the hiring of David Alexander, the President of TruGreen, and separation charges related to the resignation in 2012 of Thomas Brackett, a former President of TruGreen, and the resignation in 2011 of Stephen Donly, also a former President of TruGreen. Additionally, restructuring charges of $3 million and $1 million were recorded in 2013 and 2012, respectively. The remaining decline in income before income taxes of $60 million primarily reflected the impact of lower revenue, a reduction in labor productivity, higher fertilizer prices and usage rates, higher technology costs related to a new operating system, higher fuel prices and increased investments in productivity and standardization initiatives, offset, in part, by lower sales staffing, driven by TruGreen's decision to reduce its focus on the neighborhood sales channel, and a reduction in ice melt sales, which has lower margins than core lawn services.
Quarterly Operating Results (Unaudited)
Quarterly operating results for 2012, 2013 and the nine months ended September 30, 2014 in revenue, gross profit, income (loss) from continuing operations, income (loss) from discontinued operations, net of income taxes, net income (loss) and basic and diluted earnings (loss) per share are shown in the table below.
| |
2014 | |||||||||
|---|---|---|---|---|---|---|---|---|---|---|
(In millions, except per share data)
|
First Quarter | Second Quarter | Third Quarter | |||||||
Revenue |
$ | 533 | $ | 683 | $ | 664 | ||||
Gross Profit |
245 | 332 | 320 | |||||||
(Loss) Income from Continuing Operations(1) |
(18 | ) | 42 | (3 | ) | |||||
Loss from Discontinued Operations, net of income taxes(2) |
(95 | ) | (2 | ) | (1 | ) | ||||
Net (Loss) Income(1)(2) |
(113 | ) | 40 | (4 | ) | |||||
Basic (loss) earnings per share: |
||||||||||
(Loss) income from continuing operations |
(0.20 | ) | 0.46 | (0.02 | ) | |||||
Loss from discontinued operations, net of income taxes |
(1.03 | ) | (0.02 | ) | (0.01 | ) | ||||
Net (loss) income |
(1.23 | ) | 0.44 | (0.03 | ) | |||||
Diluted (loss) earnings per share: |
||||||||||
(Loss) income from continuing operations |
(0.20 | ) | 0.46 | (0.02 | ) | |||||
Loss from discontinued operations, net of income taxes |
(1.03 | ) | (0.02 | ) | (0.01 | ) | ||||
Net (loss) income |
(1.23 | ) | 0.44 | (0.03 | ) | |||||
82
| |
2013 | |||||||||||||||
|---|---|---|---|---|---|---|---|---|---|---|---|---|---|---|---|---|
(In millions, except per share data)
|
First Quarter | Second Quarter | Third Quarter | Fourth Quarter | Year | |||||||||||
Revenue |
$ | 514 | $ | 631 | $ | 615 | $ | 533 | $ | 2,293 | ||||||
Gross Profit |
244 | 302 | 290 | 237 | 1,073 | |||||||||||
Income (Loss) from Continuing Operations(1) |
6 | 15 | 23 | (2 | ) | 42 | ||||||||||
(Loss) Income from Discontinued Operations, net of income taxes(2) |
(30 | ) | (525 | ) | 22 | (16 | ) | (549 | ) | |||||||
Net (Loss) Income(1)(2) |
(24 | ) | (510 | ) | 45 | (18 | ) | (507 | ) | |||||||
Basic earnings (loss) per share: |
||||||||||||||||
Income (loss) from continuing operations |
0.07 | 0.16 | 0.25 | (0.02 | ) | 0.46 | ||||||||||
(Loss) income from discontinued operations, net of income taxes |
(0.32 | ) | (5.73 | ) | 0.24 | (0.18 | ) | (6.00 | ) | |||||||
Net (loss) income |
(0.25 | ) | (5.57 | ) | 0.49 | (0.20 | ) | (5.53 | ) | |||||||
Diluted earnings (loss) per share: |
||||||||||||||||
Income (loss) from continuing operations |
0.07 | 0.16 | 0.25 | (0.02 | ) | 0.46 | ||||||||||
(Loss) income from discontinued operations, net of income taxes |
(0.32 | ) | (5.68 | ) | 0.24 | (0.18 | ) | (5.95 | ) | |||||||
Net (loss) income |
(0.25 | ) | (5.52 | ) | 0.49 | (0.20 | ) | (5.49 | ) | |||||||
| |
2012 | |||||||||||||||
|---|---|---|---|---|---|---|---|---|---|---|---|---|---|---|---|---|
(In millions, except per share data)
|
First Quarter | Second Quarter | Third Quarter | Fourth Quarter | Year | |||||||||||
Revenue |
$ | 523 | $ | 611 | $ | 588 | $ | 492 | $ | 2,214 | ||||||
Gross Profit |
249 | 293 | 268 | 208 | 1,018 | |||||||||||
(Loss) Income from Continuing Operations(1) |
(39 | ) | 33 | 1 | (13 | ) | (18 | ) | ||||||||
Income (Loss) from Discontinued Operations, net of income taxes(2) |
9 | (11 | ) | (705 | ) | 11 | (696 | ) | ||||||||
Net (Loss) Income(1)(2) |
(30 | ) | 22 | (704 | ) | (2 | ) | (714 | ) | |||||||
Basic (loss) earnings per share: |
||||||||||||||||
(Loss) income from continuing operations |
(0.43 | ) | 0.36 | 0.01 | (0.14 | ) | (0.20 | ) | ||||||||
Income (loss) from discontinued operations, net of income taxes |
0.10 | (0.12 | ) | (7.67 | ) | 0.12 | (7.57 | ) | ||||||||
Net (loss) income |
(0.33 | ) | 0.25 | (7.67 | ) | (0.02 | ) | (7.77 | ) | |||||||
Diluted (loss) earnings per share: |
||||||||||||||||
(Loss) income from continuing operations |
(0.43 | ) | 0.36 | 0.01 | (0.14 | ) | (0.20 | ) | ||||||||
Income (loss) from discontinued operations, net of income taxes |
0.10 | (0.11 | ) | (7.52 | ) | 0.12 | (7.57 | ) | ||||||||
Net (loss) income |
(0.33 | ) | 0.24 | (7.51 | ) | (0.02 | ) | (7.77 | ) | |||||||
- (1)
- The results include restructuring charges primarily related to a branch optimization project at Terminix, a reorganization of leadership at American Home Shield and Franchise Services Group and an initiative to enhance capabilities and reduce costs in our centers of excellence at Other Operations and Headquarters. The table below summarizes the pre-tax and after-tax restructuring charges, by quarter, for 2014, 2013 and 2012.
83
| |
2014 | ||||||||||||
|---|---|---|---|---|---|---|---|---|---|---|---|---|---|
(In millions)
|
1st Quarter | 2nd Quarter | 3rd Quarter | Nine Months Ended September 30, |
|||||||||
Pre-tax |
$ | 5 | $ | 1 | $ | 1 | $ | 7 | |||||
After-tax |
$ | 3 | $ | 1 | $ | 1 | $ | 4 | |||||
| |
2013 | |||||||||||||||
|---|---|---|---|---|---|---|---|---|---|---|---|---|---|---|---|---|
(In millions)
|
1st Quarter | 2nd Quarter | 3rd Quarter | 4th Quarter | Year | |||||||||||
Pre-tax |
$ | 3 | $ | — | $ | 1 | $ | 2 | $ | 6 | ||||||
After-tax |
$ | 2 | $ | — | $ | — | $ | 2 | $ | 4 | ||||||
| |
2012 | |||||||||||||||
|---|---|---|---|---|---|---|---|---|---|---|---|---|---|---|---|---|
(In millions)
|
1st Quarter | 2nd Quarter | 3rd Quarter | 4th Quarter | Year | |||||||||||
Pre-tax |
$ | 3 | $ | 5 | $ | 2 | $ | 5 | $ | 15 | ||||||
After-tax |
$ | 2 | $ | 3 | $ | 1 | $ | 3 | $ | 9 | ||||||
The
results for the first quarter of 2014 include a charge of $48 million ($29 million, net of tax) for non-cash impairment of software and other related costs relating to the decision
to abandon the efforts to deploy a new operating system at American Home Shield.
The results for the third quarter of 2014 include a charge of $21 million ($13 million, net of tax) for consulting agreement termination fees paid to Equity Sponsors in connection with
the completion of the initial public offering and a $65 million ($41 million, net of tax) loss on extinguishment of debt related to the partial redemption of the 8% 2020 Notes and 7%
2020 Notes and the repayment of the Old Term Facilities.
The results for the first and third quarters of 2012 include a $39 million ($25 million, net of tax) loss and a $16 million ($10 million, net of tax) loss, respectively, on
extinguishment of debt related to the redemption of the remaining $996 million aggregate principal amount of the 2015 Notes and repayment of $276 million of outstanding borrowings under
the Old Term Facilities.
- (2)
- The results for the first quarter of 2014 include a pre-tax non-cash impairment charge of $139 million ($84 million, net of tax) to reduce the carrying value of the TruGreen trade name. The results for the second quarter of 2013 include pre-tax non-cash impairment charges of $673 million ($521 million, net of tax) to reduce the carrying value of TruGreen's goodwill and the TruGreen trade name. The results for the second and third quarters of 2012 include pre-tax non-cash impairment charges of $68 million ($41 million, net of tax) and $845 million ($725 million, net of tax), respectively, to reduce the carrying value of TruGreen's goodwill and the TruGreen trade name. Additionally, the results for the fourth quarter of 2012 include a favorable goodwill impairment adjustment of $4 million ($2 million, net of tax). See Note 1 to our audited consolidated financial statements and Note 12 to our unaudited condensed consolidated financial statement included in this prospectus for further details.
Liquidity and Capital Resources
Liquidity
We are highly leveraged, and a substantial portion of our liquidity needs are due to service requirements on our significant indebtedness. The agreements governing the 2020 Notes and the Credit Facilities contain covenants that limit or restrict the ability of SvM and certain of its subsidiaries to incur additional indebtedness, repurchase debt, incur liens, sell assets, make certain payments (including dividends) and enter into transactions with affiliates. As of September 30, 2014, SvM was in compliance with the covenants under the agreements that were in effect on such date.
84
Our ongoing liquidity needs are expected to be funded by cash on hand, net cash provided by operating activities and, as required, borrowings under our credit facilities. We expect that cash provided from operations and available capacity under the Revolving Credit Facility will provide sufficient funds to operate our business, make expected capital expenditures and meet our liquidity requirements for the following 12 months, including payment of interest and principal on our debt. On July 1, 2014, in connection with our initial public offering, SvM terminated the credit agreements governing its then-existing revolving credit facility and entered into the $300 million Revolving Credit Facility maturing in 2019. As of September 30, 2014, SvM had $161 million of remaining capacity available under the Revolving Credit Facility.
Cash and short- and long-term marketable securities totaled $387 million as of September 30, 2014, compared with $633 million as of December 31, 2013. As described below, on July 1, 2014, $243 million of available cash, together with borrowings under the Term Loan Facility and $120 million of net proceeds from our initial public offering, was used to repay in full the $2,187 million outstanding under the Old Term Facilities, and $42 million of available cash was used to pay debt issuance costs of $24 million and to pay original issue discount of $18 million in connection with the Term Loan Facility. In addition, on July 16, 2014, SvM used proceeds from our initial public offering to redeem $210 million of the 8% 2020 Notes and $263 million of the 7% 2020 Notes. In connection with the redemption of the 8% 2020 Notes and the 7% 2020 Notes, SvM was required to pay a pre-payment premium of $17 million and $18 million, respectively, and accrued interest of $7 million and $8 million, respectively.
Cash and short- and long-term marketable securities include balances associated with regulatory requirements at American Home Shield. See "—Limitations on Distributions and Dividends by Subsidiaries." American Home Shield's investment portfolio has been invested in a combination of high-quality, short-duration fixed-income securities and equities. We closely monitor the performance of the investments. From time to time, we review the statutory reserve requirements to which our regulated entities are subject and any changes to such requirements. These reviews may result in identifying current reserve levels above or below minimum statutory reserve requirements, in which case we may adjust our reserves. The reviews may also identify opportunities to satisfy certain regulatory reserve requirements through alternate financial vehicles.
Under the terms of our fuel swap contracts, we are required to post collateral in the event that the fair value of the contracts exceeds a certain agreed upon liability level and in other circumstances when required by the counterparty. As of September 30, 2014, the estimated fair value of our fuel swap contracts was a net liability of $1 million, and we had posted $1 million in letters of credit as collateral under our fuel hedging program, which were issued under SvM's Revolving Credit Facility. The continued use of letters of credit for this purpose in the future could limit SvM's ability to post letters of credit for other purposes and could limit SvM's borrowing availability under its revolving credit facilities. However, we do not expect the fair value of the outstanding fuel swap contracts to materially impact our financial position or liquidity.
We may from time to time repurchase or otherwise retire or extend our debt and/or take other steps to reduce our debt or otherwise improve our financial position. These actions may include open market debt repurchases, negotiated repurchases, other retirements of outstanding debt and/or opportunistic refinancing of debt. The amount of debt that may be repurchased or otherwise retired or refinanced, if any, will depend on market conditions, trading levels of our debt, our cash position, compliance with debt covenants and other considerations. Our affiliates may also purchase our debt from time to time, through open market purchases or other transactions. In such cases, our debt may not be retired, in which case we would continue to pay interest in accordance with the terms of the debt, and we would continue to reflect the debt as outstanding in our audited consolidated financial statements.
85
Term Loan Facility
On July 1, 2014, in connection with our initial public offering, SvM terminated the credit agreements governing its Old Term Facilities and entered into a $1,825 million Term Loan Facility maturing 2021. Borrowings under the Term Loan Facility, together with $243 million of available cash and $120 million of net proceeds of the initial public offering, were used to repay in full the $2,187 million outstanding under the Old Term Facilities. In addition, $42 million of available cash was used to pay debt issuance costs of $24 million and to pay original issue discount of $18 million in connection with the Term Loan Facility.
On July 23, 2014, SvM entered into two four-year interest rate swap agreements effective August 1, 2014. The aggregate notional amount of the agreements was $300 million. Under the terms of the agreements, SvM will pay a weighted-average fixed rate of interest of 1.786 percent on the $300 million notional amount, and SvM will receive a floating rate of interest (based on one-month LIBOR) on the notional amount. Therefore, during the term of the agreements, the effective interest rate on $300 million of the Term Loan Facility is fixed at a rate of 1.786 percent, plus the incremental borrowing margin of 3.25 percent.
On July 23, 2014, SvM entered into three forty-one month interest rate swap agreements effective March 1, 2015. The aggregate notional amount of the agreements was $400 million. Under the terms of the agreements, SvM will pay a weighted-average fixed rate of interest of 1.927 percent on the $400 million notional amount, and SvM will receive a floating rate of interest (based on one-month LIBOR) on the notional amount. Therefore, during the term of the agreements, the effective interest rate on $400 million of the Term Loan Facility is fixed at a rate of 1.927 percent, plus the incremental borrowing margin of 3.25 percent.
Senior Notes
The 8% 2020 Notes will mature on February 15, 2020. The proceeds from the 8% 2020 Notes together with available cash, were used to redeem $600 million in aggregate principal amount of SvM's outstanding 2015 Notes in the first quarter of 2012. The 7% 2020 Notes will mature on August 15, 2020. SvM used a majority of the proceeds from the 7% 2020 Notes to redeem the remaining $396 million aggregate principal amount of its 2015 Notes and to repay $276 million of outstanding borrowings under its Old Term Facilities during the third quarter of 2012. We recorded a loss on extinguishment of debt of $55 million in our consolidated statements of operations and comprehensive (loss) income for the year ended December 31, 2012 related to these transactions and the redemption of the 2015 Notes in the first quarter of 2012 discussed above. The 2020 Notes are jointly and severally guaranteed on a senior unsecured basis by SvM's domestic subsidiaries that guarantee its indebtedness under the Credit Facilities. The 2020 Notes are not guaranteed by any of SvM's non-U.S. subsidiaries, any subsidiaries subject to regulation as an insurance, home warranty or similar company, or certain other subsidiaries.
On July 16, 2014, SvM used proceeds from our initial public offering to redeem $210 million of the outstanding 8% 2020 Notes and $263 million of the 7% 2020 Notes. In connection with the redemption of the 8% 2020 Notes and the 7% 2020 Notes, SvM was required to pay a pre-payment premium of $17 million and $18 million, respectively, and accrued interest of $7 million and $8 million, respectively.
On January 16, 2015, SvM gave notice to redeem $190 million in aggregate principal amount of the 8% 2020 Notes at a redemption price of 106.0% of the principal amount thereof on February 17, 2015. SvM intends to fund the partial redemption using available cash. In connection with the partial redemption, we expect to record a loss on extinguishment of debt of approximately $13 million in the first quarter of 2015, which includes a pre-payment premium of $11 million and the write-off of approximately $2 million of debt issuance costs.
86
Fleet and Equipment Financing Arrangements
SvM has entered into the Fleet Agreement which, among other things, allows us to obtain fleet vehicles through a leasing program. We expect to fulfill substantially all of our vehicle fleet needs through the leasing program under the Fleet Agreement. For the nine months ended September 30, 2014, we acquired $12 million of vehicles under the Fleet Agreement leasing program. All leases under the Fleet Agreement are capital leases for accounting purposes. The lease rental payments include an interest component calculated using a variable rate based on one-month LIBOR plus other contractual adjustments and a borrowing margin totaling 2.45 percent. We have no minimum commitment for the number of vehicles to be obtained under the Fleet Agreement. We estimate new lease financings under the Fleet Agreement for the full year 2014 ranged from approximately $15 million to $20 million.
Limitations on Distributions and Dividends by Subsidiaries
ServiceMaster and SvM are each holding companies, and as such have no independent operations or material assets other than ownership of equity interests in their respective subsidiaries. ServiceMaster and SvM each depend on their respective subsidiaries to distribute funds to them so that they may pay obligations and expenses, including satisfying obligations with respect to indebtedness. The ability of our subsidiaries to make distributions and dividends to us depends on their operating results, cash requirements and financial condition and general business conditions, as well as restrictions under the laws of our subsidiaries' jurisdictions.
The terms of the indenture governing the 2020 Notes and the agreements governing the Credit Facilities significantly restrict the ability of our subsidiaries, including SvM, to pay dividends, make loans or otherwise transfer assets to us. Further, SvM's subsidiaries are permitted under the terms of the Credit Facilities and other indebtedness to incur additional indebtedness that may restrict or prohibit the making of distributions, the payment of dividends or the making of loans by such subsidiaries to SvM and, in turn, to us.
Furthermore, there are third-party restrictions on the ability of certain of our subsidiaries to transfer funds to us. These restrictions are related to regulatory requirements at American Home Shield and to a subsidiary borrowing arrangement at SMAC. The payment of ordinary and extraordinary dividends by our home warranty and similar subsidiaries (through which we conduct our American Home Shield business) are subject to significant regulatory restrictions under the laws and regulations of the states in which they operate. Among other things, such laws and regulations require certain such subsidiaries to maintain minimum capital and net worth requirements and may limit the amount of ordinary and extraordinary dividends and other payments that these subsidiaries can pay to us. As of September 30, 2014, the total net assets subject to these third-party restrictions was $184 million. Such limitations were in effect through the end of 2014, and similar limitations are expected to be in effect in 2015. None of our subsidiaries are obligated to make funds available to SvM or to us through the payment of dividends.
We consider undistributed earnings of our foreign subsidiaries as of September 30, 2014 to be indefinitely reinvested and, accordingly, no U.S. income taxes have been provided thereon. The amount of cash associated with indefinitely reinvested foreign earnings was approximately $22 million and $14 million as of September 30, 2014 and December 31, 2013, respectively. We have not repatriated, nor do we anticipate the need to repatriate, funds to the United States to satisfy domestic liquidity needs arising in the ordinary course of business, including liquidity needs associated with our domestic debt service requirements.
87
Cash Flows
Cash flows from operating, investing and financing activities, as reflected in the accompanying condensed consolidated statements of cash flows included in this prospectus, are summarized in the following table.
| |
Nine Months Ended September 30, |
Year Ended December 31, | ||||||||||||||
|---|---|---|---|---|---|---|---|---|---|---|---|---|---|---|---|---|
(In millions)
|
2014 | 2013 | 2013 | 2012 | 2011 | |||||||||||
Net cash provided from (used for): |
||||||||||||||||
Operating activities |
$ | 132 | $ | 127 | $ | 208 | $ | 104 | $ | 74 | ||||||
Investing activities |
(51 | ) | (81 | ) | (70 | ) | (85 | ) | (80 | ) | ||||||
Financing activities |
(274 | ) | (60 | ) | (78 | ) | (14 | ) | (110 | ) | ||||||
Discontinued operations |
(15 | ) | (52 | ) | 6 | 83 | 188 | |||||||||
| | | | | | | | | | | | | | | | | |
Cash increase (decrease) during the period |
$ | (208 | ) | $ | (66 | ) | $ | 66 | $ | 88 | $ | 72 | ||||
| | | | | | | | | | | | | | | | | |
| | | | | | | | | | | | | | | | | |
| | | | | | | | | | | | | | | | | |
Operating Activities
Net cash provided from operating activities from continuing operations increased $5 million to $132 million for the nine months ended September 30, 2014 compared to $127 million for the nine months ended September 30, 2013.
Net cash provided from operating activities for the nine months ended September 30, 2014 was comprised of $203 million in earnings adjusted for non-cash charges, offset, in part, by a $72 million increase in cash required for working capital (a $27 million increase excluding the working capital impact of accrued interest, restructuring charges and taxes). Working capital requirements for the nine months ended September 30, 2014 were negatively impacted by the timing of interest payments on the 2020 Notes, payments of accrued interest attributable to the principal paydown of debt, payments related to settlements of certain legal-related matters and normal seasonal activity.
Net cash provided from operating activities for the nine months ended September 30, 2013 was comprised of $164 million in earnings adjusted for non-cash charges, offset, in part, by a $37 million increase in cash required for working capital (a $2 million increase excluding the working capital impact of accrued interest, restructuring charges and taxes). Working capital requirements for the nine months ended September 30, 2013 were impacted by normal seasonal activity, offset, in part, by the impact of improved payment terms with certain of our vendors and increased accruals for compensation and insurance related payments. In addition, working capital requirements were negatively impacted by the timing of interest payments on the 2020 Notes.
Net cash provided from operating activities from continuing operations increased $104 million to $208 million for the year ended December 31, 2013 compared to $104 million for the year ended December 31, 2012 and $74 million for the year ended December 31, 2011.
Net cash provided from operating activities in 2013 was comprised of $195 million in earnings adjusted for non-cash charges and a $22 million decrease in cash required for working capital, offset, in part, by $9 million in cash payments related to restructuring charges. For the year ended December 31, 2013, working capital requirements were favorably impacted by a change in the timing of customer prepayments.
Net cash provided from operating activities in 2012 was comprised of $157 million in earnings adjusted for non-cash charges, $3 million in premiums received on the issuance of the 2020 Notes and a $2 million decrease in cash required for working capital, offset, in part, by $43 million in cash payments for the call premium paid on the redemption of $996 million aggregate principal amount of
88
the 2015 Notes and $15 million in cash payments related to restructuring charges. For the year ended December 31, 2012, working capital requirements were adversely impacted by the timing of interest payments on the 2020 Notes and the Continuing Notes, as defined in "Description of Certain Indebtedness," and decreased accruals for incentive compensation.
Net cash provided from operating activities in 2011 was comprised of $135 million in earnings adjusted for non-cash charges, offset, in part, by $6 million in cash payments related to restructuring charges and a $55 million increase in cash required for working capital. For the year ended December 31, 2011, working capital requirements were adversely impacted by a reduction in reserve levels under certain self-insurance programs and unrecognized tax benefits.
Investing Activities
Net cash used for investing activities from continuing operations was $51 million for the nine months ended September 30, 2014 compared to $81 million for the nine months ended September 30, 2013.
Capital expenditures decreased to $29 million for the nine months ended September 30, 2014 from $38 million in the nine months ended September 30, 2013 and included recurring capital needs and information technology projects. We estimate that capital expenditures for the full year 2014 ranged from approximately $35 million to $40 million, reflecting recurring needs and the continuation of investments in information systems and productivity enhancing technology. We expect to fulfill our ongoing vehicle fleet needs through vehicle capital leases. We have no additional material capital commitments at this time.
Cash payments for acquisitions for the nine months ended September 30, 2014 totaled $52 million, compared with $22 million for the nine months ended September 30, 2013. On February 28, 2014, we acquired HSA, based in Madison, Wisconsin, for cash consideration of $32 million. Consideration paid for tuck-in acquisitions consisted of cash payments and debt payable to sellers. We expect to continue our tuck-in acquisition program at levels consistent with prior periods.
Cash flows provided from notes receivable, financial investments and securities, net, for the nine months ended September 30, 2014 were $30 million and were primarily driven by the sale of marketable securities at American Home Shield. Cash flows used for notes receivable, financial investments and securities, net, for the nine months ended September 30, 2013 were $22 million and were primarily driven by increased investments in marketable securities at American Home Shield.
Net cash used for investing activities from continuing operations was $70 million for the year ended December 31, 2013 compared to $85 million for the year ended December 31, 2012 and $80 million for the year ended December 31, 2011.
Capital expenditures decreased to $39 million in 2013 from $44 million in 2012 and $52 million in 2011 and included recurring capital needs, including vehicle fleet purchases in 2011, and information technology projects, including technology costs at American Home Shield.
Cash payments for acquisitions in 2013 totaled $32 million, compared with $40 million in 2012 and $32 million in 2011. Consideration paid for tuck-in acquisitions consisted of cash payments and debt payable to sellers.
Financing Activities
Net cash used for financing activities from continuing operations was $274 million for the nine months ended September 30, 2014 compared to $60 million for the nine months ended September 30, 2013.
89
On July 1, 2014, we completed the initial public offering of 41,285,000 shares of our common stock at a price of $17.00 per share, and SvM terminated its existing credit agreements governing its Old Term Facilities and entered into the Term Loan Facility. The net proceeds and use of proceeds in connection with the offering and related refinancing, which are included in financing activities from continuing operations during the nine months ended September 30, 2014, are as follows:
(In millions)
|
|
|||
|---|---|---|---|---|
Net proceeds from initial public offering |
$ | 663 | ||
Borrowings under the Term Loan Facility |
1,825 | |||
Repayment of the Old Term Facilities |
(2,187 | ) | ||
Partial redemption of 8% 2020 Notes |
(210 | ) | ||
Partial redemption of 7% 2020 Notes |
(263 | ) | ||
Original issue discount paid in connection with Term Loan Facility |
(18 | ) | ||
Debt issuance costs paid in connection with Term Loan Facility |
(24 | ) | ||
Net cash used for financing activities in connection with the initial public offering |
$ | (214 | ) | |
| | | | | |
| | | | | |
| | | | | |
In addition to the aforementioned financing activities in connection with our initial public offering, during the nine months ended September 30, 2014, SvM made scheduled principal payments on long-term debt of $27 million and contributed $35 million to New TruGreen in connection with the TruGreen Spin-off. Additionally, we paid $5 million for the purchase of common stock and RSUs and received $8 million from the issuance of common stock during the nine months ended September 30, 2014.
During the nine months ended September 30, 2013, SvM made scheduled principal payments on long-term debt of $28 million and made payments on other long-term financing obligations of $4 million, paid $12 million in original issue discount, paid debt issuance costs of $6 million and borrowed an incremental $1 million. Additionally, we paid $14 million for the purchase of common stock and RSUs and received $4 million from the issuance of common stock during the nine months ended September 30, 2013.
Net cash used for financing activities from continuing operations was $78 million for the year ended December 31, 2013 compared to $14 million for the year ended December 31, 2012 and $110 million for the year ended December 31, 2011.
During 2013, SvM made scheduled principal payments on long-term debt of $49 million, including the payment of the amounts outstanding under its former accounts receivable securitization facility, and made payments on other long-term financing obligations of $4 million. During 2013, SvM borrowed an incremental $1 million, paid $12 million in original issue discount and paid debt issuance costs of $6 million as part of the 2013 Old Term Loan Facility Amendment. Additionally, during 2013, we paid $16 million for the repurchase of common stock and RSUs and received payments totaling $8 million from the issuance of common stock.
During 2012, SvM sold $1,350 million aggregate principal amount of the 2020 Notes and used a majority of the proceeds to redeem $996 million aggregate principal amount of the 2015 Notes and to repay $276 million of outstanding borrowings under the Old Term Facilities. During 2012, SvM made scheduled principal payments on long-term debt of $47 million, made payments on other long-term financing obligations of $7 million and paid debt issuance costs of $33 million related to the sale of the 2020 Notes. Additionally, during 2012, we paid $11 million for the repurchase of common stock and RSUs and received payments totaling $6 million from the issuance of common stock.
During 2011, SvM borrowed $4 million under other financing arrangements and made scheduled principal payments on long-term debt of $36 million. Additionally, during 2011, we paid $88 million for
90
the repurchase of common stock and RSUs and received payments totaling $10 million from the issuance of common stock.
Contractual Obligations
The following table presents our contractual obligations and commitments as of December 31, 2013. See "—Liquidity—Term Loan Facility" and "—Senior Notes" above for details on debt payments made during July 2014, which are not reflected in the table below.
(In millions)
|
Total | Less than 1 Yr |
1 - 3 Yrs | 3 - 5 Yrs | More than 5 Yrs |
|||||||||||
|---|---|---|---|---|---|---|---|---|---|---|---|---|---|---|---|---|
Principal repayments(1)* |
$ | 3,949 | $ | 33 | $ | 73 | $ | 2,216 | $ | 1,628 | ||||||
Capital leases(1) |
78 | 19 | 33 | 24 | 2 | |||||||||||
Estimated interest payments(2) |
1,351 | 225 | 443 | 259 | 425 | |||||||||||
Non-cancelable operating leases(3) |
125 | 39 | 52 | 27 | 7 | |||||||||||
Purchase obligations: |
||||||||||||||||
Supply agreements and other(4) |
72 | 38 | 24 | 10 | — | |||||||||||
Outsourcing agreements(5) |
58 | 15 | 21 | 22 | — | |||||||||||
Other long-term liabilities:* |
||||||||||||||||
Insurance claims |
223 | 80 | 51 | 19 | 72 | |||||||||||
Discontinued operations |
1 | 1 | — | — | — | |||||||||||
Other, including deferred compensation trust(2) |
15 | 1 | 2 | 2 | 10 | |||||||||||
| | | | | | | | | | | | | | | | | |
Total Amount |
$ | 5,872 | $ | 451 | $ | 699 | $ | 2,579 | $ | 2,144 | ||||||
| | | | | | | | | | | | | | | | | |
| | | | | | | | | | | | | | | | | |
| | | | | | | | | | | | | | | | | |
- *
- These
items are reported in our consolidated statements of financial position included in this prospectus.
- (1)
- As
discussed in "—Liquidity—Term Loan Facility" and "—Senior Notes" above, our long-term debt balance has changed since
December 31, 2013. As of September 30, 2014, future scheduled long-term debt payments, excluding capital leases, total $3,095 million, and estimated principal repayments for the
remainder of 2014 and for each fiscal year from 2015 through 2018 are $6 million, $40 million, $23 million, $22 million and $100 million, respectively. Additionally,
in connection with the TruGreen Spin-off, we transferred certain capital leases to New TruGreen, and as of September 30, 2014, future scheduled capital lease payments total $41 million,
and estimated capital lease payments for the remainder of 2014 and for each fiscal year from 2015 through 2018 are $2 million, $12 million, $12 million, $9 million and
$4 million, respectively.
- (2)
- These
amounts represent future interest payments related to our existing debt obligations based on fixed and variable interest rates and principal
maturities specified in the associated debt agreements. Payments related to variable debt are based on applicable rates at December 31, 2013 plus the specified margin in the associated debt
agreements for each period presented as of December 31, 2013. As of December 31, 2013, the estimated debt balance (including capital leases) as of each fiscal year end from 2014 through
2018 is $3,976 million, $3,913 million, $3,869 million, $1,721 million and $1,630 million, respectively, and the weighted average interest rate on the estimated debt
balances at each fiscal year end from 2014 through 2018 is expected to be 5.6%, 5.7%, 5.7%, 7.4% and 7.4%, respectively. See Note 12 of our audited consolidated financial statements included in
this prospectus for the terms and maturities of existing debt obligations.
- As discussed in "—Liquidity—Term Loan Facility" and "—Senior Notes" above, our long-term debt balance has changed since December 31, 2013. Additionally, we entered into interest rate swaps on July 23, 2014. As of September 30, 2014, estimated future interest payments total
91
$1,236 million, and estimated interest payments for the remainder of 2014 and for each fiscal year from 2015 through 2018 are $44 million, $174 million, $172 million, $170 million and $162 million, respectively. As of September 30, 2014, the estimated debt balance (including capital leases) as of each fiscal year end from 2014 through 2018 is $3,128 million, $3,076 million, $3,041 million, $3,010 million and $2,906 million, respectively, and the weighted average interest rate (including the impact of effective interest rate swaps) on the estimated debt balances at each fiscal year end from 2014 through 2018 is expected to be 5.5%, 5.6%, 5.6%, 5.6% and 5.6% respectively.
- (3)
- A
portion of our vehicle fleet and some equipment are leased through operating leases. For further discussion see "—Liquidity—Fleet
and Equipment Financing Arrangements." The amounts in non-cancelable operating leases exclude all prospective cancelable payments under these agreements. The liability for the estimated fair value of
the residual value guarantees related to the leased assets has been included in other long-term liabilities above.
- (4)
- These
obligations include commitments for various products and services including, among other things, inventory purchases, telecommunications services,
marketing and advertising services and other professional services. Arrangements are considered purchase obligations if a contract specifies all significant terms, including fixed or minimum
quantities to be purchased, a pricing structure and approximate timing of the transactions. Most arrangements are cancelable without a significant penalty and with short notice (usually
30-120 days) and amounts reflected above include our minimum contractual obligation (inclusive of applicable cancellation penalties). For obligations with significant penalties associated with
termination, the minimum required expenditures over the term of the agreement have been included in the table above.
- (5)
- Outsourcing agreements include commitments for the purchase of certain outsourced services from third-party vendors. Because the services provided through these agreements are integral to our operations, we have concluded that it is appropriate to include the total anticipated costs for services under these agreements in the table above.
Due to the uncertainty with respect to the timing of future cash flows associated with unrecognized tax benefits at December 31, 2013, we are unable to reasonably estimate the period of cash settlement with the respective taxing authority. Accordingly, $8 million of unrecognized tax benefits have been excluded from the contractual obligations table above. See the discussion of income taxes in Note 5 of our audited consolidated financial statements included in this prospectus.
The contractual obligations table includes disclosure of our contractual obligations and commitments as of December 31, 2013. We continue to make the contractually required payments, and, therefore, the 2014 obligations and commitments as listed in the contractual obligations table have been reduced by the required payments. Additionally, the TruGreen Spin-off has reduced our contractual obligations and commitments as reported as of December 31, 2013. While contractual obligations relating to principal repayments, estimated interest payments, non-cancelable operating leases and other long-term liabilities of the TruGreen Business are separately identifiable and were transferred to New TruGreen pursuant to the separation and distribution agreement, purchase obligations generally relate to company-wide spending and commitments of multiple business segments and, therefore, the obligations which were transferred to New TruGreen are more difficult to separately identify and are included in costs under the transition services agreement. We are in the process of negotiating the transfers of these contractual obligations to New TruGreen. The changes to our Term Loan Facility and Senior Notes discussed above, the related interest rate swaps and the impact of the TruGreen Spin-off were the only material changes in our previously disclosed contractual obligations and commitments during the nine months ended September 30, 2014.
92
Financial Position—Continuing Operations
The following discussion describes changes in our financial position from December 31, 2012 to December 31, 2013.
Property and equipment increased from prior year levels, primarily reflecting purchases for recurring capital needs and information technology projects and the acquisition of vehicles under the Fleet Agreement.
Intangible assets, primarily trade names, service marks and trademarks, net, decreased from prior year levels due to amortization expense. See Note 4 to our audited consolidated financial statements included in this prospectus for further information.
Other assets increased from prior year levels, primarily reflecting the inclusion, in 2013, of the non-current portion of insurance recoverables related to insured claims, which has historically been netted with loss reserves within Other long-term obligations, primarily self-insured claims.
Deferred revenue increased from prior year levels, primarily reflecting higher customer prepayments at Terminix and American Home Shield.
Other long-term obligations, primarily self-insured claims, increased from prior year levels, primarily reflecting the exclusion, in 2013, of the non-current portion of insurance recoverables related to insured claims, which is now reported within Other assets.
Total shareholders' equity was $23 million as of December 31, 2013 compared to $535 million as of December 31, 2012.
Financial Position—Discontinued Operations
The assets and liabilities related to discontinued operations have been classified in a separate caption on our consolidated statements of financial position included in this prospectus.
Off-Balance Sheet Arrangements
We have off-balance sheet arrangements in the form of guarantees as discussed in Note 9 of our audited consolidated financial statements and Note 4 of our unaudited condensed consolidated financial statements included in this prospectus.
We do not have any relationships with unconsolidated entities or financial partnerships, such as entities often referred to as structured finance or special purpose entities, established for the purpose of facilitating off- balance sheet arrangements or other contractually narrow or limited purposes. Accordingly, we are not materially exposed to any financing, liquidity, market or credit risk that could arise if we had engaged in such relationships.
Critical Accounting Policies and Estimates
The preparation of our audited consolidated financial statements and our unaudited condensed consolidated financial statements requires management to make certain estimates and assumptions required under GAAP which may differ from actual results. The more significant areas requiring the use of management estimates relate to revenue recognition; the allowance for uncollectible receivables; accruals for self-insured retention limits related to medical, workers' compensation, auto and general liability insurance claims; accruals for home warranties and termite damage claims; the possible outcome of outstanding litigation; accruals for income tax liabilities as well as deferred tax accounts; the deferral and amortization of customer acquisition costs; share-based compensation; useful lives for depreciation and amortization expense; the valuation of marketable securities; and the valuation of tangible and intangible assets. In 2013 and the nine months ended September 30, 2014, there were no
93
changes in the significant areas that require estimates or in the underlying methodologies used in determining the amounts of these associated estimates.
See Note 1 of our audited consolidated financial statements and Note 1 of our unaudited condensed consolidated financial statements included in this prospectus for a summary of significant accounting policies.
The allowance for receivables is developed based on several factors including overall customer credit quality, historical write-off experience and specific account analyses that project the ultimate collectability of the outstanding balances. As such, these factors may change over time causing the reserve level to vary.
We carry insurance policies on insurable risks at levels which we believe to be appropriate, including workers' compensation, auto and general liability risks. We purchase insurance from third-party insurance carriers. These policies typically incorporate significant deductibles or self-insured retentions. We are responsible for all claims that fall within the retention limits. In determining our accrual for self-insured claims, we uses historical claims experience to establish both the current year accrual and the underlying provision for future losses. This actuarially determined provision and related accrual include both known claims, as well as incurred but not reported claims. We adjust our estimate of accrued self-insured claims when required to reflect changes based on factors such as changes in health care costs, accident frequency and claim severity.
We seek to reduce the potential amount of loss arising from self-insured claims by insuring certain levels of risk. While insurance agreements are designed to limit our losses from large exposure and permit recovery of a portion of direct unpaid losses, insurance does not relieve us of our ultimate liability. Accordingly, the accruals for insured claims represent our total unpaid gross losses. Insurance recoverables, which are reported within Prepaid expenses and other assets and Other assets, relate to estimated insurance recoveries on the insured claims reserves.
Accruals for home warranty claims in the American Home Shield business are made based on our claims experience and actuarial projections. Termite damage claim accruals in the Terminix business are recorded based on both the historical rates of claims incurred within a contract year and the cost per claim. Current activity could differ causing a change in estimates. We have certain liabilities with respect to existing or potential claims, lawsuits, and other proceedings. We accrue for these liabilities when it is probable that future costs will be incurred and such costs can be reasonably estimated. Any resulting adjustments, which could be material, are recorded in the period identified.
We record deferred income tax balances based on the net tax effects of temporary differences between the carrying value of assets and liabilities for financial reporting purposes and income tax purposes. We record our deferred tax items based on the estimated value of the tax basis. We adjust tax estimates when required to reflect changes based on factors such as changes in tax laws, relevant court decisions, results of tax authority reviews and statutes of limitations. We record a liability for unrecognized tax benefits resulting from uncertain tax positions taken or expected to be taken in a tax return. We recognize potential interest and penalties related to our uncertain tax positions in income tax expense.
Revenue
Revenues from pest control services, as well as liquid and fumigation termite applications, are recognized as the services are provided. We eradicate termites through the use of non-baiting methods (e.g., fumigation or liquid treatments) and baiting systems. Termite services using baiting systems and termite inspection and protection contracts are frequently sold through annual contracts. Service costs for these contracts are expensed as incurred. We recognize revenue over the life of these contracts in proportion to the expected direct costs. Those costs bear a direct relationship to the fulfillment of our
94
obligations under the contracts and are representative of the relative value provided to the customer (proportional performance method). We regularly review our estimates of direct costs for our termite bait contracts and termite inspection and protection contracts and adjust the estimates when appropriate.
Home warranty contracts are typically one year in duration. Home warranty claims costs are expensed as incurred. We recognize revenue over the life of these contracts in proportion to the expected direct costs. Those costs bear a direct relationship to the fulfillment of our obligations under the contracts and are representative of the relative value provided to the customer (proportional performance method). We regularly review our estimates of claims costs and adjust the estimates when appropriate.
We have franchise agreements in our Terminix, ServiceMaster Restore, ServiceMaster Clean, Merry Maids, Furniture Medic and AmeriSpec businesses. Franchise revenue (which in the aggregate represents approximately six percent of annual consolidated revenue from continuing operations) consists principally of continuing monthly fees based upon the franchisee's customer-level revenue. Monthly fee revenue is recognized when the related customer-level revenue generating activity is performed by the franchisee and collectability is reasonably assured. Franchise revenue also includes initial fees resulting from the sale of a franchise or a license. These initial franchise or license fees are pre-established fixed amounts and are recognized as revenue when collectability is reasonably assured and all material services or conditions relating to the sale have been substantially performed.
Deferred Customer Acquisition Costs
Customer acquisition costs, which are incremental and direct costs of obtaining a customer, are deferred and amortized over the life of the related contract in proportion to revenue recognized. These costs include sales commissions and direct selling costs which can be shown to have resulted in a successful sale.
Property and Equipment, Intangible Assets and Goodwill
Fixed assets and intangible assets with finite lives are depreciated and amortized on a straight-line basis over their estimated useful lives. These lives are based on our previous experience for similar assets, potential market obsolescence and other industry and business data. As required by accounting standards for the impairment or disposal of long-lived assets, our long-lived assets, including fixed assets and intangible assets (other than goodwill), are tested for recoverability whenever events or changes in circumstances indicate that their carrying amounts may not be recoverable. If the carrying value is no longer recoverable based upon the undiscounted future cash flows of the asset, an impairment loss would be recognized equal to the difference between the carrying amount and the fair value of the asset. Changes in the estimated useful lives or in the asset values could cause us to adjust our book value or future expense accordingly.
In February 2014, American Home Shield ceased efforts to deploy a new operating system that had been intended to improve customer relationship management capabilities and enhance its operations. We recorded an impairment charge of $47 million in the nine months ended September 30, 2014 relating to this decision.
As required under accounting standards for goodwill and other intangibles, goodwill is not subject to amortization, and intangible assets with indefinite useful lives are not amortized until their useful lives are determined to no longer be indefinite. Goodwill and intangible assets that are not subject to amortization are subject to assessment for impairment by applying a fair- value based test on an annual basis or more frequently if circumstances indicate a potential impairment. We adopted the provisions of ASU 2011 08, "Testing Goodwill for Impairment," in the fourth quarter of 2011. This Accounting Standards Update, or "ASU," gives entities the option of performing a qualitative assessment before
95
calculating the fair value of a reporting unit in Step 1 of the goodwill impairment test. If entities determine, on the basis of qualitative factors, that the fair value of a reporting unit is more likely than not greater than its carrying amount, the two-step impairment test would not be required. For the 2013 and 2012 annual goodwill impairment review performed as of October 1, 2013 and October 1, 2012, respectively, we did not perform qualitative assessments on any reporting unit, but instead completed Step 1 of the goodwill impairment test for all reporting units. For the 2011 annual goodwill impairment review performed as of October 1, 2011, we performed qualitative assessments on the Terminix, American Home Shield and ServiceMaster Clean reporting units. Based on these assessments, we determined that, more likely than not, the fair values of Terminix, American Home Shield and ServiceMaster Clean were greater than their respective carrying amounts. As a result, the two-step goodwill impairment test was not performed for Terminix, American Home Shield and ServiceMaster Clean in 2011.
Goodwill impairment is determined using a two-step process. The first step involves a comparison of the estimated fair value of a reporting unit to its carrying amount, including goodwill. In performing the first step, we determine the fair value of a reporting unit using a combination of a discounted cash flow, or "DCF," analysis, a market-based comparable approach and a market-based transaction approach. Determining fair value requires the exercise of significant judgment, including judgment about appropriate discount rates, terminal growth rates, the amount and timing of expected future cash flows, as well as relevant comparable company earnings multiples for the market-based comparable approach and relevant transaction multiples for the market-based transaction approach. The cash flows employed in the DCF analyses are based on our most recent budget and, for years beyond the budget, our estimates, which are based on estimated growth rates. The discount rates used in the DCF analyses are intended to reflect the risks inherent in the future cash flows of the respective reporting units. In addition, the market-based comparable and transaction approaches utilize comparable company public trading values, comparable company historical results, research analyst estimates and, where available, values observed in private market transactions. If the estimated fair value of a reporting unit exceeds its carrying amount, goodwill of the reporting unit is not impaired and the second step of the impairment test is not necessary. If the carrying amount of a reporting unit exceeds its estimated fair value, then the second step of the goodwill impairment test must be performed. The second step of the goodwill impairment test compares the implied fair value of the reporting unit's goodwill with its goodwill carrying amount to measure the amount of impairment, if any. The implied fair value of goodwill is determined in the same manner as the amount of goodwill recognized in a business combination. In other words, the estimated fair value of the reporting unit is allocated to all of the assets and liabilities of that unit (including any unrecognized intangible assets) as if the reporting unit had been acquired in a business combination and the fair value of the reporting unit was the purchase price paid. If the carrying amount of the reporting unit's goodwill exceeds the implied fair value of that goodwill, an impairment is recognized in an amount equal to that excess.
The impairment test for other intangible assets not subject to amortization involves a comparison of the estimated fair value of the intangible asset with its carrying value. If the carrying value of the intangible asset exceeds its fair value, an impairment loss is recognized in an amount equal to that excess. The estimates of fair value of intangible assets not subject to amortization are determined using a DCF valuation analysis. The DCF methodology used to value trade names is known as the relief from royalty method and entails identifying the hypothetical cash flows generated by an assumed royalty rate that a third- party would pay to license the trade names and discounting them back to the valuation date. Significant judgments inherent in this analysis include the selection of appropriate discount rates and hypothetical royalty rates, estimating the amount and timing of estimated future cash flows attributable to the hypothetical royalty rates and identification of appropriate terminal growth rate assumptions. The discount rates used in the DCF analyses are intended to reflect the risk inherent in the projected future cash flows generated by the respective intangible assets.
96
Goodwill and indefinite-lived intangible assets, primarily our trade names, are assessed annually for impairment during the fourth quarter or earlier upon the occurrence of certain events or substantive changes in circumstances. Our 2013, 2012, and 2011 annual impairment analyses, which were performed as of October 1 of each year, did not result in any goodwill impairments.
Financial Instruments
We do not hold or issue derivative financial instruments for trading or speculative purposes. We have entered into specific financial arrangements in the normal course of business to manage certain market risks, with a policy of matching positions and limiting the terms of contracts to relatively short durations.
We have historically hedged a significant portion of our annual fuel consumption of approximately 11 million gallons. We have also historically hedged the interest payments on a portion of our variable rate debt through the use of interest rate swaps. All of our fuel swap contracts and interest rate swap contracts are classified as cash flow hedges, and, as such, the hedging instruments are recorded on our consolidated statements of financial position included in this prospectus as either an asset or liability at fair value, with the effective portion of changes in the fair value attributable to the hedged risks recorded in accumulated other comprehensive income (loss).
Stock-Based Compensation
In connection with our initial public offering, our board of directors and stockholders have adopted the ServiceMaster Global Holdings, Inc. 2014 Omnibus Incentive Plan, or the "Omnibus Incentive Plan." Prior to our initial public offering, our board of directors and stockholders had adopted the Amended and Restated ServiceMaster Global Holdings, Inc. Stock Incentive Plan, or the "MSIP." Upon adoption of the Omnibus Incentive Plan, we froze the MSIP and will make no further grants thereunder. However, awards previously granted under the MSIP are unaffected by the termination of the MSIP. The Omnibus Incentive Plan provides for awards in the form of stock options, stock purchase rights, restricted stock, RSUs, performance shares, performance units, stock appreciation rights, dividend equivalents, deferred share units, or "DSUs," and other stock-based awards. The MSIP provided for the sale of shares and DSUs of our stock to our executives, officers and other employees and to our directors as well as the grant of RSUs, performance-based RSUs and options to purchase our shares to those individuals. DSUs represent a right to receive a share of common stock in the future. Our Compensation Committee selects our executives officers and employees and directors eligible to participate in the MSIP and the Omnibus Incentive Plan and determines the specific number of shares to be offered or options to be granted to an individual. A maximum of 13,958,226 shares of our stock is authorized for issuance under the MSIP and the Omnibus Incentive Plan, of which, as of January 20, 2015, 7,971,137 remain available for future grants. We currently intend to satisfy any need for our shares of common stock associated with the settlement of DSUs, vesting of RSUs or exercise of options issued under the Omnibus Incentive Plan or the MSIP through new shares available for issuance or any shares repurchased, forfeited or surrendered from participants in the MSIP and the Omnibus Incentive Plan.
All option grants under the Omnibus Incentive Plan and the MSIP have been, and we expect that all future option grants will be, non-qualified options with a per-share exercise price no less than the fair market value of one share of our stock on the grant date. Any stock options granted will generally have a term of ten years and vesting will be subject to an employee's continued employment. Our Compensation Committee may accelerate the vesting of an option at any time. In addition, vesting of options will be accelerated if we experience a change in control (as defined in the Omnibus Incentive Plan and the MSIP) unless options with substantially equivalent terms and economic value are substituted for existing options in place of accelerated vesting. Vesting of options granted under the Omnibus Incentive Plan and the MSIP will also be accelerated in the event of an employee's death or
97
disability (as defined in the Omnibus Incentive Plan and the MSIP). Upon termination for cause (as defined in the Omnibus Incentive Plan and the MSIP), all options held by an employee are immediately cancelled. Following a termination without cause, vested options will generally remain exercisable through the earlier of the expiration of their term or three months following termination of employment (one year in the case of death, disability or retirement at normal retirement age). Unless sooner terminated by our board of directors, the Omnibus Incentive Plan will remain in effect until June 26, 2024.
Our stock-based compensation expense is estimated at the grant date based on an award's fair value as calculated by the Black-Scholes option-pricing model and is recognized as expense over the requisite service period. The Black-Scholes model requires various highly judgmental assumptions including expected volatility and option life. If any of the assumptions used in the Black-Scholes model change significantly, stock-based compensation expense may differ materially in the future from that recorded in the current period. In addition, we estimate the expected forfeiture rate and only recognize expense for those shares expected to vest. We estimate the forfeiture rate based on historical experience. To the extent our actual forfeiture rate is different from our estimate, stock-based compensation expense is adjusted accordingly. See Note 17 to our audited consolidated financial statements and Note 6 to our unaudited condensed consolidated financial statements included in this prospectus.
Our board of directors and management intended all options granted to be exercisable, at a price per share not less than the per share fair value of our common stock on the date of grant. We grant options to participants with an exercise price equal to the then current fair value of the common stock.
Quantitative and Qualitative Disclosures about Market Risk
The economy and its impact on discretionary consumer spending, labor wages, fuel prices and other material costs, home resales, unemployment rates, insurance costs and medical costs could have a material adverse impact on future results of operations.
We do not hold or issue derivative financial instruments for trading or speculative purposes. We have entered into specific financial arrangements, primarily fuel swap agreements and interest rate swap agreements, in the normal course of business to manage certain market risks, with a policy of matching positions and limiting the terms of contracts to relatively short durations. The effect of derivative financial instrument transactions could have a material impact on our financial statements.
Interest Rate Risk
We are exposed to the impact of interest rate changes and from time to time seek to mitigate this exposure through the use of interest rate swaps relating to our variable-rate indebtedness.
On July 23, 2014, SvM entered into two four-year interest rate swap agreements effective August 1, 2014. The aggregate notional amount of the agreements was $300 million. Under the terms of the agreements, SvM will pay a weighted-average fixed rate of interest of 1.786 percent on the $300 million notional amount, and SvM will receive a floating rate of interest (based on one-month LIBOR) on the notional amount. Therefore, during the term of the agreements, the effective interest rate on $300 million of the Term Loan Facility is fixed at a rate of 1.786 percent, plus the incremental borrowing margin of 3.25 percent.
On July 23, 2014, SvM entered into three forty-one month interest rate swap agreements effective March 1, 2015. The aggregate notional amount of the agreements was $400 million. Under the terms of the agreements, SvM will pay a weighted-average fixed rate of interest of 1.927 percent on the $400 million notional amount, and SvM will receive a floating rate of interest (based on one-month LIBOR) on the notional amount. Therefore, during the term of the agreements, the effective interest
98
rate on $400 million of the Term Loan Facility is fixed at a rate of 1.927 percent, plus the incremental borrowing margin of 3.25 percent.
We believe our exposure to interest rate fluctuations, when viewed on both a gross and net basis, is material to our overall results of operations. A significant portion of our outstanding debt, including debt under the Credit Facilities, bears interest at variable rates. As a result, increases in interest rates would increase the cost of servicing our debt and could materially reduce our profitability and cash flows. As of September 30, 2014, each one percentage point change in interest rates would result in an approximate $15 million change in the annual interest expense on our Term Facilities after considering the impact of the effective interest rate swaps. Assuming all revolving loans were fully drawn as of September 30, 2014, each one percentage point change in interest rates would result in an approximate $3 million change in annual interest expense on our Revolving Credit Facility. Our exposure to interest rate fluctuations has not changed significantly since December 31, 2013. The impact of increases in interest rates could be more significant for us than it would be for some other companies because of our substantial debt and floating rate leases.
The following table summarizes information about our debt as of September 30, 2014 (after considering the impact of the effective interest rate swaps), including the principal cash payments and related weighted-average interest rates by expected maturity dates based on applicable rates at September 30, 2014.
| |
Expected Year of Maturity | |
|||||||||||||||||||||||
|---|---|---|---|---|---|---|---|---|---|---|---|---|---|---|---|---|---|---|---|---|---|---|---|---|---|
| |
Fair Value |
||||||||||||||||||||||||
As of September 30, 2014 ($ in millions) |
2014 | 2015 | 2016 | 2017 | 2018 | Thereafter | Total | ||||||||||||||||||
Debt: |
|||||||||||||||||||||||||
Fixed rate |
$ | 2 | $ | 10 | $ | 7 | $ | 4 | $ | 81 | $ | 1,456 | $ | 1,560 | $ | 1,604 | |||||||||
Average interest rate |
8.0 | % | 8.0 | % | 6.4 | % | 6.7 | % | 7.1 | % | 6.9 | % | 7.0 | % | |||||||||||
Variable rate |
$ | 6 | $ | 42 | $ | 28 | $ | 27 | $ | 23 | $ | 1,450 | $ | 1,576 | $ | 1,566 | |||||||||
Average interest rate |
3.8 | % | 3.2 | % | 3.6 | % | 3.7 | % | 3.9 | % | 4.2 | % | 4.2 | % | |||||||||||
Interest Rate Swaps: |
|||||||||||||||||||||||||
Receive variable/pay fixed |
$ | 300 | |||||||||||||||||||||||
Average pay rate(1) |
1.8 | % | |||||||||||||||||||||||
Average receive rate(1) |
1.0 | % | |||||||||||||||||||||||
- (1)
- Before the application of the applicable borrowing margin.
Fuel Price Risk
We are exposed to market risk for changes in fuel prices through the consumption of fuel by our vehicle fleet in the delivery of services to our customers. We estimate to have used approximately 11 million gallons of fuel in 2014. As of September 30, 2014, a ten percent change in fuel prices would result in a change of approximately $4 million in our annual fuel cost before considering the impact of fuel swap contracts. Our exposure to changes in fuel prices has not significantly changed our per gallon fuel costs since December 31, 2013.
We use fuel swap contracts to mitigate the financial impact of fluctuations in fuel prices. As of September 30, 2014, we had fuel swap contracts to pay fixed prices for fuel with an aggregate notional amount of $22 million, maturing through 2015. The estimated fair value of these contracts as of September 30, 2014 was a net liability of $1 million. These fuel swap contracts provide a fixed price for approximately 66 and 38 percent of our estimated fuel usage for the remainder of 2014 and 2015, respectively.
99
Overview
ServiceMaster is a leading provider of essential residential and commercial services, operating through an extensive service network of more than 7,000 company-owned, franchised and licensed locations. Our mission is to simplify and improve the quality of our customers' lives by delivering services that help them protect and maintain their homes or businesses, typically their most highly valued assets. We have leading market positions across the majority of the markets we serve, as measured by customer-level revenue. Our portfolio of well-recognized brands includes Terminix (termite and pest control), American Home Shield (home warranties), ServiceMaster Restore (disaster restoration), ServiceMaster Clean (janitorial), Merry Maids (residential cleaning), Furniture Medic (furniture repair) and AmeriSpec (home inspections). We serve approximately five million residential and commercial customers through an employee base of approximately 13,000 company associates and a franchise network that independently employs an estimated 33,000 additional people.
We believe that our customers understand the financial and reputational risks associated with inadequate maintenance of their homes or businesses and that our high-quality, professional services are low-cost expenditures when compared to the alternative of failing to perform essential maintenance. We strive to be the service provider of choice and believe our customers have recognized our value proposition, as evidenced by our long-standing customer relationships and the high rate at which our customers renew their contracts from year to year. As of December 31, 2013 and September 30, 2014, our Terminix termite customer retention rate was 85% and 85%, respectively, and our Terminix pest control customer retention rate was 79% and 80%, respectively, in our American Home Shield segment customer retention rate was 74% and 75%, respectively.
We have significant size and scale, which we believe give us a number of competitive advantages. Terminix is the largest termite and pest control business in the United States, as measured by customer-level revenue, and serves approximately 2.8 million customers across 47 states and the District of Columbia through approximately 285 company-owned and 100 franchised locations. Additionally, we estimate American Home Shield to be approximately four to five times larger than its nearest competitors, as measured by revenue. American Home Shield serves approximately 1.5 million residential customers across all 50 states and the District of Columbia through a network of approximately 11,000 pre-screened independent home service contractor firms. Our Franchise Services Group serves both residential and commercial customers across all 50 states and the District of Columbia through approximately 4,000 franchised and 70 company-owned locations. We believe our significant size and scale provide a competitive advantage in our purchasing power, route density, and marketing and operating efficiencies compared to smaller local and regional competitors. Our scale also facilitates the standardization of processes, shared learning and talent development, across our entire organization.
We believe our businesses are strategically positioned to benefit from a number of favorable demographic and secular trends. These trends include growth in population, household formation and new and existing home sales. In addition, we believe there is increasing demand for outsourced services, fueled by a trend toward "do-it-for-me" as a result of an aging population and shifts in household structure and behaviors, such as dual-income families and consumers with "on-the-go" lifestyles.
100
Our Market Opportunity
Termite and Pest Control Industry
The outsourced market for residential and commercial termite and pest control services in the United States was approximately $7 billion in 2013, according to Specialty Products Consultants, LLC. We estimate that there are approximately 20,000 U.S. termite and pest control companies, nearly all of which have fewer than 100 employees.
Termites are responsible for an estimated $5 billion in home damage in the United States annually, according to the National Pest Management Association's 2012 survey. The termite control industry provides treatment and inspection services to residential and commercial property owners for the remediation and prevention of termite infestations. We believe homeowners value quality and reliability over price in choosing professional termite control services, as the cost of most professional treatments is well below the potential cost of inaction or ineffective treatment. As a result, we believe the demand for termite remediation services is relatively insulated from changes in consumer spending. In addition to remediation services, the termite control industry offers periodic termite inspections and preventative treatments to residential and commercial property owners in areas with high termite activity, typically through annual contracts. These annual contracts may carry guarantees that protect the property owner against the cost of structural damage caused by a termite infestation. Termites can cause significant damage to a structure before becoming visible to the untrained eye, highlighting the value proposition of professional preventative termite services. As a result, the termite control industry experiences high renewal rates on annual preventative inspection and treatment contracts, and revenues from such contracts are generally stable and recurring.
Pest infestations may damage a home or business while also carrying the risk of the spread of diseases. Moreover, for many commercial facilities, pest control is essential to regular operations and regulatory compliance (e.g., hotels, restaurants and healthcare facilities). As a result of these dynamics, the pest control industry experiences high rates of renewal for its pest inspection and treatment contracts. Pest control services are often delivered on a contracted basis through regularly scheduled service visits, which include an inspection of premises and application of pest control materials. According to the National Pest Management Association's 2014 survey, approximately 35% of U.S. households currently use a professional pest exterminator.
Both termite and pest activity are affected by weather. Termite activity peaks during the springtime "swarm," the timing and intensity of which varies based on weather. Similarly, pest activity tends to accelerate in the spring months when warmer temperatures arrive in many U.S. regions. However, the high proportion of termite and pest control services which are contracted and recurring, as well as the high renewal rates for those services, limit the effect of weather anomalies on the termite and pest control industry in any given year.
Home Warranty Industry
We estimate that the U.S. home warranty market had total revenue of approximately $2 billion in 2014. The home warranty market is characterized by low household penetration, which we estimate to be approximately 3-4%. The home warranty industry offers plans that protect a homeowner against costly repairs or replacement of household systems and appliances. Typically having a one-year term, coverage varies based on a menu of plan options. The most commonly covered items include electrical, plumbing, central heating and air conditioning (HVAC) systems, water heaters, refrigerators, dishwashers and ovens/cook tops. The home warranty industry is characterized by a high level of customer interaction and service requirements. This combination of a high-touch/high-service business model and the peace of mind it delivers to the customer has led to high renewal rates in the home warranty industry.
101
As consumer demand shifts towards more outsourced services, we believe that there is an opportunity for American Home Shield, a reliably scaled service provider with a national, pre-screened contractor network, to increase market share and household penetration. Additionally, we believe that increasingly complex household systems and appliances may further highlight the value proposition of professional repair services and, accordingly, the coverage offered by a home warranty.
One of the drivers of sales of new home warranties is the number of existing homes sold in the United States, since a home warranty is often recommended by a real estate sales professional or offered by the seller of a home in conjunction with a real estate resale transaction. According to the National Association of Realtors, existing home resales, as measured in units, increased by approximately 9% in 2013. Approximately 19% of the revenue of American Home Shield for the year ended December 31, 2013 was tied directly to existing home resale transactions.
Key Franchise Services Group Industries
Disaster Restoration (ServiceMaster Restore). We estimate that the U.S. disaster restoration market is approximately $39 billion, approximately two-thirds of which is related to residential customers and the remainder related to commercial customers. Most emergency response work results from emergency situations for residential and commercial customers, such as fires and flooding. Extreme weather events and natural disasters also provide demand for emergency response work. Critical factors in the selection of an emergency response firm are the firm's reputation, relationships with insurers, available resources, proper insurance and credentials, quality of service, timeliness and responsiveness. This market is highly fragmented, with two large players, including ServiceMaster Restore, and we believe there are opportunities for growth for scaled service providers.
Janitorial (ServiceMaster Clean). We estimate that the U.S. janitorial services market was approximately $50 billion in 2013. The market is highly fragmented with more than 800,000 companies competing in the janitorial space, a significant majority of which have five or fewer employees.
Residential Cleaning (Merry Maids). We estimate that the U.S. residential professional cleaning services market was approximately $3.7 billion in 2013. Competition in this market comes mainly from local, independently owned firms, and from a few national companies.
Our Competitive Strengths
#1 Market Positions in Large, Fragmented and Growing Markets. We are the leading provider of essential residential and commercial services in the majority of markets in which we operate. Our markets are generally large, growing and highly fragmented, and we believe we have significant advantages over smaller local and regional competitors. We have spent decades developing a reputation built on reliability and superior quality and service. As a result, we enjoy high unaided brand awareness and a reputation for high-quality customer service, which serve as key drivers of our customer acquisition efforts. Our nationwide presence also allows our brands to effectively serve both local residential customers and large national commercial accounts and to capitalize on lead generation sources that include large real estate agencies, financial institutions and insurance carriers. We believe our significant size and scale also provide a competitive advantage in our purchasing power, route density, and marketing and operating efficiencies compared to smaller local and regional competitors. Our scale also facilitates the standardization of processes, shared learning and talent development across our entire organization.
Diverse Revenue Streams Across Customers and Geographies. ServiceMaster is diversified in terms of customers and geographies, and our businesses served approximately five million customers in the past 12 months. We operate in all 50 states and the District of Columbia. Our Terminix business, which accounted for 57% of our revenue in 2013 served approximately 2.8 million customers across a branch
102
network of approximately 285 company-owned and 100 franchised locations. American Home Shield, which accounted for 32% of our revenue in 2013 responded to nearly three million service requests from approximately 1.4 million customers. Our diverse customer base and geographies help to mitigate the effect of adverse market conditions and other risks in any particular geography or customer segment we serve. We therefore believe that the size and scale of our company provide us with added protection from risk relative to our smaller local and regional competitors.
High-Value Service Offerings Resulting in High Retention and Recurring Revenues. We believe our high annual customer retention demonstrates the highly valued nature of the services we offer and the high level of execution and customer service that we provide. As of December 31, 2013 and September 30, 2014, our Terminix termite customer retention rates was 85% and 85%, respectively, our Terminix pest control customer retention rate was 79% and 80%, respectively, and in our American Home Shield segment, our retention rate was 74% and 75%, respectively. Many of our technicians have built long-standing, personal relationships with their customers. We believe these personal bonds, often forged over decades, help to drive customer loyalty and retention. As a result of our strong retention rates and long-standing customer relationships, we enjoy significant visibility and stability in our business, and these factors limit the effect of adverse economic cycles on our revenue base. We experienced these advantages during the most recent downturn, when we were able to grow revenue in each year from 2008 to 2013.
Multi-Channel Marketing Approach Supported by Sophisticated Customer Analytic Modeling Capabilities. Our multi-channel marketing approach focuses on building the value of our brands and generating revenue by understanding the decisions customers make at each stage in the purchase of residential and commercial services. The effectiveness of our marketing efforts is demonstrated by an increase in lead generation and online sales, as well as an improvement in close rates over the last few years. For example, in our direct-to-consumer channel at American Home Shield, new home warranty lead generation, marketing yield and close rates have benefited from increased spending on marketing as well as improved digital marketing. We have also been deploying increasingly sophisticated customer analytics models that allow us to more effectively segment our prospective customers and tailor campaigns towards them. In addition, we are seeing success with newer ways of reaching and marketing to consumers via content marketing, promotions and social media channels.
Operational and Customer Service Excellence Driven by Superior People Development. We are constantly focused on improving customer service. The customer experience is at the foundation of our business model, and we believe that each employee is an extension of ServiceMaster's reputation. We employ rigorous hiring and training practices and continuously analyze our operating metrics to identify potential improvements in service and productivity. Technicians in our Terminix branches exhibit low levels of turnover, with an average tenure of seven years, creating continuity in customer relationships and ensuring the development of best practices based on on-the-ground experience. We also provide our field personnel with access to sophisticated data management and mobility tools which enable them to drive efficiencies, improve customer service and ultimately grow our customer base and profitability.
- •
- Solid revenue and Adjusted EBITDA growth through business
cycles. Our consolidated revenue and Adjusted EBITDA compound annual growth rates from 2009 through 2013 were 4% and 6%, respectively.
We believe that our strong performance through the recent economic and housing downturns is attributable to the essential nature of our services, our strong value proposition and our management's
focus on driving results.
- •
- Solid margins with attractive operating leverage and productivity improvement initiatives. Our business model enjoys inherent operating leverage stemming from route density and fixed investments in infrastructure and technology, among other factors. We have demonstrated our
Resilient Financial Model with Track Record of Consistent Performance.
103
ability to expand our margins through a variety of initiatives, including metric-driven continuous improvement in our customer call centers, application of consistent process guidelines at the branch level, leveraging size and scale to improve the sourcing of labor and materials, and driving productivity in centralized services. We have also deployed mobility solutions and routing and scheduling systems across many of our businesses in order to enhance overall efficiency and reduce operating costs.
Capital-Light Business Model. Our business model is characterized by strong Adjusted EBITDA margins, negative working capital and limited capital expenditure requirements. For the nine months ended September 30, 2014 and in 2013, 2012 and 2011, our net cash provided from operating activities from continuing operations was $132 million, $208 million, $104 million and $74 million, respectively, and our property additions were $29 million, $39 million, $44 million and $52 million, respectively. Pre-Tax Unlevered Free Cash Flow was $386 million, $428 million, $364 million and $292 million for the nine months ended September 30, 2014 and in 2013, 2012 and 2011, respectively. We intend to utilize a meaningful portion of our future cash flow to repay debt. For a reconciliation of Pre-Tax Unlevered Free Cash Flow to net cash provided from operating activities from continuing operations, which we consider to be the most directly comparable GAAP financial measure, see "Selected Historical Financial Data."
Experienced Management Team. We have assembled a management team of highly experienced leaders with significant industry expertise. Our senior leaders have track records of producing profitable growth in a wide variety of industries and economic conditions. We also believe that we have a deep bench of talent across each of our business units, including long-tenured individuals with significant expertise and knowledge of the businesses they operate. Our management team is highly focused on execution and driving growth and profitability across our company. Our compensation structure, including incentive compensation, is tied to key performance metrics and is designed to incentivize senior management to seek the long-term success of our business.
Our Strategy
Grow Our Customer Base. We are focused on the growth of our businesses through the introduction and delivery of high-value services to new and existing customers. We drive growth in recurring and new sales via three primary channels:
- •
- Direct-to-consumer through our company-owned branches;
- •
- Indirectly through partnerships with high-quality contractors in our home warranty business; and
- •
- Through trusted service providers who are franchisees.
To accelerate new customer growth, we make strategic investments in sales, marketing and advertising to drive new business leads, brand awareness and market penetration. In addition, we are executing multiple initiatives to improve customer satisfaction and service delivery, which we believe will lead to improved retention and growth in our customer base across our business segments.
Introduce New Service Offerings. We intend to continue to leverage our existing sales channels and local coverage to deliver additional value-added services to our customers. Our product development teams draw upon the experience of our technicians in the field, combined with in-house scientific expertise, to create innovative customer solutions for both our existing customer base and identified service/category adjacencies. We have a strong history of new product introductions, such as Terminix's crawlspace encapsulation, mosquito control and wildlife exclusion services, that we believe will appeal to new potential customers as well as our existing customer base. As of September 30, 2014, mosquito, wildlife exclusion and crawl space encapsulation are being offered in substantially all U.S. geographic markets where we believe substantial market opportunity exists. We are now focusing our efforts on increasing our market share in these product lines.
104
Expand Our Geographic Markets. Through detailed assessments of local economic conditions and demographics, we have identified target markets for expansion, both in existing markets, where we have capacity to increase our local market position, and in new markets, where we see opportunities. In addition to geographic expansion opportunities within the United States, we intend to grow our international presence through strategic franchise expansions and additional licensing agreements.
Grow Our Commercial Business. Our revenue from commercial customers comprised approximately 13% of our 2013 revenue. We believe we are well positioned to leverage our national coverage, brand strength and broad service offerings to target large multi-regional accounts. We believe these capabilities provide us with a meaningful competitive advantage, especially compared to smaller local and regional competitors. We recognize that many of these large accounts seek to outsource or reduce the number of vendors used for certain services, and, accordingly, we have reenergized our marketing approach in this channel. At Terminix, for example, we have hired a dedicated sales team to focus on the development of commercial sales. Our commercial expansion strategy targets industries with a demonstrated need for our services, including healthcare, manufacturing, warehouses, hotels and commercial real estate.
Enhance Our Profitability. We have and will continue to invest in initiatives designed to improve our margins and drive profitable growth. We have been able to increase productivity across our segments through actions such as continuous process improvement, targeted systems investments, sales force initiatives and technician mobility tools. We are also focusing on strategically leveraging the $1.4 billion that we have spent annually with our vendors to capitalize on purchasing power and achieve more favorable pricing and terms. In addition, we have rolled out tools and processes to centralize and systematize pricing decisions. These tools and processes enable us to optimize pricing at the geographic market and product level while creating a flexible and scalable pricing architecture that can grow with the business. We intend to leverage these investments as well as identify further opportunities to enhance profitability across our businesses.
Pursue Selective Acquisitions. Since 2008, we have completed over 200 acquisitions. We anticipate that the highly fragmented nature of our markets will continue to create opportunities for further consolidation. As we have in the past, we will continue to take advantage of tuck-in as well as strategic acquisition opportunities, particularly in underserved markets where we can enhance and expand our service capabilities. We seek to use acquisitions, cost-effectively grow our customer count and enter high-growth geographies. We may also pursue acquisitions as vehicles for strategic international expansion.
Our Reportable Segments
Our operations are organized into three reportable segments: Terminix, American Home Shield and the Franchise Services Group (which includes ServiceMaster Restore, ServiceMaster Clean, Merry Maids, Furniture Medic and AmeriSpec).
Terminix
Terminix is the leading provider of termite and pest control services in the United States, with a market share of approximately 20% for 2013, as measured by customer-level revenue. In addition, Terminix is the most recognized brand in the industry with approximately 1.5x the unaided brand awareness of our next-largest competitor, based on a study by Decision Analyst, Inc. periodically commissioned by us as part of our ongoing marketing efforts. Terminix specializes in protection against termite damage, rodents, insects and other pests, including cockroaches, spiders, wood-destroying ants, ticks, fleas and bed bugs. Our services include termite remediation, annual termite inspection and prevention treatments with damage claim guarantees, periodic pest control services and insulation services. Our recent new product introductions include mosquito control, crawlspace encapsulation and wildlife exclusion.
105
For the year ended December 31, 2013 and the nine months ended September 30, 2014, 56% and 54%, respectively, of our Terminix revenue was generated from pest control services, which includes mosquito control, and 39% and 41%, respectively, was generated from termite control services, which includes crawlspace encapsulation, wildlife exclusion and insulation services, with the remaining 5% in each period from distribution of pest control products. For both the year ended December 31, 2013 and the nine months ended September 30, 2014, 70% and 30% of pest control revenue was related to residential services and commercial services, respectively, and 92% and 8% of termite control revenue was related to residential and commercial services, respectively. A significant portion of our Terminix revenue base is recurring, with 72% of 2013 revenue derived from services delivered through annual contracts. Additionally, as of December 31, 2013 and September 30, 2014, the retention rate for termite customers with annual contracts was 85% and 85%, respectively, and the retention rate for pest control customers with annual contracts was 79% and 80%, respectively.
We believe that the strength of the Terminix brand, along with our history of providing a high level of consistent service, allows us to enjoy a competitive advantage in attracting, retaining and growing our customer base. We believe our investments in systems and processes, such as routing and scheduling optimization, robust reporting capabilities and mobile customer management solutions, enable us to deliver a higher level of customer service when compared to smaller regional and local competitors.
Our focus on attracting and retaining customers begins with our associates in the field, who interact with our customers every day. Our associates bring a strong level of passion and commitment to the Terminix brand, as evidenced by the 11-year and 7-year average tenure of our branch managers and technicians, respectively. Our field organization is supported by dedicated customer service and call center personnel. Our culture of continuous improvement drives an intense focus on the quality of the services delivered, which we believe produces high levels of customer satisfaction and, ultimately, customer retention and referrals.
The Terminix national branch structure includes approximately 285 company-owned and 100 franchised locations, which serve approximately 2.8 million customers in 47 states and the District of Columbia. Terminix's over 8,000 employees made a daily average of 50,000 visits to residential and commercial customer locations during 2013. Terminix also provides termite and pest control services through subsidiaries in Canada, Mexico, the Caribbean and Central America, as well as a joint venture in India. In addition, licensees of Terminix provide these services in Japan, China, South Korea, Southeast Asia, Central America, the Caribbean and the Middle East. In 2013 and the nine months ended September 30, 2014, substantially all of Terminix revenue was generated in the United States, with less than 1% and approximately 1%, respectively, derived from international markets, with a presence in a total of 22 countries outside the United States through subsidiaries, a joint venture and licensing arrangements. Franchise fees from Terminix franchisees represented less than 1% of Terminix revenue in 2013 and the nine months ended September 30, 2014. We estimate that customer-level revenue for this segment was approximately $1,500 million for the year ended December 31, 2013 and $1,600 million for the trailing twelve months ended September 30, 2014. Customer-level revenue represents the total of our estimate of sales generated by our franchisees, a portion of which is included in our reported revenue from royalty fees, and sales generated by our company-owned operations.
- •
- #1 market position and #1 recognized brand in U.S. termite and pest control services
- •
- Track record of high customer retention rates
- •
- Passionate and committed associates focused on delivering superior customer service
- •
- Expansive scale and deep market presence across a national footprint
- •
- Effective multi-channel customer acquisition strategy
- •
- History of innovation leadership and introducing new products and services
Terminix Competitive Strengths
106
American Home Shield
American Home Shield founded the home warranty industry in 1971 and remains the leading provider of home warranty plans for household systems and appliances in the United States, with approximately 42% market share, as measured by revenue. We estimate American Home Shield to be approximately four to five times larger than its nearest competitors, as measured by revenue. We believe that, as the market leader, American Home Shield can drive increasing use of home warranties given the low industry household penetration of approximately 3-4%.
American Home Shield provides home warranty plans that cover the repair or replacement of up to 21 major household systems and appliances, including electrical, plumbing, central heating and air conditioning (HVAC) systems, water heaters, refrigerators, dishwashers and ovens/cook tops. Our warranty plans are generally structured as one-year contracts with annual renewal options and, as a result, a significant portion of our revenue base in this segment is recurring, with approximately 60% of our revenue base representing customers in the direct-to-consumer sales market. As of December 31, 2013 and September 30, 2014, our retention rate was 74% and 75%, respectively. Of the home warranties written by American Home Shield in 2013 and the nine months ended September 30, 2014, 69% and 67%, respectively, were derived from existing contract renewals (of which 66% and 64%, respectively, were from the direct-to-consumer channel and 34% and 36%, respectively, were from the home resale channel), while 18% and 20%, respectively, were derived from sales made in conjunction with existing home resale transactions and 13% and 13%, respectively, were derived from direct-to-consumer sales. We estimate that our share of the new sales market for contracts written in connection with existing home resales and direct-to-consumer sales in 2013 was 23% and 50%, respectively.
We believe that we have one of the largest contractor networks in the United States, comprised of approximately 11,000 independent home service contractor firms. We carefully screen our contractors and closely monitor their performance based on a number of criteria, including through feedback from customer satisfaction surveys. On an annual basis, our contractors respond to nearly three million service requests from approximately 1.5 million customers across all 50 states and the District of Columbia. Additionally, American Home Shield operates and takes service calls 24 hours a day, seven days a week. Furthermore, as a result of our large contractor network and sophisticated IT systems, approximately 90% of the time we successfully assign contractors to a job within 15 minutes or less.
American Home Shield Competitive Strengths
- •
- #1 market position in the industry with 42% market share, estimated to be four to five times the size of the next largest competitors
- •
- Track record of high customer retention rates
- •
- Large and pre-qualified national contractor network
- •
- Strong partnerships with leading national residential real estate firms
- •
- Core competency around direct-to-consumer marketing and lead generation
Franchise Services Group
Through December 31, 2013, we reported the Merry Maids business in our Other Operations and Headquarters segment and the ServiceMaster Restore, ServiceMaster Clean, Furniture Medic and AmeriSpec businesses in the ServiceMaster Clean segment. Beginning with the reporting period for the three months ended March 31, 2014, we have combined the Merry Maids business with our ServiceMaster Clean segment in a new reportable segment titled Franchise Services Group.
107
ServiceMaster's Franchise Services Group consists of the ServiceMaster Restore (disaster restoration), ServiceMaster Clean (janitorial), Merry Maids (residential cleaning), Furniture Medic (furniture repair) and AmeriSpec (home inspection) businesses. Our businesses in this segment operate principally through franchisees. In 2014 we began converting company-owned Merry Maids locations to franchises. Approximately half of our revenue in this segment consists of ongoing monthly royalty fees based upon a percentage of our franchisees' customer-level revenue. We estimate that the customer-level revenue for this segment was approximately $2,400 million for the year ended December 31, 2013 and $2,600 million for the trailing twelve months ended September 30, 2014. We believe that each business holds a leading market position in its respective category and that our scale and national presence create competitive advantages for us in attracting and retaining franchisees. We are able to invest in best-in-class systems, training and process development, provide multiple levels of marketing support and direct new business leads to our franchisees through our relationships with major insurance carriers and national account customers. The depth of our franchisee support is evidenced by the long average tenure of our franchisees, many of whom have partnered with ServiceMaster for over 25 years. Our Franchise Services Group serves both residential and commercial customers across all 50 states and the District of Columbia through approximately 4,000 franchised and 70 company-owned locations with additional locations in 17 other countries.
Franchise Services Group Competitive Strengths
- •
- Strong and trusted brands with leading market positions in their respective categories
- •
- Attractive value proposition to franchisees
- •
- Exceptional focus on customer service evidenced by strong net promoter scores, or "NPS"
- •
- Infrastructure and scale supporting our ability to service national accounts
- •
- National network and 24/7/365 service availability supports mission-critical nature of the ServiceMaster Restore business
- •
- Long-standing and strong relationships with the majority of the top 20 insurance carriers
TruGreen Spin-Off
On January 14, 2014, we completed the TruGreen Spin-off, resulting in the spin-off of the TruGreen Business through a tax-free, pro rata dividend to our stockholders. As a result of the completion of the TruGreen Spin-off, New TruGreen operates the TruGreen Business as a private independent company. The TruGreen Business provided lawn, tree and shrub care services primarily under the TruGreen brand name. Beginning with the reporting period for the three months ended March 31, 2014, the TruGreen Business has been reported in discontinued operations.
We have historically incurred the cost of certain corporate-level activities which we performed on behalf of the TruGreen Business, including communications, public relations, finance and accounting, tax, treasury, internal audit, human resources operations and benefits, risk management and insurance, supply management, real estate management, marketing, facilities, information technology and other support services. Beginning with the TruGreen Spin-off, where it was practicable, employees who historically provided such services to the TruGreen Business were separated from us and transferred to New TruGreen as of the date of the TruGreen Spin-off. For certain support services for which it was not practicable to separate employees and transfer them to New TruGreen beginning with the TruGreen Spin-off, a transition services agreement was entered into pursuant to which SvM and its subsidiaries provide specified services to New TruGreen while an orderly transition of employees and other support arrangements from SvM to New TruGreen is executed. The charges for the transition services are designed to allow us to fully recover the direct costs of providing the services, plus
108
specified margins and any out-of-pocket costs and expenses. The services provided under the transition services agreement will terminate at various specified times, and in no event later than January 14, 2016 (except for certain information technology services, which SvM expects to provide to New TruGreen beyond the two-year period).
As a result of the transfer of employees to New TruGreen, in combination with the fees we expect to receive under the transition services agreement, we expect an approximate $25 million reduction in annual costs.
Sales and Marketing
Terminix
Terminix markets its services to both homeowners and businesses through a national sales team and sales professionals in our branches and call centers. We generate leads for these sales professionals through advertising campaigns on television, online, in direct mail and in the yellow pages.
American Home Shield
In our American Home Shield segment, we market our services primarily through the internet, direct mail, television and radio advertising, print advertisements, marketing partnerships, telemarketing and various social media channels. Additionally, we market our services through a national sales team and various participants in the residential real estate marketplace, such as real estate brokerages, as well as some financial institutions and insurance carriers. American Home Shield focuses its marketing efforts on direct-to-consumer sales.
Franchise Services Group
In our Franchise Services Group segment, we market our services primarily through our franchise network, branch operations and a national sales team to a combination of business-to-business and business-to-consumer audiences. These services are advertised on a national and local level and include such media as television, radio, internet, direct mail, print advertisements, sales collateral materials and yellow page advertisements.
Service Marks, Trademarks and Trade Names
We hold various service marks, trademarks and trade names, such as ServiceMaster, Terminix, American Home Shield, ServiceMaster Restore, ServiceMaster Clean, Merry Maids, Furniture Medic and AmeriSpec, that we deem particularly important to the advertising activities conducted by each of our reportable segments as well as the franchising activities conducted by certain reportable segments. As of September 30, 2014, we had marks that were protected by registration (either by direct registration or by treaty) in the United States and approximately 95 other countries. In connection with the TruGreen Spin-off, on January 14, 2014, all of the service marks, trademarks and trade names related to the TruGreen Business were transferred to New TruGreen and its subsidiaries.
Franchises
Franchises are important to the Terminix, ServiceMaster Restore, ServiceMaster Clean, Merry Maids, Furniture Medic and AmeriSpec businesses. For the nine months ended September 30, 2014 and in 2013, 2012 and 2011, total franchise fees (monthly royalty fees as well as initial fees from sales of franchises and licenses) were $106 million, $137 million, $126 million and $125 million, respectively, related franchise operating expenses were $52 million, $59 million, $55 million and $53 million, respectively, and total profits from our franchised operations were $54 million, $78 million, $71 million and $72 million, respectively. Nearly all of the franchise fees received by our Franchise Services Group
109
segment are derived from the ServiceMaster Restore, ServiceMaster Clean and Merry Maids businesses. Franchise fees from our Terminix franchisees represented less than 1% of Terminix revenue for each of those years and the nine months ended September 30, 2014. We evaluate the performance of our franchise businesses based primarily on operating profit before corporate general and administrative expenses, interest expense and amortization of intangible assets. Franchise agreements entered into in the course of these businesses are generally for a term of five to ten years. The majority of these franchise agreements are renewed prior to expiration. Internationally, we have license agreements, whereby licensees provide services under our brand names that would ordinarily be provided by franchisees in the United States. The majority of international licenses are for ten-year terms.
Customers and Geographies
We have no single customer that accounts for more than two percent of our consolidated revenue. Additionally, no reportable segment has a single customer that accounts for more than three percent of its revenue. None of our reportable segments is dependent on a single customer or a few customers, the loss of which would have a material adverse effect on the segment.
A significant percentage of our revenues is concentrated in the southern and western regions of the United States. In our Terminix segment, California, Texas and Florida collectively accounted for approximately one-third of the revenue in 2013 and the nine months ended September 30, 2014. In our American Home Shield segment, Texas and California collectively accounted for approximately one-third of our revenue in 2013 and the nine months ended September 30, 2014.
Competition
We compete in residential and commercial services industries, focusing on termite and pest control, home warranties, disaster restoration, janitorial, residential cleaning, wood furniture repair and home inspection. We compete with many other companies in the sale of our services, franchises and products. The principal methods of competition in our businesses include quality and speed of service, name recognition and reputation, customer satisfaction, brand awareness, pricing and promotions, professional sales forces and referrals. While we compete with a broad range of competitors in each discrete segment, we do not believe that any of our competitors provides all of the services we provide in all of the market segments we serve. All of the primary segments in which we operate are highly fragmented.
Termite and Pest Control
Competition in the segment for professional termite and pest control services in the United States comes primarily from smaller regional and local, independently operated firms, as well as from Orkin, Inc., a subsidiary of Rollins, Inc., and Ecolab, Inc., both of which compete nationally. We estimate that there are approximately 20,000 termite and pest control companies in the United States, nearly all of which have fewer than 100 employees.
Home Warranties
Competition for home warranties that cover household systems and appliances comes mainly from regional providers. Our two largest national competitors are First American Financial Corporation and Old Republic International Corporation. We estimate American Home Shield to be four to five times larger than each of these companies, as measured by revenue.
110
Disaster Restoration, Emergency Response and Related Services
Competition in the markets for disaster restoration, emergency response and related services comes mainly from local, independently owned firms and a few national professional cleaning companies, such as Servpro Industries, Inc., Belfor, a subsidiary of Belfor Europe GmbH, BMS CAT, Inc., Stanley Steemer International, Inc., and Sears Holdings Corporation.
Janitorial
Competition in the market for janitorial services comes mainly from local, independently-owned firms and a few national professional janitorial firms such as ABM Industries Incorporated and Jani-King International, Inc. The market for janitorial services is highly fragmented with more than 800,000 companies.
Residential Cleaning
Competition in the market segment for residential cleaning services comes mainly from local, independently owned firms, and from a few national companies such as The Maids International, Inc., Molly Maid, Inc. and The Cleaning Authority, LLC.
Insurance
We maintain insurance coverage that we believe is appropriate for our business, including workers' compensation, auto liability, general liability, umbrella and property insurance. In addition, we provide various insurance coverages, including deductible reimbursement policies, to our business units through our wholly-owned captive insurance company, which is domiciled in Vermont.
Information Technology
We have invested in information systems and software packages designed to allow us to grow efficiently, deliver and implement nationally, while retaining local and regional flexibility. We believe this provides us with a competitive advantage in our operations. Our sophisticated IT systems enable us to provide a high level of convenience and service to our customers. Terminix is able to provide a two-hour service window to customers. Similarly, American Home Shield's call centers, which operate and take service calls 24 hours a day, seven days a week, successfully assign contractors to a job within 15 minutes or less approximately 90% of the time.
Employees
The average number of persons employed by our continuing operations during 2013 and for the nine months ended September 30, 2014 was approximately 13,000. None of our employees in the United States are represented by collective bargaining agreements.
Properties
The headquarters for Terminix, along with our corporate headquarters, are located in leased premises at 860 Ridge Lake Boulevard, Memphis, Tennessee. The headquarters for American Home Shield are located in leased premises at 889 Ridge Lake Boulevard, Memphis, Tennessee. The headquarters for ServiceMaster Restore, ServiceMaster Clean, Merry Maids, Furniture Medic and AmeriSpec, and a training facility are located in owned premises at 3839 Forest Hill Irene Road, Memphis, Tennessee. In addition, we lease space for call centers located at 6399 Shelby View Drive, Memphis, Tennessee and 7620 Appling Center Drive, Memphis, Tennessee; offices located at 850 and 855 Ridge Lake Boulevard, Memphis, Tennessee; a training facility located at 1650 Shelby Oaks Drive North, Memphis, Tennessee; and a warehouse located at 1575 Two Place, Memphis, Tennessee.
111
We and our operating companies own and lease a variety of facilities, principally in the United States, for branch and service center operations and for office, storage, call center and data processing space. Our branches are strategically located to optimize route efficiency, market coverage and branch overhead. The following chart identifies the number of owned and leased facilities, other than the headquarter properties listed above, used by each of our reportable segments as of September 30, 2014. We believe that these facilities, when considered with the corporate headquarters, call center facility, offices, training facilities and warehouse described above, are suitable and adequate to support the current needs of our business.
Reportable Segment
|
Owned Facilities |
Leased Facilities |
|||||
|---|---|---|---|---|---|---|---|
Terminix |
18 | 322 | |||||
American Home Shield |
1 | 4 | |||||
Franchise Services Group |
— | 81 | |||||
Regulatory Compliance
Our businesses are subject to various international, federal, state, provincial and local laws and regulations, compliance with which increases our operating costs, limits or restricts the services provided by our reportable segments or the methods by which our businesses offer, sell and fulfill those services or conduct their respective businesses, or subjects us and our reportable segments to the possibility of regulatory actions or proceedings. Noncompliance with these laws and regulations can subject us to fines or various forms of civil or criminal prosecution, any of which could have a material adverse effect on our reputation, business, financial position, results of operations and cash flows.
These international, federal, state, provincial and local laws and regulations include laws relating to consumer protection, wage and hour, deceptive trade practices, permitting and licensing, state contractor laws, real estate settlements, workers' safety, tax, healthcare reforms, franchise related issues, collective bargaining and other labor matters, environmental and employee benefits. The Terminix business must also meet certain Department of Transportation and Federal Motor Carrier Safety Administration requirements with respect to certain vehicles in its fleet. Terminix is regulated by federal, state and local laws, ordinances and regulations which are enforced by Pest Control Boards, Departments of Environmental Conservation and similar government entities. American Home Shield is regulated in certain states by the applicable state insurance regulatory authority and by the Real Estate Commission in Texas. ServiceMaster Clean and Merry Maids use products containing ingredients regulated by the EPA and ServiceMaster Clean is subject to licensing and certification requirements for applying disinfectants, sanitizers and other EPA registered products in certain states. AmeriSpec is regulated by various state and local home inspection laws and regulations.
Environmental, Health and Safety Matters
Our businesses are subject to various international, federal, state and local laws and regulations regarding environmental, health and safety matters. Among other things, these laws regulate the emission or discharge of materials into the environment, govern the use, storage, treatment, disposal and management of hazardous substances and wastes and protect the health and safety of our employees. These laws also impose liability for the costs of investigating and remediating, and damages resulting from, present and past releases of hazardous substances, including releases by prior owners or operators of sites we currently own or operate.
Compliance with environmental, health and safety laws increases our operating costs, limits or restricts the services provided by our reportable segments or the methods by which they offer, sell and fulfill those services or conduct their respective businesses, or subjects us and our reportable segments to the possibility of regulatory or private actions or proceedings.
112
Terminix is regulated under many federal and state environmental laws, including the Comprehensive Environmental Response, Compensation and Liability Act of 1980, or "CERCLA," the Superfund Amendments and Reauthorization Act of 1986, or "Superfund," the Federal Environmental Pesticide Control Act of 1972, the Federal Insecticide, Fungicide and Rodenticide Act of 1947, the Resource Conservation and Recovery Act of 1976, the Clean Air Act, the Emergency Planning and Community Right-to-Know Act of 1986, the Oil Pollution Act of 1990 and the Clean Water Act of 1977, each as amended.
We cannot predict the effect of possible future environmental laws on our operations. Changes in, or new interpretations of, existing laws, regulations or enforcement policies, the discovery of previously unknown contamination, or the imposition of other environmental liabilities or obligations in the future, may lead to additional compliance or other costs. During 2013 and the nine months ended September 30, 2014 there were no material capital expenditures for environmental control facilities, and there are no material expenditures anticipated for the remainder of 2014 or 2015 related to such facilities.
Consumer Protection and Solicitation Matters
We are subject to international, federal, state, provincial and local laws and regulations designed to protect consumers, including laws governing consumer privacy and fraud, the collection and use of consumer data, telemarketing and other forms of solicitation.
The telemarketing rules adopted by the Federal Communications Commission pursuant to the Federal Telephone Consumer Protection Act and the Federal Telemarketing Sales Rule issued by the Federal Trade Commission govern our telephone sales practices. In addition, some states and local governing bodies have adopted laws and regulations targeted at direct telephone sales and "do-not-knock," "do-not-mail" and "do-not-leave" activities. The implementation of these marketing regulations requires us to rely more extensively on other marketing methods and channels. In addition, if we were to fail to comply with any applicable law or regulation, we could be subject to substantial fines or damages, be involved in lawsuits, enforcement actions and other claims by third parties or governmental authorities, suffer losses to our reputation and our business or suffer the loss of licenses or penalties that may affect how the business is operated, which, in turn, could have a material adverse effect on our financial position, results of operations and cash flows.
In April 2014, the CFPB issued a CID to American Home Shield seeking documents and information to determine whether home warranty providers or other unnamed persons have engaged or are engaging in unlawful acts and practices in connection with referral arrangements and relationships in violation of RESPA and other laws enforceable by the CFPB. American Home Shield believes that it has complied with RESPA and other laws applicable to American Home Shield's home warranty business. If the CFPB determines to bring an enforcement action, it could include demands for money penalties, changes to certain of American Home Shield's business practices and customer restitution or disgorgement.
Franchise Matters
Terminix, ServiceMaster Restore, ServiceMaster Clean, Merry Maids, Furniture Medic and AmeriSpec are subject to various international, federal, state, provincial and local laws and regulations governing franchise sales, marketing and licensing and franchise trade practices generally, including applicable rules and regulations of the Federal Trade Commission. These laws and regulations generally require disclosure of business information in connection with the sale and licensing of franchises. Certain state regulations also affect the ability of the franchisor to revoke or refuse to renew a franchise. We seek to comply with regulatory requirements and deal with franchisees and licensees in good faith. From time to time, we and one or more franchisees may become involved in a dispute
113
regarding the franchise relationship, including payment of royalties or fees, location of branches, advertising, purchase of products by franchisees, non-competition covenants, compliance with our standards and franchise renewal criteria. There can be no assurance that compliance problems will not be encountered from time to time or that significant disputes with one or more franchisees will not arise.
From time to time, we receive communications from our franchisees regarding complaints, disputes or questions about our practices and standards in relation to our franchised operations and certain economic terms of our franchise arrangements. If franchisees or groups representing franchisees were to bring legal proceedings against us, we would vigorously defend against the claims in any such proceeding, but our reputation, business, financial position, results of operations and cash flows could be materially adversely impacted and the price of our common stock could decline.
Legal Proceedings
In the ordinary course of conducting business activities, we and our subsidiaries become involved in judicial, administrative and regulatory proceedings involving both private parties and governmental authorities. These proceedings include insured and uninsured matters that are brought on an individual, collective, representative and class action basis, or other proceedings involving regulatory, employment, general and commercial liability, automobile liability, wage and hour, environmental and other matters. We have entered into settlement agreements in certain cases, including with respect to putative collective and class actions, which are subject to court approval. If one or more of our settlements are not finally approved, we could have additional or different exposure, which could be material. In addition, in connection with the TruGreen Spin-off, we entered into a separation and distribution agreement with New TruGreen and TGLP pursuant to which we agreed to retain liability for specified legal proceedings relating to the TruGreen Business.
At this time, we do not expect any of these proceedings to have a material effect on our reputation, business, financial position, results of operations or cash flows; however, we can give no assurance that the results of any such proceedings will not materially affect our reputation, business, financial position, results of operations and cash flows. See Note 9 to our audited consolidated financial statements and Note 4 to our unaudited condensed consolidated financial statements included in this prospectus.
114
Directors and Executive Officers
The following table sets forth information about our directors and executive officers as of January 30, 2015.
Name
|
Age | Present Positions | First Became an Officer / Director |
||||||
|---|---|---|---|---|---|---|---|---|---|
John Krenicki, Jr. |
52 | Chairman | 2013 | ||||||
Robert J. Gillette |
54 | Chief Executive Officer & Director | 2013 | ||||||
Alan J. M. Haughie |
51 | Senior Vice President & Chief Financial Officer | 2013 | ||||||
Mark J. Barry |
52 | Group President, American Home Shield & Franchise Services Group | 2012 | ||||||
William J. Derwin |
46 | President, Terminix | 2013 | ||||||
Timothy M. Haynes |
48 | Senior Vice President & Chief Information Officer | 2013 | ||||||
Susan K. Hunsberger |
52 | Senior Vice President, Human Resources | 2014 | ||||||
James T. Lucke |
54 | Senior Vice President, General Counsel & Secretary | 2013 | ||||||
Mary Kay Runyan |
47 | Senior Vice President, Supply Management | 2013 | ||||||
Richard P. Fox |
67 | Director | 2014 | ||||||
Darren M. Friedman |
46 | Director | 2007 | ||||||
Sarah Kim |
39 | Director | 2013 | ||||||
Stephen J. Sedita |
63 | Director | 2013 | ||||||
David H. Wasserman |
47 | Director | 2007 | ||||||
John Krenicki, Jr. has served as Chairman of the board of directors since January 2013. He joined CD&R as an operating partner in January 2013, after 29 years with General Electric Company, or "GE." Mr. Krenicki currently serves as Chairman of the board of directors of Wilsonart International Holdings LLC and CHC Group Ltd. and lead director of Brand Energy & Infrastructure Services, Inc. He previously served as a director of Hess Corporation. From 2005 until 2008, Mr. Krenicki served as the President and Chief Executive Officer of GE Energy and in 2008 he became a Vice Chairman of GE, serving in such capacity until his resignation from GE in 2012. His responsibilities at GE included (among other roles) oversight of GE's Oil & Gas, Power and Water, and Energy Management businesses. While with GE, Mr. Krenicki also served as a member of GE's Corporate Executive Council and the GE Capital board of directors. Mr. Krenicki's extensive management experience and his background as a director of other service businesses give him beneficial insight into our capital and liquidity needs, in addition to our challenges, opportunities and operations and qualify him to serve on our board of directors.
Robert J. Gillette has served as ServiceMaster's Chief Executive Officer and as one of our directors since June 2013. From October 2011 until May 2013, Mr. Gillette served as the president and owner of Gillette Properties, LLC, a company which acquired and developed residential real estate properties. From October 2009 until October 2011, he served as the chief executive officer of First Solar, Inc., a manufacturer of thin film photovoltaic solar modules and solar power plants. From January 2005 to September 2009, Mr. Gillette served as the president and chief executive officer of Honeywell International, Inc.'s aerospace division, a provider of aerospace electronic systems, integrated avionics, engines and services for the aerospace industry. Mr. Gillette's extensive business and management
115
background and his prior experience as a public company executive qualify him to serve as a director on our board of directors.
Alan J. M. Haughie has served as ServiceMaster's Senior Vice President and Chief Financial Officer since September 2013. From July 2010 until September 2013, Mr. Haughie served as senior vice president and chief financial officer of Federal-Mogul Corporation, a global supplier of original equipment and aftermarket products for automotive, light commercial, heavy-duty and off-highway vehicles, as well as power generation, aerospace, marine, rail and industrial equipment. From 2005 until June 2010, he served as vice president, controller and chief accounting officer of Federal-Mogul Corporation, having joined Federal-Mogul in 1994 while serving in various roles until 2005.
Mark J. Barry has served as Group President, American Home Shield & Franchise Services Group since October 29, 2014. Mr. Barry joined ServiceMaster in August 2012 and previously served as President and Chief Operating Officer of American Home Shield. From April 2011 until February 2012, Mr. Barry served as president, Automation and Controls Solutions and from March 2010 until April 2011, served as president, Global Security Products, UTC Fire & Safety, both business units within United Technologies Corporation. From February 2008 until March 2010, Mr. Barry served as president of GE Security-Americas, a division of General Electric Company, before it was acquired by United Technologies Corporation in 2010.
William J. Derwin has served as President of Terminix since November 2013. From 2002 until October 2013, Mr. Derwin worked at Otis Elevator, serving most recently as its vice president global field operations. During his tenure at Otis Elevator he served in various other executive roles including group director UK and Ireland, vice president North and South America field operations, and vice president greater New York region. Otis Elevator is a division of United Technologies Corporation, a company which provides a broad range of high technology products and support services to the aerospace and building systems industries.
Timothy M. Haynes has served as Senior Vice President and Chief Information Officer since December 2013. Mr. Haynes joined ServiceMaster in January 2012 and has served as Vice President of Information Technology for the American Home Shield, ServiceMaster Clean and Merry Maids business units. From February 2006 until January 2012, Mr. Haynes served in a variety of Information Technology executive leadership roles for Nissan Motor Limited and Nissan Americas.
Susan K. Hunsberger has served as Senior Vice President, Human Resources since January 2014. From February 2010 until December 2013 she served as senior vice president, human resources, for the global business solutions (GBS) group of Connecticut-based Nielsen Holdings N.V., a $5.4 billion global information and measurement company with leading market positions in marketing and consumer information, television and other media measurement, online intelligence and mobile measurement. While at Nielsen, she also led the human resources team for the GBS organization, which employs more than 35,000 employees worldwide. From November 1997 until February 2010, Ms. Hunsberger served in a variety of human resources leadership positions at GE Aviation, a division of General Electric Company.
James T. Lucke has served as Senior Vice President, General Counsel and Secretary since September 2013. From May 2007 until May 2013, Mr. Lucke served as vice president, general counsel and secretary of Mohawk Industries, Inc., a leading producer of floor covering products for residential and commercial applications.
Mary Kay Runyan has served as Senior Vice President, Supply Management since July 2013. Ms. Runyan joined ServiceMaster in April 2010 and served as Vice President, Fleet until July 2013. From March 2009 until April 2010, Ms. Runyan served as the executive in charge of North American fleet operations for Coca-Cola Enterprises, where she was responsible for policy, process and operational performance across the United States and Canada.
116
Richard P. Fox has served as one of our directors since March 2014. Since 2001, Mr. Fox has been an independent consultant. From 2000 to 2001, he was president and chief operating officer of CyberSafe Corporation, a global security software provider. Mr. Fox spent 28 years at Ernst & Young LLP, a global accounting firm, last serving as managing partner at the firm's Seattle office. He currently serves on the board of directors of Acxiom Corporation, a marketing technology and services company; Pinnacle West Corporation, a vertically integrated electrical utility serving the State of Arizona; and Univar Inc., an international chemical distributor. Previously, he served on the boards of Pendrell Corporation, an intellectual property investment and advisory firm until 2014; Flow International Corporation, a machine tool manufacturer until 2014; Orbitz Worldwide, Inc. until 2011; and PopCap Games until it was acquired by Electronic Arts Inc. in 2011. He is a certified public accountant in the State of Washington. As a result of his extensive accounting and financial management experience, Mr. Fox has a deep understanding of financial reporting processes, internal accounting and financial controls, independent auditor engagements, and other audit committee and board functions. Mr. Fox's financial, accounting and management expertise, along with his experience on other boards, qualify him to serve as a director on our board of directors.
Darren M. Friedman has served as one of our directors since July 2007. Mr. Friedman is a Partner of StepStone Group LP, a global private markets firm that oversees approximately $60 billion of private capital allocations. Prior to joining StepStone in 2010, Mr. Friedman was a Managing Partner of Citi Private Equity, where he worked from 2001 to 2010, managing over $10 billion of capital across various private equity investing activities. Mr. Friedman sits or has sat on the boards or advisory boards of several portfolio companies, funds and a number of Investment Committees. Mr. Friedman currently serves on the boards of C&J Energy Services, Inc., Educate Inc., Laureate Education, Inc. and Padi Holding Company, LLC. Prior to joining Citi Private Equity, Mr. Friedman worked in the Investment Banking division at Salomon Smith Barney. Mr. Friedman's extensive business, financial and banking expertise to our board of directors from his background in investment banking and private equity fund management and extensive prior board service experience, qualify him to serve as a director on our board of directors.
Sarah Kim has served as one of our directors since December 2013. Ms. Kim is a principal of CD&R. Prior to joining CD&R in 2008, Ms. Kim held positions at Metalmark Capital and McCown De Leeuw, both private equity firms. She also worked in the investment banking division of Goldman, Sachs & Co. Ms. Kim's extensive knowledge of the capital markets gives her beneficial insight into our capital and liquidity needs, in addition to our challenges, opportunities and operations and qualify her to serve on our board of directors.
Stephen J. Sedita has served as one of our directors since December 2013. From 2008 until he retired in 2011, Mr. Sedita served as the Chief Financial Officer and Vice President of GE Home & Business Solutions, a business of General Electric Company; from 2007 until 2008, Mr. Sedita served as Chief Financial Officer and Vice President of GE Aviation. Mr. Sedita has served as a director of Controladora Mabe, S.A. de C.V., Camco Inc. and Momentive Performance Materials Holdings Inc. Mr. Sedita's extensive business and financial background and his prior board service experience, qualify him to serve as a director on our board of directors.
David H. Wasserman has served as one of our directors since July 2007. Mr. Wasserman is a partner of CD&R. Prior to joining CD&R in 1998, Mr. Wasserman worked in the principal investment area at Goldman, Sachs & Co. and as a management consultant at Monitor Company. Mr. Wasserman currently serves on the board of directors of Univar Inc., John Deere Landscapes LLC and Solenis LLC and formerly served on the boards of directors of Hertz Global Holdings, Inc., Covansys Corporation, Culligan Ltd., Kinko's, Inc. and ICO Global Communications (Holdings) Limited, currently known as Pendrell Corporation. Mr. Wasserman's extensive knowledge of the capital markets, experience as a management consultant and experience as a director of other consumer-oriented service businesses with nationwide locations that are similar to our business structure give him
117
beneficial insight into our capital and liquidity needs, in addition to our challenges, opportunities and operations and qualify him to serve on our board of directors.
Board Composition and Director Independence
Our board of directors is currently composed of seven directors. Our amended and restated certificate of incorporation provides for a classified board of directors, with members of each class serving staggered three-year terms. We have three directors in Class I (Messrs. Krenicki, Wasserman and Sedita), two directors in Class II (Messrs. Fox and Friedman) and two directors in Class III (Mr. Gillette and Ms. Kim). Any additional directorships resulting from an increase in the number of directors will be distributed among the three classes so that, as nearly as possible, each class will consist of one-third of the directors. See "Description of Capital Stock—Anti-Takeover Effects of our Certificate of Incorporation and By-Laws—Classified Board of Directors."
Under the amended stockholders agreement, the CD&R Funds and the StepStone Funds have the right to designate nominees for our board of directors, whom we refer to as the CD&R Designees and the StepStone Designees, respectively, subject to the maintenance of specified ownership requirements. See "Certain Relationships and Related Party Transactions—Stockholders Agreement."
Our board of directors is led by our non-executive Chairman, Mr. Krenicki, a CD&R Designee. The amended stockholders agreement provides that a CD&R Designee will serve as our Chairman of the board of directors as long as the CD&R Funds own at least 25% of the outstanding shares of our common stock.
The number of members on our board of directors may be fixed by resolution adopted from time to time by the board of directors. Subject to our amended stockholders agreement, any vacancies or newly created directorships may be filled only by the affirmative vote of a majority of directors then in office, even if less than a quorum, or by a sole remaining director. Each director shall hold office until his or her successor has been duly elected and qualified, or until his or her earlier death, resignation or removal.
With respect to any vacancy of a CD&R Designee or StepStone Designee, the CD&R Funds and the StepStone Funds, respectively, have the right to designate a new director for election by a majority of the remaining directors then in office.
Our board of directors has determined that Messrs. Fox and Sedita are "independent" as defined under NYSE and the Securities Exchange Act of 1934, as amended, or the "Exchange Act" rules and regulations.
Controlled Company
After the completion of this offering, the CD&R Funds and the StepStone Funds will no longer control a majority of the voting power of our outstanding common stock. Accordingly, we will no longer be a "controlled company" within the meaning of the NYSE corporate governance standards. Consequently, the NYSE rules will require that we (i) have a majority of independent directors to our board of directors within one year of the date we no longer qualify as a "controlled company"); (ii) have at least one independent director on each of the Compensation and Nominating and Corporate Governance Committees on the date we no longer qualify as a "controlled company," at least a majority of independent directors on each of the Compensation and Nominating and Corporate Governance Committees within 90 days of such date and Compensation and Nominating and Corporate Governance Committees composed entirely of independent directors within one year of such date and (iii) perform an annual performance evaluation of the Nominating and Corporate Governance and Compensation Committees. During this transition period, we may continue to utilize the available exemptions from certain corporate governance requirements as permitted by the NYSE rules.
118
Accordingly, during the transition period you will not have the same protections afforded to stockholders of companies that are subject to all of the corporate governance requirements of the NYSE. The "controlled company" exception does not modify audit committee independence requirements of Rule 10A-3 under the Exchange Act and the NYSE rules.
Board Committees
Our board of directors maintains an Audit Committee, a Compensation Committee and a Nominating and Corporate Governance Committee. Under the NYSE rules, we were required to have one independent director on our Audit Committee during the 90-day period beginning on the date of effectiveness of the registration statement filed with the SEC in connection with our initial public offering. After such 90-day period and until one year from the date of effectiveness of our initial public offering registration statement, we are required to have a majority of independent directors on our Audit Committee. Thereafter, our Audit Committee is required to be composed entirely of independent directors. Under the NYSE rules, we will need to have at least a majority of independent directors on our Nominating and Corporate Governance Committee within 90 days of the date we no longer qualify as a "controlled company" and our Nominating and Corporate Governance Committee must be composed entirely of independent directors within one year of such date. We will also need to appoint at least one independent director to our Compensation Committee within 90 days of the date we no longer qualify as a "controlled company" and have a fully independent Compensation Committee within one year of such date. The following is a brief description of our committees.
Audit Committee
Our Audit Committee is responsible, among its other duties and responsibilities, for overseeing our accounting and financial reporting processes, the audits of our financial statements, the qualifications and independence of our independent registered public accounting firm, the effectiveness of our internal control over financial reporting and the performance of our internal audit function and independent registered public accounting firm. Our Audit Committee reviews and assesses the qualitative aspects of our financial reporting, our processes to manage business and financial risks, and our compliance with significant applicable legal, ethical and regulatory requirements. Our Audit Committee is directly responsible for the appointment, compensation, retention and oversight of our independent registered public accounting firm. The charter of our Audit Committee is available without charge on the investor relations portion of our website.
The members of our Audit Committee are Messrs. Fox (Chair), Sedita and Ms. Kim. Our board of directors has designated Messrs. Fox and Sedita and Ms. Kim as "audit committee financial experts," and each of the three members has been determined to be "financially literate" under the NYSE rules. Our board of directors has also determined that Messrs. Fox and Sedita are "independent" as defined under NYSE and Exchange Act rules and regulations.
Compensation Committee
Our Compensation Committee is responsible, among its other duties and responsibilities, for reviewing and approving all forms of compensation to be provided to, and employment agreements with, the executive officers and directors of our company and its subsidiaries (including the Chief Executive Officer), establishing the general compensation policies of our company and its subsidiaries and reviewing, approving and overseeing the administration of the employee benefits plans of our company and its subsidiaries. Our Compensation Committee also periodically reviews management development and succession plans. The charter of our Compensation Committee is available without charge on the investor relations portion of our website.
119
The members of our Compensation Committee are Messrs. Krenicki (Chair), Sedita and Wasserman. After the completion of this offering, we will no longer be a "controlled company" within the meaning of the NYSE corporate governance standards and will need to appoint at least one additional independent director to our Compensation Committee within 90 days of such date and our Compensation Committee must be composed entirely of independent directors within one year of the date we no longer qualify as a "controlled company."
We intend to establish a sub-committee of our Compensation Committee consisting of "outside directors" for purposes of approving any compensation that may otherwise be subject to Section 162(m) of the Internal Revenue Code of 1986, as amended, or the "Code."
Nominating and Corporate Governance Committee
Our Nominating and Corporate Governance Committee is responsible, among its other duties and responsibilities, for identifying and recommending candidates to the board of directors for election to our board of directors, reviewing the composition of the board of directors and its committees, developing and recommending to the board of directors corporate governance guidelines that are applicable to us, and overseeing board of directors evaluations. The charter of our Nominating and Corporate Governance Committee is available without charge on the investor relations portion of our website.
The members of our Nominating and Corporate Governance Committee are Messrs. Wasserman (Chair), Krenicki and Fox. After the completion of this offering, we will no longer be a "controlled company" within the meaning of the NYSE corporate governance standards and will need to have at least a majority of independent directors within 90 days of the date we no longer qualify as a "controlled company," and the Nominating and Corporate Governance Committee must be composed entirely of independent directors within one year of such date.
Compensation Committee Interlocks and Insider Participation
The members of the Compensation Committee currently are Messrs. Krenicki, Wasserman and Sedita. For a part of 2013 and all of 2014, Ms. Kim served on our Compensation Committee. Messrs. Krenicki and Wasserman and Ms. Kim are principals of CD&R. Mr. Krenicki assumed the role of Interim CEO from April 12, 2013 through June 16, 2013 following the resignation of our former CEO and prior to the hiring of Mr. Gillette. No other member of the Compensation Committee was at any time during 2013 or 2014 an officer or employee of ServiceMaster or any of our subsidiaries nor is any such person a former officer of ServiceMaster or any one of our subsidiaries. See "Certain Relationships and Related Party Transactions" for a discussion of agreements between ServiceMaster, CD&R and the CD&R Funds.
Code of Conduct and Financial Code of Ethics
We have a Financial Code of Ethics that applies to the CEO, CFO and Controller, or persons performing similar functions, and other designated officers and associates, including the primary financial officer of each of our business units and the Treasurer. We also have a Code of Conduct that applies to all of our directors, officers and associates. The Financial Code of Ethics and Code of Conduct each address matters such as conflicts of interest, confidentiality, fair dealing and compliance with laws and regulations. The Financial Code of Ethics and the Code of Conduct is available without charge on the investor relations portion of our website.
120
Compensation Discussion and Analysis
This section describes the material elements of our 2014 executive compensation program and the principles underlying our executive compensation policies and decisions. In addition, in this section we provide information regarding the compensation paid to each individual who served in the capacity as principal executive officer (CEO) or principal financial officer (CFO) during 2014 and the three most highly compensated executive officers (other than the CEO and CFO) who were serving as such as of the end of our most recent fiscal year, collectively referred to as our Named Executive Officers, or "NEOs." For fiscal 2014 our NEOs are as follows:
- •
- Robert J. Gillette, Chief Executive Officer;
- •
- Alan J. M. Haughie, Senior Vice President and Chief Financial Officer;
- •
- Mark J. Barry, Group President, American Home Shield & Franchise Services Group;
- •
- William J. Derwin, President, Terminix; and
- •
- Susan K. Hunsberger, Senior Vice President, Human Resources.
Highlights
- •
- Our leadership structure was stable during 2014. Ms. Hunsberger was hired on January 1, 2014 as Senior Vice President,
Human Resources. In October 2014, Mr. Barry assumed the leadership of the Franchise Services Group, in addition to his responsibilities leading American Home Shield, with the departure of
Mr. Thomas J. Coba, former president of the Franchise Services Group.
- •
- Base salaries of the NEOs who were hired during 2013 and 2014 were not increased during 2014 (except Mr. Derwin's base salary,
which was increased as provided in his employment offer letter), as the Compensation Committee deemed that the salaries on the hire dates were competitive and did not need adjustment. Mr. Barry
received a 5.7 percent merit-based increase in his salary in April 2014, and then received a 7.5 percent increase in his salary in late 2014 to reflect the increased scope of his
position as he assumed the leadership of the Franchise Services Group.
- •
- Annual bonuses for 2014 have not yet been determined. The 2014 bonuses for our executive officers are not yet calculable and are
expected to be determined in February 2015 after completion of the fiscal 2014 audit when Adjusted Operating Performance, Revenue, Cash Flow (each as defined below) figures and other individual
performance criteria are finalized and approved by the Compensation Committee.
- •
- As part of our strategy to align interests between our NEOs and stockholders, and in recognition of their hire into the senior management team, Messrs. Gillette and Barry and Ms. Hunsberger purchased shares of our common stock and simultaneously were granted options under the MSIP to acquire additional shares in the future. Ms. Hunsberger was also awarded RSUs to provide additional value and alignment with our stockholders. Mr. Barry received a grant of stock options and an RSU award to recognize his assumption of the responsibility of leading the Franchise Services Group.
Objectives of Our Compensation Program
Our compensation plans for executive officers (including the NEOs) are designed to:
- •
- Attract, motivate and retain highly qualified executives;
- •
- Reward successful performance by the executives and us by linking a significant portion of compensation to financial and business results;
121
- •
- Align our executives' long-term interests with those of our stockholders through meaningful share ownership; and
- •
- Appropriately balance long- and short-term incentive compensation so that short-term performance is not emphasized at the expense of long-term value creation.
Elements of Executive Compensation, including for NEOs
To meet these objectives, our executive compensation program consists of the following:
- •
- Base salary, which is intended to attract and retain highly qualified executives and to recognize individual performance by the
executive;
- •
- Annual cash incentive, which is intended to motivate each executive to achieve short-term company (and, where applicable, business
unit) performance goals while contributing to the attainment of long-term business objectives and special bonus awards from time to time;
- •
- Stock, RSUs (including performance-based RSUs) and stock options to motivate executives to achieve long-term performance goals and to
provide equity ownership of our common stock to our executives to ensure goal alignment with our stockholders; and
- •
- Employee benefits, including retirement benefits, health and welfare benefits, perquisites, new hire bonus and relocation benefits, which are intended to attract and retain qualified executives by ensuring that our benefit programs are competitive.
Each of these elements, discussed in more detail below, plays an integral role in our balancing of executive rewards over short and long-term periods and our ability to attract and retain key executives. We believe the design of our executive compensation program creates alignment between performance achieved and compensation awarded, and motivates achievement of both annual goals and sustainable long-term performance.
Determination of Executive Compensation
Pay Decision Process
The role of our Compensation Committee is to assist our board of directors in the discharge of its responsibilities relating to our executive compensation program. Our Compensation Committee is responsible for establishing, administering and monitoring our policies governing the compensation for our executive officers, including determining base salaries and short-term and long-term incentive awards.
The Compensation Committee establishes the compensation of our CEO. Historically, in determining the CEO's compensation, the Compensation Committee has considered the following factors: (1) our operating and financial performance, (2) the competitive market data provided by Semler Brossy Consulting Group, or "Semler Brossy," our external compensation consultant at the time of the competitive review, as presented to the Compensation Committee by our Senior Vice President, Human Resources, (3) the assessment by the Compensation Committee of the CEO's individual performance and (4) prevailing economic conditions. The CEO historically recommended to the Compensation Committee compensation for the other executive officers based on his assessment of each executive officer's area of responsibility, individual and business unit performance, overall contribution, the competitive market data provided by Semler Brossy and prevailing economic conditions. All aspects of compensation for our executive officers in fiscal year 2014 were determined by the Compensation Committee and the Compensation Committee provides all functions described in this Compensation Discussion and Analysis as provided in its charter.
122
We believe that our executive compensation program must be attractive to compete in the market for executive talent and must support our growth strategy. As a result of this focus, we rely on competitive pay practices and individual and business performance in determining the compensation of our executives. In making these compensation determinations, we also consider historical individual compensation levels and historical company payout levels for annual cash incentives. The executive compensation program and underlying philosophy are reviewed at least annually to determine what, if any, modifications should be considered.
In 2014, the Compensation Committee reviewed and made adjustments to the group of peer companies, or "Peer Group," to which we compare our NEOs' compensation. The Compensation Committee approved a list of 12 companies as our Peer Group. These companies are generally 0.3 to 3.0 times our revenue size, based on 2013 revenue figures. The Compensation Committee decided that companies in the retail and restaurant sectors that were in our Peer Group in prior years were not an appropriate comparison as these sectors and the business and consumer service sectors operate and compensate differently, and Ecolab Inc. was deleted from the Peer Group due to the size of the company as measured by its significantly larger revenue base.
The new peer companies are generally from the service industry where they have a distributed business model. The Compensation Committee also considered the growth rates of the companies when selecting this group of companies. We have periodically reviewed the Peer Group and may from time to time adjust the companies comprising the group to better reflect competitors in our industry, companies with similar business models and companies that compete in our labor markets for talent. For 2014, the Peer Group consisted of the following companies:
Peer Group
| ABM Industries Incorporated | Rollins, Inc. | |
| The ADT Corporation | Service Corporation International | |
| Chemed Corporation | Spectrum Brands Holdings, Inc. | |
| Cintas Corporation | The Scotts Miracle Grow Company | |
| Realogy Holdings Corp. | Waste Connections, Inc. | |
| Republic Services, Inc. | Weight Watchers International, Inc. |
Companies that were deleted from our Peer Group for 2014 include:
AutoZone, Inc.
Chico's FAS Inc.
Chipotle Mexican Grill, Inc.
Darden Restaurants, Inc.
DSW Inc.
Ecolab Inc.
Harris Teeter Supermarkets, Inc.
L Brands, Inc.
O'Reilly Automotive, Inc.
Starbucks Corporation
The Wendy's Company
Urban Outfitters, Inc.
Companies that were added to the Peer Group for 2014 include:
The
ADT Corporation
Realogy Holdings Corp.
Weight Watchers International, Inc.
123
As part of our review of competitive pay practices, we engaged Semler Brossy in 2014 to conduct a market review to determine whether executive officer total compensation opportunities were competitive. In determining 2014 executive compensation, the Compensation Committee relied on the Peer Group data for positions reported in the peer companies' respective proxy statements provided by Semler Brossy. A general survey of competitive market data for positions which were not reported in Peer Group proxy statements was provided by Aon Hewitt and was adjusted to mirror general market merit increases, as identified in market salary increase surveys sponsored by compensation consulting organizations. The survey data reflects companies in general industries with revenue sizes between $1 and $5 billion. The Compensation Committee then evaluated base pay and annual bonuses for our executives as discussed below. Differences in total compensation generally reflect the relevant experience, expertise, tenure and performance of the individual executive officer within his or her role.
Base Salary
Base salaries for executive officers are reviewed annually during our merit review process at the beginning of each year. To determine base salaries for executive officers, we first review market data and target base salaries at the market median of the Peer Group or Aon Hewitt survey data for each respective position. The base salary for each NEO is then determined by adjusting the amount based on the Compensation Committee's assessment of the NEO's experience relative to industry peers, time in his or her position, individual performance, future potential and leadership qualities. In 2014, when a detailed review was performed prior to salary increases, the base salary of Mr. Gillette was slightly above the median of the Peer Group. The base salary for Mr. Barry was slightly below the median peer company business unit leaders. Mr. Barry's base salary was increased by 5.7 percent to $465,000 in April 2014, and then his salary was increased by 7.5% to $500,000 to recognize his additional responsibilities leading the Franchise Services Group. With this increase, Mr. Barry's salary is close to the median of peer company business unit leaders. Mr. Derwin's salary was increased by 5.3% to $500,000 consistent with a provision of his offer letter to effect that increase on April 1, 2014. Mr. Derwin's salary is at approximately the median of peer company business unit leaders. No other NEO received a salary increase during 2014, as they had been hired in 2013 or 2014 (Ms. Hunsberger) and the Compensation Committee determined that their salaries were competitive. The following table sets forth information regarding the 2014 base salaries for our NEOs.
2014 Salary Table
Named Executive Officer
|
Base Salary as of January 1, 2014 |
Base Salary as of December 31, 2014 |
Aggregate Increase % |
|||||||
|---|---|---|---|---|---|---|---|---|---|---|
Robert J. Gillette |
$ | 1,100,000 | $ | 1,100,000 | 0% | |||||
Alan J. M. Haughie |
$ | 550,000 | $ | 550,000 | 0% | |||||
Mark J. Barry(1) |
$ | 440,000 | $ | 500,000 | 13.6% | |||||
Susan K. Hunsberger |
$ | 425,000 | $ | 425,000 | 0% | |||||
William J. Derwin(2) |
$ | 475,000 | $ | 500,000 | 5.3% | |||||
- (1)
- The
salary increase for Mr. Barry to $500,000 reflects (i) a 5.7% merit-based increase and (ii) a 7.5% increase to recognize his
additional responsibilities leading the Franchise Services Group.
- (2)
- The salary increase for Mr. Derwin to $500,000 was provided for in his offer letter when hired.
Annual Bonus Plan
The Annual Bonus Plan, or "ABP," our annual cash incentive program, is designed to reward the achievement of specific pre-set financial results measured over one or more fiscal years or a portion of
124
a fiscal year. For 2014, the ABP was measured over the 2014 calendar year results. Each participant is assigned an annual incentive target expressed as a percentage of base salary. For the NEOs, these targets ranged from 60 percent of base salary to 100 percent of base salary.
To encourage our executive officers to focus on short term company (and, where applicable, business unit) goals and financial performance, incentives under the ABP are based on our performance with respect to the following measures at both a corporate consolidated and, where applicable, a business unit level, as well as an evaluation of the individual's performance:
- •
- Adjusted Operating Performance, or "AOP," which is calculated by adding back general allocations to Adjusted EBITDA;
- •
- Revenue;
- •
- Cash Flow, which is calculated by making the following adjustments to AOP: (1) adjusting for the change in net working capital
and (2) subtracting capital expenditures; and
- •
- Individual performance evaluation, as determined by the Compensation Committee.
These performance measures were selected as the most appropriate measures upon which to determine annual bonuses because they are the primary metrics that management and the Equity Sponsors use to measure our performance for purposes unrelated to compensation. Additionally, these measures were selected to incentivize profitable growth and cash flow generation to meet debt obligations and fund investments for future growth. All of the opportunity for payment under the ABP to our NEOs is based on these performance measures.
Annual bonuses for 2014 have not yet been determined. The 2014 bonuses for our executive officers are not yet calculable and are expected to be determined in February 2015 after completion of the fiscal 2014 audit when AOP, Revenue, Cash Flow, and other individual performance figures are finalized and approved by the Compensation Committee.
Performance targets are established by the Compensation Committee toward the beginning of each year and are based on expected performance in accordance with our and, where applicable, the business unit's, approved business plan for the year. In the event we and, where applicable, the business unit achieve the performance targets, payout under the ABP would be 100 percent of a specified percentage of the executive's base salary. In the event we and, where applicable, the business unit do not achieve the performance targets, a lesser bonus may be earned if we and, where applicable, the business unit meet or exceed the threshold amounts for the performance targets, which are generally equal to the previous year's results achieved for the applicable performance measure. In the event we exceed the performance targets, the amount of the bonus will increase accordingly. There is no maximum payout under the ABP on the theory that we pay for performance and our executives should receive additional compensation when we exceed our performance goals. The components and weightings of the performance measures are reviewed and determined annually by the Compensation Committee to reflect company strategy. The Compensation Committee also considers an evaluation of the individual performance for each executive officer and may adjust the formulaic bonus calculation based on its evaluation.
The tables below provide information regarding the 2014 ABP for our participating NEOs, including the performance goals, the weight assigned to each performance goal, and the payout as a percentage of the target bonus if the threshold or target performance goal is met. The performance goals and relative weightings reflect the Compensation Committee's objective of ensuring that a substantial amount of each NEO's total compensation is tied to applicable business unit performance. Although Mr. Barry assumed the leadership of the Franchise Services Group in October 2014, his 2014 bonus will be measured only on American Home Shield performance, as well as his individual performance.
125
2014 ABP Weighting, Threshold and Target Performance Goals
Participating NEO
|
Target Bonus as a % of Salary |
Organizational Weighting |
Performance Weighting | Threshold ($ in 000s) |
Target ($ in 000s) |
% of Target Performance for Threshold Payout |
% Payout With Threshold Performance |
|||||||||||||
|---|---|---|---|---|---|---|---|---|---|---|---|---|---|---|---|---|---|---|---|---|
Robert J. Gillette |
100 | % | 50% ServiceMaster AOP | 472,800 | 537,000 | 88.0 | % | 28.3 | % | |||||||||||
Alan J. M. Haughie |
70 | % | 100% ServiceMaster | 30% ServiceMaster Revenue | 2,292,900 | 2,491,200 | 92.0 | % | 52.2 | % | ||||||||||
Susan K. Hunsberger |
60 | % | 20% ServiceMaster Cash Flow | 442,800 | 489,000 | 90.6 | % | 43.3 | % | |||||||||||
Mark J. Barry |
65 | % | 100% American Home Shield | 50% American Home Shield AOP | 168,700 | 168,700 | 100.0 | % | 100.0 | % | ||||||||||
|
30% American Home Shield Revenue | 740,100 | 834,400 | 88.7 | % | 32.2 | % | |||||||||||||
|
20% American Home Shield Cash Flow | 142,000 | 161,400 | 88.0 | % | 27.9 | % | |||||||||||||
William J. Derwin |
65 | % | 100% Terminix | 50% Terminix AOP | 318,900 | 354,500 | 90.0 | % | 39.7 | % | ||||||||||
|
30% Terminix Revenue | 1,309,500 | 1,380,100 | 94.9 | % | 69.3 | % | |||||||||||||
|
20% Terminix Cash Flow | 326,100 | 335,300 | 97.3 | % | 83.5 | % | |||||||||||||
The "% of Target Performance for Threshold Payout" is equal to threshold performance (which is generally equal to the prior year's actual performance) divided by the current year's target goal. The payout levels for performance above threshold are based on a 6:1 ratio—for every one percent of achievement above threshold performance levels, the plan pays out six additional percentage points of the targeted payout. We believe the 6:1 ratio to be an effective motivator to improve over the prior year's results. The 2014 ABP target payout opportunity for each participating NEO was based on our review of Peer Group and survey data and the importance of the NEO's position relative to our overall financial success.
Sign-On Bonuses
We have historically included sign-on bonuses for newly hired executives as a part of the new hire compensation offers. The sign-on bonus is used to provide a compensation offer that differentiates our offer of employment (for executives who frequently have other available opportunities) and may be needed to compensate the executives for the lost value of existing compensation arrangements at the executives' prior employers. In 2014, we paid a sign-on bonus to Ms. Hunsberger of $225,000. Ms. Hunsberger's bonus, consistent with all sign-on bonuses for our executive officers, is subject to repayment provisions if she voluntarily terminates employment with us or is terminated by us for cause prior to the second anniversary of her hire date.
Long-Term Equity Incentive Plans
Our long-term equity incentive plans were designed to retain key executives and to align the interests of our executives with the achievement of sustainable long-term growth and performance. For 2014, our NEOs were participants under our long-term incentive plans.
MSIP
Prior to our initial public offering, the MSIP provided certain key associates (including all of our NEOs) with the opportunity (1) to invest in shares of our common stock via actual share purchases and (2) to receive RSUs and options to purchase shares of our common stock. We believe that the opportunity for executive officers to purchase shares by making a significant monetary investment in the Company encourages their focus on long-term performance, thereby aligning their interests with the interests of our stockholders. All equity awards granted subsequent to the initial public offering were made under the provisions of the Omnibus Incentive Plan. No further awards will be made under the MSIP, but awards previously granted under the MSIP, including to the NEOs, are still outstanding.
For each share of common stock purchased by an NEO under the MSIP, we granted such NEO up to four matching options to purchase shares of our common stock, or "Matching Options," except in the case of Mr. Gillette, where we granted five and one half Matching Options for each share purchased. Prior to our initial public offering, we had also awarded RSUs under the MSIP to both
126
newly hired executives and longer tenured NEOs. Each RSU represents a right to receive a share of common stock in the future, if and when the RSU vests. Vesting of RSUs is subject to the executive's continued employment.
The purchase of shares under the MSIP allowed executive officers to have a stake in our performance by putting their own financial resources at risk. Additionally, through stock option and RSU grants under the MSIP and now the Omnibus Incentive Plan, the executive officers are encouraged to focus on sustained increases in stockholder value. Specifically, we believe the granting of stock options and RSUs, both time vested and performance based, assists us to:
- •
- Enhance the link between the creation of stockholder value and long term executive incentive compensation;
- •
- Maintain competitive levels of total compensation; and
- •
- Enable us to retain key leaders by providing value for key executives.
Prior to our initial public offering, in connection with the TruGreen Spin-off, we adjusted the exercise price of options held by our employees to reflect the fair market value of our common stock after giving effect to the TruGreen Spin-off by multiplying the exercise price of such options immediately prior to the TruGreen Spin-off by a fraction, the numerator of which was the fair market value of a share of our common stock immediately following the TruGreen Spin-off ($12.00 per share) and the denominator of which was the fair market value of a share of our common stock immediately prior to the TruGreen Spin-off ($15.75 per share), or the "Option Conversion Ratio." To allow our employees to retain the intrinsic values of their stock options prior to the TruGreen Spin-off, we also adjusted the number of shares underlying the options of such employees. The number of shares underlying the options was adjusted by dividing the number of shares underlying the options held by each employee by the Option Conversion Ratio. We refer to these adjustments collectively as the "Option Conversion." Each employee who held our shares of the Company at the time of the TruGreen Spin-off received shares in New TruGreen equal to the number of shares they held in the Company. These shareholders were afforded an opportunity to sell their shares in New TruGreen and purchase the same value of shares in the Company.
Our board of directors approved a reverse 2:3 stock split in June 2014 prior to the initial public offering to more appropriately price the stock at the offering. The number of shares, stock options and RSUs were adjusted by dividing the outstanding number of shares, stock options or RSUs by three and multiplying by two. The share cost basis and the option exercise price were adjusted by multiplying the basis or price by three and dividing by two.
All share, stock option and RSU numbers reflect the adjustments related to the TruGreen Spin-off and the reverse stock split.
Under the terms of Mr. Gillette's employment agreement, at his discretion, Mr. Gillette had the opportunity, prior to December 31, 2014, to purchase up to an aggregate of $1.5 million of additional common stock at its then-current fair market value. On March 18, 2014, Mr. Gillette purchased $1.5 million of additional common stock and in connection therewith received 687,500 nonqualified options pursuant to the terms of the employment agreement. The options will vest at a rate of one-fourth per year on each of the first four anniversaries of March 18, 2014, subject to Mr. Gillette's continued employment with us.
Also on March 18, 2014, Mr. Barry purchased $200,000 of our common stock and received 66,666 nonqualified options. Of the options received by Mr. Barry, 50 percent vest upon the value of the common shares underlying the options achieving a price of $24 per share and the remaining 50 percent of the options vest upon the value of the common shares underlying the options achieving a price of
127
$36 per share, subject to Mr. Barry's continued employment with us. Our shares achieved a stock price of $24 on August 26, 2014 and, consequently, 33,333 stock options became vested on that date.
Pursuant to the terms of their offers of employment, Ms. Hunsberger and Mr. Gillette each made an investment to acquire shares of our common stock, and received Matching Options (and RSUs in Ms. Hunsberger's case) as noted below:
Name
|
Investment $ |
# of Shares Acquired |
# Matching Options |
# RSUs | |||||||||
|---|---|---|---|---|---|---|---|---|---|---|---|---|---|
Robert J. Gillette |
1,500,000 | 125,000 | 687,500 | 0 | |||||||||
Susan K. Hunsberger |
439,992 | 36,666 | 146,666 | 43,750 | |||||||||
An additional investment opportunity was also provided to Mr. Barry as noted below. This additional investment opportunity was intended to provide Mr. Barry with a long-term compensation opportunity more comparable to other more newly hired executive officers in similar positions.
Name
|
Investment $ |
# of Shares Acquired | # Matching Options(1) | # RSUs | |||||||||
|---|---|---|---|---|---|---|---|---|---|---|---|---|---|
Mark J. Barry |
200,000 | 16,666 | 66,666 | 0 | |||||||||
- (1)
- The stock options granted to Mr. Barry vest as follows: 50% of the options vest upon our shares achieving a stock price of $24 and 50% vest upon our shares achieving a stock price of $36. Our shares achieved a stock price of $24 on August 26, 2014 and, consequently, 33,333 stock options became vested on that date.
The disclosure regarding stock options in this Compensation Discussion and Analysis, including in the table above and in the "Outstanding Equity Awards at Fiscal Year End (2014)" table refers to the number of options held by each NEO, and the exercise price of each such option, as of December 31, 2014 (or as of the grant date if specified).
As discussed above, resulting from the TruGreen Spin-off, the NEOs were afforded an opportunity to consolidate their equity positions into our stock by selling their shares in New TruGreen and purchasing our shares. This opportunity also included outstanding RSU awards. All NEOs who held New TruGreen shares exercised this opportunity to consolidate their shares into our common shares and their RSUs into our units. This transaction was executed on March 18, 2014. The share purchases are noted in the table below.
Name
|
New TruGreen Shares Sold | # of SERV Shares Acquired | Acquisition Price Per Share |
New TruGreen RSUs Converted | SERV RSUs Acquired | |||||||||||
|---|---|---|---|---|---|---|---|---|---|---|---|---|---|---|---|---|
Robert J. Gillette |
100,000 | 31,250 | $ | 12.00 | 200,000 | 62,500 | ||||||||||
Alan J. M. Haughie |
32,000 | 10,000 | $ | 12.00 | 50,000 | 15,625 | ||||||||||
Mark J. Barry |
30,295 | 9,466 | $ | 12.00 | 44,445 | 13,889 | ||||||||||
Susan K. Hunsberger |
0 | 0 | N/A | 33,333 | 10,416 | |||||||||||
William J. Derwin |
69,841 | 21,824 | $ | 12.00 | 33,333 | 10,416 | ||||||||||
128
Omnibus Incentive Plan
In connection with our initial public offering, our board of directors adopted and our stockholders approved the Omnibus Incentive Plan, which became effective on June 26, 2014. Our directors, officers, associates and consultants are eligible to receive awards under the Omnibus Incentive Plan. Awards under the Omnibus Incentive Plan may be made in the form of stock options, which may be either incentive stock options or non-qualified stock options; stock purchase rights; restricted stock; RSUs; performance shares; performance units; stock appreciation rights, or "SARs"; dividend equivalents; DSUs; and other stock-based awards. Mr. Barry is the only NEO who received an award under the Omnibus Incentive Plan in 2014.
On October 29, 2014, the Compensation Committee approved awards, effective as of October 31, 2014, under the Omnibus Incentive Plan for Mr. Barry in the form of 92,670 stock options and 45,872 RSUs to recognize his assumption of the leadership of the Franchise Services Group. The options granted to Mr. Barry vest in four equal installments on the first four anniversaries of the grant date, subject to his continued employment with us. The RSUs granted to Mr. Barry vest in three equal installments on the first three anniversaries of the grant date, subject to his continued employment with us.
Subject to adjustment as provided under the Omnibus Incentive Plan, a total of 7,958,390 shares of our common stock remained available for issuance under the Omnibus Incentive Plan as of December 31, 2014. This figure represents approximately 6 percent of the shares of our common stock that was outstanding as of December 31, 2014. During any period that Section 162(m) of the Code is applicable to us, (1) the maximum number of stock options, SARs or other awards based solely on the increase in the value of common stock that a participant may receive in any year is 2,000,000; (2) a participant may receive a maximum of 1,000,000 performance shares, shares of performance-based restricted stock and performance-based RSUs in any year; and (3) the maximum value of performance units granted to a participant during any year may not exceed $10,000,000.
We will consider the award of long-term incentives under the Omnibus Incentive Plan on an ongoing basis to certain key associates, including our NEOs, in order to recognize outstanding performance, enhance retention, assumption of additional responsibilities or otherwise as the Compensation Committee may determine is in our best interest.
Retirement Benefits
Associates, including the NEOs, are generally eligible to participate in the ServiceMaster Profit Sharing and Retirement Plan, as amended and restated, as it may be further amended from time to time, or the "PSRP." The PSRP is a tax qualified 401(k) defined contribution plan under which we may make discretionary matching contributions. Historically, we have provided for a matching contribution in the PSRP where associates receive a dollar for dollar match on the first 1 percent of their contributions, and then a $0.50 per dollar match on the next 2 percent to 6 percent contributed.
We also maintain the ServiceMaster Deferred Compensation Plan, as amended and restated, as it may be further amended from time to time, or the "DCP," which is a non-qualified deferred compensation plan designed to afford certain highly compensated associates (including the NEOs, executive officers and certain other associates) the opportunity to defer additional amounts of compensation on a pre-tax basis. All deferred amounts under the DCP are subject to earnings or losses based on the investments selected by the individual participants. We believe that provision of the DCP is an important recruitment and retention tool. Many, if not all, of the companies with which we compete for executive talent provide a similar plan to their senior employees and the cost to us of providing this benefit is minimal. Under the DCP, participants may be provided with discretionary matching contributions, but since 2007 we have not elected to do so. No earnings in the DCP are credited at above market levels.
129
Employee Benefits and Executive Perquisites
We offer a variety of health and welfare programs to all eligible associates, including the NEOs. The NEOs are eligible for the same health and welfare benefit programs on the same basis as the rest of our associates, including medical and dental care coverage, life insurance coverage and short and long-term disability.
We limit the use of perquisites as a method of compensation and provide executive officers with only those perquisites that we believe are reasonable and consistent with our compensation goal of enabling us to attract and retain superior executives for key positions. The perquisites provided to our NEOs are memberships in social and professional clubs. Expenses associated with relocation of newly hired executives (including income tax gross ups on taxable relocation expense reimbursements) are paid to certain executives pursuant to our relocation policy and are based on standard market practices for executive level relocations.
Mr. Gillette is also provided with personal use of our aircraft and certain spousal travel as described in his employment agreement. The personal use of the company aircraft benefit in Mr. Gillette's employment agreement provides that we will bear the full cost of up to 100 flight hours of the executive's personal use of our aircraft per calendar year, including the cost of landing fees, but excluding any taxes imputed to the executive.
Our aircraft policy provides that the CEO shall reimburse us for personal use of the company aircraft exceeding 100 hours annually. Any amount so reimbursed to us would be applied to reduce the executive's taxable income arising from the personal use. If our CEO utilizes our aircraft for commuting purposes, the amount applied toward his annual commuting benefit is generally calculated under the income imputation rules established by the IRS for personal use of company aircraft. These rules require the cost of each flight to be estimated by applying published IRS per mile rates based on the size of the aircraft to the total miles flown. This method of calculation was affirmed by the Compensation Committee.
Employment Arrangements
We or an affiliate generally provides an executive with an offer letter prior to the time an executive joins the Company. The offer letter generally describes the basic terms of the executive's employment, including his or her start date, starting salary, ABP bonus target, special bonuses (if any), relocation benefits, severance benefits (if any), sign-on bonus (if any) and equity awards granted in connection with the commencement of his or her employment. The terms of the executive's employment are thereafter based on sustained good performance rather than contractual terms, and our policies will apply as warranted. During 2013, we and Ms. Hunsberger executed an offer letter memorializing the terms of her offer of employment.
Under certain circumstances, we recognize that special arrangements with respect to an executive's employment may be necessary or desirable. In 2013, we entered into an employment agreement with Mr. Gillette setting forth the terms of his employment as our CEO and we entered into severance agreements and/or offer letters with Messrs. Haughie and Derwin setting forth certain severance benefits to be received by Messrs. Haughie and Derwin upon a qualifying termination of employment. Please see the narrative following the table in "—Grants of Plan Based Awards (2014)" and the "—Potential Payments Upon Termination or Change in Control" section for a description of the agreements with Messrs. Gillette, Haughie and Derwin.
Post Termination Compensation
Mr. Barry and Ms. Hunsberger are covered under our standard severance policy or practice as in effect at the time employment is terminated. The standard severance policy and the terms of the post
130
termination arrangements between us and the other NEOs are described in detail below under the "—Potential Payments Upon Termination or Change in Control" section.
Employee Stock Purchase Plan
Our board of directors intends to adopt an Employee Stock Purchase Plan, or the "ESPP," that will be intended to qualify for favorable tax treatment under Sections 421 and 423 of the Code. 1,000,000 shares of our common stock will be available for issuance under the ESPP. Under the ESPP, eligible associates (generally associates working more than 20 hours a week as of the beginning of the offering period) may purchase common stock, subject to IRS limits, during pre-specified offering periods at a discount established by the Compensation Committee not to exceed 10% of the fair market value of the common stock at the end of the offering period. No decision has been made to date as to when offering periods shall commence under the ESPP, although the first offering period would not commence earlier than the day on which this offering is completed. If, after its adoption, the ESPP were to commence one or more offering periods, our executive officers would participate in the ESPP on the same terms and conditions as all other participating employees. Our board of directors intends to present the ESPP to shareholders for approval at the 2015 annual shareholders meeting.
Summary Compensation Table
Name and Principal Position
|
Year | Salary ($) |
Bonus ($) |
Stock Awards ($)(1) |
Option Awards ($)(2) |
Non-Equity Incentive Plan Compensation ($)(3) |
All Other Compensation ($)(4) |
Total ($) |
|||||||||||||||||
|---|---|---|---|---|---|---|---|---|---|---|---|---|---|---|---|---|---|---|---|---|---|---|---|---|---|
Robert J. Gillette |
2014 | 1,100,000 | 0 | 0 | 4,083,750 | TBD | 87,617 | 5,271,367 | |||||||||||||||||
Chief Executive Officer |
2013 | 592,308 | (5) | 1,596,712 | 3,000,000 | 4,087,875 | 12,623 | 108,945 | 9,398,463 | ||||||||||||||||
Alan J. M. Haughie |
2014 | 550,000 | 0 | 0 | 0 | TBD | 87,223 | 637,223 | |||||||||||||||||
Senior Vice President and Chief Financial Officer |
2013 | 140,417 | (5) | 600,000 | 750,000 | 998,899 | 0 | 112,919 | 2,602,235 | ||||||||||||||||
Mark J. Barry |
2014 | 464,583 | 0 | 1,100,011 | 1,347,502 | TBD | 9,346 | 2,921,442 | |||||||||||||||||
Group President, American Home |
2013 | 436,250 | 416,660 | 197,560 | 361,112 | 9,260 | 1,420,842 | ||||||||||||||||||
Shield & Franchise Services Group |
2012 | 156,424 | 338,148 | 750,000 | 950,657 | 72,327 | 22,358 | 2,289,914 | |||||||||||||||||
Susan K. Hunsberger |
2014 | 425,000 | 225,000 | (6) | 525,000 | 871,200 | TBD | 144,047 | 2,190,247 | ||||||||||||||||
Senior Vice President, Human Resources |
|||||||||||||||||||||||||
William J. Derwin |
2014 | 493,750 | 0 | 0 | 0 | TBD | 546,492 | 1,040,242 | |||||||||||||||||
President, Terminix |
2013 | 68,371 | (5) | 250,000 | 525,000 | 2,180,118 | 0 | 0 | 3,023,489 | ||||||||||||||||
- (1)
- The
amounts in this column reflect the aggregate grant date fair value of RSUs awarded. The assumptions used in the valuation of RSU awards issued in 2012
and 2013 are disclosed in the Stock-Based Compensation footnote in the audited financial statements for the fiscal year ended December 31, 2013 included in this prospectus. The RSU awards
issued in 2014 to NEOs were valued based on the weighted-average grant-date fair value of $18.13 per unit which was equivalent to the then current fair value of common stock at the grant date.
- (2)
- The
amounts in this column reflect the aggregate grant date fair value of stock options awarded. The assumptions used in the valuation of option awards
issued in 2012 and 2013 are disclosed in the Stock-Based Compensation footnote in the audited financial statements for the fiscal year ended December 31, 2013 included in this prospectus. The
option awards issued in 2014 were valued using the Black-Scholes option valuation model that incorporates the following assumptions: expected volatility—49.6%, expected dividend
yield—0.0%, expected life (in years)—6.3, and risk-free interest rate—1.86%. The weighted-average grant-date fair value of options granted to NEOs during 2014 was
$6.34 per unit.
- (3)
- Annual
bonuses for 2014 have not yet been determined. The 2014 bonuses for our executive officers are not yet calculable and are expected to be determined
in February 2015 after completion of the fiscal 2014 audit when Adjusted Operating Performance, Revenue, Cash Flow figures and other individual performance criteria are finalized and approved by the
Compensation Committee.
- (4)
- Amounts
in this column for 2014 are detailed in the All Other Compensation (2014) table below.
- (5)
- The
salary figure reflects the actual partial-year salary paid during 2013 from Messers. Gillette's, Haughie's and Derwin's respective hiring dates of
June 17, 2013, September 16, 2013 and November 11, 2013 through the end of the year.
- (6)
- The amount in the Bonus column for Ms. Hunsberger represents her sign-on bonus of $225,000 paid pursuant to her offer letter.
131
All Other Compensation (2014)
Named Executive Officer
|
Perquisites and Other Personal Benefits ($) |
Company Paid Life Insurance Premiums ($) |
Company Contributions to PSRP ($)(1) |
Tax Payment(s) ($)(2) |
Total ($) |
|||||||||||
|---|---|---|---|---|---|---|---|---|---|---|---|---|---|---|---|---|
Robert J. Gillette |
78,181 | (3)(4) | 336 | 9,100 | 0 | 87,617 | ||||||||||
Alan J. M. Haughie |
77,787 | (5) | 336 | 9,100 | 0 | 87,223 | ||||||||||
Mark J. Barry |
0 | 336 | 9,100 | 0 | 9,436 | |||||||||||
Susan K. Hunsberger |
120,182 | (5) | 336 | 0 | 23,529 | 144,047 | ||||||||||
William J. Derwin |
500,535 | (5) | 336 | 8,792 | 36,829 | 546,492 | ||||||||||
- (1)
- The
PSRP is our tax-qualified retirement savings plan.
- (2)
- Tax
payments related to relocation expenses were paid to Ms. Hunsberger and Mr. Derwin.
- (3)
- Mr. Gillette's
perquisites include personal use of the corporate aircraft ($61,631); Company-provided membership fees ($1,550) for business and
social dining club, and Company-provided auto allowance ($15,000).
- (4)
- The
incremental cost of the use of our aircraft included in the table above is calculated based on the variable operating costs to us, including fuel costs,
mileage, trip-related maintenance, universal weather monitoring costs, on-board catering, lamp/ramp fees and other miscellaneous variable costs based on occupied seat hours. Fixed costs, which do not
change based on usage, such as pilot salaries, depreciation and the cost of maintenance not related to trips are excluded. The compensation for personal use of our aircraft calculated based on the
variable operating costs incurred is typically greater than the amount calculated under the income imputation rules established by the IRS for personal use of company aircraft. The aggregate cost of
other perquisites and personal benefits is measured on the basis of the actual cost to us.
- (5)
- The amount listed reflects Company-paid relocation expenses.
Grants of Plan Based Awards (2014)
The amounts listed in the table below in the column entitled Estimated Future Payouts Under Non-Equity Incentive Plan Awards represent the potential 2014 earnings under the ABP, which is a non-equity incentive plan. The threshold amount is the minimum earned amount if threshold performance is attained for all performance measures. There is no maximum under the plan in effect in
132
2014. Additional information is discussed in "—Compensation Discussion and Analysis—Annual Bonus Plan" above.
| |
|
|
Estimated Future Payouts Under Non-Equity Incentive Plan Awards | All Other Stock Awards: Number of Shares of Stock (#) | All Other Option Awards: Number of Securities Underlying Options (#) | |
|
||||||||||||||||||||
|---|---|---|---|---|---|---|---|---|---|---|---|---|---|---|---|---|---|---|---|---|---|---|---|---|---|---|---|
| |
|
|
Exercise or Base Price of Option Awards ($/Sh) | Grant Date Fair Value of Stock and Option Awards(7) | |||||||||||||||||||||||
Named Executive Officer
|
Grant Date | Approval Date | Threshold ($) | Target ($) | Maximum ($) | ||||||||||||||||||||||
Robert J. Gillette |
N/A | N/A | $ | 423,155 | 1,100,000 | None | |||||||||||||||||||||
|
3/18/2014 | 3/18/2014 | 687,500 | (1) | $ | 12.00 | 4,083,750 | ||||||||||||||||||||
Alan J. M. Haughie |
N/A | N/A | $ | 148,104 | 385,000 | None | |||||||||||||||||||||
Mark J. Barry |
N/A | N/A | $ | 212,009 | 306,052 | None | |||||||||||||||||||||
|
3/18/2014 | 3/18/2014 | 66,666 | (2) | $ | 12.00 | 247,500 | ||||||||||||||||||||
|
10/31/2014 | 10/29/2014 | 45,872 | (3) | 1,100,011 | ||||||||||||||||||||||
|
10/31/2014 | 10/29/2014 | 92,670 | (4) | $ | 23.98 | 1,100,002 | ||||||||||||||||||||
Susan K. Hunsberger |
N/A | N/A | $ | 98,095 | 255,000 | None | |||||||||||||||||||||
|
1/2/2014 | 1/2/2014 | 43,750 | (5) | 525,000 | ||||||||||||||||||||||
|
3/18/2014 | 3/18/2014 | 146,666 | (6) | $ | 12.00 | 871,196 | ||||||||||||||||||||
William J. Derwin |
N/A | N/A | $ | 186,460 | 325,000 | None | |||||||||||||||||||||
- (1)
- Represents
the number of stock options granted in conjunction with the purchase of shares by Mr. Gillette in 2014 pursuant to the terms of his
employment agreement. Mr. Gillette purchased 125,000 shares on March 18, 2014 and received matching stock options equal to five and one-half times the number of shares purchased,
resulting in a stock option grant of 687,500 stock options.
- (2)
- Represents
the number of stock options granted in conjunction with the purchase of shares by Mr. Barry. The Compensation Committee approved the
additional investment to provide an opportunity similar to that of other more recently hired executive officers. Mr. Barry purchased 16,666 shares on March 18, 2014 and received matching
stock options equal to four times the number of shares purchased, resulting in a stock option grant of 66,666 stock options. These options require the attainment of specified stock prices to vest: 50%
of the options vest upon a Company stock price of $24 and the remaining 50% of the options vest upon a stock price of $36. The first 50% of the options vested on August 26, 2014.
- (3)
- Represents
the number of restricted stock units awarded to Mr. Barry to recognize his additional responsibilities leading the Franchise Services
Group, as well as American Home Shield.
- (4)
- Represents
the number of stock options awarded to Mr. Barry to recognize his additional responsibilities leading the Franchise Services Group, as
well as American Home Shield.
- (5)
- Represents
the RSU award granted as a component of Ms. Hunsberger's new hire offer. These units will vest at a rate of one-third per year on each of
the first three anniversaries of the grant date.
- (6)
- Represents
the number of stock options granted in conjunction with the purchase of shares by Ms. Hunsberger's at a rate of four stock options for
each share purchased. These options will become exercisable based on the passage of time and continued employment with one-fourth becoming exercisable on each anniversary following the grant date.
- (7)
- The amounts in this column reflect the aggregate grant date fair value of options and RSUs awarded. The assumptions used in the valuation of options and RSU awards issued in 2012 and 2013 are disclosed in the Stock-Based Compensation footnote in the audited financial statements for the fiscal year ended December 31, 2013 included in this prospectus. The option awards issued in 2014 were valued using the Black-Scholes option valuation model that incorporates the following assumptions: expected volatility—49.6%, expected dividend yield—0.0%, expected life (in years)—6.3, and risk-free interest rate 1.86%. The weighted-average grant-date fair value of options granted to NEOs during 2014 was $6.34 per unit. The RSU awards issued in 2014 to NEOs were valued based on the weighted average grant date fair value of $18.13 per unit which was equivalent to the then current fair value of common stock at the grant date.
Employment Arrangements
Employment Agreement with Mr. Gillette
On June 17, 2013, we announced that Robert J. Gillette had been elected to serve as our CEO pursuant to an employment agreement with us. Mr. Gillette's employment agreement is for a term of three years subject to automatic one year renewals thereafter, absent termination notice by either party. Under his employment agreement, Mr. Gillette received an initial annual base salary of $1.1 million, and a target annual incentive bonus opportunity of 100 percent of his base salary. Additionally, for the 2013 performance year, Mr. Gillette was guaranteed a minimum annual bonus of not less than his target bonus prorated for the portion of the year after he began his employment. This minimum bonus payable to Mr. Gillette for 2013 performance was $596,712. Mr. Gillette also received a sign-on bonus of $1 million.
133
Mr. Gillette's employment agreement also entitles him to an automobile allowance of $15,000 per year and personal use of the company aircraft for up to 100 flight hours (50 for 2013). Mr. Gillette's employment agreement also provides for severance benefits as described below under "—Potential Payments Upon Termination or Change in Control." A failure by us to renew the agreement will constitute a termination of Mr. Gillette's employment without cause for purposes of his severance benefits.
As noted in "—Compensation Discussion and Analysis," in connection with his commencement of employment, Mr. Gillette purchased $1.5 million of our common stock at a price of $15 per share. In connection with his initial investment, Mr. Gillette has been awarded RSUs and nonqualified stock options under the MSIP. He has received 200,000 RSUs, and these RSUs will vest at a rate of one third per year on each of the first three anniversaries of their grant dates. Additionally, for each share of common stock he purchased, he received five and one half Matching Options with an exercise price equal to the fair market value of a share of common stock at the time of the option grant. Mr. Gillette's Matching Options vest at a rate of one fourth per year on each of the first four anniversaries of the grant date. Based on Mr. Gillette's initial equity investment, he acquired 100,000 shares of our common stock and was granted 721,875 Matching Options.
Pursuant to the terms of his employment agreement, Mr. Gillette made a second investment of $1,500,000 in our common stock and was granted Matching Options at a rate of five and one half options per share purchased. Based on Mr. Gillette's investment, he acquired 125,000 shares of our common stock and was granted 687,500 Matching Options.
Should Mr. Gillette's employment terminate for cause, all vested and unvested options will be canceled, along with all unvested RSUs. In the case of Mr. Gillette's termination other than for cause and other than by reason of his death or disability, unvested options and RSUs will be canceled. Upon termination by reason of death or disability, Mr. Gillette's unvested Matching Options will fully vest. In addition, if the death or disability occurs prior to his RSUs having fully vested, a pro rata portion of the RSUs that would have vested in the year of termination will vest. Mr. Gillette or his estate will retain the right to exercise any vested options for up to 12 months following termination for death, disability, or retirement, and for three months following termination for all other reasons (except for termination for cause). Under the award agreements, if Mr. Gillette's employment is terminated by us without cause or Mr. Gillette resigns with good reason, in either case, when we are party to an agreement that, if consummated, would result in a change in control or such termination was otherwise connected to such an agreement, and in each case such change in control is consummated, Mr. Gillette will receive a cash payment equal to the value of his forfeited awards.
Compensation Arrangement for Ms. Hunsberger
At the time Ms. Hunsberger was hired, we provided her with an offer letter that set forth her initial base salary and initial annual target bonus opportunity under our ABP, with the actual payouts under the ABP subject to the satisfaction of performance targets established by the Compensation Committee each year. Base salary, target annual bonus and all other compensation are subject to approval each year by the Compensation Committee. The offer letter provided that she would be offered a grant of stock options in connection with her purchase of our common stock. Ms. Hunsberger received such grant of options in 2014 of 146,666 stock options. Ms. Hunsberger also received 43,750 RSUs as a part of her offer of employment. Additionally, a cash sign-on bonus of $225,000 was paid to Ms. Hunsberger.
Equity Awards
As noted in the Compensation Discussion and Analysis, during 2014, Messrs. Gillette and Barry and Ms. Hunsberger received Matching Options in connection with their respective purchases of shares
134
of our common stock. Additionally, Mr. Barry received RSUs and stock options to recognize the expanded scope of his responsibilities assuming the leadership of the Franchise Services Group in addition to his leadership of American Home Shield. All stock options and RSUs currently held by the NEOs are shown in the table in "—Outstanding Equity Awards at Fiscal Year End (2014)" below.
The MSIP or Omnibus Incentive Plan and an employee stock option agreement govern each option award and provide, among other things, that the options vest in equal annual installments over a period of four years from the date of grant, subject to continued employment through each applicable vesting date. The Matching Options granted to Mr. Barry in March 2014 related to his investment opportunity vest based on the attainment of specific stock prices. Fifty percent (50%) of the options will vest upon the attainment of a stock price of $24. Fifty percent (50%) will vest upon the attainment of a stock price of $36. The first fifty percent (50%) vested on August 26, 2014, when the stock price of our common stock attained $24. Prior to the exercise of an option, the holder has no rights as a stockholder with respect to the shares subject to such option, including voting rights and the right to receive dividends or dividend equivalents. The MSIP or Omnibus Incentive Plan and an RSU award agreement govern each RSU award and provide, among other things, that the RSUs vest in equal annual installments over a period of three years from the date of grant, subject to continued employment through each applicable vesting date. Holders of RSUs have no rights as stockholders, including voting rights. Holders of RSUs are, however, entitled to dividend equivalents if a dividend is declared on our common stock. For more information on the MSIP, see "—Compensation Discussion and Analysis—Long-Term Equity Incentive Plans" above. See "—Potential Payments Upon Termination or Change in Control" below for information regarding the cancellation or acceleration of vesting of stock options and RSUs upon certain terminations of employment or a change in control.
Omnibus Incentive Plan Awards
On October 29, 2014, the Compensation Committee approved awards, effective as of October 31, 2014, under the Omnibus Incentive Plan for Mr. Barry in the form of 92,670 stock options and 45,872 RSUs to recognize his assumption of the leadership of the Franchise Services Group.
135
Outstanding Equity Awards at Fiscal Year End (2014)
| |
|
Option Awards | Stock Awards | ||||||||||||||||||||
|---|---|---|---|---|---|---|---|---|---|---|---|---|---|---|---|---|---|---|---|---|---|---|---|
Named Executive Officer
|
Grant Date | Number of Securities Underlying Unexercised Options (#) Exercisable (1) |
Number of Securities Underlying Unexercised Options (#) Unexercisable (1) |
Equity Incentive Plan Awards: Number of Securities Underlying Unexercised Unearned Options (#) |
Option Exercise Price ($) |
Option Expiration Date | Number of Units of Stock That Have Not Vested (#)(2) |
Market Value of Units of Stock That Have Not Vested ($)(3) |
|||||||||||||||
Robert J. Gillette |
9/13/2013 | 180,469 | 541,406 | $ | 11.43 | 9/13/2023 | 175,000 | 4,684,750 | |||||||||||||||
|
3/18/2014 | 0 | 687,500 | $ | 12.00 | 3/18/2024 | |||||||||||||||||
Alan J. Haughie |
9/16/2013 | 0 | 43,750 | 1,171,188 | |||||||||||||||||||
|
12/11/2013 | 42,000 | 126,000 | $ | 12.00 | 12/11/2023 | |||||||||||||||||
Mark J. Barry |
8/20/2012 | 0 | 14,583 | 390,387 | |||||||||||||||||||
|
9/28/2012 | 58,333 | 58,332 | $ | 17.15 | 9/28/2022 | |||||||||||||||||
|
8/28/2013 | 8,750 | 26,250 | $ | 11.43 | 8/28/2023 | 9,722 | 260,258 | |||||||||||||||
|
3/18/2014 | 33,333 | 33,333 | $ | 12.00 | 3/18/2024 | |||||||||||||||||
|
10/31/2014 | 0 | 92,670 | $ | 23.98 | 10/31/2024 | |||||||||||||||||
|
10/31/2014 | 0 | 45,872 | 1,227,993 | |||||||||||||||||||
Susan K. Hunsberger |
1/2/2014 | 0 | 43,750 | 1,171,188 | |||||||||||||||||||
|
3/18/2014 | 0 | 146,666 | $ | 12.00 | 3/18/2024 | |||||||||||||||||
William J. Derwin |
11/11/2013 | 0 | 29,166 | 780,774 | |||||||||||||||||||
|
12/11/2013 | 91,666 | 274,997 | $ | 12.00 | 12/11/2023 | |||||||||||||||||
- (1)
- Represents
options to purchase shares of our common stock granted under the MSIP or Omnibus Incentive Plan. Options become exercisable on the basis of
passage of time and continued employment over a four-year period, with one-fourth becoming exercisable on each anniversary following the grant date. Mr. Barry's stock options awarded on
March 18, 2014 provides for vesting upon the attainment of certain stock prices, with 50% (33,333 options) having vested on August 26, 2014 by reaching a stock price of $24. The
remaining 50% will vest upon the attainment of a stock price of $36.
- (2)
- Represents
RSUs to be settled in our common stock granted under the MSIP or Omnibus Incentive Plan. RSUs become vested and will settle on the basis of
passage of time and continued employment over a three-year period, with one-third becoming vested on each anniversary following the grant date.
- (3)
- Fair market value as of December 31, 2014 of $26.77 per share.
Option Exercises and Stock Vested (2014)
| |
|
|
Stock Awards | ||||||||||
|---|---|---|---|---|---|---|---|---|---|---|---|---|---|
| |
Option Awards | ||||||||||||
| |
Number of Shares Acquired on Vesting (#)(1) | |
|||||||||||
Named Executive Officer
|
Number of Shares Acquired on Exercise (#) | Value Realized on Exercise ($) | Value Realized on Vesting ($) | ||||||||||
Robert J. Gillette |
0 | 0 | 87,500 | 2,142,000 | |||||||||
Alan J. M. Haughie |
0 | 0 | 21,875 | 523,469 | |||||||||
Mark J. Barry |
0 | 0 | 19,445 | 449,327 | |||||||||
Susan K. Hunsberger |
0 | 0 | 0 | 0 | |||||||||
William J. Derwin |
0 | 0 | 14,584 | 375,976 | |||||||||
- (1)
- Reflects the vesting of RSUs in 2014. Mr. Gillette remitted cash funds to satisfy tax obligations. Messrs. Haughie, Barry and Derwin elected to surrender a portion of the shares that settled upon vesting of the RSUs to satisfy tax withholding obligations, resulting in net shares of 15,893, 14,128 and 10,596, respectively.
136
Nonqualified Deferred Compensation Plans
No NEOs participated in the Deferred Compensation Plan, or "DCP," during 2014 and none have any balance in the DCP from any prior year.
Deferred Compensation Programs
The DCP is a nonqualified deferred compensation plan designed to afford certain highly compensated associates the opportunity to defer not less than 2 percent and not more than 75 percent of their compensation on a pre tax basis. Deferred amounts are credited with earnings or losses based on the rate of return of investments selected by the participants in the DCP. The plan provides for a range of mutual fund investments identical to our 401(k) plan. We, in our sole discretion, may make matching contributions, based on the amounts that are deferred by associates pursuant to the DCP. We did not make matching contributions for 2014. Distributions are paid at the time elected by the participant in accordance with the DCP.
The DCP is not currently funded by us, and participants have an unsecured contractual commitment from us to pay the amounts due under the DCP. All plan assets are held in a rabbi trust and are considered general assets of ours. When such payments are due, the cash will be distributed from the DCP's trust.
Potential Payments Upon Termination or Change in Control
Severance Benefits for NEOs
Unless modified by separate agreement, upon a termination by us for cause, by the executive without good reason, or upon death or disability, we have no obligation to pay any prospective amounts or provide any benefits to our NEOs. Our obligations will consist of those obligations accrued at the date of termination, including payment of earned salary, vacation, reimbursement of expenses and obligations that may otherwise be payable in the event of death or disability. For this purpose, "cause" means a material breach by the executive of the duties and responsibilities of the executive (other than as a result of incapacity due to physical or mental illness) that is demonstrably willful and deliberate on the executive's part, committed in bad faith or without reasonable belief that such breach is in our best interests and not remedied in a reasonable period of time after receipt of written notice from us specifying such breach; or the commission by the executive of a felony or misdemeanor involving any act of fraud, embezzlement or dishonesty or any other intentional misconduct by the executive that materially and adversely affects our business affairs or reputation. The NEOs' agreements described below also include in the definition of "cause": any failure by the executive to cooperate with any investigation or inquiry into the executive's business practices, whether internal or external, including, but not limited to, the executive's refusal to be deposed or to provide testimony at any trial or inquiry.
Upon each executive's retirement, death or disability, we will pay to the executive (or his executors or legal representatives, to the extent applicable) the annual bonus earned for the fiscal year immediately preceding the date of termination to the extent not previously paid; plus if the date of termination is after June 30 of a fiscal year, a prorated bonus through his date of termination (determined based on the target bonus, in the event of retirement or death, or actual accomplishment, in the event of disability).
Mr. Gillette
Mr. Gillette's employment agreement provides that if we were to terminate Mr. Gillette's employment without cause, or Mr. Gillette terminates his employment for good reason, he would receive: (1) continued payment of his monthly base salary for 24 months following the date of termination; (2) reimbursement of COBRA premiums paid by him for 18 months following the date of
137
termination (and reimbursement of COBRA premiums for up to an additional 6 months following the end of the original 18 month period to the extent that Mr. Gillette and his dependents have not obtained coverage from a subsequent employer); (3) the annual bonus earned for the fiscal year immediately preceding the date of termination to the extent not previously paid; (4) a prorated bonus through his date of termination; and (5) an amount equal to two times his average annual bonus paid or payable to Mr. Gillette with respect to the two fiscal years immediately preceding the date of termination or, if Mr. Gillette has not received an annual bonus for either or both of those fiscal years immediately preceding the date of termination, such average to be calculated using his target annual bonus for such year or years, as applicable. Payments of Mr. Gillette's severance benefits are subject to Mr. Gillette's signing a general release of claims. Mr. Gillette is also subject to covenants not to compete or, solicit for two years following termination and an indefinite covenant not to disclose confidential information. Upon Mr. Gillette's retirement, death or disability, we shall pay to Mr. Gillette (or his executors or legal representatives) the annual bonus earned for the fiscal year immediately preceding the date of termination to the extent not previously paid, plus a prorated bonus through his date of termination.
Messrs. Haughie and Derwin
We entered into a severance agreement with each of Messrs. Haughie and Derwin upon their respective hires that provides that if we were to terminate Mr. Haughie's or Mr. Derwin's employment without cause, or if such executive were to terminate his employment for good reason, he would receive: (1) continued payment of monthly base salary for 12 months following the date of termination; (2) an amount equal to the executive's then current year's annual bonus at target; (3) if the date of termination is after June 30 of a fiscal year, a prorated bonus through the date of termination; and (4) an amount equal to twelve times the executive's monthly cost for health care continuation coverage for those eligible plans in place immediately prior to termination.
Severance Arrangements with Other NEOs
We have not historically offered severance agreements or change in control agreements to newly hired executive officers; however, the Compensation Committee periodically reassess the need to offer these types of arrangements as part of maintaining competitive executive compensation packages and has included severance agreements for Messrs. Haughie and Derwin, where the agreements were needed to hire the executives. Mr. Barry and Ms. Hunsberger are covered under our standard severance practices and guidelines. As an officer who reports directly to our CEO, he or she is eligible to receive severance if terminated without cause (as defined in "—Potential Payments Upon Termination or Change in Control—Severance Benefits for NEOs"). Under our practice for executive officers as in effect as of December 31, 2014, in the event of such termination, an amount equal to one times base salary plus target bonus for the year of termination is paid out generally in monthly installments over a period of 12 to 18 months, and, if termination occurs after June 30 of a year, a prorated portion of the bonus earned under the ABP, would be payable to the terminated executive at the same time as annual bonuses are paid to other executives for the applicable year, subject to execution of a general release and observing covenants not to compete, solicit, nor disclose confidential information.
MSIP and Omnibus Incentive Plan
If an executive's employment is terminated by us for "cause" (as defined in the MSIP and Omnibus Incentive Plan) all options (vested and unvested) and unvested RSUs are immediately cancelled.
If an executive's employment is terminated by us without "cause" or if the executive voluntarily terminates his employment for any reason, all unvested options and RSUs immediately terminate.
138
Upon such a termination, the executive may exercise vested options before the first to occur of (1) the three month anniversary of the executive's termination of employment, (2) the expiration of the options' normal term, after which date such options are cancelled, or (3) the cancellation of the options in the event of a change in control in exchange for a cash payment.
If an executive's employment terminates by reason of death or disability, all unvested options will vest and all options will remain exercisable until the first to occur of (1) the one year anniversary of the executive's date of termination, (2) the expiration of the options' normal term, after which date such options are cancelled, or (3) the cancellation of the options in the event of a change in control in exchange for a cash payment. RSUs will vest as to the number of RSUs that would have vested on the next anniversary of the grant date (assuming the executive's employment had continued through such anniversary) multiplied by a fraction, the numerator of which is the number of days elapsed since (x) the grant date, if the termination due to death or disability occurs on or prior to the first anniversary of the grant date, or (y) the most recent prior anniversary of the grant date, if the termination due to death or disability occurs after the first anniversary of the grant date, and the denominator of which was 365 for 2014.
The stock option agreements provide that all then outstanding options (whether vested or unvested) will be cancelled in exchange for a cash payment if we experience a "change in control" (as defined in the MSIP and the Omnibus Incentive Plan), unless the board of directors reasonably determines in good faith that options with substantially equivalent or better terms are substituted for the existing options. Upon a change in control occurring prior to the third anniversary of the grant date, all RSUs will become vested.
The initial public offering of our common stock did not constitute a change in control.
The board of directors also has the discretion to accelerate the vesting of options or RSUs at any time and from time to time.
Payment Upon Retirement, Death, Disability, Qualifying Termination, or Change in Control as of December 31, 2014
The following table sets forth information regarding the value of payments and other benefits payable by us to each of the NEOs employed by us as of December 31, 2014 in the event of retirement, death, disability, qualifying termination (a termination which qualifies an NEO for severance payments under his employment agreement or offer letter or our general severance policy) or change in control. Except as otherwise noted below, the amounts shown assume termination or change in control effective as of December 31, 2014 and a fair market value of our common stock on December 31, 2014 of $26.77 per share.
139
Potential Payments Upon Retirement, Death, Disability, Qualifying Termination or Change in Control (2014)
Named Executive Officer
|
Event | Base Salary and Target Bonus ($)(1) |
Payment of Current Year Bonus ($)(2) |
Acceleration of Vesting of Stock Options ($)(3) |
Acceleration of Vesting of RSUs ($)(3) |
Health & Welfare ($) |
Total Payments ($)(4) |
||||||||||||||
|---|---|---|---|---|---|---|---|---|---|---|---|---|---|---|---|---|---|---|---|---|---|
Robert J. Gillette |
Retirement | 0 | TBD | 0 | 0 | 0 | TBD | ||||||||||||||
|
Death | 0 | 1,100,000 | 18,459,543 | 699,500 | 0 | 20,259,043 | ||||||||||||||
|
Disability | 0 | Target | 18,459,543 | 699,500 | 0 | 19,159,043 | ||||||||||||||
|
Qualifying Termination | 4,400,000 | Target | 0 | 0 | 0 | 4,400,000 | ||||||||||||||
|
Change in Control | 0 | 0 | 18,459,543 | 4,684,750 | 0 | 23,144,293 | ||||||||||||||
Alan J.M. Haughie |
Retirement |
0 |
TBD |
0 |
0 |
0 |
TBD |
||||||||||||||
|
Death | 0 | 385,000 | 1,861,020 | 174,888 | 0 | 2,420,908 | ||||||||||||||
|
Disability | 0 | Target | 1,861,020 | 174,888 | 0 | 2,035,908 | ||||||||||||||
|
Qualifying Termination | 935,000 | Target | 0 | 0 | 0 | 935,000 | ||||||||||||||
|
Change in Control | 0 | 0 | 1,861,020 | 1,171,188 | 0 | 3,032,208 | ||||||||||||||
Mark J. Barry |
Retirement |
0 |
TBD |
0 |
0 |
0 |
TBD |
||||||||||||||
|
Death | 0 | 306,052 | 1,714,707 | 255,225 | 0 | 2,275,984 | ||||||||||||||
|
Disability | 0 | Target | 1,714,707 | 255,225 | 0 | 1,969,932 | ||||||||||||||
|
Qualifying Termination | 825,000 | Target | 0 | 0 | 0 | 825,000 | ||||||||||||||
|
Change in Control | 0 | 0 | 1,714,707 | 1,878,638 | 0 | 3,593,345 | ||||||||||||||
Susan K. Hunsberger |
Retirement |
0 |
TBD |
0 |
0 |
0 |
TBD |
||||||||||||||
|
Death | 0 | 255,000 | 2,166,257 | 388,272 | 0 | 2,809,529 | ||||||||||||||
|
Disability | 0 | Target | 2,166,257 | 388,272 | 0 | 2,554,529 | ||||||||||||||
|
Qualifying Termination | 680,000 | Target | 0 | 0 | 0 | 680,000 | ||||||||||||||
|
Change in Control | 0 | 0 | 2,166,257 | 1,171,188 | 0 | 3,337,445 | ||||||||||||||
William J. Derwin |
Retirement |
0 |
TBD |
0 |
0 |
0 |
TBD |
||||||||||||||
|
Death | 0 | 325,000 | 4,061,706 | 53,486 | 0 | 4,440,192 | ||||||||||||||
|
Disability | 0 | Target | 4,061,706 | 53,486 | 0 | 4,115,192 | ||||||||||||||
|
Qualifying Termination | 825,000 | Target | 0 | 0 | 0 | 825,000 | ||||||||||||||
|
Change in Control | 0 | 0 | 4,061,706 | 780,773 | 0 | 4,842,479 | ||||||||||||||
- (1)
- Calculations
are based upon the terms previously discussed under "—Potential Payments Upon Termination or Change of
Control—Severance Benefits for NEOs."
- (2)
- Because
termination is assumed to occur on the last day of the performance period for the 2014 ABP, no amounts are shown for Retirement, Disability and
Qualifying Termination as the annual bonus for 2014 has not yet been determined. The amounts are payable upon an involuntary termination without cause (and for Messrs. Gillette, Haughie and
Derwin upon voluntary termination for good reason). The amounts shown for Death reflect ABP payments at the NEO's target award percentage.
- (3)
- As
noted above in the sections entitled MSIP and Omnibus Incentive Plan, upon a change in control, death or disability, all or portions of unvested stock
options and RSUs become vested and exercisable. The values in the table were based on a value of $26.77 per share at December 31, 2014, and option exercise prices of $11.43, 12.00, $17.15 and
$23.98, as applicable.
- (4)
- The Total Payments column does not include any payments for the 2014 Annual Bonus for Disability and Qualifying Termination as that number has not yet been determined.
Compensation Risk Assessment
Our Compensation Committee assessed the risks associated with our compensation and practices to evaluate whether they create risks that are likely to have a material adverse effect on us. Based on its assessment, the Compensation Committee concluded that our compensation policies and practices
140
do not create incentives to take risks that are likely to have a material adverse effect on us. We believe we have allocated our compensation among base salary, short-term incentives and long-term equity in such a way as to not encourage excessive risk taking.
Director Compensation
Cash and Equity Retainers
During 2014, members of the board of directors who were not employed by us were entitled to receive an annual retainer of $120,000, 50 percent of which was payable in cash and the other 50 percent of which was payable in restricted stock vesting on the day immediately preceding the first anniversary following the grant date, subject to continued service on the board of directors. The restricted stock becomes fully vested on a change in control (as defined in the MSIP and Omnibus Incentive Plan) or on a termination of the director's services due to death or Disability (as defined in the MSIP and Omnibus Incentive Plan). Directors were given the ability to defer receipt of their cash retainers under our DCP (see "—Nonqualified Deferred Compensation Plans"). Any independent chairperson of the Audit Committee received an additional annual cash retainer of $10,000. The chairpersons of the Compensation Committee and the Nominating and Corporate Governance Committee each received an additional annual cash retainer of $5,000. One-fourth of the annual cash retainer was paid at the end of each quarter, provided the director served as a director in such fiscal quarter. Each of our directors who is employed by or affiliated with the CD&R Funds or the StepStone Funds assigned all of the compensation the director received for his or her services as a director to the fund he or she is affiliated with or its affiliates. All of our directors were reimbursed for reasonable expenses incurred in connection with attending board of directors meetings and committee meetings.
2014 Director Compensation Table
This table shows the compensation that each non-employee director received for his or her board and committee chair service. Amounts reflect partial year board service for Mr. Fox. Payments to directors whose employers were primary equity sponsors of the company, including Messrs, Friedman, Krenicki and Wasserman and Ms. Kim, have been compensated for the portion of the year following the close of our initial public offering on July 1, 2014.
Name of Director
|
Cash Fees(1) | Stock Awards(2) | Total | |||||||
|---|---|---|---|---|---|---|---|---|---|---|
Richard P. Fox |
$ | 52,500 | $ | 60,000 | $ | 112,500 | ||||
Darren M. Friedman |
$ | 30,000 | $ | 29,990 | $ | 59,990 | (3) | |||
Sarah Kim |
$ | 30,000 | $ | 29,990 | $ | 59,990 | (4) | |||
John Krenicki, Jr. |
$ | 32,500 | $ | 29,990 | $ | 62,490 | (4) | |||
Stephen J. Sedita |
$ | 60,000 | $ | 60,000 | $ | 120,000 | ||||
David H. Wasserman |
$ | 32,500 | $ | 29,990 | $ | 62,490 | (4) | |||
- (1)
- Total
of cash fees paid for annual Board retainer and Committee Chair retainer. The cash amounts for Messrs. Friedman, Krenicki and Wasserman and
Ms. Kim were prorated for 50% of the year, providing cash compensation for the third and fourth quarters of 2014, following the closing of our initial public offering on July 1, 2014.
- (2)
- The amounts in this column reflect the grant date fair value of restricted stock awarded for annual Board retainer. The restricted stock awards were valued based on the grant date fair value of $12.00 per share for Messrs. Fox and Sedita and $20.74 for Ms. Kim and Messrs. Krenicki, Friedman and Wasserman, which was equivalent to the then current fair value of common stock at the grant date. The amounts for Messrs. Friedman, Krenicki and Wasserman and Ms. Kim were prorated for 50% of the year, providing a
141
restricted stock award equal to 50% of the annual retainer award, following the closing of our initial public offering on July 1, 2014.
- (3)
- Mr. Friedman
assigned both his cash and stock retainers to his employer, StepStone Group LP.
- (4)
- Ms. Kim and Messrs. Krenicki and Wasserman assigned their cash and stock retainers to their employer, Clayton, Dubilier & Rice Holdings LP.
Beginning January 1, 2015, members of the board of directors who are not employed by us are entitled to receive an annual retainer of $170,000, $70,000 of which will be payable in cash and the other $100,000 payable in restricted stock as of the date of the annual shareholders' meeting and vesting on the earlier of the next annual shareholders' meeting or the first anniversary following the grant date, subject to continued service on the board of directors. The restricted stock becomes fully vested on a change in control (as defined in the Omnibus Incentive Plan) or on a termination of the director's services due to death or Disability (as defined in the Omnibus Incentive Plan). In addition, any independent chairperson of the Audit Committee will receive an additional annual cash retainer of $15,000. The chairpersons of the Compensation Committee and the Nominating and Corporate Governance Committee will each receive an additional annual cash retainer of $10,000.
Equity Compensation Plan Information
The following table contains information, as of December 31, 2014, about the amount of our common shares to be issued upon the exercise of outstanding options and RSUs granted under the MSIP and Omnibus Incentive Plan.
Plan Category
|
Number of Securities to be Issued Upon Exercise of Outstanding Options, Warrants and Rights(1) |
Weighted Average Exercise Price of Outstanding Options |
Number of Securities Remaining Available for Future Issuance Under Equity Compensation Plans (excluding securities reflected in first column) |
|||||||
|---|---|---|---|---|---|---|---|---|---|---|
Equity compensation plans approved by shareholders |
5,037,605 | $ | 12.27 | 7,958,390 | ||||||
Equity compensation plans not approved by shareholders |
— | — | — | |||||||
Total |
5,037,605 | $ | 12.27 | 7,958,390 | ||||||
- (1)
- The figures in this column reflect 4,604,099 stock options and 433,506 RSUs granted to officers pursuant to the MSIP and Omnibus Incentive Plan. For a description of the MSIP and Omnibus Incentive Plan, please refer to "—Compensation Discussion and Analysis."
142
CERTAIN RELATIONSHIPS AND RELATED PARTY TRANSACTIONS
Policies and Procedures for Related Person Transactions
Our board of directors has approved policies and procedures with respect to the review and approval of certain transactions between us and a "Related Person," or a "Related Person Transaction," which we refer to as our "Related Person Transaction Policy." Pursuant to the terms of the Related Person Transaction Policy, the board of directors must review and decide whether to approve or ratify any Related Person Transaction. Any Related Person Transaction is required to be reported to our legal department and the legal department will then determine whether it should be submitted to our Audit Committee for consideration.
For the purposes of the Related Person Transaction Policy, a "Related Person Transaction" is a transaction, arrangement or relationship (or any series of similar transactions, arrangements or relationships) in which we (including any of our subsidiaries) were, are or will be a participant and the amount involved exceeds $120,000, and in which any Related Person had, has or will have a direct or indirect interest.
A "Related Person," as defined in the Related Person Transaction Policy, means any person who is, or at any time since the beginning of our last fiscal year was, a director or executive officer of ServiceMaster or a nominee to become a director of ServiceMaster; any person who is known to be the beneficial owner of more than five percent of our common stock; any immediate family member of any of the foregoing persons, including any child, stepchild, parent, stepparent, spouse, sibling, mother-in-law, father-in-law, son-in-law, daughter-in-law, brother-in-law, or sister-in-law of the director, executive officer, nominee or more than five percent beneficial owner, and any person (other than a tenant or employee) sharing the household of such director, executive officer, nominee or more than five percent beneficial owner; and any firm, corporation or other entity in which any of the foregoing persons is a general partner or, for other ownership interests, a limited partner or other owner in which such person has a beneficial ownership interest of ten percent or more.
Stockholders Agreement
In connection with our initial public offering, we entered into an amended stockholders agreement with the Equity Sponsors. The amended stockholders agreement granted the CD&R Funds the right to designate for nomination for election a number of CD&R Designees equal to: (i) at least a majority of the total number of directors comprising our board of directors at such time as long as the CD&R Funds own at least 50% of the outstanding shares of our common stock; (ii) at least 40% of the total number of directors comprising our board of directors at such time as long as the CD&R Funds own at least 40% but less than 50% of the outstanding shares of our common stock; (iii) at least 30% of the total number of directors comprising our board of directors at such time as long as the CD&R Funds own at least 30% but less than 40% of the outstanding shares of our common stock; (iv) at least 20% of the total number of directors comprising our board of directors at such time as long as the CD&R Funds own at least 20% but less than 30% of the outstanding shares of our common stock; and (v) at least 5% of the total number of directors comprising our board of directors at such time as long as the CD&R Funds own at least 5% but less than 20% of the outstanding shares of our common stock. For purposes of calculating the number of CD&R Designees that the CD&R Funds are entitled to nominate pursuant to the formula outlined above, any fractional amounts would be rounded to the nearest whole number and the calculation would be made on a pro forma basis after taking into account any increase in the size of our board of directors.
Our amended stockholders agreement also provides that, for as long as the StepStone Funds own 5% or more of the outstanding shares of our common stock, the StepStone Funds have the right to designate one member of our board of directors for nomination for election.
143
Registration Rights Agreement
In connection with our initial public offering, we and the Equity Sponsors holding substantially all of the shares of our common stock entered into the registration rights agreement. The registration rights agreement grants to these Equity Sponsors the right, in the case of the Lead Investor at any time, and in the case of the other Equity Sponsors holding "registrable securities" (as defined in the registration rights agreement) at least 18 months following the initial public offering of our common stock, to cause us, at our own expense, to use our reasonable best efforts to register shares held by the Equity Sponsors for public resale, subject to certain limitations. In the event we register any of our common stock following our initial public offering, these Equity Sponsors also have the right to require us to use our best efforts to include shares of our common stock held by them, subject to certain limitations, including as determined by the underwriters. The registration rights agreement also provides for us to indemnify the Equity Sponsors party to that agreement and their affiliates in connection with the registration of our common stock.
Consulting Agreements
Prior to our initial public offering, we and SvM were parties to a consulting agreement with CD&R under which CD&R provided us with ongoing consulting and management advisory services. The annual consulting fee payable under the consulting agreement with CD&R was $6.25 million. Under this agreement, we recorded consulting fees of $6.25 million in each of the years ended December 31, 2013, 2012 and 2011. The consulting agreement also provided that CD&R could receive additional fees in connection with certain subsequent financing and acquisition or disposition transactions. There were no additional fees incurred in each of the years ended December 31, 2013, 2012 and 2011. As described below, the CD&R consulting agreement was terminated in connection with our initial public offering.
Prior to our initial public offering, we and SvM were parties to consulting agreements with StepStone, JPMorgan and Ridgemont (and formerly with BAS). Effective January 1, 2012, the annual consulting fee formerly payable to BAS (and subsequently payable to Ridgemont) was reduced to $0.25 million. Pursuant to the consulting agreements, we were required to pay annual consulting fees of $0.5 million, $0.25 million and $0.25 million to StepStone, JPMorgan and Ridgemont (formerly payable to BAS), respectively. We recorded aggregate consulting fees related to these agreements of $1 million in each of the years ended December 31, 2013, 2012 and 2011.
In connection with our initial public offering, we entered into termination agreements with CD&R, StepStone, JPMorgan and Ridgemont pursuant to which the parties agreed to terminate the ongoing consulting fees described above. Pursuant to the termination agreements, we paid aggregate termination fees of $21 million ($19 million to CD&R; $1 million to StepStone; and $500,000 to each of JPMorgan and Ridgemont) upon consummation of our initial offering. All subsequent annual consulting fees were terminated. No transaction fee was payable to any Equity Sponsor under the consulting agreements as a result of our initial public offering.
Indemnification Agreements
We and SvM are parties to indemnification agreements with the CD&R Funds and CD&R, StepStone, JPMorgan and Ridgemont (and formerly with BAS), pursuant to which we and SvM indemnify such Equity Sponsors and CD&R, and their respective affiliates, directors, officers, partners, members, employees, agents, representatives and controlling persons, against certain liabilities arising out of performance of the consulting agreements, described above under "—Consulting Agreements" and certain other claims and liabilities, including liabilities arising out of financing arrangements and securities offerings.
144
In connection with our initial public offering, we entered into indemnification agreements with our directors. The indemnification agreements provide our directors with contractual rights to the indemnification and expense advancement rights. See "Description of Capital Stock—Limitations on Liability and Indemnification."
Share Repurchase from BAS
On December 22, 2011, we purchased 5 million shares of our common stock from BAS for an aggregate purchase price of $75 million.
Financing Arrangements with Related Parties
Affiliates of JPMorgan (which is one of the Equity Sponsors) have provided investment banking and commercial banking services to us for which they have received customary fees and commissions. These parties have acted as agents and lenders to us under the Credit Facilities, as an issuing bank under our Revolving Credit Facility and as initial purchasers for the 2020 Notes, for which they received customary fees, commissions, expenses or other compensation. SvM entered into a registration rights agreement with an affiliate of JPMorgan in connection with the issuance of the 2020 Notes.
145
DESCRIPTION OF CERTAIN INDEBTEDNESS
Credit Facilities
In connection with our initial public offering, on July 1, 2014, SvM entered into a credit agreement with respect to the Credit Facilities, with JPMorgan Chase Bank, N.A. as administrative agent, collateral agent and issuing bank, and a syndicate of lenders party thereto from time to time, or the "Credit Agreement." The following is a brief description of the principal terms of the Credit Agreement and the related documents governing the Credit Facilities
Overview
The Credit Facilities consist of the Term Loan Facility, a senior secured term loan facility in an original principal amount of $1,825 million, and the Revolving Credit Facility, which provides for revolving loans up to a maximum aggregate original principal amount of $300 million. A portion of the borrowings under the Revolving Credit Facility is available for the issuance of letters of credit and the issuance of swing line loans. Amounts under the Revolving Credit Facility may be borrowed in certain designated foreign currencies. As of September 30, 2014, we had $1,825 million of outstanding borrowings under the Term Loan Facility and $161 million of available borrowing capacity under the Revolving Credit Facility.
Maturity; prepayments
The maturity date of the Term Loan Facility is July 1, 2021. The Term Loan Facility amortizes in equal quarterly installments equal to 1.0 percent per annum of the original principal amount of the term loans until the maturity date.
Voluntary prepayments of borrowings under the Term Loan Facility are permitted at any time, in minimum principal amounts, without (for prepayments made after January 1, 2015) premium or penalty. Subject to certain exceptions, the Term Loan Facility is subject to mandatory prepayment in an amount equal to:
- •
- the net cash proceeds of (1) certain asset sales, (2) certain debt offerings and (3) certain insurance recovery
and condemnation events; and
- •
- 50% of annual excess cash flow (as defined in the Credit Agreement) for any fiscal year, with a stepdown to 25% or zero if certain secured leverage ratio targets are met.
The final maturity date of the Revolving Credit Facility is July 1, 2019. If at any time the sum of the amount outstanding under the Revolving Credit Facility (including revolving loans, letters of credit outstanding and swing line loans thereunder) exceeds the total amount of lenders' revolving commitments thereunder, prepayments of revolving loans and/or swing line borrowings and cash collateralization of letters of credit will be required in an amount equal to such excess.
Guarantees; security
SvM is the borrower under the Credit Facilities. CDRSVM Holding, LLC, the direct parent of SvM, and each direct and indirect domestic subsidiary of SvM (other than any subsidiary that is a foreign subsidiary holding company, any subsidiary of a foreign subsidiary, an unrestricted subsidiary, any subsidiary below a certain materiality threshold, a receivables financing subsidiary, a subsidiary subject to regulation as an insurance, home warranty, service contract or similar company (or any subsidiary thereof) and certain other specified subsidiaries) guarantee SvM's obligations under the Credit Facilities. The Credit Facilities and the guarantees thereof are secured by substantially all of the tangible and intangible assets of SvM and the guarantors (including pledges of all the capital stock of all direct domestic subsidiaries (other than foreign subsidiary holding companies, which are deemed to
146
be foreign subsidiaries) owned by SvM or any guarantor and of up to 65% of the capital stock of each direct foreign subsidiary owned by SvM or any guarantor), subject to certain exceptions, including but not limited to exceptions for equity interests, indebtedness or other obligations of subsidiaries, real estate or any other assets if the granting of a security interest therein would require that the notes described under "—Continuing Notes" below be secured.
Interest
The interest rates applicable to the term loans under the Term Loan Facility are based on a fluctuating rate of interest (which is subject to a floor) measured by reference to either, at the borrower's option, (i) an adjusted LIBOR plus a margin of 3.25% per annum or (ii) an alternate base rate plus a margin of 2.25% per annum.
The interest rates applicable to the loans under the Revolving Credit Facility are based on a fluctuating rate of interest measured by reference to either, at the borrower's option, (i) an adjusted LIBOR plus a margin of 3.25% per annum or (ii) an alternate base rate plus a margin of 2.25% per annum.
Fees
SvM pays customary fees in respect of the Term Loan Facility and the Revolving Credit Facility, including a commitment fee on the unutilized portion thereof.
Covenants
The Credit Agreement contains a number of negative covenants that, among other things, limit or restrict the ability of SvM and its restricted subsidiaries to:
- •
- incur additional debt (including guarantees of other debt);
- •
- pay dividends or make other restricted payments, including investments;
- •
- make acquisitions;
- •
- prepay or amend the terms of certain outstanding debt;
- •
- create restrictions on the ability of restricted subsidiaries to pay dividends to SvM or make other intercompany transfers;
- •
- enter into certain types of transactions with affiliates;
- •
- sell certain assets, or, in the case of SvM, consolidate, merge, sell or otherwise dispose of all or substantially all of its assets;
- •
- create liens; and
- •
- enter into agreements restricting dividends or other distributions by subsidiaries to SvM.
With respect to the Revolving Credit Facility only, SvM is required to remain below a maximum consolidated net senior secured leverage ratio, tested on a quarterly basis at any time that a certain amount of loans and/or letters of credit is outstanding. The Credit Agreement also contains certain affirmative covenants, including financial and other reporting requirements.
Events of default
The Credit Agreement provides for customary events of default, including non-payment of principal, interest or fees, violation of covenants, material inaccuracy of representations or warranties, specified cross payment default and cross acceleration to other material indebtedness, certain
147
bankruptcy events, certain Employee Retirement Income Security Act of 1974, as amended, or "ERISA," events, material invalidity of guarantees or security interests, material judgments and change of control.
2020 Notes
In February 2012, SvM issued $600 million aggregate principal amount of the 8% 2020 Notes. The 8% 2020 Notes were issued pursuant to an indenture, dated as of February 13, 2012, among SvM, the subsidiary guarantors of the 8% 2020 Notes and Wilmington Trust, National Association as trustee. SvM used $600 million of the proceeds of the sale of the 8% 2020 Notes, together with available cash, to redeem $600 million in aggregate principal amount of its 2015 Notes. The 8% 2012 Notes bear an interest rate of 8% and will mature on February 15, 2020.
In August 2012, SvM issued the 7% 2020 Notes to redeem the remaining $396 million aggregate principal amount of its 2015 Notes and to repay $276 million of outstanding borrowings under its Old Term Facilities during the third quarter of 2012. The 7% 2020 Notes bear an interest rate of 7% and will mature on August 15, 2020.
We used a portion of the net proceeds of our initial public offering to redeem $210 million of the 8% 2020 Notes and $263 million of the 7% 2020 Notes. As of September 30, 2014, we had $391 million aggregate principal amount outstanding of our 8% 2020 Notes and $488 million aggregate principal amount outstanding of our 7% 2020 Notes. On January 16, 2015, SvM gave notice to redeem $190 million in aggregate principal amount of the 8% 2020 Notes at a redemption price of 106.0% of the principal amount thereof on February 17, 2015. SvM intends to fund the partial redemption using available cash.
Ranking
The 2020 Notes are senior unsecured obligations of SvM and rank equally in right of payment with all of SvM's other existing and future senior unsecured indebtedness. The 2020 Notes are guaranteed by certain of our subsidiaries on a senior unsecured basis. The subsidiary guarantees are general unsecured senior obligations of the subsidiary guarantors and rank equally in right of payment with all of the existing and future senior unsecured indebtedness of our guarantor subsidiaries. The 2020 Notes are effectively junior to all of our existing and future secured indebtedness to the extent of the value of the assets securing such indebtedness.
Optional redemption
SvM may redeem the 8% 2020 Notes, in whole or in part, at its option, at any time prior to February 15, 2015 at a redemption price equal to 100% of the principal amount thereof, plus accrued and unpaid interest, if any, to the redemption date, plus the applicable make-whole premium.
SvM may redeem the 8% 2020 Notes, in whole or in part, at any time (i) on or after February 15, 2015 and prior to February 15, 2016, at a redemption price equal to 106% of the principal amount thereof, (ii) on or after February 15, 2016 and prior to February 15, 2017, at a redemption price equal to 104% of the principal amount thereof, (iii) on or after February 15, 2017 and prior to February 15, 2018, at a redemption price equal to 102% of the principal amount thereof and (iv) on or after February 15, 2018, at a redemption price equal to 100% of the principal amount thereof, in each case, plus accrued and unpaid interest, if any, to the redemption date.
SvM may redeem the 7% 2020 Notes, in whole or in part, at its option, at any time prior to August 15, 2015 at a redemption price equal to 100% of the principal amount thereof, plus accrued and unpaid interest, if any, to the redemption date, plus the applicable make-whole premium.
148
SvM may redeem the 7% 2020 Notes, in whole or in part, at any time (i) on or after August 15, 2015 and prior to August 15, 2016, at a redemption price equal to 105.25% of the principal amount thereof, (ii) on or after August 15, 2016 and prior to August 15, 2017, at a redemption price equal to 103.5% of the principal amount thereof, (iii) on or after August 15, 2017 and prior to August 15, 2018, at a redemption price equal to 101.75% of the principal amount thereof and (iv) on or after August 15, 2018, at a redemption price equal to 100% of the principal amount thereof, in each case, plus accrued and unpaid interest, if any, to the redemption date.
Covenants
The indenture governing the 2020 Notes contains certain covenants that, among other things, limit the ability of SvM and its restricted subsidiaries (as defined in the indenture governing such notes) to:
- •
- incur more debt;
- •
- pay dividends, redeem stock or make other distributions, or make investments;
- •
- limit the ability of restricted subsidiaries to make payments to us;
- •
- enter into certain transactions with their affiliates;
- •
- transfer or sell assets;
- •
- create certain liens;
- •
- merge or consolidate; and
- •
- designate their subsidiaries as unrestricted subsidiaries.
Events of default
The indenture governing the 2020 Notes provides for customary events of default including non-payment of principal or interest, failure to comply with covenants, and certain bankruptcy or insolvency events.
Continuing Notes
As of September 30, 2014, SvM had outstanding approximately $357 million aggregate principal amount of senior unsecured notes issued prior to the 2007 Merger, consisting of approximately $195 million aggregate principal amount of its 7.45% notes due August 15, 2027, $79 million aggregate principal amount of its 7.10% notes due March 1, 2018 and $83 million aggregate principal amount of its 7.25% notes due March 1, 2038, or collectively, the "Continuing Notes."
Ranking
The Continuing Notes rank pari passu with all other unsubordinated indebtedness of SvM.
Optional redemption
SvM may redeem the Continuing Notes of any series, upon not less than 30 or more than 60 days prior written notice, at any time, at a redemption price equal to the greater of (i) 100% of their principal amount or (ii) the sum of the present values of the remaining scheduled payments (as defined) thereon discounted to the redemption date, on a semi-annual basis, at the treasury yield (as defined in the indenture governing such notes) plus 20 bps, together with all accrued but unpaid interest, if any, to the date of redemption.
149
Covenants
The indenture governing the Continuing Notes contains certain covenants that, among other things, limit the ability of SvM and the ability of its significant subsidiaries, (as defined in the indenture governing such notes) to create certain liens, enter into certain sale and lease back transactions, and, with respect to SvM, consolidate, merge, sell or otherwise dispose of all or substantially all of its assets.
Events of default
The indenture governing the Continuing Notes provides for customary events of default including non-payment of principal or interest, failure to comply with covenants, and certain bankruptcy or insolvency events.
150
PRINCIPAL AND SELLING STOCKHOLDERS
The following table sets forth information as of January 20, 2015 with respect to the ownership of our common stock by:
- •
- each person known to own beneficially more than five percent of our common stock;
- •
- each of our directors;
- •
- each of our named executive officers;
- •
- all of our current executive officers and directors as a group; and
- •
- each selling stockholder.
The amounts and percentages of shares beneficially owned are reported on the basis of regulations of the SEC governing the determination of beneficial ownership of securities. Under SEC rules, a person is deemed to be a "beneficial owner" of a security if that person has or shares voting power or investment power, which includes the power to dispose of or to direct the disposition of such security. A person is also deemed to be a beneficial owner of any securities of which that person has a right to acquire beneficial ownership within 60 days. Securities that can be so acquired are deemed to be outstanding for purposes of computing such person's ownership percentage, but not for purposes of computing any other person's percentage. Under these rules, more than one person may be deemed to be a beneficial owner of the same securities, and a person may be deemed to be a beneficial owner of securities as to which such person has no economic interest.
Percentage computations are based on 134,255,002 shares of our common stock outstanding as of January 20, 2015.
151
Except as otherwise indicated in these footnotes, each of the beneficial owners listed has, to our knowledge, sole voting and investment power with respect to the indicated shares of common stock. Addresses for the beneficial owners are set forth in the footnotes to the table.
| |
Shares Beneficially Owned Before the Offering and After the Offering Assuming the Underwriters' Option is Not Exercised |
|
|
|||||||||||||||||||
|---|---|---|---|---|---|---|---|---|---|---|---|---|---|---|---|---|---|---|---|---|---|---|
| |
Shares Beneficially Owned After the Offering Assuming the Underwriters' Option is Exercised in Full |
|||||||||||||||||||||
| |
|
|
|
Shares Beneficially Owned After the Offering |
|
|||||||||||||||||
| |
|
Percent of Class Before the Offering |
|
|
||||||||||||||||||
| |
Number of Shares Owned |
Shares Offered Hereby |
Percentage After the Offering |
|||||||||||||||||||
Name of Beneficial Owner
|
Number | Percent | ||||||||||||||||||||
Clayton, Dubilier & Rice Fund VII, L.P. and related funds(2) |
60,406,666 | 45.0 | 17,704,075 | 42,702,591 | 31.8 | 40,046,979 | 29.8 | |||||||||||||||
StepStone Group LP managed funds(3) |
13,227,181 | 9.9 | 3,876,642 | 9,350,539 | 7.0 | 8,769,043 | 6.5 | |||||||||||||||
JPMorgan Chase Funding Inc.(4) |
6,666,666 | 5.0 | 1,953,876 | 4,712,790 | 3.5 | 4,419,709 | 3.3 | |||||||||||||||
Ridgemont Partners Secondary Fund I, L.P.(5) |
5,000,000 | 3.7 | 1,465,407 | 3,534,593 | 2.6 | 3,314,782 | 2.5 | |||||||||||||||
John Krenicki, Jr.(6) |
63,492 | * | 0 | 63,492 | * | 63,492 | * | |||||||||||||||
David H. Wasserman(6) |
0 | 0 | 0 | 0 | 0 | 0 | 0 | |||||||||||||||
Sarah Kim(6) |
0 | 0 | 0 | 0 | 0 | 0 | 0 | |||||||||||||||
Darren M. Friedman(7) |
0 | 0 | 0 | 0 | 0 | 0 | 0 | |||||||||||||||
Richard P. Fox(8)(9) |
5,000 | * | 0 | 5,000 | * | 5,000 | * | |||||||||||||||
Stephen J. Sedita(8)(9) |
5,000 | * | 0 | 5,000 | * | 5,000 | * | |||||||||||||||
Robert J. Gillette(8)(10) |
696,094 | * | 0 | 696,094 | * | 696,094 | * | |||||||||||||||
Alan J. M. Haughie(8)(10) |
99,893 | * | 0 | 99,893 | * | 99,893 | * | |||||||||||||||
Mark J. Barry(8)(10) |
170,970 | * | 0 | 170,970 | * | 170,970 | * | |||||||||||||||
William J. Derwin(8)(10) |
193,926 | * | 0 | 193,926 | * | 193,926 | * | |||||||||||||||
Susan K. Hunsberger(8)(10) |
83,721 | * | 0 | 83,721 | * | 83,721 | * | |||||||||||||||
All current directors and executive officers as a group (14 persons)(10) |
1,441,856 | 1.1 | 0 | 1,441,856 | 1.1 | 1,441,856 | 1.1 | |||||||||||||||
- *
- Less
than one percent.
- (1)
- The
selling stockholders have granted the underwriters an option to purchase up to an additional 3,750,000 shares.
- (2)
- Represents the following shares: (i) 40,000,000 shares of common stock held by Clayton, Dubilier & Rice Fund VII, L.P., whose general partner is CD&R Associates VII, Ltd., whose sole stockholder is CD&R Associates VII, L.P., whose general partner is CD&R Investment Associates VII, Ltd.; (ii) 9,788,528 shares of common stock held by Clayton, Dubilier & Rice Fund VII (Co-Investment), L.P., whose general partner is CD&R Associates VII (Co-Investment), Ltd., whose sole stockholder is CD&R Associates VII, L.P., whose general partner is CD&R Investment Associates VII, Ltd.; (iii) 7,000,000 shares of common stock held by CDR SVM Co-Investor L.P., whose general partner is CDR SVM Co-Investor GP Limited, whose sole stockholder is Clayton, Dubilier & Rice Fund VII, L.P.; (iv) 3,333,333 shares of common stock held by CDR SVM Co-Investor No. 2 L.P., whose general partner is CDR SVM Co-Investor No. 2 GP Limited, whose sole stockholder is Clayton, Dubilier & Rice Fund VII, L.P.; and (v) 284,805 shares of common stock held by CD&R Parallel Fund VII, L.P., whose general partner is CD&R Parallel Fund Associates VII, Ltd. Does not include 4,338 restricted shares issued to Clayton, Dubilier & Rice, LLC, as assignee of compensation payable to certain members of our board of directors associated with Clayton, Dubilier & Rice, LLC pursuant to their service as directors of ServiceMaster. CD&R Investment Associates VII, Ltd. and CD&R Parallel Fund Associates VII, Ltd. are each managed by a two-person board of directors, Donald J. Gogel and
152
Kevin J. Conway, as the directors of each of CD&R Investment Associates VII, Ltd. and CD&R Parallel Fund Associates VII, Ltd., may be deemed to share beneficial ownership of the shares shown as beneficially owned by Clayton, Dubilier & Rice Fund VII, L.P., Clayton Dubilier & Rice Fund VII (Co-Investment), L.P., CDR SVM Co-Investor L.P., CDR SVM Co-Investor No. 2 L.P. and CD&R Parallel Fund VII, L.P. Such persons expressly disclaim such beneficial ownership.
Investment and voting decisions with respect to shares held by each of Clayton, Dubilier & Rice Fund VII, L.P., Clayton, Dubilier & Rice Fund VII (Co-Investment), L.P., CDR SVM Co-Investor L.P., CDR SVM Co-Investor No. 2 L.P. and CD&R Parallel Fund VII, L.P. are made by an investment committee of limited partners of CD&R Associates VII, L.P., currently consisting of more than ten individuals, or the "Investment Committee." All members of the Investment Committee disclaim beneficial ownership of the shares shown as beneficially owned by the funds associated with Clayton, Dubilier & Rice, LLC.
Each of CD&R Associates VII, Ltd., CD&R Associates VII, L.P. and CD&R Investment Associates VII, Ltd. expressly disclaims beneficial ownership of the shares held by Clayton, Dubilier & Rice Fund VII, L.P., as well as of the shares held by each of Clayton, Dubilier & Rice Fund VII (Co-Investment), L.P., CD&R Parallel Fund VII, L.P., CDR SVM Co-Investor L.P. and CDR SVM Co-Investor No. 2 L.P. Each of CDR SVM Co-Investor GP Limited and CDR SVM No. 2 GP Limited expressly disclaims beneficial ownership of the shares held by each of CDR SVM Co-Investor L.P., Clayton, Dubilier & Rice Fund VII, L.P., Clayton, Dubilier & Rice Fund VII (Co-Investment), L.P., CD&R Parallel Fund VII, L.P., and CDR SVM Co-Investor No. 2 L.P. CD&R Parallel Fund Associates VII, Ltd. expressly disclaims beneficial ownership of the shares held by each of CD&R Parallel Fund VII, L.P., Clayton, Dubilier & Rice Fund VII, L.P., Clayton, Dubilier & Rice Fund VII (Co-Investment), L.P., CDR SVM Co-Investor L.P. and CDR SVM Co-Investor No. 2 L.P.
The address for each of Clayton, Dubilier & Rice Fund VII, L.P., Clayton, Dubilier & Rice Fund VII (Co-Investment), L.P., CD&R Parallel Fund VII, L.P., CD&R Associates VII, Ltd., CD&R Associates VII, L.P., CD&R Parallel Fund Associates VII, Ltd., CDR SVM Co-Investor L.P., CDR SVM Co-Investor L.P., CDR SVM Co-Investor No. 2 L.P. and CD&R Investment Associates VII, Ltd. is c/o Maples Corporate Services Limited, PO Box 309, Ugland House, South Church Street, George Town, Grand Cayman, KY1-1104, Cayman Islands.
- (3)
- Represents
shares held by 2007 Co-Investment Portfolio L.P., StepStone Capital Partners II Onshore, L.P., StepStone Capital Partners II Cayman
Holdings, L.P., and StepStone Co-Investment (ServiceMaster) LLC. Does not include 1,446 restricted shares issued to StepStone Group LP as assignee of compensation payable to Mr.
Friedman pursuant to his service as a director of ServiceMaster. The address for each of 2007 Co-Investment Portfolio L.P., StepStone Capital Partners II Onshore, L.P., StepStone Capital
Partners II Cayman Holdings, L.P. and StepStone Co-Investment (ServiceMaster) LLC, is c/o StepStone Group LP, 4350 LaJolla Village Drive, Suite 800, San Diego, CA 92122.
- (4)
- JPMorgan
Chase Funding Inc. is an affiliate of JPMorgan Chase & Co. The address for JPMorgan Chase Funding Inc. is 270 Park
Avenue, New York, NY 10017.
- (5)
- Represents shares held by Ridgemont Partners Secondary Fund I, L.P. The address for Ridgemont Partners Secondary Fund I, L.P. is c/o Ridgemont Partners Management, LLC, 150 North College Street, Suite 2500, Charlotte, NC 28202. Ridgemont Secondary Management I, L.P. is the sole general partner of Ridgemont Partners Secondary Fund I, L.P. and may therefore be deemed to be the beneficial owner of the shares, and its address is c/o Ridgemont Partners Management, LLC, 150 North College Street, Suite 2500, Charlotte, NC 28202. Ridgemont Secondary Management I, LLC is the sole general partner of Ridgemont Secondary Management I, L.P. and may therefore also be deemed to be the beneficial owner of the shares, and its address is c/o Ridgemont Partners Management, LLC, 150 North College Street, Suite 2500, Charlotte, NC 28202. A majority of the following members of Ridgemont Secondary Management I, LLC have the authority to vote or dispose of the shares held by Ridgemont Partners Secondary Fund I, L.P.: J. Travis Hain, Walker L. Poole, Robert H. Sheridan, III, Robert L. Edwards, Jr., John A. Shimp and George E. Morgan, III. The address for each of the members of Ridgemont Secondary Management I, LLC is c/o Ridgemont Partners Management, LLC,
153
150 North College Street, Suite 2500, Charlotte, NC 28202. Ridgemont Secondary Management I, L.P., Ridgemont Secondary Management I, LLC and each of the members of Ridgemont Secondary Management I, LLC disclaim beneficial ownership of such shares except to the extent of their respective pecuniary interest therein, if any.
- (6)
- Does
not include common stock held by the CD&R Funds. Ms. Kim and Messrs. Krenicki and Wasserman are directors of ServiceMaster Global
Holdings, Inc. and principals of Clayton, Dubilier & Rice, LLC. Each of them has assigned their compensation for board service to Clayton, Dubilier & Rice, LLC. They
expressly disclaim beneficial ownership of the shares held by the CD&R Funds. The address for Ms. Kim and Messrs. Krenicki and Wasserman is 375 Park Avenue, New York, New
York 10152.
- (7)
- Does
not include common stock held by investment funds associated with or designated by StepStone Group LP. Mr. Friedman is a director of
ServiceMaster and an executive of StepStone Group LP. He has assigned his compensation for board service to StepStone Group LP. He disclaims beneficial ownership of the shares held by
investment funds associated with or designated by StepStone Group LP. The address for Mr. Friedman is 505 5th Avenue, 17th Floor, New York, NY 10017.
- (8)
- The
business address for these persons is c/o ServiceMaster Global Holdings, Inc., 860 Ridge Lake Boulevard, Memphis, TN 38120.
- (9)
- With
respect to each of Messrs. Fox and Sedita, represents 5,000 restricted shares that will vest on March 31, 2015.
- (10)
- Includes shares which the current executive officers have the right to acquire prior to March 21, 2015 through the exercise of stock options or vesting of RSUs as follows: Mr. Gillette, 352,344 shares, Mr. Haughie 42,000 shares, Mr. Barry 100,416 shares, Mr. Derwin 91,666 shares and Ms. Hunsberger, 36,667 shares. All current executive officers as a group have the right to acquire 681,488 shares prior to March 21, 2015 through the exercise of stock options or vesting of RSUs.
154
The following descriptions of our capital stock, amended and restated certificate of incorporation and amended and restated by-laws are intended as summaries only and are qualified in their entirety by reference to our amended and restated certificate of incorporation and amended and restated by-laws and to the applicable provisions of the DGCL.
General
Our authorized capital stock consists of 2,000,000,000 shares of common stock, par value $0.01 per share and 200,000,000 shares of undesignated preferred stock, par value per share. As of January 20, 2015, there were 134,255,002 shares of our common stock issued and outstanding, not including 4,436,269 shares of our common stock issuable upon exercise of outstanding stock options and 425,922 shares of our common stock subject to outstanding restricted stock units.
Common Stock
Holders of common stock are entitled:
- •
- to cast one vote for each share held of record on all matters submitted to a vote of the stockholders;
- •
- to receive, on a pro rata basis, dividends and distributions, if any, that our board of directors may declare out of legally available
funds, subject to preferences that may be applicable to preferred stock, if any, then outstanding; and
- •
- upon our liquidation, dissolution or winding up, to share equally and ratably in any assets remaining after the payment of all debt and other liabilities, subject to the prior rights, if any, of holders of any outstanding shares of preferred stock.
Our ability to pay dividends on our common stock is subject to our subsidiaries' ability to pay dividends to us, which is in turn subject to the restrictions set forth in the Credit Facilities and the indenture governing the 2020 Notes. See "Dividend Policy."
The holders of our common stock do not have any preemptive, cumulative voting, subscription, conversion, redemption or sinking fund rights. The common stock is not subject to future calls or assessments by us. The rights and privileges of holders of our common stock are subject to any series of preferred stock that we may issue in the future, as described below.
Our common stock is listed on the NYSE under the symbol "SERV".
As of January 20, 2015, we had approximately 134 million shares of common stock outstanding and 86 holders of record of common stock.
Preferred Stock
Under our amended and restated certificate of incorporation, our board of directors has the authority, without further action by our stockholders, to issue up to 200,000,000 shares of preferred stock in one or more series and to fix the voting powers, designations, preferences and the relative participating, optional or other special rights and qualifications, limitations and restrictions of each series, including dividend rights, dividend rates, conversion rights, voting rights, terms of redemption, liquidation preferences and the number of shares constituting any series. No shares of our authorized preferred stock are currently outstanding. Because the board of directors has the power to establish the preferences and rights of the shares of any additional series of preferred stock, it may afford holders of any preferred stock preferences, powers and rights, including voting and dividend rights, senior to the rights of holders of our common stock, which could adversely affect the holders of the common stock
155
and could delay, discourage or prevent a takeover of us even if a change of control of our company would be beneficial to the interests of our stockholders.
Annual Stockholders Meeting
Our amended and restated by-laws provide that annual stockholder meetings will be held at a date, time and place, if any, as exclusively selected by our board of directors. To the extent permitted under applicable law, we may conduct meetings by remote communications, including by webcast.
Voting
The affirmative vote of a plurality of the shares of our common stock present, in person or by proxy, at the meeting and entitled to vote on the election of directors will decide the election of any directors, and the affirmative vote of a majority of the shares of our common stock present, in person or by proxy, at the meeting and entitled to vote at any annual or special meeting of stockholders will decide all other matters voted on by stockholders, unless the question is one upon which, by express provision of law, under our amended and restated certificate of incorporation, or under our amended and restated by-laws, a different vote is required, in which case such provision will control.
Anti-Takeover Effects of our Certificate of Incorporation and By-Laws
The provisions of our amended and restated certificate of incorporation and amended and restated by-laws summarized below may have an anti-takeover effect and may delay, defer or prevent a tender offer or takeover attempt that you might consider in your best interest, including an attempt that might result in your receipt of a premium over the market price for your shares. These provisions are also designed, in part, to encourage persons seeking to acquire control of us to first negotiate with our board of directors, which could result in an improvement of their terms.
Authorized but Unissued Shares of Common Stock. Under our amended and restated certificate of incorporation, our board of directors has the authority to issue the remaining shares of our authorized and unissued common stock without additional stockholder approval, subject to compliance with applicable NYSE requirements. While the additional shares are not designed to deter or prevent a change of control, under some circumstances we could use the additional shares to create voting impediments or to frustrate persons seeking to effect a takeover or otherwise gain control by, for example, issuing those shares in private placements to purchasers who might side with our board of directors in opposing a hostile takeover bid.
Authorized but Unissued Shares of Preferred Stock. Under our amended and restated certificate of incorporation, our board of directors has the authority, without further action by our stockholders, to issue up to 200,000,000 shares of preferred stock in one or more series and to fix the voting powers, designations, preferences and the relative participating, optional or other special rights and qualifications, limitations and restrictions of each series, including dividend rights, dividend rates, conversion rights, voting rights, terms of redemption, liquidation preferences and the number of shares constituting any series. The existence of authorized but unissued preferred stock could reduce our attractiveness as a target for an unsolicited takeover bid since we could, for example, issue shares of preferred stock to parties who might oppose such a takeover bid or shares that contain terms the potential acquiror may find unattractive. This may have the effect of delaying or preventing a change of control, may discourage bids for the common stock at a premium over the market price of the common stock, and may adversely affect the market price of, and the voting and other rights of the holders of, our common stock.
Classified Board of Directors. In accordance with the terms of our amended and restated certificate of incorporation, our board of directors is divided into three classes, Class I, Class II and
156
Class III, with members of each class serving staggered three-year terms. Under our amended and restated certificate of incorporation, our board of directors consists of such number of directors as may be determined from time to time by resolution of the board of directors, but in no event may the number of directors be less than one. Any additional directorships resulting from an increase in the number of directors will be distributed among the three classes so that, as nearly as possible, each class will consist of one-third of the directors. Our amended and restated certificate of incorporation provides that any vacancy on our board of directors, including a vacancy resulting from an enlargement of our board of directors, may be filled only by the affirmative vote of a majority of our directors then in office, even if less than a quorum, or by a sole remaining director, subject to our amended stockholders agreement with respect to the director designation rights of the CD&R Funds and the StepStone Funds. Any director elected to fill a vacancy will hold office until such director's successor shall have been duly elected and qualified or until such director's earlier death, resignation or removal. Our classified board of directors could have the effect of delaying or discouraging an acquisition of us or a change in our management.
Removal of Directors. Our amended and restated certificate of incorporation provides that directors may be removed with or without cause at any time upon the affirmative vote of holders of at least a majority of the outstanding shares of common stock then entitled to vote at an election of directors until the CD&R Funds and the StepStone Funds cease to collectively own at least 40% of the outstanding shares of our common stock. Thereafter, our amended and restated certificate of incorporation provides that directors may be removed only for cause upon the affirmative vote of holders of at least a majority of the outstanding shares of common stock then entitled to vote at an election of directors.
Special Meetings of Stockholders. Our amended and restated certificate of incorporation provides that a special meeting of stockholders may be called only by the Chairman of our board of directors or by a resolution adopted by a majority of our board of directors. Special meetings may also be called by our corporate secretary at the request of the holders of at least a majority of the outstanding shares of our common stock until the CD&R Funds and the StepStone Funds cease to collectively own at least 40% of the outstanding shares of our common stock. Thereafter, stockholders will not be permitted to call a special meeting of stockholders.
Stockholder Advance Notice Procedure. Our amended and restated by-laws establish an advance notice procedure for stockholders to make nominations of candidates for election as directors or to bring other business before an annual meeting of our stockholders. The amended and restated by-laws provide that any stockholder wishing to nominate persons for election as directors at, or bring other business before, an annual meeting must deliver to our corporate secretary a written notice of the stockholder's intention to do so. These provisions may have the effect of precluding the conduct of certain business at a meeting if the proper procedures are not followed. We expect that these provisions may also discourage or deter a potential acquirer from conducting a solicitation of proxies to elect the acquirer's own slate of directors or otherwise attempting to obtain control of our company. To be timely, the stockholder's notice must be delivered to our corporate secretary at our principal executive offices not less than 90 days nor more than 120 days before the first anniversary date of the annual meeting for the preceding year; provided, however, that in the event that the annual meeting is set for a date that is more than 30 days before or more than 70 days after the first anniversary date of the preceding year's annual meeting, a stockholder's notice must be delivered to our corporate secretary (x) not less than 90 days nor more than 120 days prior to the meeting or (y) no later than the close of business on the 10th day following the day on which a public announcement of the date of the meeting is first made by us.
No Stockholder Action by Written Consent. Our amended and restated certificate of incorporation provides that stockholder action may be taken only at an annual meeting or special meeting of
157
stockholders, provided that stockholder action may be taken by written consent in lieu of a meeting until the CD&R Funds and the StepStone Funds cease to collectively own at least 40% of the outstanding shares of our common stock.
Amendments to Certificate of Incorporation and By-Laws. Our amended and restated certificate of incorporation provides that our amended and restated certificate of incorporation may be amended by both the affirmative vote of a majority of our board of directors and the affirmative vote of the holders of a majority of the outstanding shares of our common stock then entitled to vote at any annual or special meeting of stockholders; provided that, at any time when the CD&R Funds and the StepStone Funds collectively own less than 40% of the outstanding shares of our common stock, specified provisions of our amended and restated certificate of incorporation may not be amended, altered or repealed unless the amendment is approved by the affirmative vote of the holders of at least 662/3% of the outstanding shares of our common stock then entitled to vote at any annual or special meeting of stockholders, including the provisions governing:
- •
- liability and indemnification of directors;
- •
- corporate opportunities;
- •
- elimination of stockholder action by written consent;
- •
- prohibition on the rights of stockholders to call a special meeting;
- •
- removal of directors for cause;
- •
- classified board of directors; and
- •
- required approval of the holders of at least 662/3% of the outstanding shares of our common stock to amend our amended and restated by-laws and certain provisions of our amended and restated certificate of incorporation.
In addition, our amended and restated by-laws may be amended, altered or repealed, or new by-laws may be adopted, by the affirmative vote of a majority of the board of directors, or by the affirmative vote of the holders of at least 662/3%, of the outstanding shares of our common stock then entitled to vote at any annual or special meeting of stockholders.
These provisions make it more difficult for any person to remove or amend any provisions in our amended and restated certificate of incorporation and amended and restated by-laws that may have an anti-takeover effect.
Section 203 of the Delaware General Corporation Law. In our amended and restated certificate of incorporation, we elected not to be governed by Section 203 of the DGCL, as permitted under and pursuant to subsection (b)(3) of Section 203, until the first date on which the CD&R Funds collectively cease to beneficially own (directly or indirectly) at least 5% of the outstanding shares of our common stock. Section 203 prohibits a publicly held Delaware corporation from engaging in a business combination, such as a merger, with a person or group owning 15% or more of the corporation's outstanding voting stock for a period of three years following the date the person became an interested stockholder, unless (with certain exceptions) the business combination or the transaction in which the person became an interested stockholder is approved in a prescribed manner. Accordingly, we are not subject to any anti-takeover effects of Section 203.
158
Limitations on Liability and Indemnification
Our amended and restated certificate of incorporation contains provisions permitted under DGCL relating to the liability of directors. These provisions eliminate a director's personal liability for monetary damages resulting from a breach of fiduciary duty, except in circumstances involving:
- •
- any breach of the director's duty of loyalty;
- •
- acts or omissions not in good faith or which involve intentional misconduct or a knowing violation of the law;
- •
- Section 174 of the DGCL (unlawful dividends); or
- •
- any transaction from which the director derives an improper personal benefit.
The principal effect of the limitation on liability provision is that a stockholder will be unable to prosecute an action for monetary damages against a director unless the stockholder can demonstrate a basis for liability for which indemnification is not available under the DGCL. These provisions, however, should not limit or eliminate our rights or any stockholder's rights to seek non-monetary relief, such as an injunction or rescission, in the event of a breach of a director's fiduciary duty. These provisions will not alter a director's liability under federal securities laws. The inclusion of this provision in our amended and restated certificate of incorporation may discourage or deter stockholders or management from bringing a lawsuit against directors for a breach of their fiduciary duties, even though such an action, if successful, might otherwise have benefited us and our stockholders. In addition, your investment may be adversely affected to the extent we pay costs of settlement and damage awards against directors and officers pursuant to these indemnification provisions.
Our amended and restated certificate of incorporation and our amended and restated by-laws require us to indemnify and advance expenses to our directors and officers to the fullest extent not prohibited by the DGCL and other applicable law, except in the case of a proceeding instituted by the director without the approval of our board of directors. Our amended and restated certificate of incorporation and our amended and restated by-laws provide that we are required to indemnify our directors and executive officers, to the fullest extent permitted by law, for all judgments, fines, settlements, legal fees and other expenses incurred in connection with pending or threatened legal proceedings because of the director's or officer's positions with us or another entity that the director or officer serves at our request, subject to various conditions, and to advance funds to our directors and officers to enable them to defend against such proceedings. To receive indemnification, the director or officer must have been successful in the legal proceeding or have acted in good faith and in what was reasonably believed to be a lawful manner in our best interest and, with respect to any criminal proceeding, have had no reasonable cause to believe his or her conduct was unlawful.
In connection with our initial public offering, we entered into an indemnification agreement with each of our directors. The indemnification agreements provide our directors with contractual rights to the indemnification and expense advancement rights provided under our amended and restated by-laws, as well as contractual rights to additional indemnification as provided in the indemnification agreements.
Corporate Opportunities
Our amended and restated certificate of incorporation provides that we, on our behalf and on behalf of our subsidiaries, renounce any interest or expectancy in, or in being offered an opportunity to participate in, corporate opportunities, that are from time to time presented to the CD&R Funds and the StepStone Funds or any of their respective officers, directors, employees, agents, stockholders, members, partners, affiliates or subsidiaries (other than us and our subsidiaries), even if the
159
opportunity is one that we or our subsidiaries might reasonably be deemed to have pursued or had the ability or desire to pursue if granted the opportunity to do so. Neither the CD&R Funds, the StepStone Funds nor their respective officers, directors, employees, agents, stockholders, members, partners, affiliates or subsidiaries will generally be liable to us or any of our subsidiaries for breach of any fiduciary or other duty, as a director or otherwise, by reason of the fact that such person pursues or acquires such corporate opportunity, directs such corporate opportunity to another person or fails to present such corporate opportunity, or information regarding such corporate opportunity, to us or our subsidiaries unless, in the case of any such person who is a director or officer of ServiceMaster, such corporate opportunity is expressly offered to such director or officer in writing solely in his or her capacity as a director or officer of ServiceMaster. Stockholders will be deemed to have notice of and consented to this provision of our amended and restated certificate of incorporation.
Choice of Forum
Our amended and restated certificate of incorporation provides that the Court of Chancery of the State of Delaware is the sole and exclusive forum for (i) any derivative action or proceeding brought on our behalf, (ii) any action asserting a claim of breach of a fiduciary duty owed to us or our stockholders by any of our directors, officers, employees or agents, (iii) any action asserting a claim against us arising under the DGCL or (iv) any action asserting a claim against us that is governed by the internal affairs doctrine. We may consent in writing to alternative forums. By becoming a stockholder in our company, you will be deemed to have notice of and have consented to the provisions of our amended and restated certificate of incorporation related to choice of forum.
Market Listing
Our common stock is listed on the NYSE under the symbol "SERV".
Transfer Agent and Registrar
The transfer agent and registrar for our common stock is ComputerShare Trust Company, N.A.
160
SHARES AVAILABLE FOR FUTURE SALE
Sales of substantial amounts of our common stock in the public market could adversely affect prevailing market prices of our common stock. Some shares of our common stock will not be available for sale for a certain period of time after this offering because they are subject to contractual and legal restrictions on resale some of which are described below. Sales of substantial amounts of common stock in the public market after these restrictions lapse, or the perception that these sales could occur, could adversely affect the prevailing market price and our ability to raise equity capital in the future.
Sales of Restricted Securities
As of January 20, 2015, we had 134,255,002 outstanding shares of common stock outstanding. Of these shares, all of the 41,285,000 shares sold in our initial public offering are, and the 25,000,000 shares to be sold in this offering will be, freely transferable without restriction or further registration under the Securities Act, except for any shares held by "affiliates," as that term is defined in Rule 144 under the Securities Act. In July 2014, we filed a registration statement on Form S-8 under the Securities Act to register the shares of common stock to be issued under our equity compensation plans and, as a result, all shares of common stock acquired upon exercise of (i) stock options granted under these plans and (ii) other equity-based awards granted under the Omnibus Incentive Plan, including approximately 600,000 shares of our common stock that have been sold in the public market through the exercise of stock options as of January 20, 2015, are freely tradable under the Securities Act, subject to the terms of the lock-up agreements, unless purchased by our affiliates. As of January 20, 2015, there were stock options outstanding to purchase a total of 4,436,269 shares of common stock and there were 425,922 shares of our common stock subject to restricted stock units. In addition, 7,971,137 million shares of our common stock are reserved for future issuances under our Omnibus Incentive Plan.
The remaining shares of our common stock outstanding as of January 20, 2015 are "restricted securities" within the meaning of Rule 144 under the Securities Act. Restricted securities may be sold in the public market only if they are registered under the Securities Act or are sold pursuant to an exemption from registration under Rule 144 or Rule 701 under the Securities Act, which are summarized below. Subject to the lock-up agreements described below, shares held by our affiliates that are not restricted securities or that have been owned for more than one year may be sold subject to compliance with Rule 144 of the Securities Act without regard to the prescribed one-year holding period under Rule 144.
Lock-up Agreements
Upon completion of the offering, our directors and executive officers, and the selling stockholders in this offering will have signed lock-up agreements, under which they will agree not to sell, transfer or dispose of, directly or indirectly, any shares of our common stock or any securities convertible into or exercisable or exchangeable for shares of our common stock without the prior written consent of J.P. Morgan Securities LLC and Credit Suisse Securities (USA) LLC for a period of 90 days, subject to possible extension under certain circumstances, after the date of this prospectus. These agreements are described below under "Underwriting (Conflicts of Interest)."
Registration Rights Agreement
Certain of the Equity Sponsors have the right to require us to register additional shares of common stock for resale in some circumstances. See "Certain Relationships and Related Party Transactions—Registration Rights Agreement."
161
Rule 144
In general, under Rule 144, as currently in effect, a person (or persons whose shares are aggregated) who is not deemed to be or have been one of our affiliates for purposes of the Securities Act at any time during 90 days preceding a sale and who has beneficially owned the shares proposed to be sold for at least six months, including the holding period of any prior owner other than an affiliate, is entitled to sell such shares without registration, subject to compliance with the public information requirements of Rule 144. If such a person has beneficially owned the shares proposed to be sold for at least one year, including the holding period of a prior owner other than an affiliate, then such person is entitled to sell such shares without complying with any of the requirements of Rule 144.
In general, under Rule 144, as currently in effect, our affiliates or persons selling shares on behalf of our affiliates, who have met the six-month holding period for beneficial ownership of "restricted shares" of our common stock, are entitled to sell within any three-month period, a number of shares that does not exceed the greater of:
- •
- 1% of the number of shares of our common stock then outstanding, which will equal approximately 1,342,550 shares immediately after
this offering, assuming the underwriters do not exercise their option to purchase additional shares; and
- •
- the average reported weekly trading volume of our common stock on the NYSE during the four calendar weeks preceding the date of filing a Notice of Proposed Sale of Securities Pursuant to Rule 144 with respect to the sale.
Sales under Rule 144 by our affiliates or persons selling shares on behalf of our affiliates are also subject to certain manner of sale provisions and notice requirements and to the availability of current public information about us. The sale of these shares, or the perception that sales will be made, could adversely affect the price of our common stock after this offering because a great supply of shares would be, or would be perceived to be, available for sale in the public market.
Rule 701
Any of our employees, officers or directors who acquired shares under a written compensatory plan or contract may be entitled to sell them in reliance on Rule 701. Rule 701 permits affiliates to sell their Rule 701 shares under Rule 144 without complying with the holding period requirements of Rule 144. Rule 701 further provides that non-affiliates may sell these shares in reliance on Rule 144 without complying with the holding period, public information, volume limitation or notice provisions of Rule 144.
162
MATERIAL U.S. FEDERAL TAX CONSIDERATIONS FOR NON-U.S. HOLDERS
The following is a discussion of material U.S. federal income tax considerations relating to the purchase, ownership and disposition of our common stock by Non-U.S. Holders (as defined below) that purchase our common stock pursuant to this offering and hold such common stock as a capital asset. This discussion is based on the Code, U.S. Treasury regulations promulgated or proposed thereunder, and administrative and judicial interpretations thereof, all as in effect on the date hereof and all of which are subject to change, possibly with retroactive effect, or to different interpretation. This discussion does not address all of the U.S. federal income tax considerations that may be relevant to specific Non-U.S. Holders in light of their particular circumstances or to Non-U.S. Holders subject to special treatment under U.S. federal income tax law (such as banks, insurance companies, dealers in securities or other Non-U.S. Holders that generally mark their securities to market for U.S. federal income tax purposes, foreign governments, international organizations, tax-exempt entities, certain former citizens or residents of the United States, or Non-U.S. Holders that hold our common stock as part of a straddle, hedge, conversion or other integrated transaction). This discussion does not address any U.S. state or local or non-U.S. tax considerations or any U.S. federal gift or alternative minimum tax considerations.
As used in this discussion, the term "Non-U.S. Holder" means a beneficial owner of our common stock that, for U.S. federal income tax purposes, is:
- •
- an individual who is neither a citizen nor a resident of the United States;
- •
- a corporation that is not created or organized in or under the laws of the United States, any state thereof, or the District of
Columbia;
- •
- an estate that is not subject to U.S. federal income tax on income from non-U.S. sources which is not effectively connected with the
conduct of a trade or business in the United States; or
- •
- a trust unless (i) a court within the United States is able to exercise primary supervision over its administration and one or more U.S. persons have the authority to control all of its substantial decisions or (ii) it has in effect a valid election under applicable U.S. Treasury regulations to be treated as a U.S. person.
If an entity treated as a partnership for U.S. federal income tax purposes invests in our common stock, the U.S. federal income tax considerations relating to such investment will depend in part upon the status and activities of such entity and the particular partner. Any such entity should consult its own tax advisor regarding the U.S. federal income tax considerations applicable to it and its partners relating to the purchase, ownership and disposition of our common stock.
PERSONS CONSIDERING AN INVESTMENT IN OUR COMMON STOCK SHOULD CONSULT THEIR OWN TAX ADVISORS REGARDING THE U.S. FEDERAL, STATE AND LOCAL AND NON-U.S. INCOME, ESTATE AND OTHER TAX CONSIDERATIONS RELATING TO THE PURCHASE, OWNERSHIP AND DISPOSITION OF OUR COMMON STOCK IN LIGHT OF THEIR PARTICULAR CIRCUMSTANCES.
Distributions on Common Stock
If we make a distribution of cash or other property (other than certain pro rata distributions of our common stock or rights to acquire our common stock) in respect of a share of our common stock, the distribution generally will be treated as a dividend to the extent it is paid from our current or accumulated earnings and profits (as determined under U.S. federal income tax principles). If the amount of such distribution exceeds our current and accumulated earnings and profits, such excess generally will be treated first as a tax-free return of capital to the extent of the Non-U.S. Holder's adjusted tax basis in such share of our common stock, and then as capital gain (which will be treated in
163
the manner described below under "Sale, Exchange or Other Disposition of Common Stock"). Distributions treated as dividends on our common stock that are paid to or for the account of a Non-U.S. Holder generally will be subject to U.S. federal withholding tax at a rate of 30%, or at a lower rate if provided by an applicable tax treaty and the Non-U.S. Holder provides the documentation (generally, IRS Form W-8BEN or IRS Form W-BEN-E) required to claim benefits under such tax treaty to the applicable withholding agent. Special documentation requirements apply to claim benefits under such a tax treaty when our common stock is held though certain foreign intermediaries or Non-U.S. entities that are pass through entities.
If, however, a dividend is effectively connected with the conduct of a trade or business in the United States by a Non-U.S. Holder (and, if required by an applicable income tax treaty, is attributable to a U.S. permanent establishment), such dividend generally will not be subject to the 30% U.S. federal withholding tax if such Non-U.S. Holder provides the appropriate documentation (generally, IRS Form W-8ECI) to the applicable withholding agent. Instead, such Non-U.S. Holder generally will be subject to U.S. federal income tax on such dividend in substantially the same manner as a U.S. person (except as provided by an applicable tax treaty). In addition, a Non-U.S. Holder that is treated as a corporation for U.S. federal income tax purposes may be subject to a branch profits tax at a rate of 30% (or a lower rate if provided by an applicable tax treaty) on its effectively connected income for the taxable year, subject to certain adjustments.
The foregoing discussion is subject to the discussion below under "—FATCA Withholding" and "—Information Reporting and Backup Withholding."
Sale, Exchange or Other Disposition of Common Stock
A Non-U.S. Holder generally will not be subject to U.S. federal income tax on any gain recognized on the sale, exchange or other disposition of our common stock unless:
- (i)
- such
gain is effectively connected with the conduct of a trade or business in the United States by such Non-U.S. Holder, in which event such Non-U.S. Holder
generally will be subject to U.S. federal income tax on such gain in substantially the same manner as a U.S. person (except as provided by an applicable tax treaty) and, if it is treated as a
corporation for U.S. federal income tax purposes, may also be subject to a branch profits tax at a rate of 30% (or a lower rate if provided by an applicable tax treaty);
- (ii)
- such
Non-U.S. Holder is an individual who is present in the United States for 183 days or more during the taxable year of such sale, exchange or
other disposition and certain other conditions are met, in which event such gain (net of certain U.S. source losses) generally will be subject to U.S. federal income tax at a rate of 30% (except as
provided by an applicable tax treaty); or
- (iii)
- we are or have been a "United States real property holding corporation" for U.S. federal income tax purposes at any time during the shorter of (x) the five-year period ending on the date of such sale, exchange or other disposition and (y) such Non-U.S. Holder's holding period with respect to such common stock, and certain other conditions are met.
Generally, a corporation is a "United States real property holding corporation" if the fair market value of its United States real property interests equals or exceeds 50% of the sum of the fair market value of its worldwide real property interests and its other assets used or held for use in a trade or business (all as determined for U.S. federal income tax purposes). We believe that we presently are not, that we have not been at any time during the five-year period ending as of the date of this offering and we do not presently anticipate that we will become, a United States real property holding corporation.
The foregoing discussion is subject to the discussion below under "—FATCA Withholding" and "—Information Reporting and Backup Withholding."
164
FATCA Withholding
Under the Foreign Account Tax Compliance Act provisions of the Code and related U.S. Treasury guidance, or "FATCA," a withholding tax of 30% will be imposed in certain circumstances on payments of (i) dividends on our common stock and (ii) on or after January 1, 2017, gross proceeds from the sale or other disposition of our common stock. In the case of payments made to a "foreign financial institution" (such as a bank, a broker or an investment fund), as a beneficial owner or as an intermediary, this tax generally will be imposed, subject to certain exceptions, unless such institution (i) has agreed to (and does) comply with the requirements of an agreement with the United States, or an "FFI Agreement," or (ii) is required to (and does) comply with FATCA pursuant to applicable foreign law enacted in connection with an intergovernmental agreement between the United States and a foreign jurisdiction, or an "IGA," in either case to, among other things, collect and provide to the U.S. tax authorities or other relevant tax authorities certain information regarding U.S. account holders of such institution, and, in either case such institution provides the withholding agent with a certification as to its FATCA status. In the case of payments made to a foreign entity that is not a financial institution (as a beneficial owner), the tax generally will be imposed, subject to certain exceptions, unless such entity provides the withholding agent with a certification as to its FATCA status and in certain cases, identifies any "substantial" U.S. owner (generally, any specified U.S. person that directly or indirectly owns more than a specified percentage of such entity). If our common stock is held through a foreign financial institution that has agreed to comply with the requirements of an FFI Agreement or is subject to similar requirements under applicable foreign law enacted in connection with an IGA, such foreign financial institution (or, in certain cases, a person paying amounts to such foreign financial institution) generally will be required, subject to certain exceptions, to withhold tax on payments of dividends and proceeds described above made to (i) a person (including an individual) that fails to provide any required information or documentation or (ii) a foreign financial institution that has not agreed to comply with the requirements of an FFI Agreement, unless such foreign financial institution is required to (and does) comply with FATCA pursuant to applicable foreign law enacted in connection with an IGA. Each Non-U.S. Holder should consult its own tax advisor regarding the application of FATCA to the ownership and disposition of our common stock.
Information Reporting and Backup Withholding
Amounts treated as payments of dividends on our common stock paid to a Non-U.S. Holder and the amount of any U.S. federal tax withheld from such payments generally must be reported annually to the IRS and to such Non-U.S. Holder by the applicable withholding agent.
The information reporting and backup withholding rules that apply to payments of dividends to certain U.S. persons generally will not apply to payments of dividends on our common stock to a Non-U.S. Holder if such Non-U.S. Holder certifies under penalties of perjury that it is not a U.S. person (generally by providing an IRS Form W-8BEN or W-8BEN-E to the applicable withholding agent) or otherwise establishes an exemption.
Proceeds from the sale, exchange or other disposition of our common stock by a Non-U.S. Holder effected outside the United States through a non-U.S. office of a non-U.S. broker generally will not be subject to the information reporting and backup withholding rules that apply to payments to certain U.S. persons, provided that the proceeds are paid to the Non-U.S. Holder outside the United States. However, proceeds from the sale, exchange or other disposition of our common stock by a Non-U.S. Holder effected through a non-U.S. office of a non-U.S. broker with certain specified U.S. connections or a U.S. broker generally will be subject to these information reporting rules (but generally not to these backup withholding rules), even if the proceeds are paid to such Non-U.S. Holder outside the United States, unless such Non-U.S. Holder certifies under penalties of perjury that it is not a U.S. person (generally by providing an IRS Form W-8BEN or W-8BEN-E to the applicable withholding agent) or otherwise establishes an exemption. Proceeds from the sale, exchange or other disposition of
165
our common stock by a Non-U.S. Holder effected through a U.S. office of a broker generally will be subject to these information reporting and backup withholding rules unless such Non-U.S. Holder certifies under penalties of perjury that it is not a U.S. person (generally by providing an IRS Form W-8BEN or W-8BEN-E to the applicable withholding agent) or otherwise establishes an exemption.
Backup withholding is not an additional tax. Any amounts withheld under the backup withholding rules generally will be allowed as a refund or a credit against a Non-U.S. Holder's U.S. federal income tax liability if the required information is furnished by such Non-U.S. Holder on a timely basis to the IRS.
U.S. Federal Estate Tax
Shares of our common stock owned or treated as owned by an individual Non-U.S. Holder at the time of such Non-U.S. Holder's death will be included in such Non-U.S. Holder's gross estate for U.S. federal estate tax purposes and may be subject to U.S. federal estate tax unless an applicable estate tax treaty provides otherwise.
166
UNDERWRITING (CONFLICTS OF INTEREST)
We are offering the shares of common stock described in this prospectus through a number of underwriters. J.P. Morgan Securities LLC, Credit Suisse Securities (USA) LLC, Goldman, Sachs & Co. and Morgan Stanley & Co. LLC are acting as representatives of the underwriters. We will enter into an underwriting agreement with the underwriters. Subject to the terms and conditions of the underwriting agreement, we have agreed to sell to the underwriters, and each underwriter has severally agreed to purchase, at the public offering price less the underwriting discounts and commissions set forth on the cover page of this prospectus, the number of shares of common stock listed next to its name in the following table:
Name
|
Number of Shares |
|||
|---|---|---|---|---|
| J.P. Morgan Securities LLC | ||||
| Credit Suisse Securities (USA) LLC | ||||
| Goldman, Sachs & Co. | ||||
| Morgan Stanley & Co. LLC | ||||
| Natixis Securities Americas LLC | ||||
| Merrill Lynch, Pierce, Fenner & Smith Incorporated |
||||
| Jefferies LLC | ||||
| RBC Capital Markets, LLC | ||||
| Robert W. Baird & Co. Incorporated | ||||
| Piper Jaffray & Co. | ||||
| Samuel A. Ramirez & Company, Inc. | ||||
| | | | | |
| Total | 25,000,000 | |||
| | | | | |
| | | | | |
| | | | | |
The underwriters are committed to purchase all the common shares offered by us if they purchase any shares, other than those shares covered by the underwriters' option to purchase additional shares described below. The underwriting agreement will also provide that if an underwriter defaults, the purchase commitments of non-defaulting underwriters may also be increased or the offering may be terminated.
The underwriters have an option to buy on a pro rata basis up to 3,750,000 additional shares of common stock from us at the public offering price less the underwriting discounts and commissions to cover sales of shares by the underwriters which exceed the number of shares specified in the table above. The underwriters have 30 days from the date of this prospectus to exercise this option. If any additional shares of common stock are purchased, the underwriters will offer the additional shares on the same terms as those on which the shares are being offered.
The underwriters propose to offer the common shares directly to the public at the public offering price set forth on the cover page of this prospectus and to certain dealers at that price less a concession not in excess of $ per share. After the public offering of the shares, the offering price and other selling terms may be changed by the underwriters. Sales of shares made outside of the United States may be made by affiliates of the underwriters.
The underwriting fee is equal to the public offering price per share of common stock less the amount paid by the underwriters to the selling stockholders per share of common stock. The underwriting fee is $ per share. The following table shows the per share and total underwriting
167
discounts and commissions to be paid to the underwriters by the selling stockholders assuming both no exercise and full exercise of the underwriters' option to purchase additional shares.
| |
Without exercise of option |
With exercise of option |
|||||
|---|---|---|---|---|---|---|---|
Per share |
$ | $ | |||||
Total |
$ | $ | |||||
We estimate that the total expenses of this offering payable by us, including registration, filing and listing fees, printing fees and legal and accounting expenses, but excluding the underwriting discounts and commissions, which will be payable by the selling stockholders, will be approximately $1.6 million. We have agreed to reimburse the underwriters for expenses up to $25,000 related to clearance of this offering with the Financial Industry Regulatory Authority, Inc., or "FINRA." The underwriters have agreed to reimburse us in an amount of $400,000 for certain expenses of the offering.
A prospectus in electronic format may be made available on the web sites maintained by one or more underwriters, or selling group members, if any, participating in the offering. The underwriters may agree to allocate a number of shares to underwriters and selling group members for sale to their online brokerage account holders. Internet distributions will be allocated by the representatives to underwriters and selling group members that may make Internet distributions on the same basis as other allocations.
We have agreed that we will not (i) offer, sell, contract to sell, pledge, grant any option to purchase, make any short sale or otherwise transfer or dispose of, or file with the SEC a registration statement under the Act relating to, any of our securities that are substantially similar to the securities offered hereby, including but not limited to any options or warrants to purchase shares of our common stock or any securities that are convertible into or exchangeable for, or that represent the right to receive, shares of our common stock or any such substantially similar securities or publicly disclose the intention to make any offer, sale, disposition or filing, or (ii) enter into any swap or other agreement that transfers any of the economic consequences of ownership of our common stock or any such other securities (in each case except as provided in the underwriting agreement), in each case without the prior written consent of J.P. Morgan Securities LLC and Credit Suisse Securities (USA) LLC, for a period of 90 days after the date of this prospectus. Notwithstanding the foregoing, if (1) during the last 17 days of the 90-day restricted period, we issue an earnings release or announce material news or a material event; or (2) prior to the expiration of the 90-day restricted period, we announce that we will release earnings results during the 16-day period beginning on the last day of the 90-day period, the restrictions described above shall continue to apply until the expiration of the 18-day period beginning on the release of the earnings results or the announcement of the material news or material event.
Our directors, executive officers, the CD&R Funds, the StepStone Funds, JPMorgan and Ridgemont will enter into lock-up agreements with the underwriters prior to the commencement of this offering pursuant to which each of these persons or entities, with limited exceptions, for a period of 90 days after the date of this prospectus, may not, without the prior written consent of J.P. Morgan Securities LLC and Credit Suisse Securities (USA) LLC, offer, sell, contract to sell, pledge, grant any option to purchase, make any short sale or otherwise dispose of any shares of our common stock, enter into any swap or other agreement that transfers, in whole or in part, the economic consequences of ownership of any such securities held by them, or any options or warrants to purchase any shares of our common stock, shares acquired upon the vesting of restricted stock units or settlement of deferred stock units or any securities convertible into, exchangeable for or that represent the right to receive shares of our common stock. The lock-up agreements will contain exceptions for, among other things, dispositions of shares of our common stock to us or our retention of shares of our common stock to satisfy tax withholding obligations or in payment of the exercise or purchase price in connection with the exercise of options to purchase common stock, the vesting of restricted stock units or the
168
settlement of deferred stock units. Notwithstanding the foregoing, if (1) during the last 17 days of the 90-day restricted period, we issue an earnings release or announce material news or a material event; or (2) prior to the expiration of the 90-day restricted period, we announce that we will release earnings results during the 16-day period beginning on the last day of the 90-day period, the restrictions described above shall continue to apply until the expiration of the 18-day period beginning on the release of the earnings results or the announcement of the material news or material event.
We and the selling stockholders have agreed to indemnify the several underwriters against certain liabilities, including liabilities under the Securities Act, or contribute payments that the underwriters may be required to make in that respect.
In connection with this offering, the underwriters may engage in stabilizing transactions, which involves making bids for, purchasing and selling shares of common stock in the open market for the purpose of preventing or retarding a decline in the market price of the common stock while this offering is in progress. These stabilizing transactions may include making short sales of the common stock, which involves the sale by the underwriters of a greater number of shares of common stock than they are required to purchase in this offering, and purchasing shares of common stock on the open market to cover positions created by short sales. Short sales may be "covered" shorts, which are short positions in an amount not greater than the underwriters' option to purchase additional shares referred to above, or may be "naked" shorts, which are short positions in excess of that amount. The underwriters may close out any covered short position either by exercising their option to purchase additional shares, in whole or in part, or by purchasing shares in the open market. In making this determination, the underwriters will consider, among other things, the price of shares available for purchase in the open market compared to the price at which the underwriters may purchase shares through the option to purchase additional shares. A naked short position is more likely to be created if the underwriters are concerned that there may be downward pressure on the price of the common stock in the open market that could adversely affect investors who purchase in this offering. To the extent that the underwriters create a naked short position, they will purchase shares in the open market to cover the position.
The underwriters have advised us that, pursuant to Regulation M of the Securities Act, they may also engage in other activities that stabilize, maintain or otherwise affect the price of the common stock, including the imposition of penalty bids. This means that if the representatives of the underwriters purchase common stock in the open market in stabilizing transactions or to cover short sales, the representatives can require the underwriters that sold those shares as part of this offering to repay the underwriting discount received by them.
These activities may have the effect of raising or maintaining the market price of the common stock or preventing or retarding a decline in the market price of the common stock, and, as a result, the price of the common stock may be higher than the price that otherwise might exist in the open market. If the underwriters commence these activities, they may discontinue them at any time. The underwriters may carry out these transactions on the NYSE, in the over-the-counter market or otherwise.
Other than in the United States, no action has been taken by us or the underwriters that would permit a public offering of the securities offered by this prospectus in any jurisdiction where action for that purpose is required. The securities offered by this prospectus may not be offered or sold, directly or indirectly, nor may this prospectus or any other offering material or advertisements in connection with the offer and sale of any such securities be distributed or published in any jurisdiction, except under circumstances that will result in compliance with the applicable rules and regulations of that jurisdiction. Persons into whose possession this prospectus comes are advised to inform themselves about and to observe any restrictions relating to the offering and the distribution of this prospectus.
169
This prospectus does not constitute an offer to sell or a solicitation of an offer to buy any securities offered by this prospectus in any jurisdiction in which such an offer or a solicitation is unlawful.
Selling Restrictions
United Kingdom
This document is only being distributed to and is only directed at (i) persons who are outside the United Kingdom or (ii) to investment professionals falling within Article 19(5) of the Financial Services and Markets Act 2000 (Financial Promotion) Order 2005, or the "Order," or (iii) high net worth entities, and other persons to whom it may lawfully be communicated, falling with Article 49(2)(a) to (d) of the Order (all such persons together being referred to as "relevant persons"). The securities are only available to, and any invitation, offer or agreement to subscribe, purchase or otherwise acquire such securities will be engaged in only with, relevant persons. Any person who is not a relevant person should not act or rely on this document or any of its contents.
Switzerland
The shares may not be publicly offered in Switzerland and will not be listed on the SIX Swiss Exchange, or "SIX" or on any other stock exchange or regulated trading facility in Switzerland. This document has been prepared without regard to the disclosure standards for issuance prospectuses under art. 652a or art. 1156 of the Swiss Code of Obligations or the disclosure standards for listing prospectuses under art. 27 ff. of the SIX Listing Rules or the listing rules of any other stock exchange or regulated trading facility in Switzerland. Neither this document nor any other offering or marketing material relating to the shares or the offering may be publicly distributed or otherwise made publicly available in Switzerland.
Neither this document nor any other offering or marketing material relating to the offering, us or the shares have been or will be filed with or approved by any Swiss regulatory authority. In particular, this document will not be filed with, and the offer of shares will not be supervised by, the Swiss Financial Market Supervisory Authority, or "FINMA," and the offer of shares has not been and will not be authorized under the Swiss Federal Act on Collective Investment Schemes, or "CISA." The investor protection afforded to acquirers of interests in collective investment schemes under the CISA does not extend to acquirers of shares.
European Economic Area
In relation to each Member State of the European Economic Area which has implemented the Prospectus Directive, each, a "Relevant Member State," from and including the date on which the European Union Prospectus Directive, or the "EU Prospectus Directive," was implemented in that Relevant Member State, or the "Relevant Implementation Date," an offer of securities described in this prospectus may not be made to the public in that Relevant Member State prior to the publication of a prospectus in relation to the shares which has been approved by the competent authority in that Relevant Member State or, where appropriate, approved in another Relevant Member State and notified to the competent authority in that Relevant Member State, all in accordance with the EU Prospectus Directive, except that, with effect from and including the Relevant Implementation Date, an offer of securities described in this prospectus may be made to the public in that Relevant Member State at any time:
(a) to any legal entity which is a qualified investor as defined in the Prospectus Directive;
(b) to fewer than 100 or, if the Relevant Member State has implemented the relevant provision of the 2010 PD Amending Directive, 150, natural or legal persons (other than qualified investors as defined in the Prospectus Directive), as permitted under the Prospectus Directive,
170
subject to obtaining the prior consent of the relevant dealer or dealers nominated by us for any such offer; or
(c) in any other circumstances falling within Article 3(2) of the Prospectus Directive,
provided that no such offer of shares shall require us or the underwriters to publish a prospectus pursuant to Article 3 of the Prospectus Directive.
For the purposes of this provision, the expression an "offer of shares to the public" in relation to any shares in any Relevant Member State means the communication in any form and by any means of sufficient information on the terms of the offer and the shares to be offered so as to enable an investor to decide to purchase or subscribe the shares, as the same may be varied in that Member State by any measure implementing the Prospectus Directive in that Member State, the expression Prospectus Directive means Directive 2003/71/EC (and amendments thereto, including the 2010 PD Amending Directive, to the extent implemented in the Relevant Member State), and includes any relevant implementing measure in the Relevant Member State and the expression "2010 PD Amending Directive" means Directive 2010/73/EU.
Dubai International Financial Centre
This prospectus relates to an Exempt Offer in accordance with the Offered Securities Rules of the Dubai Financial Services Authority, or "DFSA." This prospectus is intended for distribution only to persons of a type specified in the Offered Securities Rules of the DFSA. It must not be delivered to, or relied on by, any other person. The DFSA has no responsibility for reviewing or verifying any documents in connection with Exempt Offers. The DFSA has not approved this prospectus nor taken steps to verify the information set forth herein and has no responsibility for the prospectus. The shares to which this prospectus relates may be illiquid and/or subject to restrictions on their resale. Prospective purchasers of the shares offered should conduct their own due diligence on the shares. If you do not understand the contents of this prospectus you should consult an authorized financial advisor.
Australia
No placement document, prospectus, product disclosure statement or other disclosure document has been lodged with the Australian Securities and Investments Commission ("ASIC"), in relation to the offering. This prospectus does not constitute a prospectus, product disclosure statement or other disclosure document under the Corporations Act 2001 (the "Corporations Act"), and does not purport to include the information required for a prospectus, product disclosure statement or other disclosure document under the Corporations Act.
Any offer in Australia of the shares may only be made to persons (the "Exempt Investors") who are "sophisticated investors" (within the meaning of section 708(8) of the Corporations Act), "professional investors" (within the meaning of section 708(11) of the Corporations Act) or otherwise pursuant to one or more exemptions contained in section 708 of the Corporations Act so that it is lawful to offer the shares without disclosure to investors under Chapter 6D of the Corporations Act.
The shares applied for by Exempt Investors in Australia must not be offered for sale in Australia in the period of 12 months after the date of allotment under the offering, except in circumstances where disclosure to investors under Chapter 6D of the Corporations Act would not be required pursuant to an exemption under section 708 of the Corporations Act or otherwise or where the offer is pursuant to a disclosure document which complies with Chapter 6D of the Corporations Act. Any person acquiring shares must observe such Australian on-sale restrictions.
This prospectus contains general information only and does not take account of the investment objectives, financial situation or particular needs of any particular person. It does not contain any securities recommendations or financial product advice. Before making an investment decision,
171
investors need to consider whether the information in this prospectus is appropriate to their needs, objectives and circumstances, and, if necessary, seek expert advice on those matters.
Hong Kong
The securities have not been offered or sold and will not be offered or sold in Hong Kong, by means of any document, other than (a) to "professional investors" as defined in the Securities and Futures Ordinance (Cap. 571) of Hong Kong and any rules made under that Ordinance; or (b) in other circumstances which do not result in the document being a "prospectus" as defined in the Companies Ordinance (Cap. 32) of Hong Kong or which do not constitute an offer to the public within the meaning of that Ordinance. No advertisement, invitation or document relating to the securities has been or may be issued or has been or may be in the possession of any person for the purposes of issue, whether in Hong Kong or elsewhere, which is directed at, or the contents of which are likely to be accessed or read by, the public of Hong Kong (except if permitted to do so under the securities laws of Hong Kong) other than with respect to securities which are or are intended to be disposed of only to persons outside Hong Kong or only to "professional investors" as defined in the Securities and Futures Ordinance and any rules made under that Ordinance.
Japan
The securities have not been and will not be registered under the Financial Instruments and Exchange Law of Japan (Law No. 25 of 1948, as amended) and, accordingly, will not be offered or sold, directly or indirectly, in Japan, or for the benefit of any Japanese Person or to others for re-offering or resale, directly or indirectly, in Japan or to any Japanese Person, except in compliance with all applicable laws, regulations and ministerial guidelines promulgated by relevant Japanese governmental or regulatory authorities in effect at the relevant time. For the purposes of this paragraph, "Japanese Person" shall mean any person resident in Japan, including any corporation or other entity organized under the laws of Japan.
Singapore
This prospectus has not been registered as a prospectus with the Monetary Authority of Singapore. Accordingly, this prospectus and any other document or material in connection with the offer or sale, or invitation for subscription or purchase, of Non-CIS Securities may not be circulated or distributed, nor may the Non-CIS Securities be offered or sold, or be made the subject of an invitation for subscription or purchase, whether directly or indirectly, to persons in Singapore other than (i) to an institutional investor under Section 274 of the Securities and Futures Act, Chapter 289 of Singapore (the "SFA"), (ii) to a relevant person pursuant to Section 275(1), or any person pursuant to Section 275(1A), and in accordance with the conditions specified in Section 275, of the SFA, or (iii) otherwise pursuant to, and in accordance with the conditions of, any other applicable provision of the SFA.
Where the Non-CIS Securities are subscribed or purchased under Section 275 of the SFA by a relevant person which is:
- (a)
- a corporation (which is not an accredited investor (as defined in Section 4A of the SFA)), the sole business of which is to hold investments and the entire share capital of which is owned by one or more individuals, each of whom is an accredited investor; or
a trust (where the trustee is not an accredited investor) whose sole purpose is to hold investments and each beneficiary of the trust is an individual who is an accredited investor,
securities (as defined in Section 239(1) of the SFA) of that corporation or the beneficiaries' rights and interest (howsoever described) in that trust shall not be transferred within six months after that
172
corporation or that trust has acquired the Non-CIS Securities pursuant to an offer made under Section 275 of the SFA except:
- (a)
- to an institutional investor or to a relevant person defined in Section 275(2) of the SFA, or to any person arising from an offer referred to in Section 275(1A) or Section 276(4)(i)(B) of the SFA;
where no consideration is or will be given for the transfer;
where the transfer is by operation of law;
as specified in Section 276(7) of the SFA; or
as specified in Regulation 32 of the Securities and Futures (Offers of Investments) (Shares and Debentures) Regulations 2005 of Singapore.
Conflicts of Interest
JPMorgan, an affiliate of J.P. Morgan Securities LLC is one of the selling stockholders in this offering and will receive net proceeds exceeding 5% of the net proceeds of this offering. As a result it is deemed to have a "conflict of interest" with us within the meaning of Rule 5121. Accordingly, this offering is being made in compliance with the requirements of Rule 5121. Because the common stock to be offered has a bona fide public market, pursuant to Rule 5121, the appointment of a qualified independent underwriter is not necessary. J.P. Morgan Securities LLC will not confirm sales of the common stock to any account over which it exercises discretionary authority without the prior written approval of the customer.
Other Relationships
The underwriters and their affiliates have provided in the past to us and our affiliates and may provide from time to time in the future certain commercial banking, financial advisory, investment banking and other services for us and such affiliates in the ordinary course of their business, for which they have received and may continue to receive customary fees and commissions. In addition, from time to time, certain of the underwriters and their affiliates may effect transactions for their own account or the account of customers, and hold on behalf of themselves or their customers, long or short positions in our debt or equity securities or loans, and may do so in the future.
J.P. Morgan Securities LLC, Credit Suisse Securities (USA) LLC, Goldman, Sachs & Co., Merrill Lynch, Pierce, Fenner & Smith Incorporated and affiliates of Morgan Stanley & Co. LLC, Jefferies LLC, RBC Capital Markets, LLC and Natixis Securities Americas LLC acted as joint lead arrangers and joint bookrunners, and affiliates of the underwriters act as lenders, under our Term Facilities and our Revolving Credit Facility. In addition, J.P. Morgan Securities LLC, Credit Suisse Securities (USA) LLC, Goldman, Sachs & Co., Morgan Stanley & Co. LLC and Natixis Securities Americas LLC acted as initial purchasers of the 2020 Notes, for which they received customary compensation.
In addition, JPMorgan, an affiliate of J.P. Morgan Securities LLC, holds the interest in our common stock described in "Prospectus Summary—Equity Sponsors and Organizational Structure" and "Principal and Selling Stockholders" and is party to the agreements with us described in "Certain Relationships and Related Party Transactions." JPMorgan is also one of the selling stockholders for this offering and as such will receive part of the proceeds therefrom.
173
The validity of the shares of our common stock offered hereby will be passed upon for us by Debevoise & Plimpton LLP, New York, New York. The validity of the shares of our common stock offered hereby will be passed upon for the underwriters by Simpson Thacher & Bartlett LLP, New York, New York.
The financial statements as of December 31, 2013 and 2012 and for each of the three years in the period ended December 31, 2013 included in this prospectus and the related financial statement schedules included elsewhere in the registration statement have been audited by Deloitte & Touche LLP, an independent registered public accounting firm, as stated in their reports appearing herein and elsewhere in the registration statement. Such financial statements and financial statement schedules are included in reliance upon the reports of such firm given upon their authority as experts in accounting and auditing.
WHERE YOU CAN FIND MORE INFORMATION
We have filed with the SEC a registration statement on Form S-1 with respect to the shares of our common stock being sold in this offering. This prospectus does not contain all of the information set forth in the registration statement and the exhibits thereto because some parts have been omitted in accordance with the rules and regulations of the SEC. You will find additional information about us and the common stock being sold in this offering in the registration statement and the exhibits thereto. For further information with respect to ServiceMaster and the common stock being sold in this offering, reference is made to the registration statement and the exhibits filed therewith. Statements contained in this prospectus as to the contents of any contract or other document referred to are not necessarily complete and in each instance, if such contract or document is filed as an exhibit, reference is made to the copy of such contract or other document filed as an exhibit to the registration statement, each statement being qualified in all respects by such reference. A copy of the registration statement, including the exhibits thereto, may be read and copied at the SEC's Public Reference Room at 100 F Street, N.E., Room 1580, Washington, D.C. 20549. Information on the operation of the Public Reference Room may be obtained by calling the SEC at 1-800-SEC-0330. In addition, the SEC maintains an internet site at http://www.sec.gov, from which interested persons can electronically access the registration statement, including the exhibits and any schedules thereto. Copies of the registration statement, including the exhibits and schedules thereto, are also available at your request, without charge, from ServiceMaster Global Holdings, Inc., 860 Ridge Lake Boulevard, Memphis, Tennessee 38120.
We are subject to the informational requirements of the Exchange Act and, accordingly, will file annual reports containing financial statements audited by an independent registered public accounting firm, quarterly reports containing unaudited financial statements, current reports, proxy statements and other information with the SEC. You will be able to inspect and copy these reports, proxy statements and other information at the public reference facilities maintained by the SEC at the address noted above. You will also be able to obtain copies of this material from the Public Reference Room of the SEC as described above, or inspect them without charge at the SEC's website. You will also be able to access, free of charge, our reports filed with the SEC (for example, our Annual Reports on Form 10-K, our Quarterly Reports on Form 10-Q and our Current Reports on Form 8-K and any amendments to those forms) through our website (www.servicemaster.com). Reports filed with or furnished to the SEC will be available as soon as reasonably practicable after they are filed with or furnished to the SEC. None of the information contained on, or that may be accessed through our websites or any other website identified herein is part of, or incorporated into, this prospectus. All website addresses in this prospectus are intended to be inactive textual references only.
174
F-1
REPORT OF INDEPENDENT REGISTERED PUBLIC ACCOUNTING FIRM
To
the Board of Directors and Shareholders of
ServiceMaster Global Holdings, Inc.
Memphis, Tennessee
We have audited the accompanying consolidated statements of financial position of ServiceMaster Global Holdings, Inc., and subsidiaries (the "Company") as of December 31, 2013 and 2012, and the related consolidated statements of operations and comprehensive (loss) income, shareholders' equity, and cash flows for each of the three years in the period ended December 31, 2013. These financial statements are the responsibility of the Company's management. Our responsibility is to express an opinion on these financial statements based on our audits.
We conducted our audits in accordance with the standards of the Public Company Accounting Oversight Board (United States). Those standards require that we plan and perform the audit to obtain reasonable assurance about whether the financial statements are free of material misstatement. The Company is not required to have, nor were we engaged to perform, an audit of its internal control over financial reporting. Our audits included consideration of internal control over financial reporting as a basis for designing audit procedures that are appropriate in the circumstances, but not for the purpose of expressing an opinion on the effectiveness of the Company's internal control over financial reporting. Accordingly, we express no such opinion. An audit also includes examining, on a test basis, evidence supporting the amounts and disclosures in the financial statements, assessing the accounting principles used and significant estimates made by management, as well as evaluating the overall financial statement presentation. We believe that our audits provide a reasonable basis for our opinion.
In our opinion, such consolidated financial statements present fairly, in all material respects, the financial position of ServiceMaster Global Holdings, Inc., and subsidiaries as of December 31, 2013 and 2012, and the results of their operations and their cash flows for each of the three years in the period ended December 31, 2013, in conformity with accounting principles generally accepted in the United States of America.
/s/
Deloitte & Touche LLP
Memphis, Tennessee
March 24, 2014 (May 9, 2014 as to Note 3 and Note 7 to the consolidated financial statements; June 13, 2014 as to the reverse stock split described in Note 20 to the consolidated financial statements)
F-2
SERVICEMASTER GLOBAL HOLDINGS, INC.
Consolidated Statements of Operations and Comprehensive (Loss) Income
(In millions, except per share data)
| |
Year Ended December 31, | |||||||||
|---|---|---|---|---|---|---|---|---|---|---|
| |
2013 | 2012 | 2011 | |||||||
Revenue |
$ | 2,293 | $ | 2,214 | $ | 2,105 | ||||
Cost of services rendered and products sold |
1,220 | 1,196 | 1,125 | |||||||
Selling and administrative expenses |
691 | 678 | 648 | |||||||
Amortization expense |
51 | 58 | 83 | |||||||
Restructuring charges |
6 | 15 | 7 | |||||||
Interest expense |
247 | 245 | 266 | |||||||
Interest and net investment income |
(8 | ) | (7 | ) | (11 | ) | ||||
Loss on extinguishment of debt |
— | 55 | — | |||||||
| | | | | | | | | | | |
Income (Loss) from Continuing Operations before Income Taxes |
86 | (26 | ) | (13 | ) | |||||
Provision (benefit) for income taxes |
43 | (8 | ) | (6 | ) | |||||
Equity in losses of joint venture |
(1 | ) | — | — | ||||||
| | | | | | | | | | | |
Income (Loss) from Continuing Operations |
42 | (18 | ) | (7 | ) | |||||
(Loss) income from discontinued operations, net of income taxes |
(549 | ) | (696 | ) | 53 | |||||
| | | | | | | | | | | |
Net (Loss) Income |
(507 | ) | (714 | ) | 46 | |||||
| | | | | | | | | | | |
Other Comprehensive Income, Net of Income Taxes: |
||||||||||
Net unrealized gains (losses) on securities |
1 | 1 | (1 | ) | ||||||
Net unrealized gains on derivative instruments |
3 | 12 | 13 | |||||||
Foreign currency translation |
(4 | ) | — | (1 | ) | |||||
| | | | | | | | | | | |
Other Comprehensive Income, Net of Income Taxes |
— | 13 | 11 | |||||||
| | | | | | | | | | | |
Total Comprehensive (Loss) Income |
$ | (507 | ) | $ | (701 | ) | $ | 57 | ||
| | | | | | | | | | | |
| | | | | | | | | | | |
| | | | | | | | | | | |
Basic (Loss) Earnings Per Share: |
||||||||||
Income (loss) from continuing operations |
$ | 0.46 | $ | (0.20 | ) | $ | (0.08 | ) | ||
(Loss) income from discontinued operations, net of income taxes |
(6.00 | ) | (7.57 | ) | 0.58 | |||||
Net (loss) income |
(5.53 | ) | (7.77 | ) | 0.50 | |||||
Diluted (Loss) Earnings Per Share: |
||||||||||
Income (loss) from continuing operations |
$ | 0.46 | $ | (0.20 | ) | $ | (0.08 | ) | ||
(Loss) income from discontinued operations, net of income taxes |
(5.95 | ) | (7.57 | ) | 0.58 | |||||
Net (loss) income |
(5.49 | ) | (7.77 | ) | 0.50 | |||||
See accompanying Notes to the Consolidated Financial Statements.
F-3
SERVICEMASTER GLOBAL HOLDINGS, INC.
Consolidated Statements of Financial Position
(In millions, except share data)
| |
As of December 31, |
||||||
|---|---|---|---|---|---|---|---|
| |
2013 | 2012 | |||||
Assets: |
|||||||
Current Assets: |
|||||||
Cash and cash equivalents |
$ | 484 | $ | 418 | |||
Marketable securities |
27 | 19 | |||||
Receivables, less allowances of $26 and $23, respectively |
394 | 372 | |||||
Inventories |
39 | 40 | |||||
Prepaid expenses and other assets |
56 | 35 | |||||
Deferred customer acquisition costs |
30 | 27 | |||||
Deferred taxes |
107 | 103 | |||||
Assets of discontinued operations |
76 | 71 | |||||
| | | | | | | | |
Total Current Assets |
1,213 | 1,085 | |||||
| | | | | | | | |
Property and Equipment: |
|||||||
At cost |
381 | 322 | |||||
Less: accumulated depreciation |
(204 | ) | (164 | ) | |||
| | | | | | | | |
Net Property and Equipment |
177 | 158 | |||||
| | | | | | | | |
Other Assets: |
|||||||
Goodwill |
2,018 | 1,995 | |||||
Intangible assets, primarily trade names, service marks and trademarks, net |
1,721 | 1,758 | |||||
Notes receivable |
22 | 22 | |||||
Long-term marketable securities |
122 | 127 | |||||
Other assets |
49 | 7 | |||||
Debt issuance costs |
41 | 45 | |||||
Assets of discontinued operations |
542 | 1,218 | |||||
| | | | | | | | |
Total Assets |
$ | 5,905 | $ | 6,415 | |||
| | | | | | | | |
| | | | | | | | |
| | | | | | | | |
Liabilities and Shareholders' (Deficit) Equity: |
|||||||
Current Liabilities: |
|||||||
Accounts payable |
$ | 92 | $ | 73 | |||
Accrued liabilities: |
|||||||
Payroll and related expenses |
70 | 69 | |||||
Self-insured claims and related expenses |
78 | 82 | |||||
Accrued interest payable |
51 | 54 | |||||
Other |
55 | 54 | |||||
Deferred revenue |
448 | 423 | |||||
Liabilities of discontinued operations |
139 | 101 | |||||
Current portion of long-term debt |
39 | 43 | |||||
| | | | | | | | |
Total Current Liabilities |
972 | 899 | |||||
| | | | | | | | |
Long-Term Debt |
3,867 | 3,881 | |||||
Other Long-Term Liabilities: |
|||||||
Deferred taxes |
712 | 699 | |||||
Liabilities of discontinued operations |
162 | 290 | |||||
Other long-term obligations, primarily self-insured claims |
169 | 111 | |||||
| | | | | | | | |
Total Other Long-Term Liabilities |
1,043 | 1,100 | |||||
| | | | | | | | |
Commitments and Contingencies (See Note 9) |
|||||||
Shareholders' Equity: |
|||||||
Common stock $0.01 par value, authorized 2,000,000,000 shares; issued 98,915,432 and 98,336,958 shares at December 31, 2013 and 2012, respectively |
1 | 1 | |||||
Additional paid-in capital |
1,523 | 1,513 | |||||
Retained deficit |
(1,390 | ) | (883 | ) | |||
Accumulated other comprehensive income |
7 | 7 | |||||
| | | | | | | | |
Less common stock held in treasury, at cost |
(118 | ) | (103 | ) | |||
| | | | | | | | |
Total Shareholders' Equity |
23 | 535 | |||||
| | | | | | | | |
Total Liabilities and Shareholders' Equity |
$ | 5,905 | $ | 6,415 | |||
| | | | | | | | |
| | | | | | | | |
| | | | | | | | |
See accompanying Notes to the Consolidated Financial Statements.
F-4
SERVICEMASTER GLOBAL HOLDINGS, INC.
Consolidated Statements of Shareholders' Equity
(In millions)
| |
|
|
|
|
Accumulated Other Comprehensive Income (Loss) |
Treasury | |
||||||||||||||||||
|---|---|---|---|---|---|---|---|---|---|---|---|---|---|---|---|---|---|---|---|---|---|---|---|---|---|
| |
|
Common Stock |
Additional Paid-in Capital |
Retained Earnings (Deficit) |
Total Equity |
||||||||||||||||||||
| |
Shares | Shares | Amount | ||||||||||||||||||||||
Balance December 31, 2010 |
97 | $ | 1 | $ | 1,485 | $ | (215 | ) | $ | (17 | ) | — | $ | (8 | ) | $ | 1,246 | ||||||||
| | | | | | | | | | | | | | | | | | | | | | | | | | |
Net income |
46 | 46 | |||||||||||||||||||||||
Other comprehensive income, net of tax |
11 | 11 | |||||||||||||||||||||||
| | | | | | | | | | | | | | | | | | | | | | | | | | |
Total comprehensive income |
46 | 11 | 57 | ||||||||||||||||||||||
Issuance of common stock |
6 | 6 | |||||||||||||||||||||||
Exercise of stock options |
1 | 5 | 5 | ||||||||||||||||||||||
Vesting of RSUs |
(1 | ) | (1 | ) | |||||||||||||||||||||
DSUs converted into common stock |
(1 | ) | 1 | — | |||||||||||||||||||||
Repurchase of common stock |
(6 | ) | (87 | ) | (87 | ) | |||||||||||||||||||
Stock-based employee compensation |
8 | 8 | |||||||||||||||||||||||
| | | | | | | | | | | | | | | | | | | | | | | | | | |
Balance December 31, 2011 |
98 | $ | 1 | $ | 1,502 | $ | (169 | ) | $ | (6 | ) | (6 | ) | $ | (94 | ) | $ | 1,234 | |||||||
| | | | | | | | | | | | | | | | | | | | | | | | | | |
Net loss |
(714 | ) | (714 | ) | |||||||||||||||||||||
Other comprehensive income, net of tax |
13 | 13 | |||||||||||||||||||||||
| | | | | | | | | | | | | | | | | | | | | | | | | | |
Total comprehensive loss |
(714 | ) | 13 | (701 | ) | ||||||||||||||||||||
Issuance of common stock |
2 | 2 | |||||||||||||||||||||||
Exercise of stock options |
4 | 4 | |||||||||||||||||||||||
Vesting of RSUs |
(1 | ) | (1 | ) | |||||||||||||||||||||
DSUs converted into common stock |
(1 | ) | 1 | — | |||||||||||||||||||||
Repurchase of common stock |
(10 | ) | (10 | ) | |||||||||||||||||||||
Stock-based employee compensation |
7 | 7 | |||||||||||||||||||||||
| | | | | | | | | | | | | | | | | | | | | | | | | | |
Balance December 31, 2012 |
98 | $ | 1 | $ | 1,513 | $ | (883 | ) | $ | 7 | (6 | ) | $ | (103 | ) | $ | 535 | ||||||||
| | | | | | | | | | | | | | | | | | | | | | | | | | |
Net loss |
(507 | ) | (507 | ) | |||||||||||||||||||||
Other comprehensive income, net of tax |
— | — | |||||||||||||||||||||||
| | | | | | | | | | | | | | | | | | | | | | | | | | |
Total comprehensive loss |
(507 | ) | (507 | ) | |||||||||||||||||||||
Issuance of common stock |
1 | 7 | 7 | ||||||||||||||||||||||
Exercise of stock options |
1 | 1 | |||||||||||||||||||||||
Vesting of RSUs |
(1 | ) | (1 | ) | |||||||||||||||||||||
DSUs converted into common stock |
(1 | ) | 1 | — | |||||||||||||||||||||
Repurchase of common stock |
(1 | ) | (16 | ) | (16 | ) | |||||||||||||||||||
Stock-based employee compensation |
4 | 4 | |||||||||||||||||||||||
| | | | | | | | | | | | | | | | | | | | | | | | | | |
Balance December 31, 2013 |
99 | $ | 1 | $ | 1,523 | $ | (1,390 | ) | $ | 7 | (7 | ) | $ | (118 | ) | $ | 23 | ||||||||
| | | | | | | | | | | | | | | | | | | | | | | | | | |
| | | | | | | | | | | | | | | | | | | | | | | | | | |
| | | | | | | | | | | | | | | | | | | | | | | | | | |
See accompanying Notes to the Consolidated Financial Statements.
F-5
SERVICEMASTER GLOBAL HOLDINGS, INC.
Consolidated Statements of Cash Flows
(In millions)
| |
Year Ended December 31, | |||||||||
|---|---|---|---|---|---|---|---|---|---|---|
| |
2013 | 2012 | 2011 | |||||||
Cash and Cash Equivalents at Beginning of Period |
$ | 418 | $ | 330 | $ | 258 | ||||
Cash Flows from Operating Activities from Continuing Operations: |
||||||||||
Net (Loss) Income |
(507 | ) | (714 | ) | 46 | |||||
Adjustments to reconcile net (loss) income to net cash provided from operating activities: |
||||||||||
Loss from discontinued operations, net of income taxes |
549 | 696 | (53 | ) | ||||||
Equity in losses of joint venture |
1 | — | — | |||||||
Depreciation expense |
48 | 42 | 38 | |||||||
Amortization expense |
51 | 58 | 83 | |||||||
Amortization of debt issuance costs |
10 | 13 | 14 | |||||||
Loss on extinguishment of debt |
— | 55 | — | |||||||
Call premium paid on retirement of debt |
— | (43 | ) | — | ||||||
Premium received on issuance of debt |
— | 3 | — | |||||||
Deferred income tax (benefit) provision |
33 | (15 | ) | (8 | ) | |||||
Stock-based compensation expense |
4 | 7 | 8 | |||||||
Restructuring charges |
6 | 15 | 7 | |||||||
Cash payments related to restructuring charges |
(9 | ) | (15 | ) | (6 | ) | ||||
Change in working capital, net of acquisitions: |
||||||||||
Current income taxes |
— | 2 | (10 | ) | ||||||
Receivables |
(21 | ) | (20 | ) | (32 | ) | ||||
Inventories and other current assets |
(1 | ) | 11 | 3 | ||||||
Accounts payable |
16 | 9 | 3 | |||||||
Deferred revenue |
25 | 15 | 8 | |||||||
Accrued liabilities |
1 | (36 | ) | (26 | ) | |||||
Other, net |
2 | 21 | (1 | ) | ||||||
| | | | | | | | | | | |
Net Cash Provided from Operating Activities from Continuing Operations |
208 | 104 | 74 | |||||||
| | | | | | | | | | | |
Cash Flows from Investing Activities from Continuing Operations: |
||||||||||
Property additions |
(39 | ) | (44 | ) | (52 | ) | ||||
Sale of equipment and other assets |
1 | — | 3 | |||||||
Other business acquisitions, net of cash acquired |
(32 | ) | (40 | ) | (32 | ) | ||||
Purchase of other intangibles |
— | — | (2 | ) | ||||||
Notes receivable, financial investments and securities, net |
— | (1 | ) | 3 | ||||||
| | | | | | | | | | | |
Net Cash Used for Investing Activities from Continuing Operations |
(70 | ) | (85 | ) | (80 | ) | ||||
| | | | | | | | | | | |
Cash Flows from Financing Activities from Continuing Operations: |
||||||||||
Borrowings of debt |
1 | 1,350 | 4 | |||||||
Payments of debt |
(53 | ) | (1,326 | ) | (36 | ) | ||||
Repurchase of common stock and RSU vesting |
(16 | ) | (11 | ) | (88 | ) | ||||
Issuance of Common Stock |
8 | 6 | 10 | |||||||
Discount paid on issuance of debt |
(12 | ) | — | — | ||||||
Debt issuance costs paid |
(6 | ) | (33 | ) | — | |||||
| | | | | | | | | | | |
Net Cash Used for Financing Activities from Continuing Operations |
(78 | ) | (14 | ) | (110 | ) | ||||
| | | | | | | | | | | |
Cash Flows from Discontinued Operations: |
||||||||||
Cash provided from operating activities |
39 | 129 | 223 | |||||||
Cash (used for) provided from investing activities: |
||||||||||
Proceeds from sale of businesses |
— | (4 | ) | 26 | ||||||
Other investing activities |
(21 | ) | (33 | ) | (57 | ) | ||||
Cash used for financing activities |
(12 | ) | (9 | ) | (4 | ) | ||||
| | | | | | | | | | | |
Net Cash Provided from Discontinued Operations |
6 | 83 | 188 | |||||||
| | | | | | | | | | | |
Cash Increase During the Period |
66 | 88 | 72 | |||||||
| | | | | | | | | | | |
Cash and Cash Equivalents at End of Period |
$ | 484 | $ | 418 | $ | 330 | ||||
| | | | | | | | | | | |
| | | | | | | | | | | |
| | | | | | | | | | | |
See accompanying Notes to the Consolidated Financial Statements.
F-6
SERVICEMASTER GLOBAL HOLDINGS, INC.
Notes to the Consolidated Financial Statements
Note 1. Significant Accounting Policies
The Consolidated Financial Statements include the accounts of ServiceMaster Global Holdings Inc. (the "Company") and its majority-owned subsidiary partnerships, limited liability companies and corporations. All consolidated Company subsidiaries are wholly owned. Intercompany transactions and balances have been eliminated.
Summary: The preparation of the Consolidated Financial Statements requires management to make certain estimates and assumptions required under GAAP which may differ from actual results. The more significant areas requiring the use of management estimates relate to revenue recognition; the allowance for uncollectible receivables; accruals for self-insured retention limits related to medical, workers' compensation, auto and general liability insurance claims; accruals for home warranties and termite damage claims; the possible outcome of outstanding litigation; accruals for income tax liabilities as well as deferred tax accounts; the deferral and amortization of customer acquisition costs; useful lives for depreciation and amortization expense; the valuation of marketable securities; and the valuation of tangible and intangible assets. In 2013, there have been no changes in the significant areas that require estimates or in the underlying methodologies used in determining the amounts of these associated estimates.
The allowance for receivables is developed based on several factors including overall customer credit quality, historical write-off experience and specific account analyses that project the ultimate collectability of the outstanding balances. As such, these factors may change over time causing the reserve level to vary.
The Company carries insurance policies on insurable risks at levels which it believes to be appropriate, including workers' compensation, auto and general liability risks. The Company purchases insurance from third-party insurance carriers. These policies typically incorporate significant deductibles or self-insured retentions. The Company is responsible for all claims that fall within the retention limits. In determining the Company's accrual for self-insured claims, the Company uses historical claims experience to establish both the current year accrual and the underlying provision for future losses. This actuarially determined provision and related accrual include both known claims, as well as incurred but not reported claims. The Company adjusts its estimate of accrued self-insured claims when required to reflect changes based on factors such as changes in health care costs, accident frequency and claim severity.
The Company seeks to reduce the potential amount of loss arising from self-insured claims by insuring certain levels of risk. While insurance agreements are designed to limit the Company's losses from large exposure and permit recovery of a portion of direct unpaid losses, insurance does not relieve the Company of its ultimate liability. Accordingly, the accruals for insured claims represent the Company's total unpaid gross losses. Insurance recoverables, which are reported within Prepaid expenses and other assets and Other assets, relate to estimated insurance recoveries on the insured claims reserves.
Accruals for home warranty claims in the American Home Shield business are made based on the Company's claims experience and actuarial projections. Termite damage claim accruals in the Terminix business are recorded based on both the historical rates of claims incurred within a contract year and the cost per claim. Current activity could differ causing a change in estimates. The Company has certain liabilities with respect to existing or potential claims, lawsuits, and other proceedings. The Company accrues for these liabilities when it is probable that future costs will be incurred and such
F-7
SERVICEMASTER GLOBAL HOLDINGS, INC.
Notes to the Consolidated Financial Statements (Continued)
Note 1. Significant Accounting Policies (Continued)
costs can be reasonably estimated. Any resulting adjustments, which could be material, are recorded in the period identified.
The Company records deferred income tax balances based on the net tax effects of temporary differences between the carrying value of assets and liabilities for financial reporting purposes and income tax purposes. The Company records its deferred tax items based on the estimated value of the tax basis. The Company adjusts tax estimates when required to reflect changes based on factors such as changes in tax laws, relevant court decisions, results of tax authority reviews and statutes of limitations. The Company records a liability for unrecognized tax benefits resulting from uncertain tax positions taken or expected to be taken in a tax return. The Company recognizes potential interest and penalties related to its uncertain tax positions in income tax expense.
Revenue. Revenues from pest control services, as well as liquid and fumigation termite applications, are recognized as the services are provided. The Company eradicates termites through the use of non-baiting methods (e.g., fumigation or liquid treatments) and baiting systems. Termite services using baiting systems and termite inspection and protection contracts are frequently sold through annual contracts. Service costs for these contracts are expensed as incurred. The Company recognizes revenue over the life of these contracts in proportion to the expected direct costs. Those costs bear a direct relationship to the fulfillment of the Company's obligations under the contracts and are representative of the relative value provided to the customer (proportional performance method). The Company regularly reviews its estimates of direct costs for its termite bait contracts and termite inspection and protection contracts and adjusts the estimates when appropriate.
Home warranty contracts are typically one year in duration. Home warranty claims costs are expensed as incurred. The Company recognizes revenue over the life of these contracts in proportion to the expected direct costs. Those costs bear a direct relationship to the fulfillment of the Company's obligations under the contracts and are representative of the relative value provided to the customer (proportional performance method). The Company regularly reviews its estimates of claims costs and adjusts the estimates when appropriate.
The Company has franchise agreements in its Terminix, ServiceMaster Restore, ServiceMaster Clean, Merry Maids, Furniture Medic and AmeriSpec businesses. Franchise revenue (which in the aggregate represents approximately six percent of 2013 consolidated revenue from continuing operations) consists principally of continuing monthly fees based upon the franchisee's customer-level revenue. Monthly fee revenue is recognized when the related customer-level revenue generating activity is performed by the franchisee and collectability is reasonably assured. Franchise revenue also includes initial fees resulting from the sale of a franchise or a license. These initial franchise or license fees are pre-established fixed amounts and are recognized as revenue when collectability is reasonably assured and all material services or conditions relating to the sale have been substantially performed. Total profits from the franchised operations were $78 million, $71 million and $72 million for the years ended December 31, 2013, 2012 and 2011, respectively. The Company evaluates the performance of its franchise businesses based primarily on operating profit before corporate general and administrative expenses, interest expense and amortization of intangible assets. The portion of total franchise fee income related to initial fees received from the sale of franchises was immaterial to the Company's Consolidated Financial Statements for all periods.
F-8
SERVICEMASTER GLOBAL HOLDINGS, INC.
Notes to the Consolidated Financial Statements (Continued)
Note 1. Significant Accounting Policies (Continued)
Revenues are presented net of sales taxes collected and remitted to government taxing authorities on the consolidated statements of operations and comprehensive (loss) income.
The Company had $448 million and $423 million of deferred revenue as of December 31, 2013 and 2012, respectively. Deferred revenue consists primarily of payments received for annual contracts relating to home warranties, termite baiting, termite inspection and pest control services.
Deferred Customer Acquisition Costs: Customer acquisition costs, which are incremental and direct costs of obtaining a customer, are deferred and amortized over the life of the related contract in proportion to revenue recognized. These costs include sales commissions and direct selling costs which can be shown to have resulted in a successful sale. Deferred customer acquisition costs amounted to $30 million and $27 million as of December 31, 2013 and 2012, respectively.
Advertising: On an interim basis, certain advertising costs are deferred and recognized approximately in proportion to the revenue over the year and are not deferred beyond the calendar year-end. Certain other advertising costs are expensed when the advertising occurs. The cost of direct-response advertising at Terminix, consisting primarily of direct-mail promotions, is capitalized and amortized over its expected period of future benefits. Deferred advertising costs are included in prepaid expenses and other assets on our consolidated statements of financial position. Advertising expense for the years ended December 31, 2013, 2012 and 2011 was $114 million, $112 million and $109 million, respectively.
Inventory: Inventories are recorded at the lower of cost (primarily on a weighted average cost basis) or market. The Company's inventory primarily consists of finished goods to be used on the customers' premises or sold to franchisees.
Property and Equipment, Intangible Assets and Goodwill:
Property and equipment consist of the following:
| |
Balance as of December 31, |
|
||||||
|---|---|---|---|---|---|---|---|---|
| |
Estimated Useful Lives (Years) |
|||||||
(In millions)
|
2013 | 2012 | ||||||
Land |
$ | 6 | $ | 6 | N/A | |||
Buildings and improvements |
31 | 29 | 10 - 40 | |||||
Technology and communications |
225 | 192 | 3 - 7 | |||||
Machinery, production equipment and vehicles |
105 | 80 | 3 - 9 | |||||
Office equipment, furniture and fixtures |
14 | 15 | 5 - 7 | |||||
| | | | | | | | | |
|
381 | 322 | ||||||
Less accumulated depreciation |
(204 | ) | (164 | ) | ||||
| | | | | | | | | |
Net property and equipment |
$ | 177 | $ | 158 | ||||
| | | | | | | | | |
| | | | | | | | | |
| | | | | | | | | |
Depreciation of property and equipment, including depreciation of assets held under capital leases, was $48 million, $42 million and $38 million for the years ended December 31, 2013, 2012 and 2011, respectively.
F-9
SERVICEMASTER GLOBAL HOLDINGS, INC.
Notes to the Consolidated Financial Statements (Continued)
Note 1. Significant Accounting Policies (Continued)
Intangible assets consisted primarily of goodwill in the amount of $2,018 million and $1,995 million, indefinite-lived trade names in the amount of $1,608 million and $1,608 million, and other intangible assets in the amount of $113 million and $150 million as of December 31, 2013 and 2012, respectively.
Fixed assets and intangible assets with finite lives are depreciated and amortized on a straight-line basis over their estimated useful lives. These lives are based on the Company's previous experience for similar assets, potential market obsolescence and other industry and business data. As required by accounting standards for the impairment or disposal of long-lived assets, the Company's long-lived assets, including fixed assets and intangible assets (other than goodwill), are tested for recoverability whenever events or changes in circumstances indicate that their carrying amounts may not be recoverable. If the carrying value is no longer recoverable based upon the undiscounted future cash flows of the asset, an impairment loss would be recognized equal to the difference between the carrying amount and the fair value of the asset. Changes in the estimated useful lives or in the asset values could cause the Company to adjust its book value or future expense accordingly.
As required under accounting standards for goodwill and other intangibles, goodwill is not subject to amortization, and intangible assets with indefinite useful lives are not amortized until their useful lives are determined to no longer be indefinite. Goodwill and intangible assets that are not subject to amortization are subject to assessment for impairment by applying a fair-value based test on an annual basis or more frequently if circumstances indicate a potential impairment. The Company adopted the provisions of ASU 2011-08, "Testing Goodwill for Impairment," in the fourth quarter of 2011. This ASU gives entities the option of performing a qualitative assessment before calculating the fair value of a reporting unit in Step 1 of the goodwill impairment test. If entities determine, on the basis of qualitative factors, that the fair value of a reporting unit is more likely than not greater than its carrying amount, the two-step impairment test would not be required. For the 2013 and 2012 annual goodwill impairment review performed as of October 1, 2013 and October 1, 2012, respectively, the Company did not perform qualitative assessments on any reporting unit, but instead completed Step 1 of the goodwill impairment test for all reporting units. For the 2011 annual goodwill impairment review performed as of October 1, 2011, the Company performed qualitative assessments on the Terminix, American Home Shield and ServiceMaster Clean reporting units. Based on these assessments, the Company determined that, more likely than not, the fair values of Terminix, American Home Shield and ServiceMaster Clean were greater than their respective carrying amounts. As a result, the two-step goodwill impairment test was not performed for Terminix, American Home Shield and ServiceMaster Clean in 2011.
Goodwill impairment is determined using a two-step process. The first step involves a comparison of the estimated fair value of a reporting unit to its carrying amount, including goodwill. In performing the first step, the Company determines the fair value of a reporting unit using a combination of a DCF analysis, a market-based comparable approach and a market-based transaction approach. Determining fair value requires the exercise of significant judgment, including judgment about appropriate discount rates, terminal growth rates, the amount and timing of expected future cash flows, as well as relevant comparable company earnings multiples for the market-based comparable approach and relevant transaction multiples for the market-based transaction approach. The cash flows employed in the DCF analyses are based on the Company's most recent budget and, for years beyond the budget, the Company's estimates, which are based on estimated growth rates. The discount rates used in the DCF analyses are intended to reflect the risks inherent in the future cash flows of the respective reporting
F-10
SERVICEMASTER GLOBAL HOLDINGS, INC.
Notes to the Consolidated Financial Statements (Continued)
Note 1. Significant Accounting Policies (Continued)
units. In addition, the market-based comparable and transaction approaches utilize comparable company public trading values, comparable company historical results, research analyst estimates and, where available, values observed in private market transactions. If the estimated fair value of a reporting unit exceeds its carrying amount, goodwill of the reporting unit is not impaired and the second step of the impairment test is not necessary. If the carrying amount of a reporting unit exceeds its estimated fair value, then the second step of the goodwill impairment test must be performed. The second step of the goodwill impairment test compares the implied fair value of the reporting unit's goodwill with its goodwill carrying amount to measure the amount of impairment, if any. The implied fair value of goodwill is determined in the same manner as the amount of goodwill recognized in a business combination. In other words, the estimated fair value of the reporting unit is allocated to all of the assets and liabilities of that unit (including any unrecognized intangible assets) as if the reporting unit had been acquired in a business combination and the fair value of the reporting unit was the purchase price paid. If the carrying amount of the reporting unit's goodwill exceeds the implied fair value of that goodwill, an impairment is recognized in an amount equal to that excess.
The impairment test for other intangible assets not subject to amortization involves a comparison of the estimated fair value of the intangible asset with its carrying value. If the carrying value of the intangible asset exceeds its fair value, an impairment loss is recognized in an amount equal to that excess. The estimates of fair value of intangible assets not subject to amortization are determined using a DCF valuation analysis. The DCF methodology used to value trade names is known as the relief from royalty method and entails identifying the hypothetical cash flows generated by an assumed royalty rate that a third-party would pay to license the trade names and discounting them back to the valuation date. Significant judgments inherent in this analysis include the selection of appropriate discount rates and hypothetical royalty rates, estimating the amount and timing of estimated future cash flows attributable to the hypothetical royalty rates and identification of appropriate terminal growth rate assumptions. The discount rates used in the DCF analyses are intended to reflect the risk inherent in the projected future cash flows generated by the respective intangible assets.
Goodwill and indefinite-lived intangible assets, primarily the Company's trade names, are assessed annually for impairment during the fourth quarter or earlier upon the occurrence of certain events or substantive changes in circumstances. The Company's 2013, 2012, and 2011 annual impairment analyses, which were performed as of October 1 of each year, did not result in any goodwill or trade name impairments to continuing operations.
Restricted Net Assets: There are third-party restrictions on the ability of certain of the Company's subsidiaries to transfer funds to the Company. These restrictions are related to regulatory requirements at American Home Shield and to a subsidiary borrowing arrangement at SMAC. The payment of ordinary and extraordinary dividends by the Company's home warranty and similar subsidiaries (through which the Company conducts its American Home Shield business) are subject to significant regulatory restrictions under the laws and regulations of the states in which they operate. Among other things, such laws and regulations require certain such subsidiaries to maintain minimum capital and net worth requirements and may limit the amount of ordinary and extraordinary dividends and other payments that these subsidiaries can pay to the Company or to The ServiceMaster Company, LLC ("SvM"). As of December 31, 2013, the total net assets subject to these third-party restrictions was $160 million. None of the subsidiaries of the Company are obligated to make funds available to the Company through the payment of dividends.
F-11
SERVICEMASTER GLOBAL HOLDINGS, INC.
Notes to the Consolidated Financial Statements (Continued)
Note 1. Significant Accounting Policies (Continued)
Fair Value of Financial Instruments and Credit Risk: See Note 19 for information relating to the fair value of financial instruments. Financial instruments, which potentially subject the Company to financial and credit risk, consist principally of investments and receivables. Investments consist primarily of publicly traded debt and common equity securities. The Company periodically reviews its portfolio of investments to determine whether there has been an other than temporary decline in the value of the investments from factors such as deterioration in the financial condition of the issuer or the market(s) in which it competes. The majority of the Company's receivables have little concentration of credit risk due to the large number of customers with relatively small balances and their dispersion across geographical areas. The Company maintains an allowance for losses based upon the expected collectability of receivables.
Income Taxes: The Company and its subsidiaries file consolidated U.S. federal income tax returns. State and local returns are filed both on a separate company basis and on a combined unitary basis with the Company. Current and deferred income taxes are provided for on a separate company basis. The Company accounts for income taxes using an asset and liability approach for the expected future tax consequences of events that have been recognized in the Company's financial statements or tax returns. Deferred income taxes are provided to reflect the differences between the tax bases of assets and liabilities and their reported amounts in the financial statements. Valuation allowances are established when necessary to reduce deferred income tax assets to the amounts expected to be realized.
The Company records a liability for unrecognized tax benefits resulting from uncertain tax positions taken or expected to be taken in its tax return. The Company recognizes potential interest and penalties related to its uncertain tax positions in income tax expense.
Stock-Based Compensation: The Company accounts for stock-based compensation under accounting standards for share based payments, which require that stock options, restricted stock units and share grants be measured at fair value and this value is recognized as compensation expense over the vesting period.
Earnings Per Share: Basic earnings (loss) per share is computed by dividing net income (loss) by the weighted average number of shares of common stock outstanding. Diluted earnings (loss) per share is computed by dividing net income (loss) by the weighted-average number of shares of common stock outstanding during the period, increased to include the number of shares of common stock that would have been outstanding had potential dilutive shares of common stock been issued. The dilutive effect of stock options and restricted stock units are reflected in diluted net income (loss) per share by applying the treasury stock method.
Newly Issued Accounting Statements and Positions: In July 2012, the Financial Accounting Standards Board ("FASB") issued ASU 2012-02, "Intangibles—Goodwill and Other: Testing Indefinite-Lived Intangible Assets for Impairment," which amends the guidance on testing indefinite-lived intangible assets, other than goodwill, for impairment. This standard allows an entity testing an indefinite-lived intangible asset for impairment the option of performing a qualitative assessment before calculating the fair value of the asset. If entities determine, on the basis of the qualitative assessment, that the fair value of the indefinite-lived intangible asset is more likely than not greater than its carrying amount, the quantitative impairment test would not be required. Otherwise, further testing would be needed. This standard revises the examples of events and circumstances that an entity should consider in
F-12
SERVICEMASTER GLOBAL HOLDINGS, INC.
Notes to the Consolidated Financial Statements (Continued)
Note 1. Significant Accounting Policies (Continued)
interim periods, but it does not revise the requirements to test indefinite-lived intangible assets (1) annually for impairment and (2) between annual tests if there is a change in events or circumstances. The amendments in this standard are effective for annual and interim impairment tests performed for fiscal years beginning after September 15, 2012. The Company adopted the required provisions of this standard during the first quarter of 2013. The adoption of this standard did not have a material impact on the Company's Consolidated Financial Statements.
In February 2013, the FASB issued ASU 2013-02, "Reporting of Amounts Reclassified out of Accumulated Other Comprehensive Income" to improve the reporting of reclassifications out of accumulated other comprehensive income by requiring an entity to provide information about the amounts reclassified out of accumulated other comprehensive income by component. In addition, an entity is required to present, either on the face of the statement where net income is presented or in the notes, significant amounts reclassified out of accumulated other comprehensive income by the respective line items of net income but only if the amount reclassified is required under GAAP to be reclassified to net income in its entirety in the same reporting period. For other amounts that are not required under GAAP to be reclassified in their entirety to net income, an entity is required to cross-reference to other disclosures required under GAAP that provide additional detail about those amounts. The amendments in this standard do not change the current requirements for reporting net income or other comprehensive income in financial statements and are effective prospectively for reporting periods beginning after December 15, 2012. The Company adopted the required provisions of this standard during the first quarter of 2013. The disclosures required by this standard are presented in Note 14.
In July 2013, the FASB issued ASU 2013-11, "Presentation of an Unrecognized Tax Benefit When a Net Operating Loss Carryforward, a Similar Tax Loss, or Tax Credit Carryforward Exists" to eliminate the diversity in practice associated with the presentation of unrecognized tax benefits in instances where a net operating loss carryforward, a similar tax loss, or a tax credit carryforward exists. ASU 2013-11 generally requires an unrecognized tax benefit, or a portion of an unrecognized tax benefit, to be presented in the financial statements as a reduction to a deferred tax asset for a net operating loss carryforward, a similar tax loss, or a tax credit carryforward, except in certain circumstances. The amendments in ASU 2013-11 are effective for fiscal years, and interim periods within those years, beginning after December 15, 2013. The adoption of this standard is not expected to have a material impact on the Company's Consolidated Financial Statements.
Note 2. Acquisition of SvM
On the 2007 Closing Date, the Company acquired SvM pursuant to the 2007 Merger. As a result of the Merger, SvM became an indirect wholly owned subsidiary of the Company. Immediately following the completion of the 2007 Merger, all of the outstanding common stock of the Company, the ultimate parent company of SvM, was owned by investment funds sponsored by, or affiliated with, certain Equity Sponsors.
Equity contributions totaling $1,431 million, together with (i) borrowings under a then new $1,150 million senior unsecured interim loan facility, (the "Interim Loan Facility"), (ii) borrowings under a then new $2,650 million Term Loan Facility, and (iii) cash on hand at SvM, were used, among other things, to finance the aggregate 2007 Merger consideration, to make payments in satisfaction of other equity-based interests in the Company under the 2007 Merger agreement, to settle existing
F-13
SERVICEMASTER GLOBAL HOLDINGS, INC.
Notes to the Consolidated Financial Statements (Continued)
Note 2. Acquisition of SvM (Continued)
interest rate swaps, to redeem or provide for the repayment of certain of SvM's existing indebtedness and to pay related transaction fees and expenses. In addition, letters of credit issued under a new $150 million pre-funded letter of credit facility were used to replace and/or secure letters of credit previously issued under a SvM credit facility that was terminated as of the 2007 Closing Date. On the 2007 Closing Date, SvM also entered into, but did not then draw under, the Revolving Credit Facility.
In connection with the 2007 Merger and the related transactions, SvM retired certain of its existing indebtedness, including SvM's $179 million, 7.875 percent notes due August 15, 2009 (the "2009 Notes"). On the 2007 Closing Date, the 2009 Notes were called for redemption, and they were redeemed on August 29, 2007. Additionally, SvM utilized a portion of the proceeds from the Term Facilities to repay at maturity SvM's $49 million, 6.95 percent notes due August 15, 2007. The Interim Loan Facility matured on July 24, 2008. On the maturity date, outstanding amounts under the Interim Loan Facility were converted on a one-to-one basis into the 2015 Notes.
Note 3. Business Segment Reporting
The business of the Company is conducted through three reportable segments: Terminix, American Home Shield and Franchise Services Group.
In accordance with accounting standards for segments, the Company's reportable segments are strategic business units that offer different services. The Terminix segment provides termite and pest control services to residential and commercial customers and distributes pest control products. The American Home Shield segment provides home warranties for household systems and appliances. The Franchise Services Group segment provides residential and commercial disaster restoration, janitorial and cleaning services through franchises primarily under the ServiceMaster, ServiceMaster Restore and ServiceMaster Clean brand names, on-site wood furniture repair and restoration services primarily under the Furniture Medic brand name, home inspection services primarily under the AmeriSpec brand name and home cleaning services through franchises and Company-owned operations primarily under the Merry Maids brand name. Other Operations and Headquarters includes SMAC, our financing subsidiary exclusively dedicated to providing financing to our franchisees and retail customers of our operating units, and the Company's headquarters operations (substantially all of which costs are allocated to the Company's reportable segments), which provide various technology, marketing, finance, legal and other support services to the reportable segments. The composition of our reportable segments is consistent with that used by our chief operating decision maker (the "CODM") to evaluate performance and allocate resources.
Information regarding the accounting policies used by the Company is described in Note 1. The Company derives substantially all of its revenue from customers and franchisees in the United States with less than two percent generated in foreign markets. Operating expenses of the business units consist primarily of direct costs and indirect costs allocated from the Other Operations and Headquarters segment. Identifiable assets are those used in carrying out the operations of the business unit and include intangible assets directly related to its operations. Expenses which were allocated to TruGreen but are not reflected in discontinued operations are included in the Other Operations and Headquarters segment. Such expenses amounted to $38 million, $42 million and $46 million in 2013, 2012 and 2011, respectively.
F-14
SERVICEMASTER GLOBAL HOLDINGS, INC.
Notes to the Consolidated Financial Statements (Continued)
Note 3. Business Segment Reporting (Continued)
The Company uses Reportable Segment Adjusted EBITDA as its measure of segment profitability. Accordingly, the CODM evaluates performance and allocates resources based primarily on Reportable Segment Adjusted EBITDA. Reportable Segment Adjusted EBITDA is defined as net income (loss) before: unallocated corporate expenses; income (loss) from discontinued operations, net of income taxes; provision (benefit) for income taxes; gain (loss) on extinguishment of debt; interest expense; depreciation and amortization expense; impairment of software and other related costs; non-cash impairment of property and equipment; non-cash stock-based compensation expense; restructuring charges; management and consulting fees; non-cash effects attributable to the application of purchase accounting; and other non-operating expenses. The Company's definition of Reportable Segment Adjusted EBITDA may not be calculated or comparable to similarly titled measures of other companies.
F-15
SERVICEMASTER GLOBAL HOLDINGS, INC.
Notes to the Consolidated Financial Statements (Continued)
Note 3. Business Segment Reporting (Continued)
Information for continuing operations for each reportable segment and Other Operations and Headquarters is presented below:
| |
Year Ended December 31, | |||||||||
|---|---|---|---|---|---|---|---|---|---|---|
(In millions)
|
2013 | 2012 | 2011 | |||||||
Revenue: |
||||||||||
Terminix |
$ | 1,309 | $ | 1,265 | $ | 1,193 | ||||
American Home Shield |
740 | 721 | 687 | |||||||
Franchise Services Group |
236 | 221 | 220 | |||||||
| | | | | | | | | | | |
Reportable Segment Revenue |
$ | 2,285 | $ | 2,207 | $ | 2,100 | ||||
Other Operations and Headquarters |
8 | 7 | 5 | |||||||
| | | | | | | | | | | |
Total Revenue |
$ | 2,293 | $ | 2,214 | $ | 2,105 | ||||
| | | | | | | | | | | |
| | | | | | | | | | | |
| | | | | | | | | | | |
Reportable Segment Adjusted EBITDA:(1) |
||||||||||
Terminix |
$ | 266 | $ | 266 | $ | 249 | ||||
American Home Shield |
145 | 117 | 107 | |||||||
Franchise Services Group |
78 | 70 | 75 | |||||||
| | | | | | | | | | | |
Reportable Segment Adjusted EBITDA |
$ | 489 | $ | 453 | $ | 431 | ||||
| | | | | | | | | | | |
| | | | | | | | | | | |
| | | | | | | | | | | |
Identifiable Assets: |
||||||||||
Terminix |
$ | 2,694 | $ | 2,592 | $ | 2,602 | ||||
American Home Shield |
1,000 | 976 | 955 | |||||||
Franchise Services Group |
513 | 510 | 510 | |||||||
| | | | | | | | | | | |
Reportable Segment Identifiable Assets |
$ | 4,207 | $ | 4,078 | $ | 4,067 | ||||
Other Operations and Headquarters |
1,080 | 1,048 | 916 | |||||||
| | | | | | | | | | | |
Total Identifiable Assets(2) |
$ | 5,287 | $ | 5,126 | $ | 4,983 | ||||
| | | | | | | | | | | |
| | | | | | | | | | | |
| | | | | | | | | | | |
Depreciation & Amortization Expense: |
||||||||||
Terminix |
$ | 73 | $ | 76 | $ | 76 | ||||
American Home Shield |
8 | 8 | 27 | |||||||
Franchise Services Group |
8 | 8 | 9 | |||||||
| | | | | | | | | | | |
Reportable Segment Depreciation and Amortization Expense |
$ | 89 | $ | 92 | $ | 112 | ||||
Other Operations and Headquarters |
10 | 8 | 9 | |||||||
| | | | | | | | | | | |
Total Depreciation & Amortization Expense(3) |
$ | 99 | $ | 100 | $ | 121 | ||||
| | | | | | | | | | | |
| | | | | | | | | | | |
| | | | | | | | | | | |
Capital Expenditures: |
||||||||||
Terminix |
$ | 11 | $ | 14 | $ | 23 | ||||
American Home Shield |
13 | 15 | 18 | |||||||
Franchise Services Group |
3 | 2 | 2 | |||||||
| | | | | | | | | | | |
Reportable Segment Capital Expenditures |
$ | 27 | $ | 31 | $ | 43 | ||||
Other Operations and Headquarters |
12 | 13 | 9 | |||||||
| | | | | | | | | | | |
Total Capital Expenditures |
$ | 39 | $ | 44 | $ | 52 | ||||
| | | | | | | | | | | |
| | | | | | | | | | | |
| | | | | | | | | | | |
- (1)
- Presented below is a reconciliation of Adjusted EBITDA to Net (Loss) Income:
F-16
SERVICEMASTER GLOBAL HOLDINGS, INC.
Notes to the Consolidated Financial Statements (Continued)
Note 3. Business Segment Reporting (Continued)
| |
Year Ended December 31, | |||||||||
|---|---|---|---|---|---|---|---|---|---|---|
(In millions)
|
2013 | 2012 | 2011 | |||||||
Reportable Segment Adjusted EBITDA: |
||||||||||
Terminix |
$ | 266 | $ | 266 | $ | 249 | ||||
American Home Shield |
145 | 117 | 107 | |||||||
Franchise Services Group |
78 | 70 | 75 | |||||||
| | | | | | | | | | | |
Reportable Segment Adjusted EBITDA |
$ | 489 | $ | 453 | $ | 431 | ||||
| | | | | | | | | | | |
| | | | | | | | | | | |
| | | | | | | | | | | |
Unallocated corporate expenses(a) |
$ | (39 | ) | $ | (40 | ) | $ | (34 | ) | |
Depreciation and amortization expense |
(99 | ) | (100 | ) | (121 | ) | ||||
Non-cash impairment of property and equipment |
— | (9 | ) | — | ||||||
Non-cash stock-based compensation expense |
(4 | ) | (7 | ) | (8 | ) | ||||
Restructuring charges |
(6 | ) | (15 | ) | (7 | ) | ||||
Management and consulting fees |
(7 | ) | (7 | ) | (8 | ) | ||||
(Loss) income from discontinued operations, net of income taxes |
(549 | ) | (696 | ) | 53 | |||||
Benefit (provision) for income taxes |
(43 | ) | 8 | 6 | ||||||
Loss on extinguishment of debt |
— | (55 | ) | — | ||||||
Interest expense |
(247 | ) | (245 | ) | (266 | ) | ||||
Other |
(2 | ) | (1 | ) | — | |||||
| | | | | | | | | | | |
Net (Loss) Income |
$ | (507 | ) | $ | (714 | ) | $ | 46 | ||
| | | | | | | | | | | |
| | | | | | | | | | | |
| | | | | | | | | | | |
- (a)
- Represents the unallocated corporate expenses of Other Operations and Headquarters.
- (2)
- Assets
of discontinued operations are not included in the business segment table.
- (3)
- There are no adjustments necessary to reconcile total depreciation and amortization as presented in the business segment table to the consolidated totals. Amortization of debt issue costs is not included in the business segment table.
See Note 4 for information relating to segment goodwill.
Note 4. Goodwill and Intangible Assets
Goodwill and intangible assets that are not amortized are subject to assessment for impairment by applying a fair-value based test on an annual basis or more frequently if circumstances indicate a potential impairment. The Company's annual assessment date is October 1. There were no goodwill or trade name impairment charges recorded to continuing operations during the years ended December 31, 2013, 2012 and 2011. During the years ended December 31, 2013 and 2012, the increase in goodwill and other intangible assets related primarily to tuck-in acquisitions completed throughout the period by Terminix and Franchise Services Group.
F-17
SERVICEMASTER GLOBAL HOLDINGS, INC.
Notes to the Consolidated Financial Statements (Continued)
Note 4. Goodwill and Intangible Assets (Continued)
The table below summarizes the goodwill balances for continuing operations by reportable segment and for Other Operations and Headquarters:
(In millions)
|
Terminix | American Home Shield |
Franchise Services Group |
Total | |||||||||
|---|---|---|---|---|---|---|---|---|---|---|---|---|---|
Balance at December 31, 2011 |
$ | 1,424 | $ | 348 | $ | 188 | $ | 1,960 | |||||
Acquisitions |
34 | — | 1 | 35 | |||||||||
| | | | | | | | | | | | | | |
Balance at December 31, 2012 |
1,458 | 348 | 189 | 1,995 | |||||||||
Acquisitions |
22 | — | 2 | 24 | |||||||||
Other(1) |
— | — | (1 | ) | (1 | ) | |||||||
| | | | | | | | | | | | | | |
Balance at December 31, 2013 |
$ | 1,480 | $ | 348 | $ | 190 | $ | 2,018 | |||||
| | | | | | | | | | | | | | |
| | | | | | | | | | | | | | |
| | | | | | | | | | | | | | |
- (1)
- Reflects the impact of foreign exchange rate changes.
There were no accumulated impairment losses recorded in continuing operations as of December 31, 2013, 2012 or 2011.
The table below summarizes the other intangible asset balances for continuing operations:
| |
Estimated Remaining Useful Lives (Years) |
December 31, 2013 | December 31, 2012 | ||||||||||||||||||
|---|---|---|---|---|---|---|---|---|---|---|---|---|---|---|---|---|---|---|---|---|---|
(In millions)
|
Gross | Accumulated Amortization |
Net | Gross | Accumulated Amortization |
Net | |||||||||||||||
Trade names(1) |
N/A | $ | 1,608 | $ | — | $ | 1,608 | $ | 1,608 | $ | — | $ | 1,608 | ||||||||
Customer relationships |
3 - 10 | 512 | (447 | ) | 65 | 504 | (407 | ) | 97 | ||||||||||||
Franchise agreements |
20 - 25 | 88 | (54 | ) | 34 | 88 | (49 | ) | 39 | ||||||||||||
Other |
4 - 30 | 41 | (27 | ) | 14 | 36 | (22 | ) | 14 | ||||||||||||
| | | | | | | | | | | | | | | | | | | | | | |
Total |
$ | 2,249 | $ | (528 | ) | $ | 1,721 | $ | 2,236 | $ | (478 | ) | $ | 1,758 | |||||||
| | | | | | | | | | | | | | | | | | | | | | |
| | | | | | | | | | | | | | | | | | | | | | |
| | | | | | | | | | | | | | | | | | | | | | |
- (1)
- Not subject to amortization.
Amortization expense of $51 million, $58 million and $83 million was recorded in the years ended December 31, 2013, 2012 and 2011, respectively. For the existing intangible assets, the Company anticipates amortization expense of $48 million, $27 million, $8 million, $6 million and $4 million in 2014, 2015, 2016, 2017 and 2018, respectively.
In the years ended December 31, 2013, 2012 and 2011, the TruGreen Business recorded impairment charges of $673 million ($521 million, net of tax), $909 million ($764 million, net of tax) and $37 million ($22 million, net of tax), respectively, in discontinued operations, net of income taxes. In the year ended December 31, 2011, the TruGreen LandCare business recorded an impairment charge of $34 million ($21 million, net of tax in discontinued operations, net of income taxes).
F-18
SERVICEMASTER GLOBAL HOLDINGS, INC.
Notes to the Consolidated Financial Statements (Continued)
Note 5. Income Taxes
As of December 31, 2013, 2012 and 2011, the Company had $8 million, $8 million and $9 million, respectively, of tax benefits primarily reflected in state tax returns that have not been recognized for financial reporting purposes ("unrecognized tax benefits"). At December 31, 2013 and 2012, $8 million of unrecognized tax benefits would impact the effective tax rate if recognized. A reconciliation of the beginning and ending amount of gross unrecognized tax benefits is as follows:
| |
Year Ended December 31, |
|||||||||
|---|---|---|---|---|---|---|---|---|---|---|
(In millions)
|
2013 | 2012 | 2011 | |||||||
Gross unrecognized tax benefits at beginning of period |
$ | 8 | $ | 9 | $ | 14 | ||||
Increases in tax positions for prior years |
1 | — | 1 | |||||||
Decreases in tax positions for prior years |
— | — | (2 | ) | ||||||
Increases in tax positions for current year |
1 | 1 | 1 | |||||||
Lapse in statute of limitations |
(2 | ) | (2 | ) | (5 | ) | ||||
| | | | | | | | | | | |
Gross unrecognized tax benefits at end of period |
$ | 8 | $ | 8 | $ | 9 | ||||
| | | | | | | | | | | |
| | | | | | | | | | | |
| | | | | | | | | | | |
Up to $1 million of the Company's unrecognized tax benefits could be recognized within the next 12 months. As of December 31, 2012, the Company believed that it was reasonably possible that a decrease of up to $1 million in unrecognized tax benefits would have occurred during the year ended December 31, 2013. During the year ended December 31, 2013 unrecognized tax benefits actually decreased by $2 million as a result of the closing of certain state audits and the expiration of statutes of limitation.
The Company files consolidated and separate income tax returns in the United States federal jurisdiction and in many state and foreign jurisdictions. The Company has been audited by the IRS through its year ended December 31, 2011, and is no longer subject to state and local or foreign income tax examinations by tax authorities for years before 2006.
In the ordinary course of business, the Company is subject to review by domestic and foreign taxing authorities. For U.S. federal income tax purposes, the Company participates in the IRS's Compliance Assurance Process whereby its U.S. federal income tax returns are reviewed by the IRS both prior to and after their filing. The U.S. federal income tax returns filed by the Company through the year ended December 31, 2011 have been audited by the IRS. In the second quarter of 2013, the IRS completed the audits of the Company's tax returns for the year ended December 31, 2011 with no adjustments or additional payments. The Company's tax returns for the year ended December 31, 2012 are under audit, which is expected to be completed by the second quarter of 2014. The IRS commenced examinations of the Company's U.S. federal income tax returns for 2013 in the first quarter of 2013. The examination is anticipated to be completed by the second quarter of 2015. Seven state tax authorities are in the process of auditing state income tax returns of various subsidiaries.
The Company's policy is to recognize potential interest and penalties related to its tax positions within the tax provision. During the year ended December 31, 2011, the Company reversed interest expense of $2 million through the tax provision. There were no similar reversals for the year ended December 31, 2013 and 2012. As of December 31, 2013 and 2012, the Company had accrued for the payment of interest and penalties of $1 million.
F-19
SERVICEMASTER GLOBAL HOLDINGS, INC.
Notes to the Consolidated Financial Statements (Continued)
Note 5. Income Taxes (Continued)
The components of our income (loss) from continuing operations before income taxes are as follows:
| |
Year Ended December 31, |
|||||||||
|---|---|---|---|---|---|---|---|---|---|---|
| |
2013 | 2012 | 2011 | |||||||
U.S. |
$ | 80 | $ | (31 | ) | $ | (18 | ) | ||
Foreign |
6 | 5 | 5 | |||||||
| | | | | | | | | | | |
Total |
$ | 86 | $ | (26 | ) | $ | (13 | ) | ||
| | | | | | | | | | | |
| | | | | | | | | | | |
| | | | | | | | | | | |
The reconciliation of income tax computed at the U.S. federal statutory tax rate to the Company's effective income tax rate for continuing operations is as follows:
| |
Year Ended December 31, |
|||||||||
|---|---|---|---|---|---|---|---|---|---|---|
| |
2013 | 2012 | 2011 | |||||||
Tax at U.S. federal statutory rate |
35.0 | % | 35.0 | % | 35.0 | % | ||||
State and local income taxes, net of U.S. federal benefit |
9.6 | (13.0 | ) | 27.9 | ||||||
Tax credits |
(2.6 | ) | 3.7 | 12.8 | ||||||
Nondeductible goodwill |
— | — | — | |||||||
Other permanent items |
0.8 | (4.3 | ) | (8.0 | ) | |||||
Stock option forfeitures |
4.2 | — | (7.6 | ) | ||||||
Other, including foreign rate differences and reserves |
3.1 | 9.1 | (16.3 | ) | ||||||
| | | | | | | | | | | |
Effective rate |
50.1 | % | 30.5 | % | 43.8 | % | ||||
| | | | | | | | | | | |
| | | | | | | | | | | |
| | | | | | | | | | | |
The effective tax rate for discontinued operations for the years ended December 31, 2013 and 2012 was a tax benefit of 23.3 percent and 13.5 percent, respectively. The effective tax rate for discontinued operations for the year ended December 31, 2011 was a provision of 38.0 percent. The effective tax rate for the years ending December 31, 2013 and 2012 was impacted by the impairment of non-deductible goodwill.
Income tax expense from continuing operations is as follows:
| |
2013 | |||||||||
|---|---|---|---|---|---|---|---|---|---|---|
(In millions)
|
Current | Deferred | Total | |||||||
U.S. federal |
$ | 1 | $ | 27 | $ | 28 | ||||
Foreign |
3 | — | 3 | |||||||
State and local |
5 | 7 | 12 | |||||||
| | | | | | | | | | | |
|
$ | 9 | $ | 34 | $ | 43 | ||||
| | | | | | | | | | | |
| | | | | | | | | | | |
| | | | | | | | | | | |
F-20
SERVICEMASTER GLOBAL HOLDINGS, INC.
Notes to the Consolidated Financial Statements (Continued)
Note 5. Income Taxes (Continued)
| |
2012 | |||||||||
|---|---|---|---|---|---|---|---|---|---|---|
| |
Current | Deferred | Total | |||||||
U.S. federal |
$ | — | $ | (16 | ) | $ | (16 | ) | ||
Foreign |
2 | — | 2 | |||||||
State and local |
5 | 1 | 6 | |||||||
| | | | | | | | | | | |
|
$ | 7 | $ | (15 | ) | $ | (8 | ) | ||
| | | | | | | | | | | |
| | | | | | | | | | | |
| | | | | | | | | | | |
| |
2011 | |||||||||
|---|---|---|---|---|---|---|---|---|---|---|
| |
Current | Deferred | Total | |||||||
U.S. federal |
$ | (1 | ) | $ | (2 | ) | $ | (3 | ) | |
Foreign |
3 | — | 3 | |||||||
State and local |
(1 | ) | (5 | ) | (6 | ) | ||||
| | | | | | | | | | | |
|
$ | 1 | $ | (7 | ) | $ | (6 | ) | ||
| | | | | | | | | | | |
| | | | | | | | | | | |
| | | | | | | | | | | |
Deferred income tax expense results from timing differences in the recognition of income and expense for income tax and financial reporting purposes. Deferred income tax balances reflect the net tax effects of temporary differences between the carrying amounts of assets and liabilities for financial reporting and income tax purposes. The deferred tax asset primarily reflects the impact of future tax deductions related to the Company's accruals and certain net operating loss carryforwards. The deferred tax liability is primarily attributable to the basis differences related to intangible assets. Valuation allowances are recorded to reduce deferred tax assets when it is more likely than not that a tax benefit will not be realized. The valuation allowance for deferred tax assets as of December 31, 2013 was $7 million. The net change in the total valuation allowance for the year ended December 31, 2013 was an increase of $1 million and was primarily attributable to additional net operating loss carryforwards in foreign jurisdictions.
F-21
SERVICEMASTER GLOBAL HOLDINGS, INC.
Notes to the Consolidated Financial Statements (Continued)
Note 5. Income Taxes (Continued)
Significant components of the Company's deferred tax balances are as follows:
| |
December 31, | ||||||
|---|---|---|---|---|---|---|---|
(In millions)
|
2013 | 2012 | |||||
Deferred tax assets (liabilities): |
|||||||
Current Asset: |
|||||||
Prepaid expenses |
$ | (14 | ) | $ | (13 | ) | |
Receivables allowances |
14 | 11 | |||||
Accrued insurance expenses |
9 | 5 | |||||
Current reserves |
6 | 5 | |||||
Accrued expenses and other |
17 | 21 | |||||
Net operating loss and tax credit carryforwards |
74 | 74 | |||||
| | | | | | | | |
Total current asset |
$ | 106 | $ | 103 | |||
| | | | | | | | |
Long-Term Liability: |
|||||||
Intangible assets(1) |
$ | (717 | ) | $ | (716 | ) | |
Accrued insurance expenses |
3 | 4 | |||||
Net operating loss and tax credit carryforwards |
51 | 51 | |||||
Other long-term obligations |
(43 | ) | (32 | ) | |||
Less valuation allowance |
(7 | ) | (6 | ) | |||
| | | | | | | | |
Total long-term liability |
(713 | ) | (699 | ) | |||
| | | | | | | | |
Net deferred tax liability |
$ | (607 | ) | $ | (596 | ) | |
| | | | | | | | |
| | | | | | | | |
| | | | | | | | |
- (1)
- The deferred tax liability relates primarily to the difference in the tax versus book basis of intangible assets. The majority of this liability will not actually be paid unless certain business units of the Company are sold.
As of December 31, 2013, the Company had deferred tax assets, net of valuation allowances, of $105 million for federal and state net operating loss and capital loss carryforwards which expire at various dates up to 2033. The Company also had deferred tax assets, net of valuation allowances, of $14 million for federal and state credit carryforwards which expire at various dates up to 2033.
For the year ended December 31, 2011, the Company reorganized certain foreign subsidiaries in conjunction with its international growth initiatives and evaluated its liquidity requirements in the U.S. and the capital requirements of its foreign subsidiaries. Based on these factors, the Company considers undistributed earnings of its foreign subsidiaries as of December 31, 2013 to be indefinitely reinvested. Accordingly, the Company has not recorded deferred taxes for U.S. or foreign withholding taxes on the excess of the amount for financial reporting purposes over the tax basis of investments in foreign subsidiaries that are essentially permanent in duration. This amount becomes taxable upon a repatriation of assets from the subsidiary or a sale or liquidation of the subsidiary. Determination of the amount of any unrecognized deferred income tax liability on this temporary difference is not practicable due to the complexities of the hypothetical calculation. The amount of cash associated with indefinitely reinvested foreign earnings was approximately $15 million and $25 million as of December 31, 2013 and 2012, respectively. The Company does not anticipate the need to repatriate
F-22
SERVICEMASTER GLOBAL HOLDINGS, INC.
Notes to the Consolidated Financial Statements (Continued)
Note 5. Income Taxes (Continued)
funds to the United States to satisfy domestic liquidity needs arising in the ordinary course of business, including liquidity needs associated with our domestic debt service requirements.
Note 6. Acquisitions
Acquisitions have been accounted for using the acquisition method and, accordingly, the results of operations of the acquired businesses have been included in the Company's Consolidated Financial Statements since their dates of acquisition. The assets and liabilities of these businesses were recorded in the financial statements at their estimated fair values as of the acquisition dates.
2013
During the year ended December 31, 2013, the Company completed several pest control and termite acquisitions, along with several franchise acquisitions and the purchase of a distributor license agreement within the Franchise Services Group. The total net purchase price for these acquisitions was $40 million. The Company recorded goodwill of $24 million and other intangibles of $13 million related to these acquisitions.
Prior Years
During the year ended December 31, 2012, the Company completed several pest control and termite acquisitions, along with several franchise acquisitions and the purchase of a distributor license agreement with the Franchise Services Group. The total net purchase price for these acquisitions was $49 million. Related to these acquisitions, the Company recorded goodwill of $35 million and other intangibles of $13 million.
During the year ended December 31, 2011, the Company completed several pest control and termite acquisitions for a total net purchase price of $41 million. Related to these acquisitions, the Company recorded goodwill of $28 million and other intangibles of $11 million.
Cash Flow Information for Acquisitions
Supplemental cash flow information regarding the Company's acquisitions, excluding the 2007 Merger, is as follows:
| |
Year Ended December 31, |
|||||||||
|---|---|---|---|---|---|---|---|---|---|---|
(In millions)
|
2013 | 2012 | 2011 | |||||||
Purchase price (including liabilities assumed) |
$ | 40 | $ | 52 | $ | 41 | ||||
Less liabilities assumed |
— | (3 | ) | — | ||||||
| | | | | | | | | | | |
Net purchase price |
$ | 40 | $ | 49 | $ | 41 | ||||
| | | | | | | | | | | |
| | | | | | | | | | | |
| | | | | | | | | | | |
Net cash paid for acquisitions |
$ | 32 | $ | 40 | $ | 33 | ||||
Seller financed debt |
8 | 9 | 8 | |||||||
| | | | | | | | | | | |
Payment for acquisitions |
$ | 40 | $ | 49 | $ | 41 | ||||
| | | | | | | | | | | |
| | | | | | | | | | | |
| | | | | | | | | | | |
F-23
SERVICEMASTER GLOBAL HOLDINGS, INC.
Notes to the Consolidated Financial Statements (Continued)
Note 7. Discontinued Operations
TruGreen Spin-off
On January 14, 2014, the Company completed the TruGreen Spin-off resulting in the spin-off of the assets and certain liabilities of the TruGreen Business through a tax-free, pro rata dividend to Holdings' stockholders. As a result of the completion of the TruGreen Spin-off, New TruGreen operates the TruGreen Business as a private independent company.
In connection with the TruGreen Spin-off, the Company and TGLP, an indirect wholly owned subsidiary of New TruGreen, entered into a transition services agreement pursuant to which the Company and its subsidiaries provide TGLP with specified communications, public relations, finance and accounting, tax, treasury, internal audit, human resources operations and benefits, risk management and insurance, supply management, real estate management, marketing, facilities, information technology and other support services. The charges for the transition services allow the Company to fully recover the allocated direct costs of providing the services, plus specified margins and any out-of-pocket costs and expenses. The services provided under the transition services agreement will terminate at various specified times, and in no event later than January 14, 2016 (except certain information technology services, which TGLP expects the Company to provide to TGLP beyond the two-year period). TGLP may terminate the transition services agreement (or certain services under the transition services agreement) for convenience upon 90 days written notice, in which case TGLP will be required to reimburse the Company for early termination costs.
In addition, the Company, New TruGreen and TGLP entered into (1) a separation and distribution agreement containing key provisions relating to the separation of the TruGreen Business and the distribution of New TruGreen common stock to our stockholders (including relating to specified TruGreen legal matters with respect to which we have agreed to retain liability, as well as insurance coverage, non-competition, indemnification and other matters), (2) an employee matters agreement allocating liabilities and responsibilities relating to employee benefit plans and programs and other related matters and (3) a tax matters agreement governing the respective rights, responsibilities and obligations of the parties thereto with respect to taxes, including allocating liabilities for income taxes attributable to New TruGreen and its subsidiaries generally to the Company for tax periods (or portions thereof) ending on or before January 14, 2014 and generally to New TruGreen for tax periods (or portions thereof) beginning after that date.
TruGreen Goodwill and Intangible Assets
Goodwill and indefinite lived intangible assets, primarily the Company's trade names, are assessed annually for impairment during the fourth quarter or earlier upon the occurrence of certain events or substantive changes in circumstances.
Goodwill
The Company performed an interim goodwill impairment analysis at TruGreen as of June 30, 2013 that resulted in a pre tax non cash goodwill impairment of $417 million. After this impairment charge, there was no goodwill remaining at TruGreen. The Company performed an interim goodwill impairment analysis at TruGreen as of September 30, 2012 that resulted in a pre tax non cash goodwill impairment of $794 million. During the fourth quarter of 2012, the Company finalized its September 30, 2012 TruGreen valuation resulting in a $4 million adjustment to goodwill decreasing the 2012 goodwill impairment charge to $790 million. The Company's 2013, 2012, and 2011 annual
F-24
SERVICEMASTER GLOBAL HOLDINGS, INC.
Notes to the Consolidated Financial Statements (Continued)
Note 7. Discontinued Operations (Continued)
impairment analyses, which were performed as of October 1 of each year, did not result in any goodwill impairments.
The goodwill impairment charge recorded in 2013 was primarily attributable to a decline in forecasted 2013 and future cash flows at TruGreen over a defined projection period as of June 30, 2013 compared to the projections used in the last annual impairment assessment performed on October 1, 2012. The changes in projected cash flows at TruGreen arose in part from the business challenges at TruGreen. Although the Company projected future improvement in cash flows at TruGreen as a part of its June 30, 2013 impairment analysis, total cash flows and projected growth in those cash flows were lower than those projected at the time TruGreen was last tested for impairment in 2012. The long term growth rates used in the impairment tests at June 30, 2013 and October 1, 2012 were the same and were in line with historical U.S. gross domestic product growth rates. The discount rate used in the June 30, 2013 impairment test was 100 bps lower than the discount rate used in the October 1, 2012 impairment test for TruGreen. The decrease in the discount rate is primarily attributable to changes in market conditions which indicated an improved outlook for the U.S. financial markets and a higher risk tolerance for investors since the 2012 analysis.
The goodwill impairment charge recorded in 2012 was primarily attributable to a decline in forecasted 2012 cash flows and a decrease in projected future growth in cash flows at TruGreen over a defined projection period as of September 30, 2012 compared to the projections used in the previous annual impairment assessment performed on October 1, 2011. Although the Company projected future growth in cash flows at TruGreen as a part of its September 30, 2012 impairment analysis, total cash flows and projected growth in those cash flows were lower than that projected at the time TruGreen was tested for impairment in 2011. The long term growth rates used in the impairment tests at September 30, 2012 and October 1, 2011 were the same and in line with historical U.S. gross domestic product growth rates. The discount rate used in the September 30, 2012 impairment test was 50 bps lower than the discount rate used in the October 1, 2011 impairment test for TruGreen. The decrease in the discount rate is primarily attributable to changes in market conditions which indicated an improved outlook for the U.S. financial markets since the 2011 analysis.
Intangible Assets
The Company performed an interim trade name impairment analysis at TruGreen as of June 30, 2013 resulting in a pre tax non cash trade name impairment charge of $256 million recorded in the second quarter of 2013. The Company performed an interim trade name impairment analysis at TruGreen as of June 30, 2012 resulting in a pre tax non cash trade name impairment charge of $68 million recorded in the second quarter of 2012. Further, the Company performed an interim trade name impairment analysis at TruGreen as of September 30, 2012 resulting in a pre tax non cash trade name impairment charge of $51 million recorded in the third quarter of 2012. The Company's annual trade name impairment analyses, which were performed as of October 1 of each year, resulted in pre tax non cash impairment of $37 million in 2011 related to the TruGreen trade name. The Company's October 1, 2013 and 2012 trade name impairment analyses did not result in any trade name impairments.
Based on the revenue results at TruGreen in the first six months of 2013 and a lower revenue outlook for the remainder of 2013 and future years, the Company concluded that there was an impairment indicator requiring the performance of an interim indefinite lived intangible asset
F-25
SERVICEMASTER GLOBAL HOLDINGS, INC.
Notes to the Consolidated Financial Statements (Continued)
Note 7. Discontinued Operations (Continued)
impairment test for the TruGreen trade name as of June 30, 2013. The impairment charge recorded in the second quarter of 2013 was primarily attributable to a decrease in the assumed royalty rate and a decrease in projected future growth in revenue at TruGreen over a defined projection period as of June 30, 2013 compared to the royalty rate and projections used in the last annual impairment assessment performed on October 1, 2012. The decrease in the assumed royalty rate was due to lower current and projected earnings as a percent of revenue as compared to the last annual impairment test. Although the Company projected future growth in revenue at TruGreen as part of its June 30, 2013 impairment analysis, total projected revenue was lower than the revenue projected at the time the trade name was last tested for impairment in October 2012. The changes in projected future revenue growth at TruGreen arose in part from the business challenges at TruGreen. The long term revenue growth rates used in the impairment tests at October 1, 2013, June 30, 2013 and October 1, 2012 were the same and in line with historical U.S. gross domestic product growth rates. The discount rates used in the October 1, 2013 and June 30, 2013 impairment tests were the same, but were 100 bps lower than the discount rate used in the October 1, 2012 impairment test for the TruGreen trade name. The decrease in the discount rate from 2012 is primarily attributable to changes in market conditions which indicated an improved outlook for the U.S. financial markets and a higher risk tolerance for investors since the last analysis.
Based on the revenue results at TruGreen in the first six months of 2012 and a then lower revenue outlook for the remainder of 2012 and future years, the Company concluded that there was an impairment indicator requiring the performance of an interim indefinite lived intangible asset impairment test for the TruGreen trade name as of June 30, 2012. Based on the revenue results of TruGreen in the third quarter of 2012 and the revised outlook for the remainder of the year and future years, the Company performed another impairment analysis on its TruGreen trade name to determine its fair value as of September 30, 2012. The impairment charge recorded in the second quarter of 2012 was primarily attributable to a decrease in projected future growth in revenue at TruGreen over a defined projection period as of June 30, 2012 compared to the projections used in the previous annual impairment assessment performed on October 1, 2011. The third quarter impairment charge was primarily attributable to a further reduction in projected revenue growth as compared to expectations in the second quarter of 2012. Although the Company projected future growth in revenue at TruGreen over a defined projection period as a part of its September 30, 2012 impairment analysis, such growth was lower than the revenue growth projected at the time the trade name was tested for impairment in the second quarter of 2012. The long term revenue growth rates used for periods after the defined projection period in the impairment tests at September 30, 2012, June 30, 2012 and October 1, 2011 were the same and in line with historical U.S. gross domestic product growth rates. The discount rates used in the September 30, 2012 and June 30, 2012 impairment tests were the same, but were 50 bps lower than the discount rate used in the October 1, 2011 impairment test for the TruGreen trade name. The decrease in the discount rate from 2011 is primarily attributable to changes in market conditions which indicated an improved outlook for the U.S. financial markets since the last analysis.
The impairment charge in 2011 was primarily attributable to the use of higher discount rates in the DCF valuation analyses as compared to the discount rates used in the 2010 impairment analyses. Although the projected future growth in cash flows in 2011 were slightly higher than in the 2010 valuation, the increase in the discount rates more than offset the improved cash flows. The increase in the discount rates is primarily attributable to changes in market conditions which indicated a lower risk tolerance in 2011 as compared to 2010. This lower risk tolerance is exhibited through the marketplace's
F-26
SERVICEMASTER GLOBAL HOLDINGS, INC.
Notes to the Consolidated Financial Statements (Continued)
Note 7. Discontinued Operations (Continued)
desire for higher returns in order to accept market risk. The long term revenue growth rates used in the analyses for the October 1, 2011 and 2010 impairment tests were the same and in line with historical U.S. gross domestic product growth rates.
Other Dispositions
In the first quarter of 2011, the Company concluded that TruGreen LandCare did not fit within the long-term strategic plans of the Company and committed to a plan to sell the business. On April 21, 2011, the Company entered into a purchase agreement to sell the TruGreen LandCare business, and the disposition was effective as of April 30, 2011.
Financial Information for Discontinued Operations
Loss from discontinued operations, net of income taxes, for all periods presented includes the operating results of the TruGreen Business and the previously sold businesses.
The operating results of discontinued operations are as follows:
| |
Year Ended December 31, | |||||||||
|---|---|---|---|---|---|---|---|---|---|---|
(In millions)
|
2013 | 2012 | 2011 | |||||||
Revenue |
$ | 896 | $ | 979 | $ | 1,177 | ||||
(Loss) income before income taxes(1)(2) |
(716 | ) | (803 | ) | 92 | |||||
(Benefit) provision for income taxes(1)(2) |
(167 | ) | (107 | ) | 37 | |||||
| | | | | | | | | | | |
(Loss) income, net of income taxes(1)(2) |
(549 | ) | (696 | ) | 55 | |||||
Gain (loss) on sale, net of income taxes |
— | — | (2 | ) | ||||||
| | | | | | | | | | | |
(Loss) income from discontinued operations, net of income taxes(1)(2) |
$ | (549 | ) | $ | (696 | ) | $ | 53 | ||
| | | | | | | | | | | |
| | | | | | | | | | | |
| | | | | | | | | | | |
- (1)
- During
2013, 2012 and 2011, the Company recorded pre-tax non-cash impairment charges of $673 million ($521 million, net of tax),
$909 million ($764 million, net of tax) and $37 million ($22 million, net of tax), respectively, associated with the goodwill and trade name at its TruGreen Business, which
is reported in (loss) income from discontinued operations, net of income taxes.
- (2)
- As a result of the decision to sell TruGreen LandCare, a $34 million impairment charge ($21 million, net of tax) was recorded in loss from discontinued operations, net of income taxes, in the first quarter of 2011 to reduce the carrying value of TruGreen LandCare's assets to their estimated fair value less cost to sell in accordance with applicable accounting standards. Upon completion of the sale in 2011, a $6 million loss on sale ($2 million, net of tax) was recorded.
F-27
SERVICEMASTER GLOBAL HOLDINGS, INC.
Notes to the Consolidated Financial Statements (Continued)
Note 7. Discontinued Operations (Continued)
Assets and liabilities of discontinued operations are summarized below:
| |
As of December 31, |
||||||
|---|---|---|---|---|---|---|---|
(In millions)
|
2013 | 2012 | |||||
Assets: |
|||||||
Receivables, net |
$ | 28 | $ | 29 | |||
Inventories and other current assets |
48 | 42 | |||||
| | | | | | | | |
Total Current Assets |
76 | 71 | |||||
| | | | | | | | |
Property and equipment, net |
181 | 182 | |||||
Goodwill and intangible assets, net |
355 | 1,032 | |||||
Other long-term assets |
6 | 4 | |||||
| | | | | | | | |
Total Assets |
$ | 618 | $ | 1,289 | |||
| | | | | | | | |
| | | | | | | | |
| | | | | | | | |
Liabilities: |
|||||||
Current liabilities |
$ | 139 | $ | 101 | |||
Long-term debt and other long-term liabilities |
162 | 290 | |||||
| | | | | | | | |
Total Liabilities |
$ | 301 | $ | 391 | |||
| | | | | | | | |
| | | | | | | | |
| | | | | | | | |
At December 31, 2013 and 2012, these balances primarily reflect the historical assets and liabilities of the TruGreen business.
Note 8. Restructuring Charges
The Company incurred restructuring charges of $6 million ($4 million, net of tax), $15 million ($9 million, net of tax) and $7 million ($4 million, net of tax) for the years ended December 31, 2013, 2012 and 2011, respectively. Restructuring charges were comprised of the following:
| |
Year Ended December 31, |
|||||||||
|---|---|---|---|---|---|---|---|---|---|---|
(In millions)
|
2013 | 2012 | 2011 | |||||||
Terminix branch optimization(1) |
$ | 2 | $ | 4 | $ | 4 | ||||
American Home Shield reorganization(2) |
— | 1 | — | |||||||
Franchise Services Group reorganization(2) |
— | 1 | — | |||||||
Centers of excellence initiative(3) |
4 | 9 | 3 | |||||||
| | | | | | | | | | | |
Total restructuring charges |
$ | 6 | $ | 15 | $ | 7 | ||||
| | | | | | | | | | | |
| | | | | | | | | | | |
| | | | | | | | | | | |
- (1)
- These
charges included severance costs of $1 million, and for the years ended December 31, 2013, 2012 and 2011, these charges included lease
termination costs of $1 million, $3 million and $4 million, respectively.
- (2)
- For
the year ended December 31, 2012, these charges included severance costs.
- (3)
- Represents restructuring charges related to an initiative to enhance capabilities and reduce costs in the Company's headquarters functions that provide Company-wide
F-28
SERVICEMASTER GLOBAL HOLDINGS, INC.
Notes to the Consolidated Financial Statements (Continued)
Note 8. Restructuring Charges (Continued)
administrative services for our operations that we refer to as centers of excellence. For the years ended December 31, 2013, 2012 and 2011, these charges included severance and other costs of $1 million, $4 million and $2 million, respectively, and professional fees of $3 million, $5 million and $1 million, respectively.
The pretax charges discussed above are reported in Restructuring charges on the consolidated statements of operations and comprehensive (loss) income.
A reconciliation of the beginning and ending balances of accrued restructuring charges, which are included in Accrued Liabilities—Other on the consolidated statements of financial position, is presented as follows:
(In millions)
|
Accrued Restructuring Charges |
|||
|---|---|---|---|---|
Balance as of December 31, 2011 |
$ | 4 | ||
Costs incurred |
15 | |||
Costs paid or otherwise settled |
(15 | ) | ||
| | | | | |
Balance as of December 31, 2012 |
4 | |||
Costs incurred |
6 | |||
Costs paid or otherwise settled |
(9 | ) | ||
| | | | | |
Balance as of December 31, 2013 |
$ | 1 | ||
| | | | | |
| | | | | |
| | | | | |
Note 9. Commitments and Contingencies
The Company leases certain property and equipment under various operating lease arrangements. Most of the property leases provide that the Company pay taxes, insurance and maintenance applicable to the leased premises. As leases for existing locations expire, the Company expects to renew the leases or substitute another location and lease.
Rental expense for the years ended December 31, 2013, 2012 and 2011 was $29 million, $31 million and $38 million, respectively. Based on leases in place as of December 31, 2013, future long-term non-cancelable operating lease payments will be approximately $21 million in 2014, $16 million in 2015, $13 million in 2016, $11 million in 2017, $7 million in 2018 and $5 million in 2019 and thereafter.
In the normal course of business, the Company periodically enters into agreements that incorporate indemnification provisions. While the maximum amount to which the Company may be exposed under such agreements cannot be estimated, the Company does not expect these guarantees and indemnifications to have a material effect on the Company's business, financial condition, results of operations or cash flows.
The Company carries insurance policies on insurable risks at levels which it believes to be appropriate, including workers' compensation, auto and general liability risks. The Company purchases insurance policies from third-party insurance carriers, which typically incorporate significant deductibles or self-insured retentions. The Company is responsible for all claims that fall below the retention limits. In determining the Company's accrual for self- insured claims, the Company uses historical claims
F-29
SERVICEMASTER GLOBAL HOLDINGS, INC.
Notes to the Consolidated Financial Statements (Continued)
Note 9. Commitments and Contingencies (Continued)
experience to establish both the current year accrual and the underlying provision for future losses. This actuarially determined provision and related accrual includes known claims, as well as incurred but not reported claims. The Company adjusts its estimate of accrued self-insured claims when required to reflect changes based on factors such as changes in health care costs, accident frequency and claim severity.
A reconciliation of the beginning and ending accrued self-insured claims, which are included in Accrued liabilities—Self-insured claims and related expenses and Other long-term obligations, primarily self-insured claims, on the consolidated statements of financial position, net of insurance recoverables, which are included in Prepaid expenses and other assets and Other assets on the consolidated statements of financial position, is presented as follows:
(In millions)
|
Accrued Self-insured Claims, Net |
|||
|---|---|---|---|---|
Balance as of December 31, 2011 |
$ | 108 | ||
Provision for self-insured claims |
35 | |||
Cash payments |
(40 | ) | ||
| | | | | |
Balance as of December 31, 2012 |
103 | |||
Provision for self-insured claims |
47 | |||
Cash payments |
(49 | ) | ||
| | | | | |
Balance as of December 31, 2013 |
$ | 101 | ||
| | | | | |
| | | | | |
| | | | | |
Accruals for home warranty claims in the American Home Shield business are made based on the Company's claims experience and actuarial projections. Termite damage claim accruals in the Terminix business are recorded based on both the historical rates of claims incurred within a contract year and the cost per claim. Current activity could differ causing a change in estimates. The Company has certain liabilities with respect to existing or potential claims, lawsuits and other proceedings. The Company accrues for these liabilities when it is probable that future costs will be incurred and such costs can be reasonably estimated. Any resulting adjustments, which could be material, are recorded in the period the adjustments are identified.
In the ordinary course of conducting business activities, the Company and its subsidiaries become involved in judicial, administrative and regulatory proceedings involving both private parties and governmental authorities. These proceedings include insured and uninsured matters that are brought on an individual, collective, representative and class action basis, or other proceedings involving regulatory, employment, general and commercial liability, automobile liability, wage and hour, environmental and other matters. The Company has entered into settlement agreements in certain cases, including with respect to putative collective and class actions, which are subject to court or other approvals. If one or more of the Company's settlements are not finally approved, the Company could have additional or different exposure, which could be material. At this time, the Company does not expect any of these proceedings to have a material effect on its reputation, business, financial position, results of operations or cash flows; however, the Company can give no assurance that the results of any such proceedings will not materially affect its reputation, business, financial position, results of operations and cash flows.
F-30
SERVICEMASTER GLOBAL HOLDINGS, INC.
Notes to the Consolidated Financial Statements (Continued)
Note 10. Related Party Transactions
The Company is a party to a consulting agreement with CD&R under which CD&R provides the Company with ongoing consulting and management advisory services. The annual consulting fee payable under the consulting agreement with CD&R is $6 million. Under this agreement, the Company recorded consulting fees of $6 million in each of the years ended December 31, 2013, 2012 and 2011, which is included in Selling and administrative expenses in the consolidated statements of operations and comprehensive (loss) income. The consulting agreement also provides that CD&R may receive additional fees in connection with certain subsequent financing and acquisition or disposition transactions. There were no additional fees incurred in each of the years ended December 31, 2013, 2012 and 2011. The consulting agreement will terminate on July 24, 2017, unless terminated earlier at CD&R's election.
As of December 31, 2013, the Company is a party to consulting agreements with StepStone, JPMorgan and BAS. The consulting agreements terminate on June 30, 2016 or upon the earlier termination of the consulting agreement with CD&R. Effective January 1, 2012, the annual consulting fee formerly payable to BAS was reduced to $0.25 million. Pursuant to the consulting agreements, the Company is required to pay aggregate annual consulting fees of $1 million to StepStone, JPMorgan and BAS. The Company recorded aggregate consulting fees related to these agreements of $1 million in each of the years ended December 31, 2013, 2012 and 2011, which is included in selling and administrative expenses in the consolidated statements of operations and comprehensive (loss) income.
Note 11. Employee Benefit Plans
Discretionary contributions to qualified profit sharing and non-qualified deferred compensation plans were made in the amount of $13 million, $12 million and $10 million for the years ended December 31, 2013, 2012 and 2011, respectively.
F-31
SERVICEMASTER GLOBAL HOLDINGS, INC.
Notes to the Consolidated Financial Statements (Continued)
Note 12. Long-Term Debt
Long-term debt as of December 31, 2013 and December 31, 2012 is summarized in the following table:
| |
As of December 31, |
||||||
|---|---|---|---|---|---|---|---|
(In millions)
|
2013 | 2012 | |||||
Senior secured term loan facility maturing in 2014 (Tranche A) |
$ | — | $ | 1,219 | |||
Senior secured term loan facility maturing in 2017 (Tranche B) |
991 | 1,001 | |||||
Senior secured term loan facility maturing in 2017 (Tranche C)(1) |
1,198 | — | |||||
7.00% senior notes maturing in 2020 |
750 | 750 | |||||
8.00% senior notes maturing in 2020(2) |
602 | 603 | |||||
Revolving credit facility maturing in 2017 |
— | — | |||||
7.10% notes maturing in 2018(3) |
71 | 69 | |||||
7.45% notes maturing in 2027(3) |
159 | 156 | |||||
7.25% notes maturing in 2038(3) |
63 | 62 | |||||
Vehicle capital leases(4) |
32 | 16 | |||||
Other |
40 | 48 | |||||
Less current portion |
(39 | ) | (43 | ) | |||
| | | | | | | | |
Total long-term debt |
$ | 3,867 | $ | 3,881 | |||
| | | | | | | | |
| | | | | | | | |
| | | | | | | | |
- (1)
- Presented
net of $10 million in unamortized original issue discount paid as part of the 2013 Term Loan Facility Amendment.
- (2)
- As
of December 31, 2013 and 2012, includes $2 million and $3 million, respectively, in unamortized premium received on the sale of
$100 million aggregate principal amount of such notes.
- (3)
- The
increase in the balance from 2012 to 2013 reflects the amortization of fair value adjustments related to purchase accounting, which increases the
effective interest rate from the coupon rates shown above.
- (4)
- SvM has entered into the Fleet Agreement. All leases under the Fleet Agreement are capital leases for accounting purposes. The lease rental payments include an interest component calculated using a variable rate based on one-month LIBOR plus other contractual adjustments and a borrowing margin totaling 2.45 percent.
Term Facilities
On the 2007 Closing Date, in connection with the completion of the 2007 Merger, SvM became obligated under the Term Facilities. The Term Facilities consist of (i) the Term Loan Facility providing for term loans in an aggregate principal amount of $2,650 million and (ii) a then new pre-funded synthetic letter of credit facility in an aggregate principal amount of $150 million. As of December 31, 2013, after giving effect to the 2012 Term Loan Facility Amendment and 2013 Term Loan Facility Amendment discussed below, SvM had outstanding $135 million of letters of credit, resulting in unused commitments under the synthetic letter of credit facility of $3 million.
F-32
SERVICEMASTER GLOBAL HOLDINGS, INC.
Notes to the Consolidated Financial Statements (Continued)
Note 12. Long-Term Debt (Continued)
The Term Loan Facility and the guarantees thereof are secured by substantially all of the tangible and intangible assets of SvM and certain of its domestic subsidiaries, excluding certain subsidiaries subject to regulatory requirements in various states, including pledges of all the capital stock of all direct domestic subsidiaries (other than foreign subsidiary holding companies, which are deemed to be foreign subsidiaries) owned by SvM or any Guarantor and of up to 65% of the capital stock of each direct foreign subsidiary owned by SvM or any Guarantor. The Term Loan Facility security interests are subject to certain exceptions, including, but not limited to, exceptions for (i) equity interests, (ii) indebtedness or other obligations of subsidiaries, (iii) real estate or (iv) any other assets, if the granting of a security interest therein would require that any notes issued under SvM's indenture dated as of August 15, 1997 be secured. The Term Loan Facility is secured on a pari passu basis with the security interests created in the same collateral securing the Revolving Credit Facility.
Pursuant to the 2012 Term Loan Facility Amendment, the Tranche B loans have a maturity date of January 31, 2017. The interest rates applicable to the Tranche B loans under the Term Loan Facility are based on a fluctuating rate of interest measured by reference to either, at SvM's option, (i) an adjusted London inter-bank offered rate (adjusted for maximum reserves), plus a borrowing margin or (ii) an alternate base rate, plus a borrowing margin. As of December 31, 2013, the borrowing margin for the outstanding Tranche B loans was 4.25 percent. The 2012 Term Loan Facility Amendment also included mechanics for future extension amendments, permits borrower buy-backs of term loans, increased the size of certain baskets and made certain other changes to the Credit Agreement, including the reduction of the availability under the synthetic letter of credit facility from $150 million to $138 million.
On February 22, 2013, SvM entered into the 2013 Term Loan Facility Amendment to amend the Credit Agreement primarily to extend the maturity date of a portion of the borrowings under the Term Loan Facility. Pursuant to the 2013 Term Loan Facility Amendment, the maturity of the outstanding Tranche A loans was extended, and such loans were converted into the Tranche C loans. The maturity date for the Tranche C loans is January 31, 2017. The interest rates applicable to the Tranche C loans under the Term Loan Facility are based on a fluctuating rate of interest measured by reference to either, at the SvM's option, (i) an adjusted London inter-bank offered rate (adjusted for maximum reserves) plus 3.25 percent, with a minimum adjusted London inter-bank offered rate of 1.00 percent or (ii) an alternate base rate plus 2.25 percent, with a minimum alternate base rate of 2.00 percent. As part of the 2013 Term Loan Facility Amendment, the SvM paid an original issue discount equal to 1.00 percent of the outstanding borrowings, or $12 million. Voluntary prepayments of borrowings under the Tranche C Loans are permitted at any time, in minimum principal amounts, without premium or penalty.
As a result of the 2012 Term Loan Facility Amendment and the 2013 Term Loan Facility Amendment, SvM has, as of December 31, 2013, approximately $2,189 million of outstanding borrowings maturing January 31, 2017, after including the unamortized portion of the original issue discount paid. Additionally, following the 2012 Term Loan Facility Amendment and the 2013 Term Loan Facility Amendment the availability under the synthetic letter of credit facility will be reduced from the current availability of $138 million to $78 million as of July 24, 2014. The remaining $78 million of availability under the synthetic letter of credit will mature January 31, 2017.
SvM has historically entered into interest rate swap agreements. Under the terms of these agreements, SvM pays a fixed rate of interest on the stated notional amount and SvM receives a
F-33
SERVICEMASTER GLOBAL HOLDINGS, INC.
Notes to the Consolidated Financial Statements (Continued)
Note 12. Long-Term Debt (Continued)
floating rate of interest (based on one month LIBOR) on the stated notional amount. Therefore, during the term of the swap agreements, the effective interest rate on the portion of the term loans equal to the stated notional amount is fixed at the stated rate in the interest rate swap agreements plus the incremental borrowing margin. The changes in interest rate swap agreements in effect for the years ended December 31, 2013, 2012 and 2011, as well as the cumulative interest rate swaps outstanding as of December 31, 2012 and 2011 are as follows:
(In millions)
|
Notional Amount |
Weighted Average Fixed Rate(1) |
|||||
|---|---|---|---|---|---|---|---|
Interest rate swap agreements in effect as of December 31, 2011 |
$ | 1,430 | 2.84 | % | |||
Expired |
(450 | ) | |||||
| | | | | | | | |
Interest rate swap agreements in effect as of December 31, 2012 |
980 | 1.70 | % | ||||
Expired |
(980 | ) | |||||
| | | | | | | | |
Interest rate swap agreements in effect as of December 31, 2013 |
$ | — | — | ||||
| | | | | | | | |
| | | | | | | | |
| | | | | | | | |
- (1)
- Before the application of the applicable borrowing margin.
In accordance with accounting standards for derivative instruments and hedging activities, and as further described in Note 18, these interest rate swap agreements are classified as cash flow hedges, and, as such, the hedging instruments are recorded on the consolidated statements of financial position as either an asset or liability at fair value, with the effective portion of the changes in fair value attributable to the hedged risks recorded in accumulated other comprehensive (loss) income.
Senior Notes
On the 2007 Closing Date, in connection with the completion of the 2007 Merger, SvM became obligated under the Interim Loan Facility. The Interim Loan Facility matured on July 24, 2008. On the maturity date, outstanding amounts under the Interim Loan Facility were converted on a one to one basis into 2015 Notes.
The 2020 Notes, sold in February 2012, will mature on February 15, 2020 and bear interest at a rate of 8 percent per annum. The proceeds from the 2020 Notes, sold in February 2012, together with available cash, were used to redeem $600 million in aggregate principal amount of the SvM's outstanding 2015 Notes in the first quarter of 2012. The 2020 Notes, sold in August 2012, will mature on August 15, 2020 and bear interest at a rate of 7 percent per annum. SvM used a majority of the proceeds from the sale of the 2020 Notes, sold in August 2012, to redeem the remaining $396 million aggregate principal amount of its 2015 Notes and to repay $276 million of outstanding borrowings under its Term Facilities during the third quarter of 2012. The Company recorded a loss on extinguishment of debt of $55 million on the consolidated statements of operations and comprehensive (loss) income for the year ended December 31, 2012 related to these transactions and the redemption of the 2015 Notes in the first quarter of 2012 discussed above. The 2020 Notes are jointly and severally
F-34
SERVICEMASTER GLOBAL HOLDINGS, INC.
Notes to the Consolidated Financial Statements (Continued)
Note 12. Long-Term Debt (Continued)
guaranteed on a senior unsecured basis by the Guarantors. The 2020 Notes are not guaranteed by the Non-Guarantors.
The 2020 Notes are senior unsecured obligations of SvM and rank equally in right of payment with all of SvM's other existing and future senior unsecured indebtedness. The subsidiary guarantees are general unsecured senior obligations of the Guarantors and rank equally in right of payment with all of the existing and future senior unsecured indebtedness of our Non-Guarantors. The 2020 Notes are effectively junior to all of SvM's existing and future secured indebtedness to the extent of the value of the assets securing such indebtedness.
Revolving Credit Facility
On the 2007 Closing Date, in connection with the completion of the 2007 Merger, SvM became obligated under the Revolving Credit Facility. The Revolving Credit Facility provides for senior secured revolving loans and stand-by and other letters of credit. The Revolving Credit Facility limits outstanding letters of credit to $75 million. As of December 31, 2013 and 2012, there were no revolving loans or letters of credit outstanding under the Revolving Credit Facility. As of December 31, 2013, SvM had $324 million of remaining capacity available under the Revolving Credit Facility.
On November 27, 2013, SvM entered into the 2013 Revolver Amendment. Pursuant to the 2013 Revolver Amendments, after completion of the TruGreen Separation Transaction, SvM has $242 million of available borrowing capacity through July 23, 2014 and $183 million from July 24, 2014 through January 31, 2017. SvM will continue to have access to letters of credit up to $75 million through January 31, 2017.
The Revolving Credit Facility and the guarantees thereof are secured by the same collateral securing the Term Loan Facility, on a pari passu basis with the security interests created in the same collateral securing the Term Loan Facility.
The interest rates applicable to the loans under the Revolving Credit Facility will be based on a fluctuating rate of interest measured by reference to either, at the borrower's option, (1) an adjusted London inter-bank offered rate (adjusted for maximum reserves), plus a borrowing margin (2.50 percent as of December 31, 2013) or (2) an alternate base rate, plus a borrowing margin (1.50 percent as of December 31, 2013). The borrowing margin, in each case, will be adjusted from time to time based on the Consolidated Secured Leverage Ratio (as defined in the Revolving Credit Agreement) for the previous fiscal quarter.
The agreements governing the Term Facilities, the 2020 Notes and the Revolving Credit Facility contain certain covenants that, among other things, limit or restrict the incurrence of additional indebtedness, liens, sales of assets, certain payments (including dividends) and transactions with affiliates, subject to certain exceptions. SvM was in compliance with the covenants under these agreements at December 31, 2013.
As of December 31, 2013, future scheduled long-term debt payments are $39 million, $52 million, $35 million, $2,141 million and $83 million for the years ended December 31, 2014, 2015, 2016, 2017 and 2018, respectively. Certain of the Company's assets, including vehicles, equipment and a call center facility, are leased under capital leases with $35 million in remaining lease obligations as of December 31, 2013. The long-term debt payments above include future capital lease payments of approximately $9 million in 2014, $9 million in 2015, $8 million in 2016, $6 million in 2017 and $3 million in 2018.
F-35
SERVICEMASTER GLOBAL HOLDINGS, INC.
Notes to the Consolidated Financial Statements (Continued)
Note 13. Cash and Marketable Securities
Cash, money market funds and certificates of deposits with maturities of three months or less when purchased are included in Cash and cash equivalents on the consolidated statements of financial position. As of December 31, 2013 and 2012, the Company's investments consist primarily of domestic publicly traded debt and certificates of deposit ("Debt securities") and common equity securities ("Equity securities"). The amortized cost, fair value and gross unrealized gains and losses of the Company's short- and long-term investments in Debt and Equity securities as of December 31, 2013 and 2012 is as follows:
(In millions)
|
Amortized Cost |
Gross Unrealized Gains |
Gross Unrealized Losses |
Fair Value |
|||||||||
|---|---|---|---|---|---|---|---|---|---|---|---|---|---|
Available-for-sale and trading securities, December 31, 2013: |
|||||||||||||
Debt securities |
$ | 97 | $ | 3 | $ | (1 | ) | $ | 99 | ||||
Equity securities |
41 | 9 | — | 50 | |||||||||
| | | | | | | | | | | | | | |
Total securities |
$ | 138 | $ | 12 | $ | (1 | ) | $ | 149 | ||||
| | | | | | | | | | | | | | |
| | | | | | | | | | | | | | |
| | | | | | | | | | | | | | |
(In millions)
|
Amortized Cost |
Gross Unrealized Gains |
Gross Unrealized Losses |
Fair Value |
|||||||||
|---|---|---|---|---|---|---|---|---|---|---|---|---|---|
Available-for-sale and trading securities, December, 31, 2012: |
|||||||||||||
Debt securities |
$ | 99 | $ | 6 | $ | — | $ | 105 | |||||
Equity securities |
39 | 4 | (2 | ) | 41 | ||||||||
| | | | | | | | | | | | | | |
Total securities |
$ | 138 | $ | 10 | $ | (2 | ) | $ | 146 | ||||
| | | | | | | | | | | | | | |
| | | | | | | | | | | | | | |
| | | | | | | | | | | | | | |
There were no unrealized losses which had been in a loss position for more than one year as of December 31, 2013. The portion of unrealized losses which had been in a loss position for more than one year was $2 million as of December 31, 2012. The aggregate fair value of the investments with unrealized losses was $30 million and $13 million as of December 31, 2013 and 2012, respectively.
Gains and losses on sales of investments, as determined on a specific identification basis, are included in investment income in the period they are realized. The Company periodically reviews its portfolio of investments to determine whether there has been an other than temporary decline in the value of the investments from factors such as deterioration in the financial condition of the issuer or the market(s) in which the issuer competes.
The table below summarizes proceeds, gross realized gains, gross realized losses, each resulting from sales of available-for-sale securities, and impairment charges due to other than temporary declines in the value of certain investments.
| |
Year Ended December 31, |
|||||||||
|---|---|---|---|---|---|---|---|---|---|---|
(In millions)
|
2013 | 2012 | 2011 | |||||||
Proceeds from sales of securities |
$ | 23 | $ | 23 | $ | 45 | ||||
Gross realized gains, pre-tax |
2 | 2 | 6 | |||||||
Gross realized gains, net of tax |
1 | 1 | 4 | |||||||
Gross realized losses, pre-tax |
(1 | ) | — | — | ||||||
F-36
SERVICEMASTER GLOBAL HOLDINGS, INC.
Notes to the Consolidated Financial Statements (Continued)
Note 14. Comprehensive Income (Loss)
Comprehensive income (loss), which primarily includes net income (loss), unrealized gain (loss) on marketable securities, unrealized gain (loss) on derivative instruments and the effect of foreign currency translation is disclosed on the consolidated statements of operations and comprehensive income (loss) and the consolidated statements of shareholders' equity.
The following table summarizes the activity in other comprehensive income (loss) and the related tax effects.
(In millions)
|
Unrealized Losses on Derivatives |
Unrealized Gains on Available-for- Sale Securities |
Foreign Currency Translation |
Total | |||||||||
|---|---|---|---|---|---|---|---|---|---|---|---|---|---|
Balance as of December 31, 2011 |
$ | (14 | ) | $ | 4 | $ | 4 | $ | (6 | ) | |||
Other comprehensive loss before reclassifications: |
|||||||||||||
Pre-tax amount |
— | (2 | ) | — | (2 | ) | |||||||
Tax provision (benefit) |
— | (1 | ) | — | (1 | ) | |||||||
| | | | | | | | | | | | | | |
After tax amount |
— | (1 | ) | — | (1 | ) | |||||||
Amounts reclassified from accumulated other comprehensive income (loss)(1) |
12 | 2 | — | 14 | |||||||||
| | | | | | | | | | | | | | |
Net current period other comprehensive income (loss) |
12 | 1 | — | 13 | |||||||||
| | | | | | | | | | | | | | |
Balance as of December 31, 2012 |
$ | (2 | ) | $ | 5 | $ | 4 | $ | 7 | ||||
| | | | | | | | | | | | | | |
Other comprehensive income (loss) before reclassifications |
|||||||||||||
Pre-tax amount |
— | 5 | (4 | ) | 1 | ||||||||
Tax provision (benefit) |
— | 2 | — | 2 | |||||||||
| | | | | | | | | | | | | | |
After tax amount |
— | 3 | (4 | ) | (1 | ) | |||||||
Amounts reclassified from accumulated other comprehensive income (loss)(1) |
2 | (1 | ) | — | 1 | ||||||||
| | | | | | | | | | | | | | |
Net current period other comprehensive income (loss) |
2 | 2 | (4 | ) | — | ||||||||
| | | | | | | | | | | | | | |
Balance as of December 31, 2013 |
$ | — | $ | 7 | $ | — | 7 | ||||||
| | | | | | | | | | | | | | |
| | | | | | | | | | | | | | |
| | | | | | | | | | | | | | |
- (1)
- Amounts are net of tax. See reclassifications out of accumulated other comprehensive income (loss) below for further details.
F-37
SERVICEMASTER GLOBAL HOLDINGS, INC.
Notes to the Consolidated Financial Statements (Continued)
Note 14. Comprehensive Income (Loss) (Continued)
Reclassifications out of accumulated other comprehensive income (loss) included the following components for the periods indicated.
| |
As of December 31 | Consolidated Statements of Operations and Comprehensive (Loss) Income |
|||||||||
|---|---|---|---|---|---|---|---|---|---|---|---|
| |
2013 | 2012 | 2011 | ||||||||
(In millions)
|
|
||||||||||
(Gains) losses on derivatives: |
|||||||||||
Fuel swap contracts |
$ | (1 | ) | $ | (2 | ) | $ | (10 | ) | Cost of services rendered and products sold | |
Interest rate swap contracts |
5 | 22 | 38 | Interest expense | |||||||
| | | | | | | | | | | | |
Net losses on derivatives |
4 | 20 | 28 | ||||||||
Impact of income taxes |
2 | 8 | 11 | (Benefit) provision for income taxes | |||||||
| | | | | | | | | | | | |
Total reclassifications related to derivatives |
$ | 2 | $ | 12 | $ | 17 | |||||
| | | | | | | | | | | | |
| | | | | | | | | | | | |
| | | | | | | | | | | | |
(Gains) losses on available-for-sale securities |
$ | (2 | ) | $ | 3 | $ | (6 | ) | Interest and net investment income | ||
Impact of income taxes |
(1 | ) | 1 | (2 | ) | (Benefit) provision for income taxes | |||||
| | | | | | | | | | | | |
Total reclassifications related to securities |
$ | (1 | ) | $ | 2 | $ | (4 | ) | |||
| | | | | | | | | | | | |
| | | | | | | | | | | | |
| | | | | | | | | | | | |
Total reclassifications for the period |
$ | 1 | $ | 14 | $ | 13 | |||||
| | | | | | | | | | | | |
| | | | | | | | | | | | |
| | | | | | | | | | | | |
Note 15. Supplemental Cash Flow Information
Supplemental information relating to the consolidated statements of cash flows is presented in the following table:
| |
Year Ended December 31, |
|||||||||
|---|---|---|---|---|---|---|---|---|---|---|
(In millions)
|
2013 | 2012 | 2011 | |||||||
Cash paid for or (received from): |
||||||||||
Interest expense |
$ | 232 | $ | 233 | $ | 244 | ||||
Interest and dividend income |
(5 | ) | (5 | ) | (5 | ) | ||||
Income taxes, net of refunds |
9 | 9 | 12 | |||||||
The Company acquired $26 million, $20 million and $1 million of property and equipment through capital leases and other non-cash financing transactions in the years ended December 31, 2013, 2012 and 2011, respectively, which have been excluded from the consolidated statements of cash flows as non-cash investing and financing activities.
Note 16. Capital Stock
The Company is authorized to issue 2,000,000,000 shares of common stock. As of December 31, 2013, there were 98,915,432 shares of common stock issued and 91,560,966 shares of common stock outstanding. The Company has no other classes of equity securities issued or outstanding. All of the issued and outstanding shares of the Company are held by investment funds sponsored by, or affiliated with, the Equity Sponsors and certain executive officers and key employees of SvM. The Company has
F-38
SERVICEMASTER GLOBAL HOLDINGS, INC.
Notes to the Consolidated Financial Statements (Continued)
Note 16. Capital Stock (Continued)
completed equity offerings to certain executive officers and key employees pursuant to the MSIP (as defined below). The shares sold and options granted to employees in connection with these equity offerings are subject to and governed by the terms of the MSIP and are discussed further in Note 17.
In connection with these offerings, the Company sold 384,427 deferred share units ("DSUs") at a purchase price of $15.00 per DSU. DSUs represent a right to receive a share of common stock in the future. In 2008, the Company issued 384,427 shares of common stock to a rabbi trust to be held for future distribution related to the DSUs. The shares held by the rabbi trust are presented in treasury stock on the consolidated statements of financial position and the consolidated statements of shareholders' equity. As of December 31, 2013, there are 108,504 DSUs outstanding, which have not yet been converted to common stock.
Note 17. Stock-Based Compensation
The board of directors and stockholders of the Company have adopted the Amended and Restated ServiceMaster Global Holdings, Inc. Stock Incentive Plan (the "MSIP"). The MSIP provides for the sale of shares and deferred share units ("DSUs") of the Company's stock to SvM's executives, officers and other employees and to the Company's directors as well as the grant of restricted stock units ("RSUs"), performance-based RSUs and options to purchase shares of the Company's stock to those individuals. DSUs represent a right to receive a share of common stock in the future. The board of directors of the Company, or a committee designated by it, selects the SvM executives, officers and employees and the Company's directors eligible to participate in the MSIP and determines the specific number of shares to be offered or options to be granted to an individual. A maximum of 10,396,667 shares of the Company's stock is authorized for issuance under the MSIP. The Company currently intends to satisfy any need for shares of common stock of the Company associated with the settlement of DSUs, vesting of RSUs or exercise of options issued under the MSIP through those new shares available for issuance or any shares repurchased, forfeited or surrendered from participants in the MSIP.
All option grants under the MSIP have been, and will be, non-qualified options with a per-share exercise price no less than the fair market value of one share of the Company's stock on the grant date. Any stock options granted will generally have a term of ten years and vesting will be subject to an employee's continued employment. The board of directors of the Company, or a committee designated by it, may accelerate the vesting of an option at any time. In addition, vesting of options will be accelerated if the Company experiences a change in control (as defined in the MSIP) unless options with substantially equivalent terms and economic value are substituted for existing options in place of accelerated vesting. Vesting of options will also be accelerated in the event of an employee's death or disability (as defined in the MSIP). Upon a termination for cause (as defined in the MSIP), all options held by an employee are immediately cancelled. Following a termination without cause, vested options will generally remain exercisable through the earliest of the expiration of their term or three months following termination of employment (one year in the case of death, disability or retirement at normal retirement age). Unless sooner terminated by the board of directors of the Company, the MSIP will remain in effect until November 20, 2017.
In 2013, 2012 and 2011, the Company completed various equity offerings to certain executives, officers and employees of SvM pursuant to the MSIP. The shares sold and options granted in connection with these equity offerings are subject to and governed by the terms of the MSIP. In
F-39
SERVICEMASTER GLOBAL HOLDINGS, INC.
Notes to the Consolidated Financial Statements (Continued)
Note 17. Stock-Based Compensation (Continued)
connection with these offerings, the Company sold a total of 437,622; 81,899; and 330,356 shares of common stock in 2013, 2012 and 2011, respectively, at a weighted average purchase price of 15.33 per share in 2013, $21.98 per share in 2012 and $16.50 per share in 2011. In addition, the Company granted SvM's executives, officers and employees options to purchase 1,609,963; 337,404; and 1,520,252 shares of the Company's common stock in 2013, 2012 and 2011, respectively, at a weighted average exercise price of $15.24 per share for options issued in 2013, $22.01 per share for options issued in 2012 and $16.50 per share for options issued in 2011. These options are subject to and governed by the terms of the MSIP. The per share purchase price and exercise price was based on the determination by the Compensation Committee of the Company of the fair market value of the common stock of the Company as of the purchase/grant dates.
All options granted to date generally will vest in four equal annual installments, subject to an employee's continued employment. The four-year vesting period is the requisite service period over which compensation cost will be recognized on a straight-line basis for all grants. All options issued are accounted for as equity-classified awards. The non-cash stock-based compensation expense associated with the MSIP is pushed down from the Company and recorded in the Company's Consolidated Financial Statements.
The value of each option award was estimated on the grant date using the Black-Scholes option valuation model that incorporates the assumptions noted in the following table. For options granted in 2013, 2012 and 2011, the expected volatilities were based on the historical and implied volatilities of the publicly traded stock of a group of companies comparable to the Company. The expected life represents the period of time that options granted are expected to be outstanding and was calculated using the simplified method as outlined by the SEC in Staff Accounting Bulletins No. 107 and 110. The risk-free interest rates were based on the U.S. Treasury securities with terms similar to the expected lives of the options as of the grant dates.
| |
Year Ended December 31, | |||||
|---|---|---|---|---|---|---|
Assumption
|
2013 | 2012 | 2011 | |||
Expected volatility |
49.2% - 49.6% | 49.2% - 50.3% | 31.0% - 50.3% | |||
Expected dividend yield |
0.0% | 0.0% | 0.0% | |||
Expected life (in years) |
6.3 | 6.3 | 6.3 | |||
Risk-free interest rate |
1.69% - 2.02% | 0.78% - 1.43% | 1.07% - 2.65% | |||
The weighted-average grant-date fair value of the options granted during 2013, 2012 and 2011 was $7.55, $10.59 and $6.47 per option, respectively. The Company has applied a forfeiture assumption of 18.8 percent per annum in the recognition of the expense related to these options, with the exception of the options held by the Company's CEO for which the Company has applied a forfeiture rate of zero.
F-40
SERVICEMASTER GLOBAL HOLDINGS, INC.
Notes to the Consolidated Financial Statements (Continued)
Note 17. Stock-Based Compensation (Continued)
A summary of option activity under the MSIP as of December 31, 2013, and changes during the year then ended is presented below:
| |
Stock Options | Weighted Avg. Exercise Price |
Weighted Avg. Remaining Contractual Term (in years) |
|||||||
|---|---|---|---|---|---|---|---|---|---|---|
Total outstanding, December 31, 2012 |
5,978,790 | $ | 15.74 | |||||||
Granted to employees |
1,609,963 | $ | 15.24 | |||||||
Exercised |
(53,333 | ) | $ | 15.00 | ||||||
Forfeited |
(632,748 | ) | $ | 16.82 | ||||||
Expired |
(1,597,039 | ) | $ | 15.47 | ||||||
| | | | | | | | | | | |
Total outstanding, December 31, 2013 |
5,305,633 | $ | 15.54 | 5.81 | ||||||
| | | | | | | | | | | |
| | | | | | | | | | | |
| | | | | | | | | | | |
Total exercisable, December 31, 2013 |
3,287,035 | $ | 15.23 | 3.57 | ||||||
| | | | | | | | | | | |
| | | | | | | | | | | |
| | | | | | | | | | | |
The Company granted SvM's executives, officers and employees 691,441; 48,095; and 233,636 RSUs in 2013, 2012 and 2011, respectively, with weighted average grant date fair values of $17.09 per unit for 2013, $22.35 per unit in 2012 and $16.50 per unit in 2011, which was equivalent to the then current fair value of the Company's common stock at the grant date. All RSUs outstanding as of December 31, 2013 will vest in three equal annual installments, subject to an employee's continued employment. Upon vesting, each RSU will be converted into one share of the Company's common stock.
A summary of RSU activity under the MSIP as of December 31, 2013, and changes during the year then ended is presented below:
| |
RSUs | Weighted Avg. Grant Date Fair Value |
|||||
|---|---|---|---|---|---|---|---|
Total outstanding, December 31, 2012 |
223,849 | $ | 17.40 | ||||
Granted to employees |
691,441 | $ | 17.09 | ||||
Vested |
(119,834 | ) | $ | 16.79 | |||
Forfeited |
(316,126 | ) | $ | 18.86 | |||
| | | | | | | | |
Total outstanding, December 31, 2013 |
479,330 | $ | 16.04 | ||||
| | | | | | | | |
| | | | | | | | |
| | | | | | | | |
During the years ended December 31, 2013, 2012 and 2011, the Company recognized stock-based compensation expense of $4 million ($3 million, net of tax), $7 million ($4 million, net of tax) and $8 million ($5 million, net of tax), respectively. As of December 31, 2013, there was $17 million of total unrecognized compensation costs related to non-vested stock options and RSUs granted by the Company under the MSIP. These remaining costs are expected to be recognized over a weighted-average period of 3.08 years.
In 2012, the Company modified options held by certain executive officers of SvM. These modifications resulted in $1 million in additional stock compensation expense, which was recorded during 2012. There were no stock option modifications in 2013 and 2011.
F-41
SERVICEMASTER GLOBAL HOLDINGS, INC.
Notes to the Consolidated Financial Statements (Continued)
Note 18. Fair Value Measurements
The period-end carrying amounts of receivables, accounts payable and accrued liabilities approximate fair value because of the short maturity of these instruments. The period-end carrying amounts of long-term notes receivable approximate fair value as the effective interest rates for these instruments are comparable to period-end market rates. The period-end carrying amounts of short- and long-term marketable securities also approximate fair value, with unrealized gains and losses reported net of tax as a component of accumulated other comprehensive income on the consolidated statements of financial position, or, for certain unrealized losses, reported in interest and net investment income on the consolidated statements of operations and comprehensive (loss) income if the decline in value is other than temporary. The carrying amount of total debt was $3,906 million and $3,924 million and the estimated fair value was $3,906 million and $3,982 million as of December 31, 2013 and 2012, respectively. The fair value of the Company's debt is estimated based on available market prices for the same or similar instruments which are considered significant other observable inputs (Level 2) within the fair value hierarchy. The fair values presented reflect the amounts that would be received to sell an asset or paid to transfer a liability in an orderly transaction between market participants at the measurement date (exit price). The fair value estimates presented in this report are based on information available to the Company as of December 31, 2013 and 2012.
The Company has estimated the fair value of its financial instruments measured at fair value on a recurring basis using the market and income approaches. For investments in marketable securities, deferred compensation trust assets and derivative contracts, which are carried at their fair values, the Company's fair value estimates incorporate quoted market prices, other observable inputs (for example, forward interest rates) and unobservable inputs (for example, forward commodity prices) at the balance sheet date.
Interest rate swap contracts are valued using forward interest rate curves obtained from third-party market data providers. The fair value of each contract is the sum of the expected future settlements between the contract counterparties, discounted to present value. The expected future settlements are determined by comparing the contract interest rate to the expected forward interest rate as of each settlement date and applying the difference between the two rates to the notional amount of debt in the interest rate swap contracts.
Fuel swap contracts are valued using forward fuel price curves obtained from third-party market data providers. The fair value of each contract is the sum of expected future settlements between contract counterparties, discounted to present value. The expected future settlements are determined by comparing the contract fuel price to the expected forward fuel price as of each settlement date and applying the difference between the contract and expected prices to the notional gallons in the fuel swap contracts. The Company regularly reviews the forward price curves obtained from third-party market data providers and related changes in fair value for reasonableness utilizing information available to the Company from other published sources.
The Company has not changed its valuation techniques for measuring the fair value of any financial assets and liabilities during the year. Transfers between levels, if any, are recognized at the end of the reporting period. There were no significant transfers between levels during the years ended December 31, 2013 or 2012.
F-42
SERVICEMASTER GLOBAL HOLDINGS, INC.
Notes to the Consolidated Financial Statements (Continued)
Note 18. Fair Value Measurements (Continued)
The carrying amount and estimated fair value of the Company's financial instruments that are recorded at fair value on a recurring basis for the periods presented are as follows:
| |
|
As of December 31, 2013 | |||||||||||||
|---|---|---|---|---|---|---|---|---|---|---|---|---|---|---|---|
| |
|
|
Estimated Fair Value Measurements | ||||||||||||
(In millions)
|
Statement of Financial Position Location |
Carrying Value |
Quoted Prices In Active Markets (Level 1) |
Significant Other Observable Inputs (Level 2) |
Significant Unobservable Inputs (Level 3) |
||||||||||
Financial Assets: |
|||||||||||||||
Deferred compensation trust assets |
Long-term marketable securities | $ | 9 | $ | 9 | $ | — | $ | — | ||||||
Investments in marketable securities |
Marketable securities and Long-term marketable securities | 136 | 61 | 75 | — | ||||||||||
Fuel swap contracts: |
|||||||||||||||
Current |
Prepaid expenses and other assets | 1 | — | — | 1 | ||||||||||
| | | | | | | | | | | | | | | | |
Total financial assets |
$ | 146 | $ | 70 | $ | 75 | $ | 1 | |||||||
| | | | | | | | | | | | | | | | |
| | | | | | | | | | | | | | | | |
| | | | | | | | | | | | | | | | |
| |
|
As of December 31, 2012 | |||||||||||||
|---|---|---|---|---|---|---|---|---|---|---|---|---|---|---|---|
| |
|
|
Estimated Fair Value Measurements | ||||||||||||
(In millions)
|
Statement of Financial Position Location |
Carrying Value |
Quoted Prices In Active Markets (Level 1) |
Significant Other Observable Inputs (Level 2) |
Significant Unobservable Inputs (Level 3) |
||||||||||
Financial Assets: |
|||||||||||||||
Deferred compensation trust assets |
Long-term marketable securities | $ | 9 | $ | 9 | $ | — | $ | — | ||||||
Investments in marketable securities |
Marketable securities and Long-term marketable securities | 134 | 45 | 89 | — | ||||||||||
Fuel swap contracts: |
|||||||||||||||
Current |
Prepaid expenses and other assets | 2 | — | — | 2 | ||||||||||
| | | | | | | | | | | | | | | | |
Total financial assets |
$ | 145 | $ | 54 | $ | 89 | $ | 2 | |||||||
| | | | | | | | | | | | | | | | |
| | | | | | | | | | | | | | | | |
| | | | | | | | | | | | | | | | |
Financial Liabilities: |
|||||||||||||||
Interest rate swap contracts |
Other accrued liabilities(1) | $ | 7 | $ | — | $ | 7 | $ | — | ||||||
| | | | | | | | | | | | | | | | |
Total financial liabilities |
$ | 7 | $ | — | $ | 7 | $ | — | |||||||
| | | | | | | | | | | | | | | | |
| | | | | | | | | | | | | | | | |
| | | | | | | | | | | | | | | | |
F-43
SERVICEMASTER GLOBAL HOLDINGS, INC.
Notes to the Consolidated Financial Statements (Continued)
Note 18. Fair Value Measurements (Continued)
A reconciliation of the beginning and ending fair values of financial instruments valued using significant unobservable inputs (Level 3) on a recurring basis is presented as follows:
(In millions)
|
Fuel Swap Contract (Liabilities) Assets |
|||
|---|---|---|---|---|
Balance as of December 31, 2011 |
$ | (1 | ) | |
Total gains (losses) (realized and unrealized): |
||||
Included in earnings |
2 | |||
Included in accumulated other comprehensive income |
3 | |||
Settlements, net |
(2 | ) | ||
| | | | | |
Balance as of December 31, 2012 |
2 | |||
Total gains (realized and unrealized): |
||||
Included in earnings |
1 | |||
Included in accumulated other comprehensive income |
(1 | ) | ||
Settlements, net |
(1 | ) | ||
| | | | | |
Balance as of December 31, 2013 |
$ | 1 | ||
| | | | | |
| | | | | |
| | | | | |
The following table presents information relating to the significant unobservable inputs of our Level 3 financial instruments as of December 31, 2013 and 2012:
Item
|
Fair Value as of December 31, 2013 (in millions) |
Valuation Technique | Unobservable Input | Range | Weighted Average |
||||||||
|---|---|---|---|---|---|---|---|---|---|---|---|---|---|
Fuel swap contracts |
$ | 1 | Discounted Cash Flows | Forward Unleaded Price per Gallon(1) | $3.20 - $3.87 | $ | 3.60 | ||||||
Item
|
Fair Value as of December 31, 2012 (in millions) |
Valuation Technique | Unobservable Input | Range | Weighted Average |
||||||||
|---|---|---|---|---|---|---|---|---|---|---|---|---|---|
Fuel swap contracts |
$ | 2 | Discounted Cash Flows | Forward Unleaded Price per Gallon(1) | $3.36 - $3.73 | $ | 3.55 | ||||||
|
Forward Diesel Price per Gallon(1) | $3.88 - $3.96 | $ | 3.90 | |||||||||
- (1)
- Forward price per gallon for unleaded and diesel were derived from third-party market data providers. A decrease in the forward price would result in a decrease in the fair value of the fuel swap contracts.
The Company uses derivative financial instruments to manage risks associated with changes in fuel prices and has in the past used, and may in the future use, derivative financial instruments to manage risks associated with changes in interest rates. The Company does not hold or issue derivative financial instruments for trading or speculative purposes. In designating its derivative financial instruments as hedging instruments under accounting standards for derivative instruments, the Company formally documents the relationship between the hedging instrument and the hedged item, as well as the risk management objective and strategy for the use of the hedging instrument. This documentation includes linking the derivatives to forecasted transactions. The Company assesses at the time a derivative contract is entered into, and at least quarterly thereafter, whether the derivative item is effective in
F-44
SERVICEMASTER GLOBAL HOLDINGS, INC.
Notes to the Consolidated Financial Statements (Continued)
Note 18. Fair Value Measurements (Continued)
offsetting the projected changes in cash flows of the associated forecasted transactions. All of the Company's designated hedging instruments are classified as cash flow hedges.
The Company has historically hedged a significant portion of its annual fuel consumption. The Company has also historically hedged the interest payments on a portion of its variable rate debt through the use of interest rate swap agreements, although the Company has no interest rate swap agreements outstanding as of December 31, 2013. All of the Company's fuel swap contracts and interest rate swap contracts are classified as cash flow hedges, and, as such, the hedging instruments are recorded on the consolidated statements of financial position as either an asset or liability at fair value, with the effective portion of changes in the fair value attributable to the hedged risks recorded in accumulated other comprehensive income (loss). Any change in the fair value of the hedging instrument resulting from ineffectiveness, as defined by accounting standards, is recognized in current period earnings. Cash flows related to fuel and interest rate derivatives are classified as operating activities on the consolidated statements of cash flows, other than cash flows related to one amended interest rate swap which are classified as financing activities.
The effect of derivative instruments on the consolidated statements of operations and comprehensive (loss) Income and accumulated other comprehensive income (loss) on the consolidated statements of financial position is presented as follows:
| |
Effective Portion of Gain Recognized in Accumulated Other Comprehensive Income (Loss) |
Effective Portion of Gain (Loss) Reclassified from Accumulated Other Comprehensive Income (Loss) into Earnings |
|
|||||
|---|---|---|---|---|---|---|---|---|
(In millions) Derivatives designated as Cash Flow Hedge Relationships |
Location of Gain (Loss) included in Earnings |
|||||||
| Year ended December 31, 2013 | ||||||||
Fuel swap contracts |
$ | (1 | ) | $ | 1 | Cost of services rendered and products sold | ||
Interest rate swap contracts |
$ | 5 | $ | (5 | ) | Interest expense | ||
| |
Effective Portion of Gain Recognized in Accumulated Other Comprehensive Income (Loss) |
Effective Portion of Gain (Loss) Reclassified from Accumulated Other Comprehensive Income (Loss) into Income |
|
|||||
|---|---|---|---|---|---|---|---|---|
| |
Location of (Loss) Gain included in Income |
|||||||
Derivatives designated as Cash Flow Hedge Relationships |
Year ended December 31, 2012 | |||||||
Fuel swap contracts |
$ | 3 | $ | 2 | Cost of services rendered and products sold | |||
Interest rate swap contracts |
$ | 17 | $ | (22 | ) | Interest expense | ||
Ineffective portions of derivative instruments designated in accordance with accounting standards as cash flow hedge relationships were insignificant during the year ended December 31, 2013. As of December 31, 2013, the Company had fuel swap contracts to pay fixed prices for fuel with an aggregate notional amount of $26 million, maturing through 2014. Under the terms of its fuel swap contracts, the Company is required to post collateral in the event that the fair value of the contracts exceeds a certain agreed upon liability level and in other circumstances required by the counterparty. As of December 31, 2013, the Company had posted $3 million in letters of credit as collateral under its fuel hedging program, none of which were posted under the Company's Revolving Credit Facility.
F-45
SERVICEMASTER GLOBAL HOLDINGS, INC.
Notes to the Consolidated Financial Statements (Continued)
Note 18. Fair Value Measurements (Continued)
The effective portion of the gain or loss on derivative instruments designated and qualifying as cash flow hedging instruments is recorded in accumulated other comprehensive income (loss). These amounts are reclassified into earnings in the same period or periods during which the hedged forecasted debt interest settlement or the fuel settlement affects earnings. The amount expected to be reclassified into earnings during the next 12 months includes unrealized gains and losses related to open fuel hedges. Specifically, as the underlying forecasted transactions occur during the next 12 months, the hedging gains and losses in accumulated other comprehensive income (loss) expected to be recognized in earnings is a gain of $1 million, net of tax, as of December 31, 2013. The amounts that are ultimately reclassified into earnings will be based on actual fuel prices at the time the positions are settled and may differ materially from the amount noted above.
Note 19. Earnings Per Share
Basic earnings (loss) per share is computed by dividing net income (loss) by the weighted average number of shares of common stock outstanding. Diluted earnings (loss) per share is computed by dividing net income (loss) by the weighted-average number of shares of common stock outstanding during the period, increased to include the number of shares of common stock that would have been outstanding had potential dilutive shares of common stock been issued. The dilutive effect of stock options and restricted stock units are reflected in diluted net income (loss) per share by applying the treasury stock method.
A reconciliation of the amounts included in the computation of basic (loss) earnings per share from continuing operations and diluted (loss) earnings per share from continuing operations is as follows:
| |
Year Ended December 31, | |||||||||
|---|---|---|---|---|---|---|---|---|---|---|
(In millions, except per share data)
|
2013 | 2012 | 2011 | |||||||
Earnings (loss) from continuing operations |
$ | 42 | $ | (18 | ) | $ | (7 | ) | ||
| | | | | | | | | | | |
| | | | | | | | | | | |
| | | | | | | | | | | |
Weighted average common shares outstanding |
91.6 | 91.9 | 92.0 | |||||||
Effect of dilutive securities(1): |
||||||||||
RSUs |
0.1 | — | — | |||||||
Stock options(2) |
0.5 | — | — | |||||||
| | | | | | | | | | | |
Weighted average common share outstanding—assuming dilution |
92.2 | 91.9 | 92.0 | |||||||
| | | | | | | | | | | |
| | | | | | | | | | | |
| | | | | | | | | | | |
Basic earnings (loss) per share from continuing operations |
$ | 0.46 | $ | (0.20 | ) | $ | (0.08 | ) | ||
| | | | | | | | | | | |
| | | | | | | | | | | |
| | | | | | | | | | | |
Diluted earnings (loss) per share from continuing operations |
$ | 0.46 | $ | (0.20 | ) | $ | (0.08 | ) | ||
| | | | | | | | | | | |
| | | | | | | | | | | |
| | | | | | | | | | | |
- (1)
- Securities are not included in the table in periods when antidilutive. For 2012 and 2011, weighted average potentially dilutive shares from RSUs of 0.2 million and 0.1 million, respectively, and weighted average potentially dilutive shares from stock options of 1.5 million and 0.2 million, respectively, with a weighted average exercise price per share of $15.24 and $15.00, respectively, were excluded from the diluted earnings per share calculation due to the antidilutive effect such shares would have on net loss per common share.
F-46
SERVICEMASTER GLOBAL HOLDINGS, INC.
Notes to the Consolidated Financial Statements (Continued)
Note 19. Earnings Per Share (Continued)
- (2)
- Options to purchase 1.4 million, 0.7 million and 1.8 million shares for the years ended December 31, 2013, 2012 and 2011, respectively, were not included in the computation because either their exercise price or proceeds per share exceeded the average market price of the Company's common stock for each respective reporting date.
Note 20. Subsequent Events
In February 2014, American Home Shield ceased efforts to deploy a new operating system that had been intended to improve customer relationship management capabilities and enhance its operations. This decision will allow us to more effectively focus our energy and resources on driving growth and serving our customers. Important factors that led to this decision include:
- •
- the ongoing operational costs of the new operating system are high;
- •
- enhancements to our existing operating system enabled it to support our needs;
- •
- certain planned benefits of the new operating system can be achieved through other means; and
- •
- we will now be able to invest our resources in areas that will allow us to focus on growing our business.
On June 13, 2014, the Company filed an amendment to its amended and restated certificate of incorporation effecting a 2-for-3 reverse stock split of the Company's common stock. The consolidated financial statements give retroactive effect to the reverse stock split.
The Company evaluated subsequent events through March 24, 2014, the date on which the December 31, 2013 financial statements were originally issued, and has updated such evaluation for disclosure purposes through May 9, 2014, the date on which the retrospectively revised December 31, 2013 financial statements were reissued (as to the events described in Note 3 and Note 7) and June 13, 2014, the date on which the retrospectively revised December 31, 2013 financial statements were reissued (as to the reverse stock split described in this footnote).
F-47
SERVICEMASTER GLOBAL HOLDINGS, INC.
Notes to the Consolidated Financial Statements (Continued)
Note 20. Subsequent Events (Continued)
Quarterly Operating Results (Unaudited)
Quarterly operating results for the last two years in revenue, gross profit, income (loss) from continuing operations, (loss) income from discontinued operations, net of income taxes, net (loss) income and basic and diluted earnings (loss) per share are shown in the table below.
| |
2013 | |||||||||||||||
|---|---|---|---|---|---|---|---|---|---|---|---|---|---|---|---|---|
(In millions, except per share data)
|
First Quarter |
Second Quarter |
Third Quarter |
Fourth Quarter |
Year | |||||||||||
Revenue |
$ | 514 | $ | 631 | $ | 615 | $ | 533 | $ | 2,293 | ||||||
Gross Profit |
244 | 302 | 290 | 237 | 1,073 | |||||||||||
Income (Loss) from Continuing Operations(1) |
6 | 15 | 23 | (2 | ) | 42 | ||||||||||
(Loss) Income from Discontinued Operations, net of income taxes(2) |
(30 | ) | (525 | ) | 22 | (16 | ) | (549 | ) | |||||||
Net (Loss) Income(1)(2) |
(24 | ) | (510 | ) | 45 | (18 | ) | (507 | ) | |||||||
Basic earnings (loss) per share: |
||||||||||||||||
Income (loss) from continuing operations |
0.07 | 0.16 | 0.25 | (0.02 | ) | 0.46 | ||||||||||
(Loss) income from discontinued operations, net of income taxes |
(0.32 | ) | (5.73 | ) | 0.24 | (0.18 | ) | (6.00 | ) | |||||||
Net (loss) income |
(0.25 | ) | (5.57 | ) | 0.49 | (0.20 | ) | (5.53 | ) | |||||||
Diluted earnings (loss) per share: |
||||||||||||||||
Income (loss) from continuing operations |
0.07 | 0.16 | 0.25 | (0.02 | ) | 0.46 | ||||||||||
(Loss) income from discontinued operations, net of income taxes |
(0.32 | ) | (5.68 | ) | 0.24 | (0.18 | ) | (5.95 | ) | |||||||
Net (loss) income |
(0.25 | ) | (5.52 | ) | 0.49 | (0.20 | ) | (5.49 | ) | |||||||
F-48
SERVICEMASTER GLOBAL HOLDINGS, INC.
Notes to the Consolidated Financial Statements (Continued)
Note 20. Subsequent Events (Continued)
| |
2012 | |||||||||||||||
|---|---|---|---|---|---|---|---|---|---|---|---|---|---|---|---|---|
(In millions, except per share data)
|
First Quarter |
Second Quarter |
Third Quarter |
Fourth Quarter |
Year | |||||||||||
Revenue |
$ | 523 | $ | 611 | $ | 588 | $ | 492 | $ | 2,214 | ||||||
Gross Profit |
249 | 293 | 268 | 208 | 1,018 | |||||||||||
(Loss) Income from Continuing Operations(1) |
(39 | ) | 33 | 1 | (13 | ) | (18 | ) | ||||||||
Income (Loss) from Discontinued Operations, net of income taxes(2) |
9 | (11 | ) | (705 | ) | 11 | (696 | ) | ||||||||
Net (Loss) Income(1)(2) |
(30 | ) | 22 | (704 | ) | (2 | ) | (714 | ) | |||||||
Basic (loss) earnings per share: |
||||||||||||||||
(Loss) income from continuing operations |
(0.43 | ) | 0.36 | 0.01 | (0.14 | ) | (0.20 | ) | ||||||||
Income (loss) from discontinued operations, net of income taxes |
0.10 | (0.12 | ) | (7.67 | ) | 0.12 | (7.57 | ) | ||||||||
Net (loss) income |
(0.33 | ) | 0.25 | (7.67 | ) | (0.02 | ) | (7.77 | ) | |||||||
Diluted (loss) earnings per share: |
||||||||||||||||
(Loss) income from continuing operations |
(0.43 | ) | 0.36 | 0.01 | (0.14 | ) | (0.20 | ) | ||||||||
Income (loss) from discontinued operations, net of income taxes |
0.10 | (0.11 | ) | (7.52 | ) | 0.12 | (7.57 | ) | ||||||||
Net (loss) income |
(0.33 | ) | 0.24 | (7.51 | ) | (0.02 | ) | (7.77 | ) | |||||||
- (1)
- The results include restructuring charges primarily related to a branch optimization project at Terminix, a reorganization of leadership at American Home Shield and Franchise Services Group and an initiative to enhance capabilities and reduce costs in our centers of excellence at Other Operations and Headquarters. The table below summarizes the pre-tax and after-tax restructuring charges, by quarter, for 2013 and 2012.
| |
2013 | |||||||||||||||
|---|---|---|---|---|---|---|---|---|---|---|---|---|---|---|---|---|
(In millions)
|
1st Quarter | 2nd Quarter | 3rd Quarter | 4th Quarter | Year | |||||||||||
Pre-tax |
$ | 3 | $ | — | $ | 1 | $ | 2 | $ | 6 | ||||||
After-tax |
$ | 2 | $ | — | $ | — | $ | 2 | $ | 4 | ||||||
| |
2012 | |||||||||||||||
|---|---|---|---|---|---|---|---|---|---|---|---|---|---|---|---|---|
(In millions)
|
1st Quarter | 2nd Quarter | 3rd Quarter | 4th Quarter | Year | |||||||||||
Pre-tax |
$ | 3 | $ | 5 | $ | 2 | $ | 5 | $ | 15 | ||||||
After-tax |
$ | 2 | $ | 3 | $ | 1 | $ | 3 | $ | 9 | ||||||
The results for the first and third quarters of 2012 include a $39 million ($25 million, net of tax) loss and a $16 million ($10 million, net of tax) loss, respectively, on extinguishment of debt related to the redemption of the remaining $996 million aggregate principal amount of the 2015 Notes and repayment of $276 million of outstanding borrowings under the Term Facilities.
- (2)
- The results for the second quarter of 2013 include pre-tax non-cash impairment charges of $673 million ($521 million, net of tax) to reduce the carrying value of TruGreen's goodwill and the TruGreen trade name. The results for the second and third quarters of 2012 include pre-tax non-cash impairment charges of $68 million ($41 million, net of tax) and $845 million ($725 million, net of tax), respectively, to reduce the carrying value of TruGreen's goodwill and the TruGreen trade name. Additionally, the results for the fourth quarter of 2012 include a favorable goodwill impairment adjustment of $4 million ($2 million, net of tax). See Note 1 to the Consolidated Financial Statements for further details.
F-49
SERVICEMASTER GLOBAL HOLDINGS, INC.
Condensed Consolidated Statements of Operations and Comprehensive Income (Loss) (Unaudited)
(In millions, except per share data)
| |
Nine Months Ended September 30, |
||||||
|---|---|---|---|---|---|---|---|
| |
2014 | 2013 | |||||
Revenue |
$ | 1,880 | $ | 1,760 | |||
Cost of services rendered and products sold |
983 | 924 | |||||
Selling and administrative expenses |
505 | 527 | |||||
Amortization expense |
39 | 38 | |||||
Impairment of software and other related costs |
47 | — | |||||
Consulting agreement termination fees |
21 | — | |||||
Restructuring charges |
7 | 4 | |||||
Interest expense |
171 | 186 | |||||
Interest and net investment income |
(7 | ) | (6 | ) | |||
Loss on extinguishment of debt |
65 | — | |||||
| | | | | | | | |
(Loss) Income from Continuing Operations before Income Taxes |
48 | 88 | |||||
(Benefit) Provision for income taxes |
26 | 43 | |||||
| | | | | | | | |
(Loss) Income from Continuing Operations |
22 | 44 | |||||
(Loss) income from discontinued operations, net of income taxes |
(98 | ) | (533 | ) | |||
| | | | | | | | |
Net (Loss) Income |
$ | (76 | ) | $ | (489 | ) | |
| | | | | | | | |
| | | | | | | | |
| | | | | | | | |
Total Comprehensive (Loss) Income |
$ | (82 | ) | $ | (488 | ) | |
| | | | | | | | |
| | | | | | | | |
| | | | | | | | |
Weighted-average common shares outstanding—Basic |
105.8 | 91.6 | |||||
Weighted-average common shares outstanding—Diluted |
106.7 | 92.4 | |||||
Basic (Loss) Earnings Per Share: |
|||||||
(Loss) Income from Continuing Operations |
$ | 0.20 | $ | 0.48 | |||
(Loss) income from discontinued operations, net of income taxes |
(0.93 | ) | (5.82 | ) | |||
Net (Loss) Income |
(0.72 | ) | (5.33 | ) | |||
Diluted (Loss) Earnings Per Share: |
|||||||
(Loss) Income from Continuing Operations |
$ | 0.20 | $ | 0.48 | |||
(Loss) income from discontinued operations, net of income taxes |
(0.92 | ) | (5.77 | ) | |||
Net (Loss) Income |
(0.72 | ) | (5.29 | ) | |||
See accompanying Notes to the unaudited Condensed Consolidated Financial Statements
F-50
SERVICEMASTER GLOBAL HOLDINGS, INC.
Condensed Consolidated Statements of Financial Position (Unaudited)
(In millions, except per share data)
| |
As of September 30, |
As of December 31, |
|||||
|---|---|---|---|---|---|---|---|
| |
2014 | 2013 | |||||
Assets: |
|||||||
Current Assets: |
|||||||
Cash and cash equivalents |
$ | 275 | $ | 484 | |||
Marketable securities |
22 | 27 | |||||
Receivables, less allowances of $28 and $26, respectively |
477 | 394 | |||||
Inventories |
38 | 39 | |||||
Prepaid expenses and other assets |
53 | 56 | |||||
Deferred customer acquisition costs |
38 | 30 | |||||
Deferred taxes |
107 | 107 | |||||
Assets of discontinued operations |
— | 76 | |||||
| | | | | | | | |
Total Current Assets |
1,010 | 1,213 | |||||
| | | | | | | | |
Property and Equipment: |
|||||||
At cost |
363 | 381 | |||||
Less: accumulated depreciation |
(228 | ) | (204 | ) | |||
| | | | | | | | |
Net Property and Equipment |
135 | 177 | |||||
| | | | | | | | |
Other Assets: |
|||||||
Goodwill |
2,067 | 2,018 | |||||
Intangible assets, primarily trade names, service marks and trademarks, net |
1,706 | 1,721 | |||||
Notes receivable |
24 | 22 | |||||
Long-term marketable securities |
90 | 122 | |||||
Other assets |
44 | 49 | |||||
Debt issuance costs |
35 | 41 | |||||
Assets of discontinued operations |
— | 542 | |||||
| | | | | | | | |
Total Assets |
$ | 5,112 | $ | 5,905 | |||
| | | | | | | | |
| | | | | | | | |
| | | | | | | | |
Liabilities and Shareholders' Equity: |
|||||||
Current Liabilities: |
|||||||
Accounts payable |
$ | 96 | $ | 92 | |||
Accrued liabilities: |
|||||||
Payroll and related expenses |
71 | 70 | |||||
Self-insured claims and related expenses |
95 | 78 | |||||
Accrued interest payable |
11 | 51 | |||||
Other |
50 | 55 | |||||
Deferred revenue |
511 | 448 | |||||
Liabilities of discontinued operations |
8 | 139 | |||||
Current portion of long-term debt |
39 | 39 | |||||
| | | | | | | | |
Total Current Liabilities |
880 | 972 | |||||
| | | | | | | | |
Long-Term Debt |
3,020 | 3,867 | |||||
Other Long-Term Liabilities: |
|||||||
Deferred taxes |
746 | 712 | |||||
Liabilities of discontinued operations |
— | 162 | |||||
Other long-term obligations, primarily self-insured claims |
139 | 169 | |||||
| | | | | | | | |
Total Other Long-Term Liabilities |
885 | 1,043 | |||||
| | | | | | | | |
Commitments and Contingencies (See Note 4) |
|||||||
Shareholders' Equity: |
|||||||
Common stock $0.01 par value (authorized 2,000,000,000 shares with 140,987,217 shares issued and 133,349,047 outstanding at September 30, 2014 and 98,915,432 shares issued and 91,669,470 outstanding at December 31, 2013) |
2 | 1 | |||||
Additional paid-in capital |
2,197 | 1,523 | |||||
Retained deficit |
(1,750 | ) | (1,390 | ) | |||
Accumulated other comprehensive (loss) income |
(1 | ) | 7 | ||||
Less common stock held in treasury, at cost (7,638,170 shares at September 30, 2014 and 7,245,962 shares at December 31, 2013) |
(122 | ) | (118 | ) | |||
| | | | | | | | |
Total Shareholders' Equity |
327 | 23 | |||||
| | | | | | | | |
Total Liabilities and Shareholders' Equity |
$ | 5,112 | $ | 5,905 | |||
| | | | | | | | |
| | | | | | | | |
| | | | | | | | |
See accompanying Notes to the unaudited Condensed Consolidated Financial Statements
F-51
SERVICEMASTER GLOBAL HOLDINGS, INC.
Condensed Consolidated Statements of Cash Flows (Unaudited)
(In millions)
| |
Nine Months Ended September 30, |
||||||
|---|---|---|---|---|---|---|---|
| |
2014 | 2013 | |||||
Cash and Cash Equivalents at Beginning of Period |
$ | 484 | $ | 418 | |||
Cash Flows from Operating Activities from Continuing Operations: |
|||||||
Net Loss |
(76 | ) | (489 | ) | |||
Adjustments to reconcile net loss to net cash provided from operating activities: |
|||||||
Loss from discontinued operations, net of income taxes |
98 | 533 | |||||
Depreciation expense |
36 | 35 | |||||
Amortization expense |
39 | 38 | |||||
Amortization of debt issuance costs |
6 | 7 | |||||
Impairment of software and other related costs |
47 | — | |||||
Loss on extinguishment of debt |
65 | — | |||||
Call premium paid on retirement of debt |
(35 | ) | — | ||||
Deferred income tax provision |
19 | 34 | |||||
Stock-based compensation expense |
5 | 3 | |||||
Gain on sales of marketable securities |
(4 | ) | (1 | ) | |||
Other |
3 | 2 | |||||
Change in working capital, net of acquisitions: |
|||||||
Receivables |
(62 | ) | (53 | ) | |||
Inventories and other current assets |
(7 | ) | (14 | ) | |||
Accounts payable |
11 | 28 | |||||
Deferred revenue |
36 | 30 | |||||
Accrued liabilities |
(4 | ) | 7 | ||||
Accrued interest payable |
(40 | ) | (30 | ) | |||
Accrued restructuring charges |
— | (3 | ) | ||||
Current income taxes |
(5 | ) | (3 | ) | |||
| | | | | | | | |
Net Cash Provided from Operating Activities from Continuing Operations |
132 | 127 | |||||
| | | | | | | | |
Cash Flows from Investing Activities from Continuing Operations: |
|||||||
Property additions |
(29 | ) | (38 | ) | |||
Sale of equipment and other assets |
2 | 1 | |||||
Other business acquisitions, net of cash acquired |
(52 | ) | (22 | ) | |||
Notes receivable, financial investments and securities, net |
30 | (22 | ) | ||||
Notes receivable from affiliate |
— | — | |||||
| | | | | | | | |
Net Cash Used for Investing Activities from Continuing Operations |
(51 | ) | (81 | ) | |||
| | | | | | | | |
Cash Flows from Financing Activities from Continuing Operations: |
|||||||
Borrowings of debt |
1,825 | 1 | |||||
Payments of debt |
(2,687 | ) | (32 | ) | |||
Discount paid on issuance of debt |
(18 | ) | (12 | ) | |||
Debt issuance costs paid |
(24 | ) | (6 | ) | |||
Contribution to TruGreen Holding Corporation |
(35 | ) | — | ||||
Contribution from Holdings |
— | — | |||||
Repurchase of common stock and RSU vesting |
(5 | ) | (14 | ) | |||
Issuance of common stock |
671 | 4 | |||||
| | | | | | | | |
Net Cash Used for Financing Activities from Continuing Operations |
(274 | ) | (60 | ) | |||
| | | | | | | | |
Cash Flows from Discontinued Operations: |
|||||||
Cash used for operating activities |
(11 | ) | (23 | ) | |||
Cash used for investing activities |
(2 | ) | (20 | ) | |||
Cash used for financing activities |
(3 | ) | (9 | ) | |||
| | | | | | | | |
Net Cash Used for Discontinued Operations |
(15 | ) | (52 | ) | |||
| | | | | | | | |
Cash Decrease During the Period |
(208 | ) | (66 | ) | |||
| | | | | | | | |
Cash and Cash Equivalents at End of Period |
$ | 275 | $ | 352 | |||
| | | | | | | | |
| | | | | | | | |
| | | | | | | | |
See accompanying Notes to the unaudited Condensed Consolidated Financial Statements
F-52
SERVICEMASTER GLOBAL HOLDINGS, INC.
NOTES TO CONDENSED CONSOLIDATED FINANCIAL STATEMENTS
(UNAUDITED)
Note 1. Basis of Presentation
The unaudited condensed consolidated financial statements of ServiceMaster Global Holdings, Inc. include the accounts of ServiceMaster Global Holdings, Inc. ("Holdings") and its majority-owned subsidiary partnerships, limited liability companies and corporations (collectively, the "Company," "we," "us, and "our"), including The ServiceMaster Company, LLC ("SvM"). The unaudited condensed consolidated financial statements of The ServiceMaster Company, LLC include the accounts of SvM and its majority-owned subsidiary partnerships, limited liability companies and corporations. All consolidated Company subsidiaries are wholly-owned. Intercompany transactions and balances have been eliminated.
The Company is a leading provider of essential residential and commercial services. The Company's services include termite and pest control, home warranties, disaster restoration, janitorial, residential cleaning, furniture repair and home inspection. The Company provides these services through an extensive service network of company-owned, franchised and licensed locations operating primarily under the following leading brands: Terminix, American Home Shield, ServiceMaster Restore, ServiceMaster Clean, Merry Maids, Furniture Medic and AmeriSpec.
The unaudited condensed consolidated financial statements have been prepared by the Company in accordance with generally accepted accounting principles in the United States ("GAAP") and pursuant to the rules and regulations of the U.S. Securities and Exchange Commission ("SEC"). The Company recommends that the quarterly unaudited condensed consolidated financial statements of Holdings be read in conjunction with the audited consolidated financial statements and the notes thereto included in Holdings' Registration Statement on Form S-1 (File No. 333-194772), as amended (the "2014 Form S-1"), and the unaudited quarterly condensed consolidated financial statements of SvM be read in conjunction with the audited consolidated financial statements and the notes thereto included in SvM's Annual Report on Form 10-K for the year ended December 31, 2013, as filed with the SEC (the "2013 Form 10-K"). The unaudited condensed consolidated financial statements reflect all normal and recurring adjustments that are, in the opinion of management, necessary for the fair presentation of the financial position, results of operations and cash flows for the interim periods presented. The results of operations for any interim period are not indicative of the results that might be achieved for a full year.
TruGreen Spin-off
On January 14, 2014, the Company completed a separation transaction (the "TruGreen Spin-off") resulting in the spin-off of the assets and certain liabilities of the business that comprise the lawn, tree and shrub care services previously conducted by the Company primarily under the TruGreen brand name (collectively, the "TruGreen Business") through a tax-free, pro rata dividend to the stockholders of Holdings. As a result of the completion of the TruGreen Spin-off, TruGreen Holding Corporation ("New TruGreen") operates the TruGreen Business as a private independent company. The historical results of the TruGreen Business, including the results of operations, cash flows and related assets and liabilities, are reported as discontinued operations for all periods presented herein.
F-53
SERVICEMASTER GLOBAL HOLDINGS, INC.
NOTES TO CONDENSED CONSOLIDATED FINANCIAL STATEMENTS (Continued)
(UNAUDITED)
Note 1. Basis of Presentation (Continued)
Reverse Stock Split
On June 13, 2014, Holdings effected a 2-for-3 reverse stock split of its common stock. Holdings' accompanying unaudited condensed consolidated financial statements and notes thereto give retroactive effect to the reverse stock split for all periods presented.
Initial Public Offering
On June 25, 2014, Holdings' registration statement on Form S-1 was declared effective by the SEC for an initial public offering of its common stock. Holdings registered the offering and sale of 35,900,000 shares of its common stock and an additional 5,385,000 shares of its common stock sold to the underwriters pursuant to an option to purchase additional shares. On July 1, 2014, Holdings completed the offering of 41,285,000 shares of its common stock at a price of $17.00 per share. The net proceeds and use of proceeds in connection with the offering are summarized in the table below:
(In millions)
|
|
|||
|---|---|---|---|---|
Net Proceeds |
||||
Gross proceeds |
$ | 702 | ||
Underwriting discounts and commissions |
(35 | ) | ||
Offering expenses |
(4 | ) | ||
| | | | | |
Net Proceeds |
$ | 663 | ||
| | | | | |
| | | | | |
| | | | | |
(In millions)
|
|
|||
|---|---|---|---|---|
Use of Proceeds |
||||
Partial redemption of 8% 2020 Notes(1) |
$ | 234 | ||
Partial redemption of 7% 2020 Notes(1) |
289 | |||
Principal payment of Old Term Facilities(1) |
120 | |||
Consulting agreement termination fees(2) |
21 | |||
| | | | | |
Use of Proceeds |
$ | 663 | ||
| | | | | |
| | | | | |
| | | | | |
- (1)
- See
Note 10 for further details of the total debt reduction of $835 million in July 2014.
- (2)
- See Note 15 for further details on the termination of the consulting agreements.
Note 2. Significant Accounting Policies
Summary: The preparation of the unaudited condensed consolidated financial statements requires management to make certain estimates and assumptions required under GAAP which may differ from actual results. The more significant areas requiring the use of management estimates relate to revenue recognition; the allowance for uncollectible receivables; accruals for self-insured retention limits related to medical, workers' compensation, auto and general liability insurance claims; accruals for home warranties and termite damage claims; the possible outcome of outstanding litigation; accruals for income tax liabilities as well as deferred tax accounts; the deferral and amortization of customer acquisition costs; share based compensation; useful lives for depreciation and amortization expense; the
F-54
SERVICEMASTER GLOBAL HOLDINGS, INC.
NOTES TO CONDENSED CONSOLIDATED FINANCIAL STATEMENTS (Continued)
(UNAUDITED)
Note 2. Significant Accounting Policies (Continued)
valuation of marketable securities; and the valuation of tangible and intangible assets. In 2014, there have been no changes in the significant areas that require estimates or in the underlying methodologies used in determining the amounts of these associated estimates.
The allowance for receivables is developed based on several factors including overall customer credit quality, historical write-off experience and specific account analyses that project the ultimate collectability of the outstanding balances. As such, these factors may change over time causing the reserve level to vary.
The Company carries insurance policies on insurable risks at levels which it believes to be appropriate, including workers' compensation, auto and general liability risks. The Company purchases insurance from third-party insurance carriers. These policies typically incorporate significant deductibles or self-insured retentions. The Company is responsible for all claims that fall within the retention limits. In determining the Company's accrual for self-insured claims, the Company uses historical claims experience to establish both the current year accrual and the underlying provision for future losses. This actuarially determined provision and related accrual include both known claims, as well as incurred but not reported claims. The Company adjusts its estimate of accrued self-insured claims when required to reflect changes based on factors such as changes in health care costs, accident frequency and claim severity.
The Company seeks to reduce the potential amount of loss arising from self-insured claims by insuring certain levels of risk. While insurance agreements are designed to limit the Company's losses from large exposure and permit recovery of a portion of direct unpaid losses, insurance does not relieve the Company of its ultimate liability. Accordingly, the accruals for insured claims represent the Company's total unpaid gross losses. Insurance recoverables, which are reported within Prepaid expenses and other assets and Other assets, relate to estimated insurance recoveries on the insured claims reserves.
Accruals for home warranty claims in the American Home Shield business are made based on the Company's claims experience and actuarial projections. Termite damage claim accruals in the Terminix business are recorded based on both the historical rates of claims incurred within a contract year and the cost per claim. Current activity could differ causing a change in estimates. The Company has certain liabilities with respect to existing or potential claims, lawsuits, and other proceedings. The Company accrues for these liabilities when it is probable that future costs will be incurred and such costs can be reasonably estimated. Any resulting adjustments, which could be material, are recorded in the period identified.
The Company records deferred income tax balances based on the net tax effects of temporary differences between the carrying value of assets and liabilities for financial reporting purposes and income tax purposes. The Company records its deferred tax items based on the estimated value of the tax basis. The Company adjusts tax estimates when required to reflect changes based on factors such as changes in tax laws, relevant court decisions, results of tax authority reviews and statutes of limitations. The Company records a liability for unrecognized tax benefits resulting from uncertain tax positions taken or expected to be taken in a tax return. The Company recognizes potential interest and penalties related to its uncertain tax positions in income tax expense.
F-55
SERVICEMASTER GLOBAL HOLDINGS, INC.
NOTES TO CONDENSED CONSOLIDATED FINANCIAL STATEMENTS (Continued)
(UNAUDITED)
Note 2. Significant Accounting Policies (Continued)
Revenue. Revenues from pest control services, as well as liquid and fumigation termite applications, are recognized as the services are provided. The Company eradicates termites through the use of non-baiting methods (e.g., fumigation or liquid treatments) and baiting systems. Termite services using baiting systems and termite inspection and protection contracts are frequently sold through annual contracts. Service costs for these contracts are expensed as incurred. The Company recognizes revenue over the life of these contracts in proportion to the expected direct costs. Those costs bear a direct relationship to the fulfillment of the Company's obligations under the contracts and are representative of the relative value provided to the customer (proportional performance method). The Company regularly reviews its estimates of direct costs for its termite bait contracts and termite inspection and protection contracts and adjusts the estimates when appropriate.
Home warranty contracts are typically one year in duration. Home warranty claims costs are expensed as incurred. The Company recognizes revenue over the life of these contracts in proportion to the expected direct costs. Those costs bear a direct relationship to the fulfillment of the Company's obligations under the contracts and are representative of the relative value provided to the customer (proportional performance method). The Company regularly reviews its estimates of claims costs and adjusts the estimates when appropriate.
The Company has franchise agreements in its Terminix, ServiceMaster Restore, ServiceMaster Clean, Merry Maids, Furniture Medic and AmeriSpec businesses. Franchise revenue (which in the aggregate represents approximately six percent of annual consolidated revenue from continuing operations in 2013) consists principally of continuing monthly fees based upon the franchisee's customer-level revenue. Monthly fee revenue is recognized when the related customer-level revenue generating activity is performed by the franchisee and collectability is reasonably assured. Franchise revenue also includes initial fees resulting from the sale of a franchise or a license. These initial franchise or license fees are pre-established fixed amounts and are recognized as revenue when collectability is reasonably assured and all material services or conditions relating to the sale have been substantially performed. Total profits from the franchised operations were $54 million and $51 million for the nine months ended September 30, 2014 and 2013, respectively. The portion of total franchise fee income related to initial fees received from the sale of franchises was immaterial to the Company's unaudited condensed consolidated financial statements for all periods.
Revenues are presented net of sales taxes collected and remitted to government taxing authorities on the unaudited condensed consolidated statements of operations and comprehensive income (loss).
The Company had $511 million and $448 million of deferred revenue as of September 30, 2014 and December 31, 2013, respectively. Deferred revenue consists primarily of payments received for annual contracts relating to home warranties, termite baiting, termite inspection and pest control services.
Deferred Customer Acquisition Costs: Customer acquisition costs, which are incremental and direct costs of obtaining a customer, are deferred and amortized over the life of the related contract in proportion to revenue recognized. These costs include sales commissions and direct selling costs which can be shown to have resulted in a successful sale. Deferred customer acquisition costs amounted to $38 million and $30 million as of September 30, 2014 and December 31, 2013, respectively.
F-56
SERVICEMASTER GLOBAL HOLDINGS, INC.
NOTES TO CONDENSED CONSOLIDATED FINANCIAL STATEMENTS (Continued)
(UNAUDITED)
Note 2. Significant Accounting Policies (Continued)
Advertising: On an interim basis, certain advertising costs are deferred and recognized approximately in proportion to the revenue over the year and are not deferred beyond the calendar year-end. Certain other advertising costs are expensed when the advertising occurs. The cost of direct-response advertising at Terminix, consisting primarily of direct-mail promotions, is capitalized and amortized over its expected period of future benefits. Deferred advertising costs are included in prepaid expenses and other assets on the unaudited condensed consolidated statements of financial position.
Inventory: Inventories are recorded at the lower of cost (primarily on a weighted average cost basis) or market. The Company's inventory primarily consists of finished goods to be used on the customers' premises or sold to franchisees.
Property and Equipment and Intangible Assets: Fixed assets and intangible assets with finite lives are depreciated and amortized on a straight-line basis over their estimated useful lives. These lives are based on the Company's previous experience for similar assets, potential market obsolescence and other industry and business data. As required by accounting standards for the impairment or disposal of long-lived assets, the Company's long-lived assets, including fixed assets and intangible assets (other than goodwill), are tested for recoverability whenever events or changes in circumstances indicate that their carrying amounts may not be recoverable. If the carrying value is no longer recoverable based upon the undiscounted future cash flows of the asset, an impairment loss would be recognized equal to the difference between the carrying amount and the fair value of the asset. Changes in the estimated useful lives or in the asset values could cause the Company to adjust its book value or future expense accordingly.
Depreciation of property and equipment, including depreciation of assets held under capital leases, was $36 and $35 million for the nine months ended September 30, 2014 and 2013, respectively.
The Company recorded an impairment charge of $47 million ($28 million, net of tax) in the nine months ended September 30, 2014 relating to its decision in the first quarter of 2014 to abandon its efforts to deploy a new operating system at American Home Shield. Included in this charge are the impairment of the capitalized software of $45 million and the recognition of the remaining liabilities associated with the termination of lease, maintenance and hosting agreements totaling $2 million. This impairment represented an adjustment of the carrying value of the asset to its estimated fair value of zero on a non-recurring basis.
Fair Value of Financial Instruments and Credit Risk: See Note 16 for information relating to the fair value of financial instruments.
Financial instruments, which potentially subject the Company to financial and credit risk, consist principally of investments and receivables. Investments consist primarily of publicly traded debt and common equity securities. The Company periodically reviews its portfolio of investments to determine whether there has been an other than temporary decline in the value of the investments from factors such as deterioration in the financial condition of the issuer or the market(s) in which it competes. The majority of the Company's receivables have little concentration of credit risk due to the large number of customers with relatively small balances and their dispersion across geographical areas. The Company maintains an allowance for losses based upon the expected collectability of receivables.
F-57
SERVICEMASTER GLOBAL HOLDINGS, INC.
NOTES TO CONDENSED CONSOLIDATED FINANCIAL STATEMENTS (Continued)
(UNAUDITED)
Note 2. Significant Accounting Policies (Continued)
Income Taxes: The Company and its subsidiaries file consolidated U.S. federal income tax returns. State and local returns are filed both on a separate company basis and on a combined unitary basis with the Company. Current and deferred income taxes are provided for on a separate company basis. The Company accounts for income taxes using an asset and liability approach for the expected future tax consequences of events that have been recognized in the Company's financial statements or tax returns. Deferred income taxes are provided to reflect the differences between the tax bases of assets and liabilities and their reported amounts in the financial statements. Valuation allowances are established when necessary to reduce deferred income tax assets to the amounts expected to be realized.
The Company records a liability for unrecognized tax benefits resulting from uncertain tax positions taken or expected to be taken in its tax return. The Company recognizes potential interest and penalties related to its uncertain tax positions in income tax expense.
Stock-Based Compensation: The Company accounts for stock-based compensation under accounting standards for share based payments, which require that stock options, restricted stock units and restricted share grants be measured at fair value and this value is recognized as compensation expense over the vesting period.
Earnings Per Share: Basic earnings (loss) per share is computed by dividing net income (loss) by the weighted average number of shares of common stock outstanding. Diluted earnings (loss) per share is computed by dividing net income (loss) by the weighted-average number of shares of common stock outstanding during the period, increased to include the number of shares of common stock that would have been outstanding had potential dilutive shares of common stock been issued. The dilutive effect of stock options, restricted stock units and restricted share grants are reflected in diluted net income (loss) per share by applying the treasury stock method.
Newly Issued Accounting Statements and Positions: In July 2013, the Financial Accounting Standards Board ("FASB") issued Accounting Standards Update ("ASU") 2013-11, "Presentation of an Unrecognized Tax Benefit When a Net Operating Loss Carryforward, a Similar Tax Loss, or Tax Credit Carryforward Exists" to eliminate the diversity in practice associated with the presentation of unrecognized tax benefits in instances where a net operating loss carryforward, a similar tax loss, or a tax credit carryforward exists. ASU 2013-11 generally requires an unrecognized tax benefit, or a portion of an unrecognized tax benefit, to be presented in the financial statements as a reduction to a deferred tax asset for a net operating loss carryforward, a similar tax loss, or a tax credit carryforward, except in certain circumstances. The amendments in ASU 2013-11 are effective for fiscal years, and interim periods within those years, beginning after December 15, 2013. The adoption of this standard did not have a material impact on the Company's condensed consolidated financial statements.
In April 2014, the FASB issued ASU 2014-08, "Reporting Discontinued Operations and Disclosure of Disposals of Components of an Entity" to change the criteria for reporting discontinued operations and enhance the convergence of the FASB's and the International Standard Board's reporting requirements for discontinued operations. The changes in ASU 2014-08 amend the definition of discontinued operations by limiting discontinued operations reporting to disposals of components of an entity that represent strategic shifts that have or will have a major effect on an entity's operations and financial results. ASU 2014-08 requires expanded disclosures for discontinued operations and also
F-58
SERVICEMASTER GLOBAL HOLDINGS, INC.
NOTES TO CONDENSED CONSOLIDATED FINANCIAL STATEMENTS (Continued)
(UNAUDITED)
Note 2. Significant Accounting Policies (Continued)
requires an entity to disclose the pretax profit or loss of an individually significant component of an entity that does not qualify for discontinued operations reporting. The amendments in ASU 2014-08 are effective for fiscal years, and interim periods within those years, beginning after December 15, 2014. The Company anticipates the adoption of this standard will not have a material impact on the Company's unaudited condensed consolidated financial statements.
In May 2014, the FASB issued ASU 2014-09, "Revenue from Contracts with Customers" to provide a single comprehensive model for entities to use in accounting for revenue arising from contracts with customers. This model supersedes most current revenue recognition guidance, including industry-specific guidance. The core principle of the revenue model is that "an entity recognizes revenue to depict the transfer of promised goods or services to customers in an amount that reflects the consideration to which the entity expects to be entitled in exchange for those goods or services." Entities have the option of using either a full retrospective or modified approach to adopt the guidance. The amendments in ASU 2014-09 are effective for fiscal years, and interim periods within those years, beginning after December 15, 2016. The Company is currently evaluating the impact of adopting ASU 2014-09.
In August 2014, the FASB issued ASU 2014-15, "Presentation of Financial Statements—Going Concern" to require management to evaluate whether there are conditions or events that raise substantial doubt about a company's ability to continue as a going concern within one year from the date the financial statements are issued. The amendments in ASU 2014-15 are effective for annual periods ending after December 15, 2016, and for annual and interim periods thereafter. The Company anticipates the adoption of this standard will not have a material impact on the Company's unaudited condensed consolidated financial statements.
Note 3. Restructuring Charges
The Company incurred restructuring charges of $7 million ($4 million, net of tax) and $4 million ($2 million, net of tax) for the nine months ended September 30, 2014 and 2013, respectively. Restructuring charges were comprised of the following:
| |
Nine Months Ended September 30, |
||||||
|---|---|---|---|---|---|---|---|
(In millions)
|
2014 | 2013 | |||||
Terminix branch optimization(1) |
$ | 2 | $ | 1 | |||
Franchise services group reorganization(2) |
1 | — | |||||
Centers of excellence initiative(3) |
4 | 3 | |||||
| | | | | | | | |
Total restructuring charges |
$ | 7 | $ | 4 | |||
| | | | | | | | |
| | | | | | | | |
| | | | | | | | |
- (1)
- For
the nine months ended September 30, 2014, these charges included lease termination and severance costs. For the nine months ended
September 30, 2013, these charges included lease termination costs.
- (2)
- For the nine months ended September 30, 2014, these charges included severance costs.
F-59
SERVICEMASTER GLOBAL HOLDINGS, INC.
NOTES TO CONDENSED CONSOLIDATED FINANCIAL STATEMENTS (Continued)
(UNAUDITED)
Note 3. Restructuring Charges (Continued)
- (3)
- Represents restructuring charges related to an initiative to enhance capabilities and reduce costs in the Company's headquarters functions that provide Company-wide administrative services for our operations that we refer to as centers of excellence. For the nine months ended September 30, 2014, these charges included professional fees of $1 million and severance and other costs of $3 million. For the nine months ended September 30, 2013, these charges included professional fees of $2 million and severance and other costs of $1 million.
The pretax charges discussed above are reported in Restructuring charges in the unaudited condensed consolidated statements of operations and comprehensive income (loss).
A reconciliation of the beginning and ending balances of accrued restructuring charges, which are included in Accrued liabilities—Other on the unaudited condensed consolidated statements of financial position, is presented as follows:
(In millions)
|
Accrued Restructuring Charges |
|||
|---|---|---|---|---|
Balance as of December 31, 2013 |
$ | 1 | ||
Costs incurred |
7 | |||
Costs paid or otherwise settled |
(7 | ) | ||
| | | | | |
Balance as of September 30, 2014 |
$ | 1 | ||
| | | | | |
| | | | | |
| | | | | |
Note 4. Commitments and Contingencies
The Company carries insurance policies on insurable risks at levels that it believes to be appropriate, including workers' compensation, auto and general liability risks. The Company purchases insurance policies from third-party insurance carriers, which typically incorporate significant deductibles or self-insured retentions. The Company is responsible for all claims that fall below the retention limits. In determining the Company's accrual for self-insured claims, the Company uses historical claims experience to establish both the current year accrual and the underlying provision for future losses. This actuarially determined provision and related accrual includes known claims, as well as incurred but not reported claims. The Company adjusts its estimate of accrued self-insured claims when required to reflect changes based on factors such as changes in health care costs, accident frequency and claim severity.
A reconciliation of beginning and ending accrued self-insured claims, which are included in Accrued liabilities—Self-insured claims and related expenses and Other long-term obligations, primarily self-insured claims on the unaudited condensed consolidated statements of financial position, net of
F-60
SERVICEMASTER GLOBAL HOLDINGS, INC.
NOTES TO CONDENSED CONSOLIDATED FINANCIAL STATEMENTS (Continued)
(UNAUDITED)
Note 4. Commitments and Contingencies (Continued)
reinsurance recoverables, which are included in Prepaid expenses and other assets and Other assets on the unaudited condensed consolidated statements of financial position, is presented as follows:
(In millions)
|
Accrued Self-insured Claims, Net |
|||
|---|---|---|---|---|
Balance as of December 31, 2013 |
$ | 101 | ||
Provision for self-insured claims |
29 | |||
Cash payments |
(26 | ) | ||
| | | | | |
Balance as of September 30, 2014 |
$ | 104 | ||
| | | | | |
| | | | | |
| | | | | |
Balance as of December 31, 2012 |
$ | 103 | ||
Provision for self-insured claims |
36 | |||
Cash payments |
(31 | ) | ||
| | | | | |
Balance as of September 30, 2013 |
$ | 108 | ||
| | | | | |
| | | | | |
| | | | | |
Accruals for home warranty claims in the American Home Shield business are made based on the Company's claims experience and actuarial projections. Termite damage claim accruals in the Terminix business are recorded based on both the historical rates of claims incurred within a contract year and the cost per claim. Current activity could differ causing a change in estimates. The Company has certain liabilities with respect to existing or potential claims, lawsuits and other proceedings. The Company accrues for these liabilities when it is probable that future costs will be incurred and such costs can be reasonably estimated. Any resulting adjustments, which could be material, are recorded in the period the adjustments are identified.
In the ordinary course of conducting business activities, the Company and its subsidiaries become involved in judicial, administrative and regulatory proceedings involving both private parties and governmental authorities. These proceedings include insured and uninsured matters that are brought on an individual, collective, representative and class action basis, or other proceedings involving regulatory, employment, general and commercial liability, automobile liability, wage and hour, environmental and other matters. The Company has entered into settlement agreements in certain cases, including with respect to putative collective and class actions, which are subject to court or other approvals. If one or more of the Company's settlements are not finally approved, the Company could have additional or different exposure, which could be material. At this time, the Company does not expect any of these proceedings to have a material effect on its reputation, business, financial position, results of operations or cash flows; however, the Company can give no assurance that the results of any such proceedings will not materially affect its reputation, business, financial position, results of operations and cash flows.
Note 5. Goodwill and Intangible Assets
Goodwill and intangible assets that are not amortized are subject to assessment for impairment by applying a fair-value based test on an annual basis or more frequently if circumstances indicate a potential impairment. The Company's annual assessment date is October 1. There were no goodwill or trade name impairment charges recorded in continuing operations in the nine months ended
F-61
SERVICEMASTER GLOBAL HOLDINGS, INC.
NOTES TO CONDENSED CONSOLIDATED FINANCIAL STATEMENTS (Continued)
(UNAUDITED)
Note 5. Goodwill and Intangible Assets (Continued)
September 30, 2014 and 2013. There were no accumulated impairment losses recorded in continuing operations as of September 30, 2014.
The table below summarizes the goodwill balances for continuing operations by reportable segment and for Other Operations and Headquarters:
(In millions)
|
Terminix | American Home Shield |
Franchise Services Group |
Total | |||||||||
|---|---|---|---|---|---|---|---|---|---|---|---|---|---|
Balance as of December 31, 2013 |
$ | 1,480 | $ | 348 | $ | 190 | $ | 2,018 | |||||
Acquisitions |
15 | 34 | 1 | 50 | |||||||||
Other(1) |
(1 | ) | — | — | (1 | ) | |||||||
| | | | | | | | | | | | | | |
Balance as of September 30, 2014 |
$ | 1,494 | $ | 382 | $ | 191 | $ | 2,067 | |||||
| | | | | | | | | | | | | | |
| | | | | | | | | | | | | | |
| | | | | | | | | | | | | | |
- (1)
- Reflects the impact of foreign exchange rates.
The table below summarizes the other intangible asset balances for continuing operations:
| |
Estimated Remaining Useful Lives (Years) |
As of September 30, 2014 | As of December 31, 2013 | ||||||||||||||||||
|---|---|---|---|---|---|---|---|---|---|---|---|---|---|---|---|---|---|---|---|---|---|
(In millions)
|
Gross | Accumulated Amortization |
Net | Gross | Accumulated Amortization |
Net | |||||||||||||||
Trade names(1) |
N/A | $ | 1,608 | $ | — | $ | 1,608 | $ | 1,608 | $ | — | $ | 1,608 | ||||||||
Customer relationships |
3 - 10 | 532 | (479 | ) | 53 | 512 | (447 | ) | 65 | ||||||||||||
Franchise agreements |
20 - 25 | 88 | (58 | ) | 30 | 88 | (54 | ) | 34 | ||||||||||||
Other |
4 - 30 | 46 | (31 | ) | 15 | 41 | (27 | ) | 14 | ||||||||||||
| | | | | | | | | | | | | | | | | | | | | | |
Total |
$ | 2,274 | $ | (568 | ) | $ | 1,706 | $ | 2,249 | $ | (528 | ) | 1,721 | ||||||||
| | | | | | | | | | | | | | | | | | | | | | |
| | | | | | | | | | | | | | | | | | | | | | |
| | | | | | | | | | | | | | | | | | | | | | |
- (1)
- Not subject to amortization.
In the nine months ended September 30, 2014, the TruGreen Business recorded a pre-tax non-cash trade name impairment charge of $139 million ($84 million, net of tax) in discontinued operations, net of income taxes. In the nine months ended September 30, 2013, the TruGreen Business recorded a pre-tax non-cash goodwill and trade name impairment charge of $673 million ($521 million, net of tax) in discontinued operations, net of income taxes.
Note 6. Stock-Based Compensation
In connection with the TruGreen Spin-off, on January 14, 2014, we distributed all of New TruGreen's common stock to our stockholders. Following the distribution, our employees held equity incentive awards covering shares of New TruGreen common stock as well as equity incentive awards covering shares of our common stock, and employees who transferred to New TruGreen held equity incentive awards covering shares of our common stock as well as equity incentive awards covering shares of New TruGreen common stock.
F-62
SERVICEMASTER GLOBAL HOLDINGS, INC.
NOTES TO CONDENSED CONSOLIDATED FINANCIAL STATEMENTS (Continued)
(UNAUDITED)
Note 6. Stock-Based Compensation (Continued)
To align the interests of our continuing employees and the interests of New TruGreen's employees with their respective employers, on February 14, 2014, we and New TruGreen extended offers to each other's employees to allow them to tender their equity awards covering shares of their non-employing entity to the respective issuer and subsequently to apply the proceeds of any such tendered equity awards to subscribe for equity awards in their respective employers at the then-current fair market value ($12.00, in the case of our common stock, and $3.75, in the case of New TruGreen common stock). As a result of this program, on March 18, 2014, we accepted tenders of 199,075 shares of our common stock and DSUs from New TruGreen employees and issued 237,762 shares of our common stock and DSUs to our continuing employees. There was also a small number of RSUs exchanged.
In connection with the TruGreen Spin-off, we adjusted the exercise price of options held by our employees to reflect the fair market value of our common stock after giving effect to the TruGreen Spin-off by multiplying the exercise price of such options immediately prior to the TruGreen Spin-off by a fraction, the numerator of which was the fair market value of a share of our common stock immediately following the TruGreen Spin-off ($12.00 per share) and the denominator of which was the fair market value of a share of our common stock immediately prior to the TruGreen Spin-off ($15.75 per share), or the "Option Conversion Ratio."
To allow our employees to retain the intrinsic value of their stock options prior to the TruGreen Spin-off, we also adjusted the number of shares underlying the options of such employees. The number of shares underlying the options was adjusted by dividing the number of shares underlying the options held by each employee by the Option Conversion Ratio. We refer to these adjustments collectively as the "Option Conversion." The change in the number of shares underlying options and the adjustment of the exercise price pursuant to the Option Conversion represent modifications to our share based compensation awards. As a result of the Option Conversion we compared the fair value of the awards following the TruGreen Spin-off with the fair value of the original awards. The comparison did not yield incremental value. Accordingly, we did not record any incremental compensation expense as a result of the Option Conversion.
For the nine months ended September 30, 2014 and 2013, the Company recognized stock-based compensation expense of $5 million ($3 million, net of tax) and $3 million ($2 million, net of tax), respectively. As of September 30, 2014, there was $17 million of total unrecognized compensation costs related to non-vested stock options, restricted share units and restricted shares granted under the Amended and Restated ServiceMaster Global Holdings, Inc. Stock Incentive Plan ("MSIP"). These remaining costs are expected to be recognized over a weighted-average period of 2.79 years.
On June 13, 2014, the Company formally adopted the 2014 Omnibus Incentive Plan to provide for the grants of long-term incentive compensation to our directors, officers and associates, for which there were grants of 5,784 restricted shares as of September 30, 2014. Upon adoption of the 2014 Omnibus Incentive Plan, the Company froze the MSIP and will make no further grants thereunder.
Note 7. Comprehensive Income (Loss)
Comprehensive income (loss), which primarily includes net income (loss), unrealized gain (loss) on marketable securities, unrealized gain (loss) on derivative instruments and the effect of foreign currency
F-63
SERVICEMASTER GLOBAL HOLDINGS, INC.
NOTES TO CONDENSED CONSOLIDATED FINANCIAL STATEMENTS (Continued)
(UNAUDITED)
Note 7. Comprehensive Income (Loss) (Continued)
translation is disclosed in the unaudited condensed consolidated statements of operations and comprehensive income (loss).
The following tables summarize the activity in other comprehensive income (loss), net of the related tax effects.
(In millions)
|
Unrealized Loss on Derivatives |
Unrealized Gains on Available- for-Sale Securities |
Foreign Currency Translation |
Total | |||||||||
|---|---|---|---|---|---|---|---|---|---|---|---|---|---|
Balance as of December 31, 2013 |
$ | 1 | $ | 7 | $ | (1 | ) | $ | 7 | ||||
Other comprehensive (loss) income before reclassifications: |
|||||||||||||
Pre-tax amount |
(2 | ) | 2 | (2 | ) | (3 | ) | ||||||
Tax (benefit) provision |
(1 | ) | 1 | — | — | ||||||||
| | | | | | | | | | | | | | |
After-tax amount |
(2 | ) | 1 | (2 | ) | (3 | ) | ||||||
Amounts reclassified from accumulated other comprehensive income (loss)(1) |
— | (2 | ) | — | (2 | ) | |||||||
| | | | | | | | | | | | | | |
Net current period other comprehensive loss |
(1 | ) | (2 | ) | (2 | ) | (6 | ) | |||||
Spin-off of the TruGreen Business |
— | — | (2 | ) | (2 | ) | |||||||
| | | | | | | | | | | | | | |
Balance as of September 30, 2014 |
$ | (1 | ) | $ | 5 | $ | (5 | ) | $ | (1 | ) | ||
| | | | | | | | | | | | | | |
| | | | | | | | | | | | | | |
| | | | | | | | | | | | | | |
Balance as of December 31, 2012 |
$ | (2 | ) | $ | 5 | $ | 3 | $ | 7 | ||||
Other comprehensive income (loss) before reclassifications: |
|||||||||||||
Pre-tax amount |
— | 3 | (2 | ) | 1 | ||||||||
Tax provision |
— | 2 | — | 1 | |||||||||
| | | | | | | | | | | | | | |
After-tax amount |
— | 2 | (2 | ) | — | ||||||||
Amounts reclassified from accumulated other comprehensive income (loss)(1) |
2 | (1 | ) | — | 1 | ||||||||
| | | | | | | | | | | | | | |
Net current period other comprehensive income (loss) |
2 | 1 | (2 | ) | 1 | ||||||||
| | | | | | | | | | | | | | |
Balance as of September 30, 2013 |
$ | — | $ | 6 | $ | 1 | $ | 7 | |||||
| | | | | | | | | | | | | | |
| | | | | | | | | | | | | | |
| | | | | | | | | | | | | | |
- (1)
- Amounts are net of tax. See reclassifications out of accumulated other comprehensive income below for further details.
F-64
SERVICEMASTER GLOBAL HOLDINGS, INC.
NOTES TO CONDENSED CONSOLIDATED FINANCIAL STATEMENTS (Continued)
(UNAUDITED)
Note 7. Comprehensive Income (Loss) (Continued)
Reclassifications out of accumulated other comprehensive income (loss) included the following components for the periods indicated.
| |
Nine Months Ended September 30, |
|
||||||
|---|---|---|---|---|---|---|---|---|
| |
Condensed Consolidated Statements of Operations and Comprehensive Income (Loss) Location |
|||||||
(In millions)
|
2014 | 2013 | ||||||
(Gains) Losses on derivatives: |
||||||||
Fuel swap contracts |
$ | — | $ | (2 | ) | Cost of services rendered and products sold | ||
Interest rate swap contracts |
— | 5 | Interest expense | |||||
Net losses on derivatives |
— | 3 | ||||||
Impact of income taxes |
— | 1 | Provision for income taxes | |||||
Total reclassifications related to derivatives |
$ | — | $ | 2 | ||||
| | | | | | | | | |
| | | | | | | | | |
| | | | | | | | | |
Gains on available-for-sale securities |
$ | (4 | ) | $ | (1 | ) | Interest and net investment income | |
Impact of income taxes |
(2 | ) | — | Provision for income taxes | ||||
| | | | | | | | | |
Total reclassifications related to securities |
$ | (2 | ) | $ | (1 | ) | ||
| | | | | | | | | |
| | | | | | | | | |
| | | | | | | | | |
Total reclassifications for the period |
$ | (2 | ) | $ | 1 | |||
| | | | | | | | | |
| | | | | | | | | |
| | | | | | | | | |
Note 8. Supplemental Cash Flow Information
Supplemental information relating to the unaudited condensed consolidated statements of cash flows is presented in the following table:
| |
Nine Months Ended September 30, |
||||||
|---|---|---|---|---|---|---|---|
(In millions)
|
2014 | 2013 | |||||
Cash paid for or (received from): |
|||||||
Interest expense |
$ | 199 | $ | 207 | |||
Interest and dividend income |
(3 | ) | (4 | ) | |||
Income taxes, net of refunds |
11 | 12 | |||||
The Company acquired $12 million and $21 million of property and equipment through capital leases and other non-cash financing transactions in the nine months ended September 30, 2014 and 2013 months, respectively, which have been excluded from the unaudited condensed consolidated statements of cash flows as non-cash investing and financing activities.
Note 9. Cash and Marketable Securities
Cash, money market funds and certificates of deposits with maturities of three months or less when purchased are included in Cash and cash equivalents on the unaudited condensed consolidated statements of financial position. As of September 30, 2014 and December 31, 2013, the Company's investments consisted primarily of domestic publicly traded debt and certificates of deposit ("Debt securities") and common equity securities ("Equity securities"). The amortized cost, fair value and
F-65
SERVICEMASTER GLOBAL HOLDINGS, INC.
NOTES TO CONDENSED CONSOLIDATED FINANCIAL STATEMENTS (Continued)
(UNAUDITED)
Note 9. Cash and Marketable Securities (Continued)
gross unrealized gains and losses of the Company's short- and long-term investments in Debt and Equity securities as of September 30, 2014 and December 31, 2013 were as follows:
(In millions)
|
Amortized Cost |
Gross Unrealized Gains |
Gross Unrealized Losses |
Fair Value | |||||||||
|---|---|---|---|---|---|---|---|---|---|---|---|---|---|
Available-for-sale and trading securities, September 30, 2014 |
|||||||||||||
Debt securities |
$ | 70 | $ | 1 | $ | — | $ | 71 | |||||
Equity securities |
34 | 8 | (1 | ) | 41 | ||||||||
| | | | | | | | | | | | | | |
Total securities |
$ | 104 | $ | 9 | $ | (1 | ) | $ | 112 | ||||
| | | | | | | | | | | | | | |
| | | | | | | | | | | | | | |
| | | | | | | | | | | | | | |
Available-for-sale and trading securities, December 31, 2013 |
|||||||||||||
Debt securities |
$ | 97 | $ | 3 | $ | (1 | ) | $ | 99 | ||||
Equity securities |
41 | 9 | — | 50 | |||||||||
| | | | | | | | | | | | | | |
Total securities |
$ | 138 | $ | 12 | $ | (1 | ) | $ | 149 | ||||
| | | | | | | | | | | | | | |
| | | | | | | | | | | | | | |
| | | | | | | | | | | | | | |
Unrealized losses which had been in a loss position for more than one year as of September 30, 2014 were less than $1 million. There were no unrealized losses which had been in a loss position for more than one year as of December 31, 2013. The aggregate fair value of the investments with unrealized losses was $17 million and $30 million as of September 30, 2014 and December 31, 2013, respectively.
Gains and losses on sales of investments, as determined on a specific identification basis, are included in investment income in the period they are realized. The Company periodically reviews its portfolio of investments to determine whether there has been an other than temporary decline in the value of the investments from factors such as deterioration in the financial condition of the issuer or the market(s) in which the issuer competes. The table below summarizes proceeds, gross realized gains, and gross realized losses resulting from sales of available-for-sale securities. There were no impairment charges due to other than temporary declines in the value of certain investments for the nine months ended September 30, 2014 and 2013.
| |
Nine Months Ended September 30, |
||||||
|---|---|---|---|---|---|---|---|
(In millions)
|
2014 | 2013 | |||||
Proceeds from sale of securities |
$ | 43 | $ | 8 | |||
Gross realized gains, pre-tax |
5 | 1 | |||||
Gross realized gains, net of tax |
3 | 1 | |||||
Gross realized losses, pre-tax |
(1 | ) | — | ||||
Gross realized losses, net of tax |
— | — | |||||
F-66
SERVICEMASTER GLOBAL HOLDINGS, INC.
NOTES TO CONDENSED CONSOLIDATED FINANCIAL STATEMENTS (Continued)
(UNAUDITED)
Note 10. Long-Term Debt
Long-term debt as of September 30, 2014 and December 31, 2013 is summarized in the following table:
(In millions)
|
As of September 30, 2014 |
As of December 31, 2013 |
|||||
|---|---|---|---|---|---|---|---|
Senior secured term loan facility maturing in 2017 (Tranche B) |
$ | — | $ | 991 | |||
Senior secured term loan facility maturing in 2017 (Tranche C)(1) |
— | 1,198 | |||||
Senior secured term loan facility maturing in 2021(2) |
1,807 | — | |||||
7.00% senior notes maturing in 2020 |
488 | 750 | |||||
8.00% senior notes maturing in 2020(3) |
391 | 602 | |||||
Revolving credit facility maturing in 2019 |
— | — | |||||
7.10% notes maturing in 2018(4) |
73 | 71 | |||||
7.45% notes maturing in 2027(4) |
161 | 159 | |||||
7.25% notes maturing in 2038(4) |
64 | 63 | |||||
Vehicle capital leases(5) |
36 | 32 | |||||
Other |
39 | 40 | |||||
Less current portion |
(39 | ) | (39 | ) | |||
| | | | | | | | |
Total long-term debt |
$ | 3,020 | $ | 3,867 | |||
| | | | | | | | |
| | | | | | | | |
| | | | | | | | |
- (1)
- As
of December 31, 2013, presented net of $10 million in unamortized original issue discount paid as part of the 2013 amendment.
- (2)
- As
of September 30, 2014, presented net of $18 million in unamortized original issue discount paid as part of the New Term Loan Facility as
defined below under "—Refinancing of Indebtedness".
- (3)
- As
of September 30, 2014 and December 31, 2013, includes $1 million and $2 million, respectively, in unamortized premium
received on the sale of $100 million aggregate principal amount of such notes.
- (4)
- The
increase in the balance from December 31, 2013 to September 30, 2014 reflects the amortization of fair value adjustments related to
purchase accounting, which increases the effective interest rate from the coupon rates shown above.
- (5)
- The Company has entered into a fleet management services agreement (the "Fleet Agreement") which, among other things, allows the Company to obtain fleet vehicles through a leasing program. All leases under the Fleet Agreement are capital leases for accounting purposes. The lease rental payments include an interest component calculated using a variable rate based on one-month LIBOR plus other contractual adjustments and a borrowing margin totaling 2.45 percent.
Refinancing of Indebtedness
On July 1, 2014, in connection with Holdings' initial public offering, SvM terminated its existing credit agreements governing its then existing term loan facility, the pre-funded letter of credit facility (together, the "Old Term Facilities") and the then existing revolving credit facility (together with the Old Term Facilities, the "Old Credit Facilities") and entered into a new credit agreement with respect to a new $1,825 million term loan facility maturing 2021 (the "New Term Loan Facility") and a new
F-67
SERVICEMASTER GLOBAL HOLDINGS, INC.
NOTES TO CONDENSED CONSOLIDATED FINANCIAL STATEMENTS (Continued)
(UNAUDITED)
Note 10. Long-Term Debt (Continued)
$300 million revolving credit facility maturing 2019 (the "New Revolving Credit Facility," and, together with the New Term Loan Facility, the "New Credit Facilities"), with JPMorgan Chase Bank, N.A. as administrative agent, collateral agent and issuing bank, and a syndicate of lenders party thereto from time to time. Borrowings under the New Term Loan Facility, together with $243 million of available cash and $120 million of net proceeds of the initial public offering, were used to repay in full the $2,187 million outstanding under the Old Term Facilities. In addition, $42 million of available cash was used to pay debt issuance costs of $24 million and to pay original issue discount of $18 million in connection with the New Term Loan Facility.
On July 16, 2014, SvM used proceeds from Holdings' initial public offering to redeem $210 million of its outstanding 8 percent senior notes due 2020 (the "8% 2020 Notes") and $263 million of its outstanding 7 percent senior notes due 2020 (the "7% 2020 Notes"). In connection with the redemption of the 8% 2020 Notes and the 7% 2020 Notes, SvM was required to pay a pre-payment premium of $17 million and $18 million, respectively, and accrued interest of $7 million and $8 million, respectively.
In connection with the partial redemption of the 8% 2020 Notes and 7% 2020 Notes and the repayment of the Old Term Facilities, we recorded a loss on extinguishment of debt of $65 million in the nine months ended September 30, 2014, which includes the pre-payment premiums on the 8% 2020 Notes and 7% 2020 Notes of $17 million and $18 million, respectively, and the write-off of $30 million of debt issuance costs.
Interest Rate Swaps
On July 23, 2014, SvM entered into two four-year interest rate swap agreements effective August 1, 2014. The aggregate notional amount of the agreements was $300 million. Under the terms of the agreements, SvM will pay a weighted-average fixed rate of interest of 1.786 percent on the $300 million notional amount, and SvM will receive a floating rate of interest (based on one-month LIBOR) on the notional amount. Therefore, during the term of the agreements, the effective interest rate on $300 million of the New Term Loan Facility is fixed at a rate of 1.786 percent, plus the incremental borrowing margin of 3.25 percent.
On July 23, 2014, SvM entered into three forty-one month interest rate swap agreements effective March 1, 2015. The aggregate notional amount of the agreements was $400 million. Under the terms of the agreements, SvM will pay a weighted-average fixed rate of interest of 1.927 percent on the $400 million notional amount, and SvM will receive a floating rate of interest (based on one-month LIBOR) on the notional amount. Therefore, during the term of the agreements, the effective interest rate on $400 million of the New Term Loan Facility is fixed at a rate of 1.927 percent, plus the incremental borrowing margin of 3.25 percent.
Note 11. Acquisitions
Acquisitions have been accounted for using the acquisition method and, accordingly, the results of operations of the acquired businesses have been included in the Company's unaudited condensed consolidated financial statements since their dates of acquisition. The assets and liabilities of these
F-68
SERVICEMASTER GLOBAL HOLDINGS, INC.
NOTES TO CONDENSED CONSOLIDATED FINANCIAL STATEMENTS (Continued)
(UNAUDITED)
Note 11. Acquisitions (Continued)
businesses were recorded in the financial statements at their estimated fair values as of the acquisition dates.
On February 28, 2014, the Company acquired Home Security of America, Inc. ("HSA"), based in Madison, Wisconsin. The total net purchase price for this acquisition was $32 million. The Company recorded goodwill of $34 million and other intangibles of $18 million related to this acquisition.
During the nine months ended September 30, 2014, the Company completed several pest control, termite and franchise acquisitions. The total net purchase price for these acquisitions was $25 million. The Company recorded goodwill of $16 million and other intangibles of $7 million related to these acquisitions.
During the nine months ended September 30, 2013, the Company completed several pest control, termite and franchise acquisitions, along with the purchase of a distributor license agreement with the Franchise Services Group. The total net purchase price for these acquisitions was $28 million. The Company recorded goodwill of $21 million and other intangibles of $6 million related to these acquisitions.
Supplemental cash flow information regarding the Company's acquisitions is as follows:
| |
Nine Months Ended September 30, |
||||||
|---|---|---|---|---|---|---|---|
(In millions)
|
2014 | 2013 | |||||
Purchase price (including liabilities assumed) |
$ | 92 | $ | 28 | |||
Less liabilities assumed |
(35 | ) | — | ||||
| | | | | | | | |
Net purchase price |
$ | 57 | $ | 28 | |||
| | | | | | | | |
| | | | | | | | |
| | | | | | | | |
Net cash paid for acquisitions |
$ | 52 | $ | 22 | |||
Seller financed debt |
5 | 6 | |||||
| | | | | | | | |
Payment for acquisitions |
$ | 57 | $ | 28 | |||
| | | | | | | | |
| | | | | | | | |
| | | | | | | | |
Note 12. Discontinued Operations
TruGreen Spin-off
On January 14, 2014, the Company completed the TruGreen Spin-off resulting in the spin-off of the assets and certain liabilities of the TruGreen Business through a tax-free, pro rata dividend to the Company's stockholders. As a result of the completion of the TruGreen Spin-off, New TruGreen operates the TruGreen Business as a private independent company.
The TruGreen Business experienced a significant downturn in recent years. From 2011 through 2013, the TruGreen Business lost 400,000 customers, or 19 percent of its customer base. The TruGreen Business's operating margins also eroded during this time frame due to production inefficiencies, higher chemical costs and inflationary pressures, compounded by lower fixed cost leverage as falling customer counts drove revenue down. The TruGreen Business experienced revenue and Adjusted EBITDA declines of 18.6 percent and 87.6 percent, respectively, from 2011 to 2013. In light of these
F-69
SERVICEMASTER GLOBAL HOLDINGS, INC.
NOTES TO CONDENSED CONSOLIDATED FINANCIAL STATEMENTS (Continued)
(UNAUDITED)
Note 12. Discontinued Operations (Continued)
developments, the Company made the decision to effect the TruGreen Spin-off and enable its management to increase its focus on Terminix, American Home Shield and the Franchise Services Group segments while providing New TruGreen, as an independently-operated, private company, the time and focus required to execute a turnaround.
As a result of the TruGreen Spin-off, the Company was required to perform an interim impairment analysis as of January 14, 2014 on the TruGreen trade name. The assumptions were developed with the view of the TruGreen Business as a stand-alone company, resulting in an increase in the assumed discount rate of 350 basis points, or "bps," as compared to the discount rate used in the October 1, 2013 impairment test for the TruGreen trade name. This interim impairment analysis resulted in a pre-tax non-cash trade name impairment charge of $139 million ($84 million, net of tax) to reduce the carrying value of the TruGreen trade name to its estimated fair value. This impairment charge was recorded in Loss from discontinued operations, net of income taxes, in the nine months ended September 30, 2014. The impairment of the TruGreen trade name represented an adjustment of the carrying value of the asset to its estimated fair value on a non-recurring basis using significant unobservable inputs on the date of the TruGreen Spin-off.
The following is a summary of the assets and liabilities distributed to New TruGreen as part of the TruGreen spin-off on January 14, 2014:
(In millions)
|
|
|||
|---|---|---|---|---|
Assets: |
||||
Cash and cash equivalents |
$ | 57 | ||
Receivables, net |
22 | |||
Inventories and other current assets |
39 | |||
Property and equipment, net |
181 | |||
Intangible assets, net |
216 | |||
Other long-term assets |
6 | |||
| | | | | |
Total Assets |
$ | 521 | ||
| | | | | |
| | | | | |
| | | | | |
Liabilities: |
||||
Current liabilities |
$ | 149 | ||
Long-term debt and other long-term liabilities |
87 | |||
| | | | | |
Total Liabilities |
$ | 236 | ||
| | | | | |
| | | | | |
| | | | | |
Net assets distributed to New TruGreen |
$ | 285 | ||
| | | | | |
| | | | | |
| | | | | |
The historical results of the TruGreen Business, including the results of operations, cash flows and related assets and liabilities, are reported as discontinued operations for all periods presented herein.
In connection with the TruGreen Spin-off, the Company and TruGreen Limited Partnership ("TGLP"), an indirect wholly owned subsidiary of New TruGreen, entered into a transition services agreement pursuant to which the Company and its subsidiaries provide TGLP with specified communications, public relations, finance and accounting, tax, treasury, internal audit, human resources operations and benefits, risk management and insurance, supply management, real estate management, marketing, facilities, information technology and other support services. The charges for the transition
F-70
SERVICEMASTER GLOBAL HOLDINGS, INC.
NOTES TO CONDENSED CONSOLIDATED FINANCIAL STATEMENTS (Continued)
(UNAUDITED)
Note 12. Discontinued Operations (Continued)
services allow the Company to fully recover the allocated direct costs of providing the services, plus specified margins and any out-of-pocket costs and expenses. The services provided under the transition services agreement will terminate at various specified times, and in no event later than January 14, 2016 (except certain information technology services, which the Company expects to provide to TGLP beyond the two-year period). TGLP may terminate the transition services agreement (or certain services under the transition services agreement) for convenience upon 90 days written notice, in which case TGLP will be required to reimburse the Company for early termination costs.
Under this transition services agreement, in the nine months ended September 30, 2014, the Company recorded $27 million, respectively, of fees due from TGLP, which is included, net of costs incurred, in Selling and administrative expenses in the unaudited condensed consolidated statement of operations and comprehensive income (loss). As of September 30, 2014, all amounts owed by TGLP under this agreement have been paid.
During the nine months ended September 30, 2014, the Company processed certain of TGLP's accounts payable transactions. Through this process, in the nine months ended September 30, 2014, $96 million was paid on TGLP's behalf, of which $94 million was repaid by TGLP. As of September 30, 2014, the Company recorded a $2 million receivable due from TGLP, which is included in Receivables on the unaudited condensed consolidated statement of financial position.
In addition, the Company, New TruGreen and TGLP entered into (1) a separation and distribution agreement containing key provisions relating to the separation of the TruGreen Business and the distribution of New TruGreen common stock to the Company's stockholders (including relating to specified TruGreen legal matters with respect to which we have agreed to retain liability, as well as insurance coverage, non-competition, indemnification and other matters), (2) an employee matters agreement allocating liabilities and responsibilities relating to employee benefit plans and programs and other related matters and (3) a tax matters agreement governing the respective rights, responsibilities and obligations of the parties thereto with respect to taxes, including allocating liabilities for income taxes attributable to New TruGreen and its subsidiaries generally to the Company for tax periods (or portions thereof) ending on or before January 14, 2014 and generally to New TruGreen for tax periods (or portions thereof) beginning after that date.
Financial Information for Discontinued Operations
(Loss) income from discontinued operations, net of income taxes, for all periods presented includes the operating results of the TruGreen Business and previously sold businesses.
F-71
SERVICEMASTER GLOBAL HOLDINGS, INC.
NOTES TO CONDENSED CONSOLIDATED FINANCIAL STATEMENTS (Continued)
(UNAUDITED)
Note 12. Discontinued Operations (Continued)
The operating results of discontinued operations are as follows:
| |
Nine Months Ended September 30, |
||||||
|---|---|---|---|---|---|---|---|
(In millions)
|
2014 | 2013 | |||||
Revenue |
$ | 6 | $ | 715 | |||
(Loss) income before income taxes(1) |
(160 | ) | (695 | ) | |||
Benefit for income taxes(1) |
(62 | ) | (162 | ) | |||
| | | | | | | | |
(Loss) income from discontinued operations, net of income taxes(1) |
$ | (98 | ) | $ | (533 | ) | |
| | | | | | | | |
| | | | | | | | |
| | | | | | | | |
- (1)
- In the nine months ended September 30, 2014, the TruGreen Business recorded a pre-tax non-cash trade name impairment charge of $139 million ($84 million, net of tax) in discontinued operations, net of income taxes. In the nine months ended September 30, 2013, the TruGreen Business recorded a pre-tax non-cash goodwill and trade name impairment charge of $673 million ($521 million, net of tax) in discontinued operations, net of income taxes.
Assets and liabilities of discontinued operations are summarized below:
(In millions)
|
As of September 30, 2014 |
As of December 31, 2013 |
|||||
|---|---|---|---|---|---|---|---|
Assets: |
|||||||
Receivables, net |
$ | — | $ | 28 | |||
Inventories and other current assets |
— | 48 | |||||
| | | | | | | | |
Total Current Assets |
— | 76 | |||||
| | | | | | | | |
Property and equipment, net |
— | 181 | |||||
Intangible assets, net |
— | 355 | |||||
Other long-term assets |
— | 6 | |||||
| | | | | | | | |
Total Assets |
$ | — | $ | 618 | |||
| | | | | | | | |
| | | | | | | | |
| | | | | | | | |
Liabilities: |
|||||||
Current liabilities |
$ | 8 | $ | 139 | |||
Long-term debt and other long-term liabilities |
— | 162 | |||||
| | | | | | | | |
Total Liabilities |
$ | 8 | $ | 301 | |||
| | | | | | | | |
| | | | | | | | |
| | | | | | | | |
At September 30, 2014, the liabilities of discontinued operations relate primarily to accruals for legal and other reserves. At December 31, 2013, these balances also reflect the historical assets and liabilities of the TruGreen Business, which was spun off in the nine months ended September 30, 2014.
F-72
SERVICEMASTER GLOBAL HOLDINGS, INC.
NOTES TO CONDENSED CONSOLIDATED FINANCIAL STATEMENTS (Continued)
(UNAUDITED)
Note 13. Income Taxes
As of September 30, 2014 and December 31, 2013, the Company had $8 million of tax benefits primarily reflected in state tax returns that have not been recognized for financial reporting purposes ("unrecognized tax benefits"). The Company currently estimates that, as a result of pending tax settlements and expiration of statutes of limitations, the amount of unrecognized tax benefits could be reduced by approximately $1 million during the next 12 months.
As required by Accounting Standard Codification ("ASC") 740, "Income Taxes," the Company computes interim period income taxes by applying an anticipated annual effective tax rate to our year-to-date income or loss from continuing operations before income taxes, except for significant unusual or infrequently occurring items. The Company's estimated tax rate is adjusted each quarter in accordance with ASC 740.
The effective tax rate on income from continuing operations at Holdings was 54.3 percent for the nine months ended September 30, 2014 compared to 49.3 percent for the nine months ended September 30, 2013. The effective tax rate on income from continuing operations at SvM was 53.7 percent for the nine months ended September 30, 2014 compared to 48.9 percent for the nine months ended September 30, 2013. The effective tax rate on income from continuing operations for the nine months ended September 30, 2014 was affected by various discrete events, including an adjustment to deferred state taxes resulting from a change in the Company's state apportionment factors primarily attributable to the TruGreen Spin-off. The effective tax rate on income from continuing operations for the nine months ended September 30, 2013 was affected by the reclassification of the TruGreen Business to discontinued operations and the resulting impact on the allocation of the full year effective tax rate on income from continuing operations to interim periods.
Note 14. Business Segment Reporting
The business of the Company is conducted through three reportable segments: Terminix, American Home Shield and Franchise Services Group.
In accordance with accounting standards for segments, the Company's reportable segments are strategic business units that offer different services. The Terminix segment provides termite and pest control services to residential and commercial customers and distributes pest control products. The American Home Shield segment provides home warranties for household systems and appliances. The Franchise Services Group segment provides residential and commercial disaster restoration, janitorial and cleaning services through franchises primarily under the ServiceMaster, ServiceMaster Restore and ServiceMaster Clean brand names, home cleaning services through franchises and Company-owned locations primarily under the Merry Maids brand name, on-site wood furniture repair and restoration services primarily under the Furniture Medic brand name and home inspection services primarily under the AmeriSpec brand name. Other Operations and Headquarters includes The ServiceMaster Acceptance Company Limited Partnership ("SMAC"), our financing subsidiary exclusively dedicated to providing financing to our franchisees and retail customers of our operating units, and the Company's headquarters operations (substantially all of which costs are allocated to the Company's reportable segments), which provide various technology, marketing, finance, legal and other support services to the reportable segments. The composition of our reportable segments is consistent with that used by our chief operating decision maker (the "CODM") to evaluate performance and allocate resources.
F-73
SERVICEMASTER GLOBAL HOLDINGS, INC.
NOTES TO CONDENSED CONSOLIDATED FINANCIAL STATEMENTS (Continued)
(UNAUDITED)
Note 14. Business Segment Reporting (Continued)
Information regarding the accounting policies used by the Company is described in Note 2. The Company derives substantially all of its revenue from customers and franchisees in the United States with less than two percent generated in foreign markets. Operating expenses of the business units consist of direct costs and indirect costs allocated from Other Operations and Headquarters. In periods prior to the TruGreen Spin-off, expenses which were allocated to TruGreen but are not reflected in discontinued operations are included in Other Operations and Headquarters. Such expenses amounted to $29 million in the nine months ended September 30, 2014, respectively.
The Company uses Reportable Segment Adjusted EBITDA as its measure of segment profitability. Accordingly, the CODM evaluates performance and allocates resources based primarily on Reportable Segment Adjusted EBITDA. Reportable Segment Adjusted EBITDA is defined as net income (loss) before: unallocated corporate expenses; income (loss) from discontinued operations, net of income taxes; provision (benefit) for income taxes; gain (loss) on extinguishment of debt; interest expense; depreciation and amortization expense; non-cash goodwill and trade name impairment; non-cash impairment of software and other related costs; non-cash impairment of property and equipment; non-cash stock-based compensation expense; restructuring charges; management and consulting fees; consulting agreement termination fees; non-cash effects attributable to the application of purchase accounting; and other non-operating expenses. The Company's definition of Reportable Segment Adjusted EBITDA may not be calculated or comparable to similarly titled measures of other companies. We believe Reportable Segment Adjusted EBITDA is useful for investors, analysts and other interested parties as it facilitates company-to-company operating performance comparisons by excluding potential differences caused by variations in capital structures, taxation, the age and book depreciation of facilities and equipment, restructuring initiatives, consulting agreements and equity-based, long-term incentive plans.
Information for continuing operations for each reportable segment and Other Operations and Headquarters is presented below:
| |
Nine Months Ended September 30, |
||||||
|---|---|---|---|---|---|---|---|
(In millions)
|
2014 | 2013 | |||||
Revenue: |
|||||||
Terminix |
$ | 1,049 | $ | 1,012 | |||
American Home Shield |
637 | 568 | |||||
Franchise Services Group |
189 | 175 | |||||
| | | | | | | | |
Reportable Segment Revenue |
$ | 1,875 | $ | 1,754 | |||
Other Operations and Headquarters |
5 | 6 | |||||
| | | | | | | | |
Total Revenue |
$ | 1,880 | $ | 1,760 | |||
| | | | | | | | |
| | | | | | | | |
| | | | | | | | |
F-74
SERVICEMASTER GLOBAL HOLDINGS, INC.
NOTES TO CONDENSED CONSOLIDATED FINANCIAL STATEMENTS (Continued)
(UNAUDITED)
Note 14. Business Segment Reporting (Continued)
| |
Nine Months Ended September 30, |
||||||
|---|---|---|---|---|---|---|---|
(In millions)
|
2014 | 2013 | |||||
Reportable Segment Adjusted EBITDA:(1) |
|||||||
Terminix |
$ | 248 | $ | 223 | |||
American Home Shield |
144 | 114 | |||||
Franchise Services Group |
58 | 57 | |||||
| | | | | | | | |
Reportable Segment Adjusted EBITDA |
$ | 450 | $ | 395 | |||
| | | | | | | | |
| | | | | | | | |
| | | | | | | | |
- (1)
- Presented below is a reconciliation of Reportable Segment Adjusted EBITDA to Net (Loss) Income:
| |
Nine Months Ended September 30, |
||||||
|---|---|---|---|---|---|---|---|
(In millions)
|
2014 | 2013 | |||||
Reportable Segment Adjusted EBITDA: |
|||||||
Terminix |
$ | 248 | $ | 223 | |||
American Home Shield |
144 | 114 | |||||
Franchise Services Group |
58 | 57 | |||||
| | | | | | | | |
Reportable Segment Adjusted EBITDA |
$ | 450 | $ | 395 | |||
| | | | | | | | |
| | | | | | | | |
| | | | | | | | |
Unallocated corporate expenses(a) |
$ | (7 | ) | $ | (34 | ) | |
Depreciation and amortization expense |
(76 | ) | (74 | ) | |||
Non-cash impairment of software and other related costs |
(47 | ) | — | ||||
Non-cash stock-based compensation expense |
(5 | ) | (3 | ) | |||
Restructuring charges |
(7 | ) | (4 | ) | |||
Management and consulting fees |
(4 | ) | (5 | ) | |||
Consulting agreement termination fees |
(21 | ) | — | ||||
(Loss) income from discontinued operations, net of income taxes |
(98 | ) | (533 | ) | |||
Benefit (provision) for income taxes |
(26 | ) | (43 | ) | |||
Loss on extinguishment of debt |
(65 | ) | — | ||||
Interest expense |
(171 | ) | (186 | ) | |||
Other |
— | (1 | ) | ||||
| | | | | | | | |
Net (Loss) Income |
$ | (76 | ) | $ | (488 | ) | |
| | | | | | | | |
| | | | | | | | |
| | | | | | | | |
- (a)
- Represents the unallocated corporate expenses of Other Operations and Headquarters.
F-75
SERVICEMASTER GLOBAL HOLDINGS, INC.
NOTES TO CONDENSED CONSOLIDATED FINANCIAL STATEMENTS (Continued)
(UNAUDITED)
Note 15. Related Party Transactions
On July 24, 2007, the Company was acquired pursuant to a merger transaction (the "2007 Merger"), and, immediately following the completion of the 2007 Merger, all of our outstanding common stock was owned by investment funds managed by, or affiliated with, Clayton, Dubilier & Rice, LLC ("CD&R"), or the "CD&R Funds," Citigroup Private Equity LP, or "Citigroup," BAS Capital Funding Corporation, or "BAS," and JPMorgan Chase Funding Inc., or "JPMorgan." On September 30, 2010, Citigroup transferred the management responsibility for certain investment funds that owned shares of our common stock to StepStone Group LP, or "StepStone," and the investment funds managed by StepStone Group, the "StepStone Funds." As of December 22, 2011, we purchased from BAS 5 million shares of our common stock. On March 30, 2012, an affiliate of BAS sold 5 million shares of our common stock to Ridgemont Partners Secondary Fund I, L.P, or "Ridgemont." On July 24, 2012, BACSVM-A L.P., an affiliate of BAS, distributed 1,666,666 shares of our common stock to Charlotte Investor IV, L.P., its sole limited partner, (together with the CD&R Funds, the StepStone Funds, JPMorgan and Citigroup Capital Partners II Employee Master Fund, L.P., an affiliate of Citigroup, the "Equity Sponsors").
Upon completion of Holdings' initial public offering on July 1, 2014, the Equity Sponsors continued to hold approximately 65 percent of Holdings' common stock.
Consulting Agreements
The Company was a party to a consulting agreement with CD&R under which CD&R provided the Company with ongoing consulting and management advisory services. The annual consulting fee payable under the consulting agreement with CD&R was $6 million. Under this agreement, the Company recorded consulting fees of $3 million and $5 million in the nine months ended September 30, 2014 and 2013, respectively, which is included in Selling and administrative expenses in the unaudited condensed consolidated statements of operations and comprehensive income (loss).
The Company was also a party to consulting agreements with StepStone, JPMorgan and Ridgemont (and formerly with BAS). Pursuant to the consulting agreements, the Company was required to pay aggregate annual consulting fees of $1 million to StepStone, JPMorgan and Ridgemont (formerly payable to BAS), respectively.
On July 1, 2014, in connection with the completion of Holdings' initial public offering, the Company paid the Equity Sponsors aggregate fees of $21 million in connection with the termination of the consulting agreements, which is recorded in the nine months ended September 30, 2014 in Consulting agreement termination fees in the unaudited condensed consolidated statements of operations and comprehensive income (loss).
Note 16. Fair Value Measurements
The period-end carrying amounts of receivables, accounts payable and accrued liabilities approximate fair value because of the short maturity of these instruments. The period-end carrying amounts of long-term notes receivable approximate fair value as the effective interest rates for these instruments are comparable to period-end market rates. The period-end carrying amounts of short- and long-term marketable securities also approximate fair value, with unrealized gains and losses reported net of tax as a component of accumulated other comprehensive income (loss) on the unaudited
F-76
SERVICEMASTER GLOBAL HOLDINGS, INC.
NOTES TO CONDENSED CONSOLIDATED FINANCIAL STATEMENTS (Continued)
(UNAUDITED)
Note 16. Fair Value Measurements (Continued)
condensed consolidated statements of financial position, or, for certain unrealized losses, reported in interest and net investment income in the unaudited condensed consolidated statements of operations and comprehensive income (loss) if the decline in value is other than temporary. The carrying amount of total debt was $3,059 million and $3,906 million and the estimated fair value was $3,170 million and $3,906 million as of September 30, 2014 and December 31, 2013, respectively. The fair value of the Company's debt is estimated based on available market prices for the same or similar instruments which are considered significant other observable inputs (Level 2) within the fair value hierarchy. The fair values presented reflect the amounts that would be received to sell an asset or paid to transfer a liability in an orderly transaction between market participants at the measurement date (exit price). The fair value estimates presented in this report are based on information available to the Company as of September 30, 2014 and December 31, 2013.
The Company has estimated the fair value of its financial instruments measured at fair value on a recurring basis using the market and income approaches. For investments in marketable securities, deferred compensation trust assets and derivative contracts, which are carried at their fair values, the Company's fair value estimates incorporate quoted market prices, other observable inputs (for example, forward interest rates) and unobservable inputs (for example, forward commodity prices) at the balance sheet date.
Interest rate swap contracts are valued using forward interest rate curves obtained from third-party market data providers. The fair value of each contract is the sum of the expected future settlements between the contract counterparties, discounted to present value. The expected future settlements are determined by comparing the contract interest rate to the expected forward interest rate as of each settlement date and applying the difference between the two rates to the notional amount of debt in the interest rate swap contracts.
Fuel swap contracts are valued using forward fuel price curves obtained from third-party market data providers. The fair value of each contract is the sum of the expected future settlements between the contract counterparties, discounted to present value. The expected future settlements are determined by comparing the contract fuel price to the expected forward fuel price as of each settlement date and applying the difference between the contract and expected prices to the notional gallons in the fuel swap contracts. The Company regularly reviews the forward price curves obtained from third-party market data providers and related changes in fair value for reasonableness utilizing information available to the Company from other published sources.
The Company has not changed its valuation techniques for measuring the fair value of any financial assets and liabilities during the year. Transfers between levels, if any, are recognized at the end of the reporting period. There were no significant transfers between levels during each of the nine month periods ended September 30, 2014 and 2013.
F-77
SERVICEMASTER GLOBAL HOLDINGS, INC.
NOTES TO CONDENSED CONSOLIDATED FINANCIAL STATEMENTS (Continued)
(UNAUDITED)
Note 16. Fair Value Measurements (Continued)
The carrying amount and estimated fair value of the Company's financial instruments that are recorded at fair value on a recurring basis for the periods presented are as follows:
| |
|
As of September 30, 2014 | |||||||||||||
|---|---|---|---|---|---|---|---|---|---|---|---|---|---|---|---|
| |
|
|
|
Estimated Fair Value Measurements |
|||||||||||
(In millions)
|
Statement of Financial Position Location |
Carrying Value |
Quoted Prices In Active Markets (Level 1) |
Significant Other Observable Inputs (Level 2) |
Significant Unobservable Inputs (Level 3) |
||||||||||
Financial Assets: |
|||||||||||||||
Deferred compensation trust assets |
Long-term marketable securities | $ | 9 | $ | 9 | $ | — | $ | — | ||||||
Investments in marketable securities |
Marketable securities and Long-term marketable securities | 103 | 55 | 48 | — | ||||||||||
| | | | | | | | | | | | | | | | |
Total financial assets |
$ | 112 | $ | 64 | $ | 48 | $ | — | |||||||
| | | | | | | | | | | | | | | | |
| | | | | | | | | | | | | | | | |
| | | | | | | | | | | | | | | | |
Financial Liabilities: |
|||||||||||||||
Fuel swap contracts: |
|||||||||||||||
Current |
Other accrued liabilities | $ | 1 | $ | — | $ | — | $ | 1 | ||||||
| | | | | | | | | | | | | | | | |
Total financial liabilities |
$ | 1 | $ | — | $ | — | $ | 1 | |||||||
| | | | | | | | | | | | | | | | |
| | | | | | | | | | | | | | | | |
| | | | | | | | | | | | | | | | |
| |
|
As of December 31, 2013 | |||||||||||||
|---|---|---|---|---|---|---|---|---|---|---|---|---|---|---|---|
| |
|
|
|
Estimated Fair Value Measurements |
|||||||||||
(In millions)
|
Statement of Financial Position Location |
Carrying Value |
Quoted Prices In Active Markets (Level 1) |
Significant Other Observable Inputs (Level 2) |
Significant Unobservable Inputs (Level 3) |
||||||||||
Financial Assets: |
|||||||||||||||
Deferred compensation trust assets |
Long-term marketable securities | $ | 13 | $ | 13 | $ | — | $ | — | ||||||
Investments in marketable securities |
Marketable securities and Long-term marketable securities | 136 | 61 | 75 | — | ||||||||||
Fuel swap contracts: |
|||||||||||||||
Current |
Prepaid expenses and other assets | 1 | — | — | 1 | ||||||||||
| | | | | | | | | | | | | | | | |
Total financial assets |
$ | 150 | $ | 74 | $ | 75 | $ | 1 | |||||||
| | | | | | | | | | | | | | | | |
| | | | | | | | | | | | | | | | |
| | | | | | | | | | | | | | | | |
F-78
SERVICEMASTER GLOBAL HOLDINGS, INC.
NOTES TO CONDENSED CONSOLIDATED FINANCIAL STATEMENTS (Continued)
(UNAUDITED)
Note 16. Fair Value Measurements (Continued)
A reconciliation of the beginning and ending fair values of financial instruments valued using significant unobservable inputs (Level 3) on a recurring basis is presented as follows:
(In millions)
|
Fuel Swap Contract Assets (Liabilities) |
|||
|---|---|---|---|---|
Balance as of December 31, 2013 |
$ | 1 | ||
Total gains (realized and unrealized) |
||||
Included in earnings |
— | |||
Included in accumulated other comprehensive income |
(2 | ) | ||
Settlements, net |
— | |||
| | | | | |
Balance as of September 30, 2014 |
$ | (1 | ) | |
| | | | | |
| | | | | |
| | | | | |
Balance as of December 31, 2012 |
$ | 2 | ||
Total gains (realized and unrealized) |
||||
Included in earnings |
1 | |||
Included in accumulated other comprehensive income |
(2 | ) | ||
Settlements, net |
(1 | ) | ||
| | | | | |
Balance as of September 30, 2013 |
$ | — | ||
| | | | | |
| | | | | |
| | | | | |
The following tables present information relating to the significant unobservable inputs of our Level 3 financial instruments:
| |
Fair Value (in millions) |
Valuation Technique | Unobservable Input | Range | Weighted Average |
||||||||
|---|---|---|---|---|---|---|---|---|---|---|---|---|---|
As of September 30, 2014 |
|||||||||||||
Fuel swap contracts |
$ | (1 | ) | Discounted Cash Flows | Forward Unleaded Price per Gallon(1) | $3.14 - $3.99 | $ | 3.61 | |||||
As of December 31, 2013 |
|
|
|
||||||||||
Fuel swap contracts |
$ | 1 | Discounted Cash Flows | Forward Unleaded Price per Gallon(1) | $3.20 - $3.87 | $ | 3.60 | ||||||
- (1)
- Forward prices per gallon were derived from third-party market data providers. A decrease in the forward price would result in a decrease in the fair value of the fuel swap contracts.
The Company uses derivative financial instruments to manage risks associated with changes in fuel prices and interest rates. The Company does not hold or issue derivative financial instruments for trading or speculative purposes. In designating its derivative financial instruments as hedging instruments under accounting standards for derivative instruments, the Company formally documents the relationship between the hedging instrument and the hedged item, as well as the risk management objective and strategy for the use of the hedging instrument. This documentation includes linking the derivatives to forecasted transactions. The Company assesses at the time a derivative contract is entered into, and at least quarterly thereafter, whether the derivative item is effective in offsetting the projected changes in cash flows of the associated forecasted transactions. All of the Company's designated hedging instruments are classified as cash flow hedges.
F-79
SERVICEMASTER GLOBAL HOLDINGS, INC.
NOTES TO CONDENSED CONSOLIDATED FINANCIAL STATEMENTS (Continued)
(UNAUDITED)
Note 16. Fair Value Measurements (Continued)
The Company has historically hedged a significant portion of its annual fuel consumption. The Company has also historically hedged the interest payments on a portion of its variable rate debt through the use of interest rate swap agreements. All of the Company's fuel swap contracts and interest rate swap contracts are classified as cash flow hedges, and, as such, the hedging instruments are recorded on the unaudited condensed consolidated statements of financial position as either an asset or liability at fair value, with the effective portion of changes in the fair value attributable to the hedged risks recorded in accumulated other comprehensive income (loss). Any change in the fair value of the hedging instrument resulting from ineffectiveness, as defined by accounting standards, is recognized in current period earnings. Cash flows related to fuel and interest rate derivatives are classified as operating activities in the unaudited condensed consolidated statements of cash flows.
The effect of derivative instruments on the unaudited condensed consolidated statements of operations and comprehensive income (loss) and accumulated other comprehensive income (loss) on the unaudited condensed consolidated statements of financial position is presented as follows:
(In millions) Derivatives designated as Cash Flow Hedge Relationships |
Effective Portion of (Loss) Gain Recognized in Accumulated Other Comprehensive Income |
Effective Portion of Gain (Loss) Reclassified from Accumulated Other Comprehensive Income Into Earnings |
Location of Gain (Loss) included in Earnings |
|||||
|---|---|---|---|---|---|---|---|---|
Nine Months Ended September 30, 2014: |
||||||||
Fuel swap contracts |
$ | (2 | ) | $ | — | Cost of services rendered and products sold | ||
Nine Months Ended September 30, 2013: |
|
|||||||
Fuel swap contracts |
$ | (2 | ) | $ | 1 | Cost of services rendered and products sold | ||
Interest rate swap contracts |
$ | 5 | $ | (5 | ) | Interest expense | ||
Ineffective portions of derivative instruments designated in accordance with accounting standards as cash flow hedge relationships were insignificant during the nine months ended September 30, 2014. As of September 30, 2014, the Company had fuel swap contracts to pay fixed prices for fuel with an aggregate notional amount of $22 million, maturing through 2015. Under the terms of its fuel swap contracts, the Company is required to post collateral in the event that the fair value of the contracts exceeds a certain agreed upon liability level and in other circumstances required by the counterparty. As of September 30, 2014, the Company had posted $1 million in letters of credit as collateral under its fuel hedging program, which were issued under the Company's New Revolving Credit Facility.
The effective portion of the gain or loss on derivative instruments designated and qualifying as cash flow hedging instruments is recorded in accumulated other comprehensive income (loss). These amounts are reclassified into earnings in the same period or periods during which the hedged forecasted debt interest settlement or the fuel settlement affects earnings. The amount expected to be reclassified into earnings during the next 12 months includes unrealized gains and losses related to open fuel hedges and interest rate swaps. Specifically, as the underlying forecasted transactions occur
F-80
SERVICEMASTER GLOBAL HOLDINGS, INC.
NOTES TO CONDENSED CONSOLIDATED FINANCIAL STATEMENTS (Continued)
(UNAUDITED)
Note 16. Fair Value Measurements (Continued)
during the next 12 months, the hedging gains and losses in accumulated other comprehensive income (loss) expected to be recognized in earnings is a loss of $3 million, net of tax, as of September 30, 2014. The amounts that are ultimately reclassified into earnings will be based on actual interest rates and fuel prices at the time the positions are settled and may differ materially from the amount noted above.
Note 17. Earnings Per Share
Basic earnings (loss) per share is computed by dividing net income (loss) by the weighted average number of shares of common stock outstanding. Diluted earnings (loss) per share is computed by dividing net income (loss) by the weighted-average number of shares of common stock outstanding during the period, increased to include the number of shares of common stock that would have been outstanding had potential dilutive shares of common stock been issued. The dilutive effect of stock options and restricted stock units are reflected in diluted net income (loss) per share by applying the treasury stock method.
A reconciliation of the amounts included in the computation of basic earnings per share from continuing operations and diluted earnings per share from continuing operations is as follows:
| |
Nine Months Ended September 30, |
||||||
|---|---|---|---|---|---|---|---|
(In millions, except per share data)
|
2014 | 2013 | |||||
(Loss) Income from continuing operations |
$ | 22 | $ | 44 | |||
| | | | | | | | |
| | | | | | | | |
| | | | | | | | |
Weighted average common shares outstanding |
105.8 | 91.6 | |||||
Effect of dilutive securities: |
|||||||
RSUs |
0.1 | — | |||||
Stock options(1) |
0.8 | 0.8 | |||||
| | | | | | | | |
Weighted average common share outstanding—assuming dilution |
106.7 | 92.4 | |||||
| | | | | | | | |
| | | | | | | | |
| | | | | | | | |
Basic (loss) earnings per share from continuing operations |
$ | 0.20 | $ | 0.48 | |||
| | | | | | | | |
| | | | | | | | |
| | | | | | | | |
Diluted (loss) earnings per share from continuing operations |
$ | 0.20 | $ | 0.48 | |||
| | | | | | | | |
| | | | | | | | |
| | | | | | | | |
- (1)
- Options to purchase 1.7 million shares and 0.5 million shares for the nine months ended September 30, 2014 and 2013, respectively, were not included in the computation because either their exercise price or proceeds per share exceeded the average market price of the Company's common stock for each respective reporting date.
On June 25, 2014, Holdings' registration statement on Form S-1 was declared effective by the SEC for an initial public offering of its common stock, and, on July 1, 2014, Holdings completed the offering of 41,285,000 shares of its common stock. For further details, see Note 1.
F-81
25,000,000 Shares
![]()
ServiceMaster Global Holdings, Inc.
Common Stock
| J.P. Morgan | Credit Suisse | Goldman, Sachs & Co. | Morgan Stanley |
| BofA Merrill Lynch | Jefferies | Natixis | RBC Capital Markets |
| Baird | Piper Jaffray | Ramirez & Co., Inc. |
, 2015
PART II
INFORMATION NOT REQUIRED IN PROSPECTUS
Item 13. Other Expenses of Issuance and Distribution.
The following table sets forth the estimated expenses payable by us in connection with the sale and distribution of the securities registered hereby, other than underwriting discounts or commissions. All amounts are estimates except for the SEC registration fee and the Financial Industry Regulatory Authority filing fee.
SEC Registration Fee |
$ | 92,840 | ||
FINRA Filing Fee |
$ | 120,345 | ||
Printing Fees and Expenses |
$ | 300,000 | ||
Accounting Fees and Expenses |
$ | 250,000 | ||
Legal Fees and Expenses |
$ | 700,000 | ||
Transfer Agent Fees and Expenses |
$ | 10,000 | ||
Miscellaneous |
$ | 100,000 | ||
| | | | | |
Total: |
$ | 1,573,185 | ||
| | | | | |
| | | | | |
| | | | | |
Item 14. Indemnification of Directors and Officers.
ServiceMaster Global Holdings, Inc. is incorporated under the laws of the State of Delaware.
Section 145(a) of the General Corporation Law of the State of Delaware, or the "DGCL," provides that a corporation may indemnify any person who was or is a party or is threatened to be made a party to any threatened, pending or completed action, suit or proceeding, whether civil, criminal, administrative or investigative (other than an action by or in the right of the corporation) by reason of the fact that the person is or was a director, officer, employee or agent of the corporation, or is or was serving at the request of the corporation as a director, officer, employee or agent of another corporation, partnership, joint venture, trust or other enterprise, against expenses (including attorneys' fees), judgments, fines and amounts paid in settlement actually and reasonably incurred by the person in connection with such action, suit or proceeding if the person acted in good faith and in a manner the person reasonably believed to be in or not opposed to the best interests of the corporation, and, with respect to any criminal action or proceeding, had no reasonable cause to believe the person's conduct was unlawful.
Section 145(b) of the DGCL provides that a corporation may indemnify any person who was or is a party or is threatened to be made a party to any threatened, pending or completed action or suit by or in the right of the corporation to procure a judgment in its favor by reason of the fact that the person is or was a director, officer, employee or agent of the corporation, or is or was serving at the request of the corporation as a director, officer, employee or agent of another corporation, partnership, joint venture, trust or other enterprise, against expenses (including attorneys' fees) actually and reasonably incurred by the person in connection with the defense or settlement of such action or suit if the person acted in good faith and in a manner the person reasonably believed to be in or not opposed to the best interests of the corporation and except that no indemnification shall be made in respect of any claim, issue or matter as to which such person shall have been adjudged to be liable to the corporation unless and only to the extent that the Delaware Court of Chancery or the court in which such action or suit was brought shall determine upon application that, despite the adjudication of liability but in view of all of the circumstances of the case, such person is fairly and reasonably entitled to indemnity for such expenses which the Delaware Court of Chancery or such other court shall deem proper.
II-1
Section 145(c) of the DGCL provides that to the extent that a present or former director or officer of a corporation has been successful on the merits or otherwise in defense of any action, suit or proceeding referred to in subsections (a) and (b) of Section 145 of the DGCL, or in defense of any claim, issue or matter therein, such person shall be indemnified against expenses (including attorneys' fees) actually and reasonably incurred by such person in connection therewith.
Section 145(e) of the DGCL provides that expenses (including attorneys' fees) incurred by an officer or director of the corporation in defending any civil, criminal, administrative or investigative action, suit or proceeding may be paid by the corporation in advance of the final disposition of such action, suit or proceeding upon receipt of an undertaking by or on behalf of such director or officer to repay such amount if it shall ultimately be determined that such person is not entitled to be indemnified by the corporation as authorized in Section 145 of the DGCL. Such expenses, including attorneys' fees, incurred by former directors and officers or other employees and agents of the corporation or by persons serving at the request of the corporation as directors, officers, employees or agents of another corporation, partnership, joint venture, trust or other enterprise may be so paid upon such terms and conditions, if any, as the corporation deems appropriate.
Section 145(g) of the DGCL specifically allows a Delaware corporation to purchase liability insurance on behalf of its directors and officers and to insure against potential liability of such directors and officers regardless of whether the corporation would have the power to indemnify such directors and officers under Section 145 of the DGCL.
Section 102(b)(7) of the DGCL permits a Delaware corporation to include a provision in its certificate of incorporation eliminating or limiting the personal liability of directors to the corporation or its stockholders for monetary damages for breach of fiduciary duty as a director. This provision, however, may not eliminate or limit a director's liability (1) for breach of the director's duty of loyalty to the corporation or its stockholders, (2) for acts or omissions not in good faith or involving intentional misconduct or a knowing violation of law, (3) under Section 174 of the DGCL, which provides for liability of directors for unlawful payments of dividends or unlawful stock purchases or redemptions, or (4) for any transaction from which the director derived an improper personal benefit.
Our Second Amended and Restated Certificate of Incorporation contains provisions permitted under Delaware General Corporation Law relating to the liability of directors. These provisions will eliminate a director's personal liability for monetary damages resulting from a breach of fiduciary duty, except in circumstances involving:
- •
- any breach of the director's duty of loyalty;
- •
- acts or omissions not in good faith or which involve intentional misconduct or a knowing violation of the law;
- •
- under Section 174 of the Delaware General Corporation Law (unlawful dividends); or
- •
- any transaction from which the director derives an improper personal benefit.
Our Second Amended and Restated Certificate of Incorporation and our Second Amended and Restated By-laws require us to indemnify and advance expenses to our directors and officers to the fullest extent not prohibited by the Delaware General Corporation Law and other applicable law, except in the case of a proceeding instituted by the director without the approval of our board of directors. Our Second Amended and Restated Certificate of Incorporation and our Second Amended and Restated By-laws provide that we are required to indemnify our directors and officers, to the fullest extent permitted by law, for all judgments, fines, settlements, legal fees and other expenses incurred in connection with pending or threatened legal proceedings because of the director's or officer's positions with us or another entity that the director or officer serves at our request, subject to various conditions, and to advance funds to our directors and officers to enable them to defend against
II-2
such proceedings. To receive indemnification, the director or officer must have been successful in the legal proceeding or have acted in good faith and in what was reasonably believed to be a lawful manner in our best interest and, with respect to any criminal proceeding, had no reasonable cause to believe his or her conduct was unlawful.
Indemnification Agreements
We and SvM are parties to indemnification agreements with certain of the Equity Sponsors, pursuant to which we and SvM indemnify such entities and their respective affiliates, directors, officers, partners, members, employees, agents, representatives and controlling persons, against certain liabilities arising out of performance of the consulting agreements described above under "Certain Relationships and Related Party Transactions—Consulting Agreements" and certain other claims and liabilities, including liabilities arising out of financing arrangements and securities offerings.
We are party to indemnification agreements with our directors. The indemnification agreements provide the directors with contractual rights to the indemnification and expense advancement rights provided under our amended and restated by-laws, as well as contractual rights to additional indemnification as provided in the indemnification agreements.
Directors' and Officers' Liability Insurance
We have obtained directors' and officers' liability insurance which insures against certain liabilities that our directors and officers and the directors and officers of our subsidiaries may, in such capacities, incur.
Item 15. Recent Sales of Unregistered Securities.
On February 22, 2011, we issued 115,151 shares of our common stock to one of our officers in exchange for approximately $1.9 million in cash.
On April 8, 2011, we issued 15,210 shares of our common stock to three of our employees in exchange for approximately $0.3 million in cash.
On April 29, 2011, we issued 33,333 shares of our common stock pursuant to the exercise of stock options to one of our employees in exchange for approximately $0.5 million in cash.
On June 22, 2011, we issued 300,000 shares of our common stock pursuant to the exercise of stock options to one of our officers in exchange for approximately $4.5 million in cash.
On December 16, 2011, we issued 133,329 shares of our common stock to six of our officers and employees in exchange for approximately $2.2 million in cash.
On March 21, 2012, we issued 28,567 shares of our common stock to five of our officers and employees in exchange for approximately $0.6 million in cash.
On March 30, 2012, we issued 13,333 shares of our common stock pursuant to the exercise of stock options to one of our employees in exchange for approximately $0.2 million in cash.
On June 1, 2012, we issued 6,666 shares of our common stock to two of our employees in exchange for approximately $0.2 million in cash.
On September 28, 2012, we issued 46,666 shares of our common stock to four of our officers and employees in exchange for approximately $1.1 million in cash. On September 28, 2012, we also issued 23,750 shares of our common stock pursuant to the exercise of stock options to two of our employees for approximately $0.4 million in cash.
II-3
On October 5, 2012, we issued 63,333 shares of our common stock pursuant to the exercise of stock options to one of our employees in exchange for approximately $1.0 million in cash.
On October 31, 2012, we issued 31,666 shares of our common stock pursuant to the exercise of stock options to one of our employees in exchange for approximately $0.5 million in cash.
On November 2, 2012, we issued 26,666 shares of our common stock pursuant to the exercise of stock options to one of our employees in exchange for approximately $0.4 million in cash.
On November 30, 2012, we issued 41,666 shares of our common stock pursuant to the exercise of stock options to one of our employees in exchange for approximately $0.6 million in cash.
On December 27, 2012, we issued 13,333 shares of our common stock pursuant to the exercise of stock options to one of our employees in exchange for approximately $0.2 million in cash.
On December 28, 2012, we issued 40,000 shares of our common stock pursuant to the exercise of stock options to one of our employees in exchange for approximately $0.6 million in cash.
On September 13, 2013, we issued 245,156 shares of our common stock to 21 of our officers and employees in exchange for approximately $3.7 million in cash.
On December 11, 2013, we issued 192,466 shares of our common stock to seven of our directors, officers and employees in exchange for approximately $3.0 million in cash.
On December 26, 2013, we issued 53,333 shares of our common stock pursuant to the exercise of stock options to one of our employees in exchange for approximately $0.8 million in cash.
On March 18, 2014, we issued 483,758 shares of our common stock to 66 of our officers and employees in exchange for approximately $5.8 million in cash in two separate transactions.
On April 14, 2014, we issued 12,860 shares of our common stock pursuant to the exercise of stock options to one of our employees in exchange for approximately $0.1 million in cash.
On May 16, 2014, we issued 30,188 shares of our common stock pursuant to the exercise of stock options to three of our employees in exchange for approximately $0.3 million in cash.
On June 26, 2014, we issued 58,048 shares of our common stock pursuant to the exercise of stock options to a former employee in exchange for approximately $0.7 million in cash.
The sales of the above securities were deemed to be exempt from registration under the Securities Act in reliance upon Section 4(2) of the Securities Act or Regulation D or Rule 701 promulgated thereunder, as transactions by an issuer not involving any public offering or pursuant to benefit plans and contracts relating to compensation as provided under Rule 701. There were no underwriters employed in connection with any of the transactions set forth in this Item 15.
Share amounts above give effect to the 2-for-3 reverse stock split of our common stock completed on June 13, 2014.
Item 16. Exhibits and Financial Statement Schedules.
The Exhibits to this Registration Statement on Form S-1 are listed in the Exhibit Index which follows the signature pages to this Registration Statement and is herein incorporated by reference.
II-4
Financial Statement Schedules
REPORT OF INDEPENDENT REGISTERED PUBLIC ACCOUNTING FIRM
To
the Board of Directors of
ServiceMaster Global Holdings, Inc.
Memphis, Tennessee
We have audited the consolidated financial statements of ServiceMaster Global Holdings, Inc., and subsidiaries (the "Company") as of December 31, 2013 and 2012, and for each of the three years in the period ended December 31, 2013, and have issued our report thereon dated March 24, 2014 (May 9, 2014 as to Note 3 and Note 7 to the consolidated financial statements; June 13, 2014 as to the reverse stock split described in Note 20 to the consolidated financial statements); such consolidated financial statements and report are included elsewhere in this Registration Statement. Our audits also included the consolidated financial statement schedules of the Company listed in Item 16. These consolidated financial statement schedules are the responsibility of the Company's management. Our responsibility is to express an opinion based on our audits. In our opinion, such consolidated financial statement schedules, when considered in relation to the basic consolidated financial statements taken as a whole, present fairly, in all material respects, the information set forth therein.
/s/
Deloitte & Touche LLP
Memphis, Tennessee
March 24, 2014 (May 9, 2014 as to Note 3 and Note 7 to the consolidated financial statements)
II-5
SCHEDULE I
SERVICEMASTER GLOBAL HOLDINGS, INC. (PARENT)
CONDENSED FINANCIAL INFORMATION
CONDENSED STATEMENTS OF INCOME
(In millions)
| |
Year ended December 31, |
|||||||||
|---|---|---|---|---|---|---|---|---|---|---|
| |
2013 | 2012 | 2011 | |||||||
Revenue |
$ | — | $ | — | $ | — | ||||
Selling and administrative expenses |
1 | 1 | — | |||||||
Interest and net investment (income) loss |
— | — | (7 | ) | ||||||
Loss on extinguishment of debt |
— | — | (1 | ) | ||||||
| | | | | | | | | | | |
(Loss) Income from Continuing Operations before Income Taxes |
(1 | ) | (1 | ) | 8 | |||||
Provision for income taxes |
— | — | 3 | |||||||
| | | | | | | | | | | |
(Loss) Income from Continuing Operations |
(1 | ) | (1 | ) | 5 | |||||
Equity in earnings of subsidiaries (net of tax) |
(506 | ) | (713 | ) | 41 | |||||
| | | | | | | | | | | |
Net (Loss) Income |
$ | (507 | ) | $ | (714 | ) | $ | 46 | ||
| | | | | | | | | | | |
| | | | | | | | | | | |
| | | | | | | | | | | |
Total Comprehensive (Loss) Income |
$ | (507 | ) | $ | (701 | ) | $ | 57 | ||
| | | | | | | | | | | |
| | | | | | | | | | | |
| | | | | | | | | | | |
II-6
SERVICEMASTER GLOBAL HOLDINGS, INC. (PARENT)
CONDENSED FINANCIAL INFORMATION
CONDENSED BALANCE SHEETS
(In millions)
| |
As of December 31, |
||||||
|---|---|---|---|---|---|---|---|
| |
2013 | 2012 | |||||
Assets |
|||||||
Current Assets: |
|||||||
Cash and cash equivalents |
$ | 8 | $ | 6 | |||
Prepaid expenses and other assets |
— | 1 | |||||
| | | | | | | | |
Total Current Assets |
8 | 7 | |||||
Other Assets: |
|||||||
Investments in and advances to subsidiaries |
52 | 554 | |||||
| | | | | | | | |
Total Assets |
$ | 60 | $ | 561 | |||
| | | | | | | | |
| | | | | | | | |
| | | | | | | | |
Liabilities and Shareholders' Equity Current Liabilities: |
|||||||
Accrued liabilities: |
|||||||
Other |
$ | — | $ | 3 | |||
| | | | | | | | |
Total Current Liabilities |
— | 3 | |||||
Long-Term Debt |
14 | — | |||||
Other Long-Term Liabilities: |
|||||||
Deferred taxes |
23 | 23 | |||||
| | | | | | | | |
Total Other Long-Term Liabilities |
23 | 23 | |||||
Shareholders' Equity |
23 | 535 | |||||
| | | | | | | | |
Total Liabilities and Shareholders' Equity |
$ | 60 | $ | 561 | |||
| | | | | | | | |
| | | | | | | | |
| | | | | | | | |
II-7
SERVICEMASTER GLOBAL HOLDINGS, INC. (PARENT)
CONDENSED FINANCIAL INFORMATION
CONDENSED STATEMENTS OF CASH FLOWS
(In millions)
| |
As of December 31, | |||||||||
|---|---|---|---|---|---|---|---|---|---|---|
| |
2013 | 2012 | 2011 | |||||||
Cash and Cash Equivalents at Beginning of Period |
$ | 6 | $ | 10 | $ | 12 | ||||
| | | | | | | | | | | |
Net (Loss) Income Before Equity in Net Income of Subsidiary |
(1 | ) | (1 | ) | 5 | |||||
Loss on extinguishment of debt |
— | — | (1 | ) | ||||||
Deferred income tax (benefit) provision |
— | — | 6 | |||||||
Change in working capital, net of acquisitions: |
||||||||||
Current income taxes |
— | — | (3 | ) | ||||||
Receivables |
(3 | ) | 3 | — | ||||||
Inventories and other current assets |
1 | (1 | ) | — | ||||||
Accrued liabilities |
— | — | 3 | |||||||
| | | | | | | | | | | |
Net Cash (Used for) Provided from Operating Activities from Continuing Operations |
(3 | ) | 1 | 10 | ||||||
| | | | | | | | | | | |
Cash Flows from Financing Activities from Continuing Operations: |
||||||||||
Borrowings of debt |
14 | — | — | |||||||
Payments of debt |
— | — | 65 | |||||||
Repurchase of common stock and payments of restricted stock share withholdings |
(16 | ) | (11 | ) | (87 | ) | ||||
Net intercompany advances |
7 | 6 | 10 | |||||||
| | | | | | | | | | | |
Net Cash Provided From (Used for) Financing Activities from Continuing Operations |
5 | (5 | ) | (12 | ) | |||||
| | | | | | | | | | | |
Cash Increase (Decrease) During the Period |
2 | (4 | ) | (2 | ) | |||||
| | | | | | | | | | | |
Cash and Cash Equivalents at End of Period |
$ | 8 | $ | 6 | $ | 10 | ||||
| | | | | | | | | | | |
| | | | | | | | | | | |
| | | | | | | | | | | |
II-8
Notes to ServiceMaster Global Holdings, Inc. (Parent) Condensed Financial Statements
1. Basis of Presentation
The condensed financial statements of ServiceMaster Global Holdings, Inc. ("Parent") are required as a result of the restricted net assets of Parent's consolidated subsidiaries exceeding 25% of Parent's consolidated net assets as of December 31, 2013. All consolidated subsidiaries of Parent are wholly owned. The primary source of income for Parent is equity in its subsidiaries' earnings.
Pursuant to rules and regulations of the SEC, the unconsolidated condensed financial statements of Parent do not reflect all of the information and notes normally included with financial statements prepared in accordance with GAAP. Therefore, these condensed financial statements should be read in conjunction with the consolidated financial statements and related notes included in this Registration Statement on Form S-1.
Parent has accounted for its subsidiaries under the equity method in the unconsolidated condensed financial statements.
2. Related Party Transactions
On April 19, 2013, Parent entered into a revolving promissory note with SvM with a maximum borrowing capacity of $25 million that is scheduled to mature on April 18, 2018. Amounts outstanding under this agreement shall bear interest at the rate of 5.0 percent per annum. As of December 31, 2013, Parent had borrowed $14 million under this note. The funds borrowed under this note are used by Parent to repurchase shares of its common stock from associates who have left SvM.
II-9
SCHEDULE II
SERVICEMASTER GLOBAL HOLDINGS, INC.
VALUATION AND QUALIFYING ACCOUNTS
(In millions)
| |
Balance at Beginning of Period |
Additions Charged to Costs and Expenses |
Deductions(1) | Balance at End of Period |
|||||||||
|---|---|---|---|---|---|---|---|---|---|---|---|---|---|
AS OF AND FOR THE YEAR ENDING DECEMBER 31, 2013 |
|||||||||||||
Continuing Operations— |
|||||||||||||
Allowance for doubtful accounts |
|||||||||||||
Accounts receivable |
$ | 20 | $ | 36 | $ | 34 | $ | 22 | |||||
Notes receivable |
3 | 1 | — | 4 | |||||||||
Income tax valuation allowance |
6 | 1 | — | 7 | |||||||||
AS OF AND FOR THE YEAR ENDING DECEMBER 31, 2012 |
|||||||||||||
Continuing Operations— |
|||||||||||||
Allowance for doubtful accounts |
|||||||||||||
Accounts receivable |
$ | 16 | $ | 35 | $ | 31 | $ | 20 | |||||
Notes receivable |
2 | 1 | — | 3 | |||||||||
Income tax valuation allowance |
6 | — | — | 6 | |||||||||
AS OF AND FOR THE YEAR ENDING DECEMBER 31, 2011 |
|||||||||||||
Continuing Operations— |
|||||||||||||
Allowance for doubtful accounts |
|||||||||||||
Accounts receivable |
$ | 14 | $ | 31 | $ | 29 | $ | 16 | |||||
Notes receivable |
2 | — | — | 2 | |||||||||
Income tax valuation allowance |
15 | — | 9 | 6 | |||||||||
- (1)
- Deductions in the allowance for doubtful accounts for accounts and notes receivable reflect write-offs of uncollectible accounts. Deductions for the income tax valuation allowance in 2013 are primarily attributable to the reduction of net operating loss carryforwards related to their expiration. Deductions for the income tax valuation allowance in 2012 are primarily attributable to the reduction of net operating loss carryforwards related to the dissolution of certain subsidiaries. Deductions for the income tax valuation allowance in 2011 are primarily attributable to the reduction of net operating loss carryforwards and other tax attributes related to the dissolution of certain subsidiaries.
(a) The undersigned registrant hereby undertakes to provide to the underwriters at the closing specified in the underwriting agreements certificates in such denominations and registered in such names as required by the underwriters to permit prompt delivery to each purchaser.
(b) Insofar as indemnification for liabilities arising under the Securities Act of 1933 may be permitted to directors, officers and controlling persons of the registrant pursuant to the foregoing provisions, or otherwise, the registrant has been advised that in the opinion of the Securities and Exchange Commission such indemnification is against public policy as expressed in the Act and is, therefore, unenforceable. In the event that a claim for indemnification against such liabilities (other than the payment by the registrant of expenses incurred or paid by a director, officer or controlling person of the registrant in the successful defense of any action, suit or proceeding) is asserted by such
II-10
director, officer or controlling person in connection with the securities being registered, the registrant will, unless in the opinion of its counsel the matter has been settled by controlling precedent, submit to a court of appropriate jurisdiction the question whether such indemnification by it is against public policy as expressed in the Act and will be governed by the final adjudication of such issue.
(c) The undersigned registrant hereby undertakes that:
(1) For purposes of determining any liability under the Securities Act of 1933, the information omitted from the form of prospectus filed as part of this registration statement in reliance upon Rule 430A and contained in a form of prospectus filed by the registrant pursuant to Rule 424(b)(1) or (4) or 497(h) under the Securities Act shall be deemed to be part of this registration statement as of the time it was declared effective.
(2) For the purpose of determining any liability under the Securities Act of 1933, each post-effective amendment that contains a form of prospectus shall be deemed to be a new registration statement relating to the securities offered therein, and the offering of such securities at that time shall be deemed to be the initial bona fide offering thereof.
II-11
Pursuant to the requirements of the Securities Act of 1933, ServiceMaster Global Holdings, Inc. has duly caused this registration statement to be signed on its behalf by the undersigned, thereunto duly authorized, in the City of Memphis, State of Tennessee, on February 3, 2015.
| SERVICEMASTER GLOBAL HOLDINGS, INC. | ||||||
By: |
/s/ ROBERT J. GILLETTE |
|||||
| Name: | Robert J. Gillette | |||||
| Title: | Chief Executive Officer | |||||
Pursuant to the requirements of the Securities Act of 1933, this registration statement has been signed on February 3, 2015 by the following persons in the capacities indicated.
Signature
|
Title
|
|||
|---|---|---|---|---|
| * John Krenicki, Jr. |
Director, Chairman of the Board | |||
/s/ ROBERT J. GILLETTE Robert J. Gillette |
Chief Executive Officer and Director (Principal Executive Officer) |
|||
/s/ ALAN J. M. HAUGHIE Alan J. M. Haughie |
Senior Vice President and Chief Financial Officer (Principal Financial Officer) |
|||
/s/ JOHN P. MULLEN John P. Mullen |
Vice President, Controller and Chief Accounting Officer (Principal Accounting Officer) |
|||
* Richard P. Fox |
Director |
|||
* Darren M. Friedman |
Director |
|||
* Sarah Kim |
Director |
|||
S-1
Signature
|
Title
|
|||
|---|---|---|---|---|
| * Stephen J. Sedita |
Director | |||
* David H. Wasserman |
Director |
|||
*By: |
/s/ ROBERT J. GILLETTE Robert J. Gillette as Attorney-in-Fact |
|||
S-2
Note Regarding Reliance on Statements in Our Contracts: In reviewing the agreements included as exhibits to this Registration Statement on Form S-1, please remember that they are included to provide you with information regarding their terms and are not intended to provide any other factual or disclosure information about ServiceMaster Global Holdings, Inc., its subsidiaries or affiliates, or the other parties to the agreements. The agreements contain representations and warranties by each of the parties to the applicable agreement. These representations and warranties have been made solely for the benefit of the other parties to the applicable agreement and (i) should not in all instances be treated as categorical statements of fact, but rather as a way of allocating the risk to one of the parties if those statements prove to be inaccurate; (ii) have been qualified by disclosures that were made to the other party in connection with the negotiation of the applicable agreement, which disclosures are not necessarily reflected in the agreement; (iii) may apply standards of materiality in a way that is different from what may be viewed as material to investors; and (iv) were made only as of the date of the applicable agreement or such other date or dates as may be specified in the agreement and are subject to more recent developments. Accordingly, these representations and warranties may not describe the actual state of affairs as of the date they were made or at any other time. Additional information about ServiceMaster Global Holdings, Inc., its subsidiaries and affiliates may be found elsewhere in this Registration Statement on Form S-1.
| Exhibit Number |
Description | ||
|---|---|---|---|
| 1.1 | * | Form of Underwriting Agreement. | |
2.1 |
Agreement and Plan of Merger, dated as of December 31, 2013, by and between The ServiceMaster Company and The ServiceMaster Company, LLC, is incorporated by reference to Exhibit 2.1 to the Current Report on Form 8-K of The ServiceMaster Company, LLC, filed January 17, 2014. |
||
2.2 |
Separation and Distribution Agreement, dated as of January 14, 2014, by and among ServiceMaster Global Holdings, Inc., The ServiceMaster Company, TruGreen Holding Corporation and TruGreen Limited Partnership, is incorporated by reference to Exhibit 2.2 to the Current Report on Form 8-K of The ServiceMaster Company, LLC, filed January 17, 2014. |
||
2.3 |
Employee Matters Agreement, dated as of January 14, 2014, by and among ServiceMaster Global Holdings, Inc., The ServiceMaster Company, LLC, TruGreen Limited Partnership and TruGreen Holding Corporation, is incorporated by reference to Exhibit 2.3 to the Current Report on Form 8-K of The ServiceMaster Company, LLC, filed January 17, 2014. |
||
2.4 |
Tax Matters Agreement, dated as of January 14, 2014, by and among ServiceMaster Global Holdings, Inc., The ServiceMaster Company, LLC, TruGreen Holding Corporation and TruGreen Limited Partnership, is incorporated by reference to Exhibit 2.4 to the Current Report on Form 8-K of The ServiceMaster Company, LLC, filed January 17, 2014. |
||
2.5 |
Transition Services Agreement, dated as of January 14, 2014, by and between The ServiceMaster Company, LLC and TruGreen Limited Partnership, is incorporated by reference to Exhibit 2.5 to the Current Report on Form 8-K of The ServiceMaster Company, LLC, filed January 17, 2014. |
||
3.1 |
Second Amended and Restated Certificate of Incorporation of ServiceMaster Global Holdings, Inc., is incorporated by reference to Exhibit 3.1 to the Registration Statement on Form S-8 of ServiceMaster Global Holdings, Inc., filed July 1, 2014. |
||
E-1
| Exhibit Number |
Description | ||
|---|---|---|---|
| 3.2 | Second Amended and Restated By-Laws of ServiceMaster Global Holdings, Inc., is incorporated by reference to Exhibit 3.2 to the Registration Statement on Form S-8 of ServiceMaster Global Holdings, Inc., filed July 1, 2014. | ||
4.1 |
Indenture, dated as of August 15, 1997, between The ServiceMaster Company (as successor to ServiceMaster Limited Partnership and The ServiceMaster Company Limited Partnership) and the Harris Trust and Savings Bank, as trustee, is incorporated by reference to Exhibit 4.1 to the Registration Statement on Form S-3 of The ServiceMaster Company, filed August 6, 1997. |
||
4.2 |
First Supplemental Indenture dated as of August 15, 1997 between The ServiceMaster Company (as successor to ServiceMaster Limited Partnership and The ServiceMaster Company Limited Partnership) and the Harris Trust and Savings Bank, as trustee, is incorporated by reference to Exhibit 4.4 to the Annual Report on Form 10-K for the year ended December 31, 1997 of The ServiceMaster Company, filed March 27, 1998. |
||
4.3 |
Second Supplemental Indenture dated as of January 1, 1998 between The ServiceMaster Company and the Harris Trust and Savings Bank, as trustee, is incorporated by reference to Exhibit 2 to the Current Report on Form 8-K of The ServiceMaster Company, filed February 26, 1998. |
||
4.4 |
Third Supplemental Indenture dated as of March 2, 1998 between The ServiceMaster Company and the Harris Trust and Savings Bank, as trustee, is incorporated by reference to Exhibit 4.3 to the Current Report on Form 8-K of the ServiceMaster Company, filed February 27, 1998. |
||
4.5 |
Fourth Supplemental Indenture dated as of August 10, 1999 between The ServiceMaster Company and the Harris Trust and Savings Bank, as trustee, is incorporated by reference to Exhibit 3 to the Current Report on Form 8-K filed of The ServiceMaster Company, filed August 16, 1999. |
||
4.6 |
Fifth Supplemental Indenture, dated as of January 14, 2014, among The ServiceMaster Company, LLC and The Bank of New York Mellon Trust Company, N.A. (as successor to Harris Trust and Savings Bank), as Trustee is incorporated by reference to Exhibit 4.3 to the Current Report on Form 8-K of The ServiceMaster Company, LLC, filed January 17, 2014. |
||
4.7 |
Form of 7.45% Note due August 14, 2027 is incorporated by reference to Exhibit 4.2 to the Registration Statement on Form S-3 of The ServiceMaster Company, filed August 6, 1997. |
||
4.8 |
Form of 7.10% Note due March 1, 2018 is incorporated by reference to Exhibit 4.1 to the Current Report on Form 8-K of the ServiceMaster Company, filed February 27, 1998. |
||
4.9 |
Form of 7.25% Note due March 1, 2038 is incorporated by reference to Exhibit 4.2 to the Current Report on Form 8-K of the ServiceMaster Company, filed February 27, 1998. |
||
4.10 |
Indenture, dated as of February 13, 2012, among The ServiceMaster Company, the Subsidiary Guarantors named therein and Wilmington Trust, National Association, as Trustee, is incorporated by reference to Exhibit 4.1 to the Current Report on Form 8-K of The ServiceMaster Company, filed February 14, 2012. |
||
E-2
| Exhibit Number |
Description | ||
|---|---|---|---|
| 4.11 | First Supplemental Indenture, dated as of February 13, 2012, among The ServiceMaster Company, the Subsidiary Guarantors named therein and Wilmington Trust, National Association, as Trustee, is incorporated by reference to Exhibit 4.2 to the Current Report on Form 8-K of The ServiceMaster Company, filed February 14, 2012. | ||
4.12 |
Second Supplemental Indenture, dated as of February 16, 2012, among The ServiceMaster Company, the Subsidiary Guarantors named therein and Wilmington Trust, National Association, as Trustee, is incorporated by reference to Exhibit 4.1 to the Current Report on Form 8-K of The ServiceMaster Company, filed February 16, 2012. |
||
4.13 |
Third Supplemental Indenture, dated as of August 21, 2012, among The ServiceMaster Company, the Subsidiary Guarantors named therein and Wilmington Trust, National Association, as Trustee, is incorporated by reference to Exhibit 4.1 to the Current Report on Form 8-K of The ServiceMaster Company, filed August 21, 2012. |
||
4.14 |
Fourth Supplemental Indenture, dated as January 14, 2014, among The ServiceMaster Company, LLC, the Subsidiary Guarantors named therein and Wilmington Trust, National Association, as Trustee is incorporated by reference to Exhibit 4.1 to the Current Report on Form 8-K of The ServiceMaster Company, LLC, filed January 17, 2014. |
||
4.15 |
Fifth Supplemental Indenture, dated as January 14, 2014, among The ServiceMaster Company, LLC, the Subsidiary Guarantors named therein and Wilmington Trust, National Association, as Trustee is incorporated by reference to Exhibit 4.2 to the Current Report on Form 8-K of The ServiceMaster Company, LLC, filed January 17, 2014. |
||
4.16 |
Form of 8% Senior Note maturing in 2020 is incorporated by reference to Exhibit 4.1 to the Current Report on Form 8-K of The ServiceMaster Company, filed February 14, 2012. |
||
4.17 |
Form of 7% Senior Note maturing in 2020 is incorporated by reference to Exhibit 4.1 to the Current Report on Form 8-K of The ServiceMaster Company, filed February 14, 2012. |
||
4.18 |
Form of Common Stock Certificate is incorporated by reference to Exhibit 4.18 to the Registration Statement on Form S-1 of ServiceMaster Global Holdings, Inc., filed June 19, 2014. |
||
5.1 |
* |
Form of Opinion of Debevoise & Plimpton LLP. |
|
10.1 |
Credit Agreement, dated as of July 1, 2014, among The ServiceMaster Company, LLC, the several banks and other financial institutions from time to time party thereto, JPMorgan Chase Bank, as administrative agent and collateral agent for the lenders party thereto, and the other parties thereto, is incorporated by reference to Exhibit 10.1 to the Current Report on Form 8-K of ServiceMaster Global Holdings, Inc. and the ServiceMaster Company, LLC filed July 2, 2014. |
||
10.2 |
Guarantee and Collateral Agreement, dated as of July 1, 2014 among The ServiceMaster Company, LLC, the Guarantors named therein, in favor of JPMorgan Chase Bank, as administrative agent and collateral agent for the banks and other financial institutions from time to time parties to the Credit Agreement, is incorporated by reference to Exhibit 10.2 to the Current Report on Form 8-K of ServiceMaster Global Holdings, Inc. and the ServiceMaster Company, LLC filed July 2, 2014. |
||
E-3
| Exhibit Number |
Description | ||
|---|---|---|---|
| 10.3 | Term Loan Credit Agreement, dated as of July 24, 2007, among CDRSVM Acquisition Co., Inc., certain other Loan Parties (as defined therein), the lenders party thereto, and Citibank, N.A., as administrative agent (in such capacity, the "Term Loan Administrative Agent") and collateral agent (in such capacity, the "Term Loan Collateral Agent") and letter of credit facility issuing bank and JPMorgan Chase Bank, N.A., as syndication agent is incorporated by reference to Exhibit 10.1 to the Current Report on Form 8-K of The ServiceMaster Company, filed July 30, 2007. | ||
10.4 |
Term Loan Assumption Agreement, dated as of July 24, 2007, between CDRSVM Acquisition Co., Inc. and The ServiceMaster Company is incorporated by reference to Exhibit 10.2 to the Current Report on Form 8-K of The ServiceMaster Company, filed July 30, 2007. |
||
10.5 |
Term Loan Amendment Letter, dated as of July 30, 2007, among The ServiceMaster Company, the Commitment Letter Lenders and Joint Lead Arrangers (each as defined therein) parties thereto, and the other parties thereto is incorporated by reference to Exhibit 10.5 to the Current Report on Form 8-K of The ServiceMaster Company, filed July 30, 2007. |
||
10.6 |
Term Loan Supplemental Agreement, dated as of August 13, 2008, made by TruGreen Companies L.L.C. in favor of CitiBank, N.A. is incorporated by reference to Exhibit 10.34 to the Registration Statement on Form S-1 of The ServiceMaster Company, filed October 22, 2008. |
||
10.7 |
Amendment No. 1 to the Credit Agreement, dated as of August 22, 2012, among the The ServiceMaster Company, certain other loan parties, the lenders thereto and Citibank, N.A., as administrative agent and collateral agent and JPMorgan Chase Bank, N.A. as syndication agent, is incorporated by reference to Exhibit 10.1 to the Current Report on Form 8-K of The ServiceMaster Company, filed August 22, 2012. |
||
10.8 |
Amendment No. 2 to the Credit Agreement, dated as of February 22, 2013, among the The ServiceMaster Company, certain other loan parties, the lenders thereto and Citibank, N.A., as administrative agent and collateral agent is incorporated by reference to Exhibit 10.1 to the Current Report on Form 8-K of The ServiceMaster Company, filed February 25, 2013. |
||
10.9 |
Term Loan Credit Agreement Joinder Agreement, dated as of January 14, 2014, among The ServiceMaster Company, The ServiceMaster Company, LLC, Citibank, N.A., as administrative agent, and the other parties thereto is incorporated by reference to Exhibit 10.1 to the Current Report on Form 8-K of The ServiceMaster Company, LLC, filed January 17, 2014. |
||
10.10 |
Assumption Agreement, dated as of January 14, 2014, by SMCS Holdco, Inc. and SMCS Holdco II, Inc., in favor of Citibank, N.A., as administrative agent and collateral agent for the banks and other financial institutions from time to time parties to the Credit Agreement referred to therein and the other Secured Parties (as defined therein) is incorporated by reference to Exhibit 10.3 to the Current Report on Form 8-K of The ServiceMaster Company, LLC, filed January 17, 2014. |
||
E-4
| Exhibit Number |
Description | ||
|---|---|---|---|
| 10.11 | Guarantee and Collateral Agreement, dated as of July 24, 2007, made by the Company and the other Granting Parties (as defined therein), in favor of the Term Loan Administrative Agent and the Term Loan Collateral Agent is incorporated by reference to Exhibit 10.3 to the Current Report on Form 8-K of The ServiceMaster Company, filed July 30, 2007. | ||
10.12 |
Security Agreement, dated as of July 24, 2007, made by The ServiceMaster Company and ServiceMaster Consumer Services Limited Partnership, in favor of the Term Loan Collateral Agent and Term Loan Administrative Agent is incorporated by reference to Exhibit 10.4 to the Current Report on Form 8-K of The ServiceMaster Company, filed July 30, 2007. |
||
10.13 |
Revolving Credit Agreement, dated as of July 24, 2007, among The ServiceMaster Company, certain other Loan Parties (as defined therein), the lenders party thereto, and Citibank, N.A., as administrative agent (in such capacity, the "Revolving Administrative Agent"), collateral agent (in such capacity, the "Revolving Collateral Agent") and issuing bank and JPMorgan Chase Bank, N.A., as syndication agent is incorporated by reference to Exhibit 10.6 to the Current Report on Form 8-K of The ServiceMaster Company, filed July 30, 2007. |
||
10.14 |
Revolving Credit Supplemental Agreement, dated as of August 13, 2008, made by TruGreen Companies L.L.C. in favor of CitiBank, N.A. is incorporated by reference to Exhibit 10.37 to the Registration Statement on Form S-1 of The ServiceMaster Company, filed October 22, 2008. |
||
10.15 |
Amendment No. 1 to Revolving Credit Agreement, dated as of February 2, 2011, among The ServiceMaster Company, certain other loan parties, the lenders thereto and Citibank, N.A., as administrative agent and collateral agent, is incorporated by reference to Exhibit 10.13 to the Annual Report on Form 10-K for the year ended December 31, 2010 of The ServiceMaster Company, filed March 28, 2011. |
||
10.16 |
Extension Amendment No. 1 to Revolving Credit Agreement, dated as of January 30, 2012, among The ServiceMaster Company, certain other loan parties, the lenders thereto and Citibank, N.A., as administrative agent and collateral agent, is incorporated by reference to Exhibit 10.1 to the Current Report on Form 8-K of The ServiceMaster Company, filed February 14, 2012. |
||
10.17 |
Increase Supplement, dated as of January 30, 2012, between JPMorgan Chase Bank, N.A., as increasing lender, and The ServiceMaster Company is incorporated by reference to Exhibit 10.2 to the Current Report on Form 8-K of The ServiceMaster Company, filed February 14, 2012. |
||
10.18 |
Amendment No. 3 to Revolving Credit Agreement, dated November 27, 2013 and effective as of January 14, 2014, among The ServiceMaster Company, certain other loan parties, the lenders thereto and Citibank, N.A., as administrative agent and collateral agent, is incorporated by reference to Exhibit 10.16 to the Annual Report on Form 10-K for the year ended December 31, 2013 of The ServiceMaster Company, LLC, filed March 5, 2014. |
||
E-5
| Exhibit Number |
Description | ||
|---|---|---|---|
| 10.19 | Revolving Credit Agreement Joinder Agreement, dated as of January 14, 2014, among The ServiceMaster Company, The ServiceMaster Company, LLC, Citibank, N.A., as administrative agent, and the other parties thereto is incorporated by reference to Exhibit 10.2 to the Current Report on Form 8-K of The ServiceMaster Company, LLC, filed January 17, 2014. | ||
10.20 |
Assumption Agreement, dated as of January 14, 2014, by SMCS Holdco, Inc. and SMCS Holdco II, Inc., in favor of Citibank, N.A., as administrative agent and collateral agent for the banks and other financial institutions from time to time parties to the Revolving Credit Agreement referred to therein and the other Secured Parties (as defined therein) is incorporated by reference to Exhibit 10.4 to the Current Report on Form 8-K of The ServiceMaster Company, LLC, filed January 17, 2014. |
||
10.21 |
Intercreditor Agreement, dated as of July 24, 2007, between the Revolving Administrative Agent and Revolving Collateral Agent and the Term Loan Administrative Agent and Term Loan Collateral Agent is incorporated by reference to Exhibit 10.15 to the Current Report on Form 8-K of The ServiceMaster Company, filed July 30, 2007. |
||
10.22 |
Guarantee and Collateral Agreement, dated as of July 24, 2007, made by The ServiceMaster Company and the other Granting Parties (as defined therein), in favor of the Revolving Collateral Agent and the Revolving Administrative Agent is incorporated by reference to Exhibit 10.7 to the Current Report on Form 8-K of The ServiceMaster Company, filed July 30, 2007. |
||
10.23 |
Security Agreement, dated as of July 24, 2007, made by The ServiceMaster Company and ServiceMaster Consumer Services Limited Partnership, in favor of the Revolving Collateral Agent and Revolving Administrative Agent is incorporated by reference to Exhibit 10.8 to the Current Report on Form 8-K of The ServiceMaster Company, filed July 30, 2007. |
||
10.24 |
Amended and Restated Consulting Agreement, dated as of November 23, 2009, among The ServiceMaster Company; ServiceMaster Global Holdings, Inc.; and Clayton, Dubilier & Rice, LLC is incorporated by reference to Exhibit 10.10 to the Annual Report on Form 10-K for the year ended December 31, 2009 of The ServiceMaster Company, filed March 30, 2010. |
||
10.25 |
Form of Consulting Agreement entered into among The ServiceMaster Company; ServiceMaster Global Holdings, Inc.; Citigroup Alternative Investments LLC (assigned to StepStone Group LLC in 2010); BAS Capital Funding Corporation; and JPMorgan Chase is incorporated by reference to Exhibit 10.1 to the Quarterly Report on Form 10-Q for the quarter ended June 30, 2009 of The ServiceMaster Company, filed August 14, 2009. |
||
10.26 |
Amendment to Consulting Agreement, dated December 22, 2011, by and among The ServiceMaster Company, ServiceMaster Global Holdings, Inc. and BAS Capital Funding Corporation is incorporated by reference to Exhibit 10.2 to the Current Report on Form 8-K of The ServiceMaster Company, filed December 23, 2011. |
||
E-6
| Exhibit Number |
Description | ||
|---|---|---|---|
| 10.27 | Amended and Restated Indemnification Agreement, dated as of November 23, 2009, among The ServiceMaster Company; ServiceMaster Global Holdings, Inc.; Clayton, Dubilier & Rice, Inc.; Clayton, Dubilier & Rice Fund VII, L.P.; Clayton, Dubilier & Rice Fund VII (Co-Investment), L.P.; CDR SVM Co-Investor L.P.; CD&R Parallel Fund VII, L.P.; Clayton, Dubilier & Rice, LLC; and Clayton, Dubilier & Rice Holdings, L.P is incorporated by reference to Exhibit 10.11 to the Annual Report on Form 10-K for the year ended December 31, 2009 of The ServiceMaster Company, filed March 30, 2010. | ||
10.28 |
Amended and Restated Indemnification Agreement, dated as of March 19, 2010, among The ServiceMaster Company and ServiceMaster Global Holdings, Inc. and Banc of America Capital Investors V, L.P., BAS Capital Funding Corporation, BACSVM, L.P., Banc of America Strategic Investments Corporation, Banc of America Capital Management V, L.P., BACM I GP, LLC and BA Equity Co-Invest GP LLC is incorporated by reference to Exhibit 10.12 to the Annual Report on Form 10-K for the year ended December 31, 2009 of The ServiceMaster Company, filed March 30, 2010. |
||
10.29 |
Amended and Restated Indemnification Agreement, dated as of March 19, 2010, among The ServiceMaster Company and ServiceMaster Global Holdings, Inc. and Citigroup Capital Partners II 2007 Citigroup Investment, L.P., Citigroup Capital Partners II Employee Master Fund, L.P., Citigroup Capital Partners II Onshore, L.P., Citigroup Capital Partners II Cayman Holdings, L.P., CPE Co-Investment (ServiceMaster) LLC and Citigroup Private Equity LP is incorporated by reference to Exhibit 10.13 to the Annual Report on Form 10-K for the year ended December 31, 2009 of The ServiceMaster Company, filed March 30, 2010. |
||
10.30 |
Amended and Restated Indemnification Agreement, dated as of March 19, 2010, among The ServiceMaster Company and ServiceMaster Global Holdings, Inc. and JP Morgan Chase Funding, Inc. is incorporated by reference to Exhibit 10.14 to the Annual Report on Form 10-K for the year ended December 31, 2009 of The ServiceMaster Company, filed March 30, 2010. |
||
10.31 |
# |
Employment Agreement, dated as of June 14, 2013, by and between Robert J. Gillette and ServiceMaster Global Holdings, Inc. is incorporated by reference to Exhibit 10.1 to the Current Report on Form 8-K of The ServiceMaster Company, filed on June 18, 2013. |
|
10.32 |
# |
Amendment No. 1 to Employment Agreement, dated as of August 13, 2013, by and between Robert J. Gillette and ServiceMaster Global Holdings, Inc. is incorporated by reference to Exhibit 10.4 to the Quarterly Report on Form 10-Q for the quarter ended June 30, 2013 of the ServiceMaster Company, filed August 14, 2013. |
|
10.33 |
# |
Amendment No. 2 to Employment Agreement, dated as of February 28, 2014, by and between Robert J. Gillette and ServiceMaster Global Holdings, Inc. is incorporated by reference to Exhibit 10.33 to the Annual Report on Form 10-K for the year ended December 31, 2013 of The ServiceMaster Company, LLC, filed March 5, 2014. |
|
10.34 |
# |
Offer Letter, dated October 14, 2013, by and between William J. Derwin and The ServiceMaster Company is incorporated by reference to Exhibit 10.37 to the Annual Report on Form 10-K for the year ended December 31, 2013 of The ServiceMaster Company, LLC, filed March 5, 2014. |
|
10.35 |
# |
Severance Agreement, dated as of August 26, 2013, by and between Alan J. M. Haughie and The ServiceMaster Company is incorporated by reference to Exhibit 10.2 to the Current Report on Form 8-K of The ServiceMaster Company, filed on August 29, 2013. |
|
E-7
| Exhibit Number |
Description | ||
|---|---|---|---|
| 10.36 | # | Severance Agreement dated as of November 11, 2013, between The ServiceMaster Company and William J. Derwin is incorporated by reference to Exhibit 10.46 to the Annual Report on Form 10-K for the year ended December 31, 2013 of The ServiceMaster Company, LLC, filed March 5, 2014. | |
10.37 |
# |
Amended and Restated ServiceMaster Global Holdings, Inc. Stock Incentive Plan, as amended as of October 25, 2012 (the "MSIP"), is incorporated by reference to Exhibit 10 to the Current Report on Form 8-K of The ServiceMaster Company, filed October 26, 2012. |
|
10.38 |
# |
Form of Employee Stock Subscription Agreement under the MSIP is incorporated by reference to Exhibit 10.31 to the Annual Report on Form 10-K for the year ended December 31, 2007 of The ServiceMaster Company, filed March 28, 2008. |
|
10.39 |
# |
Form of Employee Stock Option Agreement under the MSIP is incorporated by reference to Exhibit 10.32 to the Annual Report on Form 10-K for the year ended December 31, 2007 of The ServiceMaster Company, filed March 28, 2008. |
|
10.40 |
# |
Form of Employee Deferred Share Unit Agreement under the MSIP is incorporated by reference to Exhibit 10.33 to the Annual Report on Form 10-K for the year ended December 31, 2007 of The ServiceMaster Company, filed March 28, 2008. |
|
10.41 |
# |
Form of Participation Agreement under the MSIP is incorporated by reference to Exhibit 10.34 to the Annual Report on Form 10-K for the year ended December 31, 2007 of The ServiceMaster Company, filed March 28, 2008. |
|
10.42 |
# |
Form of Employee Stock Subscription Agreement under the MSIP related to stock option exercises is incorporated by reference to Exhibit 10 to the Quarterly Report on Form 10-Q for the quarter ended March 31, 2010 of The ServiceMaster Company, filed May 13, 2010. |
|
10.43 |
# |
Form of Employee Restricted Stock Unit Agreement under the MSIP is incorporated by reference to Exhibit 10.3 to the Quarterly Report on Form 10-Q for the quarter ended September 30, 2010 of The ServiceMaster Company, filed November 15, 2010. |
|
10.44 |
# |
Form of Employee Performance Restricted Stock Unit Agreement under the MSIP is incorporated by reference to Exhibit 10.44 of the Annual Report on Form 10-K for the year ended December 31, 2012 of The ServiceMaster Company, filed March 4, 2013. |
|
10.45 |
# |
Form of Employee Stock Subscription Agreement for Robert J. Gillette is incorporated by reference to Exhibit 10.2 to the Current Report on Form 8-K of The ServiceMaster Company, filed on June 18, 2013. |
|
10.46 |
# |
Form of Employee Restricted Stock Unit Agreement for Robert J. Gillette is incorporated by reference to Exhibit 10.3 to the Current Report on Form 8-K of The ServiceMaster Company, filed on June 18, 2013. |
|
10.47 |
# |
Form of Employee Stock Option Agreement for Robert J. Gillette is incorporated by reference to Exhibit 10.4 to the Current Report on Form 8-K of The ServiceMaster Company, filed on June 18, 2013. |
|
10.48 |
# |
Director Stock Subscription Agreement for John Krenicki, Jr. dated December 11, 2013 is incorporated by reference to Exhibit 10.59 to the Annual Report on Form 10-K for the year ended December 31, 2013 of The ServiceMaster Company, LLC, filed March 5, 2014. |
|
E-8
| Exhibit Number |
Description | ||
|---|---|---|---|
| 10.49 | Amended and Restated Registration Rights Agreement, dated as of June 26, 2014, among ServiceMaster Global Holdings, Inc. and the Stockholders party thereto is incorporated by reference to Exhibit 10.4 to the Current Report on Form 8-K of ServiceMaster Global Holdings, Inc. and the ServiceMaster Company, LLC filed July 2, 2014. | ||
10.50 |
Second Amended and Restated Stockholders Agreement, dated as of June 26, 2014, among ServiceMaster Global Holdings, Inc. and the Stockholders party thereto is incorporated by reference to Exhibit 10.3 to the Current Report on Form 8-K of ServiceMaster Global Holdings, Inc. and the ServiceMaster Company, LLC filed July 2, 2014. |
||
10.51 |
Amendment No. 2 to Consulting Agreement, dated as of March 21, 2014, among The ServiceMaster Company, LLC, ServiceMaster Global Holdings, Inc., BAS Capital Funding Corporation and Ridgemont Partners Management, LLC is incorporated by reference to Exhibit 10.3 to the Quarterly Report on Form 10-Q for the quarter ended March 31, 2014 of The ServiceMaster Company, LLC, filed May 2, 2014. |
||
10.52 |
Termination of Indemnification Agreement, dated as of March 21, 2014, by Banc of America Capital Investors V, L.P., BAS Capital Funding Corporation, BACSVM, L.P., Banc of America Strategic Investments Corporation, Banc of America Capital Management V, L.P., BACM I GP, LLC and BA Equity Co-Invest GP LLC is incorporated by reference to Exhibit 10.1 to the Quarterly Report on Form 10-Q for the quarter ended March 31, 2014 of The ServiceMaster Company, LLC, filed May 2, 2014. |
||
10.53 |
Consulting Agreement, dated March 21, 2014, among The ServiceMaster Company, LLC, ServiceMaster Global Holdings, Inc. and Ridgemont Partners Management, LLC is incorporated by reference to Exhibit 10.4 to the Quarterly Report on Form 10-Q for the quarter ended March 31, 2014 of The ServiceMaster Company, LLC, filed May 2, 2014. |
||
10.54 |
Indemnification Agreement, dated as of March 21, 2014, among The ServiceMaster Company, LLC, ServiceMaster Global Holdings, Inc. and Ridgemont Partners Management, LLC is incorporated by reference to Exhibit 10.2 to the Quarterly Report on Form 10-Q for the quarter ended March 31, 2014 of The ServiceMaster Company, LLC, filed May 2, 2014. |
||
10.55 |
# |
Employee Stock Option Agreement for Mark J. Barry, dated as of March 18, 2014 is incorporated by reference to Exhibit 10.5 to the Quarterly Report on Form 10-Q for the quarter ended March 31, 2014 of The ServiceMaster Company, LLC, filed May 2, 2014. |
|
10.56 |
Form of Director Indemnification Agreement is incorporated by reference to Exhibit 10.71 to the Registration Statement on Form S-1 of ServiceMaster Global Holdings, Inc., filed June 19, 2014. |
||
10.56.1 |
** |
Schedule of Signatories to a Director Indemnification Agreement. |
|
10.57 |
# |
ServiceMaster Global Holdings, Inc. 2014 Omnibus Incentive Plan is incorporated by reference to Exhibit 10.73 to the Registration Statement on Form S-1 of ServiceMaster Global Holdings, Inc., filed June 19, 2014. |
|
10.58 |
# |
ServiceMaster Global Holdings, Inc. Executive Annual Bonus Plan is incorporated by reference to Exhibit 10.74 to the Registration Statement on Form S-1 of ServiceMaster Global Holdings, Inc., filed June 16, 2014. |
|
E-9
| Exhibit Number |
Description | ||
|---|---|---|---|
| 10.59 | # | ServiceMaster Deferred Compensation Plan is incorporated by reference to Exhibit 10.75 to the Registration Statement on Form S-1 of ServiceMaster Global Holdings, Inc., filed June 16, 2014. | |
10.60 |
# |
Form of Director Restricted Stock Agreement is incorporated by reference to Exhibit 10.76 to the Registration Statement on Form S-1 of ServiceMaster Global Holdings, Inc., filed June 16, 2014. |
|
10.61 |
# |
Form of Employee Stock Option Agreement under the ServiceMaster Global Holdings, Inc. 2014 Omnibus Incentive Plan is incorporated by reference to Exhibit 10.77 to the Registration Statement on Form S-1 of ServiceMaster Global Holdings, Inc., filed June 16, 2014. |
|
10.62 |
# |
Form of Employee Restricted Stock Unit Agreement under the ServiceMaster Global Holdings, Inc. 2014 Omnibus Incentive Plan is incorporated by reference to Exhibit 10.78 to the Registration Statement on Form S-1 of ServiceMaster Global Holdings, Inc., filed June 16, 2014. |
|
10.63 |
# |
ServiceMaster Global Holdings, Inc. Directors' Deferred Compensation Plan is incorporated by reference to Exhibit 10.79 to the Registration Statement on Form S-1 of ServiceMaster Global Holdings, Inc., filed June 16, 2014. |
|
10.64 |
# |
Form of Director Restricted Stock Agreement under the ServiceMaster Global Holdings, Inc. 2014 Omnibus Incentive Plan is incorporated by reference to Exhibit 10.90 to the Registration Statement on Form S-1 of ServiceMaster Global Holdings, Inc., filed June 16, 2014. |
|
10.65 |
Termination Agreement between ServiceMaster Global Holdings, Inc., The ServiceMaster Company, LLC and Clayton, Dubilier & Rice, LLC is incorporated by reference to Exhibit 10.81 to the Registration Statement on Form S-1 of ServiceMaster Global Holdings, Inc., filed June 19, 2014. |
||
10.66 |
Termination Agreement between ServiceMaster Global Holdings, Inc., The ServiceMaster Company, LLC and StepStone Group LLC is incorporated by reference to Exhibit 10.82 to the Registration Statement on Form S-1 of ServiceMaster Global Holdings, Inc., filed June 19, 2014. |
||
10.67 |
Termination Agreement between ServiceMaster Global Holdings, Inc., The ServiceMaster Company, LLC and JPMorgan Chase Funding, Inc. is incorporated by reference to Exhibit 10.83 to the Registration Statement on Form S-1 of ServiceMaster Global Holdings, Inc., filed June 19, 2014. |
||
10.68 |
Termination Agreement between ServiceMaster Global Holdings, Inc., The ServiceMaster Company, LLC and Ridgemont Partners Management, LLC is incorporated by reference to Exhibit 10.84 to the Registration Statement on Form S-1 of ServiceMaster Global Holdings, Inc., filed June 19, 2014. |
||
10.69 |
#** |
Offer Letter, dated December 13, 2013, by and between Susan K. Hunsberger and The ServiceMaster Company. |
|
21.1 |
** |
List of Subsidiaries as of January 15, 2015. |
|
23.1 |
* |
Consent of Deloitte & Touche LLP. |
|
23.2 |
* |
Consent of Debevoise & Plimpton LLP (included in Exhibit 5.1 hereto). |
|
E-10
| Exhibit Number |
Description | ||
|---|---|---|---|
| 24.1 | ** | Powers of Attorney (contained on signature pages to the Registration Statement on Form S-1). | |
101.INS |
**† |
XBRL Instance Document |
|
101.SCH |
**† |
XBRL Taxonomy Extension |
|
101.CAL |
**† |
XBRL Taxonomy Extension Calculation Linkbase |
|
101.DEF |
**† |
XBRL Taxonomy Extensive Definition Linkbase |
|
101.LAB |
**† |
XBRL Taxonomy Extension Label Linkbase |
|
101.PRE |
**† |
XBRL Extension Presentation Linkbase |
|
- #
- Denotes
management contract or compensatory plan or arrangement.
- *
- Filed
herewith.
- **
- Previously
filed.
- †
- XBRL (eXtensible Business Reporting Language) information is furnished and not filed for purposes of Sections 11 and 12 of the Securities Act of 1933, as amended, and Section 18 of the Securities Exchange Act of 1934, as amended.
E-11