Attached files
| file | filename |
|---|---|
| EX-32.2 - EX-32.2 - TERMINIX GLOBAL HOLDINGS INC | serv-20171231xex32_2.htm |
| EX-32.1 - EX-32.1 - TERMINIX GLOBAL HOLDINGS INC | serv-20171231xex32_1.htm |
| EX-31.2 - EX-31.2 - TERMINIX GLOBAL HOLDINGS INC | serv-20171231xex31_2.htm |
| EX-31.1 - EX-31.1 - TERMINIX GLOBAL HOLDINGS INC | serv-20171231xex31_1.htm |
| EX-23 - EX-23 - TERMINIX GLOBAL HOLDINGS INC | serv-20171231xex23.htm |
| EX-21 - EX-21 - TERMINIX GLOBAL HOLDINGS INC | serv-20171231xex21.htm |
| EX-12 - EX-12 - TERMINIX GLOBAL HOLDINGS INC | serv-20171231xex12.htm |
| EX-10.41 - EX-10.41 - TERMINIX GLOBAL HOLDINGS INC | serv-20171231xex10_41.htm |
| EX-10.17 - EX-10.17 - TERMINIX GLOBAL HOLDINGS INC | serv-20171231xex10_17.htm |
UNITED STATES
SECURITIES AND EXCHANGE COMMISSION
WASHINGTON, D.C. 20549
________________________________________________
FORM 10-K
________________________________________________
|
☒ |
ANNUAL REPORT PURSUANT TO SECTION 13 OR 15(d) OF THE SECURITIES EXCHANGE ACT OF 1934 |
For the fiscal year ended December 31, 2017
or
|
☐ |
TRANSITION REPORT PURSUANT TO SECTION 13 OR 15(d) OF THE SECURITIES EXCHANGE ACT OF 1934 |
Commission file number 001-36507
________________________________________________
ServiceMaster Global Holdings, Inc.
(Exact name of registrant as specified in its charter)
|
Delaware |
|
20-8738320 |
|
(State or other jurisdiction of incorporation or organization) |
|
(IRS Employer Identification No.) |
860 Ridge Lake Boulevard, Memphis, Tennessee 38120
(Address of principal executive offices) (Zip Code)
901-597-1400
(Registrant’s telephone number, including area code)
Securities registered pursuant to Section 12 (b) of the Act:
|
Common stock, par value $0.01 per share |
|
New York Stock Exchange |
|
(Title of Each Class) |
|
(Name of Each Exchange on which Registered) |
Securities registered pursuant to Section 12 (g) of the Act:
|
|
|
None |
|
|
|
|
(Title of class) |
Indicate by check mark if the registrant is a well-known seasoned issuer, as defined in Rule 405 of the Securities Act. Yes ☒ No ☐
Indicate by check mark if the registrant is not required to file reports pursuant to Section 13 or Section 15(d) of the Act. Yes ☐ No ☒
Indicate by check mark whether the registrant (1) has filed all reports required to be filed by Section 13 or 15(d) of the Securities Exchange Act of 1934 during the preceding 12 months (or for such shorter period that the registrant was required to file such reports), and (2) has been subject to such filing requirements for the past 90 days.
|
|
Yes ☒ No ☐ |
Indicate by check mark whether the registrant has submitted electronically and posted on its corporate Web site, if any, every Interactive Data File required to be submitted and posted pursuant to Rule 405 of Regulation S-T during the preceding 12 months (or for such shorter period that the registrant was required to submit and post such files).
|
|
Yes ☒ No ☐ |
Indicate by check mark if disclosure of delinquent filers pursuant to Item 405 of Regulation S-K is not contained herein, and will not be contained, to the best of the registrant’s knowledge, in definitive proxy or information statements incorporated by reference in Part III of this Form 10-K or any amendment to this Form 10-K. ☒
1
Indicate by check mark whether the registrant is a large accelerated filer, an accelerated filer, a non-accelerated filer, smaller reporting company, or an emerging growth company. See the definitions of “large accelerated filer,” “accelerated filer,” “smaller reporting company,” and “emerging growth company” in Rule 12b-2 of the Exchange Act.
|
|
|
|
|
||||
|
Large accelerated filer ☒ |
Accelerated filer ☐ |
Non-accelerated filer ☐ |
Smaller reporting company ☐ |
||||
|
|
(Do not check if a smaller reporting company) |
Emerging growth company ☐ |
|||||
If an emerging growth company, indicate by check mark if the registrant has elected not to use the extended transition period for complying with any new or revised financial accounting standards provided pursuant to Section 13(a) of the Exchange Act.
|
|
Yes ☐ No ☒ |
Indicate by check mark whether the Registrant is a shell company (as defined in Rule 12b-2 of the Act). Yes ☐ No ☒
As of June 30, 2017, there were 133,431,298 shares of the registrant’s common stock outstanding, and the aggregate market value of the voting stock held by non-affiliates (assuming only for purposes of this computation that individuals then serving as our directors and executive officers may be affiliates) was approximately $5,220 million based on the closing price of common stock on the NYSE on June 30, 2017 of $39.19 per share.
The number of shares of the registrant’s common stock outstanding as of February 23, 2018: 135,267,377 shares of common stock, par value $0.01 per share.
Documents incorporated by reference:
Portions of the registrant’s proxy statement to be filed with the Securities and Exchange Commission in connection with the registrant’s 2018 annual meeting of stockholders (the “Proxy Statement”) are incorporated by reference into Part III hereof. Such Proxy Statement will be filed within 120 days of the registrant’s fiscal year ended December 31, 2017.
2
3
The following discussion of our business contains “forward-looking statements,” as discussed in Part II, Item 7 below. Our business, operations and financial condition are subject to various risks as set forth in Part I, Item 1A below. The following information should be read in conjunction with Management’s Discussion and Analysis of Financial Condition and Results of Operations, the Consolidated Financial Statements and related notes and the Risk Factors included elsewhere in this Annual Report on Form 10-K.
Overview
ServiceMaster Global Holdings, Inc. and its majority-owned subsidiary partnerships, limited liability companies and corporations (collectively, “ServiceMaster,” the “Company,” “we,” “us” and “our”) is a leading provider of essential residential and commercial services, operating through an extensive service network of more than 8,000 company‑owned locations and franchise and license agreements. Our mission is to simplify and improve the quality of our customers’ lives by delivering services that help them protect and maintain their homes or businesses, typically their most highly valued assets. We have leading positions across the majority of the segments we serve, as measured by customer‑level revenue. Our portfolio of well‑recognized brands includes Terminix (residential and commercial termite and pest control), American Home Shield (home service plans), ServiceMaster Restore (disaster restoration), ServiceMaster Clean (janitorial), Merry Maids (residential cleaning), Furniture Medic (cabinet and wood furniture repair) and AmeriSpec (home inspection). Our strategy is to provide a differentiated service offering by promoting convenient service through the increasing use of our digital and mobile platform. We serve our residential and commercial customers through an employee base of approximately 13,000 company associates, 15,000 independent home service contractor firms and an estimated 34,000 employees of licensed franchisors.
On July 26, 2017, we announced that we intend to separate our American Home Shield business from our Terminix and Franchise Services Group businesses by means of a spin-off of the American Home Shield business to Company stockholders, resulting in two publicly traded companies. The spin-off would create two independent companies, each with an enhanced strategic focus, simplified operating structure, distinct investment identity and strong financial profile. The transaction is expected to be completed in the third quarter of 2018, subject to satisfaction of customary conditions, including the effectiveness of a Registration Statement on Form 10, receipt of a favorable ruling from the IRS concerning certain tax matters and final approval by our board of directors, and it is intended to qualify as a tax-free distribution to our stockholders for U.S. federal income tax purposes. References in this Annual Report on Form 10-K to the “distribution” refer to the distribution of shares of common stock of the entity formed to hold the American Home Shield business to ServiceMaster stockholders on a pro forma basis.
For the year ended December 31, 2017, we had revenue, net income and Adjusted EBITDA of $2,912 million, $510 million and $678 million, respectively. In 2017, Terminix, our largest segment, represented approximately 53 percent of our revenue, while American Home Shield represented approximately 40 percent of our revenue and Franchise Services Group represented approximately seven percent of our revenue. For a reconciliation of Adjusted EBITDA to net income, see “Selected Historical Financial Data.”
Approximately 98 percent of our 2017 revenue was generated by sales in the United States. A significant portion of our assets is located in the United States, and the consolidated book value of all assets located outside of the United States is not material. Organized in Delaware in 2007, ServiceMaster is the successor to various entities dating back to 1929. Financial information for each reportable segment and Corporate for 2017, 2016 and 2015 is contained in Note 3 to the consolidated financial statements.
We believe that our customers understand the financial and reputational risks associated with inadequate maintenance of their homes or businesses and that our high‑quality, professional services are low‑cost expenditures when compared to the alternative of failing to perform essential maintenance. We strive to be the service provider of choice and believe our customers have recognized our value proposition, as evidenced by our long‑standing customer relationships and the high rate at which our customers renew their contracts from year to year.
We have significant size and scale, which we believe give us a number of competitive advantages. Terminix is one of the largest termite and pest control businesses in the United States, as measured by customer‑level revenue, and serves approximately 2.7 million customers across 47 states and the District of Columbia through approximately 310 company‑owned locations and approximately 95 franchise locations. Additionally, we estimate American Home Shield to be approximately four times larger than its nearest competitor, as measured by revenue. American Home Shield serves approximately two million residential customers across all 50 states and the District of Columbia through a network of more than 15,000 licensed, independent home service contractor firms. Our Franchise Services Group serves both residential and commercial customers across all 50 states and the District of Columbia through approximately 4,500 franchise agreements. We believe our significant size and scale provide a competitive advantage in our purchasing power, route density and marketing and operating efficiencies compared to smaller local and regional competitors. Our scale also facilitates the standardization of processes, shared learning and talent development across our entire organization.
We believe our businesses are strategically positioned to benefit from a number of favorable demographic and secular trends. These trends include growth in population, household formation and new and existing home sales. In addition, we believe there is
4
increasing demand for outsourced services, fueled by a trend toward “do‑it‑for‑me” as a result of an aging population and shifts in household structure and behaviors, such as dual‑income families and consumers with “on‑the‑go” lifestyles.
Our Reportable Segments
Our operations are organized into three reportable segments: Terminix, American Home Shield and the Franchise Services Group (which includes ServiceMaster Restore, ServiceMaster Clean, Merry Maids, Furniture Medic and AmeriSpec).
Terminix
Terminix is a leading provider of residential and commercial termite and pest control services in the United States, with approximately 21 percent share, as measured by customer‑level revenue. Terminix specializes in protection against termite damage, rodents, insects and other pests, including cockroaches, spiders, wood‑destroying ants, ticks, fleas, mosquitos and bed bugs. Our services include termite remediation, annual termite inspection and prevention treatments with termite damage repair guarantees, periodic pest control services, insulation services, crawlspace encapsulation and wildlife exclusion.
For the year ended December 31, 2017, Terminix recorded revenue of $1,541 million and Adjusted EBITDA of $331 million. In 2017, 56 percent of Terminix revenue was generated from pest control services and 39 percent was generated from termite and other services, which includes crawlspace encapsulation, wildlife exclusion and insulation services, with the remaining five percent primarily from the distribution of pest control products. In 2017, 71 percent and 29 percent of pest control revenue was related to residential services and commercial services, respectively, and 92 percent and eight percent of revenue from termite and other services was related to residential and commercial services, respectively.
Approximately 80 percent of Terminix revenue comes from customers who enter into contracts with the option to renew annually. Typically, termite services require an initial inspection and the installation of a protective liquid barrier or bait stations surrounding the home. The protection plan contracts provide a guarantee for the repair of new damage resulting from termite infestation. After the first year, a customer has the option to renew the contract at a significantly reduced cost that extends the guarantee. Consequently, revenue generated from a renewal customer is less then revenue generated from a first-year termite customer.
We believe that the strength of the Terminix brand, along with our history of providing a high level of consistent service, allows us to enjoy a competitive advantage in attracting, retaining and growing our customer base. We believe our investments in systems and processes, such as routing and scheduling optimization, robust reporting capabilities and mobile customer management solutions, enable us to deliver a higher level of customer service when compared to smaller regional and local competitors.
Our focus on attracting and retaining customers begins with our associates in the field, who interact with our customers every day. Our associates bring a strong level of passion and commitment to the Terminix brand, as evidenced by the 10‑year and 8‑year average tenure of our branch managers and technicians, respectively. Our field organization is supported by dedicated customer service and customer care center personnel. Our culture of continuous improvement drives an intense focus on the quality of the services delivered, which we believe produces high levels of customer satisfaction and, ultimately, customer retention and referrals.
The Terminix national branch structure includes approximately 310 company-owned locations and approximately 95 franchise locations, which serve approximately 2.7 million customers in 47 states and the District of Columbia. Terminix’s approximately 9,500 employees made a daily average of 50,000 visits to residential and commercial customer locations during 2017. Terminix also provides termite and pest control services through subsidiaries in Canada, Mexico, the Caribbean and Central America, as well as a joint venture in India. In addition, licensees of Terminix provide these services in Japan, South Korea, Southeast Asia, Central America, the Caribbean and the Middle East. In 2017, substantially all Terminix revenue was generated in the United States, with approximately two percent derived from international markets, with a presence in a total of 19 countries outside the United States through subsidiaries, a joint venture and licensing arrangements. Franchise fees from Terminix franchisees represented less than one percent of Terminix revenue in 2017. We estimate that customer‑level revenue for this segment was $1,880 million for the year ended December 31, 2017. Customer‑level revenue represents the total of our estimate of revenue generated by our franchisees, a portion of which is included in our reported revenue from royalty fees, and revenue generated by our company‑owned operations. More specifically, customer level revenue means: Terminix revenue of $1,541 million, less royalty fees of $10 million, plus estimated sales generated by our franchisees of $349 million.
Terminix Competitive Strengths
|
· |
#1 recognized brand in U.S. termite and pest control services |
|
· |
Track record of high customer retention |
|
· |
Passionate and committed associates focused on delivering superior customer service |
|
· |
Expansive scale and deep presence across a national footprint |
|
· |
Effective multi‑channel customer acquisition strategy |
|
· |
History of innovation leadership and introducing new products and services |
5
American Home Shield
American Home Shield is the largest provider of home service plans in the United States, with approximately 46 percent share, as measured by revenue. Through American Home Shield’s home services platform, we respond to over four million service requests annually (or one every eight seconds) from homeowners who require assistance with technical home repair issues utilizing our nationwide network of over 15,000 pre-qualified professional contractor firms. American Home Shield’s customizable home service plans help customers protect and maintain their homes, typically their most valuable asset, from unplanned breakdowns of essential home systems and appliances, which are typically expensive. American Home Shield’s large recurring customer base provides our contractors a significant volume of work throughout the year, which is highly valued by them. These interactions are facilitated through American Home Shield’s leading technology-enabled customer interface and service delivery platform.
For the fiscal year ended December 31, 2017, American Home Shield generated revenue of $1,157 million and Adjusted EBITDA of $260 million.
American Home Shield serves approximately two million customers who subscribe to a yearly service plan agreement that covers the repair or replacement of major components of up to 21 home systems and appliances, including electrical, plumbing, central heating and air conditioning (“HVAC”) systems, water heaters, refrigerators, dishwashers and ranges/ovens/cooktops. Increasingly, these items tend to be the most critical and complicated items in a home and the most complex to repair, and product failures can result in significant emotional and financial inconvenience. American Home Shield continuously upgrades offerings through additional coverages and home services as homes become increasingly complex and connected. The plans are generally structured as renewable one year contracts, and, because American Home Shield’s customers value the services we provide, 66 percent of American Home Shield’s revenue base in 2017 was derived from existing contract renewals. This drives consistency and predictability into American Home Shield’s business performance.
American Home Shield’s service plans appeal to the growing segment of U.S. homeowners who want: (1) budget protection against unexpected and/or expensive home repair; and (2) the convenience of having repairs completed by experienced professionals. Given the high price of an appliance or home system breakdown, the length of time associated with vetting and hiring a qualified repairman and, typically, the lack of formal guarantee for services performed, consumers are willing to pay for the peace of mind, convenience, repair expertise and guarantee provided by a home service plan.
American Home Shield’s customers are serviced by a select group of high quality, pre-qualified independent contractors. Our reputation as a strong partner, our growth and our increasing scale have allowed us to attract one of the largest independent contractor networks in the U.S., which currently stands at more than 15,000 pre-qualified professional contractor firms. Our large recurring customer base provides our contractors a significant volume of work throughout the year, which is highly valued by them. In return for this volume, we are able to negotiate favorable rates for work performed.
On July 26, 2017, we announced that we intend to separate our American Home Shield business from our Terminix and Franchise Services Group businesses by means of a spin-off of the American Home Shield business to our stockholders, resulting in two publicly traded companies.
American Home Shield Competitive Strengths
|
· |
#1 position in the industry |
|
· |
Track record of high customer retention |
|
· |
Large, licensed national contractor network |
|
· |
Strong partnerships with leading national residential real estate firms |
|
· |
Core competency around direct‑to‑consumer marketing and lead generation |
Franchise Services Group
ServiceMaster’s Franchise Services Group consists of the ServiceMaster Restore (disaster restoration), ServiceMaster Clean (janitorial), Merry Maids (residential cleaning), Furniture Medic (cabinet and wood furniture repair) and AmeriSpec (home inspection) businesses. Our businesses in this segment operate principally through franchisees. In 2014, we began converting company‑owned Merry Maids locations to franchises. As of October 10, 2016, the branch conversion process was complete.
For the year ended December 31, 2017, Franchise Services Group recorded revenue of $212 million and Adjusted EBITDA of $87 million. In 2017, approximately 60 percent of our revenue in this segment consisted of ongoing monthly royalty fees. Royalty fees are the amounts paid to us by our franchisees and are based upon a percentage of our franchisees’ customer‑level revenue. We estimate that the customer‑level revenue for this segment was $2,559 million for the year ended December 31, 2017. Customer level revenue means: Franchise Services Group revenue of $212 million, less royalty fees of $127 million, plus estimated sales generated by our franchisees of $2,474 million.
6
We believe that each business holds a leading position in its respective category and that our scale and national presence create competitive advantages for us in attracting and retaining franchisees, commercial customers and insurance partners. We are able to invest in best‑in‑class systems, training and process development, provide multiple levels of marketing support and direct new business leads to our franchisees through our relationships with major insurance carriers and national account customers. The depth of our franchisee support is evidenced by the long average tenure of our franchisees, many of whom have partnered with ServiceMaster for over 25 years. Our Franchise Services Group serves both residential and commercial customers across all 50 states and the District of Columbia through approximately 4,500 franchise agreements, with additional locations in 10 other countries.
Franchise Services Group Competitive Strengths
|
· |
Strong and trusted brands with leading positions in their respective categories |
|
· |
Infrastructure and scale supporting our ability to sell and service national accounts, including major insurance carriers |
|
· |
Attractive value proposition to franchisees |
|
· |
Exceptional focus on customer service |
|
· |
National network and 24/7/365 service availability supports mission‑critical nature of the ServiceMaster Restore business |
|
· |
Long‑standing and strong relationships with many of the top 20 insurance carriers |
Our Opportunity
Termite and Pest Control Industry
The outsourced segment for residential and commercial termite and pest control services in the United States was approximately $8 billion in 2016, according to Specialty Consultants, LLC. We estimate that there are approximately 20,000 U.S. termite and pest control companies, nearly all of which have fewer than 100 employees.
Termites are responsible for an estimated $5 billion in home damage in the United States annually, according to the National Pest Management Association. The termite control industry provides treatment and inspection services to residential and commercial property owners for the remediation and prevention of termite infestations. We believe homeowners value quality and reliability over price in choosing professional termite control services, as the cost of most professional treatments is well below the potential cost of inaction or ineffective treatment. As a result, we believe the demand for termite remediation services is relatively insulated from changes in consumer spending. In addition to remediation services, the termite control industry offers periodic termite inspections and preventative treatments to residential and commercial property owners in areas with high termite activity, typically through annual contracts. These annual contracts may carry guarantees that protect the property owner against the cost of structural damage caused by a termite infestation. Termites can cause significant damage to a structure before becoming visible to the untrained eye, highlighting the value proposition of professional preventative termite services. As a result, the termite control industry experiences high renewal rates on annual preventative inspection and treatment contracts, and revenues from such contracts are generally stable and recurring.
Pest infestations may damage a home or business while also carrying the risk of the spread of diseases. Moreover, for many commercial facilities, pest control is essential to regular operations and regulatory compliance (e.g., hotels, restaurants and healthcare facilities). As a result of these dynamics, the pest control industry experiences high rates of renewal for its pest inspection and treatment contracts. Pest control services are often delivered on a contracted basis through regularly scheduled service visits, which include an inspection of premises and application of pest control materials.
Both termite and pest activity are affected by weather. Termite activity increases during the spring and summer months, the intensity of which varies based on weather. Similarly, pest activity tends to accelerate in the spring months when warmer temperatures arrive in many U.S. regions. However, the high proportion of termite and pest control services which are contracted and recurring, as well as the high renewal rates for those services, limit the effect of weather anomalies on the termite and pest control industry in any given year.
Home Service Plan Industry
American Home Shield operates within the larger $400 billion U.S. home services market, of which the U.S. home service plan segment represents $2.3 billion in 2016. We believe that we are well positioned to capitalize on our leadership position, while leveraging our network to provide other services to consumers in the broader home services market, as it becomes more complex and connected.
We view the home service plan segment as a long-term growth space. This segment is characterized by low household penetration with approximately five million of nearly 120 million occupied homes (owner occupied and rentals) covered by a home service plan, or approximately four percent of these households. As consumer demand shifts towards more outsourced services, we believe we have an opportunity, as a reliable, scaled service provider with a national, licensed independent contractor network, to increase share and household penetration. Additionally, we believe that increasingly complex household systems and appliances may further highlight the value proposition of professional repair services and, accordingly, the coverage benefits offered by a home service plan or other service plans. We aim to capitalize on this opportunity through a comprehensive strategy built on the key strengths of our business.
7
Key Franchise Services Group Industries
Disaster Restoration (ServiceMaster Restore). We estimate that the U.S. disaster restoration segment was approximately $14 billion in 2017, just over one-half of which is related to residential customers and the remainder related to commercial customers. Most emergency response work results from emergency situations for residential and commercial customers, such as fires and flooding. Extreme weather events and natural disasters also provide demand for emergency response work. Critical factors in the selection of an emergency response firm are the firm’s reputation, relationships with insurers, available resources, proper insurance and credentials, quality of service, timeliness and responsiveness. This segment is highly fragmented, with two large players, including ServiceMaster Restore, and we believe there are opportunities for growth for scaled service providers.
Janitorial (ServiceMaster Clean). We estimate that the U.S. janitorial services segment was approximately $56 billion in 2017. The segment is highly fragmented with approximately 900,000 companies competing in the janitorial space, a significant majority of which have five or fewer employees.
Residential Cleaning (Merry Maids). We estimate that the U.S. residential professional cleaning services segment was approximately $16 billion in 2017. Competition in this segment comes mainly from local, independently-owned firms, and from a few national companies.
Our Competitive Strengths
#1 Positions in Large, Fragmented and Growing Segments. We are the leading provider of essential residential and commercial services in the majority of segments in which we operate. Our segments are generally large, growing and highly fragmented, and we believe we have significant advantages over smaller local and regional competitors. We have spent decades developing a reputation built on reliability and superior quality and service. As a result, we enjoy industry leading brand awareness and a reputation for high‑quality customer service, both of which serve as key drivers of our customer acquisition efforts. Our nationwide presence also allows our brands to effectively serve both local residential customers and large national commercial accounts and to capitalize on lead generation sources such as large real estate agencies and insurance carriers. We believe our size and scale provide us a competitive advantage in our purchasing power, route density, and marketing and operating efficiencies compared to smaller local and regional competitors. Our scale also facilitates the standardization of processes, shared learning and talent development across our entire organization.
Diverse Revenue Streams across Customers and Geographies. ServiceMaster is diversified in terms of customers and geographies. We operate in all 50 states and the District of Columbia. Our Terminix business, which accounted for 53 percent of our revenue in 2017, served approximately 2.7 million customers. American Home Shield, which accounted for 40 percent of our revenue in 2017, responded to approximately four million service requests from approximately two million customers. Our diverse customer base and geographies help to mitigate the effect of adverse market conditions and other risks in any particular geography or customer segment we serve. We therefore believe the size and scale of our company provide us with added protection from risk relative to our smaller local and regional competitors.
High‑Value Service Offerings Resulting in High Retention and Recurring Revenues. We believe our high annual customer retention demonstrates the highly valued nature of the services we offer and the high level of execution and customer service that we provide. Many of our technicians have built long‑standing, personal relationships with their customers. We believe these personal bonds, often forged over decades, help to drive customer loyalty and retention. As a result of our high retention and long‑standing customer relationships, we enjoy significant visibility and stability in our business, and these factors limit the effect of adverse economic cycles on our revenue base. We experienced these advantages during the most recent economic downturn, and we have been able to grow revenue in each year from 2008 to 2017.
Capital‑Light Business Model. Our business model is characterized by strong Adjusted EBITDA margins, negative working capital and limited capital expenditure requirements. For the year ended December 31, 2017, 2016 and 2015, our net cash provided from operating activities from continuing operations was $413 million, $325 million and $398 million, respectively, and our property additions were $75 million (net of government grants received of $2 million), $56 million and $40 million, respectively. Free Cash Flow was $338 million, $270 million and $358 million for the year ended December 31, 2017, 2016 and 2015, respectively. For a reconciliation of Free Cash Flow to net cash provided from operating activities from continuing operations, which we consider to be the most directly comparable financial measure presented in accordance with accounting principles generally accepted in the United States of America (“GAAP”), see “Selected Historical Financial Data.”
Resilient Financial Model with Track Record of Consistent Performance.
Solid revenue and Adjusted EBITDA growth through business cycles. Our consolidated revenue and Adjusted EBITDA compound annual growth rates from 2012 through 2017 were six percent and 10 percent, respectively. We believe that our strong performance through recent economic and housing downturns is attributable to the essential nature of our services, our strong value proposition and management’s focus on driving results through strategic investment and operational execution.
Solid margins with attractive operating leverage and productivity improvement initiatives. Our business model enjoys inherent operating leverage stemming from route density and fixed investments in infrastructure and technology, among other factors. We have demonstrated our ability to expand our margins through a variety of initiatives, including metric‑driven continuous improvement in our customer care centers, application of consistent process guidelines at the branch level, leveraging size and scale to
8
improve the sourcing of labor and materials, and driving productivity in centralized services. We have also deployed mobility solutions and routing and scheduling systems across many of our businesses in order to enhance overall efficiency and reduce operating costs.
Multi‑Channel Marketing Approach Supported by Sophisticated Customer Analytic Modeling Capabilities. Our multi-channel marketing approach focuses on building the value of our brands and generating revenue by understanding the decisions consumers make at each stage in the purchase of residential and commercial services. The effectiveness of our marketing efforts is demonstrated by an increase in lead generation at American Home Shield and online sales. For example, in the direct to consumer channel at American Home Shield, new home service plan lead generation has benefited from increased spending in marketing as well as improved digital marketing. We also have been deploying increasingly sophisticated consumer analytics models that allow us to more effectively segment our prospective customers and tailor campaigns towards them and, as a result, we have kept cost per sale relatively flat. In addition, we are seeing success with innovative ways of reaching and marketing to consumers, including content marketing, online reputation management and social media channels.
Operational and Customer Service Excellence Driven by Superior Employee Development. We are constantly focused on improving customer service. The customer experience is at the foundation of our business model, and we believe that each employee is an extension of ServiceMaster’s reputation. We employ rigorous hiring and training practices and continuously analyze our operating metrics to identify potential improvements in service and productivity. Technicians in our Terminix branches have an average tenure of eight years, creating continuity in customer relationships and ensuring the development of best practices based on on‑the‑ground experience. We also provide our field personnel with access to sophisticated data management and mobility tools which enable them to drive efficiencies, improve customer service and ultimately grow our customer base and profitability.
Experienced Management Team. We have assembled a management team of highly experienced leaders with significant industry expertise. Our senior leaders have track records of producing profitable growth in a wide variety of industries and economic conditions. We also believe that we have a deep bench of talent across each of our business units, including long‑tenured individuals with significant expertise and knowledge of the businesses they operate. Our management team is highly focused on execution and driving growth and profitability across our company. Our compensation structure, including incentive compensation, is tied to key performance metrics and is designed to incentivize senior management to seek the long‑term success of our business.
Our Strategy
Grow Our Customer Base. We are focused on the growth of our businesses through the introduction and delivery of high‑value services to new and existing customers. We deliver our services through three primary channels:
|
· |
Direct‑to‑consumer through our company‑owned branches; |
|
· |
Through partnerships with high‑quality contractors in our home service plan business; and |
|
· |
Through trusted service providers who are franchisees. |
To accelerate new customer growth, we make strategic investments in sales, marketing and advertising to drive new business leads, brand awareness and market penetration. In addition, we are executing multiple initiatives to improve customer satisfaction and service delivery, which we believe will lead to improved retention and growth in our customer base across our business segments.
Develop and Expand New Service Offerings. We intend to continue to leverage our existing sales channels and local coverage to deliver additional value‑added services to our customers. Our product development teams draw upon the experience of our technicians in the field, combined with in‑house scientific expertise, to create innovative customer solutions for both our existing customer base and identified service/category adjacencies. We have a strong history of new product introductions, such as Terminix’s crawlspace encapsulation, mosquito control and wildlife exclusion services, that we believe will appeal to new potential customers as well as our existing customer base. Mosquito, wildlife exclusion and crawl space encapsulation are being offered in substantially all U.S. geographic segments where we believe substantial opportunity exists. We are now focusing our efforts on increasing our share in these product lines.
Expand Our Geographic Segments. Through detailed assessments of local economic conditions and demographics, we have identified target segments for expansion, both in existing segments, where we have capacity to increase our local position, and in new geographies, where we see opportunities. In addition to geographic expansion opportunities within the United States, we may also grow our international presence through strategic franchise expansions and additional licensing agreements.
Grow Our Commercial Business. Our revenue from commercial customers comprised approximately 12 percent of our 2017 revenue. We believe we are well positioned to leverage our national coverage, brand strength and broad service offerings to target large multi‑regional accounts. We believe these capabilities provide us with a meaningful competitive advantage, especially compared to smaller local and regional competitors. We recognize that many of these large accounts seek to outsource or reduce the number of vendors used for certain services, and, accordingly, we have reenergized our marketing approach in this channel. At Terminix, for example, we have hired a dedicated sales team to focus on the development of commercial sales. Our commercial expansion strategy targets industries with a demonstrated need for our services, including healthcare, manufacturing, warehouses, hotels and commercial real estate.
9
Enhance Our Profitability. Historically, we have a track record of being able to source and purchase targets at attractive prices and successfully integrate them into our business. We have and will continue to invest in initiatives designed to improve our margins and drive profitable growth. We have been able to increase productivity across our segments through actions such as continuous process improvement, targeted systems investments, sales force initiatives and technician mobility tools. We also focus on strategically capitalizing on our purchasing power to achieve more favorable pricing and terms. In addition, we have implemented tools and processes to centralize and systematize pricing decisions. These tools and processes enable us to optimize pricing at the local and product levels while creating a flexible and scalable pricing architecture that is fully scalable across our business. We intend to leverage these investments as well as identify further opportunities to enhance profitability.
Pursue Selective Acquisitions. From 2013 through 2017, we have completed approximately 100 acquisitions. In 2017, we completed four pest control acquisitions and purchased a ServiceMaster Clean master distributor, within the Franchise Services Group, for a total purchase price of $16 million. On June 27, 2016, we acquired OneGuard Home Warranties (“OneGuard”) for a total purchase price of $61 million, and on November 30, 2016, we acquired Landmark Home Warranty, LLC (“Landmark”) for a total purchase price of $39 million. In 2016, we completed several pest control and termite acquisitions for a total purchase price of $43 million. We anticipate that the highly fragmented nature of our segments will continue to create opportunities for further consolidation. In the future, we intend to continue to take advantage of tuck‑in as well as strategic acquisition opportunities, particularly in underserved geographies where we can enhance and expand our service capabilities. We seek to use acquisitions to cost‑effectively grow our customer count and enter high‑growth geographies. We may also pursue acquisitions as vehicles for strategic international expansion.
Sales and Marketing
We market our services to both homeowners and businesses on a national and local level through various means, including the internet, direct mail, television and radio advertising, print advertisements, marketing partnerships, telemarketing, various social media channels and through national sales teams. Additionally, in our American Home Shield segment, we partner with various participants in the residential real estate marketplace, such as real estate brokerages and some financial institutions and insurance carriers.
Franchises
Franchises are important to the Terminix, ServiceMaster Restore, ServiceMaster Clean, Merry Maids, Furniture Medic and AmeriSpec businesses. In 2017, 2016 and 2015, total franchise fees (monthly royalty fees as well as initial fees from sales of franchises and licenses) were $143 million, $135 million and $132 million, respectively, related franchise operating expenses were $56 million, $52 million and $57 million, respectively, and total profits from our franchised operations were $87 million, $83 million and $75 million, respectively. Nearly all of the franchise fees received by our Franchise Services Group segment are derived from the ServiceMaster Restore, ServiceMaster Clean and Merry Maids businesses. Franchise fees from our Terminix franchisees represented less than one percent of Terminix revenue for each of those years. We evaluate the performance of our franchise businesses based primarily on operating profit before corporate general and administrative expenses, interest expense and amortization of intangible assets. Franchise agreements entered into in the course of these businesses are generally for a term of five years. The majority of these franchise agreements are renewed prior to expiration. Internationally, we have license agreements, whereby licensees provide services under our brand names that would ordinarily be provided by franchisees in the United States. The majority of international licenses are for 10‑year terms.
Customers and Geographies
We have no single customer that accounts for more than two percent of our consolidated revenue. Additionally, no reportable segment has a single customer that accounts for more than five percent of its revenue. None of our reportable segments are dependent on a single customer or a few customers, the loss of which would have a material adverse effect on the segment.
A significant percentage of our revenue is concentrated in the southern and western regions of the U.S. In our Terminix and American Home Shield segments, California, Texas and Florida collectively accounted for approximately one‑third of our revenue in 2017.
Competition
We compete in residential and commercial services industries, focusing on termite and pest control, home service plans, disaster restoration, janitorial, residential cleaning, cabinet and wood furniture repair and home inspection. We compete with many other companies in the sale of our services, franchises and products. The principal methods of competition in our businesses include quality and speed of service, brand awareness and reputation, customer satisfaction, pricing and promotions, professional sales forces, contractor network and referrals. While we compete with a broad range of competitors in each discrete segment, we do not believe that any of our competitors provides all of the services we provide in all of the segments we serve. All of the primary segments in which we operate are highly fragmented.
10
Termite and Pest Control
Competition in the segment for professional termite and pest control services in the United States comes primarily from smaller regional and local, independently-owned firms, as well as from Orkin, Inc. (a subsidiary of Rollins, Inc.), Ecolab, Inc. and Rentokil Initial, plc., all of which compete nationally.
Home Service Plans
Competition for home service plans that cover household systems and appliances comes mainly from regional providers. Our primary direct competitors are First American Financial Corporation and Old Republic International Corporation.
Disaster Restoration, Emergency Response and Related Services
Competition in the segments for disaster restoration, emergency response and related services comes mainly from local, independently-owned firms and a few national professional cleaning companies, such as Servpro Industries, Inc., Belfor, a subsidiary of Belfor Europe GmbH, BMS CAT, Inc. and Stanley Steemer International, Inc.
Janitorial
Competition in the segment for janitorial services comes mainly from local, independently‑owned firms and a few national professional janitorial firms such as ABM Industries Incorporated, Jani‑King International, Inc., Aramark and Jan-Pro Franchise International, Inc.
Residential Cleaning
Competition in the segment for residential cleaning services comes mainly from local, independently-owned firms, and from a few national companies such as The Maids International, Inc., Molly Maid, Inc. and The Cleaning Authority, LLC.
Information Technology
We have invested in information systems and software packages designed to allow us to grow efficiently and scale across our organization, while retaining local and regional flexibility. We believe this capability provides us with a competitive advantage in our operations. Our sophisticated IT systems enable us to provide a high level of convenience and service to our customers. In 2016, Terminix launched a new sales mobility platform to enhance the customer sales experience and allow sales professionals to more easily bundle diverse product offerings. Similarly, American Home Shield’s websites and customer-facing platforms, which operate and are staffed 24 hours a day, seven days a week, are able to take customer service requests, respond to customer questions and promptly assign contractors to a job.
Employees
The average number of persons employed by us during 2017 was approximately 13,000.
Intellectual Property
We hold various service marks, trademarks and trade names, such as ServiceMaster, Terminix, American Home Shield, ServiceMaster Restore, ServiceMaster Clean, Merry Maids, Furniture Medic and AmeriSpec, that we deem particularly important to the advertising activities conducted by each of our reportable segments as well as the franchising activities conducted by certain reportable segments. As of December 31, 2017, we had marks that were protected by registration (either by direct registration or by treaty) in the United States and approximately 90 other countries.
Insurance
We maintain insurance coverage that we believe is appropriate for our business, including workers’ compensation, auto liability, general liability, umbrella and property insurance. In addition, we provide various insurance coverages, including deductible reimbursement policies, to our business units through our wholly‑owned captive insurance company, which was domiciled in Vermont through 2015 and since 2016 has been domiciled in Tennessee.
Regulatory Compliance
Our businesses are subject to various international, federal, state, provincial and local laws and regulations, compliance with which increases our operating costs, limits or restricts the services provided by our reportable segments or the methods by which our businesses offer, sell and fulfill those services or conduct their respective businesses, or subjects us and our reportable segments to the possibility of regulatory actions or proceedings. Noncompliance with these laws and regulations can subject us to fines or various forms of civil or criminal prosecution, any of which could have a material adverse effect on our reputation, business, financial position, results of operations and cash flows.
These international, federal, state, provincial and local laws and regulations include laws relating to consumer protection, wage and hour, deceptive trade practices, permitting and licensing, state contractor laws, real estate settlements, workers’ safety, tax, healthcare reforms, franchise-related issues, collective bargaining and other labor matters, environmental and employee benefits. The Terminix business must also meet certain Department of Transportation and Federal Motor Carrier Safety Administration requirements with respect to certain vehicles in its fleet. Terminix is regulated by federal, state and local laws, ordinances and
11
regulations which are enforced by pest control boards, environmental protection agencies and similar government entities. American Home Shield is regulated in certain states by the applicable state insurance regulatory authority and by the Real Estate Commission in Texas. Terminix, ServiceMaster Clean and Merry Maids use products containing ingredients regulated by the U.S. Environmental Protection Agency (the “EPA”), and ServiceMaster Clean is subject to licensing and certification requirements for applying disinfectants, sanitizers and other EPA registered products in certain states. AmeriSpec is regulated by various state and local home inspection laws and regulations.
Environmental, Health and Safety Matters
Our businesses are subject to various international, federal, state and local laws and regulations regarding environmental, health and safety matters. Among other things, these laws regulate the emission or discharge of materials into the environment, govern the use, storage, treatment, disposal, transportation and management of hazardous substances and wastes and protect the health and safety of our employees. These laws also impose liability for the costs of investigating and remediating, and damages resulting from, present and past releases of hazardous substances, including releases by prior owners or operators of sites we currently own or operate.
Compliance with environmental, health and safety laws increases our operating costs, limits or restricts the services provided by our reportable segments or the methods by which they offer, sell and fulfill those services or conduct their respective businesses, or subjects us and our reportable segments to the possibility of regulatory or private actions or proceedings.
Terminix is regulated under many federal and state environmental laws, including the Comprehensive Environmental Response, Compensation and Liability Act of 1980 (the “CERCLA”), the Superfund Amendments and Reauthorization Act of 1986 (the “Superfund”), the Federal Environmental Pesticide Control Act of 1972, the Federal Insecticide, Fungicide and Rodenticide Act of 1947, the Resource Conservation and Recovery Act of 1976, the Clean Air Act, the Emergency Planning and Community Right‑to‑Know Act of 1986, the Oil Pollution Act of 1990 and the Clean Water Act of 1977, each as amended.
We cannot predict the effect of possible future environmental laws on our operations. Changes in, or new interpretations of, existing laws, regulations or enforcement policies, the discovery of previously unknown contamination, or the imposition of other environmental liabilities or obligations in the future, may lead to additional compliance or other costs. During 2017, there were no material capital expenditures for environmental control facilities, and there are no material expenditures anticipated for 2018 or 2019 related to such facilities.
Consumer Protection and Solicitation Matters
We are subject to international, federal, state, provincial and local laws and regulations designed to protect consumers, including laws governing consumer privacy and fraud, the collection and use of consumer data, telemarketing and other forms of solicitation.
The telemarketing rules adopted by the Federal Communications Commission pursuant to the Federal Telephone Consumer Protection Act and the Federal Telemarketing Sales Rule issued by the Federal Trade Commission govern our telephone sales practices. In addition, some states and local governing bodies have adopted laws and regulations targeted at direct telephone sales and “do‑not‑knock,” “do‑not‑mail” and “do‑not‑leave” activities. The implementation of these marketing regulations requires us to rely more extensively on other marketing methods and channels. In addition, if we were to fail to comply with any applicable law or regulation, we could be subject to substantial fines or damages, be involved in lawsuits, enforcement actions and other claims by third parties or governmental authorities, suffer losses to our reputation and our business or suffer the loss of licenses or penalties that may affect how the business is operated, which, in turn, could have a material adverse effect on our financial position, results of operations and cash flows.
Franchise Matters
Terminix, ServiceMaster Restore, ServiceMaster Clean, Merry Maids, Furniture Medic and AmeriSpec are subject to various international, federal, state, provincial and local laws and regulations governing franchise sales, marketing and licensing and franchise trade practices generally, including applicable rules and regulations of the Federal Trade Commission. These laws and regulations generally require disclosure of business information in connection with the sale and licensing of franchises. Certain state regulations also affect the ability of the franchisor to revoke or refuse to renew a franchise. We seek to comply with regulatory requirements and deal with franchisees and licensees in good faith. From time to time, we and one or more franchisees may become involved in a dispute regarding the franchise relationship, including payment of royalties or fees, location of branches, advertising, purchase of products by franchisees, non‑competition covenants, compliance with our standards and franchise renewal criteria. There can be no assurance that compliance problems will not be encountered from time to time or that significant disputes with one or more franchisees will not arise.
From time to time, we receive communications from our franchisees regarding complaints, disputes or questions about our practices and standards in relation to our franchised operations and certain economic terms of our franchise arrangements. If franchisees or groups representing franchisees were to bring legal proceedings against us, we would vigorously defend against the claims in any such proceeding, but our reputation, business, financial position, results of operations and cash flows could be materially adversely impacted and the price of our common stock could decline.
12
Available Information
ServiceMaster maintains a website at http://www.servicemaster.com that includes a hyperlink to a website maintained by a third party where ServiceMaster’s Annual Report on Form 10-K, Quarterly Reports on Form 10-Q, Current Reports on Form 8-K and all amendments to those reports are available without charge as soon as reasonably practicable following the time that they are filed with or furnished to the SEC. The information found on the Company’s website is not a part of this or any other report filed with or furnished to the SEC.
You should carefully consider the factors described below, in addition to the other information set forth in this Annual Report on Form 10-K. These risk factors are important to understanding the contents of this Annual Report on Form 10-K and of other reports. Our reputation, business, financial position, results of operations and cash flows are subject to various risks. The risks and uncertainties described below are not the only ones relevant to us. Additional risks and uncertainties not presently known to us or that we currently believe to be immaterial may also materially and adversely affect our reputation, business, financial position, results of operations and cash flows. The risk factors generally have been separated into four groups: risks related to our businesses and industries, risks related to our substantial indebtedness, risks related to our common stock and risks related to the spin-off of American Home Shield.
The materialization of any risks and uncertainties set forth below or identified in Forward-Looking Statements contained in this report and our other filings with the SEC or those that are presently unforeseen could result in significant adverse effects on our financial condition, results of operations and cash flows. See “Item 7. Management’s Discussion and Analysis of Financial Condition and Results of Operations — Information Regarding Forward-Looking Statements” below.
Risks Related to Our Businesses and Our Industries
Our industries are highly competitive. Competition could reduce our share and adversely affect our reputation, businesses, financial position, results of operations and cash flows.
We operate in highly competitive industries. Changes in the source and intensity of competition in the industries served by us impact the demand for our services and may also result in additional pricing pressure. Regional and local competitors operating in a limited geographic area may have lower labor, employee benefits and overhead costs than us. The principal methods of competition in our businesses include customer service, brand reputation, fairness of contract terms, including price, and timely response to service claims. We may be unable to compete successfully against current or future competitors, and the competitive pressures that we face may result in reduced share, reduced pricing or an adverse impact to our reputation, businesses, financial position, results of operations and cash flows.
Weakening general economic conditions, especially as they may affect home sales, unemployment or consumer confidence or spending levels, may adversely impact our businesses, financial position, results of operations and cash flows.
Our results of operations are dependent upon consumer spending. Deterioration in general economic conditions and consumer confidence, particularly in California, Texas and Florida, which collectively represented approximately one-third of our revenue in 2017, could affect the demand for our services. Consumer spending and confidence tend to decline during times of declining economic conditions. A worsening of macroeconomic indicators, including weak home sales, higher home foreclosures, declining consumer confidence or rising unemployment rates, could adversely affect consumer spending levels, reduce demand for our services and adversely impact our businesses, financial position, results of operations and cash flows.
We may not successfully implement our business strategies, including achieving our growth objectives.
We may not be able to fully implement our business strategies or realize, in whole or in part within the expected time frames, the anticipated benefits of various growth or other initiatives. Our business strategies and initiatives, including growth of our customer base, introduction of new service and product offerings, geographic or segment expansion and enhancement of profitability, are subject to significant business, economic and competitive uncertainties and contingencies, many of which are beyond our control.
We will incur certain costs to achieve efficiency improvements and growth in our businesses, and we may not meet anticipated implementation timetables or stay within budgeted costs. As these efficiency improvement and growth initiatives are implemented, we may not fully achieve expected cost savings and efficiency improvements or growth rates, or these initiatives could adversely impact customer retention or our operations. Also, our business strategies may change in light of our ability to implement new business initiatives, competitive pressures, economic uncertainties or developments or other factors.
Adverse credit and financial market events and conditions could, among other things, impede access to or increase the cost of financing, which could have a material adverse impact on our businesses, financial position, results of operations and cash flows.
Disruptions in credit or financial markets could make it more difficult for us to obtain, or increase our cost of obtaining, financing for our operations or investments or to refinance our proposed indebtedness, or cause the proposed lenders to depart from prior credit industry practice and not give technical or other waivers under credit facility or other agreements to the extent we may seek them in the future, thereby causing us to be in default. Market changes in the real estate segment could also affect the demand for
13
our services as home buyers elect not to purchase our services, which could have a material adverse impact on our businesses, financial position, results of operations and cash flows.
Weather conditions and seasonality affect the demand for our services and our results of operations and cash flows.
The demand for our services and our results of operations are affected by weather conditions, including, without limitation, potential impacts, if any, from climate change, known and unknown, and by the seasonal nature of our termite and pest control services, home inspection services and disaster restoration services. Adverse weather conditions (e.g., cooler temperatures or droughts), whether created by climate change factors or otherwise, can impede the development of termite swarms and lead to lower demand for our termite control services. Extreme temperatures can lead to an increase in service requests related to household systems, particularly HVAC systems, resulting in higher claim frequency and costs and lower profitability, while mild temperatures in the winters or summers can lead to lower household systems claim frequency. For example, in the third quarter of 2016, we experienced an increase in contract claims cost driven by a higher number of HVAC work orders driven by higher summer temperatures. Extreme or unpredictable weather conditions could materially adversely impact our businesses, financial position, results of operations and cash flows.
Increases in raw material prices, fuel prices and other operating costs could adversely impact our businesses, financial position, results of operations and cash flows.
Our financial performance may be adversely affected by increases in the level of our operating expenses, such as fuel, chemicals, refrigerants, appliances and equipment, parts, raw materials, wages and salaries, employee benefits, health care, vehicle maintenance, contractor costs, self‑insurance costs and other insurance premiums, as well as various regulatory compliance costs, all of which may be subject to inflationary pressures.
Fuel prices are subject to market volatility. Our fleet has been negatively impacted by significant increases in fuel prices in the past and could be negatively impacted in the future. Previous increases in fuel prices increased our costs of operating vehicles and equipment. Although fuel prices remained relatively low during 2017, there can be no assurances that rates will not return to historical levels. We cannot predict what effect global events could have on fuel prices, but it is possible that such events could lead to higher fuel prices. Although we hedge a significant portion of our fuel costs, we do not hedge all of those costs. We expect to use approximately 13 million gallons of fuel in 2018. As of December 31, 2017, a 10 percent change in fuel prices would result in a change of approximately $3 million in our annual fuel cost before considering the impact of fuel swap contracts. Fuel price increases can also result in increases in the cost of chemicals and other materials used in our businesses. We cannot predict the extent to which we may experience future increases in costs of fuel, chemicals, refrigerants, appliances and equipment, parts, raw materials, wages and salaries, employee benefits, health care, vehicle maintenance, contractor costs, self‑insurance costs and other insurance premiums, as well as various regulatory compliance costs and other operating costs. To the extent such costs increase, we may be prevented, in whole or in part, from passing these cost increases through to our existing and prospective customers, which could have a material adverse impact on our businesses, financial position, results of operations and cash flows.
We may not be able to attract and retain qualified key executives or transition smoothly to new leadership, which could adversely impact us and our businesses and inhibit our ability to operate and grow successfully.
The execution of our business strategy and our financial performance will continue to depend in significant part on our executive management team and other key management personnel. Any inability to attract in a timely manner other qualified key executives, retain our leadership team and recruit other important personnel could have a material adverse impact on our businesses, financial position, results of operations and cash flows.
Compliance with, or violation of, environmental, health and safety laws and regulations, including laws pertaining to the use of pesticides, could result in significant costs that adversely impact our reputation, businesses, financial position, results of operations and cash flows.
International, federal, state, provincial and local laws and regulations relating to environmental, health and safety matters affect us in several ways. In the United States, products containing pesticides generally must be registered with the EPA, and similar state agencies before they can be sold or applied. The failure to obtain or the cancellation of any such registration, or the withdrawal from the marketplace of such pesticides, could have an adverse effect on our businesses, the severity of which would depend on the products involved, whether other products could be substituted and whether our competitors were similarly affected. The pesticides we use are manufactured by independent third parties and are evaluated by the EPA as part of its ongoing exposure risk assessment. The EPA may decide that a pesticide we use will be limited or will not be re‑registered for use in the United States. We cannot predict the outcome or the severity of the effect of the EPA’s continuing evaluations.
In addition, the use of certain pesticide products is regulated by various international, federal, state, provincial and local environmental and public health agencies. Although we strive to comply with such laws and regulations and have processes in place designed to achieve compliance, given our dispersed locations, distributed operations and numerous associates, we may be unable to prevent violations of these or other laws and regulations from occurring. Even if we are able to comply with all such laws and regulations and obtain all necessary registrations and licenses, the pesticides or other products we apply or use, or the manner in which we apply or use them, could be alleged to cause injury to the environment, to people or to animals, or such products could be banned in certain circumstances. The laws and regulations may also apply to third‑party vendors who are hired to repair or remediate property
14
and who may fail to comply with environmental laws, health and safety laws and regulations and subject us to risk of legal exposure. The costs of compliance, non‑compliance, investigation, remediation, combating reputational harm or defending civil or criminal proceedings, products liability, personal injury or other lawsuits could have a material adverse impact on our reputation, businesses, financial position, results of operations and cash flows.
International, federal, state, provincial and local agencies regulate the disposal, handling and storage of waste, discharges from our facilities and the investigation and clean‑up of contaminated sites. We could incur significant costs, including investigation and clean‑up costs, fines, penalties and civil or criminal sanctions and claims by third parties for property damage and personal injury, as a result of violations of, or liabilities under, these laws and regulations. In addition, potentially significant expenditures could be required to comply with environmental, health and safety laws and regulations, including requirements that may be adopted or imposed in the future.
On January 20, 2017, Terminix International USVI, LLC (“TMX USVI”) and The Terminix International Company Limited Partnership (“TMX LP”), each an indirect, wholly-owned subsidiary of the Company, entered into a revised Plea Agreement (the “Plea Agreement”) in connection with the investigation initiated by the United States Department of Justice Environmental Crimes Section (the “DOJ”) into allegations that a local Terminix branch used methyl bromide as a fumigant at a resort in St. John, U.S. Virgin Islands. The Plea Agreement was intended to resolve four misdemeanor charges of violations of the Federal Insecticide, Fungicide, and Rodenticide Act related to improper applications of methyl bromide. At a hearing on November 20, 2017, TMX USVI and TMX LP were sentenced for pleading guilty to four misdemeanor charges of violations of the Federal Insecticide, Fungicide, and Rodenticide Act related to improper applications of methyl bromide. Under the terms of sentencing handed down (i) TMX USVI and TMX LP each paid a fine of $4.6 million (total of $9.2 million); (ii) TMX USVI and TMX LP paid a total of $1.2 million to the EPA for costs incurred by the EPA for the response and clean-up of the affected units at the resort in St. John; and (iii) both TMX USVI and TMX LP will serve a five-year probation period. In lieu of the $1 million community service payment that was proposed in the Plea Agreement, the court required TMX USVI and TMX LP to provide for training certification courses with respect to pesticide application and safety in the U.S. Virgin Islands over the next five years. We have recorded a $0.5 million charge for this training program.
The Company has previously recorded within Fumigation related matters in the consolidated statement of operations and comprehensive income total charges of $10 million in connection with the aforementioned criminal matter as of December 31, 2016. As a result of the sentencing, we have recorded an additional $0.9 million in charges in the fourth quarter of 2017.
On December 16, 2016, the U.S. Virgin Islands Department of Justice filed a civil complaint in the Superior Court of the Virgin Islands related to the aforementioned fumigation incident in a matter styled Government of the United States Virgin Islands v. The ServiceMaster Company, LLC, The Terminix International Company Limited Partnership, and Terminix International USVI, LLC. The amount and extent of any further potential penalties, fines, sanctions, costs and damages that the federal or other governmental authorities may yet impose, investigation or other costs and reputational harm, as well as the impact of any additional civil, criminal or other claims or judicial, administrative or regulatory proceedings resulting from or related to the U.S. Virgin Islands matter, which could be material, is not currently known, and any such further penalties, fines, sanctions, costs or damages would not be covered under the Company’s general liability insurance policies.
Public perceptions that the products we use and the services we deliver are not environmentally friendly or safe may adversely impact the demand for our services.
In providing our services, we use, among other things, pesticides and other chemicals. Public perception that the products we use and the services we deliver are not environmentally friendly or safe or are harmful to humans or animals, whether justified or not, or our improper application of these chemicals, could reduce demand for our services, increase regulation or government restrictions or actions, result in fines or penalties, impair our reputation, involve us in litigation, damage our brand names and otherwise have a material adverse impact on our businesses, financial position, results of operations and cash flows.
Laws and government regulations applicable to our businesses and lawsuits, enforcement actions and other claims by third parties or governmental authorities could increase our legal and regulatory expenses, and impact our businesses, financial position, results of operations and cash flows.
Our businesses are subject to significant international, federal, state, provincial and local laws and regulations. These laws and regulations include laws relating to consumer protection, home warranties, real estate, wage and hour requirements, franchising, the employment of immigrants, labor relations, permitting and licensing, building code requirements, workers’ safety, the environment, insurance coverages, sales tax collection and remittance, employee benefits, marketing (including, without limitation, telemarketing) and advertising, the application and use of pesticides and other chemicals. In particular, we anticipate that various international, federal, state, provincial and local governing bodies may propose additional legislation and regulation that may be detrimental to our businesses or may substantially increase our operating costs, including increases in the minimum wage; environmental regulations related to chemical use, climate change, equipment efficiency standards, refrigerant production and use and other environmental matters; health care coverage; or “do‑not‑call” or other marketing regulations. While we do not consider ourselves to be an insurance company, the IRS or state agencies could deem us to be taxed as such, which could impact the timing of our tax payments.
15
In addition, new federal tax legislation was enacted in December 2017. This legislation made significant changes to the U.S. Internal Revenue Code, many of which are highly complex and may require interpretations and implementing regulations. As a result, we may incur meaningful expenses (including professional fees) as the new legislation is implemented. The expected impact of certain aspects of the legislation is unclear and subject to change.
We are also subject to various consumer protection laws and subject to receiving inquiries or investigative demands by regulatory bodies, including the Bureau of Consumer Financial Protection and state attorneys general and other state agencies. It is difficult to predict the future impact of the broad and expanding legislative and regulatory requirements affecting our businesses and changes to such requirements may adversely affect our businesses, financial position, results of operations and cash flows. In addition, if we were to fail to comply with any applicable law or regulation, we could be subject to substantial fines or damages, be involved in lawsuits, enforcement actions and other claims by third parties or governmental authorities, suffer harm to our reputation, suffer the loss of licenses or incur penalties that may affect how our businesses are operated, which, in turn, could have a material adverse impact on our businesses, financial position, results of operations and cash flows.
We are dependent on labor availability at our customer care centers and branches.
Our ability to conduct our operations is in part affected by our ability to increase our labor force, including on a seasonal basis at our customer care centers, which may be adversely affected by a number of factors. In the event of a labor shortage, we could experience difficulty in responding to customer calls in a timely fashion or delivering our services in a high‑quality or timely manner, and could be forced to increase wages to attract and retain associates, which would result in higher operating costs and reduced profitability. Long wait times by customers during peak operating times could have a material adverse impact on our reputation, businesses, financial position, results of operations and cash flows.
New decisions and rules by the National Labor Relations Board, including “expedited elections” and restrictions on appeals, could lead to increased organizing activities at our subsidiaries or franchisees. If these labor organizing activities were successful, it could further increase labor costs, decrease operating efficiency and productivity in the future, or otherwise disrupt or negatively impact our operations. In addition, potential competition from key associates who leave ServiceMaster could impact our ability to maintain our segment share in certain geographic areas.
Our franchisees, subcontractors, third‑party distributors and vendors could take actions that could harm our businesses.
For the years ended December 31, 2017 and 2016, $143 million and $135 million, respectively, of our consolidated revenue was received in the form of franchise revenues. Accordingly, our financial results are dependent in part upon the operational and financial success of our franchisees. Our franchisees, subcontractors, third‑party distributors and vendors are contractually obligated to operate their businesses in accordance with the standards set forth in our agreements with them. Each franchising brand also provides training and support to franchisees. However, franchisees, subcontractors, third‑party distributors and vendors are independent third parties that we do not control, and who own, operate and oversee the daily operations of their businesses. As a result, the ultimate success of any franchise operation rests with the franchisee. If franchisees do not successfully operate their businesses in a manner consistent with required standards, royalty payments to us will be adversely affected and our brands’ image and reputation could be harmed, which in turn could adversely impact our business, financial position, results of operations and cash flows. Similarly, if third‑party distributors, subcontractors, vendors and franchisees do not successfully operate their businesses in a manner consistent with required laws, standards and regulations, we could be subject to claims from regulators or legal claims for the actions or omissions of such third‑party distributors, subcontractors, vendors and franchisees. In addition, our relationship with our franchisees, third‑party distributors, subcontractors and vendors could become strained (including resulting in litigation) as we impose new standards or assert more rigorous enforcement practices of the existing required standards. These strains in our relationships or claims could have a material adverse impact on our reputation, businesses, financial position, results of operations and cash flows.
From time to time, we receive communications from our franchisees regarding complaints, disputes or questions about our practices and standards in relation to our franchised operations and certain economic terms of our franchise arrangements. If franchisees or groups representing franchisees were to bring legal proceedings against us, we would vigorously defend against the claims in any such proceeding, but our reputation, businesses, financial position, results of operations and cash flows could be materially adversely impacted and the price of our common stock could decline.
Disruptions or failures in our information technology systems could create liability for us or limit our ability to effectively monitor, operate and control our operations and adversely impact our reputation, business, financial position, results of operations and cash flows.
Our information technology systems facilitate our ability to monitor, operate and control our operations. Changes or modifications to our information technology systems could cause disruption to our operations or cause challenges with respect to our compliance with laws, regulations or other applicable standards. As the development and implementation of our information technology systems (including our operating systems) evolve, we may elect to modify, replace or abandon certain technology initiatives, which could result in write‑downs.
Any disruption in our information technology systems, including capacity limitations, instabilities, or failure to operate as expected, could, depending on the magnitude of the problem, adversely impact our business, financial position, results of operations and cash flows, including by limiting our capacity to monitor, operate and control our operations effectively. Failures of our
16
information technology systems could also lead to violations of privacy laws, regulations, trade guidelines or practices related to our customers and associates. If our disaster recovery plans do not work as anticipated, or if the third‑party vendors to which we have outsourced certain information technology, contact center or other services fail to fulfill their obligations to us, our operations may be adversely affected, and any of these circumstances could adversely affect our reputation, businesses, financial position, results of operations and cash flows.
Changes in the services we deliver or the products we use could affect our reputation, businesses, financial position, results of operations and cash flows and our future plans.
Our financial performance is affected by changes in the services and products we offer to customers. There can be no assurance that our strategies or product offerings will succeed in increasing revenue and growing profitability. An unsuccessful execution of strategies, including the rollout or adjustment of our new services or products or sales and marketing plans, could cause us to reevaluate or change our business strategies and could have a material adverse impact on our reputation, businesses, financial position, results of operations and cash flows.
If we fail to protect the security of personal information about our customers, associates and third parties, we could be subject to interruption of our business operations, private litigation, reputational damage and costly penalties.
We rely on, among other things, commercially available systems, software, tools and monitoring to provide security for processing, transmission and storage of confidential information of customers, associates and third parties, such as payment cards and personal information. The systems currently used for transmission and approval of payment card transactions, and the technology utilized in payment cards themselves, all of which can put payment card data at risk, are central to meeting standards set by the payment card industry (“PCI”). We continue to evaluate and modify these systems and protocols for PCI compliance purposes, and such PCI standards may change from time to time. Activities by third parties, advances in computer and software capabilities and encryption technology, new tools and discoveries and other events or developments may facilitate or result in a compromise or breach of these systems. Any compromises, breaches or errors in applications related to these systems or failures to comply with standards set by the PCI could cause damage to our reputation and interruptions in our operations, including customers’ ability to pay for services and products by credit card or their willingness to purchase our services and products and could result in a violation of applicable laws, regulations, orders, industry standards or agreements and subject us to costs, penalties and liabilities. We are subject to risks caused by data breaches and operational disruptions, particularly through cyber-attack or cyber-intrusion, including by computer hackers, foreign governments and cyber terrorists. The frequency of data breaches of companies and governments have increased in recent years as the number, intensity and sophistication of attempted attacks and intrusions from around the world have increased. The occurrence of any of these events could have a material adverse impact on our reputation, businesses, financial position, results of operations and cash flows.
We may not be able to adequately protect our intellectual property and other proprietary rights that are material to our businesses.
Our ability to compete effectively depends in part on our rights to proprietary information, service marks, trademarks, trade names and other intellectual property rights we own or license, particularly our registered brand names, ServiceMaster, Terminix, American Home Shield, ServiceMaster Restore, ServiceMaster Clean, Merry Maids, Furniture Medic and AmeriSpec. We have not sought to register or protect every one of our marks either in the United States or in every country in which they are or may be used. Furthermore, because of the differences in foreign trademark, patent and other intellectual property or proprietary rights laws, we may not receive the same protection in other countries as we would in the United States. If we are unable to protect our proprietary information and intellectual property rights, including brand names, it could cause a material adverse impact on our reputation, businesses, financial position, results of operations and cash flows. Litigation may be necessary to enforce our intellectual property rights and protect our proprietary information, or to defend against claims by third parties that our products, services or activities infringe their intellectual property rights.
Future acquisitions or other strategic transactions could negatively affect our reputation, businesses, financial position, results of operations and cash flows.
We may pursue strategic transactions in the future, which could involve acquisitions or dispositions of businesses or assets such as our previously announced intention to spin off our American Home Shield business to our stockholders. Any future strategic transaction could involve integration or implementation challenges, business disruption or other risks, or change our business profile significantly. Any inability on our part to consolidate and manage growth from acquired businesses or successfully implement other strategic transactions could have an adverse impact on our reputation, businesses, financial position, results of operations and cash flows. Any acquisition that we make may not provide us with the benefits that were anticipated when entering into such acquisition. The process of integrating an acquired business may create unforeseen difficulties and expenses, including the diversion of resources needed to integrate new businesses, technologies, products, personnel or systems; the inability to retain associates, customers and suppliers; the assumption of actual or contingent liabilities (including those relating to the environment); failure to effectively and timely adopt and adhere to our internal control processes and other policies; write‑offs or impairment charges relating to goodwill and other intangible assets; unanticipated liabilities relating to acquired businesses; and potential expense associated with litigation with sellers of such businesses. Any future disposition transactions could also impact our businesses and may subject us to various risks, including failure to obtain appropriate value for the disposed businesses, post‑closing claims being levied against us and disruption to our other businesses during the sale process or thereafter.
17
We may be required to recognize additional impairment charges.
We have significant amounts of goodwill and intangible assets, such as trade names. In accordance with applicable accounting standards, goodwill and indefinite-lived intangible assets are not amortized and are subject to assessment for impairment by applying a fair‑value based test annually, or more frequently if there are indicators of impairment, including:
|
· |
significant adverse changes in the business climate, including economic or financial conditions; |
|
· |
significant adverse changes in expected operating results; |
|
· |
adverse actions or assessments by regulators; |
|
· |
unanticipated competition; |
|
· |
loss of key personnel; and |
|
· |
a current expectation that it is more likely than not that a reporting unit or intangible asset will be sold or otherwise disposed of. |
Based upon future economic and financial market conditions, the operating performance of our reporting units and other factors, including those listed above, we may incur impairment charges in the future. It is possible that such impairment, if required, could be material. Any future impairment charges that we are required to record could have a material adverse impact on our results of operations.
We are subject to various restrictive covenants that could materially adversely impact our businesses, financial position, results of operations and cash flows.
From time to time, we enter into noncompetition agreements or other restrictive covenants (e.g., exclusivity, take or pay and non‑solicitation obligations), including in connection with business dispositions or strategic contracts, that restrict us from entering into lines of business or operating in certain geographic areas into which we may desire to expand our businesses. We also are subject to various non‑solicitation and no‑hire covenants that may restrict our ability to solicit potential customers or associates. In connection with the proposed spin-off of the American Home Shield business, we expect to enter into noncompetition, non-solicitation and no-hire covenants and restrictive agreements. If we do not comply with such restrictive covenants, or if a dispute arises regarding the scope and interpretation thereof, litigation could ensue, which could have an adverse impact on our businesses, financial position, results of operations and cash flows. Further, to the extent that such restrictive covenants prevent us from taking advantage of business opportunities, our businesses, financial position, results of operations and cash flows may be adversely impacted.
Our business process outsourcing initiatives have increased our reliance on third‑party vendors and may expose our businesses to harm upon the termination or disruption of our third‑party vendor relationships.
Our strategy to increase profitability, in part, by reducing our costs of operations includes the implementation of certain business process outsourcing initiatives. Any disruption, termination or substandard performance of these outsourced services, including possible breaches by third‑party vendors of their agreements with us, could adversely affect our brands, reputation, customer relationships, financial position, results of operations and cash flows. Also, to the extent a third‑party outsourcing provider relationship is terminated, there is a risk of disputes or litigation and that we may not be able to enter into a similar agreement with an alternate provider in a timely manner or on terms that we consider favorable, and even if we find an alternate provider, or choose to insource such services, there are significant risks associated with any transitioning activities. In addition, to the extent we decide to terminate outsourcing services and insource such services, there is a risk that we may not have the capabilities to perform these services internally, resulting in a disruption to our businesses, which could adversely impact our reputation, businesses, financial position, results of operations and cash flows. We could incur costs, including personnel and equipment costs, to insource previously outsourced services like these, and these costs could adversely affect our results of operations and cash flows.
Our future success depends on our ability to attract, retain and maintain positive relations with trained workers and third‑party contractors.
Our future success and financial performance depend substantially on our ability to attract, train and retain workers, attract and retain third‑party contractors and ensure third‑party contractor compliance with our policies and standards and performance expectations. However, these third‑party contractors are independent parties that we do not control, and who own, operate and oversee the daily operations of their individual businesses. If third‑party contractors do not successfully operate their businesses in a manner consistent with required laws, standards and regulations, we could be subject to claims from regulators or legal claims for the actions or omissions of such third‑party contractors. In addition, our relationship with our third‑party contractors could become strained (including resulting in litigation) as we impose new standards or assert more rigorous enforcement practices of the existing required standards and performance expectations. When a contractor relationship is terminated, there is a risk that we may not be able to enter into a similar agreement with an alternate contractor in a timely manner or on favorable terms. We could incur costs to transition to other contractors, and these costs could materially adversely affect our results of operations and cash flows.
We are also dependent on vendors for replacement appliances, systems and parts and the ability to rely on the pricing for such in the contracts we negotiate with these vendors. If we cannot obtain the replacement appliances, systems or parts from vendors within our existing stable of vendors to satisfy consumer claims, we may be forced to obtain replacement appliances, systems and parts from other vendors at higher costs, which could have a material adverse impact on our businesses, financial position, results of operations and cash flows.
18
Risks Related to Our Substantial Indebtedness
We have substantial indebtedness and may incur substantial additional indebtedness, which could adversely affect our financial health and our ability to obtain financing in the future, react to changes in our businesses and satisfy our obligations.
As of December 31, 2017, we had approximately $2.8 billion of total consolidated long-term indebtedness, including the current portion of long-term debt, outstanding.
As of December 31, 2017, there were $33 million of letters of credit outstanding and $267 million of available borrowing capacity under the Revolving Credit Facility. In addition, we are able to incur additional indebtedness in the future, subject to the limitations contained in the agreements governing our indebtedness. Our substantial indebtedness could have important consequences to you. Because of our substantial indebtedness:
|
· |
our ability to engage in acquisitions without raising additional equity or obtaining additional debt financing is limited; |
|
· |
our ability to obtain additional financing for working capital, capital expenditures, acquisitions, debt service requirements or general corporate purposes and our ability to satisfy our obligations with respect to our indebtedness may be impaired in the future; |
|
· |
a large portion of our cash flow from operations must be dedicated to the payment of principal and interest on our indebtedness, thereby reducing the funds available to us for other purposes; |
|
· |
we are exposed to the risk of increased interest rates because a portion of our borrowings are or will be at variable rates of interest; |
|
· |
it may be more difficult for us to satisfy our obligations to our creditors, resulting in possible defaults on, and acceleration of, such indebtedness; |
|
· |
we may be more vulnerable to general adverse economic and industry conditions; |
|
· |
we may be at a competitive disadvantage compared to our competitors with proportionately less indebtedness or with comparable indebtedness on more favorable terms and, as a result, they may be better positioned to withstand economic downturns; |
|
· |
our ability to refinance indebtedness may be limited or the associated costs may increase; |
|
· |
our flexibility to adjust to changing market conditions and ability to withstand competitive pressures could be limited; and |
|
· |
we may be prevented from carrying out capital spending and restructurings that are necessary or important to our growth strategy and efforts to improve operating margins of our businesses. |
Increases in interest rates would increase the cost of servicing our indebtedness and could reduce our profitability.
A significant portion of our outstanding indebtedness, including indebtedness incurred under the Credit Facilities, bears interest at variable rates. As a result, increases in interest rates would increase the cost of servicing our indebtedness and could materially reduce our profitability and cash flows. As of December 31, 2017, each one percentage point change in interest rates would result in an approximately $10 million change in the annual interest expense on the Term Loan Facility after considering the impact of the effective interest rate swaps. Assuming all revolving loans were fully drawn as of December 31, 2017, each one percentage point change in interest rates would result in an approximately $3 million change in annual interest expense on the Revolving Credit Facility. The impact of increases in interest rates could be more significant for us than it would be for some other companies because of our substantial indebtedness.
A lowering or withdrawal of the ratings, outlook or watch assigned to our debt securities by rating agencies may increase our future borrowing costs and reduce our access to capital.
Our indebtedness currently has a non‑investment grade rating, and any rating, outlook or watch assigned could be lowered or withdrawn entirely by a rating agency if, in that rating agency’s judgment, current or future circumstances relating to the basis of the rating, outlook or watch, such as adverse changes to our businesses, so warrant. Any future lowering of our ratings, outlook or watch likely would make it more difficult or more expensive for us to obtain additional debt financing.
The agreements and instruments governing our indebtedness contain restrictions and limitations that could significantly impact our ability to operate our businesses.
The Credit Facilities contain covenants that, among other things, restrict our ability to:
|
· |
incur additional indebtedness (including guarantees of other indebtedness); |
|
· |
receive dividends from certain of our subsidiaries, redeem stock or make other restricted payments, including investments and, in the case of the Revolving Credit Facility, make acquisitions; |
|
· |
prepay, repurchase or amend the terms of certain outstanding indebtedness; |
|
· |
enter into certain types of transactions with affiliates; |
|
· |
transfer or sell assets; |
|
· |
create liens; |
|
· |
merge, consolidate or sell all or substantially all of our assets; and |
|
· |
enter into agreements restricting dividends or other distributions by our subsidiaries. |
19
The restrictions in the agreements governing the Credit Facilities and the instruments governing our other indebtedness may prevent us from taking actions that we believe would be in the best interest of our businesses and may make it difficult for us to execute our business strategy successfully or effectively compete with companies that are not similarly restricted. We may also incur future debt obligations that might subject us to additional restrictive covenants that could affect our financial and operational flexibility. We may be unable to refinance our indebtedness, at maturity or otherwise, on terms acceptable to us, or at all.
Our ability to comply with the covenants and restrictions contained in the agreements governing the Credit Facilities and the instruments governing our other indebtedness may be affected by economic, financial and industry conditions beyond our control including credit or capital market disruptions. The breach of any of these covenants or restrictions could result in a default that would permit the applicable lenders to declare all amounts outstanding thereunder to be due and payable, together with accrued and unpaid interest. If we are unable to repay indebtedness, lenders having secured obligations, such as the lenders under the Credit Facilities, could proceed against the collateral securing the indebtedness. In any such case, we may be unable to borrow under the Credit Facilities and may not be able to repay the amounts due under such facilities or our other outstanding indebtedness. This could have serious consequences to our financial position and results of operations and could cause us to become bankrupt or insolvent.
Our ability to generate the significant amount of cash needed to pay interest and principal on our indebtedness and our ability to refinance all or a portion of our indebtedness or obtain additional financing depends on many factors beyond our control.
We are a holding company, and as such we have no independent operations or material assets other than ownership of equity interests in our subsidiaries. We depend on our subsidiaries to distribute funds to us so that we may pay obligations and expenses, including satisfying obligations with respect to indebtedness. Our ability to make scheduled payments on, or to refinance our obligations under, our indebtedness depends on the financial and operating performance of our subsidiaries and their ability to make distributions and dividends to us, which, in turn, depends on their results of operations, cash flows, cash requirements, financial position and general business conditions and any legal and regulatory restrictions on the payment of dividends to which they may be subject, many of which may be beyond our control.
There are third-party restrictions on the ability of certain of our subsidiaries to transfer funds to us. If we cannot receive sufficient distributions from our subsidiaries, we may not be able to meet our obligations to fund general corporate expenses or service our debt obligations. These restrictions are related to regulatory requirements at American Home Shield and to a subsidiary borrowing arrangement at ServiceMaster Acceptance Company Limited Partnership (“SMAC”). The payment of ordinary and extraordinary dividends by our home service plan and similar subsidiaries (through which we conduct our American Home Shield business) are subject to significant regulatory restrictions under the laws and regulations of the states in which they operate. Among other things, such laws and regulations require certain such subsidiaries to maintain minimum capital and net worth requirements and may limit the amount of ordinary and extraordinary dividends and other payments that these subsidiaries can pay to us. As of December 31, 2017, the total net assets subject to these third-party restrictions was $192 million. Such limitations are expected to be in effect for the foreseeable future.
We may be unable to maintain a level of cash flows from operating activities sufficient to permit us to pay the principal and interest on our indebtedness. If our cash flow and capital resources are insufficient to fund our debt service obligations, we may be forced to reduce or delay capital expenditures, sell assets, seek to obtain additional equity capital or restructure our indebtedness. In the future, our cash flow and capital resources may not be sufficient for payments of interest on and principal of our indebtedness, and such alternative measures may not be successful and may not permit us to meet our scheduled debt service obligations.
If we cannot make scheduled payments on our indebtedness, we will be in default, the lenders under the Credit Facilities could terminate their commitments to loan money, the secured lenders could foreclose against the assets securing their borrowings and we could be forced into bankruptcy or liquidation.
Despite our indebtedness levels, we and our subsidiaries may be able to incur substantially more indebtedness. This could further exacerbate the risks associated with our substantial indebtedness.
We and our subsidiaries may be able to incur substantial additional indebtedness in the future. The terms of the instruments governing our indebtedness do not prohibit us or fully prohibit our subsidiaries from doing so. The Credit Facilities permit additional borrowings beyond the committed amounts under certain circumstances. If new indebtedness is added to our current indebtedness levels, the related risks we face would increase, and we may not be able to meet all of our debt obligations.
Risks Related to Our Common Stock
ServiceMaster is a holding company with no operations of its own, and it depends on its subsidiaries for cash to fund all of its operations and expenses, including to make future dividend payments, if any.
ServiceMaster’s operations are conducted entirely through our subsidiaries, and our ability to generate cash to fund our operations and expenses, to pay dividends or to meet debt service obligations is highly dependent on the earnings and the receipt of funds from our subsidiaries through dividends or intercompany loans. Deterioration in the financial condition, earnings or cash flow of our subsidiaries for any reason could limit or impair their ability to pay such distributions. Additionally, to the extent that ServiceMaster needs funds, and its subsidiaries are restricted from making such distributions under applicable law or regulation or under the terms of our financing arrangements, or are otherwise unable to provide such funds, it could materially adversely affect our businesses, financial condition, results of operations or prospects.
20
We do not currently expect to declare or pay dividends on our common stock for the foreseeable future. Payments of dividends, if any, will be at the sole discretion of our board of directors after taking into account various factors, including general and economic conditions, our financial condition and operating results, our available cash and current and anticipated cash needs, capital requirements, contractual, legal, tax and regulatory restrictions and implications of the payment of dividends by us to our stockholders or by our subsidiaries to us, and such other factors as our board of directors may deem relevant. In addition, Delaware law may impose requirements that may restrict our ability to pay dividends to holders of our common stock. To the extent that we determine in the future to pay dividends on our common stock, none of our subsidiaries will be obligated to make funds available to us for the payment of dividends.
The market price of our common stock may be volatile and could decline.
The market price of our common stock may fluctuate significantly. Among the factors that could affect our stock price are:
|
· |
market reaction to our proposed spin-off of the American Home Shield business; |
|
· |
industry or general market conditions; |
|
· |
domestic and international economic factors unrelated to our performance; |
|
· |
lawsuits, enforcement actions and other claims by third parties or governmental authorities; |
|
· |
changes in our customers’ preferences; |
|
· |
new regulatory pronouncements and changes in regulatory guidelines; |
|
· |
actual or anticipated fluctuations in our quarterly operating results; |
|
· |
changes in securities analysts’ estimates of our financial performance or lack of research coverage and reports by industry analysts; |
|
· |
action by institutional stockholders or other large stockholders; |
|
· |
failure to meet any guidance given by us or any change in any guidance given by us, or changes by us in our guidance practices; |
|
· |
announcements by us of significant impairment charges; |
|
· |
speculation in the press or investment community; |
|
· |
investor perception of us and our industry; |
|
· |
changes in market valuations or earnings of similar companies; |
|
· |
announcements by us or our competitors of significant contracts, acquisitions, dispositions or strategic partnerships; |
|
· |
war, terrorist acts and epidemic disease; |
|
· |
any future sales of our common stock or other securities; and |
|
· |
additions or departures of key personnel. |
The stock markets have experienced volatility in recent years that has been unrelated to the operating performance of particular companies. These broad market fluctuations may adversely affect the market price of our common stock. In the past, following periods of volatility in the market price of a company’s securities, class action litigation has often been instituted against the affected company. Any litigation of this type brought against us could result in substantial costs and a diversion of our management’s attention and resources, which would harm our businesses, operating results and financial condition.
Future sales of shares by existing stockholders could cause our stock price to decline.
Sales of substantial amounts of our common stock in the public market, or the perception that these sales could occur, could cause the market price of our common stock to decline. These sales, or the possibility that these sales may occur, also might make it more difficult for us to sell equity securities in the future at a time and at a price that we deem appropriate.
In July 2014, we filed a registration statement on Form S-8 under the Securities Act to register the shares of common stock to be issued under our equity compensation plans and, as a result, all shares of common stock acquired upon exercise of (i) stock options granted under these plans and (ii) other equity based awards granted under the ServiceMaster Global Holdings, Inc. 2014 Omnibus Incentive Plan (“Omnibus Incentive Plan”), including approximately 4.5 million shares of our common stock that have been sold in the public market through the exercise of stock options as of December 31, 2017, are freely tradable under the Securities Act, unless purchased by our affiliates. As of December 31, 2017, there were stock options outstanding to purchase a total of 1,125,162 shares of our common stock, there were 571,924 shares of our common stock subject to restricted stock units and there were 93,928 shares of our common stock subject to performance share units. In addition, 6,455,971 shares of our common stock are reserved for future issuances under our Omnibus Incentive Plan.
On February 24, 2015, our board of directors approved and recommended for approval by our stockholders the ServiceMaster Global Holdings, Inc. Employee Stock Purchase Plan (“Employee Stock Purchase Plan”), which became effective for offering periods commencing July 1, 2015. The Employee Stock Purchase Plan is intended to qualify for the favorable tax treatment under Section 423 of the Code. Under the plan, eligible employees of the Company may purchase common stock, subject to IRS limits, during pre-specified offering periods at a discount established by the Company not to exceed ten percent of the then current fair market value. On April 27, 2015, our stockholders approved the Employee Stock Purchase Plan with a maximum of one million shares of common stock authorized for sale under the plan. On November 3, 2015, we filed a registration statement on Form S-8 under the Securities Act to register the one million shares of common stock that may be issued under the Employee Stock Purchase Plan and,
21
as a result, all shares of common stock acquired under the Employee Stock Purchase Plan will be freely tradable under the Securities Act, unless purchased by our affiliates. As of December 31, 2017, 843,584 shares of our common stock are reserved for future issuances under the Employee Stock Purchase Plan. As a result of the planned American Home Shield spin-off described in Note 1 to the consolidated financial statements, the Employee Stock Purchase Plan was suspended effective January 1, 2018.
In the future, we may issue additional shares of common stock or other equity or debt securities convertible into or exercisable or exchangeable for shares of our common stock in connection with a financing, acquisition, litigation settlement or employee arrangement or otherwise. Any of these issuances could result in substantial dilution to our existing stockholders and could cause the trading price of our common stock to decline.
If securities or industry analysts do not publish research or publish misleading or unfavorable research about our businesses, our stock price and trading volume could decline.
The trading market for our common stock depends in part on the research and reports that securities or industry analysts publish about us or our businesses. If one or more of the analysts that covers our common stock downgrades our stock or publishes misleading or unfavorable research about our businesses, our stock price would likely decline. If one or more of the analysts ceases coverage of our common stock or fails to publish reports on us regularly, demand for our common stock could decrease, which could cause our common stock price or trading volume to decline.
Future offerings of debt or equity securities which would rank senior to our common stock may adversely affect the market price of our common stock.
If, in the future, we decide to issue debt or equity securities that rank senior to our common stock, it is likely that such securities will be governed by an indenture or other instrument containing covenants restricting our operating flexibility. Additionally, any convertible or exchangeable securities that we issue in the future may have rights, preferences and privileges more favorable than those of our common stock and may result in dilution to owners of our common stock. We and, indirectly, our stockholders, will bear the cost of issuing and servicing such securities. Because our decision to issue debt or equity securities in any future offering will depend on market conditions and other factors beyond our control, we cannot predict or estimate the amount, timing or nature of our future offerings. Thus, holders of our common stock will bear the risk of our future offerings reducing the market price of our common stock and diluting the value of their stock holdings in us.
Anti-takeover provisions in our amended and restated certificate of incorporation and amended and restated by-laws could discourage, delay or prevent a change of control of our company and may affect the trading price of our common stock.
Our amended and restated certificate of incorporation and amended and restated by-laws include a number of provisions that may discourage, delay or prevent a change in our management or control over us that stockholders may consider favorable. For example, our amended and restated certificate of incorporation and amended and restated by-laws collectively:
|
· |
authorize the issuance of “blank check” preferred stock that could be issued by our board of directors to thwart a takeover attempt; |
|
· |
provide for a classified board of directors, which divides our board of directors into three classes, with members of each class serving staggered three-year terms, which prevents stockholders from electing an entirely new board of directors at an annual meeting; |
|
· |
limit the ability of stockholders to remove directors; |
|
· |
provide that vacancies on our board of directors, including vacancies resulting from an enlargement of our board of directors, may be filled only by a majority vote of directors then in office; |
|
· |
prohibit stockholders from calling special meetings of stockholders; |
|
· |
prohibit stockholder action by written consent, thereby requiring all actions to be taken at a meeting of the stockholders; |
|
· |
establish advance notice requirements for nominations of candidates for election as directors or to bring other business before an annual meeting of our stockholders; and |
|
· |
require the approval of holders of at least 662/3% of the outstanding shares of our common stock to amend our amended and restated by-laws and certain provisions of our amended and restated certificate of incorporation. |
These provisions may prevent our stockholders from receiving the benefit from any premium to the market price of our common stock offered by a bidder in a takeover context. Even in the absence of a takeover attempt, the existence of these provisions may adversely affect the prevailing market price of our common stock if the provisions are viewed as discouraging takeover attempts in the future.
Our amended and restated certificate of incorporation and amended and restated by laws may also make it difficult for stockholders to replace or remove our management. These provisions may facilitate management entrenchment that may delay, deter, render more difficult or prevent a change in our control, which may not be in the best interests of our stockholders.
22
We do not intend to pay cash dividends on our common stock and, consequently, your ability to achieve a return on your investment will depend on appreciation in the price of our common stock.
We do not intend to declare and pay cash dividends on our common stock for the foreseeable future. We currently intend to use our future earnings, if any, to repay debt, to repurchase shares of our common stock, to fund our growth, to develop our businesses and for working capital needs and general corporate purposes. Therefore, you are not likely to receive any cash dividends on your common stock for the foreseeable future, and the success of an investment in shares of our common stock will depend upon any future appreciation in their value. There is no guarantee that shares of our common stock will appreciate in value or even maintain the price at which our stockholders have purchased their shares. In addition, ServiceMaster’s operations are conducted almost entirely through our subsidiaries. As such, to the extent that we determine in the future to pay cash dividends on our common stock, none of our subsidiaries will be obligated to make funds available to ServiceMaster for the payment of dividends. Further, the agreements governing the Credit Facilities may restrict the ability of our subsidiaries to pay dividends, make loans or otherwise transfer assets to us. In addition, the payment of ordinary and extraordinary dividends by our subsidiaries that are regulated as insurance, home service, or similar companies is subject to applicable state law limitations.
Our amended and restated certificate of incorporation designates the Court of Chancery of the State of Delaware as the exclusive forum for certain litigation that may be initiated by our stockholders, which could limit our stockholders’ ability to obtain a favorable judicial forum for disputes with us.
Our amended and restated certificate of incorporation provides that the Court of Chancery of the State of Delaware is the sole and exclusive forum for (i) any derivative action or proceeding brought on our behalf, (ii) any action asserting a claim of breach of a fiduciary duty owed to us or our stockholders by any of our directors, officers, employees or agents, (iii) any action asserting a claim against us arising under the General Corporation Law of the State of Delaware or (iv) any action asserting a claim against us that is governed by the internal affairs doctrine. By becoming a stockholder in our company, you will be deemed to have notice of and have consented to the provisions of our amended and restated certificate of incorporation related to choice of forum. The choice of forum provision in our amended and restated certificate of incorporation may limit our stockholders’ ability to obtain a favorable judicial forum for disputes with us.
There may be substantial changes in our stockholder base.
As a result of the proposed spin-off of the American Home Shield business, many ServiceMaster investors may elect to sell ServiceMaster shares because ServiceMaster’s business profile will be changing. This may not be aligned with a holder’s investment strategy and may cause the holder to sell the shares of ServiceMaster common stock either before or after the distribution. As a result, our stock price may decline or experience volatility as our stockholder base changes.
Risks Related to the Spin-off of the American Home Shield Business
The proposed American Home Shield spin-off is subject to various risks and uncertainties, and may not be completed on the terms or timeline currently contemplated, if at all.
On July 26, 2017, we announced our plan to spin-off our American Home Shield business. The spin-off, which is expected to be completed in the third quarter of 2018, is subject to customary conditions, including the effectiveness of a Registration Statement on Form 10, receipt of a favorable ruling from the IRS concerning certain tax matters and final approval by the Company’s board of directors. There can be no assurance that the spin-off of American Home Shield will be completed. Unanticipated developments in the proposed spin-off, including, but not limited to, with respect to covenant waivers, regulatory approvals or clearances, receipt of a favorable ruling from the IRS, uncertainty of the financial markets and challenges in establishing infrastructure or processes, could delay or prevent the completion of the proposed spin-off or cause the proposed spin-off to occur on terms or conditions that are different from those currently expected.
The proposed American Home Shield spin-off may be more expensive or challenging than anticipated, which may materially and adversely affect our financial position, results of operations and cash flows.
Executing the proposed spin-off will require us to incur costs, and could distract the attention of our senior management and key employees, which could disrupt operations and result in the loss of business opportunities, which could adversely affect our businesses, financial condition, and results of operations. We may also experience increased difficulties in attracting, retaining and motivating key employees during the pendency of the spin-off and following its completion, which could harm our financial position, results of operations and cash flows.
We may not achieve some or all of the expected benefits of the spin-off, and the spin-off may materially and adversely affect our financial position, results of operations and cash flows.
Even if the proposed spin-off is completed, we may not realize some or all of the anticipated strategic, operational, marketing, financial or other benefits from the spin-off, or the realization of such benefits may be delayed. The spin-off and distribution are expected to provide the following benefits, among others:
|
· |
a distinct investment identity allowing investors to evaluate the merits, strategy, performance and future prospects of our businesses separately from American Home Shield; |
|
· |
more efficient allocation of capital for both ServiceMaster and American Home Shield; |
23
|
· |
enhanced management focus to more effectively pursue distinct operating priorities and strategies at ServiceMaster and American Home Shield; |
|
· |
the ability to pursue value‑enhancing acquisitions with fewer regulatory obstacles in two consolidating industries; and |
|
· |
facilitation of incentive compensation arrangements for employees and management that are more directly tied to the performance of the relevant company’s business, and enhancement of employee hiring and retention by, among other things, improving the alignment of management and employee incentives with performance and growth objectives. |
We may not achieve these and other anticipated benefits for a variety of reasons, including, among others that: (a) the spin-off will require significant amounts of management’s time and effort, which may divert management’s attention from operating and growing our businesses; (b) following the spin-off and distribution, we may be more susceptible to market fluctuations and other adverse events; (c) following the spin-off and distribution, our businesses will be less diversified than prior to the spin-off and distribution; and (d) the other actions required to separate the respective businesses could disrupt operations. If we fail to achieve some or all of the benefits expected to result from the spin-off, or if such benefits are delayed, it could have a material adverse effect on our financial position, results of operations and cash flows.
Moreover, the spin-off may adversely affect our businesses. Separating the businesses may result in increased costs that could negatively impact the balance sheet, income statement and cash flows of each business. Additionally, if the proposed spin-off is completed, both companies will be smaller, less diversified companies with a narrower business focus and may be more vulnerable to changing market conditions and competitive pressures, which could materially and adversely affect their respective businesses, financial conditions and results of operations. There can be no assurance that the combined value of the common stock of the two publicly traded companies following the completion of the proposed spin-off will be equal to or greater than what the value of our common stock would have been had the proposed spin-off not occurred.
ITEM 1B. UNRESOLVED STAFF COMMENTS
None.
24
Our corporate headquarters and the headquarters for Terminix are located in leased premises at 860 Ridge Lake Boulevard, Memphis, Tennessee. The headquarters for American Home Shield and the Franchise Services Group are currently located in leased premises at 889 Ridge Lake Boulevard, Memphis, Tennessee. In 2016, we entered into an office lease agreement with Peabody Place Centre GP that will result in the relocation of our corporate headquarters, which we refer to as our Global Service Center, to downtown Memphis, Tennessee. Effective March 1, 2018, the address for our Global Service Center will be 150 Peabody Place, Memphis, Tennessee 38103. We terminated our lease agreement for our headquarters at 860 Ridge Lake Boulevard during the first quarter of 2018.
We and our operating companies own and lease a variety of facilities, principally in the United States, for branch and service center operations and for office, storage, customer care centers and data processing space. Our Terminix business leases four customer care centers throughout the U.S. that field inbound claims calls and initiate sales calls in Dallas, Texas; Memphis, Tennessee; Phoenix, Arizona; and Tampa, Florida. Our American Home Shield business operates five customer care centers in Carroll, Iowa; LaGrange, Georgia; Memphis, Tennessee; Phoenix, Arizona; and Salt Lake City, Utah. The facilities in Carroll and LaGrange are owned and the facilities in Memphis, Phoenix and Salt Lake City are leased. In addition, we lease space for a training facility and a product warehouse in Memphis, Tennessee. Our branches are strategically located to optimize route efficiency, market coverage and branch overhead. The following table identifies the number of owned and leased facilities, other than the headquarter properties listed above, used by each of our reportable segments as of December 31, 2017. We believe that these facilities, when considered with the Global Service Center, customer care center facilities, offices and training facilities described above, are suitable and adequate to support the current needs of its business.
|
|
||||
|
|
Owned |
Leased |
||
|
Reportable Segment |
Facilities |
Facilities |
||
|
Terminix |
17 | 326 | ||
|
American Home Shield |
2 | 5 | ||
|
Franchise Services Group |
— |
5 |
On January 20, 2017, TMX USVI and TMX LP, each an indirect, wholly-owned subsidiary of the Company, entered into a revised Plea Agreement in connection with the investigation initiated by the DOJ into allegations that a local Terminix branch used methyl bromide as a fumigant at a resort in St. John, U.S. Virgin Islands. The Plea Agreement was intended to resolve four misdemeanor charges of violations of the Federal Insecticide, Fungicide, and Rodenticide Act related to improper applications of methyl bromide. At a hearing on November 20, 2017, TMX USVI and TMX LP were sentenced for pleading guilty to four misdemeanor charges of violations of the Federal Insecticide, Fungicide, and Rodenticide Act related to improper applications of methyl bromide. Under the terms of sentencing handed down (i) TMX USVI and TMX LP each paid a fine of $4.6 million (total of $9.2 million); (ii) TMX USVI and TMX LP paid a total of $1.2 million to the EPA for costs incurred by the EPA for the response and clean-up of the affected units at the resort in St. John; and (iii) both TMX USVI and TMX LP will serve a five-year probation period. In lieu of the $1 million community service payment that was proposed in the Plea Agreement, the court required TMX USVI and TMX LP to provide for training certification courses with respect to pesticide application and safety in the U.S. Virgin Islands over the next five years. We have recorded a $0.5 million charge for this training program.
The Company has previously recorded within Fumigation related matters in the consolidated statement of operations and comprehensive income total charges of $10 million in connection with the aforementioned criminal matter as of December 31, 2016. As a result of the sentencing, we have recorded an additional $0.9 million in charges in the fourth quarter of 2017.
On December 16, 2016, the U.S. Virgin Islands Department of Justice filed a civil complaint in the Superior Court of the Virgin Islands related to the aforementioned fumigation incident in a matter styled Government of the United States Virgin Islands v. The ServiceMaster Company, LLC, The Terminix International Company Limited Partnership, and Terminix International USVI, LLC. The amount and extent of any further potential penalties, fines, sanctions, costs and damages that the federal or other governmental authorities may yet impose, investigation or other costs and reputational harm, as well as the impact of any additional civil, criminal or other claims or judicial, administrative or regulatory proceedings resulting from or related to the U.S. Virgin Islands matter, which could be material, is not currently known, and any such further penalties, fines, sanctions, costs or damages would not be covered under the Company’s general liability insurance policies.
In addition to the above matters, the EPA has advised the Company that it has investigated potential pesticide misapplications in Hawaii. The Company has reached an agreement to resolve the investigation with the EPA for an amount less than $170,000. The resolution is subject to completion of a consent agreement with EPA.
25
In addition to the matters discussed above, in the ordinary course of conducting business activities, we and our subsidiaries become involved in judicial, administrative and regulatory proceedings involving both private parties and governmental authorities. These proceedings include insured and uninsured matters that are brought on an individual, collective, representative and class action basis, or other proceedings involving regulatory, employment, general and commercial liability, automobile liability, wage and hour, environmental and other matters. We have entered into settlement agreements in certain cases, including with respect to putative collective and class actions, which are subject to court or other approvals. If one or more of our settlements are not finally approved, we could have additional or different exposure, which could be material. Subject to the paragraphs above, we do not expect any of these proceedings to have a material effect on our reputation, business, financial position, results of operations or cash flows; however, we can give no assurance that the results of any such proceedings will not materially affect our reputation, business, financial position, results of operations and cash flows. See Note 3 to the consolidated financial statements for more details.
ITEM 4. MINE SAFETY DISCLOSURES
None.
26
ITEM 5. MARKET FOR REGISTRANT’S COMMON EQUITY, RELATED STOCKHOLDER MATTERS AND ISSUER PURCHASES OF EQUITY SECURITIES
Market Information
Our common stock is listed on the NYSE under the symbol ‘‘SERV.’’ Our common stock began trading on the NYSE on June 26, 2014. As of February 23, 2018, there were approximately 11 registered holders of our common stock.
The following table sets forth the high and low sale prices per share of our common stock during 2017 and 2016 as reported on the NYSE:
|
|
||||
|
|
High Sales Price |
Low Sales Price |
||
|
2017: |
||||
|
First Quarter |
$41.81 | $36.66 | ||
|
Second Quarter |
$42.45 | $36.34 | ||
|
Third Quarter |
$48.48 | $38.78 | ||
|
Fourth Quarter |
$52.87 | $43.75 | ||
|
2016: |
||||
|
First Quarter |
$42.21 | $34.36 | ||
|
Second Quarter |
$40.41 | $34.28 | ||
|
Third Quarter |
$41.49 | $33.28 | ||
|
Fourth Quarter |
$39.47 | $32.41 |
The graph below presents our cumulative total stockholder returns relative to the performance of the Standard & Poor’s 500 Composite Stock Index and Standard & Poor’s 400 Consumer Services Index, commencing on June 26, 2014, our initial day of trading. The graph assumes $100 invested at the opening price of our common stock on NYSE and each index on June 26, 2014.
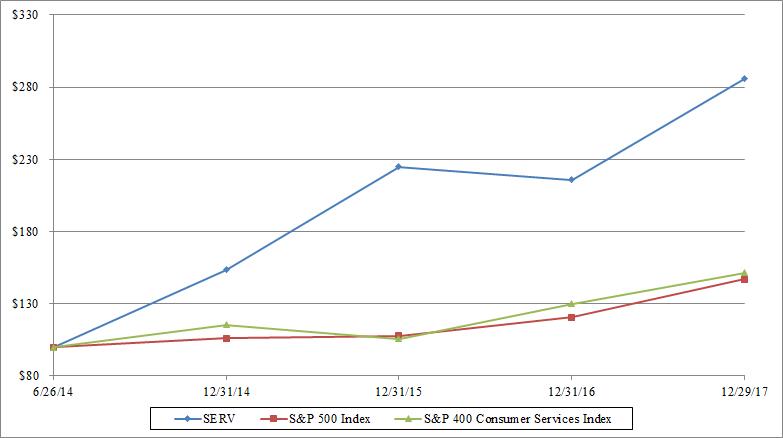
27
Dividends
We did not pay any cash dividends in 2015, 2016 or 2017. We do not intend to declare or pay cash dividends on our common stock for the foreseeable future. If the American Home Shield spin-off is completed, we expect to pay a dividend of shares of common stock of American Home Shield to ServiceMaster stockholders. We currently intend to use our future earnings, if any, to repay debt, to repurchase shares of our common stock, to fund our growth, to develop our business and for working capital needs and general corporate purposes. Our ability to pay cash dividends to holders of our common stock may be restricted by the Credit Facilities, insofar as we may seek to pay dividends out of funds made available to us by our subsidiaries. Any future determination to pay dividends on our common stock is subject to the discretion of our board of directors and will depend upon various factors, including our results of operations, financial condition, liquidity requirements, capital requirements, level of indebtedness, contractual restrictions with respect to payment of dividends, restrictions imposed by applicable law, general business conditions and other factors that our board of directors may deem relevant. See “Liquidity—Limitations on Distributions and Dividends by Subsidiaries” for a description of the impact of our restrictions under our debt instruments on our ability to pay dividends.
Share Repurchase Program
On February 23, 2016, our board of directors authorized a three-year share repurchase program, under which we may repurchase up to $300 million of outstanding shares of our common stock. As of December 31, 2017, we have repurchased $145 million of outstanding shares under this program, which is included in treasury stock on the consolidated statements of financial position. We expect to fund the share repurchases from net cash provided from operating activities. The share repurchase program is part of our capital allocation strategy that focuses on sustainable growth and maximizing stockholder value.
Issuer Purchases of Equity Securities
|
|
|||||||||||
|
|
Maximum dollar |
||||||||||
|
|
Total number of |
value of shares |
|||||||||
|
|
shares purchased as |
that may yet be |
|||||||||
|
|
Average |
part of publicly |
purchased under the |
||||||||
|
|
Total number of |
price paid |
announced plans or |
plans or programs |
|||||||
|
Period |
shares purchased |
per share |
programs |
(in millions)(1) |
|||||||
|
Jan. 1, 2017 through Mar. 31, 2017 |
1,338,426 |
(2) |
$ |
38.04 | 1,338,426 |
$ |
189 |
||||
|
Apr. 1, 2017 through June 30, 2017 |
871,571 |
(2) |
$ |
38.67 | 871,571 |
$ |
155 |
||||
|
July 1, 2017 through Sept. 30, 2017 |
833 |
(3) |
$ |
40.39 |
N/A |
N/A |
|||||
|
Q4 2017: |
|||||||||||
|
Oct. 1, 2017 through Oct. 31, 2017 |
— |
$ |
— |
N/A |
N/A |
||||||
|
Nov. 1, 2017 through Nov. 30, 2017 |
— |
$ |
— |
N/A |
N/A |
||||||
|
Dec. 1, 2017 through Dec. 31, 2017 |
1,299 |
(3) |
$ |
49.20 |
N/A |
N/A |
|||||
|
Oct. 1, 2017 through Dec. 31, 2017 |
1,299 |
$ |
49.20 |
N/A |
N/A |
||||||
|
Total |
2,212,129 |
$ |
38.29 | 2,209,997 |
$ |
155 |
|||||
___________________________________
|
(1) |
On February 23, 2016, our board of directors authorized a three-year share repurchase program, under which we may repurchase up to $300 million of outstanding shares of our common stock. |
|
(2) |
Shares were acquired as part of our share repurchase program. |
|
(3) |
Shares were acquired upon net settlement of deferred stock units (“DSUs”) to cover withholding tax obligations. |
28
ITEM 6. SELECTED FINANCIAL DATA
The following table sets forth our selected financial data derived from our audited consolidated financial statements for each of the periods indicated. The selected financial data presented below should be read in conjunction with Item 7 “Management’s Discussion and Analysis of Financial Condition and Results of Operations” and the consolidated financial statements and related notes included in Item 8 of this Annual Report on Form 10-K. Our consolidated financial information may not be indicative of our future performance.
Five-Year Financial Summary
|
|
||||||||||||||||||||
|
|
Year Ended December 31, |
|||||||||||||||||||
|
(In millions, except per share data) |
2017 |
2016 |
2015 |
2014 |
2013 |
|||||||||||||||
|
Operating Results: |
||||||||||||||||||||
|
Revenue |
$ |
2,912 |
$ |
2,746 |
$ |
2,594 |
$ |
2,457 |
$ |
2,293 | ||||||||||
|
Cost of services rendered and products sold |
1,552 | 1,448 | 1,375 | 1,298 | 1,220 | |||||||||||||||
|
Selling and administrative expenses |
773 | 711 | 666 | 669 | 691 | |||||||||||||||
|
401(k) Plan corrective contribution(1) |
(3) | 2 | 23 |
— |
— |
|||||||||||||||
|
Fumigation related matters(2) |
4 | 93 | 9 |
— |
— |
|||||||||||||||
|
Insurance reserve adjustment(3) |
— |
23 |
— |
— |
— |
|||||||||||||||
|
Impairment of software and other related costs(4) |
2 | 1 |
— |
47 |
— |
|||||||||||||||
|
Consulting agreement termination fees(5) |
— |
— |
— |
21 |
— |
|||||||||||||||
|
Interest expense |
150 | 153 | 167 | 219 | 247 | |||||||||||||||
|
Loss on extinguishment of debt(6) |
6 | 32 | 58 | 65 |
— |
|||||||||||||||
|
Income from continuing operations |
509 | 155 | 162 | 43 | 42 | |||||||||||||||
|
Net Income (Loss) |
510 | 155 | 160 | (57) | (507) | |||||||||||||||
|
Cash dividends per share |
$ |
— |
$ |
— |
$ |
— |
$ |
— |
$ |
— |
||||||||||
|
Weighted-average shares outstanding: |
||||||||||||||||||||
|
Basic |
134.4 | 135.3 | 135.0 | 112.8 | 91.6 | |||||||||||||||
|
Diluted |
135.4 | 137.3 | 136.6 | 113.8 | 92.2 | |||||||||||||||
|
Basic Earnings Per Share -- Continuing Operations |
$ |
3.79 |
$ |
1.15 |
$ |
1.20 |
$ |
0.38 |
$ |
0.46 | ||||||||||
|
Diluted Earnings Per Share -- Continuing Operations |
$ |
3.76 |
$ |
1.13 |
$ |
1.19 |
$ |
0.38 |
$ |
0.46 | ||||||||||
|
Financial Position (as of period end): |
||||||||||||||||||||
|
Total assets |
$ |
5,646 |
$ |
5,386 |
$ |
5,098 |
$ |
5,028 |
$ |
5,760 | ||||||||||
|
Total long-term debt |
2,787 | 2,831 | 2,752 | 3,026 | 3,867 | |||||||||||||||
|
Total shareholders' equity |
1,167 | 686 | 545 | 359 | 23 | |||||||||||||||
|
Cash Flow Data: |
||||||||||||||||||||
|
Net cash provided from operating activities from continuing operations |
$ |
413 |
$ |
325 |
$ |
398 |
$ |
289 |
$ |
208 | ||||||||||
|
Net cash used for investing activities from continuing operations |
(85) | (133) | (98) | (56) | (70) | |||||||||||||||
|
Net cash used for financing activities from continuing operations |
(152) | (102) | (381) | (312) | (78) | |||||||||||||||
|
Other Non-GAAP Financial Data: |
||||||||||||||||||||
|
Adjusted EBITDA(7) |
$ |
678 |
$ |
667 |
$ |
622 |
$ |
557 |
$ |
450 | ||||||||||
|
Adjusted EBITDA Margin(8) |
23.3 |
% |
24.3 |
% |
24.0 |
% |
22.7 |
% |
19.6 |
% |
||||||||||
|
Free Cash Flow(9) |
$ |
338 |
$ |
270 |
$ |
358 |
$ |
274 |
$ |
169 | ||||||||||
__________________________________
|
(1) |
Represents costs related to the 401(k) Plan described in Note 10 to the consolidated financial statements. |
|
(2) |
Represents charges for fumigation related matters described in Note 9 to the consolidated financial statements. |
|
(3) |
Represents an adjustment to the Company’s accrued self-insured claims related to automobile, general liability and workers’ compensation risk described in Note 9 to the consolidated financial statements. |
|
(4) |
For 2017 and 2016, represents the impairment of software and other related costs described in Note 2 to the consolidated financial statements. For 2014, represents an impairment charge related to the Company’s decision to abandon its effort to deploy a new operating system at American Home Shield. |
|
(5) |
Represents consulting agreement termination fees incurred in 2014 to terminate agreements with the private equity firms that owned the Company prior to our initial public offering in 2014. |
|
(6) |
For 2017, 2016 and 2015, represents a loss on extinguishment of debt as described in Note 11 to the consolidated financial statements. For 2014, represents a loss on extinguishment of debt related to the redemption of the then-existing credit facility in connection with our initial public offering. |
29
|
(7) |
We use Adjusted EBITDA to facilitate operating performance comparisons from period to period. Adjusted EBITDA is a supplemental measure of our performance that is not required by, or presented in accordance with, GAAP. Adjusted EBITDA is not a measurement of our financial performance under GAAP and should not be considered as an alternative to net income or any other performance measures derived in accordance with GAAP or as an alternative to net cash provided by operating activities or any other measures of our cash flow or liquidity. Adjusted EBITDA means net income (loss) before: (gain) loss from discontinued operations, net of income taxes; (benefit) provision for income taxes; loss on extinguishment of debt; interest expense; depreciation and amortization expense; 401(k) Plan corrective contribution; fumigation related matters; insurance reserve adjustment; non-cash stock-based compensation expense; restructuring charges; gain on sale of Merry Maids branches; non-cash impairment of software and other related costs; management and consulting fees; consulting agreement termination fees; and other non-operating expenses. |
We believe Adjusted EBITDA facilitates company-to-company operating performance comparisons by excluding potential differences caused by variations in capital structures (affecting net interest income and expense), taxation, the age and book depreciation of facilities and equipment (affecting relative depreciation expense), restructuring initiatives, consulting agreements and equity-based, long-term incentive plans, which may vary for different companies for reasons unrelated to operating performance.
Adjusted EBITDA is not necessarily comparable to other similarly titled financial measures of other companies due to the potential inconsistencies in the methods of calculation.
Adjusted EBITDA has limitations as an analytical tool, and should not be considered in isolation or as a substitute for analyzing our results as reported under GAAP. Some of these limitations are:
|
· |
Adjusted EBITDA does not reflect changes in, or cash requirements for, our working capital needs; |
|
· |
Adjusted EBITDA does not reflect our interest expense, or the cash requirements necessary to service interest or principal payments on our debt; |
|
· |
Adjusted EBITDA does not reflect our tax expense or the cash requirements to pay our taxes; |
|
· |
Adjusted EBITDA does not reflect historical capital expenditures or future requirements for capital expenditures or contractual commitments; |
|
· |
Although depreciation and amortization are non-cash charges, the assets being depreciated and amortized will often have to be replaced in the future, and Adjusted EBITDA does not reflect any cash requirements for such replacements; and |
|
· |
Other companies in our industries may calculate Adjusted EBITDA differently, limiting its usefulness as a comparative measure. |
30
The following table sets forth Adjusted EBITDA for each of our reportable segments and Corporate and reconciles Net Income (Loss) to total Adjusted EBITDA for the periods presented, which we consider to be the most directly comparable GAAP financial measure:
|
|
|||||||||||||||
|
|
Year Ended December 31, |
||||||||||||||
|
(In millions) |
2017 |
2016 |
2015 |
2014 |
2013 |
||||||||||
|
Net Income (Loss) |
$ |
510 |
$ |
155 |
$ |
160 |
$ |
(57) |
$ |
(507) | |||||
|
Depreciation and amortization expense |
103 | 94 | 84 | 100 | 99 | ||||||||||
|
401(k) Plan corrective contribution(a) |
(3) | 2 | 23 |
— |
— |
||||||||||
|
Fumigation related matters(b) |
4 | 93 | 9 |
— |
— |
||||||||||
|
Insurance reserve adjustment(c) |
— |
23 |
— |
— |
— |
||||||||||
|
Non-cash stock-based compensation expense(d) |
12 | 13 | 10 | 8 | 4 | ||||||||||
|
Restructuring charges(e) |
34 | 17 | 5 | 11 | 6 | ||||||||||
|
Gain on sale of Merry Maids branches(f) |
— |
(2) | (7) | (1) |
— |
||||||||||
|
Non-cash impairment of software and other related costs(g) |
2 | 1 |
— |
47 |
— |
||||||||||
|
Management and consulting fees(h) |
— |
— |
— |
4 | 7 | ||||||||||
|
Consulting agreement termination fees(i) |
— |
— |
— |
21 |
— |
||||||||||
|
(Gain) loss from discontinued operations, net of income taxes(j) |
— |
1 | 2 | 100 | 549 | ||||||||||
|
(Provision) benefit for income taxes |
(139) | 85 | 107 | 40 | 43 | ||||||||||
|
Loss on extinguishment of debt(k) |
6 | 32 | 58 | 65 |
— |
||||||||||
|
Interest expense |
150 | 153 | 167 | 219 | 247 | ||||||||||
|
Other non-operating expenses(l) |
— |
— |
3 |
— |
2 | ||||||||||
|
Total Adjusted EBITDA |
$ |
678 |
$ |
667 |
$ |
622 |
$ |
557 |
$ |
450 | |||||
|
|
|||||||||||||||
|
Adjusted EBITDA: |
|||||||||||||||
|
Terminix |
$ |
330 |
$ |
371 |
$ |
347 |
$ |
309 |
$ |
266 | |||||
|
American Home Shield |
260 | 220 | 205 | 179 | 145 | ||||||||||
|
Franchise Services Group |
87 | 79 | 77 | 78 | 78 | ||||||||||
|
Reportable Segment Adjusted EBITDA |
$ |
677 |
$ |
670 |
$ |
630 |
$ |
566 |
$ |
489 | |||||
|
Corporate(m) |
1 | (3) | (9) | (9) | (39) | ||||||||||
|
Total Adjusted EBITDA |
$ |
678 |
$ |
667 |
$ |
622 |
$ |
557 |
$ |
450 | |||||
____________________________________________________________________
|
(a) |
Represents costs related to the 401(k) Plan described in Note 10 to the consolidated financial statements. We exclude these charges from Adjusted EBITDA because we believe they do not reflect our ongoing operations and because we believe doing so is useful to investors in aiding period-to-period comparability. |
|
(b) |
Represents charges for fumigation related matters described in Note 9 to the consolidated financial statements. We exclude these charges from Adjusted EBITDA because we believe they do not reflect our ongoing operations and because we believe doing so is useful to investors in aiding period-to-period comparability. |
|
(c) |
Represents an adjustment to our accrued self-insured claims related to automobile, general liability and workers’ compensation risks. The adjustment is based on our detailed annual assessment of this actuarially determined accrual, which we complete the second quarter of each year. This adjustment relates to coverage periods of 2015 and prior. We have excluded this discrete second quarter 2016 adjustment from Adjusted EBITDA because we believe it does not reflect our ongoing operations and because we believe doing so is useful to investors in aiding period-to-period comparability. Adjustments to accrued self-insured claims related to this insurance program were not material for the year ended December 31, 2017, and were $4 million, $9 million, $13 million and $4 million in the years ended December 31, 2016, 2015, 2014 and 2013, respectively. Adjustments in each year were recorded as charges in total Adjusted EBITDA. |
|
(d) |
Represents the non‑cash expense of our equity‑based compensation. We exclude this expense from Adjusted EBITDA primarily because it is a non‑cash expense and because it is not used by management to assess ongoing operational performance. We believe excluding this expense from Adjusted EBITDA is useful to investors in aiding period-to-period comparability. |
|
(e) |
For 2017, 2016 and 2015, represents restructuring charges described in Note 8 to the consolidated financial statements. For 2014 and 2013, represents restructuring charges related primarily to the impact of a branch optimization program at Terminix, a reorganization of leadership at Franchise Services Group and an initiative to enhance capabilities and reduce costs in our corporate functions. We exclude these restructuring charges from Adjusted EBITDA because we believe they do not reflect our ongoing operations and because we believe doing so is useful to investors in aiding period‑to‑period comparability. |
31
|
(f) |
Represents the gain associated with the conversion of certain company-owned Merry Maids branches to franchises in 2014, 2015 and 2016 (the “branch conversions”). |
|
(g) |
Represents the impairment of software and other related costs described in Note 2 to the consolidated financial statements. We exclude non‑cash impairments from Adjusted EBITDA because we believe doing so is useful to investors in aiding period‑to‑period comparability. |
|
(h) |
Represents the amounts paid to certain of our Equity Sponsors under consulting agreements. We exclude these amounts from Adjusted EBITDA primarily because they are not reflective of ongoing operating results and because they are not used by management to assess ongoing operational performance. In addition, we have excluded these amounts from Adjusted EBITDA because the consulting agreements terminated in connection with our initial public offering. |
|
(i) |
Represents the consulting agreement termination fees to the consolidated financial statements. We exclude these amounts from Adjusted EBITDA because we believe doing so is useful to investors in aiding period-to-period comparability |
|
(j) |
Represents our loss in connection with the spin-off of TruGreen in 2014. See Note 7 to the consolidated financial statements for further discussion of the spin-off of TruGreen. We exclude these amounts from Adjusted EBITDA because these charges are not part of our ongoing operations and we believe doing so is useful to investors in aiding period-to-period comparability. |
|
(k) |
For 2017, 2016 and 2015, represents a loss on extinguishment of debt as described in Note 11 to the consolidated financial statements. For 2014, represents a loss on extinguishment of debt related to the partial redemptions of our 8% 2020 Notes and 7% 2020 Notes and the repayment on the then-existing term loan facilities. We believe excluding this expense from Adjusted EBITDA is useful to investors in aiding period-to-period comparability. |
|
(l) |
For 2015, primarily represents secondary offering expenses. For 2013, represents certain administrative expenses incurred in anticipation of our initial public offering. We exclude these amounts from Adjusted EBITDA because we believe doing so is useful to investors in aiding period-to-period comparability. |
|
(m) |
Represents unallocated corporate expenses. |
|
(8) |
Adjusted EBITDA margin is defined as Adjusted EBITDA as a percentage of revenue. |
|
(9) |
Free Cash Flow is not a measurement of our financial performance or liquidity under GAAP and does not purport to be an alternative to net cash provided from operating activities from continuing operations or any other performance or liquidity measures derived in accordance with GAAP. Free Cash Flow means (i) net cash provided from operating activities from continuing operations before cash paid for consulting agreement termination fees; (ii) less property additions, net of government grant fundings for property. Free Cash Flow has limitations as an analytical tool and should not be considered in isolation or as a substitute for analyzing our results as reported under GAAP. Other companies in our industries may calculate Free Cash Flow or similarly titled non-GAAP financial measures differently, limiting its usefulness as a comparative measure. |
Management believes Free Cash Flow is useful as a supplemental measure of our liquidity. Management uses Free Cash Flow to facilitate company-to-company cash flow comparisons by removing payments for consulting agreement termination fees, which may vary from company to company for reasons unrelated to operating performance.
The following table reconciles net cash provided from operating activities from continuing operations, which we consider to be the most directly comparable GAAP measure, to Free Cash Flow using data derived from our consolidated financial statements for the periods indicated:
|
|
|||||||||||||||||||
|
|
Year Ended December 31, |
||||||||||||||||||
|
(In millions) |
2017 |
2016 |
2015 |
2014 |
2013 |
||||||||||||||
|
Net Cash Provided from Operating Activities from Continuing Operations |
$ |
413 |
$ |
325 |
$ |
398 |
$ |
289 |
$ |
208 | |||||||||
|
Cash paid for consulting agreement termination fees |
— |
— |
— |
21 |
— |
||||||||||||||
|
Property additions, net of government grant fundings for property additions |
(75) | (56) | (40) | (35) | (39) | ||||||||||||||
|
Free Cash Flow |
$ |
338 |
$ |
270 |
$ |
358 |
$ |
274 |
$ |
169 | |||||||||
32
ITEM 7. MANAGEMENT’S DISCUSSION AND ANALYSIS OF FINANCIAL CONDITION AND RESULTS OF OPERATIONS
The following information should be read in conjunction with Item 6 “Selected Financial Data” and the consolidated financial statements and related notes included in Item 8 of this Annual Report on Form 10-K. The following discussion may contain forward-looking statements that reflect our plans, estimates and beliefs. Our actual results could differ materially from those discussed in these forward-looking statements. Factors that could cause or contribute to these differences include those factors discussed below and elsewhere in this report, particularly in “—Information Regarding Forward-Looking Statements” and “Risk Factors.”
Overview
Our core services include termite and pest control, home service plans, disaster restoration, janitorial, residential cleaning, cabinet and wood furniture repair and home inspection under the following leading brands: Terminix, American Home Shield, ServiceMaster Restore, ServiceMaster Clean, Merry Maids, Furniture Medic and AmeriSpec. Our operations for the periods presented in this report are organized into three reportable segments: Terminix, American Home Shield and Franchise Services Group.
American Home Shield Spin-off
On July 26, 2017, the Company announced that it intends to spin-off its American Home Shield business from the Company’s Terminix and Franchise Services Group businesses by means of a spin-off of the American Home Shield business to Company stockholders, resulting in two publicly traded companies. The spin-off would create two independent companies, each with an enhanced strategic focus, simplified operating structure, distinct investment identity and strong financial profile. The transaction is expected to be completed in the third quarter of 2018, subject to satisfaction of customary conditions, including the effectiveness of a Registration Statement on Form 10, receipt of a favorable ruling from the IRS concerning certain tax matters and final approval by the Company’s board of directors, and it is intended to qualify as a tax-free distribution to the Company’s stockholders for U.S. federal income tax purposes.
Our financial statements include nonrecurring costs incurred to evaluate, plan and execute the spin-off. These costs are primarily related to third-party consulting and other incremental costs directly associated with the spin-off process. Our results for 2017 include restructuring charges of $13 million related to the spin-off. We expect to incur restructuring charges of $35 million to $45 million in 2018 related to the spin-off. In addition, we expect incremental capital expenditures will be required to effect the spin-off in 2018 and will range from $20 million to $30 million, principally reflecting costs to replicate information technology systems historically shared by our business units.
The separation into two independent public companies is expected to result in dis-synergies, the cost of which could be material to our results of operations. These dis-synergies are primarily associated with corporate functions such as finance, legal, IT and human resources. We are currently evaluating the optimal structure of corporate functions to support the strategic objectives of these two separate publicly traded companies subsequent to the spin-off and thus are currently unable to estimate the amount of the dis-synergies or the division thereof between the two companies.
U.S. Federal Income Tax Reform
On December 22, 2017, the Tax Cuts and Jobs Act, the tax reform bill (the “Act” or “U.S. Tax Reform”) was signed into law. The Act includes numerous changes in existing tax law, including a permanent reduction in the federal corporate income tax rate from 35 percent to 21 percent which will reduce our effective tax rate and cash tax payments, beginning in 2018. The rate reduction took effect on January 1, 2018, however, the Act was signed in 2017 and had an immediate one-time effect of an income tax benefit of $271 million for the year ended December 31, 2017. See Note 5 to the consolidated financial statements for more details.
Some of the provisions of the Act have the potential to affect us adversely, including but not limited to: i) a limitation on the deductibility of U.S. interest expense, ii) an expansion to the limitation on the deductibility of certain employee compensation, iii) a change to the scope of the net income of our foreign subsidiaries that may be required to be included currently in our U.S. taxable income, iv) a change to the manner in which foreign income taxes are credited by us, and v) a tax imposed on certain payments to related foreign persons. This list is not comprehensive and represents our current views on the potential impacts of the Act. We do not expect those provisions to have a significant adverse impact on our effective tax rate or cash tax payments, however these views are subject to change as additional guidance becomes available and further analysis is completed.
Key Business Metrics
We focus on a variety of indicators and key operating and financial metrics to monitor the financial condition and performance of the continuing operations of our businesses. These metrics include:
|
· |
revenue, |
|
· |
operating expenses, |
|
· |
net income, |
|
· |
earnings per share, |
|
· |
Adjusted EBITDA, |
33
|
· |
organic revenue growth, |
|
· |
customer retention rates, and |
|
· |
growth in customer counts. |
To the extent applicable, these measures are evaluated with and without impairment, restructuring and other charges that management believes are not indicative of the earnings capabilities of our businesses. We also focus on measures designed to monitor cash flow, including net cash provided from operating activities from continuing operations and free cash flow.
Revenue. Our revenue results are primarily a function of the volume and pricing of the services and products provided to our customers by our businesses as well as the mix of services and products provided across our businesses. The volume of our revenue in Terminix and American Home Shield is impacted by new unit sales, the retention of our existing customers and acquisitions. We expect to continue our tuck-in acquisition program at Terminix and to periodically evaluate other strategic acquisitions. Revenue results in the Franchise Services Group are driven principally by royalty fees earned from our franchisees. We serve both residential and commercial customers, principally in the United States. In 2017, approximately 98 percent of our revenue was generated by sales in the United States.
Operating Expenses. In addition to the impact of changes in our revenue results, our profitability (Net Income and Adjusted EBITDA) are affected by, among other things, the level of our operating expenses. A number of our operating expenses are subject to inflationary pressures, such as fuel, chemicals, raw materials, wages and salaries, employee benefits and health care, vehicles, contractor costs, household appliances and systems and repair parts, self-insurance costs and other insurance premiums, as well as various regulatory compliance costs.
We have historically hedged a significant portion of our annual fuel consumption. Fuel costs for 2017, after the impact of the hedges and after adjusting for the impact of year-over-year changes in the number of gallons used, decreased $4 million compared to 2016, and fuel costs for 2016 decreased $5 million compared to 2015. Based on current Department of Energy fuel price forecasts, as well as hedges we have executed to date for 2018, we project that fuel prices for 2018 will decrease our fuel costs for 2018 by approximately $3 million compared to 2017.
After adjusting for the impact of year-over-year changes in the number of covered employees, health care and related costs for 2017 increased approximately $5 million compared to 2016 while costs in 2016 decreased approximately $6 million compared to 2015. We expect our health care costs in 2018 to increase approximately $2 million compared to 2017.
Net Income and Earnings Per Share. Basic earnings per share is computed by dividing net income by the weighted-average number of shares of common stock outstanding. Diluted earnings per share is computed by dividing net income by the weighted-average number of shares of common stock outstanding during the period, increased to include the number of shares of common stock that would have been outstanding had potential dilutive shares of common stock been issued. The dilutive effect of stock options and RSUs are reflected in diluted earnings per share by applying the treasury stock method.
Adjusted EBITDA. We evaluate performance and allocate resources based primarily on Adjusted EBITDA. We define Adjusted EBITDA as net income (loss) before: (gain) loss from discontinued operations, net of income taxes; (benefit) provision for income taxes; loss on extinguishment of debt; interest expense; depreciation and amortization expense; 401(k) Plan corrective contribution; fumigation related matters; insurance reserve adjustment; non-cash stock-based compensation expense; restructuring charges; gain on sale of Merry Maids branches; non-cash impairment of software and other related costs; management and consulting fees; consulting agreement termination fees; and other non-operating expenses. We believe Adjusted EBITDA is useful for investors, analysts and other interested parties as it facilitates company-to-company operating performance comparisons by excluding potential differences caused by variations in capital structures, taxation, the age and book depreciation of facilities and equipment, restructuring initiatives, consulting agreements and equity-based, long-term incentive plans.
Organic Revenue Growth. We evaluate organic revenue growth to track performance of the business, including the impacts of sales, pricing, new service offerings and other growth initiatives. Organic revenue growth excludes revenue from acquired customers for 12 months following the acquisition date.
Customer Retention Rates and Customer Counts Growth. Where applicable, we report our customer retention rates and growth in customer counts in order to track the performance of the business. Customer counts represents our recurring customer base, which includes customers with active contracts for recurring services. Retention rates are calculated as the ratio of ending customer counts to the sum of beginning customer counts, new sales and acquired accounts for the applicable period. These measures are presented on a rolling, 12-month basis in order to avoid seasonal anomalies. See “—Segment Review.”
Seasonality
We have seasonality in our business, which drives fluctuations in revenue and Adjusted EBITDA for interim periods. In 2017, approximately 22 percent, 28 percent, 27 percent and 23 percent of our revenue and approximately 20 percent, 31 percent, 29 percent and 20 percent of our Adjusted EBITDA was recognized in the first, second, third and fourth quarters, respectively.
34
Effect of Weather Conditions
The demand for our services and our results of operations are also affected by weather conditions, including the seasonal nature of our termite and pest control services, home inspection services and disaster restoration services. Weather conditions which have a potentially unfavorable impact to our business include cooler temperatures or droughts which can impede the development of termite swarms and lead to lower demand for our termite control services; and extreme temperatures which can lead to an increase in service requests related to household systems. For example, in the third quarter of 2016, we experienced an increase in contract claims cost at American Home Shield driven by a higher number of HVAC work orders driven by high temperatures, and in the third quarter of 2017, our Terminix business was negatively impacted by hurricanes Harvey and Irma, which resulted in 53 branches, primarily in Texas and Florida, being temporarily closed for a period of time during August and September. Weather conditions which have a potentially favorable impact to our business include mild winters which can lead to higher demand for termite and pest control services; mild winters or summers which can lead to lower household systems claim frequency; and severe storms which can lead to an increase in demand for disaster restoration services. For example, in the third and fourth quarters of 2017, our ServiceMaster Restore business saw a significant increase in royalty fees related to hurricanes Harvey and Irma and wildfires.
Refinancing of Indebtedness
On September 18, 2017, we purchased $13 million in aggregate principal amount of our 7.25% notes maturing in 2038 at a price of 104.625% of the principal amount using available cash. On May 11, 2017, we purchased $17 million in aggregate principal amount of our 7.25% notes maturing in 2038 at a price of 97% of the principal amount using available cash. The repurchased notes were delivered to the trustee for cancellation. In connection with these partial repurchases, we recorded a loss on extinguishment of debt of $6 million in the year ended December 31, 2017.
35
Results of Operations
|
|
||||||||||||||||||||||||
|
|
||||||||||||||||||||||||
|
|
Year Ended December 31, |
Increase (Decrease) |
% of Revenue |
|||||||||||||||||||||
|
(In millions) |
2017 |
2016 |
2015 |
2017 vs. 2016 |
2016 vs. 2015 |
2017 |
2016 |
2015 |
||||||||||||||||
|
Revenue |
$ |
2,912 |
$ |
2,746 |
$ |
2,594 | 6 |
% |
6 |
% |
100 |
% |
100 |
% |
100 |
% |
||||||||
|
Cost of services rendered and products sold |
1,552 | 1,448 | 1,375 | 7 | 5 | 53 | 53 | 53 | ||||||||||||||||
|
Selling and administrative expenses |
773 | 711 | 666 | 9 | 7 | 27 | 26 | 26 | ||||||||||||||||
|
Amortization expense |
27 | 33 | 38 | (18) | (13) | 1 | 1 | 1 | ||||||||||||||||
|
401(k) Plan corrective contribution |
(3) | 2 | 23 |
* |
* |
— |
— |
1 | ||||||||||||||||
|
Fumigation related matters |
4 | 93 | 9 |
* |
* |
— |
3 |
— |
||||||||||||||||
|
Insurance reserve adjustment |
— |
23 |
— |
* |
* |
— |
1 |
— |
||||||||||||||||
|
Impairment of software and other related costs |
2 | 1 |
— |
* |
* |
— |
— |
— |
||||||||||||||||
|
Restructuring charges |
34 | 17 | 5 |
* |
* |
1 | 1 |
— |
||||||||||||||||
|
Gain on sale of Merry Maids branches |
— |
(2) | (7) |
* |
* |
— |
— |
— |
||||||||||||||||
|
Interest expense |
150 | 153 | 167 | (2) | (8) | 5 | 6 | 6 | ||||||||||||||||
|
Interest and net investment income |
(4) | (6) | (9) | (33) | (33) |
— |
— |
— |
||||||||||||||||
|
Loss on extinguishment of debt |
6 | 32 | 58 |
* |
* |
— |
1 | 2 | ||||||||||||||||
|
Income from Continuing Operations before Income Taxes |
|
|
370 |
|
|
241 |
|
|
270 |
|
54 |
|
|
(11) |
|
|
13 |
|
|
9 |
|
|
10 |
|
|
Provision for income taxes |
(139) | 85 | 107 | (264) | (21) | (5) | 3 | 4 | ||||||||||||||||
|
Equity in losses of joint venture |
— |
(1) |
— |
* |
* |
— |
— |
— |
||||||||||||||||
|
Income from Continuing Operations |
509 | 155 | 162 | 228 | (4) | 17 | 6 | 6 | ||||||||||||||||
|
Gain (loss) from discontinued operations, net of income taxes |
|
|
— |
|
|
(1) |
|
|
(2) |
|
* |
|
|
* |
|
|
— |
|
|
— |
|
|
— |
|
|
Net Income |
$ |
510 |
$ |
155 |
$ |
160 | 229 |
* |
18 |
% |
6 |
% |
6 |
% |
||||||||||
___________________________________
*not meaningful
Revenue
We reported revenue of $2,912 million, $2,746 million and $2,594 million for the years ended December 31, 2017, 2016 and 2015, respectively. A summary of changes in revenue for each of our reportable segments and Corporate is included in the table below. See “—Segment Review” for a discussion of the drivers of the year-over-year changes.
|
|
|||||||||||||||
|
|
American |
Franchise |
|||||||||||||
|
|
Home |
Services |
|||||||||||||
|
(In millions) |
Terminix(5) |
Shield |
Group |
Corporate |
Total |
||||||||||
|
Year Ended December 31, 2015 |
$ |
1,444 |
$ |
917 |
$ |
232 |
$ |
2 |
$ |
2,594 | |||||
|
Pest Control(1) |
63 |
— |
— |
— |
63 | ||||||||||
|
Termite and Other Services(2) |
13 |
— |
— |
— |
13 | ||||||||||
|
Home Service Plans(3) |
— |
103 |
— |
— |
103 | ||||||||||
|
Franchise-Related Revenue |
— |
— |
(1) |
— |
(1) | ||||||||||
|
Sale of Merry Maids branches(4) |
— |
— |
(31) |
— |
(31) | ||||||||||
|
Other |
4 |
— |
— |
— |
5 | ||||||||||
|
Year Ended December 31, 2016 |
$ |
1,524 |
$ |
1,020 |
$ |
200 |
$ |
2 |
$ |
2,746 | |||||
|
Pest Control(1) |
(8) |
— |
— |
— |
(8) | ||||||||||
|
Termite and Other Services(2) |
22 |
— |
— |
— |
22 | ||||||||||
|
Home Service Plans(3) |
— |
137 |
— |
— |
137 | ||||||||||
|
Franchise-Related Revenue |
— |
— |
18 |
— |
18 | ||||||||||
|
Sale of Merry Maids branches(4) |
— |
— |
(6) |
— |
(6) | ||||||||||
|
Other |
4 |
— |
— |
— |
4 | ||||||||||
|
Year Ended December 31, 2017 |
$ |
1,541 |
$ |
1,157 |
$ |
212 |
$ |
2 |
$ |
2,912 | |||||
___________________________________
|
(1) |
Includes growth from acquisitions of approximately $8 million and $55 million for the years ended December 31, 2017 and 2016, respectively, of which approximately $42 million in 2016 is a result of the acquisition of Alterra Pest Control, LLC (“Alterra”) on November 10, 2015. In 2017, organic pest control revenue growth was negatively impacted by a $19 million organic revenue decline associated with Alterra. |
36
|
(2) |
Includes wildlife exclusion, crawl space encapsulation and attic insulation products that are managed as a component of our termite line of business. Includes growth from acquisitions of approximately $3 million and $5 million for the years ended December 31, 2017 and 2016, respectively. |
|
(3) |
Includes approximately $56 million and $22 million for the years ended December 31, 2017 and 2016, respectively, as a result of the acquisition of OneGuard on June 27, 2016 and Landmark on November 30, 2016. |
|
(4) |
Includes a $6 million and $33 million reduction in revenue from company-owned branches for the years ended December 31, 2017 and 2016, respectively, offset, in part, by a $2 million increase in royalty fees as result of the branch conversions for the year ended December 31, 2016. Royalty fee increases as a result of the branch conversions were insignificant in 2017. |
|
(5) |
Hurricanes Harvey and Irma negatively impacted 2017 by approximately $4 million as the result of 53 branches, primarily in Texas and Florida, being temporarily closed for a period of time during August and September 2017. |
Cost of Services Rendered and Products Sold
We reported cost of services rendered and products sold of $1,552 million, $1,448 million and $1,375 million for the years ended December 31, 2017, 2016 and 2015, respectively. The following table provides a summary of changes in cost of services rendered and products sold for each of our reportable segments and Corporate:
|
|
|||||||||||||||
|
|
American |
Franchise |
|||||||||||||
|
|
Home |
Services |
|||||||||||||
|
(In millions) |
Terminix |
Shield |
Group |
Corporate |
Total |
||||||||||
|
Year Ended December 31, 2015 |
$ |
792 |
$ |
468 |
$ |
106 |
$ |
10 |
$ |
1,375 | |||||
|
Impact of change in revenue(1) |
44 | 41 | 1 |
— |
86 | ||||||||||
|
Production labor |
6 |
— |
— |
— |
6 | ||||||||||
|
Fuel prices |
(5) |
— |
— |
— |
(5) | ||||||||||
|
Legal expense |
4 |
— |
— |
— |
4 | ||||||||||
|
Contract claims |
— |
17 |
— |
— |
17 | ||||||||||
|
Sale of Merry Maids branches |
— |
— |
(26) |
— |
(26) | ||||||||||
|
Vehicles and insurance program |
— |
— |
— |
(5) | (5) | ||||||||||
|
Depreciation |
4 |
— |
— |
— |
4 | ||||||||||
|
Other |
(6) | (2) |
— |
(1) | (9) | ||||||||||
|
Year Ended December 31, 2016 |
$ |
839 |
$ |
524 |
$ |
81 |
$ |
4 |
$ |
1,448 | |||||
|
Impact of change in revenue(1) |
11 | 58 | 10 |
— |
79 | ||||||||||
|
Impact of Hurricanes |
(1) |
— |
— |
— |
(1) | ||||||||||
|
Production labor |
11 |
— |
— |
— |
11 | ||||||||||
|
Vehicles and insurance program |
6 |
— |
— |
(4) | 2 | ||||||||||
|
Damage claims |
10 |
— |
— |
— |
10 | ||||||||||
|
Technology costs |
2 |
— |
— |
— |
2 | ||||||||||
|
Fuel prices |
(4) |
— |
— |
— |
(4) | ||||||||||
|
Contract claims |
— |
8 |
— |
— |
8 | ||||||||||
|
Sale of Merry Maids branches |
— |
— |
(6) |
— |
(6) | ||||||||||
|
Depreciation |
2 |
— |
— |
— |
2 | ||||||||||
|
Other |
2 |
— |
(1) |
— |
1 | ||||||||||
|
Year Ended December 31, 2017 |
$ |
878 |
$ |
590 |
$ |
84 |
$ |
— |
$ |
1,552 | |||||
___________________________________
|
(1) |
For American Home Shield, includes approximately $24 million and $10 million for the years ended December 31, 2017 and 2016, respectively, as a result of the acquisitions of OneGuard on June 27, 2016 and Landmark on November 30, 2016. |
Year Ended December 31, 2017 Compared to Year Ended December 31, 2016
At Terminix, the aforementioned hurricane-related impact in 2017 was a decrease of $1 million. The increase in production labor was driven by investments in field operations focused on improving safety, customer service and retention. The increase in our insurance programs was principally driven by an increase in the number of company-owned sales vehicles. The increase in damage claims was driven by increased termite warranty claims. Additionally, the increase in technology costs was driven by investments to improve our customers’ experiences through technology.
The increase in contract claims costs at American Home Shield is primarily due to normal inflationary pressure on the underlying costs of repairs offset, in part, by reduced service work orders driven by cooler summer temperatures in 2017.
We realized a reduction in cost of sales of $6 million in the Franchise Services Group as a result of the branch conversions completed in 2016.
37
Insurance costs decreased $4 million at Corporate for the year ended December 31, 2017. The year ended December 31, 2016 included increased reserves in our automobile, general liability and workers’ compensation insurance program of $4 million driven by unfavorable claims trends, which were impacted by a charge of $3 million in connection with civil claims related to an incident at a family’s residence in Palm Beach County, Florida (an amount equal to our insurance deductibles under our general liability insurance program). There were no material changes to reserves in our automobile, general liability and workers’ compensation insurance programs for the year ended December 31, 2017.
Year Ended December 31, 2016 Compared to Year Ended December 31, 2015
The increase in production labor at Terminix was driven by investments in field operations focused on improving safety, technician efficiency, customer service and retention. We realized lower fuel costs at Terminix as a result of lower fuel prices in 2016. The increase in legal expense at Terminix was driven by increased provisions for certain legal matters.
The increase in contract claims cost at American Home Shield was primarily driven by normal inflationary pressure on the underlying costs of repairs.
We realized a reduction in cost of sales of $26 million in the Franchise Services Group as a result of the branch conversions.
The decrease in expense related to our automobile, general liability and workers’ compensation insurance program was driven by the impact of increased reserves of $4 million driven by unfavorable claims trends.
Selling and Administrative Expenses
For the years ended December 31, 2017, 2016 and 2015, we reported selling and administrative expenses of $773 million, $711 million and $666 million, respectively, which comprised general and administrative expenses of $291 million, $284 million and $255 million, respectively, and selling and marketing expenses of $482 million, $427 million and $411 million, respectively. The following table provides a summary of changes in selling and administrative expenses for each of our reportable segments and Corporate:
|
|
|||||||||||||||
|
|
American |
Franchise |
|||||||||||||
|
|
Home |
Services |
|||||||||||||
|
(In millions) |
Terminix |
Shield |
Group |
Corporate |
Total |
||||||||||
|
Year Ended December 31, 2015 |
$ |
335 |
$ |
256 |
$ |
51 |
$ |
24 |
$ |
666 | |||||
|
Sales and marketing costs |
— |
12 |
— |
— |
12 | ||||||||||
|
Technology costs |
12 | 7 |
— |
— |
19 | ||||||||||
|
Incentive compensation |
(7) | (2) | (1) |
— |
(10) | ||||||||||
|
OneGuard and Landmark selling and administrative expenses |
|
|
— |
|
|
8 |
|
|
— |
|
|
— |
|
|
8 |
|
Customer service costs |
— |
4 |
— |
— |
4 | ||||||||||
|
Sale of Merry Maids branches |
— |
— |
(3) |
— |
(3) | ||||||||||
|
Cost reduction initiatives |
— |
— |
(4) |
— |
(4) | ||||||||||
|
Stock-based compensation expense |
— |
— |
— |
3 | 3 | ||||||||||
|
Secondary offering expenses |
— |
— |
— |
(3) | (3) | ||||||||||
|
Depreciation |
1 | 2 |
— |
7 | 11 | ||||||||||
|
Other |
7 | 1 |
— |
— |
7 | ||||||||||
|
Year Ended December 31, 2016 |
$ |
348 |
$ |
288 |
$ |
43 |
$ |
31 |
$ |
711 | |||||
|
Sales and marketing costs |
20 | 5 | 1 |
— |
26 | ||||||||||
|
OneGuard and Landmark selling and administrative expenses |
|
|
— |
|
|
20 |
|
|
— |
|
|
— |
|
|
20 |
|
Customer service costs |
— |
6 |
— |
— |
6 | ||||||||||
|
Sale of Merry Maids branches |
— |
— |
(1) |
— |
(1) | ||||||||||
|
Stock-based compensation expense |
— |
— |
— |
(1) | (1) | ||||||||||
|
Depreciation |
6 | 1 |
— |
5 | 12 | ||||||||||
|
Other |
3 | (4) | 1 |
— |
— |
||||||||||
|
Year Ended December 31, 2017 |
$ |
377 |
$ |
316 |
$ |
44 |
$ |
35 |
$ |
773 | |||||
Year Ended December 31, 2017 Compared to Year Ended December 31, 2016
The increase in sales and marketing costs at Terminix is driven by investments to grow and train our sales force, higher commissions attributable to the growth in core termite, wildlife exclusion, attic insulation and pest sales and incremental marketing investments.
At American Home Shield, the increase in sales and marketing costs was driven by incremental marketing spending. We incurred incremental selling and administrative expenses as a result of the OneGuard and Landmark acquisitions. The increase in
38
customer service costs is due to higher labor costs resulting from an acceleration of pre-season hiring and training in preparation for the high-volume summer season and an overall increase in customer care center staffing levels to improve response times.
We realized a reduction in administrative expenses of $1 million in the Franchise Services Group as a result of the branch conversions completed in 2016.
Year Ended December 31, 2016 Compared to Year Ended December 31, 2015
The increase in sales and marketing costs at Terminix was driven by higher depreciation and, to a lesser extent, other costs related to a sales vehicle program initiated in 2016. The increase in sales and marketing costs at American Home Shield was primarily driven by the shift in the timing of a holiday mail campaign from the fourth quarter of 2015 to the first quarter of 2016 and, to a lesser extent, an increase in sales commissions.
The increase in technology costs at Terminix, American Home Shield and Corporate was primarily due to an acceleration of investments to improve our customers’ experiences through technology.
We incurred incremental selling and administrative expenses at American Home Shield as a result of the OneGuard and Landmark acquisitions. The increase in customer service costs at American Home Shield was due to higher labor costs resulting from an acceleration of pre-season hiring and training in preparation for the high-volume summer season.
We realized a reduction in selling and administrative expenses of $3 million in the Franchise Services Group as a result of the branch conversions.
Amortization Expense
Amortization expense was $27 million, $33 million and $38 million in the years ended December 31, 2017, 2016 and 2015, respectively. The decreases in 2017 and 2016 were a result of certain finite-lived intangible assets recorded in connection with the merger transaction by which the Company was taken private in 2007 being fully amortized.
401(k) Plan Corrective Contribution
We recorded charges of $2 million and $23 million in the years ended December 31, 2016 and 2015, respectively, related to the 401(k) Plan. In connection with the final agreement, we reversed charges of $3 million for the 401(k) plan corrective contribution in the year ended December 31, 2017. See Note 10 to the consolidated financial statements for more details.
Fumigation Related Matters
We recorded charges of $4 million, $93 million and $9 million in the years ended December 31, 2017, 2016 and 2015, respectively, for fumigation related matters. See Note 9 to the consolidated financial statements for more details.
Insurance Reserve Adjustment
We recorded a charge of $23 million in the year ended December 31, 2016 for an adjustment to the Company’s accrued self-insured claims related to automobile, general liability and workers’ compensation risks. The adjustment was based on the Company’s detailed annual assessment of this actuarially determined accrual, which the Company completes in the second quarter of each year. This adjustment related to coverage periods of 2015 and prior. No similar charge was recorded in the year ended December 31, 2017.
Impairment of Software and Other Related Costs
We recorded impairment charges of $2 million and $1 million in the years ended December 31, 2017 and 2016, respectively, relating to our decision to replace certain software.
39
Restructuring Charges
We incurred restructuring charges of $34 million, $17 million and $5 million for the years ended December 31, 2017, 2016 and 2015, respectively. Restructuring charges are comprised of the following:
|
|
|||||||||
|
|
Year Ended December 31, |
||||||||
|
(In millions) |
2017 |
2016 |
2015 |
||||||
|
Terminix(1) |
$ |
2 |
$ |
7 |
$ |
3 | |||
|
American Home Shield(2) |
— |
2 |
— |
||||||
|
Franchise Services Group(3) |
1 |
— |
1 | ||||||
|
Corporate(4) |
2 | 5 | 1 | ||||||
|
Leadership transition(5) |
11 |
— |
— |
||||||
|
American Home Shield spin-off(6) |
13 |
— |
— |
||||||
|
Global Service Center relocation(7) |
5 | 3 |
— |
||||||
|
Total restructuring charges |
$ |
34 |
$ |
17 |
$ |
5 | |||
___________________________________
|
(1) |
For the years ended December 31, 2017, 2016 and 2015, these charges include $2 million, $4 million and $3 million, respectively, of lease termination and severance costs driven by Terminix’s branch optimization program. For the year ended December 31, 2016, these charges include $1 million of severance costs and $3 million of stock-based compensation expense due to the modification of non-vested stock options and RSUs as part of the severance agreement with the former president of Terminix. |
|
(2) |
Represents lease termination and other costs driven by the decision to consolidate the stand-alone operations of HSA, acquired in February 2014, with those of American Home Shield. |
|
(3) |
Represents severance and other costs related to the reorganization of the Franchise Services Group. |
|
(4) |
We have historically made changes on an ongoing basis to enhance capabilities and reduce costs in our corporate functions that provide company-wide administrative services for our operations. In 2017, we began taking actions to enhance capabilities and align our corporate functions with those required to support our strategic needs as two stand-alone companies in anticipation of the American Home Shield spin-off. For the years ended December 31, 2017, 2016, and 2015, these charges include severance and other costs of $2 million, $2 million, and $1 million, respectively. For the year ended December 31, 2016, these charges include professional fees of $2 million and accelerated depreciation of $2 million related to the early termination of a long-term human resources outsourcing agreement. |
|
(5) |
For the year ended December 31, 2017, these charges include $5 million of severance costs and $5 million of stock-based compensation expense as part of the severance agreements with the former CEO and CFO. |
|
(6) |
Represents professional fees and other costs of $13 million related to the proposed spin-off of the American Home Shield business to Company stockholders. |
|
(7) |
For the year ended December 31, 2017, these charges include accelerated depreciation of $2 million, redundant rent expense of $2 million and a $1 million loss recorded on the sale of an asset related to the relocation of the Company’s corporate headquarters, which we refer to as our Global Service Center. For the year ended December 31, 2016, represents impairment charges of $1 million and professional fees and other costs of $1 million related to the relocation of the Company’s Global Service Center. |
We expect to incur restructuring charges of $35 million to $45 million in 2018 related to the spin-off. We expect to incur approximately $8 million of additional Global Service Center relocation charges in 2018, principally comprised of lease exit costs.
Gain on Sale of Merry Maids Branches
We recorded gains of $2 million and $7 million for the years ended December 31, 2016 and 2015, respectively, associated with the branch conversions. There was no gain recorded in the year ended December 31, 2017. As of October 10, 2016, the branch conversion process was complete.
Interest Expense
Interest expense was $150 million, $153 million and $167 million for the years ended December 31, 2017, 2016 and 2015, respectively. The decrease in interest expense in the year ended December 31, 2017 compared to the year ended December 31, 2016 was driven by the partial repurchase of the 2038 Notes in 2017 and the refinancing of the Old Term Loan Facility. The decrease in interest expense in the year ended December 31, 2016 compared to the year ended December 31, 2015 was driven by the redemption of the 2020 Notes in 2015, offset, in part by additional borrowings under the Old Term Loan Facility. See Note 11 to the consolidated financial statements for more details.
40
Interest and Net Investment Income
Interest and net investment income was $4 million, $6 million and $9 million for the years ended December 31, 2017, 2016 and 2015, respectively, and comprised net investment gains and interest and dividend income realized on the American Home Shield investment portfolio and interest income on other cash balances.
Loss on Extinguishment of Debt
A loss on extinguishment of debt of $6 million was recorded in the year ended December 31, 2017 related to the purchase of $13 million of our 2038 Notes on September 18, 2017 and $17 million of our 2038 Notes on May 11, 2017. A loss on extinguishment of debt of $32 million was recorded in the year ended December 31, 2016 related to the refinancing of our Old Term Loan Facility on November 8, 2016. A loss on extinguishment of debt of $58 million was recorded in the year ended December 31, 2015 related to the redemptions of the 8% 2020 Notes on February 17, 2015 and April 1, 2015 and the redemption of the 7% 2020 Notes on August 17, 2015. See Note 11 to the consolidated financial statements for more details.
Income from Continuing Operations before Income Taxes
Income from continuing operations before income taxes was $370 million, $241 million and $270 million for the years ended December 31, 2017, 2016 and 2015, respectively. The change in income from continuing operations before income taxes primarily reflects the net effect of year-over-year changes in the following items:
|
|
||||||
|
|
Year Ended December 31, |
|||||
|
(In millions) |
2017 vs. 2016 |
2016 vs. 2015 |
||||
|
Reportable segments and Corporate(1) |
$ |
11 |
$ |
45 | ||
|
Depreciation expense(2) |
(15) | (14) | ||||
|
Amortization expense(3) |
6 | 5 | ||||
|
401(k) Plan corrective contribution(4) |
5 | 21 | ||||
|
Fumigation related matters(5) |
89 | (84) | ||||
|
Insurance reserve adjustment(6) |
23 | (23) | ||||
|
Impairment of software and other related costs(7) |
(1) | (1) | ||||
|
Restructuring charges(8) |
(17) | (12) | ||||
|
Gain on sale of Merry Maids branches(9) |
(2) | (5) | ||||
|
Interest expense(10) |
3 | 14 | ||||
|
Loss on extinguishment of debt(11) |
26 | 26 | ||||
|
Other(12) |
1 | (1) | ||||
|
Increase (decrease) in income from continuing operations before income taxes |
$ |
129 |
$ |
(29) | ||
___________________________________
|
(1) |
Represents the net change in Adjusted EBITDA as described in “—Segment Review.” |
|
(2) |
Represents the net change in depreciation expense, driven by investments in vehicles and technology. |
|
(3) |
Represents the net change in amortization expense as described in “—Amortization Expense.” |
|
(4) |
Represents the $3 million reversal recorded in the year ended December 31, 2017, and the $2 million and $23 million of charges recorded in the years ended December 31, 2016 and 2015, respectively, related to the 401(k) Plan as described in “—401(k) Plan Corrective Contribution.” |
|
(5) |
Represents the $4 million, $93 million and $9 million of charges for fumigation related matters recorded in the years ended December 31, 2017, 2016 and 2015 respectively, a described in “—Fumigation Related Matters.” |
|
(6) |
Represents the $23 million insurance reserve adjustment recorded in the year ended December 31, 2016 as described in “—Insurance Reserve Adjustment.” No similar adjustments were made in 2017 or 2015. |
|
(7) |
Represents impairment charges of $2 million and $1 million recorded in the years ended December 31, 2017 and 2016, respectively, as described in “—Impairment of Software and Other Related Costs.” No impairment charges were recognized in 2015. |
|
(8) |
Represents the $34 million, $17 million and $5 million charges recorded in the years ended December 31, 2017, 2016 and 2015, respectively, as described in “—Restructuring Charges.” |
|
(9) |
Represents the $2 million and $7 million gains in the years ended December 31, 2016 and 2015, respectively, as described in “—Gain on Sale of Merry Maids branches.” The branch conversion process was completed in 2016. |
|
(10) |
Represents the net change in interest expense as described in “—Interest Expense.” |
|
(11) |
Represents the $6 million, $32 million and $58 million loss on extinguishment of debt recorded in the years ended December 31, 2017, 2016 and 2015, respectively, as described in “—Loss on Extinguishment of Debt.” |
41
|
(12) |
Primarily represents the net change in stock-based compensation. |
Provision for Income Taxes
On December 22, 2017, the Act was signed into law. The Act includes numerous changes in existing tax law, including a permanent reduction in the federal corporate income tax rate from 35 percent to 21 percent. The rate reduction took effect on January 1, 2018, however, the Act was signed in 2017 and had an immediate one-time effect of an income tax benefit of $271 million for us for the year ended December 31, 2017. See Note 5 to the consolidated financial statements for more details. Some of the provisions of the Act have the potential to affect us adversely, including but not limited to: i) a limitation on the deductibility of U.S. interest expense, ii) an expansion to the limitation on the deductibility of certain employee compensation, iii) a change to the scope of the net income of our foreign subsidiaries that may be required to be included currently in our U.S. taxable income, iv) a change to the manner in which foreign income taxes are credited by us, and v) a tax imposed on certain payments to related foreign persons. This list is not comprehensive and represents our current views on the potential impacts of the Act, however these views are subject to change as additional guidance becomes available and further analysis is completed.
The effective tax rate on income from continuing operations was (37.6) percent, 35.4 percent and 39.8 percent for the years ended December 31, 2017, 2016 and 2015, respectively. The effective tax rate on income from continuing operations for the year ended December 31, 2017 was favorably impacted by tax benefits relating to stock-based compensation and the Act. Additional information on income taxes, including our effective tax rate reconciliation and liabilities for uncertain tax positions, can be found in Note 5 to the consolidated financial statements.
Net Income
Net income was $510 million, $155 million and $160 million for the years ended December 31, 2017, 2016 and 2015, respectively. The $355 million increase for the year ended December 31, 2017 compared to the year ended December 31, 2016 was primarily driven by a $129 million increase in income from continuing operations before income taxes and a $224 million reduction in the provision for income taxes. The $5 million reduction for the year ended December 31, 2016 compared to the year ended December 31, 2015 was primarily driven by a $29 million reduction in income from continuing operations before income taxes, offset, in part, by a $22 million reduction in provision for income taxes.
42
Segment Review
The following business segment reviews should be read in conjunction with the required footnote disclosures presented in the notes to the consolidated financial statements included in this report.
Revenue and Adjusted EBITDA by reportable segment and for Corporate are as follows:
|
|
|||||||||||||||
|
|
Year Ended December 31, |
Increase (Decrease) |
|||||||||||||
|
(In millions) |
2017 |
2016 |
2015 |
2017 vs. 2016 |
2016 vs. 2015 |
||||||||||
|
Revenue: |
|||||||||||||||
|
Terminix |
$ |
1,541 |
$ |
1,524 |
$ |
1,444 | 1 |
% |
6 |
% |
|||||
|
American Home Shield |
1,157 | 1,020 | 917 | 13 |
% |
11 |
% |
||||||||
|
Franchise Services Group |
212 | 200 | 232 | 6 |
% |
(14) |
% |
||||||||
|
Corporate |
2 | 2 | 2 |
— |
% |
— |
% |
||||||||
|
Total Revenue: |
$ |
2,912 |
$ |
2,746 |
$ |
2,594 | 6 |
% |
6 |
% |
|||||
|
Adjusted EBITDA:(1) |
|||||||||||||||
|
Terminix |
$ |
330 |
$ |
371 |
$ |
347 | (11) |
% |
7 |
% |
|||||
|
American Home Shield |
260 | 220 | 205 | 18 |
% |
7 |
% |
||||||||
|
Franchise Services Group |
87 | 79 | 77 | 10 |
% |
3 |
% |
||||||||
|
Reportable Segment Adjusted EBITDA |
$ |
677 |
$ |
670 |
$ |
630 | 1 |
% |
6 |
% |
|||||
|
Corporate(2) |
1 | (3) | (9) | (133) |
% |
(67) |
% |
||||||||
|
Total Adjusted EBITDA |
$ |
678 |
$ |
667 |
$ |
622 | 2 |
% |
7 |
% |
|||||
___________________________________
|
(1) |
For our definition of Adjusted EBITDA and a reconciliation to net income, see “—Selected Historical Financial Data.” |
|
(2) |
Represents unallocated corporate expenses. |
Terminix Segment
The Terminix segment, which provides termite and pest control services to residential and commercial customers and distributes pest control products, reported a one percent increase in revenue and an 11 percent decrease in Adjusted EBITDA for the year ended December 31, 2017 compared to the year ended December 31, 2016. The Terminix segment reported a six percent increase in revenue and a seven percent increase in Adjusted EBITDA for the year ended December 31, 2016 compared to the year ended December 31, 2015.
Revenue
Revenue by service line is as follows:
|
|
||||||||||||||||||||||||
|
|
Year Ended |
|||||||||||||||||||||||
|
|
December 31, |
|||||||||||||||||||||||
|
(In millions) |
2017 |
2016 |
Growth |
Acquired |
Organic |
|||||||||||||||||||
|
Pest Control |
$ |
867 |
$ |
875 |
$ |
(8) | (1) |
% |
$ |
8 | 1 |
% |
$ |
(16) | (2) |
% |
||||||||
|
Termite and Other Services |
593 | 571 | 22 | 4 |
% |
3 | 1 |
% |
19 | 3 |
% |
|||||||||||||
|
Other |
81 | 77 | 4 | 5 |
% |
— |
— |
% |
4 | 5 |
% |
|||||||||||||
|
Total revenue |
$ |
1,541 |
$ |
1,524 |
$ |
18 | 1 |
% |
$ |
10 | 0 |
% |
$ |
7 | 0 |
% |
||||||||
|
|
||||||||||||||||||||||||
|
|
||||||||||||||||||||||||
|
|
Year Ended |
|||||||||||||||||||||||
|
|
December 31, |
|||||||||||||||||||||||
|
(In millions) |
2016 |
2015 |
Growth |
Acquired |
Organic |
|||||||||||||||||||
|
Pest Control |
$ |
875 |
$ |
812 |
$ |
63 | 8 |
% |
$ |
55 | 7 |
% |
$ |
8 | 1 |
% |
||||||||
|
Termite and Other Services |
571 | 559 | 13 | 2 |
% |
5 | 1 |
% |
8 | 1 |
% |
|||||||||||||
|
Other |
77 | 73 | 4 | 5 |
% |
— |
— |
% |
4 | 5 |
% |
|||||||||||||
|
Total revenue |
$ |
1,524 |
$ |
1,444 |
$ |
80 | 6 |
% |
$ |
60 | 4 |
% |
$ |
20 | 1 |
% |
||||||||
Year Ended December 31, 2017 Compared to Year Ended December 31, 2016
Pest control revenue decreased one percent. Organic pest control revenue decreased two percent and was significantly impacted by a $19 million organic revenue decline associated with Alterra. Excluding Alterra, organic pest control revenue growth was $3 million and less than one percent.
43
Termite revenue, including the wildlife exclusion, crawl space encapsulation and attic insulation products that are managed as a component of our termite line of business, increased four percent. In 2017, termite renewal revenue comprised 49 percent of total termite revenue, while the remainder consisted of termite new unit revenue. Organic termite revenue increased three percent, reflecting an increase in core termite, wildlife exclusion and attic insulation sales and an impact from our initiative to upgrade bait monitoring stations for a small subset of our customers. Termite activity is unpredictable in its nature. Factors that can impact termite activity include conducive weather conditions and consumer awareness of termite swarms.
Hurricanes Harvey and Irma negatively impacted revenue in the year ended December 31, 2017 by approximately $4 million as the result of 53 branches, primarily in Texas and Florida, being temporarily closed for a period of time during August and September.
Year Ended December 31, 2016 Compared to Year Ended December 31, 2015
Pest control revenue increased eight percent, reflecting the impact of the Alterra acquisition, improved price realization and growth in mosquito and bed bug services. Organic pest control revenue growth was negatively impacted by a $2 million organic revenue decline associated with Alterra. Excluding Alterra, organic pest control revenue growth was $10 million and one percent.
Termite revenue, including the wildlife exclusion, crawl space encapsulation and attic insulation products that are managed as a component of our termite line of business, increased two percent. In 2016, termite renewal revenue comprised 51 percent of total termite revenue, while the remainder consisted of termite new unit revenue. The increase in termite revenue reflects an increase in core termite sales and increased sales of wildlife exclusion and crawlspace encapsulation, offset, in part, by lower price realization driven by targeted offerings of bundled services.
Adjusted EBITDA
The following table provides a summary of changes in the segment’s Adjusted EBITDA:
|
|
|||
|
(In millions) |
|||
|
Year Ended December 31, 2015 |
$ |
347 | |
|
Impact of change in revenue |
36 | ||
|
Production labor |
(6) | ||
|
Fuel prices |
5 | ||
|
Legal expense |
(4) | ||
|
Technology costs |
(12) | ||
|
Incentive compensation |
7 | ||
|
Other |
(2) | ||
|
Year Ended December 31, 2016 |
$ |
371 | |
|
Impact of change in revenue |
10 | ||
|
Impact of Hurricanes |
(3) | ||
|
Production labor |
(11) | ||
|
Fuel prices |
4 | ||
|
Vehicles and insurance program |
(6) | ||
|
Damage claims |
(10) | ||
|
Technology costs |
(2) | ||
|
Sales and marketing costs |
(20) | ||
|
Other |
(5) | ||
|
Year Ended December 31, 2017 |
$ |
330 | |
|
|
Year Ended December 31, 2017 Compared to Year Ended December 31, 2016
The aforementioned hurricane-related revenue loss negatively impacted Adjusted EBITDA in 2017 by $3 million. The increase in production labor was driven by investments in field operations focused on improving safety, customer service and retention. The increase in our insurance programs was principally driven by an increase in the number of company-owned sales vehicles. The increase in damage claims was driven by increased termite warranty claims. The increase in technology costs was driven by investments to improve our customers’ experiences through technology. The increase in sales and marketing costs was driven by investments to grow and train our sales force, higher commissions attributable to the growth in core termite, wildlife exclusion, attic insulation and pest sales and incremental marketing investments.
Year Ended December 31, 2016 Compared to Year Ended December 31, 2015
The increase in production labor was driven by investments in field operations focused on improving safety, technician efficiency, customer service and retention. We realized lower fuel costs as a result of lower fuel prices in 2016. The increase in legal expense was driven by increased provisions for certain legal matters. The increase in technology costs was primarily due to an acceleration of investments to transform our customers’ experiences through technology.
44
American Home Shield Segment
The American Home Shield segment, which provides home service plans for household systems and appliances, reported a 13 percent increase in revenue and an 18 percent increase in Adjusted EBITDA for the year ended December 31, 2017 compared to the year ended December 31, 2016. The American Home Shield segment reported an 11 percent increase in revenue and a seven percent increase in Adjusted EBITDA for the year ended December 31, 2016 compared to the year ended December 31, 2015.
The growth in renewable home service plans and customer retention are presented below.
|
|
As of December 31, |
||||||||
|
|
2017(1) |
2016(1) |
2015 |
||||||
|
American Home Shield |
|||||||||
|
Growth in Home Service Plans |
6 |
% |
15 |
% |
7 |
% |
|||
|
Customer Retention Rate |
75 |
% |
76 |
% |
75 |
% |
|||
___________________________________
|
(1) |
As of December 31, 2017 and 2016, excluding the impact of acquisitions, the growth in home warranties was six percent and seven percent, respectively, and the customer retention rate for our American Home Shield segment was 76 percent and 75 percent, respectively. |
Revenue
Year Ended December 31, 2017 Compared to Year Ended December 31, 2016
The revenue results reflect an increase in new unit sales, improved price realization and the impact of the OneGuard and Landmark acquisitions (an approximate $56 million increase).
Year Ended December 31, 2016 Compared to Year Ended December 31, 2015
The revenue results reflect an increase in new unit sales, improved price realization and the impact of the OneGuard and Landmark acquisitions (an approximate $22 million increase).
Adjusted EBITDA
The following table provides a summary of changes in the segment’s Adjusted EBITDA:
|
|
|||
|
(In millions) |
|||
|
Year Ended December 31, 2015 |
$ |
205 | |
|
Impact of change in revenue |
62 | ||
|
Contract claims |
(17) | ||
|
Sales and marketing costs |
(12) | ||
|
Technology costs |
(7) | ||
|
OneGuard and Landmark selling and administrative expenses |
(8) | ||
|
Customer service costs |
(4) | ||
|
Incentive compensation |
2 | ||
|
Interest and net investment income |
(3) | ||
|
Other |
2 | ||
|
Year Ended December 31, 2016 |
$ |
220 | |
|
Impact of change in revenue |
79 | ||
|
Contract claims |
(8) | ||
|
Sales and marketing costs |
(5) | ||
|
OneGuard and Landmark selling and administrative expenses |
(20) | ||
|
Customer service costs |
(6) | ||
|
Interest and net investment income |
(3) | ||
|
Other |
4 | ||
|
Year Ended December 31, 2017 |
$ |
260 |
Year Ended December 31, 2017 Compared to Year Ended December 31, 2016
The increase in contract claims costs is primarily due to normal inflationary pressure on the underlying costs of repairs, offset in part, by a lower number of work orders driven by cooler summer temperatures in 2017. Extreme temperatures in 2018 could lead to an increase in service requests related to household systems, resulting in higher claim frequency and costs. The increase in sales and marketing costs is driven by incremental sales and marketing spending. We incurred incremental selling and administrative expenses as a result of the OneGuard and Landmark acquisitions. The increase in customer service costs is due to higher labor costs resulting from an acceleration of pre-season hiring and training in preparation for the high-volume summer season and an overall increase in customer care staffing levels to improve response times.
45
In 2017 and 2016, the segment’s Adjusted EBITDA included interest and net investment income from the American Home Shield investment portfolio of $2 million and $5 million, respectively.
Year Ended December 31, 2016 Compared to Year Ended December 31, 2015
The increase in contract claims cost was primarily driven by normal inflationary pressure on the underlying costs of repairs.
The increase in sales and marketing costs was primarily driven by the shift in the timing of a holiday mail campaign from the fourth quarter of 2015 to the first quarter of 2016 and, to a lesser extent, an increase in sales commissions. The increase in technology costs was primarily due to an acceleration of investments to improve our customers’ experiences through technology. Additionally, we incurred incremental selling and administrative expenses as a result of the OneGuard and Landmark acquisitions. The increase in customer service costs was due to higher labor costs resulting from an acceleration of pre-season hiring and training in preparation for the high-volume summer season.
In 2016 and 2015, the segment’s Adjusted EBITDA included interest and net investment income from the American Home Shield investment portfolio of $5 million and $8 million, respectively.
Franchise Services Group Segment
The Franchise Services Group segment, which consists of the ServiceMaster Restore (disaster restoration), ServiceMaster Clean (janitorial), Merry Maids (residential cleaning), Furniture Medic (cabinet and wood furniture repair) and AmeriSpec (home inspection) businesses, reported a six percent increase in revenue and a 10 percent increase in Adjusted EBITDA for the year ended December 31, 2017 compared to the year ended December 31, 2016. The Franchise Services Group segment reported a 14 percent decrease in revenue and a three percent increase in Adjusted EBITDA for the year ended December 31, 2016 compared to the year ended December 31, 2015.
Revenue
Revenue by service line is as follows:
|
|
||||||||||||
|
|
Year Ended December 31, |
% of Revenue |
||||||||||
|
(In millions) |
2017 |
2016 |
2015 |
2017 |
||||||||
|
Royalty Fees |
$ |
127 |
$ |
120 |
$ |
117 | 60 |
% |
||||
|
Company-Owned Merry Maids Branches |
— |
6 | 42 |
— |
% |
|||||||
|
Janitorial National Accounts |
53 | 43 | 41 | 25 |
% |
|||||||
|
Sales of Products |
16 | 16 | 18 | 7 |
% |
|||||||
|
Other |
17 | 15 | 14 | 8 |
% |
|||||||
|
Total revenue |
$ |
212 |
$ |
200 |
$ |
232 | 100 |
% |
||||
Year Ended December 31, 2017 Compared to Year Ended December 31, 2016
The increase in royalty fees was primarily driven by higher disaster restoration services. Royalty fees from disaster restoration services in 2017 were benefited by hurricanes Harvey and Irma. The decline in revenue from company-owned Merry Maids branches was attributable to the branch conversions, which were completed in 2016. The increase in revenue from janitorial national accounts was driven by increased sales activity. We intend to continue to focus on expanding our market share in janitorial national accounts.
Year Ended December 31, 2016 Compared to Year Ended December 31, 2015
The increase in royalty fees was primarily driven by higher disaster restoration services and a $2 million increase attributable to the branch conversions. Approximately $33 million of the decline in revenue from company-owned Merry Maids branches was attributable to the branch conversions with the remainder of the decline attributable to a decrease in new unit sales. The increase in revenue from janitorial national accounts was driven by increased sales activity. The decrease in sales of products was driven by lower franchisee demand.
In 2014, we began converting company-owned Merry Maids locations to franchises. During the year ended December 31, 2016, we converted 28 company-owned Merry Maids branches to franchises, and as of October 10, 2016, the branch conversion process was complete. As a result of the completion of the branch conversions, we do not expect any significant future revenues from company-owned Merry Maids branches. We expect this decline to be offset, in part, by modest increases in royalty fees.
46
Adjusted EBITDA
The following table provides a summary of changes in the segment’s Adjusted EBITDA:
|
|
|||
|
(In millions) |
|||
|
Year Ended December 31, 2015 |
$ |
77 | |
|
Impact of change in revenue |
(1) | ||
|
Sale of Merry Maids branches |
(3) | ||
|
Incentive compensation |
1 | ||
|
Cost reduction initiatives |
4 | ||
|
Other |
1 | ||
|
Year Ended December 31, 2016 |
$ |
79 | |
|
Impact of change in revenue |
8 | ||
|
Sale of Merry Maids branches |
1 | ||
|
Sales and marketing costs |
(1) | ||
|
Other |
1 | ||
|
Year Ended December 31, 2017 |
$ |
87 |
Year Ended December 31, 2017 Compared to Year Ended December 31, 2016
The impact of the increase in revenue was driven by the increase in royalty fees and relatively low margin revenue from janitorial national accounts. The reduction in revenue from company-owned Merry Maids branches was more than offset by cost reductions resulting in a $1 million favorable impact on Adjusted EBITDA.
Year Ended December 31, 2016 Compared to Year Ended December 31, 2015
The impact of the decrease in revenue on Adjusted EBITDA was driven by the decrease in revenue from company-owned Merry Maids branches and sales of products, offset, in part, by the increase in royalty fees and relatively low margin revenue from janitorial national accounts. We realized a reduction in Adjusted EBITDA of $3 million as a result of the branch conversions.
Corporate
Corporate reported a $4 million increase in Adjusted EBITDA for the year ended December 31, 2017 compared to the year ended December 31, 2016. Corporate reported a $6 million increase in Adjusted EBITDA for the year ended December 31, 2016 compared to the year ended December 31, 2015
Adjusted EBITDA
The following table provides a summary of changes in Corporate’s Adjusted EBITDA:
|
|
|||
|
(In millions) |
|||
|
Year Ended December 31, 2015 |
$ |
(9) | |
|
Insurance program |
5 | ||
|
Other |
1 | ||
|
Year Ended December 31, 2016 |
$ |
(3) | |
|
Insurance program |
4 | ||
|
Year Ended December 31, 2017 |
$ |
1 |
Year Ended December 31, 2017 Compared to Year Ended December 31, 2016
Corporate reported a $4 million increase in Adjusted EBITDA for the year ended December 31 2017 compared to the year ended December 31, 2016. The year ended December 31, 2016 included increased reserves in our automobile, general liability and workers’ compensation insurance program of $4 million driven by unfavorable claims trends, which were impacted by a charge of $3 million in connection with civil claims related to an incident at a family’s residence in Palm Beach County, Florida (an amount equal to our insurance deductibles under our general liability insurance program). There were no material changes to reserves in our automobile, general liability and workers’ compensation insurance program for the year ended December 31, 2017.
Year Ended December 31, 2016 Compared to Year Ended December 31, 2015
The decrease in expense related to our automobile, general liability and workers’ compensation insurance program was driven by the impact of increased reserves of $4 million and $9 million recorded in 2016 and 2015, respectively, driven by unfavorable claims trends. The unfavorable claims trends for 2016 were impacted by a charge of $3 million in connection with civil claims related to an incident at a family’s residence in Palm Beach County, Florida, and the unfavorable claims trends for 2015 were impacted by a charge of $3 million in connection with civil claims related to an incident at a resort in St. John in the U.S. Virgin Islands. Each of the $3 million charges are amounts equal to our insurance deductible under our general liability insurance program.
47
Discontinued Operations
TruGreen Spin-off
On January 14, 2014, the Company completed the TruGreen Spin-off resulting in the spin-off of the assets and certain liabilities of the TruGreen Business through a tax-free, pro rata dividend to the Company’s stockholders. As a result of the completion of the TruGreen Spin-off, New TruGreen operates the TruGreen Business as a private independent company.
In connection with the TruGreen Spin-off, the Company entered into a transition services agreement with New TruGreen pursuant to which the Company provides New TruGreen with specified communications, public relations, finance and accounting, tax, treasury, internal audit, human resources operations and benefits, risk management and insurance, supply management, real estate management, marketing, facilities, information technology and other support services. The charges for the transition services are designed to allow the Company to fully recover the direct costs of providing the services, plus specified margins and any out-of-pocket costs and expenses. The services provided under the transition services agreement terminated at various specified times on or prior to December 31, 2017, except certain information technology services which the Company has entered into an agreement with New TruGreen to extend through June 30, 2018. New TruGreen may terminate the extended transition services agreement for convenience upon 90 days written notice.
Under this transition services agreement, in the years ended December 31, 2017, 2016 and 2015, the Company recorded $2 million, $9 million and $25 million, respectively, of fees from New TruGreen, which is included as a reduction, net of costs incurred, in Selling and administrative expenses in the consolidated statement of operations and comprehensive income. As of December 31, 2017, all amounts owed by New TruGreen under this agreement have been paid.
Financial Information for Discontinued Operations
Gain (loss) from discontinued operations, net of income taxes, for all periods presented includes the operating results of the previously sold businesses.
The operating results of discontinued operations are as follows:
|
|
|||||||||
|
|
Year Ended December 31, |
||||||||
|
(In millions) |
2017 |
2016 |
2015 |
||||||
|
Revenue |
$ |
— |
$ |
— |
$ |
— |
|||
|
Cost of services rendered and products sold |
— |
— |
— |
||||||
|
Selling and administrative expenses |
$ |
(1) |
$ |
1 |
$ |
3 | |||
|
Income (loss) before income taxes |
1 | (1) | (3) | ||||||
|
Benefit for income taxes |
— |
— |
(1) | ||||||
|
Gain (loss) from discontinued operations, net of income taxes |
$ |
— |
$ |
(1) |
$ |
(2) | |||
Liquidity and Capital Resources
Liquidity
We are highly leveraged, and a substantial portion of our liquidity needs are due to service requirements on our significant indebtedness. The agreements governing the $1,650 million Term Loan Facility maturing November 8, 2023 and the $300 million revolving credit facility maturing November 8, 2021 (together, the “Credit Facilities”) contain covenants that limit or restrict our ability, including the ability of certain of our subsidiaries, to incur additional indebtedness, repurchase debt, incur liens, sell assets, make certain payments (including dividends) and enter into transactions with affiliates. As of December 31, 2017, we were in compliance with the covenants under the agreements that were in effect on such date.
Our ongoing liquidity needs are expected to be funded by cash on hand, net cash provided by operating activities and, as required, borrowings under the Credit Facilities. We expect that cash provided from operations and available capacity under the Revolving Credit Facility will provide sufficient funds to operate our business, make expected capital expenditures and meet our liquidity requirements for the following 12 months, including payment of interest and principal on our debt. Cash and short- and long-term marketable securities totaled $522 million as of December 31, 2017, compared with $335 million as of December 31, 2016. As of December 31, 2017, there were $33 million of letters of credit outstanding and $267 million of available borrowing capacity under the Revolving Credit Facility. The letters of credit are posted to satisfy collateral requirements under our automobile, general liability and workers’ compensation insurance program and fuel swap contracts.
In 2016, our board of directors authorized a three-year share repurchase program, under which we may repurchase up to $300 million of outstanding shares of our common stock. As of December 31, 2017, we have repurchased $145 million of outstanding shares under this program, which is included in treasury stock on the consolidated statements of financial position.
In 2017, we resolved by plea agreement the federal criminal consequences related to the U.S. Virgin Islands matter and paid $10 million. In 2016, we settled all civil claims of the affected families related to the U.S. Virgin Islands and Florida fumigation matters, and payments in connection with those claims totaled $90 million ($56 million, net of tax). See Note 9 to the consolidated financial statements for more details.
48
We submitted to the IRS a voluntary correction proposal to remedy an administrative error related to our Profit Sharing and Retirement Plan. We settled this matter with the IRS during the year ended 2017 for $22 million. We had accrued $25 million as of December 31, 2016, thus the settlement resulted in a reversal of our previous accrual of $3 million during the third quarter of 2017. See Note 10 to the consolidated financial statements for more details.
Cash and short- and long-term marketable securities include balances associated with regulatory requirements at American Home Shield. See “—Limitations on Distributions and Dividends by Subsidiaries.” American Home Shield’s investment portfolio has been invested in a combination of high-quality, debt securities and equity securities. We closely monitor the performance of the investments. From time to time, we review the statutory reserve requirements to which our regulated entities are subject and any changes to such requirements. These reviews may result in identifying current reserve levels above or below minimum statutory reserve requirements, in which case we may adjust our reserves. The reviews may also identify opportunities to satisfy certain regulatory reserve requirements through alternate financial vehicles.
As of December 31, 2017, we had posted $31 million in letters of credit, which were issued under the Revolving Credit Facility, and $89 million of cash, which is included in Restricted cash on the consolidated statements of financial position, as collateral under our automobile, general liability and workers’ compensation insurance program. This amount is not related to the payments made in connection with U.S. Virgin Islands. We may from time to time change the amount of cash or marketable securities used to satisfy collateral requirements under our automobile, general liability and workers’ compensation insurance program. The amount of cash or marketable securities utilized to satisfy these collateral requirements will depend on the relative cost of the issuance of letters of credit under the Revolving Credit Facility and our cash position. Any change in cash or marketable securities used as collateral would result is a corresponding change in our available borrowing capacity under the Revolving Credit Facility.
Additionally, under the terms of our fuel swap contracts, we are required to post collateral in the event the fair value of the contracts exceeds a certain agreed upon liability level and in other circumstances required by the agreement with the counterparty. As of December 31, 2017, the estimated fair value of our fuel swap contracts was a net asset of $3 million, and we had posted $2 million in letters of credit as collateral under our fuel hedging program, which were also issued under the Revolving Credit Facility. The continued use of letters of credit for this purpose in the future could limit our ability to post letters of credit for other purposes and could limit our borrowing availability under the Revolving Credit Facility. However, we do not expect the fair value of the outstanding fuel swap contracts to materially impact our financial position or liquidity.
We may from time to time repurchase or otherwise retire or extend our debt and/or take other steps to reduce our debt or otherwise improve our financial position, results of operations or cash flows. These actions may include open market debt repurchases, negotiated repurchases, other retirements of outstanding debt and/or opportunistic refinancing of debt. The amount of debt that may be repurchased or otherwise retired or refinanced, if any, will depend on market conditions, trading levels of our debt, our cash position, compliance with debt covenants and other considerations.
Refinancing of Indebtedness
On September 18, 2017, we purchased $13 million in aggregate principal amount of our 7.25% notes maturing in 2038 at a price of 104.625% of the principal amount using available cash. On May 11, 2017, we purchased $17 million in aggregate principal amount of our 7.25% notes maturing in 2038 at a price of 97% of the principal amount using available cash. The repurchased notes were delivered to the trustee for cancellation. In connection with these partial repurchases, we recorded a loss on extinguishment of debt of $6 million in the year ended December 31, 2017.
On November 8, 2016, we entered into a $1,650 million Term Loan Facility and a $300 million Revolving Credit Facility and sold $750 million of 2024 Notes. Borrowings under the Term Loan Facility and the 2024 Notes were used to repay the remaining outstanding $2,356 million in aggregate principal amount of the Old Term Loan Facility. In connection with the repayment, we recorded a loss on extinguishment of debt of $32 million in the year ended December 31, 2016, which includes the write-off of $14 million of original issue discount and $18 million of debt issuance costs. In addition, $38 million of proceeds was used to pay debt issuance costs of $34 million and original issue discount of $4 million in connection with the Term Loan Facility, the Revolving Credit Facility and the 2024 Notes.
On November 7, 2016, we entered into a seven-year interest rate swap agreement effective November 8, 2016. The notional amount of the agreement was $650 million. Under the terms of the agreement, we will pay a fixed rate of interest of 1.493% on the $650 million notional amount, and we will receive a floating rate of interest (based on one-month LIBOR, subject to a floor of zero percent) on the notional amount. Therefore, during the term of the agreement, the effective interest rate on $650 million of the Term Loan Facility is fixed at a rate of 1.493%, plus the incremental borrowing margin of 2.50%. On November 8, 2016, the Company terminated the then-existing interest rate swap agreements and paid $10 million in connection with the terminations.
Fleet and Equipment Financing Arrangements
We have entered into a fleet management services agreement (the “Fleet Agreement”) which, among other things, allows us to obtain fleet vehicles through a leasing program. We expect to fulfill substantially all of our vehicle fleet needs through the leasing program under the Fleet Agreement. For the year ended December 31, 2017, we acquired $33 million of vehicles through the leasing program under the Fleet Agreement. All leases under the Fleet Agreement are capital leases for accounting purposes. The lease rental payments include an interest component calculated using a variable rate based on one-month LIBOR plus other contractual
49
adjustments and a borrowing margin totaling 2.45%. We have no minimum commitment for the number of vehicles to be obtained under the Fleet Agreement. Additionally, a portion of our property and equipment is leased through programs outside the scope of the Fleet Agreement. For the year ended December 31, 2017, we acquired $1 million of property and equipment through these incremental leasing programs, which are treated as capital leases for accounting purposes. We anticipate new lease financings for the full year 2018 will range from approximately $25 million to $35 million.
Limitations on Distributions and Dividends by Subsidiaries
We are a holding company, and as such have no independent operations or material assets other than ownership of equity interests in our subsidiaries. We depend on our subsidiaries to distribute funds to us so that we may pay obligations and expenses, including satisfying obligations with respect to indebtedness. The ability of our subsidiaries to make distributions and dividends to us depends on their operating results, cash requirements and financial condition and general business conditions, as well as restrictions under the laws of our subsidiaries’ jurisdictions.
The agreements governing the Credit Facilities may restrict the ability of our subsidiaries to pay dividends, make loans or otherwise transfer assets to us. Further, our subsidiaries are permitted under the terms of the Credit Facilities and other indebtedness to incur additional indebtedness that may restrict or prohibit the making of distributions, the payment of dividends or the making of loans by such subsidiaries to us.
Furthermore, there are third-party restrictions on the ability of certain of our subsidiaries to transfer funds to us. These restrictions are related to regulatory requirements at American Home Shield and to a subsidiary borrowing arrangement at SMAC. The payments of ordinary and extraordinary dividends by our home service plan and similar subsidiaries (through which we conduct our American Home Shield business) are subject to significant regulatory restrictions under the laws and regulations of the states in which they operate. Among other things, such laws and regulations require certain such subsidiaries to maintain minimum capital and net worth requirements and may limit the amount of ordinary and extraordinary dividends and other payments that these subsidiaries can pay to us. As of December 31, 2017, the total net assets subject to these third-party restrictions was $192 million. We expect that such limitations will be in effect for the foreseeable future. None of our subsidiaries are obligated to make funds available to us through the payment of dividends.
We previously considered the earnings in our non-U.S. subsidiaries to be indefinitely reinvested and, accordingly, recorded no deferred income taxes. The Act imposes a one-time tax (“Transition Tax”) on undistributed and previously untaxed post-1986 foreign earnings and profits, as determined in accordance with U.S. tax principles, of certain foreign owned corporations owned by U.S. stockholders. Prior to the Transition Tax included in the Act discussed herein, we had an excess amount for financial reporting over the tax basis in our foreign subsidiaries, including cumulative undistributed earnings of the Company’s foreign subsidiaries of $60 million as of December 31, 2016. While the Transition Tax resulted in all remaining undistributed foreign earnings being subject to U.S. tax, an actual repatriation from our non-U.S. subsidiaries could still be subject to additional foreign withholding taxes and U.S. state taxes. Included in our December 31, 2017 U.S. income tax provision is less than $1 million in Transition Tax.
The amount of cash associated with indefinitely reinvested foreign earnings was approximately $29 million and $23 million as of December 31, 2017 and 2016, respectively. We are currently analyzing our global working capital and cash requirements and the potential tax liabilities attributable to repatriation, but have yet to determine whether we plan to change our prior assertion and repatriate earnings. Accordingly, we have not recorded any deferred taxes attributable to our investment in foreign subsidiaries. We will record the tax effects of any change in our prior assertion in the period that we complete our analysis and are able to make a reasonable estimate, and disclose any unrecognized deferred tax liability for temporary differences related to our foreign investments, if practicable.
Cash Flows
Cash flows from operating, investing and financing activities, as reflected in the accompanying consolidated statements of cash flows, are summarized in the following table.
|
|
|||||||||
|
|
Year Ended December 31, |
||||||||
|
(In millions) |
2017 |
2016 |
2015 |
||||||
|
Net cash provided from (used for): |
|||||||||
|
Operating activities |
$ |
413 |
$ |
325 |
$ |
398 | |||
|
Investing activities |
(85) | (133) | (98) | ||||||
|
Financing activities |
(152) | (102) | (381) | ||||||
|
Discontinued operations |
— |
— |
(11) | ||||||
|
Effect of exchange rate changes on cash |
1 |
— |
(2) | ||||||
|
Cash increase (decrease) during the period |
$ |
177 |
$ |
89 |
$ |
(92) | |||
Operating Activities
Net cash provided from operating activities from continuing operations increased $88 million to $413 million for the year ended December 31, 2017 compared to $325 million for the year ended December 31, 2016 and $398 million for the year ended December 31, 2015.
50
Net cash provided from operating activities in 2017 comprised $436 million in earnings adjusted for non-cash charges, offset, in part, by $12 million in payments related to fumigation matters and a $11 million increase in cash required for working capital (a $14 million decrease excluding the working capital impact of accrued interest, restructuring and taxes). For the year ended December 31, 2017, working capital requirements were favorably impacted by the enactment of U.S. Tax Reform.
Net cash provided from operating activities in 2016 comprised $431 million in earnings adjusted for non-cash charges, offset, in part, by $90 million in payments related to fumigation matters and a $16 million increase in cash required for working capital (a $22 million increase excluding the working capital impact of accrued interest, restructuring and taxes). For the year ended December 31, 2016, working capital requirements were negatively impacted by timing of payments related to self-insured claims.
Net cash provided from operating activities in 2015 comprised $406 million in earnings adjusted for non-cash charges, offset, in part, by $1 million in payments related to fumigation matters and a $7 million increase in cash required for working capital (an $18 million decrease excluding the working capital impact of accrued interest, restructuring and taxes). For the year ended December 31, 2015, working capital requirements were negatively impacted by the timing of interest payments driven by the redemption of the 2020 Notes, offset, in part, by favorable changes in the payment terms with certain of our vendors.
Investing Activities
Net cash used for investing activities from continuing operations was $85 million for the year ended December 31, 2017 compared to $133 million for the year ended December 31, 2016 and $98 million for the year ended December 31, 2015.
Capital expenditures increased to $77 million ($75 million, net of government grants) in 2017 from $56 million in 2016 and $40 million in 2015 and included recurring capital needs, investments in our new corporate headquarters, which we refer to as our Global Service Center, and information technology projects. Approximately $21 million of capital expenditures related to our Global Service Center relocation were funded by a tenant improvement allowance. We anticipate capital expenditures for the full year 2018 will range from $70 million to $80 million, reflecting additional Global Service Center relocation costs, recurring capital needs and the continuation of investments in information systems and productivity enhancing technology. In addition, we expect incremental capital expenditures will be required to effect the proposed spin-off of American Home Shield in 2018 and will range from $20 million to $30 million, principally reflecting costs to replicate information technology systems historically shared by our business units. We expect to fulfill our ongoing vehicle fleet needs through vehicle capital leases. We have no additional material capital commitments at this time.
Proceeds from the sale of equipment and other assets was $4 million, $8 million and $14 million in 2017, 2016 and 2015, respectively, primarily driven by the branch conversions at Merry Maids in 2016 and 2015. The branches were sold for a total purchase price of $9 million and $17 million in 2016 and 2015, respectively. In 2016 and 2015, we received cash of $6 million and $13 million, and provided financing of $2 million and $4 million, respectively. As of October 10, 2016, the branch conversion process was complete.
Cash payments for acquisitions totaled $13 million in 2017, compared with $121 million in 2016 and $92 million in 2015. In 2017, consideration given for the purchase of a master distributor and for tuck-in acquisitions consisted of cash payments of $13 million and deferred payments of $3 million. In 2016, we acquired OneGuard Home Warranties for $61 million consisting of cash consideration of $52 million and deferred payments of $9 million and Landmark for $39 million consisting of net cash consideration of $35 million including deferred payments of $5 million. We expect to continue our tuck-in acquisition program at Terminix and to periodically evaluate other strategic acquisitions.
Cash flows provided from purchases, sales and maturities of securities, net, in 2017, 2016 and 2015 were $2 million, $43 million and $26 million, respectively, and were driven by the maturity and sale of marketable securities at American Home Shield.
Cash flows used for notes receivable, net, were $2 million, $3 million and $6 million in 2017, 2016 and 2015, respectively, and were a result of increased financing provided by SMAC to our franchisees and retail customers of our operating units.
Financing Activities
Net cash used for financing activities from continuing operations was $152 million for the year ended December 31, 2017 compared to $102 million for the year ended December 31, 2016 and $381 million for the year ended December 31, 2015.
During 2017, we made scheduled principal payments on long-term debt of $67 million, purchased $30 million in aggregate principal amount of our 7.25% notes maturing in 2038 using available cash, repurchased $85 million of common stock and received $30 million from the issuance of common stock upon the exercise of stock options and shares issued under the Employee Stock Purchase Plan.
During 2016, we entered into a $1,650 Term Loan Facility and sold $750 million of 2024 Notes and used the proceeds to repay the remaining outstanding $2,356 million in aggregate principal amount of the Old Term Facility. Additionally, we made scheduled principal payments on long-term debt of $61 million, paid $4 million in original issue discount, paid $34 million in debt issuance costs, repurchased $60 million of common stock and received $13 million from the issuance of common stock through the exercise of stock options and the sale of shares under the Employee Stock Purchase Plan.
51
During 2015, we borrowed an incremental $583 million, made scheduled principal payments on long-term debt of $45 million and redeemed $390 million and $488 million in aggregate principal amount of our 8% 2020 Notes and 7% 2020 Notes, respectively, at a redemption price of 106.0% and 105.25%, respectively, of the principal amounts. Additionally, we paid $2 million in original issue discount, paid $5 million in debt issuance costs, paid $49 million for the call premium paid on the retirement of debt and received $16 million from the issuance of common stock through the exercise of stock options and the sale of shares under the Employee Stock Purchase Plan.
Contractual Obligations
The following table presents our contractual obligations and commitments as of December 31, 2017.
|
|
|||||||||||||||
|
(In millions) |
Total |
Less than 1 Yr |
1 - 3 Yrs |
3 - 5 Yrs |
More than 5 Yrs |
||||||||||
|
Principal repayments* |
$ |
2,763 |
$ |
116 |
$ |
64 |
$ |
35 |
$ |
2,548 | |||||
|
Capital leases* |
91 | 29 | 45 | 16 | 1 | ||||||||||
|
Estimated interest payments(1) |
887 | 132 | 249 | 243 | 264 | ||||||||||
|
Non-cancelable operating leases(2) |
146 | 18 | 30 | 25 | 73 | ||||||||||
|
Purchase obligations(3) |
56 | 41 | 15 |
— |
— |
||||||||||
|
Insurance claims* |
239 | 117 | 54 | 23 | 46 | ||||||||||
|
Other, including deferred compensation trust* |
9 | 2 | 1 | 1 | 4 | ||||||||||
|
Total amount |
$ |
4,191 |
$ |
454 |
$ |
458 |
$ |
342 |
$ |
2,936 | |||||
__________________________________
*These items are reported in the consolidated statements of financial position.
|
(1) |
These amounts represent future interest payments related to existing debt obligations based on fixed and variable interest rates and principal maturities specified in the associated debt agreements. As of December 31, 2017, payments related to variable debt are based on applicable rates at December 31, 2017 plus the specified margin in the associated debt agreements for each period presented. As of December 31, 2017, the estimated debt balance (including capital leases) as of each fiscal year end from 2018 through 2021 is $2,709 million, $2,644 million, $2,600 million, $2,570 million and $2,549 million, respectively. The weighted-average interest rate on the estimated debt balances at each fiscal year end from 2018 through 2021 is expected to be 4.7 percent. See Note 11 to the consolidated financial statements for the terms and maturities of existing debt obligations. |
|
(2) |
These amounts primarily represent future payments relating to real estate operating leases. Lease exit costs, including redundant rent, expected to be incurred in 2018 of approximately $8 million related to the lease for our corporate headquarters and the headquarters for Terminix have been excluded. See Note 8 to the consolidated financial statements for additional discussion of our restructuring costs. A portion of our vehicle fleet and some equipment are leased through cancelable operating leases and are therefore excluded in the table above. |
|
(3) |
These obligations include commitments for various products and services including, among other things, inventory purchases, telecommunications services, marketing and advertising services and other professional services. Arrangements are considered purchase obligations if a contract specifies all significant terms, including fixed or minimum quantities to be purchased, a pricing structure and approximate timing of the transactions. Most arrangements are cancelable without a significant penalty and with short notice (usually 30‑120 days) and amounts reflected above include our minimum contractual obligation (inclusive of applicable cancellation penalties). For obligations with significant penalties associated with termination, the minimum required expenditures over the term of the agreement have been included in the table above. |
Due to the uncertainty with respect to the timing of future cash flows associated with unrecognized tax benefits at December 31, 2017, we are unable to reasonably estimate the period of cash settlement with the respective taxing authority. Accordingly, $14 million of unrecognized tax benefits have been excluded from the contractual obligations table above. See the discussion of income taxes in Note 5 to the consolidated financial statements.
Financial Position—Continuing Operations
The following discussion describes changes in our financial position from December 31, 2016 to December 31, 2017.
Receivables increased from prior year levels, primarily related to customer growth at American Home Shield.
Prepaid expenses and other assets increased due to an increase in the income tax receivable as a result of U.S. Tax Reform. See Note 5 to the consolidated financial statements for more details.
Property and equipment increased from prior year levels, reflecting purchases for the Global Service Center relocation, recurring capital needs, information technology projects and the acquisition of vehicles under the Fleet Agreement, offset, in part, by depreciation expense.
Goodwill increased from prior year levels due to several pest control and termite acquisitions and the purchase of a master distributor. See Notes 4 and 6 to the consolidated financial statements for more details.
52
Restricted cash represents amounts posted as collateral under our automobile, general liability and workers’ compensation insurance program.
Payroll and related expenses increased from prior year levels reflecting an increase in accrued payroll and incentive compensation expense.
Deferred revenue increased from prior year levels, primarily reflecting customer growth American Home Shield.
The current portion of long-term debt increased and long-term debt decreased from prior year levels, primarily due to the 2018 Notes becoming current as the Notes are due during the first quarter of 2018. See Note 11 to the consolidated financial statements for more details.
Deferred taxes decreased from prior year levels, primarily due to the rate impact of U.S. Tax Reform. See Note 5 to the consolidated financial statements for more details.
Total shareholders’ equity was $1,167 million as of December 31, 2017 compared to $686 million as of December 31, 2016. The increase was primarily driven by the $510 million of net income generated in 2017 which reduced our accumulated deficit. See the consolidated statements of shareholders’ equity for further information.
Off-Balance Sheet Arrangements
As of December 31, 2017, we did not have any significant off-balance sheet arrangements.
We do not have any relationships with unconsolidated entities or financial partnerships, such as entities often referred to as structured finance or special purpose entities, established for the purpose of facilitating off- balance sheet arrangements or other contractually narrow or limited purposes. Accordingly, we are not materially exposed to any financing, liquidity, market or credit risk that could arise if we had engaged in such relationships.
Critical Accounting Policies and Estimates
The preparation of the consolidated financial statements requires management to make certain estimates and assumptions required under GAAP which may differ from actual results. The following are our most critical accounting policies, which are those that require management’s most difficult, subjective and complex judgments, requiring the need to make estimates about the effect of matters that are inherently uncertain and may change in subsequent periods. The following discussion is not intended to represent a comprehensive list of our accounting policies. For a detailed description of the application of these and other accounting policies, see Note 2 to the consolidated financial statements included in this Annual Report on Form 10-K.
Self-insurance accruals
We carry insurance policies on insurable risks at levels which we believe to be appropriate, including workers’ compensation, auto and general liability risks. We purchase insurance from third-party insurance carriers. These policies typically incorporate significant deductibles or self-insured retentions. We are responsible for all claims that fall within the retention limits. In determining our accrual for self-insured claims, we use historical claims experience to establish both the current year accrual and the underlying provision for future losses. This actuarially determined provision and related accrual include both known claims, as well as incurred but not reported claims. We adjust our estimate of accrued self-insured claims when required to reflect changes based on factors such as changes in health care costs, accident frequency and claim severity. We believe the use of actuarial methods to account for these liabilities provides a consistent and effective way to measure these highly judgmental accruals. However, the use of any estimation technique in this area is inherently sensitive given the magnitude of claims involved and the length of time until the ultimate cost is known. We believe our recorded obligations for these expenses are consistently measured. Nevertheless, changes in healthcare costs, accident frequency and claim severity can materially affect the estimates for these liabilities.
Home Service Plan Claims Accruals
Home service plan contracts are typically one year in duration. Home service plan claims costs are expensed as incurred. We recognize revenue over the life of these contracts in proportion to the expected direct costs. Those costs bear a direct relationship to the fulfillment of our obligations under the contracts and are representative of the relative value provided to the customer (proportional performance method). Accruals for home service plan claims at American Home Shield are made based on our claims experience and actuarial projections. The Company’s actuary performs a reserve analysis utilizing generally accepted actuarial methods that incorporate cumulative historical claims experience and information provided by the Company. We regularly review our estimates of claims costs and adjust the estimates when appropriate. We believe the use of actuarial methods to account for these liabilities provides a consistent and effective way to measure these highly judgmental accruals. However, the use of any estimation technique in this area is inherently sensitive given the magnitude of claims involved. We believe our recorded obligations for these expenses are consistently measured. Nevertheless, changes in claims costs can materially affect the estimates for these liabilities.
Income Taxes
We record deferred income tax balances based on the net tax effects of temporary differences between the carrying value of assets and liabilities for financial reporting purposes and income tax purposes. Based on the evaluation of all available information, the Company recognizes future tax benefits, such as net operating loss carryforwards, to the extent that realizing these benefits is
53
considered more likely than not. We record valuation allowances against our deferred tax assets, when necessary. Realization of deferred tax assets (such as net operating loss carry-forwards) is dependent on future taxable earnings and is therefore uncertain. At least quarterly, we assess the likelihood that our deferred tax asset balance will be recovered from future taxable income. Significant judgment is required in evaluating the need for and magnitude of appropriate valuation allowances against deferred tax assets.
On an interim basis, we estimate what our effective tax rate will be for the full fiscal year. This estimated annual effective tax rate is then applied to the year-to-date income before income taxes, excluding infrequently occurring or unusual items, to determine the year-to-date income tax expense. The income tax effects of infrequent or unusual items are recognized in the interim period in which they occur. As the year progresses, we continually refine our estimate based upon actual events and earnings by jurisdiction during the year. This continual estimation process periodically results in a change to our expected effective tax rate for the fiscal year. When this occurs, we adjust the income tax provision during the quarter in which the change in estimate occurs. Our current and deferred tax provisions are based on estimates and assumptions that could differ from the final positions reflected in our income tax returns. We adjust our current and deferred tax provisions based on our income tax returns which are generally filed in the third or fourth quarters of the subsequent year.
Our income tax returns are audited by U.S. state, U.S. federal and foreign tax authorities, and we are typically engaged in various tax examinations at any given time. Uncertain tax positions often arise due to uncertainty or differing interpretations of the application of tax rules throughout the various jurisdictions in which we operate. On a quarterly basis, we evaluate the probability that a tax position will be effectively sustained and the appropriateness of the amount recognized for uncertain tax positions based on factors including changes in facts or circumstances, changes in tax law, settled audit issues and new audit activity. Changes in our assessment may result in the recognition of a tax benefit or an additional charge to the tax provision in the period our assessment changes. While management believes that these judgments and estimates are appropriate and reasonable under the circumstances, actual resolution of these matters may differ from recorded estimated amounts. We recognize interest and penalties related to income tax matters in income tax expense.
Property and Equipment, Intangible Assets and Goodwill
Fixed assets and intangible assets with finite lives are depreciated and amortized on a straight‑line basis over their estimated useful lives. These lives are based on our previous experience for similar assets, potential market obsolescence and other industry and business data. As required by accounting standards for the impairment or disposal of long‑lived assets, our fixed assets and finite‑lived intangible assets are tested for recoverability whenever events or changes in circumstances indicate their carrying amounts may not be recoverable. If the carrying value is no longer recoverable based upon the undiscounted future cash flows of the asset, an impairment loss would be recognized equal to the difference between the carrying amount and the fair value of the asset. Changes in the estimated useful lives or in the asset values could cause us to adjust its book value or future expense accordingly.
As required under accounting standards for goodwill and other intangibles, goodwill is not subject to amortization, and intangible assets with indefinite useful lives are not amortized until their useful lives are determined to no longer be indefinite. Goodwill and intangible assets that are not subject to amortization are subject to assessment for impairment by applying a fair‑value based test on an annual basis or more frequently if circumstances indicate a potential impairment. Goodwill and indefinite-lived intangible assets, primarily our trade names, are assessed annually for impairment during the fourth quarter or earlier upon the occurrence of certain events or substantive changes in circumstances. Our goodwill is assigned to three reporting units: Terminix, American Home Shield and Franchise Services Group. The October 1, 2017 estimated fair values for all reporting units were substantially in excess of their respective carrying values, and we do not believe the reporting units were at risk of impairment as of December 31, 2017. Our 2017, 2016 and 2015 annual impairment analyses, which were performed as of October 1 of each year, did not result in any goodwill or trade name impairments to continuing operations.
As a result of the American Home Shield spin-off transaction, we will be required to perform an interim impairment analysis on the ServiceMaster trade name as of the proposed spin-off date. The assumptions used in this analysis will be developed with the view of assumed royalty and discount rates of ServiceMaster as a stand-alone public company. Such interim impairment analysis may cause us to record a non-cash impairment loss, which could be material to our results of operations.
Stock-Based Compensation
Stock-based compensation expense for stock options is estimated at the grant date based on an award’s fair value as calculated by the Black-Scholes option-pricing model and is recognized as expense over the requisite service period. The Black-Scholes model requires various highly judgmental assumptions including expected volatility and option life. If any of the assumptions used in the Black-Scholes model change significantly, stock-based compensation expense for future grants may differ materially from that recorded in the current period related to options granted to date. In addition, we estimate the expected forfeiture rate and only recognize expense for those shares expected to vest. We estimate the forfeiture rate based on historical experience. To the extent our actual forfeiture rate is different from our estimate, stock-based compensation expense is adjusted accordingly. See Note 16 to the consolidated financial statements for more details.
Contingent Liabilities
Accruals for contingent liabilities, including legal and environmental matters, are recorded when it is probable that a liability has been incurred or an asset impaired and the amount of the loss can be reasonably estimated. Liabilities accrued for legal matters
54
require judgments regarding projected outcomes and range of loss based on historical experience and recommendations of legal counsel. Liabilities for environmental matters require evaluations of relevant environmental regulations and estimates of future remediation alternatives and costs.
Newly Issued Accounting Standards
New accounting rules and disclosure requirements can significantly impact our reported results and the comparability of our financial statements. We did not adopt any new accounting standards in the year ended December 31, 2017. See Note 2 to the consolidated financial statements for further information on these adoptions and other newly issued accounting standards.
Information Regarding Forward-Looking Statements
This report contains forward-looking statements and cautionary statements, including statements with respect to the potential spin-off of American Home Shield from ServiceMaster and the distribution of American Home Shield shares to ServiceMaster stockholders. Forward-looking statements can be identified by the use of forward-looking terms such as “believes,” “expects,” “may,” “will,” “shall,” “should,” “would,” “could,” “seeks,” “aims,” “projects,” “is optimistic,” “intends,” “plans,” “estimates,” “anticipates” or other comparable terms. Forward-looking statements are subject to known and unknown risks and uncertainties including, but not limited to: uncertainties as to the timing of the spin-off or whether it will be completed at all, the results and impact of the announcement of the proposed spin-off, the failure to satisfy any conditions to complete the spin-off, the expected tax treatment of the spin-off, the increased demands on management to prepare for and accomplish the spin-off, the incurrence of significant transaction costs, the impact of the spin-off on the businesses of ServiceMaster and American Home Shield, and the failure to achieve anticipated benefits of the spin-off. These forward-looking statements also include, but are not limited to statements regarding our intentions, beliefs, assumptions or current expectations concerning, among other things, financial position; results of operations; cash flows; prospects; growth strategies or expectations; impact resulting from U.S. Tax Reform; customer retention; the continuation of acquisitions, including the integration of any acquired company and risks relating to any such acquired company; fuel prices; attraction and retention of key personnel; the impact of fuel swaps; the valuation of marketable securities; estimates of accruals for self-insured claims related to workers’ compensation, auto and general liability risks; estimates of accruals for home service plan claims; estimates of future payments under operating and capital leases; estimates on current and deferred tax provisions; the outcome (by judgment or settlement) and costs of legal or administrative proceedings, including, without limitation, collective, representative or class action litigation; and the impact of prevailing economic conditions.
Forward-looking statements are subject to known and unknown risks and uncertainties, many of which may be beyond our control. We caution you that forward-looking statements are not guarantees of future performance or outcomes and that actual performance and outcomes, including, without limitation, our actual results of operations, financial condition and liquidity, and the development of the segments in which we operate, may differ materially from those made in or suggested by the forward-looking statements contained in this report. In addition, even if our results of operations, financial condition and cash flows, and the development of the segments in which we operate, are consistent with the forward-looking statements contained in this report, those results or developments may not be indicative of results or developments in subsequent periods. A number of important factors, including, without limitation, the risks and uncertainties discussed in “Risk Factors” and “Management’s Discussion and Analysis of Financial Condition and Results of Operations” above, could cause actual results and outcomes to differ from those reflected in the forward-looking statements. Additional factors that could cause actual results and outcomes to differ from those reflected in forward-looking statements include, without limitation:
|
· |
our ability to successfully complete the spin-off of American Home Shield, including the impact of the spin-off on the businesses of ServiceMaster and the American Home Shield company, the ability of both companies to meet debt service requirements, the availability and terms of financing and expectations of credit rating; |
|
· |
the expected tax treatment of the spin-off; |
|
· |
the increased demands on management to prepare for and accomplish the spin-off; |
|
· |
the incurrence of significant transaction costs; |
|
· |
the impact of the spin on the businesses of ServiceMaster and American Home Shield; |
|
· |
lawsuits, enforcement actions and other claims by third parties or governmental authorities; |
|
· |
compliance with, or violation of, environmental, health and safety laws and regulations; |
|
· |
cyber security breaches, disruptions or failures in our information technology systems and our failure to protect the security of personal information about our customers; |
|
· |
our ability to attract and retain key personnel, including our ability to attract, retain and maintain positive relations with trained workers and third-party contractors; |
|
· |
adverse weather conditions; |
|
· |
weakening general economic conditions, especially as they may affect home sales, unemployment and consumer confidence or spending levels; |
55
|
· |
our ability to generate the significant amount of cash needed to fund our operations and service our debt obligations; |
|
· |
our ability to successfully implement our business strategies; |
|
· |
increase in prices for fuel and raw materials, and in minimum wage levels; |
|
· |
changes in the source and intensity of competition in our segments; |
|
· |
our franchisees, subcontractors, third-party distributors and vendors taking actions that harm our business; |
|
· |
changes in our services or products; |
|
· |
our ability to protect our intellectual property and other material proprietary rights; |
|
· |
negative reputational and financial impacts resulting from future acquisitions or strategic transactions; |
|
· |
laws and governmental regulations increasing our legal and regulatory expenses; |
|
· |
increases in interest rates increasing the cost of servicing our substantial indebtedness; |
|
· |
increased borrowing costs due to lowering or withdrawal of the ratings, outlook or watch assigned to our debt securities; |
|
· |
restrictions contained in our debt agreements; |
|
· |
the effects of our substantial indebtedness and the limitations contained in the agreements governing such indebtedness; and |
|
· |
other factors described in this report and from time to time in documents that we file with the SEC. |
You should read this report completely and with the understanding that actual future results may be materially different from expectations. All forward-looking statements made in this report are qualified by these cautionary statements. These forward-looking statements are made only as of the date of this report, and we do not undertake any obligation, other than as may be required by law, to update or revise any forward-looking or cautionary statements to reflect changes in assumptions, the occurrence of events, unanticipated or otherwise, and changes in future operating results over time or otherwise.
Comparisons of results for current and any prior periods are not intended to express any future trends, or indications of future performance, unless expressed as such, and should only be viewed as historical data.
ITEM 7A. QUANTITATIVE AND QUALITATIVE DISCLOSURES ABOUT MARKET RISK
The economy and its impact on discretionary consumer spending, labor wages, fuel prices and other material costs, home resales, unemployment rates, insurance costs and medical costs could have a material adverse impact on future results of operations.
We do not hold or issue derivative financial instruments for trading or speculative purposes. We have entered into specific financial arrangements, primarily fuel swap agreements and interest rate swap agreements, in the normal course of business to manage certain market risks, with a policy of matching positions and limiting the terms of contracts to relatively short durations. The effect of derivative financial instrument transactions could have a material impact on our financial statements.
Interest Rate Risk
We are exposed to the impact of interest rate changes and manage this exposure through the use of variable-rate and fixed-rate debt and by utilizing interest rate swaps.
On November 7, 2016, we entered into a seven-year interest rate swap agreement effective November 8, 2016. The notional amount of the agreement was $650 million. Under the terms of the agreement, we will pay a fixed rate of interest of 1.493% on the $650 million notional amount, and we will receive a floating rate of interest (based on one‑month LIBOR, subject to a floor of zero percent) on the notional amount. Therefore, during the term of the agreement, the effective interest rate on $650 million of the Term Loan Facility is fixed at a rate of 1.493%, plus the incremental borrowing margin of 2.50%.
We believe our exposure to interest rate fluctuations, when viewed on both a gross and net basis, is material to our overall results of operations. A significant portion of our outstanding debt, including debt under the Credit Facilities, bears interest at variable rates. As a result, increases in interest rates would increase the cost of servicing our indebtedness and could materially reduce our profitability and cash flows. As of December 31, 2017, each one percentage point change in interest rates would result in an approximate $10 million change in the annual interest expense on our Term Loan Facility after considering the impact of the effective interest rate swap. Assuming all revolving loans were fully drawn as of December 31, 2017, each one percentage point change in interest rates would result in an approximate $3 million change in annual interest expense on our Revolving Credit Facility. The impact of increases in interest rates could be more significant for us than it would be for some other companies because of our substantial indebtedness.
56
The following table summarizes information about our debt as of December 31, 2017 (after considering the impact of the effective interest rate swaps), including the principal cash payments and related weighted‑average interest rates by expected maturity dates based on applicable rates at December 31, 2017.
|
|
||||||||||||||||||||||||
|
|
Expected Year of Maturity |
Fair |
||||||||||||||||||||||
|
(In millions) |
2018 |
2019 |
2020 |
2021 |
2022 |
Thereafter |
Total |
Value |
||||||||||||||||
|
Debt: |
||||||||||||||||||||||||
|
Fixed rate |
$ |
100 |
$ |
9 |
$ |
8 |
$ |
1 |
$ |
— |
$ |
1,647 |
$ |
1,765 |
$ |
1,781 | ||||||||
|
Average interest rate |
6.7 |
% |
5.0 |
% |
5.0 |
% |
5.0 |
% |
5.0 |
% |
5.0 |
% |
5.1 |
% |
||||||||||
|
Variable rate |
$ |
44 |
$ |
55 |
$ |
37 |
$ |
29 |
$ |
20 |
$ |
902 |
$ |
1,087 |
$ |
1,090 | ||||||||
|
Average interest rate |
4.1 |
% |
3.8 |
% |
4.1 |
% |
4.1 |
% |
4.1 |
% |
4.1 |
% |
4.1 |
% |
||||||||||
|
Interest Rate Swaps: |
||||||||||||||||||||||||
|
Receive variable/pay fixed |
$ |
650 | ||||||||||||||||||||||
|
Average pay rate(1) |
|
|
|
|
|
|
|
|
|
|
|
|
|
|
|
|
|
1.5 |
% |
|
|
|
|
|
|
Average receive rate(1) |
|
|
|
|
|
|
|
|
|
|
|
|
|
|
|
|
|
1.1 |
% |
|
|
|
|
|
__________________________________
(1)Before the application of the applicable borrowing margin.
Fuel Price Risk
We are exposed to market risk for changes in fuel prices through the consumption of fuel by our vehicle fleet in the delivery of services to our customers. We expect to use approximately 13 million gallons of fuel in 2018. As of December 31, 2017, a 10 percent change in fuel prices would result in a change of approximately $3 million in our annual fuel cost before considering the impact of fuel swap contracts.
We use fuel swap contracts to mitigate the financial impact of fluctuations in fuel prices. As of December 31, 2017, we had fuel swap contracts to pay fixed prices for fuel with an aggregate notional amount of $30 million, maturing through 2019. The estimated fair value of these contracts as of December 31, 2017 was a net asset of $3 million. These fuel swap contracts provide a fixed price for approximately 78 percent and 19 percent of our estimated fuel usage for 2018 and 2019, respectively.
57
ITEM 8. FINANCIAL STATEMENTS AND SUPPLEMENTARY DATA
REPORT OF INDEPENDENT REGISTERED PUBLIC ACCOUNTING FIRM
To the Board of Directors and Stockholders of
ServiceMaster Global Holdings, Inc.
Memphis, Tennessee
Opinion on the Financial Statements
We have audited the accompanying consolidated statements of financial position of ServiceMaster Global Holdings, Inc. and subsidiaries (the “Company”) as of December 31, 2017 and 2016, and the related consolidated statements of operations and comprehensive income, shareholders’ equity and cash flows for each of the three years in the period ended December 31, 2017, and the related notes and the schedule listed in the Index at Item 15 (collectively referred to as the "financial statements"). In our opinion, the financial statements present fairly, in all material respects, the financial position of the Company as of December 31, 2017 and 2016, and the results of its operations and its cash flows for each of the three years in the period ended December 31, 2017, in conformity with accounting principles generally accepted in the United States of America.
We have also audited, in accordance with the standards of the Public Company Accounting Oversight Board (United States) (PCAOB), the Company's internal control over financial reporting as of December 31, 2017, based on criteria established in Internal Control — Integrated Framework (2013) issued by the Committee of Sponsoring Organizations of the Treadway Commission and our report dated February 28, 2018, expressed an unqualified opinion on the Company's internal control over financial reporting.
Basis for Opinion
These financial statements are the responsibility of the Company's management. Our responsibility is to express an opinion on the Company's financial statements based on our audits. We are a public accounting firm registered with the PCAOB and are required to be independent with respect to the Company in accordance with the U.S. federal securities laws and the applicable rules and regulations of the Securities and Exchange Commission and the PCAOB.
We conducted our audits in accordance with the standards of the PCAOB. Those standards require that we plan and perform the audit to obtain reasonable assurance about whether the financial statements are free of material misstatement, whether due to error or fraud. Our audits included performing procedures to assess the risks of material misstatement of the financial statements, whether due to error or fraud, and performing procedures that respond to those risks. Such procedures included examining, on a test basis, evidence regarding the amounts and disclosures in the financial statements. Our audits also included evaluating the accounting principles used and significant estimates made by management, as well as evaluating the overall presentation of the financial statements. We believe that our audits provide a reasonable basis for our opinion.
/s/ Deloitte & Touche LLP
Memphis, Tennessee
February 28, 2018
We have served as the Company's auditor since 2002.
58
Consolidated Statements of Operations and Comprehensive Income
(In millions, except per share data)
|
|
||||||||||
|
|
Year Ended December 31, |
|||||||||
|
|
2017 |
2016 |
2015 |
|||||||
|
Revenue |
$ |
2,912 |
$ |
2,746 |
$ |
2,594 | ||||
|
Cost of services rendered and products sold |
1,552 | 1,448 | 1,375 | |||||||
|
Selling and administrative expenses |
773 | 711 | 666 | |||||||
|
Amortization expense |
27 | 33 | 38 | |||||||
|
401(k) Plan corrective contribution |
(3) | 2 | 23 | |||||||
|
Fumigation related matters |
4 | 93 | 9 | |||||||
|
Insurance reserve adjustment |
— |
23 |
— |
|||||||
|
Impairment of software and other related costs |
2 | 1 |
— |
|||||||
|
Restructuring charges |
34 | 17 | 5 | |||||||
|
Gain on sale of Merry Maids branches |
— |
(2) | (7) | |||||||
|
Interest expense |
150 | 153 | 167 | |||||||
|
Interest and net investment income |
(4) | (6) | (9) | |||||||
|
Loss on extinguishment of debt |
6 | 32 | 58 | |||||||
|
Income from Continuing Operations before Income Taxes |
370 | 241 | 270 | |||||||
|
(Benefit) provision for income taxes |
(139) | 85 | 107 | |||||||
|
Equity in losses of joint venture |
— |
(1) |
— |
|||||||
|
Income from Continuing Operations |
509 | 155 | 162 | |||||||
|
Gain (loss) from discontinued operations, net of income taxes |
— |
(1) | (2) | |||||||
|
Net Income |
$ |
510 |
$ |
155 |
$ |
160 | ||||
|
Other Comprehensive Income (Loss), Net of Income Taxes: |
||||||||||
|
Net unrealized gains (losses) on securities |
1 | (2) | (3) | |||||||
|
Net unrealized gains (losses) on derivative instruments |
4 | 20 | (2) | |||||||
|
Foreign currency translation gain (loss) |
3 |
— |
(8) | |||||||
|
Other Comprehensive Income (Loss), Net of Income Taxes |
8 | 18 | (13) | |||||||
|
Total Comprehensive Income |
$ |
518 |
$ |
173 |
$ |
147 | ||||
|
Weighted-average common shares outstanding - Basic |
134.4 | 135.3 | 135.0 | |||||||
|
Weighted-average common shares outstanding - Diluted |
135.4 | 137.3 | 136.6 | |||||||
|
Basic Earnings Per Share: |
||||||||||
|
Income from Continuing Operations |
$ |
3.79 |
$ |
1.15 |
$ |
1.20 | ||||
|
Gain (loss) from discontinued operations, net of income taxes |
— |
— |
(0.01) | |||||||
|
Net Income |
3.79 | 1.14 | 1.19 | |||||||
|
Diluted Earnings Per Share: |
||||||||||
|
Income from Continuing Operations |
$ |
3.76 |
$ |
1.13 |
$ |
1.19 | ||||
|
Gain (loss) from discontinued operations, net of income taxes |
— |
— |
(0.01) | |||||||
|
Net Income |
3.76 | 1.13 |
1.17 |
|||||||
See accompanying Notes to the Consolidated Financial Statements.
59
Consolidated Statements of Financial Position
(In millions, except share data)
|
|
|
|
|
|
|
|
|
|
|
|
|
|
|
|
|
|
|
As of |
|
As of |
||
|
|
|
December 31, |
|
December 31, |
||
|
|
|
2017 |
|
2016 |
||
|
Assets: |
|
|
|
|
|
|
|
Current Assets: |
|
|
|
|
|
|
|
Cash and cash equivalents |
|
$ |
475 |
|
$ |
291 |
|
Marketable securities |
|
|
25 |
|
|
25 |
|
Receivables, less allowances of $23 and $22, respectively |
|
|
570 |
|
|
536 |
|
Inventories |
|
|
41 |
|
|
43 |
|
Prepaid expenses and other assets |
|
|
94 |
|
|
70 |
|
Deferred customer acquisition costs |
|
|
36 |
|
|
34 |
|
Total Current Assets |
|
|
1,242 |
|
|
998 |
|
Other Assets: |
|
|
|
|
|
|
|
Property and equipment, net |
|
|
237 |
|
|
210 |
|
Goodwill |
|
|
2,256 |
|
|
2,247 |
|
Intangible assets, primarily trade names, service marks and trademarks, net |
|
|
1,692 |
|
|
1,708 |
|
Restricted cash |
|
|
89 |
|
|
95 |
|
Notes receivable |
|
|
41 |
|
|
37 |
|
Long-term marketable securities |
|
|
22 |
|
|
19 |
|
Other assets |
|
|
68 |
|
|
71 |
|
Total Assets |
|
$ |
5,646 |
|
$ |
5,386 |
|
Liabilities and Shareholders' Equity: |
|
|
|
|
|
|
|
Current Liabilities: |
|
|
|
|
|
|
|
Accounts payable |
|
$ |
115 |
|
$ |
112 |
|
Accrued liabilities: |
|
|
|
|
|
|
|
Payroll and related expenses |
|
|
63 |
|
|
54 |
|
Self-insured claims and related expenses |
|
|
117 |
|
|
111 |
|
Accrued interest payable |
|
|
15 |
|
|
16 |
|
Other |
|
|
56 |
|
|
60 |
|
Deferred revenue |
|
|
663 |
|
|
629 |
|
Current portion of long-term debt |
|
|
144 |
|
|
59 |
|
Total Current Liabilities |
|
|
1,174 |
|
|
1,042 |
|
Long-Term Debt |
|
|
2,643 |
|
|
2,772 |
|
Other Long-Term Liabilities: |
|
|
|
|
|
|
|
Deferred taxes |
|
|
493 |
|
|
719 |
|
Other long-term obligations, primarily self-insured claims |
|
|
169 |
|
|
167 |
|
Total Other Long-Term Liabilities |
|
|
662 |
|
|
886 |
|
Commitments and Contingencies (Note 9) |
|
|
|
|
|
|
|
Shareholders’ Equity: |
|
|
|
|
|
|
|
Common stock $0.01 par value (authorized 2,000,000,000 shares with 146,662,232 shares issued and 135,141,048 outstanding at December 31, 2017 and 144,339,338 shares issued and 135,030,283 outstanding at December 31, 2016) |
|
|
2 |
|
|
2 |
|
Additional paid-in capital |
|
|
2,321 |
|
|
2,274 |
|
Accumulated deficit |
|
|
(895) |
|
|
(1,405) |
|
Accumulated other comprehensive loss |
|
|
5 |
|
|
(3) |
|
Less common stock held in treasury, at cost (11,521,184 shares at December 31, 2017 and 9,309,055 shares at December 31, 2016) |
|
|
(267) |
|
|
(182) |
|
Total Shareholders' Equity |
|
|
1,167 |
|
|
686 |
|
Total Liabilities and Shareholders' Equity |
|
$ |
5,646 |
|
$ |
5,386 |
See accompanying Notes to the Consolidated Financial Statements.
60
Consolidated Statements of Shareholders’ Equity
(In millions)
|
|
||||||||||||||||||||||||
|
|
||||||||||||||||||||||||
|
|
Accumulated |
|||||||||||||||||||||||
|
|
Other |
|||||||||||||||||||||||
|
|
Additional |
Comprehensive |
||||||||||||||||||||||
|
|
Common |
Paid-in |
Accumulated |
Income |
Treasury |
Total |
||||||||||||||||||
|
|
Shares |
Stock |
Capital |
Deficit |
(Loss) |
Shares |
Amount |
Equity |
||||||||||||||||
|
Balance December 31, 2014 |
142 |
$ |
2 |
$ |
2,207 |
$ |
(1,720) |
$ |
(8) | (8) |
$ |
(122) |
$ |
359 | ||||||||||
|
Net income |
— |
— |
— |
160 |
— |
— |
— |
160 | ||||||||||||||||
|
Other comprehensive loss, net of tax |
— |
— |
— |
— |
(13) |
— |
— |
(13) | ||||||||||||||||
|
Total comprehensive loss |
— |
— |
— |
160 | (13) |
— |
— |
147 | ||||||||||||||||
|
Issuance of common stock |
— |
— |
1 |
— |
— |
— |
— |
1 | ||||||||||||||||
|
Exercise of stock options |
1 |
— |
15 |
— |
— |
— |
— |
15 | ||||||||||||||||
|
DSUs converted into common stock |
— |
— |
(1) |
— |
— |
— |
1 |
— |
||||||||||||||||
|
Repurchase of common stock |
— |
— |
— |
— |
— |
— |
(1) | (1) | ||||||||||||||||
|
Stock-based employee compensation |
— |
— |
10 |
— |
— |
— |
— |
10 | ||||||||||||||||
|
Excess tax benefits from stock-based compensation |
— |
— |
13 |
— |
— |
— |
— |
13 | ||||||||||||||||
|
Balance December 31, 2015 |
143 |
$ |
2 |
$ |
2,245 |
$ |
(1,560) |
$ |
(21) | (8) |
$ |
(122) |
$ |
545 | ||||||||||
|
Net income |
— |
— |
— |
155 |
— |
— |
— |
155 | ||||||||||||||||
|
Other comprehensive income, net of tax |
— |
— |
— |
— |
18 |
— |
— |
18 | ||||||||||||||||
|
Total comprehensive income |
— |
— |
— |
155 | 18 |
— |
— |
173 | ||||||||||||||||
|
Issuance of common stock |
— |
— |
2 |
— |
— |
— |
— |
2 | ||||||||||||||||
|
Exercise of stock options |
1 |
— |
10 |
— |
— |
— |
— |
10 | ||||||||||||||||
|
Repurchase of common stock |
— |
— |
— |
— |
— |
(2) | (60) | (60) | ||||||||||||||||
|
Stock-based employee compensation |
— |
— |
16 |
— |
— |
— |
— |
16 | ||||||||||||||||
|
Balance December 31, 2016 |
144 |
$ |
2 |
$ |
2,274 |
$ |
(1,405) |
$ |
(3) | (9) |
$ |
(182) |
$ |
686 | ||||||||||
|
Net income |
— |
— |
— |
510 |
— |
— |
— |
510 | ||||||||||||||||
|
Other comprehensive income, net of tax |
— |
— |
— |
— |
8 |
— |
— |
8 | ||||||||||||||||
|
Total comprehensive income |
— |
— |
— |
510 | 8 |
— |
— |
518 | ||||||||||||||||
|
Issuance of common stock |
— |
— |
2 |
— |
— |
— |
— |
2 | ||||||||||||||||
|
Exercise of stock options |
2 |
— |
28 |
— |
— |
— |
— |
28 | ||||||||||||||||
|
Repurchase of common stock |
— |
— |
— |
— |
— |
(2) | (85) | (85) | ||||||||||||||||
|
Stock-based employee compensation |
— |
— |
18 |
— |
— |
— |
— |
18 | ||||||||||||||||
|
Balance December 31, 2017 |
147 |
$ |
2 |
$ |
2,321 |
$ |
(895) |
$ |
5 | (12) |
$ |
(267) |
$ |
1,167 | ||||||||||
|
|
||||||||||||||||||||||||
See accompanying Notes to the Consolidated Financial Statements
61
Consolidated Statements of Cash Flows
(In millions)
|
|
||||||||
|
|
Year Ended December 31, |
|||||||
|
|
2017 |
2016 |
2015 |
|||||
|
Cash and Cash Equivalents and Restricted Cash at Beginning of Period |
$ |
386 |
$ |
296 |
$ |
389 | ||
|
Cash Flows from Operating Activities from Continuing Operations: |
||||||||
|
Net Income |
510 | 155 | 160 | |||||
|
Adjustments to reconcile net income to net cash provided from operating activities: |
||||||||
|
(Gain) loss from discontinued operations, net of income taxes |
— |
1 | 2 | |||||
|
Equity in losses of joint venture |
— |
1 |
— |
|||||
|
Depreciation expense |
76 | 61 | 47 | |||||
|
Amortization expense |
27 | 33 | 38 | |||||
|
Amortization of debt issuance costs |
5 | 5 | 5 | |||||
|
401(k) Plan corrective contribution |
(3) | 2 | 23 | |||||
|
Fumigation related matters |
4 | 93 | 9 | |||||
|
Payments on fumigation related matters |
(12) | (90) | (1) | |||||
|
Insurance reserve adjustment |
— |
23 |
— |
|||||
|
Impairment of software and other related costs |
2 | 1 |
— |
|||||
|
Gain on sale of Merry Maids branches |
— |
(2) | (7) | |||||
|
Loss on extinguishment of debt |
6 | 32 | 58 | |||||
|
Deferred income tax provision |
(226) | 22 | 60 | |||||
|
Stock-based compensation expense |
12 | 13 | 10 | |||||
|
Gain on sale of marketable securities |
— |
(3) | (6) | |||||
|
Restructuring charges |
34 | 17 | 5 | |||||
|
Cash payments related to restructuring charges |
(19) | (10) | (7) | |||||
|
Other |
9 | (3) | 8 | |||||
|
Change in working capital, net of acquisitions: |
||||||||
|
Receivables |
(35) | (40) | (44) | |||||
|
Inventories and other current assets |
4 | (6) | 5 | |||||
|
Accounts payable |
(1) | 7 | 18 | |||||
|
Deferred revenue |
33 | 44 | 38 | |||||
|
Accrued liabilities |
13 | (28) | 1 | |||||
|
Accrued interest payable |
(1) | 6 | (24) | |||||
|
Current income taxes |
(23) | (8) | 2 | |||||
|
Net Cash Provided from Operating Activities from Continuing Operations |
413 | 325 | 398 | |||||
|
Cash Flows from Investing Activities from Continuing Operations: |
||||||||
|
Property additions |
(77) | (56) | (40) | |||||
|
Government grant fundings for property additions |
2 |
— |
— |
|||||
|
Sale of equipment and other assets |
4 | 8 | 14 | |||||
|
Other business acquisitions, net of cash acquired |
(13) | (121) | (92) | |||||
|
Purchases of available-for-sale securities |
(46) | (6) | (6) | |||||
|
Sales and maturities of available-for-sale securities |
48 | 49 | 32 | |||||
|
Origination of notes receivable |
(102) | (100) | (98) | |||||
|
Collections on notes receivable |
100 | 97 | 92 | |||||
|
Other investments |
(1) | (3) |
— |
|||||
|
Net Cash Used for Investing Activities from Continuing Operations |
(85) | (133) | (98) | |||||
|
Cash Flows from Financing Activities from Continuing Operations: |
||||||||
|
Borrowings of debt |
— |
2,400 | 583 | |||||
|
Payments of debt |
(97) | (2,417) | (923) | |||||
|
Discount paid on issuance of debt |
— |
(4) | (2) | |||||
|
Debt issuance costs paid |
— |
(34) | (5) | |||||
|
Call premium paid on retirement of debt |
(1) |
— |
(49) | |||||
|
Repurchase of common stock and RSU vesting |
(85) | (60) |
— |
|||||
|
Issuance of common stock |
30 | 13 | 16 | |||||
|
Net Cash Used for Financing Activities from Continuing Operations |
(152) | (102) | (381) | |||||
|
Cash Flows from Discontinued Operations: |
||||||||
|
Cash used for operating activities |
— |
— |
(11) | |||||
|
Net Cash Used for Discontinued Operations |
— |
— |
(11) | |||||
|
Effect of Exchange Rate Changes on Cash |
1 |
— |
(2) | |||||
|
Cash Increase (Decrease) During the Period |
177 | 89 | (92) | |||||
|
Cash and Cash Equivalents and Restricted Cash at End of Period |
$ |
563 |
$ |
386 |
$ |
296 | ||
See accompanying Notes to the Consolidated Financial Statements.
62
SERVICEMASTER GLOBAL HOLDINGS, INC.
NOTES TO CONSOLIDATED FINANCIAL STATEMENTS
Note 1. Basis of Presentation
ServiceMaster is a leading provider of essential residential and commercial services. The Company’s services include termite and pest control, home service plans, disaster restoration, janitorial, residential cleaning, cabinet and wood furniture repair and home inspection. The Company provides these services through an extensive service network of company-owned, franchised and licensed locations operating primarily under the following leading brands: Terminix, American Home Shield, ServiceMaster Restore, ServiceMaster Clean, Merry Maids, Furniture Medic and AmeriSpec. All consolidated Company subsidiaries are wholly-owned. Intercompany transactions and balances have been eliminated.
During 2015, through secondary public offerings of the Company’s common stock, the selling stockholders completed the offering of an additional 80,711,763 shares of common stock.
American Home Shield Spin-off
On July 26, 2017, the Company announced that it intends to separate its American Home Shield business from the Company’s Terminix and Franchise Services Group businesses by means of a spin-off of the American Home Shield business to Company stockholders, resulting in two publicly traded companies. The spin-off would create two independent companies, each with an enhanced strategic focus, simplified operating structure, distinct investment identity and strong financial profile. The transaction is expected to be completed in the third quarter of 2018, subject to satisfaction of customary conditions, including the effectiveness of a Registration Statement on Form 10 filed with the SEC in January 2018, receipt of a favorable ruling from the IRS concerning certain tax matters and final approval by the Company’s board of directors, and it is intended to qualify as a tax-free distribution to the Company’s stockholders for U.S. federal income tax purposes.
Note 2. Significant Accounting Policies
Consolidation
The consolidated financial statements of the Company include all of its wholly-owned subsidiaries. All intercompany transactions and balances have been eliminated in consolidation.
Use of Estimates
The preparation of the consolidated financial statements requires management to make certain estimates and assumptions required under GAAP which may differ from actual results. The more significant areas requiring the use of management estimates relate to revenue recognition; the allowance for uncollectible receivables; accruals for self-insured retention limits related to medical, workers’ compensation, auto and general liability insurance claims; accruals for home warranties and termite damage claims; the possible outcome of outstanding litigation; accruals for income tax liabilities as well as deferred tax accounts; the deferral and amortization of customer acquisition costs; share based compensation; useful lives for depreciation and amortization expense; the valuation of marketable securities; and the valuation of tangible and intangible assets. In 2017, there were no changes in the significant areas that require estimates or in the underlying methodologies used in determining the amounts of these associated estimates.
The allowance for receivables is developed based on several factors including overall customer credit quality, historical write-off experience and specific account analyses that project the ultimate collectability of the outstanding balances. As such, these factors may change over time causing the allowance level to vary.
The Company carries insurance policies on insurable risks at levels which it believes to be appropriate, including workers’ compensation, auto and general liability risks. The Company purchases insurance policies from third-party insurance carriers, which typically incorporate significant deductibles or self-insured retentions. The Company is responsible for all claims that fall below the retention limits. In determining the Company’s accrual for self-insured claims, the Company uses historical claims experience to establish both the current year accrual and the underlying provision for future losses. This actuarially determined provision and related accrual include known claims, as well as incurred but not reported claims. The Company adjusts its estimate of accrued self-insured claims when required to reflect changes based on factors such as changes in health care costs, accident frequency and claim severity.
The Company seeks to reduce the potential amount of loss arising from self-insured claims by insuring certain levels of risk. While insurance agreements are designed to limit the Company’s losses from large exposure and permit recovery of a portion of direct unpaid losses, insurance does not relieve the Company of its ultimate liability. Accordingly, the accruals for insured claims represent the Company’s total unpaid gross losses. Insurance recoverables, which are reported within Prepaid expenses and other assets and Other assets, relate to estimated insurance recoveries on the insured claims reserves.
Accruals for home service plan claims in the American Home Shield business are made based on the Company’s claims experience and actuarial projections. Termite damage claim accruals in the Terminix business are recorded based on both the historical rates of claims incurred within a contract year and the cost per claim. Current activity could differ causing a change in estimates. The Company has certain liabilities with respect to existing or potential claims, lawsuits, and other proceedings. The
63
Company accrues for these liabilities when it is probable that future costs will be incurred and such costs can be reasonably estimated. Any resulting adjustments, which could be material, are recorded in the period the adjustments are identified.
The Company records deferred income tax balances based on the net tax effects of temporary differences between the carrying value of assets and liabilities for financial reporting purposes and income tax purposes. The Company records its deferred tax items based on the estimated value of the tax basis. The Company adjusts tax estimates when required to reflect changes based on factors such as changes in tax laws, relevant court decisions, results of tax authority reviews and statutes of limitations. The Company records a liability for unrecognized tax benefits resulting from uncertain tax positions taken or expected to be taken in a tax return. The Company recognizes potential interest and penalties related to its uncertain tax positions in income tax expense.
Revenue
Revenues from pest control services, as well as liquid and fumigation termite applications, are recognized as the services are provided. The Company eradicates termites through the use of non-baiting methods (e.g., fumigation or liquid treatments) and baiting systems. Termite services using baiting systems and termite inspection and protection contracts are frequently sold through annual contracts. Service costs for these contracts are expensed as incurred. The Company recognizes revenue over the life of these contracts in proportion to the expected direct costs. Those costs bear a direct relationship to the fulfillment of the Company’s obligations under the contracts and are representative of the relative value provided to the customer (proportional performance method). The Company regularly reviews its estimates of direct costs for its termite bait contracts and termite inspection and protection contracts and adjusts the estimates when appropriate.
Home service plan contracts are typically one year in duration. Home service plan claims costs are expensed as incurred. The Company recognizes revenue over the life of these contracts in proportion to the expected direct costs. Those costs bear a direct relationship to the fulfillment of the Company’s obligations under the contracts and are representative of the relative value provided to the customer (proportional performance method). The Company regularly reviews its estimates of claims costs and adjusts the estimates when appropriate.
The Company has franchise agreements in its Terminix, ServiceMaster Restore, ServiceMaster Clean, Merry Maids, Furniture Medic and AmeriSpec businesses. Franchise revenue (which in the aggregate represents approximately five percent of annual consolidated revenue from continuing operations) consists principally of continuing monthly fees based upon the franchisee’s customer-level revenue. Monthly fee revenue is recognized when the related customer-level revenue generating activity is performed by the franchisee and collectability is reasonably assured. Franchise revenue also includes initial fees resulting from the sale of a franchise or a license. These initial franchise or license fees are pre-established fixed amounts and are recognized as revenue when collectability is reasonably assured and all material services or conditions relating to the sale have been substantially performed. Total profits from the franchised operations were $87 million, $83 million, and $75 million for the years ended December 31, 2017, 2016 and 2015, respectively. The portion of total franchise fee income related to initial fees received from the sale of franchises was immaterial to the Company’s consolidated financial statements for all periods.
Revenues are presented net of sales taxes collected and remitted to government taxing authorities on the consolidated statements of operations and comprehensive income.
When a customer elects to pay for their home service plan contract on a monthly basis, accounts receivable and deferred revenue are recorded based on the total amount due from the customer. The accounts receivable balance is reduced as amounts are paid, and the deferred revenue is amortized over the life of the contract in proportion to the expected direct costs. Payments received for home service plan contracts are deferred and recognized in revenue over the life of the contract in proportion to the expected direct costs. The Company had $663 million and $629 million of deferred revenue as of December 31, 2017 and 2016, respectively. Deferred revenue consists primarily of payments received for annual contracts relating to home warranties, termite baiting, termite inspection and pest control services.
Deferred Customer Acquisition Costs
Customer acquisition costs, which are incremental and direct costs of obtaining a customer, are deferred and amortized over the life of the related contract in proportion to revenue recognized. These costs include sales commissions and direct selling costs which can be shown to have resulted in a successful sale. Deferred customer acquisition costs amounted to $36 million and $34 million as of December 31, 2017 and 2016, respectively.
Advertising
On an interim basis, certain advertising costs are deferred and recognized approximately in proportion to the revenue over the year and are not deferred beyond the calendar year-end. Certain other advertising costs are expensed when the advertising occurs. The cost of direct-response advertising at Terminix, consisting primarily of direct-mail and digital promotions, is capitalized and amortized over its expected period of future benefits. Deferred advertising costs are included in Prepaid expenses and other assets on the consolidated statements of financial position. Advertising expense for the years ended December 31, 2017, 2016 and 2015 was $122 million, $110 million and $113 million, respectively.
64
Inventory
Inventories are recorded at the lower of cost (primarily on a weighted-average cost basis) or market. The Company’s inventory primarily consists of finished goods to be used on the customers’ premises or sold to franchisees.
Property and Equipment, Intangible Assets and Goodwill
Property and equipment consist of the following:
|
|
||||||||
|
|
Estimated |
|||||||
|
|
As of December 31, |
Useful Lives |
||||||
|
(In millions) |
2017 |
2016 |
(Years) |
|||||
|
Land |
$ |
5 |
$ |
6 |
N/A |
|||
|
Buildings and improvements |
63 | 38 |
10 - 40 |
|||||
|
Technology and communications |
255 | 230 |
3 - 7 |
|||||
|
Machinery, production equipment and vehicles |
222 | 202 |
3 - 9 |
|||||
|
Office equipment, furniture and fixtures |
19 | 20 |
5 - 7 |
|||||
|
|
564 | 496 | ||||||
|
Less accumulated depreciation |
(327) | (286) | ||||||
|
Net property and equipment |
$ |
237 |
$ |
210 | ||||
Depreciation of property and equipment, including depreciation of assets held under capital leases was $76 million, $61 million and $47 million for the years ended December 31, 2017, 2016 and 2015, respectively.
The Company recorded impairment charges of $2 million and $1 million in the years ended December 31, 2017 and 2016, respectively, relating to its decisions to replace certain software.
As of December 31, 2017 and 2016, goodwill was $2,256 million and $2,247 million, respectively, and intangible assets consisted primarily of indefinite-lived trade names in the amount of $1,608 million and other amortizing intangible assets in the amount of $84 million and $100 million, respectively.
Fixed assets and intangible assets with finite lives are depreciated and amortized on a straight-line basis over their estimated useful lives. These lives are based on the Company’s previous experience for similar assets, potential market obsolescence and other industry and business data. As required by accounting standards for the impairment or disposal of long-lived assets, the Company’s fixed assets and finite-lived intangible assets are tested for recoverability whenever events or changes in circumstances indicate their carrying amounts may not be recoverable. If the carrying value is no longer recoverable based upon the undiscounted future cash flows of the asset, an impairment loss would be recognized equal to the difference between the carrying amount and the fair value of the asset. Changes in the estimated useful lives or in the asset values could cause the Company to adjust its book value or future expense accordingly.
As required under accounting standards for goodwill and other intangibles, goodwill is not subject to amortization, and intangible assets with indefinite useful lives are not amortized until their useful lives are determined to no longer be indefinite. Goodwill and intangible assets that are not subject to amortization are subject to assessment for impairment by applying a fair-value based test on an annual basis or more frequently if circumstances indicate a potential impairment.
Goodwill and indefinite-lived intangible assets, primarily the Company’s trade names, are assessed annually for impairment during the fourth quarter or earlier upon the occurrence of certain events or substantive changes in circumstances. The Company’s 2017, 2016, and 2015 annual impairment analyses, which were performed as of October 1 of each year, did not result in any goodwill or trade name impairments to continuing operations.
Restricted Cash
Restricted cash consists of cash held in trust as collateral under the Company’s automobile, general liability and workers’ compensation insurance program.
Restricted Net Assets
There are third-party restrictions on the ability of certain of the Company’s subsidiaries to transfer funds to the Company. These restrictions are related to regulatory requirements at American Home Shield and to a subsidiary borrowing arrangement at SMAC. The payment of ordinary and extraordinary dividends by the Company’s home service plan and similar subsidiaries (through which the Company conducts its American Home Shield business) are subject to significant regulatory restrictions under the laws and regulations of the states in which they operate. Among other things, such laws and regulations require certain such subsidiaries to maintain minimum capital and net worth requirements and may limit the amount of ordinary and extraordinary dividends and other payments that these subsidiaries can pay to the Company. As of December 31, 2017, the total net assets subject to these third-party restrictions was $192 million. None of the Company’s subsidiaries are obligated to make funds available to the Company through the payment of dividends.
65
Financial Instruments and Credit Risk
The Company has entered into specific financial arrangements in the normal course of business to manage certain market risks, with a policy of matching positions and limiting the terms of contracts to relatively short durations. The effect of derivative financial instrument transactions could have a material impact on the Company’s financial statements. The Company does not hold or issue derivative financial instruments for trading or speculative purposes. The Company has historically hedged a significant portion of its annual fuel consumption. The Company has also historically hedged the interest payments on a portion of its variable rate debt through the use of interest rate swap agreements. All of the Company’s fuel swap contracts and interest rate swap contracts are classified as cash flow hedges, and, as such, the hedging instruments are recorded on the consolidated statements of financial position as either an asset or liability at fair value, with the effective portion of changes in the fair value attributable to the hedged risks recorded in accumulated other comprehensive income.
Financial instruments, which potentially subject the Company to financial and credit risk, consist principally of investments and receivables. Investments consist primarily of publicly traded debt, certificates of deposit and common equity securities. The Company periodically reviews its portfolio of investments to determine whether there has been an other than temporary decline in the value of the investments from factors such as deterioration in the financial condition of the issuer or the market(s) in which the issuer competes. The majority of the Company’s receivables and notes receivable have little concentration of credit risk due to the large number of customers with relatively small balances and their dispersion across geographical areas. The Company maintains an allowance for losses based upon the expected collectability of receivables. See Note 17 to the consolidated financial statements for information relating to the fair value of financial instruments.
Stock-Based Compensation
Stock-based compensation expense for stock options is estimated at the grant date based on an award’s fair value as calculated by the Black-Scholes option-pricing model and is recognized as expense over the requisite service period. The Black-Scholes model requires various highly judgmental assumptions including expected volatility and option life. If any of the assumptions used in the Black-Scholes model change significantly, stock-based compensation expense for future grants may differ materially from that recorded in the current period related to options granted to date. In addition, the Company estimates the expected forfeiture rate and only recognizes expense for those shares expected to vest. The Company estimates the forfeiture rate based on historical experience. To the extent the actual forfeiture rate is different from the estimate, stock-based compensation expense is adjusted accordingly. See Note 16 to the consolidated financial statements for more details.
Income Taxes
The Company and its subsidiaries file consolidated U.S. federal income tax returns. State and local returns are filed both on a separate company basis and on a combined unitary basis with the Company. Current and deferred income taxes are provided for on a separate company basis. The Company accounts for income taxes using an asset and liability approach for the expected future tax consequences of events that have been recognized in the Company’s financial statements or tax returns. Deferred income taxes are provided to reflect the differences between the tax bases of assets and liabilities and their reported amounts in the financial statements. Valuation allowances are established when necessary to reduce deferred income tax assets to the amounts expected to be realized. The Company records a liability for unrecognized tax benefits resulting from uncertain tax positions taken or expected to be taken in its tax return. The Company recognizes potential interest and penalties related to its uncertain tax positions in income tax expense.
Earnings Per Share
Basic earnings per share is computed by dividing net income by the weighted-average number of shares of common stock outstanding. Diluted earnings per share is computed by dividing net income by the weighted-average number of shares of common stock outstanding during the period, increased to include the number of shares of common stock that would have been outstanding had potential dilutive shares of common stock been issued. The dilutive effect of stock options, restricted stock units (“RSUs”) and performance shares are reflected in diluted earnings per share by applying the treasury stock method. See Note 18 to the consolidated financial statements for more details.
Newly Issued Accounting Standards
In May 2014, the Financial Accounting Standards Board (“FASB”) issued Accounting Standards Update (“ASU”) 2014-09, “Revenue from Contracts with Customers,” to provide a single comprehensive model for entities to use in accounting for revenue arising from contracts with customers. This model supersedes most current revenue recognition guidance, including industry-specific guidance. The core principle of the revenue model is that “an entity should recognize revenue to depict the transfer of promised goods or services to customers in an amount that reflects the consideration to which the entity expects to be entitled in exchange for those goods or services.” Entities have the option of using either a full retrospective or modified approach to adopt the guidance. The Company will adopt the new revenue guidance effective January 1, 2018 using the modified retrospective transition method.
The Company has completed its evaluation of the impact of ASU 2014-09. The most significant impact relates to the reclassification of approximately $390 million of accounts receivable to contract assets that will be presented net of approximately $390 million of contract liabilities currently recorded as deferred revenue. Currently, when a customer elects to pay for their home service plan contract on a monthly basis, accounts receivable and deferred revenue are recorded based on the total amount due from the customer. The accounts receivable balance is reduced as amounts are paid, and the deferred revenue is amortized over the life of
66
the contract. Under the new revenue guidance, only the portion of the contract that is due in the current month will be recorded within accounts receivable.
The adoption will not have a significant impact on revenue or net income. The amount of customer acquisition costs deferred and the amortization period for such costs will increase under ASU 2014-09, resulting in an increase in deferred customer acquisition costs recognized. Costs of obtaining a contract that would have been incurred regardless of whether the contract was obtained, such as direct mail and digital advertising, will be expensed as incurred. Initial fees from sales of franchises and licenses, currently recognized in the year of the sale, will now be recognized over the term of the franchise agreement. In addition, advertising expense, currently recorded net of contributions from franchisees to the Company’s advertising programs, will now be recognized with offsetting increases to both revenue and expense such that there will not be a significant, if any, impact on net income. We expect the adjustment to our opening balance of accumulated deficit to be approximately $20 million, net of tax, upon adoption. As necessary, we have implemented changes to our business processes, systems and controls to support recognition and disclosure of this ASU upon adoption on January 1, 2018.
In January 2016, the FASB issued ASU 2016-01, “Recognition and Measurement of Financial Assets and Financial Liabilities,” to change how entities measure certain equity investments, to require the disclosure of changes in the fair value of financial liabilities measured under the fair value option that are attributable to a company’s own credit, and to change certain other disclosure requirements. The changes in ASU 2016-01 specifically require that the changes in fair value of all investments in equity securities be recognized in net income. The Company is impacted as unrealized gains or losses on the Company’s available-for-sale securities are currently recognized in other comprehensive income. The amendments in ASU 2016-01 are effective for fiscal years, and interim periods within those years, beginning after December 15, 2017, and will be adopted prospectively.
In February 2016, the FASB issued ASU 2016-02, “Leases (Topic 842),” which is the final standard on accounting for leases. While both lessees and lessors are affected by the new guidance, the effects on lessees are much more significant. The most significant change for lessees is the requirement under the new guidance to recognize right-of-use assets and lease liabilities for all leases not considered short-term leases. Entities are required to use a modified retrospective approach to adopt the guidance. The amendments in ASU 2016-02 are effective for fiscal years, and interim periods within those years, beginning after December 15, 2018. Early adoption is permitted. The Company is currently evaluating the impact of the adoption of ASU 2016-02 on the Company’s consolidated financial statements and currently expects that most of the operating lease commitments will be subject to the new standard and recognized as operating lease liabilities and right-of-use assets upon adoption of ASU 2016-02, which will increase the amount of total assets and total liabilities that is reported relative to such amounts prior to adoption.
In August 2017, the FASB issued ASU 2017-12, “Derivatives and Hedging (Topic 815): Targeted Improvements to Accounting for Hedging Activities.” The ASU simplifies certain aspects of hedge accounting and improves disclosures of hedging arrangements through the elimination of the requirement to separately measure and report hedge ineffectiveness. The ASU generally requires the entire change in the fair value of a hedging instrument to be presented in the same income statement line as the hedged item in order to align financial reporting of hedge relationships with economic results. Entities must apply the amendments to cash flow and net investment hedge relationships that exist on the date of adoption using a modified retrospective approach. The presentation and disclosure requirements must be applied prospectively. It is effective for fiscal years, and interim periods within those years, beginning after December 15, 2018. Early adoption is permitted. The Company is currently evaluating the effect that this guidance will have on its consolidated financial statements.
In February 2018, the FASB issued ASU 2018-02, “Income Statement – Reporting Comprehensive Income (Topic 220): Reclassification of Certain Tax Effects from Accumulated Other Comprehensive Income,” allowing a reclassification from Accumulated Other Comprehensive Income (“AOCI”) to Retained Earnings for stranded tax effects resulting from the corporate income tax rate change in U.S. Tax Reform. It is effective for fiscal years, and interim periods within those years, beginning after December 15, 2018. Early adoption is permitted. The Company currently expects to early adopt this guidance in the first quarter of 2018, and will reclassify approximately $4 million of unrealized losses from AOCI to Retained Earnings.
Note 3. Business Segment Reporting
The business of the Company is conducted through three reportable segments: Terminix, American Home Shield and Franchise Services Group.
In accordance with accounting standards for segments, the Company’s reportable segments are strategic business units that offer different services. The Terminix segment provides termite and pest control services to residential and commercial customers and distributes pest control products. The American Home Shield segment provides home service plans for household systems and appliances. The Franchise Services Group segment provides residential and commercial disaster restoration, janitorial and cleaning services through franchises primarily under the ServiceMaster, ServiceMaster Restore and ServiceMaster Clean brand names, home cleaning services through franchises primarily under the Merry Maids brand name, cabinet and wood furniture repair primarily under the Furniture Medic brand name and home inspection services primarily under the AmeriSpec brand name. Corporate includes SMAC, the Company’s financing subsidiary exclusively dedicated to providing financing to its franchisees and retail customers of its operating units, and the Company’s corporate operations (substantially all of which costs are allocated to the Company’s reportable segments), which provide various technology, marketing, finance, legal and other support services to the reportable segments. The
67
composition of the Company’s reportable segments is consistent with that used by the Company’s chief operating decision maker (the “CODM”) to evaluate performance and allocate resources.
Information regarding the accounting policies used by the Company is described in Note 2 to the consolidated financial statements. The Company derives substantially all of its revenue from customers and franchisees in the United States with approximately two percent generated in foreign markets. Operating expenses of the business units consist primarily of direct costs and indirect costs allocated from Corporate. Identifiable assets are those used in carrying out the operations of the business unit and include intangible assets directly related to its operations.
The Company uses Reportable Segment Adjusted EBITDA as its measure of segment profitability. Accordingly, the CODM evaluates performance and allocates resources based primarily on Reportable Segment Adjusted EBITDA. Reportable Segment Adjusted EBITDA is defined as net income before: unallocated corporate expenses; (gain) loss from discontinued operations, net of income taxes; (benefit) provision for income taxes; loss on extinguishment of debt; interest expense; depreciation and amortization expense; 401(k) Plan corrective contribution; fumigation related matters; insurance reserve adjustment; non-cash stock-based compensation expense; restructuring charges; gain on sale of Merry Maids branches; non-cash impairment of software and other related costs; and other non-operating expenses. The Company’s definition of Reportable Segment Adjusted EBITDA may not be calculated or comparable to similarly titled measures of other companies. The Company believes Reportable Segment Adjusted EBITDA is useful for investors, analysts and other interested parties as it facilitates company-to-company operating performance comparisons by excluding potential differences caused by variations in capital structures, taxation, the age and book depreciation of facilities and equipment, restructuring initiatives, consulting agreements and equity-based, long-term incentive plans.
During 2017, 2016 and 2015, no single customer exceeded 10 percent of global sales.
68
Information for continuing operations for each reportable segment and Corporate is presented below:
|
|
|||||||||
|
|
Year Ended December 31, |
||||||||
|
(In millions) |
2017 |
2016 |
2015 |
||||||
|
Revenue: |
|||||||||
|
Terminix |
$ |
1,541 |
$ |
1,524 |
$ |
1,444 | |||
|
American Home Shield |
1,157 | 1,020 | 917 | ||||||
|
Franchise Services Group |
212 | 200 | 232 | ||||||
|
Reportable Segment Revenue |
$ |
2,910 |
$ |
2,744 |
$ |
2,592 | |||
|
Corporate |
2 | 2 | 2 | ||||||
|
Total Revenue |
$ |
2,912 |
$ |
2,746 |
$ |
2,594 | |||
|
|
|||||||||
|
Reportable Segment Adjusted EBITDA:(1) |
|||||||||
|
Terminix |
$ |
330 |
$ |
371 |
$ |
347 | |||
|
American Home Shield |
260 | 220 | 205 | ||||||
|
Franchise Services Group |
87 | 79 | 77 | ||||||
|
Reportable Segment Adjusted EBITDA |
$ |
677 |
$ |
670 |
$ |
630 | |||
|
|
|||||||||
|
Identifiable Assets: |
|||||||||
|
Terminix |
$ |
2,821 |
$ |
2,820 |
$ |
2,764 | |||
|
American Home Shield |
1,441 | 1,312 | 1,137 | ||||||
|
Franchise Services Group |
489 | 480 | 492 | ||||||
|
Reportable Segment Identifiable Assets |
$ |
4,751 |
$ |
4,612 |
$ |
4,394 | |||
|
Corporate |
895 | 774 | 705 | ||||||
|
Total Identifiable Assets |
$ |
5,646 |
$ |
5,386 |
$ |
5,098 | |||
|
|
|||||||||
|
Depreciation & Amortization Expense: |
|||||||||
|
Terminix |
$ |
58 |
$ |
58 |
$ |
59 | |||
|
American Home Shield |
17 | 13 | 9 | ||||||
|
Franchise Services Group |
7 | 7 | 8 | ||||||
|
Reportable Segment Depreciation & Amortization Expense |
$ |
82 |
$ |
78 |
$ |
75 | |||
|
Corporate |
21 | 16 | 9 | ||||||
|
Total Depreciation & Amortization Expense(2) |
$ |
103 |
$ |
94 |
$ |
84 | |||
|
|
|||||||||
|
Capital Expenditures: |
|||||||||
|
Terminix |
$ |
12 |
$ |
11 |
$ |
9 | |||
|
American Home Shield |
9 | 10 | 7 | ||||||
|
Franchise Services Group |
2 | 2 | 3 | ||||||
|
Reportable Segment Capital Expenditures |
$ |
24 |
$ |
22 |
$ |
19 | |||
|
Corporate |
53 | 33 | 21 | ||||||
|
Total Capital Expenditures |
$ |
77 |
$ |
56 |
$ |
40 | |||
________________________________
69
|
(1) |
Presented below is a reconciliation of Net Income to Reportable Segment Adjusted EBITDA: |
|
|
|||||||||
|
|
|||||||||
|
|
Year Ended December 31, |
||||||||
|
(In millions) |
2017 |
2016 |
2015 |
||||||
|
Net Income |
$ |
510 |
$ |
155 |
$ |
160 | |||
|
Unallocated corporate expenses |
(1) | 3 | 9 | ||||||
|
Depreciation and amortization expense |
103 | 94 | 84 | ||||||
|
401(k) Plan corrective contribution |
(3) | 2 | 23 | ||||||
|
Fumigation related matters |
4 | 93 | 9 | ||||||
|
Insurance reserve adjustment |
— |
23 |
— |
||||||
|
Non-cash stock-based compensation expense |
12 | 13 | 10 | ||||||
|
Restructuring charges |
34 | 17 | 5 | ||||||
|
Gain on sale of Merry Maids branches |
— |
(2) | (7) | ||||||
|
Non-cash impairment of software and other related costs |
2 | 1 |
— |
||||||
|
(Gain) loss from discontinued operations, net of income taxes |
— |
1 | 2 | ||||||
|
Provision for income taxes |
(139) | 85 | 107 | ||||||
|
Loss on extinguishment of debt |
6 | 32 | 58 | ||||||
|
Interest expense |
150 | 153 | 167 | ||||||
|
Other non-operating expenses |
— |
— |
3 | ||||||
|
Reportable Segment Adjusted EBITDA |
$ |
677 |
$ |
670 |
$ |
630 | |||
___________________________________
|
(2) |
There are no adjustments necessary to reconcile total depreciation and amortization as presented in the business segment table to consolidated totals. Amortization of debt issue costs is not included in the business segment table. See Note 4 to the consolidated financial statements for information relating to segment goodwill. |
Note 4. Goodwill and Intangible Assets
Goodwill and indefinite-lived intangible assets are not amortized and are subject to assessment for impairment by applying a fair-value based test on an annual basis or more frequently if circumstances indicate a potential impairment. The Company’s annual assessment date is October 1. There were no goodwill or trade name impairment charges recorded in continuing operations during the years ended December 31, 2017, 2016, and 2015. There were no accumulated impairment losses recorded in continuing operations as of December 31, 2017, 2016 and 2015.
The table below summarizes the goodwill balances for continuing operations by reportable segment:
|
|
||||||||||||
|
|
American |
Franchise |
||||||||||
|
(In millions) |
Terminix |
Home Shield |
Services Group |
Total |
||||||||
|
Balance as of December 31, 2015 |
$ |
1,567 |
$ |
381 |
$ |
182 |
$ |
2,129 | ||||
|
Acquisitions |
34 | 90 |
— |
124 | ||||||||
|
Disposals |
— |
— |
(6) | (6) | ||||||||
|
Other (1) |
— |
— |
— |
— |
||||||||
|
Balance as of December 31, 2016 |
$ |
1,601 |
$ |
471 |
$ |
175 |
$ |
2,247 | ||||
|
Acquisitions |
2 | 4 |
— |
6 | ||||||||
|
Disposals |
— |
— |
— |
— |
||||||||
|
Other (1) |
1 |
— |
— |
2 | ||||||||
|
Balance as of December 31, 2017 |
$ |
1,605 |
$ |
476 |
$ |
176 |
$ |
2,256 | ||||
___________________________________
|
(1) |
Reflects the impact of foreign exchange rates. |
70
The table below summarizes the other intangible asset balances for continuing operations:
|
|
||||||||||||||||||
|
|
||||||||||||||||||
|
|
As of December 31, 2017 |
As of December 31, 2016 |
||||||||||||||||
|
|
Accumulated |
Accumulated |
||||||||||||||||
|
(In millions) |
Gross |
Amortization |
Net |
Gross |
Amortization |
Net |
||||||||||||
|
Trade names(1) |
$ |
1,608 |
$ |
— |
$ |
1,608 |
$ |
1,608 |
$ |
— |
$ |
1,608 | ||||||
|
Customer relationships |
589 | (555) | 34 | 594 | (538) | 56 | ||||||||||||
|
Franchise agreements |
88 | (70) | 18 | 88 | (67) | 21 | ||||||||||||
|
Other |
81 | (49) | 32 | 65 | (42) | 23 | ||||||||||||
|
Total |
$ |
2,366 |
$ |
(674) |
$ |
1,692 |
$ |
2,356 |
$ |
(647) |
$ |
1,708 | ||||||
___________________________________
|
(1) |
Not subject to amortization. |
Amortization expense of $27 million, $33 million and $38 million was recorded in the years ended December 31, 2017, 2016 and 2015, respectively. For the existing intangible assets, the Company anticipates amortization expense of $21 million, $16 million, $12 million, $9 million and $6 million in 2018, 2019, 2020, 2021 and 2022, respectively.
Note 5. Income Taxes
On December 22, 2017, the Tax Cuts and Jobs Act, the tax reform bill (the "Act" or “U.S. Tax Reform”) was signed into law. The Act includes numerous changes in existing tax law, including a permanent reduction in the federal corporate income tax rate from 35 percent to 21 percent, effective January 1, 2018. The adjustments to deferred tax assets and liabilities and the liability related to the transition tax are provisional amounts estimated based on information available as of December 31, 2017. As described below, we have made reasonable estimates. These amounts are subject to change as we obtain information necessary to complete the calculations. We will recognize any changes to the provisional amounts within (Benefit) Provision for Income Taxes on the Consolidated Statements of Operations and Comprehensive Income as we refine our estimates of our deferred tax assets and liabilities and our interpretations of the application of the Act. We expect to complete our analysis of the provisional items during the second half of 2018. The effects of other provisions of the Act are not expected to have a material impact on our consolidated financial statements.
Corporate Tax Rate Change
The Company is subject to the provisions of the Financial Accounting Standards Board ASC 740-10, Income Taxes, which requires that the effect on deferred tax assets and liabilities of a change in tax rates be recognized in the period the tax rate change was enacted. The Company remeasured deferred tax assets and liabilities based on the new U.S. tax rates at which they are expected to reverse in the future, which is generally 21 percent. The provisional amount recorded relating to the remeasurement of these deferred tax balances was a net reduction of total deferred tax liabilities of $271 million. We are still analyzing certain aspects of the Act and refining our calculations, which could potentially affect these deferred tax balances or potentially give rise to changes in existing deferred tax amounts.
Deferred Tax Analysis
The Act changes the treatment of certain income and expense items for which the Company records deferred tax assets and liabilities. The Company has assessed its valuation of deferred tax assets and liabilities at December 31, 2017, as well as valuation allowance analyses affected by various aspects of the Act. The Company has recorded no provisional amounts related to valuation allowances and revaluation of deferred tax assets affected by various aspects of the Act. However, we are still analyzing certain aspects of the Act and refining our calculations, which could potentially affect the valuation of these balances.
Transition Tax
The Act imposes a Transition Tax on undistributed and previously untaxed post-1986 foreign earnings and profits, as determined in accordance with U.S. tax principles, of certain foreign owned corporations owned by U.S. stockholders. The Company recorded a provisional amount for the one-time transition tax liability for the deemed distribution of earnings from our foreign subsidiaries resulting in an increase in income tax expense of less than $1 million. The Company recorded a provisional transition tax amount because certain information related to the computations required to compute the transition tax, including the computation of previously undistributed earnings, is not readily available, and there is limited information from federal and state taxing authorities regarding the application and interpretation of the recently enacted legislation. Accordingly, we are still analyzing certain aspects of the transition tax calculations which could potentially affect the amount recorded.
GILTI
Because of the complexity of the new global intangible low-taxed income (“GILTI”) tax rules, we are continuing to evaluate this provision of the Act and the application of ASC 740. Under U.S. GAAP, we are allowed to make an accounting policy choice. Our selection of an accounting policy with respect to the new GILTI tax rules will depend, in part, on analyzing our global income to determine whether we expect to have future U.S. inclusions in taxable income related to GILTI and, if so, what the impact is expected
71
to be. We are not yet able to reasonably estimate the effect of this provision of the Tax Act. Therefore, we have not made any adjustments related to potential GILTI tax in our financial statements and have not made a policy decision regarding whether to record deferred taxes on GILTI.
As of December 31, 2017, 2016 and 2015, the Company has $14 million, $13 million and $16 million, respectively, of tax benefits primarily reflected in state tax returns that have not been recognized for financial reporting purposes (“unrecognized tax benefits”). At December 31, 2017 and 2016, $13 million and $9 million, respectively, of unrecognized tax benefits would impact the effective tax rate if recognized. A reconciliation of the beginning and ending amount of gross unrecognized tax benefits is as follows:
|
|
|||||||||
|
|
Year Ended December 31, |
||||||||
|
(In millions) |
2017 |
2016 |
2015 |
||||||
|
Gross unrecognized tax benefits at beginning of period |
$ |
13 |
$ |
16 |
$ |
13 | |||
|
Increases in tax positions for prior years |
— |
— |
— |
||||||
|
Decrease in tax positions for prior years |
— |
(5) |
— |
||||||
|
Increases in tax positions for current year |
3 | 3 | 3 | ||||||
|
Lapse in statute of limitations |
(1) | (1) | (1) | ||||||
|
Gross unrecognized tax benefits at end of period |
$ |
14 |
$ |
13 |
$ |
16 | |||
Based on information currently available, it is reasonably possible that over the next 12 month period unrecognized tax benefits may decrease by $2 million as the result of settlements of ongoing audits, statute of limitation expirations or final settlements of uncertain tax positions in multiple jurisdictions.
The Company files consolidated and separate income tax returns in the U.S. federal jurisdiction and in many state and foreign jurisdictions. In the ordinary course of business, the Company is subject to review by domestic and foreign taxing authorities. For U.S. federal income tax purposes, the Company participates in the IRS’s Compliance Assurance Process whereby its U.S. federal income tax returns are reviewed by the IRS both prior to and after their filing. The U.S. federal income tax returns filed by the Company through the year ended December 31, 2014 have been audited by the IRS. The IRS commenced examinations of the Company’s U.S. federal income tax returns for 2015 in the first quarter of 2015. Three state tax authorities are in the process of auditing state income tax returns of various subsidiaries. The Company is no longer subject to state and local or foreign income tax examinations by tax authorities for years before 2008.
The Company’s policy is to recognize potential interest and penalties related to its tax positions within the tax provision. Total interest and penalties included in the consolidated statements of income are immaterial. As of December 31, 2017 and 2016, the Company had accrued for the payment of interest and penalties of approximately $2 million.
The components of income from continuing operations before income taxes are as follows:
|
|
|||||||||
|
|
Year Ended December 31, |
||||||||
|
(In millions) |
2017 |
2016 |
2015 |
||||||
|
U.S. |
$ |
365 |
$ |
238 |
$ |
266 | |||
|
Foreign |
5 | 3 | 4 | ||||||
|
Income from Continuing Operations before Income Taxes |
$ |
370 |
$ |
241 |
$ |
270 | |||
The reconciliation of income tax computed at the U.S. federal statutory tax rate to the Company’s effective income tax rate for continuing operations is as follows:
|
|
|||||||||
|
|
Year Ended December 31, |
||||||||
|
|
2017 |
2016 |
2015 |
||||||
|
Tax at U.S. federal statutory rate |
35.0 |
% |
35.0 |
% |
35.0 |
% |
|||
|
State and local income taxes, net of U.S. federal benefit |
3.5 | 4.7 | 3.2 | ||||||
|
Tax credits |
(0.6) | (0.9) | (0.8) | ||||||
|
Other permanent items |
1.3 | 1.5 | 2.4 | ||||||
|
U.S. Tax Reform rate change(1) |
(73.3) |
— |
— |
||||||
|
Remeasurement of prior year tax positions |
— |
(1.9) |
— |
||||||
|
Excess tax benefits from stock-based compensation |
(4.0) | (3.0) |
— |
||||||
|
Other, including foreign rate differences and reserves |
0.5 |
— |
— |
||||||
|
Effective rate |
(37.6) |
% |
35.4 |
% |
39.8 |
% |
|||
|
(1) |
Deferred income taxes in the Company’s balance sheet at December 31, 2017, were remeasured for the change in the U.S. income tax rate through income tax expense (see discussion on U.S. Tax Reform). This one-time beneficial rate change adjustment for $271 million includes $11 million in state income tax expense. |
72
The effective tax rate for discontinued operations for the years ended December 31, 2017, 2016 and 2015 was a tax benefit of 38.3 percent, 37.7 percent and 37.7 percent, respectively. Income tax expense from continuing operations is as follows:
|
|
|||||||||
|
|
Year Ended December 31, |
||||||||
|
(In millions ) |
2017 |
2016 |
2015 |
||||||
|
Current: |
|||||||||
|
U.S. federal |
$ |
71 |
$ |
50 |
$ |
33 | |||
|
Foreign |
3 | 2 | 2 | ||||||
|
State and local |
13 | 12 | 12 | ||||||
|
|
87 | 64 | 47 | ||||||
|
Deferred: |
|||||||||
|
U.S. federal |
(235) | 17 | 59 | ||||||
|
Foreign |
2 | (2) |
— |
||||||
|
State and local |
7 | 6 | 1 | ||||||
|
|
(226) | 22 | 60 | ||||||
|
(Benefit) provision for income taxes |
$ |
(139) |
$ |
85 |
$ |
107 | |||
Deferred income tax expense results from timing differences in the recognition of income and expense for income tax and financial reporting purposes. Deferred income tax balances reflect the net tax effects of temporary differences between the carrying amounts of assets and liabilities for financial reporting and income tax purposes. The deferred tax asset primarily reflects the impact of future tax deductions related to the Company’s accruals and certain net operating loss carryforwards. The deferred tax liability is primarily attributable to the basis differences related to intangible assets. Valuation allowances are recorded to reduce deferred tax assets when it is more likely than not that a tax benefit will not be realized. The valuation allowance for deferred tax assets as of December 31, 2017 and 2016 was $11 million and $7 million, respectively. The net change in the total valuation allowance for the year ended December 31, 2017 was an increase of $4 million.
Significant components of the Company’s deferred tax balances are as follows:
|
|
||||||
|
|
As of December 31, |
|||||
|
(In millions) |
2017 |
2016 |
||||
|
Long-term deferred tax assets (liabilities): |
||||||
|
Intangible assets(1) |
$ |
(483) |
$ |
(727) | ||
|
Property and equipment |
(25) | (34) | ||||
|
Prepaid expenses and deferred customer acquisition costs |
(12) | (18) | ||||
|
Receivables allowances |
9 | 13 | ||||
|
Self-insured claims and related expenses |
7 | 11 | ||||
|
Accrued liabilities |
14 | 28 | ||||
|
Other long-term obligations |
(12) | (19) | ||||
|
Net operating loss and tax credit carryforwards |
19 | 36 | ||||
|
Less valuation allowance |
(11) | (7) | ||||
|
Net Long-term deferred tax liability |
$ |
(493) |
$ |
(717) | ||
___________________________________
|
(1) |
The deferred tax liability relates primarily to the difference in the tax versus book basis of intangible assets. The Company had $507 million and $759 million of deferred tax liability included in this net deferred tax liability as of December 31, 2017 and 2016, respectively, that will not actually be paid unless certain business units of the Company are sold. |
As of December 31, 2017, the Company had deferred tax assets, net of valuation allowances, of $8 million for federal and state net operating loss and capital loss carryforwards, which expire at various dates up to 2037. The Company also had deferred tax assets, net of valuation allowances, of less than $1 million for federal and state credit carryforwards which expire at various dates up to 2027. The federal and state net operating loss carryforwards in the filed income tax returns included unrecognized tax benefits taken in prior years. The net operating losses for which a deferred tax asset is recognized for financial statement purposes in accordance with ASC 740 are presented net of these unrecognized tax benefits.
We previously considered the earnings in our non-U.S. subsidiaries to be indefinitely reinvested and, accordingly, recorded no deferred income taxes. Prior to the Transition Tax included in the Act discussed herein, we had an excess amount for financial reporting over the tax basis in our foreign subsidiaries, including cumulative undistributed earnings of the Company’s foreign subsidiaries of $60 million as of December 31, 2016. While the Transition Tax resulted in all remaining undistributed foreign earnings being subject to U.S. tax, an actual repatriation from our non-U.S. subsidiaries could still be subject to additional foreign withholding taxes and U.S. state taxes. Included in our December 31, 2017 U.S. income tax provision is less than $1 million in Transition Tax.
The amount of cash associated with indefinitely reinvested foreign earnings was approximately $29 million and $23 million as of December 31, 2017 and 2016, respectively. We are currently analyzing our global working capital and cash requirements and the
73
potential tax liabilities attributable to repatriation, but have yet to determine whether we plan to change our prior assertion and repatriate earnings. Accordingly, we have not recorded any deferred taxes attributable to our investment in foreign subsidiaries. We will record the tax effects of any change in our prior assertion in the period that we complete our analysis and are able to make a reasonable estimate, and disclose any unrecognized deferred tax liability for temporary differences related to our foreign investments, if practicable.
Note 6. Acquisitions
Acquisitions have been accounted for using the acquisition method and, accordingly, the results of operations of the acquired businesses have been included in the consolidated financial statements since their dates of acquisition. The assets and liabilities of these businesses were recorded in the financial statements at their estimated fair values as of the acquisition dates.
2017
During the year ended December 31, 2017, the Company completed four pest control acquisitions and purchased a ServiceMaster Clean master distributor within the Franchise Services Group. The total purchase price for these acquisitions was $16 million. The Company recorded goodwill of $2 million and other intangibles, primarily reacquired rights, of $13 million related to those acquisitions. The weighted-average useful life for each class of definite lived intangible asset associated with these acquisitions was approximately three years.
Prior Years
On June 27, 2016, the Company acquired OneGuard for a total purchase price of $61 million. The Company recorded goodwill of $57 million and other intangibles, primarily customer relationships, of $15 million related to this acquisition.
On November 30, 2016, the Company acquired Landmark for a total purchase price of $39 million. The Company recorded goodwill of $37 million and other intangibles, primarily customer relationships, of $13 million related to this acquisition. During the year ended December 31, 2017, the Company finalized its assessment of the fair value of the assets acquired and liabilities assumed. The Company updated its preliminary allocation and reclassified $4 million from other intangibles, primarily customer relationships, to goodwill.
The weighted-average useful life for each class of definite lived intangible asset recorded for both the OneGuard and Landmark acquisitions was five years.
During the year ended December 31, 2016, the Company completed several pest control and termite acquisitions. The total purchase price for these acquisitions was $43 million. The Company recorded goodwill of $34 million and other intangibles, primarily customer relationships, of $6 million related to these acquisitions. The weighted-average useful life for each class of definite lived intangible asset recorded for these acquisitions was five years.
During the year ended December 31, 2015, the Company completed several pest control and termite acquisitions. The total purchase price for these acquisitions was $125 million. The Company recorded goodwill of $74 million and other intangibles, primarily customer relationships, of $46 million related to these acquisitions. The average useful life for each class of definite lived intangible asset recorded for these acquisitions ranged from one year to eight years.
Supplemental cash flow information regarding the Company’s acquisitions is as follows:
|
|
|||||||||
|
|
Year Ended December 31, |
||||||||
|
(In millions) |
2017 |
2016 |
2015 |
||||||
|
Assets acquired |
$ |
17 |
$ |
184 |
$ |
126 | |||
|
Liabilities assumed |
(1) | (40) |
— |
||||||
|
Net assets acquired |
$ |
16 |
$ |
144 |
$ |
125 | |||
|
|
|||||||||
|
Net cash paid |
$ |
13 |
$ |
121 |
$ |
92 | |||
|
Seller financed debt |
3 | 23 | 33 | ||||||
|
Purchase price |
$ |
16 |
$ |
144 |
$ |
125 | |||
Note 7. Discontinued Operations
TruGreen Spin-off
On January 14, 2014, the Company completed the TruGreen Spin-off resulting in the spin-off of the assets and certain liabilities of the TruGreen Business through a tax-free, pro rata dividend to the Company’s stockholders. As a result of the completion of the TruGreen Spin-off, New TruGreen operates the TruGreen Business as a private independent company.
In connection with the TruGreen Spin-off, the Company entered into a transition services agreement with New TruGreen pursuant to which the Company provides New TruGreen with specified communications, public relations, finance and accounting, tax, treasury, internal audit, human resources operations and benefits, risk management and insurance, supply management, real estate management, marketing, facilities, information technology and other support services. The charges for the transition services are
74
designed to allow the Company to fully recover the direct costs of providing the services, plus specified margins and any out-of-pocket costs and expenses. The services provided under the transition services agreement terminated at various specified times on or prior to December 31, 2017, except certain information technology services which the Company has entered into an agreement with New TruGreen to extend through June 30, 2018. New TruGreen may terminate the extended transition services agreement for convenience upon 90 days written notice.
Under this transition services agreement, in the years ended December 31, 2017, 2016 and 2015, the Company recorded $2 million, $9 million and $25 million, respectively, of fees from New TruGreen, which is included as a reduction, net of costs incurred, in Selling and administrative expenses in the consolidated statement of operations and comprehensive income. As of December 31, 2017, all amounts owed by New TruGreen under this agreement have been paid.
Financial Information for Discontinued Operations
Gain (loss) from discontinued operations, net of income taxes, for all periods presented includes the operating results of the previously sold businesses.
The operating results of discontinued operations are as follows:
|
|
|||||||||
|
|
Year Ended December 31, |
||||||||
|
(In millions) |
2017 |
2016 |
2015 |
||||||
|
Revenue |
$ |
— |
$ |
— |
$ |
— |
|||
|
Cost of services rendered and products sold |
— |
— |
— |
||||||
|
Selling and administrative expenses |
$ |
(1) |
$ |
1 |
$ |
3 | |||
|
Income (loss) before income taxes |
1 | (1) | (3) | ||||||
|
Benefit for income taxes |
— |
— |
(1) | ||||||
|
Gain (loss) from discontinued operations, net of income taxes |
$ |
— |
$ |
(1) |
$ |
(2) | |||
Note 8. Restructuring Charges
The Company incurred restructuring charges of $34 million ($24 million, net of tax), $17 million ($11 million, net of tax) and $5 million ($3 million, net of tax) for the years ended December 31, 2017, 2016 and 2015, respectively. Restructuring charges are comprised of the following:
|
|
|||||||||
|
|
Year Ended December 31, |
||||||||
|
(In millions) |
2017 |
2016 |
2015 |
||||||
|
Terminix(1) |
$ |
2 |
$ |
7 |
$ |
3 | |||
|
American Home Shield(2) |
— |
2 |
— |
||||||
|
Franchise Services Group(3) |
1 |
— |
1 | ||||||
|
Corporate(4) |
2 | 5 | 1 | ||||||
|
Leadership transition(5) |
11 | ||||||||
|
American Home Shield spin-off(6) |
13 |
— |
— |
||||||
|
Global Service Center relocation(7) |
5 | 3 |
— |
||||||
|
Total restructuring charges |
$ |
34 |
$ |
17 |
$ |
5 | |||
___________________________________
|
(1) |
For the years ended December 31, 2017, 2016 and 2015, these charges include $2 million, $4 million and $3 million, respectively, of lease termination and severance costs driven by Terminix’s branch optimization program. For the year ended December 31, 2016, these charges include $1 million of severance costs and $3 million of stock-based compensation expense due to the modification of non-vested stock options and RSUs as part of the severance agreement with the former president of Terminix. Of this amount, $1 million was unpaid and accrued as of December 31, 2017. |
|
(2) |
Represents lease termination and other costs driven by the decision to consolidate the stand-alone operations of HSA acquired in February 2014 with those of American Home Shield. Less than $1 million was unpaid and accrued as of December 31, 2017. |
|
(3) |
Represents severance and other costs related to the reorganization of the Franchise Services Group. Less than $1 million was unpaid and accrued as of December 31, 2017. |
|
(4) |
We have historically made changes on an ongoing basis to enhance capabilities and reduce costs in our corporate functions that provide company-wide administrative services for our operations. In 2017, we began taking actions to enhance capabilities and align our corporate functions with those required to support our strategic needs as two stand-alone companies in anticipation of the American Home Shield spin-off. For the years ended December 31, 2017, 2016, and 2015, these charges include severance and other costs of $2 million, $2 million, and $1 million, respectively. For the year ended December 31, 2016, these charges include professional fees of $2 million and accelerated depreciation of $2 million related
75 |
to the early termination of a long-term human resources outsourcing agreement. Of this amount, $1 million was unpaid and accrued as of December 31, 2017. |
|
(5) |
For the year ended December 31, 2017, these charges include $5 million of severance costs and $5 million of stock-based compensation expense as part of the severance agreements with the former CEO and CFO. Of this amount, $4 million was unpaid and accrued as of December 31, 2017. |
|
(6) |
Represents professional fees and other costs of $13 million related to the proposed spin-off of the American Home Shield business to Company stockholders. Of this amount, $1 million was unpaid and accrued as of December 31, 2017. |
|
(7) |
For the year ended December 31, 2017, these charges include accelerated depreciation of $2 million, redundant rent expense of $2 million and a $1 million loss recorded on the sale of an asset related to the relocation of the Company’s corporate headquarters, which we refer to as our Global Service Center. For the year ended December 31, 2016, represents impairment charges of $1 million and professional fees and other costs of $1 million related to the relocation of the Company’s Global Service Center. |
The pretax charges discussed above are reported in Restructuring charges in the consolidated statements of operations and comprehensive income. We expect to incur $35 million to $45 million of additional spin-off costs in restructuring charges in 2018. We expect to incur approximately $8 million of additional Global Service Center relocation charges in 2018, principally comprised of lease exit costs.
A reconciliation of the beginning and ending balances of accrued restructuring charges, which are included in Accrued liabilities—Other on the consolidated statements of financial position, is presented as follows:
|
|
|||
|
|
Accrued |
||
|
|
Restructuring |
||
|
(In millions) |
Charges |
||
|
Balance as of December 31, 2015 |
$ |
1 | |
|
Costs incurred |
17 | ||
|
Costs paid or otherwise settled |
(16) | ||
|
Balance as of December 31, 2016 |
3 | ||
|
Costs incurred |
34 | ||
|
Costs paid or otherwise settled |
(29) | ||
|
Balance as of December 31, 2017 |
$ |
8 | |
The Company expects substantially all of its accrued restructuring charges to be paid within one year.
Certain restructuring comparative figures in the Consolidated Statements of Cash Flows have been reclassified to conform to the current year presentation.
Note 9. Commitments and Contingencies
The Company leases certain property and equipment under various operating lease arrangements. Most of the property leases provide that the Company pay taxes, insurance and maintenance applicable to the leased premises. As leases for existing locations expire, the Company expects to renew the leases or substitute another location and lease.
Rental expense for the years ended December 31, 2017, 2016 and 2015 was $32 million, $29 million and $29 million, respectively. Based on leases in place as of December 31, 2017, future long-term non-cancelable operating lease payments will be approximately $18 million in 2018, $14 million in 2019, $16 million in 2020, $13 million in 2021, $11 million in 2022 and $73 million in 2023, and thereafter.
In the normal course of business, the Company periodically enters into agreements that incorporate indemnification provisions. While the maximum amount to which the Company may be exposed under such agreements cannot be estimated, the Company does not expect these guarantees and indemnifications to have a material effect on the Company’s business, financial condition, results of operations or cash flows.
The Company carries insurance policies on insurable risks at levels that it believes to be appropriate, including workers’ compensation, automobile and general liability risks. The Company purchases insurance policies from third-party insurance carriers, which typically incorporate significant deductibles or self-insured retentions. The Company is responsible for all claims that fall below the retention limits, exceed our coverage limits or are otherwise not covered by our insurance policies. In determining the Company’s accrual for self-insured claims, the Company uses historical claims experience to establish both the current year accrual and the underlying provision for future losses. This actuarially determined provision and related accrual include known claims, as well as incurred but not reported claims. The Company adjusts its estimate of accrued self-insured claims when required to reflect changes based on factors such as changes in health care costs, accident frequency and claim severity.
76
A reconciliation of beginning and ending accrued self-insured claims, which are included in Accrued liabilities—Self-insured claims and related expenses and Other long-term obligations, primarily self-insured claims on the consolidated statements of financial position, net of insurance recoverables, which are included in Prepaid expenses and other assets and Other assets on the consolidated statements of financial position, is presented as follows:
|
|
|||
|
|
Accrued |
||
|
|
Self-insured |
||
|
(In millions) |
Claims, Net |
||
|
Balance as of December 31, 2015 |
$ |
114 | |
|
Provision for self-insured claims(1) |
58 | ||
|
Cash payments |
(51) | ||
|
Balance as of December 31, 2016 |
120 | ||
|
Provision for self-insured claims |
36 | ||
|
Cash payments |
(42) | ||
|
Balance as of December 31, 2017 |
$ |
115 | |
___________________________________
|
(1) |
Includes a charge of $23 million recorded in the year ended December 31, 2016 for an adjustment to the Company’s accrued self-insured claims related to automobile, general liability and workers’ compensation risks. The adjustment is based on the Company’s detailed annual assessment of this actuarially determined accrual, which the Company completes in the second quarter of each year. This adjustment relates to coverage periods of 2015 and prior. |
Accruals for home service plan claims in the American Home Shield business are made based on the Company’s claims experience and actuarial projections. Termite damage claim accruals in the Terminix business are recorded based on both the historical rates of claims incurred within a contract year and the cost per claim. Current activity could differ causing a change in estimates. The Company has certain liabilities with respect to existing or potential claims, lawsuits and other proceedings. The Company accrues for these liabilities when it is probable that future costs will be incurred and such costs can be reasonably estimated. Any resulting adjustments, which could be material, are recorded in the period the adjustments are identified.
In addition to the matters discussed above and the fumigation related matters discussed below, in the ordinary course of conducting business activities, the Company and its subsidiaries become involved in judicial, administrative and regulatory proceedings involving both private parties and governmental authorities. These proceedings include insured and uninsured matters that are brought on an individual, collective, representative and class action basis, or other proceedings involving regulatory, employment, general and commercial liability, automobile liability, wage and hour, environmental and other matters. The Company has entered into settlement agreements in certain cases, including with respect to putative collective and class actions, which are subject to court or other approvals. If one or more of the Company’s settlements are not finally approved, the Company could have additional or different exposure, which could be material. Subject to the paragraphs below, the Company does not expect any of these proceedings to have a material effect on its reputation, business, financial position, results of operations or cash flows; however, the Company can give no assurance that the results of any such proceedings will not materially affect its reputation, business, financial position, results of operations and cash flows.
Fumigation Related Matters
On January 20, 2017, TMX USVI and TMX LP, each an indirect, wholly-owned subsidiary of the Company, entered into a revised Plea Agreement in connection with the investigation initiated by the DOJ into allegations that a local Terminix branch used methyl bromide as a fumigant at a resort in St. John, U.S. Virgin Islands. The Plea Agreement was intended to resolve four misdemeanor charges of violations of the Federal Insecticide, Fungicide, and Rodenticide Act related to improper applications of methyl bromide. At a hearing on November 20, 2017, TMX USVI and TMX LP were sentenced for pleading guilty to four misdemeanor charges of violations of the Federal Insecticide, Fungicide, and Rodenticide Act related to improper applications of methyl bromide. Under the terms of sentencing handed down, TMX USVI and TMX LP each paid fines or costs of approximately $5 million (total of approximately $10 million). The court required TMX USVI and TMX LP to provide for training certification courses with respect to pesticide application and safety in the U.S. Virgin Islands over the next five years. As a result of the sentencing, we have recorded an additional $1 million in charges in the fourth quarter of 2017. The Company had previously recorded within Fumigation related matters in the consolidated statement of operations and comprehensive income total charges of $10 million in connection with the aforementioned criminal matter as of December 31, 2016.
On December 16, 2016, the U.S. Virgin Islands Department of Justice filed a civil complaint in the Superior Court of the Virgin Islands related to the aforementioned fumigation incident in a matter styled Government of the United States Virgin Islands v. The ServiceMaster Company, LLC, The Terminix International Company Limited Partnership, and Terminix International USVI, LLC. The amount and extent of any further potential penalties, fines, sanctions, costs and damages that the federal or other governmental authorities may yet impose, investigation or other costs and reputational harm, as well as the impact of any additional civil, criminal or other claims or judicial, administrative or regulatory proceedings resulting from or related to the U.S. Virgin Islands matter, which could be material, is not currently known, and any such further penalties, fines, sanctions, costs or damages would not be covered under the Company’s general liability insurance policies.
77
In addition to the matters discussed above, in the ordinary course of conducting business activities, we and our subsidiaries become involved in judicial, administrative and regulatory proceedings involving both private parties and governmental authorities. These proceedings include insured and uninsured matters that are brought on an individual, collective, representative and class action basis, or other proceedings involving regulatory, employment, general and commercial liability, automobile liability, wage and hour, environmental and other matters. We have entered into settlement agreements in certain cases, including with respect to putative collective and class actions, which are subject to court or other approvals. If one or more of our settlements are not finally approved, we could have additional or different exposure, which could be material. Subject to the paragraphs above, we do not expect any of these proceedings to have a material effect on our reputation, business, financial position, results of operations or cash flows; however, we can give no assurance that the results of any such proceedings will not materially affect our reputation, business, financial position, results of operations and cash flows. See Note 4 to the consolidated financial statement for more details.
On September 15, 2015, a lawsuit was filed in the Circuit Court of the 15th Judicial Circuit in and for Palm Beach County, Florida, styled Carl Robert McCaughey, et al. v. Terminix International Company Limited Partnership, Sunland Pest Control Services, Inc., et al. The lawsuit alleged that fumigation of a Florida family’s residence by Sunland, a subcontractor of TMX LP, resulted in serious injuries to one of the family’s children. Under the terms of the court approved settlement agreement, in addition to the amounts that the Company’s insurance carriers agreed to pay to the family pursuant to our general liability insurance policies, the Company paid $3 million, an amount equal to the Company’s insurance deductible under its general liability insurance policies. In the year ended December 31, 2016, the Company recorded within Cost of services rendered and products sold in the consolidated statement of operations and comprehensive income a charge of $3 million in connection with civil claims related to the Florida fumigation matter.
Note 10. Employee Benefit Plans
Discretionary contributions to the Company’s 401(k) plan were made in the amount of $15 million, $15 million and $14 million for the years ended December 31, 2017, 2016 and 2015, respectively.
In 2008, the Company amended its Profit Sharing and Retirement Plan, a tax qualified 401(k) defined contribution plan available to substantially all of its employees (the “401(k) Plan”), to implement a qualified automatic contribution arrangement (“QACA”) under the safe harbor provisions of the Internal Revenue Code of 1986, as amended (the “Code”). QACA plans, in general, require automatic enrollment of employees into the retirement plan absent an affirmative election that such employees do not wish to participate. Although the Company implemented processes to auto-enroll new hires after adopting the QACA plan in 2008, it discovered that it did not auto enroll then existing employees who were not participating in the 401(k) Plan. In response, the Company implemented an auto-enrollment process for affected active employees and submitted to the Internal Revenue Service (the “IRS”) a voluntary correction proposal (the “VCP”) to remedy the issue for prior years. On October 3, 2017, the Company and the IRS agreed on the terms of the VCP submitted by the Company. The VCP required the Company to contribute approximately $22 million to 401(k) accounts for impacted current and former employees. The contribution occurred on November 13, 2017. The Company recorded within Selling and administrative expenses in the consolidated statement of operations and comprehensive income charges of $(3) million, $2 million and $23 million for the years ended December 31, 2017, 2016 and 2015, respectively.
Note 11. Long-Term Debt
Long-term debt is summarized in the following table:
|
|
||||||
|
|
As of December 31, |
|||||
|
(In millions) |
2017 |
2016 |
||||
|
Senior secured term loan facility maturing in 2023(1) |
$ |
1,615 |
$ |
1,628 | ||
|
5.125% notes maturing in 2024(2) |
739 | 737 | ||||
|
Revolving credit facility maturing in 2021 |
— |
— |
||||
|
7.10% notes maturing in 2018(3) |
79 | 77 | ||||
|
7.45% notes maturing in 2027(3) |
169 | 167 | ||||
|
7.25% notes maturing in 2038(3) |
42 | 65 | ||||
|
Vehicle capital leases(4) |
90 | 87 | ||||
|
Other |
54 | 71 | ||||
|
Less current portion |
(144) | (59) | ||||
|
Total long-term debt |
$ |
2,643 |
$ |
2,772 | ||
___________________________________
|
(1) |
As of December 31, 2017 and 2016, presented net of $16 million and $18 million, respectively, in unamortized debt issuance costs and $3 million and $4 million, respectively, in unamortized original issue discount paid as described below under “––Term Loan Facility.” |
|
(2) |
As of December 31, 2017 and 2016, presented net of $11 million and $13 million, respectively, in unamortized debt issuance costs as described below under “––2024 Notes.” |
78
|
(3) |
As of December 31, 2017 and 2016, collectively presented net of $37 million and $48 million, respectively, of unamortized fair value adjustments related to purchase accounting, which increases the effective interest rate from the coupon rates shown above. |
|
(4) |
The Company has entered into the Fleet Agreement which, among other things, allows the Company to obtain fleet vehicles through a leasing program. All leases under the Fleet Agreement are capital leases for accounting purposes. The lease rental payments include an interest component calculated using a variable rate based on one-month LIBOR plus other contractual adjustments and a borrowing margin totaling 2.45%. |
Term Loan Facility
On April 1, 2015, the Company entered into a first amendment to the Old Term Loan Facility, which provides for incremental term loans in an aggregate principal amount of $175 million. On April 1, 2015, the Company used the net proceeds from the incremental term loans, together with cash on hand, to redeem the remaining outstanding $200 million in aggregate principal amount of the 8% 2020 Notes at a redemption price of 106.0% of the principal amount. In addition, $2 million of available cash was used to pay debt issuance costs in connection with the incremental term loans.
On August 17, 2015, the Company entered into a second amendment to the Old Term Loan Facility, which provides for incremental term loans in an aggregate principal amount of $400 million. On August 17, 2015, the Company used the net proceeds from incremental term loans, together with cash on hand, to redeem the remaining outstanding $488 million in aggregate principal amount of the 7% 2020 Notes at a redemption price of 105.25% of the principal amount. In addition, $5 million of available cash was used to pay debt issuance costs of $3 million and original issue discount of $2 million in connection with the incremental term loans.
On November 8, 2016, the Company entered into a $1,650 million Term Loan Facility maturing November 8, 2023. Borrowings under the Term Loan Facility, together with the 2024 Notes, were used to repay the remaining outstanding $2,356 million in aggregate principal amount of the Old Term Loan Facility. In connection with the repayment, the Company recorded a loss on extinguishment of debt of $32 million in the year ended December 31, 2016, which includes the write-off of $14 million of original issue discount and $18 million of debt issuance costs. In addition, $38 million of proceeds was used to pay debt issuance costs of $34 million and original issue discount of $4 million in connection with the Term Loan Facility, the Revolving Credit Facility and the 2024 Notes.
The interest rates applicable to the term loans under the Term Loan Facility are based on a fluctuating rate of interest measured by reference to either, at The Company’s option, (i) an adjusted LIBOR (subject to a floor of zero percent) plus a margin of 2.50% per annum or (ii) an alternate base rate (subject to a floor of 1.00%) plus a margin of 1.50% per annum. Voluntary prepayments of borrowings under the Term Loan Facility are permitted at any time, in minimum principal amounts, without premium or penalty.
The Term Loan Facility and the guarantees thereof are secured by substantially all of the tangible and intangible assets of the Company and certain of its domestic subsidiaries, excluding certain subsidiaries subject to regulatory requirements in various states, including pledges of all the capital stock of all direct domestic subsidiaries (other than foreign subsidiary holding companies, which are deemed to be foreign subsidiaries) owned by the Company or any Guarantor and of up to 65% of the capital stock of each direct foreign subsidiary owned by the Company or any Guarantor. The Term Loan Facility security interests are subject to certain exceptions, including, but not limited to, exceptions for (i) equity interests, (ii) indebtedness or other obligations of subsidiaries, (iii) real estate or (iv) any other assets, if the granting of a security interest therein would require that any notes issued under the Company’s indenture dated as of August 15, 1997 be secured. The Term Loan Facility is secured on a pari passu basis with the security interests created in the same collateral securing the Revolving Credit Facility.
The Company has historically entered into interest rate swap agreements. Under the terms of these agreements, the Company pays a fixed rate of interest on the stated notional amount and receives a floating rate of interest (based on one month LIBOR) on the stated notional amount. Therefore, during the term of the swap agreements, the effective interest rate on the portion of the term loans equal to the stated notional amount is fixed at the stated rate in the interest rate swap agreements plus the incremental borrowing margin.
On November 8, 2016, in connection with the repayment of the Old Term Loan Facility, the Company terminated the then-existing interest rate swap agreements and paid $10 million in connection with the terminations. The fair value of the terminated agreements of $10 million is recorded within accumulated other comprehensive income (loss) on the consolidated statements of financial position and will be amortized into interest expense over the original term of the agreements.
On November 7, 2016 the Company entered into a seven-year interest rate swap agreement effective November 8, 2016. The notional amount of the agreement was $650 million. Under the terms of the agreement, the Company will pay a fixed rate of interest of 1.493% on the $650 million notional amount, and the Company will receive a floating rate of interest (based on one-month LIBOR, subject to a floor of zero percent) on the notional amount. Therefore, during the term on the agreement, the effective interest rate on $650 million of the Term Loan Facility is fixed at a rate of 1.493%, plus the incremental borrowing margin of 2.50%.
79
The changes in interest rate swap agreements, as well as the cumulative interest rate swaps outstanding, are as follows:
|
|
||||||
|
|
Weighted |
|||||
|
|
Notional |
Average Fixed |
||||
|
(In millions) |
Amount |
Rate(1) |
||||
|
Interest rate swap agreements in effect as of December 31, 2015 |
$ |
700 | 1.867 |
% |
||
|
Terminated |
(700) | |||||
|
Entered into effect |
650 | |||||
|
Interest rate swap agreements in effect as of December 31, 2016 |
650 | 1.493 |
% |
|||
|
Terminated |
— |
|||||
|
Entered into effect |
— |
|||||
|
Interest rate swap agreements in effect as of December 31, 2017 |
$ |
650 | 1.493 |
% |
||
___________________________________
|
(1) |
Before the application of the applicable borrowing margin. |
In accordance with accounting standards for derivative instruments and hedging activities, and as further described in Note 17 to the consolidated financial statements, these interest rate swap agreements are classified as cash flow hedges, and, as such, the hedging instruments are recorded on the consolidated statements of financial position as either an asset or liability at fair value, with the effective portion of the changes in fair value attributable to the hedged risks recorded in accumulated other comprehensive income (loss).
Revolving Credit Facility
On November 8, 2016, in connection with the Company’s refinancing, the Company terminated the Old Revolving Credit Facility and entered into a $300 million Revolving Credit Facility. The maturity date for the Revolving Credit Facility is November 8, 2021. The Revolving Credit Facility provides for senior secured revolving loans and stand‑by and other letters of credit. The Revolving Credit Facility limits outstanding letters of credit to $225 million. As of December 31, 2017, there were $33 million of letters of credit outstanding and $267 million of available borrowing capacity under the Revolving Credit Facility.
The Revolving Credit Facility and the guarantees thereof are secured by the same collateral securing the Term Loan Facility, on a pari passu basis with the security interests created in the same collateral securing the Term Loan Facility.
The interest rates applicable to the loans under the Revolving Credit Facility are based on a fluctuating rate of interest measured by reference to either, at the Company’s option, (i) an adjusted LIBOR plus a margin of 2.50% per annum or (ii) an alternate base rate plus a margin of 1.50% per annum.
2024 Notes
On November 8, 2016, the Company sold $750 million of 2024 Notes. The 2024 Notes will mature on November 15, 2024 and bear interest at a rate of 5.125% per annum. The 2024 Notes are jointly and severally guaranteed on a senior unsecured basis by the Company’s domestic subsidiaries that guarantee its indebtedness under the Credit Facilities (the “Guarantors”). The 2024 Notes are not guaranteed by any of the Company’s non‑U.S. subsidiaries, any subsidiaries subject to regulation as an insurance, home service plan or similar company, or certain other subsidiaries (the “Non-Guarantors”).
The 2024 Notes are our unsecured obligations and rank equally in right of payment with all of our other existing and future senior unsecured indebtedness. The subsidiary guarantees are senior unsecured obligations of the Guarantors and rank equally in right of payment with all of the existing and future senior unsecured indebtedness of our Non-Guarantors. The 2024 Notes are effectively junior to all of our existing and future secured indebtedness to the extent of the value of the assets securing such indebtedness.
2020 Notes
On February 17, 2015, the Company redeemed $190 million in aggregate principal amount of its 8% 2020 Notes at a redemption price of 106.0% of the principal amount using available cash. In connection with the partial redemption, the Company recorded a loss on extinguishment of debt of $13 million in the year ended December 31, 2015, which includes a pre-payment premium of $11 million and the write-off of $2 million of debt issuance costs.
On April 1, 2015, the Company used the net proceeds from additional borrowings under the Old Term Loan Facility, together with cash on hand, to redeem the remaining outstanding $200 million in aggregate principal amount of its 8% 2020 Notes at a redemption price of 106.0% of the principal amount. In connection with the redemption, the Company recorded a loss on extinguishment of debt of $14 million in the year ended December 31, 2015, which includes a pre-payment premium of $12 million and the write-off of $2 million of debt issuance costs.
On August 17, 2015, the Company used the net proceeds from additional borrowings under the Old Term Loan Facility, together with cash on hand, to redeem the remaining outstanding $488 million in aggregate principal amount of the 7% 2020 Notes at a redemption price of 105.25% of the principal amount. In connection with the redemption, the Company recorded a loss on extinguishment of debt of $31 million in the year ended December 31, 2015, which includes a pre‑payment premium of $25 million and the write‑off of $6 million of debt issuance costs.
80
2038 Notes
On September 18, 2017, the Company purchased $13 million in aggregate principal amount of its 7.25% notes maturing in 2038 at a price of 104.625% of the principal amount using available cash. On May 11, 2017, the Company purchased $17 million in aggregate principal amount of its 7.25% notes maturing in 2038 at a price of 97% of the principal amount using available cash. The repurchased notes were delivered to the trustee for cancellation. In connection with these partial repurchases, the Company recorded a loss on extinguishment of debt of $6 million in the year ended December 31, 2017.
Other
The agreements governing the Term Loan Facility and the Revolving Credit Facility contain certain covenants that, among other things, limit or restrict the incurrence of additional indebtedness, liens, sales of assets, certain payments (including dividends) and transactions with affiliates, subject to certain exceptions. The Company was in compliance with the covenants under these agreements at December 31, 2017.
As of December 31, 2017, future scheduled long‑term debt payments are $144 million, $65 million, $45 million, $31 million and $20 million for the years ended December 31, 2018, 2019, 2020, 2021 and 2022, respectively. Certain of the Company’s assets, including vehicles, equipment and a customer care center facility, are leased under capital leases with $91 million in remaining lease obligations as of December 31, 2017. The long‑term debt payments above include future capital lease payments of approximately $29 million in 2018, $24 million in 2019, $21 million in 2020, $13 million in 2021, and $3 million in 2022.
Note 12. Cash and Marketable Securities
Cash, money market funds and certificates of deposits with maturities of three months or less when purchased are included in Cash and cash equivalents on the consolidated statements of financial position. As of December 31, 2017 and 2016, the Company’s marketable securities consisted primarily of treasury bills (“Debt securities”) and common equity securities (“Equity securities”). The amortized cost, fair value and gross unrealized gains and losses of the Company’s short- and long-term investments in Debt and Equity securities are as follows:
|
|
||||||||||||
|
|
Gross |
Gross |
||||||||||
|
|
Amortized |
Unrealized |
Unrealized |
Fair |
||||||||
|
(In millions) |
Cost |
Gains |
Losses |
Value |
||||||||
|
Available-for-sale securities, December 31, 2017: |
||||||||||||
|
Debt securities |
$ |
29 |
$ |
— |
$ |
— |
$ |
29 | ||||
|
Equity securities |
15 | 3 |
— |
18 | ||||||||
|
Total securities |
$ |
44 |
$ |
3 |
$ |
— |
$ |
47 | ||||
|
Available-for-sale securities, December 31, 2016: |
||||||||||||
|
Debt securities |
$ |
27 |
$ |
— |
$ |
— |
$ |
27 | ||||
|
Equity securities |
15 | 1 |
— |
17 | ||||||||
|
Total securities |
$ |
43 |
$ |
1 |
$ |
— |
$ |
44 | ||||
There were no unrealized losses which had been in a loss position for more than one year as of December 31, 2017 and 2016.
Gains and losses on sales of investments, as determined on a specific identification basis, are included in investment income in the period they are realized. The Company periodically reviews its portfolio of investments to determine whether there has been an other than temporary decline in the value of the investments from factors such as deterioration in the financial condition of the issuer or the market(s) in which the issuer competes. The table below summarizes proceeds, maturities, gross realized gains and gross realized losses resulting from sales of available-for-sale securities. There were no impairment charges due to other than temporary declines in the value of certain investments for the years ended December 31, 2017, 2016, and 2015.
|
|
|||||||||
|
|
Year Ended December 31, |
||||||||
|
(In millions) |
2017 |
2016 |
2015 |
||||||
|
Proceeds from sale of securities |
$ |
12 |
$ |
42 |
$ |
22 | |||
|
Maturities of securities |
36 | 7 | 11 | ||||||
|
Gross realized gains, pre-tax |
— |
4 | 7 | ||||||
|
Gross realized gains, net of tax |
— |
2 | 4 | ||||||
|
Gross realized losses, pre-tax |
— |
— |
— |
||||||
|
Gross realized losses, net of tax |
— |
— |
— |
||||||
Note 13. Comprehensive Income (Loss)
Comprehensive income (loss), which primarily includes net income (loss), unrealized gain on marketable securities, unrealized gain (loss) on derivative instruments and the effect of foreign currency translation loss is disclosed in the consolidated statements of operations and comprehensive income and the consolidated statements of shareholders’ equity.
81
The following tables summarize the activity in accumulated other comprehensive income (loss), net of the related tax effects.
|
|
||||||||||||
|
|
Unrealized |
|||||||||||
|
|
Gains on |
Foreign |
||||||||||
|
|
Unrealized |
Available |
Currency |
|||||||||
|
|
(Losses) Gains on |
-for-Sale |
Translation |
|||||||||
|
(In millions) |
Derivatives |
Securities |
(Loss) Gain |
Total |
||||||||
|
Balance as of December 31, 2015 |
$ |
(7) |
$ |
2 |
$ |
(15) |
$ |
(21) | ||||
|
Other comprehensive income before reclassifications: |
||||||||||||
|
Pre-tax amount |
20 | 1 |
— |
21 | ||||||||
|
Tax provision |
8 | 1 |
— |
9 | ||||||||
|
After-tax amount |
13 |
— |
— |
13 | ||||||||
|
Amounts reclassified from accumulated other comprehensive income (loss)(1) |
|
|
7 |
|
|
(2) |
|
|
— |
|
|
5 |
|
Net current period other comprehensive income (loss) |
20 | (2) |
— |
18 | ||||||||
|
Balance as of December 31, 2016 |
$ |
12 |
$ |
1 |
$ |
(15) |
$ |
(3) | ||||
|
Other comprehensive income before reclassifications: |
||||||||||||
|
Pre-tax amount |
— |
2 | 3 | 5 | ||||||||
|
Tax provision |
— |
1 |
— |
1 | ||||||||
|
After-tax amount |
— |
1 | 3 | 4 | ||||||||
|
Amounts reclassified from accumulated other comprehensive income(1) |
|
|
4 |
|
|
— |
|
|
— |
|
|
4 |
|
Net current period other comprehensive income |
4 | 1 | 3 | 8 | ||||||||
|
Balance as of December 31, 2017 |
$ |
16 |
$ |
2 |
$ |
(12) |
$ |
5 | ||||
___________________________________
|
(1) |
Amounts are net of tax. See reclassifications out of accumulated other comprehensive income below for further details. |
Reclassifications out of accumulated other comprehensive income included the following components for the periods indicated.
|
|
|||||||||||
|
|
|||||||||||
|
|
Amounts Reclassified from Accumulated |
||||||||||
|
|
Other Comprehensive Income |
||||||||||
|
|
As of December 31, |
Consolidated Statements of Operations |
|||||||||
|
(In millions) |
2017 |
2016 |
2015 |
and Comprehensive Income Location |
|||||||
|
Gains (losses) on derivatives: |
|||||||||||
|
Fuel swap contracts |
$ |
3 |
$ |
(4) |
$ |
(5) |
Cost of services rendered and products sold |
||||
|
Interest rate swap contracts |
(8) | (7) | (6) |
Interest expense |
|||||||
|
Net losses on derivatives |
(6) | (11) | (11) | ||||||||
|
Impact of income taxes |
2 | 4 | 4 |
Provision for income taxes |
|||||||
|
Total reclassifications related to derivatives |
$ |
(4) |
$ |
(7) |
$ |
(7) | |||||
|
Gains on available-for-sale securities |
$ |
— |
$ |
3 |
$ |
7 |
Interest and net investment income |
||||
|
Impact of income taxes |
— |
(1) | (3) |
Provision for income taxes |
|||||||
|
Total reclassifications related to securities |
$ |
— |
$ |
2 |
$ |
4 | |||||
|
Total reclassifications for the period |
$ |
(4) |
$ |
(5) |
$ |
(3) | |||||
Note 14. Supplemental Cash Flow Information
Supplemental information relating to the consolidated statements of cash flows is presented in the following table:
|
|
|||||||||
|
|
Year Ended December 31, |
||||||||
|
(In millions) |
2017 |
2016 |
2015 |
||||||
|
Cash paid for or (received from): |
|||||||||
|
Interest expense(1) |
$ |
134 |
$ |
134 |
$ |
178 | |||
|
Interest and dividend income |
(1) | (2) | (3) | ||||||
|
Income taxes, net of refunds |
109 | 71 | 44 | ||||||
|
(1) |
For the year ended December 31, 2016, excludes $10 million paid in connection with the termination of interest rate swap agreements. |
As of December 31, 2017 and 2016, Cash and cash equivalents of $475 million and $291 million, respectively, and Restricted cash of $89 million and $95 million, respectively, as presented on the consolidated statements of financial position
82
represent the amounts comprising Cash and cash equivalents and restricted cash of $563 million and $386 million presented on the consolidated statements of cash flows. There were no restricted cash balances as of December 31, 2015.
The Company acquired $41 million, $61 million and $27 million of property and equipment through capital leases and other non-cash financing transactions in the years ended December 31, 2017, 2016 and 2015, respectively, which have been excluded from the consolidated statements of cash flows as non-cash investing and financing activities.
In the years ended December 31, 2016 and 2015 the Company converted certain company-owned Merry Maids branches to franchises for a total purchase price of $9 million and $17 million, respectively. In the years ended December 31, 2016, and 2015, the Company received cash of $6 million and $13 million, respectively, and provided financing of $2 million and $4 million, respectively.
Note 15. Capital Stock
The Company is authorized to issue 2,000,000,000 shares of common stock. As of December 31, 2017, there were 146,662,232 shares of common stock issued and 135,141,048 shares of common stock outstanding. The Company has no other classes of equity securities issued or outstanding.
Note 16. Stock-Based Compensation
In connection with the Company’s initial public offering, the Company’s board of directors and stockholders have adopted the Omnibus Incentive Plan. Prior to the Company’s initial public offering, the Company’s board of directors and stockholders had adopted the MSIP. Upon adoption of the Omnibus Incentive Plan, the Company froze the MSIP and will make no further grants thereunder. However, awards previously granted under the MSIP are unaffected by the termination of the MSIP. The Omnibus Incentive Plan provides for awards in the form of stock options, stock purchase rights, restricted stock, RSUs, performance shares, performance units, stock appreciation rights, dividend equivalents, DSUs and other stock-based awards. The MSIP provided for the sale of shares and DSUs of the Company’s stock to the Company’s executives, officers and other employees and to the Company’s directors as well as the grant of RSUs, performance-based RSUs and options to purchase the Company’s shares to those individuals. DSUs represent a right to receive a share of common stock in the future. The Company’s Compensation Committee selects the Company’s executive officers, employees and directors eligible to participate in the Omnibus Incentive Plan and determines the specific number of shares to be offered or options to be granted to an individual.
On February 24, 2015, the Company’s board of directors approved and recommended for approval by the Company’s stockholders the Employee Stock Purchase Plan, which became effective for offering periods commencing July 1, 2015. The Employee Stock Purchase Plan is intended to qualify for the favorable tax treatment under the Code. Under the plan, eligible employees of the Company may purchase common stock, subject to Internal Revenue Service limits, during pre-specified offering periods at a discount established by the Company not to exceed ten percent of the then-current fair market value. On April 27, 2015, the Company’s stockholders approved the Employee Stock Purchase Plan with a maximum of one million shares of common stock authorized for sale under the plan. Under the Employee Stock Purchase Plan, the Company sold 52,051 shares in 2017, 70,063 shares in 2016 and 34,302 shares in 2015. As a result of the American Home Shield spin-off described in Note 1 to the consolidated financial statements, the Employee Stock Purchase Plan was suspended effective January 1, 2018.
A maximum of 16,396,667 shares of the Company’s stock is authorized for issuance under the MSIP, the Omnibus Incentive Plan and the Employee Stock Purchase Plan, of which, as of December 31, 2017, 7,299,555 shares remain available for future grants. The Company currently intends to satisfy any need for the Company’s shares of common stock associated with the settlement of DSUs, vesting of RSUs, exercise of options or purchase of shares issued under the Omnibus Incentive Plan, MSIP or Employee Stock Purchase Plan through new shares available for issuance or any shares repurchased, forfeited or surrendered from participants in the MSIP and the Omnibus Incentive Plan.
All option grants under the Omnibus Incentive Plan and the MSIP have been, and the Company expects that all future option grants will be, non-qualified options with a per-share exercise price no less than the fair market value of one share of the Company’s stock on the grant date. Any stock options granted will generally have a term of ten years and vesting will be subject to an employee’s continued employment. The Company’s Compensation Committee may accelerate the vesting of an option at any time. In addition, vesting of options will be accelerated if the Company experiences a change in control (as defined in the Omnibus Incentive Plan and the MSIP) unless options with substantially equivalent terms and economic value are substituted for existing options in place of accelerated vesting. Vesting of options granted under the Omnibus Incentive Plan and the MSIP will also be accelerated in the event of an employee’s death or disability (as defined in the Omnibus Incentive Plan and the MSIP). Upon termination for cause (as defined in the Omnibus Incentive Plan and the MSIP), all options held by an employee are immediately cancelled. Following a termination without cause, vested options will generally remain exercisable through the earlier of the expiration of their term or three months following termination of employment (one year in the case of death, disability or retirement at normal retirement age). Unless sooner terminated by the Company’s board of directors, the Omnibus Incentive Plan will remain in effect until June 26, 2024.
In 2017, 2016 and 2015, the Company completed various equity offerings to certain of the Company’s executives, officers and employees pursuant to the Omnibus Incentive Plan. The shares sold and options granted in connection with these equity offerings are subject to and governed by the terms of the Omnibus Incentive Plan. No other shares of common stock were sold by the Company in 2017, 2016 or 2015.
83
Stock Options
The Company granted the Company’s executives, officers and employees options to purchase 747,761; 684,329; and 411,506 shares of the Company’s common stock in 2017, 2016 and 2015, respectively, at a weighted-average exercise price of $39.27 per share for options issued in 2017, $39.54 per share for options issued in 2016 and $32.70 per share for options issued in 2015. These options are subject to and governed by the terms of the MSIP and Omnibus Incentive Plan. The per share purchase price and exercise price was based on the determination by the Company’s Compensation Committee of the fair market value of the Company’s common stock as of the purchase/grant dates. All options granted to date generally will vest in four equal annual installments, subject to an employee’s continued employment. The four-year vesting period is the requisite service period over which compensation cost will be recognized on a straight-line basis for all grants. All options issued are accounted for as equity-classified awards.
The value of each option award was estimated on the grant date using the Black-Scholes option valuation model that incorporates the assumptions noted in the following table. For options granted in 2017, 2016 and 2015, the expected volatility was based on historical and implied volatilities of the Company’s publicly traded stock. The expected life represents the period of time that options granted are expected to be outstanding and was calculated using the simplified method as outlined by the SEC in Staff Accounting Bulletins No. 107 and 110 as the Company does not have sufficient historical exercise to provide a reasonable basis upon which to estimate expected life due to the limited period of time the Company’s equity shares have been publicly traded. The risk-free interest rates were based on the U.S. Treasury securities with terms similar to the expected lives of the options as of the grant dates.
|
|
|||||||||
|
|
Year Ended December 31, |
||||||||
|
Assumption |
2017 |
2016 |
2015 |
||||||
|
Expected volatility |
27.7 |
% |
32.3 |
% |
34.1 |
% |
|||
|
Expected dividend yield |
0.0 |
% |
0.0 |
% |
0.0 |
% |
|||
|
Expected life (in years) |
6.3 | 6.3 | 6.3 | ||||||
|
Risk-free interest rate |
1.83% - 2.29 |
% |
1.25% - 1.46 |
% |
1.50% - 1.83 |
% |
|||
The weighted-average grant-date fair value of the options granted during 2017, 2016 and 2015 was $12.45, $13.58 and $11.91 per option, respectively. During the year ended December 31, 2017, the Company applied a forfeiture assumption of 18.34 percent per annum in the recognition of the expense related to these options, with the exception of the options held by the Company’s CEO for which the Company has applied a forfeiture rate of zero. The total intrinsic value of stock options exercised during the years ended December 31, 2017, 2016 and 2015, was $60 million, $20 million and $25 million, respectively. The total fair value of stock options vested during the years ended December 31, 2017, 2016 and 2015, was $6 million, $6 million and $5 million, respectively.
A summary of option activity under the MSIP and Omnibus Incentive Plan as of December 31, 2017 and changes during the year then ended is presented below:
|
|
||||||||||
|
|
Weighted Avg. |
|||||||||
|
|
Aggregate |
Remaining |
||||||||
|
|
Weighted Avg. |
Intrinsic |
Contractual |
|||||||
|
|
Stock |
Exercise |
Value |
Term |
||||||
|
|
Options |
Price |
(in millions) |
(in years) |
||||||
|
Total outstanding, December 31, 2016 |
3,155,344 |
$ |
18.96 |
$ |
60 | 6.97 | ||||
|
Granted to employees |
747,761 |
$ |
39.27 | |||||||
|
Exercised |
(2,050,978) |
$ |
13.61 | |||||||
|
Forfeited |
(726,965) |
$ |
30.38 | |||||||
|
Expired |
— |
$ |
— |
|||||||
|
Total outstanding, December 31, 2017 |
1,125,162 |
$ |
34.84 |
$ |
18 | 8.15 | ||||
|
Total exercisable, December 31, 2017 |
214,369 |
$ |
25.97 |
$ |
5 | 6.44 | ||||
RSUs
The Company granted the Company’s executives, officers and employees 416,604; 267,739; and 304,680 RSUs in 2017, 2016 and 2015, respectively, with weighted-average grant date fair values of $40.51 per unit for 2017, $39.15 per unit for 2016 and $32.55 per unit for 2015, which was equivalent to the then current fair value of the Company’s common stock at the grant date. All RSUs outstanding as of December 31, 2017 will vest in three equal annual installments, subject to an employee’s continued employment. Upon vesting, each RSU will be converted into one share of the Company’s common stock. The total fair value of RSUs vested during the years ended December 31, 2017, 2016 and 2015, was $7 million, $10 million and $7 million, respectively.
84
A summary of RSU activity under the Omnibus Incentive Plan as of December 31, 2017, and changes during the year then ended is presented below:
|
|
|||||
|
|
Weighted Avg. |
||||
|
|
Grant Date |
||||
|
|
RSUs |
Fair Value |
|||
|
Total outstanding, December 31, 2016 |
439,134 |
$ |
35.63 | ||
|
Granted to employees |
416,604 |
$ |
40.51 | ||
|
Vested |
(184,151) |
$ |
33.71 | ||
|
Forfeited |
(99,663) |
$ |
38.77 | ||
|
Total outstanding, December 31, 2017 |
571,924 |
$ |
39.26 | ||
Included within the summary of RSU activity above are 162,172 grants of performance RSUs to certain executives who are key to the American Home Shield spin-off transaction. All such performance RSUs are contingent upon the successful completion of the spin-off transaction and subject to the employee’s continued employment. For certain grants, all performance RSUs vest on the date of the spin-off. For the remainder of these grants, the performance RSUs vest one-half on the date of the spin-off and one-half one year subsequent to the date of the spin-off.
Performance Shares
The Company granted the Company’s executives 120,778 performance shares in 2017 with a weighted–average grant date fair value of $38.98 per share and 131,352 performance shares in 2016 with a weighted-average grant date fair value of $39.59 per share, which were equivalent to the then current fair value of the Company’s common stock at the grant date. The performance shares vest at the end of a three-year period based on the achievement of a cumulative adjusted EPS target established at the grant date and subject to an executive’s continued employment. As the performance shares contain a performance condition, stock-based compensation expense, net of estimated forfeitures, is recorded over the requisite service period based on the number of awards expected to vest. No performance shares were granted in 2015.
A summary of performance share activity under the Omnibus Incentive Plan as of December 31, 2017, and changes during the year then ended is presented below:
|
|
|||||
|
|
Weighted Avg. |
||||
|
|
Performance |
Grant Date |
|||
|
|
Shares |
Fair Value |
|||
|
Total outstanding, December 31, 2016 |
109,881 |
$ |
39.59 | ||
|
Granted to executives |
120,778 |
$ |
38.98 | ||
|
Forfeited |
(136,731) |
$ |
39.55 | ||
|
Total outstanding, December 31, 2017 |
93,928 |
$ |
38.86 | ||
Stock-based compensation expense
During the years ended December 31, 2017, 2016 and 2015, the Company recognized stock-based compensation expense of $12 million ($7 million, net of tax), $13 million ($8 million, net of tax) and $10 million ($6 million, net of tax), respectively. These charges are recorded within Selling and administrative expenses in the consolidated statements of operations and comprehensive income. Additionally, during the years ended December 31, 2017 and 2016, the Company recognized $5 million and $3 million, respectively, of stock-based compensation expense due to the modification of non-vested stock options and RSUs as part of the severance agreements with the former CEO (2017) and president of Terminix (2016), which has been included in Restructuring charges in the consolidated statements of operations and comprehensive income. There were no award modifications in 2015.
As of December 31, 2017, there was $26 million of total unrecognized compensation costs related to non-vested stock options, RSUs and performance shares granted under the MSIP and Omnibus Incentive Plan. These remaining costs are expected to be recognized over a weighted-average period of 1.89 years.
85
Note 17. Fair Value Measurements
The period-end carrying amounts of cash and cash equivalents, receivables, restricted cash, accounts payable and accrued liabilities approximate fair value because of the short maturity of these instruments. The period-end carrying amounts of long-term notes receivable approximate fair value as the effective interest rates for these instruments are comparable to period-end market rates. The period-end carrying amounts of short- and long-term marketable securities also approximate fair value, with unrealized gains and losses reported net of tax as a component of accumulated other comprehensive income on the consolidated statements of financial position, or, for certain unrealized losses, reported in interest and net investment income in the consolidated statements of operations and comprehensive income if the decline in value is other than temporary. The carrying amount of total debt was $2,787 million and $2,831 million and the estimated fair value was $2,888 million and $2,930 million as of December 31, 2017 and December 31, 2016, respectively. The fair value of the Company’s debt is estimated based on available market prices for the same or similar instruments which are considered significant other observable inputs (Level 2) within the fair value hierarchy. The fair values presented reflect the amounts that would be received to sell an asset or paid to transfer a liability in an orderly transaction between market participants at the measurement date (exit price). The fair value estimates presented in this report are based on information available to the Company as of December 31, 2017 and 2016.
The Company has estimated the fair value of its financial instruments measured at fair value on a recurring basis using the market and income approaches. For investments in marketable securities, deferred compensation trust assets and derivative contracts, which are carried at their fair values, the Company’s fair value estimates incorporate quoted market prices, other observable inputs (for example, forward interest rates) and unobservable inputs (for example, forward commodity prices) at the balance sheet date.
Interest rate swap contracts are valued using forward interest rate curves obtained from third-party market data providers. The fair value of each contract is the sum of the expected future settlements between the contract counterparties, discounted to present value. The expected future settlements are determined by comparing the contract interest rate to the expected forward interest rate as of each settlement date and applying the difference between the two rates to the notional amount of debt in the interest rate swap contracts.
Fuel swap contracts are valued using forward fuel price curves obtained from third-party market data providers. The fair value of each contract is the sum of the expected future settlements between the contract counterparties, discounted to present value. The expected future settlements are determined by comparing the contract fuel price to the expected forward fuel price as of each settlement date and applying the difference between the contract and expected prices to the notional gallons in the fuel swap contracts. The Company regularly reviews the forward price curves obtained from third-party market data providers and related changes in fair value for reasonableness utilizing information available to the Company from other published sources.
The Company has not changed its valuation techniques for measuring the fair value of any financial assets and liabilities during the year. Transfers between levels, if any, are recognized at the end of the reporting period. There were no significant transfers between levels during each of the years ended December 31, 2017 and 2016.
86
The carrying amount and estimated fair value of the Company’s financial instruments that are recorded at fair value on a recurring basis for the periods presented are as follows:
|
|
|
|
|
|
|
|
|
|
|
|
|
|
|
|
|
|
|
|
|
|
|
|
|
|
|
|
|
|
|
|
|
|
|
|
|
|
|
|
Estimated Fair Value Measurements |
|||||||
|
|
|
|
|
|
|
|
Quoted |
|
Significant |
|
|
|
||
|
|
|
|
|
|
|
|
Prices In |
|
Other |
|
Significant |
|||
|
|
|
|
|
|
|
|
Active |
|
Observable |
|
Unobservable |
|||
|
|
|
Statement of Financial |
|
Carrying |
|
Markets |
|
Inputs |
|
Inputs |
||||
|
(In millions) |
|
Position Location |
|
Value |
|
(Level 1) |
|
(Level 2) |
|
(Level 3) |
||||
|
As of December 31, 2017: |
|
|
|
|
|
|
|
|
|
|
|
|
|
|
|
Financial Assets: |
|
|
|
|
|
|
|
|
|
|
|
|
|
|
|
Deferred compensation trust assets |
|
Long-term marketable securities |
|
$ |
12 |
|
$ |
12 |
|
$ |
— |
|
$ |
— |
|
Investments in marketable securities |
|
Marketable securities and Long-term marketable securities |
|
|
35 |
|
|
34 |
|
|
1 |
|
|
— |
|
Fuel swap contracts |
|
Prepaid expenses and other assets and Other assets |
|
|
3 |
|
|
— |
|
|
— |
|
|
3 |
|
Interest rate swap contracts |
|
Other assets |
|
|
25 |
|
|
— |
|
|
25 |
|
|
— |
|
Total financial assets |
|
|
|
$ |
75 |
|
$ |
46 |
|
$ |
26 |
|
$ |
3 |
|
Financial Liabilities: |
|
|
|
|
|
|
|
|
|
|
|
|
|
|
|
Interest rate swap contracts |
|
Other accrued liabilities and Other long-term obligations |
|
|
— |
|
|
— |
|
|
— |
|
|
— |
|
Total financial liabilities |
|
|
|
$ |
— |
|
$ |
— |
|
$ |
— |
|
$ |
— |
|
As of December 31, 2016: |
|
|
|
|
||||||||||
|
Financial Assets: |
|
|
|
|
|
|
|
|
|
|
|
|
|
|
|
Deferred compensation trust assets |
|
Long-term marketable securities |
|
$ |
8 |
|
$ |
8 |
|
$ |
— |
|
$ |
— |
|
Investments in marketable securities |
|
Marketable securities and Long-term marketable securities |
|
|
36 |
|
|
33 |
|
|
3 |
|
|
— |
|
Fuel swap contracts |
|
Prepaid expenses and other assets and Other assets |
|
|
5 |
|
|
— |
|
|
— |
|
|
5 |
|
Interest rate swap contracts |
|
Other assets |
|
|
27 |
|
|
— |
|
|
27 |
|
|
— |
|
Total financial assets |
|
|
|
$ |
75 |
|
$ |
40 |
|
$ |
30 |
|
$ |
5 |
|
Financial Liabilities: |
|
|
|
|
|
|
|
|
|
|
|
|
|
|
|
Fuel swap contracts |
|
Other accrued liabilities |
|
$ |
— |
|
$ |
— |
|
$ |
— |
|
$ |
— |
|
Interest rate swap contracts |
|
Other long-term obligations |
|
|
4 |
|
|
— |
|
|
4 |
|
|
— |
|
Total financial liabilities |
|
|
|
$ |
4 |
|
$ |
— |
|
$ |
4 |
|
$ |
— |
A reconciliation of the beginning and ending fair values of financial instruments valued using significant unobservable inputs (Level 3) on a recurring basis is presented as follows:
|
|
|||||
|
|
Fuel Swap |
||||
|
|
Contract |
||||
|
|
Assets |
||||
|
(In millions) |
(Liabilities) |
Location of Loss included in Earnings |
|||
|
Balance as of December 31, 2015 |
$ |
(4) | |||
|
Total (losses) gains (realized and unrealized) |
|||||
|
Included in earnings |
(4) |
Cost of services rendered and products sold |
|||
|
Included in other comprehensive income |
8 | ||||
|
Settlements |
4 | ||||
|
Balance as of December 31, 2016 |
5 | ||||
|
Total gains (losses) (realized and unrealized) |
|||||
|
Included in earnings |
3 |
Cost of services rendered and products sold |
|||
|
Included in other comprehensive income |
(2) | ||||
|
Settlements |
(3) | ||||
|
Balance as of December 31, 2017 |
$ |
3 | |||
87
The following tables present information relating to the significant unobservable inputs of the Company’s Level 3 financial instruments:
|
|
|
|
|
|
|
|
|
|
|
|
|
|
|
|
|
|
|
|
|
|
|
|
|
|
|
|
|
|
|
Fair Value |
|
Valuation |
|
|
|
|
|
Weighted |
||
|
|
|
(in millions) |
|
Technique |
|
Unobservable Input |
|
Range |
|
Average |
||
|
As of December 31, 2017: |
|
|
|
|
|
|
|
|
|
|
|
|
|
Fuel swap contracts |
|
$ |
3 |
|
Discounted Cash Flows |
|
Forward Unleaded Price per Gallon(1) |
|
$2.43 - $2.90 |
|
$ |
2.66 |
|
|
|
|
|
|
|
|
|
|
|
|
|
|
|
As of December 31, 2016: |
|
|
|
|
|
|
|
|
|
|
|
|
|
Fuel swap contracts |
|
$ |
5 |
|
Discounted Cash Flows |
|
Forward Unleaded Price per Gallon(1) |
|
$2.31 - $2.85 |
|
$ |
2.55 |
___________________________________
|
(1) |
Forward prices per gallon were derived from third-party market data providers. A decrease in the forward price would result in a decrease in the fair value of the fuel swap contracts. |
The Company uses derivative financial instruments to manage risks associated with changes in fuel prices and interest rates. The Company does not hold or issue derivative financial instruments for trading or speculative purposes. In designating its derivative financial instruments as hedging instruments under accounting standards for derivative instruments, the Company formally documents the relationship between the hedging instrument and the hedged item, as well as the risk management objective and strategy for the use of the hedging instrument. This documentation includes linking the derivatives to forecasted transactions. The Company assesses at the time a derivative contract is entered into, and at least quarterly thereafter, whether the derivative item is effective in offsetting the projected changes in cash flows of the associated forecasted transactions. All of the Company’s designated hedging instruments are classified as cash flow hedges.
The Company has historically hedged a significant portion of its annual fuel consumption. The Company has also historically hedged the interest payments on a portion of its variable rate debt through the use of interest rate swap agreements. All of the Company’s fuel swap contracts and interest rate swap contracts are classified as cash flow hedges, and, as such, the hedging instruments are recorded on the consolidated statements of financial position as either an asset or liability at fair value, with the effective portion of changes in the fair value attributable to the hedged risks recorded in accumulated other comprehensive income. Any change in the fair value of the hedging instrument resulting from ineffectiveness, as defined by accounting standards, is recognized in current period earnings. Cash flows related to fuel and interest rate derivatives are classified as operating activities in the consolidated statements of cash flows.
Ineffective portions of derivative instruments designated in accordance with accounting standards as cash flow hedge relationships were insignificant during the 12 months ended December 31, 2017, 2016 and 2015. As of December 31, 2017, the Company had fuel swap contracts to pay fixed prices for fuel with an aggregate notional amount of $30 million, maturing through 2018. Under the terms of its fuel swap contracts, the Company is required to post collateral in the event that the fair value of the contracts exceeds a certain agreed upon liability level and in other circumstances required by the counterparty. As of December 31, 2017, the Company had posted $2 million in letters of credit as collateral under its fuel hedging program, which were issued under the Revolving Credit Facility.
The effective portion of the gain or loss on derivative instruments designated and qualifying as cash flow hedging instruments is recorded in accumulated other comprehensive income. These amounts are reclassified into earnings in the same period or periods during which the hedged forecasted debt interest settlement or the fuel settlement affects earnings. See Note 13 to the consolidated financial statements for the effective portion of the gain or loss on derivative instruments recorded in accumulated other comprehensive income and for the amounts reclassified out of accumulated other comprehensive income and into earnings. The amount expected to be reclassified into earnings during the next 12 months includes unrealized gains and losses related to open fuel hedges and interest rate swaps. Specifically, as the underlying forecasted transactions occur during the next 12 months, the hedging gains and losses in accumulated other comprehensive income expected to be recognized in earnings is a gain of $1 million, net of tax, as of December 31, 2017. The amounts that are ultimately reclassified into earnings will be based on actual fuel prices and interest rates at the time the positions are settled and may differ materially from the amount noted above.
88
Note 18. Earnings Per Share
Basic earnings per share is computed by dividing net income by the weighted-average number of shares of common stock outstanding. Diluted earnings per share is computed by dividing net income by the weighted-average number of shares of common stock outstanding during the period, increased to include the number of shares of common stock that would have been outstanding had potential dilutive shares of common stock been issued. The dilutive effect of stock options, RSUs and performance shares are reflected in diluted net income per share by applying the treasury stock method.
A reconciliation of the amounts included in the computation of basic earnings per share from continuing operations and diluted earnings per share from continuing operations is as follows:
|
|
|||||||||
|
|
Year Ended December 31, |
||||||||
|
(In millions, except per share data) |
2017 |
2016 |
2015 |
||||||
|
Income from continuing operations |
$ |
509 |
$ |
155 |
$ |
162 | |||
|
Weighted-average common shares outstanding |
134.4 | 135.3 | 135.0 | ||||||
|
Effect of dilutive securities: |
|||||||||
|
RSUs |
0.1 | 0.2 | 0.2 | ||||||
|
Stock options(1) |
0.9 | 1.8 | 1.4 | ||||||
|
Weighted-average common shares outstanding - assuming dilution |
135.4 | 137.3 | 136.6 | ||||||
|
Basic earnings per share from continuing operations |
$ |
3.79 |
$ |
1.15 |
$ |
1.20 | |||
|
Diluted earnings per share from continuing operations |
$ |
3.76 |
$ |
1.13 |
$ |
1.19 | |||
___________________________________
|
(1) |
Options to purchase 0.8 million, 0.9 million, and 0.3 million shares for the years ended December 31, 2017, 2016 and 2015, respectively, were not included in the diluted earnings per share calculation because their effect would have been anti-dilutive. |
Note 19. Subsequent Events
On February 26, 2018, we entered into an agreement to purchase Copesan Services, Inc. for a preliminary purchase price of approximately $150 million, comprised of approximately $100 million due at closing and $50 million due on the third anniversary of closing. This transaction is expected to enhance our Terminix national account pest control operations and expand our commercial pest management portfolio. This transaction is expected to be completed in the first half of calendar year 2018. The closing of the transaction is subject to satisfaction of customary conditions, including obtaining regulatory approval, which we expect to receive.
89
REPORT OF INDEPENDENT REGISTERED PUBLIC ACCOUNTING FIRM
To the Board of Directors and Stockholders of
ServiceMaster Global Holdings, Inc.
Memphis, Tennessee
Opinion on Internal Control over Financial Reporting
We have audited the internal control over financial reporting of ServiceMaster Global Holdings, Inc. and subsidiaries (the “Company”) as of December 31, 2017, based on criteria established in Internal Control — Integrated Framework (2013) issued by the Committee of Sponsoring Organizations of the Treadway Commission (COSO). In our opinion, the Company maintained, in all material respects, effective internal control over financial reporting as of December 31, 2017, based on criteria established in Internal Control — Integrated Framework (2013) issued by COSO.
We have also audited, in accordance with the standards of the Public Company Accounting Oversight Board (United States) (PCAOB),the consolidated financial statements and financial statement schedule as of and for the year ended December 31, 2017, of the Company and our report dated February 28, 2018, expressed an unqualified opinion on those financial statements.
Basis for Opinion
The Company’s management is responsible for maintaining effective internal control over financial reporting and for its assessment of the effectiveness of internal control over financial reporting, included in the accompanying Management’s Report on Internal Control over Financial Reporting. Our responsibility is to express an opinion on the Company’s internal control over financial reporting based on our audit. We are a public accounting firm registered with the PCAOB and are required to be independent with respect to the Company in accordance with the U.S. federal securities laws and the applicable rules and regulations of the Securities and Exchange Commission and the PCAOB.
We conducted our audit in accordance with the standards of the PCAOB. Those standards require that we plan and perform the audit to obtain reasonable assurance about whether effective internal control over financial reporting was maintained in all material respects. Our audit included obtaining an understanding of internal control over financial reporting, assessing the risk that a material weakness exists, testing and evaluating the design and operating effectiveness of internal control based on the assessed risk, and performing such other procedures as we considered necessary in the circumstances. We believe that our audit provides a reasonable basis for our opinion.
Definition and Limitations of Internal Control over Financial Reporting
A company’s internal control over financial reporting is a process designed to provide reasonable assurance regarding the reliability of financial reporting and the preparation of financial statements for external purposes in accordance with generally accepted accounting principles. A company’s internal control over financial reporting includes those policies and procedures that (1) pertain to the maintenance of records that, in reasonable detail, accurately and fairly reflect the transactions and dispositions of the assets of the company; (2) provide reasonable assurance that transactions are recorded as necessary to permit preparation of financial statements in accordance with generally accepted accounting principles, and that receipts and expenditures of the company are being made only in accordance with authorizations of management and directors of the company; and (3) provide reasonable assurance regarding prevention or timely detection of unauthorized acquisition, use, or disposition of the company’s assets that could have a material effect on the financial statements.
Because of its inherent limitations, internal control over financial reporting may not prevent or detect misstatements. Also, projections of any evaluation of effectiveness to future periods are subject to the risk that controls may become inadequate because of changes in conditions, or that the degree of compliance with the policies or procedures may deteriorate.
/s/ Deloitte & Touche LLP
Memphis, Tennessee
February 28, 2018
90
Quarterly Operating Results (Unaudited)
Quarterly operating results for the last two years are shown in the table below. As discussed in the “Advertising” section in the Significant Accounting Policies, on an interim basis, certain advertising costs are deferred and recognized approximately in proportion to revenue over the year and are not deferred beyond the calendar year-end. Full year results are not affected.
|
|
||||||||||||||||
|
|
2017 |
|||||||||||||||
|
|
First |
Second |
Third |
Fourth |
||||||||||||
|
(in millions, except per share data) |
Quarter |
Quarter |
Quarter |
Quarter |
Year |
|||||||||||
|
Operating Revenue |
$ |
643 |
$ |
807 |
$ |
797 |
$ |
666 |
$ |
2,912 | ||||||
|
Gross Profit |
297 | 392 | 377 | 294 | 1,360 | |||||||||||
|
Income from Continuing Operations(1) |
38 | 85 | 80 | 306 | 509 | |||||||||||
|
Gain (loss) from Discontinued Operations, net of income taxes |
— |
— |
— |
— |
— |
|||||||||||
|
Net Income(1) |
39 | 85 | 80 | 306 | 510 | |||||||||||
|
Basic earnings per share: |
||||||||||||||||
|
Income from Continuing Operations |
0.28 | 0.64 | 0.60 | 2.26 | 3.79 | |||||||||||
|
Gain (loss) from Discontinued Operations, net of income taxes |
— |
— |
— |
— |
— |
|||||||||||
|
Net Income |
0.29 | 0.64 | 0.60 | 2.26 | 3.79 | |||||||||||
|
Diluted earnings per share: |
||||||||||||||||
|
Income from Continuing Operations |
0.28 | 0.63 | 0.59 | 2.26 | 3.76 | |||||||||||
|
Gain (loss) from Discontinued Operations, net of income taxes |
— |
— |
— |
— |
— |
|||||||||||
|
Net Income |
0.29 | 0.63 | 0.59 | 2.26 | 3.76 | |||||||||||
|
|
||||||||||||||||
|
|
||||||||||||||||
|
|
2016 |
|||||||||||||||
|
|
First |
Second |
Third |
Fourth |
||||||||||||
|
(in millions, except per share data) |
Quarter |
Quarter |
Quarter |
Quarter |
Year |
|||||||||||
|
Operating Revenue |
$ |
608 |
$ |
747 |
$ |
758 |
$ |
633 |
$ |
2,746 | ||||||
|
Gross Profit |
284 | 368 | 358 | 288 | 1,298 | |||||||||||
|
Income from Continuing Operations(1) |
39 | 16 | 70 | 31 | 155 | |||||||||||
|
Loss from Discontinued Operations, net of income taxes |
— |
— |
— |
— |
(1) | |||||||||||
|
Net Income(1) |
39 | 16 | 70 | 31 | 155 | |||||||||||
|
Basic earnings per share: |
||||||||||||||||
|
Income from Continuing Operations |
0.29 | 0.11 | 0.52 | 0.23 | 1.15 | |||||||||||
|
Loss from Discontinued Operations, net of income taxes |
— |
— |
— |
— |
— |
|||||||||||
|
Net Income |
0.28 | 0.12 | 0.52 | 0.23 | 1.14 | |||||||||||
|
Diluted earnings per share: |
||||||||||||||||
|
Income from Continuing Operations |
0.28 | 0.11 | 0.51 | 0.23 | 1.13 | |||||||||||
|
Loss from Discontinued Operations, net of income taxes |
— |
— |
— |
— |
— |
|||||||||||
|
Net Income |
0.28 | 0.11 | 0.51 | 0.23 | 1.13 | |||||||||||
91
|
(1) |
The results include restructuring charges primarily related to the American Home Shield spin-off, an initiative to enhance capabilities and reduce costs in the Company’s corporate functions, severance costs related to the former CEO and other executives and costs related to the relocation of the Company’s corporate headquarters, which we refer to as our Global Service Center. The table below summarizes the pre-tax and after-tax restructuring charges, by quarter, for 2017 and 2016. |
|
|
|||||||||||||||
|
|
2017 |
||||||||||||||
|
|
First |
Second |
Third |
Fourth |
|||||||||||
|
(in millions) |
Quarter |
Quarter |
Quarter |
Quarter |
Year |
||||||||||
|
Pre-tax |
$ |
2 |
$ |
1 |
$ |
21 |
$ |
10 |
$ |
34 | |||||
|
After-tax |
$ |
1 |
$ |
1 |
$ |
14 |
$ |
8 |
$ |
24 | |||||
|
|
|||||||||||||||
|
|
2016 |
||||||||||||||
|
|
First |
Second |
Third |
Fourth |
|||||||||||
|
(in millions) |
Quarter |
Quarter |
Quarter |
Quarter |
Year |
||||||||||
|
Pre-tax |
$ |
1 |
$ |
4 |
$ |
8 |
$ |
4 |
$ |
17 | |||||
|
After-tax |
$ |
1 |
$ |
3 |
$ |
5 |
$ |
2 |
$ |
11 | |||||
The results for the third and fourth quarters of 2017 include charges of $7 million ($5 million, net of tax) and $6 million ($4 million, net of tax), respectively, related to the American Home Shield spin-off.
The results for the first, third and fourth quarters of 2017 include $1 million ($1 million, net of tax), $11 million ($8 million, net of tax) and $1 million ($1 million, net of tax), respectively, of severance costs and stock-based compensation expense.
The results for the first, second third and fourth quarters of 2017 includes charges of $1 million ($0 million, net of tax), $1 million ($0 million, net of tax), $3 million ($2 million, net of tax) and $1 million ($1 million, net of tax), respectively, of Global Service Center relocation costs.
The results for the fourth quarter of 2017 includes $3 million ($2 million, net of tax) of a benefit related to the reversal of expenses accrued related to the 401(k) Plan. The results for the second and fourth quarters of 2016 includes charges of $1 million ($1 million, net of tax) and $1 million ($0 million, net of tax), respectively, related to the 401(k) Plan.
The results for the fourth quarter of 2017 include charges of $4 million ($4 million, net of tax) for fumigation related matters. The results for the first, second and third quarters of 2016 include charges of $3 million ($3 million, net of tax), $88 million ($54 million, net of tax) and $1 million ($1 million, net of tax), respectively, for fumigation related matters.
The results for the second and third quarters include losses on extinguishment of debt of $3 million ($1 million, net of tax) and $3 million ($1 million, net of tax) related to partial repurchases of the Company’s 2038 Notes. The results for the fourth quarter of 2016 includes a loss on extinguishment of debt of $32 million ($20 million, net of tax) related to the repayment of the Old Credit Facilities.
The results for the first quarter of 2016 includes a gain of $1 million ($0 million, net of tax) associated with the branch conversions.
The results for the second quarter of 2016 includes a charge of $23 million ($15 million, net of tax) related to an insurance reserve adjustment.
92
ITEM 9. CHANGES IN AND DISAGREEMENTS WITH ACCOUNTANTS ON ACCOUNTING AND FINANCIAL DISCLOSURE
None.
ITEM 9A. CONTROLS AND PROCEDURES
Evaluation of disclosure controls and procedures
The Company’s CEO, Nikhil M. Varty, and Senior Vice President and CFO, Anthony D. DiLucente, have evaluated the Company’s disclosure controls and procedures (as defined in Rule 13a-15(e) and Rule 15d-15(e) under the Exchange Act) as of the end of the period covered by this Annual Report on Form 10-K as required by Rule 13a-15(b) and Rule 15d-15(b) under the Exchange Act. Messrs. Varty and DiLucente have concluded that both the design and operation of the Company’s disclosure controls and procedures were effective as of December 31, 2017.
Changes in internal control over financial reporting
No changes in the Company’s internal control over financial reporting, as defined in Rule 13a-15(f) or Rule 15d-15(f) under the Exchange Act, occurred during the fourth quarter of fiscal 2017 that has materially affected, or is reasonably likely to materially affect, the Company’s internal control over financial reporting.
Management’s Report on Internal Control over Financial Reporting
The Company’s management is responsible for establishing and maintaining adequate internal controls over financial reporting. The Company’s internal control over financial reporting is a process designed to provide reasonable assurance regarding the reliability of financial reporting and the preparation and fair presentation of published financial statements.
All internal control systems, no matter how well designed, have inherent limitations. Therefore, even those systems determined to be effective can provide only reasonable assurance with respect to financial statement preparation and presentation.
The Company’s management assessed, under the supervision and with the participation of the Company’s CEO, Nikhil M. Varty, and Senior Vice President and CFO, Anthony D. Dilucente, the effectiveness of its internal control over financial reporting as of December 31, 2017. In making this assessment, management used the criteria set forth by the Committee of Sponsoring Organizations of the Treadway Commission in Internal Control—Integrated Framework (2013). Based on this assessment, management concluded that, as of December 31, 2017, the Company’s internal control over financial reporting is effective based on those criteria.
The Company’s independent registered public accounting firm, Deloitte & Touche LLP, has audited the effectiveness of the Company’s internal control over financial reporting as of December 31, 2017 and has expressed an unqualified opinion in their report which is included herein.
Effective March 1, 2018, the Company’s address for its corporate headquarters, which we refer to as our Global Service Center, will be 150 Peabody Place, Memphis, Tennessee 38103.
93
ITEM 10. DIRECTORS, EXECUTIVE OFFICERS AND CORPORATE GOVERNANCE
The information required by this Item for the Company will be set forth in Company’s Proxy Statement for the 2018 Annual Meeting of Stockholders, which information is hereby incorporated herein by reference.
ITEM 11. EXECUTIVE COMPENSATION
The information required by this Item for the Company will be set forth in Company’s Proxy Statement for the 2018 Annual Meeting of Stockholders, which information is hereby incorporated herein by reference.
ITEM 12. SECURITY OWNERSHIP OF CERTAIN BENEFICIAL OWNERS AND MANAGEMENT AND RELATED STOCKHOLDER MATTERS
The information required by this Item for the Company will be set forth in Company’s Proxy Statement for the 2018 Annual Meeting of Stockholders, which information is hereby incorporated herein by reference.
ITEM 13. CERTAIN RELATIONSHIPS AND RELATED TRANSACTIONS, AND DIRECTOR INDEPENDENCE
The information required by this Item for the Company will be set forth in Company’s Proxy Statement for the 2018 Annual Meeting of Stockholders, which information is hereby incorporated herein by reference.
ITEM 14. PRINCIPAL ACCOUNTING FEES AND SERVICES
The information required by this Item for the Company will be set forth in Company’s Proxy Statement for the 2018 Annual Meeting of Stockholders, which information is hereby incorporated herein by reference.
ITEM 15. EXHIBITS AND FINANCIAL STATEMENT SCHEDULES
(a). Financial Statements, Schedules and Exhibits.
1. Financial Statements
|
|
|
|
|
|
|
58 |
||
|
|
|||
|
|
60 | ||
|
|
61 | ||
|
|
62 | ||
|
|
63 | ||
|
2. Exhibits |
95 |
||
The exhibits filed with this report are listed on the Exhibit Index. Entries marked by the symbol # next to the exhibit’s number identify management compensatory plans, contracts or arrangements.
3. Financial Statements Schedules
The following information is filed as part of this Annual Report on Form 10-K and should be read in conjunction with the financial statements contained in Item 8 of this Annual Report on Form 10-K:
None.
94
|
|
|
|
|
Exhibit Number |
|
Description |
|
|
|
|
| 2.1 |
|
|
|
|
|
|
| 3.1 |
|
|
|
|
|
|
| 3.2 |
|
|
|
|
|
|
| 4.1 |
|
|
|
|
|
|
| 4.2 |
|
|
|
|
|
|
| 4.3 |
|
|
|
|
|
|
| 4.4 |
|
|
|
|
|
|
| 4.5 |
|
|
|
|
|
|
| 4.6 |
|
|
|
|
|
|
| 4.7 |
|
|
|
|
|
|
| 4.8 |
|
|
|
|
|
|
| 4.9 |
|
|
|
|
|
|
95
| 4.10 |
|
|
|
|
|
|
| 4.11 |
|
|
|
|
|
|
| 4.12 |
|
|
|
|
|
|
| 4.13 |
|
|
|
|
|
|
| 10.1 |
|
|
|
|
|
|
| 10.2 |
|
|
|
|
|
|
| 10.3 |
|
|
|
|
|
|
| 10.4 |
|
|
|
|
|
|
| 10.5 |
|
|
|
|
|
|
| 10.6 |
# |
|
|
|
|
|
| 10.7 |
# |
|
|
|
|
|
| 10.8 |
# |
|
|
|
|
|
96
| 10.9 |
# |
|
|
|
|
|
| 10.10 |
# |
|
|
|
|
|
| 10.11 |
# |
|
|
|
|
|
| 10.12 |
# |
|
|
|
|
|
| 10.13 |
# |
|
|
|
|
|
| 10.14 |
# |
|
|
|
|
|
| 10.15 |
# |
|
|
|
|
|
| 10.16 |
|
|
|
|
|
|
| 10.17 |
* |
Schedule of Signatories to a Director Indemnification Agreement. |
|
|
|
|
| 10.18 |
# |
|
|
|
|
|
| 10.19 |
# |
|
|
|
|
|
| 10.20 |
# |
|
|
|
|
|
| 10.21 |
# |
|
|
|
|
|
| 10.22 |
# |
|
|
|
|
|
| 10.23 |
# |
|
|
|
|
|
97
| 10.24 |
# |
|
|
|
|
|
| 10.25 |
# |
|
|
|
|
|
| 10.26 |
# |
|
|
|
|
|
| 10.27 |
# |
|
|
|
|
|
| 10.28 |
# |
|
|
|
|
|
| 10.29 |
# |
|
|
|
|
|
| 10.30 |
# |
|
|
|
|
|
| 10.31 |
# |
|
|
|
|
|
| 10.32 |
# |
|
|
|
|
|
| 10.33 |
# |
|
|
|
|
|
| 10.34 |
# |
|
|
|
|
|
| 10.35 |
# |
|
|
|
|
|
| 10.36 |
# |
|
|
|
|
|
98
| 10.37 |
# |
|
|
|
|
|
| 10.38 |
# |
|
|
|
|
|
| 10.39 |
# |
|
|
|
|
|
| 10.40 |
# |
|
|
|
|
|
| 10.41 |
#* |
Separation Agreement and General Release entered into with Martin Wick, dated December 31, 2017. |
|
|
|
|
| 12 |
* |
Statement regarding Computation of Ratio of Earnings to Fixed Charges as of December 31, 2017. |
|
|
|
|
| 21 |
* |
|
|
|
|
|
| 23 |
* |
|
|
|
|
|
| 31.1 |
* |
|
|
|
|
|
| 31.2 |
* |
|
|
|
|
|
| 32.1 |
* |
|
|
|
|
|
| 32.2 |
* |
|
|
|
|
|
|
101.INS |
* |
XBRL Instance Document |
|
|
|
|
|
101.SCH |
* |
XBRL Taxonomy Extension Schema |
|
|
|
|
|
101.CAL |
* |
XBRL Taxonomy Extension Calculation Linkbase |
|
|
|
|
|
101.DEF |
* |
XBRL Taxonomy Extension Definition Linkbase |
|
|
|
|
|
101.LAB |
* |
XBRL Taxonomy Extension Label Linkbase |
|
|
|
|
|
101.PRE |
* |
XBRL Extension Presentation Linkbase |
|
|
|
|
________________________________________________________
#Denotes management compensatory plans, contracts or arrangements.
*Filed herewith.
99
Pursuant to the requirements of Section 13 and 15(d) of the Securities Exchange Act of 1934, ServiceMaster Global Holdings, Inc. has duly caused this report to be signed on its behalf by the undersigned, thereunto duly authorized.
|
|
SERVICEMASTER GLOBAL HOLDINGS, INC. |
||
|
|
|||
|
Date: February 28, 2018 |
By: |
/s/ NIKHIL M. VArty |
|
|
|
|
Name: |
Nikhil M. Varty |
|
|
|
Title: |
Chief Executive Officer |
Pursuant to the requirements of the Securities Exchange Act of 1934, this report has been signed below by the following persons on behalf of the registrants and in the capacities and on the dates indicated.
|
|
|||
|
Date: February 28, 2018 |
By: |
/s/ Mark E. Tomkins |
|
|
|
|
Name: |
Mark E. Tomkins |
|
|
|
Title: |
Director, Chairman of the Board |
|
|
|||
|
Date: February 28, 2018 |
By: |
/s/ NIKHIL M. VArty |
|
|
|
|
Name: |
Nikhil M. Varty |
|
|
|
Title: |
Chief Executive Officer and Director (Principal Executive Officer) |
|
|
|||
|
Date: February 28, 2018 |
By: |
/s/ Anthony D. DiLucente |
|
|
|
|
Name: |
Anthony D. DiLucente |
|
|
|
Title: |
Senior Vice President and Chief Financial Officer (Principal Financial Officer) |
|
|
|||
|
Date: February 28, 2018 |
By: |
/s/ John P. Mullen |
|
|
|
|
Name: |
John P. Mullen |
|
|
|
Title: |
Vice President, Controller and Chief Accounting Officer (Principal Accounting Officer) |
|
|
|||
|
Date: February 28, 2018 |
By: |
/s/ Peter L. Cella |
|
|
|
|
Name: |
Peter L. Cella |
|
|
|
Title: |
Director |
|
|
|||
|
Date: February 28, 2018 |
By: |
/s/ John B. Corness |
|
|
|
|
Name: |
John B. Corness |
|
|
|
Title: |
Director |
|
|
|||
|
Date: February 28, 2018 |
By: |
/s/ Naren K. Gursahaney |
|
|
|
|
Name: |
Naren K. Gursahaney |
|
|
|
Title: |
Director |
|
|
|||
|
Date: February 28, 2018 |
By: |
/s/ Richard P. Fox |
|
|
|
|
Name: |
Richard P. Fox |
|
|
|
Title: |
Director |
|
|
|||
|
Date: February 28, 2018 |
By: |
/s/ Laurie Ann Goldman |
|
|
|
|
Name: |
Laurie Ann Goldman |
|
|
|
Title: |
Director |
|
|
|||
|
Date: February 28, 2018 |
By: |
/s/ Stephan J. Sedita |
|
|
|
|
Name: |
Stephan J. Sedita |
|
|
|
Title: |
Director |
|
|
|||
|
|
|||
100
SCHEDULE II
SERVICEMASTER GLOBAL HOLDINGS, INC.
Valuation and Qualifying Accounts
(In millions)
|
|
||||||||||||
|
|
Additions |
|||||||||||
|
|
Balance at |
Charged to |
Balance at |
|||||||||
|
|
Beginning of |
Costs and |
End of |
|||||||||
|
|
Period |
Expenses |
Deductions(1) |
Period |
||||||||
|
As of and for the year ending December 31, 2017: |
||||||||||||
|
Continuing Operations— |
||||||||||||
|
Allowance for doubtful accounts |
||||||||||||
|
Accounts receivable |
$ |
21 |
$ |
42 |
$ |
40 |
$ |
22 | ||||
|
Notes receivable |
2 |
— |
— |
1 | ||||||||
|
Income tax valuation allowance |
7 | 4 |
— |
11 | ||||||||
|
As of and for the year ending December 31, 2016: |
||||||||||||
|
Continuing Operations— |
||||||||||||
|
Allowance for doubtful accounts |
||||||||||||
|
Accounts receivable |
$ |
21 |
$ |
39 |
$ |
39 |
$ |
21 | ||||
|
Notes receivable |
2 |
— |
1 | 2 | ||||||||
|
Income tax valuation allowance |
7 | 2 | 2 | 7 | ||||||||
|
As of and for the year ending December 31, 2015: |
||||||||||||
|
Continuing Operations— |
||||||||||||
|
Allowance for doubtful accounts |
||||||||||||
|
Accounts receivable |
$ |
22 |
$ |
35 |
$ |
36 |
$ |
21 | ||||
|
Notes receivable |
3 |
— |
1 | 2 | ||||||||
|
Income tax valuation allowance |
7 | 1 | 2 | 7 | ||||||||
___________________________________
|
(1) |
Deductions in the allowance for doubtful accounts for accounts and notes receivable reflect write-offs of uncollectible accounts. Deductions for the income tax valuation allowance in 2017, 2016 and 2015 are primarily attributable to the reduction of net operating loss carryforwards and other deferred tax assets related to the uncertainty of future taxable income in certain jurisdictions. |
101