Attached files
| file | filename |
|---|---|
| EX-23 - EX-23 - TERMINIX GLOBAL HOLDINGS INC | serv-20151231xex23.htm |
| EX-32.2 - EX-32.2 - TERMINIX GLOBAL HOLDINGS INC | serv-20151231xex322.htm |
| EX-31.1 - EX-31.1 - TERMINIX GLOBAL HOLDINGS INC | serv-20151231xex311.htm |
| EX-31.2 - EX-31.2 - TERMINIX GLOBAL HOLDINGS INC | serv-20151231xex312.htm |
| EX-32.1 - EX-32.1 - TERMINIX GLOBAL HOLDINGS INC | serv-20151231xex321.htm |
| EX-21 - EX-21 - TERMINIX GLOBAL HOLDINGS INC | serv-20151231ex2118796bd.htm |
| EX-12 - EX-12 - TERMINIX GLOBAL HOLDINGS INC | serv-20151231ex123b40a42.htm |
| EX-10.31 - EX-10.31 - TERMINIX GLOBAL HOLDINGS INC | serv-20151231ex1031483cc.htm |
UNITED STATES
SECURITIES AND EXCHANGE COMMISSION
WASHINGTON, D.C. 20549
________________________________________________
FORM 10-K
________________________________________________
|
☒ |
ANNUAL REPORT PURSUANT TO SECTION 13 OR 15(d) OF THE SECURITIES EXCHANGE ACT OF 1934 |
For the fiscal year ended December 31, 2015
or
|
☐ |
TRANSITION REPORT PURSUANT TO SECTION 13 OR 15(d) OF THE SECURITIES EXCHANGE ACT OF 1934 |
Commission file number 001-36507
________________________________________________
ServiceMaster Global Holdings, Inc.
(Exact name of registrant as specified in its charter)
|
Delaware |
|
20-8738320 |
|
(State or other jurisdiction of incorporation or organization) |
|
(IRS Employer Identification No.) |
860 Ridge Lake Boulevard, Memphis, Tennessee 38120
(Address of principal executive offices) (Zip Code)
901-597-1400
(Registrant’s telephone number, including area code)
Securities registered pursuant to Section 12 (b) of the Act:
|
Common stock, par value $0.01 per share |
|
New York Stock Exchange |
|
(Title of Each Class) |
|
(Name of Each Exchange on which Registered) |
Securities registered pursuant to Section 12 (g) of the Act:
|
|
|
None |
|
|
|
(Title of class) |
Indicate by check mark if the registrant is a well-known seasoned issuer, as defined in Rule 405 of the Securities Act. Yes ☒ No ☐
Indicate by check mark if the registrant is not required to file reports pursuant to Section 13 or Section 15(d) of the Act. Yes ☐ No ☒
Indicate by check mark whether the registrant (1) has filed all reports required to be filed by Section 13 or 15(d) of the Securities Exchange Act of 1934 during the preceding 12 months (or for such shorter period that the registrant was required to file such reports), and (2) has been subject to such filing requirements for the past 90 days.
|
|
Yes ☒ No ☐ |
Indicate by check mark whether the registrant has submitted electronically and posted on its corporate Web site, if any, every Interactive Data File required to be submitted and posted pursuant to Rule 405 of Regulation S-T during the preceding 12 months (or for such shorter period that the registrant was required to submit and post such files).
|
|
Yes ☒ No ☐ |
Indicate by check mark if disclosure of delinquent filers pursuant to Item 405 of Regulation S-K is not contained herein, and will not be contained, to the best of the registrant’s knowledge, in definitive proxy or information statements incorporated by reference in Part III of this Form 10-K or any amendment to this Form 10-K. ☒
1
Indicate by check mark whether the registrant is a large accelerated filer, an accelerated filer, a non-accelerated filer, or a smaller reporting company. See definitions of “large accelerated filer,” “accelerated filer,” and “smaller reporting company” in Rule 12b-2 of the Exchange Act.
|
|
|
|
|
|
Large accelerated filer ☒ |
Accelerated filer ☐ |
Non-accelerated filer ☐ |
Smaller reporting company ☐ |
|
(Do not check if a smaller reporting company) |
Indicate by check mark whether the registrant is a shell company (as defined in Rule 12b-2 of the Exchange Act).
|
|
Yes ☐ No ☒ |
As of June 30, 2015, there were 135,146,287 shares of the registrant’s common stock outstanding, and the aggregate market value of the voting stock held by non-affiliates (assuming only for purposes of this computation that the CD&R Funds and the StepStone Funds (each as defined below), directors and executive officers may be affiliates) was approximately $3,814 million based on the closing price of common stock on the NYSE on June 30, 2015 of $36.17 per share.
The number of shares of the registrant’s common stock outstanding as of February 19, 2016: 135,575,559 shares of common stock, par value $0.01 per share.
Documents incorporated by reference:
Portions of the registrant’s proxy statement to be filed with the Securities and Exchange Commission in connection with the registrant’s 2015 annual meeting of stockholders (the “Proxy Statement”) are incorporated by reference into Part III hereof. Such Proxy Statement will be filed within 120 days of the registrant’s fiscal year ended December 31, 2015.
2
3
PART I
The following discussion of our business contains “forward-looking statements,” as discussed in Part II, Item 7 below. Our business, operations and financial condition are subject to various risks as set forth in Part I, Item 1A below. The following information should be read in conjunction with Management’s Discussion and Analysis of Financial Condition and Results of Operations, the Consolidated Financial Statements and related notes and the Risk Factors included elsewhere in this Annual Report on Form 10-K.
Overview
ServiceMaster Global Holdings, Inc. and its majority-owned subsidiary partnerships, limited liability companies and corporations (collectively, “ServiceMaster,” the “Company,” “we,” “us” and “our”) is a leading provider of essential residential and commercial services, operating through an extensive service network of more than 8,000 company‑owned locations and franchise and license agreements. Our mission is to simplify and improve the quality of our customers’ lives by delivering services that help them protect and maintain their homes or businesses, typically their most highly valued assets. We have leading market positions across the majority of the markets we serve, as measured by customer‑level revenue. Our portfolio of well‑recognized brands includes Terminix (termite and pest control), American Home Shield (home warranties), ServiceMaster Restore (disaster restoration), ServiceMaster Clean (janitorial), Merry Maids (residential cleaning), Furniture Medic (furniture repair) and AmeriSpec (home inspections). We serve our residential and commercial customers through an employee base of approximately 13,000 company associates.
Approximately 98 percent of our 2015 revenue was generated by sales in the United States. A significant portion of our assets is located in the United States, and the consolidated book value of all assets located outside of the United States is not material. Organized in Delaware in 2007, ServiceMaster is the successor to various entities dating back to 1947. Financial information for each reportable segment and Corporate for 2015, 2014 and 2013 is contained in Note 3 to the consolidated financial statements.
We believe that our customers understand the financial and reputational risks associated with inadequate maintenance of their homes or businesses and that our high‑quality, professional services are low‑cost expenditures when compared to the alternative of failing to perform essential maintenance. We strive to be the service provider of choice and believe our customers have recognized our value proposition, as evidenced by our long‑standing customer relationships and the high rate at which our customers renew their contracts from year to year.
We have significant size and scale, which we believe give us a number of competitive advantages. Terminix is the largest termite and pest control business in the United States, as measured by customer‑level revenue, and serves approximately 2.8 million customers across 46 states and the District of Columbia through approximately 300 company‑owned locations and approximately 25 franchise agreements. Additionally, we estimate American Home Shield to be approximately four times larger than its nearest competitors, as measured by revenue. American Home Shield serves approximately 1.6 million residential customers across all 50 states and the District of Columbia through a network of more than 11,000 pre‑screened independent home service contractor firms. Our Franchise Services Group serves both residential and commercial customers across all 50 states and the District of Columbia through approximately 4,400 franchise agreements and approximately 30 company‑owned locations. We believe our significant size and scale provide a competitive advantage in our purchasing power, route density, and marketing and operating efficiencies compared to smaller local and regional competitors. Our scale also facilitates the standardization of processes, shared learning and talent development across our entire organization.
We believe our businesses are strategically positioned to benefit from a number of favorable demographic and secular trends. These trends include growth in population, household formation and new and existing home sales. In addition, we believe there is increasing demand for outsourced services, fueled by a trend toward “do‑it‑for‑me” as a result of an aging population and shifts in household structure and behaviors, such as dual‑income families and consumers with “on‑the‑go” lifestyles.
Initial Public Offering
On June 25, 2014, our registration statement on Form S-1 for our initial public offering was declared effective by the U.S. Securities and Exchange Commission (the “SEC”). On July 1, 2014, we completed the offering of 41,285,000 shares of our common stock at a price of $17.00 per share.
Secondary Public Offerings
On February 4, 2015, our registration statement on Form S-1 was declared effective by the SEC for a secondary offering of our common stock. We registered on behalf of certain stockholders the offering and sale of 25,000,000 shares of common stock and an additional 3,750,000 shares of common stock sold to the underwriters pursuant to an option to purchase additional shares. On February 10, 2015, the selling stockholders completed the offering of 25,000,000 shares of common stock at a price of $29.50 per share. On February 13, 2015, the selling stockholders completed the offering of an additional 3,750,000 shares of common stock at a price of $29.50 per share pursuant to the underwriters’ option to purchase additional shares.
On May 27, 2015, our registration statement on Form S-1 was declared effective by the SEC for a secondary offering of our common stock. We registered on behalf of certain stockholders the offering and sale of 20,000,000 shares of common stock and an additional 3,000,000 shares of common stock sold to the underwriters pursuant to an option to purchase additional shares. On June 2,
4
2015, the selling stockholders completed the offering of 20,000,000 shares of common stock at a price of $34.00 per share. On June 12, 2015, the selling stockholders completed the offering of an additional 3,000,000 shares of common stock at a price of $34.00 per share pursuant to the underwriters’ option to purchase additional shares.
On November 5, 2015, our shelf registration statement on Form S-3 was automatically declared effective by the SEC for a secondary offering of our common stock. We registered on behalf of certain stockholders the offering and sale of 28,961,763 shares of common stock. On November 5, 2015, the selling stockholders completed the offering of 28,961,763 shares of common stock at a price of $33.91 per share.
We did not receive any of the proceeds from the aggregate 80,711,763 shares of common stock sold by the selling stockholders in 2015.
Ownership
On July 24, 2007, we were taken private pursuant to a merger transaction, and, following the completion of the merger and other subsequent transactions and prior to our initial public offering, the significant majority of our outstanding common stock was owned by investment funds managed by, or affiliated with, Clayton, Dubilier & Rice, LLC (“CD&R” or the “CD&R Funds”), JPMorgan Chase Funding Inc. (“JPMorgan”), StepStone Group LP (“StepStone”), the investment funds managed by StepStone (the “StepStone Funds”) and Ridgemont Partners Secondary Fund I, L.P. (“Ridgemont”) (collectively, the “Equity Sponsors”). Upon completion of the secondary public offerings in February, May and November 2015, the CD&R Funds and StepStone Funds no longer hold our common stock. See “—Initial Public Offering” and “—Secondary Public Offerings” for further details on our ownership structure.
Refinancing of Indebtedness
On February 17, 2015, we redeemed $190 million in aggregate principal amount of our outstanding 8% senior notes due 2020 (the “8% 2020 Notes”) at a redemption price of 106.0% of the principal amount using available cash. In connection with the partial redemption, we recorded a loss on extinguishment of debt of $13 million in the year ended December 31, 2015, which includes a pre-payment premium of $11 million and the write-off of $2 million of debt issuance costs.
On April 1, 2015, we entered into a first amendment (the “First Term Loan Amendment”) which further amends the agreement governing our $1,825 million term loan facility maturing July 1, 2021 (the “Term Loan Facility) and our $300 million revolving credit facility maturing July 1, 2019 (the “Revolving Credit Facility”) (together with the Term Loan Facility, the “Credit Facilities”). The First Term Loan Amendment provides for incremental term loans (the “April Incremental Term Loans”) under the Term Loan Facility in an aggregate principal amount of $175 million. On April 1, 2015, we used the net proceeds from the April Incremental Term Loans, together with cash on hand, to redeem the remaining outstanding $200 million in aggregate principal amount of the 8% 2020 Notes at a redemption price of 106.0% of the principal amount. In connection with the redemption, we recorded a loss on extinguishment of debt of $14 million in the year ended December 31, 2015, which includes a pre‑payment premium of $12 million and the write‑off of $2 million of debt issuance costs.
On August 17, 2015, we entered into a second amendment (the “Second Term Loan Amendment”) which amends the agreement governing the Credit Facilities. The Second Term Loan Amendment provides for incremental term loans (the “August Incremental Term Loans”) under the Term Loan Facility in an aggregate principal amount of $400 million. On August 17, 2015, we used the net proceeds from the August Incremental Term Loans, together with cash on hand, to redeem the remaining outstanding $488 million in aggregate principal amount of our outstanding 7% senior notes due 2020 (the “7% 2020 Notes”) (together with the 8% 2020 Note, the “2020 Notes”) at a redemption price of 105.25% of the principal amount. In connection with the redemption, we recorded a loss on extinguishment of debt of $31 million in the year ended December 31, 2015, which includes a pre‑payment premium of $25 million and the write-off of $6 million of debt issuance costs.
Our Market Opportunity
Termite and Pest Control Industry
The outsourced market for residential and commercial termite and pest control services in the United States was approximately $7 billion in 2014, according to Specialty Products Consultants, LLC. We estimate that there are approximately 20,000 U.S. termite and pest control companies, nearly all of which have fewer than 100 employees.
Termites are responsible for an estimated $5 billion in home damage in the United States annually, according to the National Pest Management Association. The termite control industry provides treatment and inspection services to residential and commercial property owners for the remediation and prevention of termite infestations. We believe homeowners value quality and reliability over price in choosing professional termite control services, as the cost of most professional treatments is well below the potential cost of inaction or ineffective treatment. As a result, we believe the demand for termite remediation services is relatively insulated from changes in consumer spending. In addition to remediation services, the termite control industry offers periodic termite inspections and preventative treatments to residential and commercial property owners in areas with high termite activity, typically through annual contracts. These annual contracts may carry guarantees that protect the property owner against the cost of structural damage caused by a termite infestation. Termites can cause significant damage to a structure before becoming visible to the untrained eye, highlighting
5
the value proposition of professional preventative termite services. As a result, the termite control industry experiences high renewal rates on annual preventative inspection and treatment contracts, and revenues from such contracts are generally stable and recurring.
Pest infestations may damage a home or business while also carrying the risk of the spread of diseases. Moreover, for many commercial facilities, pest control is essential to regular operations and regulatory compliance (e.g., hotels, restaurants and healthcare facilities). As a result of these dynamics, the pest control industry experiences high rates of renewal for its pest inspection and treatment contracts. Pest control services are often delivered on a contracted basis through regularly scheduled service visits, which include an inspection of premises and application of pest control materials. According to the National Pest Management Association’s 2014 survey, approximately 35 percent of U.S. households currently use a professional pest exterminator.
Both termite and pest activity are affected by weather. Termite activity peaks during the springtime “swarm,” the timing and intensity of which varies based on weather. Similarly, pest activity tends to accelerate in the spring months when warmer temperatures arrive in many U.S. regions. However, the high proportion of termite and pest control services which are contracted and recurring, as well as the high renewal rates for those services, limit the effect of weather anomalies on the termite and pest control industry in any given year.
Home Warranty Industry
We estimate that the U.S. home warranty market was approximately $2 billion in 2015. The home warranty market is characterized by low household penetration, which we estimate to be approximately four percent. The home warranty industry offers plans that protect a homeowner against costly repairs or replacement of household systems and appliances. Typically having a one‑year term, coverage varies based on a menu of plan options. The most commonly covered items include electrical, plumbing, central heating and air conditioning (HVAC) systems, water heaters, refrigerators, dishwashers and ovens/cook tops. The home warranty industry is characterized by a high level of customer interaction and service requirements. This combination of a high‑touch/high‑service business model and the peace of mind it delivers to the customer has led to high renewal rates in the home warranty industry.
As consumer demand shifts towards more outsourced services, we believe that there is an opportunity for American Home Shield, a reliable, scaled service provider with a national, pre‑screened contractor network, to increase market share and household penetration. Additionally, we believe that increasingly complex household systems and appliances may further highlight the value proposition of professional repair services and, accordingly, the coverage offered by a home warranty.
One of the drivers of sales of new home warranties is the number of existing homes sold in the United States, since a home warranty is often recommended by a real estate sales professional or offered by the seller of a home in conjunction with a real estate resale transaction. According to the National Association of Realtors, existing home resales, as measured in units, increased by approximately eight percent in 2015 compared to 2014. Approximately 20 percent of American Home Shield revenue for the year ended December 31, 2015 was tied directly to existing home resale transactions.
Key Franchise Services Group Industries
Disaster Restoration (ServiceMaster Restore). We estimate that the U.S. disaster restoration market is approximately $39 billion, approximately two‑thirds of which is related to residential customers and the remainder related to commercial customers. Most emergency response work results from emergency situations for residential and commercial customers, such as fires and flooding. Extreme weather events and natural disasters also provide demand for emergency response work. Critical factors in the selection of an emergency response firm are the firm’s reputation, relationships with insurers, available resources, proper insurance and credentials, quality of service, timeliness and responsiveness. This market is highly fragmented, with two large players, including ServiceMaster Restore, and we believe there are opportunities for growth for scaled service providers.
Janitorial (ServiceMaster Clean). We estimate that the U.S. janitorial services market was approximately $51 billion in 2015. The market is highly fragmented with more than 800,000 companies competing in the janitorial space, a significant majority of which have five or fewer employees.
Residential Cleaning (Merry Maids). We estimate that the U.S. residential professional cleaning services market was approximately $3 billion in 2015. Competition in this market comes mainly from local, independently-owned firms, and from a few national companies.
Our Competitive Strengths
#1 Market Positions in Large, Fragmented and Growing Markets. We are the leading provider of essential residential and commercial services in the majority of markets in which we operate. Our markets are generally large, growing and highly fragmented, and we believe we have significant advantages over smaller local and regional competitors. We have spent decades developing a reputation built on reliability and superior quality and service. As a result, we enjoy high unaided brand awareness and a reputation for high‑quality customer service, which serve as key drivers of our customer acquisition efforts. Our nationwide presence also allows our brands to effectively serve both local residential customers and large national commercial accounts and to capitalize on lead generation sources that include large real estate agencies, financial institutions and insurance carriers. We believe our significant size and scale also provide a competitive advantage in our purchasing power, route density, and marketing and operating efficiencies
6
compared to smaller local and regional competitors. Our scale also facilitates the standardization of processes, shared learning and talent development across our entire organization.
Diverse Revenue Streams Across Customers and Geographies. ServiceMaster is diversified in terms of customers and geographies. We operate in all 50 states and the District of Columbia. Our Terminix business, which accounted for 56 percent of our revenue in 2015, served approximately 2.8 million customers. American Home Shield, which accounted for 35 percent of our revenue in 2015, responded to more than three million service requests from approximately 1.6 million customers. Our diverse customer base and geographies help to mitigate the effect of adverse market conditions and other risks in any particular geography or customer segment we serve. We therefore believe the size and scale of our company provide us with added protection from risk relative to our smaller local and regional competitors.
High‑Value Service Offerings Resulting in High Retention and Recurring Revenues. We believe our high annual customer retention demonstrates the highly valued nature of the services we offer and the high level of execution and customer service that we provide. Many of our technicians have built long‑standing, personal relationships with their customers. We believe these personal bonds, often forged over decades, help to drive customer loyalty and retention. As a result of our high retention and long‑standing customer relationships, we enjoy significant visibility and stability in our business, and these factors limit the effect of adverse economic cycles on our revenue base. We experienced these advantages during the most recent economic downturn, when we were able to grow revenue in each year from 2008 to 2015.
Multi‑Channel Marketing Approach Supported by Sophisticated Customer Analytic Modeling Capabilities. Our multi‑channel marketing approach focuses on building the value of our brands and generating revenue by understanding the decisions customers make at each stage in the purchase of residential and commercial services. The effectiveness of our marketing efforts is demonstrated by an increase in lead generation and online sales, as well as an improvement in close rates over the last few years. For example, in our direct‑to‑consumer channel at American Home Shield, new home warranty lead generation, marketing yield and close rates have benefited from increased spending on marketing as well as improved digital marketing. We have also been deploying increasingly sophisticated customer analytics models that allow us to more effectively segment our prospective customers and tailor campaigns towards them. In addition, we are seeing success with newer ways of reaching and marketing to consumers via content marketing, promotions and social media channels.
Operational and Customer Service Excellence Driven by Superior People Development. We are constantly focused on improving customer service. The customer experience is at the foundation of our business model, and we believe that each employee is an extension of ServiceMaster’s reputation. We employ rigorous hiring and training practices and continuously analyze our operating metrics to identify potential improvements in service and productivity. Technicians in our Terminix branches have an average tenure of seven years, creating continuity in customer relationships and ensuring the development of best practices based on on‑the‑ground experience. We also provide our field personnel with access to sophisticated data management and mobility tools which enable them to drive efficiencies, improve customer service and ultimately grow our customer base and profitability.
Resilient Financial Model with Track Record of Consistent Performance.
|
· |
Solid revenue and Adjusted EBITDA growth through business cycles. Our consolidated revenue and Adjusted EBITDA compound annual growth rates from 2010 through 2015 were five percent and 12 percent, respectively. We believe that our strong performance through the recent economic and housing downturns is attributable to the essential nature of our services, our strong value proposition and our management’s focus on driving results. |
|
· |
Solid margins with attractive operating leverage and productivity improvement initiatives. Our business model enjoys inherent operating leverage stemming from route density and fixed investments in infrastructure and technology, among other factors. We have demonstrated our ability to expand our margins through a variety of initiatives, including metric‑driven continuous improvement in our customer call centers, application of consistent process guidelines at the branch level, leveraging size and scale to improve the sourcing of labor and materials, and driving productivity in centralized services. We have also deployed mobility solutions and routing and scheduling systems across many of our businesses in order to enhance overall efficiency and reduce operating costs. |
Capital‑Light Business Model. Our business model is characterized by strong Adjusted EBITDA margins, negative working capital and limited capital expenditure requirements. In 2015, 2014 and 2013, our net cash provided from operating activities from continuing operations was $336 million, $253 million and $208 million, respectively, and our property additions were $40 million, $35 million and $39 million, respectively. Free Cash Flow was $358 million, $274 million and $169 million in 2015, 2014 and 2013, respectively. For a reconciliation of Free Cash Flow to net cash provided from operating activities from continuing operations, which we consider to be the most directly comparable financial measure presented in accordance with accounting principles generally accepted in the United States of America (“GAAP”), see “Selected Historical Financial Data.”
Experienced Management Team. We have assembled a management team of highly experienced leaders with significant industry expertise. Our senior leaders have track records of producing profitable growth in a wide variety of industries and economic conditions. We also believe that we have a deep bench of talent across each of our business units, including long‑tenured individuals with significant expertise and knowledge of the businesses they operate. Our management team is highly focused on execution and driving growth and profitability across our company. Our compensation structure, including incentive compensation, is tied to key performance metrics and is designed to incentivize senior management to seek the long‑term success of our business.
7
Our Strategy
Grow Our Customer Base. We are focused on the growth of our businesses through the introduction and delivery of high‑value services to new and existing customers. We drive growth in recurring and new sales via three primary channels:
|
· |
Direct‑to‑consumer through our company‑owned branches; |
|
· |
Indirectly through partnerships with high‑quality contractors in our home warranty business; and |
|
· |
Through trusted service providers who are franchisees. |
To accelerate new customer growth, we make strategic investments in sales, marketing and advertising to drive new business leads, brand awareness and market penetration. In addition, we are executing multiple initiatives to improve customer satisfaction and service delivery, which we believe will lead to improved retention and growth in our customer base across our business segments.
Develop and Expand New Service Offerings. We intend to continue to leverage our existing sales channels and local coverage to deliver additional value‑added services to our customers. Our product development teams draw upon the experience of our technicians in the field, combined with in‑house scientific expertise, to create innovative customer solutions for both our existing customer base and identified service/category adjacencies. We have a strong history of new product introductions, such as Terminix’s crawlspace encapsulation, mosquito control and wildlife exclusion services, that we believe will appeal to new potential customers as well as our existing customer base. As of December 31, 2015, mosquito, wildlife exclusion and crawl space encapsulation are being offered in substantially all U.S. geographic markets where we believe substantial market opportunity exists. We are now focusing our efforts on increasing our market share in these product lines.
Expand Our Geographic Markets. Through detailed assessments of local economic conditions and demographics, we have identified target markets for expansion, both in existing markets, where we have capacity to increase our local market position, and in new markets, where we see opportunities. In addition to geographic expansion opportunities within the United States, we may also grow our international presence through strategic franchise expansions and additional licensing agreements.
Grow Our Commercial Business. Our revenue from commercial customers comprised approximately 13 percent of our 2015 revenue. We believe we are well positioned to leverage our national coverage, brand strength and broad service offerings to target large multi‑regional accounts. We believe these capabilities provide us with a meaningful competitive advantage, especially compared to smaller local and regional competitors. We recognize that many of these large accounts seek to outsource or reduce the number of vendors used for certain services, and, accordingly, we have reenergized our marketing approach in this channel. At Terminix, for example, we have hired a dedicated sales team to focus on the development of commercial sales. Our commercial expansion strategy targets industries with a demonstrated need for our services, including healthcare, manufacturing, warehouses, hotels and commercial real estate.
Enhance Our Profitability. We have and will continue to invest in initiatives designed to improve our margins and drive profitable growth. We have been able to increase productivity across our segments through actions such as continuous process improvement, targeted systems investments, sales force initiatives and technician mobility tools. We are also focusing on strategically leveraging the $1.4 billion that we have spent annually with our vendors to capitalize on purchasing power and achieve more favorable pricing and terms. In addition, we have rolled out tools and processes to centralize and systematize pricing decisions. These tools and processes enable us to optimize pricing at the geographic market and product level while creating a flexible and scalable pricing architecture that can grow with the business. We intend to leverage these investments as well as identify further opportunities to enhance profitability across our businesses.
Pursue Selective Acquisitions. From 2011 through 2015, we have completed over 125 acquisitions. We anticipate that the highly fragmented nature of our markets will continue to create opportunities for further consolidation. As we have in the past, we will continue to take advantage of tuck‑in as well as strategic acquisition opportunities, particularly in underserved markets where we can enhance and expand our service capabilities. We seek to use acquisitions to cost‑effectively grow our customer count and enter high‑growth geographies. We may also pursue acquisitions as vehicles for strategic international expansion.
Our Reportable Segments
Our operations are organized into three reportable segments: Terminix, American Home Shield and the Franchise Services Group (which includes ServiceMaster Restore, ServiceMaster Clean, Merry Maids, Furniture Medic and AmeriSpec).
Terminix
Terminix is the leading provider of termite and pest control services in the United States, with an estimated 21 percent market share for 2015, as measured by customer‑level revenue. In addition, Terminix is the most recognized brand in the industry with approximately 1.5x the unaided brand awareness of our next‑largest competitor, based on a study by Decision Analyst, Inc. periodically commissioned by us as part of our ongoing marketing efforts. Terminix specializes in protection against termite damage, rodents, insects and other pests, including cockroaches, spiders, wood‑destroying ants, ticks, fleas and bed bugs. Our services include termite remediation, annual termite inspection and prevention treatments with damage claim guarantees, periodic pest control services, insulation services, mosquito control, crawlspace encapsulation and wildlife exclusion.
8
For the year ended December 31, 2015, 56 percent of Terminix revenue was generated from pest control services, which includes mosquito control, and 39 percent was generated from termite and other services, which includes crawlspace encapsulation, wildlife exclusion and insulation services, with the remaining five percent primarily from the distribution of pest control products. For the year ended December 31, 2015, 69 percent and 31 percent of pest control revenue was related to residential services and commercial services, respectively, and 91 percent and nine percent of revenue from termite and other services was related to residential and commercial services, respectively.
Approximately 80 percent of our revenue comes from customers who enter into contracts with the option to renew annually. Typically, termite services require an initial inspection and the installation of a protective liquid barrier or baited traps surrounding the home. As part of the contract, the customer is provided a guarantee that protects against damage resulting from termite infestation. After the first year, a customer has the option to renew the contact at a significantly reduced cost that extends the guarantee. Consequently, revenue generated from a renewal customer is less then revenue generated from a first-year termite customer.
We believe that the strength of the Terminix brand, along with our history of providing a high level of consistent service, allows us to enjoy a competitive advantage in attracting, retaining and growing our customer base. We believe our investments in systems and processes, such as routing and scheduling optimization, robust reporting capabilities and mobile customer management solutions, enable us to deliver a higher level of customer service when compared to smaller regional and local competitors.
Our focus on attracting and retaining customers begins with our associates in the field, who interact with our customers every day. Our associates bring a strong level of passion and commitment to the Terminix brand, as evidenced by the 11‑year and 7‑year average tenure of our branch managers and technicians, respectively. Our field organization is supported by dedicated customer service and call center personnel. Our culture of continuous improvement drives an intense focus on the quality of the services delivered, which we believe produces high levels of customer satisfaction and, ultimately, customer retention and referrals.
The Terminix national branch structure includes approximately 300 company-owned locations and approximately 25 franchise agreements, which serve approximately 2.8 million customers in 46 states and the District of Columbia. Terminix’s over 8,000 employees made a daily average of 50,000 visits to residential and commercial customer locations during 2015. Terminix also provides termite and pest control services through subsidiaries in Canada, Mexico, the Caribbean and Central America, as well as a joint venture in India. In addition, licensees of Terminix provide these services in Japan, China, South Korea, Southeast Asia, Central America, the Caribbean and the Middle East. In 2015, substantially all Terminix revenue was generated in the United States, with approximately two percent derived from international markets, with a presence in a total of 21 countries outside the United States through subsidiaries, a joint venture and licensing arrangements. Franchise fees from Terminix franchisees represented less than one percent of Terminix revenue in 2015. We estimate that customer‑level revenue for this segment was approximately $1,700 million for the year ended December 31, 2015. Customer‑level revenue represents the total of our estimate of sales generated by our franchisees, a portion of which is included in our reported revenue from royalty fees, and sales generated by our company‑owned operations.
Terminix Competitive Strengths
|
· |
#1 market position and #1 recognized brand in U.S. termite and pest control services |
|
· |
Track record of high customer retention |
|
· |
Passionate and committed associates focused on delivering superior customer service |
|
· |
Expansive scale and deep market presence across a national footprint |
|
· |
Effective multi‑channel customer acquisition strategy |
|
· |
History of innovation leadership and introducing new products and services |
American Home Shield
American Home Shield founded the home warranty industry in 1971 and remains the leading provider of home warranty plans for household systems and appliances in the United States, with approximately 42 percent market share, as measured by revenue. We estimate American Home Shield to be approximately four times larger than its nearest competitors, as measured by revenue. We believe that, as the market leader, American Home Shield can drive increasing use of home warranties given the low industry household penetration of approximately four percent.
American Home Shield provides home warranty plans that cover the repair or replacement of up to 21 major household systems and appliances, including electrical, plumbing, central heating and air conditioning (HVAC) systems, water heaters, refrigerators, dishwashers and ovens/cook tops. Our warranty plans are generally structured as one‑year contracts with annual renewal options and, as a result, a significant portion of our revenue base in this segment is recurring. For the year ended December 31, 2015, 65 percent of American Home Shield revenue was derived from existing contract renewals (of which 64 percent was from the direct‑to‑consumer channel and 36 percent was from the home resale channel), while 20 percent and 15 percent were derived from sales made in conjunction with existing home resale transactions and direct‑to‑consumer sales, respectively. In total, approximately 56 percent of our revenue base represents customers in the direct‑to‑consumer sales market. We estimate that our share of the new sales
9
market for contracts written in connection with existing home resales and direct‑to‑consumer sales in 2015 was 25 percent and 50 percent, respectively.
We believe that we have one of the largest contractor networks in the United States, comprised of more than 11,000 independent home service contractor firms. We carefully screen our contractors and closely monitor their performance based on a number of criteria, including through feedback from customer satisfaction surveys. On an annual basis, our contractors respond to more than three million service requests from approximately 1.6 million customers across all 50 states and the District of Columbia. Additionally, American Home Shield operates and takes service calls 24 hours a day, seven days a week. Furthermore, as a result of our large contractor network and sophisticated IT systems, approximately 90 percent of the time we successfully assign contractors to a job within 15 minutes or less.
American Home Shield Competitive Strengths
|
· |
#1 market position in the industry with 42 percent market share, estimated to be four times the size of the next largest competitors |
|
· |
Track record of high customer retention |
|
· |
Large and pre‑qualified national contractor network |
|
· |
Strong partnerships with leading national residential real estate firms |
|
· |
Core competency around direct‑to‑consumer marketing and lead generation |
Franchise Services Group
ServiceMaster’s Franchise Services Group consists of the ServiceMaster Restore (disaster restoration), ServiceMaster Clean (janitorial), Merry Maids (residential cleaning), Furniture Medic (furniture repair) and AmeriSpec (home inspection) businesses. Our businesses in this segment operate principally through franchisees. In 2014 we began converting company‑owned Merry Maids branches to franchises. Approximately half of our revenue in this segment consists of ongoing monthly royalty fees based upon a percentage of our franchisees’ customer‑level revenue. We estimate that the customer‑level revenue for this segment was approximately $2,400 million for the year ended December 31, 2015. We believe that each business holds a leading market position in its respective category and that our scale and national presence create competitive advantages for us in attracting and retaining franchisees. We are able to invest in best‑in‑class systems, training and process development, provide multiple levels of marketing support and direct new business leads to our franchisees through our relationships with major insurance carriers and national account customers. The depth of our franchisee support is evidenced by the long average tenure of our franchisees, many of whom have partnered with ServiceMaster for over 25 years. Our Franchise Services Group serves both residential and commercial customers across all 50 states and the District of Columbia through approximately 4,400 franchise agreements and approximately 30 company‑owned locations with additional locations in 14 other countries.
Franchise Services Group Competitive Strengths
|
· |
Strong and trusted brands with leading market positions in their respective categories |
|
· |
Attractive value proposition to franchisees |
|
· |
Exceptional focus on customer service evidenced by strong net promoter scores (“NPS”) |
|
· |
Infrastructure and scale supporting our ability to service national accounts |
|
· |
National network and 24/7/365 service availability supports mission‑critical nature of the ServiceMaster Restore business |
|
· |
Long‑standing and strong relationships with the majority of the top 20 insurance carriers |
Sales and Marketing
Terminix
Terminix markets its services to both homeowners and businesses through a national sales team and sales professionals in our branches and call centers. We generate leads for these sales professionals through advertising campaigns on television, online, in direct mail and in the yellow pages.
American Home Shield
In our American Home Shield segment, we market our services primarily through the internet, direct mail, television and radio advertising, print advertisements, marketing partnerships, telemarketing and various social media channels. Additionally, we market our services through a national sales team and various participants in the residential real estate marketplace, such as real estate brokerages, as well as some financial institutions and insurance carriers. American Home Shield focuses its marketing efforts on direct‑to‑consumer sales.
10
Franchise Services Group
In our Franchise Services Group segment, we market our services primarily through our franchise network, branch operations and a national sales team to a combination of business‑to‑business and business‑to‑consumer audiences. These services are advertised on a national and local level and include such media as television, radio, internet, direct mail, print advertisements, sales collateral materials and yellow page advertisements.
Service Marks, Trademarks and Trade Names
We hold various service marks, trademarks and trade names, such as ServiceMaster, Terminix, American Home Shield, ServiceMaster Restore, ServiceMaster Clean, Merry Maids, Furniture Medic and AmeriSpec, that we deem particularly important to the advertising activities conducted by each of our reportable segments as well as the franchising activities conducted by certain reportable segments. As of December 31, 2015, we had marks that were protected by registration (either by direct registration or by treaty) in the United States and approximately 95 other countries.
Franchises
Franchises are important to the Terminix, ServiceMaster Restore, ServiceMaster Clean, Merry Maids, Furniture Medic and AmeriSpec businesses. In 2015, 2014 and 2013, total franchise fees (monthly royalty fees as well as initial fees from sales of franchises and licenses) were $132 million, $132 million and $130 million, respectively, related franchise operating expenses were $57 million, $61 million and $62 million, respectively, and total profits from our franchised operations were $75 million, $71 million and $68 million, respectively. Nearly all of the franchise fees received by our Franchise Services Group segment are derived from the ServiceMaster Restore, ServiceMaster Clean and Merry Maids businesses. Franchise fees from our Terminix franchisees represented less than one percent of Terminix revenue for each of those years. We evaluate the performance of our franchise businesses based primarily on operating profit before corporate general and administrative expenses, interest expense and amortization of intangible assets. Franchise agreements entered into in the course of these businesses are generally for a term of five to 10 years. The majority of these franchise agreements are renewed prior to expiration. Internationally, we have license agreements, whereby licensees provide services under our brand names that would ordinarily be provided by franchisees in the United States. The majority of international licenses are for 10‑year terms.
Customers and Geographies
We have no single customer that accounts for more than two percent of our consolidated revenue. Additionally, no reportable segment has a single customer that accounts for more than five percent of its revenue. None of our reportable segments is dependent on a single customer or a few customers, the loss of which would have a material adverse effect on the segment.
A significant percentage of our revenue is concentrated in the southern and western regions of the United States. In our Terminix and American Home Shield segments, California, Texas and Florida collectively accounted for approximately one‑third of the revenue in 2015.
Competition
We compete in residential and commercial services industries, focusing on termite and pest control, home warranties, disaster restoration, janitorial, residential cleaning, furniture repair and home inspection. We compete with many other companies in the sale of our services, franchises and products. The principal methods of competition in our businesses include quality and speed of service, name recognition and reputation, customer satisfaction, brand awareness, pricing and promotions, professional sales forces and referrals. While we compete with a broad range of competitors in each discrete segment, we do not believe that any of our competitors provides all of the services we provide in all of the market segments we serve. All of the primary segments in which we operate are highly fragmented.
Termite and Pest Control
Competition in the segment for professional termite and pest control services in the United States comes primarily from smaller regional and local, independently-owned firms, as well as from Orkin, Inc. (a subsidiary of Rollins, Inc.), Ecolab, Inc. and Rentokil Initial, plc., all of which compete nationally.
Home Warranties
Competition for home warranties that cover household systems and appliances comes mainly from regional providers. Our two largest competitors are First American Financial Corporation and Old Republic International Corporation.
Disaster Restoration, Emergency Response and Related Services
Competition in the markets for disaster restoration, emergency response and related services comes mainly from local, independently-owned firms and a few national professional cleaning companies, such as Servpro Industries, Inc., Belfor, a subsidiary of Belfor Europe GmbH, BMS CAT, Inc. and Stanley Steemer International, Inc.
11
Janitorial
Competition in the market for janitorial services comes mainly from local, independently‑owned firms and a few national professional janitorial firms such as ABM Industries Incorporated, Jani‑King International, Inc., Aramark and Jan-Pro. Franchise International, Inc.
Residential Cleaning
Competition in the market segment for residential cleaning services comes mainly from local, independently-owned firms, and from a few national companies such as The Maids International, Inc., Molly Maid, Inc. and The Cleaning Authority, LLC.
Insurance
We maintain insurance coverage that we believe is appropriate for our business, including workers’ compensation, auto liability, general liability, umbrella and property insurance. In addition, we provide various insurance coverages, including deductible reimbursement policies, to our business units through our wholly‑owned captive insurance company, which was domiciled in Vermont through 2015 and since 2016 has been domiciled in Tennessee.
Information Technology
We have invested in information systems and software packages designed to allow us to grow efficiently, deliver and implement nationally, while retaining local and regional flexibility. We believe this provides us with a competitive advantage in our operations. Our sophisticated IT systems enable us to provide a high level of convenience and service to our customers. Terminix is able to provide a two‑hour service window to customers. Similarly, American Home Shield’s call centers, which operate and take service calls 24 hours a day, seven days a week, successfully assign contractors to a job within 15 minutes or less approximately 90 percent of the time.
Employees
The average number of persons employed by our continuing operations during 2015 was approximately 13,000. None of our employees in the United States are represented by collective bargaining agreements.
Regulatory Compliance
Our businesses are subject to various international, federal, state, provincial and local laws and regulations, compliance with which increases our operating costs, limits or restricts the services provided by our reportable segments or the methods by which our businesses offer, sell and fulfill those services or conduct their respective businesses, or subjects us and our reportable segments to the possibility of regulatory actions or proceedings. Noncompliance with these laws and regulations can subject us to fines or various forms of civil or criminal prosecution, any of which could have a material adverse effect on our reputation, business, financial position, results of operations and cash flows.
These international, federal, state, provincial and local laws and regulations include laws relating to consumer protection, wage and hour, deceptive trade practices, permitting and licensing, state contractor laws, real estate settlements, workers’ safety, tax, healthcare reforms, franchise-related issues, collective bargaining and other labor matters, environmental and employee benefits. The Terminix business must also meet certain Department of Transportation and Federal Motor Carrier Safety Administration requirements with respect to certain vehicles in its fleet. Terminix is regulated by federal, state and local laws, ordinances and regulations which are enforced by Pest Control Boards, Departments of Environmental Conservation and similar government entities. American Home Shield is regulated in certain states by the applicable state insurance regulatory authority and by the Real Estate Commission in Texas. ServiceMaster Clean and Merry Maids use products containing ingredients regulated by the U.S. Environmental Protection Agency (the “EPA”), and ServiceMaster Clean is subject to licensing and certification requirements for applying disinfectants, sanitizers and other EPA registered products in certain states. AmeriSpec is regulated by various state and local home inspection laws and regulations.
Environmental, Health and Safety Matters
Our businesses are subject to various international, federal, state and local laws and regulations regarding environmental, health and safety matters. Among other things, these laws regulate the emission or discharge of materials into the environment, govern the use, storage, treatment, disposal and management of hazardous substances and wastes and protect the health and safety of our employees. These laws also impose liability for the costs of investigating and remediating, and damages resulting from, present and past releases of hazardous substances, including releases by prior owners or operators of sites we currently own or operate.
Compliance with environmental, health and safety laws increases our operating costs, limits or restricts the services provided by our reportable segments or the methods by which they offer, sell and fulfill those services or conduct their respective businesses, or subjects us and our reportable segments to the possibility of regulatory or private actions or proceedings.
Terminix is regulated under many federal and state environmental laws, including the Comprehensive Environmental Response, Compensation and Liability Act of 1980 (the “CERCLA”), the Superfund Amendments and Reauthorization Act of 1986 (the “Superfund”), the Federal Environmental Pesticide Control Act of 1972, the Federal Insecticide, Fungicide and Rodenticide Act
12
of 1947, the Resource Conservation and Recovery Act of 1976, the Clean Air Act, the Emergency Planning and Community Right‑to‑Know Act of 1986, the Oil Pollution Act of 1990 and the Clean Water Act of 1977, each as amended.
We cannot predict the effect of possible future environmental laws on our operations. Changes in, or new interpretations of, existing laws, regulations or enforcement policies, the discovery of previously unknown contamination, or the imposition of other environmental liabilities or obligations in the future, may lead to additional compliance or other costs. During 2015 there were no material capital expenditures for environmental control facilities, and there are no material expenditures anticipated for 2016 or 2017 related to such facilities.
Consumer Protection and Solicitation Matters
We are subject to international, federal, state, provincial and local laws and regulations designed to protect consumers, including laws governing consumer privacy and fraud, the collection and use of consumer data, telemarketing and other forms of solicitation.
The telemarketing rules adopted by the Federal Communications Commission pursuant to the Federal Telephone Consumer Protection Act and the Federal Telemarketing Sales Rule issued by the Federal Trade Commission govern our telephone sales practices. In addition, some states and local governing bodies have adopted laws and regulations targeted at direct telephone sales and “do‑not‑knock,” “do‑not‑mail” and “do‑not‑leave” activities. The implementation of these marketing regulations requires us to rely more extensively on other marketing methods and channels. In addition, if we were to fail to comply with any applicable law or regulation, we could be subject to substantial fines or damages, be involved in lawsuits, enforcement actions and other claims by third parties or governmental authorities, suffer losses to our reputation and our business or suffer the loss of licenses or penalties that may affect how the business is operated, which, in turn, could have a material adverse effect on our financial position, results of operations and cash flows.
Franchise Matters
Terminix, ServiceMaster Restore, ServiceMaster Clean, Merry Maids, Furniture Medic and AmeriSpec are subject to various international, federal, state, provincial and local laws and regulations governing franchise sales, marketing and licensing and franchise trade practices generally, including applicable rules and regulations of the Federal Trade Commission. These laws and regulations generally require disclosure of business information in connection with the sale and licensing of franchises. Certain state regulations also affect the ability of the franchisor to revoke or refuse to renew a franchise. We seek to comply with regulatory requirements and deal with franchisees and licensees in good faith. From time to time, we and one or more franchisees may become involved in a dispute regarding the franchise relationship, including payment of royalties or fees, location of branches, advertising, purchase of products by franchisees, non‑competition covenants, compliance with our standards and franchise renewal criteria. There can be no assurance that compliance problems will not be encountered from time to time or that significant disputes with one or more franchisees will not arise.
From time to time, we receive communications from our franchisees regarding complaints, disputes or questions about our practices and standards in relation to our franchised operations and certain economic terms of our franchise arrangements. If franchisees or groups representing franchisees were to bring legal proceedings against us, we would vigorously defend against the claims in any such proceeding, but our reputation, business, financial position, results of operations and cash flows could be materially adversely impacted and the price of our common stock could decline.
Available Information
ServiceMaster maintains a website at http://www.servicemaster.com that includes a hyperlink to a website maintained by a third party where ServiceMaster’s Annual Report on Form 10-K, Quarterly Reports on Form 10-Q, Current Reports on Form 8-K and all amendments to those reports are available without charge as soon as reasonably practicable following the time that they are filed with or furnished to the SEC. The information found on the Company’s website is not a part of this or any other report filed with or furnished to the SEC.
You should carefully consider the factors described below, in addition to the other information set forth in this Annual Report on Form 10-K. These risk factors are important to understanding the contents of this Annual Report on Form 10-K and of other reports. Our reputation, business, financial position, results of operations and cash flows are subject to various risks. The risks and uncertainties described below are not the only ones relevant to us. Additional risks and uncertainties not currently known to us or that we currently believe are immaterial may also adversely impact our reputation, business, financial position, results of operations and cash flows.
The materialization of any risks and uncertainties set forth below or identified in Forward-Looking Statements contained in this report and our other filings with the SEC or those that are presently unforeseen could result in significant adverse effects on our financial condition, results of operations and cash flows. See “Item 7. Management’s Discussion and Analysis of Financial Condition and Results of Operations — Information Regarding Forward-Looking Statements” below.
13
Risks Related to Our Business and Our Industry
Weakening in general economic conditions, especially as they may affect home sales, unemployment or consumer confidence or spending levels, may adversely impact our business, financial position, results of operations and cash flows.
A substantial portion of our results of operations is dependent upon spending by consumers. Deterioration in general economic conditions and consumer confidence, particularly in California, Texas and Florida, which collectively represented approximately one‑third of our revenue in 2015 in our Terminix and American Home Shield segments, could affect the demand for our services. Consumer spending and confidence tend to decline during times of declining economic conditions. A worsening of macroeconomic indicators, including weak home sales, higher home foreclosures, declining consumer confidence or rising unemployment rates, could adversely affect consumer spending levels, reduce the demand for our services and adversely impact our business, financial position, results of operations and cash flows. These factors could also negatively impact the timing or the ultimate collection of accounts receivable, which would adversely impact our business, financial position, results of operations and cash flows.
We may not successfully implement our business strategies, including achieving our growth objectives.
We may not be able to fully implement our business strategies or realize, in whole or in part within the expected time frames, the anticipated benefits of our various growth or other initiatives. Our various business strategies and initiatives, including growth of our customer base, introduction of new service offerings, geographic expansion, growth of our commercial business and enhancement of profitability, are subject to significant business, economic and competitive uncertainties and contingencies, many of which are beyond our control.
In addition, we may incur certain costs to achieve efficiency improvements and growth in our business and we may not meet anticipated implementation timetables or stay within budgeted costs. As these efficiency improvement and growth initiatives are undertaken, we may not fully achieve our expected cost savings and efficiency improvements or growth rates, or these initiatives could adversely impact our customer retention or our operations. Also, our business strategies may change from time to time in light of our ability to implement our new business initiatives, competitive pressures, economic uncertainties or developments, or other factors.
Adverse credit and financial market events and conditions could, among other things, impede access to or increase the cost of financing or cause our commercial and governmental customers to incur liquidity issues that could lead to some of our services not being purchased or being cancelled, or result in reduced revenue and lower Adjusted EBITDA, any of which could have an adverse impact on our business, financial position, results of operations and cash flows.
Disruptions in credit or financial markets could, among other things, lead to impairment charges, make it more difficult for us to obtain, or increase our cost of obtaining, financing for our operations or investments or to refinance our indebtedness, cause our lenders to depart from prior credit industry practice and not give technical or other waivers under the $2,374 million Term Loan Facility and the $300 million Revolving Credit Facility to the extent we may seek them in the future, thereby causing us to be in default under the Credit Facilities. These disruptions also could cause our commercial customers to encounter liquidity issues that could lead to some of our services being cancelled or reduced, or that could result in an increase in the time it takes our customers to pay us, or that could lead to a decrease in pricing for our services and products, any of which could adversely affect our accounts receivable, among other things, and, in turn, increase our working capital needs. Volatile swings in the commercial real estate segment could also impact the demand for our services as landlords cut back on services provided to their tenants. In addition, adverse developments at federal, state and local levels associated with budget deficits resulting from economic conditions could result in federal, state and local governments decreasing their purchasing of our products or services and/or increasing taxes or other fees on businesses, including us, to generate more tax revenues, which could negatively impact spending by commercial customers and municipalities on our services.
Our market segments are highly competitive. Competition could reduce our share of the market segments served by us and adversely impact our reputation, business, financial position, results of operations and cash flows.
We operate in highly competitive market segments. Changes in the source and intensity of competition in the market segments served by us impact the demand for our services and may also result in additional pricing pressures. The relatively low capital cost of entry into certain of our business categories has led to strong competitive market segments, including competition from smaller regional and local owner‑operated companies. Regional and local competitors operating in a limited geographic area may have lower labor, employee benefits and overhead costs. The principal methods of competition in our businesses include name recognition, quality and speed of service, customer satisfaction, reputation and pricing. We may be unable to compete successfully against current or future competitors, and the competitive pressures that we face may result in reduced market segment share, reduced pricing or adversely impact our reputation, business, financial position, results of operations and cash flows.
Weather conditions and seasonality affect the demand for our services and our results of operations and cash flows.
The demand for our services and our results of operations are affected by weather conditions, including, without limitation, potential impacts, if any, from climate change, known and unknown, and by the seasonal nature of our termite and pest control services, home inspection services, home warranties and disaster restoration services. Adverse weather conditions (e.g., cooler temperatures or droughts), whether created by climate change factors or otherwise, can impede the development of the termite swarm and lead to lower demand for our termite remediation services. Severe winter storms can also impact our home cleaning business if
14
personnel cannot travel to service locations due to hazardous road conditions. In addition, extreme temperatures can lead to an increase in service requests related to household systems and appliances in our American Home Shield business, resulting in higher claim frequency and costs and lower profitability. These or other weather conditions could adversely impact our business, financial position, results of operations and cash flows.
Compliance with IRS rules for our 401(k) Plan could result in significant costs that adversely impact our financial position, results of operations and cash flows.
In 2008, we amended our Profit Sharing and Retirement Plan, a tax qualified 401(k) defined contribution plan available to substantially all of our employees (the “401(k) Plan”), to implement a qualified automatic contribution arrangement (“QACA”) under the safe harbor provisions of the Internal Revenue Code of 1986, as amended (the “Code”). QACA plans, in general, require automatic enrollment of employees into the retirement plan absent an affirmative election that such employees do not wish to participate.
Although we implemented processes to auto-enroll new hires after adopting the QACA plan in 2008, we have discovered that we did not auto-enroll then existing employees who were not participating in the 401(k) Plan. In response, we implemented an auto-enrollment process for affected active employees, and we are preparing to submit to the IRS a voluntary correction proposal to remedy the issue for prior years. Our current estimate of the cost of the correction ranges from $23 million to approximately $85 million. We recorded a charge in the consolidated statement of operations and comprehensive income (loss) for the year ended December 31, 2015 of $23 million. However, there can be no assurances as to the ultimate costs of the correction.
Increases in raw material prices, fuel prices and other operating costs could adversely impact our business, financial position, results of operations and cash flows.
Our financial performance may be adversely affected by increases in the level of our operating expenses, such as fuel, chemicals, refrigerants, appliances and equipment, parts, raw materials, wages and salaries, employee benefits, health care, vehicle maintenance, contractor costs, self‑insurance costs and other insurance premiums, as well as various regulatory compliance costs, all of which may be subject to inflationary pressures.
In recent years, fuel prices have fluctuated widely, and previous increases in fuel prices increased our costs of operating vehicles and equipment. Although in the twelve months of 2015 fuel prices remained relatively low, there can be no assurances that rates will not return to historical levels. We cannot predict what effect global events or any future Middle East, Russia or other crisis could have on fuel prices, but it is possible that such events could lead to higher fuel prices. With respect to fuel, our fleet has been negatively impacted by significant increases in fuel prices in the past and could be negatively impacted in the future. Although we hedge a significant portion of our fuel costs, we do not hedge all of those costs. We expect to use approximately 13 million gallons of fuel in 2016. As of December 31, 2015, a ten percent change in fuel prices would result in a change of approximately $3 million in our annual fuel cost before considering the impact of fuel swap contracts. Fuel price increases can also result in increases in the cost of chemicals and other materials used in our business. We cannot predict the extent to which we may experience future increases in costs of fuel, chemicals, refrigerants, appliances and equipment, parts, raw materials, wages and salaries, employee benefits, health care, vehicle, self‑insurance costs and other insurance premiums as well as various regulatory compliance costs and other operating costs. To the extent such costs increase, we may be prevented, in whole or in part, from passing these cost increases through to our existing and prospective customers, and the rates we pay to our subcontractors and suppliers may increase, any of which could have a material adverse impact on our business, financial position, results of operations and cash flows.
We may not be able to attract and retain qualified key executives or transition smoothly to new leadership, which could adversely impact us and our businesses and inhibit our ability to operate and grow successfully.
The execution of our business strategy and our financial performance will continue to depend in significant part on our executive management team and other key management personnel. Any inability to attract in a timely manner other qualified key executives, retain our leadership team and recruit other important personnel could have a material adverse impact on our business, financial position, results of operations and cash flows.
Compliance with, or violation of, environmental, health and safety laws and regulations, including laws pertaining to the use of pesticides, could result in significant costs that adversely impact our reputation, business, financial position, results of operations and cash flows.
International, federal, state, provincial and local laws and regulations relating to environmental, health and safety matters affect us in several ways. In the United States, products containing pesticides generally must be registered with the EPA, and similar state agencies before they can be sold or applied. The failure to obtain or the cancellation of any such registration, or the withdrawal from the marketplace of such pesticides, could have an adverse effect on our business, the severity of which would depend on the products involved, whether other products could be substituted and whether our competitors were similarly affected. The pesticides we use are manufactured by independent third parties and are evaluated by the EPA as part of its ongoing exposure risk assessment. The EPA may decide that a pesticide we use will be limited or will not be re‑registered for use in the United States. We cannot predict the outcome or the severity of the effect of the EPA’s continuing evaluations.
In addition, the use of certain pesticide products is regulated by various international, federal, state, provincial and local environmental and public health agencies. Although we strive to comply with such laws and regulations and have processes in place designed to achieve compliance, given our dispersed locations, distributed operations and numerous associates, we may be unable to
15
prevent violations of these or other laws and regulations from occurring. Even if we are able to comply with all such laws and regulations and obtain all necessary registrations and licenses, the pesticides or other products we apply or use, or the manner in which we apply or use them, could be alleged to cause injury to the environment, to people or to animals, or such products could be banned in certain circumstances. The laws and regulations may also apply to third‑party vendors who are hired to repair or remediate property and who may fail to comply with environmental laws, health and safety laws and regulations and subject us to risk of legal exposure. The costs of compliance, non‑compliance, investigation, remediation, combating reputational harm or defending civil or criminal proceedings, products liability, personal injury or other lawsuits could have a material adverse impact on our reputation, business, financial position, results of operations and cash flows.
International, federal, state, provincial and local agencies regulate the disposal, handling and storage of waste, discharges from our facilities and the investigation and clean‑up of contaminated sites. We could incur significant costs, including investigation and clean‑up costs, fines, penalties and civil or criminal sanctions and claims by third parties for property damage and personal injury, as a result of violations of, or liabilities under, these laws and regulations. In addition, potentially significant expenditures could be required to comply with environmental, health and safety laws and regulations, including requirements that may be adopted or imposed in the future.
In March 2015, we were informed that the United States Department of Justice (the “DOJ”) initiated a criminal investigation into allegations that a local Terminix branch used methyl bromide as a fumigant at a resort in St. John, U.S. Virgin Islands, resulting in serious injuries to four members of a family vacationing there. The U.S. Virgin Islands government is also investigating the matter, as is the EPA. The EPA also requested information concerning the possible distribution, sale or use of methyl bromide in Puerto Rico. During the year ended December 31, 2015, we recorded in our consolidated statement of operations and comprehensive income (loss) a charge of $3 million in connection with civil claims related to the U.S. Virgin Islands matter, an amount equal to our insurance deductible under our general liability insurance program, although no assurance can be given regarding our insurance coverage or recoveries in connection with such civil claims.
We continue to cooperate fully with all relevant governmental authorities in their investigations and have had discussions with the DOJ concerning potential resolution of the criminal investigation. Although we have recorded in our consolidated statement of operations and comprehensive income (loss) a charge of $8 million as a result of those discussions, the amount and extent of any further potential penalties, fines, sanctions, costs and damages that the federal or other governmental authorities may yet impose, investigation or other costs and reputational harm, as well as the impact of any civil, criminal or other claims or judicial, administrative or regulatory proceedings resulting from or related to the U.S. Virgin Islands incident, which could be material, is not currently known or reasonably estimable, and any such penalties, fines, sanctions, costs or damages may not be covered under our general liability insurance program.
On September 15, 2015, a lawsuit was filed in the Circuit Court of the 15th Judicial Circuit in and for Palm Beach County, Florida, styled Carl Robert McCaughey, et al. v. Terminix International Company Limited Partnership, Sunland Pest Control Services, Inc., et al. (Case No. 32080796). The lawsuit alleges that fumigation of a Florida family’s residence by Sunland Pest Control Services, Inc. (“Sunland”), a subcontractor of Terminix, resulted in serious injuries to one of the family’s children, alleges claims for negligence and strict liability, and seeks an unspecified amount of monetary and punitive damages. The court has set a trial date in September 2016. The DOJ and other federal and state agencies are investigating the matter, and the DOJ has filed criminal charges against Sunland and two persons associated with Sunland. We continue to cooperate fully with all relevant governmental authorities. The amount and extent of any potential penalties, fines, sanctions, costs and damages that the federal or other governmental authorities may impose, investigation or other costs and reputational harm, as well as the impact of any civil, criminal or other claims or judicial, administrative or regulatory proceedings resulting from or related to this incident, which could be material, is not currently known or reasonably estimable, and any such penalties, fines, sanctions, costs or damages may not be covered under our general liability insurance program.
Public perceptions that the products we use and the services we deliver are not environmentally friendly or safe may adversely impact the demand for our services.
In providing our services, we use, among other things, pesticides and other chemicals. Public perception that the products we use and the services we deliver are not environmentally friendly or safe or are harmful to humans or animals, whether justified or not, or our improper application of these chemicals, could reduce demand for our services, increase regulation or government restrictions or actions, result in fines or penalties, impair our reputation, involve us in litigation, damage our brand names and otherwise have a material adverse impact on our business, financial position, results of operations and cash flows.
Laws and government regulations applicable to our businesses and lawsuits, enforcement actions and other claims by third parties or governmental authorities could increase our legal and regulatory expenses, and impact our business, financial position, results of operations and cash flows.
Our businesses are subject to significant international, federal, state, provincial and local laws and regulations. These laws and regulations include laws relating to consumer protection, wage and hour requirements, franchising, the employment of immigrants, labor relations, permitting and licensing, building code requirements, workers’ safety, the environment, insurance and home warranties, employee benefits, marketing (including, without limitation, telemarketing) and advertising, the application and use of pesticides and other chemicals. In particular, we anticipate that various international, federal, state, provincial and local governing
16
bodies may propose additional legislation and regulation that may be detrimental to our business or may substantially increase our operating costs, including increases in the minimum wage, environmental regulations related to chemical use, climate change, equipment efficiency standards, refrigerant production and use and other environmental matters; other consumer protection laws or regulations; health care coverage; or “do‑not‑knock,” “do‑not‑mail,” “do‑not‑leave” or other marketing regulations. It is difficult to predict the future impact of the broad and expanding legislative and regulatory requirements affecting our businesses and changes to such requirements may adversely affect our business, financial position, results of operations and cash flows. In addition, if we were to fail to comply with any applicable law or regulation, we could be subject to substantial fines or damages, be involved in lawsuits, enforcement actions and other claims by third parties or governmental authorities, suffer losses to our reputation, suffer the loss of licenses or incur penalties that may affect how our business is operated, which, in turn, could have a material adverse impact on our business, financial position, results of operations and cash flows.
Our franchisees, subcontractors, third‑party distributors and vendors could take actions that could harm our business.
For each of the years ended December 31, 2015 and 2014, $132 million of our consolidated revenue was received in the form of franchise revenues. Accordingly, our financial results are dependent in part upon the operational and financial success of our franchisees. Our franchisees, subcontractors, third‑party distributors and vendors are contractually obligated to operate their businesses in accordance with the standards set forth in our agreements with them. Each franchising brand also provides training and support to franchisees. However, franchisees, subcontractors, third‑party distributors and vendors are independent third parties that we do not control, and who own, operate and oversee the daily operations of their businesses. As a result, the ultimate success of any franchise operation rests with the franchisee. If franchisees do not successfully operate their businesses in a manner consistent with required standards, royalty payments to us will be adversely affected and our brands’ image and reputation could be harmed, which in turn could adversely impact our business, financial position, results of operations and cash flows. Similarly, if third‑party distributors, subcontractors, vendors and franchisees do not successfully operate their businesses in a manner consistent with required laws, standards and regulations, we could be subject to claims from regulators or legal claims for the actions or omissions of such third‑party distributors, subcontractors, vendors and franchisees. In addition, our relationship with our franchisees, third‑party distributors, subcontractors and vendors could become strained (including resulting in litigation) as we impose new standards or assert more rigorous enforcement practices of the existing required standards. These strains in our relationships or claims could have a material adverse impact on our reputation, business, financial position, results of operations and cash flows.
From time to time, we receive communications from our franchisees regarding complaints, disputes or questions about our practices and standards in relation to our franchised operations and certain economic terms of our franchise arrangements. If franchisees or groups representing franchisees were to bring legal proceedings against us, we would vigorously defend against the claims in any such proceeding, but our reputation, business, financial position, results of operations and cash flows could be materially adversely impacted and the price of our common stock could decline.
Disruptions or failures in our information technology systems could create liability for us or limit our ability to effectively monitor, operate and control our operations and adversely impact our reputation, business, financial position, results of operations and cash flows.
Our information technology systems facilitate our ability to monitor, operate and control our operations. Changes or modifications to our information technology systems could cause disruption to our operations or cause challenges with respect to our compliance with laws, regulations or other applicable standards. As the development and implementation of our information technology systems (including our operating systems) evolve, we may elect to modify, replace or abandon certain technology initiatives, which could result in write‑downs. For example, in February 2014, American Home Shield ceased efforts to deploy a new operating system that had been intended to improve customer relationship management capabilities and enhance its operations. We recorded an impairment charge of $47 million in the year ended December 31, 2014 relating to this decision.
Any disruption in our information technology systems, including capacity limitations, instabilities, or failure to operate as expected, could, depending on the magnitude of the problem, adversely impact our business, financial position, results of operations and cash flows, including by limiting our capacity to monitor, operate and control our operations effectively. Failures of our information technology systems could also lead to violations of privacy laws, regulations, trade guidelines or practices related to our customers and associates. If our disaster recovery plans do not work as anticipated, or if the third‑party vendors to which we have outsourced certain information technology, contact center or other services fail to fulfill their obligations to us, our operations may be adversely impacted, and any of these circumstances could adversely impact our reputation, business, financial position, results of operations and cash flows.
Changes in the services we deliver or the products we use could impact our reputation, business, financial position, results of operations and cash flows and our future plans.
Our financial performance is affected by changes in the services and products we offer our customers. For example, in 2014, Terminix introduced new products relating to mosquito control, crawlspace encapsulation and wildlife exclusion. There can be no assurance that our new strategies or product offerings will succeed in increasing revenue and growing profitability. An unsuccessful execution of new strategies, including the rollout or adjustment of our new services or products or sales and marketing plans, could cause us to re‑evaluate or change our business strategies and could have a material adverse impact on our reputation, business, financial position, results of operations and cash flows and our future plans.
17
If we fail to protect the security of personal information about our customers, associates and third parties, we could be subject to interruption of our business operations, private litigation, reputational damage and costly penalties.
We rely on, among other things, commercially available systems, software, tools and monitoring to provide security for processing, transmission and storage of confidential information of customers, associates and third parties, such as payment card and personal information. The systems currently used for transmission and approval of payment card transactions, and the technology utilized in payment cards themselves, all of which can put payment card data at risk, are central to meeting standards set by the payment card industry (“PCI”). We continue to evaluate and modify our systems and protocols for PCI compliance purposes, and such PCI standards may change from time to time. Activities by third parties, advances in computer and software capabilities and encryption technology, new tools and discoveries and other events or developments may facilitate or result in a compromise or breach of our systems. Any compromises, breaches or errors in applications related to our systems or failures to comply with standards set by the PCI could cause damage to our reputation and interruptions in our operations, including our customers’ ability to pay for our services and products by credit card or their willingness to purchase our services and products and could result in a violation of applicable laws, regulations, orders, industry standards or agreements and subject us to costs, penalties and liabilities which could have a material adverse impact on our reputation, business, financial position, results of operations and cash flows.
We may not be able to adequately protect our intellectual property and other proprietary rights that are material to our business.
Our ability to compete effectively depends in part on our rights to service marks, trademarks, trade names and other intellectual property rights we own or license, particularly our registered brand names, ServiceMaster, Terminix, American Home Shield, ServiceMaster Restore, ServiceMaster Clean, Merry Maids, Furniture Medic and AmeriSpec. We have not sought to register or protect every one of our marks either in the United States or in every country in which they are or may be used. Furthermore, because of the differences in foreign trademark, patent and other intellectual property or proprietary rights laws, we may not receive the same protection in other countries as we would in the United States. If we are unable to protect our proprietary information and brand names, we could suffer a material adverse impact on our reputation, business, financial position, results of operations and cash flows. Litigation may be necessary to enforce our intellectual property rights and protect our proprietary information, or to defend against claims by third parties that our products, services or activities infringe their intellectual property rights.
Future acquisitions or other strategic transactions could negatively impact our reputation, business, financial position, results of operations and cash flows.
We may pursue strategic transactions in the future, which could involve acquisitions or dispositions of businesses or assets. Any future strategic transaction could involve integration or implementation challenges, business disruption or other risks, or change our business profile significantly. Any inability on our part to consolidate and manage growth from acquired businesses or successfully implement other strategic transactions could have an adverse impact on our reputation, business, financial position, results of operations and cash flows. Any acquisition that we make may not provide us with the benefits that were anticipated when entering into such acquisition. The process of integrating an acquired business may create unforeseen difficulties and expenses, including the diversion of resources needed to integrate new businesses, technologies, products, personnel or systems; the inability to retain associates, customers and suppliers; the assumption of actual or contingent liabilities (including those relating to the environment); failure to effectively and timely adopt and adhere to our internal control processes and other policies; write‑offs or impairment charges relating to goodwill and other intangible assets; unanticipated liabilities relating to acquired businesses; and potential expense associated with litigation with sellers of such businesses. Any future disposition transactions could also impact our business and may subject us to various risks, including failure to obtain appropriate value for the disposed businesses, post‑closing claims being levied against us and disruption to our other businesses during the sale process or thereafter.
We may be required to recognize additional impairment charges.
In the first quarter of 2014, we incurred impairment charges with respect to fixed assets, and we have also incurred impairment charges in the past in connection with our disposition activities. We have significant amounts of goodwill and intangible assets, such as trade names. In accordance with applicable accounting standards, goodwill and indefinite-lived intangible assets are not amortized and are subject to assessment for impairment by applying a fair‑value based test annually, or more frequently if there are indicators of impairment, including:
|
· |
significant adverse changes in the business climate, including economic or financial conditions; |
|
· |
significant adverse changes in expected operating results; |
|
· |
adverse actions or assessments by regulators; |
|
· |
unanticipated competition; |
|
· |
loss of key personnel; and |
|
· |
a current expectation that it is more likely than not that a reporting unit or intangible asset will be sold or otherwise disposed of. |
In February 2014, American Home Shield ceased efforts to deploy a new operating system that had been intended to improve customer relationship management capabilities and enhance its operations. We recorded an impairment charge of $47 million in the year ended December 31, 2014 relating to this decision.
18
Based upon future economic and financial market conditions, the operating performance of our reporting units and other factors, including those listed above, we may incur impairment charges in the future. It is possible that such impairment, if required, could be material. Any future impairment charges that we are required to record could have a material adverse impact on our results of operations.
We are subject to various restrictive covenants that could adversely impact our business, financial position, results of operations and cash flows.
From time to time, we enter into noncompetition agreements or other restrictive covenants (e.g., exclusivity, take or pay and non‑solicitation), including in connection with business dispositions or strategic contracts, that restrict us from entering into lines of business or operating in certain geographic areas into which we may desire to expand our business. We also are subject to various non‑solicitation and no‑hire covenants that may restrict our ability to solicit potential customers or associates. If we do not comply with such restrictive covenants, or if a dispute arises regarding the scope and interpretation thereof, litigation could ensue, which could have an adverse impact on our business, financial position, results of operations and cash flows. Further, to the extent that such restrictive covenants prevent us from taking advantage of business opportunities, our business, financial position, results of operations and cash flows may be adversely impacted.
Our business process outsourcing initiatives have increased our reliance on third‑party contractors and may expose our business to harm upon the termination or disruption of our third‑party contractor relationships.
Our strategy to increase profitability, in part, by reducing our costs of operations includes the implementation of certain business process outsourcing initiatives. Any disruption, termination or substandard performance of these outsourced services, including possible breaches by third‑party vendors of their agreements with us, could adversely affect our brands, reputation, customer relationships, financial position, results of operations and cash flows. Also, to the extent a third‑party outsourcing provider relationship is terminated, there is a risk that we may not be able to enter into a similar agreement with an alternate provider in a timely manner or on terms that we consider favorable, and even if we find an alternate provider, or choose to insource such services, there are significant risks associated with any transitioning activities. In addition, to the extent we decide to terminate outsourcing services and insource such services, there is a risk that we may not have the capabilities to perform these services internally, resulting in a disruption to our business, which could adversely impact our reputation, business, financial position, results of operations and cash flows. We could incur costs, including personnel and equipment costs, to insource previously outsourced services like these, and these costs could adversely affect our results of operations and cash flows.
In addition, when a third‑party provider relationship is terminated, there is a risk of disputes or litigation and that we may not be able to enter into a similar agreement with an alternate provider in a timely manner or on terms that we consider favorable, and even if we find an alternate provider, there are significant risks associated with any transitioning activities.
Our future success depends on our ability to attract, retain and maintain positive relations with trained workers and third‑party contractors.
Our future success and financial performance depend substantially on our ability to attract, train and retain workers, attract and retain third‑party contractors and ensure third‑party contractor compliance with our policies and standards. Our ability to conduct our operations is in part impacted by our reliance on a network of third-party contractors. When a contractor relationship is terminated, there is a risk that we may not be able to enter into a similar agreement with an alternate contractor in a timely manner or on terms that we consider favorable. We could incur costs to transition to other contractors, and these costs could adversely affect our results of operations and cash flows.
Our ability to conduct our operations is in part impacted by our ability to increase our labor force, including on a seasonal basis, which may be adversely impacted by a number of factors. In the event of a labor shortage, we could experience difficulty in delivering our services in a high‑quality or timely manner and could be forced to increase wages in order to attract and retain associates, which would result in higher operating costs and reduced profitability. New decisions and rules by the National Labor Relations Board, including “expedited elections” and restrictions on appeals, could lead to increased organizing activities at our subsidiaries or franchisees. If these labor organizing activities were successful, it could further increase labor costs, decrease operating efficiency and productivity in the future, or otherwise disrupt or negatively impact our operations. In addition, potential competition from key associates who leave ServiceMaster could impact our ability to maintain our market segment share in certain geographic areas.
Risks Related to Our Substantial Indebtedness
We have substantial indebtedness and may incur substantial additional indebtedness, which could adversely affect our financial health and our ability to obtain financing in the future, react to changes in our business and satisfy our obligations.
As of December 31, 2015, we had approximately $2.8 billion of total long‑term consolidated indebtedness outstanding.
As of December 31, 2015, there was $133 million of letters of credit outstanding and $167 million of available borrowing capacity under the Revolving Credit Facility. In addition, we are able to incur additional indebtedness in the future, subject to the limitations contained in the agreements governing our indebtedness. Our substantial indebtedness could have important consequences to you. Because of our substantial indebtedness:
19
|
· |
our ability to engage in acquisitions without raising additional equity or obtaining additional debt financing is limited; |
|
· |
our ability to obtain additional financing for working capital, capital expenditures, acquisitions, debt service requirements or general corporate purposes and our ability to satisfy our obligations with respect to our indebtedness may be impaired in the future; |
|
· |
a large portion of our cash flow from operations must be dedicated to the payment of principal and interest on our indebtedness, thereby reducing the funds available to us for other purposes; |
|
· |
we are exposed to the risk of increased interest rates because a portion of our borrowings are or will be at variable rates of interest; |
|
· |
it may be more difficult for us to satisfy our obligations to our creditors, resulting in possible defaults on, and acceleration of, such indebtedness; |
|
· |
we may be more vulnerable to general adverse economic and industry conditions; |
|
· |
we may be at a competitive disadvantage compared to our competitors with proportionately less indebtedness or with comparable indebtedness on more favorable terms and, as a result, they may be better positioned to withstand economic downturns; |
|
· |
our ability to refinance indebtedness may be limited or the associated costs may increase; |
|
· |
our flexibility to adjust to changing market conditions and ability to withstand competitive pressures could be limited; and |
|
· |
we may be prevented from carrying out capital spending and restructurings that are necessary or important to our growth strategy and efforts to improve operating margins of our businesses. |
Increases in interest rates would increase the cost of servicing our indebtedness and could reduce our profitability.
A significant portion of our outstanding indebtedness, including indebtedness incurred under the Credit Facilities, bears interest at variable rates. As a result, increases in interest rates would increase the cost of servicing our indebtedness and could materially reduce our profitability and cash flows. As of December 31, 2015, each one percentage point change in interest rates would result in an approximately $17 million change in the annual interest expense on the Term Loan Facility after considering the impact of the effective interest rate swaps. Assuming all revolving loans were fully drawn as of December 31, 2015, each one percentage point change in interest rates would result in an approximately $2 million change in annual interest expense on the Revolving Credit Facility. The impact of increases in interest rates could be more significant for us than it would be for some other companies because of our substantial indebtedness.
A lowering or withdrawal of the ratings, outlook or watch assigned to our debt securities by rating agencies may increase our future borrowing costs and reduce our access to capital.
Our indebtedness currently has a non‑investment grade rating, and any rating, outlook or watch assigned could be lowered or withdrawn entirely by a rating agency if, in that rating agency’s judgment, current or future circumstances relating to the basis of the rating, outlook, or watch such as adverse changes to our business, so warrant. Any future lowering of our ratings, outlook or watch likely would make it more difficult or more expensive for us to obtain additional debt financing.
The agreements and instruments governing our indebtedness contain restrictions and limitations that could significantly impact our ability to operate our business.
The Credit Facilities contain covenants that, among other things, restrict our ability to:
|
· |
incur additional indebtedness (including guarantees of other indebtedness); |
|
· |
pay dividends to ServiceMaster, redeem stock, or make other restricted payments, including investments and, in the case of the Revolving Credit Facility, make acquisitions; |
|
· |
prepay, repurchase or amend the terms of certain outstanding indebtedness; |
|
· |
enter into certain types of transactions with affiliates; |
|
· |
transfer or sell assets; |
|
· |
create liens; |
|
· |
merge, consolidate or sell all or substantially all of our assets; and |
|
· |
enter into agreements restricting dividends or other distributions by our subsidiaries. |
The restrictions in the agreements governing the Credit Facilities and the instruments governing our other indebtedness may prevent us from taking actions that we believe would be in the best interest of our business and may make it difficult for us to execute our business strategy successfully or effectively compete with companies that are not similarly restricted. We may also incur future debt obligations that might subject us to additional restrictive covenants that could affect our financial and operational flexibility. We may be unable to refinance our indebtedness, at maturity or otherwise, on terms acceptable to us, or at all.
Our ability to comply with the covenants and restrictions contained in the agreements governing the Credit Facilities and the instruments governing our other indebtedness may be affected by economic, financial and industry conditions beyond our control including credit or capital market disruptions. The breach of any of these covenants or restrictions could result in a default that would permit the applicable lenders to declare all amounts outstanding thereunder to be due and payable, together with accrued and unpaid interest. If we are unable to repay indebtedness, lenders having secured obligations, such as the lenders under the Credit Facilities,
20
could proceed against the collateral securing the indebtedness. In any such case, we may be unable to borrow under the Credit Facilities and may not be able to repay the amounts due under such facilities or our other outstanding indebtedness. This could have serious consequences to our financial position and results of operations and could cause us to become bankrupt or insolvent.
Our ability to generate the significant amount of cash needed to pay interest and principal on our indebtedness and our ability to refinance all or a portion of our indebtedness or obtain additional financing depends on many factors beyond our control.
We are a holding company, and as such we have no independent operations or material assets other than ownership of equity interests in our subsidiaries. We depend on our subsidiaries to distribute funds to us so that we may pay obligations and expenses, including satisfying obligations with respect to indebtedness. Our ability to make scheduled payments on, or to refinance our obligations under, our indebtedness depends on the financial and operating performance of our subsidiaries, and their ability to make distributions and dividends to us, which, in turn, depends on their results of operations, cash flows, cash requirements, financial position and general business conditions and any legal and regulatory restrictions on the payment of dividends to which they may be subject, many of which may be beyond our control.
There are third party restrictions on the ability of certain of our subsidiaries to transfer funds to us. If we cannot receive sufficient distributions from our subsidiaries, we may not be able to meet our obligations to fund general corporate expenses or service our debt obligations. These restrictions are related to regulatory requirements at American Home Shield and to a subsidiary borrowing arrangement at ServiceMaster Acceptance Company Limited Partnership (“SMAC”). The payment of ordinary and extraordinary dividends by our home warranty and similar subsidiaries (through which we conduct our American Home Shield business) are subject to significant regulatory restrictions under the laws and regulations of the states in which they operate. Among other things, such laws and regulations require certain such subsidiaries to maintain minimum capital and net worth requirements and may limit the amount of ordinary and extraordinary dividends and other payments that these subsidiaries can pay to us. As of December 31, 2015, the total net assets subject to these third party restrictions was $169 million. Such limitations are expected to be in effect through the end of 2016.
We may be unable to maintain a level of cash flows from operating activities sufficient to permit us to pay the principal and interest on our indebtedness. If our cash flow and capital resources are insufficient to fund our debt service obligations, we may be forced to reduce or delay capital expenditures, sell assets, seek to obtain additional equity capital or restructure our indebtedness. In the future, our cash flow and capital resources may not be sufficient for payments of interest on and principal of our indebtedness, and such alternative measures may not be successful and may not permit us to meet our scheduled debt service obligations.
The $2,336 million of outstanding borrowings under the Term Loan Facility, as of December 31, 2015, after including the unamortized portion of the original issue discount paid and the unamortized debt issuance costs, have a maturity date of July 1, 2021. The Revolving Credit Facility is scheduled to mature on July 1, 2019. We may be unable to refinance any of our indebtedness or obtain additional financing, particularly because of our high levels of indebtedness. Market disruptions, such as those experienced in 2008 and 2009, as well as our significant indebtedness levels, may increase our cost of borrowing or adversely affect our ability to refinance our obligations as they become due. If we are unable to refinance our indebtedness or access additional credit, or if short-term or long-term borrowing costs dramatically increase, our ability to finance current operations and meet our short term and long term obligations could be adversely affected.
If we cannot make scheduled payments on our indebtedness, we will be in default, the lenders under the Credit Facilities could terminate their commitments to loan money, the secured lenders could foreclose against the assets securing their borrowings and we could be forced into bankruptcy or liquidation.
Despite our indebtedness levels, we and our subsidiaries may be able to incur substantially more indebtedness. This could further exacerbate the risks associated with our substantial indebtedness.
We and our subsidiaries may be able to incur substantial additional indebtedness in the future. The terms of the instruments governing our indebtedness do not prohibit us or fully prohibit our subsidiaries from doing so. The Credit Facilities permit additional borrowings beyond the committed amounts under certain circumstances. If new indebtedness is added to our current indebtedness levels, the related risks we face would increase, and we may not be able to meet all of our debt obligations.
Risks Related to Our Common Stock
ServiceMaster is a holding company with no operations of its own, and it depends on its subsidiaries for cash to fund all of its operations and expenses, including to make future dividend payments, if any.
ServiceMaster’s operations are conducted entirely through our subsidiaries, and our ability to generate cash to fund our operations and expenses, to pay dividends or to meet debt service obligations is highly dependent on the earnings and the receipt of funds from our subsidiaries through dividends or intercompany loans. Deterioration in the financial condition, earnings or cash flow of our subsidiaries for any reason could limit or impair their ability to pay such distributions. Additionally, to the extent that ServiceMaster needs funds, and its subsidiaries are restricted from making such distributions under applicable law or regulation or under the terms of our financing arrangements, or are otherwise unable to provide such funds, it could materially adversely affect our business, financial condition, results of operations or prospects.
For example, there are third-party restrictions on the ability of certain of our subsidiaries to transfer funds to us. If we cannot receive sufficient distributions from our subsidiaries, we may not be able to meet our obligations to fund general corporate expenses or
21
service our debt obligations. These restrictions are related to regulatory requirements at American Home Shield and to a subsidiary borrowing arrangement at SMAC. The payment of ordinary and extraordinary dividends by our home warranty and similar subsidiaries (through which we conduct our American Home Shield business) are subject to significant regulatory restrictions under the laws and regulations of the states in which they operate. Among other things, such laws and regulations require certain such subsidiaries to maintain minimum capital and net worth requirements and may limit the amount of ordinary and extraordinary dividends and other payments that these subsidiaries can pay to us. As of December 31, 2015, the total net assets subject to these third-party restrictions was $169 million. Such limitations are expected to be in effect through the end of 2016.
Further, the terms of the agreements governing the Credit Facilities significantly restrict the ability of our subsidiaries to pay dividends, make loans or otherwise transfer assets to ServiceMaster. Furthermore, our subsidiaries are permitted under the terms of the Credit Facilities and other indebtedness to incur additional indebtedness that may restrict or prohibit the making of distributions, the payment of dividends or the making of loans by such subsidiaries to us. In addition, Delaware law may impose requirements that may restrict our ability to pay dividends to holders of our common stock.
We do not currently expect to declare or pay dividends on our common stock for the foreseeable future. Payments of dividends, if any, will be at the sole discretion of our board of directors after taking into account various factors, including general and economic conditions, our financial condition and operating results, our available cash and current and anticipated cash needs, capital requirements, contractual, legal, tax and regulatory restrictions and implications of the payment of dividends by us to our stockholders or by our subsidiaries to us, and such other factors as our board of directors may deem relevant. In addition, Delaware law may impose requirements that may restrict our ability to pay dividends to holders of our common stock. To the extent that we determine in the future to pay dividends on our common stock, none of our subsidiaries will be obligated to make funds available to us for the payment of dividends.
The market price of our common stock may be volatile and could decline.
The market price of our common stock may fluctuate significantly. Among the factors that could affect our stock price are:
|
· |
industry or general market conditions; |
|
· |
domestic and international economic factors unrelated to our performance; |
|
· |
lawsuits, enforcement actions and other claims by third parties or governmental authorities; |
|
· |
changes in our customers’ preferences; |
|
· |
new regulatory pronouncements and changes in regulatory guidelines; |
|
· |
actual or anticipated fluctuations in our quarterly operating results; |
|
· |
changes in securities analysts’ estimates of our financial performance or lack of research coverage and reports by industry analysts; |
|
· |
action by institutional stockholders or other large stockholders (including the Equity Sponsors), including additional future sales of our common stock; |
|
· |
failure to meet any guidance given by us or any change in any guidance given by us, or changes by us in our guidance practices; |
|
· |
announcements by us of significant impairment charges; |
|
· |
speculation in the press or investment community; |
|
· |
investor perception of us and our industry; |
|
· |
changes in market valuations or earnings of similar companies; |
|
· |
announcements by us or our competitors of significant contracts, acquisitions, dispositions or strategic partnerships; |
|
· |
war, terrorist acts and epidemic disease; |
|
· |
any future sales of our common stock or other securities; and |
|
· |
additions or departures of key personnel. |
The stock markets have experienced extreme volatility in recent years that has been unrelated to the operating performance of particular companies. These broad market fluctuations may adversely affect the market price of our common stock. In the past, following periods of volatility in the market price of a company’s securities, class action litigation has often been instituted against the affected company. Any litigation of this type brought against us could result in substantial costs and a diversion of our management’s attention and resources, which would harm our business, operating results and financial condition.
Future sales of shares by existing stockholders could cause our stock price to decline.
Sales of substantial amounts of our common stock in the public market, or the perception that these sales could occur, could cause the market price of our common stock to decline. These sales, or the possibility that these sales may occur, also might make it more difficult for us to sell equity securities in the future at a time and at a price that we deem appropriate. As of February 19, 2016, we had 135,575,559 outstanding shares of common stock. Of these shares, all of the 121,996,763 shares of common stock sold by us in our initial public offering and in the secondary offerings in February 2015, May 2015 and November 2015 by certain of our stockholders, including the CD&R Funds and the StepStone Funds, are freely transferable without restriction or further registration under the Securities Act, except for any shares held by our “affiliates” as that term is defined in Rule 144 under the Securities Act.
22
In July 2014, we filed a registration statement on Form S-8 under the Securities Act to register the shares of common stock to be issued under our equity compensation plans and, as a result, all shares of common stock acquired upon exercise of (i) stock options granted under these plans and (ii) other equity based awards granted under the ServiceMaster Global Holdings, Inc. 2014 Omnibus Incentive Plan (“Omnibus Incentive Plan”), including approximately 1.7 million shares of our common stock that have been sold in the public market through the exercise of stock options as of February 19, 2016, are freely tradable under the Securities Act, unless purchased by our affiliates. As of February 19, 2016, there were stock options outstanding to purchase a total of 3,584,716 shares of our common stock and there were 480,649 shares of our common stock subject to restricted stock units. In addition, 7,481,708 and 965,698 shares of our common stock are reserved for future issuances under our Omnibus Incentive Plan and the ServiceMaster Global Holdings, Inc. Employee Stock Purchase Plan (“Employee Stock Purchase Plan”), respectively.
On February 24, 2015, our board of directors approved and recommended for approval by our stockholders the Employee Stock Purchase Plan, which became effective for offering periods commencing July 1, 2015. The Employee Stock Purchase Plan is intended to qualify for the favorable tax treatment under Section 423 of the Code. Under the plan, eligible employees of the Company may purchase common stock, subject to Internal Revenue Service limits, during pre specified offering periods at a discount established by the Company not to exceed ten percent of the then current fair market value. On April 27, 2015, our stockholders approved the Employee Stock Purchase Plan with a maximum of one million shares of common stock authorized for sale under the plan. On November 3, 2015, we filed a registration statement on Form S-8 under the Securities Act to register the 1,000,000 shares of common stock that may be issued under the Employee Stock Purchase Plan and, as a result, all shares of common stock acquired under the Employee Stock Purchase Plan will be freely tradable under the Securities Act, unless purchased by our affiliates.
The remaining shares of our common stock outstanding as of February 19, 2016 are restricted securities within the meaning of Rule 144 under the Securities Act, but are eligible for resale subject to applicable volume, means of sale, holding period and other limitations of Rule 144 under the Securities Act or pursuant to an exception from registration under Rule 701 under the Securities Act.
In the future, we may issue additional shares of common stock or other equity or debt securities convertible into or exercisable or exchangeable for shares of our common stock in connection with a financing, acquisition, litigation settlement or employee arrangement or otherwise. Any of these issuances could result in substantial dilution to our existing stockholders and could cause the trading price of our common stock to decline.
If securities or industry analysts do not publish research or publish misleading or unfavorable research about our business, our stock price and trading volume could decline.
The trading market for our common stock depends in part on the research and reports that securities or industry analysts publish about us or our business. If one or more of the analysts that covers our common stock downgrades our stock or publishes misleading or unfavorable research about our business, our stock price would likely decline. If one or more of the analysts ceases coverage of our common stock or fails to publish reports on us regularly, demand for our common stock could decrease, which could cause our common stock price or trading volume to decline.
Future offerings of debt or equity securities which would rank senior to our common stock may adversely affect the market price of our common stock.
If, in the future, we decide to issue debt or equity securities that rank senior to our common stock, it is likely that such securities will be governed by an indenture or other instrument containing covenants restricting our operating flexibility. Additionally, any convertible or exchangeable securities that we issue in the future may have rights, preferences and privileges more favorable than those of our common stock and may result in dilution to owners of our common stock. We and, indirectly, our stockholders, will bear the cost of issuing and servicing such securities. Because our decision to issue debt or equity securities in any future offering will depend on market conditions and other factors beyond our control, we cannot predict or estimate the amount, timing or nature of our future offerings. Thus, holders of our common stock will bear the risk of our future offerings reducing the market price of our common stock and diluting the value of their stock holdings in us.
Fulfilling our obligations incident to being a public company, including with respect to the requirements of and related rules under the Sarbanes-Oxley Act of 2002, is expensive and time-consuming, and any delays or difficulties in satisfying these obligations could have a material adverse effect on our future results of operations and our stock price.
Our initial public offering was completed on July 1, 2014. As a public company, we are subject to the reporting and corporate governance requirements, under the listing standards of the NYSE and the Sarbanes-Oxley Act of 2002, that apply to issuers of listed equity, which impose certain significant compliance costs and obligations upon us. The changes necessitated by being a publicly listed company require a significant commitment of additional resources and management oversight which increase our operating costs. Other expenses associated with being a public company include increases in auditing, accounting and legal fees and expenses, investor relations expenses, increased directors’ fees and director and officer liability insurance costs, registrar and transfer agent fees and listing fees, as well as other expenses. As a public company, we are required, among other things, to define and expand the roles and the duties of our board of directors and its committees and institute more comprehensive compliance and investor relations functions. Failure to comply with the Sarbanes-Oxley Act of 2002 could potentially subject us to sanctions or investigations by the SEC, the NYSE or other regulatory authorities.
23
Anti-takeover provisions in our amended and restated certificate of incorporation and amended and restated by-laws could discourage, delay or prevent a change of control of our company and may affect the trading price of our common stock.
Our amended and restated certificate of incorporation and amended and restated by laws include a number of provisions that may discourage, delay or prevent a change in our management or control over us that stockholders may consider favorable. For example, our amended and restated certificate of incorporation and amended and restated by laws collectively:
|
· |
authorize the issuance of “blank check” preferred stock that could be issued by our board of directors to thwart a takeover attempt; |
|
· |
provide for a classified board of directors, which divides our board of directors into three classes, with members of each class serving staggered three-year terms, which prevents stockholders from electing an entirely new board of directors at an annual meeting; |
|
· |
limit the ability of stockholders to remove directors; |
|
· |
provide that vacancies on our board of directors, including vacancies resulting from an enlargement of our board of directors, may be filled only by a majority vote of directors then in office; |
|
· |
prohibit stockholders from calling special meetings of stockholders; |
|
· |
prohibit stockholder action by written consent, thereby requiring all actions to be taken at a meeting of the stockholders; |
|
· |
establish advance notice requirements for nominations of candidates for election as directors or to bring other business before an annual meeting of our stockholders; and |
|
· |
require the approval of holders of at least 662/3% of the outstanding shares of our common stock to amend our amended and restated by-laws and certain provisions of our amended and restated certificate of incorporation. |
These provisions may prevent our stockholders from receiving the benefit from any premium to the market price of our common stock offered by a bidder in a takeover context. Even in the absence of a takeover attempt, the existence of these provisions may adversely affect the prevailing market price of our common stock if the provisions are viewed as discouraging takeover attempts in the future.
Our amended and restated certificate of incorporation and amended and restated by laws may also make it difficult for stockholders to replace or remove our management. These provisions may facilitate management entrenchment that may delay, deter, render more difficult or prevent a change in our control, which may not be in the best interests of our stockholders.
We do not intend to pay dividends on our common stock and, consequently, your ability to achieve a return on your investment will depend on appreciation in the price of our common stock.
We do not intend to declare and pay dividends on our common stock for the foreseeable future. We currently intend to use our future earnings, if any, to repay debt, to repurchase shares of our common stock, to fund our growth, to develop our business, for working capital needs and general corporate purposes. Therefore, you are not likely to receive any dividends on your common stock for the foreseeable future and the success of an investment in shares of our common stock will depend upon any future appreciation in their value. There is no guarantee that shares of our common stock will appreciate in value or even maintain the price at which our stockholders have purchased their shares. In addition, ServiceMaster’s operations are conducted almost entirely through our subsidiaries. As such, to the extent that we determine in the future to pay dividends on our common stock, none of our subsidiaries will be obligated to make funds available to ServiceMaster for the payment of dividends. Further, the agreements governing our Credit Facilities significantly restrict the ability of our subsidiaries to pay dividends or otherwise transfer assets to us. In addition, the payment of ordinary and extraordinary dividends by our subsidiaries that are regulated as insurance, home service, or similar companies is subject to applicable state law limitations, and Delaware law may impose additional requirements that may restrict our ability to pay dividends to holders of our common stock.
Our amended and restated certificate of incorporation designates the Court of Chancery of the State of Delaware as the exclusive forum for certain litigation that may be initiated by our stockholders, which could limit our stockholders’ ability to obtain a favorable judicial forum for disputes with us.
Our amended and restated certificate of incorporation provides that the Court of Chancery of the State of Delaware is the sole and exclusive forum for (i) any derivative action or proceeding brought on our behalf, (ii) any action asserting a claim of breach of a fiduciary duty owed to us or our stockholders by any of our directors, officers, employees or agents, (iii) any action asserting a claim against us arising under the General Corporation Law of the State of Delaware or (iv) any action asserting a claim against us that is governed by the internal affairs doctrine. By becoming a stockholder in our company, you will be deemed to have notice of and have consented to the provisions of our amended and restated certificate of incorporation related to choice of forum. The choice of forum provision in our amended and restated certificate of incorporation may limit our stockholders’ ability to obtain a favorable judicial forum for disputes with us.
24
Risks Related to the TruGreen Spin-Off
If the TruGreen Separation Transaction were ultimately determined to be a taxable transaction for U.S. federal income tax purposes, then we could be subject to significant tax liability.
In connection with the separation transaction that we completed in January 2014 (the “TruGreen Spin-off”), resulting in the spin-off of the assets and certain liabilities of the business that comprises the lawn, tree and shrub care services previously conducted by ServiceMaster primarily under the TruGreen brand name (collectively, the “TruGreen Business”) through a tax free, pro rata dividend to our stockholders, we received an opinion of tax counsel with respect to the tax free nature of the TruGreen Spin-off to ServiceMaster, TruGreen and ServiceMaster’s stockholders under Section 355 and related provisions of the Code. The opinion relied on an Internal Revenue Service (the “IRS”) private letter ruling as to matters covered by the ruling. The tax opinion was based on, among other things, certain assumptions and representations as to factual matters made by us, which, if incorrect or inaccurate in any material respect, would jeopardize the conclusions reached by tax counsel in its opinion. The opinion is not binding on the IRS or the courts, and the IRS or the courts may not agree with the opinion. If the TruGreen Spin-off were ultimately determined not to be tax free, we could be liable for the U.S. federal income taxes imposed as a result of the transaction. Furthermore, events subsequent to the TruGreen Spin-off could cause us to recognize a taxable gain in connection therewith. In addition, as is customary with tax free spin-off transactions, we and the Equity Sponsors are limited in our ability to pursue certain strategic transactions.
Federal and state fraudulent transfer laws and Delaware corporate law may permit a court to void the TruGreen Spin-Off, which would adversely affect our financial condition and our results of operations.
In connection with the TruGreen Spin-off, we undertook several corporate restructuring transactions which, along with the contributions and distributions to be made as part of the spin-off, may be subject to challenge under federal and state fraudulent conveyance and transfer laws as well as under Delaware corporate law.
Under applicable laws, any transaction, contribution or distribution completed as part of the spin-off could be voided as a fraudulent transfer or conveyance if, among other things, the transferor received less than reasonably equivalent value or fair consideration in return and was insolvent or rendered insolvent by reason of the transfer.
We cannot be certain as to the standards a court would use to determine whether or not any entity involved in the spin-off was insolvent at the relevant time. In general, however, a court would look at various facts and circumstances related to the entity in question, including evaluation of whether or not:
|
· |
the sum of its debts, including contingent and unliquidated liabilities, was greater than the fair saleable value of all of its assets; |
|
· |
the present fair saleable value of its assets was less than the amount that would be required to pay its probable liability on its existing debts, including contingent liabilities, as they become absolute and mature; or |
|
· |
it could not pay its debts as they became due. |
If a court were to find that any transaction, contribution or distribution involved in the spin-off was a fraudulent transfer or conveyance, the court could void the transaction, contribution or distribution. In addition, the spin-off could also be voided if a court were to find that the spin-off was not a legal dividend under Delaware corporate law. The resulting complications, costs and expenses of either finding could materially adversely affect our business, financial condition and results of operations.
Our directors and officers may have actual or potential conflicts of interest because of their equity ownership in New TruGreen.
As a result of the completion of the TruGreen Spin-off, TruGreen Holding Corporation (“New TruGreen”) operates the TruGreen Business as a private independent company. Our directors and officers may own shares of New TruGreen’s common stock or be affiliated with certain equity owners of New TruGreen. This ownership may create, or may create the appearance of, conflicts of interest when these directors and officers are faced with decisions that could have different implications for us and New TruGreen. In connection with the TruGreen Spin-off, we entered into a transition services agreement with New TruGreen under which we will provide a range of support services to New TruGreen for a limited period of time. Potential conflicts of interest could arise in connection with the resolution of any dispute that may arise between us and New TruGreen regarding the terms of the transition services agreement or other agreements governing the TruGreen Spin-off and the relationship thereafter between the companies.
ITEM 1B. UNRESOLVED STAFF COMMENTS
None.
The headquarters for Terminix, along with the corporate headquarters, are located in leased premises at 860 Ridge Lake Boulevard, Memphis, Tennessee. The headquarters for American Home Shield are located in leased premises at 889 Ridge Lake Boulevard, Memphis, Tennessee. The headquarters for the Franchise Services Group and a training facility are located in owned premises at 3839 Forest Hill Irene Road, Memphis, Tennessee. In addition, we lease space for call centers located at 6399 Shelby View Drive, Memphis, Tennessee and 7620 Appling Center Drive, Memphis, Tennessee; offices located at 855 Ridge Lake Boulevard, Memphis, Tennessee; and a training facility located at 1650 Shelby Oaks Drive North, Memphis, Tennessee.
25
We and our operating companies own and lease a variety of facilities, principally in the United States, for branch and service center operations and for office, storage, call center and data processing space. Our branches are strategically located to optimize route efficiency, market coverage and branch overhead. The following table identifies the number of owned and leased facilities, other than the headquarters properties listed above, used by each of our reportable segments as of December 31, 2015. We believe that these facilities, when considered with the corporate headquarters, call center facilities, offices and training facilities described above, are suitable and adequate to support the current needs of its business.
|
Owned |
Leased |
|||
|
Reportable Segment |
Facilities |
Facilities |
||
|
Terminix |
19 | 334 | ||
|
American Home Shield |
1 | 4 | ||
|
Franchise Services Group |
— |
65 |
In March 2015, we were informed that the DOJ initiated a criminal investigation into allegations that a local Terminix branch used methyl bromide as a fumigant at a resort in St. John, U.S. Virgin Islands, resulting in serious injuries to four members of a family vacationing there. The U.S. Virgin Islands government is also investigating the matter, as is the EPA. The EPA also requested information concerning the possible distribution, sale or use of methyl bromide in Puerto Rico. During the year ended December 31, 2015, we recorded in our consolidated statement of operations and comprehensive income (loss) a charge of $3 million in connection with civil claims related to the U.S. Virgin Islands matter, an amount equal to our insurance deductible under our general liability insurance program, although no assurance can be given regarding our insurance coverage or recoveries in connection with such civil claims.
We continue to cooperate fully with all relevant governmental authorities in their investigations and have had discussions with the DOJ concerning potential resolution of the criminal investigation. Although we have recorded in our consolidated statement of operations and comprehensive income (loss) a charge of $8 million as a result of those discussions, the amount and extent of any further potential penalties, fines, sanctions, costs and damages that the federal or other governmental authorities may yet impose, investigation or other costs and reputational harm, as well as the impact of any civil, criminal or other claims or judicial, administrative or regulatory proceedings resulting from or related to the U.S. Virgin Islands incident, which could be material, is not currently known or reasonably estimable, and any such penalties, fines, sanctions, costs or damages may not be covered under our general liability insurance program.
On September 15, 2015, a lawsuit was filed in the Circuit Court of the 15th Judicial Circuit in and for Palm Beach County, Florida, styled Carl Robert McCaughey, et al. v. Terminix International Company Limited Partnership, Sunland Pest Control Services, Inc., et al. (Case No. 32080796). The lawsuit alleges that fumigation of a Florida family’s residence by Sunland, a subcontractor of Terminix, resulted in serious injuries to one of the family’s children, alleges claims for negligence and strict liability, and seeks an unspecified amount of monetary and punitive damages. The court has set a trial date in September 2016. The DOJ and other federal and state agencies are investigating the matter, and the DOJ has filed criminal charges against Sunland and two persons associated with Sunland. We continue to cooperate fully with all relevant governmental authorities. The amount and extent of any potential penalties, fines, sanctions, costs and damages that the federal or other governmental authorities may impose, investigation or other costs and reputational harm, as well as the impact of any civil, criminal or other claims or judicial, administrative or regulatory proceedings resulting from or related to this incident, which could be material, is not currently known or reasonably estimable, and any such penalties, fines, sanctions, costs or damages may not be covered under our general liability insurance program.
In addition to the matters discussed above, in the ordinary course of conducting business activities, we and our subsidiaries become involved in judicial, administrative and regulatory proceedings involving both private parties and governmental authorities. These proceedings include insured and uninsured matters that are brought on an individual, collective, representative and class action basis, or other proceedings involving regulatory, employment, general and commercial liability, automobile liability, wage and hour, environmental and other matters. We have entered into settlement agreements in certain cases, including with respect to putative collective and class actions, which are subject to court or other approvals. If one or more of our settlements are not finally approved, we could have additional or different exposure, which could be material. Subject to the paragraphs above, we do not expect any of these proceedings to have a material effect on our reputation, business, financial position, results of operations or cash flows; however, we can give no assurance that the results of any such proceedings will not materially affect our reputation, business, financial position, results of operations and cash flows. See Note 9 to the consolidated financial statements for more details.
ITEM 4. MINE SAFETY DISCLOSURES
None.
26
ITEM 5. MARKET FOR REGISTRANT’S COMMON EQUITY, RELATED STOCKHOLDER MATTERS AND ISSUER PURCHASES OF EQUITY SECURITIES
Market Information
Our common stock is listed on the NYSE under the symbol ‘‘SERV.’’ Our common stock began trading on the NYSE on June 26, 2014. As of February 19, 2016, there were approximately 13 registered holders of our common stock.
The following table sets forth the high and low sale prices per share of our common stock during 2015 and 2014 as reported on the NYSE:
|
High Sales Price |
Low Sales Price |
|||
|
2015: |
||||
|
First Quarter |
$ 36.95 |
$ 25.98 |
||
|
Second Quarter |
$ 37.30 |
$ 31.98 |
||
|
Third Quarter |
$ 38.90 |
$ 32.10 |
||
|
Fourth Quarter |
$ 39.99 |
$ 32.79 |
||
|
2014: |
||||
|
Second Quarter (beginning June 26, 2014) |
$ 19.75 |
$ 17.08 |
||
|
Third Quarter |
$ 25.23 |
$ 17.05 |
||
|
Fourth Quarter |
$ 28.20 |
$ 20.32 |
The graph below presents our cumulative total shareholder returns relative to the performance of the Standard & Poor’s 500 Composite Stock Index and Standard & Poor’s 400 Consumer Services Index, commencing on June 26, 2014, our initial day of trading. The graph assumes $100 invested at the opening price of our common stock on NYSE and each index on June 26, 2014.
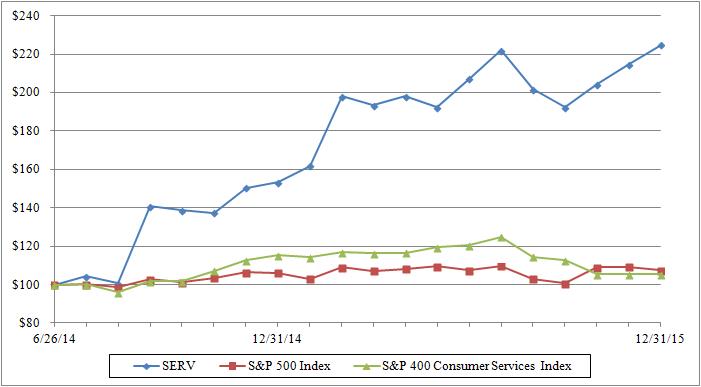
Dividends
We did not pay any cash dividends in 2014 or 2015. The spin-off of the TruGreen Business was accomplished through a tax-free, stock dividend. We do not intend to declare or pay dividends on our common stock for the foreseeable future. We currently intend to use our future earnings, if any, to repay debt, to repurchase shares of our common stock, to fund our growth, to develop our business, for working capital needs and general corporate purposes. Our ability to pay dividends to holders of our common stock is significantly limited as a practical matter by the Credit Facilities, insofar as we may seek to pay dividends out of funds made available to us by our subsidiaries, because our debt instruments directly or indirectly restrict our ability to pay dividends. Any future determination to pay dividends on our common stock is subject to the discretion of our board of directors and will depend upon various factors, including our results of operations, financial condition, liquidity requirements, capital requirements, level of
27
indebtedness, contractual restrictions with respect to payment of dividends, restrictions imposed by applicable law, general business conditions and other factors that our board of directors may deem relevant. See “Liquidity—Limitations on Distributions and Dividends by Subsidiaries” for a description of the impact of our restrictions under our debt instruments on our ability to pay dividends.
Issuer Purchases of Equity Securities
|
Maximum number |
|||||||||
|
Total number of |
(or approximate |
||||||||
|
shares purchased as |
dollar value) of shares |
||||||||
|
part of publicly |
that may yet be |
||||||||
|
Total number of |
Average price |
announced plans or |
purchased under the |
||||||
|
Period |
shares purchased(1) |
paid per share |
programs |
plans or programs |
|||||
|
Oct. 1, 2015 through Oct. 31, 2015 |
— |
$ |
— |
N/A |
N/A |
||||
|
Nov. 1, 2015 through Nov. 30, 2015 |
— |
$ |
— |
N/A |
N/A |
||||
|
Dec. 1, 2015 through Dec. 31, 2015 |
10,452 |
$ |
38.34 |
N/A |
N/A |
||||
|
Total |
10,452 |
$ |
38.34 |
N/A |
N/A |
||||
___________________________________
(1) All shares were acquired from employees upon net settlement of deferred stock units (“DSUs”) to cover withholding tax obligations.
Share Repurchase Program
On February 23, 2016, our board of directors authorized a three-year share repurchase program, under which we may repurchase up to $300 million of outstanding shares of our common stock. We expect to fund the share repurchases from operating cash flow. The share repurchase program is part of our capital allocation strategy that focuses on sustainable growth and maximizing shareholder value.
28
ITEM 6. SELECTED FINANCIAL DATA
The following table sets forth our selected financial data derived from our audited consolidated financial statements for each of the periods indicated. The selected financial data presented below should be read in conjunction with Item 7 “Management’s Discussion and Analysis of Financial Condition and Results of Operations” and the consolidated financial statements and related notes included in Item 8 of this Annual Report on Form 10-K. Our consolidated financial information may not be indicative of our future performance.
Five-Year Financial Summary
|
Year Ended December 31, |
||||||||||||||||||||
|
(In millions, except per share data) |
2015 |
2014 |
2013 |
2012 |
2011 |
|||||||||||||||
|
Operating Results: |
||||||||||||||||||||
|
Revenue |
$ |
2,594 |
$ |
2,457 |
$ |
2,293 |
$ |
2,214 |
$ |
2,105 | ||||||||||
|
Cost of services rendered and products sold |
1,375 | 1,298 | 1,220 | 1,196 | 1,125 | |||||||||||||||
|
Selling and administrative expenses |
666 | 669 | 691 | 678 | 648 | |||||||||||||||
|
401(k) Plan corrective contribution(1) |
23 |
— |
— |
— |
— |
|||||||||||||||
|
Impairment of software and other related costs(2) |
— |
47 |
— |
— |
— |
|||||||||||||||
|
Consulting agreement termination fees(3) |
— |
21 |
— |
— |
— |
|||||||||||||||
|
Interest expense |
167 | 219 | 247 | 245 | 266 | |||||||||||||||
|
Loss on extinguishment of debt(4) |
58 | 65 |
— |
55 |
— |
|||||||||||||||
|
Income (Loss) from continuing operations |
162 | 43 | 42 | (18) | (7) | |||||||||||||||
|
Cash dividends per share |
$ |
— |
$ |
— |
$ |
— |
$ |
— |
$ |
— |
||||||||||
|
Weighted-average shares outstanding: |
||||||||||||||||||||
|
Basic |
135.0 | 112.8 | 91.6 | 91.9 | 92.0 | |||||||||||||||
|
Diluted |
136.6 | 113.8 | 92.2 | 91.9 | 92.0 | |||||||||||||||
|
Basic Earnings (Loss) Per Share -- Continuing Operations |
$ |
1.20 |
$ |
0.38 |
$ |
0.46 |
$ |
(0.20) |
$ |
(0.08) | ||||||||||
|
Diluted Earnings (Loss) Per Share -- Continuing Operations |
$ |
1.19 |
$ |
0.38 |
$ |
0.46 |
$ |
(0.20) |
$ |
(0.08) | ||||||||||
|
Financial Position (as of period end): |
||||||||||||||||||||
|
Total assets |
$ |
5,098 |
$ |
5,028 |
$ |
5,760 |
$ |
6,269 |
$ |
7,039 | ||||||||||
|
Total long-term debt |
2,752 | 3,026 | 3,867 | 3,882 | 3,825 | |||||||||||||||
|
Total shareholders’ equity |
545 | 359 | 23 | 535 | 1,234 | |||||||||||||||
|
Cash Flow Data: |
||||||||||||||||||||
|
Net cash provided from operating activities from continuing operations |
$ |
336 |
$ |
253 |
$ |
208 |
$ |
104 |
$ |
74 | ||||||||||
|
Net cash used for investing activities from continuing operations |
(98) | (56) | (70) | (85) | (80) | |||||||||||||||
|
Net cash used for financing activities from continuing operations |
(319) | (277) | (78) | (14) | (110) | |||||||||||||||
|
Other Financial Data: |
||||||||||||||||||||
|
Adjusted EBITDA(5) |
$ |
622 |
$ |
557 |
$ |
450 |
$ |
413 |
$ |
397 | ||||||||||
|
Adjusted EBITDA Margin(6) |
24.0 |
% |
22.7 |
% |
19.6 |
% |
18.7 |
% |
18.9 |
% |
||||||||||
|
Free Cash Flow(7) |
$ |
358 |
$ |
274 |
$ |
169 |
$ |
100 |
$ |
22 | ||||||||||
__________________________________
|
(1) |
Represents costs related to the 401(k) Plan described in Note 11 to the consolidated financial statements. |
|
(2) |
Represents the impairment of software and other related costs described in Note 2 to the consolidated financial statements. |
|
(3) |
Represents consulting agreement termination fees described in Note 10 to the consolidated financial statements. |
|
(4) |
For 2015 and 2014, represents a loss on extinguishment of debt as described in Note 12 to the consolidated financial statements. For 2012, represents a loss on extinguishment of debt related to the redemption of the $996 million aggregate principal amount of the then-existing 10.75% senior notes maturing in 2015 and repayment of $276 million of outstanding borrowings under the then-existing term loan facility (together with the pre-funded letter of credit facility, the “Old Term Facilities”). |
|
(5) |
We use Adjusted EBITDA to facilitate operating performance comparisons from period to period. Adjusted EBITDA is a supplemental measure of our performance that is not required by, or presented in accordance with, GAAP. Adjusted EBITDA is not a measurement of our financial performance under GAAP and should not be considered as an alternative to net income or any other performance measures derived in accordance with GAAP or as an alternative to net cash provided by operating activities or any other measures of our cash flow or liquidity. Adjusted EBITDA means net income (loss) before: income (loss) from discontinued operations, net of income taxes; provision (benefit) for income taxes; loss on extinguishment of debt; interest expense; depreciation and amortization expense; 401(k) Plan corrective contribution; non-cash impairment of software and other related costs; non-cash impairment of property and equipment; non-cash stock-based compensation
29 |
expense; restructuring charges; gain on sale of Merry Maids branches; management and consulting fees; consulting agreement termination fees; and other non-operating expenses. |
We believe Adjusted EBITDA facilitates company-to-company operating performance comparisons by excluding potential differences caused by variations in capital structures (affecting net interest income and expense), taxation, the age and book depreciation of facilities and equipment (affecting relative depreciation expense), restructuring initiatives, consulting agreements and equity-based, long-term incentive plans, which may vary for different companies for reasons unrelated to operating performance.
Adjusted EBITDA is not necessarily comparable to other similarly titled financial measures of other companies due to the potential inconsistencies in the methods of calculation.
Adjusted EBITDA has limitations as an analytical tool, and should not be considered in isolation or as a substitute for analyzing our results as reported under GAAP. Some of these limitations are:
|
· |
Adjusted EBITDA does not reflect changes in, or cash requirements for, our working capital needs; |
|
· |
Adjusted EBITDA does not reflect our interest expense, or the cash requirements necessary to service interest or principal payments on our debt; |
|
· |
Adjusted EBITDA does not reflect our tax expense or the cash requirements to pay our taxes; |
|
· |
Adjusted EBITDA does not reflect historical capital expenditures or future requirements for capital expenditures or contractual commitments; |
|
· |
Although depreciation and amortization are non-cash charges, the assets being depreciated and amortized will often have to be replaced in the future, and Adjusted EBITDA does not reflect any cash requirements for such replacements; and |
|
· |
Other companies in our industries may calculate Adjusted EBITDA differently, limiting its usefulness as a comparative measure. |
30
The following table sets forth Adjusted EBITDA for each of our reportable segments and Corporate and reconciles total Adjusted EBITDA to Net Income (Loss) for the periods presented, which we consider to be the most directly comparable GAAP financial measure:
|
Year Ended December 31, |
|||||||||||||||
|
(In millions) |
2015 |
2014 |
2013 |
2012 |
2011 |
||||||||||
|
Adjusted EBITDA: |
|||||||||||||||
|
Terminix |
$ |
347 |
$ |
309 |
$ |
266 |
$ |
266 |
$ |
249 | |||||
|
American Home Shield |
205 | 179 | 145 | 117 | 107 | ||||||||||
|
Franchise Services Group |
77 | 78 | 78 | 70 | 75 | ||||||||||
|
Reportable Segment Adjusted EBITDA |
$ |
630 |
$ |
566 |
$ |
489 |
$ |
453 |
$ |
431 | |||||
|
Corporate(a) |
(9) | (9) | (39) | (40) | (34) | ||||||||||
|
Total Adjusted EBITDA |
$ |
622 |
$ |
557 |
$ |
450 |
$ |
413 |
$ |
397 | |||||
|
Depreciation and amortization expense |
(84) | (100) | (99) | (100) | (121) | ||||||||||
|
401(k) Plan corrective contribution(b) |
(23) |
— |
— |
— |
— |
||||||||||
|
Non-cash stock-based compensation expense(c) |
(10) | (8) | (4) | (7) | (8) | ||||||||||
|
Restructuring charges(d) |
(5) | (11) | (6) | (15) | (7) | ||||||||||
|
Gain on sale of Merry Maids branches(e) |
7 | 1 |
— |
— |
— |
||||||||||
|
Non-cash impairment of software and other related costs(f) |
— |
(47) |
— |
— |
— |
||||||||||
|
Non-cash impairment of property and equipment(g) |
— |
— |
— |
(9) |
— |
||||||||||
|
Management and consulting fees(h) |
— |
(4) | (7) | (7) | (8) | ||||||||||
|
Consulting agreement termination fees(i) |
— |
(21) |
— |
— |
— |
||||||||||
|
(Loss) income from discontinued operations, net of income taxes(j) |
(2) | (100) | (549) | (696) | 53 | ||||||||||
|
(Provision) benefit for income taxes |
(107) | (40) | (43) | 8 | 6 | ||||||||||
|
Loss on extinguishment of debt(k) |
(58) | (65) |
— |
(55) |
— |
||||||||||
|
Interest expense |
(167) | (219) | (247) | (245) | (266) | ||||||||||
|
Other non-operating expenses(l) |
(12) |
— |
(2) | (1) |
— |
||||||||||
|
Net Income (Loss) |
$ |
160 |
$ |
(57) |
$ |
(507) |
$ |
(714) |
$ |
46 | |||||
__________________________________
|
(a) |
Represents unallocated corporate expenses. |
|
(b) |
Represents costs related to the 401(k) Plan described in Note 11 to the consolidated financial statements. We exclude these charges from Adjusted EBITDA because we believe they do not reflect our on-going operations and because we believe doing so is useful to investors in aiding period-to-period comparability. |
|
(c) |
Represents the non‑cash expense of our equity‑based compensation. We exclude this expense from Adjusted EBITDA primarily because it is a non‑cash expense and because it is not used by management to assess ongoing operational performance. We believe excluding this expense from Adjusted EBITDA is useful to investors in aiding period-to-period comparability. |
|
(d) |
Represents restructuring charges related primarily to the impact of a branch optimization project at Terminix, a reorganization of leadership at Franchise Services Group and an initiative to enhance capabilities and reduce costs in our headquarters functions. We exclude these restructuring charges from Adjusted EBITDA because we believe they do not reflect our ongoing operations and because we believe doing so is useful to investors in aiding period‑to‑period comparability. |
|
(e) |
Represents the gain associated with the conversion of certain company-owned Merry Maids branches to franchises in 2014 and 2015 (the “branch conversions”). |
|
(f) |
Represents the impairment of software and other related costs described in Note 2 to the consolidated financial statements. We exclude non‑cash impairments from Adjusted EBITDA because we believe doing so is useful to investors in aiding period‑to‑period comparability. |
|
(g) |
Represents a $3 million impairment of licensed intellectual property and a $1 million impairment of abandoned real estate at Terminix, and a $4 million impairment of certain internally developed software at Merry Maids recorded in 2012. We exclude non-cash impairments of property and equipment from Adjusted EBITDA because we believe doing so is useful to investors in aiding period-to-period comparability. |
|
(h) |
Represents the amounts paid to certain of our Equity Sponsors under the consulting agreements described in Note 10 to the consolidated financial statements. We exclude these amounts from Adjusted EBITDA primarily because they are not reflective of ongoing operating results and because they are not used by management to assess ongoing operational performance. In addition, we have excluded these amounts from Adjusted EBITDA because the consulting agreements terminated in connection with our initial public offering. |
31
|
(i) |
Represents the consulting agreement termination fees described in Note 10 to the consolidated financial statements. We exclude these amounts from Adjusted EBITDA because we believe doing so is useful to investors in aiding period-to-period comparability. |
|
(j) |
Represents our loss in connection with the spin-off of TruGreen in 2014 and the disposition of our commercial landscaping business in 2011. See Note 7 to the consolidated financial statements for further discussion of the spin-off of TruGreen. We exclude these amounts from Adjusted EBITDA because these charges are not part of our ongoing operations and we believe doing so is useful to investors in aiding period-to-period comparability. |
|
(k) |
Represents the loss on extinguishment of debt described in Note 12 to the consolidated financial statements. We believe excluding this expense from Adjusted EBITDA is useful to investors in aiding period-to-period comparability. |
|
(l) |
For 2015, primarily represents secondary offering expenses and legal and environmental expenses. We exclude these amounts from Adjusted EBITDA because we believe doing so is useful to investors in aiding period-to-period comparability. |
For 2013 and 2012, represents certain administrative expenses. We excluded these expenses from the calculation of Adjusted EBITDA in order to present Adjusted EBITDA on a basis consistent with Adjusted EBITDA as reported in periods prior to our initial public offering, which is familiar to holders of our indebtedness.
|
(6) |
Adjusted EBITDA margin is defined as Adjusted EBITDA as a percentage of revenue. |
|
(7) |
Free Cash Flow is not a measurement of our financial performance or liquidity under GAAP and does not purport to be an alternative to net cash provided from operating activities from continuing operations or any other performance or liquidity measures derived in accordance with GAAP. |
Management believes Free Cash Flow is useful as a supplemental measure of our liquidity. Management uses Free Cash Flow to facilitate company-to-company cash flow comparisons by removing potential differences caused by variations in capital structures (affecting payments made or received in connection with debt issuances and debt retirements), as well as payments for consulting agreement termination fees and excess tax benefits from stock-based compensation, which may vary from company to company for reasons unrelated to operating performance.
Free Cash Flow means (i) net cash provided from operating activities from continuing operations before: call premium paid on retirement of debt; premium received on issuance of debt; cash paid for consulting agreement termination fees; and excess tax benefits from stock-based compensation; (ii) less property additions.
Free Cash Flow has limitations as an analytical tool and should not be considered in isolation or as a substitute for analyzing our results as reported under GAAP. Some of these limitations are:
|
· |
Free Cash Flow does not reflect payments made or received in connection with debt issuances and debt retirements; |
|
· |
Free Cash Flow does not reflect cash payments for consulting agreement termination fees; |
|
· |
Free Cash Flow does not reflect excess tax benefits from stock-based compensation; and |
|
· |
Other companies in our industries may calculate Free Cash Flow or similarly titled non-GAAP financial measures differently, limiting is usefulness as a comparative measure. |
The following table reconciles net cash provided from operating activities from continuing operations, which we consider to be the most directly comparable GAAP measure, to Free Cash Flow using data derived from our consolidated financial statements for the periods indicated:
|
Year Ended December 31, |
|||||||||||||||||||
|
(In millions) |
2015 |
2014 |
2013 |
2012 |
2011 |
||||||||||||||
|
Net Cash Provided from Operating Activities from |
$ |
336 |
$ |
253 |
$ |
208 |
$ |
104 |
$ |
74 | |||||||||
|
Call premium paid on retirement of debt |
49 | 35 |
— |
43 |
— |
||||||||||||||
|
Premium received on issuance of debt |
— |
— |
— |
(3) |
— |
||||||||||||||
|
Cash paid for consulting agreement termination fees |
— |
21 |
— |
— |
— |
||||||||||||||
|
Excess tax benefits from stock-based compensation |
13 |
— |
— |
— |
— |
||||||||||||||
|
Property additions |
(40) | (35) | (39) | (44) | (52) | ||||||||||||||
|
Free Cash Flow |
$ |
358 |
$ |
274 |
$ |
169 |
$ |
100 |
$ |
22 | |||||||||
32
ITEM 7. MANAGEMENT’S DISCUSSION AND ANALYSIS OF FINANCIAL CONDITION AND RESULTS OF OPERATIONS
The following information should be read in conjunction with Item 6 “Selected Financial Data” and the consolidated financial statements and related notes included in Item 8 of this Annual Report on Form 10-K. The following discussion may contain forward-looking statements that reflect our plans, estimates and beliefs. Our actual results could differ materially from those discussed in these forward-looking statements. Factors that could cause or contribute to these differences include those factors discussed below and elsewhere in this report, particularly in “—Information Regarding Forward-Looking Statements” and “Risk Factors.”
Overview
Our core services include termite and pest control, home warranties, disaster restoration, janitorial, residential cleaning, furniture repair and home inspection under the following leading brands: Terminix, American Home Shield, ServiceMaster Restore, ServiceMaster Clean, Merry Maids, Furniture Medic and AmeriSpec. Our operations for the periods presented in this report are organized into three reportable segments: Terminix, American Home Shield and Franchise Services Group.
Management Change
On September 22, 2015, our board of directors appointed Mark J. Barry as our Chief Marketing & Strategy Officer. Prior to his promotion, Mr. Barry served as Group President, American Home Shield & Franchise Services Group. In connection with Mr. Barry’s new role, our board of directors appointed Timothy M. Haynes as President, American Home Shield and Jamie Smith as Senior Vice President & Chief Information Officer. Mr. Haynes previously served as Senior Vice President & Chief Information Officer, and Mr. Smith previously served as Vice President reporting to Mr. Haynes in the IT function. In their new roles, Messrs. Barry, Haynes and Smith will report directly to Robert J. Gillette, our Chief Executive Officer. Also in connection with the management changes, Martin Wick, who is serving as President, Franchise Services Group, will now report directly to Mr. Gillette. He reported to Mr. Barry in his former position.
Key Business Metrics
We focus on a variety of indicators and key operating and financial metrics to monitor the financial condition and performance of the continuing operations of our businesses. These metrics include:
|
· |
revenue, |
|
· |
operating expenses, |
|
· |
Adjusted EBITDA, |
|
· |
net income (loss), |
|
· |
earnings (loss) per share, |
|
· |
customer retention rates, and |
|
· |
customer counts growth. |
To the extent applicable, these measures are evaluated with and without impairment, restructuring and other charges that management believes are not indicative of the earnings capabilities of our businesses. We also focus on measures designed to optimize cash flow, including the management of working capital and capital expenditures.
Revenue. Our revenue results are primarily a function of the volume and pricing of the services and products provided to our customers by our businesses as well as the mix of services and products provided across our businesses. The volume of our revenue in Terminix and American Home Shield, and in our company-owned branches in the Franchise Services Group, is impacted by new unit sales, the retention of our existing customers and tuck-in acquisitions. We expect to continue our tuck-in acquisition program at Terminix and to periodically evaluate other strategic acquisitions. Revenue results in the remainder of our Franchise Services Group are driven principally by royalty fees earned from our franchisees. We serve both residential and commercial customers, principally in the United States. In 2015, approximately 98 percent of our revenue was generated by sales in the United States.
Operating Expenses. In addition to the impact of changes in our revenue results, our operating results are affected by, among other things, the level of our operating expenses. A number of our operating expenses are subject to inflationary pressures, such as fuel, chemicals, raw materials, wages and salaries, employee benefits and health care, vehicles, contractor costs, self-insurance costs and other insurance premiums, as well as various regulatory compliance costs.
We have historically hedged a significant portion of our annual fuel consumption. Fuel costs for 2015, after the impact of the hedges and after adjusting for the impact of year-over-year changes in the number of gallons used, decreased $5 million compared to 2014 and were comparable for 2014 compared to 2013. Based upon current Department of Energy fuel price forecasts, as well as hedges we have executed to date for 2016, we project that fuel prices will decrease our fuel costs for 2016 by approximately $6 million compared to 2015.
33
After adjusting for the impact of year-over-year changes in the number of covered employees, health care and related costs for 2015 were comparable compared to 2014 while costs in 2014 increased $3 million compared to 2013. We expect our health care costs in 2016 to remain comparable to 2015.
Adjusted EBITDA. We evaluate performance and allocate resources based primarily on Adjusted EBITDA. We define Adjusted EBITDA as net income (loss) before: income (loss) from discontinued operations, net of income taxes; provision (benefit) for income taxes; loss on extinguishment of debt; interest expense; depreciation and amortization expense; 401(k) Plan corrective contribution; non-cash impairment of software and other related costs; non-cash impairment of property and equipment; non-cash stock-based compensation expense; restructuring charges; gain on sale of Merry Maids branches; management and consulting fees; consulting agreement termination fees; and other non-operating expenses. We believe Adjusted EBITDA is useful for investors, analysts and other interested parties as it facilitates company-to-company operating performance comparisons by excluding potential differences caused by variations in capital structures, taxation, the age and book depreciation of facilities and equipment, restructuring initiatives, consulting agreements and equity-based, long-term incentive plans.
Net Income (Loss) and Earnings (Loss) Per Share. Basic earnings (loss) per share is computed by dividing net income (loss) by the weighted-average number of shares of common stock outstanding. Diluted earnings (loss) per share is computed by dividing net income (loss) by the weighted-average number of shares of common stock outstanding during the period, increased to include the number of shares of common stock that would have been outstanding had potential dilutive shares of common stock been issued. The dilutive effect of stock options and RSUs are reflected in diluted net income (loss) per share by applying the treasury stock method. The presentation of net income (loss) and earnings (loss) per share provides GAAP measures of performance which are useful for investors, analysts and other interested parties in company-to-company operating performance comparisons.
Customer Retention Rates and Customer Counts Growth. We report our customer retention rates and growth in customer counts for our two largest revenue generating businesses in order to track the performance of those businesses. Customer counts represent our recurring customer base, which includes customers with active contracts for recurring services and excludes customers who purchased a service we consider non-recurring. At Terminix, recurring services are primarily delivered on an annual, quarterly or monthly frequency. Retention rates are calculated as the ratio of ending customer counts to the sum of beginning customer counts, new sales and acquired accounts for the applicable period. These measures are presented on a rolling, 12-month basis in order to avoid seasonal anomalies. See “—Segment Review.”
Seasonality
We have seasonality in our business, which drives fluctuations in revenue and Adjusted EBITDA for interim periods. In 2015, approximately 22 percent, 28 percent, 27 percent and 23 percent of our revenue and approximately 21 percent, 31 percent, 28 percent and 20 percent of our Adjusted EBITDA was recognized in the first, second, third and fourth quarters, respectively.
Effect of Weather Conditions
The demand for our services and our results of operations are also affected by weather conditions, including the seasonal nature of our termite and pest control services, home inspection services and disaster restoration services. Weather conditions which have a potentially unfavorable impact to our business include cooler temperatures or droughts which can impede the development of termite swarms and lead to lower demand for our termite control services; severe winter storms which can impact our residential cleaning business if we cannot travel to service locations due to hazardous road conditions; and extreme temperatures which can lead to an increase in service requests related to household systems. Weather conditions which have a potentially favorable impact to our business include mild winters which can lead to higher demand for termite and pest control services; mild winters or summers which can lead to lower household systems claim frequency; and severe storms which can lead to an increase in demand for disaster restoration services.
Secondary Public Offerings
On February 4, 2015, our registration statement on Form S-1 was declared effective by the SEC for a secondary offering of our common stock. We registered on behalf of certain stockholders the offering and sale of 25,000,000 shares of common stock and an additional 3,750,000 shares of common stock sold to the underwriters pursuant to an option to purchase additional shares. On February 10, 2015, the selling stockholders completed the offering of 25,000,000 shares of common stock at a price of $29.50 per share. On February 13, 2015, the selling stockholders completed the offering of an additional 3,750,000 shares of common stock at a price of $29.50 per share pursuant to the underwriters’ option to purchase additional shares.
On May 27, 2015, our registration statement on Form S-1 was declared effective by the SEC for a secondary offering of our common stock. We registered on behalf of certain stockholders the offering and sale of 20,000,000 shares of common stock and an additional 3,000,000 shares of common stock sold to the underwriters pursuant to an option to purchase additional shares. On June 2, 2015, the selling stockholders completed the offering of 20,000,000 shares of common stock at a price of $34.00 per share. On June 12, 2015, the selling stockholders completed the offering of an additional 3,000,000 shares of common stock at a price of $34.00 per share pursuant to the underwriters’ option to purchase additional shares.
On November 5, 2015, our shelf registration statement on Form S-3 was automatically declared effective by the SEC for a secondary offering of our common stock. We registered on behalf of certain stockholders the offering and sale of 28,961,763 shares of
34
common stock. On November 5, 2015, the selling stockholders completed the offering of 28,961,763 shares of common stock at a price of $33.91 per share.
We did not receive any of the proceeds from the aggregate 80,711,763 shares of common stock sold by the selling stockholders in 2015.
Refinancing of Indebtedness
On February 17, 2015, we redeemed $190 million in aggregate principal amount of the 8% 2020 Notes at a redemption price of 106.0% of the principal amount using available cash. In connection with the partial redemption, we recorded a loss on extinguishment of debt of $13 million in the year ended December 31, 2015, which includes a pre-payment premium of $11 million and the write-off of $2 million of debt issuance costs.
On April 1, 2015, we entered into the First Term Loan Amendment, which provides for the April Incremental Term Loans in an aggregate principal amount of $175 million. On April 1, 2015, we used the net proceeds from the April Incremental Term Loans, together with cash on hand, to redeem the remaining outstanding $200 million in aggregate principal amount of the 8% 2020 Notes at a redemption price of 106.0% of the principal amount. In connection with the redemption, we recorded a loss on extinguishment of debt of $14 million in the year ended December 31, 2015, which includes a pre-payment premium of $12 million and the write-off of $2 million of debt issuance costs.
On August 17, 2015, we entered into the Second Term Loan Amendment, which provides for the August Incremental Term Loans in an aggregate principal amount of $400 million. On August 17, 2015, we used the net proceeds from the August Incremental Term Loans, together with cash on hand, to redeem the remaining outstanding $488 million in aggregate principal amount of the 7% 2020 Notes at a redemption price of 105.25% of the principal amount. In connection with the redemption, we recorded a loss on extinguishment of debt of $31 million in the year ended December 31, 2015, which includes a pre-payment premium of $25 million and the write-off of $6 million of debt issuance costs.
35
Results of Operations
|
Year Ended December 31, |
Increase (Decrease) |
% of Revenue |
||||||||||||||||||||||
|
(In millions) |
2015 |
2014 |
2013 |
2015 vs. 2014 |
2014 vs. 2013 |
2015 |
2014 |
2013 |
||||||||||||||||
|
Revenue |
$ |
2,594 |
$ |
2,457 |
$ |
2,293 | 6 |
% |
7 |
% |
100 |
% |
100 |
% |
100 |
% |
||||||||
|
Cost of services rendered and products sold |
1,375 | 1,298 | 1,220 | 6 | 6 | 53 | 53 | 53 | ||||||||||||||||
|
Selling and administrative expenses |
666 | 669 | 691 |
— |
(3) | 26 | 27 | 30 | ||||||||||||||||
|
Amortization expense |
38 | 52 | 51 | (27) | 2 | 1 | 2 | 2 | ||||||||||||||||
|
401(k) Plan corrective contribution |
23 |
— |
— |
* |
* |
1 |
— |
— |
||||||||||||||||
|
Impairment of software and other related costs |
— |
47 |
— |
* |
* |
— |
2 |
— |
||||||||||||||||
|
Consulting agreement termination fees |
— |
21 |
— |
* |
* |
— |
1 |
— |
||||||||||||||||
|
Restructuring charges |
5 | 11 | 6 | (55) | 76 |
— |
— |
— |
||||||||||||||||
|
Gain on sale of Merry Maids branches |
(7) | (1) |
— |
* |
* |
— |
— |
— |
||||||||||||||||
|
Interest expense |
167 | 219 | 247 | (24) | (11) | 6 | 9 | 11 | ||||||||||||||||
|
Interest and net investment income |
(9) | (7) | (8) | 29 | (9) |
— |
— |
— |
||||||||||||||||
|
Loss on extinguishment of debt |
58 | 65 |
— |
(11) |
* |
2 | 3 |
— |
||||||||||||||||
|
Other expense |
9 |
— |
— |
* |
* |
— |
— |
— |
||||||||||||||||
|
Income from Continuing Operations before Income Taxes |
270 | 84 | 86 | 221 | (2) | 10 | 3 | 4 | ||||||||||||||||
|
Provision for income taxes |
107 | 40 | 43 | 166 | (6) | 4 | 2 | 2 | ||||||||||||||||
|
Equity in losses of joint venture |
— |
— |
(1) |
* |
* |
— |
— |
— |
||||||||||||||||
|
Income from Continuing Operations |
162 | 43 | 42 | 277 | 2 | 6 | 2 | 2 | ||||||||||||||||
|
Loss from discontinued operations, net of income taxes |
(2) | (100) | (549) |
* |
* |
— |
(4) | (24) | ||||||||||||||||
|
Net Income (Loss) |
$ |
160 |
$ |
(57) |
$ |
(507) |
* |
* |
6 |
% |
(2) |
% |
(22) |
% |
||||||||||
___________________________________
*not meaningful
Revenue
We reported revenue of $2,594 million, $2,457 million and $2,293 million for the years ended December 31, 2015, 2014 and 2013, respectively. A summary of changes in revenue for each of our reportable segments and Corporate is included in the table below. See “—Segment Review” for a discussion of the drivers of the year-over-year changes.
|
American |
Franchise |
||||||||||||||
|
Home |
Services |
||||||||||||||
|
(In millions) |
Terminix |
Shield |
Group |
Corporate |
Total |
||||||||||
|
Year Ended December 31, 2013 |
$ |
1,309 |
$ |
740 |
$ |
236 |
$ |
8 |
$ |
2,293 | |||||
|
Pest Control |
27 |
— |
— |
— |
27 | ||||||||||
|
Termite and Other Services(1) |
34 |
— |
— |
— |
34 | ||||||||||
|
Home Warranties(2) |
— |
88 |
— |
— |
88 | ||||||||||
|
Franchise-Related Revenue |
— |
— |
17 |
— |
17 | ||||||||||
|
Other |
— |
— |
— |
(1) | (2) | ||||||||||
|
Year Ended December 31, 2014 |
$ |
1,370 |
$ |
828 |
$ |
253 |
$ |
7 |
$ |
2,457 | |||||
|
Pest Control(3) |
54 |
— |
— |
— |
54 | ||||||||||
|
Termite and Other Services(1)(3) |
17 |
— |
— |
— |
17 | ||||||||||
|
Home Warranties(2) |
— |
89 |
— |
— |
89 | ||||||||||
|
Franchise-Related Revenue |
— |
— |
(5) |
— |
(5) | ||||||||||
|
Sale of Merry Maids branches(4) |
— |
— |
(16) |
— |
(16) | ||||||||||
|
Other |
3 |
— |
— |
(5) | (2) | ||||||||||
|
Year Ended December 31, 2015 |
$ |
1,444 |
$ |
917 |
$ |
232 |
$ |
2 |
$ |
2,594 | |||||
___________________________________
|
(1) |
Includes wildlife exclusion, crawl space encapsulation and attic insulation products which are managed as a component of our termite line of business. |
|
(2) |
Includes approximately $10 million and $56 million for the years ended December 31, 2015 and 2014, respectively, as a result of the acquisition of Home Security of America, Inc., based in Madison, Wisconsin, (“HSA”) on February 28, 2014. |
36
|
(3) |
Incudes growth from acquisitions of approximately $26 million and $4 million in pest control and termite and other services, respectively, of which approximately $8 million is a result of the acquisition of Alterra Pest Control, LLC (“Alterra”) on November 10, 2015. |
|
(4) |
Includes a $17 million reduction in revenue from company-owned branches, offset, in part, by a $1 million increase in royalty fees as result of the branch conversions. |
Cost of Services Rendered and Products Sold
We reported cost of services rendered and products sold of $1,375 million, $1,298 million and $1,220 million for the years ended December 31, 2105, 2014 and 2013, respectively. The following table provides a summary of changes in cost of services rendered and products sold for each of our reportable segments and Corporate:
|
American |
Franchise |
||||||||||||||
|
Home |
Services |
||||||||||||||
|
(In millions) |
Terminix |
Shield |
Group |
Corporate |
Total |
||||||||||
|
Year Ended December 31, 2013 |
$ |
743 |
$ |
367 |
$ |
101 |
$ |
9 |
$ |
1,220 | |||||
|
Impact of change in revenue(1) |
22 | 42 | 14 |
— |
78 | ||||||||||
|
Damage claims |
5 |
— |
— |
— |
5 | ||||||||||
|
Legal |
(5) |
— |
— |
— |
(5) | ||||||||||
|
Contract claims |
— |
(6) |
— |
— |
(6) | ||||||||||
|
Insurance program |
— |
— |
— |
9 | 9 | ||||||||||
|
Other |
(2) | 1 | 3 | (4) | (3) | ||||||||||
|
Year Ended December 31, 2014 |
$ |
763 |
$ |
404 |
$ |
118 |
$ |
14 |
$ |
1,298 | |||||
|
Impact of change in revenue(1) |
36 | 32 |
— |
— |
68 | ||||||||||
|
Fuel prices |
(5) |
— |
— |
— |
(5) | ||||||||||
|
Contract claims |
— |
33 |
— |
— |
33 | ||||||||||
|
Sale of Merry Maids branches |
— |
— |
(12) |
— |
(12) | ||||||||||
|
Insurance program |
— |
— |
— |
(4) | (4) | ||||||||||
|
Cost reduction initiatives |
(3) |
— |
— |
— |
(3) | ||||||||||
|
Other |
1 | (1) |
— |
— |
— |
||||||||||
|
Year Ended December 31, 2015 |
$ |
792 |
$ |
468 |
$ |
106 |
$ |
10 |
$ |
1,375 | |||||
___________________________________
|
(1) |
For American Home Shield, includes approximately $5 million and $23 million for the years ended December 31, 2015 and 2014, respectively, as a result of the acquisition of HSA on February 28, 2014. |
Year Ended December 31, 2015 Compared to Year Ended December 31, 2014
We realized lower fuel costs at Terminix as a result of lower fuel prices in 2015.
The increase in contract claims cost at American Home Shield was driven by an increase in the average cost per service request associated with appliance repairs due to greater use of more expensive out-of-network contractors, largely in the fourth quarter, and, to a lesser extent, by warmer summer temperatures in 2015 and general inflation.
We realized a reduction in cost of sales of $12 million in the Franchises Services Group as a result of the branch conversions.
The decrease in expense related to our automobile, general liability and workers’ compensation insurance program was driven by the impact of increased reserves of $9 million and $13 million recorded in 2015 and 2014, respectively, driven by unfavorable claims trends.
Year Ended December 31, 2014 Compared to Year Ended December 31, 2013
The increase in damage claims at Terminix was primarily driven by higher claim payments. The decrease in legal expense at Terminix was driven by reduced provisions for certain legal matters.
The decrease in contract claims at American Home Shield was primarily driven by lower claims costs due, in part, to an increase in the service fee charged to our customers for service visits and, to a lesser extent, mild weather conditions, offset, in part, by the impact of favorable adjustments to reserves for prior year contract claims of $1 million and $5 million in 2014 and 2013, respectively.
The increase in expense related to our automobile, general liability and workers’ compensation insurance program was driven by adverse claims trends.
37
Selling and Administrative Expenses
For the years ended December 31, 2015, 2014 and 2013, we reported selling and administrative expenses of $666 million, $669 million and $691 million, respectively, which comprised general and administrative expenses of $255 million, $271 million and $314 million, respectively, and selling and marketing expenses of $411 million, $398 million and $377 million, respectively. The following table provides a summary of changes in selling and administrative expenses for each of our reportable segments and Corporate:
|
American |
Franchise |
||||||||||||||
|
Home |
Services |
||||||||||||||
|
(In millions) |
Terminix |
Shield |
Group |
Corporate |
Total |
||||||||||
|
Year Ended December 31, 2013 |
$ |
331 |
$ |
240 |
$ |
58 |
$ |
62 |
$ |
691 | |||||
|
HSA selling and administrative expenses |
— |
18 |
— |
— |
18 | ||||||||||
|
Sales and marketing costs |
5 | 10 |
— |
— |
15 | ||||||||||
|
Legal and tax-related reserves |
— |
4 |
— |
— |
4 | ||||||||||
|
Cost reduction initiatives |
(3) | (7) |
— |
(36) | (46) | ||||||||||
|
Technology costs |
— |
(9) |
— |
— |
(9) | ||||||||||
|
Key executive transition charges |
(3) | (1) |
— |
(2) | (6) | ||||||||||
|
Management and consulting fees |
— |
— |
— |
(4) | (4) | ||||||||||
|
Stock-based compensation expense |
— |
— |
— |
3 | 3 | ||||||||||
|
Other |
(1) | 2 | 1 |
— |
3 | ||||||||||
|
Year Ended December 31, 2014 |
$ |
329 |
$ |
257 |
$ |
59 |
$ |
23 |
$ |
669 | |||||
|
Sales and marketing costs |
11 | (2) | (3) |
— |
6 | ||||||||||
|
Customer service costs |
— |
5 |
— |
— |
5 | ||||||||||
|
HSA selling and administrative expenses |
— |
4 |
— |
— |
4 | ||||||||||
|
Technology costs |
— |
(2) |
— |
— |
(2) | ||||||||||
|
Sale of Merry Maids branches |
— |
— |
(2) |
— |
(2) | ||||||||||
|
Incentive compensation |
(4) | (4) |
— |
— |
(8) | ||||||||||
|
Cost reduction initiatives |
— |
(1) | (3) |
— |
(4) | ||||||||||
|
Management and consulting fees |
— |
— |
— |
(4) | (4) | ||||||||||
|
Stock-based compensation expense |
— |
— |
— |
3 | 3 | ||||||||||
|
Secondary offering expenses |
— |
— |
— |
3 | 3 | ||||||||||
|
Other |
(1) | (1) |
— |
(1) | (3) | ||||||||||
|
Year Ended December 31, 2015 |
$ |
335 |
$ |
256 |
$ |
51 |
$ |
24 |
$ |
666 | |||||
Year Ended December 31, 2015 Compared to Year Ended December 31, 2014
The increase in sales costs at Terminix was primarily driven by investments to grow and train our sales force and higher commissions attributable to the growth in new products and pest control revenue.
The increase in customer service costs at American Home Shield was due to higher labor costs resulting from customer growth. Additionally, we incurred incremental selling and administrative expenses at American Home Shield as a result of the HSA acquisition on February, 28, 2014. The decrease in technology costs at American Home Shield was driven by our decision in the first quarter of 2014 to abandon efforts to deploy a new operating system.
We realized a reduction in selling and administrative expenses of $2 million in the Franchises Services Group as a result of the branch conversions.
We expect information technology costs to increase in 2016 due to an acceleration in investments to transform our customers’ experiences through new technology and a reduction in fees received from New TruGreen under the transition services agreement.
Year Ended December 31, 2014 Compared to Year Ended December 31, 2013
We incurred incremental selling and administrative expenses at American Home Shield as a result of the HSA acquisition on February 28, 2014. The increase in marketing costs at American Home Shield was driven by incremental investments in our direct-to-consumer channel. The increase in legal expense at American Home Shield was driven by increased provisions for certain legal matters. The decrease in technology costs at American Home Shield was driven by our decision in the first quarter of 2014 to abandon our efforts to deploy a new operating system. Additionally, $1 million and $3 million reductions in tax-related reserves were recorded in 2014 and 2013, respectively.
The cost reduction initiatives at Corporate were primarily driven by the transition of certain costs to New TruGreen.
38
Amortization Expense
Amortization expense was $38 million, $52 million and $51 million in the years ended December 31, 2015, 2014 and 2013, respectively. The decrease in 2015 was a result of certain finite-lived intangible assets recorded in connection with the merger in 2007 being fully amortized.
401(k) Plan Corrective Contribution
We recorded a charge of $23 million in the year ended December 31, 2015 related to the 401(k) Plan. See Note 11 to the consolidated financial statements for more details.
Impairment of Software and Other Related Costs
We recorded an impairment charge of $47 million in the year ended December 31, 2014 relating to our decision in the first quarter of 2014 to abandon our efforts to deploy a new operating system at American Home Shield.
Consulting Agreement Termination Fees
On July 1, 2014, in connection with the completion of our initial public offering, we paid the Equity Sponsors aggregate fees of $21 million in connection with the termination of the consulting agreements, which was recorded in the year ended December 31, 2014. See Note 10 to the consolidated financial statements for more details.
Restructuring Charges
We incurred restructuring charges of $5 million, $11 million and $6 million for the years ended December 31, 2015, 2014 and 2013, respectively. Restructuring charges were comprised of the following:
|
Year Ended December 31, |
|||||||||
|
(In millions) |
2015 |
2014 |
2013 |
||||||
|
Terminix branch optimization(1) |
$ |
3 |
$ |
2 |
$ |
2 | |||
|
Franchise Services Group reorganization(2) |
1 | 3 |
— |
||||||
|
Corporate(3) |
1 | 6 | 4 | ||||||
|
Total restructuring charges |
$ |
5 |
$ |
11 |
$ |
6 | |||
___________________________________
|
(1) |
These charges included severance costs of $2 million, $2 million and $1 million for the years ended December 31, 2015, 2014 and 2013, respectively, and lease termination costs of $1 million for the years ended December 31, 2015 and 2013. |
|
(2) |
Represents severance costs. |
|
(3) |
Represents restructuring charges related to an initiative to enhance capabilities and reduce costs in our headquarters functions that provide company-wide administrative services for our operations. For the years ended December 31, 2015, 2014 and 2013, these charges included severance and other costs of $1 million, $5 million and $1 million, respectively. For the years ended December 31, 2014 and 2013, these charges also included professional fees of $1 million and $3 million, respectively. |
Gain on Sale of Merry Maids Branches
We recorded a gain of $7 million and $1 million for the years ended December 31, 2015 and 2014, respectively, associated with the branch conversions.
Interest Expense
Interest expense was $167 million, $219 million and $247 million for the years ended December 31, 2015, 2014 and 2013, respectively. The decrease in interest expense in the year ended December 31, 2015 compared to the year ended December 31, 2014 was driven by the refinancing of the Old Term Facilities on July 1, 2014 and the redemption of the 2020 Notes, offset, in part, by additional borrowings under the April and August Incremental Term Loans. The decrease in interest expense in the year ended December 31, 2014 compared to the year ended December 31, 2013 was driven by the refinancing of the Old Term Facilities and the partial redemption of the 2020 Notes. See Note 12 to the consolidated financial statements for more details.
Interest and Net Investment Income
Interest and net investment income was $9 million, $7 million and $8 million for the years ended December 31, 2015, 2014 and 2013, respectively, and comprised the following:
|
Year Ended December 31, |
|||||||||
|
(In millions) |
2015 |
2014 |
2013 |
||||||
|
Realized gains(1) |
$ |
8 |
$ |
6 |
$ |
5 | |||
|
Deferred compensation trust(2) |
— |
— |
2 | ||||||
|
Other(3) |
1 | 1 | 1 | ||||||
|
Total interest and net investment income |
$ |
9 |
$ |
7 |
$ |
8 | |||
39
___________________________________
|
(1) |
Represents the net investment gains and the interest and dividend income realized on the American Home Shield investment portfolio. |
|
(2) |
Represents investment income resulting from a change in the market value of investments within an employee deferred compensation trust (for which there is a corresponding and offsetting change in compensation expense within income from continuing operations before income taxes). |
|
(3) |
Includes interest income on other cash balances. |
Loss on Extinguishment of Debt
A loss on extinguishment of debt of $58 million was recorded in the year ended December 31, 2015 related to the redemptions of the 8% 2020 Notes on February 17, 2015 and April 1, 2015 and the redemption of the 7% 2020 Notes on August 17, 2015. A loss on extinguishment of debt of $65 million was recorded in the year ended December 31, 2014 related to the repayment of the Old Term Facilities and the partial redemption of the 2020 Notes on July 16, 2014. There were no debt extinguishments by us in the year ended December 31, 2013. See Note 12 to the consolidated financial statements for more details.
Income from Continuing Operations before Income Taxes
Income from continuing operations before income taxes was $270 million, $84 million and $86 million for the years ended December 31, 2015, 2014 and 2013, respectively. The change in income from continuing operations before income taxes primarily reflects the net effect of year-over-year changes in the following items:
|
Year Ended December 31, |
||||||
|
(In millions) |
2015 vs. 2014 |
2014 vs. 2013 |
||||
|
Reportable segments and Corporate(1) |
$ |
65 |
$ |
107 | ||
|
Interest expense(2) |
52 | 28 | ||||
|
Impairment of software and other related costs(3) |
47 | (47) | ||||
|
401(k) Plan corrective contribution(4) |
(23) |
— |
||||
|
Consulting agreement termination fees(5) |
21 | (21) | ||||
|
Loss on extinguishment of debt(6) |
7 | (65) | ||||
|
Amortization expense(7) |
14 | (1) | ||||
|
Gain on sale of Merry Maids branches(8) |
6 | 1 | ||||
|
Other(9) |
(3) | (4) | ||||
|
Increase (decrease) in income from continuing operations before income taxes |
$ |
186 |
$ |
(2) | ||
___________________________________
|
(1) |
Represents the net change in Adjusted EBITDA as described in “—Segment Review.” |
|
(2) |
Represents the net change in interest expense as described in “—Interest Expense.” |
|
(3) |
Represents a $47 million impairment of software and other related costs at American Home Shield recorded in the year ended December 31, 2014 as described in “—Impairment of Software and Other Related Costs.” |
|
(4) |
Represents the $23 million charge recorded in the year ended December 31, 2015 related to the 401(k) Plan as described in “—401(k) Plan Corrective Contribution.” |
|
(5) |
Represents the consulting agreement termination fees of $21 million recorded in the year ended December 31, 2014 as described in “—Consulting Agreement Termination Fees.” |
|
(6) |
Represents the $58 million and $65 million loss on extinguishment of debt recorded in the years ended December 31, 2015 and 2014, respectively, as described in “—Loss on Extinguishment of Debt.” |
|
(7) |
Represents the net change in amortization expense as described in “—Amortization Expense.” |
|
(8) |
Represents the $7 million and $1 million gain in the years ended December 31, 2015 and 2014, respectively, as described in |
|
(9) |
Primarily represents the net change in restructuring charges, management and consulting fees, stock-based compensation, secondary offering fees, legal and environmental expenses and depreciation. |
Provision for Income Taxes
The effective tax rate on income from continuing operations was 39.8 percent, 48.2 percent and 50.1 percent for the years ended December 31, 2015, 2014 and 2013, respectively. The effective tax rate on income from continuing operations for the year ended December 31, 2014 was affected by an adjustment to deferred state taxes as a result of a change in the state apportionment factors attributable to the TruGreen Spin-off. The effective tax rate on income from continuing operations for the year ended December 31, 2013 was affected by a one-time state valuation allowance increase as well as other state adjustments. For 2014 and
40
2013, the increased state tax expense applied against lower pre-tax income was the primary driver of a higher overall effective tax rate. For a reconciliation of our effective tax rates to the statutory rate see Note 5 to the consolidated financial statements.
Net Income (Loss)
Net income (loss) was $160 million, $(57) million and $(507) million for the years ended December 31, 2015, 2014 and 2013, respectively. The $217 million improvement for the year ended December 31, 2015 compared to the year ended December 31, 2014 was primarily driven by a $186 million improvement in income from continuing operations before income taxes and a $98 million reduction in loss from discontinued operations, net of income taxes, offset, in part, by a $67 million increase in provision for income taxes. The $450 million improvement for the year ended December 31, 2014 compared to the year ended December 31, 2013 was primarily driven by a $449 million reduction in loss from discontinued operations.
Segment Review
The following business segment reviews should be read in conjunction with the required footnote disclosures presented in the notes to the consolidated financial statements included in this report.
Revenue and Adjusted EBITDA by reportable segment and for Corporate are as follows:
|
Year Ended December 31, |
Increase (Decrease) |
||||||||||||||
|
(In millions) |
2015 |
2014 |
2013 |
2015 vs. 2014 |
2014 vs. 2013 |
||||||||||
|
Revenue: |
|||||||||||||||
|
Terminix |
$ |
1,444 |
$ |
1,370 |
$ |
1,309 | 5 |
% |
5 |
% |
|||||
|
American Home Shield |
917 | 828 | 740 | 11 |
% |
12 |
% |
||||||||
|
Franchise Services Group |
232 | 253 | 236 | (8) |
% |
7 |
% |
||||||||
|
Corporate |
2 | 7 | 8 | (64) |
% |
(13) |
% |
||||||||
|
Total Revenue: |
$ |
2,594 |
$ |
2,457 |
$ |
2,293 | 6 |
% |
7 |
% |
|||||
|
Adjusted EBITDA:(1) |
|||||||||||||||
|
Terminix |
$ |
347 |
$ |
309 |
$ |
266 | 12 |
% |
16 |
% |
|||||
|
American Home Shield |
205 | 179 | 145 | 15 |
% |
23 |
% |
||||||||
|
Franchise Services Group |
77 | 78 | 78 | (1) |
% |
— |
% |
||||||||
|
Reportable Segment Adjusted EBITDA |
$ |
630 |
$ |
566 |
$ |
489 | 11 |
% |
16 |
% |
|||||
|
Corporate(2) |
(9) | (9) | (39) |
— |
% |
(77) |
% |
||||||||
|
Total Adjusted EBITDA |
$ |
622 |
$ |
557 |
$ |
450 | 12 |
% |
24 |
% |
|||||
___________________________________
|
(1) |
For our definition of Adjusted EBITDA and a reconciliation to net income (loss), see “—Selected Historical Financial Data.” |
|
(2) |
Represents unallocated corporate expenses. |
The table below presents selected operating metrics related to renewable customer counts and customer retention for our Terminix and American Home Shield segments.
|
As of December 31, |
|||||||||
|
2015(1) |
2014(2) |
2013 |
|||||||
|
Terminix |
|||||||||
|
Growth (Reduction) in Pest Control Customers |
3 |
% |
(1) |
% |
(2) |
% |
|||
|
Pest Control Customer Retention Rate |
79 |
% |
79 |
% |
79 |
% |
|||
|
Reduction in Termite and Other Services Customers |
(2) |
% |
(2) |
% |
(2) |
% |
|||
|
Termite and Other Services Customer Retention Rate |
85 |
% |
85 |
% |
85 |
% |
|||
|
American Home Shield |
|||||||||
|
Growth in Home Warranties |
7 |
% |
15 |
% |
— |
% |
|||
|
Customer Retention Rate |
75 |
% |
75 |
% |
74 |
% |
|||
___________________________________
|
(1) |
As of December 31, 2015, excluding the Alterra accounts acquired on November 10, 2015, there was a reduction in pest control customers of three percent, and, excluding all Alterra accounts, the pest control customer retention rate was 79 percent. |
|
(2) |
As of December 31, 2014, excluding the HSA accounts acquired on February 28, 2014, the growth in home warranties was five percent, and, excluding all HSA accounts, the customer retention rate for our American Home Shield segment was 76 percent. |
41
Terminix Segment
The Terminix segment, which provides termite and pest control services to residential and commercial customers and distributes pest control products, reported a five percent increase in revenue and a 12 percent increase in Adjusted EBITDA for the year ended December 31, 2015 compared to the year ended December 31, 2014. The Terminix segment reported a five percent increase in revenue and a 16 percent increase in Adjusted EBITDA for the year ended December 31, 2014 compared to the year ended December 31, 2013. Acquisitions contributed approximately $30 million in revenue in the year ended December 31, 2015, of which the Alterra acquisition contributed approximately $8 million.
Revenue
Revenue by service line is as follows:
|
Year Ended December 31, |
% of Revenue |
|||||||||||
|
(In millions) |
2015 |
2014 |
2013 |
2015 |
||||||||
|
Pest Control |
$ |
812 |
$ |
758 |
$ |
731 | 56 |
% |
||||
|
Termite and Other Services |
559 | 542 | 508 | 39 |
% |
|||||||
|
Other |
73 | 70 | 70 | 5 |
% |
|||||||
|
Total revenue |
$ |
1,444 |
$ |
1,370 |
$ |
1,309 | 100 |
% |
||||
Year Ended December 31, 2015 Compared to Year Ended December 31, 2014
Pest control revenue increased seven percent compared to 2014, reflecting improved price realization, a favorable product mix, the impact of the Alterra acquisition on November 10, 2015 and growth in mosquito and bed bug services.
Termite revenue, including the wildlife exclusion, crawl space encapsulation and attic insulation products, which are managed as a component of our termite line of business, increased three percent compared to 2014. In 2015, termite renewal revenue comprised 50 percent of total termite revenue, while the remainder consisted of termite new unit revenue. The increase in termite revenue reflects growth of new products (wildlife exclusion and crawlspace encapsulation), increased sales of attic insulation and improved price realization, offset, in part, by a decrease in traditional termite sales. Termite activity is unpredictable in its nature. Factors that can impact termite activity include conducive weather conditions and consumer awareness of termite swarms.
Year Ended December 31, 2014 Compared to Year Ended December 31, 2013
Pest control revenue increased four percent compared to 2013, reflecting improved price realization, a favorable product mix and the introduction of a new mosquito service, offset, in part by a decrease in new unit sales.
Termite revenue, including the wildlife exclusion, crawl space encapsulation and attic insulation products which are managed as a component of our termite line of business, increased seven percent compared to 2013. In 2014, termite renewal revenue comprised 52 percent of total termite revenue, while the remainder consisted of termite new unit revenue. The increase in termite revenue reflects introductions of new products (wildlife exclusion and crawlspace encapsulation), increased sales of attic insulation and improved price realization, offset, in part, by a decrease in traditional termite sales.
Adjusted EBITDA
The following table provides a summary of changes in the segment’s Adjusted EBITDA:
|
(In millions) |
|||
|
Year Ended December 31, 2013 |
$ |
266 | |
|
Impact of change in revenue |
39 | ||
|
Damage claims |
(5) | ||
|
Legal |
5 | ||
|
Sales costs |
(5) | ||
|
Cost reduction initiatives |
3 | ||
|
Key executive transition charges |
3 | ||
|
Other |
3 | ||
|
Year Ended December 31, 2014 |
$ |
309 | |
|
Impact of change in revenue |
38 | ||
|
Fuel prices |
5 | ||
|
Sales costs |
(11) | ||
|
Incentive compensation |
4 | ||
|
Cost reduction initiatives |
3 | ||
|
Other |
(1) | ||
|
Year Ended December 31, 2015 |
$ |
347 |
42
Year Ended December 31, 2015 Compared to Year Ended December 31, 2014
We realized lower fuel costs as a result of lower fuel prices in 2015. The increase in sales costs was primarily driven by investments to grow and train our sales force and higher commissions attributable to the growth in new products and pest control revenue.
Year Ended December 31, 2014 Compared to Year Ended December 31, 2013
The increase in damage claims was primarily driven by higher claim payments. The decrease in legal expense was driven by reduced provisions for certain legal matters.
American Home Shield Segment
The American Home Shield segment, which provides home warranties for household systems and appliances, reported an 11 percent increase in revenue and a 15 percent increase in Adjusted EBITDA for the year ended December 31, 2015 compared to the year ended December 31, 2014. The American Home Shield segment reported a 12 percent increase in revenue and a 23 percent increase in Adjusted EBITDA for the year ended December 31, 2014 compared to the year ended December 31, 2013.
Revenue
Year Ended December 31, 2015 Compared to Year Ended December 31, 2014
The revenue results reflect an increase in new unit sales, improved price realization, a favorable product mix and the impact of the HSA acquisition (an approximate $10 million increase as a result of the acquisition on February 28, 2014).
Year Ended December 31, 2014 Compared to Year Ended December 31, 2013
The revenue results reflect the impact of the HSA acquisition, a favorable product mix and an increase in new unit sales. The HSA acquisition contributed approximately $56 million in revenue in 2014.
Adjusted EBITDA
The following table provides a summary of changes in the segment’s Adjusted EBITDA:
|
(In millions) |
|||
|
Year Ended December 31, 2013 |
$ |
145 | |
|
Impact of change in revenue |
46 | ||
|
Contract claims |
6 | ||
|
HSA selling and administrative expenses |
(18) | ||
|
Marketing costs |
(10) | ||
|
Legal |
(2) | ||
|
Tax-related reserves |
(2) | ||
|
Cost reduction initiatives |
7 | ||
|
Technology costs |
9 | ||
|
Key executive transition charges |
1 | ||
|
Interest and net investment income |
1 | ||
|
Other |
(4) | ||
|
Year Ended December 31, 2014 |
$ |
179 | |
|
Impact of change in revenue |
57 | ||
|
Contract claims |
(33) | ||
|
Marketing costs |
2 | ||
|
Customer services costs |
(5) | ||
|
HSA selling and administrative expenses |
(4) | ||
|
Technology costs |
2 | ||
|
Incentive compensation |
4 | ||
|
Cost reduction initiatives |
1 | ||
|
Interest and net investment income |
2 | ||
|
Year Ended December 31, 2015 |
$ |
205 |
Year Ended December 31, 2015 Compared to Year Ended December 31, 2014
The increase in contract claims cost was driven by an increase in the average cost per service request associated with appliance repairs due to greater use of more expensive out-of-network contractors, largely in the fourth quarter, and, to a lesser extent, by warmer summer temperature in 2015 and general inflation. Extreme temperatures in 2016 could lead to an increase in service requests related to household systems, resulting in higher claim frequency and costs.
43
The increase in customer service costs was due to higher labor costs resulting from customer growth. Additionally, we incurred incremental selling and administrative expenses as a result of the HSA acquisition on February 28, 2014. The decrease in technology costs was driven by our decision in the first quarter of 2014 to abandon efforts to deploy a new operating system.
In 2015 and 2014, the segment’s Adjusted EBITDA included interest and net investment income from the American Home Shield investment portfolio of $8 million and $6 million, respectively.
Year Ended December 31, 2014 Compared to Year Ended December 31, 2013
The decrease in contract claims was primarily driven by lower claims costs due, in part, to an increase in the service fee charged to our customers for service visits and, to a lesser extent, mild weather conditions, offset, in part, by the impact of favorable adjustments to reserves for prior year contract claims of $1 million and $5 million in 2014 and 2013, respectively.
We incurred incremental selling and administrative expenses as a result of the HSA acquisition on February 28, 2014. The increase in marketing costs was driven by incremental investments in our direct-to-consumer channel. The increase in legal expense was driven by increased provisions for certain legal matters. The decrease in technology costs was driven by our decision in the first quarter of 2014 to abandon our efforts to deploy a new operating system. Additionally, $1 million and $3 million reductions in tax-related reserves were recorded in 2014 and 2013, respectively.
In 2014 and 2013, the segment’s Adjusted EBITDA included interest and net investment income from the American Home Shield investment portfolio of $6 million and $5 million, respectively.
Franchise Services Group Segment
The Franchise Services Group segment, which consists of the ServiceMaster Restore (disaster restoration), ServiceMaster Clean (janitorial), Merry Maids (residential cleaning), Furniture Medic (furniture repair) and AmeriSpec (home inspection) businesses, reported an eight percent decrease in revenue and a one percent decrease in Adjusted EBITDA for the year ended December 31, 2015 compared to the year ended December 31, 2014. The Franchise Services Group segment reported a seven percent increase in revenue and comparable Adjusted EBITDA for the year ended December 31, 2014 compared to the year ended December 31, 2013.
Revenue
Revenue by service line is as follows:
|
Year Ended December 31, |
% of Revenue |
|||||||||||
|
(In millions) |
2015 |
2014 |
2013 |
2015 |
||||||||
|
Royalty Fees |
$ |
117 |
$ |
118 |
$ |
115 | 50 |
% |
||||
|
Company-Owned Merry Maids Branches |
42 | 62 | 63 | 18 |
% |
|||||||
|
Janitorial National Accounts |
41 | 36 | 23 | 18 |
% |
|||||||
|
Sales of Products |
18 | 23 | 23 | 8 |
% |
|||||||
|
Other |
14 | 14 | 12 | 6 |
% |
|||||||
|
Total revenue |
$ |
232 |
$ |
253 |
$ |
236 | 100 |
% |
||||
Year Ended December 31, 2015 Compared to Year Ended December 31, 2014
The decrease in royalty fees was primarily driven by lower disaster restoration services, offset, in part, by a $1 million increase attributable to the branch conversions. Approximately $17 million of the decline in revenue from company-owned Merry Maids branches was attributable to the branch conversions with the remainder of the decline attributable to a decrease in new unit sales. The increase in revenue from janitorial national accounts was driven by strong sales activity. We intend to continue to focus on expanding our market share in janitorial national accounts. The decrease in sales of products was driven by lower franchisee demand.
In 2014, we began converting company-owned Merry Maids locations to franchises. We expect the branch conversions completed through December 31, 2015, as well as further branch conversions expected in 2016, to result in further decreases in revenues from company-owned Merry Maids branches, which we expect will be offset, in part, by modest increases in royalty fees. During the year ended December 31, 2015, we converted 38 company-owned Merry Maids branches to franchises. As of December 31, 2015, there were 29 company-owned Merry Maids branches remaining.
Year Ended December 31, 2014 Compared to Year Ended December 31, 2013
The increase in royalty fees was primarily driven by increases in disaster restoration services. The decline in revenue from company-owned Merry Maids branches was attributable to a decrease in new unit sales. The increase in revenue from janitorial national accounts was driven by strong sales activity.
44
Adjusted EBITDA
The following table provides a summary of changes in the segment’s Adjusted EBITDA:
|
(In millions) |
|||
|
Year Ended December 31, 2013 |
$ |
78 | |
|
Impact of change in revenue |
3 | ||
|
Other |
(3) | ||
|
Year Ended December 31, 2014 |
$ |
78 | |
|
Impact of change in revenue |
(5) | ||
|
Sale of Merry Maids branches |
(2) | ||
|
Sales and marketing costs |
3 | ||
|
Cost reduction initiatives |
3 | ||
|
Year Ended December 31, 2015 |
$ |
77 |
Year Ended December 31, 2015 Compared to Year Ended December 31, 2014
The impact of the decrease in revenue on Adjusted EBITDA was driven by the decrease in royalty fees, revenue from company-owned Merry Maids branches and sales of products, offset, in part, by the increase in relatively low margin revenue from janitorial national accounts.
We realized a reduction in Adjusted EBITDA of $2 million as a result of the branch conversions.
Year Ended December 31, 2014 Compared to Year Ended December 31, 2013
The impact of the increase in revenue on Adjusted EBITDA was driven by the increase in royalty fees and relatively low margin revenue from janitorial national accounts.
Corporate
Adjusted EBITDA for Corporate for the year ended December 31, 2015 was comparable to December 31, 2014. Corporate reported a $31 million increase in Adjusted EBITDA for the year ended December 31, 2014 compared to the year ended December 31, 2013.
Adjusted EBITDA
The following table provides a summary of changes in Corporate’s Adjusted EBITDA:
|
(In millions) |
|||
|
Year Ended December 31, 2013 |
$ |
(39) | |
|
Insurance program |
(9) | ||
|
Key executive transition charges |
2 | ||
|
Cost reduction initiatives |
36 | ||
|
Other |
1 | ||
|
Year Ended December 31, 2014 |
$ |
(9) | |
|
Insurance program |
4 | ||
|
Other |
(4) | ||
|
Year Ended December 31, 2015 |
$ |
(9) |
Year Ended December 31, 2015 Compared to Year Ended December 31, 2014
The decrease in expense related to our automobile, general liability and workers’ compensation insurance program was driven by the impact of increased reserves of $9 million and $13 million recorded in 2015 and 2014, respectively, driven by unfavorable claims trends. The unfavorable claims trends for 2015 were impacted by a charge of $3 million in connection with civil claims related to an incident at a resort in St. John in the U.S. Virgin Islands. The charge of $3 million is an amount equal to our insurance deductible under our general liability insurance program.
Year Ended December 31, 2014 Compared to Year Ended December 31, 2013
The increase in expense related to our automobile, general liability and workers’ compensation insurance program was driven by adverse claims trends. The cost reduction initiatives were primarily driven by the transfer of employees to New TruGreen in combination with fees received under the transition services agreement with New TruGreen.
45
Discontinued Operations
TruGreen Spin-off
On January 14, 2014, we completed the TruGreen Spin‑Off, resulting in the spin‑off of the TruGreen Business through a tax‑free, pro rata dividend to our stockholders. As a result of the completion of the TruGreen Spin‑Off, New TruGreen operates the TruGreen Business as a private independent company.
In connection with the TruGreen Spin-off, we entered into a transition services agreement with New TruGreen pursuant to which we provide New TruGreen with specified communications, public relations, finance and accounting, tax, treasury, internal audit, human resources operations and benefits, risk management and insurance, supply management, real estate management, marketing, facilities, information technology and other support services. The charges for the transition services are designed to allow us to fully recover the direct costs of providing the services, plus specified margins and any out‑of‑pocket costs and expenses. The services provided under the transition services agreement terminated at various specified times on or prior to January 14, 2016 (except for certain information technology, human resources and accounts payable services, which we expect to provide to New TruGreen beyond January 14, 2016). New TruGreen may terminate the transition services agreement (or certain services under the transition services agreement) for convenience upon 90 days written notice, in which case New TruGreen will be required to reimburse us for early termination costs. As a result of the transfer of employees to New TruGreen, in combination with the fees we received under the transition services agreement, we achieved an approximate $25 million reduction in annual costs in 2014. We did not have any incremental change in our annual costs in 2015 related to fees under the transition services agreement or the transfer of employees to New TruGreen. We expect an increase in our annual costs in 2016 related to a reduction in fees received under the transition services agreement but do not expect such increase to be material.
Under this transition services agreement, in the years ended December 31, 2015 and 2014, we recorded $25 million and $36 million, respectively, of fees due from New TruGreen, which is included, net of costs incurred, in Selling and administrative expenses in the consolidated statement of operations and comprehensive income (loss). As of December 31, 2015, all amounts owed by New TruGreen under this agreement have been paid. We expect to receive fees under the transition services agreement of approximately $9 million in 2016.
During the year ended December 31, 2014, we processed certain of New TruGreen’s accounts payable transactions. Through this process, in the year ended December 31, 2014, $97 million was paid on New TruGreen’s behalf, all of which was repaid by New TruGreen.
In addition, we, New TruGreen and TruGreen Limited Partnership entered into (1) a separation and distribution agreement containing key provisions relating to the separation of the TruGreen Business and the distribution of New TruGreen common stock to our stockholders (including relating to specified TruGreen legal matters with respect to which we have agreed to retain liability, as well as insurance coverage, non-competition, indemnification and other matters), (2) an employee matters agreement allocating liabilities and responsibilities relating to employee benefit plans and programs and other related matters and (3) a tax matters agreement governing the respective rights, responsibilities and obligations of the parties thereto with respect to taxes, including allocating liabilities for income taxes attributable to New TruGreen and its subsidiaries generally to us for tax periods (or portions thereof) ending on or before January 14, 2014 and generally to New TruGreen for tax periods (or portions thereof) beginning after that date.
Financial Information of Discontinued Operations
Loss income from discontinued operations, net of income taxes, for all periods presented includes the operating results of the previously sold businesses.
The operating results of discontinued operations are as follows:
|
Year Ended December 31, |
|||||||||
|
(In millions) |
2015 |
2014 |
2013 |
||||||
|
Revenue |
$ |
— |
$ |
6 |
$ |
896 | |||
|
Cost of services rendered and products sold |
— |
12 | 686 | ||||||
|
Selling and administrative expenses |
3 | 14 | 232 | ||||||
|
Amortization |
— |
— |
5 | ||||||
|
Goodwill and trade name impairment(1) |
— |
139 | 673 | ||||||
|
Restructuring charges |
— |
3 | 15 | ||||||
|
Interest expense |
— |
— |
2 | ||||||
|
Interest income |
— |
— |
(1) | ||||||
|
Loss before income taxes(1) |
(3) | (161) | (716) | ||||||
|
Benefit for income taxes(1) |
(1) | (61) | (167) | ||||||
|
Loss from discontinued operations, net of income taxes(1) |
$ |
(2) |
$ |
(100) |
$ |
(549) | |||
46
___________________________________
|
(1) |
During the years ended December 31, 2014 and 2013, the Company recorded pre-tax non-cash impairment charges of $139 million ($84 million, net of tax) and $673 million ($521 million, net of tax), respectively, associated with the goodwill and trade name at its former TruGreen business, which is reported in Loss from discontinued operations, net of income taxes in the consolidated statements of operations and comprehensive income (loss). See Note 7 to the consolidated financial statements for more details. |
Liquidity and Capital Resources
Liquidity
We are highly leveraged, and a substantial portion of our liquidity needs are due to service requirements on our significant indebtedness. The agreements governing the Credit Facilities contain covenants that limit or restrict our ability, including the ability of certain of our subsidiaries, to incur additional indebtedness, repurchase debt, incur liens, sell assets, make certain payments (including dividends) and enter into transactions with affiliates. As of December 31, 2015, we were in compliance with the covenants under the agreements that were in effect on such date.
Our ongoing liquidity needs are expected to be funded by cash on hand, net cash provided by operating activities and, as required, borrowings under our credit facilities. We expect that cash provided from operations and available capacity under the Revolving Credit Facility will provide sufficient funds to operate our business, make expected capital expenditures and meet our liquidity requirements for the following 12 months, including payment of interest and principal on our debt. As of December 31, 2015, there was $133 million of letters of credit outstanding and $167 million of available borrowing capacity under the Revolving Credit Facility. The letters of credit are posted to satisfy collateral requirements under our automobile, general liability and workers’ compensation insurance program and fuel swap contracts.
Cash and short- and long-term marketable securities totaled $377 million as of December 31, 2015, compared with $495 million as of December 31, 2014. As described below, on February 17, 2015, we redeemed $190 million in aggregate principal amount of the 8% 2020 Notes at a redemption price of 106.0% of the principal amount using available cash. On April 1, 2015, we redeemed the remaining $200 million in aggregate principal amount of the 8% 2020 Notes at a redemption price of 106.0% of the principal amount using net proceeds from the April Incremental Term Loans, together with cash on hand. On August 17, 2015, we redeemed the remaining $488 million in aggregate principal amount of the 7% 2020 Notes at a redemption price of 105.25% of the principal amount using net proceeds from the August Incremental Term Loans, together with cash on hand.
On February 23, 2016, our board of directors authorized a three-year share repurchase program, under which we may repurchase up to $300 million of outstanding shares of our common stock. We expect to fund the share repurchases from operating cash flow.
Cash and short- and long-term marketable securities include balances associated with regulatory requirements at American Home Shield. See “—Limitations on Distributions and Dividends by Subsidiaries.” American Home Shield’s investment portfolio has been invested in a combination of high-quality, debt securities and equity securities. We closely monitor the performance of the investments. From time to time, we review the statutory reserve requirements to which our regulated entities are subject and any changes to such requirements. These reviews may result in identifying current reserve levels above or below minimum statutory reserve requirements, in which case we may adjust our reserves. The reviews may also identify opportunities to satisfy certain regulatory reserve requirements through alternate financial vehicles.
As of December 31, 2015, we had posted $129 million in letters of credit as collateral under our automobile, general liability and workers’ compensation insurance program, which were issued under the Revolving Credit Facility. Additionally, under the terms of our fuel swap contracts, we are required to post collateral in the event the fair value of the contracts exceeds a certain agreed upon liability level and in other circumstances when required by the counterparty. As of December 31, 2015, the estimated fair value of our fuel swap contracts was a net liability of $4 million, and we had posted $4 million in letters of credit as collateral under our fuel hedging program, which were also issued under the Revolving Credit Facility. The continued use of letters of credit for this purpose in the future could limit our ability to post letters of credit for other purposes and could limit our borrowing availability under the Revolving Credit Facility. However, we do not expect the fair value of the outstanding fuel swap contracts to materially impact our financial position or liquidity. We may from time to time repurchase or otherwise retire or extend our debt and/or take other steps to reduce our debt or otherwise improve our financial position, results of operations or cash flows. These actions may include open market debt repurchases, negotiated repurchases, other retirements of outstanding debt and/or opportunistic refinancing of debt or the utilization of cash or marketable securities to satisfy collateral requirements. The amount of debt that may be repurchased or otherwise retired or refinanced, if any, will depend on market conditions, trading levels of our debt, our cash position, compliance with debt covenants and other considerations.
Term Loan Facility
On July 1, 2014, in connection with our initial public offering, we terminated the Old Term Facilities and entered into the Term Loan Facility. Borrowings under the Term Loan Facility, together with $243 million of available cash and $120 million of net proceeds of the initial public offering, were used to repay in full the $2,187 million outstanding under the Old Term Facilities. In
47
addition, $42 million of available cash was used to pay debt issuance costs of $24 million and to pay original issue discount of $18 million in connection with the Term Loan Facility.
On July 23, 2014, we entered into two four-year interest rate swap agreements effective August 1, 2014. The aggregate notional amount of the agreements was $300 million. Under the terms of the agreements, we will pay a weighted-average fixed rate of interest of 1.786 percent on the $300 million notional amount, and we will receive a floating rate of interest (based on one-month London inter-bank offered rate “LIBOR”) on the notional amount. Therefore, during the term of the agreements, the effective interest rate on $300 million of the Term Loan Facility is fixed at a rate of 1.786 percent, plus the incremental borrowing margin of 3.25 percent.
On July 23, 2014, we entered into three forty-one month interest rate swap agreements effective March 1, 2015. The aggregate notional amount of the agreements was $400 million. Under the terms of the agreements, we will pay a weighted-average fixed rate of interest of 1.927 percent on the $400 million notional amount, and we will receive a floating rate of interest (based on one-month LIBOR) on the notional amount. Therefore, during the term of the agreements, the effective interest rate on $400 million of the Term Loan Facility is fixed at a rate of 1.927 percent, plus the incremental borrowing margin of 3.25 percent.
2020 Notes
On July 16, 2014, we used proceeds from our initial public offering to redeem $210 million of its outstanding 8% 2020 Notes and $263 million of its outstanding 7% 2020 Notes. In connection with the partial redemption of the 8% 2020 Notes and 7% 2020 Notes, we were required to pay a pre-payment premium of $17 million and $18 million, respectively, and accrued interest of $7 million and $8 million, respectively. Additionally, in connection with the partial redemption of the 8% 2020 Notes and 7% 2020 Notes and the repayment of the Old Term Facilities, we recorded a loss on extinguishment of debt of $65 million in the year ended December 31, 2014, which includes the pre-payment premiums on the 8% 2020 Notes and 7% 2020 Notes of $17 million and $18 million, respectively, and the write-off of $30 million of debt issuance costs.
On February 17, 2015, we redeemed $190 million in aggregate principal amount of the 8% 2020 Notes at a redemption price of 106.0% of the principal amount using available cash. In connection with the partial redemption, we recorded a loss on extinguishment of debt of $13 million in the year ended December 31, 2015, which includes a pre-payment premium of $11 million and the write-off of $2 million of debt issuance costs.
On April 1, 2015, we entered into the First Term Loan Amendment, which provides for the April Incremental Term Loans in an aggregate principal amount of $175 million. On April 1, 2015, we used the net proceeds from the April Incremental Term Loans, together with cash on hand, to redeem the remaining outstanding $200 million in aggregate principal amount of the 8% 2020 Notes at a redemption price of 106.0% of the principal amount. In connection with the redemption, we recorded a loss on extinguishment of debt of $14 million in the year ended December 31, 2015, which includes a pre-payment premium of $12 million and the write-off of $2 million of debt issuance costs.
On August 17, 2015, we entered into the Second Term Loan Amendment, which provides for the August Incremental Term Loans in an aggregate principal amount of $400 million. On August 17, 2015, we used the net proceeds from the August Incremental Term Loans, together with cash on hand, to redeem the remaining outstanding $488 million in aggregate principal amount of the 7% 2020 Notes at a redemption price of 105.25% of the principal amount. In connection with the redemption, we recorded a loss on extinguishment of debt of $31 million in the year ended December 31, 2015, which includes a pre-payment premium of $25 million and the write-off of $6 million of debt issuance costs.
Fleet and Equipment Financing Arrangements
We have entered into a fleet management services agreement (the “Fleet Agreement”) which, among other things, allows us to obtain fleet vehicles through a leasing program. We expect to fulfill substantially all of our vehicle fleet needs through the leasing program under the Fleet Agreement. For the year ended December 31, 2015, we acquired $21 million of vehicles through the leasing program under the Fleet Agreement. All leases under the Fleet Agreement are capital leases for accounting purposes. The lease rental payments include an interest component calculated using a variable rate based on one-month LIBOR plus other contractual adjustments and a borrowing margin totaling 2.45 percent. We have no minimum commitment for the number of vehicles to be obtained under the Fleet Agreement.
Additionally, a portion of our property and equipment is leased through programs outside the scope of the Fleet Agreement. For the year ended December 31, 2015, we acquired $6 million of property and equipment through these incremental leasing programs, which are treated as capital leases for accounting purposes. We anticipate new lease financing, including the Fleet Agreement and incremental leasing programs, for the full year 2016 will range from $35 million to $45 million.
Limitations on Distributions and Dividends by Subsidiaries
We are a holding company, and as such have no independent operations or material assets other than ownership of equity interests in our subsidiaries. We depend on our subsidiaries to distribute funds to us so that we may pay obligations and expenses, including satisfying obligations with respect to indebtedness. The ability of our subsidiaries to make distributions and dividends to us depends on their operating results, cash requirements and financial condition and general business conditions, as well as restrictions under the laws of our subsidiaries’ jurisdictions.
48
The terms of the agreements governing the Credit Facilities restrict the ability of our subsidiaries to pay dividends, make loans or otherwise transfer assets to us. Further, our subsidiaries are permitted under the terms of the Credit Facilities and other indebtedness to incur additional indebtedness that may restrict or prohibit the making of distributions, the payment of dividends or the making of loans by such subsidiaries to us.
Furthermore, there are third-party restrictions on the ability of certain of our subsidiaries to transfer funds to us. These restrictions are related to regulatory requirements at American Home Shield and to a subsidiary borrowing arrangement at SMAC. The payments of ordinary and extraordinary dividends by our home warranty and similar subsidiaries (through which we conduct our American Home Shield business) are subject to significant regulatory restrictions under the laws and regulations of the states in which they operate. Among other things, such laws and regulations require certain such subsidiaries to maintain minimum capital and net worth requirements and may limit the amount of ordinary and extraordinary dividends and other payments that these subsidiaries can pay to us. As of December 31, 2015, the total net assets subject to these third-party restrictions was $169 million. We expect that such limitations will be in effect in 2016. None of our subsidiaries are obligated to make funds available to us through the payment of dividends.
We consider undistributed earnings of our foreign subsidiaries as of December 31, 2015 to be indefinitely reinvested and, accordingly, no U.S. income taxes have been provided thereon. Cumulative undistributed earnings of our foreign subsidiaries amounted to $56 million and $53 million as of December 31, 2015 and 2014, respectively. Should these earnings become taxable, we could be subject to U.S. income taxes (subject to an adjustment for foreign tax credits) and withholding taxes in various jurisdictions. The amount of cash associated with indefinitely reinvested foreign earnings was approximately $17 million and $20 million as of December 31, 2015 and December 31, 2014, respectively. We have not repatriated, nor do we anticipate the need to repatriate, funds to the United States to satisfy domestic liquidity needs arising in the ordinary course of business, including liquidity needs associated with our domestic debt service requirements.
Cash Flows
Cash flows from operating, investing and financing activities, as reflected in the accompanying consolidated statements of cash flows, are summarized in the following table.
|
Year Ended December 31, |
|||||||||
|
(In millions) |
2015 |
2014 |
2013 |
||||||
|
Net cash provided from (used for): |
|||||||||
|
Operating activities |
$ |
336 |
$ |
253 |
$ |
208 | |||
|
Investing activities |
(98) | (56) | (70) | ||||||
|
Financing activities |
(319) | (277) | (78) | ||||||
|
Discontinued operations |
(11) | (15) | 6 | ||||||
|
Effect of exchange rate changes on cash |
(2) |
— |
— |
||||||
|
Cash (decrease) increase during the period |
$ |
(92) |
$ |
(95) |
$ |
66 | |||
Operating Activities
Net cash provided from operating activities from continuing operations increased $83 million to $336 million for the year ended December 31, 2015 compared to $253 million for the year ended December 31, 2014 and $208 million for the year ended December 31, 2013.
Net cash provided from operating activities in 2015 comprised $405 million in earnings adjusted for non-cash charges, offset, in part, by a $7 million increase in cash required for working capital (an $18 million decrease excluding the working capital impact of accrued interest, restructuring and taxes), $49 million in payments for the call premium paid on the retirement of debt and $13 million in excess tax benefits from stock-based compensation expense. For the year ended December 31, 2015, working capital requirements were negatively impacted by the timing of interest payments driven by the redemption of the 2020 Notes, offset, in part, by favorable changes in the payment terms with certain of our vendors.
Our federal cash tax obligations have benefitted in recent years from the usage of federal net operating loss carryforwards (“NOLs”). In the third quarter of 2015, we exhausted such NOLs and began making federal cash tax payments. For the year ended December 31, 2015, we have made federal cash tax payments of $34 million.
Net cash provided from operating activities in 2014 comprised $303 million in earnings adjusted for non-cash charges, offset, in part, by $35 million in payments for the call premium paid on the retirement of debt and a $14 million increase in cash required for working capital (a $3 million decrease excluding the working capital impact of accrued interest, restructuring and taxes). Accrued interest balances were reduced in 2014 as a result of the reduction in long-term debt.
Net cash provided from operating activities in 2013 comprised $191 million in earnings adjusted for non‑cash charges and a $17 million decrease in cash required for working capital (an $18 million decrease excluding the working capital impact of accrued interest, restructuring and taxes). For the year ended December 31, 2013, working capital requirements were favorably impacted by a change in the timing of customer prepayments.
49
Investing Activities
Net cash used for investing activities from continuing operations was $98 million for the year ended December 31, 2015 compared to $56 million for the year ended December 31, 2014 and $70 million for the year ended December 31, 2013.
Capital expenditures increased to $40 million in 2015 from $35 million in 2014 and $39 million in 2013 and included recurring capital needs and information technology projects. We anticipate capital expenditures for the full year 2016 will range from $50 million to $60 million, reflecting recurring capital needs and the continuation of investments in information systems and productivity enhancing technology. We expect to fulfill our ongoing vehicle fleet needs through vehicle capital leases. We have no additional material capital commitments at this time.
Proceeds from the sale of equipment and other assets was $14 million in 2015, primarily driven by the branch conversions. The branches were sold for a total purchase price of $17 million for which we received cash of $13 million and provided financing of $4 million. We expect to continue the branch conversions in 2016.
Cash payments for acquisitions totaled $92 million in 2015, compared with $58 million in 2014 and $32 million in 2013. Consideration paid for tuck-in acquisitions consisted of cash payments and debt payable to sellers. We expect to continue our tuck-in acquisition program at Terminix and to periodically evaluate other strategic acquisitions.
Cash flows provided from purchases, sales and maturities of securities, net, in 2015 and 2014 were $26 million and $40 million, respectively, and were driven by the maturity and sale of marketable securities at American Home Shield. There were no cash flows from purchases, sales and maturities of securities, net, in 2013.
Cash flows used for notes receivable, net, in 2015 and 2014 were $6 million and were a result of increased financing provided by SMAC to our franchisees and retail customers of our operating units. There were no cash flows from notes receivable, net, in 2013.
Financing Activities
Net cash used for financing activities from continuing operations was $319 million for the year ended December 31, 2015 compared to $277 million for the year ended December 31, 2014 and $78 million for the year ended December 31, 2013.
During 2015, we borrowed an incremental $583 million, made scheduled principal payments on long-term debt of $45 million and redeemed $390 million and $488 million in aggregate principal amount of our 8% 2020 Notes and 7% 2020 Notes, respectively, at a redemption price of 106.0% and 105.25%, respectively, of the principal amounts using available cash and the April and August Incremental Term Loans. Additionally, we paid $2 million in original issue discount, paid $5 million in debt issuance costs, recognized $13 million in excess tax benefits from the exercise of stock options and vesting of RSUs and received $16 million from the issuance of common stock.
On July 1, 2014, we completed the initial public offering of 41,285,000 shares of our common stock at a price of $17.00 per share, and we terminated the then-existing agreements governing our Old Term Facilities and the then-existing revolving credit facility and entered into the Credit Facilities. The net proceeds and use of proceeds in connection with the offering and related refinancing, which are included in financing activities from continuing operations during 2014, are as follows:
|
(In millions) |
|||
|
Net proceeds from the initial public offering |
$ |
663 | |
|
Borrowings under the Term Loan Facility |
1,825 | ||
|
Repayment of the Old Term Facilities |
(2,187) | ||
|
Partial redemption of 8% 2020 Notes |
(210) | ||
|
Partial redemption of 7% 2020 Notes |
(263) | ||
|
Original issue discount paid in connection with the Term Loan Facility |
(18) | ||
|
Debt issuance costs paid in connection with the Term Loan Facility |
(24) | ||
|
Net cash used for financing activities in connection with the initial public offering |
$ |
(214) |
In addition to the aforementioned financing activities in connection with our initial public offering, during 2014, we made scheduled principal payments on long-term debt of $38 million and contributed $35 million to New TruGreen in connection with the TruGreen Spin-off. Additionally, during 2014, we paid $6 million for the purchase of common stock and RSUs and received $16 million from the issuance of common stock.
During 2013, we made scheduled principal payments on long‑term debt of $49 million, including the payment of the amounts outstanding under the former accounts receivable securitization facility, and made payments on other long‑term financing obligations of $4 million. During 2013, we borrowed an incremental $1 million, paid $12 million in original issue discount and paid debt issuance costs of $6 million. Additionally, during 2013, we paid $16 million for the repurchase of common stock and RSUs and received payments totaling $8 million from the issuance of common stock.
50
Contractual Obligations
The following table presents our contractual obligations and commitments as of December 31, 2015.
|
(In millions) |
Total |
Less than 1 Yr |
1 - 3 Yrs |
3 - 5 Yrs |
More than 5 Yrs |
||||||||||
|
Principal repayments* |
$ |
2,792 |
$ |
36 |
$ |
163 |
$ |
61 |
$ |
2,531 | |||||
|
Capital leases* |
51 | 18 | 24 | 9 | 1 | ||||||||||
|
Estimated interest payments(1) |
901 | 136 | 255 | 235 | 275 | ||||||||||
|
Non-cancelable operating leases(2) |
67 | 20 | 31 | 11 | 5 | ||||||||||
|
Purchase obligations: |
|||||||||||||||
|
Supply agreements and other(3) |
122 | 75 | 47 |
— |
— |
||||||||||
|
Outsourcing agreements(4) |
45 | 13 | 28 | 3 |
— |
||||||||||
|
Insurance claims* |
259 | 106 | 93 | 22 | 38 | ||||||||||
|
Other, including deferred compensation trust* |
9 | 2 | 1 | 1 | 5 | ||||||||||
|
Total amount |
$ |
4,246 |
$ |
407 |
$ |
641 |
$ |
343 |
$ |
2,854 | |||||
*These items are reported in the consolidated statements of financial position.
|
(1) |
These amounts represent future interest payments related to existing debt obligations based on fixed and variable interest rates and principal maturities specified in the associated debt agreements. As of December 31, 2015, payments related to variable debt are based on applicable rates at December 31, 2015 plus the specified margin in the associated debt agreements for each period presented. As of December 31, 2015, the estimated debt balance (including capital leases) as of each fiscal year end from 2016 through 2020 is $2,789 million, $2,723 million, $2,602 million, $2,564 million and $2,532 million, respectively. The weighted-average interest rate on the estimated debt balances at each fiscal year end from 2016 through 2020 is expected to be 4.8 percent. See Note 12 to the consolidated financial statements for the terms and maturities of existing debt obligations. |
|
(2) |
These amounts primarily represent future payments relating to real estate operating leases. A portion of our vehicle fleet and some equipment are leased through cancelable operating leases and are therefore excluded in the table above. |
|
(3) |
These obligations include commitments for various products and services including, among other things, inventory purchases, telecommunications services, marketing and advertising services and other professional services. Arrangements are considered purchase obligations if a contract specifies all significant terms, including fixed or minimum quantities to be purchased, a pricing structure and approximate timing of the transactions. Most arrangements are cancelable without a significant penalty and with short notice (usually 30‑120 days) and amounts reflected above include our minimum contractual obligation (inclusive of applicable cancellation penalties). For obligations with significant penalties associated with termination, the minimum required expenditures over the term of the agreement have been included in the table above. |
|
(4) |
Outsourcing agreements include commitments for the purchase of certain outsourced services from third‑party vendors. Because the services provided through these agreements are integral to our operations, we have concluded that it is appropriate to include the total anticipated costs for services under these agreements in the table above. |
Due to the uncertainty with respect to the timing of future cash flows associated with unrecognized tax benefits at December 31, 2015, we are unable to reasonably estimate the period of cash settlement with the respective taxing authority. Accordingly, $16 million of unrecognized tax benefits have been excluded from the contractual obligations table above. See the discussion of income taxes in Note 5 to the consolidated financial statements.
Financial Position—Continuing Operations
The following discussion describes changes in our financial position from December 31, 2014 to December 31, 2015.
Receivables increased from prior year levels, primarily related to customer growth at American Home Shield.
Property and equipment increased from prior year levels, reflecting the purchases for recurring capital needs and information technology projects and the acquisition of vehicles under the Fleet Agreement, offset, in part, by depreciation expense.
Goodwill increased from prior year levels due to several pest control and termite acquisitions, offset, in part, by reductions due to the branch conversions. and foreign exchange rate adjustments. See Notes 4 and 6 to the consolidated financial statements for more details.
Marketable securities decreased from prior year levels, primarily due to the sale of securities at American Home Shield.
Other assets increased from prior year levels, primarily due to an increase in insurance recoverables.
Accounts payable increased from prior year levels, primarily reflecting the change in the timing of payments to vendors.
Accrued interest payable decreased from prior year levels, reflecting the reduction in long-term debt.
51
Deferred revenue increased from prior year levels, primarily reflecting customer growth American Home Shield.
Long-term debt decreased from prior year levels due to the redemption of the 2020 Notes. See Note 12 to the consolidated financial statements for more details.
Deferred taxes increased from prior year levels, primarily reflecting the utilization of net operating losses.
Other long-term obligations, primarily self-insured claims increased from prior year levels, primarily reflecting an increase in accruals for insured claims.
Total shareholders’ equity was $545 million as of December 31, 2015 compared to $359 million as of December 31, 2014. The increase was primarily driven by the $147 million of comprehensive income in the year ended December 31, 2015. See the consolidated statements of shareholders’ equity for further information.
Financial Position—Discontinued Operations
The assets and liabilities related to discontinued operations have been classified in a separate caption on the consolidated statements of financial position.
Off-Balance Sheet Arrangements
As of December 31, 2015, we did not have any significant off-balance sheet arrangements.
We do not have any relationships with unconsolidated entities or financial partnerships, such as entities often referred to as structured finance or special purpose entities, established for the purpose of facilitating off- balance sheet arrangements or other contractually narrow or limited purposes. Accordingly, we are not materially exposed to any financing, liquidity, market or credit risk that could arise if we had engaged in such relationships.
Critical Accounting Policies and Estimates
The preparation of the consolidated financial statements requires management to make certain estimates and assumptions required under GAAP which may differ from actual results. The following are our most critical accounting policies, which are those that require management’s most difficult, subjective and complex judgments, requiring the need to make estimates about the effect of matters that are inherently uncertain and may change in subsequent periods. The following discussion is not intended to represent a comprehensive list of our accounting policies. For a detailed description of the application of these and other accounting policies, see Note 2 to the consolidated financial statements included in this Annual Report on Form 10-K.
Self-insurance accruals
We carry insurance policies on insurable risks at levels which we believe to be appropriate, including workers’ compensation, auto and general liability risks. We purchase insurance from third-party insurance carriers. These policies typically incorporate significant deductibles or self-insured retentions. We are responsible for all claims that fall within the retention limits. In determining our accrual for self-insured claims, we use historical claims experience to establish both the current year accrual and the underlying provision for future losses. This actuarially determined provision and related accrual include both known claims, as well as incurred but not reported claims. We adjust our estimate of accrued self-insured claims when required to reflect changes based on factors such as changes in health care costs, accident frequency and claim severity. We believe the use of actuarial methods to account for these liabilities provides a consistent and effective way to measure these highly judgmental accruals. However, the use of any estimation technique in this area is inherently sensitive given the magnitude of claims involved and the length of time until the ultimate cost is known. We believe our recorded obligations for these expenses are consistently measured. Nevertheless, changes in healthcare costs, accident frequency and claim severity can materially affect the estimates for these liabilities.
Home Warranty Claims Accruals
Home warranty contracts are typically one year in duration. Home warranty claims costs are expensed as incurred. We recognize revenue over the life of these contracts in proportion to the expected direct costs. Those costs bear a direct relationship to the fulfillment of our obligations under the contracts and are representative of the relative value provided to the customer (proportional performance method). Accruals for home warranty claims at American Home Shield are made based on our claims experience and actuarial projections. The Company’s actuary performs a reserve analysis utilizing generally accepted actuarial methods that incorporate cumulative historical claims experience and information provided by the Company. We regularly review our estimates of claims costs and adjust the estimates when appropriate. We believe the use of actuarial methods to account for these liabilities provides a consistent and effective way to measure these highly judgmental accruals. However, the use of any estimation technique in this area is inherently sensitive given the magnitude of claims involved. We believe our recorded obligations for these expenses are consistently measured. Nevertheless, changes in claims costs can materially affect the estimates for these liabilities.
52
Income Taxes
We record deferred income tax balances based on the net tax effects of temporary differences between the carrying value of assets and liabilities for financial reporting purposes and income tax purposes. Based on the evaluation of all available information, the Company recognizes future tax benefits, such as net operating loss carryforwards, to the extent that realizing these benefits is considered more likely than not. We record valuation allowances against our deferred tax assets, when necessary. Realization of deferred tax assets (such as net operating loss carry-forwards) is dependent on future taxable earnings and is therefore uncertain. At least quarterly, we assess the likelihood that our deferred tax asset balance will be recovered from future taxable income. Significant judgment is required in evaluating the need for and magnitude of appropriate valuation allowances against deferred tax assets.
On an interim basis, we estimate what our effective tax rate will be for the full fiscal year. This estimated annual effective tax rate is then applied to the year-to-date income before income taxes, excluding infrequently occurring or unusual items, to determine the year-to-date income tax expense. The income tax effects of infrequent or unusual items are recognized in the interim period in which they occur. As the year progresses, we continually refine our estimate based upon actual events and earnings by jurisdiction during the year. This continual estimation process periodically results in a change to our expected effective tax rate for the fiscal year. When this occurs, we adjust the income tax provision during the quarter in which the change in estimate occurs. Our current and deferred tax provisions are based on estimates and assumptions that could differ from the final positions reflected in our income tax returns. We adjust our current and deferred tax provisions based on our income tax returns which are generally filed in the third or fourth quarters of the subsequent year.
Our income tax returns are audited by U.S. state, U.S. federal and foreign tax authorities, and we are typically engaged in various tax examinations at any given time. Uncertain tax positions often arise due to uncertainty or differing interpretations of the application of tax rules throughout the various jurisdictions in which we operate. On a quarterly basis, we evaluate the probability that a tax position will be effectively sustained and the appropriateness of the amount recognized for uncertain tax positions based on factors including changes in facts or circumstances, changes in tax law, settled audit issues and new audit activity. Changes in our assessment may result in the recognition of a tax benefit or an additional charge to the tax provision in the period our assessment changes. While management believes that these judgments and estimates are appropriate and reasonable under the circumstances, actual resolution of these matters may differ from recorded estimated amounts. We recognize interest and penalties related to income tax matters in income tax expense.
Property and Equipment, Intangible Assets and Goodwill
Fixed assets and intangible assets with finite lives are depreciated and amortized on a straight-line basis over their estimated useful lives. These lives are based on our previous experience for similar assets, potential market obsolescence and other industry and business data. As required by accounting standards for the impairment or disposal of long-lived assets, our fixed assets and finite-lived intangible assets are tested for recoverability whenever events or changes in circumstances indicate their carrying amounts may not be recoverable. If the carrying value is no longer recoverable based upon the undiscounted future cash flows of the asset, an impairment loss would be recognized equal to the difference between the carrying amount and the fair value of the asset. Changes in the estimated useful lives or in the asset values could cause us to adjust our book value or future expense accordingly.
As required under accounting standards for goodwill and other intangibles, goodwill is not subject to amortization, and intangible assets with indefinite useful lives are not amortized until their useful lives are determined to no longer be indefinite. Goodwill and intangible assets that are not subject to amortization are subject to assessment for impairment by applying a fair-value based test on an annual basis or more frequently if circumstances indicate a potential impairment. We adopted the provisions of ASU 2011-08, ‘‘Testing Goodwill for Impairment,’’ in the fourth quarter of 2011. This Accounting Standards Update (‘‘ASU’’), gives entities the option of performing a qualitative assessment before calculating the fair value of a reporting unit in Step 1 of the goodwill impairment test. If entities determine, on the basis of qualitative factors, that the fair value of a reporting unit is more likely than not greater than its carrying amount, the two-step impairment test would not be required. For the 2015, 2014 and 2013 annual goodwill impairment analysis performed as of October 1 of each year, we did not perform qualitative assessments on any reporting unit, but instead completed Step 1 of the goodwill impairment test for all reporting units.
Goodwill impairment is determined using a two-step process. The first step involves a comparison of the estimated fair value of a reporting unit to its carrying amount, including goodwill. In performing the first step, we determine the fair value of a reporting unit using a combination of a discounted cash flow, or ‘‘DCF,’’ analysis, a market-based comparable approach and a market-based transaction approach. Determining fair value requires the exercise of significant judgment, including judgment about appropriate discount rates, terminal growth rates, the amount and timing of expected future cash flows, as well as relevant comparable company earnings multiples for the market-based comparable approach and relevant transaction multiples for the market-based transaction approach. The cash flows employed in the DCF analyses are based on our most recent annual operating plan and, for years beyond the annual operating plan, our estimates, which are based on estimated growth rates. The discount rates used in the DCF analyses are intended to reflect the risks inherent in the future cash flows of the respective reporting units. In addition, the market-based comparable and transaction approaches utilize comparable company public trading values, comparable company historical results, research analyst estimates and, where available, values observed in private market transactions. If the estimated fair value of a reporting unit exceeds its carrying amount, goodwill of the reporting unit is not impaired and the second step of the impairment test is not necessary. If the carrying amount of a reporting unit exceeds its estimated fair value, then the second step of the goodwill impairment test must be performed. The second step of the goodwill impairment test compares the implied fair value of the reporting
53
unit’s goodwill with its goodwill carrying amount to measure the amount of impairment, if any. The implied fair value of goodwill is determined in the same manner as the amount of goodwill recognized in a business combination. In other words, the estimated fair value of the reporting unit is allocated to all of the assets and liabilities of that unit (including any unrecognized intangible assets) as if the reporting unit had been acquired in a business combination and the fair value of the reporting unit was the purchase price paid. If the carrying amount of the reporting unit’s goodwill exceeds the implied fair value of that goodwill, an impairment is recognized in an amount equal to that excess.
The impairment test for other intangible assets not subject to amortization involves a comparison of the estimated fair value of the intangible asset with its carrying value. If the carrying value of the intangible asset exceeds its fair value, an impairment loss is recognized in an amount equal to that excess. The estimates of fair value of intangible assets not subject to amortization are determined using a DCF valuation analysis. The DCF methodology used to value trade names is known as the relief from royalty method and entails identifying the hypothetical cash flows generated by an assumed royalty rate that a third-party would pay to license the trade names and discounting them back to the valuation date. Significant judgments inherent in this analysis include the selection of appropriate discount rates and hypothetical royalty rates, estimating the amount and timing of estimated future cash flows attributable to the hypothetical royalty rates and identification of appropriate terminal growth rate assumptions. The discount rates used in the DCF analyses are intended to reflect the risk inherent in the projected future cash flows generated by the respective intangible assets.
Goodwill and indefinite-lived intangible assets, primarily our trade names, are assessed annually for impairment during the fourth quarter or earlier upon the occurrence of certain events or substantive changes in circumstances. Our goodwill is assigned to four reporting units: Terminix, American Home Shield, ServiceMaster Clean and Merry Maids. The ServiceMaster Clean and Merry Maids reporting units are aggregated into the Franchise Services Group segment. The October 1, 2015 estimated fair values for all reporting units were substantially in excess of their respective carrying values, and we do not believe the reporting units were at risk of impairment as of December 31, 2015. Our 2015, 2014, and 2013 annual impairment analyses, which were performed as of October 1 of each year, did not result in any goodwill or trade name impairments to continuing operations.
Stock-Based Compensation
Stock-based compensation expense for stock options is estimated at the grant date based on an award’s fair value as calculated by the Black-Scholes option-pricing model and is recognized as expense over the requisite service period. The Black-Scholes model requires various highly judgmental assumptions including expected volatility and option life. If any of the assumptions used in the Black-Scholes model change significantly, stock-based compensation expense for future grants may differ materially from that recorded in the current period related to options granted to date. In addition, we estimate the expected forfeiture rate and only recognize expense for those shares expected to vest. We estimate the forfeiture rate based on historical experience. To the extent our actual forfeiture rate is different from our estimate, stock-based compensation expense is adjusted accordingly. See Note 17 to the consolidated financial statements for more details.
Contingent Liabilities
Accruals for contingent liabilities, including legal and environmental matters, are recorded when it is probable that a liability has been incurred or an asset impaired and the amount of the loss can be reasonably estimated. Liabilities accrued for legal matters require judgments regarding projected outcomes and range of loss based on historical experience and recommendations of legal counsel. Liabilities for environmental matters require evaluations of relevant environmental regulations and estimates of future remediation alternatives and costs.
Newly Issued Accounting Standards
New accounting rules and disclosure requirements can significantly impact our reported results and the comparability of our financial statements. Effective December 31, 2015, we adopted Accounting Standards Update (“ASU”) 2015-03, “Simplifying the Presentation of Debt Issuance Costs” and ASU 2015-17, “Balance Sheet Classification of Deferred Taxes.” See Note 2 to the consolidated financial statements for further information on these adoptions and other newly issued accounting standards.
Information Regarding Forward-Looking Statements
This report contains forward-looking statements and cautionary statements. Some of the forward-looking statements can be identified by the use of forward-looking terms such as “believes,” “expects,” “may,” “will,” “shall,” “should,” “would,” “could,” “seeks,” “aims,” “projects,” “is optimistic,” “intends,” “plans,” “estimates,” “anticipates” or other comparable terms. Forward-looking statements include, without limitation, all matters that are not historical facts. They appear in a number of places throughout this report and include, without limitation, statements regarding our intentions, beliefs, assumptions or current expectations concerning, among other things, financial position; results of operations; cash flows; prospects; growth strategies or expectations; customer retention; the continuation of acquisitions, including the integration of any acquired company and risks relating to any such acquired company; fuel prices; attraction and retention of key personnel; the impact of fuel swaps; the valuation of marketable securities; estimates of accruals for self-insured claims related to workers’ compensation, auto and general liability risks; estimates of accruals for home warranty claims; estimates of future payments under operating and capital leases; estimates on current and deferred tax provisions; the outcome
54
(by judgment or settlement) and costs of legal or administrative proceedings, including, without limitation, collective, representative or class action litigation; and the impact of prevailing economic conditions.
Forward-looking statements are subject to known and unknown risks and uncertainties, many of which may be beyond our control. We caution you that forward-looking statements are not guarantees of future performance or outcomes and that actual performance and outcomes, including, without limitation, our actual results of operations, financial condition and liquidity, and the development of the market segments in which we operate, may differ materially from those made in or suggested by the forward-looking statements contained in this report. In addition, even if our results of operations, financial condition and cash flows, and the development of the market segments in which we operate, are consistent with the forward-looking statements contained in this report, those results or developments may not be indicative of results or developments in subsequent periods. A number of important factors, including, without limitation, the risks and uncertainties discussed in “Risk Factors” and “Management’s Discussion and Analysis of Financial Condition and Results of Operations” above, could cause actual results and outcomes to differ from those reflected in the forward-looking statements. Additional factors that could cause actual results and outcomes to differ from those reflected in forward-looking statements include, without limitation:
|
· |
lawsuits, enforcement actions and other claims by third parties or governmental authorities; |
|
· |
the 401(k) Plan correction contribution and other employee benefit plan compliance issues; |
|
· |
compliance with, or violation of, environmental, health and safety laws and regulations; |
|
· |
weakening general economic conditions, especially as they may affect home sales, unemployment and consumer confidence or spending levels; |
|
· |
our ability to successfully implement our business strategies; |
|
· |
adverse credit and financial markets impeding access, increasing financing costs or causing our customers to incur liquidity issues leading to some of our services not being purchased or cancelled; |
|
· |
cyber security breaches, disruptions or failures in our information technology systems and our failure to protect the security of personal information about our customers; |
|
· |
our ability to attract and retain key personnel, including our ability to attract, retain and maintain positive relations with trained workers and third-party contractors; |
|
· |
increase in prices for fuel and raw materials, and in minimum wage levels; |
|
· |
changes in the source and intensity of competition in our market segments; |
|
· |
adverse weather conditions; |
|
· |
our franchisees, subcontractors, third-party distributors and vendors taking actions that harm our business; |
|
· |
changes in our services or products; |
|
· |
our ability to protect our intellectual property and other material proprietary rights; |
|
· |
negative reputational and financial impacts resulting from future acquisitions or strategic transactions; |
|
· |
laws and governmental regulations increasing our legal and regulatory expenses; |
|
· |
increases in interest rates increasing the cost of servicing our substantial indebtedness; |
|
· |
increased borrowing costs due to lowering or withdrawal of the ratings, outlook or watch assigned to our debt securities; |
|
· |
restrictions contained in our debt agreements; |
|
· |
our ability to refinance all or a portion of our indebtedness or obtain additional financing; and |
|
· |
other factors described in this report and from time to time in documents that we file with the SEC. |
You should read this report completely and with the understanding that actual future results may be materially different from expectations. All forward-looking statements made in this report are qualified by these cautionary statements. These forward-looking statements are made only as of the date of this report, and we do not undertake any obligation, other than as may be required by law, to update or revise any forward-looking or cautionary statements to reflect changes in assumptions, the occurrence of events, unanticipated or otherwise, and changes in future operating results over time or otherwise.
Comparisons of results for current and any prior periods are not intended to express any future trends, or indications of future performance, unless expressed as such, and should only be viewed as historical data.
55
ITEM 7A. QUANTITATIVE AND QUALITATIVE DISCLOSURES ABOUT MARKET RISK
The economy and its impact on discretionary consumer spending, labor wages, fuel prices and other material costs, home resales, unemployment rates, insurance costs and medical costs could have a material adverse impact on future results of operations.
We do not hold or issue derivative financial instruments for trading or speculative purposes. We have entered into specific financial arrangements, primarily fuel swap agreements and interest rate swap agreements, in the normal course of business to manage certain market risks, with a policy of matching positions and limiting the terms of contracts to relatively short durations. The effect of derivative financial instrument transactions could have a material impact on our financial statements.
Interest Rate Risk
We are exposed to the impact of interest rate changes and manage this exposure through the use of variable-rate and fixed-rate debt and by utilizing interest rate swaps.
On July 23, 2014, we entered into two four‑year interest rate swap agreements effective August 1, 2014. The aggregate notional amount of the agreements was $300 million. Under the terms of the agreements, we will pay a weighted‑average fixed rate of interest of 1.786 percent on the $300 million notional amount, and we will receive a floating rate of interest (based on one‑month LIBOR) on the notional amount. Therefore, during the term of the agreements, the effective interest rate on $300 million of the Term Loan Facility is fixed at a rate of 1.786 percent, plus the incremental borrowing margin of 3.25 percent.
On July 23, 2014, we entered into three forty‑one month interest rate swap agreements effective March 1, 2015. The aggregate notional amount of the agreements was $400 million. Under the terms of the agreements, we will pay a weighted‑average fixed rate of interest of 1.927 percent on the $400 million notional amount, and we will receive a floating rate of interest (based on one‑month LIBOR) on the notional amount. Therefore, during the term of the agreements, the effective interest rate on $400 million of the Term Loan Facility is fixed at a rate of 1.927 percent, plus the incremental borrowing margin of 3.25 percent.
We believe our exposure to interest rate fluctuations, when viewed on both a gross and net basis, is material to our overall results of operations. A significant portion of our outstanding debt, including debt under the Credit Facilities, bears interest at variable rates. As a result, increases in interest rates would increase the cost of servicing our indebtedness and could materially reduce our profitability and cash flows. As of December 31, 2015, each one percentage point change in interest rates would result in an approximate $17 million change in the annual interest expense on our Term Facility after considering the impact of the effective interest rate swaps. Assuming all revolving loans were fully drawn as of December 31, 2015, each one percentage point change in interest rates would result in an approximate $2 million change in annual interest expense on our Revolving Credit Facility. Our exposure to interest rate fluctuations has not changed significantly since December 31, 2014. The impact of increases in interest rates could be more significant for us than it would be for some other companies because of our substantial indebtedness.
The following table summarizes information about our debt as of December 31, 2015 (after considering the impact of the effective interest rate swaps), including the principal cash payments and related weighted‑average interest rates by expected maturity dates based on applicable rates at December 31, 2015.
|
Expected Year of Maturity |
Fair |
|||||||||||||||||||||||
|
(In millions) |
2016 |
2017 |
2018 |
2019 |
2020 |
Thereafter |
Total |
Value |
||||||||||||||||
|
Debt: |
||||||||||||||||||||||||
|
Fixed rate |
$ |
15 |
$ |
12 |
$ |
88 |
$ |
7 |
$ |
6 |
$ |
978 |
$ |
1,105 |
$ |
1,092 | ||||||||
|
Average interest rate |
6.9 |
% |
6.5 |
% |
7.0 |
% |
6.5 |
% |
6.5 |
% |
5.8 |
% |
5.9 |
% |
||||||||||
|
Variable rate |
$ |
39 |
$ |
54 |
$ |
34 |
$ |
30 |
$ |
27 |
$ |
1,554 |
$ |
1,738 |
$ |
1,721 | ||||||||
|
Average interest rate |
3.6 |
% |
3.3 |
% |
3.7 |
% |
3.9 |
% |
4.1 |
% |
4.2 |
% |
4.2 |
% |
||||||||||
|
Interest Rate Swaps: |
||||||||||||||||||||||||
|
Receive variable/pay fixed |
$ |
700 | ||||||||||||||||||||||
|
Average pay rate(1) |
1.9 |
% |
||||||||||||||||||||||
|
Average receive rate(1) |
1.0 |
% |
||||||||||||||||||||||
(1)Before the application of the applicable borrowing margin.
Fuel Price Risk
We are exposed to market risk for changes in fuel prices through the consumption of fuel by our vehicle fleet in the delivery of services to our customers. We expect to use approximately 13 million gallons of fuel in 2016. As of December 31, 2015, a ten percent change in fuel prices would result in a change of approximately $3 million in our annual fuel cost before considering the impact of fuel swap contracts.
We use fuel swap contracts to mitigate the financial impact of fluctuations in fuel prices. As of December 31, 2015, we had fuel swap contracts to pay fixed prices for fuel with an aggregate notional amount of $21 million, maturing through 2016. The estimated fair value of these contracts as of December 31, 2015 was a net liability of $4 million. These fuel swap contracts provide a fixed price for approximately 71 percent of our estimated fuel usage for 2016.
56
ITEM 8. FINANCIAL STATEMENTS AND SUPPLEMENTARY DATA
REPORT OF INDEPENDENT REGISTERED PUBLIC ACCOUNTING FIRM
To the Board of Directors and Shareholders of
ServiceMaster Global Holdings, Inc.
Memphis, Tennessee
We have audited the accompanying consolidated statements of financial position of ServiceMaster Global Holdings, Inc. and subsidiaries (the “Company”) as of December 31, 2015 and 2014, and the related consolidated statements of operations and comprehensive income (loss), shareholders’ equity and cash flows for each of the three years in the period ended December 31, 2015. Our audits also included the financial statement schedules listed in the Index at Item 15. These financial statements and financial statement schedules are the responsibility of the Company’s management. Our responsibility is to express an opinion on the financial statements and financial statement schedules based on our audits.
We conducted our audits in accordance with the standards of the Public Company Accounting Oversight Board (United States). Those standards require that we plan and perform the audit to obtain reasonable assurance about whether the financial statements are free of material misstatement. An audit includes examining, on a test basis, evidence supporting the amounts and disclosures in the financial statements. An audit also includes assessing the accounting principles used and significant estimates made by management, as well as evaluating the overall financial statement presentation. We believe that our audits provide a reasonable basis for our opinion.
In our opinion, such consolidated financial statements present fairly, in all material respects, the financial position of ServiceMaster Global Holdings, Inc. and subsidiaries as of December 31, 2015 and 2014, and the results of their operations and their cash flows for each of the three years in the period ended December 31, 2015, in conformity with accounting principles generally accepted in the United States of America. Also, in our opinion, such financial statement schedules, when considered in relation to the basic consolidated financial statements taken as a whole, present fairly, in all material respects, the information set forth therein.
As discussed in Note 2 to the consolidated financial statements, as of December 31, 2015, the Company adopted Accounting Standards Update 2015-17 Income Taxes (Topic 740): Balance Sheet Classification of Deferred Taxes which resulted in a change in the presentation of deferred income taxes.
We have also audited, in accordance with the standards of the Public Company Accounting Oversight Board (United States), the Company’s internal control over financial reporting as of December 31, 2015, based on the criteria established in Internal Control—Integrated Framework (2013) issued by the Committee of Sponsoring Organizations of the Treadway Commission and our report dated February 26, 2016, expressed an unqualified opinion on the Company’s internal control over financial reporting.
/s/ Deloitte & Touche LLP
Memphis, Tennessee
February 26, 2016
57
Consolidated Statements of Operations and Comprehensive Income (Loss)
(In millions, except per share data)
|
Year Ended December 31, |
||||||||||
|
2015 |
2014 |
2013 |
||||||||
|
Revenue |
$ |
2,594 |
$ |
2,457 |
$ |
2,293 | ||||
|
Cost of services rendered and products sold |
1,375 | 1,298 | 1,220 | |||||||
|
Selling and administrative expenses |
666 | 669 | 691 | |||||||
|
Amortization expense |
38 | 52 | 51 | |||||||
|
401(k) Plan corrective contribution |
23 |
— |
— |
|||||||
|
Impairment of software and other related costs |
— |
47 |
— |
|||||||
|
Consulting agreement termination fees |
— |
21 |
— |
|||||||
|
Restructuring charges |
5 | 11 | 6 | |||||||
|
Gain on sale of Merry Maids branches |
(7) | (1) |
— |
|||||||
|
Interest expense |
167 | 219 | 247 | |||||||
|
Interest and net investment income |
(9) | (7) | (8) | |||||||
|
Loss on extinguishment of debt |
58 | 65 |
— |
|||||||
|
Other expense |
9 |
— |
— |
|||||||
|
Income from Continuing Operations before Income Taxes |
270 | 84 | 86 | |||||||
|
Provision for income taxes |
107 | 40 | 43 | |||||||
|
Equity in losses of joint venture |
— |
— |
(1) | |||||||
|
Income from Continuing Operations |
162 | 43 | 42 | |||||||
|
Loss from discontinued operations, net of income taxes |
(2) | (100) | (549) | |||||||
|
Net Income (Loss) |
$ |
160 |
$ |
(57) |
$ |
(507) | ||||
|
Other Comprehensive (Loss) Income, Net of Income Taxes: |
||||||||||
|
Net unrealized (losses) gains on securities |
(3) | (1) | 1 | |||||||
|
Net unrealized (losses) gains on derivative instruments |
(2) | (6) | 3 | |||||||
|
Foreign currency translation loss |
(8) | (5) | (4) | |||||||
|
Other Comprehensive Loss, Net of Income Taxes |
(13) | (13) |
— |
|||||||
|
Total Comprehensive Income (Loss) |
$ |
147 |
$ |
(70) |
$ |
(507) | ||||
|
Weighted-average common shares outstanding - Basic |
135.0 | 112.8 | 91.6 | |||||||
|
Weighted-average common shares outstanding - Diluted |
136.6 | 113.8 | 92.2 | |||||||
|
Basic Earnings (Loss) Per Share: |
||||||||||
|
Income from Continuing Operations |
$ |
1.20 |
$ |
0.38 |
$ |
0.46 | ||||
|
Loss from discontinued operations, net of income taxes |
(0.01) | (0.88) | (6.00) | |||||||
|
Net Income (Loss) |
1.19 | (0.50) | (5.53) | |||||||
|
Diluted Earnings (Loss) Per Share: |
||||||||||
|
Income from Continuing Operations |
$ |
1.19 |
$ |
0.38 |
$ |
0.46 | ||||
|
Loss from discontinued operations, net of income taxes |
(0.01) | (0.88) | (5.95) | |||||||
|
Net Income (Loss) |
1.17 | (0.50) | (5.49) | |||||||
See accompanying Notes to the Consolidated Financial Statements.
58
Consolidated Statements of Financial Position
(In millions, except share data)
|
As of |
As of |
|||||
|
December 31, |
December 31, |
|||||
|
2015 |
2014 |
|||||
|
Assets: |
||||||
|
Current Assets: |
||||||
|
Cash and cash equivalents |
$ |
296 |
$ |
389 | ||
|
Marketable securities |
24 | 19 | ||||
|
Receivables, less allowances of $23 and $25, respectively |
487 | 441 | ||||
|
Inventories |
40 | 42 | ||||
|
Prepaid expenses and other assets |
54 | 44 | ||||
|
Deferred customer acquisition costs |
32 | 35 | ||||
|
Total Current Assets |
933 | 969 | ||||
|
Other Assets: |
||||||
|
Property and equipment, net |
160 | 136 | ||||
|
Goodwill |
2,129 | 2,069 | ||||
|
Intangible assets, primarily trade names, service marks and trademarks, net |
1,704 | 1,696 | ||||
|
Notes receivable |
32 | 26 | ||||
|
Long-term marketable securities |
57 | 88 | ||||
|
Other assets |
83 | 44 | ||||
|
Total Assets |
$ |
5,098 |
$ |
5,028 | ||
|
Liabilities and Shareholders’ Equity: |
||||||
|
Current Liabilities: |
||||||
|
Accounts payable |
$ |
110 |
$ |
84 | ||
|
Accrued liabilities: |
||||||
|
Payroll and related expenses |
64 | 82 | ||||
|
Self-insured claims and related expenses |
106 | 92 | ||||
|
Accrued interest payable |
10 | 34 | ||||
|
Other |
59 | 51 | ||||
|
Deferred revenue |
552 | 514 | ||||
|
Liabilities of discontinued operations |
— |
9 | ||||
|
Current portion of long-term debt |
54 | 39 | ||||
|
Total Current Liabilities |
955 | 905 | ||||
|
Long-Term Debt |
2,698 | 2,987 | ||||
|
Other Long-Term Liabilities: |
||||||
|
Deferred taxes |
687 | 640 | ||||
|
Other long-term obligations, primarily self-insured claims |
213 | 138 | ||||
|
Total Other Long-Term Liabilities |
901 | 778 | ||||
|
Commitments and Contingencies (Note 9) |
||||||
|
Shareholders’ Equity: |
||||||
|
Common stock $0.01 par value (authorized 2,000,000,000 shares with 143,170,897 shares issued and 135,511,176 outstanding at December 31, 2015 and 141,731,682 shares issued and 134,092,335 outstanding at December 31, 2014) |
2 | 2 | ||||
|
Additional paid-in capital |
2,245 | 2,207 | ||||
|
Accumulated deficit |
(1,560) | (1,720) | ||||
|
Accumulated other comprehensive loss |
(21) | (8) | ||||
|
Less common stock held in treasury, at cost (7,659,721 shares at December 31, 2015 and 7,639,347 shares at December 31, 2014) |
(122) | (122) | ||||
|
Total Shareholders’ Equity |
545 | 359 | ||||
|
Total Liabilities and Shareholders’ Equity |
$ |
5,098 |
$ |
5,028 | ||
See accompanying Notes to the Consolidated Financial Statements.
59
Consolidated Statements of Shareholders’ Equity
(In millions)
|
Accumulated |
||||||||||||||||||||||||
|
Other |
||||||||||||||||||||||||
|
Additional |
Comprehensive |
|||||||||||||||||||||||
|
Common |
Paid-in |
Accumulated |
Income |
Treasury |
Total |
|||||||||||||||||||
|
Shares |
Stock |
Capital |
Deficit |
(Loss) |
Shares |
Amount |
Equity |
|||||||||||||||||
|
Balance December 31, 2012 |
98 |
$ |
1 |
$ |
1,513 |
$ |
(883) |
$ |
7 | (6) |
$ |
(103) |
$ |
535 | ||||||||||
|
Net loss |
— |
— |
— |
(507) |
— |
— |
— |
(507) | ||||||||||||||||
|
Other comprehensive income, net of tax |
— |
— |
— |
— |
— |
— |
— |
— |
||||||||||||||||
|
Total comprehensive loss |
— |
— |
— |
(507) |
— |
— |
— |
(507) | ||||||||||||||||
|
Issuance of common stock |
1 |
— |
7 |
— |
— |
— |
— |
7 | ||||||||||||||||
|
Exercise of stock options |
— |
— |
1 |
— |
— |
— |
— |
1 | ||||||||||||||||
|
Vesting of RSUs |
— |
— |
(1) |
— |
— |
— |
— |
(1) | ||||||||||||||||
|
DSUs converted into common stock |
— |
— |
(1) |
— |
— |
— |
1 |
— |
||||||||||||||||
|
Repurchase of common stock |
— |
— |
— |
— |
— |
(1) | (16) | (16) | ||||||||||||||||
|
Stock-based employee compensation |
— |
— |
4 |
— |
— |
— |
— |
4 | ||||||||||||||||
|
Balance December 31, 2013 |
99 |
$ |
1 |
$ |
1,523 |
$ |
(1,390) |
$ |
7 | (7) |
$ |
(118) |
$ |
23 | ||||||||||
|
Net loss |
— |
— |
— |
(57) |
— |
— |
— |
(57) | ||||||||||||||||
|
Other comprehensive loss, net of tax |
— |
— |
— |
— |
(13) |
— |
— |
(13) | ||||||||||||||||
|
Total comprehensive loss |
— |
— |
— |
(57) | (13) |
— |
— |
(70) | ||||||||||||||||
|
Net assets distributed to New TruGreen |
— |
— |
— |
(274) | (1) |
— |
— |
(275) | ||||||||||||||||
|
Issuance of common stock |
— |
— |
6 |
— |
— |
— |
— |
6 | ||||||||||||||||
|
Issuance of common stock through IPO |
41 |
— |
663 |
— |
— |
— |
— |
663 | ||||||||||||||||
|
Exercise of stock options |
1 |
— |
10 |
— |
— |
— |
— |
10 | ||||||||||||||||
|
Vesting of RSUs |
— |
— |
(1) |
— |
— |
— |
— |
(1) | ||||||||||||||||
|
DSUs converted into common stock |
— |
— |
(1) |
— |
— |
— |
1 |
— |
||||||||||||||||
|
Repurchase of common stock |
— |
— |
— |
— |
— |
— |
(5) | (5) | ||||||||||||||||
|
Stock-based employee compensation |
— |
— |
8 |
— |
— |
— |
— |
8 | ||||||||||||||||
|
Balance December 31, 2014 |
142 |
$ |
2 |
$ |
2,207 |
$ |
(1,720) |
$ |
(8) | (8) |
$ |
(122) |
$ |
359 | ||||||||||
|
Net income |
— |
— |
— |
160 |
— |
— |
— |
160 | ||||||||||||||||
|
Other comprehensive loss, net of tax |
— |
— |
— |
— |
(13) |
— |
— |
(13) | ||||||||||||||||
|
Total comprehensive income (loss) |
— |
— |
— |
160 | (13) |
— |
— |
147 | ||||||||||||||||
|
Issuance of common stock |
— |
— |
1 |
— |
— |
— |
— |
1 | ||||||||||||||||
|
Exercise of stock options |
1 |
— |
15 |
— |
— |
— |
— |
15 | ||||||||||||||||
|
DSUs converted into common stock |
— |
— |
(1) |
— |
— |
— |
1 |
— |
||||||||||||||||
|
Repurchase of common stock |
— |
— |
— |
— |
— |
— |
(1) | (1) | ||||||||||||||||
|
Stock-based employee compensation |
— |
— |
10 |
— |
— |
— |
— |
10 | ||||||||||||||||
|
Excess tax benefits from stock-based compensation |
— |
— |
13 |
— |
— |
— |
— |
13 | ||||||||||||||||
|
Balance December 31, 2015 |
143 |
$ |
2 |
$ |
2,245 |
$ |
(1,560) |
$ |
(21) | (8) |
$ |
(122) |
$ |
545 | ||||||||||
See accompanying Notes to the Consolidated Financial Statements
60
Consolidated Statements of Cash Flows
(In millions)
|
Year Ended December 31, |
||||||||
|
2015 |
2014 |
2013 |
||||||
|
Cash and Cash Equivalents at Beginning of Period |
$ |
389 |
$ |
484 |
$ |
418 | ||
|
Cash Flows from Operating Activities from Continuing Operations: |
||||||||
|
Net Income (Loss) |
160 | (57) | (507) | |||||
|
Adjustments to reconcile net loss to net cash provided from operating activities: |
||||||||
|
Loss from discontinued operations, net of income taxes |
2 | 100 | 549 | |||||
|
Equity in losses of joint venture |
— |
— |
1 | |||||
|
Depreciation expense |
47 | 48 | 48 | |||||
|
Amortization expense |
38 | 52 | 51 | |||||
|
Amortization of debt issuance costs |
5 | 8 | 10 | |||||
|
401(k) Plan corrective contribution |
23 |
— |
— |
|||||
|
Impairment of software and other related costs |
— |
47 |
— |
|||||
|
Gain on sale of Merry Maids branches |
(7) | (1) |
— |
|||||
|
Loss on extinguishment of debt |
58 | 65 |
— |
|||||
|
Call premium paid on retirement of debt |
(49) | (35) |
— |
|||||
|
Deferred income tax provision |
60 | 29 | 33 | |||||
|
Stock-based compensation expense |
10 | 8 | 4 | |||||
|
Excess tax benefits from stock-based compensation |
(13) |
— |
— |
|||||
|
Gain on sale of marketable securities |
(6) | (4) | (2) | |||||
|
Other |
16 | 7 | 3 | |||||
|
Change in working capital, net of acquisitions: |
||||||||
|
Receivables |
(44) | (34) | (21) | |||||
|
Inventories and other current assets |
5 | (1) | (1) | |||||
|
Accounts payable |
18 | (1) | 16 | |||||
|
Deferred revenue |
38 | 39 | 25 | |||||
|
Accrued liabilities |
1 | 1 | (1) | |||||
|
Accrued interest payable |
(24) | (17) | 2 | |||||
|
Accrued restructuring charges |
(2) | 3 | (3) | |||||
|
Current income taxes |
2 | (3) |
— |
|||||
|
Net Cash Provided from Operating Activities from Continuing Operations |
336 | 253 | 208 | |||||
|
Cash Flows from Investing Activities from Continuing Operations: |
||||||||
|
Property additions |
(40) | (35) | (39) | |||||
|
Sale of equipment and other assets |
14 | 2 | 1 | |||||
|
Other business acquisitions, net of cash acquired |
(92) | (58) | (32) | |||||
|
Purchases of available-for-sale securities |
(6) | (11) | (38) | |||||
|
Sales and maturities of available-for-sale securities |
32 | 51 | 38 | |||||
|
Origination of notes receivable |
(98) | (85) | (73) | |||||
|
Collections on notes receivable |
92 | 79 | 73 | |||||
|
Net Cash Used for Investing Activities from Continuing Operations |
(98) | (56) | (70) | |||||
|
Cash Flows from Financing Activities from Continuing Operations: |
||||||||
|
Borrowings of debt |
583 | 1,825 | 1 | |||||
|
Payments of debt |
(923) | (2,698) | (53) | |||||
|
Discount paid on issuance of debt |
(2) | (18) | (12) | |||||
|
Debt issuance costs paid |
(5) | (24) | (6) | |||||
|
Contribution to TruGreen Holding Corporation |
— |
(35) |
— |
|||||
|
Repurchase of common stock and RSU vesting |
— |
(6) | (16) | |||||
|
Issuance of common stock |
16 | 679 | 8 | |||||
|
Excess tax benefits from stock-based compensation |
13 |
— |
— |
|||||
|
Net Cash Used for Financing Activities from Continuing Operations |
(319) | (277) | (78) | |||||
|
Cash Flows from Discontinued Operations: |
||||||||
|
Cash (used for) provided from operating activities |
(11) | (11) | 39 | |||||
|
Cash used for investing activities |
— |
(2) | (21) | |||||
|
Cash used for financing activities |
— |
(3) | (12) | |||||
|
Net Cash (Used for) Provided from Discontinued Operations |
(11) | (15) | 6 | |||||
|
Effect of Exchange Rate Changes on Cash |
(2) |
— |
— |
|||||
|
Cash (Decrease) Increase During the Period |
(92) | (95) | 66 | |||||
|
Cash and Cash Equivalents at End of Period |
$ |
296 |
$ |
389 |
$ |
484 | ||
See accompanying Notes to the Consolidated Financial Statements.
61
SERVICEMASTER GLOBAL HOLDINGS, INC.
NOTES TO CONSOLIDATED FINANCIAL STATEMENTS
Note 1. Basis of Presentation
ServiceMaster is a leading provider of essential residential and commercial services. The Company’s services include termite and pest control, home warranties, disaster restoration, janitorial, residential cleaning, furniture repair and home inspection. The Company provides these services through an extensive service network of company-owned, franchised and licensed locations operating primarily under the following leading brands: Terminix, American Home Shield, ServiceMaster Restore, ServiceMaster Clean, Merry Maids, Furniture Medic and AmeriSpec. All consolidated Company subsidiaries are wholly-owned. Intercompany transactions and balances have been eliminated.
Initial Public Offering
On June 25, 2014, the Company’s registration statement on Form S-1 was declared effective by the SEC for an initial public offering of its common stock. The Company registered the offering and sale of 35,900,000 shares of its common stock and an additional 5,385,000 shares of its common stock sold to the underwriters pursuant to an option to purchase additional shares. On July 1, 2014, the Company completed the offering of 41,285,000 shares of its common stock at a price of $17.00 per share.
Secondary Public Offerings
On February 4, 2015, the Company’s registration statement on Form S-1 was declared effective by the SEC for a secondary offering of its common stock. The Company registered on behalf of certain stockholders the offering and sale of 25,000,000 shares of common stock and an additional 3,750,000 shares of common stock sold to the underwriters pursuant to an option to purchase additional shares. On February 10, 2015, the selling stockholders completed the offering of 25,000,000 shares of common stock at a price of $29.50 per share. On February 13, 2015, the selling stockholders completed the offering of an additional 3,750,000 shares of common stock at a price of $29.50 per share pursuant to the underwriters’ option to purchase additional shares.
On May 27, 2015, the Company’s registration statement on Form S-1 was declared effective by the SEC for a secondary offering of its common stock. The Company registered on behalf of certain stockholders the offering and sale of 20,000,000 shares of common stock and an additional 3,000,000 shares of common stock sold to the underwriters pursuant to an option to purchase additional shares. On June 2, 2015, the selling stockholders completed the offering of 20,000,000 shares of common stock at a price of $34.00 per share. On June 12, 2015, the selling stockholders completed the offering of an additional 3,000,000 shares of common stock at a price of $34.00 per share pursuant to the underwriters’ option to purchase additional shares.
On November 5, 2015, the Company’s shelf registration statement on Form S-3 was automatically declared effective by the SEC for a secondary offering of its common stock. The Company registered on behalf of certain stockholders the offering and sale of 28,961,763 shares of common stock. On November 5, 2015, the selling stockholders completed the offering of 28,961,763 shares of common stock at a price of $33.91 per share.
The Company did not receive any of the proceeds from the aggregate 80,711,763 shares of common stock sold by the selling stockholders in 2015.
Note 2. Significant Accounting Policies
Consolidation
The consolidated financial statements of the Company include all of its wholly-owned subsidiaries. All intercompany transactions and balances have been eliminated in consolidation.
Use of Estimates
The preparation of the consolidated financial statements requires management to make certain estimates and assumptions required under GAAP which may differ from actual results. The more significant areas requiring the use of management estimates relate to revenue recognition; the allowance for uncollectible receivables; accruals for self-insured retention limits related to medical, workers’ compensation, auto and general liability insurance claims; accruals for home warranties and termite damage claims; the possible outcome of outstanding litigation; accruals for income tax liabilities as well as deferred tax accounts; the deferral and amortization of customer acquisition costs; share based compensation; useful lives for depreciation and amortization expense; the valuation of marketable securities; and the valuation of tangible and intangible assets. In 2015, there were no changes in the significant areas that require estimates or in the underlying methodologies used in determining the amounts of these associated estimates.
The allowance for receivables is developed based on several factors including overall customer credit quality, historical write-off experience and specific account analyses that project the ultimate collectability of the outstanding balances. As such, these factors may change over time causing the allowance level to vary.
The Company carries insurance policies on insurable risks at levels which it believes to be appropriate, including workers’ compensation, auto and general liability risks. The Company purchases insurance policies from third-party insurance carriers, which typically incorporate significant deductibles or self-insured retentions. The Company is responsible for all claims that fall below the retention limits. In determining the Company’s accrual for self-insured claims, the Company uses historical claims experience to
62
establish both the current year accrual and the underlying provision for future losses. This actuarially determined provision and related accrual include known claims, as well as incurred but not reported claims. The Company adjusts its estimate of accrued self-insured claims when required to reflect changes based on factors such as changes in health care costs, accident frequency and claim severity.
The Company seeks to reduce the potential amount of loss arising from self-insured claims by insuring certain levels of risk. While insurance agreements are designed to limit the Company’s losses from large exposure and permit recovery of a portion of direct unpaid losses, insurance does not relieve the Company of its ultimate liability. Accordingly, the accruals for insured claims represent the Company’s total unpaid gross losses. Insurance recoverables, which are reported within Prepaid expenses and other assets and Other assets, relate to estimated insurance recoveries on the insured claims reserves.
Accruals for home warranty claims in the American Home Shield business are made based on the Company’s claims experience and actuarial projections. Termite damage claim accruals in the Terminix business are recorded based on both the historical rates of claims incurred within a contract year and the cost per claim. Current activity could differ causing a change in estimates. The Company has certain liabilities with respect to existing or potential claims, lawsuits, and other proceedings. The Company accrues for these liabilities when it is probable that future costs will be incurred and such costs can be reasonably estimated. Any resulting adjustments, which could be material, are recorded in the period the adjustments are identified.
The Company records deferred income tax balances based on the net tax effects of temporary differences between the carrying value of assets and liabilities for financial reporting purposes and income tax purposes. The Company records its deferred tax items based on the estimated value of the tax basis. The Company adjusts tax estimates when required to reflect changes based on factors such as changes in tax laws, relevant court decisions, results of tax authority reviews and statutes of limitations. The Company records a liability for unrecognized tax benefits resulting from uncertain tax positions taken or expected to be taken in a tax return. The Company recognizes potential interest and penalties related to its uncertain tax positions in income tax expense.
Revenue
Revenues from pest control services, as well as liquid and fumigation termite applications, are recognized as the services are provided. The Company eradicates termites through the use of non-baiting methods (e.g., fumigation or liquid treatments) and baiting systems. Termite services using baiting systems and termite inspection and protection contracts are frequently sold through annual contracts. Service costs for these contracts are expensed as incurred. The Company recognizes revenue over the life of these contracts in proportion to the expected direct costs. Those costs bear a direct relationship to the fulfillment of the Company’s obligations under the contracts and are representative of the relative value provided to the customer (proportional performance method). The Company regularly reviews its estimates of direct costs for its termite bait contracts and termite inspection and protection contracts and adjusts the estimates when appropriate.
Home warranty contracts are typically one year in duration. Home warranty claims costs are expensed as incurred. The Company recognizes revenue over the life of these contracts in proportion to the expected direct costs. Those costs bear a direct relationship to the fulfillment of the Company’s obligations under the contracts and are representative of the relative value provided to the customer (proportional performance method). The Company regularly reviews its estimates of claims costs and adjusts the estimates when appropriate.
The Company has franchise agreements in its Terminix, ServiceMaster Restore, ServiceMaster Clean, Merry Maids, Furniture Medic and AmeriSpec businesses. Franchise revenue (which in the aggregate represents approximately five percent of annual consolidated revenue from continuing operations) consists principally of continuing monthly fees based upon the franchisee’s customer-level revenue. Monthly fee revenue is recognized when the related customer-level revenue generating activity is performed by the franchisee and collectability is reasonably assured. Franchise revenue also includes initial fees resulting from the sale of a franchise or a license. These initial franchise or license fees are pre-established fixed amounts and are recognized as revenue when collectability is reasonably assured and all material services or conditions relating to the sale have been substantially performed. Total profits from the franchised operations were $75 million, $71 million, and $68 million for the years ended December 31, 2015, 2014 and 2013, respectively. The portion of total franchise fee income related to initial fees received from the sale of franchises was immaterial to the Company’s consolidated financial statements for all periods.
Revenues are presented net of sales taxes collected and remitted to government taxing authorities on the consolidated statements of operations and comprehensive income (loss).
The Company had $552 million and $514 million of deferred revenue as of December 31, 2015 and 2014, respectively. Deferred revenue consists primarily of payments received for annual contracts relating to home warranties, termite baiting, termite inspection and pest control services.
Deferred Customer Acquisition Costs
Customer acquisition costs, which are incremental and direct costs of obtaining a customer, are deferred and amortized over the life of the related contract in proportion to revenue recognized. These costs include sales commissions and direct selling costs which can be shown to have resulted in a successful sale. Deferred customer acquisition costs amounted to $32 million and $35 million as of December 31, 2015 and 2014, respectively.
63
Advertising
On an interim basis, certain advertising costs are deferred and recognized approximately in proportion to the revenue over the year and are not deferred beyond the calendar year-end. Certain other advertising costs are expensed when the advertising occurs. The cost of direct-response advertising at Terminix, consisting primarily of direct-mail and digital promotions, is capitalized and amortized over its expected period of future benefits. Deferred advertising costs are included in Prepaid expenses and other assets on the consolidated statements of financial position. Advertising expense for the years ended December 31, 2015, 2014 and 2013 was $113 million, $122 million and $114 million, respectively.
Inventory
Inventories are recorded at the lower of cost (primarily on a weighted-average cost basis) or market. The Company’s inventory primarily consists of finished goods to be used on the customers’ premises or sold to franchisees.
Property and Equipment, Intangible Assets and Goodwill
Property and equipment consist of the following:
|
Estimated |
||||||||
|
As of December 31, |
Useful Lives |
|||||||
|
(In millions) |
2015 |
2014 |
(Years) |
|||||
|
Land |
$ |
6 |
$ |
6 |
N/A |
|||
|
Buildings and improvements |
38 | 35 |
10 - 40 |
|||||
|
Technology and communications |
200 | 185 |
3 - 7 |
|||||
|
Machinery, production equipment and vehicles |
146 | 124 |
3 - 9 |
|||||
|
Office equipment, furniture and fixtures |
17 | 19 |
5 - 7 |
|||||
| 408 | 369 | |||||||
|
Less accumulated depreciation |
(248) | (233) | ||||||
|
Net property and equipment |
$ |
160 |
$ |
136 | ||||
Depreciation of property and equipment, including depreciation of assets held under capital leases, was $47 million, $48 million and $48 million for the years ended December 31, 2015, 2014 and 2013, respectively.
The Company recorded an impairment charge of $47 million ($28 million, net of tax) in the year ended December 31, 2014 related to its decision in the first quarter of 2014 to abandon its efforts to deploy a new operating system at American Home Shield. This impairment represented an adjustment of the carrying value of the asset to its estimated fair value of zero on a non-recurring basis.
As of December 31, 2015 and 2014, goodwill was $2,129 million and $2,069 million, respectively, and intangible assets consisted primarily of indefinite-lived trade names in the amount of $1,608 million and other intangible assets in the amount of $96 million and $88 million, respectively.
Fixed assets and intangible assets with finite lives are depreciated and amortized on a straight-line basis over their estimated useful lives. These lives are based on the Company’s previous experience for similar assets, potential market obsolescence and other industry and business data. As required by accounting standards for the impairment or disposal of long-lived assets, the Company’s fixed assets and finite-lived intangible assets are tested for recoverability whenever events or changes in circumstances indicate their carrying amounts may not be recoverable. If the carrying value is no longer recoverable based upon the undiscounted future cash flows of the asset, an impairment loss would be recognized equal to the difference between the carrying amount and the fair value of the asset. Changes in the estimated useful lives or in the asset values could cause the Company to adjust its book value or future expense accordingly.
As required under accounting standards for goodwill and other intangibles, goodwill is not subject to amortization, and intangible assets with indefinite useful lives are not amortized until their useful lives are determined to no longer be indefinite. Goodwill and intangible assets that are not subject to amortization are subject to assessment for impairment by applying a fair-value based test on an annual basis or more frequently if circumstances indicate a potential impairment. The Company adopted the provisions of ASU 2011-08, “Testing Goodwill for Impairment,” in the fourth quarter of 2011. This ASU gives entities the option of performing a qualitative assessment before calculating the fair value of a reporting unit in Step 1 of the goodwill impairment test. If entities determine, on the basis of qualitative factors, that the fair value of a reporting unit is more likely than not greater than its carrying amount, the two-step impairment test would not be required. For the 2015, 2014 and 2013 annual goodwill impairment analysis performed as of October 1 of each year, the Company did not perform qualitative assessments on any reporting unit, but instead completed Step 1 of the goodwill impairment test for all reporting units.
Goodwill and indefinite-lived intangible assets, primarily the Company’s trade names, are assessed annually for impairment during the fourth quarter or earlier upon the occurrence of certain events or substantive changes in circumstances. The Company’s 2015, 2014, and 2013 annual impairment analyses, which were performed as of October 1 of each year, did not result in any goodwill or trade name impairments to continuing operations.
64
Restricted Net Assets
There are third-party restrictions on the ability of certain of the Company’s subsidiaries to transfer funds to the Company. These restrictions are related to regulatory requirements at American Home Shield and to a subsidiary borrowing arrangement at SMAC. The payment of ordinary and extraordinary dividends by the Company’s home warranty and similar subsidiaries (through which the Company conducts its American Home Shield business) are subject to significant regulatory restrictions under the laws and regulations of the states in which they operate. Among other things, such laws and regulations require certain such subsidiaries to maintain minimum capital and net worth requirements and may limit the amount of ordinary and extraordinary dividends and other payments that these subsidiaries can pay to the Company. As of December 31, 2015, the total net assets subject to these third-party restrictions was $169 million. None of the Company’s subsidiaries are obligated to make funds available to the Company through the payment of dividends.
Financial Instruments and Credit Risk
The Company has entered into specific financial arrangements in the normal course of business to manage certain market risks, with a policy of matching positions and limiting the terms of contracts to relatively short durations. The effect of derivative financial instrument transactions could have a material impact on the Company’s financial statements. The Company does not hold or issue derivative financial instruments for trading or speculative purposes. The Company has historically hedged a significant portion of its annual fuel consumption. The Company has also historically hedged the interest payments on a portion of its variable rate debt through the use of interest rate swap agreements. All of the Company’s fuel swap contracts and interest rate swap contracts are classified as cash flow hedges, and, as such, the hedging instruments are recorded on the consolidated statements of financial position as either an asset or liability at fair value, with the effective portion of changes in the fair value attributable to the hedged risks recorded in accumulated other comprehensive income (loss).
Financial instruments, which potentially subject the Company to financial and credit risk, consist principally of investments and receivables. Investments consist primarily of publicly traded debt, certificates of deposit and common equity securities. The Company periodically reviews its portfolio of investments to determine whether there has been an other than temporary decline in the value of the investments from factors such as deterioration in the financial condition of the issuer or the market(s) in which the issuer competes. The majority of the Company’s receivables and notes receivable have little concentration of credit risk due to the large number of customers with relatively small balances and their dispersion across geographical areas. The Company maintains an allowance for losses based upon the expected collectability of receivables. See Note 18 to the consolidated financial statements for information relating to the fair value of financial instruments.
Stock-Based Compensation
Stock-based compensation expense for stock options is estimated at the grant date based on an award’s fair value as calculated by the Black-Scholes option-pricing model and is recognized as expense over the requisite service period. The Black-Scholes model requires various highly judgmental assumptions including expected volatility and option life. If any of the assumptions used in the Black-Scholes model change significantly, stock-based compensation expense for future grants may differ materially from that recorded in the current period related to options granted to date. In addition, the Company estimates the expected forfeiture rate and only recognizes expense for those shares expected to vest. The Company estimates the forfeiture rate based on historical experience. To the extent the actual forfeiture rate is different from the estimate, stock-based compensation expense is adjusted accordingly. See Note 17 to the consolidated financial statements for more details.
Income Taxes
The Company and its subsidiaries file consolidated U.S. federal income tax returns. State and local returns are filed both on a separate company basis and on a combined unitary basis with the Company. Current and deferred income taxes are provided for on a separate company basis. The Company accounts for income taxes using an asset and liability approach for the expected future tax consequences of events that have been recognized in the Company’s financial statements or tax returns. Deferred income taxes are provided to reflect the differences between the tax bases of assets and liabilities and their reported amounts in the financial statements. Valuation allowances are established when necessary to reduce deferred income tax assets to the amounts expected to be realized. The Company records a liability for unrecognized tax benefits resulting from uncertain tax positions taken or expected to be taken in its tax return. The Company recognizes potential interest and penalties related to its uncertain tax positions in income tax expense.
Earnings Per Share
Basic earnings (loss) per share is computed by dividing net income (loss) by the weighted-average number of shares of common stock outstanding. Diluted earnings (loss) per share is computed by dividing net income (loss) by the weighted-average number of shares of common stock outstanding during the period, increased to include the number of shares of common stock that would have been outstanding had potential dilutive shares of common stock been issued. The dilutive effect of stock options and restricted stock units (“RSUs”) are reflected in diluted net income (loss) per share by applying the treasury stock method. See Note 19 to the consolidated financial statements for more details.
65
Newly Issued Accounting Standards
In April 2014, the Financial Accounting Standards Board (“FASB”) issued ASU 2014-08, “Reporting Discontinued Operations and Disclosure of Disposals of Components of an Entity” to change the criteria for reporting discontinued operations and enhance the convergence of the FASB’s and the International Standard Board’s reporting requirements for discontinued operations. The changes in ASU 2014-08 amend the definition of discontinued operations by limiting discontinued operations reporting to disposals of components of an entity that represent strategic shifts that have or will have a major effect on an entity’s operations and financial results. ASU 2014-08 requires expanded disclosures for discontinued operations and also requires an entity to disclose the pretax profit or loss of an individually significant component of an entity that does not qualify for discontinued operations reporting. ASU 2014-08 is effective for fiscal years, and interim periods within those years, beginning after December 15, 2014. The adoption of this standard did not have a material impact on the Company’s consolidated financial statements.
In May 2014, the FASB issued ASU 2014-09, “Revenue from Contracts with Customers” to provide a single comprehensive model for entities to use in accounting for revenue arising from contracts with customers. This model supersedes most current revenue recognition guidance, including industry-specific guidance. The core principle of the revenue model is that “an entity recognizes revenue to depict the transfer of promised goods or services to customers in an amount that reflects the consideration to which the entity expects to be entitled in exchange for those goods or services.” Entities have the option of using either a full retrospective or modified approach to adopt the guidance. ASU 2014-09 is effective for fiscal years, and interim periods within those years, beginning after December 15, 2017. Early adoption is permitted for fiscal years, and interim period within those years, beginning after December 15, 2016. The Company is currently evaluating the impact of adopting ASU 2014-09.
In April 2015, the FASB issued ASU 2015-03, “Simplifying the Presentation of Debt Issuance Costs” to change the presentation of debt issuance costs in financial statements as part of the FASB’s simplification initiative. Under previous guidance, an entity reported debt issuance costs in the balance sheet as deferred charges (i.e., as an asset). The ASU specifies that “debt issuance costs related to a note shall be reported in the balance sheet as a direct deduction from the face amount of that note” and that “amortization of debt issuance costs also shall be reported as interest expense.” ASU 2015-03 is effective for fiscal years, and interim periods within those years, beginning after December 15, 2015. As allowed by ASU 2015-03, the Company has elected to early adopt the amendments of this ASU as of December 31, 2015. The adoption of ASU 2015-03 has been accounted for as a change in accounting principle resulting in the retrospective presentation of debt issuance costs as a direct deduction from the face amount of debt. The Company historically and currently reports the amortization of debt issuance costs as interest expense. As a result of the implementation of this ASU, $31 million of debt issuance costs, as of December 31, 2014, were retrospectively reclassified to Long Term Debt, and the Debt Issuance Costs line was removed from the Consolidated Statements of Financial Position. The remaining $3 million of debt issuance costs, as of December 31, 2014, were related to the Revolving Credit Facility maturing in 2019 and have been reclassified to Other Assets.
In November 2015, the FASB issued ASU 2015-17, “Balance Sheet Classification of Deferred Taxes” to change the classification of deferred tax assets (“DTAs”) and deferred tax liabilities (“DTLs”) in financial statements as part of the FASB’s simplification initiative. Under previous guidance, an entity presented DTAs and DTLs as current and noncurrent in the balance sheet. The ASU specifies that “an entity shall classify deferred tax liabilities and assets as noncurrent amounts.” ASU 2015-17 is effective for fiscal years, and interim periods within those years, beginning after December 15, 2016. As allowed by ASU 2015-17, the Company has elected to early adopt the amendments of this ASU. The adoption of ASU 2015-17 has been accounted for as a change in accounting principle with retrospective reclassification of current DTAs and DTLs to noncurrent. As a result of the implementation of this ASU, $76 million of current DTAs, as of December 31, 2014, were retrospectively reclassified to noncurrent and netted Other long term liabilities – Deferred taxes, and the Deferred taxes line within Assets was removed from the Consolidated Statements of Financial Position.
In January 2016, the FASB issued ASU 2016-01, “Recognition and Measurement of Financial Assets and Financial Liabilities” to change how entities measure certain equity investments, to require the disclosure of changes in the fair value of financial liabilities measured under the fair value option that are attributable to a company’s own credit, and to change certain other disclosure requirements. The changes in ASU 2016-01 specifically require that the changes in fair value of all investments in equity securities be recognized in net income. The Company is impacted as unrealized gains or losses on the Company’s available-for-sale securities are currently recognized in other comprehensive income. The amendments in ASU 2016-01 are effective for fiscal years, and interim periods within those years, beginning after December 15, 2017, and will be adopted prospectively.
66
Note 3. Business Segment Reporting
The business of the Company is conducted through three reportable segments: Terminix, American Home Shield and Franchise Services Group.
In accordance with accounting standards for segments, the Company’s reportable segments are strategic business units that offer different services. The Terminix segment provides termite and pest control services to residential and commercial customers and distributes pest control products. The American Home Shield segment provides home warranties for household systems and appliances. The Franchise Services Group segment provides residential and commercial disaster restoration, janitorial and cleaning services through franchises primarily under the ServiceMaster, ServiceMaster Restore and ServiceMaster Clean brand names, home cleaning services through franchises and Company-owned operations primarily under the Merry Maids brand name, on-site wood furniture repair and restoration services primarily under the Furniture Medic brand name and home inspection services primarily under the AmeriSpec brand name. Corporate includes SMAC, the Company’s financing subsidiary exclusively dedicated to providing financing to its franchisees and retail customers of its operating units, and the Company’s headquarters operations (substantially all of which costs are allocated to the Company’s reportable segments), which provide various technology, marketing, finance, legal and other support services to the reportable segments. The composition of the Company’s reportable segments is consistent with that used by the Company’s chief operating decision maker (the “CODM”) to evaluate performance and allocate resources.
Information regarding the accounting policies used by the Company is described in Note 2 to the consolidated financial statements. The Company derives substantially all of its revenue from customers and franchisees in the United States with approximately two percent generated in foreign markets. Operating expenses of the business units consist primarily of direct costs and indirect costs allocated from Corporate. Identifiable assets are those used in carrying out the operations of the business unit and include intangible assets directly related to its operations. In periods prior to the TruGreen Spin-off, expenses which were allocated to TruGreen but are not reflected in discontinued operations were included in Corporate. Such expenses amounted to $38 million in 2013.
The Company uses Reportable Segment Adjusted EBITDA as its measure of segment profitability. Accordingly, the CODM evaluates performance and allocates resources based primarily on Reportable Segment Adjusted EBITDA. Reportable Segment Adjusted EBITDA is defined as net income (loss) before: unallocated corporate expenses; income (loss) from discontinued operations, net of income taxes; provision (benefit) for income taxes; loss on extinguishment of debt; interest expense; depreciation and amortization expense; 401(k) Plan corrective contribution; non-cash impairment of software and other related costs; non-cash impairment of property and equipment; non-cash stock-based compensation expense; restructuring charges; gain on sale of Merry Maids branches; management and consulting fees; consulting agreement termination fees; and other non-operating expenses. The Company’s definition of Reportable Segment Adjusted EBITDA may not be calculated or comparable to similarly titled measures of other companies. The Company believes Reportable Segment Adjusted EBITDA is useful for investors, analysts and other interested parties as it facilitates company-to-company operating performance comparisons by excluding potential differences caused by variations in capital structures, taxation, the age and book depreciation of facilities and equipment, restructuring initiatives, consulting agreements and equity-based, long-term incentive plans.
67
Information for continuing operations for each reportable segment and Corporate is presented below:
|
Year Ended December 31, |
|||||||||
|
(In millions) |
2015 |
2014 |
2013 |
||||||
|
Revenue: |
|||||||||
|
Terminix |
$ |
1,444 |
$ |
1,370 |
$ |
1,309 | |||
|
American Home Shield |
917 | 828 | 740 | ||||||
|
Franchise Services Group |
232 | 253 | 236 | ||||||
|
Reportable Segment Revenue |
$ |
2,592 |
$ |
2,450 |
$ |
2,285 | |||
|
Corporate |
2 | 7 | 8 | ||||||
|
Total Revenue |
$ |
2,594 |
$ |
2,457 |
$ |
2,293 | |||
|
Reportable Segment Adjusted EBITDA:(1) |
|||||||||
|
Terminix |
$ |
347 |
$ |
309 |
$ |
266 | |||
|
American Home Shield |
205 | 179 | 145 | ||||||
|
Franchise Services Group |
77 | 78 | 78 | ||||||
|
Reportable Segment Adjusted EBITDA |
$ |
630 |
$ |
566 |
$ |
489 | |||
|
Identifiable Assets: |
|||||||||
|
Terminix |
$ |
2,764 |
$ |
2,663 |
$ |
2,682 | |||
|
American Home Shield |
1,137 | 1,063 | 1,000 | ||||||
|
Franchise Services Group |
492 | 506 | 510 | ||||||
|
Reportable Segment Identifiable Assets |
$ |
4,394 |
$ |
4,232 |
$ |
4,192 | |||
|
Corporate |
705 | 796 | 949 | ||||||
|
Total Identifiable Assets(2) |
$ |
5,098 |
$ |
5,028 |
$ |
5,141 | |||
|
Depreciation & Amortization Expense: |
|||||||||
|
Terminix |
$ |
59 |
$ |
73 |
$ |
73 | |||
|
American Home Shield |
9 | 9 | 8 | ||||||
|
Franchise Services Group |
8 | 8 | 8 | ||||||
|
Reportable Segment Depreciation & Amortization Expense |
$ |
75 |
$ |
90 |
$ |
89 | |||
|
Corporate |
9 | 10 | 10 | ||||||
|
Total Depreciation & Amortization Expense(3) |
$ |
84 |
$ |
100 |
$ |
99 | |||
|
Capital Expenditures: |
|||||||||
|
Terminix |
$ |
9 |
$ |
7 |
$ |
11 | |||
|
American Home Shield |
7 | 10 | 13 | ||||||
|
Franchise Services Group |
3 | 4 | 3 | ||||||
|
Reportable Segment Capital Expenditures |
$ |
19 |
$ |
21 |
$ |
27 | |||
|
Corporate |
21 | 15 | 12 | ||||||
|
Total Capital Expenditures |
$ |
40 |
$ |
35 |
$ |
39 | |||
________________________________
68
|
(1) |
Presented below is a reconciliation of Reportable Segment Adjusted EBITDA to Net Income (Loss): |
|
Year Ended December 31, |
|||||||||
|
(In millions) |
2015 |
2014 |
2013 |
||||||
|
Reportable Segment Adjusted EBITDA: |
|||||||||
|
Terminix |
$ |
347 |
$ |
309 |
$ |
266 | |||
|
American Home Shield |
205 | 179 | 145 | ||||||
|
Franchise Services Group |
77 | 78 | 78 | ||||||
|
Reportable Segment Adjusted EBITDA |
$ |
630 |
$ |
566 |
$ |
489 | |||
|
Unallocated corporate expenses |
$ |
(9) |
$ |
(9) |
$ |
(39) | |||
|
Depreciation and amortization expense |
(84) | (100) | (99) | ||||||
|
401(k) Plan corrective contribution |
(23) |
— |
— |
||||||
|
Non-cash stock-based compensation expense |
(10) | (8) | (4) | ||||||
|
Restructuring charges |
(5) | (11) | (6) | ||||||
|
Gain on sale of Merry Maids branches |
7 | 1 |
— |
||||||
|
Non-cash impairment of software and other related costs |
— |
(47) |
— |
||||||
|
Management and consulting fees |
— |
(4) | (7) | ||||||
|
Consulting agreement termination fees |
— |
(21) |
— |
||||||
|
Loss from discontinued operations, net of income taxes |
(2) | (100) | (549) | ||||||
|
Provision for income taxes |
(107) | (40) | (43) | ||||||
|
Loss on extinguishment of debt |
(58) | (65) |
— |
||||||
|
Interest expense |
(167) | (219) | (247) | ||||||
|
Other non-operating expenses |
(12) |
— |
(2) | ||||||
|
Net Income (Loss) |
$ |
160 |
$ |
(57) |
$ |
(507) | |||
___________________________________
|
(2) |
Assets of discontinued operations are not included in the business segment table. |
|
(3) |
There are no adjustments necessary to reconcile total depreciation and amortization as presented in the business segment table to consolidated totals. Amortization of debt issue costs is not included in the business segment table. See Note 4 to the consolidated financial statements for information relating to segment goodwill. |
Note 4. Goodwill and Intangible Assets
Goodwill and indefinite-lived intangible assets are not amortized and are subject to assessment for impairment by applying a fair-value based test on an annual basis or more frequently if circumstances indicate a potential impairment. The Company’s annual assessment date is October 1. There were no goodwill or trade name impairment charges recorded in continuing operations during the years ended December 31, 2015, 2014, and 2013. There were no accumulated impairment losses recorded in continuing operations as of December 31, 2015, 2014 and 2013.
The table below summarizes the goodwill balances for continuing operations by reportable segment:
|
American |
Franchise |
|||||||||||
|
(In millions) |
Terminix |
Home Shield |
Services Group |
Total |
||||||||
|
Balance as of December 31, 2013 |
$ |
1,480 | 348 | 190 | 2,018 | |||||||
|
Acquisitions |
18 | 34 | 1 | 53 | ||||||||
|
Other (1) |
(1) |
— |
(1) | (3) | ||||||||
|
Balance as of December 31, 2014 |
1,497 | 381 | 191 | 2,069 | ||||||||
|
Acquisitions |
74 |
— |
— |
74 | ||||||||
|
Disposals |
— |
— |
(9) | (9) | ||||||||
|
Other (1) |
(4) |
— |
(1) | (5) | ||||||||
|
Balance as of December 31, 2015 |
$ |
1,567 |
$ |
381 |
$ |
182 |
$ |
2,129 | ||||
___________________________________
|
(1) |
Reflects the impact of foreign exchange rates. |
69
The table below summarizes the other intangible asset balances for continuing operations:
|
As of December 31, 2015 |
As of December 31, 2014 |
|||||||||||||||||
|
Accumulated |
Accumulated |
|||||||||||||||||
|
(In millions) |
Gross |
Amortization |
Net |
Gross |
Amortization |
Net |
||||||||||||
|
Trade names(1) |
$ |
1,608 |
— |
1,608 |
$ |
1,608 |
$ |
— |
$ |
1,608 | ||||||||
|
Customer relationships |
571 | (517) | 53 | 533 | (489) | 44 | ||||||||||||
|
Franchise agreements |
88 | (63) | 25 | 88 | (59) | 29 | ||||||||||||
|
Other |
53 | (36) | 18 | 47 | (32) | 15 | ||||||||||||
|
Total |
$ |
2,320 |
$ |
(616) |
$ |
1,704 |
$ |
2,277 |
$ |
(581) |
$ |
1,696 | ||||||
___________________________________
|
(1) |
Not subject to amortization. |
Amortization expense of $38 million, $52 million and $51 million was recorded in the years ended December 31, 2015, 2014 and 2013, respectively. For the existing intangible assets, the Company anticipates amortization expense of $30 million, $19 million, $13 million, $8 million and $6 million in 2016, 2017, 2018, 2019 and 2020, respectively.
During the years ended December 31, 2014 and 2013, the Company recorded pre-tax non-cash impairment charges of $139 million ($84 million, net of tax) and $673 million ($521 million, net of tax), respectively, associated with the goodwill and trade name at its former TruGreen business, which is reported in Loss from discontinued operations, net of income taxes in the consolidated statements of operations and comprehensive income (loss).
Note 5. Income Taxes
As of December 31, 2015, 2014 and 2013, the Company has $16 million, $13 million and $8 million, respectively, of tax benefits primarily reflected in state tax returns that have not been recognized for financial reporting purposes (“unrecognized tax benefits”). At December 31, 2015 and 2014, $12 million and $11 million, respectively, of unrecognized tax benefits would impact the effective tax rate if recognized. A reconciliation of the beginning and ending amount of gross unrecognized tax benefits is as follows:
|
Year Ended December 31, |
|||||||||
|
(In millions) |
2015 |
2014 |
2013 |
||||||
|
Gross unrecognized tax benefits at beginning of period |
$ |
13 |
$ |
8 |
$ |
8 | |||
|
Increases in tax positions for prior years |
— |
1 | 1 | ||||||
|
Increases in tax positions for current year |
3 | 7 | 1 | ||||||
|
Lapse in statute of limitations |
(1) | (1) | (2) | ||||||
|
Gross unrecognized tax benefits at end of period |
$ |
16 |
$ |
13 |
$ |
8 | |||
Based on information currently available, it is reasonably possible that over the next 12 month period unrecognized tax benefits may decrease by $7 million as the result of settlements of ongoing audits, statute of limitation expirations or final settlements of uncertain tax positions in multiple jurisdictions. As of December 31, 2014, the Company believed that it was reasonably possible that a decrease of up to $1 million in unrecognized tax benefits would have occurred during the year ended December 31, 2015. During the year ended December 31, 2015, unrecognized tax benefits actually decreased by $1 million as a result of the closing of certain state audits and the expiration of statutes of limitation.
The Company files consolidated and separate income tax returns in the U.S. federal jurisdiction and in many state and foreign jurisdictions. The Company has been audited by the IRS through its year ended December 31, 2013, and is no longer subject to state and local or foreign income tax examinations by tax authorities for years before 2008.
In the ordinary course of business, the Company is subject to review by domestic and foreign taxing authorities. For U.S. federal income tax purposes, the Company participates in the IRS’s Compliance Assurance Process whereby its U.S. federal income tax returns are reviewed by the IRS both prior to and after their filing. The U.S. federal income tax returns filed by the Company through the year ended December 31, 2013 have been audited by the IRS. In the second quarter of 2015, the IRS completed the audits of the Company’s tax returns for the year ended December 31, 2013 with no adjustments or additional payments. The Company’s tax returns for the year ended December 31, 2014 are under audit, which is expected to be completed by the second quarter of 2016. The IRS commenced examinations of the Company’s U.S. federal income tax returns for 2015 in the first quarter of 2015. The examination is anticipated to be completed by the second quarter of 2017. Five state tax authorities are in the process of auditing state income tax returns of various subsidiaries.
The Company’s policy is to recognize potential interest and penalties related to its tax positions within the tax provision. Total interest and penalties included in the consolidated statements of income are immaterial. As of December 31, 2015 and 2014, the Company had accrued for the payment of interest and penalties of less than $1 million.
70
The components of income (loss) from continuing operations before income taxes are as follows:
|
Year Ended December 31, |
|||||||||
|
(In millions) |
2015 |
2014 |
2013 |
||||||
|
U.S. |
$ |
266 |
$ |
79 |
$ |
80 | |||
|
Foreign |
4 | 5 | 6 | ||||||
|
Income from Continuing Operations before Income Taxes |
$ |
270 |
$ |
84 |
$ |
86 | |||
The reconciliation of income tax computed at the U.S. federal statutory tax rate to the Company’s effective income tax rate for continuing operations is as follows:
|
Year Ended December 31, |
|||||||||
|
2015 |
2014 |
2013 |
|||||||
|
Tax at U.S. federal statutory rate |
35.0 |
% |
35.0 |
% |
35.0 |
% |
|||
|
State and local income taxes, net of U.S. federal benefit |
3.2 | 12.3 | 9.6 | ||||||
|
Tax credits |
(0.8) | (3.1) | (2.6) | ||||||
|
Other permanent items |
2.4 | 1.8 | 0.8 | ||||||
|
Stock option forfeitures |
— |
1.6 | 4.2 | ||||||
|
Other, including foreign rate differences and reserves |
— |
0.6 | 3.1 | ||||||
|
Effective rate |
39.8 |
% |
48.2 |
% |
50.1 |
% |
|||
The effective tax rate for discontinued operations for the years ended December 31, 2015, 2014 and 2013 was a tax benefit of 37.7 percent, 38.1 percent and 23.3 percent, respectively. The effective tax rate for the year ending December 31, 2013 was impacted by the impairment of non-deductible goodwill.
Income tax expense from continuing operations is as follows:
|
Year Ended December 31, |
|||||||||
|
(In millions ) |
2015 |
2014 |
2013 |
||||||
|
Current: |
|||||||||
|
U.S. federal |
$ |
33 |
$ |
— |
$ |
1 | |||
|
Foreign |
2 | 3 | 3 | ||||||
|
State and local |
12 | 9 | 5 | ||||||
| 47 | 11 | 9 | |||||||
|
Deferred: |
|||||||||
|
U.S. federal |
59 | 27 | 27 | ||||||
|
Foreign |
— |
— |
— |
||||||
|
State and local |
1 | 2 | 7 | ||||||
| 60 | 29 | 33 | |||||||
|
Provision for income taxes |
$ |
107 |
$ |
40 |
$ |
43 | |||
On December 18, 2015, the President signed into law the Protecting Americans from Tax Hikes Act of 2015, which retroactively extended the number of tax deductions and credits that otherwise would have expired. This legislation did not have a significant impact on our total income tax expense.
Deferred income tax expense results from timing differences in the recognition of income and expense for income tax and financial reporting purposes. Deferred income tax balances reflect the net tax effects of temporary differences between the carrying amounts of assets and liabilities for financial reporting and income tax purposes. The deferred tax asset primarily reflects the impact of future tax deductions related to the Company’s accruals and certain net operating loss carryforwards. The deferred tax liability is primarily attributable to the basis differences related to intangible assets. Valuation allowances are recorded to reduce deferred tax assets when it is more likely than not that a tax benefit will not be realized. The valuation allowance for deferred tax assets as of December 31, 2015 was $7 million.
71
Significant components of the Company’s deferred tax balances are as follows:
|
As of December 31, |
||||||
|
(In millions) |
2015 |
2014 |
||||
|
Long-term deferred tax assets (liabilities): |
||||||
|
Intangible assets(1) |
$ |
(719) |
$ |
(718) | ||
|
Property and equipment |
(21) | (19) | ||||
|
Prepaid expenses and deferred customer acquisition costs |
(17) | (16) | ||||
|
Receivables allowances |
13 | 12 | ||||
|
Self-insured claims and related expenses |
11 | 9 | ||||
|
Accrued liabilities |
30 | 34 | ||||
|
Other long-term obligations |
(14) | (25) | ||||
|
Net operating loss and tax credit carryforwards |
37 | 90 | ||||
|
Less valuation allowance |
(7) | (7) | ||||
|
Net Long-term deferred tax liability |
$ |
(687) |
$ |
(640) | ||
___________________________________
|
(1) |
The deferred tax liability relates primarily to the difference in the tax versus book basis of intangible assets. The Company had $760 million and $764 million of deferred tax liability included in this net deferred tax liability as of December 31, 2015 and 2014, respectively, that will not actually be paid unless certain business units of the Company are sold. |
As of December 31, 2015, the Company had deferred tax assets, net of valuation allowances, of $31 million for federal and state net operating loss and capital loss carryforwards, which expire at various dates up to 2034. The Company also had deferred tax assets, net of valuation allowances, of $1 million for federal and state credit carryforwards which expire at various dates up to 2034. The federal and state net operating loss carryforwards in the filed income tax returns included unrecognized tax benefits taken in prior years. The net operating losses for which a deferred tax asset is recognized for financial statement purposes in accordance with ASC 740 are presented net of these unrecognized tax benefits.
As a result of certain realization requirements of ASC 718, the table of deferred tax assets and liabilities shown above does not include certain deferred tax assets as of December 31, 2014 that arose directly from tax deductions related to equity compensation greater than compensation recognized for financial reporting. Equity was increased by $3 million when such deferred tax assets were realized as of December 31, 2015. The Company uses ASC 740 ordering when determining when excess tax benefits have been realized.
For the year ended December 31, 2011, the Company reorganized certain foreign subsidiaries in conjunction with its international growth initiatives and evaluated its liquidity requirements in the United States and the capital requirements of its foreign subsidiaries. Based on these factors, the Company considers undistributed earnings of its foreign subsidiaries as of December 31, 2015 to be indefinitely reinvested. Accordingly, the Company has not recorded any material deferred taxes for U.S. or foreign withholding taxes on the excess of the amount for financial reporting purposes over the tax basis of investments in foreign subsidiaries that are essentially permanent in duration. Cumulative undistributed earnings of the Company’s foreign subsidiaries amounted to $56 million and $53 million as of December 31, 2015 and 2014, respectively. This amount becomes taxable upon a repatriation of assets from the subsidiary or a sale or liquidation of the subsidiary. Should these earnings become taxable, the Company could be subject to U.S. income taxes (subject to an adjustment for foreign tax credits) and withholding taxes in various jurisdictions. Determination of the amount of any unrecognized deferred income tax liability on this temporary difference is not practicable due to the complexities of the hypothetical calculation. The amount of cash associated with indefinitely reinvested foreign earnings was approximately $17 million and $20 million as of December 31, 2015 and 2014, respectively. The Company does not anticipate the need to repatriate funds to the United States to satisfy domestic liquidity needs arising in the ordinary course of business, including liquidity needs associated with domestic debt service requirements.
Note 6. Acquisitions
Acquisitions have been accounted for using the acquisition method and, accordingly, the results of operations of the acquired businesses have been included in the Company’s consolidated financial statements since their dates of acquisition. The assets and liabilities of these businesses were recorded in the financial statements at their estimated fair values as of the acquisition dates.
2015
During the year ended December 31, 2015, the Company completed several pest control and termite acquisitions. The total net purchase price for these acquisitions was $125 million. The Company recorded goodwill of $74 million and other intangibles, primarily customer relationships, of $46 million related to these acquisitions.
The fair value of assets acquired and liabilities assumed from the acquisition of Alterra was based on a preliminary valuation, and the Company’s estimates and assumptions are subject to change within the measurement period. In particular, the Company is still evaluating the fair value of certain intangible assets. As the Company finalizes the fair value of assets acquired and liabilities assumed, additional purchased price adjustments may be recorded during the measurement period in 2016.
72
Prior Years
On February 28, 2014, the Company acquired HSA. The total net purchase price for this acquisition was $32 million. The Company recorded goodwill of $34 million and other intangibles of $18 million related to this acquisition.
During the year ended December 31, 2014, the Company completed several pest control, termite and franchise acquisitions. The total net purchase price for these acquisitions was $32 million. The Company recorded goodwill of $20 million and other intangibles, primarily customer relationships, of $11 million related to these acquisitions.
During the year ended December 31, 2013, the Company completed several pest control and termite acquisitions, along with several franchise acquisitions and the purchase of a distributor license agreement within the Franchise Services Group. The total net purchase price for these acquisitions was $40 million. The Company recorded goodwill of $24 million and other intangibles, primarily customer relationships, of $13 million related to these acquisitions.
Supplemental cash flow information regarding the Company’s acquisitions is as follows:
|
Year Ended December 31, |
|||||||||
|
(In millions) |
2015 |
2014 |
2013 |
||||||
|
Assets acquired |
$ |
126 |
$ |
99 |
$ |
40 | |||
|
Liabilities assumed |
— |
(34) |
— |
||||||
|
Net assets acquired |
$ |
125 |
$ |
64 |
$ |
40 | |||
|
Net cash paid |
$ |
92 |
$ |
58 |
$ |
32 | |||
|
Seller financed debt |
33 | 6 | 8 | ||||||
|
Purchase price |
$ |
125 |
$ |
64 |
$ |
40 | |||
Note 7. Discontinued Operations
TruGreen Spin-off
On January 14, 2014, the Company completed the TruGreen Spin-off resulting in the spin-off of the assets and certain liabilities of the TruGreen Business through a tax-free, pro rata dividend to the Company’s stockholders. As a result of the completion of the TruGreen Spin-off, New TruGreen operates the TruGreen Business as a private independent company. The following is a summary of the assets and liabilities distributed to New TruGreen as part of the TruGreen spin-off on January 14, 2014:
|
(In millions) |
|||
|
Assets: |
|||
|
Cash and cash equivalents |
$ |
57 | |
|
Receivables, net |
22 | ||
|
Inventories and other current assets |
39 | ||
|
Property and equipment, net |
181 | ||
|
Intangible assets, net |
216 | ||
|
Other long-term assets |
6 | ||
|
Total Assets |
$ |
521 | |
|
Liabilities: |
|||
|
Current liabilities |
$ |
149 | |
|
Long-term debt and other long-term liabilities |
97 | ||
|
Total Liabilities |
$ |
246 | |
|
Net assets distributed to New TruGreen |
$ |
275 |
The historical results of the TruGreen Business, including the results of operations, cash flows and related assets and liabilities, are reported as discontinued operations for all periods presented herein.
In connection with the TruGreen Spin-off, the Company entered into a transition services agreement with New TruGreen pursuant to which the Company provides New TruGreen with specified communications, public relations, finance and accounting, tax, treasury, internal audit, human resources operations and benefits, risk management and insurance, supply management, real estate management, marketing, facilities, information technology and other support services. The charges for the transition services are designed to allow the Company to fully recover the direct costs of providing the services, plus specified margins and any out-of-pocket costs and expenses. The services provided under the transition services agreement terminated at various specified times on or prior to January 14, 2016 (except certain information technology, human resources and accounts payable services, which the Company expects to provide to New TruGreen beyond January 14, 2016). New TruGreen may terminate the transition services agreement (or certain services under the transition services agreement) for convenience upon 90 days written notice, in which case New TruGreen will be required to reimburse the Company for early termination costs.
73
Under this transition services agreement, in the years ended December 31, 2015 and 2014, the Company recorded $25 million and $36 million, respectively, of fees due from New TruGreen, which is included as a reduction, net of costs incurred, in Selling and administrative expenses in the consolidated statement of operations and comprehensive income (loss). As of December 31, 2015, all amounts owed by New TruGreen under this agreement have been paid.
During the year ended December 31, 2014, the Company processed certain of New TruGreen’s accounts payable transactions. Through this process, in the year ended December 31, 2014, $97 million was paid on New TruGreen’s behalf, all of which was repaid by New TruGreen.
In addition, the Company, New TruGreen and TGLP entered into (1) a separation and distribution agreement containing key provisions relating to the separation of the TruGreen Business and the distribution of New TruGreen common stock to the Company’s stockholders (including relating to specified TruGreen legal matters with respect to which the Company has agreed to retain liability, as well as insurance coverage, non-competition, indemnification and other matters), (2) an employee matters agreement allocating liabilities and responsibilities relating to employee benefit plans and programs and other related matters and (3) a tax matters agreement governing the respective rights, responsibilities and obligations of the parties thereto with respect to taxes, including allocating liabilities for income taxes attributable to New TruGreen and its subsidiaries generally to the Company for tax periods (or portions thereof) ending on or before January 14, 2014 and generally to New TruGreen for tax periods (or portions thereof) beginning after that date.
TruGreen Goodwill and Intangible Assets
Goodwill and indefinite lived intangible assets, primarily the Company’s trade names, are assessed annually for impairment during the fourth quarter or earlier upon the occurrence of certain events or substantive changes in circumstances.
Goodwill – Prior Years
The Company performed an interim goodwill impairment analysis at TruGreen as of June 30, 2013 that resulted in a pre-tax non-cash goodwill impairment of $417 million. After this impairment charge, there was no goodwill remaining at TruGreen. The Company’s 2013 annual goodwill impairment analyses, which was performed as of October 1, did not result in any goodwill impairments.
The goodwill impairment charge recorded in 2013 was primarily attributable to a decline in forecasted 2013 and future cash flows at TruGreen over a defined projection period as of June 30, 2013 compared to the projections used in the last annual impairment assessment performed on October 1, 2012. The changes in projected cash flows at TruGreen arose in part from the business challenges at TruGreen. Although the Company projected future improvement in cash flows at TruGreen as a part of its June 30, 2013 impairment analysis, total cash flows and projected growth in those cash flows were lower than those projected at the time TruGreen was last tested for impairment in 2012. The long term growth rates used in the impairment tests at June 30, 2013 and October 1, 2012 were the same and were in line with historical U.S. gross domestic product growth rates. The discount rate used in the June 30, 2013 impairment test was 100 bps lower than the discount rate used in the October 1, 2012 impairment test for TruGreen. The decrease in the discount rate is primarily attributable to changes in market conditions which indicated an improved outlook for the U.S. financial markets and a higher risk tolerance for investors since the 2012 analysis.
Intangible Assets – Prior Years
As a result of the TruGreen Spin-off, the Company was required to perform an interim impairment analysis as of January 14, 2014 on the TruGreen trade name. The assumptions were developed with the view of the TruGreen Business as a stand-alone company, resulting in an increase in the assumed discount rate of 350 bps, as compared to the discount rate used in the October 1, 2013 impairment test for the TruGreen trade name. This interim impairment analysis resulted in a pre-tax non-cash trade name impairment charge of $139 million ($84 million, net of tax) to reduce the carrying value of the TruGreen trade name to its estimated fair value. This impairment charge was recorded in Loss from discontinued operations, net of income taxes, in the year ended December 31, 2014. The impairment of the TruGreen trade name represented an adjustment of the carrying value of the asset to its estimated fair value on a non-recurring basis using significant unobservable inputs on the date of the TruGreen Spin-off.
The Company performed an interim trade name impairment analysis at TruGreen as of June 30, 2013 resulting in a pre-tax non-cash trade name impairment charge of $256 million recorded in the second quarter of 2013. The Company’s 2013 annual trade name impairment analyses, which was performed as of October 1, did not result in any trade name impairments.
Based on the revenue results at TruGreen in the first six months of 2013 and a lower revenue outlook for the remainder of 2013 and future years, the Company concluded that there was an impairment indicator requiring the performance of an interim indefinite lived intangible asset impairment test for the TruGreen trade name as of June 30, 2013. The impairment charge recorded in the second quarter of 2013 was primarily attributable to a decrease in the assumed royalty rate and a decrease in projected future growth in revenue at TruGreen over a defined projection period as of June 30, 2013 compared to the royalty rate and projections used in the last annual impairment assessment performed on October 1, 2012. The decrease in the assumed royalty rate was due to lower current and projected earnings as a percent of revenue as compared to the last annual impairment test. Although the Company projected future growth in revenue at TruGreen as part of its June 30, 2013 impairment analysis, total projected revenue was lower than the revenue projected at the time the trade name was last tested for impairment in October 2012. The changes in projected future revenue growth at TruGreen arose in part from the business challenges at TruGreen. The long term revenue growth rates used in the
74
impairment tests at October 1, 2013, June 30, 2013 and October 1, 2012 were the same and in line with historical U.S. gross domestic product growth rates. The discount rates used in the October 1, 2013 and June 30, 2013 impairment tests were the same, but were 100 bps lower than the discount rate used in the October 1, 2012 impairment test for the TruGreen trade name. The decrease in the discount rate from 2012 is primarily attributable to changes in market conditions which indicated an improved outlook for the U.S. financial markets and a higher risk tolerance for investors since the last analysis.
Financial Information for Discontinued Operations
Loss from discontinued operations, net of income taxes, for all periods presented includes the operating results of the previously sold businesses.
The operating results of discontinued operations are as follows:
|
Year Ended December 31, |
|||||||||
|
(In millions) |
2015 |
2014 |
2013 |
||||||
|
Revenue |
$ |
— |
$ |
6 |
$ |
896 | |||
|
Cost of services rendered and products sold |
— |
12 | 686 | ||||||
|
Selling and administrative expenses |
3 | 14 | 232 | ||||||
|
Amortization |
— |
— |
5 | ||||||
|
Goodwill and trade name impairment(1) |
— |
139 | 673 | ||||||
|
Restructuring charges |
— |
3 | 15 | ||||||
|
Interest expense |
— |
— |
2 | ||||||
|
Interest income |
— |
— |
(1) | ||||||
|
Loss before income taxes(1) |
(3) | (161) | (716) | ||||||
|
Benefit for income taxes(1) |
(1) | (61) | (167) | ||||||
|
Loss from discontinued operations, net of income taxes(1) |
$ |
(2) |
$ |
(100) |
$ |
(549) | |||
___________________________________
|
(1) |
During the years ended December 31, 2014 and 2013, the Company recorded pre-tax non-cash impairment charges of $139 million ($84 million, net of tax) and $673 million ($521 million, net of tax), respectively, associated with the goodwill and trade name at its former TruGreen business, which is reported in Loss from discontinued operations, net of income taxes in the consolidated statements of operations and comprehensive income (loss). |
The table below summarizes the activity during the year ended December 31 2015, for the remaining liabilities of previously sold businesses.
|
Liabilities of |
||||
|
Discontinued |
||||
|
(In millions) |
Operations |
|||
|
Balance as of December 31, 2014 |
$ |
9 | ||
|
Costs incurred |
2 | |||
|
Costs paid or otherwise settled |
(11) | |||
|
Balance as of December 31, 2015 |
$ |
— |
||
Note 8. Restructuring Charges
The Company incurred restructuring charges of $5 million ($3 million, net of tax), $11 million ($7 million, net of tax) and $6 million ($4 million, net of tax) for the years ended December 31, 2015, 2014 and 2013, respectively. Restructuring charges were comprised of the following:
|
Year Ended December 31, |
|||||||||
|
(In millions) |
2015 |
2014 |
2013 |
||||||
|
Terminix branch optimization(1) |
$ |
3 |
$ |
2 |
$ |
2 | |||
|
Franchise Services Group reorganization(2) |
1 | 3 |
— |
||||||
|
Corporate(3) |
1 | 6 | 4 | ||||||
|
Total restructuring charges |
$ |
5 |
$ |
11 |
$ |
6 | |||
___________________________________
|
(1) |
These charges included severance costs of $2 million, $2 million and $1 million for the years ended December 31, 2015, 2014 and 2013, respectively, and lease termination costs of $1 million for the years ended December 31, 2015 and 2013. |
|
(2) |
Represents severance costs. |
|
(3) |
Represents restructuring charges related to an initiative to enhance capabilities and reduce costs in the Company’s headquarters functions that provide company-wide administrative services for its operations. For the years ended December
75 |
31, 2015, 2014 and 2013, these charges included severance and other costs of $1 million, $5 million and $1 million, respectively. For the years ended December 31, 2014 and 2013, these charges also included professional fees of $1 million and $3 million, respectively. |
The pretax charges discussed above are reported in Restructuring charges in the consolidated statements of operations and comprehensive (loss) income.
A reconciliation of the beginning and ending balances of accrued restructuring charges, which are included in Accrued liabilities—Other on the consolidated statements of financial position, is presented as follows:
|
Accrued |
|||
|
Restructuring |
|||
|
(In millions) |
Charges |
||
|
Balance as of December 31, 2013 |
$ |
1 | |
|
Costs incurred |
11 | ||
|
Costs paid or otherwise settled |
(8) | ||
|
Balance as of December 31, 2014 |
4 | ||
|
Costs incurred |
5 | ||
|
Costs paid or otherwise settled |
(7) | ||
|
Balance as of December 31, 2015 |
$ |
1 | |
Note 9. Commitments and Contingencies
The Company leases certain property and equipment under various operating lease arrangements. Most of the property leases provide that the Company pay taxes, insurance and maintenance applicable to the leased premises. As leases for existing locations expire, the Company expects to renew the leases or substitute another location and lease.
Rental expense for the years ended December 31, 2015, 2014 and 2013 was $29 million, $31 million and $29 million, respectively. Based on leases in place as of December 31, 2015, future long-term non-cancelable operating lease payments will be approximately $20 million in 2016, $17 million in 2017, $13 million in 2018, $9 million in 2019, $2 million in 2020 and $5 million in 2021 and thereafter.
In the normal course of business, the Company periodically enters into agreements that incorporate indemnification provisions. While the maximum amount to which the Company may be exposed under such agreements cannot be estimated, the Company does not expect these guarantees and indemnifications to have a material effect on the Company’s business, financial condition, results of operations or cash flows.
The Company carries insurance policies on insurable risks at levels that it believes to be appropriate, including workers’ compensation, auto and general liability risks. The Company purchases insurance policies from third-party insurance carriers, which typically incorporate significant deductibles or self-insured retentions. The Company is responsible for all claims that fall below the retention limits. In determining the Company’s accrual for self-insured claims, the Company uses historical claims experience to establish both the current year accrual and the underlying provision for future losses. This actuarially determined provision and related accrual include known claims, as well as incurred but not reported claims. The Company adjusts its estimate of accrued self-insured claims when required to reflect changes based on factors such as changes in health care costs, accident frequency and claim severity.
A reconciliation of beginning and ending accrued self-insured claims, which are included in Accrued liabilities—Self-insured claims and related expenses and Other long-term obligations, primarily self-insured claims on the consolidated statements of financial position, net of insurance recoverables, which are included in Prepaid expenses and other assets and Other assets on the consolidated statements of financial position, is presented as follows:
|
Accrued |
|||
|
Self-insured |
|||
|
(In millions) |
Claims, Net |
||
|
Balance as of December 31, 2013 |
$ |
101 | |
|
Provision for self-insured claims |
45 | ||
|
Cash payments |
(43) | ||
|
Balance as of December 31, 2014 |
104 | ||
|
Provision for self-insured claims |
41 | ||
|
Cash payments |
(31) | ||
|
Balance as of December 31, 2015 |
$ |
114 | |
Accruals for home warranty claims in the American Home Shield business are made based on the Company’s claims experience and actuarial projections. Termite damage claim accruals in the Terminix business are recorded based on both the historical rates of claims incurred within a contract year and the cost per claim. Current activity could differ causing a change in estimates. The Company has certain liabilities with respect to existing or potential claims, lawsuits and other proceedings. The
76
Company accrues for these liabilities when it is probable that future costs will be incurred and such costs can be reasonably estimated. Any resulting adjustments, which could be material, are recorded in the period the adjustments are identified.
In March 2015, the Company was informed that the DOJ initiated a criminal investigation into allegations that a local Terminix branch used methyl bromide as a fumigant at a resort in St. John, U.S. Virgin Islands, resulting in serious injuries to four members of a family vacationing there. The U.S. Virgin Islands government is also investigating the matter, as is the EPA. The EPA also requested information concerning the possible distribution, sale or use of methyl bromide in Puerto Rico. During the year ended December 31, 2015, the Company recorded in its consolidated statement of operations and comprehensive income (loss) a charge of $3 million in connection with civil claims related to the U.S. Virgin Islands matter, an amount equal to its insurance deductible under the Company’s general liability insurance program, although no assurance can be given regarding its insurance coverage or recoveries in connection with such civil claims.
The Company continues to cooperate fully with all relevant governmental authorities in their investigations and have had discussions with the DOJ concerning potential resolution of the criminal investigation. Although the Company has recorded in its consolidated statement of operations and comprehensive income (loss) a charge of $8 million as a result of those discussions, the amount and extent of any further potential penalties, fines, sanctions, costs and damages that the federal or other governmental authorities may yet impose, investigation or other costs and reputational harm, as well as the impact of any civil, criminal or other claims or judicial, administrative or regulatory proceedings resulting from or related to the U.S. Virgin Islands incident, which could be material, is not currently known or reasonably estimable, and any such penalties, fines, sanctions, costs or damages may not be covered under the Company’s general liability insurance program.
On September 15, 2015, a lawsuit was filed in the Circuit Court of the 15th Judicial Circuit in and for Palm Beach County, Florida, styled Carl Robert McCaughey, et al. v. Terminix International Company Limited Partnership, Sunland Pest Control Services, Inc., et al. (Case No. 32080796). The lawsuit alleges that fumigation of a Florida family’s residence by Sunland, a subcontractor of Terminix, resulted in serious injuries to one of the family’s children, alleges claims for negligence and strict liability, and seeks an unspecified amount of monetary and punitive damages. The court has set a trial date in September 2016. The DOJ and other federal and state agencies are investigating the matter, and the DOJ has filed criminal charges against Sunland and two persons associated with Sunland. The Company continues to cooperate fully with all relevant governmental authorities. The amount and extent of any potential penalties, fines, sanctions, costs and damages that the federal or other governmental authorities may impose, investigation or other costs and reputational harm, as well as the impact of any civil, criminal or other claims or judicial, administrative or regulatory proceedings resulting from or related to this incident, which could be material, is not currently known or reasonably estimable, and any such penalties, fines, sanctions, costs or damages may not be covered under the Company’s general liability insurance program.
For more information on the 401(k) Plan corrective contribution, see Note 11 to the consolidated financial statements.
In addition to the matters discussed above, in the ordinary course of conducting business activities, the Company and its subsidiaries become involved in judicial, administrative and regulatory proceedings involving both private parties and governmental authorities. These proceedings include insured and uninsured matters that are brought on an individual, collective, representative and class action basis, or other proceedings involving regulatory, employment, general and commercial liability, automobile liability, wage and hour, environmental and other matters. The Company has entered into settlement agreements in certain cases, including with respect to putative collective and class actions, which are subject to court or other approvals. If one or more of the Company’s settlements are not finally approved, the Company could have additional or different exposure, which could be material. Subject to the paragraphs above, the Company does not expect any of these proceedings to have a material effect on its reputation, business, financial position, results of operations or cash flows; however, the Company can give no assurance that the results of any such proceedings will not materially affect its reputation, business, financial position, results of operations and cash flows.
Note 10. Related Party Transactions
On July 24, 2007, the Company was taken private pursuant to a merger transaction, and, following the completion of the merger and other subsequent transactions and prior to the Company’s initial public offering, the significant majority of the Company’s outstanding common stock was owned by investment funds managed by, or affiliated with the Equity Sponsors. Upon completion of the secondary public offerings in February, May and November 2015, the CD&R Funds and StepStone Funds no longer hold the Company’s common stock. See Note 1 to the consolidated financial statements for further details on the Company’s ownership structure.
Consulting Agreements
The Company was a party to a consulting agreement with CD&R under which CD&R provided the Company with ongoing consulting and management advisory services. The annual consulting fee payable under the consulting agreement with CD&R was $6 million. The Company was also a party to consulting agreements with StepStone, JPMorgan and Ridgemont. Pursuant to the consulting agreements, the Company was required to pay aggregate annual consulting fees of $1 million to StepStone, JPMorgan and Ridgemont. Under these agreements, the Company recorded consulting fees of $4 million and $7 million for the years ended December 31, 2014 and 2013, respectively, which is included in Selling and administrative expenses in the consolidated statements of operations and comprehensive income (loss).
77
On July 1, 2014, in connection with the completion of the Company’s initial public offering, the Company paid the Equity Sponsors aggregate fees of $21 million in connection with the termination of the consulting agreements, which is recorded in the year ended December 31, 2014 in Consulting agreement termination fees in the consolidated statements of operations and comprehensive income (loss). Due to the termination of the consulting agreements, there were no consulting fees recorded in the year ended December 31, 2015.
Note 11. Employee Benefit Plans
Discretionary contributions to the Company’s 401(k) plan were made in the amount of $14 million, $12 million and $13 million for the years ended December 31, 2015, 2014 and 2013, respectively.
In 2008, the Company amended its 401(k) Plan to implement a QACA under the safe harbor provisions of the Code. QACA plans, in general, require automatic enrollment of employees into the retirement plan absent an affirmative election that such employees do not wish to participate.
Although the Company implemented processes to auto-enroll new hires after adopting the QACA plan in 2008, it discovered that it did not auto-enroll then existing employees who were not participating in the 401(k) Plan. In response, the Company implemented an auto-enrollment process for affected active employees, and it is preparing to submit to the IRS a voluntary correction proposal to remedy the issue for prior years. The Company’s current estimate of the cost of the correction ranges from $23 million to approximately $85 million. The Company recorded a charge in the consolidated statement of operations and comprehensive income (loss) for the year ended December 31, 2015 of $23 million. However, there can be no assurances as to the ultimate cost of the correction.
Note 12. Long-Term Debt
Long-term debt is summarized in the following table:
|
As of December 31, |
||||||
|
(In millions) |
2015 |
2014 |
||||
|
Senior secured term loan facility maturing in 2021(1) |
2,336 | 1,784 | ||||
|
7.00% senior notes maturing in 2020(2) |
— |
481 | ||||
|
8.00% senior notes maturing in 2020(3) |
— |
386 | ||||
|
Revolving credit facility maturing in 2019 |
— |
— |
||||
|
7.10% notes maturing in 2018(4) |
75 | 73 | ||||
|
7.45% notes maturing in 2027(4) |
164 | 161 | ||||
|
7.25% notes maturing in 2038(4) |
65 | 64 | ||||
|
Vehicle capital leases(5) |
47 | 39 | ||||
|
Other |
65 | 37 | ||||
|
Less current portion |
(54) | (39) | ||||
|
Total long-term debt |
$ |
2,698 |
$ |
2,987 | ||
___________________________________
|
(1) |
As of December 31, 2015 and 2014, presented net of $21 million and $19 million, respectively, in unamortized debt issuance costs and $17 million in unamortized original issue discount paid as described below under “––Term Loan Facility.” |
|
(2) |
As of December 31, 2014, presented net of $6 million in unamortized debt issuance costs. |
|
(3) |
As of December 31, 2014, presented net of $5 million in unamortized debt issuance costs and inclusive of $1 million in unamortized premium received on the sale of $100 million aggregate principal amount of such notes. |
|
(4) |
As of December 31, 2015 and 2014, collectively presented net of $53 million and $59 million, respectively, of unamortized fair value adjustments related to purchase accounting, which increases the effective interest rate from the coupon rates shown above. |
|
(5) |
The Company has entered into the Fleet Agreement which, among other things, allows the Company to obtain fleet vehicles through a leasing program. All leases under the Fleet Agreement are capital leases for accounting purposes. The lease rental payments include an interest component calculated using a variable rate based on one-month LIBOR plus other contractual adjustments and a borrowing margin totaling 2.45 percent. |
Term Loan Facility
On July 1, 2014, in connection with the Company’s initial public offering, the Company terminated the Old Term Facilities and entered into a $1,825 million Term Loan Facility, maturing July 1, 2021. Borrowings under the Term Loan Facility, together with $243 million of available cash and $120 million of net proceeds of the initial public offering, were used to repay in full the $2,187
78
million outstanding under the Old Term Facilities. In addition, $42 million of available cash was used to pay debt issuance costs of $24 million and to pay original issue discount of $18 million in connection with the Term Loan Facility.
On April 1, 2015, the Company entered into the First Term Loan Amendment, which provides for the April Incremental Term Loans in an aggregate principal amount of $175 million. On April 1, 2015, the Company used the net proceeds from the April Incremental Term Loans, together with cash on hand, to redeem the remaining outstanding $200 million in aggregate principal amount of the 8% 2020 Notes at a redemption price of 106.0% of the principal amount. In addition, $2 million of available cash was used to pay debt issuance costs in connection with the April Incremental Term Loans.
On August 17, 2015, the Company entered into the Second Term Loan Amendment, which provides for the August Incremental Term Loans in an aggregate principal amount of $400 million. On August 17, 2015, the Company used the net proceeds from the August Incremental Term Loans, together with cash on hand, to redeem the remaining outstanding $488 million in aggregate principal amount of the 7% 2020 Notes at a redemption price of 105.25% of the principal amount. In addition, $5 million of available cash was used to pay debt issuance costs of $3 million and original issue discount of $2 million in connection with the August Incremental Term Loans.
The interest rates applicable to the term loans under the Term Loan Facility are based on a fluctuating rate of interest measured by reference to either, at The Company’s option, (i) an adjusted LIBOR (subject to a floor of 1.00 percent) plus a margin of 3.25 percent per annum or (ii) an alternate base rate (subject to a floor of 2.00 percent) plus a margin of 2.25 percent per annum. Voluntary prepayments of borrowings under the Term Loan Facility are permitted at any time, in minimum principal amounts, without premium or penalty.
The Term Loan Facility and the guarantees thereof are secured by substantially all of the tangible and intangible assets of the Company and certain of its domestic subsidiaries, excluding certain subsidiaries subject to regulatory requirements in various states, including pledges of all the capital stock of all direct domestic subsidiaries (other than foreign subsidiary holding companies, which are deemed to be foreign subsidiaries) owned by the Company or any Guarantor and of up to 65% of the capital stock of each direct foreign subsidiary owned by the Company or any Guarantor. The Term Loan Facility security interests are subject to certain exceptions, including, but not limited to, exceptions for (i) equity interests, (ii) indebtedness or other obligations of subsidiaries, (iii) real estate or (iv) any other assets, if the granting of a security interest therein would require that any notes issued under the Company’s indenture dated as of August 15, 1997 be secured. The Term Loan Facility is secured on a pari passu basis with the security interests created in the same collateral securing the Revolving Credit Facility.
The Company has historically entered into interest rate swap agreements. Under the terms of these agreements, the Company pays a fixed rate of interest on the stated notional amount and receives a floating rate of interest (based on one month LIBOR) on the stated notional amount. Therefore, during the term of the swap agreements, the effective interest rate on the portion of the term loans equal to the stated notional amount is fixed at the stated rate in the interest rate swap agreements plus the incremental borrowing margin.
On July 23, 2014, the Company entered into two four-year interest rate swap agreements effective August 1, 2014. The aggregate notional amount of the agreements was $300 million. Under the terms of the agreements, the Company will pay a weighted-average fixed rate of interest of 1.786 percent on the $300 million notional amount, and the Company will receive a floating rate of interest (based on one-month LIBOR) on the notional amount. Therefore, during the term of the agreements, the effective interest rate on $300 million of the Term Loan Facility is fixed at a rate of 1.786 percent, plus the incremental borrowing margin of 3.25 percent.
On July 23, 2014, the Company entered into three forty-one month interest rate swap agreements effective March 1, 2015. The aggregate notional amount of the agreements was $400 million. Under the terms of the agreements, the Company will pay a weighted-average fixed rate of interest of 1.927 percent on the $400 million notional amount, and the Company will receive a floating rate of interest (based on one-month LIBOR) on the notional amount. Therefore, during the term of the agreements, the effective interest rate on $400 million of the Term Loan Facility is fixed at a rate of 1.927 percent, plus the incremental borrowing margin of 3.25 percent.
The changes in interest rate swap agreements, as well as the cumulative interest rate swaps outstanding, are as follows:
|
Weighted |
||||||
|
Notional |
Average Fixed |
|||||
|
(In millions) |
Amount |
Rate(1) |
||||
|
Interest rate swap agreements in effect as of December 31, 2013 |
$ |
— |
— |
% |
||
|
Entered into effect |
300 | |||||
|
Interest rate swap agreements in effect as of December 31, 2014 |
300 | 1.786 |
% |
|||
|
Entered into effect |
400 | |||||
|
Interest rate swap agreements in effect as of December 31, 2015 |
$ |
700 | 1.867 |
% |
||
___________________________________
|
(1) |
Before the application of the applicable borrowing margin. |
79
In accordance with accounting standards for derivative instruments and hedging activities, and as further described in Note 18 to the consolidated financial statements, these interest rate swap agreements are classified as cash flow hedges, and, as such, the hedging instruments are recorded on the consolidated statements of financial position as either an asset or liability at fair value, with the effective portion of the changes in fair value attributable to the hedged risks recorded in accumulated other comprehensive income (loss).
Revolving Credit Facility
On July 1, 2014, in connection with the Company’s initial public offering, the Company terminated the then-existing revolving credit facility and entered into a $300 million Revolving Credit Facility. The maturity date for the Revolving Credit Facility is July 1, 2019. The Revolving Credit Facility provides for senior secured revolving loans and stand‑by and other letters of credit. The Revolving Credit Facility limits outstanding letters of credit to $225 million. As of December 31, 2015, there were $133 million of letters of credit outstanding and $167 million of available borrowing capacity under the Revolving Credit Facility.
The Revolving Credit Facility and the guarantees thereof are secured by the same collateral securing the Term Loan Facility, on a pari passu basis with the security interests created in the same collateral securing the Term Loan Facility.
The interest rates applicable to the loans under the Revolving Credit Facility are based on a fluctuating rate of interest measured by reference to either, at The Company’s option, (i) an adjusted LIBOR plus a margin of 3.25 percent per annum or (ii) an alternate base rate plus a margin of 2.25 percent per annum.
2020 Notes
On July 16, 2014, the Company used proceeds from the Company’s initial public offering to redeem $210 million in aggregate principal amount of its 8% 2020 Notes and $263 million in aggregate principal amount of its 7% 2020 Notes. In connection with the partial redemption of the 8% 2020 Notes and 7% 2020 Notes, the Company was required to pay a pre-payment premium of $17 million and $18 million, respectively, and accrued interest of $7 million and $8 million, respectively. Additionally, in connection with the partial redemption of the 2020 Notes and the repayment of the Old Term Facilities, the Company recorded a loss on extinguishment of debt of $65 million in the year ended December 31, 2014, which includes the pre-payment premiums on the 8% 2020 Notes and 7% 2020 Notes of $17 million and $18 million, respectively, and the write-off of $30 million of debt issuance costs.
On February 17, 2015, the Company redeemed $190 million in aggregate principal amount of its 8% 2020 Notes at a redemption price of 106.0% of the principal amount using available cash. In connection with the partial redemption, the Company recorded a loss on extinguishment of debt of $13 million in the year ended December 31, 2015, which includes a pre-payment premium of $11 million and the write-off of $2 million of debt issuance costs.
On April 1, 2015, the Company used the net proceeds from the April Incremental Term Loans, together with cash on hand, to redeem the remaining outstanding $200 million in aggregate principal amount of its 8% 2020 Notes at a redemption price of 106.0% of the principal amount. In connection with the redemption, the Company recorded a loss on extinguishment of debt of $14 million in the year ended December 31, 2015, which includes a pre-payment premium of $12 million and the write-off of $2 million of debt issuance costs.
On August 17, 2015, the Company used the net proceeds from the August Incremental Term Loans, together with cash on hand, to redeem the remaining outstanding $488 million in aggregate principal amount of the 7% 2020 Notes at a redemption price of 105.25% of the principal amount. In connection with the redemption, the Company recorded a loss on extinguishment of debt of $31 million in the year ended December 31, 2015, which includes a pre‑payment premium of $25 million and the write‑off of $6 million of debt issuance costs.
Other
The agreements governing the Term Loan Facility and the Revolving Credit Facility contain certain covenants that, among other things, limit or restrict the incurrence of additional indebtedness, liens, sales of assets, certain payments (including dividends) and transactions with affiliates, subject to certain exceptions. The Company was in compliance with the covenants under these agreements at December 31, 2015.
As of December 31, 2015, future scheduled long‑term debt payments are $54 million, $66 million, $121 million, $38 million and $32 million for the years ended December 31, 2016, 2017, 2018, 2019 and 2020, respectively. Certain of the Company’s assets, including vehicles, equipment and a call center facility, are leased under capital leases with $51 million in remaining lease obligations as of December 31, 2015. The long‑term debt payments above include future capital lease payments of approximately $18 million in 2016, $15 million in 2017, $10 million in 2018, $6 million in 2019, and $2 million in 2020.
80
Note 13. Cash and Marketable Securities
Cash, money market funds and certificates of deposits with maturities of three months or less when purchased are included in Cash and cash equivalents on the consolidated statements of financial position. As of December 31, 2015 and 2014, the Company’s investments consisted primarily of domestic publicly traded debt and certificates of deposit (“Debt securities”) and common equity securities (“Equity securities”). The amortized cost, fair value and gross unrealized gains and losses of the Company’s short- and long-term investments in Debt and Equity securities are as follows:
|
Gross |
Gross |
|||||||||||
|
Amortized |
Unrealized |
Unrealized |
Fair |
|||||||||
|
(In millions) |
Cost |
Gains |
Losses |
Value |
||||||||
|
Available-for-sale and trading securities, December 31, 2015: |
||||||||||||
|
Debt securities |
$ |
60 |
$ |
1 |
$ |
— |
$ |
60 | ||||
|
Equity securities |
18 | 3 |
— |
21 | ||||||||
|
Total securities |
$ |
78 |
$ |
4 |
$ |
(1) |
$ |
81 | ||||
|
Available-for-sale and trading securities, December 31, 2014: |
||||||||||||
|
Debt securities |
$ |
65 |
$ |
1 |
$ |
— |
$ |
66 | ||||
|
Equity securities |
33 | 9 | (1) | 41 | ||||||||
|
Total securities |
$ |
98 |
$ |
10 |
$ |
(1) |
$ |
107 | ||||
There were no unrealized losses which had been in a loss position for more than one year as of December 31, 2015 and 2014. The aggregate fair value of the investments with unrealized losses was $23 million and $29 million as of December 31, 2015 and 2014, respectively.
Gains and losses on sales of investments, as determined on a specific identification basis, are included in investment income in the period they are realized. The Company periodically reviews its portfolio of investments to determine whether there has been an other than temporary decline in the value of the investments from factors such as deterioration in the financial condition of the issuer or the market(s) in which the issuer competes. The table below summarizes proceeds, gross realized gains and gross realized losses resulting from sales of available-for-sale securities. There were no impairment charges due to other than temporary declines in the value of certain investments for the years ended December 31, 2015, 2014, and 2013.
|
Year Ended December 31, |
|||||||||
|
(In millions) |
2015 |
2014 |
2013 |
||||||
|
Proceeds from sale of securities |
$ |
22 |
$ |
43 |
$ |
23 | |||
|
Gross realized gains, pre-tax |
7 | 5 | 2 | ||||||
|
Gross realized gains, net of tax |
4 | 3 | 1 | ||||||
|
Gross realized losses, pre-tax |
— |
(1) | (1) | ||||||
|
Gross realized losses, net of tax |
— |
(1) |
— |
||||||
81
Note 14. Comprehensive Income (Loss)
Comprehensive income (loss), which primarily includes net income (loss), unrealized gain (loss) on marketable securities, unrealized gain (loss) on derivative instruments and the effect of foreign currency translation gain (loss) is disclosed in the consolidated statements of operations and comprehensive income (loss) and the consolidated statements of shareholders’ equity.
The following tables summarize the activity in other comprehensive income (loss), net of the related tax effects.
|
Unrealized |
||||||||||||
|
Gains on |
Foreign |
|||||||||||
|
Unrealized |
Available |
Currency |
||||||||||
|
(Losses) Gains on |
-for-Sale |
Translation |
||||||||||
|
(In millions) |
Derivatives |
Securities |
Loss |
Total |
||||||||
|
Balance as of December 31, 2013 |
$ |
1 |
$ |
7 |
$ |
(1) |
$ |
7 | ||||
|
Other comprehensive (loss) income before reclassifications: |
||||||||||||
|
Pre-tax amount |
(12) | 3 | (5) | (15) | ||||||||
|
Tax (benefit) provision |
(5) | 1 |
— |
(4) | ||||||||
|
After-tax amount |
(7) | 1 | (5) | (11) | ||||||||
|
Amounts reclassified from accumulated other comprehensive income (loss)(1) |
1 | (3) |
— |
(1) | ||||||||
|
Net current period other comprehensive loss |
(6) | (1) | (5) | (13) | ||||||||
|
Spin-off of the TruGreen Business |
— |
— |
(2) | (2) | ||||||||
|
Balance as of December 31, 2014 |
$ |
(6) |
$ |
6 |
$ |
(8) |
$ |
(8) | ||||
|
Other comprehensive (loss) income before reclassifications: |
||||||||||||
|
Pre-tax amount |
(13) | 1 | (8) | (21) | ||||||||
|
Tax (benefit) provision |
(5) |
— |
— |
(5) | ||||||||
|
After-tax amount |
(9) | 1 | (8) | (16) | ||||||||
|
Amounts reclassified from accumulated other comprehensive income (loss)(1) |
7 | (4) |
— |
3 | ||||||||
|
Net current period other comprehensive loss |
(2) | (3) | (8) | (13) | ||||||||
|
Balance as of December 31, 2015 |
$ |
(7) |
$ |
2 |
$ |
(15) |
$ |
(21) | ||||
___________________________________
|
(1) |
Amounts are net of tax. See reclassifications out of accumulated other comprehensive income (loss) below for further details. |
Reclassifications out of accumulated other comprehensive income (loss) included the following components for the periods indicated.
|
Amounts Reclassified from Accumulated |
|||||||||||
|
Other Comprehensive Income (Loss) |
|||||||||||
|
As of December 31, |
Consolidated Statements of Operations |
||||||||||
|
(In millions) |
2015 |
2014 |
2013 |
and Comprehensive Income (Loss) Location |
|||||||
|
(Losses) gains on derivatives: |
|||||||||||
|
Fuel swap contracts |
$ |
(5) |
$ |
(1) |
$ |
1 |
Cost of services rendered and products sold |
||||
|
Interest rate swap contracts |
(6) | (1) | (5) |
Interest expense |
|||||||
|
Net losses on derivatives |
(11) | (2) | (4) | ||||||||
|
Impact of income taxes |
4 | 1 | 2 |
Provision for income taxes |
|||||||
|
Total reclassifications related to derivatives |
$ |
(7) |
$ |
(1) |
$ |
(2) | |||||
|
Gains on available-for-sale securities |
$ |
7 |
$ |
4 |
$ |
2 |
Interest and net investment income |
||||
|
Impact of income taxes |
(3) | (2) | (1) |
Provision for income taxes |
|||||||
|
Total reclassifications related to securities |
$ |
4 |
$ |
3 |
$ |
1 | |||||
|
Total reclassifications for the period |
$ |
(3) |
$ |
1 |
$ |
(1) | |||||
82
Note 15. Supplemental Cash Flow Information
Supplemental information relating to the consolidated statements of cash flows is presented in the following table:
|
Year Ended December 31, |
|||||||||
|
(In millions) |
2015 |
2014 |
2013 |
||||||
|
Cash paid for or (received from): |
|||||||||
|
Interest expense |
$ |
178 |
$ |
220 |
$ |
232 | |||
|
Interest and dividend income |
(3) | (3) | (5) | ||||||
|
Income taxes, net of refunds |
44 | 12 | 9 | ||||||
The Company acquired $27 million, $17 million and $26 million of property and equipment through capital leases and other non-cash financing transactions in the years ended December 31, 2015, 2014 and 2013, respectively, which have been excluded from the consolidated statements of cash flows as non-cash investing and financing activities.
In the years ended December 31, 2015 and 2014, the Company converted certain company-owned Merry Maids branches to franchises for a total purchase price of $17 million and $2 million, respectively. In the year ended December 31, 2015, the Company received cash of $13 million and provided financing of $4 million. In the year ended December 31, 2014, the Company provided financing of $2 million. These financed amounts have been excluded from the consolidated statements of cash flows as non-cash investing activities.
Note 16. Capital Stock
The Company is authorized to issue 2,000,000,000 shares of common stock. As of December 31, 2015, there were 143,170,897 shares of common stock issued and 135,511,176 shares of common stock outstanding. The Company has no other classes of equity securities issued or outstanding.
In connection with equity offerings to certain executive officers and key employees as discussed further in Note 17 to the consolidated financial statements, the Company sold 504,560 DSUs at a purchase price of $11.43 per DSU. DSUs represent a right to receive a share of common stock in the future. In 2008, the Company issued 504,560 shares of common stock to a rabbi trust to be held for future distribution related to the DSUs. The shares held by the rabbi trust are presented in treasury stock on the consolidated statements of financial position and the consolidated statements of shareholders’ equity. As of December 31, 2015, there are 11,357 DSUs outstanding, which have not yet been converted to common stock.
Note 17. Stock-Based Compensation
In connection with the Company’s initial public offering, the Company’s board of directors and stockholders have adopted the Omnibus Incentive Plan. Prior to the Company’s initial public offering, the Company’s board of directors and stockholders had adopted the MSIP. Upon adoption of the Omnibus Incentive Plan, the Company froze the MSIP and will make no further grants thereunder. However, awards previously granted under the MSIP are unaffected by the termination of the MSIP. The Omnibus Incentive Plan provides for awards in the form of stock options, stock purchase rights, restricted stock, RSUs, performance shares, performance units, stock appreciation rights, dividend equivalents, DSUs and other stock-based awards. The MSIP provided for the sale of shares and DSUs of the Company’s stock to the Company’s executives, officers and other employees and to the Company’s directors as well as the grant of RSUs, performance-based RSUs and options to purchase the Company’s shares to those individuals. DSUs represent a right to receive a share of common stock in the future. The Company’s Compensation Committee selects the Company’s executive officers, employees and directors eligible to participate in the MSIP and the Omnibus Incentive Plan and determines the specific number of shares to be offered or options to be granted to an individual.
On February 24, 2015, the Company’s board of directors approved and recommended for approval by the Company’s stockholders the Employee Stock Purchase Plan, which became effective for offering periods commencing July 1, 2015. The Employee Stock Purchase Plan is intended to qualify for the favorable tax treatment under the Code. Under the plan, eligible employees of the Company may purchase common stock, subject to Internal Revenue Service limits, during pre-specified offering periods at a discount established by the Company not to exceed ten percent of the then-current fair market value. On April 27, 2015, the Company’s stockholders approved the Employee Stock Purchase Plan with a maximum of one million shares of common stock authorized for sale under the plan. Under the Employee Stock Purchase Plan, the Company sold 34,302 shares in 2015 at a weighted-average grant-date fair value of the purchase rights of $3.97.
A maximum of 16,396,667 shares of the Company’s stock is authorized for issuance under the MSIP, the Omnibus Incentive Plan, and the Employee Stock Purchase Plan, of which, as of December 31, 2015, 8,409,133 shares remain available for future grants. The Company currently intends to satisfy any need for the Company’s shares of common stock associated with the settlement of DSUs, vesting of RSUs, exercise of options or purchase of shares issued under the Omnibus Incentive Plan, MSIP or Employee Stock Purchase Plan through new shares available for issuance or any shares repurchased, forfeited or surrendered from participants in the MSIP and the Omnibus Incentive Plan.
All option grants under the Omnibus Incentive Plan and the MSIP have been, and the Company expects that all future option grants will be, non-qualified options with a per-share exercise price no less than the fair market value of one share of the Company’s stock on the grant date. Any stock options granted will generally have a term of ten years, and vesting will be subject to an employee’s
83
continued employment. The Company’s Compensation Committee may accelerate the vesting of an option at any time. In addition, vesting of options will be accelerated if the Company experiences a change in control (as defined in the Omnibus Incentive Plan and the MSIP) unless options with substantially equivalent terms and economic value are substituted for existing options in place of accelerated vesting. Vesting of options granted under the Omnibus Incentive Plan and the MSIP will also be accelerated in the event of an employee’s death or disability (as defined in the Omnibus Incentive Plan and the MSIP). Upon termination for cause (as defined in the Omnibus Incentive Plan and the MSIP), all options held by an employee are immediately cancelled. Following a termination without cause, vested options will generally remain exercisable through the earlier of the expiration of their term or three months following termination of employment (one year in the case of death, disability or retirement at normal retirement age). Unless sooner terminated by the Company’s board of directors, the Omnibus Incentive Plan will remain in effect until June 26, 2024.
In 2015, 2014 and 2013, the Company completed various equity offerings to certain of the Company’s executives, officers and employees pursuant to the MSIP and Omnibus Incentive Plan. The shares sold and options granted in connection with these equity offerings are subject to and governed by the terms of the MSIP and Omnibus Incentive Plan. In connection with these offerings, the Company sold a total of 245,996 and 574,379 shares of common stock in 2014 and 2013, respectively, at a weighted-average purchase price of $12.00 per share in 2014 and $11.68 per share in 2013. No shares of common stock were sold in 2015. In addition, the Company granted the Company’s executives, officers and employees options to purchase 411,506; 1,222,831; and 2,113,076 shares of the Company’s common stock in 2015, 2014 and 2013, respectively, at a weighted-average exercise price of $32.70 per share for options issued in 2015, $12.91 per share for options issued in 2014 and $11.61 per share for options issued in 2013. These options are subject to and governed by the terms of the MSIP and Omnibus Incentive Plan. The per share purchase price and exercise price was based on the determination by the Company’s Compensation Committee of the fair market value of the Company’s common stock as of the purchase/grant dates.
All options granted to date generally will vest in four equal annual installments, subject to an employee’s continued employment. The four-year vesting period is the requisite service period over which compensation cost will be recognized on a straight-line basis for all grants. All options issued are accounted for as equity-classified awards.
The value of each option award was estimated on the grant date using the Black-Scholes option valuation model that incorporates the assumptions noted in the following table. For options granted in 2015, the expected volatility was based on historical and implied volatilities of the Company’s publicly traded stock. For options granted in 2014 and 2013, the expected volatilities were based on the historical and implied volatilities of the publicly traded stock of a group of companies comparable to the Company. The expected life represents the period of time that options granted are expected to be outstanding and was calculated using the simplified method as outlined by the SEC in Staff Accounting Bulletins No. 107 and 110 as the Company does not have sufficient historical exercise to provide a reasonable basis upon which to estimate expected life due to the limited period of time the Company’s equity shares have been publicly traded. The risk-free interest rates were based on the U.S. Treasury securities with terms similar to the expected lives of the options as of the grant dates.
|
Year Ended December 31, |
|||||||||
|
Assumption |
2015 |
2014 |
2013 |
||||||
|
Expected volatility |
34.1 |
% |
49.6 |
% |
49.2% - 49.6 |
% |
|||
|
Expected dividend yield |
0.0 |
% |
0.0 |
% |
0.0 |
% |
|||
|
Expected life (in years) |
6.3 | 6.3 | 6.3 | ||||||
|
Risk-free interest rate |
1.50% - 1.83 |
% |
1.86 |
% |
1.69% - 2.02 |
% |
|||
The weighted-average grant-date fair value of the options granted during 2015, 2014 and 2013 was $11.91, $6.18 and $5.75 per option, respectively. During the year ended December 31, 2015, the Company applied a forfeiture assumption of 20.37 percent per annum in the recognition of the expense related to these options, with the exception of the options held by the Company’s CEO for which the Company has applied a forfeiture rate of zero. The total intrinsic value of stock options exercised during the years ended December 31, 2015, 2014 and 2013, was $25 million, $10 million and less than $1 million, respectively. The total fair value of stock options vested during the years ended December 31, 2015, 2014 and 2013, was $5 million, $4 million and $3 million, respectively.
84
A summary of option activity under the MSIP and Omnibus Incentive Plan as of December 31, 2015, and changes during the year then ended is presented below:
|
Weighted Avg. |
||||||||||
|
Remaining |
||||||||||
|
Weighted Avg. |
Aggregate |
Contractual |
||||||||
|
Stock |
Exercise |
Intrinsic Value |
Term |
|||||||
|
Options |
Price |
(in millions) |
(in years) |
|||||||
|
Total outstanding, December 31, 2014 |
4,604,099 |
$ |
12.27 |
$ |
67 | |||||
|
Granted to employees |
411,506 |
$ |
32.70 | |||||||
|
Exercised |
(1,182,674) |
$ |
12.33 | |||||||
|
Forfeited |
(160,500) |
$ |
20.92 | |||||||
|
Expired |
(4,376) |
$ |
16.01 | |||||||
|
Total outstanding, December 31, 2015 |
3,668,055 |
$ |
14.16 |
$ |
92 | 7.22 | ||||
|
Total exercisable, December 31, 2015 |
1,644,793 |
$ |
12.01 |
$ |
45 | 6.10 | ||||
The Company granted the Company’s executives, officers and employees 304,680; 99,622; and 907,516 RSUs in 2015, 2014 and 2013, respectively, with weighted-average grant date fair values of $32.55 per unit for 2015, $17.52 per unit for 2014, and $13.02 per unit in 2013, which was equivalent to the then current fair value of the Company’s common stock at the grant date. All RSUs outstanding as of December 31, 2015 will vest in three equal annual installments, subject to an employee’s continued employment. Upon vesting, each RSU will be converted into one share of the Company’s common stock. The total fair value of RSUs vested during the years ended December 31, 2015, 2014 and 2013, was $7 million, $5 million and $2 million, respectively.
A summary of RSU activity under the MSIP and the Omnibus Incentive Plan as of December 31, 2015, and changes during the year then ended is presented below:
|
Weighted Avg. |
|||||
|
Grant Date |
|||||
|
RSUs |
Fair Value |
||||
|
Total outstanding, December 31, 2014 |
433,506 |
$ |
13.12 | ||
|
Granted to employees |
304,680 |
$ |
32.55 | ||
|
Vested |
(206,610) |
$ |
12.92 | ||
|
Forfeited |
(31,610) |
$ |
29.77 | ||
|
Total outstanding, December 31, 2015 |
499,966 |
$ |
23.99 | ||
During the years ended December 31, 2015, 2014 and 2013, the Company recognized stock-based compensation expense of $10 million ($6 million, net of tax), $8 million ($5 million, net of tax) and $4 million ($3 million, net of tax), respectively. As of December 31, 2015, there was $19 million of total unrecognized compensation costs related to non-vested stock options and RSUs granted by the Company under the MSIP and Omnibus Incentive Plan. These remaining costs are expected to be recognized over a weighted-average period of 2.17 years.
There were no stock option modifications in 2015, 2014 and 2013.
TruGreen Spin-Off
In connection with the TruGreen Spin-off, on January 14, 2014, the Company distributed all of New TruGreen’s common stock to the Company’s stockholders. Following the distribution, the Company’s employees held equity incentive awards covering shares of New TruGreen common stock as well as equity incentive awards covering shares of the Company’s common stock, and employees who transferred to New TruGreen held equity incentive awards covering shares of the Company’s common stock as well as equity incentive awards covering shares of New TruGreen common stock.
To align the interests of the Company’s continuing employees and the interests of New TruGreen’s employees with their respective employers, on February 14, 2014, the Company and New TruGreen extended offers to each other’s employees to allow them to tender their equity awards covering shares of their non-employing entity to the respective issuer and subsequently to apply the proceeds of any such tendered equity awards to subscribe for equity awards in their respective employers at the then-current fair market value ($12.00, in the case of the Company’s common stock, and $3.75, in the case of New TruGreen common stock). As a result of this program, on March 18, 2014, the Company accepted tenders of 199,075 shares of the Company’s common stock and DSUs from New TruGreen employees and issued 237,762 shares of the Company’s common stock and DSUs to the Company’s continuing employees. Additionally, 63,663 RSUs were converted under this program.
In connection with the TruGreen Spin-off, the Company adjusted the exercise price of options held by the Company’s employees to reflect the fair market value of its common stock after giving effect to the TruGreen Spin-off by multiplying the exercise price of such options immediately prior to the TruGreen Spin-off by a fraction, the numerator of which was the fair market value of a share of its common stock immediately following the TruGreen Spin-off ($12.00 per share) and the denominator of which was the fair
85
market value of a share of its common stock immediately prior to the TruGreen Spin-off ($15.75 per share), or the “Option Conversion Ratio.”
To allow the Company’s employees to retain the intrinsic value of their stock options prior to the TruGreen Spin-off, the Company also adjusted the number of shares underlying the options of such employees. The number of shares underlying the options was adjusted by dividing the number of shares underlying the options held by each employee by the Option Conversion Ratio. The Company refers to these adjustments collectively as the “Option Conversion.” The change in the number of shares underlying options and the adjustment of the exercise price pursuant to the Option Conversion represent modifications to the Company’s share based compensation awards. As a result of the Option Conversion the Company compared the fair value of the awards following the TruGreen Spin-off with the fair value of the original awards. The comparison did not yield incremental value. Accordingly, the Company did not record any incremental compensation expense as a result of the Option Conversion.
Note 18. Fair Value Measurements
The period-end carrying amounts of receivables, accounts payable and accrued liabilities approximate fair value because of the short maturity of these instruments. The period-end carrying amounts of long-term notes receivable approximate fair value as the effective interest rates for these instruments are comparable to period-end market rates. The period-end carrying amounts of short- and long-term marketable securities also approximate fair value, with unrealized gains and losses reported net of tax as a component of accumulated other comprehensive income (loss) on the consolidated statements of financial position, or, for certain unrealized losses, reported in interest and net investment income in the consolidated statements of operations and comprehensive income (loss) if the decline in value is other than temporary. The carrying amount of total debt was $2,752 million and $3,026 million and the estimated fair value was $2,813 million and $3,102 million as of December 31, 2015 and December 31, 2014, respectively. The fair value of the Company’s debt is estimated based on available market prices for the same or similar instruments which are considered significant other observable inputs (Level 2) within the fair value hierarchy. The fair values presented reflect the amounts that would be received to sell an asset or paid to transfer a liability in an orderly transaction between market participants at the measurement date (exit price). The fair value estimates presented in this report are based on information available to the Company as of December 31, 2015 and 2014.
The Company has estimated the fair value of its financial instruments measured at fair value on a recurring basis using the market and income approaches. For investments in marketable securities, deferred compensation trust assets and derivative contracts, which are carried at their fair values, the Company’s fair value estimates incorporate quoted market prices, other observable inputs (for example, forward interest rates) and unobservable inputs (for example, forward commodity prices) at the balance sheet date.
Interest rate swap contracts are valued using forward interest rate curves obtained from third-party market data providers. The fair value of each contract is the sum of the expected future settlements between the contract counterparties, discounted to present value. The expected future settlements are determined by comparing the contract interest rate to the expected forward interest rate as of each settlement date and applying the difference between the two rates to the notional amount of debt in the interest rate swap contracts.
Fuel swap contracts are valued using forward fuel price curves obtained from third-party market data providers. The fair value of each contract is the sum of the expected future settlements between the contract counterparties, discounted to present value. The expected future settlements are determined by comparing the contract fuel price to the expected forward fuel price as of each settlement date and applying the difference between the contract and expected prices to the notional gallons in the fuel swap contracts. The Company regularly reviews the forward price curves obtained from third-party market data providers and related changes in fair value for reasonableness utilizing information available to the Company from other published sources.
The Company has not changed its valuation techniques for measuring the fair value of any financial assets and liabilities during the year. Transfers between levels, if any, are recognized at the end of the reporting period. There were no significant transfers between levels during each of the years ended December 31, 2015 and 2014.
86
The carrying amount and estimated fair value of the Company’s financial instruments that are recorded at fair value on a recurring basis for the periods presented are as follows:
|
Estimated Fair Value Measurements |
||||||||||||||
|
Quoted |
Significant |
|||||||||||||
|
Prices In |
Other |
Significant |
||||||||||||
|
Active |
Observable |
Unobservable |
||||||||||||
|
Statement of Financial |
Carrying |
Markets |
Inputs |
Inputs |
||||||||||
|
(In millions) |
Position Location |
Value |
(Level 1) |
(Level 2) |
(Level 3) |
|||||||||
|
As of December 31, 2015: |
||||||||||||||
|
Financial Assets: |
||||||||||||||
|
Deferred compensation trust assets |
Long-term marketable securities |
$ |
8 |
$ |
8 |
$ |
— |
$ |
— |
|||||
|
Investments in marketable securities |
Marketable securities and Long-term marketable securities |
73 | 38 | 35 |
— |
|||||||||
|
Total financial assets |
$ |
81 |
$ |
46 |
$ |
35 |
$ |
— |
||||||
|
Financial Liabilities: |
||||||||||||||
|
Fuel swap contracts |
Other accrued liabilities |
$ |
4 |
$ |
— |
$ |
— |
$ |
4 | |||||
|
Interest rate swap contracts |
Other long-term liabilities |
8 |
— |
8 |
— |
|||||||||
|
Total financial liabilities |
$ |
12 |
$ |
— |
$ |
8 |
$ |
4 | ||||||
|
As of December 31, 2014: |
||||||||||||||
|
Financial Assets: |
||||||||||||||
|
Deferred compensation trust assets |
Long-term marketable securities |
$ |
8 |
$ |
8 |
$ |
— |
$ |
— |
|||||
|
Investments in marketable securities |
Marketable securities and Long-term marketable securities |
99 | 53 | 45 |
— |
|||||||||
|
Total financial assets |
$ |
107 |
$ |
62 |
$ |
45 |
$ |
— |
||||||
|
Financial Liabilities: |
||||||||||||||
|
Fuel swap contracts |
Other accrued liabilities |
$ |
6 |
$ |
— |
$ |
— |
$ |
6 | |||||
|
Interest rate swap contracts |
Other long-term liabilities |
4 |
— |
4 |
— |
|||||||||
|
Total financial liabilities |
$ |
10 |
$ |
— |
$ |
4 |
$ |
6 | ||||||
A reconciliation of the beginning and ending fair values of financial instruments valued using significant unobservable inputs (Level 3) on a recurring basis is presented as follows:
|
Fuel Swap |
|||||
|
Contract |
|||||
|
Assets |
|||||
|
(In millions) |
(Liabilities) |
Location of Loss included in Earnings |
|||
|
Balance as of December 31, 2013 |
$ |
1 | |||
|
Total losses (realized and unrealized) |
|||||
|
Included in earnings |
(1) |
Cost of services rendered and products sold |
|||
|
Included in other comprehensive income |
(7) | ||||
|
Settlements |
1 | ||||
|
Balance as of December 31, 2014 |
(6) | ||||
|
Total (losses) gains (realized and unrealized) |
|||||
|
Included in earnings |
(5) |
Cost of services rendered and products sold |
|||
|
Included in other comprehensive income |
2 | ||||
|
Settlements |
5 | ||||
|
Balance as of December 31, 2015 |
$ |
(4) | |||
87
The following tables present information relating to the significant unobservable inputs of the Company’s Level 3 financial instruments:
|
Fair Value |
Valuation |
Weighted |
||||||||||
|
(in millions) |
Technique |
Unobservable Input |
Range |
Average |
||||||||
|
As of December 31, 2015: |
||||||||||||
|
Fuel swap contracts |
$ |
(4) |
Discounted Cash Flows |
Forward Unleaded Price per Gallon(1) |
$1.91 - $2.55 |
$ |
2.22 | |||||
|
As of December 31, 2014: |
||||||||||||
|
Fuel swap contracts |
$ |
(6) |
Discounted Cash Flows |
Forward Unleaded Price per Gallon(1) |
$2.06 - $2.71 |
$ |
2.39 | |||||
___________________________________
|
(1) |
Forward prices per gallon were derived from third-party market data providers. A decrease in the forward price would result in a decrease in the fair value of the fuel swap contracts. |
The Company uses derivative financial instruments to manage risks associated with changes in fuel prices and interest rates. The Company does not hold or issue derivative financial instruments for trading or speculative purposes. In designating its derivative financial instruments as hedging instruments under accounting standards for derivative instruments, the Company formally documents the relationship between the hedging instrument and the hedged item, as well as the risk management objective and strategy for the use of the hedging instrument. This documentation includes linking the derivatives to forecasted transactions. The Company assesses at the time a derivative contract is entered into, and at least quarterly thereafter, whether the derivative item is effective in offsetting the projected changes in cash flows of the associated forecasted transactions. All of the Company’s designated hedging instruments are classified as cash flow hedges.
The Company has historically hedged a significant portion of its annual fuel consumption. The Company has also historically hedged the interest payments on a portion of its variable rate debt through the use of interest rate swap agreements. All of the Company’s fuel swap contracts and interest rate swap contracts are classified as cash flow hedges, and, as such, the hedging instruments are recorded on the consolidated statements of financial position as either an asset or liability at fair value, with the effective portion of changes in the fair value attributable to the hedged risks recorded in accumulated other comprehensive income (loss). Any change in the fair value of the hedging instrument resulting from ineffectiveness, as defined by accounting standards, is recognized in current period earnings. Cash flows related to fuel and interest rate derivatives are classified as operating activities in the consolidated statements of cash flows.
Ineffective portions of derivative instruments designated in accordance with accounting standards as cash flow hedge relationships were insignificant during the 12 months ended December 31, 2015. As of December 31, 2015, the Company had fuel swap contracts to pay fixed prices for fuel with an aggregate notional amount of $21 million, maturing through 2016. Under the terms of its fuel swap contracts, the Company is required to post collateral in the event that the fair value of the contracts exceeds a certain agreed upon liability level and in other circumstances required by the counterparty. As of December 31, 2015, the Company had posted $4 million in letters of credit as collateral under its fuel hedging program, which were issued under the Revolving Credit Facility.
The effective portion of the gain or loss on derivative instruments designated and qualifying as cash flow hedging instruments is recorded in accumulated other comprehensive income (loss). These amounts are reclassified into earnings in the same period or periods during which the hedged forecasted debt interest settlement or the fuel settlement affects earnings. See Note 14 to the consolidated financial statements for the effective portion of the gain or loss on derivative instruments recorded in accumulated other comprehensive income (loss) and for the amounts reclassified out of accumulated other comprehensive income (loss) and into earnings. The amount expected to be reclassified into earnings during the next 12 months includes unrealized gains and losses related to open fuel hedges and interest rate swaps. Specifically, as the underlying forecasted transactions occur during the next 12 months, the hedging gains and losses in accumulated other comprehensive income (loss) expected to be recognized in earnings is a loss of $6 million, net of tax, as of December 31, 2015. The amounts that are ultimately reclassified into earnings will be based on actual fuel prices and interest rates at the time the positions are settled and may differ materially from the amount noted above.
88
Note 19. Earnings Per Share
Basic earnings per share is computed by dividing net income by the weighted-average number of shares of common stock outstanding. Diluted earnings per share is computed by dividing net income by the weighted-average number of shares of common stock outstanding during the period, increased to include the number of shares of common stock that would have been outstanding had potential dilutive shares of common stock been issued. The dilutive effect of stock options and RSUs are reflected in diluted net income per share by applying the treasury stock method.
A reconciliation of the amounts included in the computation of basic earnings per share from continuing operations and diluted earnings per share from continuing operations is as follows:
|
Year Ended December 31, |
|||||||||
|
(In millions, except per share data) |
2015 |
2014 |
2013 |
||||||
|
Income from continuing operations |
$ |
162 |
$ |
43 |
$ |
42 | |||
|
Weighted-average common shares outstanding |
135.0 | 112.8 | 91.6 | ||||||
|
Effect of dilutive securities: |
|||||||||
|
RSUs |
0.2 | 0.1 | 0.1 | ||||||
|
Stock options(1) |
1.4 | 0.8 | 0.5 | ||||||
|
Weighted-average common shares outstanding - assuming dilution |
136.6 | 113.8 | 92.2 | ||||||
|
Basic earnings per share from continuing operations |
$ |
1.20 |
$ |
0.38 |
$ |
0.46 | |||
|
Diluted earnings per share from continuing operations |
$ |
1.19 |
$ |
0.38 |
$ |
0.46 | |||
___________________________________
|
(1) |
Options to purchase 0.3 million, 0.1 million, and 1.4 million shares for the years ended December 31, 2015, 2014 and 2013, respectively, were not included in the diluted earnings per share calculation because either their exercise price or proceeds per share exceeded the average market price of the Company’s common stock for each respective reporting date. |
On June 25, 2014, the Company’s registration statement on Form S-1 was declared effective by the SEC for an initial public offering of its common stock, and, on July 1, 2014, the Company completed the offering of 41,285,000 shares of its common stock. See Note 1 to the consolidated financial statements for further details.
89
REPORT OF INDEPENDENT REGISTERED PUBLIC ACCOUNTING FIRM
To the Board of Directors and Shareholders of
ServiceMaster Global Holdings, Inc.
Memphis, Tennessee
We have audited the internal control over financial reporting of ServiceMaster Global Holdings, Inc. and subsidiaries (the “Company”) as of December 31, 2015, based on criteria established in Internal Control—Integrated Framework (2013) issued by the Committee of Sponsoring Organizations of the Treadway Commission. The Company’s management is responsible for maintaining effective internal control over financial reporting and for its assessment of the effectiveness of internal control over financial reporting, included in the accompanying Management’s Report on Internal Control over Financial Reporting. Our responsibility is to express an opinion on the Company’s internal control over financial reporting based on our audit.
We conducted our audit in accordance with the standards of the Public Company Accounting Oversight Board (United States). Those standards require that we plan and perform the audit to obtain reasonable assurance about whether effective internal control over financial reporting was maintained in all material respects. Our audit included obtaining an understanding of internal control over financial reporting, assessing the risk that a material weakness exists, testing and evaluating the design and operating effectiveness of internal control based on the assessed risk, and performing such other procedures as we considered necessary in the circumstances. We believe that our audit provides a reasonable basis for our opinion.
A company’s internal control over financial reporting is a process designed by, or under the supervision of, the company’s principal executive and principal financial officers, or persons performing similar functions, and effected by the company’s board of directors, management, and other personnel to provide reasonable assurance regarding the reliability of financial reporting and the preparation of financial statements for external purposes in accordance with generally accepted accounting principles. A company’s internal control over financial reporting includes those policies and procedures that (1) pertain to the maintenance of records that, in reasonable detail, accurately and fairly reflect the transactions and dispositions of the assets of the company; (2) provide reasonable assurance that transactions are recorded as necessary to permit preparation of financial statements in accordance with generally accepted accounting principles, and that receipts and expenditures of the company are being made only in accordance with authorizations of management and directors of the company; and (3) provide reasonable assurance regarding prevention or timely detection of unauthorized acquisition, use, or disposition of the company’s assets that could have a material effect on the financial statements.
Because of the inherent limitations of internal control over financial reporting, including the possibility of collusion or improper management override of controls, material misstatements due to error or fraud may not be prevented or detected on a timely basis. Also, projections of any evaluation of the effectiveness of the internal control over financial reporting to future periods are subject to the risk that the controls may become inadequate because of changes in conditions, or that the degree of compliance with the policies or procedures may deteriorate.
In our opinion, the Company maintained, in all material respects, effective internal control over financial reporting as of December 31, 2015, based on the criteria established in Internal Control—Integrated Framework (2013) issued by the Committee of Sponsoring Organizations of the Treadway Commission.
We have also audited, in accordance with the standards of the Public Company Accounting Oversight Board (United States), the consolidated financial statements and financial statement schedules as of and for the year ended December 31, 2015 of the Company and our report dated February 26, 2016 expressed an unqualified opinion on those financial statements and included an explanatory paragraph regarding the Company’s adoption of a new accounting standard.
/s/ Deloitte & Touche LLP
Memphis, Tennessee
February 26, 2016
90
Quarterly Operating Results (Unaudited)
Quarterly operating results for the last two years are shown in the table below. As discussed in the “Advertising” section in the Significant Accounting Policies, on an interim basis, certain advertising costs are deferred and recognized approximately in proportion to revenue over the year and are not deferred beyond the calendar year-end. Full year results are not affected.
|
2015 |
||||||||||||||||
|
First |
Second |
Third |
Fourth |
|||||||||||||
|
(in millions, except per share data) |
Quarter |
Quarter |
Quarter |
Quarter |
Year |
|||||||||||
|
Operating Revenue |
$ |
571 |
$ |
716 |
$ |
706 |
$ |
601 |
$ |
2,594 | ||||||
|
Gross Profit |
268 | 351 | 338 | 261 | 1,219 | |||||||||||
|
Income from Continuing Operations(1) |
28 | 67 | 50 | 17 | 162 | |||||||||||
|
Loss from Discontinued Operations, net of income taxes |
— |
— |
(1) |
— |
(2) | |||||||||||
|
Net Income(1) |
28 | 67 | 49 | 17 | 160 | |||||||||||
|
Basic earnings (loss) per share: |
||||||||||||||||
|
Income from Continuing Operations |
0.21 | 0.50 | 0.37 | 0.13 | 1.20 | |||||||||||
|
Loss from Discontinued Operations, net of income taxes |
— |
— |
(0.01) |
— |
(0.01) | |||||||||||
|
Net Income |
0.21 | 0.49 | 0.37 | 0.12 | 1.19 | |||||||||||
|
Diluted earnings (loss) per share: |
||||||||||||||||
|
Income from Continuing Operations |
0.21 | 0.49 | 0.37 | 0.12 | 1.19 | |||||||||||
|
Loss from Discontinued Operations, net of income taxes |
— |
— |
(0.01) |
— |
(0.01) | |||||||||||
|
Net Income |
0.20 | 0.49 | 0.36 | 0.12 | 1.17 | |||||||||||
|
2014 |
||||||||||||||||
|
First |
Second |
Third |
Fourth |
|||||||||||||
|
(in millions, except per share data) |
Quarter |
Quarter |
Quarter |
Quarter |
Year |
|||||||||||
|
Operating Revenue |
$ |
533 |
$ |
683 |
$ |
664 |
$ |
577 |
$ |
2,457 | ||||||
|
Gross Profit |
245 | 332 | 320 | 262 | 1,159 | |||||||||||
|
(Loss) Income from Continuing Operations(1) |
(18) | 42 | (3) | 22 | 43 | |||||||||||
|
Loss from Discontinued Operations, net of income taxes(2) |
(95) | (2) | (1) | (2) | (100) | |||||||||||
|
Net (Loss) Income(1)(2) |
(113) | 40 | (4) | 20 | (57) | |||||||||||
|
Basic (loss) earnings per share: |
||||||||||||||||
|
(Loss) Income from Continuing Operations |
(0.20) | 0.46 | (0.02) | 0.16 | 0.38 | |||||||||||
|
Loss from Discontinued Operations, net of income taxes |
(1.03) | (0.02) | (0.01) | (0.01) | (0.88) | |||||||||||
|
Net (Loss) Income |
(1.23) | 0.44 | (0.03) | 0.15 | (0.50) | |||||||||||
|
Diluted (loss) earnings per share: |
||||||||||||||||
|
(Loss) Income from Continuing Operations |
(0.20) | 0.46 | (0.02) | 0.16 | 0.38 | |||||||||||
|
Loss from Discontinued Operations, net of income taxes |
(1.03) | (0.02) | (0.01) | (0.01) | (0.88) | |||||||||||
|
Net (Loss) Income |
(1.23) | 0.44 | (0.03) | 0.15 | (0.50) | |||||||||||
91
|
(1) |
The results include restructuring charges primarily related to a branch optimization project at Terminix, a reorganization of leadership at Franchise Services Group and an initiative to enhance capabilities and reduce costs in the Company’s headquarters functions. The table below summarizes the pre-tax and after-tax restructuring charges, by quarter, for 2015 and 2014. |
|
2015 |
|||||||||||||||
|
First |
Second |
Third |
Fourth |
||||||||||||
|
(in millions) |
Quarter |
Quarter |
Quarter |
Quarter |
Year |
||||||||||
|
Pre-tax |
$ |
2 |
$ |
— |
$ |
2 |
$ |
1 |
$ |
5 | |||||
|
After-tax |
$ |
1 |
$ |
— |
$ |
1 |
$ |
1 |
$ |
3 | |||||
|
2014 |
|||||||||||||||
|
First |
Second |
Third |
Fourth |
||||||||||||
|
(in millions) |
Quarter |
Quarter |
Quarter |
Quarter |
Year |
||||||||||
|
Pre-tax |
$ |
5 |
$ |
1 |
$ |
1 |
$ |
4 |
$ |
11 | |||||
|
After-tax |
$ |
3 |
$ |
1 |
$ |
1 |
$ |
2 |
$ |
7 | |||||
The results for the fourth quarter of 2015 include a charge of $23 million ($14 million, net of tax) related to the 401(k) Plan.
The results for the first quarter of 2014 include a $48 million ($29 million, net of tax) non-cash impairment charge relating to the Company’s decision to abandon efforts to deploy a new operating system at American Home Shield. The results for the second quarter of 2014 include a reduction of this impairment charge of $1 million ($1 million, net of tax).
The results for the third quarter of 2014 include a charge of $21 million ($13 million, net of tax) for consulting agreement termination fees paid to the Equity Sponsors in connection with the completion of the Company’s initial public offering.
The results for the first, second, third and fourth quarters of 2015 include gains of $1 million ($1 million, net of tax), $2 million ($1 million, net of tax), $3 million ($2 million, net of tax) and $2 million ($1 million, net of tax), respectively, associated with the branch conversions. The results for the fourth quarter of 2014 include a gain of $1 million ($1 million, net of tax) related to these branch conversions.
The results for the first, second and third quarters of 2015 include a loss on extinguishment of debt of $13 million ($9 million, net of tax), $14 million ($9 million, net of tax) and $31 million ($20 million, net of tax), respectively, related to the redemption of the 2020 Notes. The results for the third quarter of 2014 also include a $65 million ($41 million, net of tax) loss on extinguishment of debt related to the partial redemption of the 2020 Notes and the repayment of the Old Term Facilities.
|
(2) |
The results for the first quarter of 2014 include pre-tax non-cash impairment charges of $139 million ($84 million, net of tax) associated with the trade name at the Company’s former TruGreen business. |
92
ITEM 9. CHANGES IN AND DISAGREEMENTS WITH ACCOUNTANTS ON ACCOUNTING AND FINANCIAL DISCLOSURE
None.
ITEM 9A. CONTROLS AND PROCEDURES
Evaluation of disclosure controls and procedures
The Company’s CEO, Robert J. Gillette, and Senior Vice President and CFO, Alan J. M. Haughie, have evaluated the Company’s disclosure controls and procedures (as defined in Rule 13a-15(e) and Rule 15d-15(e) under the Exchange Act) as of the end of the period covered by this Annual Report on Form 10-K as required by Rule 13a-15(b) and Rule 15d-15(b) under the Exchange Act. Messrs. Gillette and Haughie have concluded that both the design and operation of the Company’s disclosure controls and procedures were effective as of December 31, 2015.
Changes in internal control over financial reporting
No changes in the Company’s internal control over financial reporting, as defined in Rule 13a-15(f) or Rule 15d-15(f) under the Exchange Act, occurred during the fourth quarter of fiscal 2015 that has materially affected, or is reasonably likely to materially affect, the Company’s internal control over financial reporting.
Management’s Report on Internal Control over Financial Reporting
The Company’s management is responsible for establishing and maintaining adequate internal controls over financial reporting. The Company’s internal control over financial reporting is a process designed to provide reasonable assurance regarding the reliability of financial reporting and the preparation and fair presentation of published financial statements.
All internal control systems, no matter how well designed, have inherent limitations. Therefore, even those systems determined to be effective can provide only reasonable assurance with respect to financial statement preparation and presentation.
The Company’s management assessed, under the supervision and with the participation of the Company’s CEO, Robert J. Gillette, and Senior Vice President and CFO, Alan J.M. Haughie, the effectiveness of its internal control over financial reporting as of December 31, 2015. In making this assessment, management used the criteria set forth by the Committee of Sponsoring Organizations of the Treadway Commission in Internal Control—Integrated Framework (2013). Based on this assessment, management concluded that, as of December 31, 2015, the Company’s internal control over financial reporting is effective based on those criteria.
The Company’s independent registered public accounting firm, Deloitte & Touche LLP, has audited the effectiveness of the Company’s internal control over financial reporting as of December 31, 2015 and has expressed an unqualified opinion in their report which is included herein.
Announcement of Director Resignation
On February 23, 2016, David H. Wasserman informed the Company’s board of directors that he intends to resign as a member of the board of directors in advance of the Company’s 2016 Annual Meeting of Stockholders to be held in early May. Mr. Wasserman was appointed to the board as a designee of investment funds managed by, or affiliated with, CD&R, a former stockholder of the Company. Mr. Wasserman’s resignation from the board is another step forward in the Company transitioning from directors appointed by private equity funds to a board of directors comprised of independent directors.
93
ITEM 10. DIRECTORS, EXECUTIVE OFFICERS AND CORPORATE GOVERNANCE
The information required by this Item for the Company will be set forth in Company’s Proxy Statement for the 2016 Annual Meeting of Stockholders, which information is hereby incorporated herein by reference.
ITEM 11. EXECUTIVE COMPENSATION
The information required by this Item for the Company will be set forth in Company’s Proxy Statement for the 2016 Annual Meeting of Stockholders, which information is hereby incorporated herein by reference.
ITEM 12. SECURITY OWNERSHIP OF CERTAIN BENEFICIAL OWNERS AND MANAGEMENT AND RELATED STOCKHOLDER MATTERS
The information required by this Item for the Company will be set forth in Company’s Proxy Statement for the 2016 Annual Meeting of Stockholders, which information is hereby incorporated herein by reference.
ITEM 13. CERTAIN RELATIONSHIPS AND RELATED TRANSACTIONS, AND DIRECTOR INDEPENDENCE
The information required by this Item for the Company will be set forth in Company’s Proxy Statement for the 2016 Annual Meeting of Stockholders, which information is hereby incorporated herein by reference.
ITEM 14. PRINCIPAL ACCOUNTING FEES AND SERVICES
The information required by this Item for the Company will be set forth in Company’s Proxy Statement for the 2016 Annual Meeting of Stockholders, which information is hereby incorporated herein by reference.
ITEM 15. EXHIBITS AND FINANCIAL STATEMENT SCHEDULES
(a). Financial Statements, Schedules and Exhibits.
1. Financial Statements
| 57 | ||
| 58 | ||
| 62 | ||
| 63 | ||
| 64 | ||
| 65 |
2. Financial Statements Schedules
The following information is filed as part of this Annual Report on Form 10-K and should be read in conjunction with the financial statements contained in Item 8 of this Annual Report on Form 10-K:
|
3. Exhibits |
102 |
The exhibits filed with this report are listed on the Exhibit Index. Entries marked by the symbol # next to the exhibit’s number identify management compensatory plans, contracts or arrangements.
94
Pursuant to the requirements of Section 13 and 15(d) of the Securities Exchange Act of 1934, ServiceMaster Global Holdings, Inc. has duly caused this report to be signed on its behalf by the undersigned, thereunto duly authorized.
|
|
SERVICEMASTER GLOBAL HOLDINGS, INC. |
||
|
Date: February 26, 2016 |
By: |
/s/ Robert J. Gillette |
|
|
|
|
Name: |
Robert J. Gillette |
|
|
|
Title: |
Chief Executive Officer |
Pursuant to the requirements of the Securities Exchange Act of 1934, this report has been signed below by the following persons on behalf of the registrants and in the capacities and on the dates indicated.
|
Date: February 26, 2016 |
By: |
/s/ John Krenicki, Jr.. |
|
|
|
|
Name: |
John Krenicki, Jr. |
|
|
|
Title: |
Director, Chairman of the Board |
|
Date: February 26, 2016 |
By: |
/s/ Robert J. Gillette |
|
|
|
|
Name: |
Robert J. Gillette |
|
|
|
Title: |
Chief Executive Officer and Director (Principal Executive Officer) |
|
Date: February 26, 2016 |
By: |
/s/ Alan J. M. Haughie |
|
|
|
|
Name: |
Alan J. M. Haughie |
|
|
|
Title: |
Senior Vice President and Chief Financial Officer (Principal Financial Officer) |
|
Date: February 26, 2016 |
By: |
/s/ John P. Mullen |
|
|
|
|
Name: |
John P. Mullen |
|
|
|
Title: |
Vice President, Controller and Chief Accounting Officer (Principal Accounting Officer) |
|
Date: February 26, 2016 |
By: |
/s/ Richard P. Fox |
|
|
|
|
Name: |
Richard P. Fox |
|
|
|
Title: |
Director |
|
Date: February 26, 2016 |
By: |
/s/ Laurie Ann Goldman |
|
|
|
|
Name: |
Laurie Ann Goldman |
|
|
|
Title: |
Director |
|
Date: February 26, 2016 |
By: |
/s/ Stephan J. Sedita |
|
|
|
|
Name: |
Stephan J. Sedita |
|
|
|
Title: |
Director |
|
Date: February 26, 2016 |
By: |
/s/ Thomas C. Tiller, Jr. |
|
|
Name: |
Thomas C. Tiller, Jr. |
||
|
|
|
Title: |
Director |
|
Date: February 26, 2016 |
By: |
/s/ Mark E. Tomkins |
|
|
|
|
Name: |
Mark E. Tomkins |
|
|
|
Title: |
Director |
|
Date: February 26, 2016 |
By: |
/s/ David H. Wasserman |
|
|
|
|
Name: |
David H. Wasserman |
|
|
|
Title: |
Director |
|
|
|
|
|
95
SERVICEMASTER GLOBAL HOLDINGS, INC. (PARENT COMPANY ONLY)
Condensed Statements of Income
(In millions)
|
Year ended December 31, |
|||||||||
|
2015 |
2014 |
2013 |
|||||||
|
Revenue |
$ |
— |
$ |
— |
$ |
— |
|||
|
Selling and administrative expenses |
— |
1 | 1 | ||||||
|
Loss from Continuing Operations before Income Taxes |
— |
(2) | (1) | ||||||
|
Benefit for income taxes |
(1) | (1) |
— |
||||||
|
Income (Loss) from Continuing Operations |
1 | (1) | (1) | ||||||
|
Equity in earnings of subsidiaries (net of tax) |
160 | (56) | (506) | ||||||
|
Net Income (Loss) |
$ |
160 |
$ |
(57) |
$ |
(507) | |||
|
Total Comprehensive Income (Loss) |
$ |
147 |
$ |
(70) |
$ |
(507) | |||
96
SERVICEMASTER GLOBAL HOLDINGS, INC. (PARENT COMPANY ONLY)
Condensed Balance Sheets
(In millions)
|
As of December 31, |
||||||
|
2015 |
2014 |
|||||
|
Assets: |
||||||
|
Current Assets: |
||||||
|
Cash and cash equivalents |
$ |
14 |
$ |
21 | ||
|
Receivables |
1 |
— |
||||
|
Total Current Assets |
15 | 21 | ||||
|
Other Assets: |
||||||
|
Investments in and advances to subsidiaries |
552 | 362 | ||||
|
Total Assets |
$ |
568 |
$ |
383 | ||
|
Liabilities and Shareholders’ Equity: |
||||||
|
Current Liabilities: |
||||||
|
Accrued liabilities: |
||||||
|
Payroll and related expenses |
$ |
1 |
$ |
2 | ||
|
Other |
22 |
— |
||||
|
Total Current Liabilities |
23 | 2 | ||||
|
Other Long-Term Liabilities: |
||||||
|
Deferred taxes |
— |
22 | ||||
|
Total Other Long-Term Liabilities |
— |
22 | ||||
|
Shareholders’ Equity |
545 | 359 | ||||
|
Total Liabilities and Shareholders’ Equity |
$ |
568 |
$ |
383 | ||
97
SERVICEMASTER GLOBAL HOLDINGS, INC. (PARENT COMPANY ONLY)
Condensed Statements of Cash Flows
(In millions)
|
Year ended December 31, |
|||||||||
|
2015 |
2014 |
2013 |
|||||||
|
Cash and Cash Equivalents at Beginning of Period |
$ |
21 |
$ |
8 |
$ |
6 | |||
|
Net Cash Used for Operating Activities from Continuing Operations |
(3) |
— |
(3) | ||||||
|
Cash Flows from Financing Activities from Continuing Operations: |
|||||||||
|
Borrowings of debt |
— |
2 | 14 | ||||||
|
Payments of debt |
— |
(16) |
— |
||||||
|
Contribution to ServiceMaster Company, LLC |
(20) | (646) |
— |
||||||
|
Repurchase of common stock and RSU vesting |
— |
(6) | (16) | ||||||
|
Issuance of common stock |
16 | 679 | 8 | ||||||
|
Net Cash (Used for) Provided from Financing Activities from Continuing Operations |
(5) | 13 | 5 | ||||||
|
Cash (Decrease) Increase During the Period |
(7) | 13 | 2 | ||||||
|
Cash and Cash Equivalents at End of Period |
$ |
14 |
$ |
21 |
$ |
8 | |||
98
Notes to Condensed Parent Company Only Financial Statements
1. Basis of Presentation
The condensed financial statements of ServiceMaster Global Holdings, Inc. (“Parent Company”) are required as a result of the restricted net assets of the Parent Company’s consolidated subsidiaries exceeding 25% of the Parent Company’s consolidated net assets as of December 31, 2015. All consolidated subsidiaries of the Parent Company are wholly owned. The primary source of income for the Parent Company is equity in its subsidiaries’ earnings.
Pursuant to rules and regulations of the SEC, the unconsolidated condensed financial statements of the Parent Company do not reflect all of the information and notes normally included with financial statements prepared in accordance with GAAP. Therefore, these condensed financial statements should be read in conjunction with the consolidated financial statements and related notes included in this Annual Report on Form 10-K.
The Parent Company has accounted for its subsidiaries under the equity method in the unconsolidated condensed financial statements.
2. Commitments and Contingencies
The Parent Company and its subsidiaries are parties to environmental and other legal matters. For further discussion of commitments, guarantees and contingencies, see Note 9 to the consolidated financial statements of ServiceMaster Global Holdings, Inc. included in this Annual Report on Form 10-K.
3. Long-Term Debt
On April 19, 2013, the Parent Company entered into a revolving promissory note with ServiceMaster Company, LLC with a maximum borrowing capacity of $25 million that was scheduled to mature on April 18, 2018. Amounts outstanding under this agreement bore interest at the rate of five percent per annum. As of December 31, 2013, the Parent Company had borrowed $14 million under this note. The funds borrowed under this note were used to repurchase shares of common stock from associates who have left the Company. On July 1, 2014, the Parent Company used a portion of the proceeds from the initial public offering to repay this inter-company loan. As a result of this repayment, the Parent Company did not have a balance outstanding under this note as of December 31, 2014 and 2015.
99
SCHEDULE II
SERVICEMASTER GLOBAL HOLDINGS, INC.
Valuation and Qualifying Accounts
(In millions)
|
Additions |
||||||||||||
|
Balance at |
Charged to |
Balance at |
||||||||||
|
Beginning of |
Costs and |
End of |
||||||||||
|
Period |
Expenses |
Deductions(1) |
Period |
|||||||||
|
As of and for the year ending December 31, 2015: |
||||||||||||
|
Continuing Operations— |
||||||||||||
|
Allowance for doubtful accounts |
||||||||||||
|
Accounts receivable |
$ |
22 |
$ |
35 |
$ |
36 |
$ |
21 | ||||
|
Notes receivable |
3 |
— |
1 | 2 | ||||||||
|
Income tax valuation allowance |
7 | 1 | 2 | 7 | ||||||||
|
As of and for the year ending December 31, 2014: |
||||||||||||
|
Continuing Operations— |
||||||||||||
|
Allowance for doubtful accounts |
||||||||||||
|
Accounts receivable |
$ |
22 |
$ |
34 |
$ |
34 |
$ |
22 | ||||
|
Notes receivable |
4 |
— |
1 | 3 | ||||||||
|
Income tax valuation allowance |
7 | 1 | 1 | 7 | ||||||||
|
As of and for the year ending December 31, 2013: |
||||||||||||
|
Continuing Operations— |
||||||||||||
|
Allowance for doubtful accounts |
||||||||||||
|
Accounts receivable |
$ |
20 |
$ |
36 |
$ |
34 |
$ |
22 | ||||
|
Notes receivable |
3 | 1 |
— |
4 | ||||||||
|
Income tax valuation allowance |
6 | 2 |
— |
7 | ||||||||
___________________________________
|
(1) |
Deductions in the allowance for doubtful accounts for accounts and notes receivable reflect write-offs of uncollectible accounts. Deductions for the income tax valuation allowance in 2015, 2014 and 2013 are primarily attributable to the reduction of net operating loss carryforwards and other deferred tax assets related to the uncertainty of future taxable income in certain jurisdictions. |
100
|
Exhibit Number |
Description |
||
| 2.1 |
Separation and Distribution Agreement, dated as of January 14, 2014, by and among ServiceMaster Global Holdings, Inc., The ServiceMaster Company, TruGreen Holding Corporation and TruGreen Limited Partnership, is incorporated by reference to Exhibit 2.2 to the Current Report on Form 8-K of The ServiceMaster Company, LLC, filed January 17, 2014. |
||
| 2.2 |
Employee Matters Agreement, dated as of January 14, 2014, by and among ServiceMaster Global Holdings, Inc., The ServiceMaster Company, LLC, TruGreen Limited Partnership and TruGreen Holding Corporation, is incorporated by reference to Exhibit 2.3 to the Current Report on Form 8-K of The ServiceMaster Company, LLC, filed January 17, 2014. |
||
| 2.3 |
Tax Matters Agreement, dated as of January 14, 2014, by and among ServiceMaster Global Holdings, Inc., The ServiceMaster Company, LLC, TruGreen Holding Corporation and TruGreen Limited Partnership, is incorporated by reference to Exhibit 2.4 to the Current Report on Form 8-K of The ServiceMaster Company, LLC, filed January 17, 2014. |
||
| 2.4 |
Transition Services Agreement, dated as of January 14, 2014, by and between The ServiceMaster Company, LLC and TruGreen Limited Partnership, is incorporated by reference to Exhibit 2.5 to the Current Report on Form 8-K of The ServiceMaster Company, LLC, filed January 17, 2014. |
||
| 3.1 |
Second Amended and Restated Certificate of Incorporation of ServiceMaster Global Holdings, Inc., is incorporated by reference to Exhibit 3.1 to the Registration Statement on Form S-8 of ServiceMaster Global Holdings, Inc., filed July 1, 2014. |
||
| 3.2 |
Second Amended and Restated By-Laws of ServiceMaster Global Holdings, Inc., is incorporated by reference to Exhibit 3.2 to the Registration Statement on Form S-8 of ServiceMaster Global Holdings, Inc., filed July 1, 2014. |
||
| 4.1 |
Indenture, dated as of August 15, 1997, between The ServiceMaster Company (as successor to ServiceMaster Limited Partnership and The ServiceMaster Company Limited Partnership) and the Harris Trust and Savings Bank, as trustee, is incorporated by reference to Exhibit 4.1 to the Registration Statement on Form S-3 of The ServiceMaster Company, filed August 6, 1997. |
||
| 4.2 |
First Supplemental Indenture dated as of August 15, 1997 between The ServiceMaster Company (as successor to ServiceMaster Limited Partnership and The ServiceMaster Company Limited Partnership) and the Harris Trust and Savings Bank, as trustee, is incorporated by reference to Exhibit 4.4 to the Annual Report on Form 10-K for the year ended December 31, 1997 of The ServiceMaster Company, filed March 27, 1998. |
||
| 4.3 |
Second Supplemental Indenture dated as of January 1, 1998 between The ServiceMaster Company and the Harris Trust and Savings Bank, as trustee, is incorporated by reference to Exhibit 2 to the Current Report on Form 8-K of The ServiceMaster Company, filed February 26, 1998. |
||
| 4.4 |
Third Supplemental Indenture dated as of March 2, 1998 between The ServiceMaster Company and the Harris Trust and Savings Bank, as trustee, is incorporated by reference to Exhibit 4.3 to the Current Report on Form 8-K of the ServiceMaster Company, filed February 27, 1998. |
||
| 4.5 |
Fourth Supplemental Indenture dated as of August 10, 1999 between The ServiceMaster Company and the Harris Trust and Savings Bank, as trustee, is incorporated by reference to Exhibit 3 to the Current Report on Form 8-K filed of The ServiceMaster Company, filed August 16, 1999. |
||
101
| 4.6 |
Fifth Supplemental Indenture, dated as of January 14, 2014, among The ServiceMaster Company, LLC and The Bank of New York Mellon Trust Company, N.A. (as successor to Harris Trust and Savings Bank), as Trustee is incorporated by reference to Exhibit 4.3 to the Current Report on Form 8-K of The ServiceMaster Company, LLC, filed January 17, 2014. |
||
| 4.7 |
Form of 7.45% Note due August 14, 2027 is incorporated by reference to Exhibit 4.2 to the Registration Statement on Form S-3 of The ServiceMaster Company, filed August 6, 1997. |
||
| 4.8 |
Form of 7.10% Note due March 1, 2018 is incorporated by reference to Exhibit 4.1 to the Current Report on Form 8-K of the ServiceMaster Company, filed February 27, 1998. |
||
| 4.9 |
Form of 7.25% Note due March 1, 2038 is incorporated by reference to Exhibit 4.2 to the Current Report on Form 8-K of the ServiceMaster Company, filed February 27, 1998. |
||
| 4.10 |
Indenture, dated as of February 13, 2012, among The ServiceMaster Company, the Subsidiary Guarantors named therein and Wilmington Trust, National Association, as Trustee, is incorporated by reference to Exhibit 4.1 to the Current Report on Form 8-K of The ServiceMaster Company, filed February 14, 2012. |
||
| 4.11 |
First Supplemental Indenture, dated as of February 13, 2012, among The ServiceMaster Company, the Subsidiary Guarantors named therein and Wilmington Trust, National Association, as Trustee, is incorporated by reference to Exhibit 4.2 to the Current Report on Form 8-K of The ServiceMaster Company, filed February 14, 2012. |
||
| 4.12 |
Second Supplemental Indenture, dated as of February 16, 2012, among The ServiceMaster Company, the Subsidiary Guarantors named therein and Wilmington Trust, National Association, as Trustee, is incorporated by reference to Exhibit 4.1 to the Current Report on Form 8-K of The ServiceMaster Company, filed February 16, 2012. |
||
| 4.13 |
Third Supplemental Indenture, dated as of August 21, 2012, among The ServiceMaster Company, the Subsidiary Guarantors named therein and Wilmington Trust, National Association, as Trustee, is incorporated by reference to Exhibit 4.1 to the Current Report on Form 8-K of The ServiceMaster Company, filed August 21, 2012. |
||
| 4.14 |
Fourth Supplemental Indenture, dated as January 14, 2014, among The ServiceMaster Company, LLC, the Subsidiary Guarantors named therein and Wilmington Trust, National Association, as Trustee is incorporated by reference to Exhibit 4.1 to the Current Report on Form 8-K of The ServiceMaster Company, LLC, filed January 17, 2014. |
||
| 4.15 |
Fifth Supplemental Indenture, dated as January 14, 2014, among The ServiceMaster Company, LLC, the Subsidiary Guarantors named therein and Wilmington Trust, National Association, as Trustee is incorporated by reference to Exhibit 4.2 to the Current Report on Form 8-K of The ServiceMaster Company, LLC, filed January 17, 2014. |
||
| 4.16 |
Form of 8% Senior Note maturing in 2020 is incorporated by reference to Exhibit 4.1 to the Current Report on Form 8-K of The ServiceMaster Company, filed February 14, 2012. |
||
| 4.17 |
Form of 7% Senior Note maturing in 2020 is incorporated by reference to Exhibit 4.1 to the Current Report on Form 8-K of The ServiceMaster Company, filed February 14, 2012. |
||
| 4.18 |
Form of Common Stock Certificate is incorporated by reference to Exhibit 4.18 to the Registration Statement on Form S-1 of ServiceMaster Global Holdings, Inc., filed June 19, 2014. |
||
102
| 10.1 |
Credit Agreement, dated as of July 1, 2014, among The ServiceMaster Company, LLC, the several banks and other financial institutions from time to time party thereto, JPMorgan Chase Bank, as administrative agent and collateral agent for the lenders party thereto, and the other parties thereto, is incorporated by reference to Exhibit 10.1 to the Current Report on Form 8-K of ServiceMaster Global Holdings, Inc. and the ServiceMaster Company, LLC filed July 2, 2014. |
||
| 10.2 |
First Term Loan Amendment, dated as of April 1, 2015, to the Credit Agreement, dated as of July 1, 2014, among The ServiceMaster Company, LLC and the incremental term lenders party thereto, JPMorgan Chase Bank, N.A., as administrative agent and collateral agent for the lenders and the other parties party thereto is incorporated by reference to Exhibit 10.1 to the Quarterly Report on Form 10-Q for the quarter ended March 31, 2015 of ServiceMaster Global Holdings, Inc. and the ServiceMaster Company, LLC, filed on May 4, 2015. |
||
| 10.3 |
Second Amendment, dated as of August 17, 2015, to the Credit Agreement, dated as of July 1, 2014, among The ServiceMaster Company, LLC and the incremental term lenders party thereto, JPMorgan Chase Bank, N.A., as administrative agent and collateral agent for the lenders and the other parties party thereto is incorporated by reference to Exhibit 10.1 to the Current Report on Form 8-K of ServiceMaster Global Holdings, Inc., and The ServiceMaster Company, LLC, filed on August 17, 2015. |
||
| 10.4 |
Guarantee and Collateral Agreement, dated as of July 1, 2014 among The ServiceMaster Company, LLC, the Guarantors named therein, in favor of JPMorgan Chase Bank, as administrative agent and collateral agent for the banks and other financial institutions from time to time parties to the Credit Agreement, is incorporated by reference to Exhibit 10.2 to the Current Report on Form 8-K of ServiceMaster Global Holdings, Inc. and the ServiceMaster Company, LLC filed July 2, 2014. |
||
| 10.5 |
# |
Employment Agreement, dated as of June 14, 2013, by and between Robert J. Gillette and ServiceMaster Global Holdings, Inc. is incorporated by reference to Exhibit 10.1 to the Current Report on Form 8-K of The ServiceMaster Company, filed on June 18, 2013. |
|
| 10.6 |
# |
Amendment No. 1 to Employment Agreement, dated as of August 13, 2013, by and between Robert J. Gillette and ServiceMaster Global Holdings, Inc. is incorporated by reference to Exhibit 10.4 to the Quarterly Report on Form 10-Q for the quarter ended June 30, 2013 of The ServiceMaster Company, filed August 14, 2013. |
|
| 10.7 |
# |
Amendment No. 2 to Employment Agreement, dated as of February 28, 2014, by and between Robert J. Gillette and ServiceMaster Global Holdings, Inc. is incorporated by reference to Exhibit 10.33 to the Annual Report on Form 10-K for the year ended December 31, 2013 of The ServiceMaster Company, LLC, filed March 5, 2014. |
|
| 10.8 |
# |
Severance Agreement, dated as of August 26, 2013, by and between Alan J. M. Haughie and The ServiceMaster Company is incorporated by reference to Exhibit 10.2 to the Current Report on Form 8-K of The ServiceMaster Company, filed on August 29, 2013. |
|
| 10.9 |
# |
Severance Agreement dated as of November 11, 2013, between The ServiceMaster Company and William J. Derwin is incorporated by reference to Exhibit 10.46 to the Annual Report on Form 10-K for the year ended December 31, 2013 of The ServiceMaster Company, LLC, filed March 5, 2014. |
|
| 10.10 |
# |
Employee Stock Option Agreement for Mark J. Barry, dated as of March 18, 2014 is incorporated by reference to Exhibit 10.5 to the Quarterly Report on Form 10-Q for the quarter ended March 31, 2014 of The ServiceMaster Company, LLC, filed May 2, 2014. |
|
| 10.11 |
# |
Approval of airplane usage perquisite for Mark J. Barry is incorporated by reference to Exhibit 10.2 to the Quarterly Report on Form 10-Q for the quarter ended September 30, 2015 of ServiceMaster Global Holdings, Inc., filed November 3, 2015. |
|
103
| 10.12 |
# |
Amended and Restated ServiceMaster Global Holdings, Inc. Stock Incentive Plan, as amended as of October 25, 2012 (the “MSIP”), is incorporated by reference to Exhibit 10 to the Current Report on Form 8-K of The ServiceMaster Company, filed October 26, 2012. |
|
| 10.13 |
# |
Form of Employee Stock Subscription Agreement under the MSIP is incorporated by reference to Exhibit 10.31 to the Annual Report on Form 10-K for the year ended December 31, 2007 of The ServiceMaster Company, filed March 28, 2008. |
|
| 10.14 |
# |
Form of Employee Stock Option Agreement under the MSIP is incorporated by reference to Exhibit 10.32 to the Annual Report on Form 10-K for the year ended December 31, 2007 of The ServiceMaster Company, filed March 28, 2008. |
|
| 10.15 |
# |
Form of Employee Deferred Share Unit Agreement under the MSIP is incorporated by reference to Exhibit 10.33 to the Annual Report on Form 10-K for the year ended December 31, 2007 of The ServiceMaster Company, filed March 28, 2008. |
|
| 10.16 |
# |
Form of Participation Agreement under the MSIP is incorporated by reference to Exhibit 10.34 to the Annual Report on Form 10-K for the year ended December 31, 2007 of The ServiceMaster Company, filed March 28, 2008. |
|
| 10.17 |
# |
Form of Employee Stock Subscription Agreement under the MSIP related to stock option exercises is incorporated by reference to Exhibit 10 to the Quarterly Report on Form 10-Q for the quarter ended March 31, 2010 of The ServiceMaster Company, filed May 13, 2010. |
|
| 10.18 |
# |
Form of Employee Restricted Stock Unit Agreement under the MSIP is incorporated by reference to Exhibit 10.3 to the Quarterly Report on Form 10-Q for the quarter ended September 30, 2010 of The ServiceMaster Company, filed November 15, 2010. |
|
| 10.19 |
Form of Director Restricted Stock Agreement under the MSIP is incorporated by reference to Exhibit 10.76 to the Registration Statement on Form S-1 of ServiceMaster Global Holdings, Inc., filed June 16, 2014. |
||
| 10.20 |
# |
Form of Employee Stock Subscription Agreement for Robert J. Gillette is incorporated by reference to Exhibit 10.2 to the Current Report on Form 8-K of The ServiceMaster Company, filed on June 18, 2013. |
|
| 10.21 |
# |
Form of Employee Restricted Stock Unit Agreement for Robert J. Gillette is incorporated by reference to Exhibit 10.3 to the Current Report on Form 8-K of The ServiceMaster Company, filed on June 18, 2013. |
|
| 10.22 |
# |
Form of Employee Stock Option Agreement for Robert J. Gillette is incorporated by reference to Exhibit 10.4 to the Current Report on Form 8-K of The ServiceMaster Company, filed on June 18, 2013. |
|
| 10.23 |
# |
Director Stock Subscription Agreement for John Krenicki, Jr. dated December 11, 2013 is incorporated by reference to Exhibit 10.59 to the Annual Report on Form 10-K for the year ended December 31, 2013 of The ServiceMaster Company, LLC, filed March 5, 2014. |
|
| 10.24 |
Amended and Restated Registration Rights Agreement, dated as of June 26, 2014, among ServiceMaster Global Holdings, Inc. and the Stockholders party thereto is incorporated by reference to Exhibit 10.4 to the Current Report on Form 8-K of ServiceMaster Global Holdings, Inc. and the ServiceMaster Company, LLC filed July 2, 2014. |
||
| 10.25 |
Second Amended and Restated Stockholders Agreement, dated as of June 26, 2014, among ServiceMaster Global Holdings, Inc. and the Stockholders party thereto is incorporated by reference to Exhibit 10.3 to the Current Report on Form 8-K of ServiceMaster Global Holdings, Inc. and the ServiceMaster Company, LLC filed July 2, 2014. |
||
104
| 10.26 |
Amended and Restated Indemnification Agreement, dated as of November 23, 2009, among The ServiceMaster Company; ServiceMaster Global Holdings, Inc.; Clayton, Dubilier & Rice, Inc.; Clayton, Dubilier & Rice Fund VII, L.P.; Clayton, Dubilier & Rice Fund VII (Co-Investment), L.P.; CDR SVM Co-Investor L.P.; CD&R Parallel Fund VII, L.P.; Clayton, Dubilier & Rice, LLC; and Clayton, Dubilier & Rice Holdings, L.P is incorporated by reference to Exhibit 10.11 to the Annual Report on Form 10-K for the year ended December 31, 2009 of The ServiceMaster Company, filed March 30, 2010. |
||
| 10.27 |
Amended and Restated Indemnification Agreement, dated as of March 19, 2010, among The ServiceMaster Company and ServiceMaster Global Holdings, Inc. and Banc of America Capital Investors V, L.P., BAS Capital Funding Corporation, BACSVM, L.P., Banc of America Strategic Investments Corporation, Banc of America Capital Management V, L.P., BACM I GP, LLC and BA Equity Co-Invest GP LLC is incorporated by reference to Exhibit 10.12 to the Annual Report on Form 10-K for the year ended December 31, 2009 of The ServiceMaster Company, filed March 30, 2010. |
||
| 10.28 |
Amended and Restated Indemnification Agreement, dated as of March 19, 2010, among The ServiceMaster Company and ServiceMaster Global Holdings, Inc. and Citigroup Capital Partners II 2007 Citigroup Investment, L.P., Citigroup Capital Partners II Employee Master Fund, L.P., Citigroup Capital Partners II Onshore, L.P., Citigroup Capital Partners II Cayman Holdings, L.P., CPE Co-Investment (ServiceMaster) LLC and Citigroup Private Equity LP is incorporated by reference to Exhibit 10.13 to the Annual Report on Form 10-K for the year ended December 31, 2009 of The ServiceMaster Company, filed March 30, 2010. |
||
| 10.29 |
Amended and Restated Indemnification Agreement, dated as of March 19, 2010, among The ServiceMaster Company and ServiceMaster Global Holdings, Inc. and JP Morgan Chase Funding, Inc. is incorporated by reference to Exhibit 10.14 to the Annual Report on Form 10-K for the year ended December 31, 2009 of The ServiceMaster Company, filed March 30, 2010. |
||
| 10.30 |
Form of Director Indemnification Agreement is incorporated by reference to Exhibit 10.71 to the Registration Statement on Form S-1 of ServiceMaster Global Holdings, Inc., filed June 19, 2014. |
||
| 10.31 |
* |
Schedule of Signatories to a Director Indemnification Agreement. |
|
| 10.32 |
# |
ServiceMaster Deferred Compensation Plan is incorporated by reference to Exhibit 10.75 to the Registration Statement on Form S-1 of ServiceMaster Global Holdings, Inc., filed June 16, 2014. |
|
| 10.33 |
# |
ServiceMaster Global Holdings, Inc. Directors’ Deferred Compensation Plan is incorporated by reference to Exhibit 10.79 to the Registration Statement on Form S-1 of ServiceMaster Global Holdings, Inc., filed June 16, 2014. |
|
| 10.34 |
# |
ServiceMaster Global Holdings, Inc. Executive Annual Bonus Plan is incorporated by reference to Annex A to the definitive Proxy Statement on Schedule 14A of ServiceMaster Global Holdings, Inc., filed March 20, 2015 (the “2015 Proxy Statement”). |
|
| 10.35 |
# |
Amended and Restated ServiceMaster Global Holdings, Inc. 2014 Omnibus Incentive Plan (the “Omnibus Plan”) is incorporated by reference to Annex B to the 2015 Proxy Statement. |
|
| 10.36 |
# |
ServiceMaster Global Holdings, Inc. Employee Stock Purchase Plan is incorporated by reference to Annex C to the 2015 Proxy Statement. |
|
| 10.37 |
# |
Form of Employee Stock Option Agreement under the Omnibus Plan for awards granted between July 1, 2014 and February 23, 2015 is incorporated by reference to Exhibit 10.77 to the Registration Statement on Form S-1 of ServiceMaster Global Holdings, Inc., filed June 16, 2014. |
|
105
| 10.38 |
# |
Form of Employee Restricted Stock Unit Agreement under the Omnibus Plan for awards granted between July 1, 2014 and February 23, 2015 is incorporated by reference to Exhibit 10.78 to the Registration Statement on Form S-1 of ServiceMaster Global Holdings, Inc., filed June 16, 2014. |
|
| 10.39 |
# |
Form of Director Restricted Stock Agreement under the Omnibus Plan is incorporated by reference to Exhibit 10.90 to the Registration Statement on Form S-1 of ServiceMaster Global Holdings, Inc., filed June 16, 2014. |
|
| 10.40 |
# |
Form of Employee Stock Option Agreement under the Omnibus Plan for awards granted between February 24, 2015 and February 21, 2016 is incorporated by reference to Exhibit 10.70 to the Annual Report on Form 10-K for the year ended December 31, 2014 of ServiceMaster Global Holdings, Inc. and the ServiceMaster Company, LLC, filed March 2, 2015. |
|
| 10.41 |
# |
Form of Employee Restricted Stock Unit Agreement under the Omnibus Plan for awards granted between February 24, 2015 and February 21, 2016 is incorporated by reference to Exhibit 10.71 to the Annual Report on Form 10-K for the year ended December 31, 2014 of ServiceMaster Global Holdings, Inc. and the ServiceMaster Company, LLC, filed March 2, 2015. |
|
| 12 |
* |
Statement regarding Computation of Ratio of Earnings to Fixed Charges as of December 31, 2015. |
|
| 21 |
* |
List of Subsidiaries as of December 31, 2015. |
|
| 23 |
* |
Consent of Deloitte & Touche LLP. |
|
| 31.1 |
* |
Certification of Chief Executive Officer of ServiceMaster Global Holdings, Inc. Pursuant to Rule 13a — 14, as adopted pursuant to Section 302 of the Sarbanes-Oxley Act of 2002. |
|
| 31.2 |
* |
Certification of Chief Financial Officer of ServiceMaster Global Holdings, Inc. Pursuant to Rule 13a — 14, as adopted pursuant to Section 302 of the Sarbanes-Oxley Act of 2002. |
|
| 32.1 |
* |
Certification of Chief Executive Officer of ServiceMaster Global Holdings, Inc. Pursuant to Section 1350 of Chapter 63 of Title 18 of the United States Code, as adopted pursuant to Section 906 of the Sarbanes-Oxley Act of 2002. |
|
| 32.2 |
* |
Certification of Chief Financial Officer of ServiceMaster Global Holdings, Inc. Pursuant to Section 1350 of Chapter 63 of Title 18 of the United States Code, as adopted pursuant to Section 906 of the Sarbanes-Oxley Act of 2002. |
|
|
101.INS |
* |
XBRL Instance Document |
|
|
101.SCH |
* |
XBRL Taxonomy Extension Schema |
|
|
101.CAL |
* |
XBRL Taxonomy Extension Calculation Linkbase |
|
|
101.DEF |
* |
XBRL Taxonomy Extension Definition Linkbase |
|
|
101.LAB |
* |
XBRL Taxonomy Extension Label Linkbase |
|
|
101.PRE |
* |
XBRL Extension Presentation Linkbase |
|
__________________________________
#Denotes management compensatory plans, contracts or arrangements.
*Filed herewith.
106
107