Attached files
| file | filename |
|---|---|
| 8-K - 8-K - McEwen Mining Inc. | a15-2843_18k.htm |
Exhibit 99.1
|
|
1 January 2015 |
|
|
2 This presentation contains certain forward-looking statements and information, including "forward- looking statements" within the meaning of the Private Securities Litigation Reform Act of 1995. The forward-looking statements and information expressed, as at the date of this presentation, McEwen Mining Inc.'s (the "Company") estimates, forecasts, projections, expectations or beliefs as to future events and results. Forward-looking statements and information are necessarily based upon a number of estimates and assumptions that, while considered reasonable by management, are inherently subject to significant business, technical, economic and competitive uncertainties, risks and contingencies, and there can be no assurance that such statements and information will prove to be accurate. Therefore, actual results and future events could differ materially from those anticipated in such statements and information. Risks and uncertainties that could cause results or future events to differ materially from current expectations expressed or implied by the forward-looking statements and information include, but are not limited to, risks related to the cost of transferring or otherwise allocating funds between operating jurisdictions, factors associated with fluctuations in the market price of precious metals, mining industry risks, political, economic, social and security risks associated with foreign operations, risks related to permitting and the projected timeframes to receive the necessary permits, risks associated with mining operations, the construction of mining operations and commencement of production and the projected costs thereof, risks related to litigation, property title, the state of the capital markets, environmental risks and hazards, uncertainty as to calculation of mineral resources and reserves and other risks. Readers should not place undue reliance on forward-looking statements or information included herein, which speak only as of the date hereof. The Company undertakes no obligation to reissue or update forward-looking statements or information as a result of new information or events after the date hereof except as may be required by law. See McEwen Mining's Annual Report on Form 10-K for the fiscal year ended December 31, 2013 and Quarterly Report or Form 10-Q for the Quarter ended September 30, 2014 and other filings with the Securities and Exchange Commission, under the caption "Risk Factors", for additional information on risks, uncertainties and other factors relating to the forward-looking statements and information regarding the Company. All forward-looking statements and information made in this presentation are qualified by this cautionary statement. All currency information quoted in U.S. dollars. Cautionary Statement |
|
|
3 |
|
|
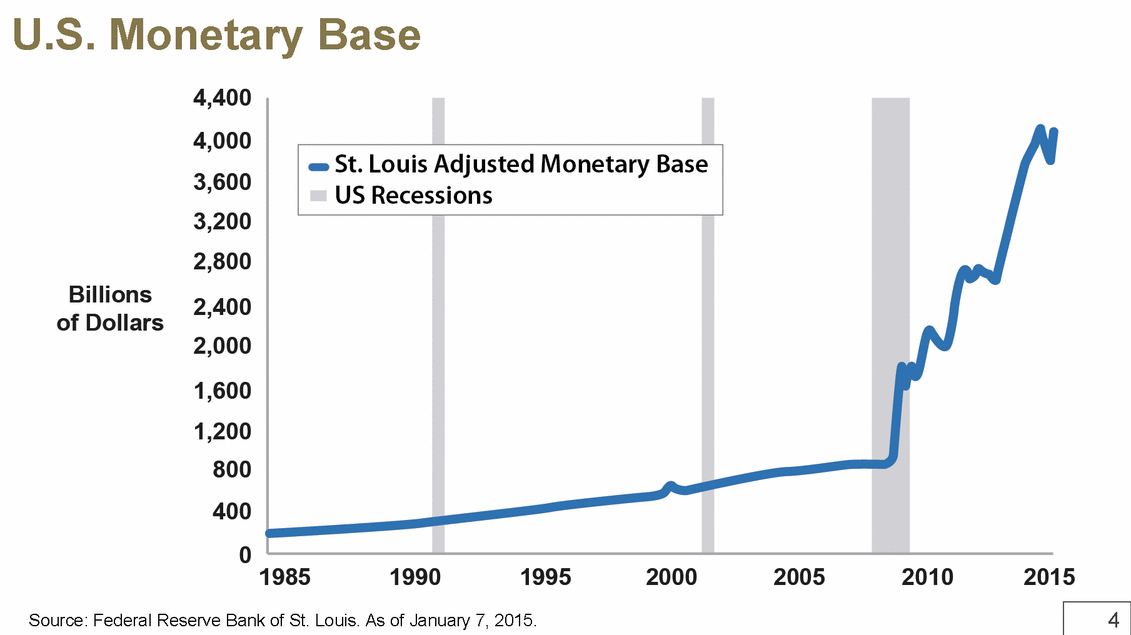
4 U.S. Monetary Base Source: Federal Reserve Bank of St. Louis. As of January 7, 2015. |
|
|
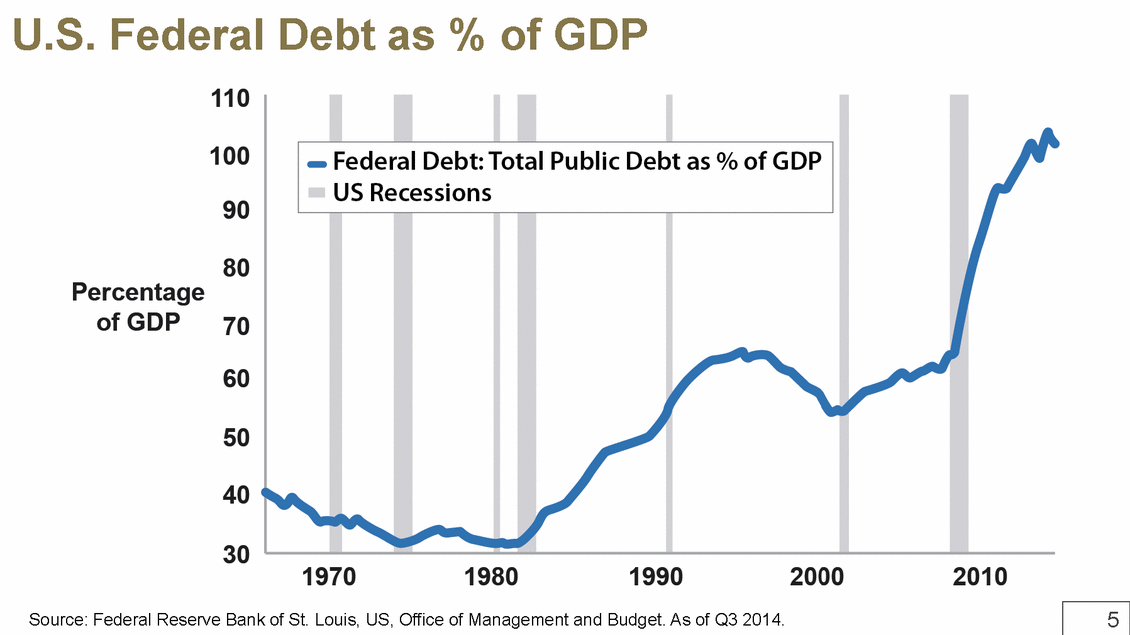
5 U.S. Federal Debt as % of GDP Source: Federal Reserve Bank of St. Louis, US, Office of Management and Budget. As of Q3 2014. |
|
|
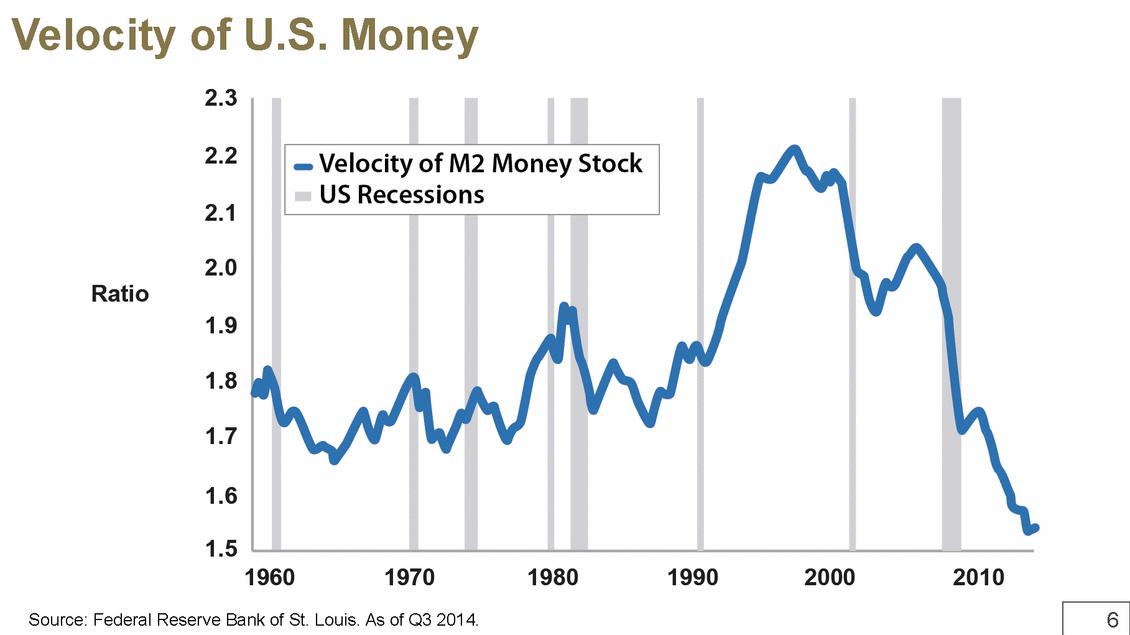
6 Velocity of U.S. Money Source: Federal Reserve Bank of St. Louis. As of Q3 2014. |
|
|
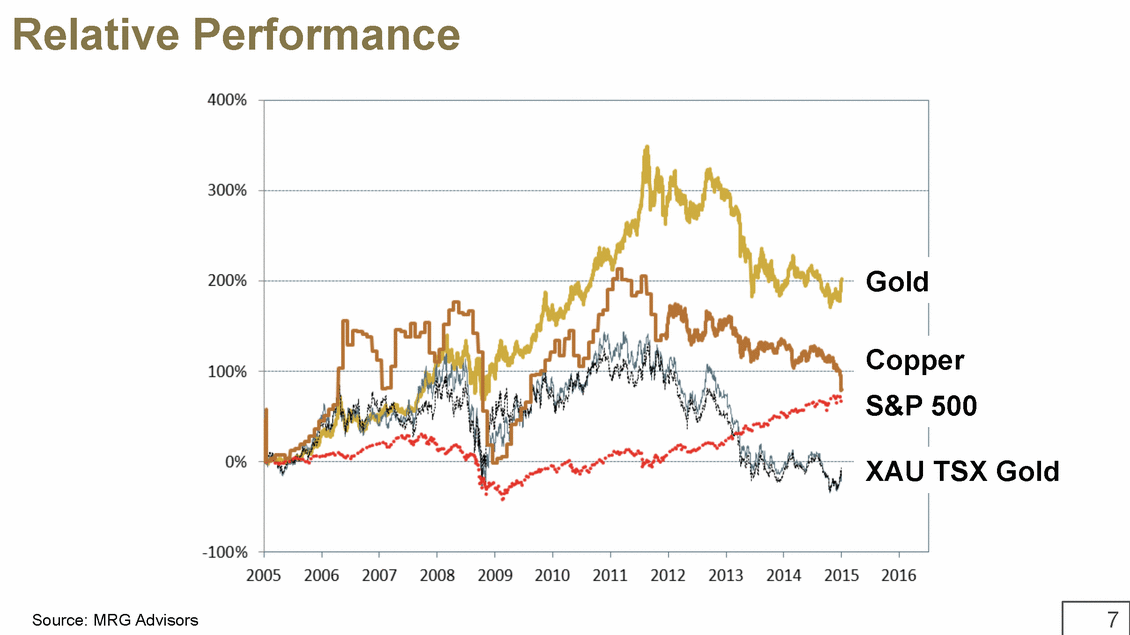
7 Relative Performance Source: MRG Advisors Gold Copper S&P 500 XAU TSX Gold |
|
|
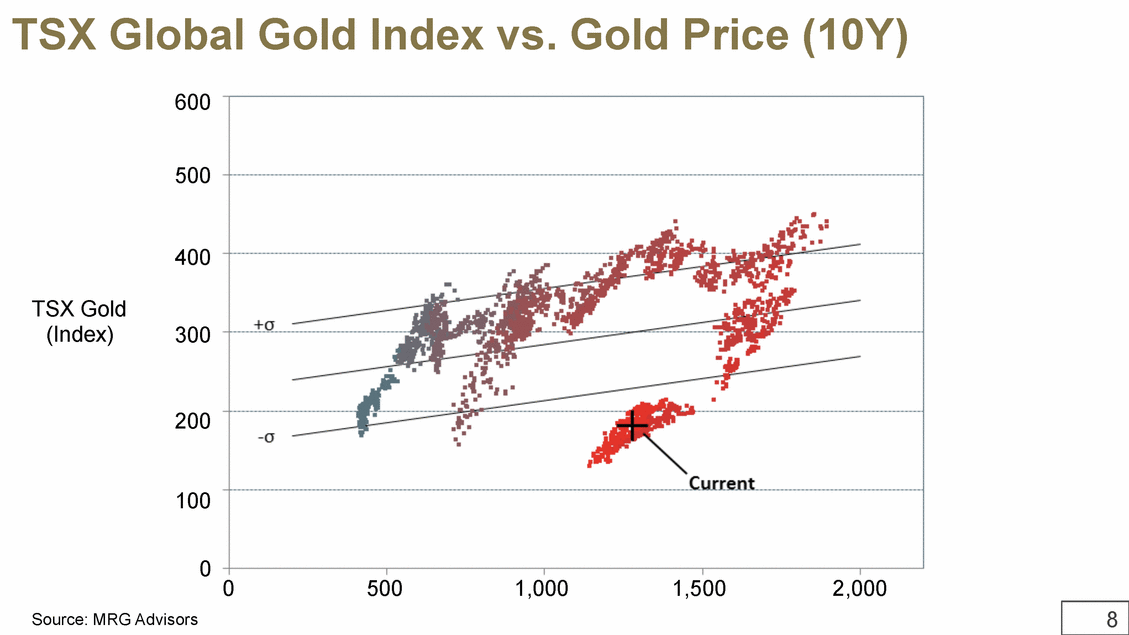
8 TSX Global Gold Index vs. Gold Price (10Y) Source: MRG Advisors TSX Gold (Index) 600 500 400 300 200 100 0 0 500 1,000 1,500 2,000 |
|
|
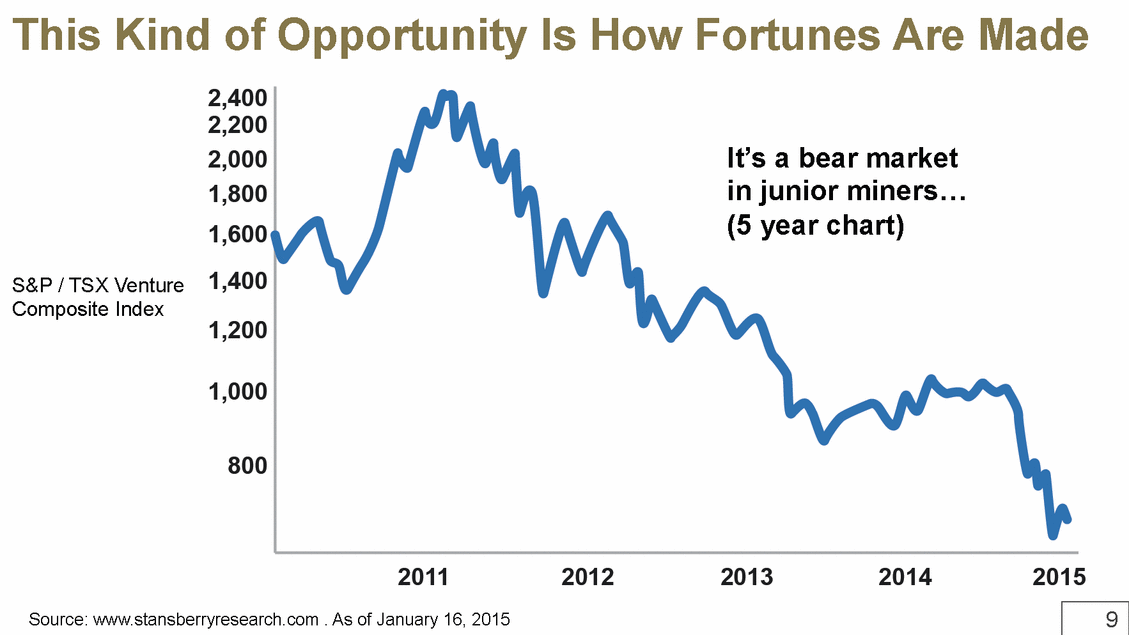
9 This Kind of Opportunity Is How Fortunes Are Made It’s a bear market in junior miners (5 year chart) Source: www.stansberryresearch.com . As of January 16, 2015 S&P / TSX Venture Composite Index |
|
|
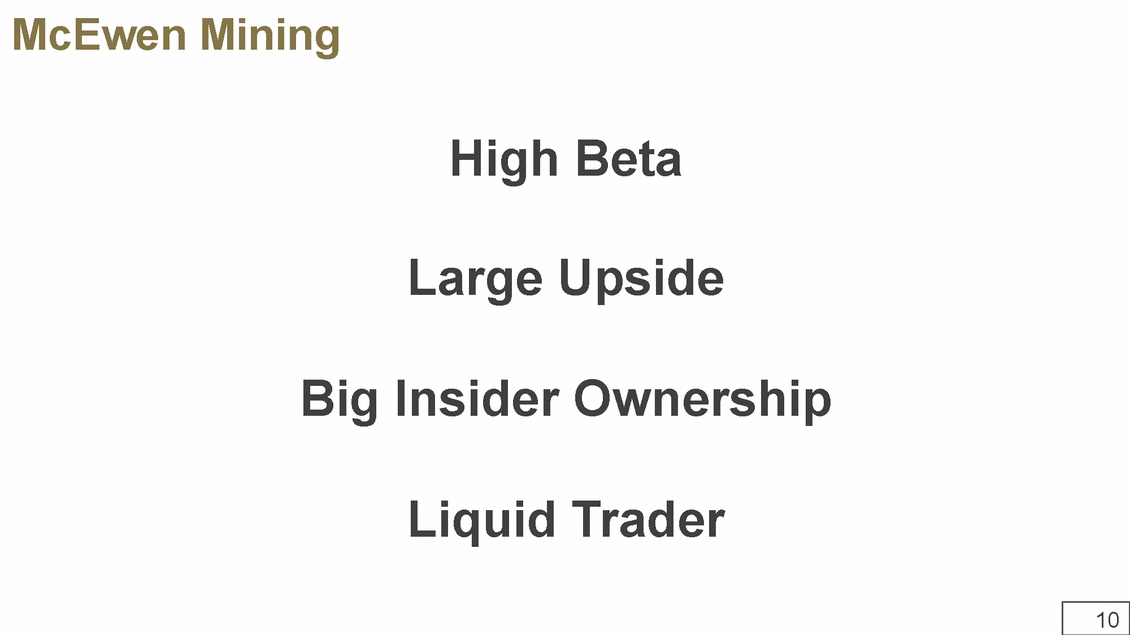
10 High Beta Large Upside Big Insider Ownership Liquid Trader McEwen Mining |
|
|
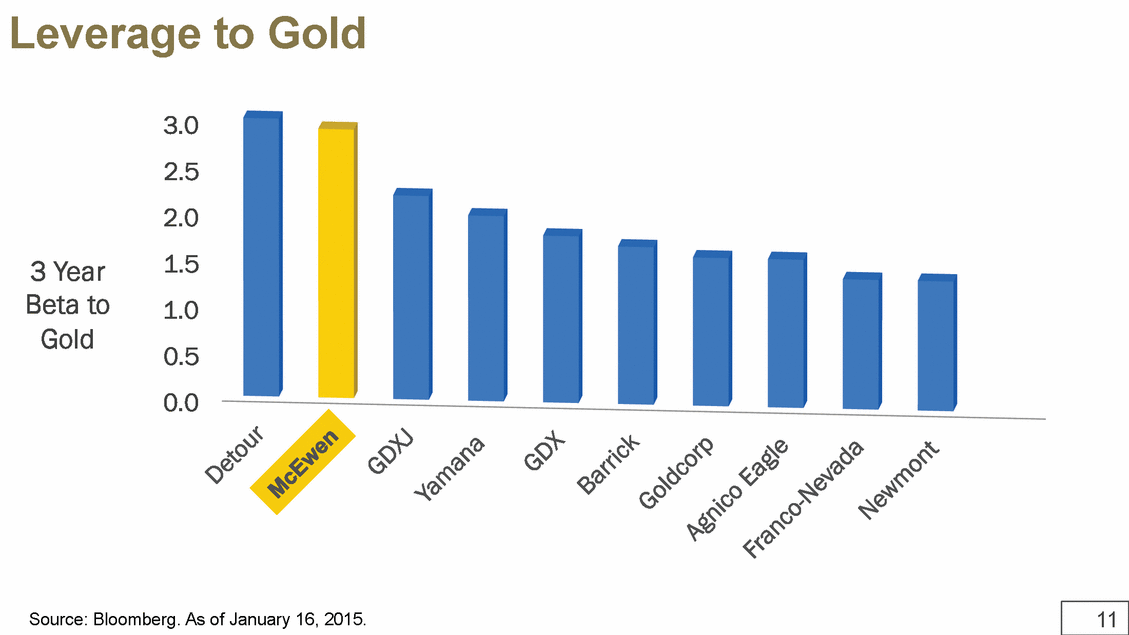
11 0.0 0.5 1.0 1.5 2.0 2.5 3.0 3 Year Beta to Gold Leverage to Gold Source: Bloomberg. As of January 16, 2015. |
|
|
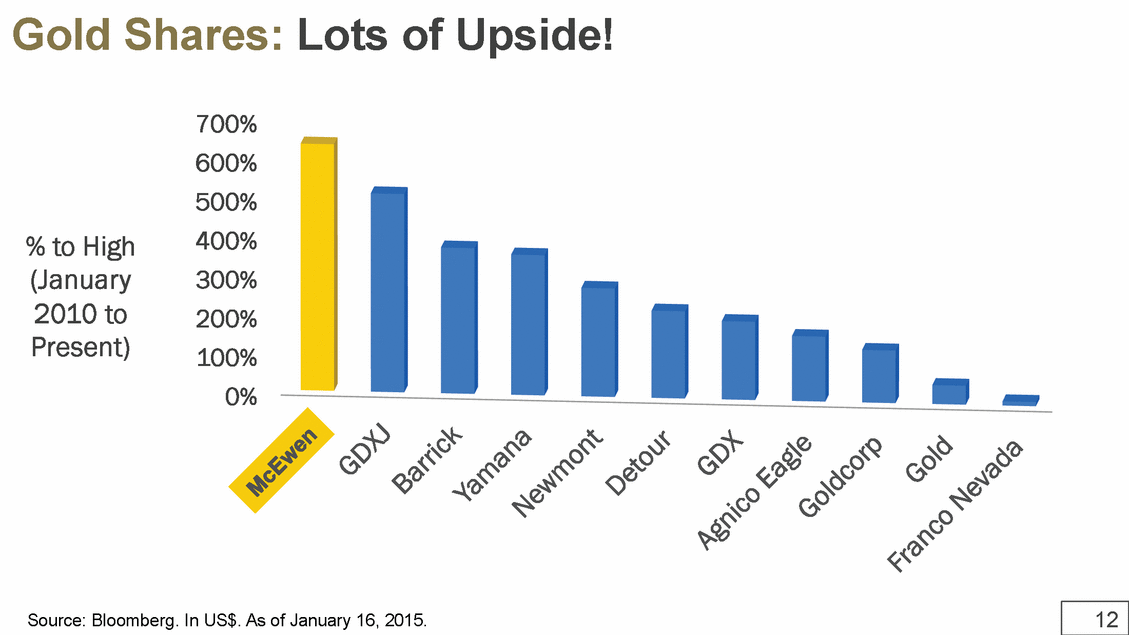
12 0% 100% 200% 300% 400% 500% 600% 700% % to High (January 2010 to Present) Gold Shares: Lots of Upside! Source: Bloomberg. In US$. As of January 16, 2015. |
|
|
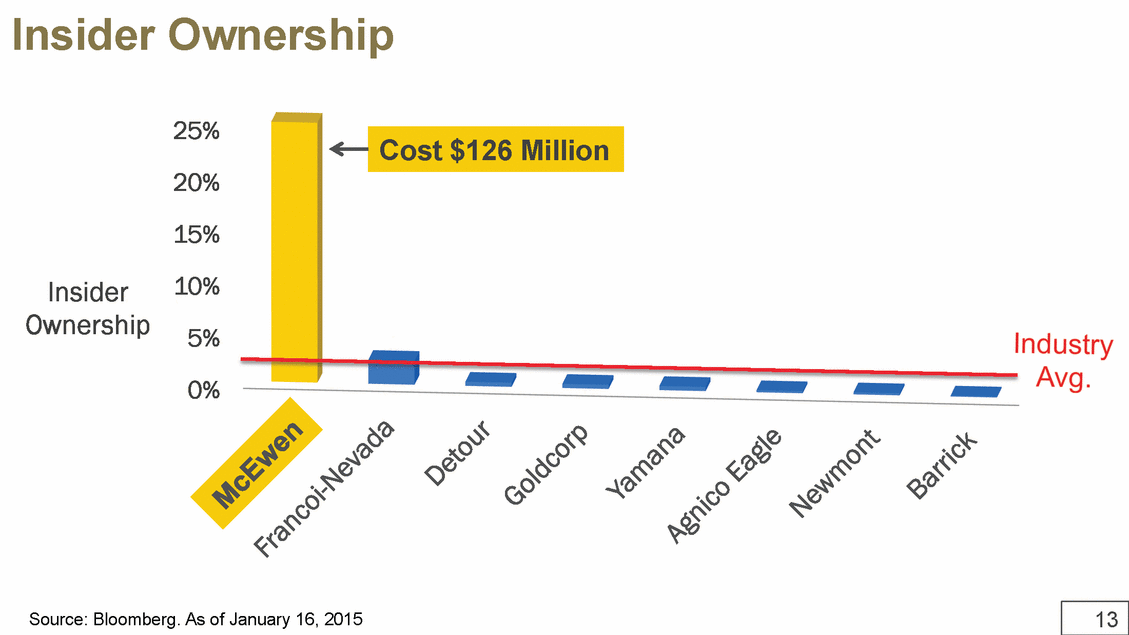
13 0% 5% 10% 15% 20% 25% Insider Ownership Insider Ownership Source: Bloomberg. As of January 16, 2015 Cost $126 Million |
|
|
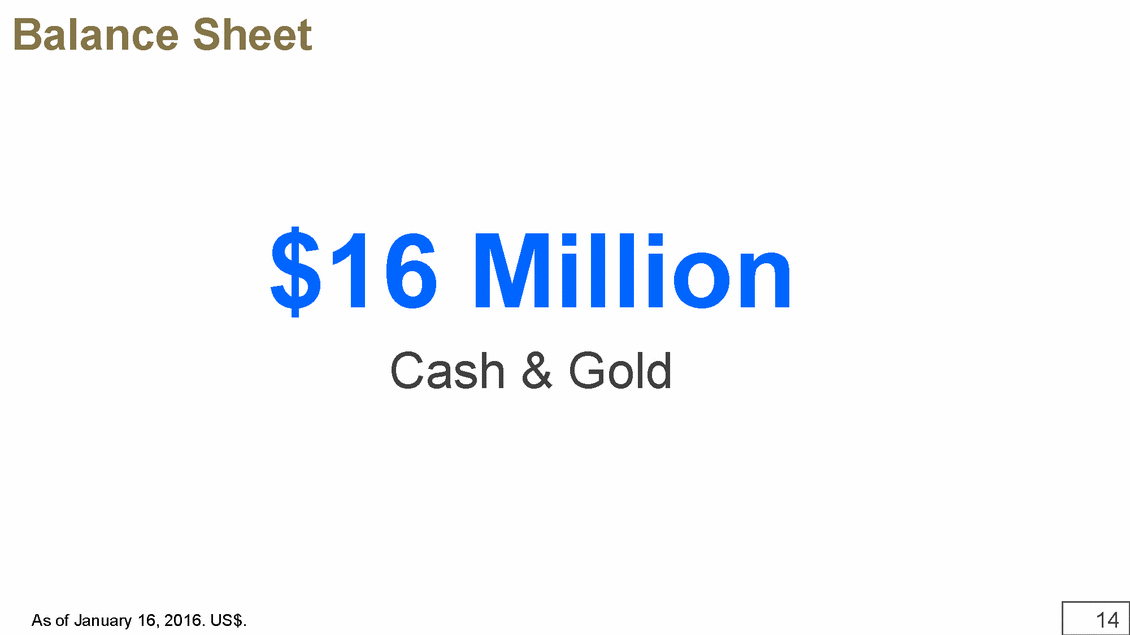
14 Balance Sheet As of January 16, 2016. US$. $16 Million Cash & Gold |
|
|
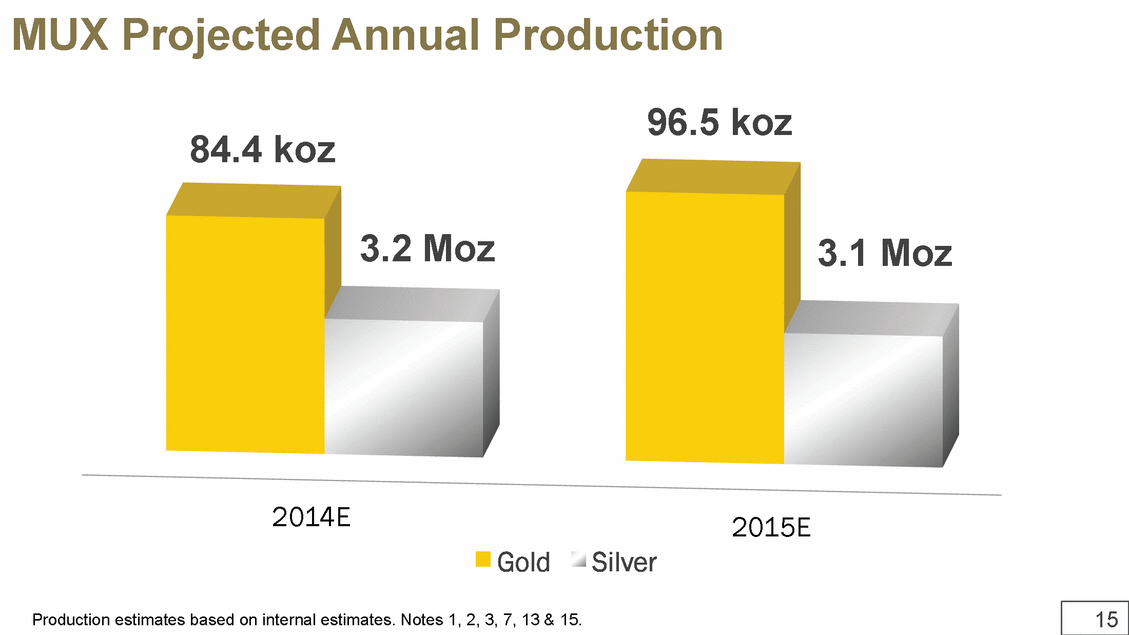
15 2014E 2015E Gold Silver MUX Projected Annual Production Production estimates based on internal estimates. Notes 1, 2, 3, 7, 13 & 15. 84.4 koz 96.5 koz 3.2 Moz 3.1 Moz |
|
|
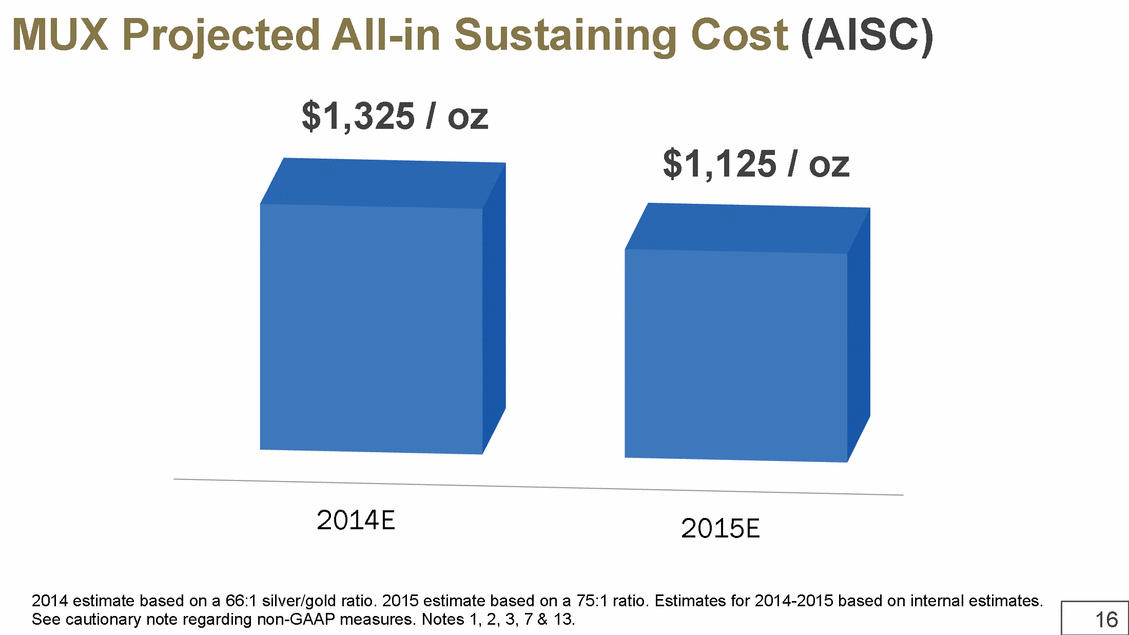
16 2014E 2015E MUX Projected All-in Sustaining Cost (AISC) 2014 estimate based on a 66:1 silver/gold ratio. 2015 estimate based on a 75:1 ratio. Estimates for 2014-2015 based on internal estimates. See cautionary note regarding non-GAAP measures. Notes 1, 2, 3, 7 & 13. $1,325 / oz $1,125 / oz |
|
|
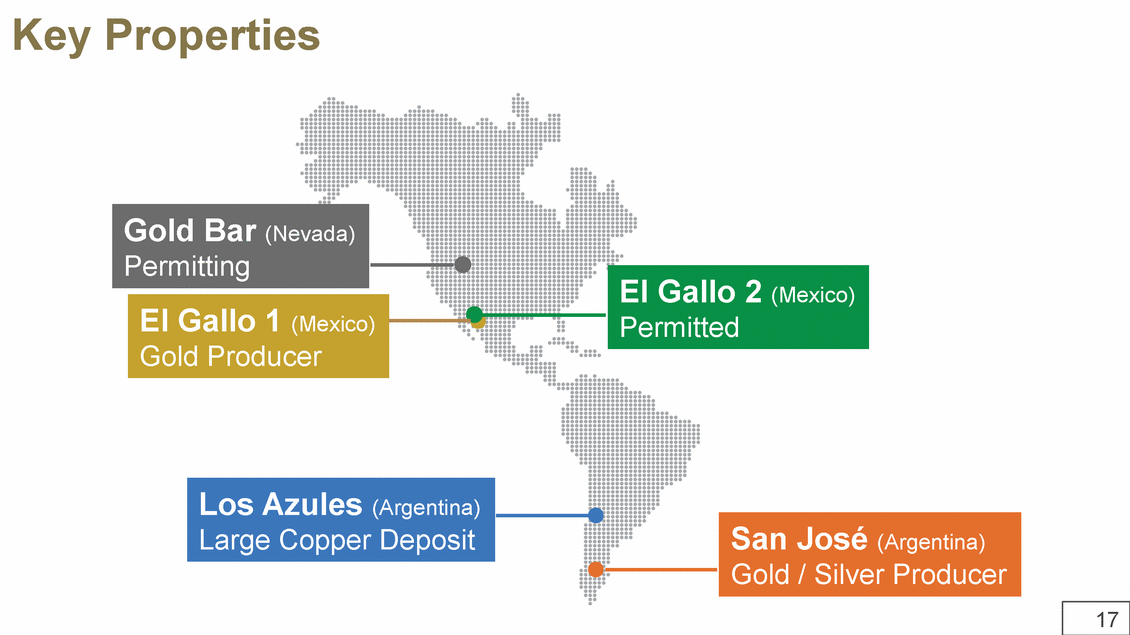
17 Gold Bar (Nevada) Permitting El Gallo 1 (Mexico) Gold Producer El Gallo 2 (Mexico) Permitted Los Azules (Argentina) Large Copper Deposit San José (Argentina) Gold / Silver Producer Key Properties |
|
|
18 Mexico EL GALLO MINE Production |
|
|
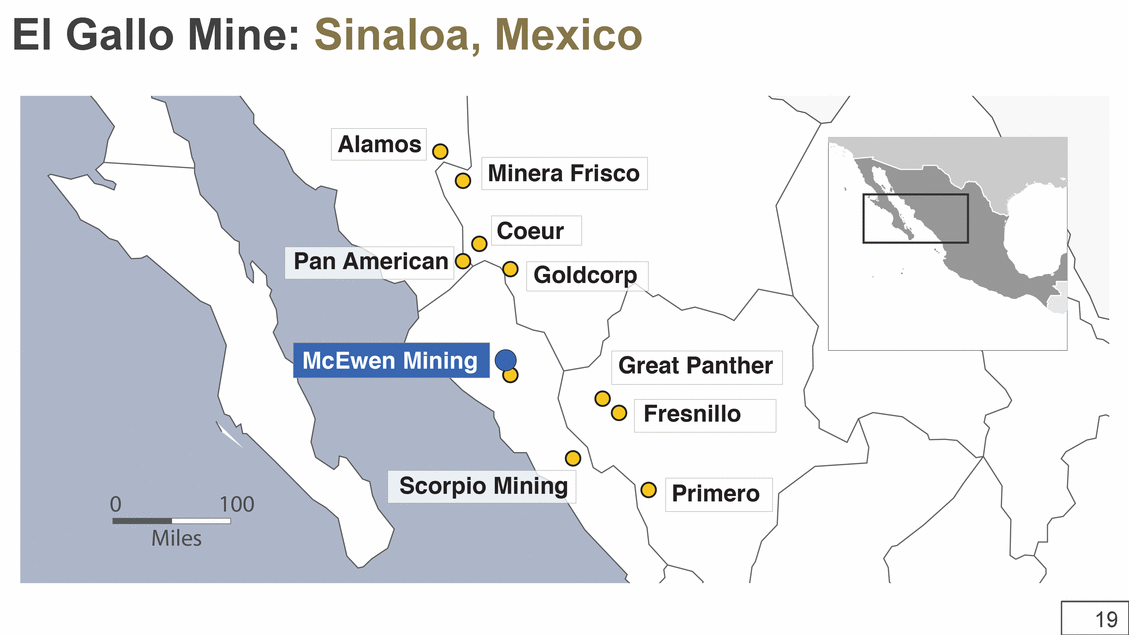
19 El Gallo Mine: Sinaloa, Mexico |
|
|
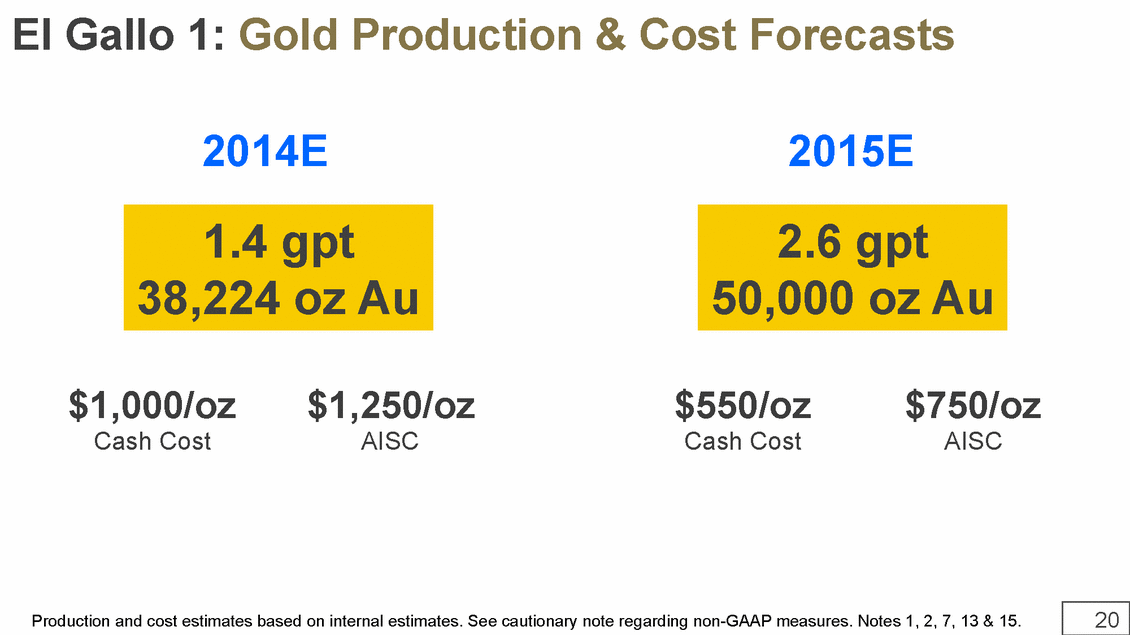
20 $1,000/oz Cash Cost $1,250/oz AISC 1.4 gpt 38,224 oz Au Production and cost estimates based on internal estimates. See cautionary note regarding non-GAAP measures. Notes 1, 2, 7, 13 & 15. 2.6 gpt 50,000 oz Au $550/oz Cash Cost $750/oz AISC 2014E 2015E El Gallo 1: Gold Production & Cost Forecasts |
|
|
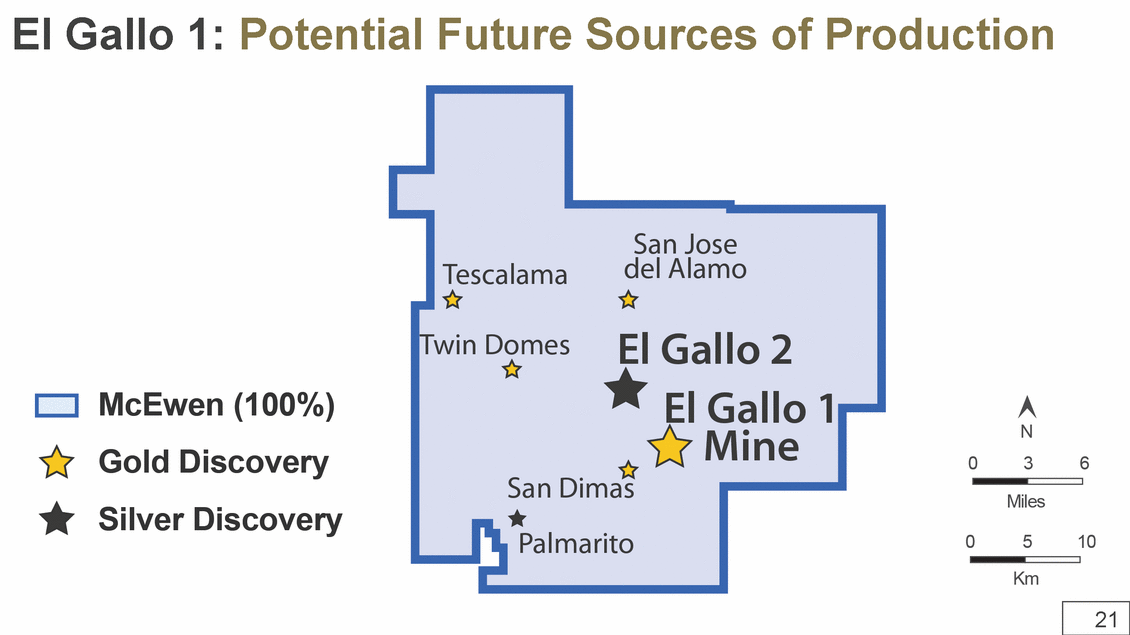
21 El Gallo 1: Potential Future Sources of Production |
|
|
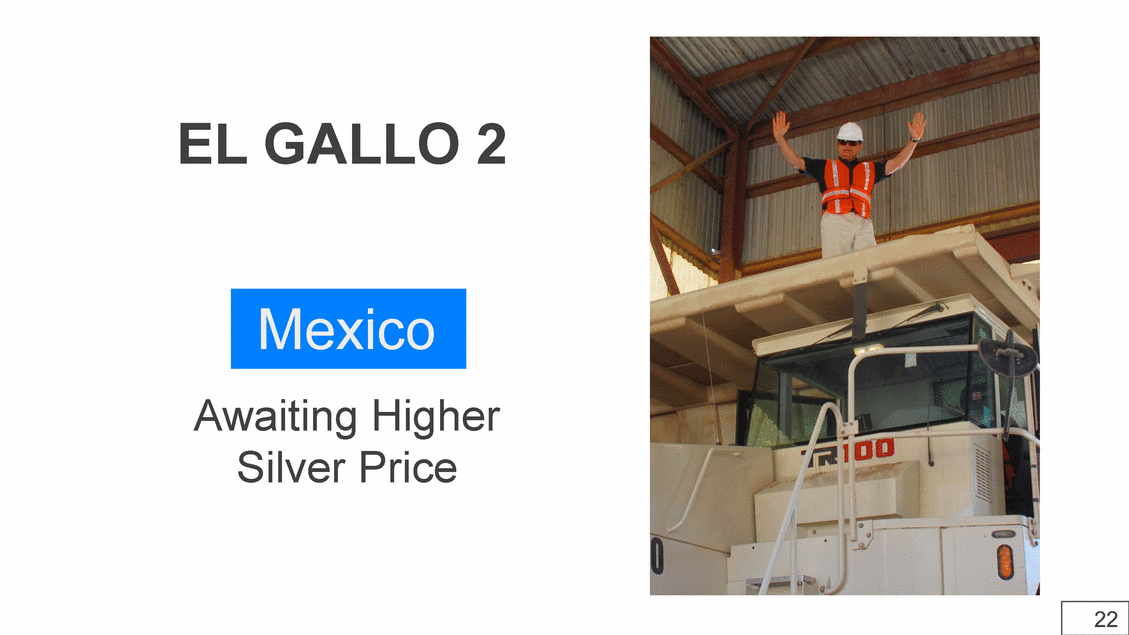
22 Mexico EL GALLO 2 Awaiting Higher Silver Price |
|
|
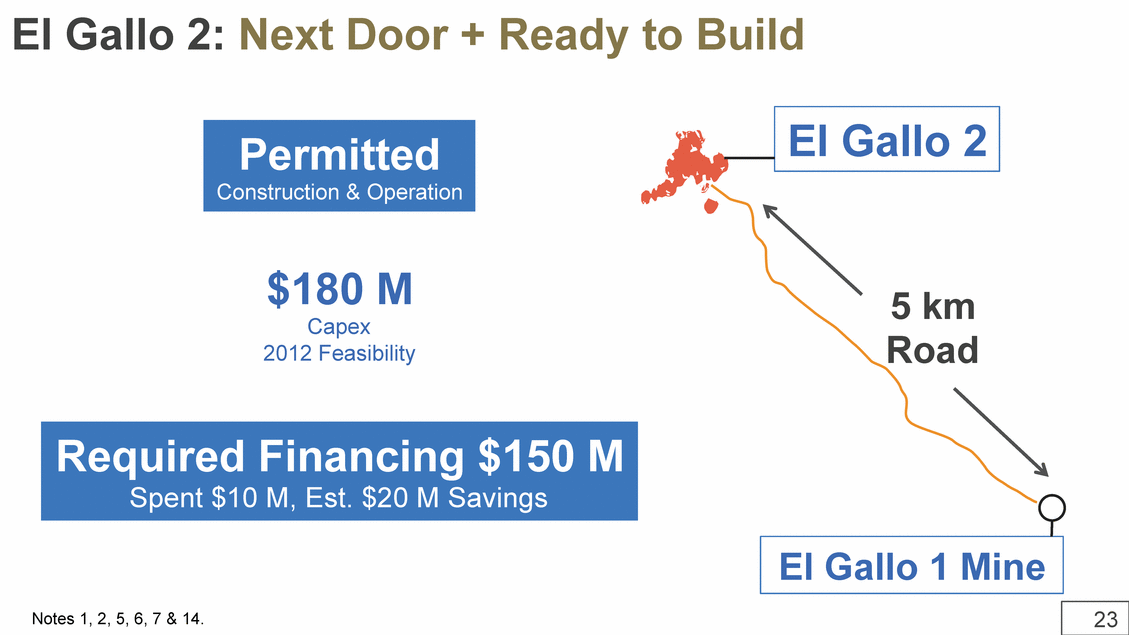
23 Notes 1, 2, 5, 6, 7 & 14. El Gallo 2: Next Door + Ready to Build El Gallo 1 Mine 5 km Road El Gallo 2 $180 M Capex 2012 Feasibility Permitted Construction & Operation Required Financing $150 M Spent $10 M, Est. $20 M Savings |
|
|
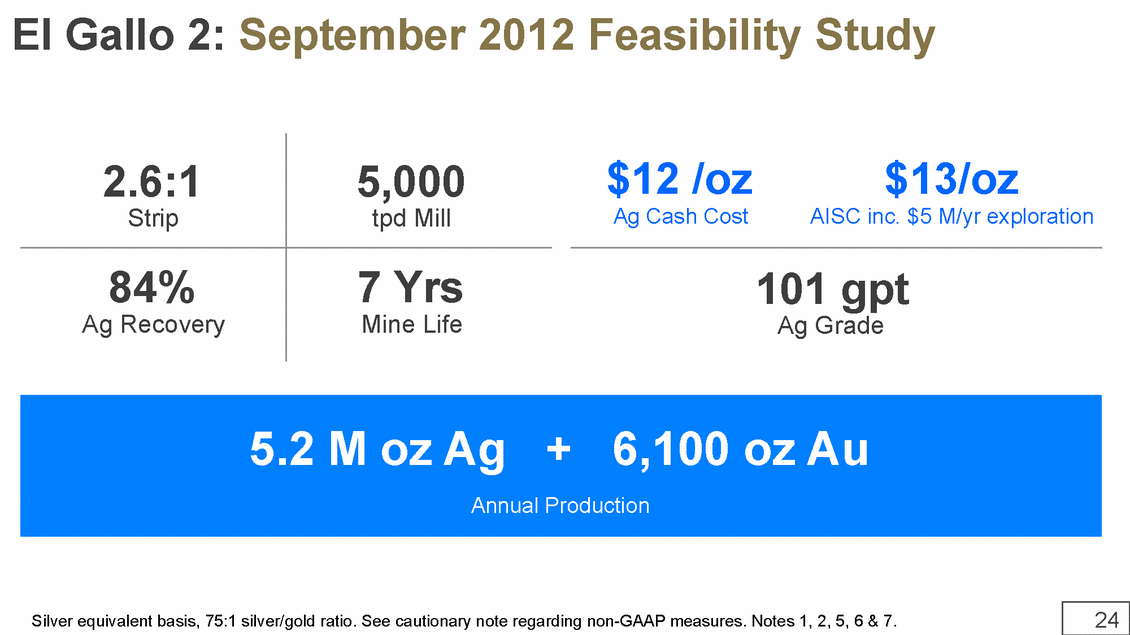
24 El Gallo 2: September 2012 Feasibility Study 5.2 M oz Ag + 6,100 oz Au 2.6:1 Strip $13/oz AISC inc. $5 M/yr exploration Silver equivalent basis, 75:1 silver/gold ratio. See cautionary note regarding non-GAAP measures. Notes 1, 2, 5, 6 & 7. Annual Production 5,000 tpd Mill 84% Ag Recovery 7 Yrs Mine Life $12 /oz Ag Cash Cost 101 gpt Ag Grade |
|
|
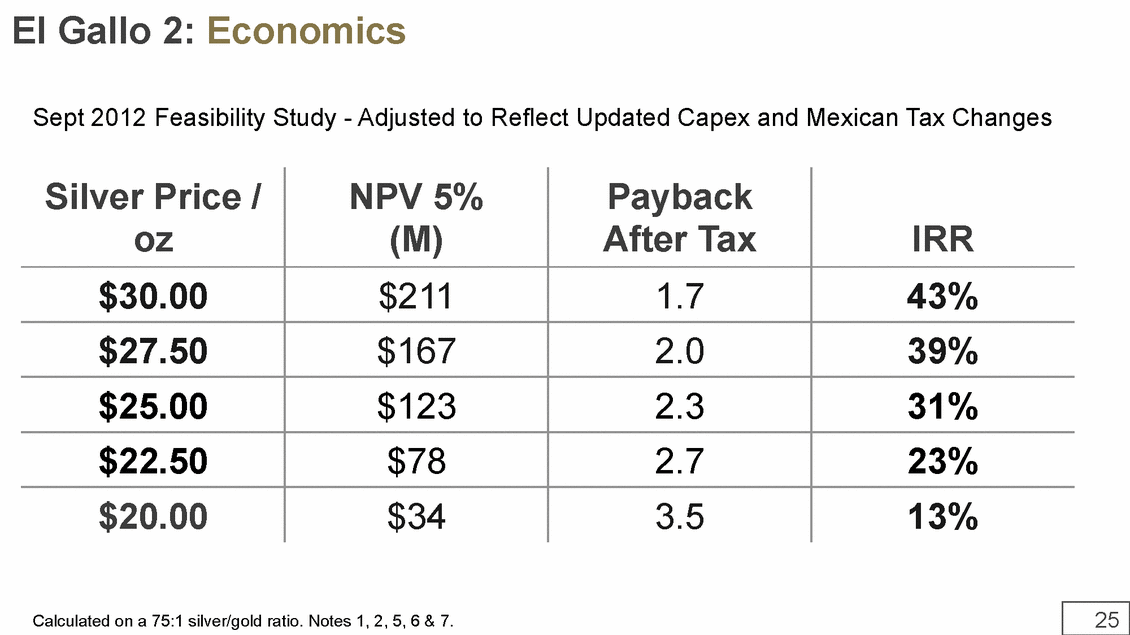
25 El Gallo 2: Economics Sept 2012 Feasibility Study - Adjusted to Reflect Updated Capex and Mexican Tax Changes Silver Price / oz NPV 5% (M) Payback After Tax IRR $30.00 $211 1.7 43% $27.50 $167 2.0 39% $25.00 $123 2.3 31% $22.50 $78 2.7 23% $20.00 $34 3.5 13% Calculated on a 75:1 silver/gold ratio. Notes 1, 2, 5, 6 & 7. |
|
|
26 Santa Cruz Province SAN JOSÉ MINE Argentina Gold & Silver Production |
|
|
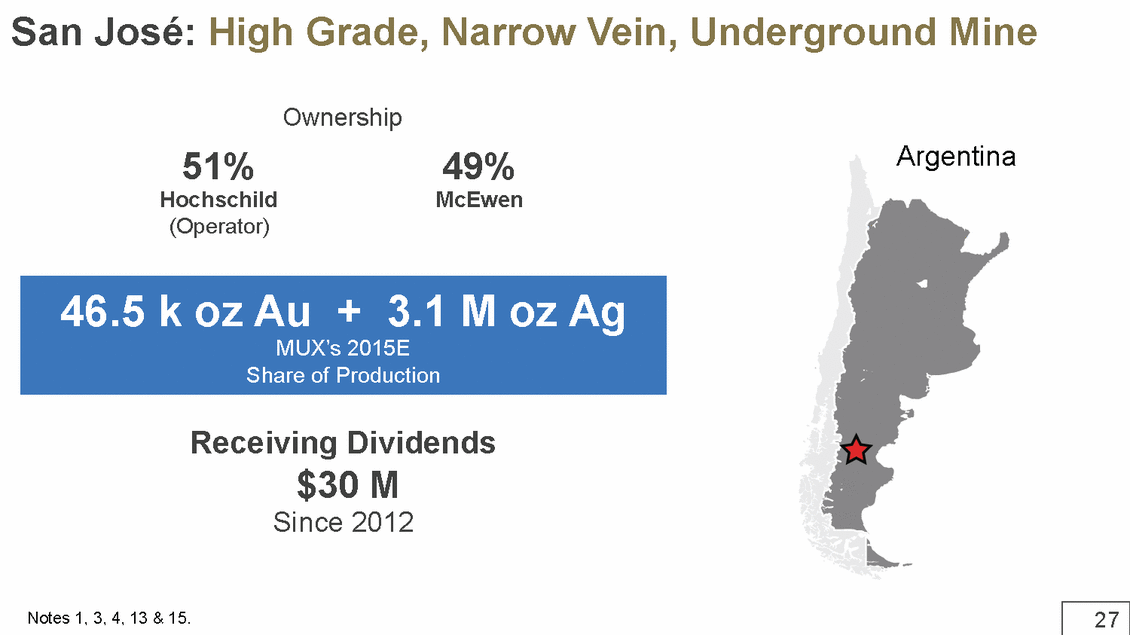
27 San José: High Grade, Narrow Vein, Underground Mine 51% Hochschild (Operator) 46.5 k oz Au + 3.1 M oz Ag MUX’s 2015E Share of Production Notes 1, 3, 4, 13 & 15. Receiving Dividends $30 M Since 2012 49% McEwen Ownership Argentina |
|
|
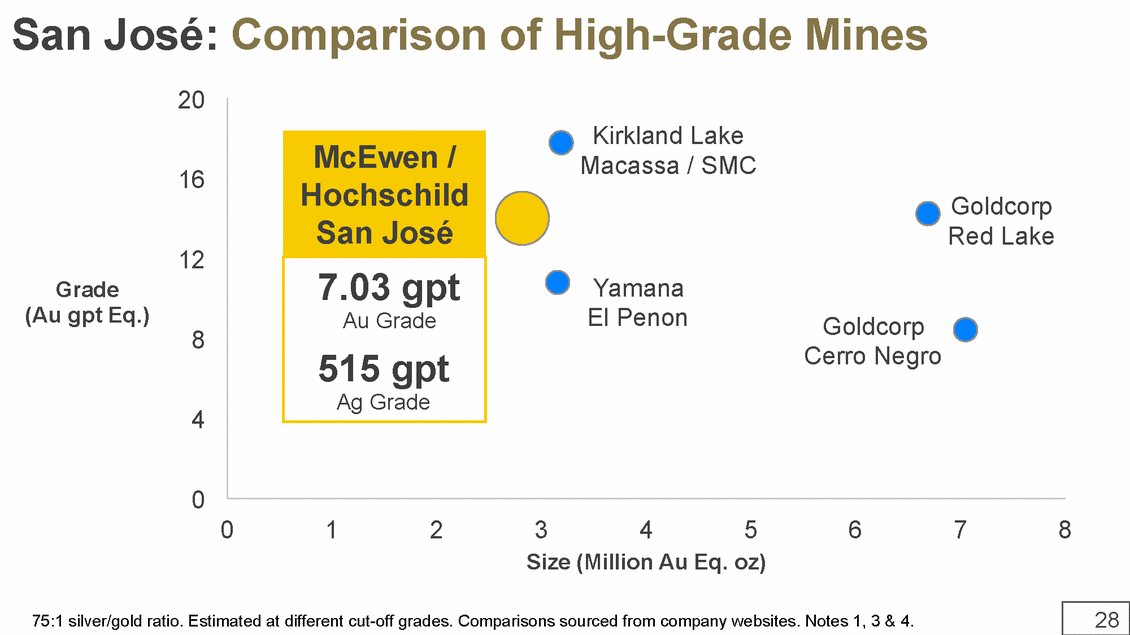
28 0 4 8 12 16 20 0 1 2 3 4 5 6 7 8 Grade (Au gpt Eq.) Size (Million Au Eq. oz) San José: Comparison of High-Grade Mines McEwen / Hochschild San José Goldcorp Red Lake Goldcorp Cerro Negro Kirkland Lake Macassa / SMC 75:1 silver/gold ratio. Estimated at different cut-off grades. Comparisons sourced from company websites. Notes 1, 3 & 4. Yamana El Penon 7.03 gpt Au Grade 515 gpt Ag Grade |
|
|
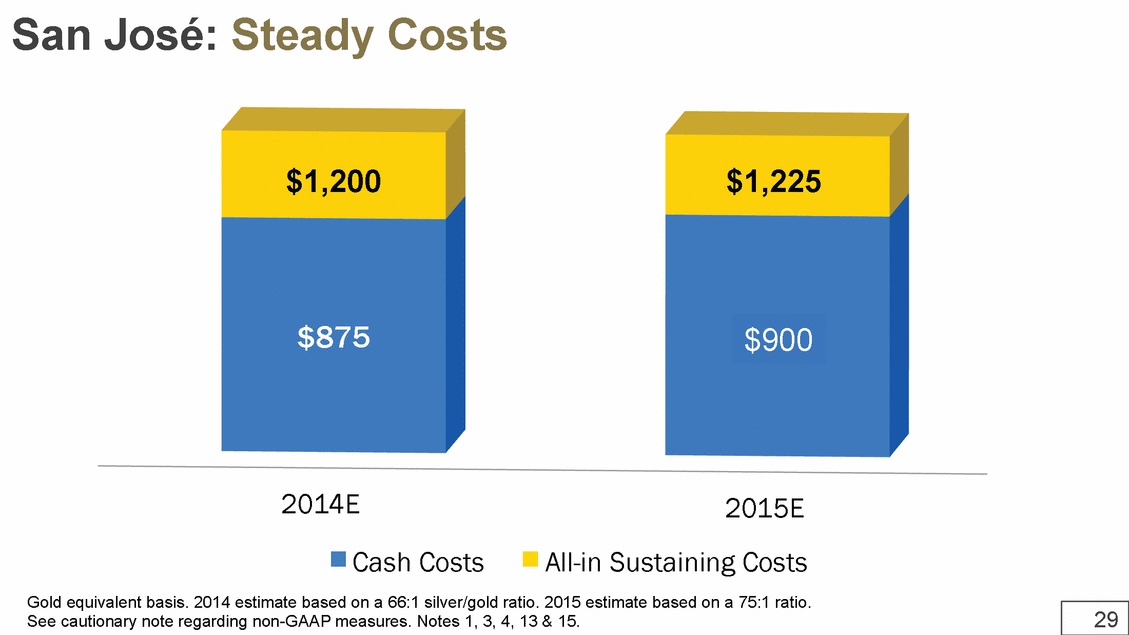
29 San José: Steady Costs 2014E 2015E $875 $825 Cash Costs All-in Sustaining Costs $1,200 $1,225 Gold equivalent basis. 2014 estimate based on a 66:1 silver/gold ratio. 2015 estimate based on a 75:1 ratio. See cautionary note regarding non-GAAP measures. Notes 1, 3, 4, 13 & 15. $900 |
|
|
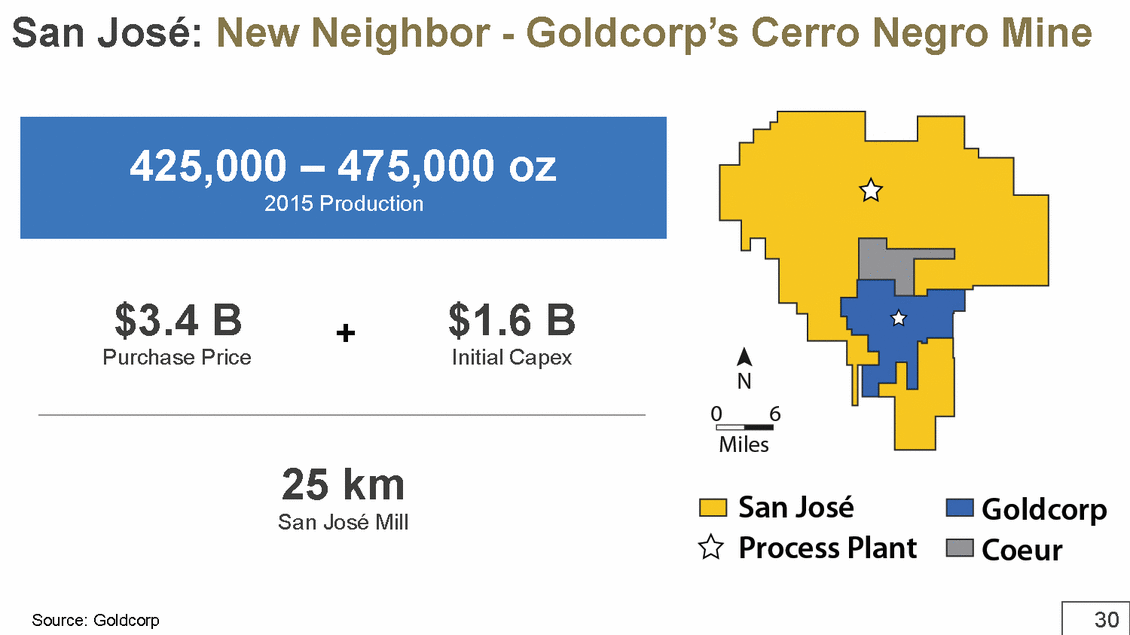
30 San José: New Neighbor - Goldcorp’s Cerro Negro Mine $3.4 B Purchase Price $1.6 B Initial Capex 425,000 – 475,000 oz 2015 Production 25 km San José Mill Source: Goldcorp + |
|
|
31 Nevada GOLD BAR Cortez Trend Mine Permitting 100% Owned |
|
|
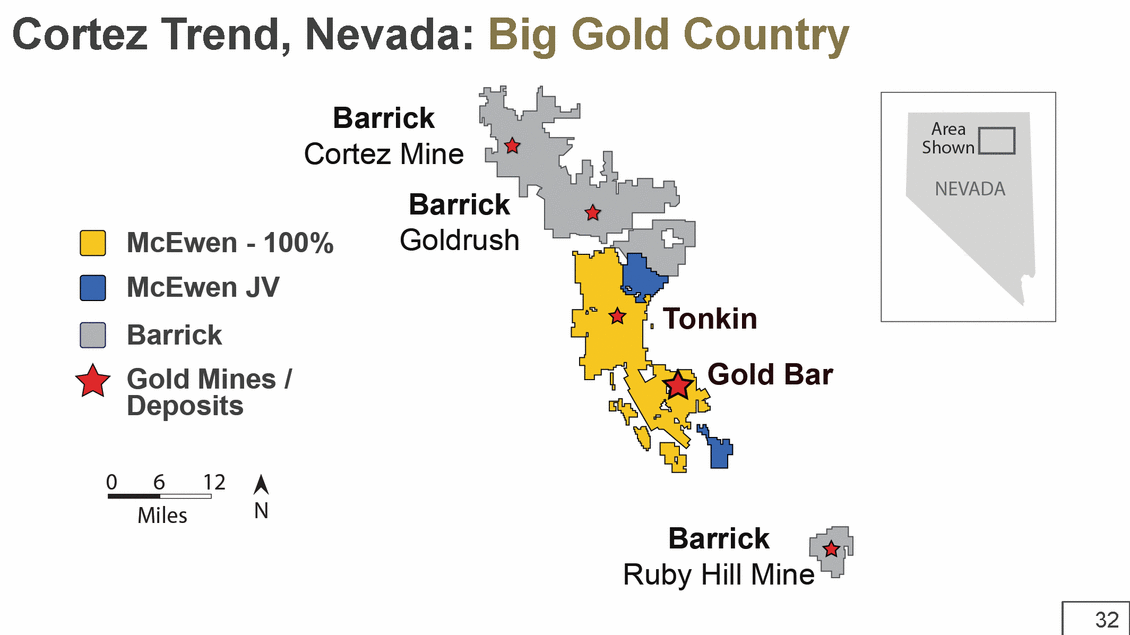
32 Cortez Trend, Nevada: Big Gold Country |
|
|
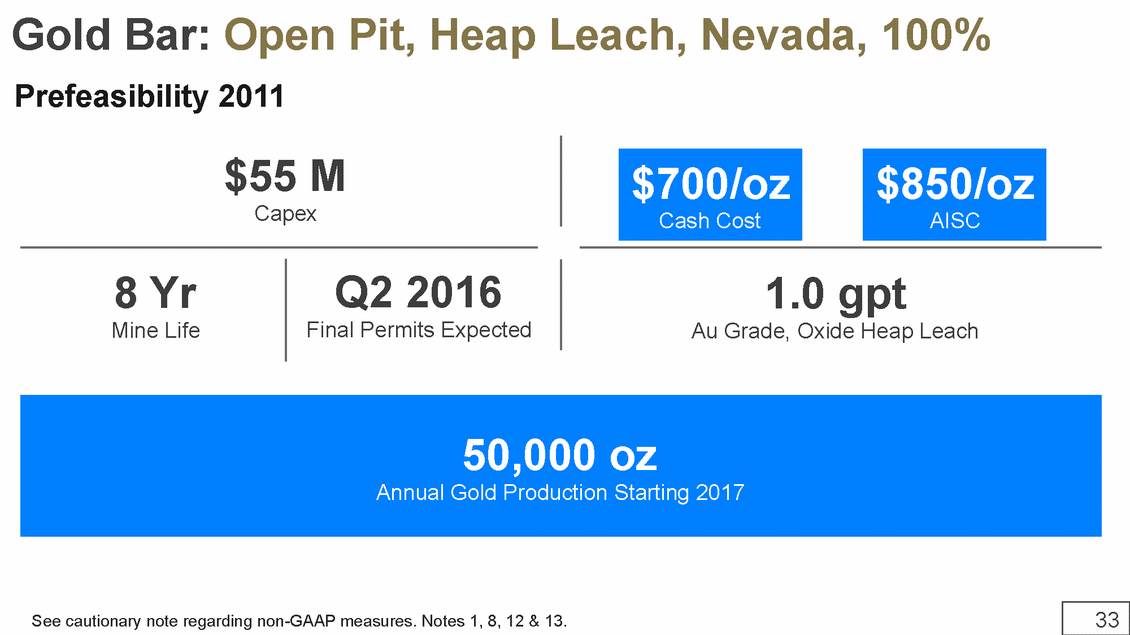
33 Gold Bar: Open Pit, Heap Leach, Nevada, 100% 8 Yr Mine Life $55 M Capex $700/oz Cash Cost $850/oz AISC See cautionary note regarding non-GAAP measures. Notes 1, 8, 12 & 13. Q2 2016 Final Permits Expected 50,000 oz Annual Gold Production Starting 2017 1.0 gpt Au Grade, Oxide Heap Leach Prefeasibility 2011 |
|
|
34 San Juan Province LOS AZULES Argentina Big Copper Deposit |
|
|
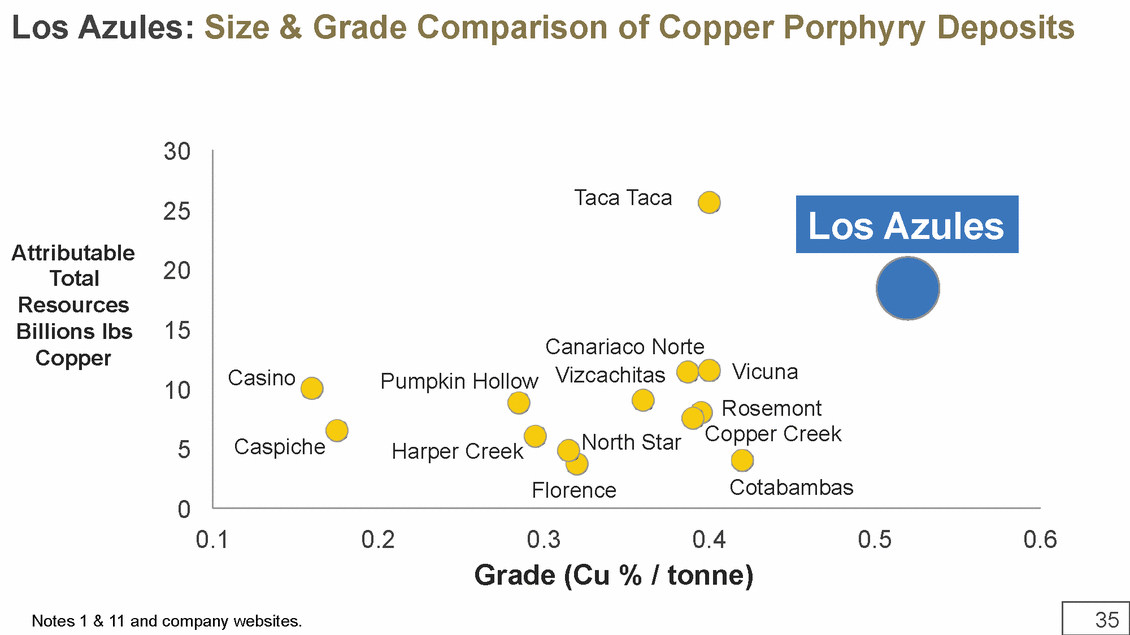
35 Los Azules: Size & Grade Comparison of Copper Porphyry Deposits Grade (Cu % / tonne) 0 5 10 15 20 25 30 0.1 0.2 0.3 0.4 0.5 0.6 Attributable Total Resources Billions lbs Copper Taca Taca Los Azules Vicuna Rosemont Copper Creek Cotabambas Canariaco Norte Vizcachitas Pumpkin Hollow Harper Creek North Star Florence Caspiche Casino Notes 1 & 11 and company websites. |
|
|
36 Los Azules: A Rare Deposit – PEA Sept 2013 Highlights Open Pit Development 100% Ownership 19.7 B lbs Cu IRR 14.3% NPV (8%) $1.7 B @ $3/lb Cu Capex $3.9 B After tax basis. Notes 1 & 11. Based on $3.00/lb copper, $1,300/oz gold. PEA – Preliminary economic assessment. No Back-in Right |
|
|
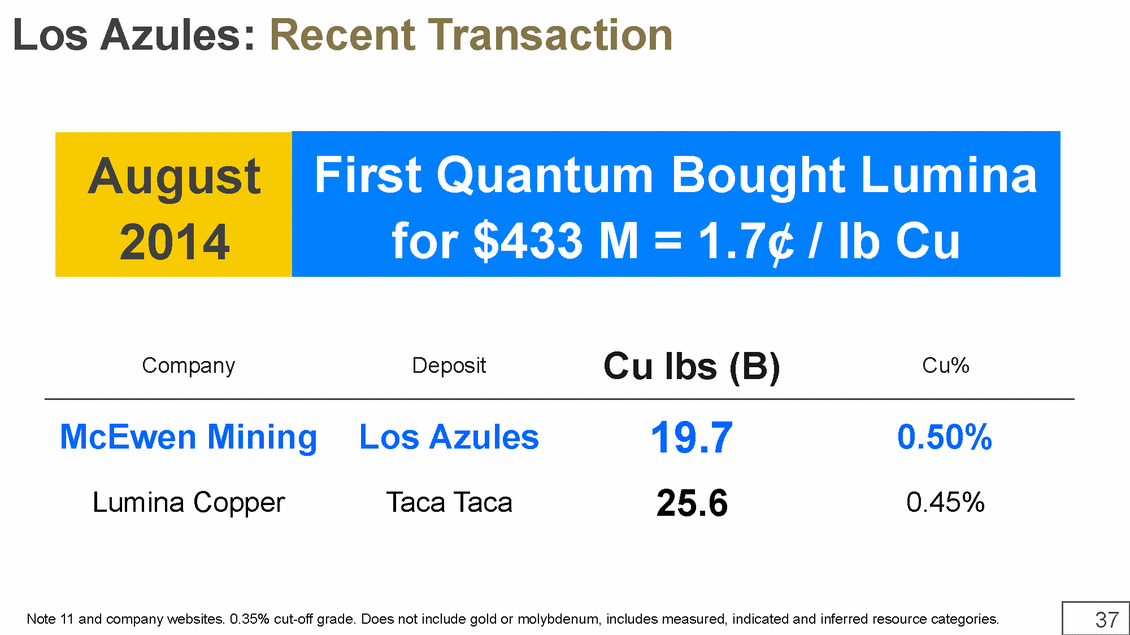
37 Los Azules: Recent Transaction First Quantum Bought Lumina for $433 M = 1.7¢ / lb Cu Note 11 and company websites. 0.35% cut-off grade. Does not include gold or molybdenum, includes measured, indicated and inferred resource categories. Company Deposit Cu lbs (B) Cu% McEwen Mining Los Azules 19.7 0.50% Lumina Copper Taca Taca 25.6 0.45% August 2014 |
|
|
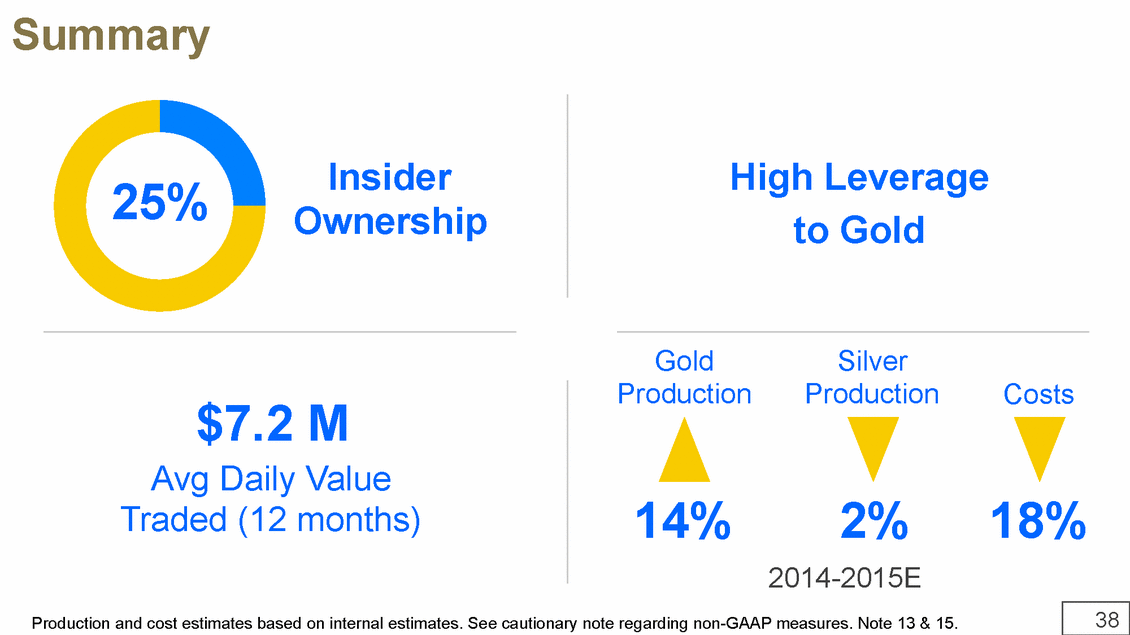
38 High Leverage to Gold Production and cost estimates based on internal estimates. See cautionary note regarding non-GAAP measures. Note 13 & 15. Summary 25% Insider Ownership Avg Daily Value Traded (12 months) 14% 18% Gold Production Costs 2014-2015E $7.2 M Silver Production 2% |
|
|
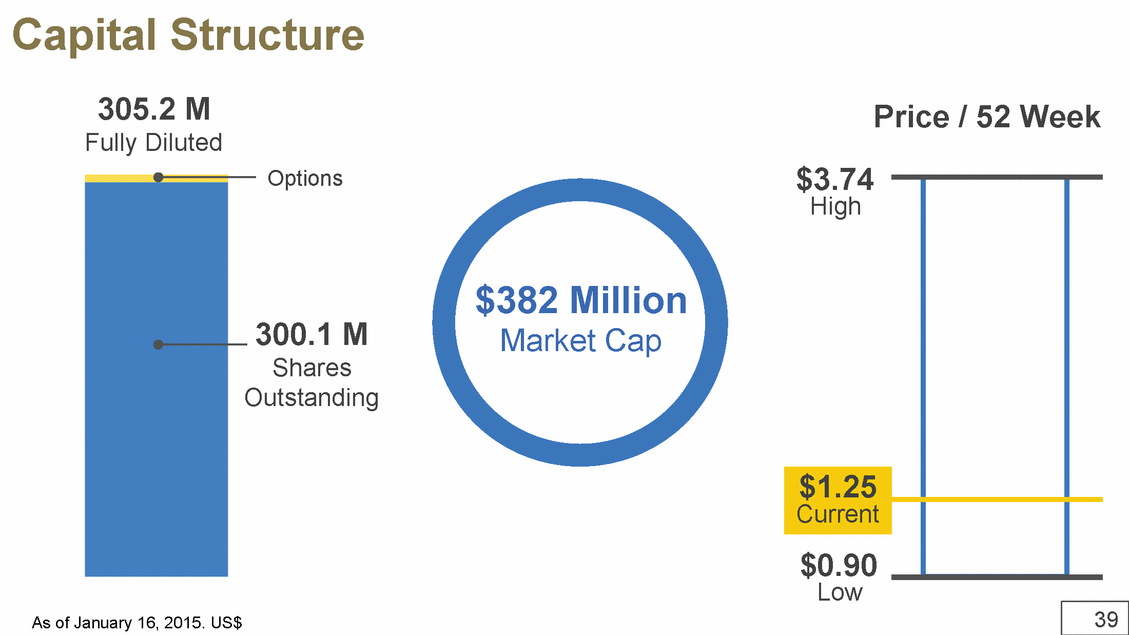
39 Capital Structure 305.2 M Fully Diluted Price / 52 Week $0.90 Low $1.25 Current 300.1 M Shares Outstanding Options $3.74 High $382 Million Market Cap As of January 16, 2015. US$ |
|
|
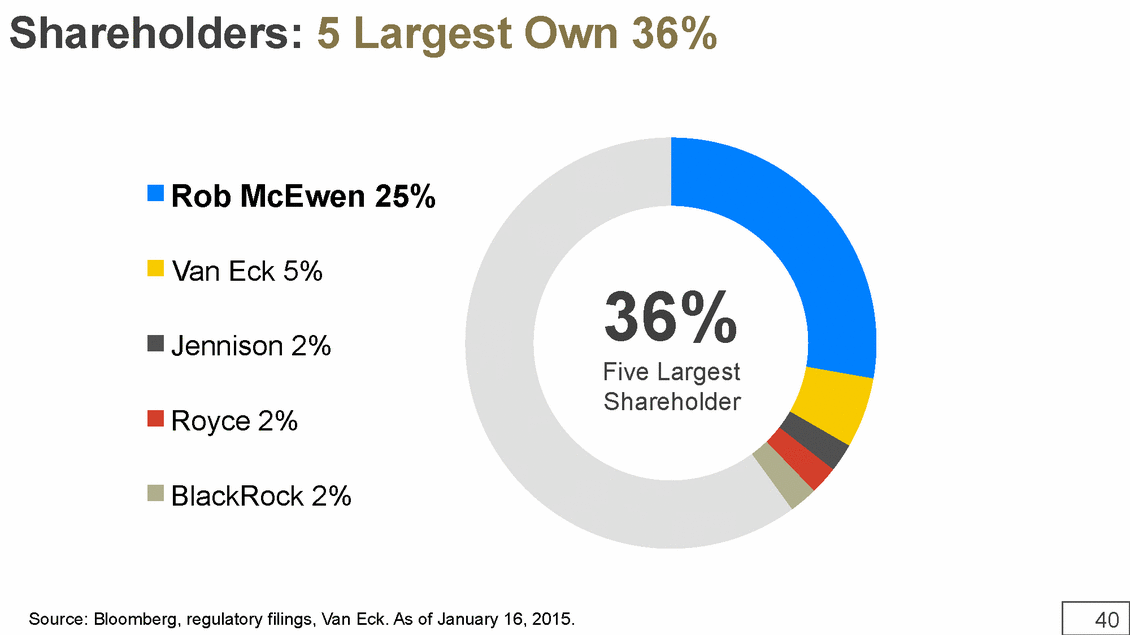
40 Shareholders: 5 Largest Own 36% Source: Bloomberg, regulatory filings, Van Eck. As of January 16, 2015. Rob McEwen 25% Van Eck 5% Jennison 2% Royce 2% BlackRock 2% 36% Five Largest Shareholder |
|
|
41 Collaborate. Create. Cure. |
|
|
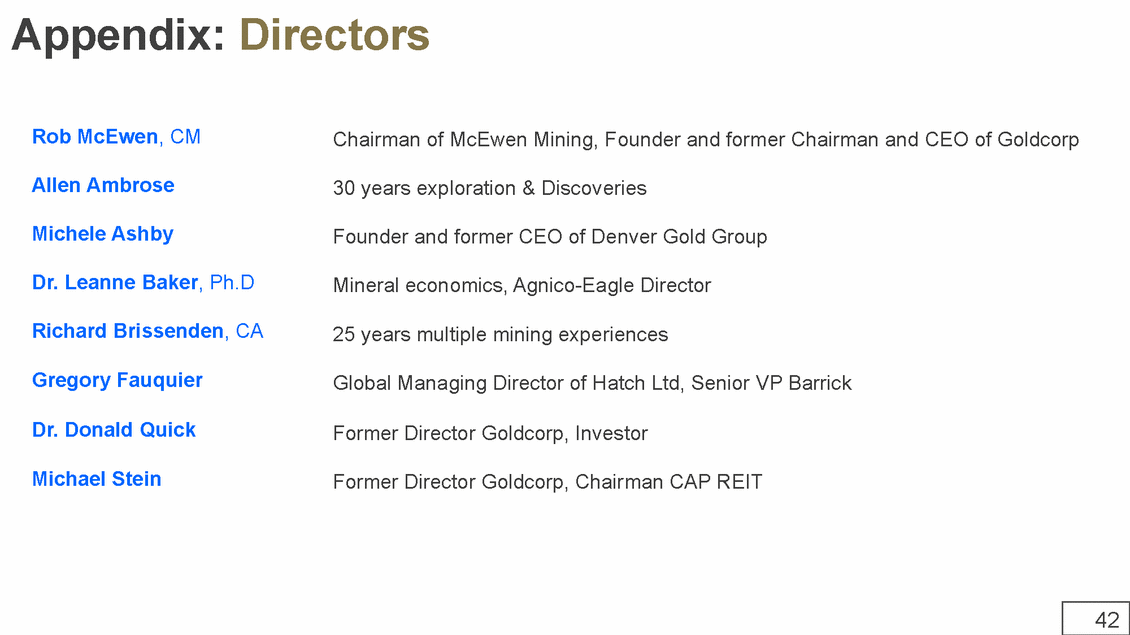
42 Rob McEwen, CM Allen Ambrose Michele Ashby Dr. Leanne Baker, Ph.D Richard Brissenden, CA Gregory Fauquier Dr. Donald Quick Michael Stein Appendix: Directors Chairman of McEwen Mining, Founder and former Chairman and CEO of Goldcorp 30 years exploration & Discoveries Founder and former CEO of Denver Gold Group Mineral economics, Agnico-Eagle Director 25 years multiple mining experiences Global Managing Director of Hatch Ltd, Senior VP Barrick Former Director Goldcorp, Investor Former Director Goldcorp, Chairman CAP REIT |
|
|
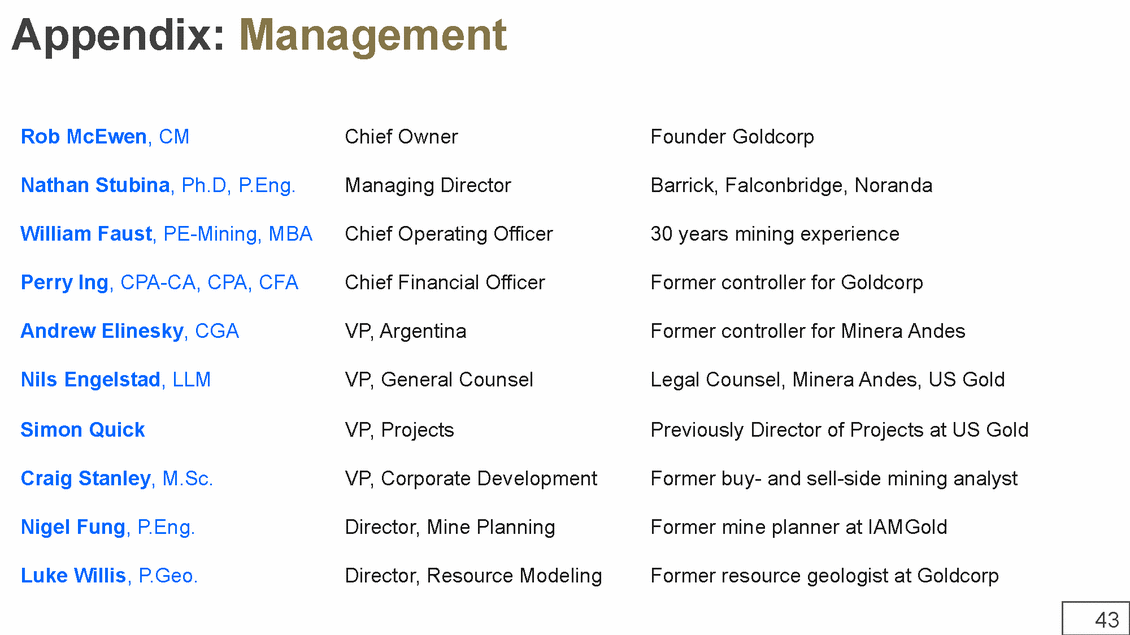
43 Rob McEwen, CM Nathan Stubina, Ph.D, P.Eng. William Faust, PE-Mining, MBA Perry Ing, CPA-CA, CPA, CFA Andrew Elinesky, CGA Nils Engelstad, LLM Simon Quick Craig Stanley, M.Sc. Nigel Fung, P.Eng. Luke Willis, P.Geo. Appendix: Management Chief Owner Managing Director Chief Operating Officer Chief Financial Officer VP, Argentina VP, General Counsel VP, Projects VP, Corporate Development Director, Mine Planning Director, Resource Modeling Founder Goldcorp Barrick, Falconbridge, Noranda 30 years mining experience Former controller for Goldcorp Former controller for Minera Andes Legal Counsel, Minera Andes, US Gold Previously Director of Projects at US Gold Former buy- and sell-side mining analyst Former mine planner at IAMGold Former resource geologist at Goldcorp |
|
|
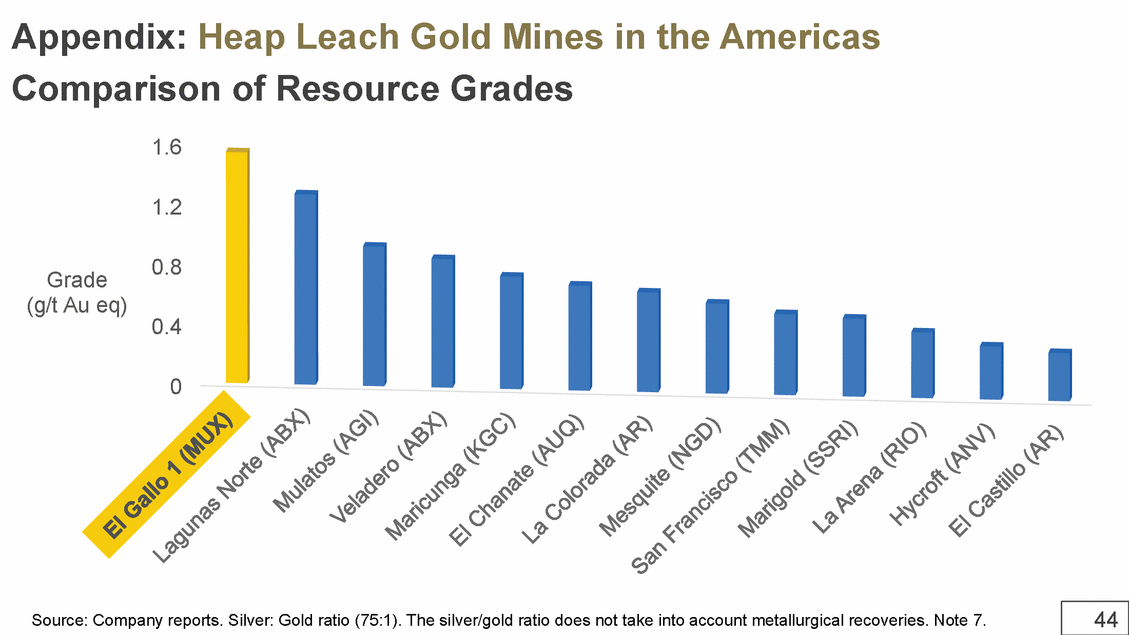
44 0 0.4 0.8 1.2 1.6 Grade (g/t Au eq) Appendix: Heap Leach Gold Mines in the Americas Comparison of Resource Grades Source: Company reports. Silver: Gold ratio (75:1). The silver/gold ratio does not take into account metallurgical recoveries. Note 7. |
|
|
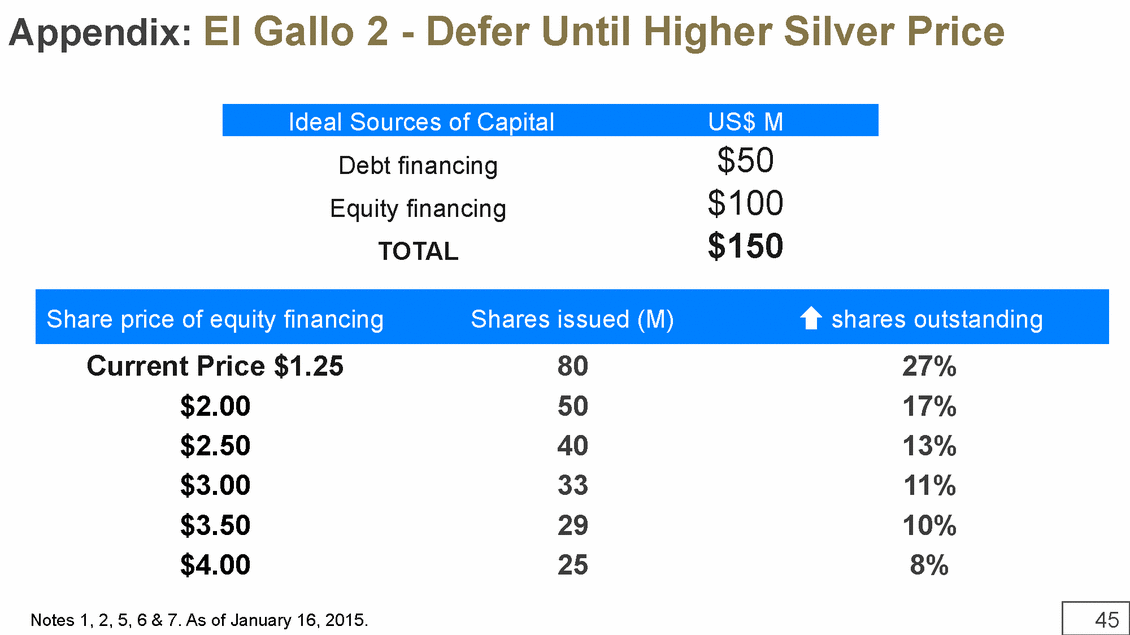
45 Appendix: El Gallo 2 - Defer Until Higher Silver Price Ideal Sources of Capital US$ M Debt financing $50 Equity financing $100 TOTAL $150 Share price of equity financing Shares issued (M) shares outstanding Current Price $1.25 80 27% $2.00 50 17% $2.50 40 13% $3.00 33 11% $3.50 29 10% $4.00 25 8% Notes 1, 2, 5, 6 & 7. As of January 16, 2015. |
|
|
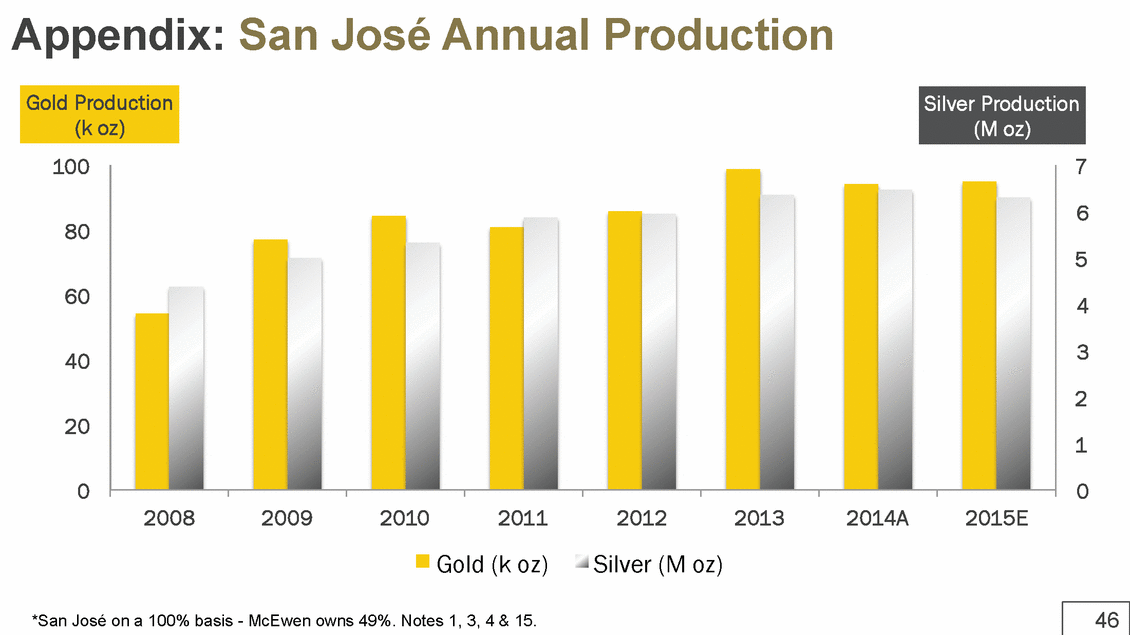
46 0 1 2 3 4 5 6 7 0 20 40 60 80 100 2008 2009 2010 2011 2012 2013 2014A 2015E Silver Production (M oz) Gold Production (k oz) Gold (k oz) Silver (M oz) Appendix: San José Annual Production *San José on a 100% basis - McEwen owns 49%. Notes 1, 3, 4 & 15. |
|
|
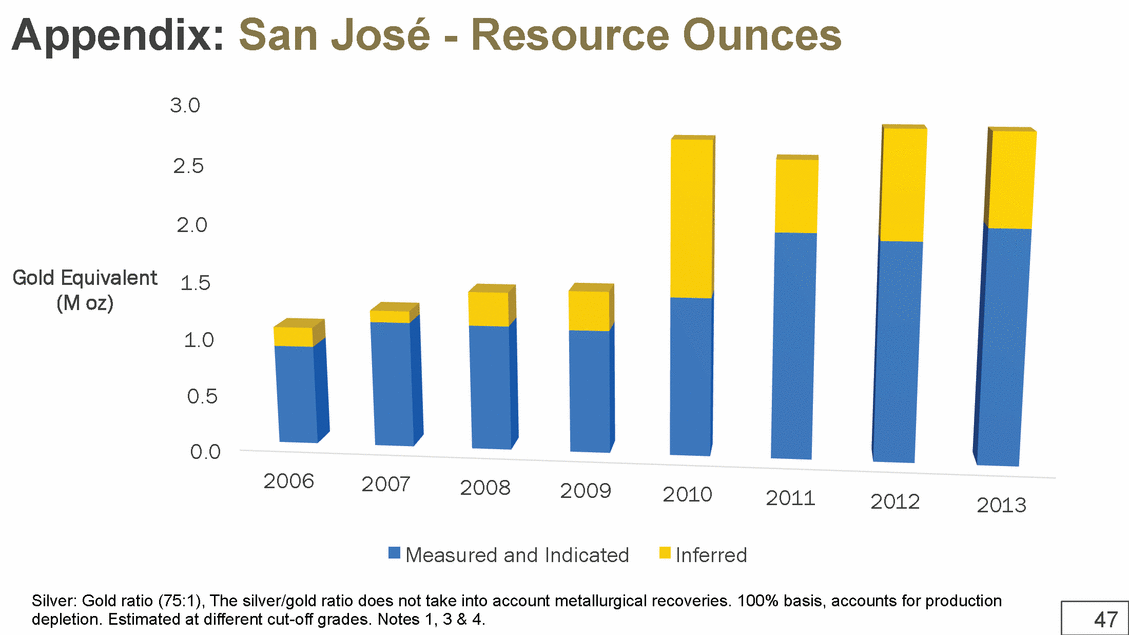
47 Appendix: San José - Resource Ounces Silver: Gold ratio (75:1), The silver/gold ratio does not take into account metallurgical recoveries. 100% basis, accounts for production depletion. Estimated at different cut-off grades. Notes 1, 3 & 4. 0.0 0.5 1.0 1.5 2.0 2.5 3.0 2006 2007 2008 2009 2010 2011 2012 2013 Gold Equivalent (M oz) Measured and Indicated Inferred |
|
|
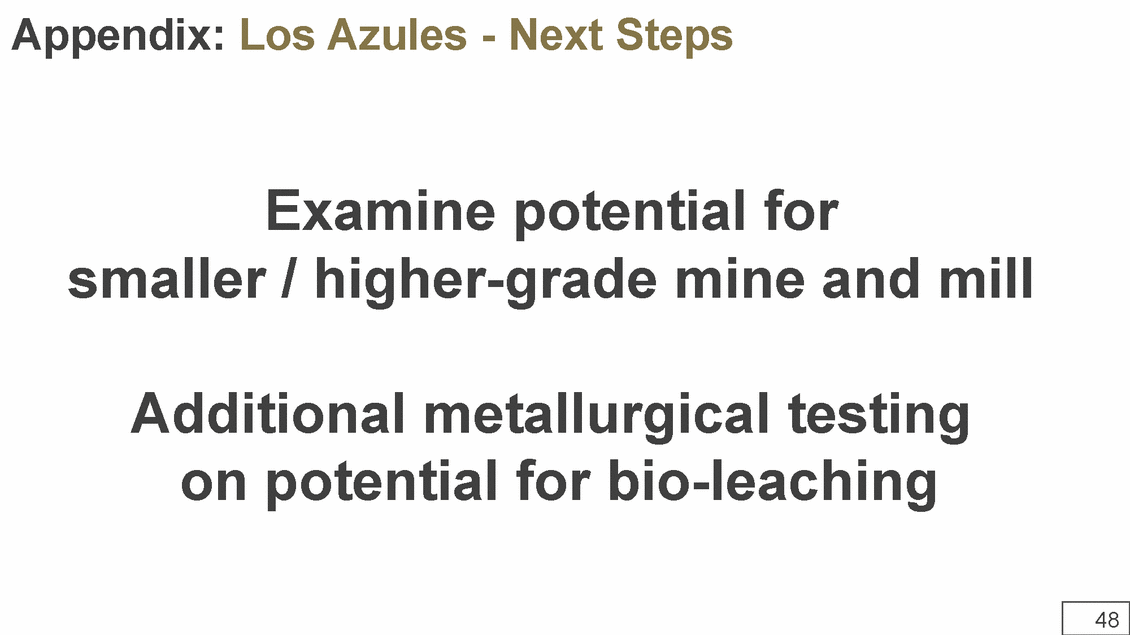
48 Appendix: Los Azules - Next Steps Examine potential for smaller / higher-grade mine and mill Additional metallurgical testing on potential for bio-leaching |
|
|
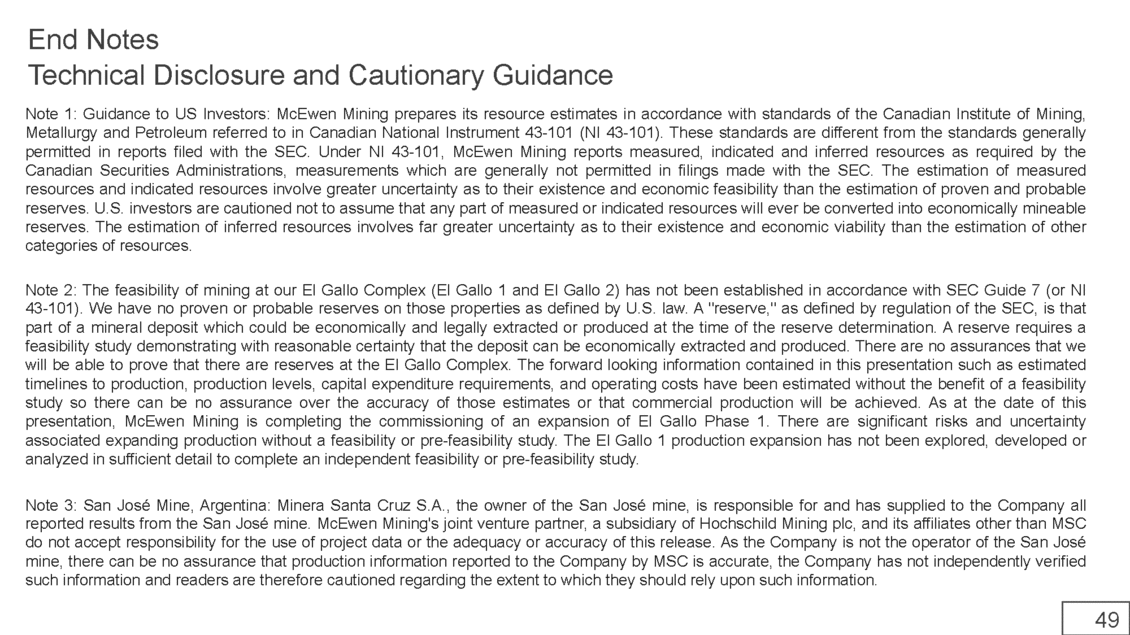
49 End Notes Note 1: Guidance to US Investors: McEwen Mining prepares its resource estimates in accordance with standards of the Canadian Institute of Mining, Metallurgy and Petroleum referred to in Canadian National Instrument 43-101 (NI 43-101). These standards are different from the standards generally permitted in reports filed with the SEC. Under NI 43-101, McEwen Mining reports measured, indicated and inferred resources as required by the Canadian Securities Administrations, measurements which are generally not permitted in filings made with the SEC. The estimation of measured resources and indicated resources involve greater uncertainty as to their existence and economic feasibility than the estimation of proven and probable reserves. U.S. investors are cautioned not to assume that any part of measured or indicated resources will ever be converted into economically mineable reserves. The estimation of inferred resources involves far greater uncertainty as to their existence and economic viability than the estimation of other categories of resources. Note 2: The feasibility of mining at our El Gallo Complex (El Gallo 1 and El Gallo 2) has not been established in accordance with SEC Guide 7 (or NI 43-101). We have no proven or probable reserves on those properties as defined by U.S. law. A "reserve," as defined by regulation of the SEC, is that part of a mineral deposit which could be economically and legally extracted or produced at the time of the reserve determination. A reserve requires a feasibility study demonstrating with reasonable certainty that the deposit can be economically extracted and produced. There are no assurances that we will be able to prove that there are reserves at the El Gallo Complex. The forward looking information contained in this presentation such as estimated timelines to production, production levels, capital expenditure requirements, and operating costs have been estimated without the benefit of a feasibility study so there can be no assurance over the accuracy of those estimates or that commercial production will be achieved. As at the date of this presentation, McEwen Mining is completing the commissioning of an expansion of El Gallo Phase 1. There are significant risks and uncertainty associated expanding production without a feasibility or pre-feasibility study. The El Gallo 1 production expansion has not been explored, developed or analyzed in sufficient detail to complete an independent feasibility or pre-feasibility study. Note 3: San José Mine, Argentina: Minera Santa Cruz S.A., the owner of the San José mine, is responsible for and has supplied to the Company all reported results from the San José mine. McEwen Mining's joint venture partner, a subsidiary of Hochschild Mining plc, and its affiliates other than MSC do not accept responsibility for the use of project data or the adequacy or accuracy of this release. As the Company is not the operator of the San José mine, there can be no assurance that production information reported to the Company by MSC is accurate, the Company has not independently verified such information and readers are therefore cautioned regarding the extent to which they should rely upon such information. Technical Disclosure and Cautionary Guidance |
|
|
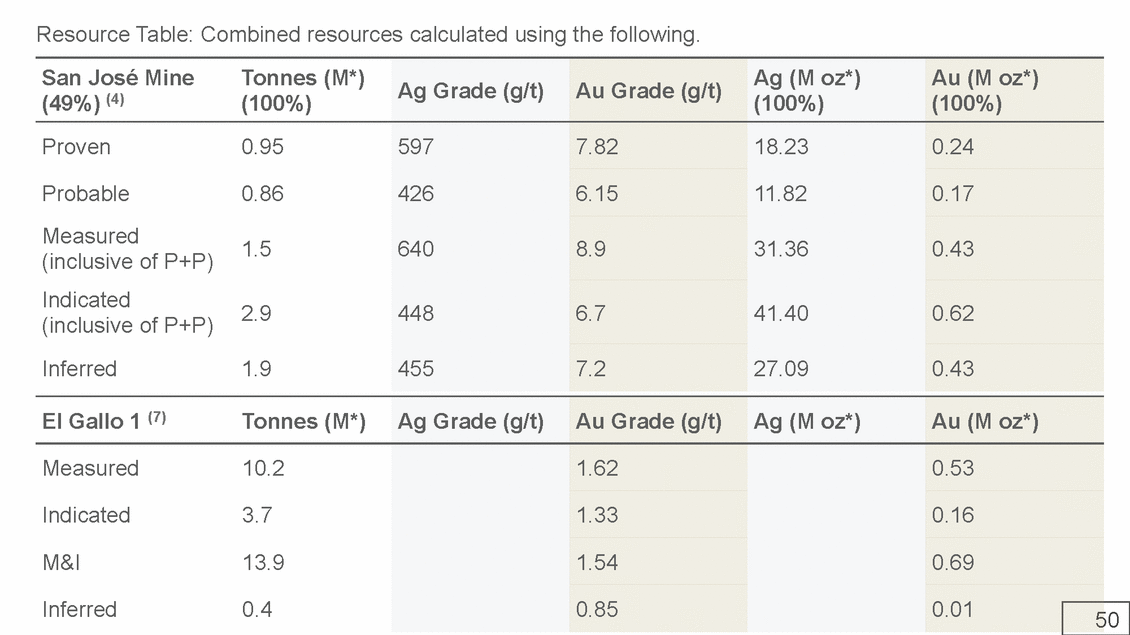
50 San José Mine (49%) (4) Tonnes (M*) (100%) Ag Grade (g/t) Au Grade (g/t) Ag (M oz*) (100%) Au (M oz*) (100%) Proven 0.95 597 7.82 18.23 0.24 Probable 0.86 426 6.15 11.82 0.17 Measured (inclusive of P+P) 1.5 640 8.9 31.36 0.43 Indicated (inclusive of P+P) 2.9 448 6.7 41.40 0.62 Inferred 1.9 455 7.2 27.09 0.43 Resource Table: Combined resources calculated using the following. El Gallo 1 (7) Tonnes (M*) Ag Grade (g/t) Au Grade (g/t) Ag (M oz*) Au (M oz*) Measured 10.2 1.62 0.53 Indicated 3.7 1.33 0.16 M&I 13.9 1.54 0.69 Inferred 0.4 0.85 0.01 |
|
|
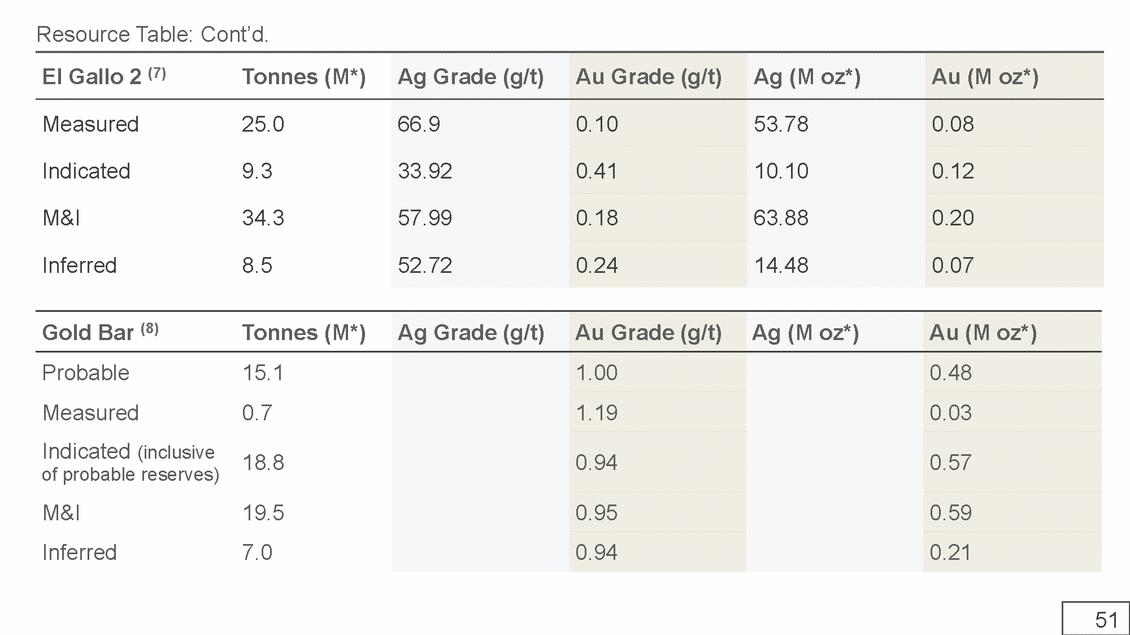
51 Gold Bar (8) Tonnes (M*) Ag Grade (g/t) Au Grade (g/t) Ag (M oz*) Au (M oz*) Probable 15.1 1.00 0.48 Measured 0.7 1.19 0.03 Indicated (inclusive of probable reserves) 18.8 0.94 0.57 M&I 19.5 0.95 0.59 Inferred 7.0 0.94 0.21 El Gallo 2 (7) Tonnes (M*) Ag Grade (g/t) Au Grade (g/t) Ag (M oz*) Au (M oz*) Measured 25.0 66.9 0.10 53.78 0.08 Indicated 9.3 33.92 0.41 10.10 0.12 M&I 34.3 57.99 0.18 63.88 0.20 Inferred 8.5 52.72 0.24 14.48 0.07 Resource Table: Cont’d. |
|
|
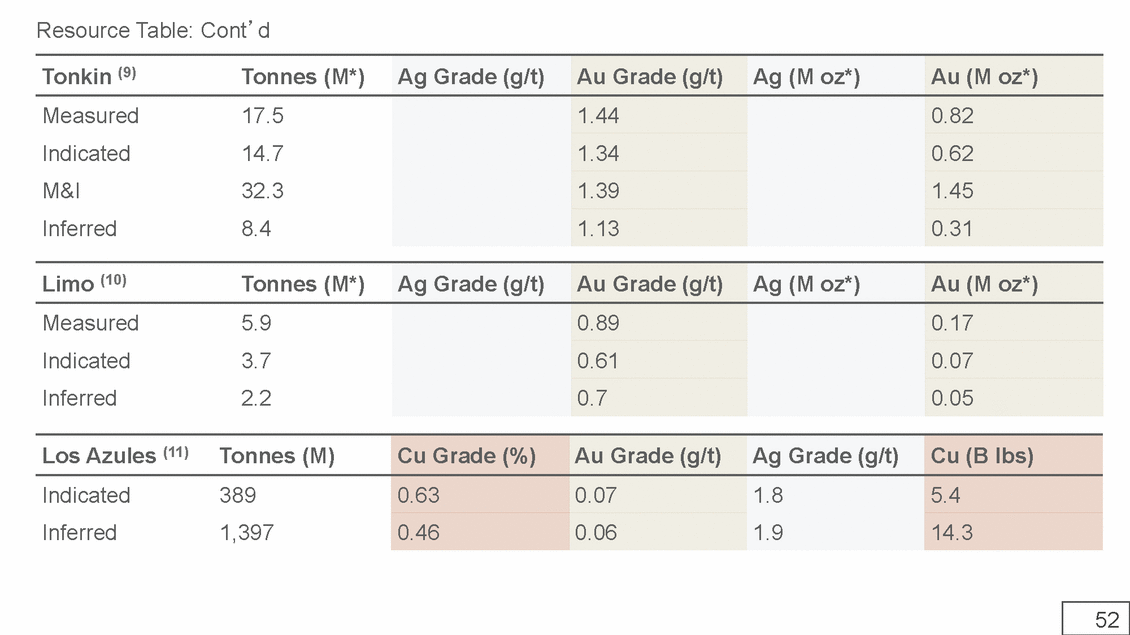
52 Los Azules (11) Tonnes (M) Cu Grade (%) Au Grade (g/t) Ag Grade (g/t) Cu (B lbs) Indicated 389 0.63 0.07 1.8 5.4 Inferred 1,397 0.46 0.06 1.9 14.3 Resource Table: Cont’d Limo (10) Tonnes (M*) Ag Grade (g/t) Au Grade (g/t) Ag (M oz*) Au (M oz*) Measured 5.9 0.89 0.17 Indicated 3.7 0.61 0.07 Inferred 2.2 0.7 0.05 Tonkin (9) Tonnes (M*) Ag Grade (g/t) Au Grade (g/t) Ag (M oz*) Au (M oz*) Measured 17.5 1.44 0.82 Indicated 14.7 1.34 0.62 M&I 32.3 1.39 1.45 Inferred 8.4 1.13 0.31 |
|
|
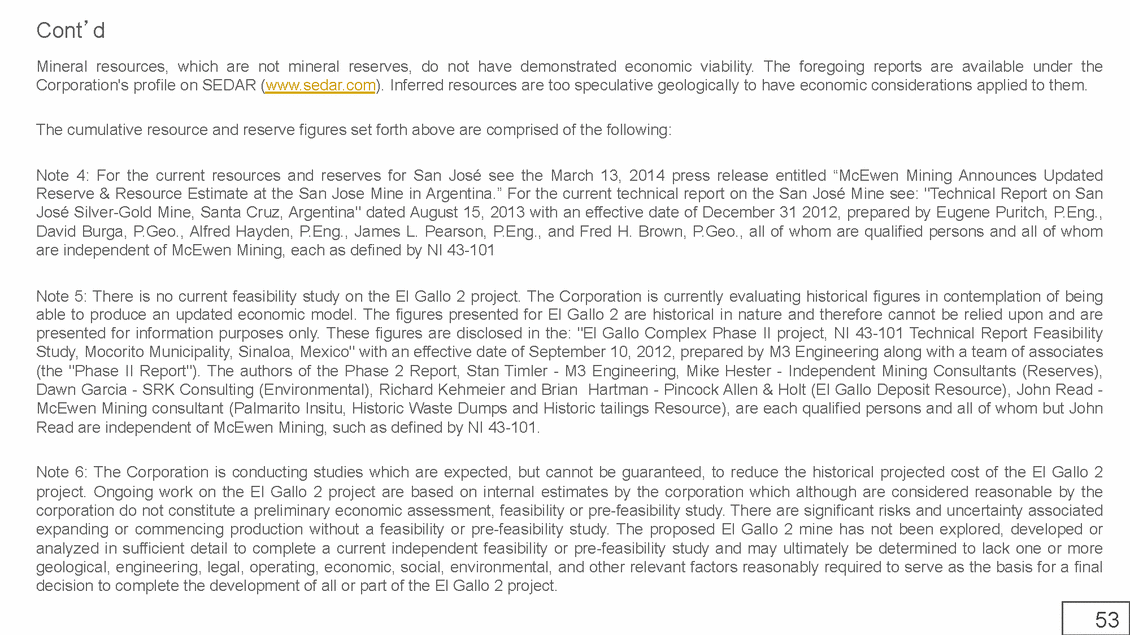
53 Mineral resources, which are not mineral reserves, do not have demonstrated economic viability. The foregoing reports are available under the Corporation's profile on SEDAR (www.sedar.com). Inferred resources are too speculative geologically to have economic considerations applied to them. The cumulative resource and reserve figures set forth above are comprised of the following: Note 4: For the current resources and reserves for San José see the March 13, 2014 press release entitled “McEwen Mining Announces Updated Reserve & Resource Estimate at the San Jose Mine in Argentina.” For the current technical report on the San José Mine see: "Technical Report on San José Silver-Gold Mine, Santa Cruz, Argentina" dated August 15, 2013 with an effective date of December 31 2012, prepared by Eugene Puritch, P.Eng., David Burga, P.Geo., Alfred Hayden, P.Eng., James L. Pearson, P.Eng., and Fred H. Brown, P.Geo., all of whom are qualified persons and all of whom are independent of McEwen Mining, each as defined by NI 43-101 Note 5: There is no current feasibility study on the El Gallo 2 project. The Corporation is currently evaluating historical figures in contemplation of being able to produce an updated economic model. The figures presented for El Gallo 2 are historical in nature and therefore cannot be relied upon and are presented for information purposes only. These figures are disclosed in the: "El Gallo Complex Phase II project, NI 43-101 Technical Report Feasibility Study, Mocorito Municipality, Sinaloa, Mexico" with an effective date of September 10, 2012, prepared by M3 Engineering along with a team of associates (the "Phase II Report"). The authors of the Phase 2 Report, Stan Timler - M3 Engineering, Mike Hester - Independent Mining Consultants (Reserves), Dawn Garcia - SRK Consulting (Environmental), Richard Kehmeier and Brian Hartman - Pincock Allen & Holt (El Gallo Deposit Resource), John Read - McEwen Mining consultant (Palmarito Insitu, Historic Waste Dumps and Historic tailings Resource), are each qualified persons and all of whom but John Read are independent of McEwen Mining, such as defined by NI 43-101. Note 6: The Corporation is conducting studies which are expected, but cannot be guaranteed, to reduce the historical projected cost of the El Gallo 2 project. Ongoing work on the El Gallo 2 project are based on internal estimates by the corporation which although are considered reasonable by the corporation do not constitute a preliminary economic assessment, feasibility or pre-feasibility study. There are significant risks and uncertainty associated expanding or commencing production without a feasibility or pre-feasibility study. The proposed El Gallo 2 mine has not been explored, developed or analyzed in sufficient detail to complete a current independent feasibility or pre-feasibility study and may ultimately be determined to lack one or more geological, engineering, legal, operating, economic, social, environmental, and other relevant factors reasonably required to serve as the basis for a final decision to complete the development of all or part of the El Gallo 2 project. Cont’d |
|
|
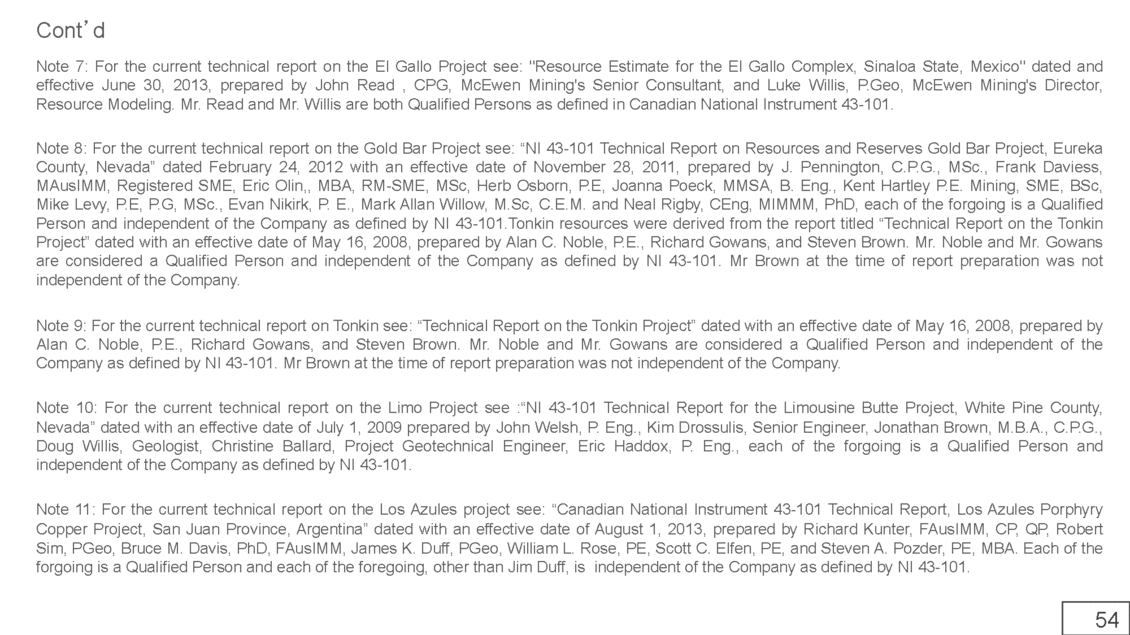
54 Note 7: For the current technical report on the El Gallo Project see: "Resource Estimate for the El Gallo Complex, Sinaloa State, Mexico" dated and effective June 30, 2013, prepared by John Read , CPG, McEwen Mining's Senior Consultant, and Luke Willis, P.Geo, McEwen Mining's Director, Resource Modeling. Mr. Read and Mr. Willis are both Qualified Persons as defined in Canadian National Instrument 43-101. Note 8: For the current technical report on the Gold Bar Project see: “NI 43-101 Technical Report on Resources and Reserves Gold Bar Project, Eureka County, Nevada” dated February 24, 2012 with an effective date of November 28, 2011, prepared by J. Pennington, C.P.G., MSc., Frank Daviess, MAusIMM, Registered SME, Eric Olin,, MBA, RM-SME, MSc, Herb Osborn, P.E, Joanna Poeck, MMSA, B. Eng., Kent Hartley P.E. Mining, SME, BSc, Mike Levy, P.E, P.G, MSc., Evan Nikirk, P. E., Mark Allan Willow, M.Sc, C.E.M. and Neal Rigby, CEng, MIMMM, PhD, each of the forgoing is a Qualified Person and independent of the Company as defined by NI 43-101.Tonkin resources were derived from the report titled “Technical Report on the Tonkin Project” dated with an effective date of May 16, 2008, prepared by Alan C. Noble, P.E., Richard Gowans, and Steven Brown. Mr. Noble and Mr. Gowans are considered a Qualified Person and independent of the Company as defined by NI 43-101. Mr Brown at the time of report preparation was not independent of the Company. Note 9: For the current technical report on Tonkin see: “Technical Report on the Tonkin Project” dated with an effective date of May 16, 2008, prepared by Alan C. Noble, P.E., Richard Gowans, and Steven Brown. Mr. Noble and Mr. Gowans are considered a Qualified Person and independent of the Company as defined by NI 43-101. Mr Brown at the time of report preparation was not independent of the Company. Note 10: For the current technical report on the Limo Project see :“NI 43-101 Technical Report for the Limousine Butte Project, White Pine County, Nevada” dated with an effective date of July 1, 2009 prepared by John Welsh, P. Eng., Kim Drossulis, Senior Engineer, Jonathan Brown, M.B.A., C.P.G., Doug Willis, Geologist, Christine Ballard, Project Geotechnical Engineer, Eric Haddox, P. Eng., each of the forgoing is a Qualified Person and independent of the Company as defined by NI 43-101. Note 11: For the current technical report on the Los Azules project see: “Canadian National Instrument 43-101 Technical Report, Los Azules Porphyry Copper Project, San Juan Province, Argentina” dated with an effective date of August 1, 2013, prepared by Richard Kunter, FAusIMM, CP, QP, Robert Sim, PGeo, Bruce M. Davis, PhD, FAusIMM, James K. Duff, PGeo, William L. Rose, PE, Scott C. Elfen, PE, and Steven A. Pozder, PE, MBA. Each of the forgoing is a Qualified Person and each of the foregoing, other than Jim Duff, is independent of the Company as defined by NI 43-101. Cont’d |
|
|
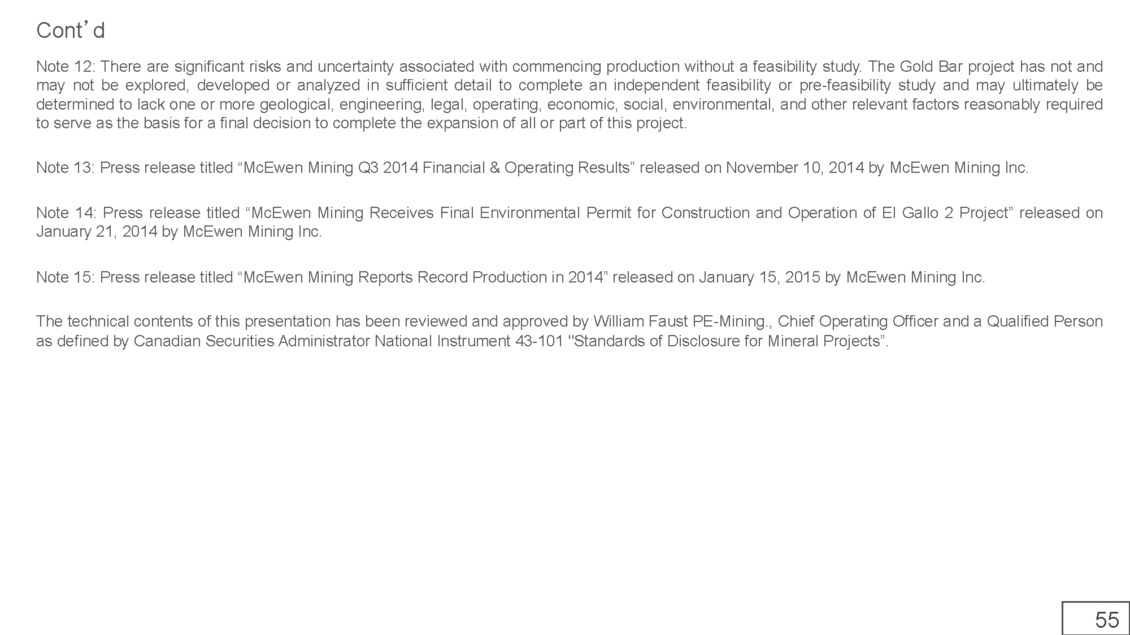
55 Note 12: There are significant risks and uncertainty associated with commencing production without a feasibility study. The Gold Bar project has not and may not be explored, developed or analyzed in sufficient detail to complete an independent feasibility or pre-feasibility study and may ultimately be determined to lack one or more geological, engineering, legal, operating, economic, social, environmental, and other relevant factors reasonably required to serve as the basis for a final decision to complete the expansion of all or part of this project. Note 13: Press release titled “McEwen Mining Q3 2014 Financial & Operating Results” released on November 10, 2014 by McEwen Mining Inc. Note 14: Press release titled “McEwen Mining Receives Final Environmental Permit for Construction and Operation of El Gallo 2 Project” released on January 21, 2014 by McEwen Mining Inc. Note 15: Press release titled “McEwen Mining Reports Record Production in 2014” released on January 15, 2015 by McEwen Mining Inc. The technical contents of this presentation has been reviewed and approved by William Faust PE-Mining., Chief Operating Officer and a Qualified Person as defined by Canadian Securities Administrator National Instrument 43-101 "Standards of Disclosure for Mineral Projects”. Cont’d |
|
|
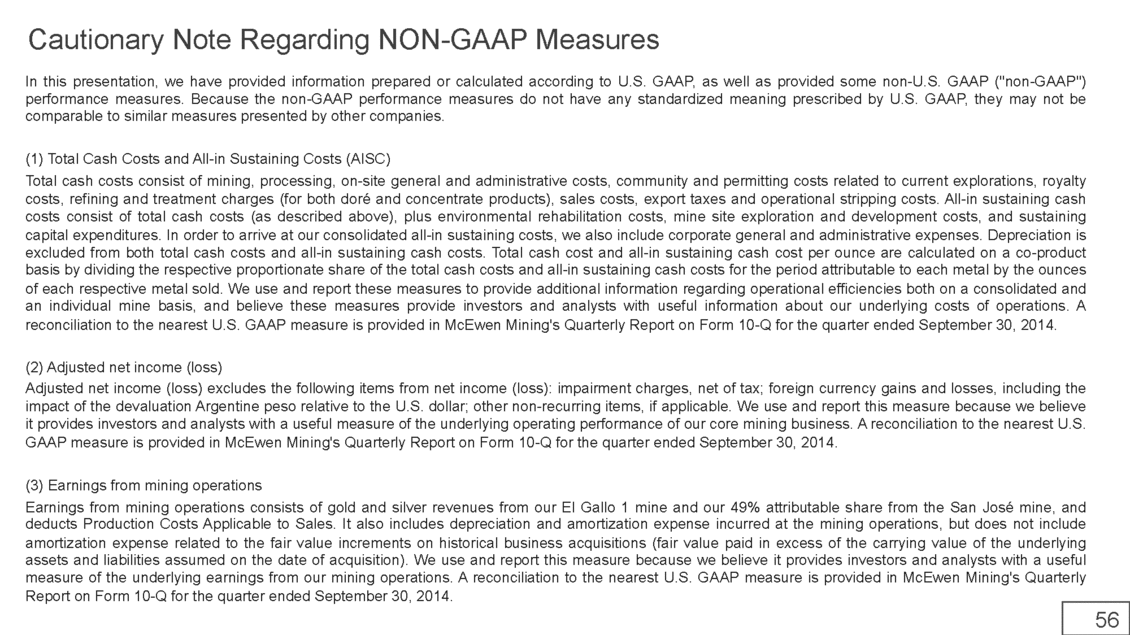
56 Cautionary Note Regarding NON-GAAP Measures In this presentation, we have provided information prepared or calculated according to U.S. GAAP, as well as provided some non-U.S. GAAP ("non-GAAP") performance measures. Because the non-GAAP performance measures do not have any standardized meaning prescribed by U.S. GAAP, they may not be comparable to similar measures presented by other companies. (1) Total Cash Costs and All-in Sustaining Costs (AISC) Total cash costs consist of mining, processing, on-site general and administrative costs, community and permitting costs related to current explorations, royalty costs, refining and treatment charges (for both doré and concentrate products), sales costs, export taxes and operational stripping costs. All-in sustaining cash costs consist of total cash costs (as described above), plus environmental rehabilitation costs, mine site exploration and development costs, and sustaining capital expenditures. In order to arrive at our consolidated all-in sustaining costs, we also include corporate general and administrative expenses. Depreciation is excluded from both total cash costs and all-in sustaining cash costs. Total cash cost and all-in sustaining cash cost per ounce are calculated on a co-product basis by dividing the respective proportionate share of the total cash costs and all-in sustaining cash costs for the period attributable to each metal by the ounces of each respective metal sold. We use and report these measures to provide additional information regarding operational efficiencies both on a consolidated and an individual mine basis, and believe these measures provide investors and analysts with useful information about our underlying costs of operations. A reconciliation to the nearest U.S. GAAP measure is provided in McEwen Mining's Quarterly Report on Form 10-Q for the quarter ended September 30, 2014. (2) Adjusted net income (loss) Adjusted net income (loss) excludes the following items from net income (loss): impairment charges, net of tax; foreign currency gains and losses, including the impact of the devaluation Argentine peso relative to the U.S. dollar; other non-recurring items, if applicable. We use and report this measure because we believe it provides investors and analysts with a useful measure of the underlying operating performance of our core mining business. A reconciliation to the nearest U.S. GAAP measure is provided in McEwen Mining's Quarterly Report on Form 10-Q for the quarter ended September 30, 2014. (3) Earnings from mining operations Earnings from mining operations consists of gold and silver revenues from our El Gallo 1 mine and our 49% attributable share from the San José mine, and deducts Production Costs Applicable to Sales. It also includes depreciation and amortization expense incurred at the mining operations, but does not include amortization expense related to the fair value increments on historical business acquisitions (fair value paid in excess of the carrying value of the underlying assets and liabilities assumed on the date of acquisition). We use and report this measure because we believe it provides investors and analysts with a useful measure of the underlying earnings from our mining operations. A reconciliation to the nearest U.S. GAAP measure is provided in McEwen Mining's Quarterly Report on Form 10-Q for the quarter ended September 30, 2014. |
|
|
57 Contact Information Director, Investor Relations 1.866.441.0690 x.410 info@mcewenmining.com facebook.com/mcewenrob twitter.com/mcewenmining Sheena Scotland |

