Attached files
| file | filename |
|---|---|
| 8-K - ORM 8-K - Owens Realty Mortgage, Inc. | form8k.htm |

Investor Presentation December 2014
IMPORTANT NOTICE: This presentation contains forward-looking statements, within the meaning of the safe harbor provisions of the United States Private Securities Litigation Reform Act of 1995 (the “Reform Act”). All such forward-looking statements are intended to be subject to the safe harbor and other protections provided by the Reform Act and applicable securities laws. The forward-looking statements included in this presentation reflect Owens Realty Mortgage, Inc.’s (“ORM’s”) current views about future events and are subject to numerous known and unknown risks, uncertainties, assumptions and changes in circumstances that may cause ORM’s actual results to differ significantly from those expressed in any forward-looking statement and, consequently, readers should not rely on these forward-looking statements as predictions of future events. Statements regarding the following subjects, among others, may be forward-looking: ORM’s business and investment strategy; projected dividend yields; ORM’s projected expenses and operating results; ORM’s projected capital expenditures and construction related expenses; economic, demographic, lending or real estate developments in ORM’s markets; early terminations of or non-renewal of leases by ORM’s tenants; ORM’s ability to obtain financing arrangements; general volatility of the markets in which ORM participates; construction progress and completion dates, permit, entitlement, zoning and other property related approvals, expected real estate planning and policies of city, county, state, and other regional municipalities, including zoning, land annexation, and building and development approvals, expected listing and sale dates, occupancy rates and dates, and marketability of ORM’s real estate assets; ORM’s ability to qualify and maintain ORM’s qualification as a REIT; market trends in ORM’s industry, including interest rates, real estate values, vacancy and absorption rates, lease rates, land, residential and commercial property statistics, regional population and income growth, or the general economy; and statements about ORM’s current expectations, plans, strategies, prospects, beliefs, targets, assumptions, and forecasts. Words such as “expect,” “target,” “assume,” “estimate,” “project,” “budget,” “forecast,” “anticipate,” “intend,” “approximate,” “plan,” “may,” “will,” “could,” “should,” “believe,” “predicts,” “potential,” “continue,” and similar expressions are intended to identify such forward-looking statements. Readers are cautioned not to place undue reliance upon any forward-looking statements, which speak only as of the date made. The Company does not guarantee the assumptions underlying such forward-looking statements and does not undertake or accept any obligation to release publicly any updates or revisions to any forward-looking statement to reflect any change in its expectations or any change in events, conditions or circumstances on which any such statement is based. Certain important factors that could cause actual results to differ materially from those contained in the forward-looking statements are included in our periodic reports filed with the Securities and Exchange Commission (“SEC”). Copies are available on the SEC’s website at www.sec.gov. Investors are encouraged to read the following presentation in conjunction with our periodic reports including, without limitation, the Risk Factors section in the Annual Report on Form 10-K for the year ended December 31, 2013. All subsequent written and oral forward-looking statements concerning the Company or matters attributable to the Company or any person acting on its behalf are expressly qualified in their entirety by the cautionary statements above. DISCLAIMERS: Pro Forma Dividend Yield The projected dividend yield in this presentation is meant to provide an estimated dividend yield range for informational purposes only and is not a forecast of expected results. The pro forma dividend represents annualized distributions of $1.70 to $1.95 per share, based on an average annualized loan investment rate of 8.50%, less projected 5.50% weighted average cost of capital, divided by a pro forma stock price of $20.00 per share. * Forward-Looking Statements and Other Disclaimers

MARKET STATISTICS MARKET STATISTICS Ticker (NYSE MKT) ORM Shares Outstanding1 10,768,001 Market Capitalization1 $161M Recent Share Price1 $14.98 Book Value per Common Share2 $16.93 Quarterly Dividend per Share3 $0.05 Total Assets2 $229M * As of November 21, 2014 As of quarter ending September 30, 2014 Q3 2014 dividend per common share

* Company Overview Owens Realty Mortgage, Inc. is a specialty finance company organized as a REIT that focuses on the origination, investment and management of small-balance and middle-market commercial real estate loans. We provide customized, short-term acquisition and transition capital to commercial real estate investors that require speed and flexibility. During recession, beginning in 2009, foreclosed on 50%+ of loan portfolio, LP redemptions and lending activity suspended. During recovery have repositioned and improved real estate assets, maximizing potential market value. In May 2013, ORM completed a reorganization into a publicly-traded REIT. Its predecessor, Owens Mortgage Investment Fund, a California LP, was formed in 1983 and became a SEC registered public filer in 1988. We are managed by Owens Financial Group, Inc., a specialized commercial real estate management company that has originated, serviced and managed alternative commercial real estate investments since 1951. Focused on converting real estate assets to new commercial real estate loans. Seasoned executive team and long-standing origination relationships.

* The Opportunity Unlock embedded NAV gains potential in real estate portfolio Objectives to convert real estate assets into cash, Grow loan portfolio, and Deliver consistent, attractive risk-adjusted yield to stockholders REIT tax rules Growth in demand for commercial real estate and restricted ability of banks to lend has created favorable market conditions CRE fundamentals improving Wall of CRE loan maturities from 2003-2007 Increased demand for transitional capital Increased demand for speed Regulatory environment limiting the lending capacity of banks and other traditional capital sources Investment Opportunity ORM trading at discount to book value and NAV Balance sheet transition beginning in May 2015 Committed to growing dividends

* Transaction Platform Experience and business model a competitive advantage Experienced Management Team – 50 years Flexible and Creative Investment Structures Strong Brand Recognition in Small Balance Bridge Market Strong Relationships Fast Funding Capabilities Direct Origination & Servicing Owens Competitive Advantage

Owens competes primarily in the Small Balance Commercial Lending market ($500K - $10M) but also lends in the Middle-Market ($10M - $50M) Although catching attention, market is still under-served and funding gap exists for SBC and Middle Market Higher yields asymmetrical with risk vs. middle and large market CRE lending * Source: Boxwood Means, Inc., April 2014 Small Balance Commercial (SBC) Market

* Source: Boxwood Means, Inc., April 2014 Fragmented and inefficient market opportunity to be exploited The top 15 lenders command only 23% total production in 2013 No dominant national lenders with large market shares Strong demand from credit-worthy sponsors Small balance commercial (SBC) loan originations (under $5M in value) topped $175B in 2013 Property sales continue at an accelerated space National SBC market mimics overall CRE market fundamentals Small Balance Commercial (SBC) Market

* CRE prices are recovering from recessionary lows – macro fundamentals and lack of new supply Overall prices are off by a third from peak levels but 5% above trough, experiencing a positive trend Limited lending capacity of banks in CRE market creating opportunities for alternative lenders Caused by increased bank regulation and over-leveraged balance sheets Total CRE loans at FDIC-insured banks fell 24% A significant proportion of CRE loans originated from 2003-2007 are maturing every year, creating opportunities for new originations $1.5T estimated loans maturing through 2018 Commercial Real Estate (CRE) Market
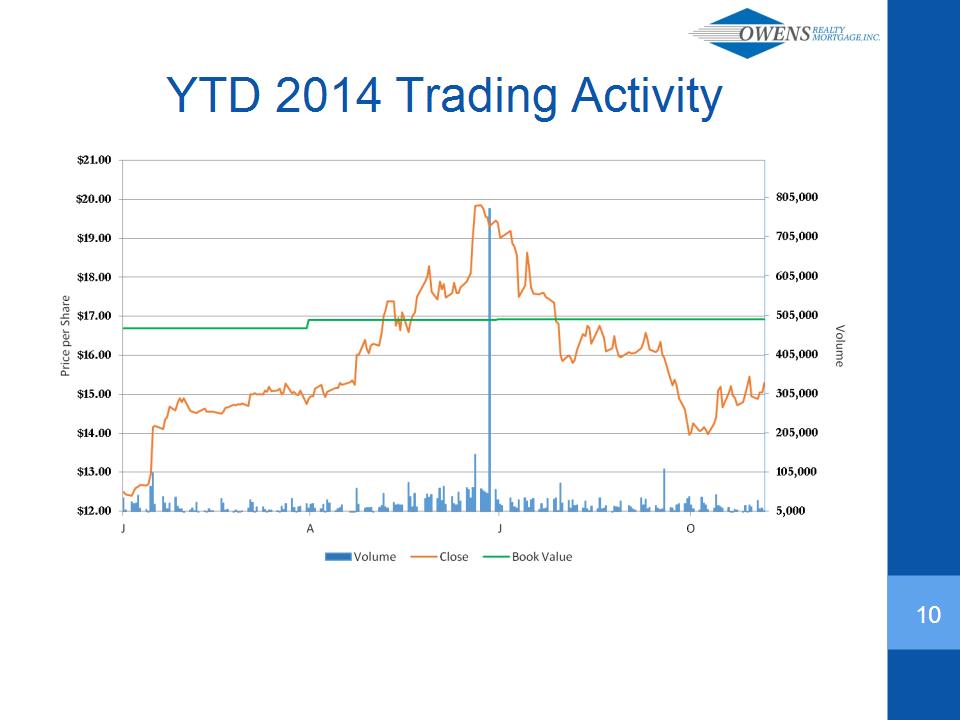
* YTD 2014 Trading Activity
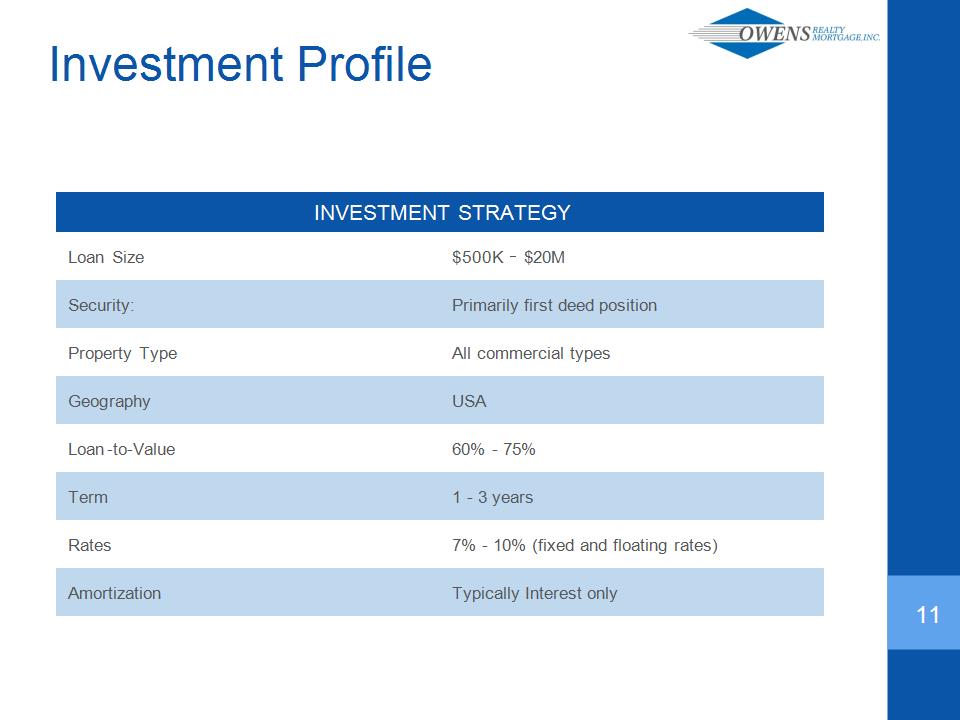
* INVESTMENT STRATEGY INVESTMENT STRATEGY Loan Size $500K ‐ $20M Security: Primarily first deed position Property Type All commercial types Geography USA Loan-to-Value 60% – 75% Term 1 – 3 years Rates 7% - 10% (fixed and floating rates) Amortization Typically Interest only Investment Profile

* Sample Transaction: University Plaza, Santa Clara CA $5.85M first position trust deed 8.0% interest only loan 2-year term 73% LTV 51,978 SF Retail over Office Acquisition bridge financing required 3 week close Strong sponsor, direct origination through relationship
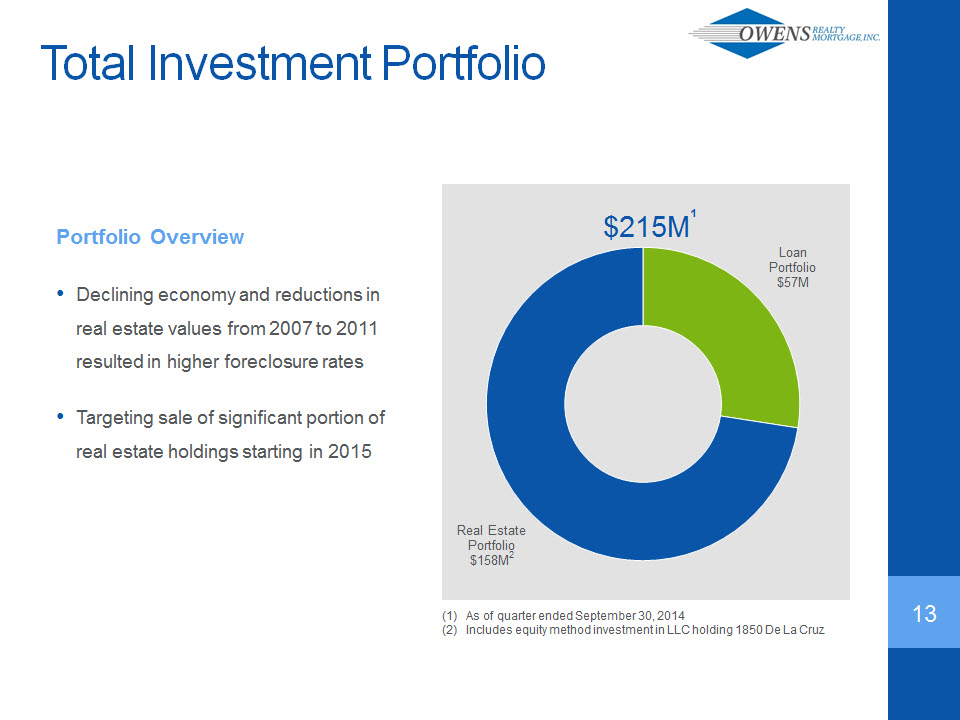
Total Investment Portfolio Portfolio Overview • Declining economy and reductions in real estate values from 2007 to 2011 resulted in higher foreclosure rates • Targeting sale of significant portion of real estate holdings starting in 2015 Loan Portfolio $57M Real Estate Portfolio $158M2 (1) As of quarter ended September 30, 2014 (2) Includes equity method investment in LLC holding 1850 De La Cruz

* California: 72% Washington: 3% Pennsylvania: 7% Hawaii: 2% Oregon: 2% Arizona: 12% Louisiana: 2% Diversified portfolio, with main focus in Western U.S. GEOGRAPHY Loan Portfolio $62M¹ As of quarter ended September 30, 2014

Loan Portfolio $62M¹ Property Type Land 3% Residential 26% Commercial 71% Position Junior loans 10% Senior Loans 90% (1) As of quarter ended September 30, 2014 (2) The junior loans in our portfolio at September 30, 2014 are junior to existing senior loans held by us and are secured by the same collateral.

* Commercial Loans by Property Type ($44M outstanding) (1) As of quarter ended September 30, 2014 Loan Portfolio $62M¹

Real Estate Portfolio 29 Properties1 Other 5% Storage, 2% Industrial, 3% Office, 6% Retail, 10% Condos, 30% Land (including developments), 44% $224M2 Tax Basis $156M2 GAAP Book Value (1) Total properties does not include book value of equity investment in 1850 De La Cruz, LLC (2) As of quarter ended September 30, 2014.

* (1) As of quarter ended September 30, 2014 Chateau at Lake Tahoe Commercial Retail and Residential Project1 Book Value: $51.9 million Tax Basis: $63.5 million Financing: $3.8 million South Lake Tahoe, CA 11.5 acre resort property, prime location at Stateline within close proximity to the Heavenly Valley ski resort gondola, and Harvey’s and Harrah’s casinos, and the new Hard Rock Hotel & Casino scheduled to open in 2015. Project entitled for 477 hospitality/residential units and 58,000 SF of retail. Prior to foreclosure approx. $100+ million and many years invested in the acquisition, entitlement process and initial foundation infrastructure. Transitional property – construction substantially complete of approx. 30,255 RSF of commercial retail space Expect to list property for sale in Q4 2014

* (1) As of quarter ended September 30, 2014 (2) Consists of a loan of up to $13 million secured by the Pointe tower, closed on November 17, 2014,and construction financing secured, subject to certain post-closing conditions, by TOTB, North, LLC of up to $21.3 million for the redevelopment of the north tower. $993,000 outstanding loan balance as of September 30, 2014. Treasures On The Bay Book Value: $34 million Tax Basis: $33 million Financing: $13,993,0002 Fractured condo conversion; apartment complex built between 1962 and 1966, consists of three, 10-story residential towers with 498 total units located on Treasure Island in Biscayne Bay in between Miami Beach and downtown Miami. ORM owns 329 units totaling approx. 328,792 of RSF. Pointe Tower: located on the southern point of Treasure Island, own 154 units (of 178) totaling approx. 162,740 RSF. Floor plans (Units) - 1/1 (100) and 2/2 (54) with avg. 970 RSF per unit. Renovated 2005-2007 South Tower: middle building, own 15 units (of 160) totaling approx. 18,052 RSF. Floor plans (Units) - 1/1 (1), 2/1 (1), 2/2 (3), and 3/2 (10) units with avg. 1,200 RSF per unit. Renovated 2005-2007 North Tower: northernmost building, own all 160 units totaling approx. 148,000 RSF. Floor plans (Units) - 1/1 (93), 2/1 (9), 2/2 (48), and 3/2 (10) with avg. 923 RSF per unit. Extensive renovation project commenced in July 2014; estimate total cap ex of $22 million and anticipate completion in Q4 2015. Fractured Condo Conversion Complex1 North Bay Village, FL

* As of quarter ended September 30, 2014 University Square 23.14 acre grocery-anchored community shopping center located at the northeast corner of US Highway 34 and 11th Ave, within ½ mile of University of Northern Colorado 242,000 RSF 4-building, Class C property built between 1971 and 2003 consists of 39 retail units, anchored by long-term lease with 47,000 RSF grocery store, King Soopers. Currently in contract to sell in May 2015 for $21.0 million Retail Shopping Center1 Book Value: $11.5 million Tax Basis: $10.7 million Financing: $9.8 million Greeley, CO

* Strategy Back to Basics Execution → Simplifying Balance Sheet and Increasing Income Liquidate Real Estate Assets Grow Loan Portfolio Lower Cost of Capital and Create Value Through Prudent Use of Leverage Consistently Deliver Attractive Dividend Yields Improving CRE market conditions Increasing demand for transitional assets Complete improvement/redevelopment projects REIT tax rules Leverage management domain experience, brand identity, and origination platform Focus on new investment originations Reduce non-performing loans Improve balance sheet ratios Lower cost and improved capital terms Prudent leverage of up to 1x stockholder’s equity, providing opportunity to deliver attractive returns Committed to increasing dividends as income increases Average yield 1989 – 2007 ~ 8.40%1 Pro forma dividend yield ~ 8.50% - 9.50%2 Based upon annual income distributions to investors from 1989 through 2007 divided by year end book capital and averaged over applicable period. The average dividend from 2008 through 2012 was 2.70% Constitutes forward-looking information. Actual future dividend yields could vary significantly from the pro forma projection presented. See Forward-Looking Statements and Other Disclaimers disclosure on page 1

* Investment Highlights Growth in demand for commercial real estate and restricted ability of banks to lend has created favorable market conditions Predecessor company had been in business over 30 years with a strong track record Experienced management with in-depth knowledge of target geographies and longstanding deal flow relationships Embedded gains in physical asset portfolio Poised to ramp up commercial lending activities Improved balance sheet provides opportunity to increase leverage on attractive terms Committed to increasing dividends as income increases

* Appendix

Pre-2008 2008 - 2012 2013 CORPORATE PORTFOLIO Timeline * Average dividend yield of 8.40%¹ Deployed up to $160M annually Completed conversion to a Maryland REIT Started trading on the NYSE MKT Entered into stock repurchase plan to purchase $7 M or 5% of shares outstanding Completed full or partial sale of six real estate properties Merger between Owens Mortgage Investment Fund and Owens Realty Mortgage Predecessor company, Owens Mortgage Investment Fund, a CA LP, in business for 35 years 50%+ of portfolio foreclosed Based upon annual income distributions to investors from 1989 through 2007 divided by year end book capital and averaged over applicable period. Based upon annual income distributions to investors from 2008 through 2012 divided by year end book capital and averaged over applicable period. Average dividend yield of 2.70%²

2014 2015 2016 CORPORATE PORTFOLIO * Initiate sale of real estate properties that offer net taxable gain Ramping up commercial lending to small balance and middle market investors Secured up to $74M in bank debt financing Rebuilding capital resources through asset sales Plan to grow interest revenue Anticipate completion of initial retail portion of the Chateau Development Project in South Lake Tahoe, CA Completed repurchase of 430,118 shares or 3.80% of shares outstanding at $12.44 average price per share Renovation of TOTB Miami, FL expected to begin in 2014 for completion in 2015 Timeline

* Financing California Bank & Trust Secured in February 2014 Revolving line of credit of up to $20M Two year term CB&T prime rate + 25bp Opus Bank Secured in April 2014 Revolving line of credit of up to $20M Two year draw period; Repayment due in 2017 6 month LIBOR + 400bp (4.50% floor) Bank of the Ozarks Secured in June 2014 Construction loan of up to approximately $21.3M Three year term 3 month LIBOR + 400bp (4.50% floor) Bank of the Ozarks Secured in November 2014 Term loan of up to approximately $13.0M Three year term 3 month LIBOR + 400bp (4.25% floor)

* Real Estate Portfolio Summary As of September 30, 2014 Properties Property Type Location Book Value Tax Basis 2013 NOI YTD 2014 NOI Property Listing Date Land Chateau at Lake Tahoe Retail/Residential/Hospitality Land South Lake Tahoe, CA $51,855,000 $63,461,568 $17,861 ($27,461) Q4 2014 Saddle Ridge Parcel Unimproved Land Gypsum, CO $5,813,434 $18,249,311 ($156,019) ($158,616) Q4 2014 Baldwin Ranch Lots Finished Residential Lots Auburn, CA $3,878,544 $17,565,143 ($92,225) ($80,544) 2017 Oakley Parcel Unimproved Residential Land Oakley, CA $2,334,773 $2,334,773 n/a ($10,234) Q3 2016 Piercy Road Parcel Unimproved Industrial Land San Jose, CA $1,958,400 $3,025,992 ($114,038) ($91,707) Q1 2018 Half Moon Bay Parcel Unimproved Commercial Land Half Moon Bay, CA $1,468,800 $2,302,055 ($19,047) ($14,254) Held for Sale Brighton Village Lots Unimproved Residential Land Coolidge, AZ $1,017,600 $2,082,348 $5,480 $7,836 Q1 2018 Chowchilla Parcel Unimproved Residential Land Chowchilla, CA $726,580 $5,911,207 ($17,325) ($15,085) Q1 2018 Art on R Parcel Unimproved Residential Land Olivehurst, CA $403,200 $1,200,805 ($7,407) ($5,247) Q1 2018 The Rivers Lot Finished Residential Lot West Sacramento, CA $58,560 $310,641 ($9,864) ($6,498) Held for Sale DarkHorse Parcel Unimproved Residential Land Auburn, CA $103,198 $0 ($1,026) $1,354 Q1 2018 Coeur d' Alene Lots Unimproved Residential Land Coeur d'Alene, ID $316,800 $2,275,896 ($8,313) ($10,496) Q1 2018 Total Land 12 $69,934,889 $118,719,741 ($401,923) ($410,953) Residential Treasures on the Bay Condos Miami, FL $33,820,493 $32,982,934 $925,607 $907,165 Q3-Q4 2015 Solstice at Arcadia Condos Phoenix, AZ $6,824,260 $14,707,299 $320,278 $296,633 Q3 2015 The Pointe at Lake Steilacoom Condos Lakewood, WA $4,401,014 $6,301,365 $253,129 $194,002 Q4 2015 Broadway & Commerce Condos/Office/Retail Tacoma, WA $2,420,792 $3,483,909 $93,232 $74,780 Q4 2015 The Shores Single Family Residence Lincoln City, OR $93,647 $95,854 ($6,490) ($8,541) Held for Sale Total Residential 5 $47,560,206 $57,571,362 $1,585,756 $1,464,039 Commercial Auburn Valley Golf Course Golf Course Auburn, CA $2,011,685 $2,176,496 ($66,224) $21,236 Held for Sale Wolfe Road Industrial Sunnyvale, CA $3,049,999 $3,180,342 $486,129 $364,431 Q1 2017 Paso Robles Industrial Complex Light Industrial Paso Robles, CA $1,466,542 $1,479,585 $196,158 $177,653 Q1 2017 Piper Point Marina Marina Bethel Island, CA $1,151,931 $1,152,933 n/a ($22,012) Q1 2015 Brannan Island Marina Marina Isleton, CA $2,035,036 $2,035,037 ($36,454) $16,765 Q3 2015 The Last Resort & Marina Marina Oakley, CA $236,500 $626,075 ($22,464) ($16,174) Held for Sale Harbor Shores Medical Plaza II Office Gilbert, AZ $4,743,494 $9,112,191 $189,032 $88,671 Q4 2014 Pico Ranch Complex Office Roseville, CA $3,715,657 $7,494,187 $63,839 $80,383 Q1 2018 Melody Hills Business Park Office Roseville, CA $740,698 $748,504 $45,631 $33,493 Q4 2016 University Square Retail Greeley, CO $11,534,319 $10,686,666 $1,142,180 $835,227 Held for Sale K Street Retail/Office Sacramento, CA $3,890,968 $3,890,958 ($67,207) ($72,698) Q1 2015 Outback Storage Self-Storage Stockton, CA $3,871,858 $5,219,575 $388,107 $302,664 Q1 2015 Total Commercial 12 $38,448,688 $47,802,548 $2,318,727 $1,809,637 Total 29 $155,943,783 $224,093,650 $3,502,560 $2,862,723 1850 De La Cruz (investment in LLC) Industrial Building/Land Santa Clara, CA $2,184,939 $2,915,983 $161,000 $126,000 Q1 2015 Total inc. 1850 De La Cruz 30 $158,128,722 $227,009,632 $3,663,560 $2,988,723