Attached files
| file | filename |
|---|---|
| 8-K - FORM 8-K - FURMANITE CORP | form8-kq32014earnings.htm |
| EX-99.1 - EXHIBIT 99.1 - FURMANITE CORP | q32014exhibit991.htm |

Furmanite Corporation QUARTER AND NINE MONTHS ENDED SEPTEMBER 30, 2014 Charles R. Cox, Chief Executive Officer Joseph E. Milliron, President & COO Robert S. Muff, Chief Financial Officer

Certain of the Company’s statements in this presentation are not purely historical, and as such are “forward-looking statements” within the meaning of the Private Securities Litigation Reform Act of 1995. These include statements regarding management’s plans, beliefs, expectations, intentions or projections of the future. Forward-looking statements involve risks and uncertainties, including without limitation, the various risks inherent in the Company’s business, and other risks and uncertainties detailed most recently in this presentation and the Company’s Form 10-K as of December 31, 2013 filed with the Securities and Exchange Commission. One or more of these factors could affect the Company’s business and financial results in future periods, and could cause actual results to differ materially from plans and projections. There can be no assurance that the forward-looking statements made in this presentation will prove to be accurate, and issuance of such forward-looking statements should not be regarded as a representation by the Company, or any other person, that the objectives and plans of the Company will be achieved. All forward-looking statements made in this presentation are based on information presently available to management, and the Company assumes no obligation to update any forward-looking statements. 2

Furmanite Corporation QUARTER AND NINE MONTHS ENDED SEPTEMBER 30, 2014 Financial Review Robert S. Muff, Chief Financial Officer 3

Condensed Consolidated Income Statements (Amounts in 000s except percentages and per-share amounts) (Unaudited) 4 For the Three Months Ended For the Nine Months Ended September 30, September 30, 2014 2013 Change 2014 2013 Change Revenues $ 124,129 $ 99,523 $ 24,606 $ 395,312 $ 296,937 $ 98,375 Operating costs 94,256 71,851 22,405 298,130 206,279 91,851 Depreciation and amortization expense 3,168 2,724 444 9,145 8,232 913 Selling, general and administrative expense¹ 24,426 20,501 3,925 74,936 62,277 12,659 Operating income 2,279 4,447 (2,168) 13,101 20,149 (7,048) Interest and other income (expense), net (296) (797) 501 (1,794) (1,205) (589) Income before income taxes 1,983 3,650 (1,667) 11,307 18,944 (7,637) Income tax expense (921) (1,530) 609 (4,722) (7,499) 2,777 Net income $ 1,062 $ 2,120 $ (1,058) $ 6,585 $ 11,445 $ (4,860) Diluted earnings per share $ 0.03 $ 0.06 $ (0.03) $ 0.17 $ 0.30 $ (0.13) Weighted-average number of common and common equivalent shares used in computing earnings per common share: Basic 37,659 37,431 37,615 37,392 Diluted 37,905 37,715 37,856 37,586 ¹ Includes $0.3 million and $0.5 million of direct costs associated with management transition and integration of the Furmanite Technical Solutions division for three and nine months ended September 30, 2014, respectively, and approximately $0.1 million of such costs for both the three and nine months ended September 30, 2013. In addition, both the three and nine months ended September 30, 2014 include approximately $0.9 million of non-recurring, incremental retirement-related executive compensation costs.

Consolidating Income Statements (Amounts in 000s except percentages) (Unaudited) 5 For the Three Months Ended For the Three Months Ended September 30, 2014 September 30, 2013 Technical Services Engineering & Project Solutions Corporate¹ Total Technical Services Engineering & Project Solutions Corporate¹ Total Revenues $ 85,762 $ 38,367 $ – $ 124,129 $ 84,915 $ 14,608 $ – $ 99,523 Operating costs 59,417 34,839 – 94,256 58,063 13,788 – 71,851 % of revenues 69.3% 90.8% 75.9% 68.4% 94.4% 72.2% Depreciation and amortization expense 2,502 489 177 3,168 2,354 238 132 2,724 % of revenues 2.9% 1.3% 2.6% 2.8% 1.6% 2.7% Selling, general and administrative expense² 16,011 2,904 5,511 24,426 15,851 811 3,839 20,501 % of revenues 18.7% 7.6% 19.7% 18.6% 5.6% 20.6% Operating income (loss) 7,832 135 (5,688) 2,279 8,647 (229) (3,971) 4,447 % of revenues 9.1% 0.3% 1.8% 10.2% -1.6% 4.5% Interest and other income (expense), net (296) (797) Income before income taxes 1,983 3,650 Income tax expense (921) (1,530) Net income $ 1,062 $ 2,120 ¹ Corporate represents certain corporate overhead costs, including executive management, strategic planning, treasury, legal, human resources, information technology, accounting and risk management, which are not allocated to reportable segments. ² The Engineering & Project Solutions segment includes approximately $0.3 million of direct costs associated with management transition and integration of the Furmanite Technical Solutions division for three months ended September 30, 2014 and approximately $0.1 million of such costs for the three months ended September 30, 2013. Corporate includes approximately $0.9 million of non-recurring, incremental retirement-related executive compensation costs for the three months ended September 30, 2014.

Consolidating Income Statements (Amounts in 000s except percentages) (Unaudited) 6 For the Nine Months Ended For the Nine Months Ended September 30, 2014 September 30, 2013 Technical Services Engineering & Project Solutions Corporate¹ Total Technical Services Engineering & Project Solutions Corporate¹ Total Revenues $ 279,801 $ 115,511 $ – $ 395,312 $ 272,622 $ 24,315 $ – $ 296,937 Operating costs 191,333 106,797 – 298,130 183,440 22,839 – 206,279 % of revenues 68.4% 92.4% 75.4% 67.3% 93.9% 69.5% Depreciation and amortization expense 7,225 1,453 467 9,145 7,214 538 480 8,232 % of revenues 2.6% 1.3% 2.3% 2.6% 2.2% 2.8% Selling, general and administrative expense² 51,462 8,473 15,001 74,936 46,985 1,133 14,159 62,277 % of revenues 18.4% 7.3% 19.0% 17.2% 4.7% 21.0% Operating income (loss) 29,781 (1,212) (15,468) 13,101 34,983 (195) (14,639) 20,149 % of revenues 10.6% -1.0% 3.3% 12.8% -0.8% 6.7% Interest and other income (expense), net (1,794) (1,205) Income before income taxes 11,307 18,944 Income tax expense (4,722) (7,499) Net income $ 6,585 $ 11,445 ¹ Corporate represents certain corporate overhead costs, including executive management, strategic planning, treasury, legal, human resources, information technology, accounting and risk management, which are not allocated to reportable segments. ² The Engineering & Project Solutions segment includes approximately $0.5 million of direct costs associated with management transition and integration of the Furmanite Technical Solutions division for nine months ended September 30, 2014 and approximately $0.1 million of such costs for the nine months ended September 30, 2013. Corporate includes approximately $0.9 million of non-recurring, incremental retirement-related executive compensation costs for the nine months ended September 30, 2014.

Revenues Adjusted for Currency Rates 2014 amounts at 2013 exchange rates (Amounts in 000s except percentages) (Unaudited) 7 For the Three Months Ended For the Nine Months Ended September 30, September 30, 2014 2013 Change % Change 2014 2013 Change % Change Technical Services revenues Americas $ 49,619 $ 52,153 $ (2,534) -5% $ 165,792 $ 177,553 $ (11,761) -7% EMEA 24,258 24,984 (726) -3% 81,701 69,983 11,718 17% Asia-Pacific 11,885 7,778 4,107 53% 32,308 25,086 7,222 29% Total Technical Services revenues 85,762 84,915 847 1% 279,801 272,622 7,179 3% Engineering & Project Solutions revenues 38,367 14,608 23,759 115,511 24,315 91,196 Total revenues $ 124,129 $ 99,523 $ 24,606 25% $ 395,312 $ 296,937 $ 98,375 33% Currency adjusted revenues: Americas $ 49,684 $ 52,153 $ (2,469) -5% $ 166,030 $ 177,553 $ (11,523) -6% EMEA 23,183 24,984 (1,801) -7% 77,657 69,983 7,674 11% Asia-Pacific 11,604 7,778 3,826 49% 33,387 25,086 8,301 33% Total currency adjusted Technical Services revenues 84,471 84,915 (444) -1% 277,074 272,622 4,452 2% Engineering & Project Solutions revenues 38,367 14,608 23,759 115,511 24,315 91,196 Total currency adjusted revenues $ 122,838 $ 99,523 $ 23,315 23% $ 392,585 $ 296,937 $ 95,648 32%

Condensed Consolidated Balance Sheets (Amounts in 000s) 8 Unaudited September 30, December 31, 2014 2013 Cash $ 42,296 $ 33,240 Trade receivables, net 105,649 106,853 Inventories, net 41,264 35,443 Other current assets 18,079 21,159 Total current assets 207,288 196,695 Property and equipment, net 52,802 55,347 Other assets 30,249 33,125 Total assets $ 290,339 $ 285,167 Total current liabilities $ 63,767 $ 62,523 Total long-term debt 61,990 63,196 Other liabilities 24,006 25,952 Total stockholders' equity 140,576 133,496 Total liabilities and stockholders' equity $ 290,339 $ 285,167

Condensed Consolidated Statements of Cash Flows (Amounts in 000s) (Unaudited) 9 For the Nine Months Ended September 30, 2014 2013 Net income $ 6,585 $ 11,445 Depreciation, amortization and other non-cash items 10,720 14,418 Working capital changes (1,362) (14,657) Net cash provided by operating activities 15,943 11,206 Capital expenditures (5,172) (13,496) Acquisition of businesses (265) (16,695) Proceeds from issuance of debt – 20,000 Payments on debt (916) (2,180) Other, net (49) 301 Effect of exchange rate changes on cash (485) (623) Increase (decrease) in cash and cash equivalents 9,056 (1,487) Cash and cash equivalents at beginning of period 33,240 33,185 Cash and cash equivalents at end of period $ 42,296 $ 31,698

Furmanite Corporation QUARTER AND NINE MONTHS ENDED SEPTEMBER 30, 2014 Operations Review Joseph E. Milliron, President and Chief Operating Officer 10

The Americas¹ EMEA APAC ¹ Included in the Americas is Engineering & Project Solutions •1,978 technicians & engineers •71% of YTD revenues •45 locations •418 technicians & engineers •21% of YTD revenues •24 locations •194 technicians & engineers •8% of YTD revenues •16 locations •1,046 technicians & engineers •29% of YTD revenues •5 locations As of September 30, 2014 11

12 Geographic Data – On-line Technical Services Revenues (Amounts in 000’s) (Unaudited) Total Americas EMEA APAC On-line Services 3rd Qtr. 2014 $ 33,325 $ 21,065 $ 10,117 $ 2,143 On-line Services 3rd Qtr. 2013 33,141 18,880 11,347 2,914 Variance $ 184 $ 2,185 $ (1,230) $ (771) On-line Services YTD 2014 $ 104,940 $ 63,339 $ 33,916 $ 7,685 On-line Services YTD 2013 102,706 61,851 31,145 9,710 Variance $ 2,234 $ 1,488 $ 2,771 $ (2,025)

Geographic Data – Off-line Technical Services Revenues (Amounts in 000’s) (Unaudited) 13 Total Americas EMEA APAC Off-line Services 3rd Qtr. 2014 $ 38,063 $ 20,248 $ 8,725 $ 9,090 Off-line Services 3rd Qtr. 2013 40,128 26,706 9,093 4,329 Variance $ (2,065) $ (6,458) $ (368) $ 4,761 Off-line Services YTD 2014 $ 136,098 $ 80,048 $ 33,167 $ 22,883 Off-line Services YTD 2013 134,348 93,965 26,417 13,966 Variance $ 1,750 $ (13,917) $ 6,750 $ 8,917

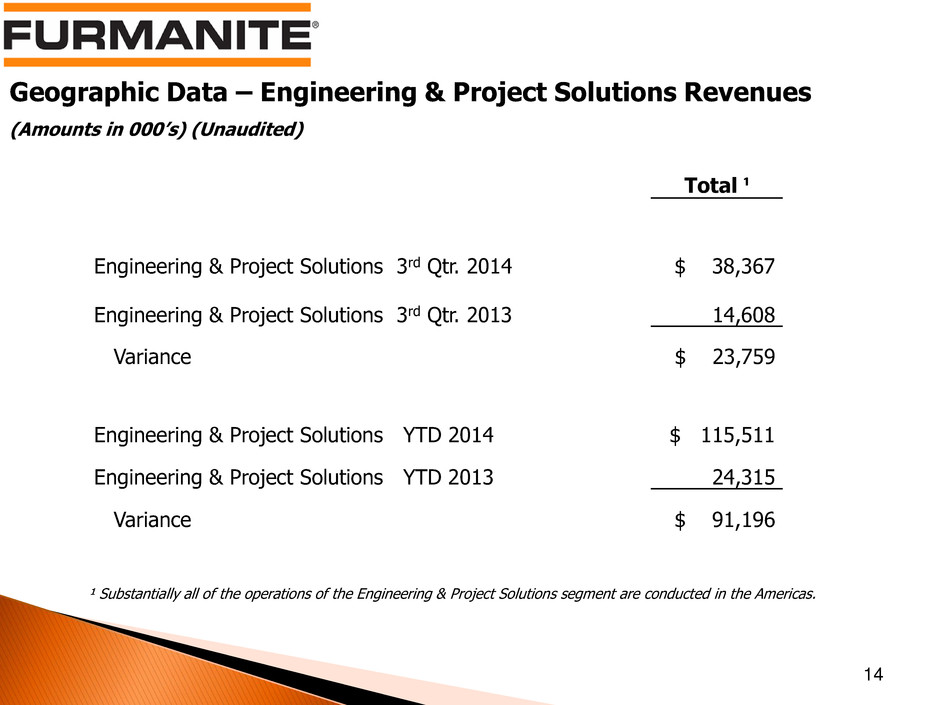
Geographic Data – Engineering & Project Solutions Revenues (Amounts in 000’s) (Unaudited) 14 Total ¹ Engineering & Project Solutions 3rd Qtr. 2014 $ 38,367 Engineering & Project Solutions 3rd Qtr. 2013 14,608 Variance $ 23,759 Engineering & Project Solutions YTD 2014 $ 115,511 Engineering & Project Solutions YTD 2013 24,315 Variance $ 91,196 ¹ Substantially all of the operations of the Engineering & Project Solutions segment are conducted in the Americas.

Furmanite Corporation QUARTER AND NINE MONTHS ENDED SEPTEMBER 30, 2014 Closing Comments 15

Furmanite Corporation Review of 3Q 2014 November 3, 2014 www.furmanite.com 16
