Attached files
| file | filename |
|---|---|
| 8-K - FORM 8-K - General Motors Financial Company, Inc. | d809816d8k.htm |
| EX-99.1 - EX-99.1 - General Motors Financial Company, Inc. | d809816dex991.htm |
 3
rd
Quarter 2014
Earnings Call
October 23, 2014
Exhibit 99.2 |
 2
Safe Harbor Statement
This presentation contains several “forward-looking statements”. Forward-looking
statements are those that use words such as “believe”, “expect”,
“anticipate”, “intend”, “plan”, “may”, “likely”, “should”, “estimate”, “continue”, “future” or other
comparable expressions. These words indicate future events and trends. Forward-looking statements
are General Motors Financial Company, Inc.’s (the “Company’s”) current
views with respect to future events and financial performance. These forward-looking
statements are subject to many assumptions, risks and uncertainties that could cause actual results to
differ significantly from historical results or from those anticipated by the Company. The most
significant risks are detailed from time to time in the Company’s filings and reports with
the Securities and Exchange Commission, including the Company’s Report on Form 10-K
for the year ended December 31, 2013. Such risks include - but are not limited to - our
ability to close the acquisition of Ally Financial’s equity interest in its auto finance and
financial services operations in China and operate that business successfully, changes in
general economic and business conditions, GM’s ability to sell new vehicles that we
finance in the markets we serve in North America, Europe and Latin America, interest rate and
currency fluctuations, our financial condition and liquidity, as well as future cash flows and
earnings, competition, the effect, interpretation or application of new or existing laws,
regulations, court decisions and accounting pronouncements, the availability of sources of
financing, the level of net credit losses, delinquencies and prepayments on the loans and
leases we originate, the viability of GM-franchised dealers that are commercial loan customers,
the prices at which used cars and end of term leased vehicles are sold in the wholesale
markets, and changes in business strategy, including acquisitions and expansion of product
lines and credit risk appetite. If one or more of these risks or uncertainties materializes, or
if underlying assumptions prove incorrect, actual events or results may differ materially. It is advisable not
to place undue reliance on the Company’s forward-looking statements. The Company undertakes
no obligation to, and does not, publicly update or revise any forward-looking statements,
except as required by federal securities laws, whether as a result of new information, future
events or otherwise. |
 3
rd
Quarter 2014 Highlights
Operating Results
–
Strong origination volume, driven by
North America loan and lease originations at record levels
Higher
retail
penetration
in
the
United
States,
Europe
and
Latin
America
–
U.S. prime lending update
$162
million
of
prime
originations
in
the
quarter,
rolled
out
to
approximately
1,600
GM
dealers
Expanding
offering
to
all
GM
dealers
on
November
1
st
–
Solid profitability with $208 million in pretax earnings in the quarter
China JV Acquisition Update
–
Progressing through the regulatory process and expect to close in late 2014 or
early 2015 Financing
–
Raised $3.5 billion in Senior Unsecured Notes in the U.S.
–
Entered into a support agreement with GM which provides for leverage limits and
liquidity support to GMF, if needed
–
Upgraded to investment grade by S&P and GMF’s ratings equalized to
GM’s across all four agencies (S&P, Moody’s, Fitch and
DBRS) 3 |
 4
Key Metrics
September 2014 Quarter
September 2013 Quarter
($MM)
North
America
1
International
2
Total Co.
North
America
1
International
2
Total Co.
Earnings Before Tax
$150
$58
$208
3
$175
$63
$239
3
Ending Earning Assets
$20,972
$17,253
$38,225
$15,921
$11,689
$27,610
Total Originations (Loan & Lease)
$ 3,699
$2,140
$5,839
$ 1,997
$ 1,233
$ 3,230
GM as a % of Total Originations
65.5%
87.7%
73.6%
56.0%
85.0%
67.1%
Annualized Net Credit Loss as a % of Avg.
Consumer Finance Receivable
3.2%
0.8%
2.0%
2.8%
0.4%
1.9%
1.
United States and Canada
2.
Brazil
acquired
on
October
1,
2013;
Brazil
included
in
September
2014 metrics but excluded in September 2013 metrics
3.
Reflects net impact of intercompany allocations |
 North
America GM and GMF Penetration Statistics
5
Sept-14
June-14
Sept-13
GMF as a % of GM Retail Sales
U.S.
10.5%
8.9%
5.7%
Canada
15.5%
27.6%
8.6%
GMF Wholesale Dealer Penetration
U.S.
7.5%
6.7%
4.5%
Canada
9.7%
8.8%
7.3%
GM as % of GMF Consumer Originations
(GM New / GMF Consumer Loan & lease)
U.S.
62.1%
59.7%
52.3%
Canada
98.8%
99.6%
97.6% |
 North
America Consumer Loan Originations
Loan
origination
volume
up
driven
by
strong
new
and
used
vehicle
sales
and
growth
in GM related business, including prime lending
GMF as % of
GM U.S. Subprime
29.0%
30.0%
31.5%
32.7%
32.8%
6
$722
$673
$814
$855
$905
$156
$160
$196
$191
$372
$392
$313
$354
$507
$680
$0
$500
$1,000
$1,500
$2,000
$2,500
Sep-13
Dec-13
Mar-14
Jun-14
Sep-14
Quarterly
($MM)
Loans originated
on new vehicles
by GM dealers
Loans originated
on used vehicles
by GM dealers
Loans originated
on vehicles by
non-GM dealers
$1,270
$1,146
$1,364
$1,553
$1,957 |
 7
North America
Consumer Loan Credit Performance
Credit metrics impacted by seasonality and normalizing credit environment
–
Credit metrics continue to moderate, reflecting current credit environment and
portfolio mix –
Recovery rates migrating toward historical levels
Comparable performance of GM new remains favorable relative to performance of
non-GM
2.8%
3.5%
3.1%
2.3%
3.2%
0.0%
1.0%
2.0%
3.0%
4.0%
5.0%
6.0%
7.0%
8.0%
0.0%
1.0%
2.0%
3.0%
4.0%
5.0%
Recovery Rate
58.7%
56.7%
59.1%
61.5%
56.6%
Annualized quarterly
net credit losses
31-60 day
delinquency
61+ day delinquency
Sep-13
Dec-13
Mar-14
Jun-14
Sep-14
Credit Metrics |
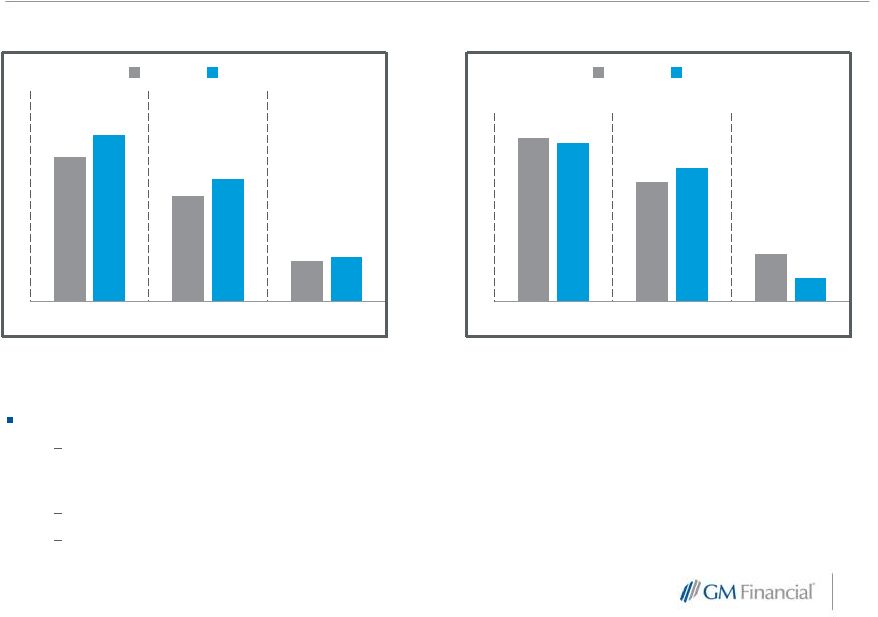
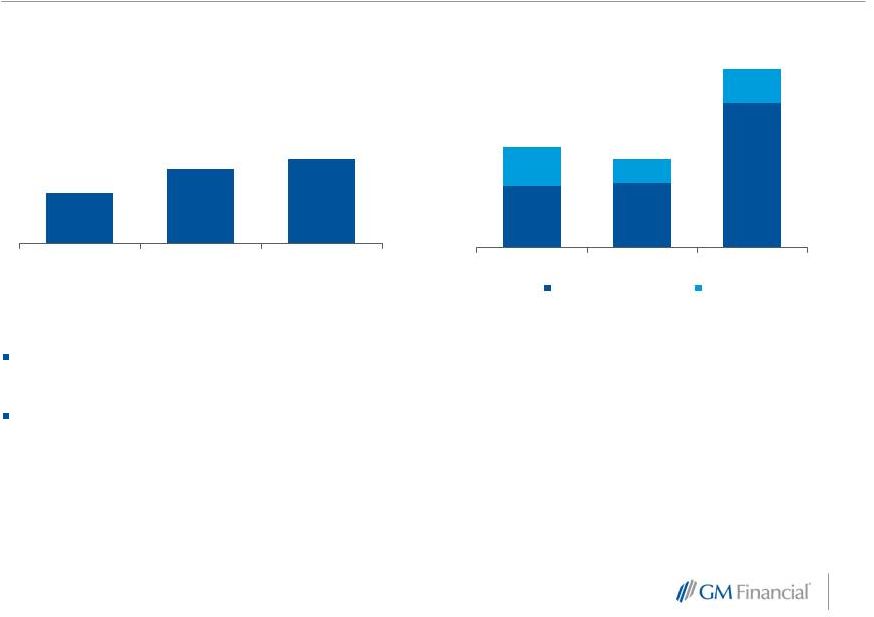
 North
America Lease Originations
Total lease volume up sequentially and year-over-year driven by broader, more
competitive product offerings and improved dealer acceptance
GMF as a percentage of GM’s U.S. lease business doubled over the past
year Credit performance reflects the predominantly prime credit profile of the
portfolio At September 30, 2014, substantially all of our leases were current
with minimal defaults to date GM Market Penetration
Sep-13
Sep-14
Sep-13
Sep-14
U.S. Lease
21.3%
22.3%
24.1%
25.6%
Canada Lease
8.1%
15.9%
19.2%
22.1%
GMF as a % of
GM U.S. Lease
1
16.6%
15.2%
17.0%
28.8%
33.2%
1.
GMF is exclusive GM lease provider in Canada
8
$577
$383
$519
$1,048
$1,417
$150
$267
$254
$501
$325
$3.1B
$3.4B
$3.7B
$4.7B
$5.8B
Sep-13
Dec-13
Mar-14
Jun-14
Sep-14
Canada Lease Volume ($MM)
U.S. Lease Volume ($MM)
Lease Portfolio ($B)
Industry
Average
(excluding
GM) |
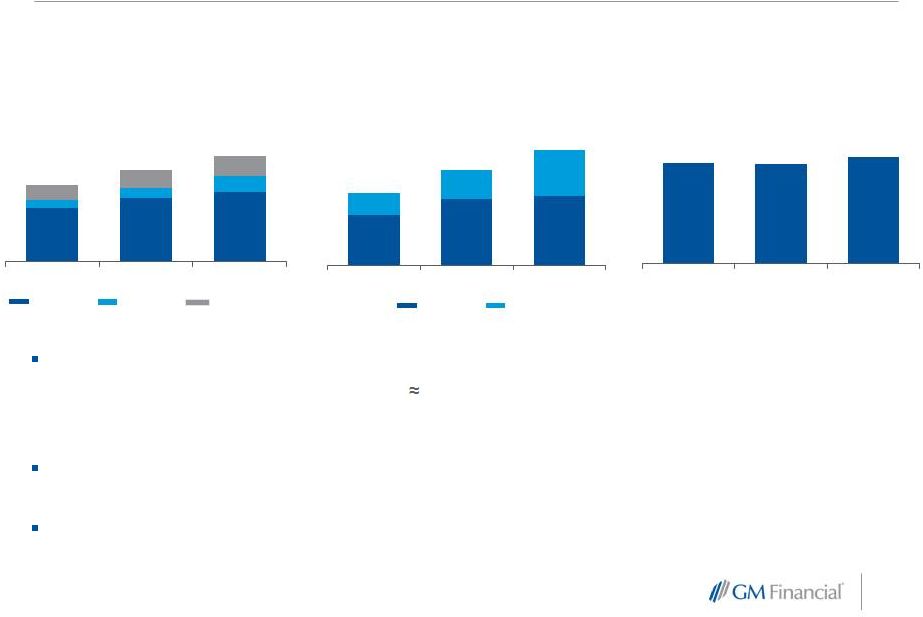
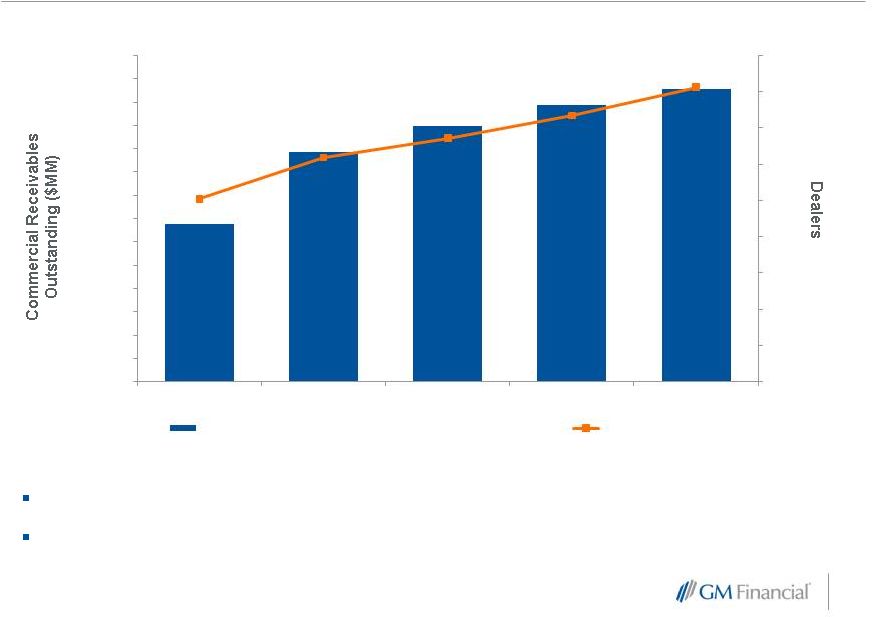 9
North America
Commercial Lending
Floorplan financing represented the largest share of the portfolio at 88%
Roll-out of prime lending program and increases in leasing penetration expected
to boost commercial lending growth
$1,357
$1,975
$2,190
$2,373
$2,513
252
309
336
367
406
-
50
100
150
200
250
300
350
400
450
Sep-13
Dec-13
Mar-14
Jun-14
Sep-14
$0
$200
$400
$600
$800
$1,000
$1,200
$1,400
$1,600
$1,800
$2,000
$2,200
$2,400
$2,600
$2,800
Commercial Finance Receivables Outstanding
Number of Dealers |
 International Operations
GM and GMF Penetration Statistics
10
-
Brazil reflected beginning with the December 2013 quarter
Sept-14
June-14
Sept-13
GMF as a % of GM Retail Sales
Europe
39.3%
36.9%
30.7%
Latin America
47.8%
43.3%
33.5%
GMF Wholesale Dealer Penetration
Europe
97.7%
98.4%
97.1%
Latin America
92.1%
93.2%
89.8%
GM as % of GMF Consumer Originations
(GM New / GMF Consumer Loan and Lease)
Europe
80.0%
80.5%
81.1%
Latin America
95.7%
94.4%
96.0% |
 11
International Operations
Loan Origination Volume
Stable origination volume quarter over quarter across International
Operations
-
Brazil reflected beginning with the December 2013 quarter
$0
$500
$1,000
$1,500
$2,000
$2,500
Sep-13
Dec-13
Mar-14
Jun-14
Sep-14
Quarterly
($MM)
Latin America
Consumer Loan
Europe Consumer Loan
$1,233
$2,121
$2,048
$2,080
$2,127 |
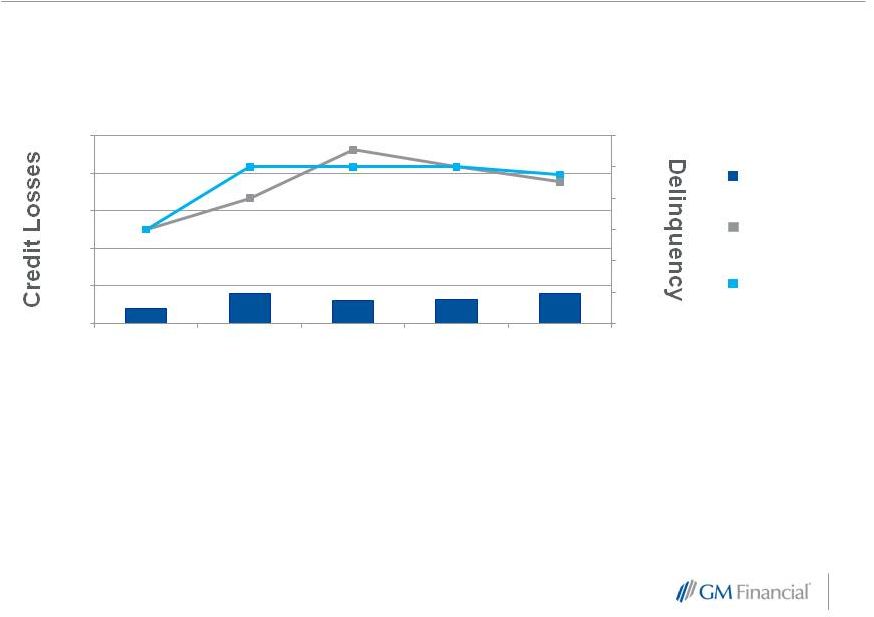 12
International Operations
Consumer Loan Credit Performance
•
Credit losses reflect strong performance in Latin America and remain
consistently low in Europe
-
Brazil reflected beginning with the December 2013 quarter
0.4%
0.8%
0.6%
0.6%
0.8%
0.0%
0.2%
0.4%
0.6%
0.8%
1.0%
1.2%
0.0%
1.0%
2.0%
3.0%
4.0%
5.0%
Annualized quarterly
net credit losses
61+ day delinquency
Credit Metrics
31-60 day
delinquency
Sep-13
Dec-13
Mar-14
Jun-14
Sep-14 |
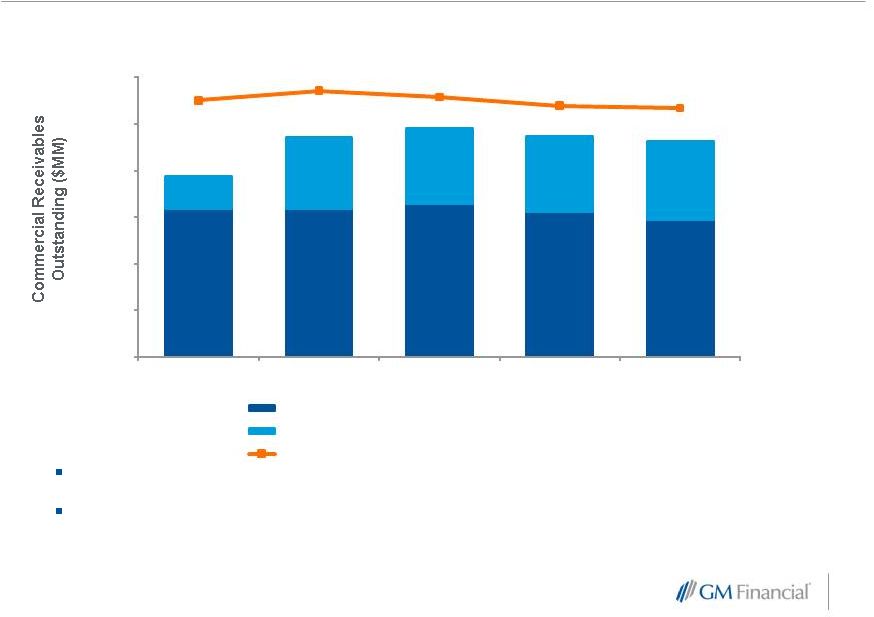 13
International Operations
Commercial
Commercial receivable balance and credit performance remain stable
Dealer count down sequentially due to discontinuation of Chevrolet brand in
Europe
-
Brazil reflected beginning with the December 2013 quarter
2,387
2,646
2,473
2,241
2,174
$3,889
$4,725
$4,918
$4,741
$4,638
$0
$1,000
$2,000
$3,000
$4,000
$5,000
$6,000
Sep
-13
Dec
-13
Mar-14
Jun
-14
Sep-14
Europe Commercial Finance Receivables Outstanding
Latin America Commercial Finance Receivables Outstanding
Number of dealers |
 14
Financial Results
Earnings
Before
Taxes
($MM)
1,
2
YTD earnings drivers:
North America earnings down due to runoff of higher yielding pre-acquisition
receivables portfolio, normalizing credit trends, provisioning for asset
growth and increased interest expense associated with unsecured debt
issuance, with the majority of growth in higher credit quality, lower margin assets
International Operations earnings increased as a result of the Brazil
acquisition Operating expense as a percentage of average earning assets is
stable at 3.1% and expected to trend down over time as origination platforms
continue to scale 1.
Brazil included beginning with the December 2013 quarter
2.
Results include acquisition and integration expenses of $7 and $29 million for the
three and nine months ended September 30, 2013, respectively 3.
Reflects net impact of intercompany allocations
3
3
$208
$150
$58
$239
$175
$63
Total Co.
North America
International
2014
2013
Three Months Ended September 30,
$695
$504
$202
$673
$564
$100
Total Co.
North America
International
2014
2013
Nine Months Ended September 30, |
 15
Financial Results
Allowance for Loan Losses
Consumer and commercial allowance consistent with credit performance
North America consumer allowance reflective of normalizing credit trends
Consumer and commercial allowance collectively includes reserve for discontinuing
Chevrolet brand in Europe, originally established at $15 million in December
2013 Wind
down
of
Chevrolet
portfolio
in
Europe
over
90%
complete
-
$11
million
of
initial
reserve
released
in
the
first
nine months of 2014
2.6%
2.3%
2.3%
2.4%
2.5%
4.4%
4.4%
4.5%
4.5%
4.4%
0.6%
0.8%
0.7%
0.6%
0.5%
1.0%
0.9%
0.7%
0.7%
0.7%
0.0%
2.0%
4.0%
6.0%
Sep-13
Dec-13
Mar-14
Jun-14
Sep-14
Consumer Allowance
Commercial Allowance
North America Only
North America Only |
 16
Solid Balance Sheet Metrics
Composition
of
earning
assets
shifting
to
more
“prime-like”
credit
profile
–
Subprime
loan
portfolio
represented
30%
of
ending
earning
assets
at
September
30,
2014
and percentage is expected to decline with continued growth in the commercial and
lease portfolios and the prime loan rollout in North America
Unsecured
debt
as
a
percentage
of
total
debt
increased
to
32%
at
September
30,
2014 from 22% at September 30, 2013
GM to provide a $700M equity contribution upon closing of the China JV
$23.7
$29.0
$33.8
Sep-13
Dec-13
Sep-14
Total Debt
($B)
$27.6
$33.3
$38.2
Sep-13
Dec-13
Sep-14
Ending Earning
Assets
($B)
$5.0
$5.0
$5.3
Sep-13
Dec-13
Sep-14
Tangible Net Worth
($B)
Consumer
Lease
Consumer
Loan
Commercial
Loan
Unsecured
Debt
Secured
Debt |
 17
Solid Balance Sheet Metrics
Liquidity increase primarily driven by $3.5B in unsecured debt issuance in the
quarter 5.4x
6.5x
7.0x
Sep-13
Dec-13
Sep-14
Leverage
Sep-13
Dec-13
Sep-14
Liquidity
($B)
Borrowing capacity
Cash
$4.5
$3.9
$8.0
Leverage below support threshold as defined in support agreement (net earning assets to
tangible net worth plus outstanding junior subordinated debt) |
 18
Funding Overview
Committed credit facilities totaling $18.6B, provided by
27 banks
–
North America: Renewed and upsized Canada lease warehouse to
C$1B from C$800M
–
International Operations: Renewed and/or upsized 11 committed
credit
facilities
in
the
quarter
totaling
$1.3
billion
of
capacity
across
eight countries
Permanent securitization funding
–
North America:
Lease
securitization
(144A),
$709M
-
September
2014
AMCAR
2014-3
(subprime
loan),
$1.0B
-
August
2014
–
International Operations:
E-Carat 7 Germany (retail loan) €337M/$462M
E-Carat
4
UK
(retail
loan),
£457/$741M
–
September
2014
Senior note issuances
–
US$1.5B in July 2014 (3 and 5 year tenors)
–
US$2.0B in September 2014 (3 and 7 year tenors)
–
In
October
2014,
issued
inaugural
€500M
senior
note
offering
in
Europe (5 year tenor)
Credit Facilities
$3.0B
Unsecured
$10.9B
Secured
$22.9B
Credit
Facilities
$6.4B
Securitization
Notes Payable
$16.5B
Sr. Notes
$7.9B
$33.8B
9/30/2014 |
 |