Attached files
Table of Contents
UNITED STATES
SECURITIES AND EXCHANGE COMMISSION
WASHINGTON, D.C. 20549
FORM 10-K
(Mark One)
| x | ANNUAL REPORT PURSUANT TO SECTION 13 OR 15(d) OF THE |
| SECURITIES EXCHANGE ACT OF 1934 |
For the fiscal year ended June 30, 2010
OR
| ¨ | TRANSITION REPORT PURSUANT TO SECTION 13 OR 15(d) OF THE |
| SECURITIES EXCHANGE ACT OF 1934 |
For the transition period from to
Commission file number 1-10667
AmeriCredit Corp.
(Exact name of registrant as specified in its charter)
| Texas | 75-2291093 | |
| (State or other jurisdiction of incorporation or organization) |
(I.R.S. Employer Identification No.) |
801 Cherry Street, Suite 3500, Fort Worth, Texas 76102
(Address of principal executive offices, including Zip Code)
(817) 302-7000
(Registrant’s telephone number, including area code)
Securities registered pursuant to Section 12(b) of the Act:
| Title of each class |
Name of each exchange on which registered | |
| Common Stock, $0.01 par value | New York Stock Exchange |
Securities registered pursuant to Section 12(g) of the Act:
None
(Title of each class)
Indicate by check mark if the registrant is a well-known seasoned issuer, as defined in Rule 405 of the Securities Act. Yes x No ¨
Indicate by check mark if the registrant is not required to file reports pursuant to Section 13 or Section 15(d) of the Act. Yes ¨ No x
Indicate by check mark whether the registrant (1) has filed all reports required to be filed by Section 13 or 15(d) of the Securities Exchange Act of 1934 during the preceding 12 months (or for such shorter period that the registrant was required to file such reports), and (2) has been subject to such filing requirements for the past 90 days. Yes x No ¨
Indicate by check mark if disclosure of delinquent filers pursuant to Item 405 of Regulation S-K (Section 229.405 of this chapter) is not contained herein, and will not be contained, to the best of registrant’s knowledge in definitive proxy or information statements incorporated by reference in Part III of this Form 10-K. x
Indicate by check mark whether the registrant has submitted electronically and posted on its corporate Web site, if any, every Interactive Data File required to be submitted and posted pursuant to Rule 105 of Regulation S-T during the preceding 12 months (or for such shorter period that the registrant was required to submit and post such files). Yes ¨ No ¨
Indicate by check mark whether the registrant is a large accelerated filer, an accelerated filer, or a non-accelerated filer. See definition of “accelerated filer and large accelerated filer” in Rule 12b-2 of the Exchange Act.
| Large accelerated filer x | Accelerated filer ¨ | Non-accelerated filer ¨ | Smaller Reporting Company ¨ |
Indicate by check mark whether the registrant is a shell company (as defined in Rule 12b-2 of the Act). Yes ¨ No x
The aggregate market value of the 50,803,574 shares of the Registrant’s Common Stock held by non-affiliates, based upon the closing price of the Registrant’s Common Stock on the New York Stock Exchange on December 31, 2009, was approximately $967,300,049.
There were 135,390,408 shares of Common Stock, $0.01 par value, outstanding as of August 26, 2010.
DOCUMENTS INCORPORATED BY REFERENCE
NONE
Table of Contents
AMERICREDIT CORP.
| Item |
Page | |||
| 3 | ||||
| PART I | ||||
| 1. | 4 | |||
| 1A. | 12 | |||
| 1B. | 20 | |||
| 2. | 21 | |||
| 3. | 21 | |||
| 4. | 22 | |||
| PART II | ||||
| 5. | MARKET FOR REGISTRANT’S COMMON EQUITY AND RELATED STOCKHOLDER MATTERS |
23 | ||
| 6. | 25 | |||
| 7. | MANAGEMENT’S DISCUSSION AND ANALYSIS OF FINANCIAL CONDITION AND RESULTS OF OPERATIONS |
26 | ||
| 7A. | 42 | |||
| 8. | 47 | |||
| 9. | CHANGES IN AND DISAGREEMENTS WITH ACCOUNTANTS ON ACCOUNTING AND FINANCIAL DISCLOSURE |
90 | ||
| 9A. | 90 | |||
| PART III | ||||
| 10. | 93 | |||
| 11. | 100 | |||
| 12. | SECURITY OWNERSHIP OF CERTAIN BENEFICIAL OWNERS AND MANAGEMENT |
120 | ||
| 13. | 122 | |||
| 14. | 125 | |||
| PART IV | ||||
| 15. | 126 | |||
| SIGNATURES | 127 | |||
2
Table of Contents
This Form 10-K contains several “forward-looking statements.” Forward-looking statements are those that use words such as “believe,” “expect,” “anticipate,” “intend,” “plan,” “may,” “likely,” “should,” “estimate,” “continue,” “future” or other comparable expressions. These words indicate future events and trends. Forward-looking statements are our current views with respect to future events and financial performance. These forward-looking statements are subject to many assumptions, risks and uncertainties that could cause actual results to differ significantly from historical results or from those anticipated by us. The most significant risks are detailed from time to time in our filings and reports with the Securities and Exchange Commission, including this Annual Report on Form 10-K for the year ended June 30, 2010. It is advisable not to place undue reliance on our forward-looking statements. We undertake no obligation to, and do not, publicly update or revise any forward-looking statements, except as required by federal securities laws, whether as a result of new information, future events or otherwise.
The following factors are among those that may cause actual results to differ materially from historical results or from the forward-looking statements:
| • | changes in general economic and business conditions; |
| • | interest rate fluctuations; |
| • | our financial condition and liquidity, as well as future cash flows and earnings; |
| • | competition; |
| • | the effect, interpretation or application of new or existing laws, regulations, court decisions and accounting pronouncements; |
| • | the availability of sources of financing; |
| • | the level of net charge-offs, delinquencies and prepayments on the automobile contracts we originate; |
| • | items associated with our pending merger with General Motors; and |
| • | significant litigation. |
If one or more of these risks or uncertainties materialize, or if underlying assumptions prove incorrect, our actual results may vary materially from those expected, estimated or projected.
INDUSTRY DATA
In this Form 10-K, we rely on and refer to information regarding the automobile lending industry from market research reports, analyst reports and other publicly available information. Although we believe that this information is reliable, we have not independently verified any of it.
AVAILABLE INFORMATION
We make available free of charge through our website, www.americredit.com, our AmeriCredit Automobile Receivables Trust, AmeriCredit Prime Automobile Receivables Trust, Bay View Automobile Receivables Trust and Long Beach Automobile Receivables Trust securitization portfolio performance measures and all materials that we file electronically with the SEC, including our annual report on Form 10-K, quarterly reports on Form 10-Q, current reports on Form 8-K, and amendments to those reports filed pursuant to Section 13(a) or 15(d) of the Securities Exchange Act of 1934, as amended, as soon as reasonably practical after filing or furnishing such material with or to the SEC.
The public may read and copy any materials we file with or furnish to the SEC at the SEC’s Public Reference Room at 100 F Street, N.E., Washington, D.C. 20549. Information on the operation of the Public Reference Room may be obtained by calling the SEC at 1-800-SEC-0330. The SEC maintains an Internet website, www.sec.gov, which contains reports, proxy and information statements and other information regarding issuers that file electronically with the SEC.
3
Table of Contents
PART I
| ITEM 1. | BUSINESS |
General Motors Merger Agreement
On July 21, 2010, we entered into an Agreement and Plan of Merger (the “Merger Agreement”) with General Motors Holdings LLC (“GM Holdings”), a Delaware limited liability company and a wholly owned subsidiary of General Motors Company (“General Motors”), and Goalie Texas Holdco Inc. (“Merger Sub”), a Texas corporation and a direct wholly owned subsidiary of GM Holdings. Under the terms of the Merger Agreement, Merger Sub will be merged with and into AmeriCredit, with AmeriCredit continuing as the surviving corporation and a direct wholly owned subsidiary of GM Holdings (the “Merger”). Pursuant to the terms of the Merger Agreement and subject to the satisfaction or waiver of the closing conditions set forth in the Merger Agreement, at the effective time of the Merger (the “Effective Time”), each share of our common stock issued and outstanding immediately prior to the Effective Time (other than (i) any shares held by us or any of our subsidiaries immediately prior to the Effective Time, which shares will be cancelled with no consideration in exchange for such cancellation, and (ii) any shares held by our shareholders who are entitled to and who properly exercise appraisal rights under Texas law) will be converted into the right to receive $24.50 in cash, without interest.
General
We are a leading independent auto finance company that has been operating in the automobile finance business since September 1992. We purchase auto finance contracts for new and used vehicles purchased by consumers from franchised and select independent automobile dealerships. As used herein, “loans” include auto finance contracts originated by dealers and purchased by us. We predominantly offer financing to consumers who are typically unable to obtain financing from banks, credit unions and manufacturer captive auto finance companies. We service our loan portfolio at regional centers using automated loan servicing and collection systems. Funding for our auto lending activities is obtained through the utilization of our credit facilities and securitization transactions.
We have historically maintained a significant share of the sub-prime market and have, in the past, participated in the prime and near prime sectors of the auto finance industry to a more limited extent. We source our business primarily through our relationships with auto dealers, which we maintain through our regional credit centers, marketing representatives (dealer relationship managers) and alliance relationships. We expanded our traditional sub-prime niche through the acquisition of Bay View Acceptance Corporation (“BVAC”) in May 2006, which offered specialized auto finance products, including extended term financing and higher loan-to-value advances, to consumers with prime credit bureau scores, and our acquisition of Long Beach Acceptance Corporation (“LBAC”) in January 2007, which offered auto finance products primarily to consumers with near prime credit bureau scores. The operations of BVAC and LBAC have been integrated into our originations, servicing and administrative activities and we provide auto finance products solely under the AmeriCredit Financial Services, Inc. name.
We were incorporated in Texas on May 18, 1988, and succeeded to the business, assets and liabilities of a predecessor corporation formed under the laws of Texas on August 1, 1986. Our predecessor began operations in March 1987, and the business has been operated continuously since that time. Our principal executive offices are located at 801 Cherry Street, Suite 3500, Fort Worth, Texas, 76102 and our telephone number is (817) 302-7000.
Marketing and Loan Originations
Target Market. Our automobile lending programs are designed to serve customers who have limited access to automobile financing through banks, credit unions and the manufacturer captives. The bulk of our typical borrowers have experienced prior credit difficulties or have limited credit histories and generally have
4
Table of Contents
credit bureau scores ranging from 500 to 700. Because we generally serve customers who are unable to meet the credit standards imposed by most banks, credit unions and manufacturer captives, we generally charge higher interest rates than those charged by such sources. Since we provide financing in a relatively high-risk market, we also expect to sustain a higher level of credit losses than these other automobile financing sources.
Marketing. As an indirect lender, we focus our marketing activities on automobile dealerships. We are selective in choosing the dealers with whom we conduct business and primarily pursue manufacturer franchised dealerships with used car operations and a limited number of independent dealerships. We prefer to finance later model, low mileage used vehicles and moderately priced new vehicles. Of the contracts purchased by us during fiscal 2010, approximately 94% were originated by manufacturer franchised dealers and 6% by select independent dealers; further, approximately 77% were used vehicles and 23% were new vehicles. We purchased contracts from 10,756 dealers during fiscal 2010. No dealer location accounted for more than 1% of the total volume of contracts purchased by us for that same period.
Prior to entering into a relationship with a dealer, we consider the dealer’s operating history and reputation in the marketplace. We then maintain a non-exclusive relationship with the dealer. This relationship is actively monitored with the objective of maximizing the volume of applications received from the dealer that meet our underwriting standards and profitability objectives. Due to the non-exclusive nature of our relationships with dealerships, the dealerships retain discretion to determine whether to obtain financing from us or from another source for a loan made by the dealership to a customer seeking to make a vehicle purchase. Our representatives regularly contact and visit dealers to solicit new business and to answer any questions dealers may have regarding our financing programs and capabilities and to explain our underwriting philosophy. To increase the effectiveness of these contacts, marketing personnel have access to our management information systems which detail current information regarding the number of applications submitted by a dealership, our response and the reasons why a particular application was rejected.
We purchase finance contracts without recourse to the dealer. Accordingly, the dealer has no liability to us if the consumer defaults on the contract. Although finance contracts are purchased without recourse to the dealer, the dealer typically makes certain representations as to the validity of the contract and compliance with certain laws, and indemnifies us against any claims, defenses and set-offs that may be asserted against us because of assignment of the contract or the condition of the underlying collateral. Recourse based upon those representations and indemnities would be limited in circumstances in which the dealer has insufficient financial resources to perform upon such representations and indemnities. We do not view recourse against the dealer on these representations and indemnities to be of material significance in our decision to purchase finance contracts from a dealer. Depending upon the contract structure and consumer credit attributes, we may charge dealers a non-refundable acquisition fee or pay dealers a participation fee when purchasing finance contracts. These fees are assessed on a contract-by-contract basis.
Origination Network. Our origination platform provides specialized focus on marketing and underwriting loans. Responsibilities are segregated so that the sales group markets our programs and products to our dealer customers, while the underwriting group focuses on underwriting, negotiating and closing loans.
We use a combination of regional credit centers and dealer relationship managers to market our indirect financing programs to select dealers, develop relationships with these dealers and underwrite contracts submitted by the dealerships. We believe that the personal relationships our credit underwriters and dealer relationship managers establish with the dealership staff are an important factor in creating and maintaining productive relationships with our dealer customer base.
We select markets for credit center locations based upon numerous factors, most notably proximity to the geographic markets and dealers we seek to serve and availability of qualified personnel. Credit centers are typically situated in suburban office buildings that are accessible to dealers.
5
Table of Contents
Regional credit managers, credit managers and credit underwriters staff credit center locations. The regional credit managers report to a senior vice president. Credit center personnel are compensated with base salaries and incentives based on corporate and overall credit center performance, including factors such as loan credit quality, loan pricing adequacy and loan volume objectives.
The senior vice presidents monitor credit center compliance with our underwriting guidelines. Our management information systems provide the senior vice presidents with access to credit center information enabling them to consult with the regional credit managers on credit decisions and review exceptions to our underwriting guidelines. The senior vice presidents also make periodic visits to the credit centers to conduct operational reviews.
Dealer relationship managers are either based in a credit center or work from a home office. Dealer relationship managers solicit dealers for applications and maintain our relationships with the dealers in their geographic vicinity, but do not have responsibility for credit approvals. We believe the local presence provided by our dealer relationship managers enables us to be more responsive to dealer concerns and local market conditions. Applications solicited by the dealer relationship managers are underwritten at our credit centers. The dealer relationship managers are compensated with base salaries and incentives based on loan volume objectives and profitability. The dealer relationship managers report to regional sales managers.
Alliance Relationships. We have programs with certain new vehicle manufacturers under which the new vehicle manufacturers provide us cash payments in order for us to offer lower interest rates on finance contracts we purchase from the new vehicle manufacturers’ dealership network. The programs serve our goal of increasing new loan originations and the new vehicle manufacturers’ goal of making credit more available to consumers purchasing vehicles sold by the new vehicle manufacturer.
Origination Data. The following table sets forth information with respect to the number of credit centers, number of dealer relationship managers, dollar volume of contracts purchased and number of producing dealerships for the periods set forth below.
| Years Ended June 30, | |||||||||
| 2010 | 2009 | 2008 | |||||||
| (dollars in thousands) | |||||||||
| Number of credit centers |
14 | 13 | 24 | ||||||
| Number of dealer relationship managers |
99 | 55 | 104 | ||||||
| Origination volume(a) |
$ | 2,137,620 | $ | 1,285,091 | $ | 6,293,494 | |||
| Number of producing dealerships(b) |
10,756 | 9,401 | 17,872 | ||||||
| (a) | Fiscal 2008 amount includes $218.1 million of contracts purchased through our leasing program. |
| (b) | A producing dealership refers to a dealership from which we purchased a contract in the respective period. |
Credit Underwriting
We utilize a proprietary credit scoring system to support the credit approval process. The credit scoring system was developed through statistical analysis of our consumer demographic and portfolio databases. Credit scoring is used to differentiate credit applicants and to rank order credit risk in terms of expected default rates, which enables us to evaluate credit applications for approval and tailor loan pricing and structure according to this statistical assessment of credit risk. For example, a consumer with a lower score would indicate a higher probability of default and, therefore, we would either decline the application, or, if approved, compensate for this higher default risk through the structuring and pricing of the loan. While we employ a credit scoring system in the credit approval process, credit scoring does not eliminate credit risk. Adverse determinations in evaluating contracts for purchase or changes in certain macroeconomic factors could negatively affect the credit quality of our receivables portfolio.
6
Table of Contents
The credit scoring system considers data contained in the customer’s credit application, credit bureau report, other third-party data sources as well as the structure of the proposed loan and produces a statistical assessment of these attributes. This assessment is used to segregate applicant risk profiles and determine whether the risk is acceptable and the price we should charge for that risk. Our credit scorecards are monitored through comparison of actual versus projected performance by score. Periodically, we endeavor to refine our proprietary scorecards based on new information including identified correlations between receivables performance and data obtained in the underwriting process.
We purchase individual contracts through our underwriting specialists in credit centers using a credit approval process tailored to local market conditions. Underwriting personnel have a specific credit authority based upon their experience and historical loan portfolio results as well as established credit scoring parameters. Although the credit approval process is decentralized, our application processing system includes controls designed to ensure that credit decisions comply with our credit scoring strategies and underwriting policies and procedures.
Finance contract application packages completed by prospective obligors are received electronically, through web-based platforms that automate and accelerate the financing process. Upon receipt or entry of application data into our application processing system, a credit bureau report and other third-party data sources are automatically accessed and a credit score is computed. For applications that are not automatically declined, our underwriting personnel review the application package and determine whether to approve the application, approve the application subject to conditions that must be met, or deny the application. The credit decision is based primarily on the applicant’s credit score determined by our proprietary credit scoring system. We estimate that approximately 25-35% of applicants will be approved for credit by us. Dealers are contacted regarding credit decisions electronically or by facsimile. Declined applicants are also provided with appropriate notification of the decision.
Our underwriting and collateral guidelines, including credit scoring parameters, form the basis for the credit decision. Exceptions to credit policies and authorities must be approved by designated individuals with appropriate credit authority. Additionally, our centralized credit review and credit risk management departments monitor exceptions and adherence to underwriting guidelines, procedures and appropriate approval levels.
Completed contract packages are sent to us by dealers. Loan documentation is scanned to create electronic images and electronically forwarded to our centralized loan processing department. A loan processing representative verifies certain applicant employment, income and residency information. Loan terms, insurance coverage and other information may be verified or confirmed with the customer. The original documents are subsequently sent to our centralized account services department and critical documents are stored in a fire resistant vault.
Once cleared for funding, the funds are electronically transferred to the dealer or a check is issued. Upon funding of the contract, we acquire a perfected security interest in the automobile that was financed. Daily loan reports are generated for review by senior operations management. All of our contracts are fully amortizing with substantially equal monthly installments. Key variables, such as loan applicant data, credit bureau and credit score information, loan structures and terms and payment histories are tracked. Our credit risk management department also regularly reviews the performance of our credit scoring system and is responsible for the development and enhancement of our credit scorecards.
Credit indicator packages track portfolio performance at various levels of detail including total company, credit center and dealer. Various daily reports and analytical data are also generated to monitor credit quality as well as to refine the structure and mix of new loan originations. We review profitability metrics on a consolidated basis, as well as at the credit center, origination channel, dealer and contract levels.
Loan Servicing
Our servicing activities consist of collecting and processing customer payments, responding to customer inquiries, initiating contact with customers who are delinquent in payment of an installment, maintaining the
7
Table of Contents
security interest in the financed vehicle, monitoring physical damage insurance coverage of the financed vehicle, and arranging for the repossession of financed vehicles, liquidation of collateral and pursuit of deficiencies when appropriate.
We use monthly billing statements to serve as a reminder to customers as well as an early warning mechanism in the event a customer has failed to notify us of an address change. Approximately 15 days before a customer’s first payment due date and each month thereafter, we mail the customer a billing statement directing the customer to mail payments to a lockbox bank for deposit in a lockbox account. Payment receipt data is electronically transferred from our lockbox bank to us for posting to the loan accounting system. Payments may also be received from third party payment processors, such as Western Union, directly by us from customers or via electronic transmission of funds. Payment processing and customer account maintenance is performed centrally at our operations center in Arlington, Texas.
Our collections activities are performed at regional centers located in Arlington, Texas; Chandler, Arizona; Charlotte, North Carolina; and Peterborough, Ontario. A predictive dialing system is utilized to make phone calls to customers whose payments are past due. The predictive dialer is a computer-controlled telephone dialing system that simultaneously dials phone numbers of multiple customers from a file of records extracted from our database. Once a live voice responds to the automated dialer’s call, the system automatically transfers the call to a collector and the relevant account information to the collector’s computer screen. Accounts that the system has been unable to reach within a specified number of days are flagged, thereby promptly identifying for management all customers who cannot be reached by telephone. By eliminating the time spent on attempting to reach customers, the system gives a single collector the ability to speak with a larger number of customers daily.
Once an account reaches a certain level of delinquency, the account moves to one of our advanced collection units. The objective of these collectors is to resolve the delinquent account. We may repossess a financed vehicle if an account is deemed uncollectible, the financed vehicle is deemed by collection personnel to be in danger of being damaged, destroyed or hidden, the customer deals in bad faith or the customer voluntarily surrenders the financed vehicle.
Statistically-based behavioral assessment models are used in our servicing activities to project the relative probability that an individual account will default. The behavioral assessment models are used to help develop servicing strategies for the portfolio or for targeted account groups within the portfolio.
At times, we offer payment deferrals to customers who have encountered financial difficulty, hindering their ability to pay as contracted. A deferral allows the customer to move delinquent payments to the end of the loan, usually by paying a fee that is calculated in a manner specified by applicable law. The collector reviews the customer’s past payment history and behavioral score and assesses the customer’s desire and capacity to make future payments. Before agreeing to a deferral, the collector also considers whether the deferment transaction complies with our policies and guidelines. Exceptions to our policies and guidelines for deferrals must be approved in accordance with these policies and guidelines. While payment deferrals are initiated and approved in the collections department, a separate department processes authorized deferment transactions. Exceptions are also monitored by our centralized credit risk management function.
Repossessions are subject to prescribed legal procedures, which include peaceful repossession, one or more customer notifications, a prescribed waiting period prior to disposition of the repossessed automobile and return of personal items to the customer. Some jurisdictions provide the customer with reinstatement or redemption rights. Legal requirements, particularly in the event of bankruptcy, may restrict our ability to dispose of the repossessed vehicle. Independent repossession firms engaged by us handle repossessions. All repossessions, other than bankruptcy or previously charged off accounts, must be approved by a collections officer. Upon repossession and after any prescribed waiting period, the repossessed automobile is sold at auction. We do not sell any vehicles on a retail basis. The proceeds from the sale of the automobile at auction, and any other recoveries, are credited against the balance of the contract. Auction proceeds from sale of the repossessed vehicle
8
Table of Contents
and other recoveries are usually not sufficient to cover the outstanding balance of the contract, and the resulting deficiency is charged off. For fiscal 2010, the net recovery rate upon the sale of repossessed assets was approximately 44%. We pursue collection of deficiencies when we deem such action to be appropriate.
Our policy is to charge off an account in the month in which the account becomes 120 days contractually delinquent if we have not repossessed the related vehicle. We charge off accounts in repossession when the automobile is repossessed and legally available for disposition. A charge-off represents the difference between the estimated net sales proceeds and the amount of the delinquent contract, including accrued interest. Accounts in repossession that have been charged off are removed from finance receivables and the related repossessed automobiles are included in other assets at net realizable value on the consolidated balance sheet pending disposal.
The value of the collateral underlying our receivables portfolio is updated periodically with a loan-by-loan link to national wholesale auction values. This data, along with our own experience relative to mileage and vehicle condition, are used for evaluating collateral disposition activities.
Financing
We finance our loan origination volume through the use of our credit facilities and execution of securitization transactions.
Credit Facilities. Loans are typically funded initially using credit facilities that are administered by agents on behalf of institutionally managed commercial paper or medium term note conduits. Under these funding agreements, we transfer finance receivables to special purpose finance subsidiaries. These subsidiaries, in turn, issue notes to the agents, collateralized by such finance receivables and cash. The agents provide funding under the notes to the subsidiaries pursuant to an advance formula, and the subsidiaries forward the funds to us in consideration for the transfer of finance receivables. While these subsidiaries are included in our consolidated financial statements, these subsidiaries are separate legal entities and the finance receivables and other assets held by these subsidiaries are legally owned by them and are not available to our creditors or creditors of our other subsidiaries. Advances under our funding agreements bear interest at commercial paper, London Interbank Offered Rates (“LIBOR”) or prime rates plus a credit spread and specified fees depending upon the source of funds provided by the agents.
Securitizations. We pursue a financing strategy of securitizing our receivables to diversify our funding sources and free up capacity on our credit facilities for the purchase of additional automobile finance contracts. The asset-backed securities market has traditionally allowed us to fund our finance receivables at fixed interest rates over the life of a securitization transaction, thereby locking in the excess spread on our loan portfolio.
Proceeds from securitizations are primarily used to fund initial cash credit enhancement requirements in the securitization and to pay down borrowings under our credit facilities, thereby increasing availability thereunder for further contract purchases. From 1994 to June 30, 2010, we had securitized approximately $61.2 billion of automobile receivables.
In our securitizations, we, through wholly-owned subsidiaries, transfer automobile receivables to newly-formed securitization trusts (“Trusts”), which issue one or more classes of asset-backed securities. The asset-backed securities are in turn sold to investors.
Since the beginning of fiscal 2009, we have primarily utilized senior subordinated securitization structures which involve the sale of subordinated asset-backed securities to provide credit enhancement for the senior, or higher rated, asset-backed securities. On May 20, 2010, we closed a $600 million senior subordinated securitization transaction, AmeriCredit Automobile Receivables Trust (“AMCAR”) 2010-2, that has initial cash deposit and overcollateralization requirements of 8.25% in order to provide credit enhancement for the asset-backed securities sold, including the double-B rated securities which were the lowest rated securities sold. The
9
Table of Contents
level of credit enhancement in future senior subordinated securitizations will depend, in part, on the net interest margin, collateral characteristics and credit performance trends of the receivables transferred, our portfolio and overall auto finance industry credit trends, as well as our financial condition, the economic environment and our ability to sell lower rated subordinated bonds at rates we consider acceptable.
The second type of securitization structure we have utilized involves the purchase of a financial guaranty insurance policy issued by an insurer. On August 19, 2010, we closed a $200 million securitization transaction, AMCAR 2010-B, which was insured by Assured Guaranty Municipal Corp. (“Assured”) and has initial cash deposit and overcollateralization requirements of 17.0%. The asset-backed securities sold had an underlying rating of single-A, but achieved a triple-A credit rating with the benefit of the financial guaranty insurance policy.
The financial guaranty insurance policies insure the timely payment of interest and the ultimate payment of principal due on the asset-backed securities. We have limited reimbursement obligations to the insurers; however, credit enhancement requirements, including the insurers’ encumbrance of certain restricted cash accounts and subordinated interests in Trusts, provide a source of funds to cover shortfalls in collections and to reimburse the insurers for any claims which may be made under the policies issued with respect to our securitizations. Since our securitization program’s inception, there have been no claims under any insurance policies.
The credit enhancement requirements in our securitization transactions include restricted cash accounts that are generally established with an initial deposit and may subsequently be funded through excess cash flows from securitized receivables. An additional form of credit enhancement is provided in the form of overcollateralization whereby more receivables are transferred to the Trusts than the amount of asset-backed securities issued by the Trusts. In the event a shortfall exists in amounts payable on the asset-backed securities, first overcollateralization is reduced, and then funds may be withdrawn from the restricted cash account to cover the shortfall before amounts are drawn on the insurance policy, if applicable. With respect to insured securitization transactions, funds may also be withdrawn to reimburse the insurers for draws on financial guaranty insurance policies in an event of default. Additionally, agreements with the insurers provide that if portfolio performance ratios (delinquency, cumulative default or cumulative net loss triggers) in a Trust’s pool of receivables exceed certain targets, the restricted cash account would be increased. Cash would be retained in the restricted cash account and not released to us until the increased target levels have been reached and maintained. We are entitled to receive amounts from the restricted cash accounts to the extent the amounts deposited exceed the required target enhancement levels. The credit enhancement requirements related to senior subordinated transactions typically do not contain portfolio performance ratios which could increase the minimum required credit enhancement levels.
Trade Names
We have obtained federal trademark protection for the “AmeriCredit” name and the logo that incorporates the “AmeriCredit” name. Certain other names, logos and phrases used by us in our business operations have also been trademarked.
Regulation
Our operations are subject to regulation, supervision and licensing under various federal, state and local statutes, ordinances and regulations.
In most states in which we operate, a consumer credit regulatory agency regulates and enforces laws relating to consumer lenders and sales finance companies such as us. These rules and regulations generally provide for licensing as a sales finance company or consumer lender, limitations on the amount, duration and charges, including interest rates, for various categories of loans, requirements as to the form and content of finance
10
Table of Contents
contracts and other documentation, and restrictions on collection practices and creditors’ rights. In certain states, we are subject to periodic examination by state regulatory authorities. Some states in which we operate do not require special licensing or provide extensive regulation of our business.
We are also subject to extensive federal regulation, including the Truth in Lending Act, the Equal Credit Opportunity Act and the Fair Credit Reporting Act. These laws require us to provide certain disclosures to prospective borrowers and protect against discriminatory lending practices and unfair credit practices. The principal disclosures required under the Truth in Lending Act include the terms of repayment, the total finance charge and the annual percentage rate charged on each contract or loan. The Equal Credit Opportunity Act prohibits creditors from discriminating against credit applicants on the basis of race, color, religion, national origin, sex, age or marital status. According to Regulation B promulgated under the Equal Credit Opportunity Act, creditors are required to make certain disclosures regarding consumer rights and advise consumers whose credit applications are not approved of the reasons for the rejection. In addition, the credit scoring system used by us must comply with the requirements for such a system as set forth in the Equal Credit Opportunity Act and Regulation B. The Fair Credit Reporting Act requires us to provide certain information to consumers whose credit applications are not approved on the basis of a report obtained from a consumer reporting agency and to respond to consumers who inquire regarding any adverse reporting submitted by us to the consumer reporting agencies. Additionally, we are subject to the Gramm-Leach-Bliley Act, which requires us to maintain the privacy of certain consumer data in our possession and to periodically communicate with consumers on privacy matters. We are also subject to the Servicemembers Civil Relief Act, which requires us, in most circumstances, to reduce the interest rate charged to customers who have subsequently joined, enlisted, been inducted or called to active military duty.
The dealers who originate automobile finance contracts purchased by us also must comply with both state and federal credit and trade practice statutes and regulations. Failure of the dealers to comply with these statutes and regulations could result in consumers having rights of rescission and other remedies that could have an adverse effect on us.
We believe that we maintain all material licenses and permits required for our current operations and are in substantial compliance with all applicable local, state and federal regulations. There can be no assurance, however, that we will be able to maintain all requisite licenses and permits, and the failure to satisfy those and other regulatory requirements could have a material adverse effect on our operations. Further, the adoption of additional, or the revision of existing, rules and regulations could have a material adverse effect on our business.
Compliance with applicable law is costly and can affect operating results. Compliance also requires forms, processes, procedures, controls and the infrastructure to support these requirements, and may create operational constraints. Laws in the financial services industry are designed primarily for the protection of consumers. The failure to comply could result in significant statutory civil and criminal penalties, monetary damages, attorneys’ fees and costs, possible revocation of licenses and damage to reputation, brand and valued customer relationships.
In the near future, the financial services industry is likely to see increased disclosure obligations, restrictions on pricing and fees and enforcement proceedings. Effective June 30, 2010, the Wall Street Reform and Consumer Protection Act (the “Reform Act”) created the Consumer Financial Protection Bureau (“CFPB”). The CFPB has been given broad authority to seek consumer financial protection by rulemaking, supervision and enforcement.
The Reform Act also repealed Rule 436(g) under the Securities Act of 1933, as amended (the “Securities Act”), which relates to U.S. public offerings registered under the Securities Act. Rule 436(g) provided that credit ratings assigned by a Nationally Registered Statistical Rating Organization (“NRSRO”) are not considered a part of registration statements prepared or certified by an ‘expert’, as described within the meaning of sections 7 and 11 of the Securities Act and, accordingly, the NRSRO consent was not required to include credit ratings in Securities Act registration statements and any related prospectuses.
11
Table of Contents
Subsequent to the Reform Act being signed into law, the SEC’s Division of Corporation Finance issued a ‘no-action’ letter allowing a six month transition period ending January 24, 2011, for issuers to omit credit ratings from registration statements filed under Regulation AB promulgated under the Securities Act so as to provide issuers, rating agencies and other market participants with a transition period in order to implement changes to comply with the new statutory requirement while still conducting registered asset-backed security offerings. If there is no resolution after the six month transition period, it may be difficult to bring new asset-backed securities issues to the public market. We also believe that, even with a longer-term resolution of the issue, it likely will become more expensive for us to bring new transactions to the public market, potentially shrinking the total amount of asset-backed issuance, lowering the availability of consumer and commercial credit, and raising costs for borrowers.
The SEC has proposed significant changes to the rules applicable to issuers and sponsors of asset-backed securities under the Securities Act and the Securities Exchange Act of 1934, as amended (the “Exchange Act”). With the proposed changes we could potentially see an adverse impact in access to the asset-backed capital markets and lessened effectiveness of our financing programs.
Competition
The automobile finance market is highly fragmented and is served by a variety of financial entities including the captive finance affiliates of major automotive manufacturers, banks, thrifts, credit unions and independent finance companies. Many of these competitors have substantially greater financial resources and lower costs of funds than ours. In addition, our competitors often provide financing on terms more favorable to automobile purchasers or dealers than we offer. Many of these competitors also have long standing relationships with automobile dealerships and may offer dealerships or their customers other forms of financing, including dealer floor plan financing or revolving credit products, which are not provided by us. Providers of automobile financing have traditionally competed on the basis of interest rates charged, the quality of credit accepted, the flexibility of loan terms offered and the quality of service provided to dealers and customers. In seeking to establish ourselves as one of the principal financing sources at the dealers we serve, we compete predominantly on the basis of our high level of dealer service and strong dealer relationships and by offering flexible loan terms. There can be no assurance that we will be able to compete successfully in this market or against these competitors.
Employees
At June 30, 2010, we employed 2,940 persons in the United States and Canada. None of our employees are a part of a collective bargaining agreement, and our relationships with employees are satisfactory.
| ITEM 1A. | RISK FACTORS |
Pending Merger. On July 21, 2010, we entered into the Merger Agreement with GM Holdings. Under the terms of the Merger Agreement, Merger Sub will be merged with and into AmeriCredit, with AmeriCredit continuing as the surviving corporation and a direct wholly owned subsidiary of GM Holdings. Pursuant to the terms of the Merger Agreement and subject to the satisfaction or waiver of the closing conditions set forth in the Merger Agreement, at the Effective Time each share of our common stock issued and outstanding immediately prior to the Effective Time (other than (i) any shares held by us or any of our subsidiaries immediately prior to the Effective Time, which shares will be cancelled with no consideration in exchange for such cancellation, and (ii) any shares held by our shareholders who are entitled to and who properly exercise appraisal rights under Texas law) will be converted into the right to receive $24.50 in cash, without interest.
There is no assurance that the Merger with GM Holdings will occur. The closing of the Merger is subject to the satisfaction of certain closing conditions, including the approval of the Merger by our shareholders. The timing of such approval and the closing of the Merger are subject to factors beyond our control. While our Board
12
Table of Contents
of Directors has unanimously recommended that our shareholders adopt and approve the Merger Agreement, we cannot predict the outcome of the shareholder vote. The Merger will not close if the requisite approval is not received from our shareholders.
If the proposed Merger is not completed, the share price of our common stock may drop to the extent that the current market price of our common stock reflects an assumption that the Merger will be completed. In addition, under circumstances defined in the Merger Agreement, we may be required to pay a termination fee of $105 million. Further, a failed transaction may result in negative publicity and a negative impression of us in the investment community. Finally, any disruptions to our business resulting from the announcement and pendency of the Merger, or any adverse changes in our relationships with our customers, vendors and employees, could continue or accelerate as a result of the announcement of the proposed Merger or in the event of a failed transaction. There can be no assurance that our business, these relationships or our financial condition will not be adversely affected, as compared to the condition prior to the announcement of the Merger, if the Merger is not consummated.
The Merger Agreement contains customary representations and warranties of AmeriCredit, GM Holdings and Merger Sub. The Merger Agreement also contains customary covenants and agreements, including covenants relating to (a) the conduct of our business between the date of the signing of the Merger Agreement and the closing of the Merger, (b) non-solicitation of competing acquisition proposals and (c) the efforts of the parties to cause the Merger to be completed. Compliance with the covenants outlined in the Merger Agreement could restrict our ability to operate our business or result in our failure to pursue other opportunities which could be beneficial to our business in the future, should the Merger not be completed. Furthermore, management’s efforts may be focused on completing the Merger and diverted from the operation of our business.
Dependence on Credit Facilities. We depend on various credit facilities with financial institutions to finance our purchase of contracts pending securitization.
At June 30, 2010, we had one credit facility, which we refer to as our master/syndicated warehouse facility, which provides borrowing capacity of up to $1.3 billion. In February 2010, we amended our master/syndicated warehouse facility, which was approved by the eight lenders in the facility to expand the size of the facility to $1.3 billion from $1.0 billion, and to extend the revolving period to February 2011. In February 2011 when the revolving period ends and if the facility is not renewed, the outstanding balance will be repaid over time based on the amortization of the receivables pledged until February 2012 when the remaining balance will be due and payable. On August 20, 2010, the master/syndicated warehouse facility was amended to allow for the change of control following the consummation of the pending Merger.
Additionally, we have a medium term note facility that reached the end of its revolving period in October 2009 and has $598.9 million outstanding at June 30, 2010. The outstanding balance of this facility will be repaid over time based on the amortization of the receivables pledged until October 2016 when any remaining amount outstanding will be due and payable.
We cannot guarantee that the master/syndicated warehouse facility will continue to be available beyond the current maturity date on reasonable terms or at all. The availability of this financing source depends, in part, on factors outside of our control, including regulatory capital treatment for unfunded bank lines of credit and the availability of bank liquidity in general. If we are unable to extend or replace this facility or arrange new credit facilities or other types of interim financing, we will have to curtail or suspend loan origination activities, which would have a material adverse effect on our financial position, liquidity, and results of operations.
Our credit facilities generally contain a borrowing base or advance formula which requires us to pledge finance receivables in excess of the amounts which we can borrow under the facilities. We are also required to hold certain funds in restricted cash accounts to provide additional collateral for borrowings under the credit facilities. In addition, the finance receivables pledged as collateral must be less than 31 days delinquent at
13
Table of Contents
periodic measurement dates. Accordingly, increases in delinquencies or defaults on pledged collateral resulting from weakened economic conditions, or due to our inability to execute securitization transactions or any other factor, would require us to pledge additional finance receivables to support the same borrowing levels and to replace delinquent or defaulted collateral. The pledge of additional finance receivables to support our credit facilities would adversely impact our financial position, liquidity, and results of operations.
Disruptions in the capital markets in 2008 and early 2009 have caused banks and other credit providers to restrict availability of new credit facilities, including execution of hedging arrangements, and require more collateral and higher pricing upon renewal of existing credit facilities, if such facilities are renewed at all. Accordingly, as our existing master/syndicated warehouse facility comes up for renewal, we may be required to provide more collateral in the form of finance receivables or cash to support borrowing levels which will affect our financial position, liquidity, and results of operations. In addition, higher pricing would increase our cost of funds and adversely affect our profitability.
Additionally, the credit facilities contain various covenants requiring certain minimum financial ratios, asset quality, and portfolio performance ratios (portfolio net loss and delinquency ratios, and pool level cumulative net loss ratios) as well as limits on deferment levels. Failure to meet any of these covenants could result in an event of default under these agreements. If an event of default occurs under these agreements, the lenders could elect to declare all amounts outstanding under these agreements to be immediately due and payable, enforce their interests against collateral pledged under these agreements or restrict our ability to obtain additional borrowings under these facilities. If the lenders elect to accelerate outstanding indebtedness under these agreements following the violation of any covenant, such actions may result in an event of default under our senior note and convertible senior note indentures.
Dependence on Securitization Program.
General. Since December 1994, we have relied upon our ability to transfer receivables to securitization Trusts and sell securities in the asset-backed securities market to generate cash proceeds for repayment of credit facilities and to purchase additional receivables. Accordingly, adverse changes in our asset-backed securities program or in the asset-backed securities market for automobile receivables in general have in the past, and could in the future, materially adversely affect our ability to purchase and securitize loans on a timely basis and upon terms acceptable to us. Any adverse change or delay would have a material adverse effect on our financial position, liquidity, and results of operations.
We will continue to require the execution of securitization transactions in order to fund our future liquidity needs. There can be no assurance that funding will be available to us through these sources or, if available, that it will be on terms acceptable to us. If these sources of funding are not available to us on a regular basis for any reason, including the occurrence of events of default, deterioration in loss experience on the receivables, breach of financial covenants or portfolio and pool performance measures, disruption of the asset-backed market or otherwise, we will be required to revise the scale of our business, including the possible discontinuation of loan origination activities, which would have a material adverse effect on our financial position, liquidity, and results of operations.
Recent Conditions and Events. Although, the asset-backed securities market, along with credit markets in general, have stabilized, they are operating at reduced levels compared to periods prior to mid-2007. Conditions in the asset-backed securities market began deteriorating in mid-2007, were further weakened by the credit rating downgrades of the financial guaranty insurance providers, and worsened significantly following the bankruptcy of Lehman Brothers in September 2008. Over this time period, conditions in the asset-backed securities market generally included increased risk premiums for issuers, limited investor demand for asset-backed securities, particularly those securities backed by sub-prime collateral, rating agency downgrades of asset-backed securities, and a general tightening of availability of credit. These conditions increased our cost of funding and restricted our access to the asset-backed securities market, and may occur again in the future.
14
Table of Contents
There can be no assurance that we will continue to be successful in selling securities in the asset-backed securities market. Since we are highly dependent on the availability of the asset-backed securities market to finance our operations, disruptions in this market or adverse changes or delays in our ability to access this market would have a material adverse effect on our financial position, liquidity, and results of operations. Although we experienced sufficient investor demand for the securities we issued in our recent securitizations, reduced investor demand for asset-backed securities could result in our having to hold auto loans until investor demand improves, but our capacity to hold auto loans is not unlimited. A reduced demand for our asset-backed securities could require us to reduce the amount of auto loans that we will purchase. A return to adverse market conditions, such as we experienced in 2008 and early 2009, could also result in increased costs and reduced margins in connection with our securitization transactions.
Securitization Structures. Since the beginning of fiscal 2009, we have primarily utilized senior subordinated securitization structures which involve the sale of subordinated asset-backed securities to provide credit enhancement for the senior, or higher rated, asset-backed securities. In a senior-subordinated securitization, we expect that the higher rated, or triple-A, securities to be sold by us will comprise approximately 70% of the total securities issued. The balance of securities we expect to issue, the subordinated notes, will comprise the remaining 30%. Sizes of the classes depend upon rating agency loss assumptions and loss coverage requirements in addition to the level of subordinate bonds. The market environment for subordinated securities is traditionally smaller than for senior securities and, therefore, can be more challenging than the market for triple-A securities. There can be no assurance that we will be able to sell the subordinated securities in a senior subordinated securitization, or that the pricing and terms demanded by investors for such securities will be acceptable to us. If we were unable for any reason to sell the subordinated securities in a senior subordinated securitization, we would be required to hold such securities which could have a material adverse effect on our financial position, liquidity, and results of operations and could force us to curtail or suspend loan origination activities.
The amount of the initial credit enhancement on future senior-subordinated securitizations will be dependent upon the amount of subordinated securities sold and the desired ratings on the securities being sold. In the AMCAR 2010-2 securitization, the initial cash deposit and overcollateralization requirement was 8.25% in order to provide credit enhancement for the asset-backed securities sold, including the double-B rated securities which were the lowest rated securities sold. The required initial and targeted credit enhancement levels depend, in part, on the net interest margin expected over the life of a securitization, the collateral characteristics of the pool of receivables securitized, credit performance trends of our finance receivables, the structure of the securitization transaction, our financial condition and the economic environment. In periods of economic weakness and associated deterioration of credit performance trends, required credit enhancement levels generally increase, particularly for securitizations of higher risk finance receivables such as our loan portfolio. Higher levels of credit enhancement require significantly greater use of liquidity to execute a securitization transaction. The level of credit enhancement requirements in the future could adversely impact our ability to execute securitization transactions and may affect the timing of such securitizations given the increased amount of liquidity necessary to fund credit enhancement requirements. This, in turn, may adversely impact our ability to opportunistically access the capital markets when conditions are favorable.
Prior to fiscal 2009, we primarily utilized financial guaranty insurance policies provided by various monoline insurance providers in order to achieve triple-A ratings on the securities issued in our securitization transactions. Most of the monoline insurers we have used in the past are still facing financial stress and have received rating agency downgrades due to risk exposures on insurance policies that guarantee mortgage debt and related structured products. As a result, there is limited demand for securities guaranteed by insurance policies. However, during calendar 2010, we were able to issue two securitizations utilizing financial guaranty insurance policies. The asset-backed securities sold had an underlying rating of single-A without considering the benefit of the financial guaranty insurance policy.
Liquidity and Capital Needs. Our ability to make payments on or to refinance our indebtedness and to fund our operations depends on our ability to generate cash and our access to the capital markets in the future.
15
Table of Contents
This, to a certain extent, is subject to general economic, financial, competitive, legislative, regulatory, capital market conditions and other factors that are beyond our control.
We expect to continue to require substantial amounts of cash. Our primary cash requirements include the funding of: (i) contract purchases pending their securitization; (ii) credit enhancement requirements in connection with the securitization of the receivables and credit facilities; (iii) interest and principal payments under our credit facilities and other indebtedness; (iv) fees and expenses incurred in connection with the securitization and servicing of receivables and credit facilities; (v) ongoing operating expenses; (vi) income tax payments; and (vii) capital expenditures.
We require substantial amounts of cash to fund our contract purchase and securitization activities. Although we must fund certain credit enhancement requirements upon the closing of a securitization, we typically receive the cash representing excess cash flows and return of credit enhancement deposits over the actual life of the receivables securitized. We also incur transaction costs in connection with a securitization transaction. Accordingly, our strategy of securitizing our newly purchased receivables will require significant amounts of cash.
Our primary sources of future liquidity are expected to be: (i) interest and principal payments on loans not yet securitized; (ii) distributions received from securitization Trusts; (iii) servicing fees; (iv) borrowings under our credit facilities or proceeds from securitization transactions; and (v) further issuances of other debt or equity securities.
Because we expect to continue to require substantial amounts of cash for the foreseeable future, we anticipate that we will require the execution of additional securitization transactions and may choose to enter into other additional debt or equity financings. The type, timing and terms of financing selected by us will be dependent upon our cash needs, the availability of other financing sources and the prevailing conditions in the capital markets. There can be no assurance that funding will be available to us through these sources or, if available, that the funding will be on acceptable terms. If we are unable to execute securitization transactions on a regular basis, we would not have sufficient funds to finance new loan originations and, in such event, we would be required to revise the scale of our business, including possible discontinuation of loan origination activities, which would have a material adverse effect on our ability to achieve our business and financial objectives.
Leverage. We currently have a substantial amount of outstanding indebtedness. Our ability to make payments of principal or interest on, or to refinance, our indebtedness will depend on our future operating performance, including the performance of receivables transferred to securitization Trusts, and our ability to enter into additional securitization transactions as well as other debt or equity financings, which, to a certain extent, are subject to economic, financial, competitive, regulatory, capital markets and other factors beyond our control.
If we are unable to generate sufficient cash flows in the future to service our debt, we may be required to refinance all or a portion of our existing debt or to obtain additional financing. There can be no assurance that any refinancings will be possible or that any additional financing could be obtained on acceptable terms. The inability to service or refinance our existing debt or to obtain additional financing would have a material adverse effect on our financial position, liquidity, and results of operations.
The degree to which we are leveraged creates risks including: (i) we may be unable to satisfy our obligations under our outstanding indebtedness; (ii) we may find it more difficult to fund future credit enhancement requirements, operating costs, income tax payments, capital expenditures, or general corporate expenditures; (iii) we may have to dedicate a substantial portion of our cash resources to payments on our outstanding indebtedness, thereby reducing the funds available for operations and future business opportunities; and (iv) we may be vulnerable to adverse general economic, capital markets and industry conditions.
16
Table of Contents
Our credit facilities require us to comply with certain financial ratios and covenants, including minimum asset quality maintenance requirements. These restrictions may interfere with our ability to obtain financing or to engage in other necessary or desirable business activities. If we cannot comply with the requirements in our credit facilities, then the lenders may increase our borrowing costs, remove us as servicer or declare the outstanding debt immediately due and payable. If our debt payments were accelerated, the assets pledged on these facilities might not be sufficient to fully repay the debt. These lenders may foreclose upon their collateral, including the restricted cash in these credit facilities. These events may also result in a default under our senior note and convertible senior note indentures. We may not be able to obtain a waiver of these provisions or refinance our debt, if needed. In such case, our financial condition, liquidity, and results of operations would materially suffer.
Default and Prepayment Risks. Our financial condition, liquidity, and results of operations depend, to a material extent, on the performance of loans in our portfolio. Obligors under contracts acquired or originated by us may default during the term of their loan. Generally, we bear the full risk of losses resulting from defaults. In the event of a default, the collateral value of the financed vehicle usually does not cover the outstanding loan balance and costs of recovery.
We maintain an allowance for loan losses for our finance receivable portfolio which reflects management’s estimates of inherent losses for these loans. If the allowance is inadequate, we would recognize the losses in excess of that allowance as an expense and results of operations would be adversely affected. A material adjustment to our allowance for loan losses and the corresponding decrease in earnings could limit our ability to enter into future securitizations and other financings, thus impairing our ability to finance our business.
We are required to deposit substantial amounts of the cash flows generated by our interests in securitizations sponsored by us to satisfy targeted credit enhancement requirements. An increase in defaults would reduce the cash flows generated by our interests in securitization transactions lengthening the period required to build targeted credit enhancement levels in the securitization trusts. Distributions of cash from the securitizations to us would be delayed and the ultimate amount of cash distributable to us would be less, which would have an adverse effect on our liquidity. The targeted credit enhancement levels in future securitizations may also be increased, due to an increase in defaults and losses, further impacting our liquidity.
Consumer prepayments affect the amount of finance charge income we receive over the life of the loans. If prepayment levels increase for any reason and we are not able to replace the prepaid receivables with newly originated loans, we will receive less finance charge income and our results of operations may be adversely affected.
Portfolio Performance—Negative Impact on Cash Flows. Generally, the form of agreements we have entered into with our financial guaranty insurance providers in connection with securitization transactions insured by them contain specified limits on portfolio performance ratios (delinquency, cumulative default and cumulative net loss) on the receivables included in each securitization Trust. If, at any measurement date, a portfolio performance ratio with respect to any Trust were to exceed the specified limits, provisions of the credit enhancement agreement would automatically increase the level of credit enhancement requirements for that Trust if a waiver was not obtained. During the period in which the specified portfolio performance ratio was exceeded, excess cash flows, if any, from the Trust would be used to fund additional credit enhancement up to the increased levels instead of being distributed to us, which would have an adverse effect on our cash flows and liquidity.
Our securitization transactions insured by some of our financial guaranty insurance providers are cross-collateralized to a limited extent. In the event of a shortfall in the original targeted credit enhancement requirement for any of these securitization Trusts after a certain period of time, excess cash flows from other transactions insured by the same insurance provider would be used to satisfy the shortfall amount rather than be distributed to us.
17
Table of Contents
Right to Terminate Servicing. The agreements that we have entered into with our financial guaranty insurance providers in connection with securitization transactions insured by them contain additional specified targeted portfolio performance ratios (delinquency, cumulative default and cumulative net loss) that are higher than the limits referred to in the preceding risk factor. If, at any measurement date, the targeted portfolio performance ratios with respect to any insured Trust were to exceed these additional levels, provisions of the agreements permit the financial guaranty insurance providers to declare the occurrence of an event of default and take steps to terminate our servicing rights to the receivables sold to that Trust. In addition, the servicing agreements on certain insured securitization Trusts are cross-defaulted so that a default declared under one servicing agreement would allow the financial guaranty insurance provider to terminate our servicing rights under all servicing agreements for securitization Trusts in which they issued a financial guaranty insurance policy. Additionally, if these higher targeted portfolio performance levels were exceeded and the financial guaranty insurance providers elected to declare an event of default, the insurance providers may retain all excess cash generated by other securitization transactions insured by them as additional credit enhancement. This, in turn, could result in defaults under our other securitizations and other material indebtedness, including under our senior note and convertible senior note indentures. Although we have never exceeded these additional targeted portfolio performance ratios, there can be no assurance that we will not exceed these additional targeted portfolio performance ratios in the future. If such targeted portfolio performance ratios are exceeded, or if we have breached our obligations under the servicing agreements, or if the financial guaranty insurance providers are required to make payments under a policy, or if certain bankruptcy or insolvency events were to occur then there can be no assurance that an event of default will not be declared and our servicing rights will not be terminated. The termination of any or all of our servicing rights would have a material adverse effect on our financial position, liquidity, and results of operations.
Implementation of Business Strategy. Our financial position, liquidity, and results of operations depend on management’s ability to execute our business strategy. Key factors involved in the execution of the business strategy include achieving the desired loan origination volume, continued and successful use of proprietary scoring models for credit risk assessment and risk-based pricing, the use of effective credit risk management techniques and servicing strategies, implementation of effective loan servicing and collection practices, continued investment in technology to support operating efficiency, and continued access to funding and liquidity sources. Our failure or inability to execute any element of our business strategy could materially adversely affect our financial position, liquidity, and results of operations.
Target Consumer Base. The majority of our loan purchasing and servicing activities involve sub-prime automobile receivables. Sub-prime borrowers are associated with higher-than-average delinquency and default rates. While we believe that we effectively manage these risks with our proprietary credit scoring system, risk-based loan pricing and other underwriting policies, and our servicing and collection methods, no assurance can be given that these criteria or methods will be effective in the future. In the event that we underestimate the default risk or under-price contracts that we purchase, our financial position, liquidity, and results of operations would be adversely affected, possibly to a material degree.
Economic Conditions. We are subject to changes in general economic conditions that are beyond our control. During periods of economic slowdown or recession, delinquencies, defaults, repossessions and losses generally increase. These periods also may be accompanied by increased unemployment rates, decreased consumer demand for automobiles and declining values of automobiles securing outstanding loans, which weakens collateral coverage and increases the amount of a loss in the event of default. Additionally, higher gasoline prices, declining stock market values, unstable real estate values, increasing unemployment levels, general availability of consumer credit or other factors that impact consumer confidence or disposable income could increase loss frequency and decrease consumer demand for automobiles as well as weaken collateral values on certain types of automobiles. Because we focus predominantly on sub-prime borrowers, the actual rates of delinquencies, defaults, repossessions and losses on these loans are higher than those experienced in the general automobile finance industry and could be more dramatically affected by a general economic downturn. In addition, during an economic slowdown or recession, our servicing costs may increase without a corresponding
18
Table of Contents
increase in our finance charge income. While we seek to manage the higher risk inherent in loans made to sub-prime borrowers through the underwriting criteria and collection methods we employ, no assurance can be given that these criteria or methods will afford adequate protection against these risks. Any sustained period of increased delinquencies, defaults, repossessions or losses or increased servicing costs could adversely affect our financial position, liquidity, results of operations and our ability to enter into future securitizations and future credit facilities.
Wholesale Auction Values. We sell repossessed automobiles at wholesale auction markets located throughout the United States and Canada. Auction proceeds from the sale of repossessed vehicles and other recoveries are usually not sufficient to cover the outstanding balance of the contract, and the resulting deficiency is charged off. Decreased auction proceeds resulting from the depressed prices at which used automobiles may be sold during periods of economic slowdown or slack consumer demand will result in higher credit losses for us. Furthermore, depressed wholesale prices for used automobiles may result from significant liquidations of rental or fleet inventories, financial difficulties of the new vehicle manufacturers, discontinuance of vehicle brands and models and from increased volume of trade-ins due to promotional programs offered by new vehicle manufacturers. Additionally, higher gasoline prices may decrease the wholesale auction values of certain types of vehicles as evidenced by declines in calendar 2008 in the wholesale values of large sport utility vehicles and trucks. Our net recoveries as a percentage of repossession charge-offs were 44% in fiscal 2010, 40% in fiscal 2009 and 45% in fiscal 2008. There can be no assurance that our recovery rates will remain at current levels.
Interest Rates. Our profitability may be directly affected by the level of and fluctuations in interest rates, which affects the gross interest rate spread we earn on our receivables. As the level of interest rates change, our gross interest rate spread on new originations either increases or decreases since the rates charged on the contracts purchased from dealers are fixed rate and are limited by market and competitive conditions, restricting our opportunity to pass on increased interest costs to the consumer. We believe that our financial position, liquidity, and results of operations could be adversely affected during any period of higher interest rates, possibly to a material degree. We monitor the interest rate environment and employ hedging strategies designed to mitigate the impact of increases in interest rates. We can provide no assurance however, that hedging strategies will mitigate the impact of increases in interest rates.
Significant Share Ownership. As of June 30, 2010, we have two shareholders that each held significant share ownership of our outstanding common stock.
Leucadia National Corp. (“Leucadia”) owns approximately 25% of our outstanding common stock and has two members on our Board of Directors. As a result, Leucadia could exert significant influence over matters requiring shareholder approval, including approval of significant corporate transactions such as the Merger. This concentration of ownership may delay or prevent a change in control and make the approval of certain transactions more difficult without their support. We entered into a standstill agreement with Leucadia which expired on March 3, 2010. Subsequent to the termination of the standstill agreement, Leucadia has no restrictions with respect to taking certain actions regarding business combinations or proxy solicitations concerning the composition of our Board of Directors. In connection with the proposed Merger, Leucadia and certain of its affiliates entered into a shareholder support and voting agreement, under which each of them agreed to vote as shareholders in favor of the Merger Agreement, pursuant to the terms and conditions of such voting agreement.
Fairholme Funds Inc. (“Fairholme”) owns approximately 18% of our outstanding common stock. As a result, Fairholme could exert significant influence over matters requiring shareholder approval, including approval of significant corporate transactions such as the Merger. This concentration of ownership may delay or prevent a change in control and make the approval of certain transactions more difficult without their support. We have entered into a standstill agreement with Fairholme which expires on December 31, 2010. Subsequent to the termination of the standstill agreement, Fairholme will not be restricted from taking certain actions regarding business combinations or proxy solicitations concerning the composition of our Board of Directors. In connection with the proposed Merger, Fairholme and certain of its affiliates entered into a shareholder support
19
Table of Contents
and voting agreement, under which each of them agreed to vote as shareholders in favor of the Merger Agreement, pursuant to the terms and conditions of such voting agreement.
Labor Market Conditions. Competition to hire and retain personnel possessing the skills and experience required by us could contribute to an increase in our employee turnover rate. High turnover or an inability to attract and retain qualified personnel could have an adverse effect on our delinquency, default and net loss rates, our ability to grow and, ultimately, our financial condition, liquidity, and results of operations.
Data Integrity. If third parties or our employees are able to penetrate our network security or otherwise misappropriate our customers’ personal information or loan information, or if we give third parties or our employees improper access to our customers’ personal information or loan information, we could be subject to liability. This liability could include identity theft or other similar fraud-related claims. This liability could also include claims for other misuses or losses of personal information, including for unauthorized marketing purposes. Other liabilities could include claims alleging misrepresentation of our privacy and data security practices.
We rely on encryption and authentication technology licensed from third parties to provide the security and authentication necessary to effect secure online transmission of confidential consumer information. Advances in computer capabilities, new discoveries in the field of cryptography or other events or developments may result in a compromise or breach of the algorithms that we use to protect sensitive customer transaction data. A party who is able to circumvent our security measures could misappropriate proprietary information or cause interruptions in our operations. We may be required to expend capital and other resources to protect against such security breaches or to alleviate problems caused by such breaches. Our security measures are designed to protect against security breaches, but our failure to prevent such security breaches could subject us to liability, decrease our profitability, and damage our reputation.
Regulation. Reference should be made to Item 1. “Business – Regulation” for a discussion of regulatory risk factors.
Competition. Reference should be made to Item 1. “Business – Competition” for a discussion of competitive risk factors.
Litigation. As a consumer finance company, we are subject to various consumer claims and litigation seeking damages and statutory penalties, based upon, among other things, usury, disclosure inaccuracies, wrongful repossession, violations of bankruptcy stay provisions, certificate of title disputes, fraud, breach of contract and discriminatory treatment of credit applicants. Some litigation against us could take the form of class action complaints by consumers and/or shareholders. As the assignee of finance contracts originated by dealers, we may also be named as a co-defendant in lawsuits filed by consumers principally against dealers. The damages and penalties claimed by consumers in these types of matters can be substantial. The relief requested by the plaintiffs varies but can include requests for compensatory, statutory and punitive damages. We believe that we have taken prudent steps to address and mitigate the litigation risks associated with our business activities. However, any adverse resolution of litigation pending or threatened against us could have a material adverse affect on our financial condition, results of operations and cash flows.
On July 21, 2010, we entered into the Merger Agreement. A public announcement of the agreement was made on July 22, 2010. In accordance with the Merger Agreement, we filed a preliminary proxy statement with the SEC on August 20, 2010. Litigation has been commenced with respect to the proposed Merger. See Item 3 – “Legal Proceedings” for further discussion.
| ITEM 1B. UNRESOLVED | STAFF COMMENTS |
None
20
Table of Contents
| ITEM 2. | PROPERTIES |
Our executive offices are located at 801 Cherry Street, Suite 3500, Fort Worth, Texas, in a 51,000 square foot office space under a ten-year lease that commenced in June 2009.
We also lease 46,000 square feet of office space in Charlotte, North Carolina under a lease expiring in June 2012, 85,000 square feet of office space in Peterborough, Ontario under a lease expiring in July 2019, 62,000 square feet of office space in Chandler, Arizona, under a lease expiring in September 2015 and 250,000 square feet of office space in Arlington, Texas, under a twelve-year agreement with renewal options that commenced in August 2005. We also own a 250,000 square foot servicing facility in Arlington, Texas. Our regional credit centers are generally leased under agreements with original terms of three to five years. Such facilities are typically located in a suburban office building and consist of between 2,000 and 6,000 square feet of space.
| ITEM 3. | LEGAL PROCEEDINGS |
As a consumer finance company, we are subject to various consumer claims and litigation seeking damages and statutory penalties, based upon, among other things, usury, disclosure inaccuracies, wrongful repossession, violations of bankruptcy stay provisions, certificate of title disputes, fraud, breach of contract and discriminatory treatment of credit applicants. Some litigation against us could take the form of class action complaints by consumers and/or shareholders. As the assignee of finance contracts originated by dealers, we may also be named as a co-defendant in lawsuits filed by consumers principally against dealers. The damages and penalties claimed by consumers in these types of matters can be substantial. The relief requested by the plaintiffs varies but can include requests for compensatory, statutory and punitive damages. We believe that we have taken prudent steps to address and mitigate the litigation risks associated with our business activities. However, any adverse resolution of litigation pending or threatened against us could have a material adverse affect on our financial condition, results of operations and cash flows.
On July 21, 2010, we entered into the Merger Agreement. The following litigation has been commenced with respect to the proposed Merger:
On July 27, 2010, an action styled Robert Hatfield, Derivatively on behalf of AmeriCredit Corp. vs. Clifton H. Morris, Jr., Daniel E. Berce, John Clay, Ian M. Cumming, A.R. Dike, James H. Greer, Douglas K. Higgins, Kenneth H. Jones, Jr., Robert B. Sturges, Justin R. Wheeler, General Motors Holdings LLC and General Motors Company, Defendants, and AmeriCredit Corp., Nominal Defendant, was filed in the District Court of Tarrant County, Texas, Cause No. 017 246937 10 (the “Hatfield Case”). In the Hatfield Case, the plaintiff alleges, among other allegations, that the individual defendants, who are members of our Board of Directors, breached their fiduciary duties with regards to the pending transaction between us and GM Holdings. Among other relief, the complaint seeks to enjoin the closing of the transaction, to require us to rescind the transaction and the recovery of attorney fees and expenses.
On July 28, 2010, an action styled Labourers’ Pension Fund of Central and Eastern Canada, on behalf of itself and all others similarly situated v. AmeriCredit Corp., Clifton H. Morris, Jr., Daniel E. Berce, Bruce R. Berkowitz, John R. Clay, Ian M. Cumming, A.R. Dike, James H. Greer, Douglas K. Higgins, Kenneth H. Jones, Jr., Justin R. Wheeler and General Motors Company, Defendants, was filed in the District Court of Tarrant County, Texas, Cause No. 236 246960 10 (the “Labourers’ Pension Fund Case”). In the Labourers’ Pension Fund Case, the plaintiff seeks class action status and alleges that members of our Board of Directors breached their fiduciary duties in negotiating and approving the proposed transaction between us and GM Holdings. Among other relief, the complaint seeks to enjoin both the transaction from closing as well as a shareholder vote on the pending transaction and seeks the recovery of damages on behalf of shareholders and the recovery of attorney fees and expenses. The court has not yet determined whether the case may be maintained as a class action.
On August 6, 2010, an action styled Carla Butler, Derivatively on behalf of AmeriCredit Corp., Plaintiff vs. Clifton H. Morris, Jr., Daniel E. Berce, John Clay, Ian M. Cumming, A.R. Dike, James H. Greer, Douglas K.
21
Table of Contents
Higgins, Kenneth H. Jones, Jr., Robert B. Sturges, Justin R. Wheeler, General Motors Holdings LLC and General Motors Company, Defendants, and AmeriCredit Corp., Nominal Defendant, was filed in the District Court of Tarrant County, Texas, Cause No. 67 247227-10 (the “Butler Case”). In the Butler Case, like previously filed litigation related to the proposed transaction between us and GM Holdings, the complaint alleges that our individual officers and directors breached their fiduciary duties. Among other relief, the complaint seeks to rescind the transaction and enjoin its consummation and also to award plaintiff costs and disbursements including attorneys’ and expert fees.
On August 24, 2010, an action styled Asbestos Workers Local 42 Pension Fund, Plaintiff vs. Daniel E. Berce, Clifton H. Morris, Ian M. Cumming, Justin R. Wheeler, James H. Greer, A.R. Dike, Douglas K. Higgins, Kenneth H. Jones, Jr., John R. Clay, Robert B. Sturges, General Motors Holdings LLC and Goalie Texas Holdco Inc., Defendants, and AmeriCredit Corp., Nominal Defendant, was filed in the District Court of Tarrant County, Texas, Cause No. 017 247635-10 (the “Asbestos Workers Case”). In the Asbestos Workers Case, like previously filed litigation related to the proposed transaction between us and GM Holdings, the complaint alleges that our individual officers and directors breached their fiduciary duties. Among other relief, the complaint seeks to rescind the transaction and enjoin its consummation and also to award plaintiff costs and disbursements including attorneys’ and expert fees.
We believe that the claims alleged in the Hatfield Case, the Labourers’ Pension Fund Case, the Butler Case and the Asbestos Workers Case are without merit and we intend to assert vigorous defenses to the litigation. Neither the likelihood of an unfavorable outcome nor the amount of ultimate liability, if any, with respect to this litigation can be determined at this time.
| ITEM 4. | REMOVED AND RESERVED |
22
Table of Contents
PART II
| ITEM 5. | MARKET FOR REGISTRANT’S COMMON EQUITY AND RELATED STOCKHOLDER MATTERS |
Market Information
Our common stock trades on the New York Stock Exchange under the symbol ACF. As of August 26, 2010, there were 135,390,408 shares of common stock outstanding and 197 shareholders of record.
The following table sets forth the range of the high, low and closing sale prices for our common stock as reported on the Composite Tape of the New York Stock Exchange Listed Issues.
| High | Low | Close | |||||||
| Fiscal year ended June 30, 2010 |
|||||||||
| First Quarter |
$ | 18.00 | $ | 11.51 | $ | 15.79 | |||
| Second Quarter |
20.10 | 14.71 | 19.04 | ||||||
| Third Quarter |
24.55 | 18.69 | 23.76 | ||||||
| Fourth Quarter |
26.49 | 18.14 | 18.22 | ||||||
| Fiscal year ended June 30, 2009 |
|||||||||
| First Quarter |
$ | 14.90 | $ | 6.26 | $ | 10.13 | |||
| Second Quarter |
10.58 | 2.85 | 7.64 | ||||||
| Third Quarter |
8.50 | 3.07 | 5.86 | ||||||
| Fourth Quarter |
14.40 | 5.67 | 13.55 | ||||||
Dividend Policy
We have never paid cash dividends on our common stock. The indentures pursuant to which our senior notes and convertible senior notes were issued contain certain restrictions on the payment of dividends. We presently intend to retain future earnings, if any, for use in the operation of the business and do not anticipate paying any cash dividends in the foreseeable future.
Stock Repurchases
We have repurchased $1,374.8 million of our common stock since inception of our share repurchase program in April 2004, and we have remaining authorization to repurchase $172.0 million of our common stock. Covenants in our indentures entered into with respect to our senior notes and our convertible senior notes limit our ability to repurchase stock. We do not anticipate pursuing repurchase activity for the foreseeable future.
23
Table of Contents
Performance Graph
The following performance graph presents cumulative shareholder returns on our Common Stock for the five years ended June 30, 2010. In the performance graph, we are compared to (i) the S&P 500 and (ii) the S&P Consumer Finance Index. Each Index assumes $100 invested at the beginning of the measurement period and is calculated assuming quarterly reinvestment of dividends and quarterly weighting by market capitalization.
The data source for the graphs is Hemscott Inc., an authorized licensee of S&P.
Comparison of Cumulative Shareholder Return 2005-2010
COMPARISON OF CUMULATIVE TOTAL RETURN
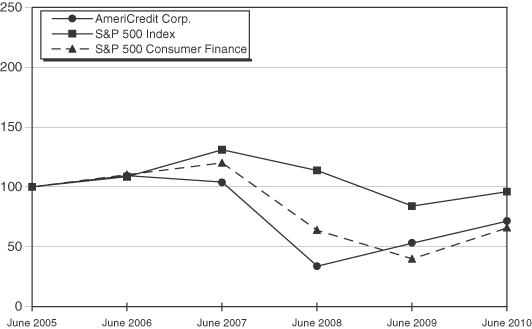
| June 2005 | June 2006 | June 2007 | June 2008 | June 2009 | June 2010 | |||||||||||||
| AmeriCredit Corp. |
$ | 100.00 | $ | 109.49 | $ | 104.12 | $ | 33.80 | $ | 53.14 | $ | 71.45 | ||||||
| S&P 500 |
$ | 100.00 | $ | 108.63 | $ | 131.00 | $ | 113.81 | $ | 83.97 | $ | 96.09 | ||||||
| S&P Consumer Finance |
$ | 100.00 | $ | 110.09 | $ | 120.07 | $ | 63.71 | $ | 40.00 | $ | 65.89 | ||||||
24
Table of Contents
| ITEM 6. | SELECTED FINANCIAL DATA |
The table below summarizes selected financial information. For additional information, refer to the audited consolidated financial statements and notes thereto in Item 8. Financial Statements and Supplementary Data.
| Years Ended June 30, |
2010 | 2009 | 2008 | 2007 | 2006 | ||||||||||||
| (dollars in thousands, except per share data) | |||||||||||||||||
| Operating Data |
|||||||||||||||||
| Finance charge income |
$ | 1,431,319 | $ | 1,902,684 | $ | 2,382,484 | $ | 2,142,470 | $ | 1,641,125 | |||||||
| Other revenue |
91,498 | 164,640 | 160,598 | 197,453 | 170,213 | ||||||||||||
| Total revenue |
1,522,817 | 2,067,324 | 2,543,082 | 2,339,923 | 1,811,338 | ||||||||||||
| Impairment of goodwill |
212,595 | ||||||||||||||||
| Net income (loss) |
220,546 | (10,889 | ) | (82,369 | ) | 349,963 | 306,183 | ||||||||||
| Basic earnings (loss) per Share |
1.65 | (0.09 | ) | (0.72 | ) | 2.94 | 2.29 | ||||||||||
| Diluted earnings (loss) per Share |
1.60 | (0.09 | ) | (0.72 | ) | 2.65 | 2.08 | ||||||||||
| Diluted weighted average Shares |
138,179,945 | 125,239,241 | 114,962,241 | 133,224,945 | 148,824,916 | ||||||||||||
| Other Data |
|||||||||||||||||
| Origination volume(a) |
$ | 2,137,620 | $ | 1,285,091 | $ | 6,293,494 | $ | 8,454,600 | $ | 6,208,004 | |||||||
| June 30, |
2010 | 2009 | 2008 (a) | 2007 (a) | 2006 | ||||||||||||
| (in thousands) | |||||||||||||||||
| Balance Sheet Data |
|||||||||||||||||
| Cash and cash equivalents |
$ | 282,273 | $ | 193,287 | $ | 433,493 | $ | 910,304 | $ | 513,240 | |||||||
| Finance receivables, net |
8,160,208 | 10,037,329 | 14,030,299 | 15,102,370 | 11,097,008 | ||||||||||||
| Total assets |
9,881,033 | 11,958,327 | 16,508,201 | 17,762,999 | 13,067,865 | ||||||||||||
| Credit facilities |
598,946 | 1,630,133 | 2,928,161 | 2,541,702 | 2,106,282 | ||||||||||||
| Securitization notes payable |
6,108,976 | 7,426,687 | 10,420,327 | 11,939,447 | 8,518,849 | ||||||||||||
| Senior notes |
70,620 | 91,620 | 200,000 | 200,000 | |||||||||||||
| Convertible senior notes |
414,068 | 392,514 | 642,599 | 620,537 | 200,000 | ||||||||||||
| Total liabilities |
7,480,609 | 9,851,019 | 14,542,939 | 15,606,407 | 11,058,979 | ||||||||||||
| Shareholders’ equity |
2,400,424 | 2,107,308 | 1,965,262 | 2,156,592 | 2,008,886 | ||||||||||||
| Other Data |
|||||||||||||||||
| Finance receivables |
8,733,518 | 10,927,969 | 14,981,412 | 15,922,458 | 11,775,665 | ||||||||||||
| Gain on sale receivables |
24,091 | 421,037 | |||||||||||||||
| Managed receivables |
8,733,518 | 10,927,969 | 14,981,412 | 15,946,549 | 12,196,702 | ||||||||||||
| (a) | Fiscal 2008 and 2007 amounts include $218.1 million and $34.9 million of contracts purchased through our leasing program, respectively. |
25
Table of Contents
| ITEM 7. | MANAGEMENT’S DISCUSSION AND ANALYSIS OF FINANCIAL CONDITION AND RESULTS OF OPERATIONS |
Recent Events
On July 21, 2010, we entered into an Agreement and Plan of Merger (the “Merger Agreement”) with General Motors Holdings LLC (“GM Holdings”), a Delaware limited liability company and a wholly owned subsidiary of General Motors Company (“General Motors”), and Goalie Texas Holdco Inc. (“Merger Sub”), a Texas corporation and a direct wholly owned subsidiary of GM Holdings. Under the terms of the Merger Agreement, Merger Sub will be merged with and into AmeriCredit, with AmeriCredit continuing as the surviving corporation and a direct wholly owned subsidiary of GM Holdings. Pursuant to the terms of the Merger Agreement and subject to the satisfaction or waiver of the closing conditions set forth in the Merger Agreement, at the Effective Time each share of our common stock issued and outstanding immediately prior to the Effective Time (other than (i) any shares held by us or any of our subsidiaries immediately prior to the Effective Time, which shares will be cancelled with no consideration in exchange for such cancellation, and (ii) any shares held by our shareholders who are entitled to and who properly exercise appraisal rights under Texas law) will be converted into the right to receive $24.50 in cash, without interest.
There is no assurance that the Merger with GM Holdings will occur. The closing of the Merger is subject to the satisfaction of certain closing conditions, including the approval of the Merger by our shareholders. The timing of such approval and the closing of the Merger are subject to factors beyond our control. While our Board of Directors has unanimously recommended that our shareholders adopt and approve the Merger Agreement, we cannot predict the outcome of the shareholder vote. The Merger will not close if the requisite approval is not received from our shareholders.
The Merger Agreement contains customary representations and warranties of AmeriCredit, GM Holdings and Merger Sub. The Merger Agreement also contains customary covenants and agreements, including covenants relating to (a) the conduct of our business between the date of the signing of the Merger Agreement and the closing of the Merger, (b) non-solicitation of competing acquisition proposals and (c) the efforts of the parties to cause the Merger to be completed.
GENERAL
We are a leading independent auto finance company specializing in purchasing retail automobile installment sales contracts originated by franchised and select independent dealers in connection with the sale of used and new automobiles. We generate revenue and cash flows primarily through the purchase, retention, subsequent securitization and servicing of finance receivables. As used herein, “loans” include auto finance receivables originated by dealers and purchased by us. To fund the acquisition of receivables prior to securitization, we use available cash and borrowings under our credit facilities. We earn finance charge income on the finance receivables and pay interest expense on borrowings under our credit facilities.
Through wholly-owned subsidiaries, we periodically transfer receivables to securitization trusts (“Trusts”) that issue asset-backed securities to investors. We retain an interest in these securitization transactions in the form of restricted cash accounts and overcollateralization, whereby more receivables are transferred to the Trusts than the amount of asset-backed securities issued by the Trusts, as well as the estimated future excess cash flows expected to be received by us over the life of the securitization. Excess cash flows result from the difference between the finance charges received from the obligors on the receivables and the interest paid to investors in the asset-backed securities, net of credit losses and expenses.
Excess cash flows from the Trusts are initially utilized to fund credit enhancement requirements in order to attain specific credit ratings for the asset-backed securities issued by the Trusts. Once targeted credit enhancement requirements are reached and maintained, excess cash flows are distributed to us or, in a securitization utilizing a senior subordinated structure, may be used to accelerate the repayment of certain
26
Table of Contents
subordinated securities. In addition to excess cash flows, we receive monthly base servicing fees and we collect other fees, such as late charges, as servicer for securitization Trusts. For securitization transactions that involve the purchase of a financial guaranty insurance policy, credit enhancement requirements will increase if specified portfolio performance ratios are exceeded. Excess cash flows otherwise distributable to us from Trusts in which the portfolio performance ratios were exceeded and from other Trusts which may be subject to limited cross-collateralization provisions are accumulated in the Trusts until such higher levels of credit enhancement are reached and maintained. Senior subordinated securitizations typically do not utilize portfolio performance ratios.
We structure our securitization transactions as secured financings. Accordingly, following a securitization, the finance receivables and the related securitization notes payable remain on the consolidated balance sheets. We recognize finance charge and fee income on the receivables and interest expense on the securities issued in the securitization transaction and record a provision for loan losses to cover probable loan losses on the receivables.
Prior to October 1, 2002, our securitization transactions were structured as sales of finance receivables. In connection with the acquisitions described below, we also acquired two securitization Trusts which were accounted for as sales of finance receivables. Receivables sold under this structure are referred to herein as “gain on sale receivables.” At June 30, 2010, we had no outstanding gain on sale securitizations.
On May 1, 2006, we acquired the stock of Bay View Acceptance Corporation (“BVAC”). BVAC served auto dealers in 32 states offering specialized auto finance products, including extended term financing and higher loan-to-value advances to consumers with prime credit bureau scores.
On January 1, 2007, we acquired the stock of Long Beach Acceptance Corporation (“LBAC”). LBAC served auto dealers in 34 states offering auto finance products primarily to consumers with near prime credit bureau scores.
The operations of BVAC and LBAC have been integrated into our origination, servicing and administrative activities and we provide auto finance products solely under the AmeriCredit Financial Services, Inc. name.
CRITICAL ACCOUNTING ESTIMATES
The preparation of financial statements in conformity with generally accepted accounting principles requires management to make estimates and assumptions which affect the reported amounts of assets and liabilities and the disclosures of contingent assets and liabilities as of the date of the financial statements and the amount of revenue and costs and expenses during the reporting periods. Actual results could differ from those estimates and those differences may be material. The accounting estimates that we believe are the most critical to understanding and evaluating our reported financial results include the following:
Allowance for loan losses
The allowance for loan losses is established systematically based on the determination of the amount of probable credit losses inherent in the finance receivables as of the reporting date. We review charge-off experience factors, delinquency reports, historical collection rates, estimates of the value of the underlying collateral, economic trends, such as unemployment rates, and other information in order to make the necessary judgments as to the probable credit losses. We also use historical charge-off experience to determine a loss confirmation period, which is defined as the time between when an event, such as delinquency status, giving rise to a probable credit loss occurs with respect to a specific account and when such account is charged off. This loss confirmation period is applied to the forecasted probable credit losses to determine the amount of losses inherent in finance receivables at the reporting date. Assumptions regarding credit losses and loss confirmation periods are reviewed periodically and may be impacted by actual performance of finance receivables and changes in any of the factors discussed above. Should the credit loss assumption or loss confirmation period increase, there would be an increase in the amount of allowance for loan losses required, which would decrease the net carrying value of finance receivables and increase the amount of provision for loan losses recorded on the consolidated
27
Table of Contents
statements of operations and comprehensive operations. A 10% and 20% increase in cumulative net credit losses over the loss confirmation period would increase the allowance for loan losses as of June 30, 2010, as follows (in thousands):
| 10% adverse change |
20% adverse change | |||||
| Impact on allowance for loan losses |
$ | 57,331 | $ | 114,662 | ||
We believe that the allowance for loan losses is adequate to cover probable losses inherent in our receivables; however, because the allowance for loan losses is based on estimates, there can be no assurance that the ultimate charge-off amount will not exceed such estimates or that our credit loss assumptions will not increase.
Income Taxes
We are subject to income tax in the United States and Canada. In the ordinary course of our business, there may be transactions, calculations, structures and filing positions where the ultimate tax outcome is uncertain. At any point in time, multiple tax years are subject to audit by various taxing jurisdictions and we record liabilities for estimated tax results based on the requirements of the accounting for uncertainty in income taxes. Management believes that the estimates it uses are reasonable. However, due to expiring statutes of limitations, audits, settlements, changes in tax law or new authoritative rulings, no assurance can be given that the final outcome of these matters will be comparable to what was reflected in the historical income tax provisions and accruals. We may need to adjust our accrued tax assets or liabilities if actual results differ from estimated results or if we adjust these assumptions in the future, which could materially impact the effective tax rate, earnings, accrued tax balances and cash.
As a part of our financial reporting process, we must assess the likelihood that our deferred tax assets can be recovered. Unless recovery is more likely than not, the provision for income taxes must be increased by recording a reserve in the form of a valuation allowance for all or a portion of the deferred tax assets. In this process, certain criteria are evaluated including the existence of deferred tax liabilities that can be used to absorb deferred tax assets, taxable income in prior carryback years that can be used to absorb net operating losses, credit carrybacks, estimated taxable income in future years and the duration of the carryforward periods. We incurred a significant taxable loss for fiscal 2009. On November 6, 2009, the Worker, Homeownership, and Business Assistance Act of 2009 was signed into law which provides an election to carryback a loss to the third, fourth or fifth year that precedes the year of loss. Because of this change in tax law, we elected to extend our U.S. federal fiscal 2009 net operating loss (“NOL”) carryback period. We have fully utilized our federal NOL. In contrast to U.S. federal tax rules, there is generally no carryback potential for the majority of U.S. state tax jurisdictions and the various state carryforward periods range from 5 to 20 years. We have established a valuation allowance against a portion of our state tax net operating loss. Our judgment regarding future taxable income may change due to evolving corporate and operational strategies, market conditions, changes in U.S., state or international tax laws and other factors which may later alter our judgment of the utilization of these assets.
RESULTS OF OPERATIONS
Year Ended June 30, 2010 as compared to Year Ended June 30, 2009
Changes in Finance Receivables
A summary of changes in our finance receivables is as follows (in thousands):
| Years Ended June 30, |
2010 | 2009 | ||||||
| Balance at beginning of period |
$ | 10,927,969 | $ | 14,981,412 | ||||
| Loans purchased |
2,137,620 | 1,285,091 | ||||||
| Liquidations and other |
(4,332,071 | ) | (5,338,534 | ) | ||||
| Balance at end of period |
$ | 8,733,518 | $ | 10,927,969 | ||||
| Average finance receivables |
$ | 9,495,125 | $ | 13,001,773 | ||||
28
Table of Contents
The increase in loans purchased during fiscal 2010 as compared to fiscal 2009 was primarily due to our establishing higher loan origination goals as a result of improved access to the securitization markets. Loan production targets were constrained during fiscal 2009 in order to preserve capital and liquidity. The decrease in liquidations and other resulted primarily from reduced average finance receivables.
The average new loan size increased to $18,209 for fiscal 2010 from $17,507 for fiscal 2009. The average annual percentage rate for finance receivables purchased during fiscal 2010 was 17.0% for both fiscal 2010 and fiscal 2009.
Net Margin
Net margin is the difference between finance charge and other income earned on our receivables and the cost to fund the receivables as well as the cost of debt incurred for general corporate purposes.
Our net margin as derived from the consolidated statements of operations and comprehensive operations is as follows (in thousands):
| Years Ended June 30, |
2010 | 2009 | ||||||
| Finance charge income |
$ | 1,431,319 | $ | 1,902,684 | ||||
| Other income |
91,215 | 116,488 | ||||||
| Interest expense |
(457,222 | ) | (726,560 | ) | ||||
| Net margin |
$ | 1,065,312 | $ | 1,292,612 | ||||
Net margin as a percentage of average finance receivables is as follows:
| Years Ended June 30, |
2010 | 2009 | ||||
| Finance charge income |
15.1 | % | 14.6 | % | ||
| Other income |
0.9 | 0.9 | ||||
| Interest expense |
(4.8 | ) | (5.6 | ) | ||
| Net margin as a percentage of average finance receivables |
11.2 | % | 9.9 | % | ||
The increase in net margin as a percentage of average finance receivables for fiscal 2010, as compared to fiscal 2009, was mainly due to higher annual percentage rates for finance receivables purchased since mid calendar year 2008, reduced interest costs as a result of declining leverage and lower interest rates on securitizations completed in fiscal 2010. Interest expense in fiscal 2009 was also adversely impacted by warrant costs and commitment fees associated with a forward purchase agreement that terminated in fiscal 2009.
Revenue
Finance charge income decreased by 24.8% to $1,431.3 million for fiscal 2010 from $1,902.7 million for fiscal 2009, primarily due to the decrease in average finance receivables. The effective yield on our finance receivables increased to 15.1% for fiscal 2010 from 14.6% for fiscal 2009. The effective yield represents finance charges and fees taken into earnings during the period as a percentage of average finance receivables and is lower than the contractual rates of our auto finance contracts due to finance receivables in nonaccrual status.
Other income consists of the following (in thousands):
| Years Ended June 30, | ||||||
| 2010 | 2009 | |||||
| Leasing income |
$ | 44,316 | $ | 47,073 | ||
| Investment income |
2,989 | 16,295 | ||||
| Late fees and other income |
43,910 | 53,120 | ||||
| $ | 91,215 | $ | 116,488 | |||
29
Table of Contents
Investment income decreased as a result of lower invested cash balances combined with lower market interest rates. Late fees and other income decreased as a result of the reduction in average finance receivables.
During fiscal 2010, we repurchased on the open market $21.0 million of senior notes due in 2015 at an average price of 97.3% of the principal amount of the notes repurchased, which resulted in a gain on retirement of debt of $0.3 million. Gain on retirement of debt for fiscal 2009 was $48.2 million. In fiscal 2009, we repurchased on the open market $60.0 million par value of our convertible senior notes due in 2013 at an average price of 44.1% of the principal amount, $200.0 million par value of our convertible senior notes due in 2023 at an average price of 99.5% of the principal amount, and $28.0 million par value of our convertible senior notes due in 2011 at an average price of 44.2% of the principal amount. In connection with these repurchases, we recorded a gain on retirement of debt of $33.5 million. We also issued 15,122,670 shares of our common stock to Fairholme Funds Inc. (“Fairholme”), in a non-cash transaction, in exchange for $108.4 million of our senior notes due 2015, held by Fairholme, at a price of $840 per $1,000 principal amount of the notes. We recognized a gain of $14.7 million, net of transaction costs, on retirement of debt in the exchange. Fairholme and its affiliates held approximately 19.8% of our outstanding common stock prior to the issuance of the shares described above.
Costs and Expenses
Operating Expenses
Operating expenses decreased to $288.8 million for fiscal 2010 from $308.8 million for fiscal 2009. Our operating expenses are predominately related to personnel costs that include base salary and wages, performance incentives and benefits as well as related employment taxes. Personnel costs represented 74.2% and 72.8% of total operating expenses for fiscal 2010 and 2009, respectively.
Operating expenses as a percentage of average finance receivables increased to 3.0% for fiscal 2010, as compared to 2.4% for fiscal 2009. The increase in operating expenses as a percentage of average finance receivables primarily resulted from the impact of a decreasing portfolio on our fixed cost base and higher loan origination staffing to support increased origination levels.
Provision for Loan Losses
Provisions for loan losses are charged to income to bring our allowance for loan losses to a level which management considers adequate to absorb probable credit losses inherent in the portfolio of finance receivables. The provision for loan losses recorded for fiscal 2010 and 2009 reflects inherent losses on receivables originated during those periods and changes in the amount of inherent losses on receivables originated in prior periods. The provision for loan losses decreased to $388.1 million for fiscal 2010 from $972.4 million for fiscal 2009 as a result of favorable credit performance of loans originated since early calendar year 2008, stabilization of economic conditions and improved recovery values on repossessed collateral. As a percentage of average finance receivables, the provision for loan losses was 4.1% and 7.5% for fiscal 2010 and 2009, respectively.
Interest Expense
Interest expense decreased to $457.2 million for fiscal 2010 from $726.6 million for fiscal 2009. Average debt outstanding was $8.0 billion and $11.8 billion for fiscal 2010 and 2009, respectively. Our effective rate of interest paid on our debt decreased to 5.7% for fiscal 2010 compared to 6.2% for fiscal 2009, due to lower interest on securitizations completed in fiscal 2010. Interest expense in fiscal 2009 was also adversely impacted by warrant costs and commitment fees associated with a forward purchase agreement that terminated in fiscal 2009.
Taxes
Our effective income tax rate was 37.6% for fiscal 2010. The fiscal 2009 effective tax rate was not meaningful due to the low absolute level of the loss before income taxes.
30
Table of Contents
Other Comprehensive Income (Loss)
Other comprehensive income (loss) consisted of the following (in thousands):
| Years Ended June 30, |
2010 | 2009 | ||||||
| Unrealized gains (losses) on cash flow hedges |
$ | 43,306 | $ | (26,871 | ) | |||
| Foreign currency translation adjustment |
8,230 | 750 | ||||||
| Income tax (provision) benefit |
(18,567 | ) | 11,426 | |||||
| $ | 32,969 | $ | (14,695 | ) | ||||
Cash Flow Hedges
Unrealized gains (losses) on cash flow hedges consisted of the following (in thousands):
| Years Ended June 30, |
2010 | 2009 | ||||||
| Unrealized losses related to changes in fair value |
$ | (36,761 | ) | $ | (109,115 | ) | ||
| Reclassification of unrealized losses into earnings |
80,067 | 82,244 | ||||||
| $ | 43,306 | $ | (26,871 | ) | ||||
Unrealized losses related to changes in fair value for fiscal 2010 and 2009, were due to changes in the fair value of interest rate swap agreements that were designated as cash flow hedges for accounting purposes. The fair value of the interest rate swap agreements changed in fiscal 2010 and 2009 because of significant declines in forward interest rates.
Unrealized gains (losses) on cash flow hedges of our floating rate debt are reclassified into earnings when interest rate fluctuations on securitization notes payable or other hedged items affect earnings.
Canadian Currency Translation Adjustment
Canadian currency translation adjustment gains of $8.2 million and $0.7 million for fiscal 2010 and 2009, respectively, were included in other comprehensive loss. The translation adjustment gains are due to the increase in the value of our Canadian dollar denominated assets related to the decline in the U.S. dollar to Canadian dollar conversion rates.
Year Ended June 30, 2009 as compared to Year Ended June 30, 2008
Changes in Finance Receivables
A summary of changes in our finance receivables is as follows (in thousands):
| Years Ended June 30, |
2009 | 2008 | ||||||
| Balance at beginning of period |
$ | 14,981,412 | $ | 15,922,458 | ||||
| Loans purchased |
1,285,091 | 6,075,412 | ||||||
| Loans repurchased from gain on sale Trusts |
18,401 | |||||||
| Liquidations and other |
(5,338,534 | ) | (7,034,859 | ) | ||||
| Balance at end of period |
$ | 10,927,969 | $ | 14,981,412 | ||||
| Average finance receivables |
$ | 13,001,773 | $ | 16,059,129 | ||||
31
Table of Contents
The decrease in loans purchased during fiscal 2009 as compared to fiscal 2008 was primarily due to significantly reduced loan origination targets in order to preserve capital and liquidity in fiscal 2009. The decrease in liquidations and other resulted primarily from reduced average finance receivables.
The average new loan size decreased to $17,507 for fiscal 2009 from $19,093 for fiscal 2008 primarily as a result of limiting loan-to-value ratios on new loan originations. The average annual percentage rate for finance receivables purchased during fiscal 2009 increased to 17.0 % from 15.4% during fiscal 2008 due to increased pricing on new loan originations necessitated by higher funding costs.
Net Margin
Net margin is the difference between finance charge and other income earned on our receivables and the cost to fund the receivables as well as the cost of debt incurred for general corporate purposes.
Our net margin as derived from the consolidated statements of operations and comprehensive operations is as follows (in thousands):
| Years Ended June 30, |
2009 | 2008 | ||||||
| Finance charge income |
$ | 1,902,684 | $ | 2,382,484 | ||||
| Other income |
116,488 | 160,598 | ||||||
| Interest expense |
(726,560 | ) | (858,874 | ) | ||||
| Net margin |
$ | 1,292,612 | $ | 1,684,208 | ||||
Net margin as a percentage of average finance receivables is as follows:
| Years Ended June 30, |
2009 | 2008 | ||||
| Finance charge income |
14.6 | % | 14.8 | % | ||
| Other income |
0.9 | 1.0 | ||||
| Interest expense |
(5.6 | ) | (5.3 | ) | ||
| Net margin as a percentage of average finance receivables |
9.9 | % | 10.5 | % | ||
The decrease in net margin for fiscal 2009, as compared to fiscal 2008, was the result of a lower effective yield on the portfolio due to higher delinquency levels in fiscal 2009 and an increase in funding costs primarily from the warrant costs and commitment fees related to a forward purchase agreement terminated in fiscal 2009.
Revenue
Finance charge income decreased by 20.1% to $1,902.7 million for fiscal 2009 from $2,382.5 million for fiscal 2008, primarily due to the decrease in average finance receivables. The effective yield on our finance receivables decreased to 14.6% for fiscal 2009 from 14.8% for fiscal 2008. The effective yield represents finance charges and fees taken into earnings during the period as a percentage of average finance receivables and is lower than the contractual rates of our auto finance contracts due to finance receivables in nonaccrual status.
Other income consists of the following (in thousands):
| Years Ended June 30, | ||||||
| 2009 | 2008 | |||||
| Investment income |
$ | 16,295 | $ | 56,769 | ||
| Leasing income |
47,073 | 40,679 | ||||
| Late fees and other income |
53,120 | 63,150 | ||||
| $ | 116,488 | $ | 160,598 | |||
32
Table of Contents
Investment income decreased as a result of lower invested cash balances combined with lower market interest rates. Late fees and other income decreased as a result of the reduction in average finance receivables.
Gain on retirement of debt for fiscal 2009 was $48.2 million. We repurchased on the open market, $60.0 million par value of our convertible senior notes due in 2013 at an average price of 44.1% of the principal amount, $200.0 million par value of our convertible senior notes due in 2023 at an average price of 99.5% of the principal amount, and $28.0 million par value of our convertible senior notes due in 2011 at an average price of 44.2% of the principal amount. In connection with these repurchases, we recorded a gain on retirement of debt of $33.5 million. We also issued 15,122,670 shares of our common stock to Fairholme in a non-cash transaction, in exchange for $108.4 million of our senior notes due 2015, held by Fairholme, at a price of $840 per $1,000 principal amount of the notes. We recognized a gain of $14.7 million, net of transaction costs, on retirement of debt in the exchange. Fairholme and its affiliates held approximately 19.8% of our outstanding common stock prior to the issuance of the shares described above.
Costs and Expenses
Operating Expenses
Operating expenses decreased to $308.8 million for fiscal 2009 from $397.8 million for fiscal 2008, as a result of cost savings from implementation of plans to reduce loan origination levels and related staffing and administrative support. Our operating expenses are predominately related to personnel costs that include base salary and wages, performance incentives and benefits as well as related employment taxes. Personnel costs represented 72.8% and 79.4% of total operating expenses for fiscal 2009 and 2008, respectively.
Operating expenses as a percentage of average finance receivables were 2.4% for fiscal 2009, as compared to 2.5% for fiscal 2008.
Provision for Loan Losses
Provisions for loan losses are charged to income to bring our allowance for loan losses to a level which management considers adequate to absorb probable credit losses inherent in the portfolio of finance receivables. The provision for loan losses recorded for fiscal 2009 and 2008 reflects inherent losses on receivables originated during those periods and changes in the amount of inherent losses on receivables originated in prior periods. The provision for loan losses decreased to $972.4 million for fiscal 2009 from $1,131.0 million for fiscal 2008 as a result of a lower level of receivables originated during fiscal 2009 and the improved credit profile of loans originated since early calendar year 2008, partially offset by higher expected future losses due to weaker economic conditions. As a percentage of average finance receivables, the provision for loan losses was 7.5% and 7.0% for fiscal 2009 and 2008, respectively.
Interest Expense
Interest expense decreased to $726.6 million for fiscal 2009 from $858.9 million for fiscal 2008. Average debt outstanding was $11.8 billion and $15.1 billion for fiscal 2009 and 2008, respectively. Our effective rate of interest paid on our debt increased to 6.2% for fiscal 2009 compared to 5.7% for fiscal 2008, due to warrant costs and commitment fees associated with a forward purchase agreement that was terminated in fiscal 2009.
Taxes
The fiscal 2009 effective tax rate was not meaningful due to the low absolute level of the loss before income taxes. The fiscal 2008 effective tax rate was impacted by the effect of no longer being permanently reinvested with respect to our Canadian subsidiaries, an impairment of non-deductible goodwill, adjustment of uncertain tax positions, and revision of deferred tax assets and liabilities.
33
Table of Contents
Other Comprehensive Loss
Other comprehensive loss consisted of the following (in thousands):
| Years Ended June 30, |
2009 | 2008 | ||||||
| Unrealized losses on cash flow hedges |
$ | (26,871 | ) | $ | (84,404 | ) | ||
| Foreign currency translation adjustment |
750 | 5,855 | ||||||
| Unrealized losses on credit enhancement assets |
(232 | ) | ||||||
| Income tax benefit |
11,426 | 26,683 | ||||||
| $ | (14,695 | ) | $ | (52,098 | ) | |||
Cash Flow Hedges
Unrealized losses on cash flow hedges consisted of the following (in thousands):
| Years Ended June 30, |
2009 | 2008 | ||||||
| Unrealized losses related to changes in fair value |
$ | (109,115 | ) | $ | (109,039 | ) | ||
| Reclassification of unrealized losses into earnings |
82,244 | 24,635 | ||||||
| $ | (26,871 | ) | $ | (84,404 | ) | |||
Unrealized losses related to changes in fair value for fiscal 2009 and 2008, were due to changes in the fair value of interest rate swap agreements that were designated as cash flow hedges for accounting purposes. The fair value of the interest rate swap agreements changed in fiscal 2009 and 2008 because of significant declines in forward interest rates.
Unrealized losses on cash flow hedges of our floating rate debt are reclassified into earnings when interest rate fluctuations on securitization notes payable or other hedged items affect earnings.
Canadian Currency Translation Adjustment
Canadian currency translation adjustment gains of $0.7 million and $5.9 million for fiscal 2009 and 2008, respectively, were included in other comprehensive loss. The translation adjustment gains are due to the increase in the value of our Canadian dollar denominated assets related to the decline in the U.S. dollar to Canadian dollar conversion rates.
CREDIT QUALITY
We provide financing in relatively high-risk markets, and, therefore, anticipate a corresponding high level of delinquencies and charge-offs.
The following table presents certain data related to the receivables portfolio (dollars in thousands):
| June 30, 2010 |
June 30, 2009 |
|||||||
| Principal amount of receivables, net of fees |
$ | 8,733,518 | $ | 10,927,969 | ||||
| Allowance for loan losses |
(573,310 | ) | (890,640 | ) | ||||
| Receivables, net |
$ | 8,160,208 | $ | 10,037,329 | ||||
| Number of outstanding contracts |
776,377 | 895,708 | ||||||
| Average carrying amount of outstanding contract (in dollars) |
$ | 11,249 | $ | 12,200 | ||||
| Allowance for loan losses as a percentage of receivables |
6.6% | 8.2% | ||||||
34
Table of Contents
The allowance for loan losses as a percentage of receivables decreased to 6.6% as of June 30, 2010, from 8.2% as of June 30, 2009, as a result of the favorable credit performance of loans originated since early calendar year 2008, stabilization of economic conditions and improved recovery rates on repossessed collateral.
Delinquency
The following is a summary of finance receivables that are (i) more than 30 days delinquent, but not yet in repossession, and (ii) in repossession, but not yet charged off (dollars in thousands):
| June 30, 2010 | June 30, 2009 | |||||||||||
| Amount | Percent | Amount | Percent | |||||||||
| Delinquent contracts: |
||||||||||||
| 31 to 60 days |
$ | 542,655 | 6.2 | % | $ | 753,086 | 6.9 | % | ||||
| Greater-than-60 days |
230,780 | 2.7 | 383,245 | 3.5 | ||||||||
| 773,435 | 8.9 | 1,136,331 | 10.4 | |||||||||
| In repossession |
31,457 | 0.4 | 49,280 | 0.5 | ||||||||
| $ | 804,892 | 9.3 | % | $ | 1,185,611 | 10.9 | % | |||||
An account is considered delinquent if a substantial portion of a scheduled payment has not been received by the date such payment was contractually due. Delinquencies in our managed receivables portfolio may vary from period to period based upon the average age or seasoning of the portfolio, seasonality within the calendar year and economic factors. Due to our target customer base, a relatively high percentage of accounts become delinquent at some point in the life of a loan and there is a high rate of account movement between current and delinquent status in the portfolio.
Delinquencies in finance receivables were lower at June 30, 2010, as compared to June 30, 2009, as a result of the favorable credit performance of loans originated since early calendar year 2008 and stabilization of economic conditions.
Deferrals
In accordance with our policies and guidelines, we, at times, offer payment deferrals to consumers, whereby the consumer is allowed to move up to two delinquent payments to the end of the loan generally by paying a fee (approximately the interest portion of the payment deferred, except where state law provides for a lesser amount). Our policies and guidelines limit the number and frequency of deferments that may be granted. Additionally, we generally limit the granting of deferments on new accounts until a requisite number of payments have been received. Due to the nature of our customer base and policies and guidelines of the deferral program, which policies and guidelines have not changed materially in several years, approximately 50% to 60% of accounts historically comprising the portfolio receive a deferral at some point in the life of the account.
An account for which all delinquent payments are cleared through a deferment transaction, which may include installment payments, is classified as current at the time the deferment is granted and therefore is not included as a delinquent account. Thereafter, such account is aged based on the timely payment of future installments in the same manner as any other account.
Contracts receiving a payment deferral as an average quarterly percentage of average receivables outstanding were 7.3%, 7.8% and 6.3% for fiscal 2010, 2009 and 2008, respectively. Deferment levels were lower in fiscal 2010 than in fiscal 2009 as a result of the stabilization of economic conditions.
35
Table of Contents
The following is a summary of total deferrals as a percentage of receivables outstanding:
| June 30, 2010 |
June 30, 2009 |
|||||
| Never deferred |
67.8 | % | 66.9 | % | ||
| Deferred: |
||||||
| 1-2 times |
22.4 | 26.0 | ||||
| 3-4 times |
9.7 | 7.0 | ||||
| Greater than 4 times |
0.1 | 0.1 | ||||
| Total deferred |
32.2 | 33.1 | ||||
| Total |
100.0 | % | 100.0 | % | ||
We evaluate the results of our deferment strategies based upon the amount of cash installments that are collected on accounts after they have been deferred versus the extent to which the collateral underlying the deferred accounts has depreciated over the same period of time. Based on this evaluation, we believe that payment deferrals granted according to our policies and guidelines are an effective portfolio management technique and result in higher ultimate cash collections from the portfolio.
Changes in deferment levels do not have a direct impact on the ultimate amount of finance receivables charged off by us. However, the timing of a charge-off may be affected if the previously deferred account ultimately results in a charge-off. To the extent that deferrals impact the ultimate timing of when an account is charged off, historical charge-off ratios and loss confirmation periods used in the determination of the adequacy of our allowance for loan losses are also impacted. Increased use of deferrals may result in a lengthening of the loss confirmation period, which would increase expectations of credit losses inherent in the loan portfolio and therefore increase the allowance for loan losses and related provision for loan losses. Changes in these ratios and periods are considered in determining the appropriate level of allowance for loan losses and related provision for loan losses.
Charge-offs
The following table presents charge-off data with respect to our finance receivables portfolio (dollars in thousands):
| Years Ended June 30, |
2010 | 2009 | 2008 | |||||||||
| Finance receivables: |
||||||||||||
| Repossession charge-offs |
$ | 1,232,318 | $ | 1,573,006 | $ | 1,496,713 | ||||||
| Less: Recoveries |
(543,910 | ) | (626,245 | ) | (670,307 | ) | ||||||
| Mandatory charge-offs(a) |
16,980 | 86,093 | 173,640 | |||||||||
| Net charge-offs |
$ | 705,388 | $ | 1,032,854 | $ | 1,000,046 | ||||||
| Net charge-offs as a percentage of average receivables: |
7.4 | % | 7.9 | % | 6.2 | % | ||||||
| Recoveries as a percentage of gross repossession charge-offs: |
44.1 | % | 39.8 | % | 44.8 | % | ||||||
| (a) | Mandatory charge-offs represent accounts 120 days delinquent that are charged off in full with no recovery amounts realized at time of charge-off net of any subsequent recoveries and the net write-down of finance receivables in repossession to the net realizable value of the repossessed vehicle when the repossessed vehicle is legally available for sale. |
Net charge-offs as a percentage of average receivables outstanding may vary from period to period based upon the average age or seasoning of the portfolio and economic factors. The decrease in net charge-offs as a percentage of average receivables for fiscal 2010, compared to fiscal 2009, was a result of the favorable credit performance of loans originated since early calendar year 2008, stabilization of economic conditions and improved recovery rates on repossessed collateral.
36
Table of Contents
LIQUIDITY AND CAPITAL RESOURCES
General
Our primary sources of cash have been finance charge income, servicing fees, distributions from securitization Trusts, borrowings under credit facilities, transfers of finance receivables to Trusts in securitization transactions and collections, recoveries on finance receivables and net proceeds from senior notes and convertible senior notes transactions. Our primary uses of cash have been purchases of finance receivables, repayment of credit facilities, securitization notes payable and other indebtedness, funding credit enhancement requirements for securitization transactions and credit facilities, repurchases of unsecured debt, operating expenses, and income tax payments.
We used cash of $2,090.6 million, $1,280.3 million and $6,260.2 million for the purchase of finance receivables during fiscal 2010, 2009 and 2008, respectively. Generally, these purchases were funded initially utilizing cash and borrowings under credit facilities and subsequently funded in securitization transactions.
Liquidity
Our available liquidity consisted of the following (in thousands):
| June 30, |
2010 | 2009 | ||||
| Cash and cash equivalents |
$ | 282,273 | $ | 193,287 | ||
| Borrowing capacity on unpledged eligible receivables |
489,552 | 289,424 | ||||
| Total |
$ | 771,825 | $ | 482,711 | ||
Credit Facilities
In the normal course of business, in addition to using our available cash, we pledge receivables to and borrow under our credit facilities to fund our operations and repay these borrowings as appropriate under our cash management strategy.
As of June 30, 2010, credit facilities consisted of the following (in millions):
| Facility Type |
Facility Amount |
Advances Outstanding | ||||
| Master/Syndicated warehouse facility(a) |
$ | 1,300.0 | ||||
| Medium term note facility(b) |
$ | 598.9 | ||||
| $ | 1,300.0 | $ | 598.9 | |||
| (a) | In February 2011 when the revolving period ends and if the facility is not renewed, the outstanding balance will be repaid over time based on the amortization of the receivables pledged until February 2012 when the remaining balance will be due and payable. |
| (b) | The revolving period under this facility ended in October 2009, and the outstanding debt balance will be repaid over time based on the amortization of the receivables pledged until October 2016 when any remaining amount outstanding will be due and payable. |
In February 2010, we amended our master/syndicated warehouse facility, which was approved by the eight lenders in the facility, to expand the size of the facility to $1.3 billion from $1.0 billion and to extend the revolving period to February 2011. On August 20, 2010, the master/syndicated warehouse facility was amended to allow for the change of control following the consummation of the pending Merger.
We are required to hold certain funds in restricted cash accounts to provide additional collateral for borrowings under our facilities. Additionally, our funding agreements contain various covenants requiring minimum financial ratios, asset quality and portfolio performance ratios (portfolio net loss and delinquency
37
Table of Contents
ratios, and pool level cumulative net loss ratios) as well as limits on deferment levels. Failure to meet any of these covenants could result in an event of default under these agreements. If an event of default occurs under these agreements, the lenders could elect to declare all amounts outstanding under these agreements to be immediately due and payable, enforce their interests against collateral pledged under these agreements or, with respect to the master/syndicated warehouse facility, restrict our ability to obtain additional borrowings.
Senior Notes
In June 2007, we issued $200.0 million of senior notes, which are uncollateralized, due in June 2015. Interest on the senior notes is payable semiannually at a rate of 8.5%. The notes will be redeemable, at our option, in whole or in part, at any time on or after July 1, 2011, at specific redemption prices.
In November 2008, we entered into a purchase agreement with Fairholme under which Fairholme purchased $123.2 million of asset-backed securities, consisting of $50.6 million of Class B Notes and $72.6 million of Class C Notes in the AmeriCredit Automobile Receivables Trust (“AMCAR”) 2008-2 transaction. We also issued 15,122,670 shares of our common stock to Fairholme, in a non-cash transaction, in exchange for $108.4 million of our senior notes due 2015, held by Fairholme, at a price of $840 per $1,000 principal amount of the notes. We recognized a gain of $14.7 million, net of transaction costs, on retirement of debt in the exchange. Fairholme and its affiliates held approximately 19.8% of our outstanding common stock prior to the issuance of the shares described above.
In March 2010, we repurchased on the open market $21.0 million of senior notes due in 2015 at an average price of 97.3% of the principal amount of the notes repurchased, which resulted in a gain on retirement of debt of $0.3 million.
Convertible Senior Notes
In September 2006, we issued $550.0 million of convertible senior notes of which $275.0 million are due in 2011, bearing interest at a rate of 0.75% per annum, and $275.0 million are due in 2013, bearing interest at a rate of 2.125% per annum. Interest on the notes is payable semiannually. Subject to certain conditions, the notes, which are uncollateralized, may be converted prior to maturity into shares of our common stock at an initial conversion price of $28.07 per share and $30.51 per share for the notes due in 2011 and 2013, respectively. Upon conversion, the conversion value will be paid in: 1) cash equal to the principal amount of the notes and 2) to the extent the conversion value exceeds the principal amount of the notes, shares of our common stock. The notes are convertible only in the following circumstances: 1) if the closing sale price of our common stock exceeds 130% of the conversion price during specified periods set forth in the indentures under which the notes were issued, 2) if the average trading price per $1,000 principal amount of the notes is less than or equal to 98% of the average conversion value of the notes during specified periods set forth in the indentures under which the notes were issued or 3) upon the occurrence of specific corporate transactions set forth in the indentures under which the notes were issued.
In conjunction with the issuance of the convertible senior notes, we purchased call options that entitle us to purchase shares of our common stock in an amount equal to the number of shares issued upon conversion of the notes at $28.07 per share and $30.51 per share for the notes due in 2011 and 2013, respectively. These call options are expected to allow us to offset the dilution of our shares if the conversion feature of the convertible senior notes is exercised.
We also sold warrants to purchase 9,796,408 shares of our common stock at $35 per share and 9,012,713 shares of our common stock at $40 per share for the notes due in 2011 and 2013, respectively. In no event are we required to deliver a number of shares in connection with the exercise of these warrants in excess of twice the aggregate number of shares initially issuable upon the exercise of the warrants.
38
Table of Contents
We have analyzed the conversion feature, call option and warrant transactions regarding accounting for derivative financial instruments indexed to and potentially settled in a company’s own stock and determined they meet the criteria for classification as equity transactions. As a result, both the cost of the call options and the proceeds of the warrants are reflected in additional paid-in capital on our consolidated balance sheets, and we will not recognize subsequent changes in their fair value.
As a result of adopting the accounting for convertible debt instruments that may be settled in cash upon conversion (including partial cash settlement), we have separately accounted for the liability and equity components of the convertible senior notes due in September 2011 and 2013, retrospectively, based on our determination that our borrowing rate at the time of issuance for unsecured senior debt without an equity conversion feature was approximately 7%. At issuance, the liability and equity components were $404.3 million and $145.7 million ($91.7 million net of deferred taxes), respectively. The debt discount is being amortized to interest expense based on the effective interest method. The carrying value as of June 30, 2010 was $414.1 million (net of debt discount of $47.9 million).
During fiscal 2009, we repurchased on the open market $28.0 million par value of our convertible senior notes due in 2011 at an average price of 44.2% of the principal amount of the notes repurchased. We also repurchased $60.0 million par value of our convertible senior notes due in 2013 at an average price of 44.1% of the principal amount of the notes repurchased. In connection with these repurchases, we recorded a gain on retirement of debt of $32.7 million.
During fiscal 2009, we repurchased and retired all $200.0 million of our convertible notes due in November 2023 at an average price equal to 99.5% of the principal amount of the notes redeemed. We recorded a gain on retirement of debt of $0.8 million.
Contractual Obligations
The following table summarizes the expected scheduled principal and interest payments, where applicable, under our contractual obligations (in thousands):
| Years Ending June 30, |
2011 | 2012 | 2013 | 2014 | 2015 | Thereafter | Total | ||||||||||||||
| Operating leases |
$ | 11,174 | $ | 11,097 | $ | 10,522 | $ | 10,248 | $ | 9,878 | $ | 24,560 | $ | 77,479 | |||||||
| Other notes payable |
118 | 118 | |||||||||||||||||||
| Medium term note facility |
212,542 | 165,604 | 124,646 | 74,570 | 21,201 | 383 | 598,946 | ||||||||||||||
| Securitization notes payable |
3,075,510 | 1,961,636 | 625,210 | 280,471 | 131,842 | 37,722 | 6,112,391 | ||||||||||||||
| Senior notes |
70,620 | 70,620 | |||||||||||||||||||
| Convertible senior notes |
247,000 | 215,017 | 462,017 | ||||||||||||||||||
| Total expected interest payments(a) |
218,277 | 116,339 | 62,347 | 33,611 | 13,720 | 1,048 | 445,342 | ||||||||||||||
| Total |
$ | 3,517,621 | $ | 2,501,676 | $ | 822,725 | $ | 613,917 | $ | 176,641 | $ | 134,333 | $ | 7,766,913 | |||||||
| (a) | Interest expense is calculated based on London Interbank Offered Rates (“LIBOR”) plus the respective credit spreads and specified fees associated with the medium term note facility, the coupon rate for the senior notes and convertible senior notes and a fixed rate of interest for our securitization notes payable. Interest expense on the floating rate tranches of the securitization notes payable is converted to a fixed rate based on the floating rate plus any expected hedge payments. |
We adopted the provisions of accounting for uncertain tax positions on July 1, 2007. As of June 30, 2010, we had liabilities associated with uncertain tax positions of $63.1 million. The table above does not include these liabilities due to the high degree of uncertainty regarding the future cash flows associated with these amounts.
39
Table of Contents
Securitizations
We have completed 70 securitization transactions through June 30, 2010, excluding securitization Trusts entered into by BVAC and LBAC prior to their acquisition by us. The proceeds from the transactions were primarily used to repay borrowings outstanding under our credit facilities.
A summary of the active transactions is as follows (in millions):
| Transaction |
Date | Original Amount | Balance at June 30, 2010 | |||||
| 2005-C-F |
August 2005 | $ | 1,100.0 | $ | 70.0 | |||
| 2005-D-A |
November 2005 | 1,400.0 | 118.6 | |||||
| 2006-1 |
March 2006 | 945.0 | 83.7 | |||||
| 2006-R-M |
May 2006 | 1,200.0 | 253.5 | |||||
| 2006-A-F |
July 2006 | 1,350.0 | 209.6 | |||||
| 2006-B-G |
September 2006 | 1,200.0 | 227.5 | |||||
| 2007-A-X |
January 2007 | 1,200.0 | 276.6 | |||||
| 2007-B-F |
April 2007 | 1,500.0 | 410.2 | |||||
| 2007-1 |
May 2007 | 1,000.0 | 263.5 | |||||
| 2007-C-M |
July 2007 | 1,500.0 | 481.2 | |||||
| 2007-D-F |
September 2007 | 1,000.0 | 347.9 | |||||
| 2007-2-M |
October 2007 | 1,000.0 | 347.7 | |||||
| 2008-A-F |
May 2008 | 750.0 | 343.7 | |||||
| 2008-1 |
October 2008 | 500.0 | 221.9 | |||||
| 2008-2 |
November 2008 | 500.0 | 230.8 | |||||
| 2009-1 |
July 2009 | 725.0 | 451.0 | |||||
| 2009-1 (APART) |
October 2009 | 227.5 | 163.3 | |||||
| 2010-1 |
February 2010 | 600.0 | 511.6 | |||||
| 2010-A |
March 2010 | 200.0 | 187.2 | |||||
| 2010-2 |
May 2010 | 600.0 | 583.2 | |||||
| BV2005-LJ-1 |
February 2005 | 232.1 | 11.3 | |||||
|
BV2005-LJ-2(a) |
July 2005 | 185.6 | 11.5 | |||||
| BV2005-3 |
December 2005 | 220.1 | 22.4 | |||||
| LB2005-A |
June 2005 | 350.0 | 15.7 | |||||
| LB2005-B |
October 2005 | 350.0 | 22.3 | |||||
| LB2006-A |
May 2006 | 450.0 | 49.6 | |||||
| LB2006-B |
September 2006 | 500.0 | 83.2 | |||||
| LB2007-A |
March 2007 | 486.0 | 110.3 | |||||
| Total active securitizations |
$ | 21,271.3 | $ | 6,109.0 | ||||
| (a) | Note balance does not include $1.4 million of asset-backed securities repurchased and retained by us as of June 30, 2010. |
We structure our securitization transactions as secured financings. Finance receivables are transferred to a securitization Trust, which is one of our special purpose finance subsidiaries, and the Trusts issue one or more series of asset-backed securities (securitization notes payable). While these Trusts are included in our consolidated financial statements, these Trusts are separate legal entities; thus the finance receivables and other assets held by these Trusts are legally owned by these Trusts, are available to satisfy the related securitization notes payable and are not available to our creditors or our other subsidiaries.
At the time of securitization of finance receivables, we are required to pledge assets equal to a specified percentage of the securitization pool to provide credit enhancement required for specific credit ratings for the asset-backed securities issued by the Trusts.
40
Table of Contents
Since the beginning of fiscal 2009, we have primarily utilized senior subordinated securitization structures which involve the sale of subordinated asset-backed securities to provide credit enhancement for the senior, or highest rated, asset-backed securities. On May 20, 2010, we closed a $600 million senior subordinated securitization transaction, AMCAR 2010-2, that has initial cash deposit and overcollateralization requirements of 8.25% in order to provide credit enhancement for the asset-backed securities sold, including the double-B rated securities which were the lowest rated securities sold. The level of credit enhancement in future senior subordinated securitizations will depend, in part, on the net interest margin, collateral characteristics, and credit performance trends of the receivables transferred, as well as our financial condition, the economic environment and our ability to sell subordinated bonds at rates we consider acceptable.
The second type of securitization structure we have utilized involves the purchase of a financial guaranty insurance policy issued by an insurer. On August 19, 2010, we closed a $200 million securitization transaction, AMCAR 2010-B, which was insured by Assured Guaranty Municipal Corp. (“Assured”), and has initial cash deposit and overcollateralization requirements of 17.0%. The asset-backed securities sold had an underlying rating of single-A without considering the benefit of the financial guaranty insurance policy.
Cash flows related to securitization transactions were as follows (in millions):
| Years Ended June 30, |
2010 | 2009 | 2008 | ||||||
| Initial credit enhancement deposits: |
|||||||||
| Restricted cash |
$ | 53.9 | $ | 25.8 | $ | 82.4 | |||
| Overcollateralization |
490.8 | 289.1 | 384.1 | ||||||
| Distributions from Trusts: |
|||||||||
| Secured Financing Trusts |
424.2 | 429.5 | 668.5 | ||||||
| Gain on sale Trusts |
7.5 | ||||||||
The agreements with the insurers of our securitization transactions covered by a financial guaranty insurance policy provide that if portfolio performance ratios (delinquency, cumulative default or cumulative net loss) in a Trust’s pool of receivables exceed certain targets, the specified credit enhancement levels would be increased.
The agreements that we have entered into with our financial guaranty insurance providers in connection with securitization transactions insured by them contain additional specified targeted portfolio performance ratios (delinquency, cumulative default and cumulative net loss) that are higher than the limits referred to above. If, at any measurement date, the targeted portfolio performance ratios with respect to any insured Trust were to exceed these additional levels, provisions of the agreements permit the financial guaranty insurance providers to declare the occurrence of an event of default and take steps to terminate our servicing rights to the receivables sold to that Trust. In addition, the servicing agreements on certain insured securitization Trusts are cross-defaulted so that a default declared under one servicing agreement would allow the financial guaranty insurance provider to terminate our servicing rights under all servicing agreements for securitization Trusts in which they issued a financial guaranty insurance policy. Additionally, if these higher targeted portfolio performance levels were exceeded and the financial guaranty insurance providers elect to declare an event of default, the insurance providers may retain all excess cash generated by other securitization transactions insured by them as additional credit enhancement. This, in turn, could result in defaults under our other securitizations and other material indebtedness, including under our senior note and convertible note indentures. Although we have never exceeded these additional targeted portfolio performance ratios, and we currently believe it is unlikely that an event of default would be declared and our servicing rights terminated if we were to exceed these higher targeted ratios, there can be no assurance that an event of default will not be declared and our servicing rights will not be terminated if (i) such targeted portfolio performance ratios are breached, (ii) we breach our obligations under the servicing agreements, (iii) the financial guaranty insurance providers are required to make payments under a policy, or (iv) certain bankruptcy or insolvency events were to occur. As of June 30, 2010, no such servicing right termination events have occurred with respect to any of the Trusts formed by us.
41
Table of Contents
During fiscal 2010, 2009 and 2008, we exceeded certain portfolio performance ratios in several AMCAR and LBAC securitizations. Excess cash flows from Trusts associated with these securitizations have been or are being used to build higher credit enhancement in each respective Trust instead of being distributed to us. We do not expect the trapping of excess cash flows from these Trusts to have a material adverse impact to our liquidity.
On January 22, 2010, we entered into an agreement with Assured to increase the levels of additional specified targeted portfolio performance ratios in the AMCAR 2007-D-F, AMCAR 2008-A-F, LB2006-B and LB2007-A securitizations. As part of this agreement, we deposited $38.0 million in the AMCAR 2007-D-F securitization restricted cash account and $57.0 million in the AMCAR 2008-A-F securitization restricted cash account. This cash is expected to be redistributed to us over time as the securitization notes pay down.
Stock Repurchases
We have repurchased $1,374.8 million of our common stock since inception of our share repurchase program in April 2004, and we have remaining authorization to repurchase $172.0 million of our common stock. Covenants in our indentures entered into with respect to our senior notes and convertible senior notes limit our ability to repurchase stock. Currently, we do not anticipate pursuing repurchase activity for the foreseeable future.
| ITEM 7A. QUANTITATIVE | AND QUALITATIVE DISCLOSURES ABOUT MARKET RISK |
Fluctuations in market interest rates impact our credit facilities and securitization transactions. Our gross interest rate spread, which is the difference between interest earned on our finance receivables and interest paid, is affected by changes in interest rates as a result of our dependence upon the issuance of variable rate securities and the incurrence of variable rate debt to fund our purchases of finance receivables.
Credit Facilities
Finance receivables purchased by us and pledged to secure borrowings under our credit facilities bear fixed interest rates. Amounts borrowed under our credit facilities bear interest at variable rates that are subject to frequent adjustments to reflect prevailing market interest rates. To protect the interest rate spread within each credit facility, our special purpose finance subsidiaries are contractually required to purchase interest rate cap agreements in connection with borrowings under our credit facilities. The purchaser of the interest rate cap agreement pays a premium in return for the right to receive the difference in the interest cost at any time a specified index of market interest rates rises above the stipulated “cap” rate. The purchaser of the interest rate cap agreement bears no obligation or liability if interest rates fall below the “cap” rate. As part of our interest rate risk management strategy and when economically feasible, we may simultaneously sell a corresponding interest rate cap agreement in order to offset the premium paid by our special purpose finance subsidiary to purchase the interest rate cap agreement and thus retain the interest rate risk. The fair value of the interest rate cap agreement purchased by the special purpose finance subsidiary is included in other assets and the fair value of the interest rate cap agreement sold by us is included in other liabilities on our consolidated balance sheets.
Securitizations
The interest rate demanded by investors in our securitization transactions depends on prevailing market interest rates for comparable transactions and the general interest rate environment. We utilize several strategies to minimize the impact of interest rate fluctuations on our gross interest rate margin, including the use of derivative financial instruments and the regular sale or pledging of auto receivables to securitization Trusts.
In our securitization transactions, we transfer fixed rate finance receivables to Trusts that, in turn, sell either fixed rate or floating rate securities to investors. The fixed rates on securities issued by the Trusts are indexed to market interest rate swap spreads for transactions of similar duration or various LIBOR and do not fluctuate
42
Table of Contents
during the term of the securitization. The floating rates on securities issued by the Trusts are indexed to LIBOR and fluctuate periodically based on movements in LIBOR. Derivative financial instruments, such as interest rate swap and cap agreements, are used to manage the gross interest rate spread on these transactions. We use interest rate swap agreements to convert the variable rate exposures on securities issued by our securitization Trusts to a fixed rate, thereby locking in the gross interest rate spread to be earned by us over the life of a securitization. Interest rate swap agreements purchased by us do not impact the amount of cash flows to be received by holders of the asset-backed securities issued by the Trusts. The interest rate swap agreements serve to offset the impact of increased or decreased interest paid by the Trusts on floating rate asset-backed securities on the cash flows to be received by us from the Trusts. We utilize such arrangements to modify our net interest sensitivity to levels deemed appropriate based on our risk tolerance. In circumstances where the interest rate risk is deemed to be tolerable, usually if the risk is less than one year in term at inception, we may choose not to hedge potential fluctuations in cash flows due to changes in interest rates. Our special purpose finance subsidiaries are contractually required to purchase a derivative financial instrument to protect the net spread in connection with the issuance of floating rate securities even if we choose not to hedge our future cash flows. Although the interest rate cap agreements are purchased by the Trusts, cash outflows from the Trusts ultimately impact our retained interests in the securitization transactions as cash expended by the securitization Trusts will decrease the ultimate amount of cash to be received by us. Therefore, when economically feasible, we may simultaneously sell a corresponding interest rate cap agreement to offset the premium paid by the Trust to purchase the interest rate cap agreement. The fair value of the interest rate cap agreements purchased by the special purpose finance subsidiaries in connection with securitization transactions are included in other assets and the fair value of the interest rate cap agreements sold by us are included in other liabilities on our consolidated balance sheets. Changes in the fair value of the interest rate cap agreements are reflected in interest expense on our consolidated statements of operations and comprehensive operations.
We have entered into interest rate swap agreements to hedge the variability in interest payments on eight of our active securitization transactions. Portions of these interest rate swap agreements are designated and qualify as cash flow hedges. The fair value of interest rate swap agreements designated as hedges is included in liabilities on the consolidated balance sheets. Interest rate swap agreements that are not designated as hedges are included in other assets on the consolidated balance sheets.
43
Table of Contents
The following table provides information about our interest rate-sensitive financial instruments by expected maturity date as of June 30, 2010 (dollars in thousands):
| Years Ending June 30, |
2011 | 2012 | 2013 | 2014 | 2015 | Thereafter | Fair Value | ||||||||||||||||||||
| Assets: |
|||||||||||||||||||||||||||
| Finance receivables |
|||||||||||||||||||||||||||
| Principal amounts |
$ | 3,820,633 | $ | 2,553,069 | $ | 1,385,146 | $ | 612,810 | $ | 262,155 | $ | 99,705 | $ | 8,110,223 | |||||||||||||
| Weighted average annual percentage rate |
15.89 | % | 15.90 | % | 15.94 | % | 16.02 | % | 15.90 | % | 15.77 | % | |||||||||||||||
| Interest rate swaps |
|||||||||||||||||||||||||||
| Notional amounts |
$ | 943,818 | $ | 669,225 | $ | 69,139 | $ | 26,194 | |||||||||||||||||||
| Average pay rate |
5.34 | % | 4.54 | % | 2.81 | % | |||||||||||||||||||||
| Average receive rate |
1.31 | % | 1.46 | % | 2.05 | % | |||||||||||||||||||||
| Interest rate caps purchased |
|||||||||||||||||||||||||||
| Notional amounts |
$ | 138,028 | $ | 84,780 | $ | 100,025 | $ | 118,011 | $ | 139,230 | $ | 194,382 | $ | 3,188 | |||||||||||||
| Average strike rate |
5.75 | % | 5.66 | % | 5.52 | % | 5.40 | % | 5.29 | % | 5.15 | % | |||||||||||||||
| Liabilities: |
|||||||||||||||||||||||||||
| Credit facilities |
|||||||||||||||||||||||||||
| Principal amounts |
$ | 212,542 | $ | 165,604 | $ | 124,646 | $ | 74,570 | $ | 21,201 | $ | 383 | $ | 598,946 | |||||||||||||
| Weighted average effective interest rate |
2.10 | % | 2.61 | % | 3.48 | % | 4.32 | % | 4.97 | % | 5.43 | % | |||||||||||||||
| Securitization notes payable |
|||||||||||||||||||||||||||
| Principal amounts |
$ | 3,075,510 | $ | 1,961,636 | $ | 625,210 | $ | 280,471 | $ | 131,842 | $ | 37,722 | $ | 6,230,902 | |||||||||||||
| Weighted average effective interest rate |
4.07 | % | 4.75 | % | 6.28 | % | 6.47 | % | 6.59 | % | 8.17 | % | |||||||||||||||
| Senior notes |
|||||||||||||||||||||||||||
| Principal amounts |
$ | 70,620 | $ | 70,620 | |||||||||||||||||||||||
| Weighted average effective interest rate |
8.50 | % | |||||||||||||||||||||||||
| Convertible senior notes |
|||||||||||||||||||||||||||
| Principal amounts |
$ | 247,000 | $ | 215,017 | $ | 414,007 | |||||||||||||||||||||
| Weighted average effective coupon interest rate |
0.75 | % | 2.125 | % | |||||||||||||||||||||||
| Interest rate swaps |
|||||||||||||||||||||||||||
| Notional amounts |
$ | 943,818 | $ | 669,225 | $ | 69,139 | $ | 70,421 | |||||||||||||||||||
| Average pay rate |
5.34 | % | 4.54 | % | 2.81 | % | |||||||||||||||||||||
| Average receive rate |
1.31 | % | 1.46 | % | 2.05 | % | |||||||||||||||||||||
| Interest rate caps sold |
|||||||||||||||||||||||||||
| Notional amounts |
$ | 71,859 | $ | 84,780 | $ | 100,025 | $ | 118,011 | $ | 139,230 | $ | 194,382 | $ | 3,320 | |||||||||||||
| Average strike rate |
5.76 | % | 5.66 | % | 5.52 | % | 5.40 | % | 5.29 | % | 5.15 | % | |||||||||||||||
44
Table of Contents
The following table provides information about our interest rate-sensitive financial instruments by expected maturity date as of June 30, 2009 (dollars in thousands):
| Years Ending June 30, |
2010 | 2011 | 2012 | 2013 | 2014 | Thereafter | Fair Value | ||||||||||||||||||||
| Assets: |
|||||||||||||||||||||||||||
| Finance receivables |
|||||||||||||||||||||||||||
| Principal amounts |
$ | 4,377,885 | $ | 3,049,845 | $ | 1,973,972 | $ | 1,083,894 | $ | 384,822 | $ | 57,551 | $ | 9,717,655 | |||||||||||||
| Weighted average annual percentage rate |
15.56 | % | 15.61 | % | 15.65 | % | 15.65 | % | 15.63 | % | 15.42 | % | |||||||||||||||
| Interest rate swaps |
|||||||||||||||||||||||||||
| Notional amounts |
$ | 864,354 | $ | 911,639 | $ | 744,329 | $ | 72,226 | $ | 24,267 | |||||||||||||||||
| Average pay rate |
4.24 | % | 4.20 | % | 3.16 | % | 1.72 | % | |||||||||||||||||||
| Average receive rate |
0.67 | % | 1.75 | % | 2.07 | % | 1.47 | % | |||||||||||||||||||
| Interest rate caps purchased |
|||||||||||||||||||||||||||
| Notional amounts |
$ | 415,190 | $ | 427,643 | $ | 308,301 | $ | 294,311 | $ | 191,645 | $ | 277,796 | $ | 15,858 | |||||||||||||
| Average strike rate |
4.33 | % | 4.49 | % | 4.60 | % | 4.60 | % | 4.68 | % | 3.80 | % | |||||||||||||||
| Liabilities: |
|||||||||||||||||||||||||||
| Credit facilities |
|||||||||||||||||||||||||||
| Principal amounts |
$ | 955,012 | $ | 286,281 | $ | 168,629 | $ | 121,533 | $ | 79,995 | $ | 18,683 | $ | 1,630,133 | |||||||||||||
| Weighted average effective interest rate |
3.95 | % | 3.30 | % | 4.83 | % | 5.63 | % | 6.05 | % | 6.31 | % | |||||||||||||||
| Securitization notes payable |
|||||||||||||||||||||||||||
| Principal amounts |
$ | 3,221,439 | $ | 2,280,382 | $ | 1,698,314 | $ | 233,825 | $ | 6,879,245 | |||||||||||||||||
| Weighted average effective interest rate |
4.15 | % | 4.75 | % | 5.48 | % | 7.04 | % | |||||||||||||||||||
| Senior notes |
|||||||||||||||||||||||||||
| Principal amounts |
$ | 91,620 | $ | 85,207 | |||||||||||||||||||||||
| Weighted average effective interest rate |
8.50 | % | |||||||||||||||||||||||||
| Convertible senior notes |
|||||||||||||||||||||||||||
| Principal amounts |
$ | 247,000 | $ | 215,017 | $ | 328,396 | |||||||||||||||||||||
| Weighted average effective coupon interest rate |
0.75 | % | 2.125 | % | |||||||||||||||||||||||
| Interest rate swaps |
|||||||||||||||||||||||||||
| Notional amounts |
$ | 864,354 | $ | 911,639 | $ | 744,329 | $ | 72,226 | $ | 131,885 | |||||||||||||||||
| Average pay rate |
4.24 | % | 4.20 | % | 3.16 | % | 1.72 | % | |||||||||||||||||||
| Average receive rate |
0.67 | % | 1.75 | % | 2.07 | % | 1.47 | % | |||||||||||||||||||
| Interest rate caps |
|||||||||||||||||||||||||||
| sold Notional amounts |
$ | 298,675 | $ | 353,224 | $ | 306,219 | $ | 293,491 | $ | 191,639 | $ | 277,796 | $ | 16,644 | |||||||||||||
| Average strike rate |
4.64 | % | 4.60 | % | 4.60 | % | 4.60 | % | 4.68 | % | 3.80 | % | |||||||||||||||
Finance receivables are estimated to be realized by us in future periods using discount rate, prepayment and credit loss assumptions similar to our historical experience. Notional amounts on interest rate swap and cap agreements are based on contractual terms. Credit facilities and securitization notes payable amounts have been classified based on expected payoff. Senior notes and convertible senior notes principal amounts have been classified based on maturity.
The notional amounts of interest rate swap and cap agreements, which are used to calculate the contractual payments to be exchanged under the contracts, represent average amounts that will be outstanding for each of the years included in the table. Notional amounts do not represent amounts exchanged by parties and, thus, are not a measure of our exposure to loss through our use of these agreements.
45
Table of Contents
Management monitors our hedging activities to ensure that the value of derivative financial instruments, their correlation to the contracts being hedged and the amounts being hedged continue to provide effective protection against interest rate risk. However, there can be no assurance that our strategies will be effective in minimizing interest rate risk or that increases in interest rates will not have an adverse effect on our profitability. All transactions are entered into for purposes other than trading.
Recently Issued Accounting Pronouncements
In June 2009, the Financial Accounting Standards Board (“FASB”) issued updated guidance on the accounting for transfers of financial assets, as well as the consolidation of variable interest entities. The adoption of the changes in accounting are effective for us beginning with the first quarter in fiscal 2011. We do not anticipate the impact of the adoption to have a material impact on our consolidated financial position, results of operations or cash flows.
On July 21, 2010, the FASB issued Accounting Standards Update (“ASU”) 2010-20, Disclosures about the Credit Quality of Financing Receivables and the Allowance for Credit Losses. The new disclosure guidance will significantly expand the existing disclosure requirements surrounding finance receivables and the allowance for loan losses. The objectives of the enhanced disclosures are to provide information that will enable readers of financial statements to understand the nature of credit risk in financing receivables, how that risk is analyzed in determining the related allowance for loan losses, and changes to the allowance during the reporting period. The new disclosures are required starting in the first interim or annual reporting period on or after December 31, 2010. We do not anticipate the adoption of this ASU to have an impact on our consolidated financial position, results of operations or cash flows.
46
Table of Contents
| ITEM 8. FINANCIAL | STATEMENTS AND SUPPLEMENTARY DATA |
AMERICREDIT CORP.
CONSOLIDATED BALANCE SHEETS
(dollars in thousands)
| June 30, | ||||||||
| 2010 | 2009 | |||||||
| Assets |
||||||||
| Cash and cash equivalents |
$ | 282,273 | $ | 193,287 | ||||
| Finance receivables, net |
8,160,208 | 10,037,329 | ||||||
| Restricted cash—securitization notes payable |
930,155 | 851,606 | ||||||
| Restricted cash—credit facilities |
142,725 | 195,079 | ||||||
| Property and equipment, net |
37,734 | 44,195 | ||||||
| Leased vehicles, net |
94,677 | 156,387 | ||||||
| Deferred income taxes |
81,836 | 75,782 | ||||||
| Income tax receivable |
197,579 | |||||||
| Other assets |
151,425 | 207,083 | ||||||
| Total assets |
$ | 9,881,033 | $ | 11,958,327 | ||||
| Liabilities and Shareholders’ Equity |
||||||||
| Liabilities: |
||||||||
| Credit facilities |
$ | 598,946 | $ | 1,630,133 | ||||
| Securitization notes payable |
6,108,976 | 7,426,687 | ||||||
| Senior notes |
70,620 | 91,620 | ||||||
| Convertible senior notes |
414,068 | 392,514 | ||||||
| Accrued taxes and expenses |
210,013 | 157,640 | ||||||
| Interest rate swap agreements |
70,421 | 131,885 | ||||||
| Other liabilities |
7,565 | 20,540 | ||||||
| Total liabilities |
7,480,609 | 9,851,019 | ||||||
| Commitments and contingencies (Note 10) |
||||||||
| Shareholders’ equity: |
||||||||
| Preferred stock, $.01 par value per share, 20,000,000 shares authorized; none issued |
||||||||
| Common stock, $.01 par value per share, 350,000,000 shares authorized; 136,856,360 and 134,977,812 shares issued |
1,369 | 1,350 | ||||||
| Additional paid-in capital |
327,095 | 284,961 | ||||||
| Accumulated other comprehensive income (loss) |
11,870 | (21,099 | ) | |||||
| Retained earnings |
2,099,005 | 1,878,459 | ||||||
| 2,439,339 | 2,143,671 | |||||||
| Treasury stock, at cost (1,916,510 and 1,806,446 shares) |
(38,915 | ) | (36,363 | ) | ||||
| Total shareholders’ equity |
2,400,424 | 2,107,308 | ||||||
| Total liabilities and shareholders’ equity |
$ | 9,881,033 | $ | 11,958,327 | ||||
The accompanying notes are an integral part of these consolidated financial statements.
47
Table of Contents
AMERICREDIT CORP.
CONSOLIDATED STATEMENTS OF OPERATIONS AND COMPREHENSIVE OPERATIONS
(dollars in thousands, except per share data)
| Years Ended June 30, | ||||||||||||
| 2010 | 2009 | 2008 | ||||||||||
| Revenue |
||||||||||||
| Finance charge income |
$ | 1,431,319 | $ | 1,902,684 | $ | 2,382,484 | ||||||
| Other income |
91,215 | 116,488 | 160,598 | |||||||||
| Gain on retirement of debt |
283 | 48,152 | ||||||||||
| 1,522,817 | 2,067,324 | 2,543,082 | ||||||||||
| Costs and expenses |
||||||||||||
| Operating expenses |
288,791 | 308,803 | 397,814 | |||||||||
| Leased vehicles expenses |
34,639 | 47,880 | 36,362 | |||||||||
| Provision for loan losses |
388,058 | 972,381 | 1,130,962 | |||||||||
| Interest expense |
457,222 | 726,560 | 858,874 | |||||||||
| Restructuring charges, net |
668 | 11,847 | 20,116 | |||||||||
| Impairment of goodwill |
212,595 | |||||||||||
| 1,169,378 | 2,067,471 | 2,656,723 | ||||||||||
| Income (loss) before income taxes |
353,439 | (147 | ) | (113,641 | ) | |||||||
| Income tax provision (benefit) |
132,893 | 10,742 | (31,272 | ) | ||||||||
| Net income (loss) |
220,546 | (10,889 | ) | (82,369 | ) | |||||||
| Other comprehensive income (loss) |
||||||||||||
| Unrealized gains (losses) on cash flow hedges |
43,306 | (26,871 | ) | (84,404 | ) | |||||||
| Foreign currency translation adjustment |
8,230 | 750 | 5,855 | |||||||||
| Unrealized losses on credit enhancement assets |
(232 | ) | ||||||||||
| Income tax (provision) benefit |
(18,567 | ) | 11,426 | 26,683 | ||||||||
| Other comprehensive income (loss) |
32,969 | (14,695 | ) | (52,098 | ) | |||||||
| Comprehensive income (loss) |
$ | 253,515 | $ | (25,584 | ) | $ | (134,467 | ) | ||||
| Earnings (loss) per share |
||||||||||||
| Basic |
$ | 1.65 | $ | (0.09 | ) | $ | (0.72 | ) | ||||
| Diluted |
$ | 1.60 | $ | (0.09 | ) | $ | (0.72 | ) | ||||
| Weighted average shares |
||||||||||||
| Basic |
133,845,238 | 125,239,241 | 114,962,241 | |||||||||
| Diluted |
138,179,945 | 125,239,241 | 114,962,241 | |||||||||
The accompanying notes are an integral part of these consolidated financial statements.
48
Table of Contents
AMERICREDIT CORP.
CONSOLIDATED STATEMENTS OF SHAREHOLDERS’ EQUITY
(dollars in thousands)
| Common Stock | Additional Paid-in Capital |
Accumulated Other Comprehensive Income (Loss) |
Retained Earnings |
Treasury Stock | ||||||||||||||||||||||
| Shares | Amount | Shares | Amount | |||||||||||||||||||||||
| Balance at July 1, 2007 |
120,590,473 | $ | 1,206 | $ | 163,051 | $ | 45,694 | $ | 1,989,780 | 1,934,061 | $ | (43,139 | ) | |||||||||||||
| Common stock issued on exercise of options |
1,138,691 | 11 | 12,561 | |||||||||||||||||||||||
| Common stock issued on exercise of warrants |
1,065,047 | 11 | 8,581 | |||||||||||||||||||||||
| Uncertain tax position liability adjustment |
(463 | ) | ||||||||||||||||||||||||
| Income tax benefit from exercise of options and amortization of convertible note hedges |
13,443 | |||||||||||||||||||||||||
| Common stock cancelled—restricted stock |
(15,050 | ) | ||||||||||||||||||||||||
| Common stock issued for employee benefit plans |
987,089 | 10 | 2,140 | (214,377 | ) | 6,606 | ||||||||||||||||||||
| Stock based compensation expense |
17,945 | |||||||||||||||||||||||||
| Repurchase of common stock |
5,734,850 | (127,901 | ) | |||||||||||||||||||||||
| Amortization of warrant costs |
10,193 | |||||||||||||||||||||||||
| Retirement of treasury stock |
(5,000,000 | ) | (50 | ) | (93,850 | ) | (17,600 | ) | (5,000,000 | ) | 111,500 | |||||||||||||||
| Other comprehensive loss, net of income tax benefit of $26,683 |
(52,098 | ) | ||||||||||||||||||||||||
| Net loss |
(82,369 | ) | ||||||||||||||||||||||||
| Balance at June 30, 2008 |
118,766,250 | 1,188 | 134,064 | (6,404 | ) | 1,889,348 | 2,454,534 | (52,934 | ) | |||||||||||||||||
| Common stock issued on exercise of options |
131,654 | 1 | 1,053 | |||||||||||||||||||||||
| Common stock issued relating to retirement of debt |
15,122,670 | 151 | 90,830 | |||||||||||||||||||||||
| Income tax benefit from exercise of options and amortization of convertible note hedges |
10,678 | |||||||||||||||||||||||||
| Common stock cancelled—restricted stock |
(47,000 | ) | ||||||||||||||||||||||||
| Common stock issued for employee benefit plans |
1,004,238 | 10 | (11,029 | ) | (648,088 | ) | 16,571 | |||||||||||||||||||
| Stock based compensation expense |
14,264 | |||||||||||||||||||||||||
| Amortization of warrant costs |
45,101 | |||||||||||||||||||||||||
| Other comprehensive loss, net of income tax benefit of $11,426 |
(14,695 | ) | ||||||||||||||||||||||||
| Net loss |
(10,889 | ) | ||||||||||||||||||||||||
| Balance at June 30, 2009 |
134,977,812 | 1,350 | 284,961 | (21,099 | ) | 1,878,459 | 1,806,446 | (36,363 | ) | |||||||||||||||||
| Common stock issued on exercise of options |
837,411 | 8 | 11,597 | |||||||||||||||||||||||
| Income tax benefit from exercise of options and amortization of convertible note hedges |
9,434 | |||||||||||||||||||||||||
| Common stock issued for employee benefit plans |
1,041,137 | 11 | 4,020 | 110,064 | (2,552 | ) | ||||||||||||||||||||
| Stock based compensation expense |
15,115 | |||||||||||||||||||||||||
| Amortization of warrant costs |
1,968 | |||||||||||||||||||||||||
| Other comprehensive income, net of income tax provision of $18,567 |
32,969 | |||||||||||||||||||||||||
| Net income |
220,546 | |||||||||||||||||||||||||
| Balance at June 30, 2010 |
136,856,360 | $ | 1,369 | $ | 327,095 | $ | 11,870 | $ | 2,099,005 | 1,916,510 | $ | (38,915 | ) | |||||||||||||
The accompanying notes are an integral part of these consolidated financial statements.
49
Table of Contents
AMERICREDIT CORP.
CONSOLIDATED STATEMENTS OF CASH FLOWS
(in thousands)
| Years Ended June 30, | ||||||||||||
| 2010 | 2009 | 2008 | ||||||||||
| Cash flows from operating activities |
||||||||||||
| Net income (loss) |
$ | 220,546 | $ | (10,889 | ) | $ | (82,369 | ) | ||||
| Adjustments to reconcile net income (loss) to net cash provided by operating activities: |
||||||||||||
| Depreciation and amortization |
79,044 | 109,008 | 86,879 | |||||||||
| Provision for loan losses |
388,058 | 972,381 | 1,130,962 | |||||||||
| Deferred income taxes |
(24,567 | ) | 226,783 | (146,361 | ) | |||||||
| Stock based compensation expense |
15,115 | 14,264 | 17,945 | |||||||||
| Amortization of warrant costs |
1,968 | 45,101 | 10,193 | |||||||||
| Non-cash interest charges on convertible debt |
21,554 | 22,506 | 22,062 | |||||||||
| Accretion and amortization of loan fees |
4,791 | 19,094 | 29,435 | |||||||||
| Gain on retirement of debt |
(283 | ) | (48,907 | ) | ||||||||
| Impairment of goodwill |
212,595 | |||||||||||
| Other |
(15,954 | ) | 2,773 | 6,126 | ||||||||
| Changes in assets and liabilities, net of assets and liabilities acquired: |
||||||||||||
| Income tax receivable |
197,402 | (174,682 | ) | (22,897 | ) | |||||||
| Other assets |
5,256 | (6,704 | ) | (15,627 | ) | |||||||
| Accrued taxes and expenses |
35,779 | (52,113 | ) | 11,018 | ||||||||
| Net cash provided by operating activities |
928,709 | 1,118,615 | 1,259,961 | |||||||||
| Cash flows from investing activities |
||||||||||||
| Purchases of receivables |
(2,090,602 | ) | (1,280,291 | ) | (6,260,198 | ) | ||||||
| Principal collections and recoveries on receivables |
3,606,680 | 4,257,637 | 6,108,690 | |||||||||
| Purchases of property and equipment |
(1,581 | ) | (1,003 | ) | (8,463 | ) | ||||||
| Change in restricted cash—securitization notes payable |
(78,549 | ) | 131,064 | 31,683 | ||||||||
| Change in restricted cash—credit facilities |
52,354 | 63,180 | (92,754 | ) | ||||||||
| Change in other assets |
43,875 | 12,960 | (41,731 | ) | ||||||||
| Proceeds from money market fund |
10,047 | 104,319 | ||||||||||
| Investment in money market fund |
(115,821 | ) | ||||||||||
| Net purchases of leased vehicles |
(198,826 | ) | ||||||||||
| Distributions from gain on sale Trusts |
7,466 | |||||||||||
| Net cash provided (used) by investing activities |
1,542,224 | 3,172,045 | (454,133 | ) | ||||||||
| Cash flows from financing activities |
||||||||||||
| Net change in credit facilities |
(1,031,187 | ) | (1,278,117 | ) | 385,611 | |||||||
| Issuance of securitization notes payable |
2,352,493 | 1,000,000 | 4,250,000 | |||||||||
| Payments on securitization notes payable |
(3,674,062 | ) | (3,987,424 | ) | (5,774,035 | ) | ||||||
| Debt issuance costs |
(24,754 | ) | (32,609 | ) | (39,347 | ) | ||||||
| Net proceeds from issuance of common stock |
15,635 | 3,741 | 25,174 | |||||||||
| Retirement of debt |
(20,425 | ) | (238,617 | ) | ||||||||
| Repurchase of common stock |
(127,901 | ) | ||||||||||
| Other net changes |
645 | (603 | ) | 323 | ||||||||
| Net cash used by financing activities |
(2,381,655 | ) | (4,533,629 | ) | (1,280,175 | ) | ||||||
| Net increase (decrease) in cash and cash equivalents |
89,278 | (242,969 | ) | (474,347 | ) | |||||||
| Effect of Canadian exchange rate changes on cash and cash equivalents |
(292 | ) | 2,763 | (2,464 | ) | |||||||
| Cash and cash equivalents at beginning of year |
193,287 | 433,493 | 910,304 | |||||||||
| Cash and cash equivalents at end of year |
$ | 282,273 | $ | 193,287 | $ | 433,493 | ||||||
The accompanying notes are an integral part of these consolidated financial statements.
50
Table of Contents
AMERICREDIT CORP.
NOTES TO CONSOLIDATED FINANCIAL STATEMENTS
| 1. | Summary of Significant Accounting Policies |
History and Operations
We were formed on August 1, 1986, and, since September 1992, have been in the business of purchasing and servicing automobile sales finance contracts. From January 2007 through May 2008, we also originated leases on automobiles.
Recent Events
On July 21, 2010, we entered into an Agreement and Plan of Merger (the “Merger Agreement”) with General Motors Holdings LLC (“GM Holdings”), a Delaware limited liability company and a wholly owned subsidiary of General Motors Company (“General Motors”), and Goalie Texas Holdco Inc. (“Merger Sub”), a Texas corporation and a direct wholly owned subsidiary of GM Holdings. Under the terms of the Merger Agreement, Merger Sub will be merged with and into AmeriCredit, with AmeriCredit continuing as the surviving corporation and a direct wholly owned subsidiary of GM Holdings (the “Merger”). Pursuant to the terms of the Merger Agreement and subject to the satisfaction or waiver of the closing conditions set forth in the Merger Agreement, at the effective time of the Merger (the “Effective Time”), each share of our common stock issued and outstanding immediately prior to the Effective Time (other than (i) any shares held by us or any of our subsidiaries immediately prior to the Effective Time, which shares will be cancelled with no consideration in exchange for such cancellation, and (ii) any shares held by our shareholders who are entitled to and who properly exercise appraisal rights under Texas law) will be converted into the right to receive $24.50 in cash, without interest.
Basis of Presentation
The consolidated financial statements include our accounts and the accounts of our wholly-owned subsidiaries, including certain special purpose financing trusts utilized in securitization transactions (“Trusts”) which are considered variable interest entities. All intercompany transactions and accounts have been eliminated in consolidation. Certain prior year amounts have been reclassified to conform to the current year presentation.
The preparation of financial statements in conformity with accounting principles generally accepted in the United States of America requires management to make estimates and assumptions which affect the reported amounts of assets and liabilities and the disclosures of contingent assets and liabilities as of the date of the financial statements and the amount of revenue and costs and expenses during the reporting periods. Actual results could differ from those estimates and those differences may be material. These estimates include, among other things, the determination of the allowance for loan losses on finance receivables, and income taxes.
Cash Equivalents
Investments in highly liquid securities with original maturities of 90 days or less are included in cash and cash equivalents.
Finance Receivables
Finance receivables are carried at amortized cost, net of allowance for loan losses.
Allowance for Loan Losses
Provisions for loan losses are charged to operations in amounts sufficient to maintain the allowance for loan losses at a level considered adequate to cover probable credit losses inherent in our finance receivables.
51
Table of Contents
The allowance for loan losses is established systematically based on the determination of the amount of probable credit losses inherent in the finance receivables as of the reporting date. We review charge-off experience factors, delinquency reports, historical collection rates, estimates of the value of the underlying collateral, economic trends, such as unemployment rates, and other information in order to make the necessary judgments as to probable credit losses. We also use historical charge-off experience to determine a loss confirmation period, which is defined as the time between when an event, such as delinquency status, giving rise to a probable credit loss occurs with respect to a specific account and when such account is charged off. This loss confirmation period is applied to the forecasted probable credit losses to determine the amount of losses inherent in finance receivables at the reporting date. Assumptions regarding probable credit losses and loss confirmation periods are reviewed periodically and may be impacted by actual performance of finance receivables and changes in any of the factors discussed above.
Charge-off Policy
Our policy is to charge off an account in the month in which the account becomes 120 days contractually delinquent if we have not repossessed the related vehicle. We charge off accounts in repossession when the automobile is repossessed and legally available for disposition. A charge-off generally represents the difference between the estimated net sales proceeds and the amount of the delinquent contract, including accrued interest. Accounts in repossession that have been charged off have been removed from finance receivables and the related repossessed automobiles, aggregating $12.4 million and $20.4 million at June 30, 2010 and 2009, respectively, are included in other assets on the consolidated balance sheets pending sale.
Securitization
The structure of our securitization transactions does not qualify under the accounting criteria for sales of finance receivables and, accordingly, such securitization transactions have been accounted for as secured financings. Therefore, following a securitization, the finance receivables and the related securitization notes payable remain on the consolidated balance sheets. We recognize finance charge and fee income on the receivables and interest expense on the securities issued in the securitization transaction, and record a provision for loan losses to recognize probable loan losses inherent in the finance receivables. Cash pledged to support the securitization transaction is deposited to a restricted account and recorded on our consolidated balance sheets as restricted cash – securitization notes payable, which is invested in highly liquid securities with original maturities of 90 days or less or in highly rated guaranteed investment contracts.
Prior to October 1, 2002, we structured our securitization transactions to meet the accounting criteria for sales of finance receivables. We also acquired two securitization Trusts which were accounted for as sales of receivables. Such securitization transactions are referred to herein as gain on sale Trusts. We had no gain on sale Trusts outstanding as of June 30, 2010.
Property and Equipment
Property and equipment are carried at cost less accumulated depreciation. Depreciation is generally provided on a straight-line basis over the estimated useful lives of the assets, which ranges from three to 25 years. The cost of assets sold or retired and the related accumulated depreciation are removed from the accounts at the time of disposition and any resulting gain or loss is included in operations. Maintenance, repairs and minor replacements are charged to operations as incurred; major replacements and betterments are capitalized.
Leased Vehicles
Leased vehicles consist of automobiles leased to consumers. These assets are reported at cost, less accumulated depreciation. Depreciation expense is recorded on a straight-line basis over the term of the lease. Leased vehicles are depreciated to the estimated residual value at the end of the lease term. Under the accounting for impairment or disposal of long-lived assets, residual values of operating leases are evaluated individually for
52
Table of Contents
impairment. When aggregate future cash flows from the operating lease, including the expected realizable fair value of the leased asset at the end of the lease, are less than the book value of the lease, an immediate impairment write-down is recognized if the difference is deemed not recoverable. Otherwise, reductions in the expected residual value result in additional depreciation of the leased asset over the remaining term of the lease. Upon disposition, a gain or loss is recorded for any difference between the net book value of the lease and the proceeds from the disposition of the asset, including any insurance proceeds.
Goodwill
Under the purchase method of accounting, the net assets of entities acquired by us are recorded at their estimated fair value at the date of acquisition. The excess cost of the acquisition over the fair value is recorded as goodwill. Goodwill is subject to impairment testing using a two-step process. The first step of the goodwill impairment test is to identify potential impairment by comparing the fair value of the reporting unit with its carrying amount, including goodwill. We have determined that we have only one reporting unit. If the fair value of a reporting unit exceeds its carrying amount, goodwill of the reporting unit is considered not impaired and the second step of the impairment test is not required. If the carrying amount of a reporting unit exceeds its fair value, the second step of the goodwill impairment test is performed to measure the amount of the impairment loss, if any. The second step of the goodwill impairment test compares the implied fair value (i.e., the fair value of reporting unit less the fair value of the unit’s assets and liabilities, including identifiable intangible assets) of the reporting unit’s goodwill with the carrying amount of that goodwill. If the carrying value of goodwill exceeds its implied fair value, the excess is required to be recorded as an impairment charge in earnings.
On January 1, 2007, we acquired the stock of Long Beach Acceptance Corporation (“LBAC”). The total consideration in the all-cash transaction, including transaction costs, was approximately $287.7 million. We initially recorded goodwill of approximately $196.8 million, all of which is deductible for federal income tax purposes. On May 1, 2006, we acquired the stock of Bay View Acceptance Corporation (“BVAC”). The total consideration in the all-cash transaction, including transaction costs, was approximately $64.6 million. We initially recorded goodwill of approximately $14.4 million, which is not deductible for federal income tax purposes. The operations of LBAC and BVAC have been integrated into our activities and we provide auto finance products solely under the AmeriCredit Financial Services, Inc. name.
Our annual goodwill impairment analysis performed during the fourth quarter of the year ended June 30, 2008 resulted in the determination that the goodwill was fully impaired.
A summary of changes to goodwill is as follows (in thousands):
| Years ended June 30, |
2008 | |||
| Balance at beginning of year |
$ | 208,435 | ||
| Adjustments to goodwill |
4,160 | |||
| Impairment |
(212,595 | ) | ||
| Balance at end of year |
$ | |||
Derivative Financial Instruments
We recognize all of our derivative financial instruments as either assets or liabilities on our consolidated balance sheets at fair value. The accounting for changes in the fair value of each derivative financial instrument depends on whether it has been designated and qualifies as an accounting hedge, as well as the type of hedging relationship identified.
Our special purpose finance subsidiaries are contractually required to purchase derivative instruments as credit enhancement in connection with securitization transactions and credit facilities.
53
Table of Contents
Interest Rate Swap Agreements
We utilize interest rate swap agreements to convert floating rate exposures on securities issued in securitization transactions to fixed rates, thereby hedging the variability in interest expense paid. Our interest rate swap agreements are designated as cash flow hedges on the floating rate debt of our securitization notes payable and may qualify for hedge accounting treatment, while others do not qualify and are marked to market through interest expense in our consolidated statements of operations. Cash flows from derivatives used to manage interest rate risk are classified as operating activities.
For interest rate swap agreements designated as hedges, we formally document all relationships between the interest rate swap agreement and the underlying asset, liability or cash flows being hedged, as well as our risk management objective and strategy for undertaking the hedge transactions. At hedge inception and at least quarterly, we also formally assess whether the interest rate swap agreements that are used in hedging transactions have been highly effective in offsetting changes in the cash flows or fair value of the hedged items and whether those interest rate swap agreements may be expected to remain highly effective in future periods. In addition, we also assess the continued probability that the hedged cash flows will be realized.
We use regression analysis to assess hedge effectiveness of our cash flow hedges on a prospective and retrospective basis. A derivative financial instrument is deemed to be effective if the X-coefficient from the regression analysis is between a range of 0.80 and 1.25. At June 30, 2010, all of our interest rate swap agreements designated as cash flow hedges fall within this range and are deemed to be effective hedges for accounting purposes. We use the hypothetical derivative method to measure the amount of ineffectiveness and a net earnings impact occurs when the change in the value of a derivative instrument does not offset the change in the value of the underlying hedged item. Ineffectiveness of our hedges is not material.
The effective portion of the changes in the fair value of the interest rate swaps qualifying as cash flow hedges are included as a component of accumulated other comprehensive income (loss) as an unrealized gain or loss on cash flow hedges. These unrealized gains or losses are recognized as adjustments to income over the same period in which cash flows from the related hedged item affect earnings. However, if we expect the continued reporting of a loss in accumulated other comprehensive income would lead to recognizing a net loss on the combination of the interest rate swap agreements and the hedged item, the loss is reclassified to earnings for the amount that is not expected to be recovered. Additionally, to the extent that any of these contracts are not considered to be perfectly effective in offsetting the change in the value of the cash flows being hedged, any changes in fair value relating to the ineffective portion of these contracts are recognized in interest expense on our consolidated statements of operations and comprehensive operations. We discontinue hedge accounting prospectively when it is determined that an interest rate swap agreement has ceased to be effective as an accounting hedge or if the underlying hedged cash flow is no longer probable of occurring.
Interest Rate Cap Agreements
Generally, we purchase interest rate cap agreements to limit floating rate exposures on securities issued in our credit facilities. As part of our interest rate risk management strategy and when economically feasible, we may simultaneously sell a corresponding interest rate cap agreement in order to offset the premium paid to purchase the interest rate cap agreement and thus retain the interest rate risk. Because the interest rate cap agreements entered into by us or our special purpose finance subsidiaries do not qualify for hedge accounting, changes in the fair value of interest rate cap agreements purchased by the special purpose finance subsidiaries and interest rate cap agreements sold by us are recorded in interest expense on our consolidated statements of operations and comprehensive operations.
We do not use derivative instruments for trading or speculative purposes.
54
Table of Contents
Interest rate risk management contracts are generally expressed in notional principal or contract amounts that are much larger than the amounts potentially at risk for nonpayment by counterparties. Therefore, in the event of nonperformance by the counterparties, our credit exposure is limited to the uncollected interest and the market value related to the contracts that have become favorable to us. We manage the credit risk of such contracts by using highly rated counterparties, establishing risk limits and monitoring the credit ratings of the counterparties.
We maintain a policy of requiring that all derivative contracts be governed by an International Swaps and Derivatives Association Master Agreement. We enter into arrangements with individual counterparties that we believe are creditworthy and generally settle on a net basis. In addition, we perform a quarterly assessment of our counterparty credit risk, including a review of credit ratings, credit default swap rates and potential nonperformance of the counterparty. Based on our most recent quarterly assessment of our counterparty credit risk, we consider this risk to be low.
Income Taxes
Deferred income taxes are provided in accordance with the asset and liability method of accounting for income taxes to recognize the tax effects of tax credits and temporary differences between financial statement and income tax accounting. A valuation allowance is recognized if it is more likely than not that some portion or the entire deferred tax asset will not be realized.
We account for uncertainty in income taxes in the financial statements. See Note 14 - “Income Taxes” for a discussion of the accounting for uncertain tax positions.
Revenue Recognition
Finance Charge Income
Finance charge income related to finance receivables is recognized using the interest method. Accrual of finance charge income is suspended on accounts that are more than 60 days delinquent, accounts in bankruptcy, and accounts in repossession. Fees and commissions received and direct costs of originating loans are deferred and amortized over the term of the related finance receivables using the interest method and are removed from the consolidated balance sheets when the related finance receivables are sold, charged off or paid in full.
Operating Leases – deferred origination fees or costs
Net deferred origination fees or costs are amortized on a straight-line basis over the life of the lease to other income.
Stock Based Compensation
Share-based payment transactions are measured at fair value and recognized in the financial statements. For fiscal 2010, 2009, and 2008, we have recorded total stock based compensation expense of $15.1 million ($9.4 million net of tax), $14.3 million ($9.2 million net of tax), and $17.9 million ($13.5 million net of tax), respectively.
The excess tax benefit of the stock based compensation expense related to the exercise of stock options of $1.1 million and $1.3 million for fiscal 2010 and 2008, respectively, has been included in other net changes as a cash inflow from financing activities on the consolidated statements of cash flows.
55
Table of Contents
The fair value of each option granted or modified was estimated using an option-pricing model with the following weighted average assumptions:
| Years Ended June 30, |
2010 | 2009 | 2008 | ||||||
| Expected dividends |
0 | 0 | 0 | ||||||
| Expected volatility |
65.7 | % | 92.1 | % | 60.8 | % | |||
| Risk-free interest rate |
1.2 | % | 1.7 | % | 3.3 | % | |||
| Expected life |
1.4 years | 2.0 years | 1.2 years |
We have not paid out dividends historically, thus the dividend yields are estimated at zero percent.
Expected volatility reflects an average of the implied and historical volatility rates. Management believes that a combination of market-based measures is currently the best available indicator of expected volatility.
The risk-free interest rate is the implied yield available for zero-coupon U.S. government issues with a remaining term equal to the expected life of the options.
The expected lives of options are determined based on our historical option exercise experience and the term of the option.
Assumptions are reviewed each time there is a new grant or modification of a previous grant and may be impacted by actual fluctuation in our stock price, movements in market interest rates and option terms. The use of different assumptions produces a different fair value for the options granted or modified and impacts the amount of compensation expense recognized on the consolidated statements of operations and comprehensive operations.
Recently Issued Accounting Pronouncements
In June 2009, the Financial Accounting Standards Board (“FASB”) issued updated guidance on the accounting for transfers of financial assets, as well as the consolidation of variable interest entities. The adoption of the changes in accounting are effective for us beginning with the first quarter in fiscal 2011. We do not anticipate the impact of the adoption to have a material impact on our consolidated financial position, results of operations or cash flows.
On July 21, 2010, the FASB issued Accounting Standards Update (“ASU”) 2010-20, Disclosures about the Credit Quality of Financing Receivables and the Allowance for Credit Losses. The new disclosure guidance will significantly expand the existing disclosure requirements surrounding finance receivables and the allowance for loan losses. The objectives of the enhanced disclosures are to provide information that will enable readers of financial statements to understand the nature of credit risk in financing receivables, how that risk is analyzed in determining the related allowance for loan losses, and changes to the allowance during the reporting period. The new disclosures are required starting in the first interim or annual reporting period on or after December 31, 2010. We do not anticipate the adoption of this ASU to have an impact on our consolidated financial position, results of operations or cash flows.
| 2. | Finance Receivables |
Finance receivables consist of the following (in thousands):
| June 30, |
2010 | 2009 | ||||||
| Finance receivables unsecuritized, net of fees |
$ | 1,533,673 | $ | 2,534,158 | ||||
| Finance receivables securitized, net of fees |
7,199,845 | 8,393,811 | ||||||
| Less allowance for loan losses |
(573,310 | ) | (890,640 | ) | ||||
| $ | 8,160,208 | $ | 10,037,329 | |||||
56
Table of Contents
Finance receivables securitized represent receivables transferred to our special purpose finance subsidiaries in securitization transactions accounted for as secured financings. Finance receivables unsecuritized include $651.3 million and $2,037.6 million pledged under our credit facilities as of June 30, 2010 and 2009, respectively.
Finance receivables are collateralized by vehicle titles and we have the right to repossess the vehicle in the event the consumer defaults on the payment terms of the contract.
The accrual of finance charge income has been suspended on $491.2 million and $667.3 million of delinquent finance receivables as of June 30, 2010 and 2009, respectively.
Finance contracts are purchased by us from auto dealers without recourse, and accordingly, the dealer has no liability to us if the consumer defaults on the contract. Depending upon the contract structure and consumer credit attributes, we may pay dealers a participation fee or we may charge dealers a non-refundable acquisition fee when purchasing individual finance contracts. We record the amortization of participation fees and accretion of acquisition fees to finance charge income using the effective interest method.
A summary of the allowance for loan losses is as follows (in thousands):
| Years ended June 30, |
2010 | 2009 | 2008 | |||||||||
| Balance at beginning of year |
$ | 890,640 | $ | 951,113 | $ | 820,088 | ||||||
| Repurchase of receivables |
109 | |||||||||||
| Provision for loan losses |
388,058 | 972,381 | 1,130,962 | |||||||||
| Net charge-offs |
(705,388 | ) | (1,032,854 | ) | (1,000,046 | ) | ||||||
| Balance at end of year |
$ | 573,310 | $ | 890,640 | $ | 951,113 | ||||||
| 3. | Securitizations |
A summary of our securitization activity and cash flows from special purpose entities used for securitizations is as follows (in thousands):
| Years ended June 30, |
2010 | 2009 | 2008 | ||||||
| Receivables securitized |
$ | 2,843,308 | $ | 1,289,082 | $ | 4,634,083 | |||
| Net proceeds from securitization |
2,352,493 | 1,000,000 | 4,250,000 | ||||||
| Servicing fees: |
|||||||||
| Sold |
28 | 168 | |||||||
| Secured financing(a) |
196,304 | 237,471 | 306,949 | ||||||
| Distributions from Trusts: |
|||||||||
| Sold |
7,466 | ||||||||
| Secured financing |
424,161 | 429,457 | 668,510 | ||||||
| (a) | Cash flows received for servicing securitizations accounted for as secured financings are included in finance charge income on the consolidated statements of operations and comprehensive operations. |
We retain servicing responsibilities for receivables transferred to the Trusts. Included in finance charge income is a monthly base servicing fee earned on the outstanding principal balance of our securitized receivables and supplemental fees (such as late charges) for servicing the receivables.
As of June 30, 2010 and 2009, we were servicing $7.2 billion and $8.4 billion, respectively, of finance receivables that have been transferred to securitization Trusts.
57
Table of Contents
In April 2008, we entered into a one year, $2 billion forward purchase commitment agreement with Deutsche Bank (“Deutsche”). Under this agreement and subject to certain terms, Deutsche committed to purchase triple-A rated asset-backed securities issued by our sub-prime AmeriCredit Automobile Receivables Trust (“AMCAR”) securitization platform in registered public offerings. We paid $20.0 million of upfront commitment fees and issued a warrant to purchase up to 7.5 million shares of our common stock valued at $48.9 million in connection with the agreement. We utilized $752.8 million of the commitment in conjunction with the execution of our AMCAR 2008-1 and 2008-2 transactions. Effective December 19, 2008, we entered into a letter agreement with Deutsche whereby the parties mutually agreed to terminate the forward purchase commitment agreement. The remaining unamortized warrant costs of $14.3 million and unamortized commitment fees of $5.8 million at the termination date were charged to interest expense during fiscal 2009. See Note 11 - “Common Stock and Warrants” for a discussion of warrants issued by us in connection with this transaction.
In September 2008, we entered into agreements with Wachovia Capital Markets, LLC and Wachovia Bank, National Association (together, “Wachovia”), to establish two funding facilities under which Wachovia would provide total funding of $117.7 million, during the one year term of the facilities, secured by asset-backed securities as collateral. In conjunction with our AMCAR 2008-1 transaction, we obtained funding under these facilities of $48.9 million by pledging double-A rated asset-backed securities (the “Class B Notes”) as collateral and $68.8 million by pledging single-A rated asset-backed securities (the “Class C Notes”) as collateral. Under these funding facilities, we retained the Class B Notes and the Class C Notes issued in the transaction and then sold the retained notes to a special purpose subsidiary, which in turn pledged such retained notes as collateral to secure the funding under the two facilities. The facilities were renewed for another one year term in September 2009. At the end of the one year term, the facilities, if not renewed, will amortize in accordance with the securitization transaction until paid off. We paid $1.9 million of upfront commitment fees and issued a warrant to purchase up to 1.0 million shares of our common stock valued at $8.3 million in connection with these facilities, which were amortized to interest expense over the original one year term of the facilities. Unamortized warrant costs of $2.0 million and unamortized commitment fees of $0.5 million, as of June 30, 2009, are included in other assets on the consolidated balance sheets. See Note 11 - “Common Stock and Warrants” for a discussion of warrants issued by us in connection with this transaction.
We have analyzed the warrant transactions regarding accounting for derivative financial instruments indexed to and potentially settled in a company’s own stock and determined they meet the criteria for classification as equity transactions. As a result, amortization of the warrant costs is reflected in additional paid-in capital on our consolidated balance sheets, and we did not recognize subsequent changes in their fair value.
In November 2008, we entered into a purchase agreement with Fairholme Funds Inc. (“Fairholme”) under which Fairholme purchased $123.2 million of asset-backed securities, consisting of $50.6 million of Class B Notes and $72.6 million of Class C Notes in the AMCAR 2008-2 transaction. See Note 7 - “Senior Notes and Convertible Senior Notes” for discussion of other transactions with Fairholme.
| 4. | Investment in Money Market Fund |
We had an investment in the Reserve Primary Money Market Fund (the “Reserve Fund”), a money market fund which has subsequently liquidated its portfolio of investments. As of June 30, 2009, the investment was valued at the estimated net asset value of $0.97 per share as published by the Reserve Fund. Through June 30, 2010, we have received distributions from the Reserve Fund representing approximately $0.99 per share in total distributions.
58
Table of Contents
| 5. | Credit Facilities |
Amounts outstanding under our credit facilities are as follows (in thousands):
| June 30, |
2010 | 2009 | ||||
| Medium term note facility |
$ | 598,946 | $ | 750,000 | ||
| Master/Syndicated warehouse facility |
569,756 | |||||
| Prime/Near prime facility |
250,377 | |||||
| Lease warehouse facility |
60,000 | |||||
| $ | 598,946 | $ | 1,630,133 | |||
Further detail regarding terms and availability of the credit facilities as of June 30, 2010, follows (in thousands):
| Facility |
Facility Amount |
Advances Outstanding |
Finance Receivables Pledged |
Restricted Cash Pledged(c) | ||||||||
| Master/Syndicated warehouse facility(a): |
$ | 1,300,000 | $ | 300 | ||||||||
| Medium term note facility(b): |
$ | 598,946 | $ | 651,255 | 115,837 | |||||||
| $ | 1,300,000 | $ | 598,946 | $ | 651,255 | $ | 116,137 | |||||
| (a) | In February 2011 when the revolving period ends and if the facility is not renewed, the outstanding balance will be repaid over time based on the amortization of the receivables pledged until February 2012 when the remaining balance will be due and payable. |
| (b) | The revolving period under this facility ended in October 2009, and the outstanding debt balance will be repaid over time based on the amortization of the receivables pledged until October 2016 when any remaining amount outstanding will be due and payable. |
| (c) | These amounts do not include cash collected on finance receivables pledged of $26.6 million which is also included in restricted cash – credit facilities on the consolidated balance sheets. |
Generally, our credit facilities are administered by agents on behalf of institutionally managed commercial paper or medium term note conduits. Under these funding agreements, we transfer finance receivables to our special purpose finance subsidiaries. These subsidiaries, in turn, issue notes to the agents, collateralized by such finance receivables and cash. The agents provide funding under the notes to the subsidiaries pursuant to an advance formula, and the subsidiaries forward the funds to us in consideration for the transfer of finance receivables. While these subsidiaries are included in our consolidated financial statements, these subsidiaries are separate legal entities and the finance receivables and other assets held by these subsidiaries are legally owned by these subsidiaries and are not available to our creditors or our other subsidiaries. Advances under the funding agreements bear interest at commercial paper, London Interbank Offered Rates (“LIBOR”) or prime rates plus a credit spread and specified fees depending upon the source of funds provided by the agents.
We are required to hold certain funds in restricted cash accounts to provide additional collateral for borrowings under the credit facilities. Additionally, the credit facilities contain various covenants requiring minimum financial ratios, asset quality and portfolio performance ratios (portfolio net loss and delinquency ratios, and pool level cumulative net loss ratios) as well as limits on deferment levels. Failure to meet any of these covenants could result in an event of default under these agreements. If an event of default occurs under these agreements, the lenders could elect to declare all amounts outstanding under these agreements to be immediately due and payable, enforce their interests against collateral pledged under these agreements or restrict our ability to obtain additional borrowings under these agreements. As of June 30, 2010, we were in compliance with all covenants in our credit facilities.
59
Table of Contents
On February 26, 2010, we increased and extended our master/syndicated warehouse facility. The borrowing capacity available under the facility increased to $1.3 billion from $1.0 billion and includes commitments from eight lenders. On August 20, 2010, the master/syndicated warehouse facility was amended to allow for the change of control following the consummation of the pending Merger.
Debt issuance costs are being amortized to interest expense over the expected term of the credit facilities. Unamortized costs of $8.3 million and $16.1 million, as of June 30, 2010 and 2009, respectively, are included in other assets on the consolidated balance sheets.
| 6. | Securitization Notes Payable |
Securitization notes payable represents debt issued by us in securitization transactions. Debt issuance costs are being amortized over the expected term of the securitizations on an effective yield basis. Unamortized costs of $19.7 million and $13.9 million as of June 30, 2010 and 2009, respectively, are included in other assets on the consolidated balance sheets.
Securitization notes payable consists of the following (dollars in thousands):
| Transaction |
Maturity Date(b) |
Original Note Amount |
Original Weighted Average Interest Rate |
Receivables Pledged at June 30, 2010 |
Note Balance at June 30, 2010 |
Note Balance at June 30, 2009 | |||||||||||
| 2004-D-F |
July 2011 | $ | 750,000 | 3.1 | % | $ | 48,301 | ||||||||||
| 2005-A-X |
October 2011 | 900,000 | 3.7 | % | 72,264 | ||||||||||||
| 2005-1 |
May 2011 | 750,000 | 4.5 | % | 57,059 | ||||||||||||
| 2005-B-M |
May 2012 | 1,350,000 | 4.1 | % | 159,428 | ||||||||||||
| 2005-C-F |
June 2012 | 1,100,000 | 4.5 | % | $ | 77,101 | $ | 69,967 | 160,112 | ||||||||
| 2005-D-A |
November 2012 | 1,400,000 | 4.9 | % | 130,552 | 118,645 | 245,084 | ||||||||||
| 2006-1 |
May 2013 | 945,000 | 5.3 | % | 107,872 | 83,724 | 162,775 | ||||||||||
| 2006-R-M |
January 2014 | 1,200,000 | 5.4 | % | 282,564 | 253,467 | 452,604 | ||||||||||
| 2006-A-F |
September 2013 | 1,350,000 | 5.6 | % | 231,544 | 209,606 | 371,300 | ||||||||||
| 2006-B-G |
September 2013 | 1,200,000 | 5.2 | % | 250,414 | 227,503 | 386,480 | ||||||||||
| 2007-A-X |
October 2013 | 1,200,000 | 5.2 | % | 302,553 | 276,588 | 447,945 | ||||||||||
| 2007-B-F |
December 2013 | 1,500,000 | 5.2 | % | 449,540 | 410,193 | 650,889 | ||||||||||
| 2007-1 |
March 2016 | 1,000,000 | 5.4 | % | 260,396 | 263,468 | 430,801 | ||||||||||
| 2007-C-M |
April 2014 | 1,500,000 | 5.5 | % | 526,484 | 481,155 | 742,002 | ||||||||||
| 2007-D-F |
June 2014 | 1,000,000 | 5.5 | % | 381,097 | 347,913 | 539,020 | ||||||||||
| 2007-2-M |
March 2016 | 1,000,000 | 5.3 | % | 363,564 | 347,739 | 535,200 | ||||||||||
| 2008-A-F |
October 2014 | 750,000 | 6.0 | % | 431,228 | 343,753 | 518,835 | ||||||||||
| 2008-1 |
January 2015 | 500,000 | 8.7 | % | 356,580 | 221,952 | 388,355 | ||||||||||
| 2008-2 |
April 2015 | 500,000 | 10.5 | % | 378,821 | 230,803 | 400,108 | ||||||||||
| 2009-1 |
January 2016 | 725,000 | 7.5 | % | 675,981 | 450,998 | |||||||||||
| 2009-1 (APART) |
July 2017 | 227,493 | 2.7 | % | 228,458 | 163,350 | |||||||||||
| 2010-1 |
July 2017 | 600,000 | 3.7 | % | 600,341 | 511,583 | |||||||||||
| 2010-A |
July 2017 | 200,000 | 3.1 | % | 224,084 | 187,162 | |||||||||||
| 2010-2 |
June 2016 | 600,000 | 3.8 | % | 609,800 | 583,210 | |||||||||||
|
BV2005-LJ-1(a) |
May 2012 | 232,100 | 5.1 | % | 10,635 | 11,271 | 26,800 | ||||||||||
|
BV2005-LJ-2(a)(c) |
February 2014 | 185,596 | 4.6 | % | 12,215 | 11,467 | 26,668 | ||||||||||
|
BV2005-3(a) |
June 2014 | 220,107 | 5.1 | % | 21,211 | 22,359 | 43,065 | ||||||||||
|
LB2004-C(a) |
July 2011 | 350,000 | 3.5 | % | 23,543 | ||||||||||||
|
LB2005-A(a) |
April 2012 | 350,000 | 4.1 | % | 14,852 | 15,708 | 41,040 | ||||||||||
|
LB2005-B(a) |
June 2012 | 350,000 | 4.4 | % | 24,567 | 22,293 | 53,157 | ||||||||||
|
LB2006-A(a) |
May 2013 | 450,000 | 5.4 | % | 54,482 | 49,638 | 97,058 | ||||||||||
|
LB2006-B(a) |
September 2013 | 500,000 | 5.2 | % | 80,735 | 83,194 | 148,167 | ||||||||||
| LB2007-A |
January 2014 | 486,000 | 5.0 | % | 112,174 | 110,267 | 198,627 | ||||||||||
| $ | 25,371,296 | $ | 7,199,845 | $ | 6,108,976 | $ | 7,426,687 | ||||||||||
60
Table of Contents
| (a) | Transactions relate to securitization Trusts acquired by us. |
| (b) | Maturity date represents final legal maturity of securitization notes payable. Securitization notes payable are expected to be paid based on amortization of the finance receivables pledged to the Trusts. Expected principal payments are $3,075.5 million in fiscal 2011, $1,961.6 million in fiscal 2012, $625.2 million in fiscal 2013, $280.5 million in fiscal 2014, $131.8 million in fiscal 2015 and $37.7 million thereafter. |
| (c) | Note balance does not include $1.4 million of asset-backed securities repurchased and retained by us as of June 30, 2010. |
At the time of securitization of finance receivables, we are required to pledge assets equal to a specified percentage of the securitization pool to support the securitization transaction. Typically, the assets pledged consist of cash deposited to a restricted account and additional receivables delivered to the Trust, which create overcollateralization. The securitization transactions require the percentage of assets pledged to support the transaction to increase until a specified level is attained. Excess cash flows generated by the Trusts are added to the restricted cash account or used to pay down outstanding debt in the Trusts, creating overcollateralization until the targeted percentage level of assets has been reached. Once the targeted percentage level of assets is reached and maintained, excess cash flows generated by the Trusts are released to us as distributions from Trusts. Additionally, as the balance of the securitization pool declines, the amount of pledged assets needed to maintain the required percentage level is reduced. Assets in excess of the required percentage are also released to us as distributions from Trusts.
With respect to our securitization transactions covered by a financial guaranty insurance policy, agreements with the insurers provide that if portfolio performance ratios (delinquency, cumulative default or cumulative net loss) in a Trust’s pool of receivables exceed certain targets, the specified credit enhancement levels would be increased.
Agreements with our financial guaranty insurance providers contain additional specified targeted portfolio performance ratios that are higher than those described in the preceding paragraph. If, at any measurement date, the targeted portfolio performance ratios with respect to any insured Trust were to exceed these higher levels, provisions of the agreements permit our financial guaranty insurance providers to declare the occurrence of an event of default and terminate our servicing rights to the receivables transferred to that Trust. As of June 30, 2010, no such servicing right termination events have occurred with respect to any of the Trusts formed by us.
During fiscal 2010, 2009 and 2008, we exceeded certain portfolio performance ratios in several AMCAR and LBAC securitizations. Excess cash flows from these Trusts have been or are being used to build higher credit enhancement in each respective Trust instead of being distributed to us. We do not expect the trapping of excess cash flows from these Trusts to have a material adverse impact to our liquidity.
On January 22, 2010, we entered into an agreement with Assured Guaranty Municipal Corp. (“Assured”), to increase the levels of additional specified targeted portfolio performance ratios in the AMCAR 2007-D-F, AMCAR 2008-A-F, LB2006-B and LB2007-A securitizations. As part of this agreement, we deposited $38.0 million in the AMCAR 2007-D-F securitization restricted cash account and $57.0 million in the AMCAR 2008-A-F securitization restricted cash account. This cash is expected to be redistributed to us over time as the securitization notes pay down.
61
Table of Contents
| 7. | Senior Notes and Convertible Senior Notes |
Senior notes and convertible senior notes consist of the following (in thousands):
| June 30, 2010 |
June 30, 2009 |
|||||||
| 8.5% Senior Notes (due July 2015) |
$ | 70,620 | $ | 91,620 | ||||
| 0.75% Convertible Senior Notes |
247,000 | 247,000 | ||||||
| Debt discount |
(17,645 | ) | (31,088 | ) | ||||
| 2.125% Convertible Senior Notes |
215,017 | 215,017 | ||||||
| Debt discount |
(30,304 | ) | (38,415 | ) | ||||
| $ | 414,068 | $ | 392,514 | |||||
As a result of adopting new guidance regarding the accounting for convertible debt instruments that may be settled in cash upon conversion (including partial cash settlement), we have separately accounted for the liability and equity components of the convertible senior notes due in September 2011 and 2013, retrospectively, based on our nonconvertible debt borrowing rate on the issuance date of approximately 7%. At issuance, the liability and equity components were $404.3 million and $145.7 million ($91.7 million net of deferred taxes), respectively. The debt discount is being amortized to interest expense over the expected term of the notes based on the effective interest method.
Interest expense related to the convertible senior notes consists of the following (in thousands):
| Years Ended June 30, |
2010 | 2009 | 2008 | ||||||
| Discount amortization |
$ | 21,554 | $ | 22,506 | $ | 22,062 | |||
| Contractual interest |
6,421 | 7,379 | 7,906 | ||||||
| Total interest expense related to convertible senior notes |
$ | 27,975 | $ | 29,885 | $ | 29,968 | |||
Debt issuance costs related to the senior notes and the convertible senior notes are being amortized to interest expense over the expected term of the notes; unamortized costs of $0.9 million and $1.4 million related to the senior notes and $2.8 million and $4.2 million related to the convertible senior notes are included in other assets on the consolidated balance sheets as of June 30, 2010 and 2009, respectively. Debt issuance costs of approximately $3.5 million directly related to the issuance of the convertible senior notes have been allocated to the equity component in proportion to the allocation of proceeds.
Senior Notes
Interest on the senior notes is payable semiannually. The notes will be redeemable, at our option, in whole or in part, at any time on or after July 1, 2011, at specific redemption prices. The indenture pursuant to which the senior notes were issued contains certain restrictions including limitations on our ability to incur additional indebtedness, other than certain collateralized indebtedness, pay cash dividends and repurchase common stock.
In November 2008, we issued 15,122,670 shares of our common stock to Fairholme Funds Inc (“Fairholme”), in a non-cash transaction, in exchange for $108.4 million of our senior notes due 2015, held by Fairholme, at a price of $840 per $1,000 principal amount of the notes. We recognized a gain of $14.7 million, net of transaction costs, on retirement of debt in the exchange. Fairholme and its affiliates held approximately 19.8% of our outstanding common stock prior to the issuance of these shares.
62
Table of Contents
During fiscal 2010, we repurchased on the open market $21.0 million of senior notes due in 2015 at an average price of 97.3% of the principal amount of the notes repurchased which resulted in a gain on retirement of debt of $0.3 million.
In the event of a change of control, each holder of senior notes shall have the right, at the holder’s option, to require us to repurchase all or any part of such holder’s senior notes pursuant to a notice from us describing the transaction that constitutes a change of control at an offer price equal to 101% of the principal amount of the notes.
Convertible Senior Notes
Interest on the convertible senior notes is payable semiannually. Subject to certain conditions, the notes, which are uncollateralized, may be converted prior to maturity into shares of our common stock at an initial conversion price of $28.07 per share and $30.51 per share for the notes due in 2011 and 2013, respectively. Upon conversion, the conversion value will be paid in: 1) cash equal to the principal amount of the notes and 2) to the extent the conversion value exceeds the principal amount of the notes, shares of our common stock. The notes are convertible only in the following circumstances: 1) if the closing sale price of our common stock exceeds 130% of the conversion price during specified periods set forth in the indentures under which the notes were issued, 2) if the average trading price per $1,000 principal amount of the notes is less than or equal to 98% of the average conversion value of the notes during specified periods set forth in the indentures under which the notes were issued or 3) upon the occurrence of specific corporate transactions set forth in the indentures under which the notes were issued. At June 30, 2010 and 2009, the if-converted value did not exceed the principal amount of the convertible senior notes.
In connection with the issuance of the convertible senior notes due in 2011 and 2013, we purchased call options that entitle us to purchase shares of our common stock in an amount equal to the number of shares issued upon conversion of the notes at $28.07 per share and $30.51 per share for the notes due in 2011 and 2013, respectively. These call options are expected to allow us to offset the dilution of our shares if the conversion feature of the convertible senior notes is exercised.
We also sold warrants to purchase 9,796,408 shares of our common stock at $35.00 per share and 9,012,713 shares of our common stock at $40 per share for the notes due in 2011 and 2013, respectively. In no event are we required to deliver a number of shares in connection with the exercise of these warrants in excess of twice the aggregate number of shares initially issuable upon the exercise of the warrants.
We have analyzed the conversion feature, call option and warrant transactions regarding accounting for derivative financial instruments indexed to and potentially settled in a company’s own stock and determined they meet the criteria for classification as equity transactions. As a result, both the cost of the call options and the proceeds of the warrants are reflected in additional paid-in capital on our consolidated balance sheets, and we will not recognize subsequent changes in their fair value.
During fiscal 2009, we repurchased on the open market $28.0 par value million of our convertible senior notes due in 2011 at an average price of 44.2% of the principal amount of the notes repurchased. We also repurchased $60.0 par value million of our convertible senior notes due in 2013 at an average price of 44.1% of the principal amount of the notes repurchased. In connection with these repurchases, we recorded a gain on retirement of debt of $32.7 million.
During fiscal 2009, we repurchased and retired all $200.0 million of our convertible notes due in November 2023 at an average price equal to 99.5% of the principal amount of notes redeemed. We recorded a gain on retirement of debt of $0.8 million.
In the event of a change of control, each holder of convertible senior notes shall have the right, at the holder’s option, to require us to repurchase all or any part of such holder’s convertible senior notes pursuant to a notice from us describing the transaction that constitutes a change of control at an offer price equal to 100% of the principal amount of the notes.
63
Table of Contents
| 8. | Derivative Financial Instruments and Hedging Activities |
We are exposed to market risks arising from adverse changes in interest rates due to floating interest rate exposure on our credit facilities and on certain securitization notes payable. See Note 1 - “Summary of Significant Accounting Policies—Derivative Financial Instruments” for more information regarding our derivative financial instruments and hedging activities.
Interest rate caps, swaps and foreign currency contracts consist of the following (in thousands):
| June 30, 2010 | June 30, 2009 | |||||||||||
| Notional | Fair Value | Notional | Fair Value | |||||||||
| Assets |
||||||||||||
| Interest rate swaps(a) |
$ | 1,682,182 | $ | 26,194 | $ | 2,592,548 | $ | 24,267 | ||||
| Interest rate caps(a) |
774,456 | 3,188 | 1,914,886 | 15,858 | ||||||||
| Total assets |
$ | 2,456,638 | $ | 29,382 | $ | 4,507,434 | $ | 40,125 | ||||
| Liabilities |
||||||||||||
| Interest rate swaps |
$ | 1,682,182 | $ | 70,421 | $ | 2,592,548 | $ | 131,885 | ||||
| Interest rate caps(b) |
708,287 | 3,320 | 1,721,044 | 16,644 | ||||||||
| Foreign currency contracts(b)(c) |
58,470 | 1,206 | ||||||||||
| Total liabilities |
$ | 2,448,939 | $ | 74,947 | $ | 4,313,592 | $ | 148,529 | ||||
| (a) | Included in other assets on the consolidated balance sheets. |
| (b) | Included in other liabilities on the consolidated balance sheets. |
| (c) | Notional has been translated from Canadian dollars to U.S. dollars at the quarter end rate. |
Interest rate swap agreements designated as hedges had unrealized losses of approximately $53.8 million and $97.1 million included in accumulated other comprehensive income (loss) as of June 30, 2010 and 2009, respectively. The ineffectiveness related to the interest rate swap agreements was $0.4 million and $0.8 million for fiscal 2010 and 2009, respectively, and immaterial for fiscal 2008. We estimate approximately $43.7 million of unrealized losses included in accumulated other comprehensive loss will be reclassified into earnings within the next twelve months.
Interest rate swap agreements not designated as hedges had a change in fair value which resulted in gains of $12.6 million and $22.7 million included in interest expense on the consolidated statements of operations for fiscal 2010 and 2009, respectively.
Under the terms of our derivative financial instruments, we are required to pledge certain funds to be held in restricted cash accounts as collateral for the outstanding derivative transactions. As of June 30, 2010 and 2009, these restricted cash accounts totaled $26.7 million and $45.7 million, respectively, and are included in other assets on the consolidated balance sheets.
On September 15, 2008, Lehman Brothers Holdings Inc. (“LBHI”) and 16 additional affiliates of LBHI (together with LBHI, “Lehman”), filed petitions in bankruptcy court. Lehman was the hedge counterparty on interest rate swaps with notional amounts of $1.1 billion. In November 2008, we replaced Lehman as the counterparty on these interest rate swaps. Upon replacement we designated these new swaps as hedges. From July 1, 2008 until the hedge designation date of the replacement swaps, the change in fair value on these swap agreements resulted in a $34.1 million loss for fiscal 2009, and is included in interest expense in the consolidated statements of operations and comprehensive operations.
64
Table of Contents
The following tables present information on the effect of derivative instruments on the consolidated statements of operations and comprehensive operations for fiscal 2010 and 2009, respectively (in thousands):
| Income (Losses) Recognized In Income | ||||||||||||
| 2010 | 2009 | 2008 | ||||||||||
| Non-Designated hedges: |
||||||||||||
| Interest rate contracts(a) |
$ | 13,248 | $ | (12,463 | ) | $ | 6,891 | |||||
| Foreign currency contracts(b) |
(1,206 | ) | ||||||||||
| Total |
$ | 12,042 | $ | (12,463 | ) | $ | 6,891 | |||||
| Designated hedges: |
||||||||||||
| Interest rate contracts(a) |
$ | 394 | $ | (781 | ) | $ | ||||||
| Total |
$ | 394 | $ | (781 | ) | $ | ||||||
| (Losses) Recognized in Accumulated Other Comprehensive Income (Loss) |
||||||||||||
| 2010 | 2009 | 2008 | ||||||||||
| Designated hedges: |
||||||||||||
| Interest rate contracts(a) |
$ | (36,761 | ) | $ | (109,115 | ) | $ | (109,039 | ) | |||
| Total |
$ | (36,761 | ) | $ | (109,115 | ) | $ | (109,039 | ) | |||
| (Losses) Reclassified From Accumulated Other Comprehensive Income (Loss) into Income(c) |
||||||||||||
| 2010 | 2009 | 2008 | ||||||||||
| Designated hedges: |
||||||||||||
| Interest rate contracts(a) |
$ | (80,067 | ) | $ | (82,244 | ) | $ | (24,635 | ) | |||
| Total |
$ | (80,067 | ) | $ | (82,244 | ) | $ | (24,635 | ) | |||
| (a) | Income (losses) recognized in income are included in interest expense. |
| (b) | Income (losses) recognized in income are included in operating expenses. |
| (c) | Losses reclassified from AOCI into income for effective and ineffective portions are included in interest expense. |
| 9. | Fair Values of Assets and Liabilities |
Effective July 1, 2008, we adopted fair value measurement guidance which provides a framework for measuring fair value under GAAP. Fair value is defined as the exchange price that would be received for an asset or paid to transfer a liability (an exit price) in the principal or most advantageous market for the asset or liability in an orderly transaction between market participants on the measurement date. Fair value measurement requires that valuation techniques maximize the use of observable inputs and minimize the use of unobservable inputs and also establishes a fair value hierarchy which prioritizes the valuation inputs into three broad levels.
There are three general valuation techniques that may be used to measure fair value, as described below:
| (A) | Market approach – Uses prices and other relevant information generated by market transactions involving identical or comparable assets or liabilities. Prices may be indicated by pricing guides, sale transactions, market trades, or other sources; |
| (B) | Cost approach – Based on the amount that currently would be required to replace the service capacity of an asset (replacement cost); and |
65
Table of Contents
| (C) | Income approach – Uses valuation techniques to convert future amounts to a single present amount based on current market expectations about the future amounts (includes present value techniques and option-pricing models). Net present value is an income approach where a stream of expected cash flows is discounted at an appropriate market interest rate. |
Assets and liabilities itemized below were measured at fair value on a recurring basis at June 30, 2010:
| June 30, 2010 (in thousands) | ||||||||||||
| Fair Value Measurements Using | Assets/ Liabilities At Fair Value | |||||||||||
| Level
1 Quoted Prices In Active Markets Identical Assets |
Level 2 Significant Other Observable Inputs |
Level 3 Significant Unobservable Inputs |
||||||||||
| Assets |
||||||||||||
| Derivatives not designated as hedging instruments: |
||||||||||||
| Interest rate caps (A) |
$ | 3,188 | $ | 3,188 | ||||||||
| Interest rate swaps (C) |
$ | 26,194 | 26,194 | |||||||||
| Total assets |
$ | $ | 3,188 | $ | 26,194 | $ | 29,382 | |||||
| Liabilities |
||||||||||||
| Derivatives designated as hedging instruments: |
||||||||||||
| Interest rate swaps (C) |
$ | 70,421 | $ | 70,421 | ||||||||
| Derivatives not designated as hedging instruments: |
||||||||||||
| Interest rate caps (A) |
$ | 3,320 | 3,320 | |||||||||
| Foreign currency contracts (A) |
1,206 | 1,206 | ||||||||||
| Total liabilities |
$ | $ | 4,526 | $ | 70,421 | $ | 74,947 | |||||
Assets and liabilities itemized below were measured at fair value on a recurring basis at June 30, 2009:
| June 30, 2009 (in thousands) | ||||||||||||
| Fair Value Measurements Using | Assets/ Liabilities At Fair Value | |||||||||||
| Level
1 Quoted Prices In Active Markets Identical Assets |
Level 2 Significant Other Observable Inputs |
Level 3 Significant Unobservable Inputs |
||||||||||
| Assets |
||||||||||||
| Investment in money market fund (A) |
$ | 8,027 | $ | 8,027 | ||||||||
| Derivatives not designated as hedging instruments: |
||||||||||||
| Interest rate caps (A) |
$ | 15,858 | 15,858 | |||||||||
| Interest rate swaps (C) |
24,267 | 24,267 | ||||||||||
| Total assets |
$ | $ | 15,858 | $ | 32,294 | $ | 48,152 | |||||
| Liabilities |
||||||||||||
| Derivatives designated as hedging instruments: |
||||||||||||
| Interest rate swaps (C) |
$ | 131,885 | $ | 131,885 | ||||||||
| Derivatives not designated as hedging instruments: |
||||||||||||
| Interest rate caps (A) |
$ | 16,644 | 16,644 | |||||||||
| Total liabilities |
$ | $ | 16,644 | $ | 131,885 | $ | 148,529 | |||||
66
Table of Contents
Financial instruments are considered Level 1 when quoted prices are available in active markets for identical assets or liabilities as of the reporting date. Active markets are those in which transactions for the asset or liability occur in sufficient frequency and volume to provide pricing information on an ongoing basis.
Financial instruments are considered Level 2 when inputs other than quoted prices are observable for the asset or liability, either directly or indirectly. These include quoted prices for similar assets or liabilities in active markets and quoted prices for identical or similar assets or liabilities in markets that are not active.
Financial instruments are considered Level 3 when their values are determined using price models, discounted cash flow methodologies or similar techniques and at least one significant model assumption or input is unobservable. Level 3 financial instruments also include those for which the determination of fair value requires significant management judgment or estimation. A brief description of the valuation techniques used for our Level 3 assets and liabilities is provided below and in Note 4 - “Investment in Money Market Fund”.
The table below presents a reconciliation for all assets and liabilities measured at fair value on a recurring basis using significant unobservable inputs (Level 3) for fiscal 2010 and 2009 (in thousands):
| Assets | Liabilities | |||||||||||
| Interest Rate Swap Agreements |
Investment in Money Market Fund |
Interest Rate Swap Agreements |
||||||||||
| Balance at July 1, 2008 |
$ | 3,572 | $ | (76,269 | ) | |||||||
| Transfers into Level 3 |
$ | 115,821 | ||||||||||
| Total realized and unrealized gains (losses) |
||||||||||||
| Included in earnings |
22,700 | (3,475 | ) | (34,926 | ) | |||||||
| Included in other comprehensive income |
(109,115 | ) | ||||||||||
| Settlements |
(2,005 | ) | (104,319 | ) | 88,425 | |||||||
| Balance at June 30, 2009 |
24,267 | 8,027 | (131,885 | ) | ||||||||
| Total realized and unrealized gains (losses) |
||||||||||||
| Included in earnings |
12,595 | 2,020 | 394 | |||||||||
| Included in other comprehensive income |
(36,761 | ) | ||||||||||
| Settlements |
(10,668 | ) | (10,047 | ) | 97,831 | |||||||
| Balance at June 30, 2010 |
$ | 26,194 | $ | $ | (70,421 | ) | ||||||
Derivatives
The fair values of our interest rate caps are valued based on quoted market prices received from bank counterparties and are classified as Level 2.
Our interest rate swaps are not exchange traded but instead traded in over-the-counter markets where quoted market prices are not readily available. The fair value of derivatives is derived using models that use primarily market observable inputs, such as interest rate yield curves and credit curves. Any derivative fair value measurements using significant assumptions that are unobservable are classified as Level 3, which include interest rate swaps whose remaining terms extend beyond market observable interest rate yield curves. The impacts of our and the counterparties’ non-performance risk to the derivative trades is considered when measuring the fair value of derivative assets and liabilities.
| 10. | Commitments and Contingencies |
Leases
Our credit centers are generally leased for terms of up to five years with certain rights to extend for additional periods. We also lease space for our administrative offices and loan servicing activities under leases with terms up to twelve years with renewal options. Certain leases contain lease escalation clauses for real estate
67
Table of Contents
taxes and other operating expenses and renewal option clauses calling for increased rents. Lease expense was $12.9 million, $15.6 million and $18.5 million for fiscal 2010, 2009 and 2008, respectively.
Operating lease commitments for years ending June 30 are as follows (in thousands):
| 2011 |
$ | 11,174 | |
| 2012 |
11,097 | ||
| 2013 |
10,522 | ||
| 2014 |
10,248 | ||
| 2015 |
9,878 | ||
| Thereafter |
24,560 | ||
| $ | 77,479 | ||
Concentrations of Credit Risk
Financial instruments which potentially subject us to concentrations of credit risk are primarily cash equivalents, restricted cash, derivative financial instruments and finance receivables. Our cash equivalents and restricted cash represent investments in highly rated securities placed through various major financial institutions and highly rated investments in guaranteed investment contracts. The counterparties to our derivative financial instruments are various major financial institutions. Finance receivables represent contracts with consumers residing throughout the United States and, to a limited extent, in Canada, with borrowers located in Texas and California each accounting for 14% and 11%, respectively, of the finance receivables portfolio as of June 30, 2010. No other state accounted for more than 10% of finance receivables.
Limited Corporate Guarantees of Indebtedness
We guarantee the timely payment of interest and ultimate payment of principal on the Class B and Class C asset-backed securities issued in our AMCAR 2008-2 securitization transaction, up to a maximum of $50.0 million in the aggregate.
Guarantees of Indebtedness
The payments of principal and interest on our senior notes and convertible senior notes are guaranteed by certain of our subsidiaries. As of June 30, 2010 and 2009, the par value of the senior notes and convertible senior notes was $532.6 million and $553.6 million, respectively. See Note 21 - “Guarantor Consolidating Financial Statements”.
Legal Proceedings
As a consumer finance company, we are subject to various consumer claims and litigation seeking damages and statutory penalties, based upon, among other things, usury, disclosure inaccuracies, wrongful repossession, violations of bankruptcy stay provisions, certificate of title disputes, fraud, breach of contract and discriminatory treatment of credit applicants. Some litigation against us could take the form of class action complaints by consumers and/or shareholders. As the assignee of finance contracts originated by dealers, we may also be named as a co-defendant in lawsuits filed by consumers principally against dealers. The damages and penalties claimed by consumers in these types of matters can be substantial. The relief requested by the plaintiffs varies but can include requests for compensatory, statutory and punitive damages. We believe that we have taken prudent steps to address and mitigate the litigation risks associated with our business activities. However, any adverse resolution of litigation pending or threatened against us could have a material adverse affect on our financial condition, results of operations and cash flows.
68
Table of Contents
On July 21, 2010, we entered into the Merger Agreement. A public announcement of the agreement was made on July 22, 2010. The following litigation has been commenced with respect to the proposed Merger:
On July 27, 2010, an action styled Robert Hatfield, Derivatively on behalf of AmeriCredit Corp. vs. Clifton H. Morris, Jr., Daniel E. Berce, John Clay, Ian M. Cumming, A.R. Dike, James H. Greer, Douglas K. Higgins, Kenneth H. Jones, Jr., Robert B. Sturges, Justin R. Wheeler, General Motors Holdings LLC and General Motors Company, Defendants, and AmeriCredit Corp., Nominal Defendant, was filed in the District Court of Tarrant County, Texas, Cause No. 017 246937 10 (the “Hatfield Case”). In the Hatfield Case, the plaintiff alleges, among other allegations, that the individual defendants, who are members of our Board of Directors, breached their fiduciary duties with regards to the pending transaction between us and GM Holdings. Among other relief, the complaint seeks to enjoin the closing of the transaction, to require us to rescind the transaction and the recovery of attorney fees and expenses.
On July 28, 2010, an action styled Labourers’ Pension Fund of Central and Eastern Canada, on behalf of itself and all others similarly situated v. AmeriCredit Corp., Clifton H. Morris, Jr., Daniel E. Berce, Bruce R. Berkowitz, John R. Clay, Ian M. Cumming, A.R. Dike, James H. Greer, Douglas K. Higgins, Kenneth H. Jones, Jr., Justin R. Wheeler and General Motors Company, Defendants, was filed in the District Court of Tarrant County, Texas, Cause No. 236 246960 10 (the “Labourers’ Pension Fund Case”). In the Labourers’ Pension Fund Case, the plaintiff seeks class action status and alleges that members of our Board of Directors breached their fiduciary duties in negotiating and approving the proposed transaction between us and GM Holdings. Among other relief, the complaint seeks to enjoin both the transaction from closing as well as a shareholder vote on the pending transaction and seeks the recovery of damages on behalf of shareholders and the recovery of attorney fees and expenses. The court has not yet determined whether the case may be maintained as a class action.
On August 6, 2010, an action styled Carla Butler, Derivatively on behalf of AmeriCredit Corp., Plaintiff vs. Clifton H. Morris, Jr., Daniel E. Berce, John Clay, Ian M. Cumming, A.R. Dike, James H. Greer, Douglas K. Higgins, Kenneth H. Jones, Jr., Robert B. Sturges, Justin R. Wheeler, General Motors Holdings LLC and General Motors Company, Defendants, and AmeriCredit Corp., Nominal Defendant, was filed in the District Court of Tarrant County, Texas, Cause No. 67 247227-10 (the “Butler Case”). In the Butler Case, like previously filed litigation related to the proposed transaction between us and GM Holdings, the complaint alleges that our individual officers and directors breached their fiduciary duties. Among other relief, the complaint seeks to rescind the transaction and enjoin its consummation and also to award plaintiff costs and disbursements including attorneys’ and expert fees.
On August 24, 2010, an action styled Asbestos Workers Local 42 Pension Fund, Plaintiff vs. Daniel E. Berce, Clifton H. Morris, Ian M. Cumming, Justin R. Wheeler, James H. Greer, A.R. Dike, Douglas K. Higgins, Kenneth H. Jones, Jr., John R. Clay, Robert B. Sturges, General Motors Holdings LLC and Goalie Texas Holdco Inc., Defendants, and AmeriCredit Corp., Nominal Defendant, was filed in the District Court of Tarrant County, Texas, Cause No. 017 247635-10 (the “Asbestos Workers Case”). In the Asbestos Workers Case, like previously filed litigation related to the proposed transaction between us and GM Holdings, the complaint alleges that our individual officers and directors breached their fiduciary duties. Among other relief, the complaint seeks to rescind the transaction and enjoin its consummation and also to award plaintiff costs and disbursements including attorneys’ and expert fees.
We believe that the claims alleged in the Hatfield Case, the Labourers’ Pension Fund Case, the Butler Case and the Asbestos Workers Case are without merit and we intend to assert vigorous defenses to the litigation. Neither the likelihood of an unfavorable outcome nor the amount of ultimate liability, if any, with respect to this litigation can be determined at this time.
69
Table of Contents
| 11. | Common Stock and Warrants |
The following summarizes share repurchase activity:
| Years Ended June 30, |
2008 | ||
| Number of shares |
5,734,850 | ||
| Average price per share |
$ | 22.30 | |
We have repurchased $1,374.8 million of our common stock since inception of our share repurchase program in April 2004, and we have remaining authorization to repurchase $172.0 million of our common stock. Covenants in our indentures entered into with respect to our senior notes and convertible senior notes limit our ability to repurchase stock. Currently, we do not anticipate pursuing repurchase activity for the foreseeable future.
In connection with the forward purchase commitment agreement with Deutsche (See Note 3 - “Securitizations”), we issued a warrant to an affiliate of Deutsche under which it may purchase up to 7.5 million shares of our common stock. The warrant may be exercised on or before April 15, 2015 at an exercise price of $12.01 per share.
In connection with the closing of the Wachovia funding facilities (See Note 3 - “Securitizations”), we issued a warrant to Wachovia under which they may purchase up to 1.0 million shares of common stock. The warrant may be exercised on or before September 24, 2015 at an exercise price of $13.55 per share. On August 10, 2010, Wachovia exercised the warrant at a price of $24.12 per share in a cashless exercise and received a net settlement of 438,112 shares of our common stock.
| 12. | Stock Based Compensation |
General
We have certain stock based compensation plans for employees, non-employee directors and key executive officers.
A total of 10,000,000 shares were available for grants to non-employee directors as well as employees. As of June 30, 2010, 8,235,800 shares remain available for future grants. The exercise price of each equity grant must equal the market price of our stock on the date of grant, and the maximum term of each equity grant is ten years. The vesting period is typically three to four years, although grants with other vesting periods or grants that vest upon the achievement of specified performance criteria may be authorized under certain employee plans. A committee of our Board of Directors establishes policies and procedures for equity grants, vesting periods and the term of each grant.
Total unamortized stock based compensation was $16.7 million as of June 30, 2010, and will be recognized over a weighted average life of 1.5 years.
Stock Options
Compensation expense recognized for stock options was $1.3 million, $2.1 million, and $1.0 million for fiscal 2010, 2009 and 2008, respectively. As of June 30, 2010 and 2009, unamortized compensation expense related to stock options was $1.2 million, and $2.2 million, respectively.
70
Table of Contents
Employee Plans
A summary of stock option activity under our employee plans is as follows (shares in thousands):
| Years Ended June 30, |
2010 | 2009 | 2008 | |||||||||||||||
| Shares | Weighted Average Exercise Price |
Shares | Weighted Average Exercise Price |
Shares | Weighted Average Exercise Price | |||||||||||||
| Outstanding at beginning of year |
2,106 | $ | 18.02 | 2,127 | $ | 23.48 | 3,499 | $ | 18.83 | |||||||||
| Granted |
42 | 20.96 | 942 | 8.03 | ||||||||||||||
| Exercised |
(757 | ) | 13.44 | (132 | ) | 8.01 | (1,119 | ) | 9.01 | |||||||||
| Canceled/forfeited |
(67 | ) | 17.56 | (831 | ) | 22.26 | (253 | ) | 23.21 | |||||||||
| Outstanding at end of year |
1,324 | $ | 20.75 | 2,106 | $ | 18.02 | 2,127 | $ | 23.48 | |||||||||
| Options exercisable at end of year |
1,033 | $ | 23.81 | 1,563 | $ | 21.33 | 2,055 | $ | 23.34 | |||||||||
| Weighted average fair value of options granted during year |
$ | 10.79 | $ | 4.50 | ||||||||||||||
Cash received from exercise of options for fiscal 2010, 2009 and 2008 was $10.2 million, $1.1 million and $10.1 million, respectively. The total intrinsic value of options exercised during fiscal 2010, 2009 and 2008, was $5.9 million, $0.4 million and $6.4 million, respectively.
A summary of options outstanding under our employee plans as of June 30, 2010, is as follows (shares in thousands):
| Options Outstanding | Options Exercisable | |||||||||||
| Range of Exercise Prices |
Number Outstanding |
Weighted Average Years of Remaining Contractual Life |
Weighted Average Exercise Price |
Number Outstanding |
Weighted Average Exercise Price | |||||||
| $6.80 to 10.00 |
421 | 2.66 | $ | 7.94 | 172 | $ | 7.80 | |||||
| $10.01 to 15.00 |
80 | 3.35 | 13.55 | 80 | 13.55 | |||||||
| $15.01 to 19.00 |
128 | 1.35 | 16.10 | 128 | 16.10 | |||||||
| $19.01 to 21.00 |
158 | 4.01 | 20.08 | 116 | 19.77 | |||||||
| $21.01 to 30.00 |
309 | 2.42 | 25.58 | 309 | 25.58 | |||||||
| $30.01 to 50.00 |
216 | 0.80 | 42.91 | 216 | 42.91 | |||||||
| $50.01 to 55.00 |
12 | 0.98 | 54.14 | 12 | 54.14 | |||||||
| 1,324 | 1,033 | |||||||||||
Non-Employee Director Plans
A summary of stock option activity under our non-employee director plans is as follows (shares in thousands):
| Years Ended June 30, |
2010 | 2009 | 2008 | |||||||||||||||
| Shares | Weighted Average Exercise Price |
Shares | Weighted Average Exercise Price |
Shares | Weighted Average Exercise Price | |||||||||||||
| Outstanding at beginning of year |
80 | $ | 17.81 | 160 | $ | 16.35 | 220 | $ | 15.88 | |||||||||
| Exercised |
(80 | ) | 17.81 | (20 | ) | 14.63 | ||||||||||||
| Canceled/forfeited |
(80 | ) | 14.88 | (40 | ) | 14.63 | ||||||||||||
| Outstanding and exercisable at end of year |
$ | 80 | $ | 17.81 | 160 | $ | 16.35 | |||||||||||
71
Table of Contents
Cash received from exercise of options for fiscal 2010 and 2008 was $1.4 million and $0.3 million, respectively. The total intrinsic value of options exercised during fiscal 2010 and 2008 was $0.03 million and $0.1 million, respectively.
Restricted Stock Based Grants
Restricted stock grants totaling 5,596,600 shares with an approximate aggregate market value of $98.8 million at the time of grant have been issued under the employee plans. The market value of these restricted shares at the date of grant is being amortized into expense over a period that approximates the service period of three years.
A total of 2,948,500 shares of restricted stock granted to employees vest in annual increments through March 2013.
A total of 2,373,500 shares of restricted stock granted to key executive officers may vest depending on achievement of specific financial results on the date when the Compensation Committee of our Board of Directors certifies these results for years ending through June 30, 2012.
A total of 274,600 shares of restricted stock granted to non-employee directors vest between the date of grant and completion of a one year service period.
Compensation expense recognized for restricted stock grants was $10.1 million, $9.8 million and $11.9 million for fiscal 2010, 2009 and 2008, respectively. As of June 30, 2010 and 2009, unamortized compensation expense related to the restricted stock awards was $14.4 million and $12.4 million, respectively. A summary of the status of non-vested restricted stock for fiscal 2010, 2009 and 2008, is presented below (shares in thousands):
| Years Ended June 30, |
2010 | 2009 | 2008 | ||||||
| Nonvested at beginning of year |
2,253 | 1,301 | 2,421 | ||||||
| Granted |
415 | 2,143 | 61 | ||||||
| Vested |
(555 | ) | (545 | ) | (847 | ) | |||
| Forfeited |
(303 | ) | (646 | ) | (334 | ) | |||
| Nonvested at end of year |
1,810 | 2,253 | 1,301 | ||||||
Stock Appreciation Rights
Stock appreciation rights with respect to 680,600 shares with an approximate aggregate market value of $9.7 million at the time of grant have been issued under the employee plans. The market value of these rights at the date of grant is being amortized into expense over a period that approximates the service period of three years. Compensation expense recognized for stock appreciation rights was $2.5 million for fiscal 2008. As of June 30, 2010 and 2009 there was no unamortized compensation expense remaining.
A summary of the status of non-vested stock appreciation rights for fiscal 2008, is presented below (shares in thousands):
| Years ended June 30, |
2008 | ||
| Nonvested at beginning of year |
337 | ||
| Vested |
(337 | ) | |
| Forfeited |
|||
| Nonvested at end of year |
|||
72
Table of Contents
| 13. | Employee Benefit Plans |
We have a defined contribution retirement plan covering substantially all employees. We recognized $1.4 million, $2.7 million, and $5.6 million in compensation expense for fiscal 2010, 2009 and 2008, respectively, for contributions of cash in fiscal 2010 and common stock in fiscal 2009 and 2008 to the plan.
We also have an employee stock purchase plan that allows participating employees to purchase, through payroll deductions, shares of our common stock at 85% of the market value at specified dates. A total of 8,000,000 shares have been reserved for issuance under the plan. As of June 30, 2010, 2,157,104 shares remain available for issuance under the plan. Shares issued under the plan were 706,204, 483,334, and 570,813 for fiscal 2010, 2009 and 2008, respectively. We recognized $3.7 million, $2.4 million, and $2.6 million in compensation expense for fiscal 2010, 2009 and 2008, respectively, related to this plan. As of June 30, 2010 and 2009, unamortized compensation expense related to the employee stock purchase plan was $1.1 million and $2.0 million, respectively.
| 14. | Income Taxes |
The income tax provision consists of the following (in thousands):
| Years Ended June 30, |
2010 | 2009 | 2008 | |||||||||
| Current |
$ | 157,460 | $ | (216,041 | ) | $ | 115,089 | |||||
| Deferred |
(24,567 | ) | 226,783 | (146,361 | ) | |||||||
| $ | 132,893 | $ | 10,742 | $ | (31,272 | ) | ||||||
Our effective income tax rate on income before income taxes differs from the U.S. statutory tax rate as follows:
| Years Ended June 30, |
2010 | 2009(a) | 2008 | ||||||
| U.S. statutory tax rate |
35.0 | % | 35.0 | % | 35.0 | % | |||
| State and other income taxes |
0.9 | N/M | 1.1 | ||||||
| Deferred tax rate change |
0.7 | N/M | 11.4 | ||||||
| FIN 48 uncertain tax positions |
1.1 | N/M | (6.0 | ) | |||||
| Valuation allowance |
0.3 | N/M | |||||||
| Tax exempt interest |
1.6 | ||||||||
| Investment in Canadian subsidiaries |
(12.4 | ) | |||||||
| Non-deductible impairment of goodwill |
(2.6 | ) | |||||||
| Other |
(0.4 | ) | N/M | (0.6 | ) | ||||
| 37.6 | % | N/M | 27.5 | % | |||||
| (a) | N/M = Not meaningful. Because the retrospective adoption of the accounting for convertible debt instruments that may be settled in cash upon conversion (including partial cash settlement) resulted in a loss before income taxes of $0.1 million and we recorded an income tax provision of $10.7 million, the effective income tax rate and the effect on such rate of the listed reconciling items is not meaningful. |
The fiscal 2009 effective tax rate was negatively impacted by state and other income tax items of $4.0 million, deferred tax rate change of $3.3 million, state net operating losses limited under Section 382 of $2.1 million and other items of $0.9 million.
73
Table of Contents
The tax effects of temporary differences that give rise to deferred tax liabilities and assets are as follows (in thousands):
| June 30, |
2010 | 2009 | ||||||
| Deferred tax liabilities: |
||||||||
| Market value difference of loan portfolio |
$ | (14,644 | ) | $ | (104,984 | ) | ||
| Capitalized direct loan origination costs |
(6,695 | ) | (10,084 | ) | ||||
| Fixed assets |
(17,386 | ) | (13,397 | ) | ||||
| Deferred gain on debt repurchase |
(8,998 | ) | (8,638 | ) | ||||
| Basis difference on convertible debt |
(17,169 | ) | (24,357 | ) | ||||
| Other |
(38,208 | ) | (6,606 | ) | ||||
| (103,100 | ) | (168,066 | ) | |||||
| Deferred tax assets: |
||||||||
| Net operating loss carryforward–Canada |
1,348 | 3,229 | ||||||
| Net operating loss carryforward–U.S. |
73,589 | |||||||
| Net operating loss carryforward–state |
3,280 | 9,685 | ||||||
| Alternative minimum tax credit carryforward |
12,131 | |||||||
| Unrealized swap valuation on other comprehensive income |
19,842 | 31,745 | ||||||
| Impairment of goodwill and other intangible amortization |
60,191 | 62,748 | ||||||
| Unrecognized income tax benefits from uncertain tax positions |
27,929 | 19,586 | ||||||
| Other |
74,104 | 31,869 | ||||||
| 186,694 | 244,582 | |||||||
| Valuation allowance |
(1,759 | ) | (734 | ) | ||||
| Net deferred tax asset |
$ | 81,836 | $ | 75,782 | ||||
Tax Accounting Change
During fiscal 2009, we filed an application for a change of accounting method for tax purposes under Internal Revenue Code (“IRC”) Section 475. We believe that, as a result of our business activities, certain assets must be marked-to-market for income tax purposes. Although this method change requires consent from the IRS, which is still pending, this change to a permissible method of accounting is generally considered to be perfunctory and should be granted. As a result of this change of accounting, we reported a taxable loss for fiscal 2009 of $803 million. Approximately $600 million of this loss was carried back to the prior two fiscal years to offset federal taxable income recognized in those years, resulting in an income tax refund of approximately $198 million.
On November 6, 2009, the Worker, Homeownership, and Business Assistance Act of 2009 was signed into law which provides an election to carryback a loss to the third, fourth or fifth year that precedes the year of loss. Because of this change in tax law, we elected to extend our U.S. federal fiscal 2009 net operating loss (“NOL”) carryback period which resulted in an additional income tax refund of approximately $81 million. We have fully utilized our federal NOL.
Deferred Tax Assets
As a part of our financial reporting process, we must assess the likelihood that our deferred tax assets can be recovered. Unless recovery is more likely than not, the income tax provision must be increased by recording a valuation allowance.
In evaluating the need for a valuation allowance, all available evidence, both positive and negative, is considered to determine whether, based on the weight of that evidence, a valuation allowance is needed. Future
74
Table of Contents
realization of the deferred tax assets depends in part on the existence of sufficient taxable income within the carryback and carryforward period available under the tax law. Other criteria which are considered in evaluating the need for a valuation allowance include the existence of deferred tax liabilities that can be used to realize deferred tax assets.
We have state NOL carryforwards resulting in a deferred tax asset of approximately $3.3 million which have carryforward periods ranging from 5 years to 20 years. Accordingly, any specific NOL carryforwards that remain unused will expire between fiscal 2015 and fiscal 2030, depending on the respective state laws. Management has determined based upon the positive and negative evidence in existence at June 30, 2010 that a valuation allowance in the amount of $1.8 million is necessary for these state deferred tax assets.
Based upon our review of all negative and positive evidence in existence at June 30, 2010, management believes it is more likely than not that all other deferred tax assets will be fully realized. Accordingly, no valuation allowance has been provided on deferred tax assets other than the state NOL assets.
Uncertain tax positions
We adopted the provisions of accounting for uncertain tax positions on July 1, 2007 which resulted in a decrease to retained earnings of $0.5 million, an increase in deferred income taxes of $53.1 million and an increase in accrued taxes of $53.6 million. Upon implementation, gross unrecognized tax benefits were $42.3 million.
A reconciliation of the beginning and ending balances of the total amounts of gross unrecognized tax benefits is as follows (in thousands):
| Year Ended June 30, |
2010 | 2009 | 2008 | |||||||||
| Gross unrecognized tax benefits at beginning of year |
$ | 34,971 | $ | 57,728 | $ | 42,312 | ||||||
| Increase in tax positions for prior years |
3,186 | 2,761 | 4,621 | |||||||||
| Decrease in tax positions for prior years |
(4,901 | ) | (24,254 | ) | (14,536 | ) | ||||||
| Increase in tax positions for current year |
12,907 | 1,402 | 25,938 | |||||||||
| Lapse of statute of limitations |
(218 | ) | (245 | ) | (420 | ) | ||||||
| Settlements |
(3,443 | ) | (2,421 | ) | (187 | ) | ||||||
| Gross unrecognized tax benefits at end of year |
$ | 42,502 | $ | 34,971 | $ | 57,728 | ||||||
As of June 30, 2010, the amount of gross unrecognized tax benefits and the amount that would affect the effective income tax rate in future periods were $42.5 million and $17.6 million, respectively. On June 30, 2009, the amount of gross unrecognized tax benefits and the amount that would affect the effective income tax rate in future periods were $35.0 million and $18.0 million, respectively.
At June 30, 2010, we believe that it is reasonably possible that the balance of the gross unrecognized tax benefits could decrease by $0.2 million to $13.5 million in the next twelve months due to ongoing activities with various taxing jurisdictions that we expect may give rise to settlements or the expiration of statute of limitations. We continually evaluate expiring statutes of limitations, audits, proposed settlements, changes in tax law and new authoritative rulings.
75
Table of Contents
We recognize accrued interest and penalties associated with uncertain tax positions as part of the income tax provision. The changes regarding accrued interest and accrued penalties associated with uncertain tax positions for fiscal 2010, 2009 and 2008 are as follows (in thousands):
| Accrued Interest |
Accrued Penalties | |||||
| July 1, 2007 |
$ | 5,631 | $ | 6,869 | ||
| Changes |
3,877 | 552 | ||||
| June 30, 2008 |
9,508 | 7,421 | ||||
| Changes |
804 | 466 | ||||
| June 30, 2009 |
10,312 | 7,887 | ||||
| Changes |
1,785 | 587 | ||||
| June 30, 2010 |
$ | 12,097 | $ | 8,474 | ||
We file income tax returns in the U.S. and various state, local, and foreign jurisdictions. Our consolidated federal income tax returns for fiscal years 2006, 2007, 2008 and 2009 are under audit by the Internal Revenue Service (“IRS”). The IRS completed its examination of our fiscal years 2004 and 2005 consolidated federal income tax returns in the second quarter of fiscal 2008. The returns for those years were subject to an appeals proceeding, which was concluded favorably to us in December 2009. The outcome of the appeals proceeding did not result in a material change to our financial position or results of operations. Our federal income tax returns prior to fiscal 2004 are closed. Foreign and state jurisdictions have statutes of limitations that generally range from three to five years. Certain of our tax returns are currently under examination in various state tax jurisdictions.
| 15. | Restructuring Charges |
We recognized restructuring charges of $0.7 million, $11.8 million and $20.1 million for the fiscal 2010, 2009 and 2008, respectively, related to the implementation of revised operating plans.
A summary of the liabilities, which are included in accrued taxes and expenses on the consolidated balance sheets, for restructuring charges for fiscal 2010, 2009 and 2008, is as follows (in thousands):
| Personnel- Related Costs |
Contract Termination Costs |
Other Associated Costs |
Total | |||||||||||||
| Balance at July 1, 2007 |
$ | 122 | $ | 4,175 | $ | 1,973 | $ | 6,270 | ||||||||
| Additions |
18,099 | 2,243 | 434 | 20,776 | ||||||||||||
| Cash settlements |
(14,860 | ) | (2,278 | ) | (457 | ) | (17,595 | ) | ||||||||
| Non-cash settlements |
(65 | ) | (336 | ) | (401 | ) | ||||||||||
| Adjustments |
(154 | ) | (334 | ) | (172 | ) | (660 | ) | ||||||||
| Balance at June 30, 2008 |
3,207 | 3,741 | 1,442 | 8,390 | ||||||||||||
| Additions |
9,287 | 2,068 | 372 | 11,727 | ||||||||||||
| Cash settlements |
(11,482 | ) | (2,980 | ) | (77 | ) | (14,539 | ) | ||||||||
| Non-cash settlements |
(106 | ) | 432 | (390 | ) | (64 | ) | |||||||||
| Adjustments |
(43 | ) | 1,510 | (1,347 | ) | 120 | ||||||||||
| Balance at June 30, 2009 |
863 | 4,771 | 5,634 | |||||||||||||
| Additions |
802 | 802 | ||||||||||||||
| Cash settlements |
(1,564 | ) | (4,076 | ) | (5,640 | ) | ||||||||||
| Non-cash settlements |
(145 | ) | (145 | ) | ||||||||||||
| Adjustments |
(101 | ) | (33 | ) | (134 | ) | ||||||||||
| Balance at June 30, 2010 |
$ | $ | 517 | $ | $ | 517 | ||||||||||
76
Table of Contents
| 16. | Earnings per Share |
A reconciliation of weighted average shares used to compute basic and diluted earnings per share is as follows (dollars in thousands, except per share data):
| Years Ended June 30, |
2010 | 2009 | 2008 | ||||||||
| Net income (loss) |
$ | 220,546 | $ | (10,889 | ) | $ | (82,369 | ) | |||
| Basic weighted average shares |
133,845,238 | 125,239,241 | 114,962,241 | ||||||||
| Incremental shares resulting from assumed conversions: |
|||||||||||
| Stock based compensation and warrants |
4,334,707 | ||||||||||
| Diluted weighted average shares |
138,179,945 | 125,239,241 | 114,962,241 | ||||||||
| Earnings (loss) per share: |
|||||||||||
| Basic |
$ | 1.65 | $ | (0.09 | ) | $ | (0.72 | ) | |||
| Diluted |
$ | 1.60 | $ | (0.09 | ) | $ | (0.72 | ) | |||
Basic earnings (loss) per share have been computed by dividing net income (loss) by weighted average shares outstanding.
Diluted earnings per share has been computed by dividing net income by the diluted weighted average shares, including incremental shares. The treasury stock method was used to compute the assumed incremental shares related to our outstanding stock-based compensation and warrants and will be used to compute the shares related to our convertible senior notes issued in September 2006 upon our stock price increasing above the relevant initial conversion price. The average common stock market prices for the periods were used to determine the number of incremental shares. Options to purchase approximately 0.7 million shares of common stock for fiscal 2010, were not included in the computation of diluted earnings per share because the option exercise price was greater than the average market price of the common shares. Warrants to purchase approximately 18.8 million shares of common stock for fiscal 2010, were not included in the computation of diluted earnings per share because the exercise price was greater than the average market price of the common shares. For fiscal 2009 and 2008, diluted loss per share has been computed by dividing net loss by the diluted weighted average shares, assuming no incremental shares because all potentially dilutive common stock equivalents are anti-dilutive.
| 17. | Supplemental Cash Flow Information |
Cash payments for interest costs and income taxes consist of the following (in thousands):
| Years Ended June 30, |
2010 | 2009 | 2008 | ||||||
| Interest costs (none capitalized) |
$ | 446,699 | $ | 645,386 | $ | 835,698 | |||
| Income taxes |
190,825 | 2,501 | 79,926 | ||||||
Non-cash investing and financing activities, not otherwise disclosed, during fiscal 2009 and 2008, included $3.8 million and $5.8 million, respectively, of common stock issued for employee benefit plans.
Cash payments related to income taxes do not include $280.0 million, $21.9 million and $0.02 million in income tax refunds received during fiscal 2010, 2009 and 2008, respectively.
77
Table of Contents
| 18. | Supplemental Disclosure for Accumulated Other Comprehensive Income (Loss) |
A summary of changes in accumulated other comprehensive income (loss) is as follows (in thousands):
| Years Ended June 30, |
2010 | 2009 | 2008 | |||||||||
| Unrealized (losses) gains on cash flow hedges: |
||||||||||||
| Balance at beginning of year |
$ | (62,509 | ) | $ | (44,676 | ) | $ | 8,345 | ||||
| Change in fair value associated with current period hedging activities, net of taxes of $(13,333) $(39,818), and $(40,595), respectively |
(23,428 | ) | (69,297 | ) | (68,444 | ) | ||||||
| Reclassification into earnings, net of taxes of $28,948, $30,780, and $9,212, respectively |
51,119 | 51,464 | 15,423 | |||||||||
| Balance at end of year |
(34,818 | ) | (62,509 | ) | (44,676 | ) | ||||||
| Foreign currency translation adjustment: |
||||||||||||
| Balance at beginning of year |
41,410 | 38,272 | 37,114 | |||||||||
| Translation gain net of taxes of $2,952, $(2,388), and $4,697, respectively |
5,278 | 3,138 | 1,158 | |||||||||
| Balance at end of year |
46,688 | 41,410 | 38,272 | |||||||||
| Net unrealized gains on credit enhancement assets: |
||||||||||||
| Balance at beginning of year |
235 | |||||||||||
| Unrealized (losses) gains, net of taxes of $54 |
(114 | ) | ||||||||||
| Reclassification into earnings, net of taxes of $(51) |
(121 | ) | ||||||||||
| Balance at end of year |
||||||||||||
| Total accumulated other comprehensive income (loss) |
$ | 11,870 | $ | (21,099 | ) | $ | (6,404 | ) | ||||
| 19. | Fair Value of Financial Instruments |
FASB guidance regarding disclosures about fair value of financial instruments requires disclosure of fair value information about financial instruments, whether recognized or not in our consolidated balance sheets. Fair values are based on estimates using present value or other valuation techniques in cases where quoted market prices are not available. Those techniques are significantly affected by the assumptions used, including the discount rate and the estimated timing and amount of future cash flows. Therefore, the estimates of fair value may differ substantially from amounts that ultimately may be realized or paid at settlement or maturity of the financial instruments and those differences may be material. Disclosures about fair value of financial instruments exclude certain financial instruments and all non-financial instruments from our disclosure requirements. Accordingly, the aggregate fair value amounts presented do not represent the underlying value of our Company.
78
Table of Contents
Estimated fair values, carrying values and various methods and assumptions used in valuing our financial instruments are set forth below (in thousands):
| June 30, |
2010 | 2009 | ||||||||||
| Carrying Value |
Estimated Fair Value |
Carrying Value |
Estimated Fair Value | |||||||||
| Financial assets: |
||||||||||||
| Cash and cash equivalents(a) |
$ | 282,273 | $ | 282,273 | $ | 193,287 | $ | 193,287 | ||||
| Finance receivables, net(b) |
8,160,208 | 8,110,223 | 10,037,329 | 9,717,655 | ||||||||
| Restricted cash—securitization notes payable(a) |
930,155 | 930,155 | 851,606 | 851,606 | ||||||||
| Restricted cash—credit facilities(a) |
142,725 | 142,725 | 195,079 | 195,079 | ||||||||
| Restricted cash—other(a) |
26,960 | 26,960 | 46,905 | 46,905 | ||||||||
| Interest rate swap agreements(d) |
26,194 | 26,194 | 24,267 | 24,267 | ||||||||
| Interest rate cap agreements purchased(d) |
3,188 | 3,188 | 15,858 | 15,858 | ||||||||
| Investment in money market fund(d) |
8,027 | 8,027 | ||||||||||
| Financial liabilities: |
||||||||||||
| Credit facilities(c) |
598,946 | 598,946 | 1,630,133 | 1,630,133 | ||||||||
| Securitization notes payable(d) |
6,108,976 | 6,230,902 | 7,426,687 | 6,879,245 | ||||||||
| Senior notes(d) |
70,620 | 70,620 | 91,620 | 85,207 | ||||||||
| Convertible senior notes(d) |
414,068 | 414,007 | 392,514 | 328,396 | ||||||||
| Interest rate swap agreements(d) |
70,421 | 70,421 | 131,885 | 131,885 | ||||||||
| Interest rate cap agreements sold(d) |
3,320 | 3,320 | 16,644 | 16,644 | ||||||||
| Foreign currency contracts(d) |
1,206 | 1,206 | ||||||||||
| (a) | The carrying value of cash and cash equivalents, restricted cash – securitization notes payable, restricted cash—credit facilities and restricted cash—other is considered to be a reasonable estimate of fair value since these investments bear interest at market rates and have maturities of less than 90 days. |
| (b) | The fair value of the finance receivables is estimated based upon forecast cash flows on the receivables discounted using a weighted average cost of capital. The forecast includes among other things items such as prepayment, defaults, recoveries and fee income assumptions. |
| (c) | Credit facilities have variable rates of interest and maturities of three years or less. Therefore, carrying value is considered to be a reasonable estimate of fair value. |
| (d) | The fair values of the interest rate cap and swap agreements, investment in money market fund, securitization notes payable, senior notes, convertible senior notes and foreign currency contracts are based on quoted market prices, when available. If quoted market prices are not available, the market value is estimated by discounting future net cash flows expected to be settled using a current risk-adjusted rate. |
79
Table of Contents
| 20. | Quarterly Financial Data (unaudited) |
The following is a summary of quarterly financial results (dollars in thousands, except per share data):
| First Quarter |
Second Quarter |
Third Quarter |
Fourth Quarter | ||||||||||||
| Year Ended June 30, 2010 |
|||||||||||||||
| Total revenue |
$ | 413,284 | $ | 386,755 | $ | 361,105 | $ | 361,673 | |||||||
| Income before income taxes |
46,250 | 72,215 | 95,815 | 139,159 | |||||||||||
| Net income |
25,761 | 46,029 | 63,206 | 85,550 | |||||||||||
| Basic earnings per share |
0.19 | 0.34 | 0.47 | 0.64 | |||||||||||
| Diluted earnings per share |
0.19 | 0.33 | 0.45 | 0.61 | |||||||||||
| Diluted weighted average shares |
136,083,460 | 137,630,694 | 139,231,152 | 139,787,408 | |||||||||||
| Year Ended June 30, 2009 |
|||||||||||||||
| Total revenue |
$ | 566,043 | $ | 558,597 | $ | 492,425 | $ | 450,259 | |||||||
| Income (loss) before income taxes |
(5,196 | ) | (52,805 | ) | 11,590 | 46,264 | |||||||||
| Net income (loss) |
(5,274 | ) | (35,002 | ) | (2,406 | ) | 31,793 | ||||||||
| Basic earnings (loss) per share |
(0.05 | ) | (0.29 | ) | (0.02 | ) | 0.24 | ||||||||
| Diluted earnings (loss) per share |
(0.05 | ) | (0.29 | ) | (0.02 | ) | 0.24 | ||||||||
| Diluted weighted average shares |
116,271,119 | 120,106,666 | 131,914,885 | 133,523,867 | |||||||||||
| 21. | Guarantor Consolidating Financial Statements |
The payment of principal and interest on our senior notes and convertible senior notes are guaranteed by certain of our subsidiaries (the “Subsidiary Guarantors”). The separate financial statements of the Subsidiary Guarantors are not included herein because the Subsidiary Guarantors are our wholly-owned consolidated subsidiaries and are jointly, severally, fully and unconditionally liable for the obligations represented by the convertible senior notes. We believe that the consolidating financial information for AmeriCredit Corp., the combined Subsidiary Guarantors and the combined Non-Guarantor Subsidiaries provide information that is more meaningful in understanding the financial position of the Subsidiary Guarantors than separate financial statements of the Subsidiary Guarantors.
The consolidating financial statements present consolidating financial data for (i) AmeriCredit Corp. (on a parent only basis), (ii) the combined Subsidiary Guarantors, (iii) the combined Non-Guarantor Subsidiaries, (iv) an elimination column for adjustments to arrive at the information for the parent company and our subsidiaries on a consolidated basis and (v) the parent company and our subsidiaries on a consolidated basis as of June 30, 2010 and 2009 and for each of the three years in the period ended June 30, 2010.
Investments in subsidiaries are accounted for by the parent company using the equity method for purposes of this presentation. Results of operations of subsidiaries are therefore reflected in the parent company’s investment accounts and earnings. The principal elimination entries set forth below eliminate investments in subsidiaries and intercompany balances and transactions.
80
Table of Contents
AMERICREDIT CORP.
CONSOLIDATING BALANCE SHEET
June 30, 2010
(in thousands)
| AmeriCredit Corp. |
Guarantors | Non- Guarantors |
Eliminations | Consolidated | |||||||||||||||
| ASSETS | |||||||||||||||||||
| Cash and cash equivalents |
$ | 275,139 | $ | 7,134 | $ | 282,273 | |||||||||||||
| Finance receivables, net |
823,241 | 7,336,967 | 8,160,208 | ||||||||||||||||
| Restricted cash–securitization notes payable |
930,155 | 930,155 | |||||||||||||||||
| Restricted cash–credit facilities |
142,725 | 142,725 | |||||||||||||||||
| Property and equipment, net |
$ | 5,194 | 32,540 | 37,734 | |||||||||||||||
| Leased vehicles, net |
3,194 | 91,483 | 94,677 | ||||||||||||||||
| Deferred income taxes |
13,118 | 107,912 | (39,194 | ) | 81,836 | ||||||||||||||
| Other assets |
3,751 | 97,010 | 50,664 | 151,425 | |||||||||||||||
| Due from affiliates |
741,354 | 1,857,097 | $ | (2,598,451 | ) | ||||||||||||||
| Investment in affiliates |
2,256,871 | 3,753,620 | 820,266 | (6,830,757 | ) | ||||||||||||||
| Total assets |
$ | 3,020,288 | $ | 5,092,656 | $ | 11,197,297 | $ | (9,429,208 | ) | $ | 9,881,033 | ||||||||
| Liabilities: |
|||||||||||||||||||
| Credit facilities |
$ | 598,946 | $ | 598,946 | |||||||||||||||
| Securitization notes payable |
6,108,976 | 6,108,976 | |||||||||||||||||
| Senior notes |
$ | 70,620 | 70,620 | ||||||||||||||||
| Convertible senior notes |
414,068 | 414,068 | |||||||||||||||||
| Accrued taxes and expenses |
135,058 | $ | 34,229 | 40,726 | 210,013 | ||||||||||||||
| Interest rate swap agreements |
70,421 | 70,421 | |||||||||||||||||
| Other liabilities |
118 | 7,447 | 7,565 | ||||||||||||||||
| Due to affiliates |
2,598,451 | $ | (2,598,451 | ) | |||||||||||||||
| Total liabilities |
619,864 | 2,640,127 | 6,819,069 | (2,598,451 | ) | 7,480,609 | |||||||||||||
| Shareholders’ equity: |
|||||||||||||||||||
| Common stock |
1,369 | 110,457 | (110,457 | ) | 1,369 | ||||||||||||||
| Additional paid-in capital |
327,095 | 75,887 | 1,272,491 | (1,348,378 | ) | 327,095 | |||||||||||||
| Accumulated other comprehensive income (loss) |
11,870 | 45,256 | (34,818 | ) | (10,438 | ) | 11,870 | ||||||||||||
| Retained earnings |
2,099,005 | 2,220,929 | 3,140,555 | (5,361,484 | ) | 2,099,005 | |||||||||||||
| 2,439,339 | 2,452,529 | 4,378,228 | (6,830,757 | ) | 2,439,339 | ||||||||||||||
| Treasury stock |
(38,915 | ) | (38,915 | ) | |||||||||||||||
| Total shareholders’ equity |
2,400,424 | 2,452,529 | 4,378,228 | (6,830,757 | ) | 2,400,424 | |||||||||||||
| Total liabilities and shareholders’ equity |
$ | 3,020,288 | $ | 5,092,656 | $ | 11,197,297 | $ | (9,429,208 | ) | $ | 9,881,033 | ||||||||
81
Table of Contents
AMERICREDIT CORP.
CONSOLIDATING BALANCE SHEET
June 30, 2009
(in thousands)
| AmeriCredit Corp. |
Guarantors | Non- Guarantors |
Eliminations | Consolidated | |||||||||||||||
| ASSETS | |||||||||||||||||||
| Cash and cash equivalents |
$ | 186,564 | $ | 6,723 | $ | 193,287 | |||||||||||||
| Finance receivables, net |
580,420 | 9,456,909 | 10,037,329 | ||||||||||||||||
| Restricted cash–securitization notes payable |
851,606 | 851,606 | |||||||||||||||||
| Restricted cash–credit facilities |
195,079 | 195,079 | |||||||||||||||||
| Property and equipment, net |
$ | 5,527 | 38,668 | 44,195 | |||||||||||||||
| Leased vehicles, net |
5,319 | 151,068 | 156,387 | ||||||||||||||||
| Deferred income taxes |
97,657 | 243,803 | (265,678 | ) | 75,782 | ||||||||||||||
| Income tax receivable |
162,036 | 35,543 | 197,579 | ||||||||||||||||
| Other assets |
5,682 | 132,485 | 68,916 | 207,083 | |||||||||||||||
| Due from affiliates |
404,943 | 4,059,841 | $ | (4,464,784 | ) | ||||||||||||||
| Investment in affiliates |
1,976,793 | 5,558,924 | 603,680 | (8,139,397 | ) | ||||||||||||||
| Total assets |
$ | 2,652,638 | $ | 6,781,726 | $ | 15,128,144 | $ | (12,604,181 | ) | $ | 11,958,327 | ||||||||
| LIABILITIES AND SHAREHOLDERS’ EQUITY |
|||||||||||||||||||
| Liabilities: |
|||||||||||||||||||
| Credit facilities |
$ | 1,630,133 | $ | 1,630,133 | |||||||||||||||
| Securitization notes payable |
7,426,687 | 7,426,687 | |||||||||||||||||
| Senior notes |
$ | 91,620 | 91,620 | ||||||||||||||||
| Convertible senior notes |
392,514 | 392,514 | |||||||||||||||||
| Accrued taxes and expenses |
60,596 | $ | 44,371 | 52,673 | 157,640 | ||||||||||||||
| Interest rate swap agreements |
525 | 131,360 | 131,885 | ||||||||||||||||
| Other liabilities |
600 | 19,940 | 20,540 | ||||||||||||||||
| Due to affiliates |
4,464,784 | $ | (4,464,784 | ) | |||||||||||||||
| Total liabilities |
545,330 | 4,529,620 | 9,240,853 | (4,464,784 | ) | 9,851,019 | |||||||||||||
| Shareholders’ equity: |
|||||||||||||||||||
| Common stock |
1,350 | 172,368 | (172,368 | ) | 1,350 | ||||||||||||||
| Additional paid-in capital |
284,961 | 75,878 | 3,177,841 | (3,253,719 | ) | 284,961 | |||||||||||||
| Accumulated other comprehensive (loss) income |
|
(21,099 |
) |
|
26,009 |
|
(62,508 |
) |
|
36,499 |
|
|
(21,099 |
) | |||||
| Retained earnings |
1,878,459 | 1,977,851 | 2,771,958 | (4,749,809 | ) | 1,878,459 | |||||||||||||
| 2,143,671 | 2,252,106 | 5,887,291 | (8,139,397 | ) | 2,143,671 | ||||||||||||||
| Treasury stock |
(36,363 | ) | (36,363 | ) | |||||||||||||||
| Total shareholders’ equity |
2,107,308 | 2,252,106 | 5,887,291 | (8,139,397 | ) | 2,107,308 | |||||||||||||
| Total liabilities and shareholders’ equity |
$ | 2,652,638 | $ | 6,781,726 | $ | 15,128,144 | $ | (12,604,181 | ) | $ | 11,958,327 | ||||||||
82
Table of Contents
AMERICREDIT CORP.
CONSOLIDATING STATEMENT OF OPERATIONS
Year Ended June 30, 2010
(in thousands)
| AmeriCredit Corp. |
Guarantors | Non- Guarantors |
Eliminations | Consolidated | ||||||||||||||
| Revenue |
||||||||||||||||||
| Finance charge income |
$ | 107,750 | $ | 1,323,569 | $ | 1,431,319 | ||||||||||||
| Other income |
$ | 29,634 | 444,840 | 822,260 | $ | (1,205,519 | ) | 91,215 | ||||||||||
| Gain on retirement of debt |
283 | 283 | ||||||||||||||||
| Equity in income of affiliates |
243,078 | 368,597 | (611,675 | ) | ||||||||||||||
| 272,995 | 921,187 | 2,145,829 | (1,817,194 | ) | 1,522,817 | |||||||||||||
| Costs and expenses |
||||||||||||||||||
| Operating expenses |
17,771 | 58,849 | 212,171 | 288,791 | ||||||||||||||
| Leased vehicles expenses |
1,684 | 32,955 | 34,639 | |||||||||||||||
| Provision for loan losses |
174,646 | 213,412 | 388,058 | |||||||||||||||
| Interest expense |
45,950 | 507,082 | 1,109,709 | (1,205,519 | ) | 457,222 | ||||||||||||
| Restructuring charges |
668 | 668 | ||||||||||||||||
| 63,721 | 742,929 | 1,568,247 | (1,205,519 | ) | 1,169,378 | |||||||||||||
| Income before income taxes |
209,274 | 178,258 | 577,582 | (611,675 | ) | 353,439 | ||||||||||||
| Income tax (benefit) provision |
(11,272 | ) | (64,820 | ) | 208,985 | 132,893 | ||||||||||||
| Net income |
$ | 220,546 | $ | 243,078 | $ | 368,597 | $ | (611,675 | ) | $ | 220,546 | |||||||
83
Table of Contents
AMERICREDIT CORP.
CONSOLIDATING STATEMENT OF OPERATIONS
Year Ended June 30, 2009
(in thousands)
| AmeriCredit Corp. |
Guarantors | Non- Guarantors |
Eliminations | Consolidated | |||||||||||||||
| Revenue |
|||||||||||||||||||
| Finance charge income |
$ | 74,562 | $ | 1,828,122 | $ | 1,902,684 | |||||||||||||
| Other income |
$ | 38,193 | 892,546 | 1,762,638 | $ | (2,576,889 | ) | 116,488 | |||||||||||
| Gain on retirement of debt |
48,152 | 48,152 | |||||||||||||||||
| Equity in income of affiliates |
20,535 | 143,940 | (164,475 | ) | |||||||||||||||
| 106,880 | 1,111,048 | 3,590,760 | (2,741,364 | ) | 2,067,324 | ||||||||||||||
| Costs and expenses |
|||||||||||||||||||
| Operating expenses |
32,701 | 29,914 | 246,188 | 308,803 | |||||||||||||||
| Leased vehicles expenses |
4,955 | 42,925 | 47,880 | ||||||||||||||||
| Provision for loan losses |
105,919 | 866,462 | 972,381 | ||||||||||||||||
| Interest expense |
100,228 | 992,563 | 2,210,658 | (2,576,889 | ) | 726,560 | |||||||||||||
| Restructuring charges |
11,847 | 11,847 | |||||||||||||||||
| 132,929 | 1,145,198 | 3,366,233 | (2,576,889 | ) | 2,067,471 | ||||||||||||||
| (Loss) income before income taxes |
(26,049 | ) | (34,150 | ) | 224,527 | (164,475 | ) | (147 | ) | ||||||||||
| Income tax (benefit) provision |
(15,160 | ) | (54,685 | ) | 80,587 | 10,742 | |||||||||||||
| Net (loss) income |
$ | (10,889 | ) | $ | 20,535 | $ | 143,940 | $ | (164,475 | ) | $ | (10,889 | ) | ||||||
84
Table of Contents
AMERICREDIT CORP.
CONSOLIDATING STATEMENT OF OPERATIONS
Year Ended June 30, 2008
(in thousands)
| AmeriCredit Corp. |
Guarantors | Non- Guarantors |
Eliminations | Consolidated | |||||||||||||||
| Revenue |
|||||||||||||||||||
| Finance charge income |
$ | 83,321 | $ | 2,299,163 | $ | 2,382,484 | |||||||||||||
| Other income |
$ | 39,232 | 1,347,530 | 2,918,238 | $ | (4,144,402 | ) | 160,598 | |||||||||||
| Equity in income of affiliates |
(57,110 | ) | 267,141 | (210,031 | ) | ||||||||||||||
| (17,878 | ) | 1,697,992 | 5,217,401 | (4,354,433 | ) | 2,543,082 | |||||||||||||
| Costs and expenses |
|||||||||||||||||||
| Operating expenses |
23,167 | 56,895 | 317,752 | 397,814 | |||||||||||||||
| Leased vehicles expenses |
35,993 | 369 | 36,362 | ||||||||||||||||
| Provision for loan losses |
103,852 | 1,027,110 | 1,130,962 | ||||||||||||||||
| Impairment of goodwill |
212,595 | 212,595 | |||||||||||||||||
| Interest expense |
53,762 | 1,434,144 | 3,515,370 | (4,144,402 | ) | 858,874 | |||||||||||||
| Restructuring charges |
20,116 | 20,116 | |||||||||||||||||
| 76,929 | 1,863,595 | 4,860,601 | (4,144,402 | ) | 2,656,723 | ||||||||||||||
| (Loss) income before income taxes |
(94,807 | ) | (165,603 | ) | 356,800 | (210,031 | ) | (113,641 | ) | ||||||||||
| Income tax (benefit) provision |
(12,438 | ) | (108,493 | ) | 89,659 | (31,272 | ) | ||||||||||||
| Net (loss) income |
$ | (82,369 | ) | $ | (57,110 | ) | $ | 267,141 | $ | (210,031 | ) | $ | (82,369 | ) | |||||
85
Table of Contents
AMERICREDIT CORP.
CONSOLIDATING STATEMENT OF CASH FLOWS
Year Ended June 30, 2010
(in thousands)
| AmeriCredit Corp. |
Guarantors | Non- Guarantors |
Eliminations | Consolidated | ||||||||||||||||
| Cash flows from operating activities: |
||||||||||||||||||||
| Net income |
$ | 220,546 | $ | 243,078 | $ | 368,597 | $ | (611,675 | ) | $ | 220,546 | |||||||||
| Adjustments to reconcile net income to net cash provided by operating activities: |
||||||||||||||||||||
| Depreciation and amortization |
1,688 | 9,167 | 68,189 | 79,044 | ||||||||||||||||
| Provision for loan losses |
174,646 | 213,412 | 388,058 | |||||||||||||||||
| Deferred income taxes |
81,395 | 136,135 | (242,097 | ) | (24,567 | ) | ||||||||||||||
| Stock based compensation expense |
15,115 | 15,115 | ||||||||||||||||||
| Amortization of warrant costs |
1,968 | 1,968 | ||||||||||||||||||
| Non-cash interest charges on convertible debt |
21,554 | 21,554 | ||||||||||||||||||
| Accretion and amortization of loan fees |
51 | 4,740 | 4,791 | |||||||||||||||||
| Gain on retirement of debt |
(283 | ) | (283 | ) | ||||||||||||||||
| Other |
(3,242 | ) | (12,712 | ) | (15,954 | ) | ||||||||||||||
| Equity in income of affiliates |
(243,078 | ) | (368,597 | ) | 611,675 | |||||||||||||||
| Changes in assets and liabilities, net of assets and liabilities acquired: |
||||||||||||||||||||
| Income tax receivable |
162,036 | 35,366 | 197,402 | |||||||||||||||||
| Other assets |
7,941 | (8,697 | ) | 6,012 | 5,256 | |||||||||||||||
| Accrued taxes and expenses |
70,942 | (27,848 | ) | (7,315 | ) | 35,779 | ||||||||||||||
| Net cash provided by operating activities |
339,824 | 190,059 | 398,826 | 928,709 | ||||||||||||||||
| Cash flows from investing activities: |
||||||||||||||||||||
| Purchases of receivables |
(2,090,602 | ) | (1,606,146 | ) | 1,606,146 | (2,090,602 | ) | |||||||||||||
| Principal collections and recoveries on receivables |
100,273 | 3,506,407 | 3,606,680 | |||||||||||||||||
| Net proceeds from sale of receivables |
1,606,146 | (1,606,146 | ) | |||||||||||||||||
| Purchases of property and equipment |
(1,581 | ) | (1,581 | ) | ||||||||||||||||
| Change in restricted cash–securitization notes payable |
(78,549 | ) | (78,549 | ) | ||||||||||||||||
| Change in restricted cash–credit facilities |
52,354 | 52,354 | ||||||||||||||||||
| Change in other assets |
17,841 | 26,034 | 43,875 | |||||||||||||||||
| Proceeds from money market fund |
10,047 | 10,047 | ||||||||||||||||||
| Net change in investment in affiliates |
(9,308 | ) | 2,180,625 | (216,588 | ) | (1,954,729 | ) | |||||||||||||
| Net cash (used) provided by investing activities |
(9,308 | ) | 1,822,749 | 1,683,512 | (1,954,729 | ) | 1,542,224 | |||||||||||||
| Cash flows from financing activities: |
||||||||||||||||||||
| Net change in credit facilities |
(1,031,187 | ) | (1,031,187 | ) | ||||||||||||||||
| Issuance of securitization notes payable |
2,352,493 | 2,352,493 | ||||||||||||||||||
| Payments on securitization notes payable |
(3,674,062 | ) | (3,674,062 | ) | ||||||||||||||||
| Debt issuance costs |
1,810 | (26,564 | ) | (24,754 | ) | |||||||||||||||
| Net proceeds from issuance of common stock |
15,635 | (61,900 | ) | (1,905,350 | ) | 1,967,250 | 15,635 | |||||||||||||
| Retirement of debt |
(20,425 | ) | (20,425 | ) | ||||||||||||||||
| Other net changes |
645 | 645 | ||||||||||||||||||
| Net change in due (to) from affiliates |
(336,411 | ) | (1,861,166 | ) | 2,202,743 | (5,166 | ) | |||||||||||||
| Net cash used by financing activities |
(338,746 | ) | (1,923,066 | ) | (2,081,927 | ) | 1,962,084 | (2,381,655 | ) | |||||||||||
| Net (decrease) increase in cash and cash equivalents |
(8,230 | ) | 89,742 | 411 | 7,355 | 89,278 | ||||||||||||||
| Effect of Canadian exchange rate changes on cash and cash equivalents |
8,230 | (1,167 | ) | (7,355 | ) | (292 | ) | |||||||||||||
| Cash and cash equivalents at beginning of year |
186,564 | 6,723 | 193,287 | |||||||||||||||||
| Cash and cash equivalents at end of year |
$ | $ | 275,139 | $ | 7,134 | $ | $ | 282,273 | ||||||||||||
86
Table of Contents
AMERICREDIT CORP.
CONSOLIDATING STATEMENT OF CASH FLOWS
Year Ended June 30, 2009
(in thousands)
| AmeriCredit Corp. |
Guarantors | Non- Guarantors |
Eliminations | Consolidated | ||||||||||||||||
| Cash flows from operating activities: |
||||||||||||||||||||
| Net (loss) income |
$ | (10,889 | ) | $ | 20,535 | $ | 143,940 | $ | (164,475 | ) | $ | (10,889 | ) | |||||||
| Adjustments to reconcile net (loss) income to net cash (used) provided by operating activities: |
||||||||||||||||||||
| Depreciation and amortization |
2,634 | 33,878 | 72,496 | 109,008 | ||||||||||||||||
| Provision for loan losses |
105,919 | 866,462 | 972,381 | |||||||||||||||||
| Deferred income taxes |
(100,156 | ) | 31,977 | 294,962 | 226,783 | |||||||||||||||
| Stock based compensation expense |
14,264 | 14,264 | ||||||||||||||||||
| Amortization of warrant costs |
45,101 | 45,101 | ||||||||||||||||||
| Non-cash interest charges on convertible debt |
22,506 | 22,506 | ||||||||||||||||||
| Accretion and amortization of loan fees |
903 | 18,191 | 19,094 | |||||||||||||||||
| Gain on retirement of debt |
(48,907 | ) | (48,907 | ) | ||||||||||||||||
| Other |
(16,603 | ) | 19,376 | 2,773 | ||||||||||||||||
| Equity in income of affiliates |
(20,535 | ) | (143,940 | ) | 164,475 | |||||||||||||||
| Changes in assets and liabilities, net of assets and liabilities acquired: |
||||||||||||||||||||
| Income tax receivable |
(173,844 | ) | (838 | ) | (174,682 | ) | ||||||||||||||
| Other assets |
(1,901 | ) | 12,169 | (16,972 | ) | (6,704 | ) | |||||||||||||
| Accrued taxes and expenses |
(23,386 | ) | (9,700 | ) | (19,027 | ) | (52,113 | ) | ||||||||||||
| Net cash (used) provided by operating activities |
(295,113 | ) | 34,300 | 1,379,428 | 1,118,615 | |||||||||||||||
| Cash flows from investing activities: |
||||||||||||||||||||
| Purchases of receivables |
(1,280,291 | ) | (535,526 | ) | 535,526 | (1,280,291 | ) | |||||||||||||
| Principal collections and recoveries on receivables |
217,414 | 4,040,223 | 4,257,637 | |||||||||||||||||
| Net proceeds from sale of receivables |
535,526 | (535,526 | ) | |||||||||||||||||
| Purchases of property and equipment |
(1,003 | ) | (1,003 | ) | ||||||||||||||||
| Change in restricted cash–securitization notes payable |
131,064 | 131,064 | ||||||||||||||||||
| Change in restricted cash–credit facilities |
63,180 | 63,180 | ||||||||||||||||||
| Change in other assets |
103,179 | (90,219 | ) | 12,960 | ||||||||||||||||
| Proceeds from money market fund |
104,319 | 104,319 | ||||||||||||||||||
| Investment in money market fund |
(115,821 | ) | (115,821 | ) | ||||||||||||||||
| Net change in investment in affiliates |
(6,317 | ) | 480,377 | (36,469 | ) | (437,591 | ) | |||||||||||||
| Net cash (used) provided by investing activities |
(6,317 | ) | 43,700 | 3,572,253 | (437,591 | ) | 3,172,045 | |||||||||||||
| Cash flows from financing activities: |
||||||||||||||||||||
| Net change in credit facilities |
(1,278,117 | ) | (1,278,117 | ) | ||||||||||||||||
| Issuance of securitization notes payable |
1,000,000 | 1,000,000 | ||||||||||||||||||
| Payments on securitization notes payable |
(3,987,424 | ) | (3,987,424 | ) | ||||||||||||||||
| Debt issuance costs |
(56 | ) | (2,163 | ) | (30,390 | ) | (32,609 | ) | ||||||||||||
| Net proceeds from issuance of common stock |
3,741 | 121,593 | (535,315 | ) | 413,722 | 3,741 | ||||||||||||||
| Retirement of convertible debt |
(238,617 | ) | (238,617 | ) | ||||||||||||||||
| Other net changes |
(603 | ) | (603 | ) | ||||||||||||||||
| Net change in due (to) from affiliates |
536,214 | (371,011 | ) | (185,918 | ) | 20,715 | ||||||||||||||
| Net cash provided (used) by financing activities |
300,679 | (251,581 | ) | (5,017,164 | ) | 434,437 | (4,533,629 | ) | ||||||||||||
| Net decrease in cash and cash equivalents |
(751 | ) | (173,581 | ) | (65,483 | ) | (3,154 | ) | (242,969 | ) | ||||||||||
| Effect of Canadian exchange rate changes on cash and cash equivalents |
751 | (1,207 | ) | 65 | 3,154 | 2,763 | ||||||||||||||
| Cash and cash equivalents at beginning of year |
361,352 | 72,141 | 433,493 | |||||||||||||||||
| Cash and cash equivalents at end of year |
$ | $ | 186,564 | $ | 6,723 | $ | $ | 193,287 | ||||||||||||
87
Table of Contents
AMERICREDIT CORP.
CONSOLIDATING STATEMENT OF CASH FLOWS
Year Ended June 30, 2008
(in thousands)
| AmeriCredit Corp. |
Guarantors | Non- Guarantors |
Eliminations | Consolidated | ||||||||||||||||
| Cash flows from operating activities: |
||||||||||||||||||||
| Net (loss) income |
$ | (82,369 | ) | $ | (57,110 | ) | $ | 267,141 | $ | (210,031 | ) | $ | (82,369 | ) | ||||||
| Adjustments to reconcile net (loss) income to net cash provided (used) by operating activities: |
||||||||||||||||||||
| Depreciation and amortization |
(266 | ) | 50,086 | 37,059 | 86,879 | |||||||||||||||
| Provision for loan losses |
103,852 | 1,027,110 | 1,130,962 | |||||||||||||||||
| Deferred income taxes |
(64,561 | ) | (160,193 | ) | 78,393 | (146,361 | ) | |||||||||||||
| Stock based compensation expense |
17,945 | 17,945 | ||||||||||||||||||
| Amortization of warrant costs |
10,193 | 10,193 | ||||||||||||||||||
| Non-cash interest charges on convertible debt |
22,062 | 22,062 | ||||||||||||||||||
| Accretion and amortization of loan fees |
8,529 | 20,906 | 29,435 | |||||||||||||||||
| Impairment of goodwill |
212,595 | 212,595 | ||||||||||||||||||
| Other |
6,915 | (789 | ) | 6,126 | ||||||||||||||||
| Equity in income of affiliates |
57,110 | (267,141 | ) | 210,031 | ||||||||||||||||
| Changes in assets and liabilities, net of assets and liabilities acquired: |
||||||||||||||||||||
| Income tax receivable |
11,808 | (34,705 | ) | (22,897 | ) | |||||||||||||||
| Other assets |
13,977 | (39,299 | ) | 9,695 | (15,627 | ) | ||||||||||||||
| Accrued taxes and expenses |
33,104 | (12,244 | ) | (9,842 | ) | 11,018 | ||||||||||||||
| Net cash provided (used) by operating activities |
19,003 | (188,715 | ) | 1,429,673 | 1,259,961 | |||||||||||||||
| Cash flows from investing activities: |
||||||||||||||||||||
| Purchases of receivables |
(6,260,198 | ) | (5,992,951 | ) | 5,992,951 | (6,260,198 | ) | |||||||||||||
| Principal collections and recoveries on receivables |
119,528 | 5,989,162 | 6,108,690 | |||||||||||||||||
| Net proceeds from sale of receivables |
5,992,951 | (5,992,951 | ) | |||||||||||||||||
| Purchases of property and equipment |
1,412 | (9,875 | ) | (8,463 | ) | |||||||||||||||
| Change in restricted cash–securitization notes payable |
(10 | ) | 31,693 | 31,683 | ||||||||||||||||
| Change in restricted cash–credit facilities |
(92,754 | ) | (92,754 | ) | ||||||||||||||||
| Change in other assets |
(42,912 | ) | 1,181 | (41,731 | ) | |||||||||||||||
| Net purchases of leased vehicles |
(103,904 | ) | (94,922 | ) | (198,826 | ) | ||||||||||||||
| Distributions from gain on sale Trusts |
7,466 | 7,466 | ||||||||||||||||||
| Net change in investment in affiliates |
(7,457 | ) | (1,589,195 | ) | (14,822 | ) | 1,611,474 | |||||||||||||
| Net cash used by investing activities |
(6,045 | ) | (1,893,615 | ) | (165,947 | ) | 1,611,474 | (454,133 | ) | |||||||||||
| Cash flows from financing activities: |
||||||||||||||||||||
| Net change in credit facilities |
385,611 | 385,611 | ||||||||||||||||||
| Issuance of securitization notes payable |
4,250,000 | 4,250,000 | ||||||||||||||||||
| Payments on securitization notes payable |
(5,774,035 | ) | (5,774,035 | ) | ||||||||||||||||
| Debt issuance costs |
(39,347 | ) | (39,347 | ) | ||||||||||||||||
| Net proceeds from issuance of common stock |
25,174 | 12 | 1,610,217 | (1,610,229 | ) | 25,174 | ||||||||||||||
| Repurchase of common stock |
(127,901 | ) | (127,901 | ) | ||||||||||||||||
| Other net changes |
324 | (1 | ) | 323 | ||||||||||||||||
| Net change in due (to) from affiliates |
88,287 | 1,543,437 | (1,634,952 | ) | 3,228 | |||||||||||||||
| Net cash (used) provided by financing activities |
(14,116 | ) | 1,543,448 | (1,202,506 | ) | (1,607,001 | ) | (1,280,175 | ) | |||||||||||
| Net (decrease) increase in cash and cash equivalents |
(1,158 | ) | (538,882 | ) | 61,220 | 4,473 | (474,347 | ) | ||||||||||||
| Effect of Canadian exchange rate changes on cash and cash equivalents |
1,158 | 848 | 3 | (4,473 | ) | (2,464 | ) | |||||||||||||
| Cash and cash equivalents at beginning of year |
899,386 | 10,918 | 910,304 | |||||||||||||||||
| Cash and cash equivalents at end of year |
$ | $ | 361,352 | $ | 72,141 | $ | $ | 433,493 | ||||||||||||
88
Table of Contents
REPORT OF INDEPENDENT REGISTERED PUBLIC ACCOUNTING FIRM
To the Board of Directors and Shareholders of
AmeriCredit Corp.:
We have audited the accompanying consolidated balance sheets of AmeriCredit Corp. and subsidiaries (the “Company”) as of June 30, 2010 and 2009, and the related consolidated statements of operations and comprehensive operations, shareholders’ equity, and cash flows for each of the three years in the period ended June 30, 2010. These financial statements are the responsibility of the Company’s management. Our responsibility is to express an opinion on the financial statements based on our audits.
We conducted our audits in accordance with the standards of the Public Company Accounting Oversight Board (United States). Those standards require that we plan and perform the audit to obtain reasonable assurance about whether the financial statements are free of material misstatement. An audit includes examining, on a test basis, evidence supporting the amounts and disclosures in the financial statements. An audit also includes assessing the accounting principles used and significant estimates made by management, as well as evaluating the overall financial statement presentation. We believe that our audits provide a reasonable basis for our opinion.
In our opinion, such consolidated financial statements present fairly, in all material respects, the financial position of AmeriCredit Corp. and subsidiaries at June 30, 2010 and 2009, and the results of their operations and their cash flows for each of the three years in the period ended June 30, 2010, in conformity with accounting principles generally accepted in the United States of America.
We have also audited, in accordance with the standards of the Public Company Accounting Oversight Board (United States), the Company’s internal control over financial reporting as of June 30, 2010, based on the criteria established in Internal Control—Integrated Framework issued by the Committee of Sponsoring Organizations of the Treadway Commission and our report dated August 27, 2010, expressed an unqualified opinion on the Company’s internal control over financial reporting.
/s/ Deloitte & Touche LLP
Dallas, Texas
August 27, 2010
89
Table of Contents
| ITEM 9. | CHANGES IN AND DISAGREEMENTS WITH ACCOUNTANTS ON ACCOUNTING AND FINANCIAL DISCLOSURE |
We had no disagreements on accounting or financial disclosure matters with our independent accountants to report under this Item 9.
| ITEM 9A. | CONTROLS AND PROCEDURES |
Evaluation of Disclosure Controls and Procedures
We maintain disclosure controls and procedures that are designed to ensure that information required to be disclosed in the reports we file or submit under the Securities and Exchange Act of 1934, as amended, is recorded, processed, summarized and reported within the time periods specified in the SEC’s rules and forms. Such controls include those designed to ensure that information for disclosure is accumulated and communicated to management, including the Chief Executive Officer (“CEO”) and Chief Financial Officer (“CFO”), as appropriate to allow timely decisions regarding required disclosure.
The CEO and CFO, with the participation of management, have evaluated the effectiveness of our disclosure controls and procedures as of June 30, 2010. Based on their evaluation, they have concluded, to the best of their knowledge and belief, that the disclosure controls and procedures are effective.
Internal Control over Financial Reporting
There were no changes made in our internal control over financial reporting during the quarter ended June 30, 2010, that have materially affected, or are reasonably likely to materially affect, our internal controls over financial reporting.
Limitations Inherent in all Controls
Our management, including the CEO and CFO, recognize that the disclosure controls and procedures and internal controls over financial reporting (discussed above) cannot prevent all errors or all attempts at fraud. Any controls system, no matter how well crafted and operated, can only provide reasonable, and not absolute, assurance of achieving the desired control objectives, and management is required to apply its judgment in evaluating the cost-benefit relationship of possible controls and procedures. Because of the inherent limitations in any control system, no evaluation or implementation of a control system can provide complete assurance that all control issues and all possible instances of fraud have been or will be detected.
90
Table of Contents
MANAGEMENT’S REPORTS
NEW YORK STOCK EXCHANGE REQUIRED DISCLOSURES
On October 28, 2009, our Chief Executive Officer certified that he was not aware of any violation by us of the New York Stock Exchange’s Corporate Governance listing standards.
We have filed with the Securities and Exchange Commission, as exhibits to our Annual Report on Form 10-K for the year ended June 30, 2010, our Chief Executive Officer’s and Chief Financial Officer’s certifications required by Section 302 of the Sarbanes-Oxley Act of 2002.
MANAGEMENT’S REPORT ON INTERNAL CONTROL OVER FINANCIAL REPORTING
Our management is responsible for establishing and maintaining adequate internal control over financial reporting, as such term is defined in Exchange Act Rule 13a-15(f). Under the supervision and with the participation of management, including our Chief Executive Officer and Chief Financial Officer, we conducted an evaluation of the effectiveness of our internal control over financial reporting based on the Internal Control-Integrated Framework, issued by the Committee of Sponsoring Organizations of the Treadway Commission. Based on our evaluation under the Internal Control-Integrated Framework, management concluded that our internal control over financial reporting was effective as of June 30, 2010. Our internal control over financial reporting as of June 30, 2010, has been audited by Deloitte and Touche LLP, an independent registered public accounting firm, as stated in their report which is included herein.
91
Table of Contents
REPORT OF INDEPENDENT REGISTERED PUBLIC ACCOUNTING FIRM
To the Board of Directors and Shareholders of
AmeriCredit Corp.:
We have audited the internal control over financial reporting of AmeriCredit Corp. and subsidiaries (the “Company”) as of June 30, 2010 based on criteria established in Internal Control–Integrated Framework issued by the Committee of Sponsoring Organizations of the Treadway Commission. The Company’s management is responsible for maintaining effective internal control over financial reporting and for its assessment of the effectiveness of internal control over financial reporting, included in Management’s Report on Internal Control over Financial Reporting. Our responsibility is to express an opinion on the Company’s internal control over financial reporting based on our audit.
We conducted our audit in accordance with the standards of the Public Company Accounting Oversight Board (United States). Those standards require that we plan and perform the audit to obtain reasonable assurance about whether effective internal control over financial reporting was maintained in all material respects. Our audit included obtaining an understanding of internal control over financial reporting, assessing the risk that a material weakness exists, testing and evaluating the design and operating effectiveness of internal control based on the assessed risk, and performing such other procedures as we considered necessary in the circumstances. We believe that our audit provides a reasonable basis for our opinion.
A company’s internal control over financial reporting is a process designed by, or under the supervision of, the company’s principal executive and principal financial officers, or persons performing similar functions, and effected by the company’s board of directors, management, and other personnel to provide reasonable assurance regarding the reliability of financial reporting and the preparation of financial statements for external purposes in accordance with generally accepted accounting principles. A company’s internal control over financial reporting includes those policies and procedures that (1) pertain to the maintenance of records that, in reasonable detail, accurately and fairly reflect the transactions and dispositions of the assets of the company; (2) provide reasonable assurance that transactions are recorded as necessary to permit preparation of financial statements in accordance with generally accepted accounting principles, and that receipts and expenditures of the company are being made only in accordance with authorizations of management and directors of the company; and (3) provide reasonable assurance regarding prevention or timely detection of unauthorized acquisition, use, or disposition of the company’s assets that could have a material effect on the financial statements.
Because of the inherent limitations of internal control over financial reporting, including the possibility of collusion or improper management override of controls, material misstatements due to error or fraud may not be prevented or detected on a timely basis. Also, projections of any evaluation of the effectiveness of the internal control over financial reporting to future periods are subject to the risk that the controls may become inadequate because of changes in conditions, or that the degree of compliance with the policies or procedures may deteriorate.
In our opinion, the Company maintained, in all material respects, effective internal control over financial reporting as of June 30, 2010, based on the criteria established in Internal Control–Integrated Framework issued by the Committee of Sponsoring Organizations of the Treadway Commission.
We have also audited, in accordance with the standards of the Public Company Accounting Oversight Board (United States), the consolidated financial statements as of and for the year ended June 30, 2010 of the Company and our report dated August 27, 2010, expressed an unqualified opinion on those financial statements.
/s/ Deloitte & Touche LLP
Dallas, Texas
August 27, 2010
92
Table of Contents
PART III
| ITEM 10. | DIRECTORS AND EXECUTIVE OFFICERS AND CORPORATE GOVERNANCE |
Board of Directors
Our bylaws provide for the Board of Directors to serve in three classes (Class I, Class II and Class III) having staggered terms of three years each. The table below sets forth information for the Class I, Class II and Class III directors, whose terms will expire at the Annual Meeting of Shareholders in 2012, 2010 and 2011, respectively.
| Name |
Principal Occupation |
Age | Director Since |
Class | ||||
| DANIEL E. BERCE |
56 | 1990 | I |
Mr. Berce has been President and Chief Executive Officer since August 2005. Mr. Berce served as President from April 2003 until August 2005. Mr. Berce was Vice Chairman and Chief Financial Officer from November 1996 until April 2003. Before joining AmeriCredit Corp., Mr. Berce was a partner with Coopers & Lybrand. Mr. Berce is also a director of AZZ incorporated, a publicly held company that manufactures specialty electrical equipment and provides galvanizing services to the steel fabrication industry, and Cash America International, Inc., a publicly held company that provides specialty financial services to consumers. The Board of Directors believes Mr. Berce’s qualifications to sit on our Board of Directors include his leadership experience and knowledge of AmeriCredit Corp. and our business that he has obtained through his service on our Board of Directors and as our President and Chief Executive Officer and through the other positions he has held with us over the course of the past 20 years as well as his experience as a director of other publicly traded companies.
| ROBERT B. STURGES |
63 | 2009 | I |
Since October 2006, Mr. Sturges has been a director and Chief Executive Officer of Nevada Gold and Casinos, Inc., a publicly held company engaged in the development, ownership and operation of commercial gaming facilities and lodging and entertainment facilities in the United States. He has over 25 years of gaming industry experience including over 15 years with Carnival Resorts & Casinos and Carnival Corporation. Earlier in Mr. Sturges’ career, he served as Deputy Director and Director of the New Jersey Division of Gaming Enforcement. Mr. Sturges is also a limited partner of the Miami Heat NBA franchise. Mr. Sturges was a board member of Benihana, Inc. from 2003 through 2009 and served at various times during his tenure as the Lead Independent Director, as well as a member of the Audit, Compensation and Executive Committees from 2003 through 2009. The Board of Directors believes Mr. Sturges’ qualifications to sit on our Board of Directors include his experience in corporate executive management, his experience as a director of publicly traded companies, his legal training and his regulatory compliance background.
| IAN M. CUMMING |
70 | 2008 | I |
Mr. Cumming has served as Chief Executive Officer and Chairman of the Board of Leucadia National Corporation (“Leucadia”) since June 1978. Leucadia is a publicly held diversified holding company engaged in a variety of businesses, including manufacturing, telecommunications, property management and services, gaming entertainment, real estate activities, medical product development and winery operations. Mr. Cumming is also a director of SkyWest, Inc., a Utah-based regional air carrier, HomeFed Corporation, a publicly held real estate development company, and Jefferies Group, Inc., a publicly held full service global investment bank and institutional securities firm serving companies and other investors and Fortescue Metals Group Ltd, an Australian public company that is engaged in the mining of iron ore. The Board of Directors believes Mr. Cumming’s qualifications to sit on our Board of Directors include his varied executive, investment and business experience.
| JAMES H. GREER |
83 | 1990 | I |
Mr. Greer is Chairman of the Board of Greer Capital Corporation as well as Chairman of two companies involved in real estate and commercial real estate development and management. From 1985 to 2001, Mr. Greer
93
Table of Contents
served as Chairman of the Board of Shelton W. Greer Co., Inc., which engineers, manufactures, fabricates and installs building specialty products, and as Chairman of the Board of Vermiculite Products, Inc. Mr. Greer served as a director of Service Corporation International for 27 years, retiring from that position in 2005. The Board of Directors believes Mr. Greer’s qualifications to sit on our Board of Directors include his over 40 years of governance experience through service on multiple boards in the banking industry and executive level experience in strategy development and implementation.
| A. R. DIKE |
74 | 1998 | II |
Mr. Dike is the President and Chief Executive Officer of The Dike Company, Inc., a private insurance agency, and has been in such position since July 1999. Prior to July 1999, Mr. Dike was President of Willis Corroon Life, Inc. of Texas, and was in such position for more than five years. Mr. Dike previously served as a director for several insurance companies. Mr. Dike served as a director of JPMorgan Chase Bank of Tarrant County and its predecessor banks from 1977 though 1988 and served as an advisory director until 2008. Mr. Dike served as a director of Cash America International, Inc. for 21 years, retiring from that position in April 2009. The Board of Directors believes Mr. Dike’s qualifications to sit on our Board of Directors include his corporate executive management and leadership experience, his insurance expertise and his experience as a director of other publicly and privately held companies.
| DOUGLAS H. HIGGINS |
60 | 1996 | II |
Mr. Higgins is a private investor and owner of Higgins & Associates and has been in such position since July 1994. Mr. Higgins served as the President and Chief Executive Officer of H&M Food Systems Company, Inc. from 1983 through 1994. The Board of Directors believes Mr. Higgins’ qualifications to sit on our Board of Directors include his experience as a business owner, his investment experience and his financial acumen.
| KENNETH H. JONES |
75 | 1998 | II |
Mr. Jones, a private investor, retired as Vice Chairman of KBK Capital Corporation (“KBK”) (now known as Marquette Commercial Finance, Inc.), a non-bank commercial finance company, in December 1999. Mr. Jones had been Vice Chairman of KBK since January 1995. Prior to January 1995, Mr. Jones was a shareholder in the Decker, Jones, McMackin, McClane, Hall & Bates, P.C. law firm in Fort Worth, Texas, and was with such firm and its predecessor or otherwise involved in the private practice of law in Fort Worth, Texas for more than five years. Mr. Jones is Chairman of the Board of Trustees for Texas Wesleyan University for 2010 and has been on the Board of Trustees since 1988. The Board of Directors believes Mr. Jones’ qualifications to sit on our Board of Directors include his legal and financial knowledge and experience, his community service and his service as Chairman of the Board’s Audit Committee.
| CLIFTON H. MORRIS, JR. |
74 | 1988 | III |
Mr. Morris has been Chairman of the Board since May 1988. Mr. Morris served as Chairman of the Board and Chief Executive Officer from May 1988 to July 2000 and from April 2003 to August 2005. Mr. Morris also served as President from May 1988 until April 1991 and from April 1992 to November 1996. Previously, he served as Chief Financial Officer of Cash America International, Inc., prior to which he owned his own public accounting firm. Mr. Morris was instrumental in the early formulation and initial public offerings of Service Corporation International, Cash America International, Inc. and AmeriCredit Corp., all of which are now listed on the New York Stock Exchange. Mr. Morris is a director of Service Corporation International, a publicly held company that owns and operates funeral homes and related businesses. The Board of Directors believes Mr. Morris’ qualifications to sit on our Board of Directors include his extensive knowledge and experience related to the subprime automobile finance industry and AmeriCredit Corp. as well as his executive and business experience.
| JOHN R. CLAY |
62 | 2003 | III |
Mr. Clay was Chief Executive Officer of Practitioners Publisher Company, Inc., a leading publisher of accounting and auditing manuals for CPA firms, from 1979 to 1999. Mr. Clay has also served 12 years as a public accountant, first with Ernst & Ernst and later as a partner with Rylander, Clay & Opitz. Mr. Clay is a
94
Table of Contents
certified public accountant and has authored several accounting articles and financial publications. The Board of Directors believes Mr. Clay’s qualifications to sit on our Board of Directors include his accounting expertise as well as his executive, financial and business experience.
| JUSTIN R. WHEELER |
38 | 2008 | III |
Mr. Wheeler joined Leucadia in 2000. Currently, Mr. Wheeler is President of the Asset Management Group and a Vice President of Leucadia and has been in such positions since 2000. Prior to his current position within Leucadia’s Asset Management Group, Mr. Wheeler was the President and Chief Executive Officer of American Investment Bank, a subprime auto lending bank and wholly owned subsidiary of Leucadia. Mr. Wheeler is also a director of International Assets Holding Corporation, a publicly held financial services firm focused on select international markets. The Board of Directors believes Mr. Wheeler’s qualifications to sit on our Board of Directors include his extensive knowledge and experience related to the subprime automobile finance industry as well as his executive and business experience.
Executive Officers
The following sets forth certain data concerning our executive officers.
| Name |
Age | Position | ||
| Clifton H. Morris, Jr. |
74 | Chairman of the Board | ||
| Daniel E. Berce |
56 | President and Chief Executive Officer | ||
| Kyle R. Birch |
49 | Executive Vice President, Dealer Services | ||
| Steven P. Bowman |
43 | Executive Vice President, Chief Credit and Risk Officer | ||
| Chris A. Choate |
47 | Executive Vice President, Chief Financial Officer and Treasurer | ||
| James M. Fehleison |
51 | Executive Vice President, Corporate Controller | ||
| J. Michael May |
65 | Executive Vice President, Chief Legal Officer and Secretary | ||
| Brian S. Mock |
45 | Executive Vice President, Consumer Services | ||
| Susan B. Sheffield |
44 | Executive Vice President, Structured Finance | ||
CLIFTON H. MORRIS, JR. has been Chairman of the Board since May 1988 and served as Chief Executive Officer from April 2003 to August 2005 and from May 1988 to July 2000. He also served as President from May 1988 until April 1991 and from April 1992 to November 1996. Mr. Morris has been with the company since its founding in 1988.
DANIEL E. BERCE has been President since April 2003 and Chief Executive Officer since August 2005. Mr. Berce was Vice Chairman and Chief Financial Officer from November 1996 until April 2003. Mr. Berce joined us in 1990.
KYLE R. BIRCH has been Executive Vice President, Dealer Services since May 2003. Prior to that, he was Senior Vice President of Dealer Services from July 1999 to April 2003. Mr. Birch joined us in 1997.
STEVEN P. BOWMAN has been Executive Vice President, Chief Credit and Risk Officer since January 2005. Prior to that, he was Executive Vice President, Chief Credit Officer from March 2000 to January 2005. Mr. Bowman joined us in 1996.
CHRIS A. CHOATE has been Executive Vice President, Chief Financial Officer and Treasurer since January 2005. Prior to that, he was Executive Vice President, Chief Legal Officer and Secretary from November 1999 to January 2005. Mr. Choate joined us in 1991.
95
Table of Contents
JAMES M. FEHLEISON has been Executive Vice President, Corporate Controller, since October 2004. Prior to that, he was Senior Vice President, Corporate Controller, from November 2000 to October 2004. Mr. Fehleison joined us in 2000.
J. MICHAEL MAY has been Executive Vice President, Chief Legal Officer and Secretary since July 2006. Prior to that, he was Senior Vice President, Associate Counsel, from June 2001 to July 2006. Mr. May joined us in 1999.
BRIAN S. MOCK has been Executive Vice President, Consumer Services since September 2002. Prior to that, he was Senior Vice President of Operational Services from April 2001 to August 2002. Mr. Mock joined us in 2001.
SUSAN B. SHEFFIELD has been Executive Vice President, Structured Finance since July 2008. Prior to that, she was Senior Vice President, Structured Finance, from February 2004 to July 2008 and Vice President, Structured Finance, from February 2003 to February 2004. Ms. Sheffield joined us in 2001.
Section 16(a) Beneficial Ownership Reporting Compliance
Our executive officers, directors and beneficial owners of more than 10% of our Common Stock are required to file under the Securities Exchange Act of 1934, as amended, reports of ownership and changes of ownership with the SEC. Based solely upon information provided to us by executive officers, directors and 10% shareholders, we believe that during the fiscal year ended June 30, 2010, all filing requirements applicable to its executive officers, directors and 10% shareholders were met.
Corporate Governance
We have adopted the AmeriCredit Code of Ethical Conduct for Senior Financial Officers (“code of ethics”), a code of ethics that applies to the Chief Executive Officer, Chief Financial Officer and Corporate Controller. The code of ethics is publicly available on our website at www.americredit.com (and a copy will be provided to any shareholder upon written request to our Secretary). Corporate governance guidelines applicable to the Board of Directors and charters for all Board committees are also available on our website. If any substantive amendments are made to the code of ethics or any waivers granted, including any implicit waiver, from a provision of the code to the Chief Executive Officer, Chief Financial Officer or Corporate Controller, we will disclose the nature of such amendment or waiver on our website or in a report on Form 8-K.
Our Board of Directors recognizes that while risk management is primarily the responsibility of our management, an important part of the Board’s responsibilities is to oversee our overall process to assess and mitigate risks. As part of its regular reviews of our financial and operational performance, the Board discusses with management the most critical business risks, such as credit quality, loan origination strategy, loan servicing, liquidity and capital management. In addition, management has developed a formal program to assess, manage and report to the Board enterprise risk factors, which are then reviewed by the Board as part of its strategic reviews.
The Board also utilizes its committees to oversee specific risks and receives regular reports from its committees on the areas of risk for which they have oversight. Each committee is made up entirely of independent directors and makes regular reports to the Board. The Audit Committee has responsibility for the oversight of risks associated with financial accounting and reporting, including our system of internal control. This oversight includes reviewing and discussing our risk assessment process with management, our senior internal audit officer and our independent registered public accounting firm, with respect to major financial risk exposures. The Compensation Committee oversees the risks relating to compensation policies and programs. The Nominating and Corporate Governance Committee oversees risks relating to corporate governance and, acting with the Compensation Committee, risks associated with executive management and succession planning.
In April 2010, management and the Compensation Committee reviewed our compensation policies and practices, with a focus on incentive programs, to ensure that they do not encourage excessive risk taking. Specifically, this review included a detailed review of long-term equity-based awards to executive officers and to
96
Table of Contents
other officers, as well as incentive cash programs for all employees. Based on this comprehensive review, management and the Compensation Committee concluded that our compensation policies and practices do not encourage excessive risk taking for the following reasons:
| • | Our programs appropriately balance short-term and long-term incentives, to achieve a balance of annual achievement with long-term shareholder value. |
| • | Our executive incentive compensation program is performance-based, using a balanced mix of metrics that encourage results in our long-term best interests and our shareholders. |
| • | Short-term cash incentive programs for all employees are performance-based and also use balanced metrics that discourage undue risk taking. |
| • | The alignment of the interests of management and other employees with the interests of our shareholders is further promoted by our stock ownership guidelines for named executive officers, performance-based equity awards for executives, equity awards to other officers, and employee participation in our Employee Stock Purchase Program. |
Director Nomination Process
No changes have been made to the procedures by which security holders may recommend nominees to our board of directors since our last proxy statement dated September 16, 2009. The Nominating and Corporate Governance Committee considers diversity in making director nominee recommendations in accordance with the Corporate Governance Guidelines. There is no formal process for implementing this policy.
Board Committees and Meetings
Standing committees of the Board include the Audit Committee, the Compensation Committee and the Nominating and Corporate Governance Committee.
Audit Committee
As enumerated more fully in its charter, which may be accessed on our website at www.americredit.com and is available in print to any shareholder requesting it, the Audit Committee’s principal responsibilities consist of the following:
| • | Review and discuss with management and the independent registered public accounting firm the quarterly and annual financial statements, including disclosures made in management’s discussion and analysis. |
| • | Review and discuss with management and the independent registered public accounting firm the effect of any major changes to our accounting principles and practices, as well as the impact of any regulatory and accounting initiatives on our financial statements. |
| • | Review and discuss with management and the independent registered public accounting firm the effectiveness of management’s internal controls over our financial reporting process. |
| • | Oversee and review the performance of our internal audit function. |
| • | Review the qualifications, independence and performance of the independent registered public accounting firm annually and appoint or re-appoint the independent registered public accounting firm. |
| • | Review and discuss with management our major financial risk exposures and the steps management has taken to monitor and control such exposures, including our risk assessment and risk management policies. |
| • | Review and discuss summary reports from our compliance hotline, a toll-free number available to our employees to make anonymous reports of any complaints or issues regarding our financial statements or accounting policies. |
97
Table of Contents
The Board has affirmatively determined that (i) all members of the Audit Committee are independent under the rules of the New York Stock Exchange and the Board’s Corporate Governance Guidelines, (ii) all members of the Audit Committee are financially literate, as the Board interpreted such qualifications in its business judgment and (iii) Mr. Clay qualifies as an audit committee financial expert as defined in Item 401 of Regulation S-K under the Securities Exchange Act of 1934, as amended. Members consist of Messrs. Clay, Dike, Greer and Jones. In fiscal 2010, the Audit Committee met four times and, pursuant to the authority delegated to him by the Audit Committee, Mr. Jones, Chairman of the Audit Committee, met with our independent registered public accounting firm several additional times. No Audit Committee member serves on the Audit Committee of more than three public companies.
Compensation Committee
As enumerated more fully in its charter, which may be accessed on our website at www.americredit.com and is available in print to any shareholder requesting it, the Compensation Committee’s principal responsibilities consist of the following:
| • | Review and approve corporate goals and objectives relevant to CEO compensation, evaluate the CEO’s performance in light of these established goals and objectives and set the CEO’s annual compensation, including salary, bonus, incentive and equity compensation. |
| • | Oversee and evaluate, based on input and recommendations from the CEO, the performance of and compensation structure (including salary, bonus and equity compensation) for the members of our executive management team. |
| • | Administer our employee equity-based compensation plans and grant equity-based awards and amend and terminate equity-based compensation plans. |
| • | Retain and terminate compensation consultants to evaluate the compensation of officers. |
The Board has affirmatively determined that all members of the Compensation Committee are independent under the rules of the Securities Exchange Act of 1934, as amended, the New York Stock Exchange, the Internal Revenue Code of 1986, as amended, and the Board’s Corporate Governance Guidelines. Members consist of Messrs. Clay, Greer, Higgins and Jones. In fiscal 2010, the Compensation Committee met four times.
Nominating and Corporate Governance Committee
As enumerated more fully in its charter, which may be accessed on our website at www.americredit.com and is available in print to any shareholder requesting it, the Nominating and Corporate Governance Committee’s principal responsibilities consist of the following:
| • | Regularly review, monitor and, as appropriate, update the Corporate Governance Guidelines. |
| • | Develop qualification standards for Board membership. |
| • | Identify and recruit new candidates for the Board, develop a re-nomination review process for current Board members and develop a process to review director nominees received from shareholders. |
| • | Recommend director nominees to the Board for approval, who, if approved, will stand for election by the shareholders at the Annual Meeting. |
| • | Make recommendations to the Board with respect to committee assignments for Board members, including the chairmanships of the committees. |
| • | Develop and lead an annual process for self-assessment of the Board as a whole and for the committees. |
| • | Oversee our CEO and executive succession planning, including the development of both short-term (i.e., emergency) succession plans and long-term succession plans, including leadership development planning. |
98
Table of Contents
| • | Develop and regularly review a program for the orientation of new Board members, in conjunction with the Chairman of the Board, so that they can quickly become sufficiently knowledgeable about us to contribute meaningfully to Board discussions and decision-making. |
| • | Make recommendations to the Board with respect to directors’ compensation and to regularly review and, as appropriate, recommend revisions to directors’ compensation. |
The Board has affirmatively determined that all members of the Nominating and Corporate Governance Committee are independent under the rules of the New York Stock Exchange and the Board’s Corporate Governance Guidelines. In fiscal 2010, the Nominating and Corporate Governance Committee met three times. Members consist of Messrs. Dike, Greer, Higgins and Jones. Mr. Dike, as Chairman of this Committee, led the executive sessions of the independent directors held during every Board meeting.
The Board of Directors held four regularly scheduled meetings during the fiscal year ended June 30, 2010. Various matters were also approved during the last fiscal year by unanimous written consent of the Board of Directors. No director attended fewer than 75% of the aggregate of (i) the total number of meetings of the Board of Directors and (ii) the total number of meetings held by all committees of the Board on which such director served.
Procedures for Contacting Directors
Shareholders and other interested parties who wish to communicate with the Board, including the presiding director of the non-management directors as a group, may do so by writing to AmeriCredit Corp., Board of Directors (or Chairman of the Nominating and Corporate Governance Committee, committee name or director’s name, as appropriate), 801 Cherry Street, Suite 3500, Fort Worth, Texas 76102. The non-management directors have established procedures for the handling of communications from shareholders and other interested parties and have directed the Secretary to act as their agent in processing any communications received. All communications that relate to matters that are within the scope of the responsibilities of the Board and its committees are to be forwarded to the Chairman of the Nominating and Corporate Governance Committee. Communications that relate to matters that are within the responsibility of one of the Committees are also to be forwarded to the Chairman of the appropriate committee. Communications that relate to ordinary business matters that are not within the scope of the Board’s responsibilities are to be sent to our appropriate officer for review and investigation as appropriate. Solicitations, junk mail and obviously frivolous or inappropriate communications will not be forwarded, but will be made available to any non-management director who wishes to review them.
Policy on Attendance at Annual Meeting of Shareholders
We do not have a stated policy, but encourage our directors to attend each annual meeting of shareholders. We may consider in the future whether we should adopt a more formal policy regarding director attendance at annual meetings. At the 2009 Annual Meeting of Shareholders held on October 27, 2009, all directors were present and in attendance.
Compensation Committee Interlocks and Insider Participation
No member of the Compensation Committee is or has been an officer or employee of ours or any of our subsidiaries or had any relationship requiring disclosure pursuant to Item 404 of Regulation S-K promulgated by the SEC. None of our executive officers served during fiscal 2010, or currently serves, as a member of the board of directors or compensation committee of any entity that has one or more executive officers serving on our Board or our Compensation Committee.
99
Table of Contents
| ITEM 11. | EXECUTIVE AND DIRECTOR COMPENSATION |
Director Compensation
The following table sets forth director compensation for fiscal 2010. The table and following discussion apply to directors who are not employees (outside directors). Employees who are directors (namely, Messrs. Morris and Berce) do not receive director fees or other director compensation.
| Name |
Fees Earned or Paid in Cash ($)(1) |
Stock Awards ($)(2) |
All Other Compensation ($) |
Total ($) | |||||
| Bruce R. Berkowitz |
0 | 0 | 61,695 | (3) | 61,695 | ||||
| John R. Clay |
52,000 | 125,160 | 25,462 | (4) | 202,622 | ||||
| Ian M. Cumming |
40,000 | 125,160 | 0 | 165,160 | |||||
| A.R. Dike |
52,000 | 125,160 | 31,196 | (4) | 208,356 | ||||
| James H. Greer |
55,000 | 125,160 | 62,162 | (4) | 242,322 | ||||
| Douglas K. Higgins |
53,500 | 125,160 | 51,190 | (4) | 229,850 | ||||
| Kenneth H. Jones, Jr. |
59,000 | 125,160 | 66,983 | (4) | 251,143 | ||||
| Robert B. Sturges(5) |
23,600 | 78,750 | 81,219 | (4) | 183,569 | ||||
| Justin R. Wheeler |
40,000 | 125,160 | 0 | 165,160 |
| (1) | In fiscal 2010, Messrs. Clay, Cumming, Dike, Greer, Higgins, Jones and Wheeler received a $24,000 annual Board of Director retainer fee, and Mr. Sturges received a $15,600 annual Board of Director retainer fee (the pro-rata amount of the annual retainer fee under the Non-Employee Director Compensation Plan for Fiscal 2010 measured from November 16, 2009 through June 30, 2010). The Audit Committee Chairman received a $4,000 annual retainer fee, and the Compensation Committee Chairman and Nominating and Corporate Governance Committee Chairman each received $3,000 annual retainer fees. In addition to the annual retainer, Messrs. Clay, Cumming, Dike, Greer, Higgins, Jones, Sturges and Wheeler received $4,000 for each Board meeting attended and received $1,500 for each Committee meeting attended. |
| (2) | The stock awards column sets forth the dollar amounts representing the aggregate grant date fair value of restricted stock units (“RSUs”) awarded during the year. During fiscal 2010, Messrs. Clay, Cumming, Dike, Greer, Higgins, Jones, Sturges and Wheeler did not realize any financial benefit from these awards. Under the Non-Employee Director Compensation Plan for Fiscal 2010, each of Messrs. Clay, Cumming, Dike, Greer, Higgins, Jones and Wheeler received a long-term incentive equity award with a grant date equity value of approximately $125,000. In fiscal 2010, the equity award granted was in the form of RSUs. The number of RSUs granted is determined by dividing the closing stock price on the grant date into the equity value and rounded up to the nearest 100. Accordingly, each of Messrs. Clay, Cumming, Dike, Greer, Higgins, Jones and Wheeler received 7,000 RSUs based on the closing price of our Common Stock on October 27, 2009 of $17.88 per share. The grant was 50 percent vested on April 27, 2010 and the remaining 50 percent will vest on October 27, 2010. On November 23, 2009, Mr. Sturges received a long-term incentive equity award with a grant date equity value of $78,750 (the pro-rata amount of the long-term incentive equity award under the Non-Employee Director Compensation Plan for Fiscal 2010 measured from November 16, 2009 through June 30, 2010). The number of RSUs granted is determined by dividing the closing stock price on the grant date into the equity value and rounded up to the nearest 100. Accordingly, Mr. Sturges received 4,200 RSUs based on the closing price of our Common Stock on November 23, 2009 of $18.75 per share. The grant made to Mr. Sturges was 50 percent vested on April 27, 2010 and the remaining 50 percent will vest on October 27, 2010. The Common Stock to be issued in connection with these RSUs will be distributed upon the earliest to occur of (1) the board members’ death, disability or separation from the board, (2) a change of control event, or (3) October 27, 2014. |
| (3) | The amounts represent the reasonable out-of-pocket expenses incurred during fiscal 2010 in connection with Mr. Berkowitz’s attendance and participation in the meetings of our Board of Directors. Due to certain fiduciary duties regarding investors in Fairholme Funds, Inc. (“Fairholme”), Mr. Berkowitz declined any |
100
Table of Contents
| Board compensation and requested instead that he or Fairholme be reimbursed for reasonable out-of-pocket expenses incurred by him or Fairholme in connection with his attendance and participation in meetings of our Board of Directors not to exceed $125,000 in any fiscal year. Mr. Berkowitz resigned from the Board effective November 16, 2009. |
| (4) | The amounts represent the incremental cost of personal use of our aircraft to the extent we are not reimbursed by the outside director. The cost includes the average cost of fuel used, direct costs incurred (such as flight planning services, pilot expenses and food) and an hourly charge for maintenance of the engines and airframe. The outside directors are entitled to certain hours of use of our aircraft for personal reasons in accordance with our usage policy approved by the Board of Directors and pursuant to a signed dry lease agreement which is governed by FAA regulations. For each flight in excess of the allocated personal use flight hours, the outside directors are required to reimburse us for operating costs associated with personal aircraft usage which are based on an hourly rate and include estimates for costs that are specifically defined by the FAA regulations pursuant to dry lease agreements. Personal use is treated as taxable compensation to the outside director to the extent the Internal Revenue Service valuation of the personal aircraft usage exceeds the payments pursuant to the dry lease agreement. |
| (5) | Mr. Sturges joined the Board of Directors on November 16, 2009. |
Director Stock Ownership Guidelines
On April 27, 2004, the Board of Directors adopted stock ownership guidelines for each director as described in the Corporate Governance Guidelines. Each director is expected to own our stock having a value that, by the third anniversary of the later of the adoption of the Corporate Governance Guidelines or his or her election to the Board, equals twice the director’s annual retainer then in effect. Presently, all of the directors other than Mr. Sturges own more than the minimum number of shares necessary to comply with the director stock ownership guidelines. Mr. Sturges was appointed to the Board of Directors on November 16, 2009, and accordingly, Mr. Sturges has until November 16, 2012 to own the requisite number of shares.
Compensation Discussion and Analysis
This Compensation Discussion and Analysis (“CD&A”) focuses on our executive officers (consisting of the executives who are named in the tables below (the “Named Executive Officers”) and four other senior executives). This CD&A is organized into the following sections:
| • | Executive Summary; |
| • | Compensation Programs and Objectives; |
| • | Decision Making Process; |
| • | Components of Total Compensation and Summary of 2010 Pay Decisions; and |
| • | Other Arrangements, Policies and Practices Related to Our Executive Compensation Program. |
Executive Summary
The Executive Summary is intended to highlight information in the CD&A and does not purport to contain all of the information that is necessary to gain an understanding of our executive compensation policies and decisions. Please read the CD&A and the compensation tables that follow for a more complete understanding of our executive compensation program.
Our compensation programs are designed to motivate and retain our executives to generate positive financial performance and to create incentive plans that align their interests with those of our shareholders.
The Compensation Committee (the “Committee”) of our Board of Directors considers a number of factors when making its compensation decisions affecting our Named Executive Officers. The Committee, which may
101
Table of Contents
consult with a compensation consultant engaged by the Committee, considers our financial performance, competitive market practice, relative importance of role, individual performance, internal pay equity, alignment with shareholders’ interests and creation of long-term shareholder value.
In fiscal 2010, we met or exceeded key financial measures that are used to determine our executives’ bonuses and achieved other milestones as follows:
| • | Reported a profit (net income of $221 million or $1.60 per share), which is attributable to the leadership of our management team as well as the sustainability of our business model; |
| • | Preserved and strengthened our capital and liquidity position; |
| • | Reduced our leverage ratio of managed assets to equity; |
| • | Increased tangible net worth; |
| • | Reduced net charge-offs as a percentage of average finance receivables despite continued high unemployment levels; |
| • | Effectively managed expenses while maintaining appropriate service levels through a difficult economic environment; |
| • | Increased new loan originations while rebuilding our national footprint; |
| • | Successfully increased the size and extended the term of our warehouse credit facility thereby maintaining sufficient capacity to fund new loan originations; and |
| • | Successfully executed five automobile securitization transactions. |
For fiscal 2011, although we anticipate that the financial services industry will continue to face challenges, we will maintain focus on the achievement of key financial and strategic business goals. We believe that the long-term incentive compensation awards granted in fiscal 2009 will continue to motivate executive officers to make decisions in support of long-term financial interests while also serving as a retention tool. We will continue to monitor the compensation programs to ensure they continue to align the interests of our executive officers, which includes the Named Executive Officers, with those of our shareholders.
Compensation Programs and Objectives
The Committee is responsible for overseeing the establishment and implementation of our compensation policy and monitoring our compensation practices. The Committee ensures that the total compensation of our executive officers, particularly our CEO, is fair, reasonable and competitive. The Committee is directly responsible for reviewing and approving the corporate goals and objectives relevant to the CEO’s compensation, evaluating the CEO’s performance in light of those goals and objectives, determining and approving the CEO’s compensation based on that evaluation and approving equity-based compensation programs for our executive officers.
Our compensation programs are designed to align compensation with business objectives and performance, enabling us to attract, retain and reward executive officers and other key employees who contribute to our long-term success and motivate executive officers to enhance long-term shareholder value. We also strive to design programs to position us competitively in the market and industries where we compete for talent. We recognize that compensation programs must be understandable to be effective and that program administration and decision-making must be fair and equitable. We also recognize that compensation programs, specifically incentive-based programs, must evolve to reflect changing economic conditions and capital markets dynamics that may adversely affect our overall performance, including what may be realistically achievable in the future.
102
Table of Contents
Decision Making Process
Role of the Compensation Committee
The Committee oversees the design and administration of our compensation programs and evaluates these programs against competitive practices, legal and regulatory developments and corporate governance trends. For more information about the Committee’s role, see the Committee’s charter, which may be accessed on our website at www.americredit.com. During fiscal 2010, the Committee reviewed and approved all compensation programs applicable to our executive officers, our overall strategy for employee compensation, and the specific compensation of our CEO and other executive team members which includes the Named Executive Officers. In the course of this review, the Committee considered our current compensation programs and whether to modify them or introduce new programs or elements of compensation in order to better meet our overall compensation objectives. The Committee decided to postpone making annual long-term incentive awards in fiscal 2010.
In fiscal 2010, the Committee had the authority to select, retain and terminate special counsel and other experts (including compensation consultants), as the Committee deemed appropriate. The Committee retained Ernst & Young as its compensation consultant for fiscal 2009 to evaluate an annual long-term incentive award program for the CEO and the executive officers. The Committee has not utilized a compensation consultant since the review described above.
Role of Executive Officers in Compensation Decisions
While the Committee determines our overall compensation philosophy and sets the compensation of our CEO, the other Named Executive Officers and other executive team members, it relies on certain executive officers and compensation consultants, if retained by the Committee, to work within the compensation philosophy to make recommendations to the Committee with respect to compensation guidelines and specific compensation decisions. Our CEO also provides the Board and the Committee with his perspective on the performance of our executive officers. Our CEO recommends to the Committee specific compensation amounts for executive officers other than himself, and the Committee considers those recommendations and makes the ultimate compensation decisions. Our CEO, CFO and other members of management regularly attend the Committee’s meetings to provide perspectives on the competitive landscape and information regarding our accomplishments as well as estimated future performance.
Role of Compensation Consultants
As discussed above, the Committee engaged Ernst & Young in fiscal 2009 to help evaluate compensation objectives including an annual long-term incentive award program for the CEO and the executive officers for fiscal 2009. As part of the engagement, Ernst & Young conducted a total rewards study to evaluate the competitiveness of our compensation programs and provide advice with respect to our executive compensation and policies.
For fiscal 2010, the Committee determined that it would not materially benefit from engaging an independent consultant. The Committee noted that while the use of consultants can be beneficial, our compensation strategy for fiscal 2010 for base salary and short-term incentive-based cash awards was similar in all material respects to the structure and levels of compensation offered to our officers in fiscal 2009. This, combined with the decision to postpone making long-term incentive awards, led the Committee to its decision to not retain a consultant.
Competitive Considerations
In making decisions regarding each compensation element, the Committee considers the competitive market for executives and compensation levels provided by comparable companies with whom we compete for executive talent, principally consumer financial services firms and other automobile-related companies. The
103
Table of Contents
companies chosen for comparison may vary from one executive to the next, depending on the scope and nature of the business for which the particular executive is responsible. These businesses typically include BOK Financial Corporation, Capital One Financial Corporation, CarMax, Inc., CIT Group, Inc., Commerce Bancshares, Inc., CompuCredit Corp., Cullen/Frost Bankers, Inc., Lithia Motors, Inc., Penske Automotive Group, Inc. and Sonic Automotive, Inc. The Committee also looks to the salary information of other financial services companies in the United States whose annual revenues are comparable to ours and relies on salary surveys compiled by and purchased from compensation consultants and other providers of such data.
Components of Total Compensation and Summary of 2010 Pay Decisions
Executive Compensation Practices
For fiscal 2010, the components of executive compensation paid to the Named Executive Officers consisted of base salary and short-term incentive-based cash awards. Our pay positioning strategy is to target total annual compensation of the Named Executive Officers as a whole at approximately the 75th percentile level of our peer group. Our executive officers were also provided certain perquisites, as described below, and were also eligible to participate in our health and benefits plans, retirement plans and our employee stock purchase plan, which are generally available to all of our employees.
Base Salary
Base salary is the fixed portion of executive pay and is set to reward individuals’ current contributions to us and compensate them for their expected day-to-day performance. For fiscal 2010, the annual base salary of the Named Executive Officers as a whole was slightly above the 75th percentile level of our peer group based upon reviews of publicly available information.
Salaries are reviewed annually. The Committee reviews the base salary of the CEO. The CEO and the Committee review the base salaries of the other executive team members, including the Named Executive Officers. Merit increases are based on the executive’s management and leadership effectiveness over the performance period, as well as any changes in the competitive market for that executive’s position. During fiscal 2010, the Committee considered input and recommendations from the CEO when evaluating factors relative to the other executive officers’ salary. To further cost management efforts and be reflective of the challenging economic conditions, none of the Named Executive Officers received a base salary increase for fiscal 2010.
Short-Term Incentive-Based Cash Awards
The Amended and Restated Senior Executive Bonus Plan (“SEBP”) is designed to align executive compensation with annual performance and to enable us to attract, retain and reward participants who contribute to our success and motivate them to enhance our value. The SEBP provides our Named Executive Officers and other officers the opportunity to earn annual short-term incentive-based cash awards based on the achievement of financial and operational objectives and other factors that the Committee may establish. The Committee has the sole discretion of establishing a bonus plan for a given year and paying cash bonus awards after the end of the fiscal year. The SEBP is designed to qualify awards under Section 162(m) of the Internal Revenue Code of 1986, as amended (the “IRC”). The SEBP was adopted by the Committee in August 2009, approved by the Board in August 2009 and approved by our shareholders at the 2009 Annual Meeting of Shareholders.
The Committee considers management’s recommendations regarding the annual bonus plan, including the performance measures and targets and associated cash payouts, at a meeting during the first quarter of the fiscal year, usually held in September. When establishing the bonus plan for a given year, the Committee (1) reviews overall performance goals for the year; (2) establishes performance measures based on business criteria and target levels of performance; (3) establishes a formula for calculating a participant’s award based on actual performance compared to pre-established performance goals; and (4) approves the target bonuses for SEBP
104
Table of Contents
participants who are senior officers, including the Named Executive Officers, expressed as a percentage of that individual’s base salary. The Committee completes its review and approval process for a new bonus plan within the framework of Section 162(m) of the IRC, as discussed later in the CD&A.
Under the SEBP, the Committee established the following financial and operating performance metrics for fiscal 2010: (1) net income calculated before taxes and restructuring charges (“EBTR”), (2) credit losses, (3) return on equity (“ROE”) and (4) operating expenses. Moreover, (i) our earnings per share (“EPS”) must be positive and (ii) our liquidity (as defined to include cash and borrowing capacity on unpledged eligible automobile loans) as of June 30, 2010 must be above $250 million in order for a cash bonus to be paid regardless of the achievement of the other performance goals. Each metric has performance levels set at the threshold, target and maximum levels; however a minimum level of originations must occur for the ROE metric to be achieved. The threshold targets were set at levels considered achievable even if there was further deterioration in the economy. To achieve the maximum targets, performance for fiscal 2010 would have to be outstanding and at a level difficult to achieve based on business and economic conditions existing at the time the fiscal year 2010 plan was adopted. The bonus amount at the target level is set to result in total cash compensation, when combined with base salary, at the 75th percentile of our peer group. The “Grants of Plan-Based Awards” table provides, under the heading “Estimated Future Payouts Under Non-Equity Incentive Plan Awards,” the range of possible payouts under the fiscal 2010 SEBP.
Taking into consideration difficult economic conditions, we believe that the fiscal 2010 SEBP focused on principal business metrics that executives could control or influence that affect fiscal 2010 profitability. The EBTR target was chosen as a performance measure because it is a key metric used by management to measure our financial performance for the year. The EBTR target excluded various one-time items we anticipated could be incurred in fiscal 2010 including the impact of fluctuations in the income tax rate and restructuring charges that were necessary and advisable to align our expense base to our declining portfolio level. Measuring credit losses reflects our servicing and collection performance. ROE measures the profitability of new loan originations during fiscal 2010 and incentivizes pricing discipline and execution and responsiveness to changes in cost of funds. Measuring operating expenses reflects our proactive management of expenses.
The Committee established the following pre-determined threshold, target and maximum levels for EBTR, credit losses and operating expenses under the SEBP for fiscal 2010:
| Threshold | Target | Maximum | Actual Results | |||||
| EBTR |
$50 million | $80 million | $110 million | $354 million | ||||
| Credit Losses |
9.1% | 8.9% | 8.7% | 7.4% | ||||
| Operating Expenses |
3.1% | 2.9% | 2.7% | 3.0% |
In addition, the Committee established pre-determined threshold, target and maximum levels for ROE under the SEBP for fiscal 2010, for which target level was achieved. Because disclosure of ROE levels under the fiscal 2010 SEBP would give competitors insight into areas where we are focusing on pricing execution on new loan originations under our strategic operating plan, we have not disclosed ROE targets utilized for fiscal 2010. Knowledge of the targets could also be used by our competitors to take advantage of insight into this specific area to target the recruitment of key employees. In addition, disclosing the details of our ROE targets for profitability on new loan originations provide confidential information we currently do not publicly disclose which would impair our ability to leverage our pricing competitiveness. Furthermore, our competitors do not publicly disclose their ROE targets.
105
Table of Contents
For the fiscal 2010 SEBP, the Committee established the weighting of the performance metrics for the Named Executive Officers, as set out below:
| Performance Goals |
Weight | ||
| EBTR |
30 | % | |
| Credit Losses |
30 | % | |
| ROE |
30 | % | |
| Operating Expenses |
10 | % |
The bonus target amounts, expressed as a percentage of base salary, are established for the Named Executive Officers each year, with a target bonus opportunity between 93.75% and 125% of base salary and a maximum bonus opportunity between 150% and 200%. As stated above, no bonuses were payable to the Named Executive Officers for fiscal 2010 unless positive EPS was achieved and liquidity as of June 30, 2010 was above $250 million regardless of the achievement of the other performance goals.
In August 2010, the Committee evaluated whether and to what extent we achieved the fiscal 2010 SEBP financial and operational performance goals. The Committee determined that the targets for (i) EBTR and credit losses were achieved at the maximum level, (ii) ROE was achieved at the target level, and (iii) operating expenses were achieved at the threshold level. Moreover, we reported net income of $221 million ($1.60 earnings per share) for fiscal 2010 and had a cash balance of $772 million as of June 30, 2010.
As a result of the Committee’s determinations, each of the Named Executive Officers received as bonus award payments in August 2010 the amounts reported in the Summary Compensation Table under “Non-Equity Incentive Plan Compensation.” These amounts represent the following percentages of the Named Executive Officers’ respective base salaries on June 30, 2010: 162.50% for each of Messrs. Berce and Choate and 121.875% for each of Messrs. Bowman, Birch and Mock.
Long-Term Incentive Compensation
We believe that long-term incentives are a significant element of total executive officer compensation. These incentives are designed to motivate executive officers to make decisions in support of long-term financial interests while also serving as the primary tool for retention. We also believe that a significant portion of compensation should be contingent on delivery of value to all shareholders. Long-term compensation is an incentive tool that management and the Committee use to align the financial interests of officers to the creation of sustained shareholder value.
For fiscal 2010, the Committee, in light of the long-term incentive awards granted in fiscal 2009, decided to postpone making annual long-term incentive awards.
Other Arrangements, Policies and Practices Related to Our Executive Compensation Program
Employment Agreements
We have employment agreements with each of Messrs. Berce, Choate, Bowman, Birch and Mock. For further discussion of these agreements, refer to “Executive Employment Agreements” below.
Retirement and Other Benefits
We do not maintain a defined benefit retirement program or any supplemental executive retirement plan (“SERP”). Instead, the Named Executive Officers and all of our other employees are eligible to participate in a 401(k) Plan. The Named Executive Officers and certain other officers can also participate in a non-qualified deferred compensation plan.
106
Table of Contents
401(k). We maintain a 401(k) plan for all employees. The 401(k) plan is a tax-qualified savings plan pursuant to which all employees, including the Named Executive Officers can contribute a portion of their annual salary on a pre-tax basis to the 401(k) up to certain limits prescribed by the Internal Revenue Service. All employee contributions to the 401(k) plan are fully vested upon contribution. Employees may select from among several mutual funds when investing their 401(k) account funds. In fiscal 2010, we matched 100% of the first 3% of contributed pay, and matching contributions were paid in cash.
Non-Qualified Deferred Compensation Plan. On October 22, 2004, the American Jobs Creation Act of 2004 was signed into law, changing the tax rules applicable to non-qualified deferred compensation arrangements. We believe we are operating in good faith compliance with Section 409A of the IRC, which went into effect January 1, 2005. A more detailed discussion of our non-qualified deferred compensation arrangements is provided under the heading “Non-Qualified Deferred Compensation.”
Stock Ownership Guidelines for Executive Officers
The Board of Directors has adopted stock ownership guidelines that are designed to encourage the accumulation of our stock within a reasonable time from the date of hire or promotion by its executive officers and to further align executive officers’ interests with those of our shareholders. The guidelines require that certain executive officers, depending on their position, achieve a level of direct stock ownership with a valuation equal to a multiple of their base salary as set forth below; provided, however, that notwithstanding the valuation of our shares at any given measurement date, the executive officers are not required to own a greater number of shares than reflected in the “Minimum Number of Shares To Be Directly Owned” column set forth below:
| Position |
Base Salary Multiple |
Minimum Number of Shares To Be Directly Owned | ||
| Chairman, Chief Executive Officer and President |
4X | 150,000 | ||
| Chief Financial Officer and Chief Credit and Risk Officer |
3X | 60,000 |
These guidelines are subject to periodic review to ensure that the levels are appropriate. Shares of our stock directly owned by an executive officer and shares owned by an executive officer through our 401(k) and employee stock purchase plan constitute qualifying ownership. Restricted stock units or restricted shares that have vested would also qualify. Stock options or stock appreciation rights are not counted towards compliance with the guidelines. The Committee will review the progress of each executive officer toward compliance with the guidelines and, in the event an officer is not making satisfactory progress, the Committee may reduce prospective equity incentive grants to such officer. Presently, all required executive officers (namely, Messrs. Morris, Berce, Choate and Bowman) own more than the minimum number of shares necessary to comply with the stock ownership guidelines.
Perquisites and Personal Benefits
We provide various personal benefits to our Named Executive Officers which are generally provided by other companies and become an expected component of the overall remuneration for executive talent, including:
| • | Personal use of our aircraft – Mr. Berce is entitled to certain hours of use of our aircraft for personal reasons in accordance with our usage policy approved by the Board of Directors and pursuant to a signed dry lease agreement which is governed by FAA regulations. For each flight in excess of the allocated personal use flight hours, Mr. Berce is required to reimburse us for operating costs associated with personal aircraft usage which are based on an hourly rate and include estimates for costs that are specifically defined by the FAA regulations pursuant to dry lease agreements. Personal use is treated as taxable compensation to Mr. Berce to the extent the Internal Revenue Service valuation of the personal aircraft usage exceeds the payments pursuant to the dry lease agreement. |
107
Table of Contents
| • | City club membership – provided to Mr. Berce for business dining purposes. Monthly dues are reimbursable, but expressly excluded are initiation fees, food service (unless business related) and general assessments. |
| • | Medical reimbursements – provided to Mr. Berce for an annual health check. |
| • | Accounting and legal services – provided to Mr. Berce for professional accounting and/or legal services rendered personally to him. |
| • | Additional life insurance policies – provided to the Named Executive Officers for executive term life insurance. In addition, the Committee has authorized us to reimburse Mr. Berce annually for the premium payments on a whole life insurance policy and the related federal income taxes. |
Personal benefit amounts are not considered annual salary for bonus purposes, deferred compensation purposes, 401(k) contribution purposes or employee stock purchase plan purposes.
Attributed costs of the personal benefits for the Named Executive Officers for the year ended June 30, 2010 are included in the “All Other Compensation” column of the Summary Compensation Table and the footnotes to that table.
Accounting and Tax Matters
Accounting and tax issues are explicitly considered in setting compensation policies, especially with regard to our choice of long-term incentive grants. In the past, we chose to grant RSUs due in part to the fixed plan accounting treatment prescribed by accounting standards for those awards. The expense per share granted is substantially fixed at grant although actual forfeitures that differ from estimates can cause adjustments. Our performance relative to the pre-set targets is reviewed each reporting period and any necessary adjustments are recorded through the income statement.
As part of its role, the Committee reviews and considers the deductibility of executive compensation under Section 162(m) of the IRC which provides that we may not deduct compensation of more than $1 million that is paid to certain individuals. This limitation does not apply to certain performance-based pay. The SEBP is designed to qualify awards under Section 162(m) of the IRC. The SEBP, under which executive officers’ short-term incentive-based cash awards are paid, was adopted by the Committee in August 2009, approved by the Board in August 2009 and approved by our shareholders at the 2009 Annual Meeting of Shareholders.
The Committee may, in certain situations, approve compensation that will not meet these deductibility requirements in order to ensure competitive levels of compensation for our executive officers.
COMPENSATION COMMITTEE REPORT
Our Compensation Committee has reviewed and discussed the Compensation Discussion and Analysis required by Item 402(b) of Regulation S-K with management and, based on such review and discussions, the Committee has recommended to the Board that the Compensation Discussion and Analysis be included in this Form 10-K.
| COMPENSATION COMMITTEE |
| DOUGLAS K. HIGGINS (CHAIRMAN) |
| JOHN R. CLAY |
| JAMES H. GREER |
| KENNETH H. JONES, JR. |
108
Table of Contents
Summary Compensation Table
The table below summarizes the total compensation paid or earned by each of the Named Executive Officers for the fiscal years shown.
| Name and Principal Position |
Fiscal Year |
Salary ($) |
Bonus ($) |
Restricted Stock Unit Awards ($)(2) |
SAR Awards ($) |
Phantom Stock Unit Awards ($)(2) |
Non-Equity Incentive Plan Compensation ($) |
Change in Pension Value and Non- Qualified Deferred Compensation Earnings ($) |
All
Other Compensation ($)(3) |
Total ($) | ||||||||||
| Daniel E. Berce |
2010 | 950,000 | 0 | 0 | 0 | 0 | 1,543,750 | 0 | 121,850 | 2,615,600 | ||||||||||
| President and Chief Executive Officer |
2009 | 950,000 | 0 | 1,452,000 | 0 | 1,452,000 | 475,000 | 0 | 115,423 | 4,444,423 | ||||||||||
| 2008 | 950,000 | 0 | 0 | 0 | 0 | 0 | 0 | 156,637 | 1,106,637 | |||||||||||
| Chris A. Choate |
2010 | 460,000 | 0 | 0 | 0 | 0 | 747,500 | 0 | 15,678 | 1,223,178 | ||||||||||
| Executive Vice President, Chief Financial Officer and Treasurer |
2009 | 460,000 | 0 | 1,089,000 | 0 | 1,089,000 | 172,500 | 0 | 10,880 | 2,821,380 | ||||||||||
| 2008 | 451,202 | 0 | 0 | 0 | 0 | 0 | 0 | 10,605 | 461,807 | |||||||||||
| Steven P. Bowman(1) |
2010 | 380,000 | 0 | 0 | 0 | 0 | 463,125 | 0 | 8,118 | 851,243 | ||||||||||
| Executive Vice President, Chief Credit and Risk Officer |
2009 | 380,000 | 0 | 726,000 | 0 | 726,000 | 142,500 | 0 | 11,076 | 1,985,576 | ||||||||||
| Kyle R. Birch(1) |
2010 | 350,000 | 0 | 0 | 0 | 0 | 426,563 | 0 | 8,114 | 784,677 | ||||||||||
| Executive Vice President, Dealer Services |
2009 | 346,629 | 0 | 726,000 | 0 | 726,000 | 87,500 | 0 | 11,073 | 1,897,202 | ||||||||||
| Brian S. Mock (1) |
2010 | 350,000 | 0 | 0 | 0 | 0 | 426,563 | 0 | 8,323 | 784,886 | ||||||||||
| Executive Vice President, Collections |
2009 | 346,631 | 0 | 726,000 | 0 | 726,000 | 87,500 | 0 | 11,323 | 1,897,454 | ||||||||||
| (1) | Messrs. Bowman, Birch and Mock were not Named Executive Officers in fiscal 2008. As permitted by regulations of the SEC, the table above includes the compensation for each of Messrs. Bowman, Birch and Mock only for the year in which they were one of our Named Executive Officers. |
| (2) | These columns represent the dollar amounts of the aggregate grant date fair value of performance-based RSUs and performance-based phantom stock units (“PSUs”) granted in those years. For RSUs, fair value is calculated using the closing price of our stock on the date of grant combined with the estimated level of grant that will ultimately be earned. If the maximum level of RSU grants were to be earned, grant date fair value would be $2,178,000 for Mr. Berce, $1,645,600 for Mr. Choate, and $1,089,000 for Messrs. Bowman, Birch and Mock. The actual value of the RSUs received is different from the accounting expense because the price of our stock at vest date may differ from the price at grant date. For PSUs, fair value is calculated using the lower of (i) our book value as of the last day of the fiscal year then ended or (ii) closing price of our stock on the date of grant combined with the estimated level of grant that will ultimately be earned. If the maximum level of PSU grants were to be earned, grant date fair value would be $2,178,000 for Mr. Berce, $1,645,600 for Mr. Choate, and $1,089,000 for Messrs. Bowman, Birch and Mock. |
| (3) | All other compensation consists of the following on a per executive basis for fiscal 2010: |
| Name |
Contribution to 401(k) Plan ($) |
Personal Use of Aircraft ($)(a) |
Accounting and Legal Services ($)(b) |
City Club Membership ($)(c) |
Medical Reimbursement ($)(d) |
Additional Life Insurance Policies ($)(e) |
Total ($) | |||||||
| Daniel E. Berce |
7,350 | 37,211 | 7,868 | 2,508 | 3,364 | 63,549 | 121,850 | |||||||
| Chris A. Choate |
7,350 | 7,798 | 0 | 0 | 0 | 530 | 15,678 | |||||||
| Steven P. Bowman |
7,350 | 0 | 0 | 0 | 0 | 768 | 8,118 | |||||||
| Kyle R. Birch |
7,350 | 0 | 0 | 0 | 0 | 764 | 8,114 | |||||||
| Brian S. Mock |
7,350 | 0 | 0 | 0 | 0 | 973 | 8,323 |
| (a) | The amounts represent the incremental cost of personal use of our aircraft to the extent not reimbursed by the executive. The cost includes the average cost of fuel used, direct costs incurred (such as flight planning services, pilot expenses and food) and an hourly charge for maintenance of the engines and airframe. Mr. Berce is entitled to certain hours of use of our aircraft for personal reasons in accordance with our usage policy approved by the Board of Directors and pursuant to a signed dry lease agreement which is governed by FAA regulations. For each flight in excess of the allocated personal use flight hours, Mr. Berce is required to reimburse us for operating costs associated with personal aircraft usage which are based on an hourly rate and include estimates for costs that are specifically defined by the FAA regulations pursuant to dry lease agreements. Personal use is treated as taxable compensation to the executive to the extent the Internal Revenue Service valuation of the personal aircraft usage exceeds the payments pursuant to the dry lease agreement. |
109
Table of Contents
| (b) | The amount represents payments to reimburse Mr. Berce for professional accounting and legal services. |
| (c) | The amount represents the monthly dues for a city club membership. |
| (d) | The amount represents payments to the executive for medical expenses which are not reimbursed to the executive by our health insurance plan. |
| (e) | The amounts disclosed in this column for fiscal 2010 include the payment of premiums for term life insurance on behalf of Mr. Berce, $1,190; Mr. Choate, $530; Mr. Bowman, $768; Mr. Birch, $764; and Mr. Mock, $973. In addition, the Compensation Committee has authorized us to reimburse Mr. Berce for the premium payments on a whole life insurance policy and the related federal income taxes. In fiscal 2010, this amount was $62,359. |
Grants of Plan-Based Award
The following table sets forth plan-based awards granted to our Named Executive Officers during the fiscal year ended June 30, 2010.
| Estimated Future Payouts Under Non-Equity Incentive Plan Awards(1) | ||||||||
| Name |
Grant Date(2) | Threshold ($) | Target ($) | Maximum ($) | ||||
| Daniel E. Berce |
08/6/2010 | 475,000 | 1,187,500 | 1,900,000 | ||||
| Chris A. Choate |
08/6/2010 | 230,000 | 575,000 | 920,000 | ||||
| Steven P. Bowman |
08/6/2010 | 142,500 | 356,250 | 570,000 | ||||
| Kyle R. Birch |
08/6/2010 | 131,250 | 328,125 | 525,000 | ||||
| Brian S. Mock |
08/6/2010 | 131,250 | 328,125 | 525,000 | ||||
| (1) | Amounts shown represent the range of performance-based annual incentive amounts achievable for fiscal 2010. For fiscal 2010, the specific performance levels were established by the Compensation Committee, in August 2009 at the threshold, target and maximum levels. Actual amounts earned in fiscal 2010 and paid in August 2010 are reflected in the Summary Compensation Table. See discussion under the section entitled “Compensation Discussion and Analysis – Short-Term Incentive–Based Cash Awards” above for further details on these awards. |
| (2) | Date on which non-equity incentive plan awards were paid to the Named Executive Officers. |
Outstanding Equity Awards at Fiscal Year-End
The following tables provide information as of June 30, 2010 concerning unexercised options, performance-based restricted stock units (“RSUs”) that have not vested and performance-based phantom stock units (“PSUs”) that have not vested.
| Option Awards | ||||||||||||
| Name |
Option Grant Date |
Number
of Securities Underlying Unexercised Options (#) Exercisable |
Number
of Securities Underlying Unexercised Options (#) Unexercisable |
Equity Incentive Plan Awards: Number of Securities Underlying Unexercised Unearned Options (#) |
Option Exercise Price ($) |
Option Expiration Date | ||||||
| Daniel E. Berce |
||||||||||||
| Chris A. Choate |
05/01/2001 | 12,800 | 0 | 0 | 45.27 | 05/01/2011 | ||||||
| 11/06/2001 | 31,100 | 0 | 0 | 16.10 | 11/06/2011 | |||||||
| Steven P. Bowman |
05/01/2001 | 12,800 | 0 | 0 | 45.27 | 05/01/2011 | ||||||
| 11/06/2001 | 31,100 | 0 | 0 | 16.10 | 11/06/2011 | |||||||
| Kyle R. Birch |
05/01/2001 | 5,800 | 0 | 0 | 45.27 | 05/01/2011 | ||||||
| Brian S. Mock |
04/11/2001 | 6,720 | 0 | 0 | 35.88 | 04/11/2011 | ||||||
110
Table of Contents
| Stock Awards | ||||||||||
| Name |
Grant Date | Number of Shares or Units of Stock That Have Not Vested (#) |
Market Value of Shares or Units of Stock That Have Not Vested ($) |
Equity Incentive Plan Awards: Number of Unearned Shares, Units or Other Rights That Have Not Vested (#)(1) |
Equity Incentive Plan Awards: Market or Payout Value of Unearned Shares, Units or Other Rights That Have Not Vested ($)(1)(2)(3) | |||||
| Daniel E. Berce |
04/28/2009 | 0 | 0 | 450,000 | 8,102,205 | |||||
| Chris A. Choate |
04/28/2009 | 0 | 0 | 340,000 | 6,121,700 | |||||
| Steven P. Bowman |
04/28/2009 | 0 | 0 | 225,000 | 4,051,125 | |||||
| Kyle R. Birch |
04/28/2009 | 0 | 0 | 225,000 | 4,051,125 | |||||
| Brian S. Mock |
04/28/2009 | 0 | 0 | 225,000 | 4,051,125 | |||||
| (1) | With respect to the April 28, 2009 grant, the stock awards listed include one half of the award in the form of RSUs and the other half of the award in the form of PSUs. Amounts shown represent value at the maximum level of RSUs and PSUs granted to the Named Executive Officers. Both the RSUs and the PSUs become earned at threshold to maximum levels based upon achievement of different levels of targeted book value per share at June 30, 2012; provided, however, that 33% of the threshold level of RSUs and PSUs will vest if our book value per share equals or exceeds $15.50 as of June 30, 2010; provided, further, that an additional 33% of the threshold level of RSUs and PSUs will vest if our book value per share equals or exceeds $15.50 as of June 30, 2011. The amount of RSUs and PSUs earned as of June 30, 2012 will be reduced by the total amount of RSUs and PSUs earned, if any, as of June 30, 2010 and 2011. For earned RSUs, the Named Executive Officer or other senior executive will receive a right to receive shares of Common Stock. For earned PSUs, the Named Executive Officer or other senior executive will receive a cash payment in an amount equal to the number of PSUs earned times the lower of (i) our book value as of the last day of the fiscal year then ended or (ii) the average closing price per share of Common Stock for the 20 consecutive trading days prior to and including the last day of the fiscal year then ended. Earned RSUs will be distributed and earned PSUs will be paid as soon as practicable following our filing of our Annual Report on Form 10-K for the years ended June 30, 2010, 2011 and 2012, as applicable. Our book value per share as of June 30, 2010 is $17.79. |
| (2) | The value shown is based on the closing price of our Common Stock on June 30, 2010 of $18.22 per share and book value at June 30, 2010 of $17.79. |
| (3) | In addition to the awards listed in the table, we made performance-based RSU grants to the Named Executive Officers on May 1, 2007 (the “2007 Grant”). During fiscal 2010, our performance relative to the pre-determined EPS targets in the 2007 Grant was reviewed each quarter. For fiscal 2010, due to our determination that the performance conditions in the 2007 Grant would not be met, we did not recognize any stock based compensation expense with respect to the RSUs allocated to the fiscal 2010 performance period and treated such RSUs as forfeited awards. |
111
Table of Contents
Option Exercises and Stock Vested Table
The following table provides information for the Named Executive Officers on (1) the aggregate stock options exercised during fiscal 2010, including the number of shares acquired on exercise and the value realized, and (2) the aggregate number of shares acquired upon the vesting of performance-based restricted stock units and the value realized.
| Option Awards | Stock Awards | |||||||
| Name |
Number of Shares Acquired on Exercise (#) |
Value Realized on Exercise ($)(1) |
Number of Shares Acquired on Exercise (#) |
Value Realized on Vesting ($) | ||||
| Daniel E. Berce |
0 | 0 | 0 | 0 | ||||
| Chris A. Choate(2) |
42,300 | 229,093 | 0 | 0 | ||||
| Steven P. Bowman(3) |
35,200 | 53,964 | 0 | 0 | ||||
| Kyle R. Birch(4) |
27,640 | 68,221 | 0 | 0 | ||||
| Brian S. Mock |
0 | 0 | 0 | 0 | ||||
| (1) | Values reflect the aggregate difference between the stock option exercise prices and the prices of our stock when the stock options were exercised and do not reflect the tax consequences of the exercise. |
| (2) | Mr. Choate exercised 23,000 stock options at an exercise price of $16.38. These stock options had an expiration date of February 3, 2010. Mr. Choate exercised 19,300 stock options at an exercise price of $18.13. These stock options had an expiration date of April 24, 2010. |
| (3) | Mr. Bowman exercised 35,200 stock options at an exercise price of $18.13. These stock options had an expiration date of April 24, 2010. |
| (4) | Mr. Birch exercised 6,200 stock options at an exercise price of $14.56. These stock options had an expiration date of September 21, 2009. Mr. Birch exercised 14,000 stock options at an exercise price of $16.10. These stock options had an expiration date of November 6, 2011. Mr. Birch exercised 7,440 stock options at an exercise price of $18.13. These stock options had an expiration date of April 24, 2010. |
Pension Benefits
We do not have a defined benefit pension plan for our employees and have not included a table disclosing the actuarial present value of each Named Executive Officer’s accumulated benefits under defined benefit pension plans, the number of years of credited service under each such plan and the amount of pension benefits paid to each Named Executive Officer during the year. We also do not have a SERP for our employees. The only retirement plans available to the Named Executive Officers were our qualified 401(k) plan, which is available to all employees and a non-qualified deferred compensation plan, which is available to certain officers. The non-qualified deferred compensation plan is described in “Compensation Discussion and Analysis – Retirement and Other Benefits” and in the “Non-Qualified Deferred Compensation” section, which follows.
112
Table of Contents
Non-Qualified Deferred Compensation
We sponsor a non-qualified deferred compensation plan. The Deferred Compensation Plan II (“DCP II”) is a voluntary non-qualified deferred compensation plan. Compensation eligible to be deferred into the DCP II includes base annual salary and cash payments under the Amended and Restated Senior Executive Bonus Plan (“SEBP”). The DCP II is a successor plan to our Deferred Compensation Plan (the “DCP,” and together with DCP II, the “DCP Plans”), which was frozen on December 31, 2004.
The following table shows the contributions, earnings and account balances for the Named Executive Officers participating in our sponsored non-qualified deferred compensation program:
| Name |
Executive Contributions in Last Fiscal Year ($)(1) |
Registrant Contributions in Last Fiscal Year ($) |
Aggregate Earnings in Last Fiscal Year ($)(2) |
Aggregate Withdrawals/ Distributions ($)(3) |
Aggregate Balance at Last Fiscal Year-End ($) | ||||||
| Daniel E. Berce |
0 | 0 | 25,828 | 0 | 291,203 | ||||||
| Chris A. Choate |
0 | 0 | 178,453 | 0 | 1,071,898 | ||||||
| Steven P. Bowman |
0 | 0 | (13,766 | ) | 0 | 287,553 | |||||
| Kyle R. Birch |
0 | 0 | 0 | 0 | 0 | ||||||
| Brian S. Mock |
159,933 | 0 | 38,726 | 50,632 | 228,383 |
| (1) | For Mr. Mock, the contributions were from fiscal 2010 base salary and SEBP and are included in the Summary Compensation Table under “Salary” and “SEBP.” |
| (2) | The aggregate earnings reflect dividends and investment gains and losses on the DCP funds and/or DCP II funds as selected by Messrs. Berce, Choate, Bowman and Mock and are not included in the Summary Compensation Table. |
| (3) | Amounts shown reflect a distribution from the DCP II. |
Deferred Compensation Plan II
DCP II was adopted by the Compensation Committee effective on January 1, 2005, and is the successor plan to the DCP, which was frozen effective December 31, 2004. The DCP II has participation and distribution provisions intended to comply with the regulations issued under Section 409A of the IRC. Participants’ accounts in the legacy DCP continue to be credited with earnings on the same basis as accounts in the DCP II.
Participants may voluntarily elect to participate in the DCP II. Participation is open to vice presidents and above. For fiscal 2010, approximately 75 employees were eligible to participate in DCP II. Of the Named Executive Officers, Mr. Mock participated in the program in fiscal 2010.
Participants may elect to defer into the DCP II up to 100% of their base annual salary and up to 100% of their annual SEBP payment. An election to participate is valid for only one calendar year. Participants are always fully vested in the amounts credited to their accounts in the DCP II. We currently do not make and have not made any contributions to the participants’ accounts under the DCP Plans.
We compute deemed investment gain or loss under the different investment funds based on the actual investment performance of the funds selected by the participants. Participants in the DCP II have the option to direct their individual deferrals among 25 different investment funds made available by the plan. Distributions under the DCP II may be made to executives according to their respective elected schedule for distribution, or upon termination of employment, change of control, or certain other events.
The DCP II is a successor plan to the DCP, which was frozen on December 31, 2004. No additional participants are permitted to enter the DCP and no compensation is taken into account after this date. Messrs. Berce, Choate, Bowman and Mock were previous participants in the DCP and, as such, returns on these investments are reported for fiscal 2010. Participants in the DCP have the option to direct their individual deferrals among 25 different investment funds made available by the plan.
113
Table of Contents
Employees who elect to participate in DCP II must also make a distribution election at the same time they select their level of participation. Separate elections as to timing and form of payment can be made for separations from service due to retirement, disability or death. The participant can elect the time payments start – in a particular year or some designated fixed number of years following the separation from service. The participant may also elect from one to ten annual payments. Distributions under the DCP Plans are subject to ordinary income taxes.
The DCP Plans are not directly supported by our assets. Amounts paid under these plans are paid from our general corporate funds, and each participant and his or her beneficiaries are unsecured general creditors of us with no special or prior right to any of our assets for payment of any obligation.
Executive Employment Agreements
We have entered into employment agreements with each of Messrs. Berce, Choate, Bowman, Birch and Mock that provide for, among other things, the term of employment, compensation and benefits payable during the term of the agreement as well as for specified payments in case of termination of employment. In each case, the agreement provides that the Named Executive Officer will participate in all compensation and benefit programs made available to all executive officers. The terms and conditions of each employment agreement were negotiated between us and the respective Named Executive Officer. We believe that the terms and conditions of the employment agreements are appropriate in order to retain the Named Executive Officers. On April 27, 2010, the Compensation Committee approved amended and restated employment agreements for Messrs. Berce, Choate, Bowman, Birch and Mock and other executive team members primarily to ensure that post-employment payments and benefits under the agreements comply with the regulations issued under Section 409A of the IRC, a section of the IRC that governs certain deferred compensation and severance arrangements. These employment agreements, as amended and restated in fiscal 2010, contain terms that renew annually for successive three year periods (five years in the case of Mr. Berce).
The descriptions that follow are qualified in their entirety with respect to the employment agreements for Messrs. Berce, Choate, Bowman, Birch and Mock, which have been included as exhibits to our Quarterly Report on Form 10-Q for the period ended March 31, 2010, as filed with the SEC on May 7, 2010.
The employments agreements for the Named Executive Officers provide for base salaries which may be increased by the Compensation Committee in its sole discretion and the right to participate in bonus and other compensation and benefit arrangements. As of June 30, 2010, the base salaries for Messrs. Berce, Choate, Bowman, Birch and Mock were $950,000, $460,000, $380,000, $350,000 and $350,000, respectively.
In the event of termination of employment due to the Named Executive Officer’s voluntary termination or in the event of termination by us for due cause, the Named Executive Officer will be entitled to receive his pro rata base salary plus all earned and vested bonuses through the date of termination. “Due cause” includes intentional misapplication of funds, conviction of a crime involving moral turpitude, use or possession of any controlled substance or abuse of alcoholic beverages, violation of his obligations under the employment agreement and willful and deliberate malfeasance or gross negligence in performance of his duties. In the event of termination of employment due to disability or death, Mr. Berce or his estate will be entitled to receive his base salary for one year (six months for Messrs. Choate, Bowman, Birch and Mock) following the date of termination.
In the event of termination by us without cause, the employment agreement for Mr. Berce provide that he will be entitled to receive the remainder of his current fiscal year’s salary (undiscounted) plus the discounted present value (employing an interest rate of 8%) of two additional years’ salary. Under the employment agreement for Mr. Berce, “salary” means the highest base salary paid to him in any of the seven fiscal years preceding the year in which a termination without cause occurs plus the highest annual cash bonus or other cash incentive compensation earned by him under a performance based award granted under the Senior Executive Bonus Plan (including any successor plans) in any of the seven fiscal years preceding the year in which a
114
Table of Contents
termination without cause occurs. In the event of termination by us without cause, the employment agreements for Messrs. Choate, Bowman, Birch and Mock provide that the executive will be entitled to receive an amount equal to his current years base salary (undiscounted).
In the event of a change of control and the subsequent termination of the executive without due cause or voluntary termination by the executive during the twelve (12) months following the change of control, Messrs. Berce, Choate, Bowman, Birch and Mock would be entitled to receive termination payments. For Mr. Berce, termination payments consist of the remainder of his current fiscal year’s salary (undiscounted) plus the discounted present value (employing an interest rate of 8%) of two additional years’ salary. For Messrs. Choate, Bowman, Birch and Mock, termination payments consist of one year’s salary (undiscounted) plus the discounted present value (employing an interest rate of 8%) of two additional years’ salary. Under the employment agreements for Mr. Berce, “salary” means the highest base salary paid to such executive in any of the seven fiscal years preceding the year in which a change of control occurs plus the highest annual cash bonus or other cash incentive compensation earned by him under the Senior Executive Bonus Plan (including any successor plans) in any of the seven fiscal years preceding the year in which a change of control occurs. Under the employment agreements for Messrs. Choate, Bowman, Birch and Mock, “salary” means the base salary paid to such executive prior to the change of control plus the average annual cash bonuses or other cash incentive compensation earned by him under the Senior Executive Bonus Plan (including any successor plans) for the three fiscal years immediately preceding the year in which a change of control occurs.
Under the employment agreements for the Named Executive Officers, a change of control would occur upon any of the following:
| • | on the date that any one person, or more than one person acting as a group, acquires ownership of our stock that, together with stock held by such person or group, constitutes more than 50% of the total fair market value or total voting power of our stock; |
| • | on the date that a majority of the members of our Board of Directors is replaced during any 12-month period by directors whose appointment or election is not endorsed by a majority of the members of our Board of Directors prior to the date of the appointment or election; or |
| • | on the date any one person, or more than one person acting as a group acquires (or has acquired during the 12-month period ending on the date of the most recent acquisition by such person or persons) our assets that have a total gross fair market value equal to or more than 40% of the total gross fair market value of all of our assets immediately prior to such acquisition or acquisitions. |
The employment agreements for the Named Executive Officers have incorporated language requiring compliance with Section 409A of the IRC which could result in delays of the payments discussed above.
Included in the employment agreements for the Named Executive Officers is a covenant of the employee not to compete with us during the term of his employment and for a period of three years from the date on which he ceased to be employed as a result of a termination for due cause, termination of his employment by us at any time for any reason whatsoever, even without due cause, or voluntary termination unless such voluntary termination occurs within twelve months after a change of control.
115
Table of Contents
Potential Payment upon Termination or Change of Control
The following tables show potential payments to the Named Executive Officers under the existing agreements, plans or arrangements for various scenarios involving a termination of employment or change of control, assuming a June 30, 2010 termination date and, where applicable, using the closing price of our Common Stock of $18.22 (as reported on the New York Stock Exchange as of June 30, 2010).
Daniel E. Berce
| Executive Benefits and Payments Upon as of June 30, 2010 |
Voluntary Termination/ Termination for Due Cause ($) |
Involuntary Not for Due Cause Termination ($) |
Change of Control ($) |
Disability ($) |
Death ($) | |||||
| Compensation: |
||||||||||
| Salary (Base Salary and Bonus) |
0 | 4,717,984 | 4,717,984 | 950,000 | 950,000 | |||||
| Long Term Incentives |
||||||||||
| Fiscal 2006 RSU Award |
0 | 0 | 631,268 | 631,268 | 631,268 | |||||
| Fiscal 2007 RSU Award |
0 | 0 | 734,464 | 734,464 | 734,464 | |||||
| Fiscal 2009 RSU/PSU Award |
0 | 0 | 5,400,000 | 5,400,000 | 5,400,000 | |||||
| Other Benefits: |
||||||||||
| Disability Insurance Benefits |
0 | 0 | 0 | 988,849 | 0 | |||||
| Life Insurance Proceeds |
0 | 0 | 0 | 0 | 550,000 | |||||
| Total: |
0 | 4,717,984 | 11,483,716 | 8,704,581 | 8,265,732 |
Chris A. Choate
| Executive Benefits and Payments Upon as of June 30, 2010 |
Voluntary Termination/ Termination for Due Cause ($) |
Involuntary Not for Due Cause Termination ($) |
Change of Control ($) |
Disability ($) |
Death ($) | ||||||
| Compensation: |
|||||||||||
| Salary (Base Salary and Bonus) |
0 | 1,897,804 | 1,897,804 | 230,000 | 230,000 | ||||||
| Long Term Incentives |
|||||||||||
| Fiscal 2006 RSU Award |
0 | 0 | 315,634 | 315,634 | 315,634 | ||||||
| Fiscal 2007 RSU Award |
0 | 0 | 364,200 | 364,200 | 364,200 | ||||||
| Fiscal 2009 RSU/PSU Award |
0 | 0 | 2,893,730 | (1) | 4,050,000 | 4,050,000 | |||||
| Other Benefits: |
|||||||||||
| Disability Insurance Benefits |
0 | 0 | 0 | 2,098,849 | 0 | ||||||
| Life Insurance Proceeds |
0 | 0 | 0 | 0 | 550,000 | ||||||
| Total: |
0 | 1,897,804 | 5,471,368 | 7,058,683 | 5,509,834 |
| (1) | Equity plan limitation due to Section 280G. |
116
Table of Contents
Steven P. Bowman
| Executive Benefits and Payments Upon as of June 30, 2010 |
Voluntary Termination/ Termination for Due Cause ($) |
Involuntary Not for Due Cause Termination ($) |
Change of Control ($) |
Disability ($) |
Death ($) | ||||||
| Compensation: |
|||||||||||
| Salary (Base Salary and Bonus) |
0 | 1,581,788 | 1,581,788 | 190,000 | 190,000 | ||||||
| Long Term Incentives |
|||||||||||
| Fiscal 2006 RSU Award |
0 | 0 | 315,634 | 315,634 | 315,634 | ||||||
| Fiscal 2007 RSU Award |
0 | 0 | 364,200 | 364,200 | 364,200 | ||||||
| Fiscal 2009 RSU/PSU Award |
0 | 0 | 2,501,302 | (1) | 2,700,000 | 2,700,000 | |||||
| Other Benefits: |
|||||||||||
| Disability Insurance Benefits |
0 | 0 | 0 | 2,618,849 | 0 | ||||||
| Life Insurance Proceeds |
0 | 0 | 0 | 0 | 550,000 | ||||||
| Total: |
0 | 1,581,788 | 4,762,924 | 6,188,683 | 4,119,834 |
| (1) | Equity plan limitation due to Section 280G. |
Kyle R. Birch
| Executive Benefits and Payments Upon as of June 30, 2010 |
Voluntary Termination/ Termination for Due Cause ($) |
Involuntary Not for Due Cause Termination ($) |
Change of Control ($) |
Disability ($) |
Death ($) | ||||||
| Compensation: |
|||||||||||
| Salary (Base Salary and Bonus) |
0 | 1,244,650 | 1,244,650 | 175,000 | 175,000 | ||||||
| Long Term Incentives |
|||||||||||
| Fiscal 2006 RSU Award |
0 | 0 | 109,260 | 109,260 | 109,260 | ||||||
| Fiscal 2007 RSU Award |
0 | 0 | 127,470 | 127,470 | 127,470 | ||||||
| Fiscal 2009 RSU/PSU Award |
0 | 0 | 1,651,320 | (1) | 2,700,000 | 2,700,000 | |||||
| Other Benefits: |
|||||||||||
| Disability Insurance Benefits |
0 | 0 | 0 | 1,822,749 | 0 | ||||||
| Life Insurance Proceeds |
0 | 0 | 0 | 0 | 350,000 | ||||||
| Total: |
0 | 1,244,650 | 3,132,700 | 4,934,479 | 3,461,730 |
| (1) | Equity plan limitation due to Section 280G. |
Brian S. Mock
| Executive Benefits and Payments Upon as of June 30, 2010 |
Voluntary Termination/ Termination for Due Cause ($) |
Involuntary Not for Due Cause Termination ($) |
Change of Control ($) |
Disability ($) |
Death ($) | ||||||
| Compensation: |
|||||||||||
| Salary (Base Salary and Bonus) |
0 | 1,239,067 | 1,239,067 | 175,000 | 175,000 | ||||||
| Long Term Incentives |
|||||||||||
| Fiscal 2006 RSU Award |
0 | 0 | 109,260 | 109,260 | 109,260 | ||||||
| Fiscal 2007 RSU Award |
0 | 0 | 127,470 | 127,470 | 127,470 | ||||||
| Fiscal 2009 RSU/PSU Award |
0 | 0 | 2,155,902 | (1) | 2,700,000 | 2,700,000 | |||||
| Other Benefits: |
|||||||||||
| Disability Insurance Benefits |
0 | 0 | 0 | 2,362,749 | 0 | ||||||
| Life Insurance Proceeds |
0 | 0 | 0 | 0 | 350,000 | ||||||
| Total: |
0 | 1,239,067 | 3,631,699 | 5,474,479 | 3,461,730 |
| (1) | Equity plan limitation due to Section 280G |
117
Table of Contents
Below is a description of the assumptions that were used in creating the tables above.
Salary
The amounts of these elements of compensation are governed by the employment agreements. See “Executive Employment Agreements” herein above. In addition, the meaning of “change of control” as used in the tables is set forth in the employment agreements.
Long-Term Incentives
The amounts pertaining to the performance-based RSUs and performance-based PSUs are governed by the terms of their respective awards.
The tables provide values for the (i) RSUs allocated to the 2010 performance period for the May 1, 2007 grant (the “Fiscal 2007 Grant”); and (ii) RSUs and PSUs allocated to the book value targets for the April 28, 2009 grant (the “Fiscal 2009 Grant”) which would become, in whole or in part, vested upon the termination events shown in the tables above. For the Fiscal 2007 Grant, the RSUs vest 100% upon a change of control, disability or death and are paid at the maximum level. For the Fiscal 2009 Grant, the RSUs and PSUs vest 100% upon a change of control, disability or death and are paid at the target level. For the Fiscal 2007 Grant and the Fiscal 2009 Grant, upon termination of the Named Executive Officer’s employment for any reason as of June 30, 2010, any unvested RSUs and PSUs subject to the award are forfeited; provided, however, for the Fiscal 2009 Grant, if the Named Executive Officer is terminated (other than for cause) during fiscal 2010, 2011 or 2012, the Named Executive Officer will remain eligible to earn a percentage of the RSUs and PSUs under a payout matrix based upon the date of termination. Additionally, for the Fiscal 2009 Grant, if a change of control occurs after the termination of a Named Executive Officer during fiscal 2010, 2011 or 2012 but prior to June 30, 2012, the Named Executive Officer will receive, based on the fiscal year in which his termination occurred, a percentage of the target level of RSUs and PSUs that vest on the closing date of such change of control.
The values are calculated by multiplying the unvested amounts of the RSUs by $18.22, the closing market price of our stock on June 30, 2010 less the amount to be paid by the executive of $0.01 per share and multiplying the unvested amounts of the PSUs by $17.79, our book value at June 30, 2010. The amounts also include vested RSUs from the May 31, 2006 grant that were mandatorily deferred.
Other Benefits
The amounts of Disability Insurance Benefits are based upon disability payments the Named Executive Officer would receive if he remained disabled for the maximum period covered by third-party insurance policies.
The amounts of the Life Insurance Proceeds are based upon life insurance policies provided by us.
The non-qualified deferred compensation amounts are fully vested at all times and are governed by the distribution elections made by the executives.
Section 280G
If (a) there is a change of control or in the ownership of a substantial portion of our assets (within the meaning of Section 280G(b)(2)(A) of the IRC) and (b) the payments otherwise to be made pursuant to the employment agreements, equity-based compensation agreements and any other payments or benefits otherwise to be paid to Named Executive Officer in the nature of compensation or received by or for the benefit of the Named Executive Officer and contingent upon such event (the “Termination Payments”) would create an “excess parachute payment” within the meaning of Section 280G, then (i) in the case of the employment agreements, we will make the Termination Payments in substantially equal installments, such that the aggregate present value of
118
Table of Contents
all Termination Payments, will be as close as possible to, but not exceed, 299% of the Named Executive Officer’s base amount, within the meaning of Section 280G; and (ii) in the case of the equity-based compensation agreements, unvested equity grants, which would otherwise be accelerated, would not be accelerated such that the total compensation would not exceed 299% of the Named Executive Officer’s base amount, within the meaning of Section 280G.
As a result of the provisions of Section 280G, if a change of control occurred as of June 30, 2010, a portion of the unvested equity grants of Messrs. Choate, Bowman, Birch and Mock, which would have otherwise been accelerated, would not be accelerated. The value of these lost equity awards are $1,156,270 for Mr. Choate; $198,698 for Mr. Bowman; $1,048,680 for Mr. Birch; and $544,098 for Mr. Mock. Mr. Berce would not have any lost equity value in connection with acceleration upon a change of control as of June 30, 2010.
119
Table of Contents
| ITEM 12. | SECURITY OWNERSHIP OF CERTAIN BENEFICIAL OWNERS AND MANAGEMENT |
PRINCIPAL SHAREHOLDERS AND STOCK OWNERSHIP OF MANAGEMENT
The following table and the notes thereto set forth certain information regarding the beneficial ownership of our Common Stock as of August 26, 2010, by (1) each current director; (2) our Chief Executive Officer and each of our other four Named Executive Officers; (3) all of our present executive officers and directors as a group; and (4) each other person known to us to own beneficially more than five percent of our presently outstanding Common Stock.
| Name and Address of the Beneficial Owner(1) |
Shares of Common Stock Beneficially Owned(2) |
Percent of
Class Beneficially Owned(3) |
||||
| Leucadia National Corporation 315 Park Avenue South New York, New York 10010 |
33,900,440 | (4) | 25.04 | % | ||
| Fairholme Capital Management, L.L.C. 4400 Biscayne Boulevard, 9th Floor Miami, Florida 33137 |
24,811,327 | (5) | 18.33 | % | ||
| Fairholme Funds, Inc. |
||||||
| Bruce R. Berkowitz |
||||||
| Columbia Wanger Asset Management, L.P. 227 West Monroe, Suite 3000 Chicago, Illinois 60606 |
9,998,100 | (6) | 7.38 | % | ||
| Clifton H. Morris, Jr. |
986,772 | (7) | * | |||
| Daniel E. Berce |
628,495 | (8) | * | |||
| John R. Clay |
100,500 | (9) | * | |||
| Ian M. Cumming |
21,700 | (10) | * | |||
| A.R. Dike |
141,800 | (11) | * | |||
| James H. Greer |
310,504 | (12) | * | |||
| Douglas K. Higgins |
284,500 | (13) | * | |||
| Kenneth H. Jones, Jr. |
170,500 | (14) | * | |||
| Robert B. Sturges |
2,100 | (15) | * | |||
| Justin R. Wheeler |
21,700 | (16) | * | |||
| Chris A. Choate |
174,454 | (17) | * | |||
| Steven P. Bowman |
109,684 | (18) | * | |||
| Kyle R. Birch |
18,925 | (19) | * | |||
| Brian S. Mock |
13,891 | (20) | * | |||
| All Current Directors and Executive Officers as a Group (17 Persons) |
3,026,526 | (21) | 2.22 | % | ||
| * | Less than 1%. |
| (1) | Unless otherwise noted, the address for the beneficial owners listed in this table is c/o AmeriCredit Corp., 801 Cherry Suite 3500, Fort Worth, Texas 76102. |
| (2) | To AmeriCredit’s knowledge, except as otherwise indicated, the persons named in the table have sole voting and investment power with respect to all shares of common stock shown as beneficially owned by them. |
| (3) | Based on 135,390,408 shares of AmeriCredit’s common stock issued and outstanding as of August 26, 2010. |
120
Table of Contents
| (4) | Based on the Shareholder Support and Voting Agreement, dated as of July 21, 2010, by and among General Motors Holdings LLC, Goalie Texas Holdco Inc., Leucadia National Corporation (“Leucadia”), Phlcorp, Inc. (“Phlcorp”), Baldwin Enterprises, Inc. (“Baldwin”), BEI Arch Holdings, LLC (“BEI Arch”) and BEI-Longhorn LLC (BEI-Longhorn”), attached as an exhibit to the Form 8-K filed with the SEC on July 26, 2010. The indicated interest reflects 33,900,400 shares directly owned by BEI-Longhorn and indirectly owned by BEI Arch, Baldwin, Phlcorp and Leucadia. BEI-Longhorn is a wholly-owned subsidiary of BEI Arch, BEI Arch is a wholly-owned subsidiary of Baldwin, Baldwin is a wholly-owned subsidiary of Phlcorp and Phlcorp is a wholly-owned subsidiary of Leucadia. |
| (5) | Pursuant to a Schedule 13D filed on or about July 21, 2010, the indicated interests reflects 24,811,327 shares held jointly by Fairholme Capital Management, L.L.C., Fairholme Funds, Inc. and Mr. Berkowitz and includes 102,552 shares owned directly by Mr. Berkowitz. Mr. Berkowitz is Managing Member of Fairholme Capital Management, L.L.C. and President of Fairholme Funds, Inc. Mr. Berkowitz is deemed to have beneficial ownership of these shares because he holds voting and dispositive power over all shares beneficially owned by Fairholme Capital Management, L.L.C. and Fairholme Funds, Inc. |
| (6) | Pursuant to a Schedule 13F filed on or about August 4, 2010, Columbia Wanger Asset Management, L.P. reports holding an aggregate of 9,998,100 shares. |
| (7) | This amount includes 34,666 shares subject to vested performance-based RSUs that are mandatorily deferred. This amount also includes 44,608 shares of Common Stock in the name of Sheridan C. Morris, Mr. Morris’ wife. |
| (8) | This amount includes 34,666 shares subject to vested performance-based RSUs that are mandatorily deferred. |
| (9) | This amount includes 100,500 shares subject to stock options that are currently exercisable or exercisable within 60 days and vested RSUs that are mandatorily deferred. |
| (10) | This amount includes 21,700 vested RSUs that are mandatorily deferred and excludes shares held by Leucadia as to which Mr. Cumming disclaims beneficial ownership. |
| (11) | This amount includes 100,500 shares subject to stock options that are currently exercisable or exercisable within 60 days and vested RSUs that are mandatorily deferred. This amount also includes 6,000 shares of Common Stock held in the name of Sara B. Dike, Mr. Dike’s wife. |
| (12) | This amount includes 160,500 shares subject to stock options that are currently exercisable or exercisable within 60 days and vested RSUs that are mandatorily deferred. |
| (13) | This amount includes 160,500 shares subject to stock options that are currently exercisable or exercisable within 60 days and vested RSUs that are mandatorily deferred. This amount does not include 20,000 shares held in trust for the benefit of certain family members of Mr. Higgins, as to which Mr. Higgins disclaims any beneficial ownership. |
| (14) | This amount includes 120,500 shares subject to stock options that are currently exercisable or exercisable within 60 days and vested RSUs that are mandatorily deferred. |
| (15) | This amount includes 2,100 vested RSUs that are mandatorily deferred. |
| (16) | This amount includes 21,700 vested RSUs that are mandatorily deferred. |
| (17) | This amount includes 61,233 shares subject to stock options that are currently exercisable or exercisable within 60 days and vested performance-based RSUs that are mandatorily deferred. |
| (18) | This amount includes 61,233 shares subject to stock options that are currently exercisable or exercisable within 60 days and vested performance-based RSUs that are mandatorily deferred. |
| (19) | This amount includes 11,800 shares subject to stock options that are currently exercisable or exercisable within 60 days and vested performance-based RSUs that are mandatorily deferred. |
| (20) | This amount includes 12,720 shares subject to stock options that are currently exercisable or exercisable within 60 days and vested performance-based RSUs that are mandatorily deferred. |
| (21) | This amount includes (i) directly owned shares with sole voting and dispositive power, (ii) shares subject to stock options that are currently exercisable or exercisable within 60 days, (iii) vested RSUs that are mandatorily deferred and (iv) vested performance-based RSUs that are mandatorily deferred. This amount excludes shares held by Leucadia (but does include shares directly owned by Messrs. Cumming and Wheeler, described in footnotes 10 and 16 above, respectively). This amount also excludes performance-based RSUs granted on April 28, 2009 to Messrs. Morris, Berce, Choate, Bowman, Birch, Mock and three |
121
Table of Contents
| other senior executives. The performance-based RSUs become earned at threshold, target and maximum levels based upon achievement of different levels of targeted book value per share at June 30, 2012; provided, however, that 33% of the threshold level of performance-based RSUs will vest if our book value per share equals or exceeds $15.50 as of June 30, 2010; provided, further, that an additional 33% of the threshold level of performance-based RSUs will vest if our book value per share equals or exceeds $15.50 as of June 30, 2011. The amount of performance-based RSUs earned as of June 30, 2012 will be reduced by the total amount of performance-based RSUs earned, if any, as of June 30, 2010 and 2011. Our book value per share exceeded $15.50 as of June, 30, 2010. Accordingly, 33% of the threshold level of performance-based RSUs will be distributed as soon as practicable following our filing of our Annual Report on Form 10-K for the year ended June 30, 2010. This amount also excludes unvested RSUs granted under the Non-Employee Director Compensation Plan for Fiscal 2010 to Messrs. Clay, Cumming, Dike, Greer, Higgins, Jones, Wheeler and Sturges. |
| ITEM 13. | CERTAIN RELATIONSHIPS, RELATED TRANSACTIONS AND DIRECTOR INDEPENDENCE |
When customers default on automobile loans, we maintain the services of qualified independent contractors for the recovery and repossession of the financed vehicles. We use the services of more than 250 different independent contractors. During fiscal 2010, we engaged three vehicle recovery and repossession companies controlled by Clifton H. Morris, III, an adult son of Mr. Clifton H. Morris, Jr., our Chairman of the Board. A per vehicle payment is made pursuant to a fee schedule submitted by these three companies for each recovery, repossession or other service performed. We consider the fees charged by these companies to be competitive and reasonable. During fiscal 2010, payments by us to these three companies totaled $283,280.
On March 4, 2008, we entered into a standstill letter agreement with Leucadia National Corporation (“Leucadia”) regarding their ownership of our Common Stock. On December 12, 2008, we and Leucadia entered into an amended and restated standstill letter agreement (as amended and restated, the “Leucadia Agreement”). The Leucadia Agreement provides that Leucadia will not acquire more than 29.9% of our outstanding Common Stock, subject to certain exceptions, and will forebear from taking actions concerning business combinations with us or concerning the composition of our Board of Directors, without the approval of a majority of the directors not affiliated with Leucadia. Under the terms of the Leucadia Agreement, we agreed to create two additional director positions on our Board of Directors and to elect two representatives designated by Leucadia to fill the two new positions. Also on March 4, 2008, our Board of Directors amended its Bylaws, created two new director positions and elected Ian M. Cumming and Justin R. Wheeler to fill those positions. Mr. Wheeler was elected for a term expiring in 2008, and Mr. Cumming was elected for a term expiring in 2009, pursuant to the provisions of the Leucadia Agreement. Both Mr. Cumming and Mr. Wheeler are officers of Leucadia and Mr. Cumming is Chairman of Leucadia’s Board of Directors. At the 2008 Annual Meeting of Shareholders, the shareholders elected Mr. Wheeler to serve as a director for a term expiring in 2011 and Mr. Cumming to serve as a director for a term expiring in 2009. At the 2009 Annual Meeting of Shareholders, the shareholders elected Mr. Cumming to serve as a director for a term expiring in 2012. We have also agreed to file one or more registration statements with the SEC regarding the shares owned by Leucadia, if requested by Leucadia and upon certain terms and conditions. We filed such a registration statement with the SEC on May 23, 2008. The Leucadia Agreement expired on March 3, 2010; however, the registration rights under the agreement survived.
On November 24, 2008, we and two of our subsidiaries, AmeriCredit Financial Services, Inc. and AFS SenSub Corp., entered into a letter agreement with Fairholme under which Fairholme agreed to purchase approximately $123 million of asset-backed securities rated below triple A (the “Subordinated Notes”) issued by the AmeriCredit Automobile Receivables Trust 2008-2 (the “Trust”) in a securitization transaction (the “Note Purchase Agreement”).
On November 26, 2008, we issued a Limited Guaranty to Wells Fargo Bank, National Association, as trust collateral agent under the indenture for the Trust for the benefit of the Subordinated Notes, as additional credit enhancement for the securitization transaction, in the aggregate amount not to exceed $50 million. Under the
122
Table of Contents
Limited Guaranty, we will guarantee the timely payment of interest on the Subordinated Notes, the payment of any outstanding principal balance on the Subordinated Notes on their final scheduled distribution date, and the Limited Guaranty may be drawn upon to ensure that certain over-collateralization requirements in the securitization are met.
On November 26, 2008, we entered into a registration rights agreement concerning the Subordinated Notes (the “Registration Rights Agreement”) with Fairholme. Under the Registration Rights Agreement, we agreed to promptly file a shelf registration statement with the SEC providing for the resale of the Subordinated Notes. We filed such a registration statement with the SEC on January 7, 2009.
On November 24, 2008, we entered into an exchange agreement with Fairholme under which we were obligated to issue to Fairholme 15,122,670 shares of our Common Stock in exchange (the “Exchange”) for a portion of our Senior Notes due 2015 (the “Notes”) held by Fairholme at a price of $840 per $1,000 principal amount of the Notes (the “Exchange Agreement”). Under the Exchange Agreement, the aggregate principal amount of the Notes exchanged for shares was determined based upon the lower of 120% of the ten-day average closing price of the Common Stock immediately prior to the closing of the Exchange, or $6.02. The Exchange Agreement also provides that Fairholme shall have certain pre-emptive rights regarding the proposed issuance of any Common Stock or securities exercisable or convertible into Common Stock or any other security with voting rights and Fairholme’s proportionate ownership of Common Stock, subject to certain exceptions. On December 12, 2008, we completed the Exchange, and we issued 15,122,670 shares of Common Stock in exchange for $108,380,000 in principal amount of the Notes held by Fairholme. We issued the shares on December 12, 2008, and the Notes exchanged for the shares pursuant to the Exchange Agreement were cancelled.
Also on December 12, 2008, we entered into a standstill letter agreement (the “Fairholme Agreement”) with Fairholme and Fairholme Capital Management, L.L.C. (on behalf of certain advisory accounts through which it may have beneficial ownership of our shares of Common Stock) regarding Fairholme’s and Fairholme Capital Management, L.L.C.’s ownership of our Common Stock. Under the terms of the Fairholme Agreement, we agreed to create one additional director position on its Board of Directors and to elect a representative designated by Fairholme and Fairholme Capital Management, L.L.C. We also agreed that we will not increase the size of our Board of Directors to more than ten, without the approval of both a majority of the directors unaffiliated with Fairholme’s and Fairholme Capital Management, L.L.C.’s designated director. These provisions will terminate if Fairholme and Fairholme Capital Management, L.L.C. subsequently sell or otherwise dispose of shares of Common Stock and as a result own collectively less than 20% of our outstanding Common Stock. The Fairholme Agreement expires on December 31, 2010, subject to certain events that would cause earlier termination of the restrictions on Fairholme’s and Fairholme Capital Management, L.L.C.’s ownership of our Common Stock, including such earlier time as Fairholme and Fairholme Capital Management, L.L.C. collectively beneficially own less than 5% of our Common Stock. On December 12, 2008, our Board of Directors amended its Bylaws, created a new director position and elected Bruce R. Berkowitz to fill this position. Mr. Berkowitz was elected for a term expiring in 2009, pursuant to the provisions of the Fairholme Agreement. Mr. Berkowitz is President and a member of the Board of Directors of Fairholme. The Fairholme Agreement also provides that Fairholme shall have certain pre-emptive rights regarding the proposed issuance of our Common Stock or securities exercisable or convertible into Common Stock or any other security with voting rights and Fairholme’s proportionate ownership of Common Stock, subject to certain exceptions.
The Fairholme Agreement also provides that Fairholme and Fairholme Capital Management, L.L.C. (on behalf of such advisory accounts) will refrain from taking certain actions prior to December 31, 2010 regarding business combinations or proxy solicitations concerning the composition of our Board of Directors, will not increase their percentage ownership of our Common Stock together with any shares of Common Stock they are considered to beneficially own to more than 28.5%, except under certain conditions, and granted a proxy to vote certain shares of Common Stock held by them to our chairman, Clifton H. Morris, Jr. On July 21, 2010, we entered into a letter agreement with Fairholme and Fairholme Capital Management, L.L.C. that suspended the Fairholme Agreement during the period that the Fairholme voting agreement entered into in connection with the proposed Merger is effective.
123
Table of Contents
We also entered into a separate standstill letter agreement on December 12, 2008 with Bruce R. Berkowitz and certain of his family members and controlled entities under which they will refrain from taking certain actions prior to December 31, 2010 regarding business combinations or proxy solicitations concerning the composition of our Board of Directors, and will not acquire additional shares of our Common Stock, except under certain circumstances.
On November 16, 2009, Mr. Berkowitz stepped down from our board due to the demands of his position as Managing Member of Fairholme Capital Management, L.L.C. Mr. Berkowitz’s resignation did not result from any disagreement with our Board of Directors or management. On November 17, 2009, Fairholme and Fairholme Capital Management, L.L.C. irrevocably waived their rights under paragraph 6 of the Fairholme Agreement including Fairholme’s and Fairholme Capital Management, L.L.C.’s right to designate a director designee and a replacement for Mr. Berkowitz.
Review and Approval of Transactions with Related Persons
We review relationships and transactions in which we and our directors and officers or their immediate family members are participants to determine whether such related persons have a direct or indirect material interest. With respect to our Policy regarding Transactions with Section 16 Officers and Directors, approved by the Nominating and Corporate Governance Committee on March 23, 2006 and ratified by the Board of Directors on April 25, 2006, our Chief Legal Officer and Corporate Controller are primarily responsible for the development and implementation of processes and controls to obtain information from the directors and officers with respect to related party transactions and for then determining, based on the facts and circumstances, whether a related person has a direct or indirect material interest in the transaction. In the course of the review, any such transaction requires financial and legal review and, where appropriate, review by the Audit Committee and the Nominating and Corporate Governance Committee. As required under SEC rules, transactions that are determined to be directly or indirectly material to a related person are disclosed. In addition, the Nominating and Corporate Governance Committee reviews and approves or ratifies any related party transaction that is required to be disclosed.
Director Independence
The Board of Directors has determined that, with the exception of Messrs. Morris and Berce, all of its directors, including all of the members of the Audit, Compensation and Nominating and Corporate Governance Committees, are “independent” as defined by the listing standards of the New York Stock Exchange currently in effect and all applicable rules and regulations of the SEC. Messrs. Morris and Berce are not independent because of the following:
| • | Mr. Morris is our Chairman of the Board. |
| • | Mr. Berce is our President and Chief Executive Officer. |
No director is deemed independent unless the Board affirmatively determines that the director has no material relationship with us, either directly or as an officer, shareholder or partner of an organization that has a relationship with us. In making its determination, the Board observes the criteria for independence established by the rules of the SEC and the New York Stock Exchange. In addition, the Board considers all commercial, banking, consulting, legal, accounting, charitable or other business relationships any director may have with us.
124
Table of Contents
| ITEM 14. | PRINCIPAL ACCOUNTING FEES AND SERVICES |
Audit Fees
The following table presents fees for professional audit services rendered by Deloitte & Touche for the audit of our annual financial statements for the fiscal years ended June 30, 2010 and 2009; and fees for other services rendered by Deloitte & Touche LLP during those periods.
| Deloitte & Touche LLP |
Fiscal 2010 | Fiscal 2009 | ||||
| Audit Services(1) |
$ | 1,025,000 | $ | 1,211,000 | ||
| Audit-Related Services(2) |
498,900 | 346,000 | ||||
| Tax Services(3) |
150,977 | 325,000 | ||||
| All Other Services |
0 | 0 | ||||
| Total Fees |
$ | 1,674,877 | $ | 1,882,000 | ||
| (1) | Audit Services include the annual financial statement audit (including quarterly reviews, subsidiary audits and other procedures required to be performed by the independent registered public accounting firm to be able to form an opinion on our consolidated financial statements). Audit Services includes fees for professional services to perform the attestation required by the requirements of Section 404 of the Sarbanes-Oxley Act of 2002 and related regulations. |
| (2) | Audit-Related Services are assurance and related services that are reasonably related to the performance of the audit or review of our financial statements or that are traditionally performed by the independent registered public accounting firm. Audit-Related Services include, among other things, agreed-upon procedures and other services pertaining to our securitization program and other warehouse credit facility reviews; the attestations required by the requirements of Regulation AB; and accounting consultations related to accounting, financial reporting or disclosure matters not classified as “Audit Services.” |
| (3) | Tax services include tax services related to tax compliance and related advice. |
The Audit Committee considered whether the provision of non-audit services is compatible with maintaining the auditor’s independence, and has determined such services for fiscal years 2010 and 2009 were compatible.
125
Table of Contents
PART IV
| ITEM 15. | EXHIBITS AND FINANCIAL STATEMENT SCHEDULES |
| (1) | The following Consolidated Financial Statements as set forth in Item 8 of this report are filed herein. |
Consolidated Financial Statements:
Consolidated Balance Sheets as of June 30, 2010 and 2009.
Consolidated Statements of Operations and Comprehensive Operations for the years ended June 30, 2010, 2009 and 2008.
Consolidated Statements of Shareholders’ Equity for the years ended June 30, 2010, 2009 and 2008.
Consolidated Statements of Cash Flows for the years ended June 30, 2010, 2009 and 2008.
Notes to Consolidated Financial Statements
| (2) | All other schedules for which provision is made in the applicable accounting regulation of the Securities and Exchange Commission are either not required under the related instructions, are inapplicable, or the required information is included elsewhere in the Consolidated Financial Statements and incorporated herein by reference. |
| (3) | The exhibits filed in response to Item 601 of Regulation S-K are listed in the Index to Exhibits. |
126
Table of Contents
Pursuant to the requirements of Section 13 or 15(d) of the Securities Exchange Act of 1934, the Registrant has duly caused this report to be signed on its behalf by the undersigned, thereunto duly authorized, on August 27, 2010.
| AmeriCredit Corp. | ||
| BY: |
/s/ DANIEL E. BERCE | |
| Daniel E. Berce | ||
| President and Chief Executive Officer | ||
Pursuant to the requirements of the Securities Exchange Act of 1934, this report has been signed by the following persons on behalf of the Registrant and in the capacities and on the dates indicated.
| Signature |
Title |
Date | ||
| /s/ CLIFTON H. MORRIS, JR. |
Director and Chairman of the Board |
August 27, 2010 | ||
| Clifton H. Morris, Jr. | ||||
| /s/ DANIEL E. BERCE Daniel E. Berce |
Director, President and Chief Executive Officer (Principal Executive Officer) |
August 27, 2010 | ||
| /s/ CHRIS A. CHOATE Chris A. Choate |
Executive Vice President, Chief Financial Officer and Treasurer (Chief Accounting Officer) |
August 27, 2010 | ||
| /s/ JOHN R. CLAY John R. Clay |
Director |
August 27, 2010 | ||
| /s/ IAN M. CUMMING Ian M. Cumming |
Director |
August 27, 2010 | ||
| /s/ A.R. DIKE A.R. Dike |
Director |
August 27, 2010 | ||
| /s/ JAMES H. GREER James H. Greer |
Director |
August 27, 2010 | ||
| /s/ DOUGLAS K. HIGGINS Douglas K. Higgins |
Director |
August 27, 2010 | ||
| /s/ KENNETH H. JONES, JR. Kenneth H. Jones, Jr. |
Director |
August 27, 2010 | ||
| /s/ ROBERT B. STURGES Robert B. Sturges |
Director |
August 27, 2010 | ||
| /s/ JUSTIN R. WHEELER Justin R. Wheeler |
Director |
August 27, 2010 | ||
127
Table of Contents
INDEX TO EXHIBITS
The following documents are filed as a part of this report. Those exhibits previously filed and incorporated herein by reference are identified by the numbers in parenthesis under the Exhibit Number column. Documents filed with this report are identified by the symbol “@” under the Exhibit Number column.
| Exhibit No. |
Description | |
| 2.1(38) | Agreement and Plan of Merger, dated July 21, 2010, among General Motors Holdings LLC, Goalie Texas Holdco Inc. and AmeriCredit Corp. (Exhibit 2.1) | |
| 3.1(1) |
Articles of Incorporation of the Company, filed May 18, 1988, and Articles of Amendment to Articles of Incorporation, filed August 24, 1988 (Exhibit 3.1) | |
| 3.2(1) |
Amendment to Articles of Incorporation, filed October 18, 1989 Exhibit 3.2) | |
| 3.3(3) |
Articles of Amendment to Articles of Incorporation of the Company, filed November 12, 1992 (Exhibit 3.3) | |
| 3.4(14) |
Amended & Restated Bylaws of the Company (Exhibit 3.1) | |
| 4.1(2) |
Specimen stock certificate evidencing the Common Stock (Exhibit 4.1) | |
| 10.1(6) |
2000 Limited Omnibus and Incentive Plan for AmeriCredit Corp. | |
| 10.1.1(12) |
Amended and Restated 2000 Limited Omnibus and Incentive Plan for AmeriCredit Corp. (Exhibit 4.4) | |
| 10.1.2(17) |
Amendment No. 1 to the Amended and Restated 2000 Limited Omnibus and Incentive Plan for AmeriCredit Corp. (Appendix C to Proxy Statement) | |
| 10.1.3(19) |
Form of Restricted Stock Unit Grant Agreement (Exhibit 99.1) | |
| 10.2(36) |
Non-employee director compensation plan for fiscal 2010 (Exhibit 10.2) | |
| 10.3(20) |
Second Amended and Restated Executive Employment Agreement, dated May 6, 2010, between the Company and Daniel E. Berce (Exhibit 10.1) | |
| 10.3.1(20) |
Amended and Restated Executive Employment Agreement, dated May 7, 2010, between the Company and Kyle R. Birch (Exhibit 10.2) | |
| 10.3.2(20) |
Second Amended and Restated Executive Employment Agreement, dated May 7, 2010, between the Company and Steven P. Bowman (Exhibit 10.3) | |
| 10.4(20) |
Second Amended and Restated Employment Agreement, dated May 7, 2010, between the Company and Chris A. Choate (Exhibit 10.4) | |
| 10.4.1(20) |
Amended and Restated Executive Employment Agreement, dated May 7, 2010, between the Company and Brian S. Mock (Exhibit 10.4) | |
| 10.5(17) |
2008 Omnibus Incentive Plan (Exhibit 99.1) | |
| 10.5.1(22) |
Form of Restricted Stock Unit Grant Agreement | |
| 10.5.2(23) |
Amendment No. 1 to 2008 Omnibus Incentive Plan (Exhibit 10.2) | |
| 10.5.3(23) |
Form of Restricted Stock Unit Grant Agreement (Exhibit 10.1) | |
| 10.6(28) |
Loan and Security Agreement, dated September 25, 2008, among AmeriCredit Class B Note Funding Trust, AmeriCredit Financial Services, Inc., AFS SenSub Corp., Wachovia Bank, National Association, Wachovia Capital Markets, LLC and Wells Fargo Bank, National Association (Exhibit 10.1) | |
128
Table of Contents
INDEX TO EXHIBITS
(Continued)
| 10.6.1(28) |
Loan and Security Agreement, dated September 25, 2008, among AmeriCredit Class C Note Funding Trust, AmeriCredit Financial Services, Inc., AFS SenSub Corp., Wachovia Bank, National Association, Wachovia Capital Markets, LLC and Wells Fargo Bank, National Association (Exhibit 10.2) | |
| 10.6.2(28) |
Warrant, dated September 25, 2008, issued by AmeriCredit Corp. to Wachovia Investment Holdings, LLC (Exhibit 10.3) | |
| 10.7(4) |
1995 Omnibus Stock and Incentive Plan for AmeriCredit Corp. | |
| 10.7.1(5) |
Amendment No. 1 to 1995 Omnibus Stock and Incentive Plan for AmeriCredit Corp. | |
| 10.7.2(21) |
Amendment No. 2 to the 1995 Omnibus Stock and Incentive Plan for AmeriCredit Corp. (Exhibit 99.2) | |
| 10.8(8) |
FY 2000 Stock Option Plan of AmeriCredit Corp. | |
| 10.9(9) |
Management Stock Option Plan of AmeriCredit Corp. | |
| 10.10(10) |
AmeriCredit Corp. Employee Stock Purchase Plan | |
| 10.10.1(10) |
Amendment No. 1 to AmeriCredit Corp. Employee Stock Purchase Plan | |
| 10.10.2(11) |
Amendment No. 2 to AmeriCredit Corp. Employee Stock Purchase Plan | |
| 10.10.3(13) |
Amendment No. 3 to AmeriCredit Corp. Employee Stock Purchase Plan | |
| 10.10.4(15) |
Amendment No. 4 to AmeriCredit Corp. Employee Stock Purchase Plan (Exhibit 99.1) | |
| 10.10.5(37) |
Amendment No. 5 to AmeriCredit Corp. Employee Stock Purchase Plan | |
| 10.11(24) |
Sale and Servicing Agreement, dated as of February 26, 2010, among AmeriCredit Syndicated Warehouse Trust, AmeriCredit Funding Corp. XI, AmeriCredit Financial Services, Inc., Deutsche Bank AG New York Branch and Wells Fargo Bank, NA (Exhibit 99.1) | |
| 10.11.1(24) |
Indenture, dated February 26, 2010, among AmeriCredit Syndicated warehouse Trust, Deutsche Bank AG New York Branch and Wells Fargo Bank, NA (Exhibit 99.2) | |
| 10.11.2(24) |
Note Purchase Agreement, dated February 26, 2010, among AmeriCredit Syndicated Warehouse Trust, AmeriCredit Funding Corp. XI, AmeriCredit Financial Services, Inc., Deutsche Bank AG New York Branch and Wells Fargo Bank, NA (Exhibit 99.3) | |
| 10.11.3(@) |
First Supplemental Indenture, dated August 20, 2010, between AmeriCredit Syndicated Warehouse Trust and Wells Fargo Bank, N A | |
| 10.11.4(@) |
Amendment No. 1, dated August 20, 2010, to Sale and Servicing Agreement, dated February 26, 2010, among AmeriCredit Syndicated Warehouse Trust, AmeriCredit Funding Corp. XI, AmeriCredit Financial Services, Inc., Deutsche Bank AG New York Branch and Wells Fargo Bank, NA | |
| 10.12(25) |
Security Agreement dated as of October 3, 2006, among AmeriCredit MTN Receivables Trust V, AmeriCredit Financial Services, Inc., AmeriCredit MTN Corp. V and Wells Fargo Bank Exhibit 99.2) | |
| 10.12.1(25) |
Servicing and Custodian Agreement dated as of October 3, 2006, among AmeriCredit Financial Services, Inc., AmeriCredit MTN Receivables Trust V and Wells Fargo Bank (Exhibit 99.3) | |
| 10.12.2(25) |
Master Receivables Purchase Agreement dated as of October 3, 2006, among AmeriCredit MTN Receivables Trust V, AmeriCredit Financial Services, Inc., AmeriCredit MTN Corp. V and Wells Fargo Bank (Exhibit 99.5) | |
129
Table of Contents
INDEX TO EXHIBITS
(Continued)
| 10.12.3(25) |
Insurance Agreement dated as of October 3, 2006, among MBIA Insurance Corporation, AmeriCredit MTN Receivables Trust V, AmeriCredit Financial Services, Inc., AmeriCredit MTN Corp. V and Wells Fargo Bank (Exhibit 99.6) | |
| 10.12.4(26) | Note Purchase Agreement dated as of October 3, 2006, among AmeriCredit MTN Receivables Trust V, AmeriCredit Financial Services, Inc., Meridian Funding Company, LLC and MBIA Insurance Corporation (Exhibit 99.4) | |
| 10.12.5(29) | Omnibus Amendment No. 1, dated March 5, 2009, among AmeriCredit MTN Receivables Trust V, AmeriCredit Financial services, Inc., AmeriCredit MTN Corp. V, MBIA Insurance Corporation, Meridian Funding Company, LLC, Wilmington Trust Company and Wells Fargo Bank, National Association (Exhibit 99.7) | |
| 10.13 (17) | AmeriCredit Corp. Senior Executive Bonus Plan (Appendix D to Proxy Statement) | |
| 10.14(32) | Letter Agreement, dated December 12, 2008, between AmeriCredit Corp. and Fairholme Funds, Inc. (Exhibit 10.1) | |
| 10.14.1(32) | Letter Agreement, dated December 12, 2008, among AmeriCredit Corp., Tracey Berkowitz, Bruce Berkowitz, The Fairholme Foundation, and East Lane, LLC (Exhibit 10.2) | |
| 10.14.2(32) | Registration Rights Agreement, dated December 12, 2008, between AmeriCredit Corp. and Fairholme Funds, Inc. (Exhibit 10.3) | |
| 10.14.3(34) | Exchange Agreement, dated November 24, 2008, between AmeriCredit Corp. and Fairholme Funds, Inc. (Exhibit 10.1) | |
| 10.14.4(33) | Note Purchase Agreement, dated November 24, 2008, among AmeriCredit Corp., AmeriCredit Financial Services, Inc, AmeriCredit SenSub Corp. and Fairholme Funds, Inc. (Exhibit 10.2) | |
| 10.14.5(33) | Limited Guaranty, dated November 24, 2008, issued by AmeriCredit Corp. to Wells Fargo Bank, National Association Exhibit 10.3) | |
| 10.14.6(33) | Registration Rights Agreement, dated November 26, 2008, among AmeriCredit Corp., AmeriCredit Financial Services, Inc, AmeriCredit SenSub Corp. and Fairholme Funds, Inc. (Exhibit 10.4) | |
| 10.14.7(35) | Letter agreement effective November 19, 2009, between AmeriCredit Corp. and Fairholme Fund, Inc. (Exhibit 10.1) | |
| 10.15(17) | AmeriCredit Corp. Deferred Compensation Plan II (Exhibit 99.1) | |
| 10.16(18) | Revised Form of Stock Appreciation Rights Agreement (Exhibit 10.1) | |
| 10.17(25) | Indenture, dated as of September 18, 2006, among AmeriCredit Corp., the Guarantors party thereto, and HSBC Bank USA, National Association, entered into in connection with AmeriCredit’s $275,000,000 0.75% Convertible Senior Notes due 2011 (Exhibit 10.2) | |
| 10.18(25) | Indenture, dated as of September 18, 2006, among AmeriCredit Corp., the Guarantors party thereto, and HSBC Bank USA, National Association, entered into in connection with AmeriCredit’s $275,000,000 2.125% Convertible Senior Notes due 2013 (Exhibit 10.3) | |
| 10.19(26) | Restricted Stock Unit Agreement (Exhibit 99.1) | |
| 10.20(27) | Indenture, dated as of June 28, 2007, among AmeriCredit Corp., the Guarantors party thereto and HSBC Bank USA, National Association, entered into in connection with AmeriCredit’s $200,000,000 8.50% Senior Notes due 2015 (Exhibit 4.1) | |
130
Table of Contents
INDEX TO EXHIBITS
(Continued)
| 10.21(27) | Registration Rights Agreement, dated as of June 28, 2007, among AmeriCredit Corp., as issuer, and Deutsche Bank Securities Inc. and Lehman Brothers Inc, as representatives of the initial purchasers, entered into in connection with AmeriCredit’s $200,000,000 8.50% Senior Notes due 2015 (Exhibit 10.1) | |
| 10.22(31) | Registration Rights Agreement, dated April 21, 2008, between AmeriCredit Corp. and Leucadia National Corporation (Exhibit 99.1) | |
| 10.23(30) | Warrant Agreement, dated April 15, 2008, between AmeriCredit Corp. and Deutsche Bank Securities Inc. (Exhibit 10.2) | |
| 10.23.1(36) | Amendment No. 1, dated October 28, 2009, to Warrant dated April 15, 2008, issued by AmeriCredit Corp. to Deutsche Bank Securities Inc. (Exhibit 10.1) | |
| 12.1(@) | Statement Re Computation of Ratios | |
| 21.1(@) | Subsidiaries of the Registrant | |
| 23.1(@) | Consent of Independent Registered Public Accounting Firm | |
| 31.1(@) | Officers’ Certifications of Periodic Report pursuant to Section 302 of Sarbanes-Oxley Act of 2002 | |
| 32.1(@) | Officers’ Certifications of Periodic Report pursuant to Section 906 of Sarbanes-Oxley Act of 2002 | |
| (@) | Filed herewith. |
| (1) | Incorporated by reference to the exhibit shown in parenthesis included in Registration Statement No. 33-31220 on Form S-1 filed by the Company with the Securities and Exchange Commission. |
| (2) | Intentionally deleted. |
| (3) | Incorporated by reference to the exhibit shown in parenthesis included in the Company’s Annual Report on Form 10-K for the year ended June 30, 1991, filed by the Company with the Securities and Exchange Commission. |
| (4) | Incorporated by reference to the exhibit shown in parenthesis included in the Company’s Annual Report on Form 10-K for the year ended June 30, 1993, filed by the Company with the Securities and Exchange Commission. |
| (5) | Incorporated by reference from the Company’s Proxy Statement for the year ended June 30, 1995, filed by the Company with the Securities and Exchange Commission. |
| (6) | Incorporated by reference from the Company’s Proxy Statement for the year ended June 30, 1997, filed by the Company with the Securities and Exchange Commission. |
| (7) | Footnote intentionally omitted. |
| (8) | Incorporated by reference to the exhibit shown in parenthesis included in the Company’s Registration Statement on Form S-8, filed on October 29, 1999, by the Company with the Securities and Exchange Commission (Exhibit 4.4) |
| (9) | Incorporated by reference to the exhibit shown in parenthesis included in the Company’s Registration Statement on Form S-8, filed on February 23, 2000, by the Company with the Securities and Exchange Commission (Exhibit 4.4) |
| (10) | Incorporated by reference to the exhibit shown in parenthesis included in the Company’s Registration Statement on Form S-8, filed on November 16, 1994, by the Company with the Securities and Exchange Commission (Exhibit 4.3) |
| (11) | Incorporated by reference to the exhibit shown in parenthesis included in the Company’s Registration Statement on Form S-8, filed on March 1, 1999, by the Company with the Securities and Exchange Commission (Exhibit 4.4.1) |
131
Table of Contents
| (12) | Incorporated by reference to the exhibit shown in parenthesis included in the Company’s Registration Statement on Form S-8, filed on November 7, 2001, by the Company with the Securities and Exchange Commission (Exhibit 4.4.2) |
| (13) | Incorporated by reference to the exhibit shown in parenthesis included in the Company’s Registration Statement on Form S-8, filed on December 12, 2002, by the Company with the Securities and Exchange Commission |
| (14) | Incorporated by reference to the exhibit shown in parenthesis included in the Company’s Current Report on Form 8-K, filed by the Company with the Securities and Exchange Commission on February 3, 2010. |
| (15) | Incorporated by reference to the exhibit shown in parenthesis included in the Company’s Registration Statement on Form S-8, filed on December 18, 2003, by the Company with the Securities and Exchange Commission (Exhibit 4.4.3) |
| (16) | Footnote intentionally omitted. |
| (17) | Filed as an exhibit to the Proxy Statement, filed on Form DEF 14A with the Securities and Exchange Commission on September 28, 2004. |
| (18) | Filed as an exhibit to the report on Form 8-K, filed with the Securities and Exchange Commission on December 15, 2004. |
| (19) | Incorporated by reference to the exhibit shown in parenthesis included in the Company’s Quarterly Report on Form 10-Q for the quarterly period ended March 31, 2005, filed by the Company with the Securities and Exchange Commission. |
| (20) | Filed as an exhibit to the Current Report on Form 8-K, filed with the Securities and Exchange Commission on June 6, 2006. |
| (21) | Incorporated by reference to the exhibit shown in parenthesis included in the Company’s Current Report on Form 8-K, filed by the Company with the Securities and Exchange Commission on May 9, 2010. |
| (22) | Filed as an exhibit to the Current Report on Form 8-K, filed with the Securities and Exchange Commission on December 16, 2005. |
| (23) | Incorporated by reference to the exhibit included in the Company’s Quarterly Report on Form 10-Q for the quarterly period ended December 31, 2008, filed by the Company with the Securities and Exchange Commission. |
| (24) | Filed as an exhibit to the Current Report on Form 8-K, filed with the Securities and Exchange Commission on March 2, 2010. |
| (25) | Incorporated by reference to the exhibit shown in parenthesis included in the Company’s Quarterly Report on Form 10-Q for the quarterly period ended September 30, 2006, filed by the Company with the Securities and Exchange Commission. |
| (26) | Filed as an exhibit to the Current Report on Form 8-K, filed with the Securities and Exchange Commission on November 1, 2006. |
| (27) | Filed as an exhibit to the Current Report on Form 8-K, filed with the Securities and Exchange Commission on July 5, 2007. |
| (28) | Filed as an exhibit to the Current Report on Form 8-K, filed with the Securities and Exchange Commission on October 1, 2008. |
| (29) | Filed as an exhibit to the Current Report on Form 8-K, filed with the Securities and Exchange Commission on March 10, 2009. |
| (30) | Filed as an exhibit to the Current Report on Form 8-K, filed with the Securities and Exchange Commission on April 17, 2008. |
| (31) | Filed as an exhibit to the Current Report on Form 8-K, filed with the Securities and Exchange Commission on April 24, 2008. |
| (32) | Filed as an exhibit to the Current Report on Form 8-K, filed with the Securities and Exchange Commission on December 15, 2008. |
| (33) | Filed as an exhibit to the Current Report on Form 8-K, filed with the Securities and Exchange Commission on November 26, 2008. |
| (34) | Filed as an exhibit to the Current Report on Form 8-K, filed with the Securities and Exchange Commission on December 23, 2008. |
132
Table of Contents
| (35) | Filed as an exhibit to the Current Report on Form 8-K, filed with the Securities and Exchange Commission on November 16, 2009. |
| (36) | Filed as an exhibit to the Current Report on Form 8-K, filed with the Securities and Exchange Commission on October 29, 2009. |
| (37) | Filed as an Exhibit to the Company’s Annual report of Form 10-K for the year ended June 30, 2009. |
| (38) | Filed as an exhibit to the Current Report on Form 8-K, filed with the Securities and Exchange Commission on July 26, 2010. |
133