Attached files
| file | filename |
|---|---|
| 8-K - 8-K - Education Realty Trust, Inc. | a8krichardspreleasingwinve.htm |
| EX-99.1 - EXHIBIT 99.1 PRESS RELEASE - Education Realty Trust, Inc. | richardsandleasingnumbersv5.htm |

. . Investor Presentation SEPTEMBER 2014 UNIVERSITY OF KENTUCKY CHAMPIONS COURT I UNIVERSITY OF KENTUCKY CHAMPIONS COURT I – ROOFTOP LOUNGE

. . EMBEDDED EXTERNAL GROWTH EDR BY THE NUMBERS STABLE AND PREDICTABLE STUDENT HOUSING MARKET BEST IN CLASS PORTFOLIO CAPITAL MANAGEMENT UNIQUE P3 OPPORTUNITIES THE ONE PLANSM Key Themes 2

. . 3 Portfolio EdR by the Numbers $725m ACQUISITIONS $494m DEVELOPMENTS $311m DISPOSITIONS 157% TOTAL SHAREHOLDER RETURN August 31, 2014 • $2.1 Billion Enterprise Value • 39 University Markets • 52 Communities • 28,865 Beds January 1, 2010 • $654 Million Enterprise Value • 33 University Markets • 40 Communities • 25,454 Beds

. . EdR By The Numbers Year Opening Occupancy Occupancy Growth Rate Growth Total Revenue Growth 2010 93.6% 2.3% 2.0% 4.3% 2011 94.9% 1.5% 5.6% 7.1% 2012 90.5% (4.2%) 5.1% 0.9% 2013 94.1% 3.0% 2.0% 5.0% Superior Same-Community Leasing Results Historical Same-Community Leasing Results 4 Best-In-Class 4.3%(CAGR) Same-Community Revenue Growth

. . 5 Strong History of Growth EdR By The Numbers Revenue and NOI Growth $99.2 $109.4 $131.1 $167.5 2010 2011 2012 2013 Revenue (In Millions) $50.8 $58.8 $67.9 $87.5 2010 2011 2012 2013 NOI (In Millions) CAGR-20% Source: Company filings, represents amounts reported in each respective year prior subsequent changes for discontinued ops. CAGR-19%

. . $0.47 $0.55 $0.63 2012 2013 2014 Core FFO Growth Per Share (1) EdR By The Numbers • Strong historical growth that is expected to continue. • Industry leading same-community revenue growth three out four years. • Significant increases in total revenue, NOI and gross assets. • Strong growth in Core FFO per share. – 16% 3-year CAGR(1) • Annual dividend increases of at least 9% over the last two years. Superior Core FFO Growth (1) Mid-point of company’s projected range. 6 CAGR-16%

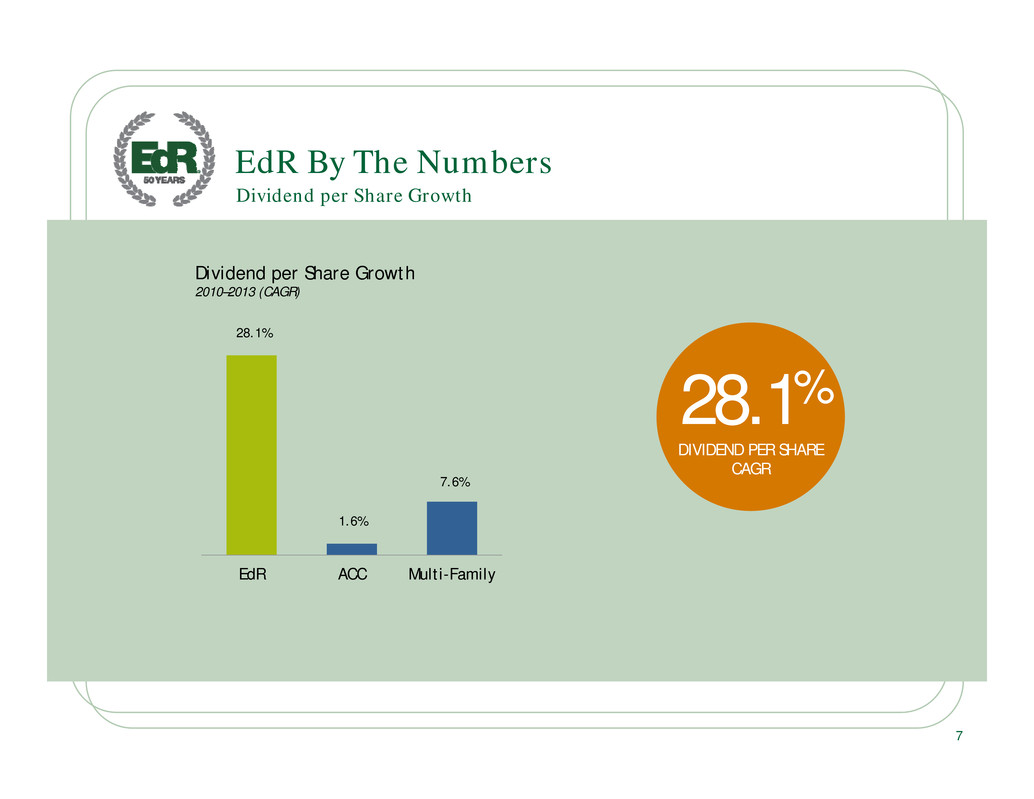
. . 28.1% 1.6% 7.6% EdR ACC Multi-Family Dividend per Share Growth 2010–2013 (CAGR) EdR By The Numbers Dividend per Share Growth 7 28.1% DIVIDEND PER SHARE CAGR

. . 108% 71% 69% 34% (10%) EDR MF REITs RMS ACC CCG Total Shareholder Return 2010–2013 (2)(1) EdR #2 VS. ALL PUBLIC MULTIFAMILY REITS EdR #1 VS. ALL PUBLIC STUDENT HOUSING REITS Total Shareholder Return EdR By The Numbers Source: KeyBanc Corp (1) MF REITs include: AEC, AIV, AVB, BRE, CPT, EQR, ESS, HME, IRET, MAA, PPS, RPI and UDR (2) For the period October 2011 – December 31, 2013 8 EdR 85th Percentile ALL PUBLIC REITs

. . 0.9% 0.7% 0.9% 1.4% 1.6% 1.6% 1.3% 1.0% 2014 2015 2016 2017 2018 2019 2020 2021 Projected Average % Growth 2014-21= 1.1% Projected Full-Time Enrollment Growth Enrollment Trends Stable and Predictable Student Housing Market Source: National Center for Education Statistics (NCES) report titled “The Condition of Education 2012.” +1.1% AVERAGE ANNUAL ENROLLMENT GROWTH THROUGH 2021 9

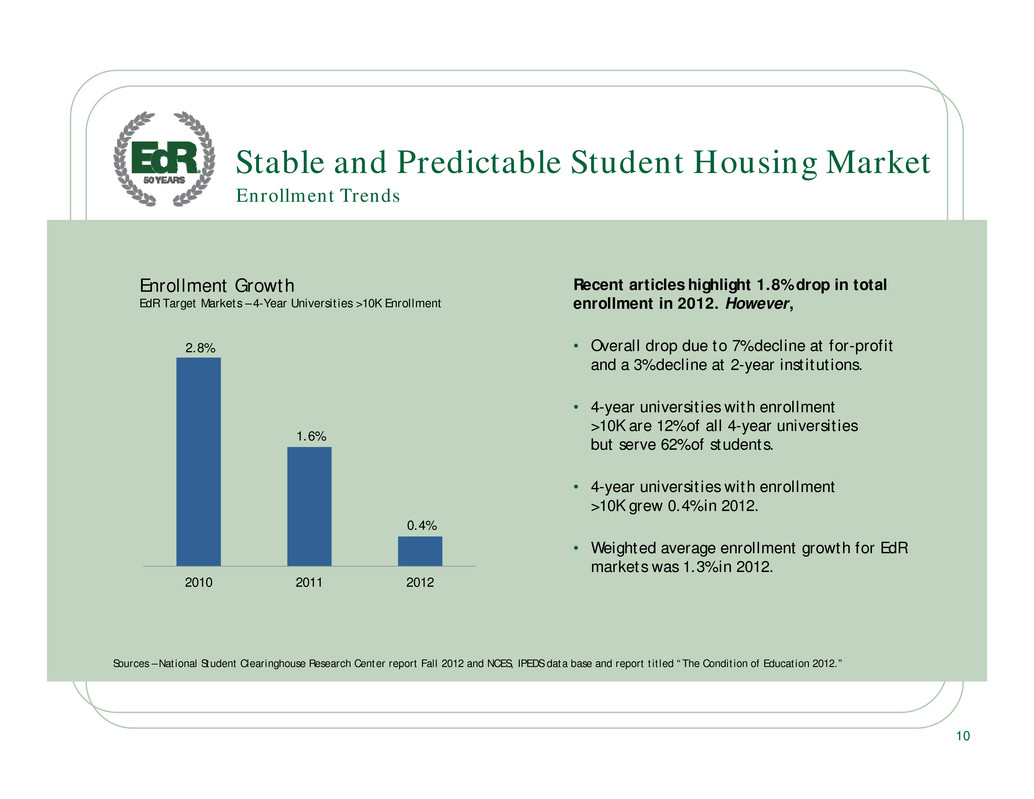
. . Enrollment Trends Stable and Predictable Student Housing Market Sources – National Student Clearinghouse Research Center report Fall 2012 and NCES, IPEDS data base and report titled “The Condition of Education 2012.” 2.8% 1.6% 0.4% 2010 2011 2012 Enrollment Growth EdR Target Markets – 4-Year Universities >10K Enrollment Recent articles highlight 1.8% drop in total enrollment in 2012. However, • Overall drop due to 7% decline at for-profit and a 3% decline at 2-year institutions. • 4-year universities with enrollment >10K are 12% of all 4-year universities but serve 62% of students. • 4-year universities with enrollment >10K grew 0.4% in 2012. • Weighted average enrollment growth for EdR markets was 1.3% in 2012. 10

. . Enrollment Trends Stable and Predictable Student Housing Market Source: NCES; Board of Governors of the Federal Reserve System. 8 12 16 20 24 1970 1975 1980 1985 1990 1995 2000 2005 2010 2015 2020 Projection RECESSIONS Recession causes temporary increase in enrollment. Once recession ends this temporary increase subsides. Enrollment in Millions 11

. . Stable and Predictable Student Housing Market • “Enrollment declines are concentrated in colleges with smaller enrollment size, high tuition dependence, weak selectivity/yield rates, and soft regional demographics. The survey indicates that market-leading, diversified colleges and universities rated Aaa or Aa continue to fare better than the majority of the sector and are still seeing healthy student demand.” • “The survey shows that there remains a “flight to quality” as students seek the highest value education in the face of declining family income and weak job prospects. As a result, small, lower-rated public and private universities, as well as publics with small enrollment size, experienced the most enrollment pressure in fall 2012.” • “For public universities, there continues to be a correlation between size and enrollment trends, with the highest median enrollment growth experienced at large, program-diversified universities.” 12 Enrollment Drivers Source: Moody’s Investors Service, Special Comment: More US Colleges Face Stagnating Enrollment and Tuition Revenue, According to Moody’s Survey, Jan. 10, 2013. EdR Target Markets • Universities with Aaa or Aa rating • Highly-regarded universities • Large, program-diversified, public universities Moody’s Investor Services

. . 2015 New Supply: EdR Markets Stable and Predictable Student Housing Market * Enrollment projection represents the 4-year enrollment CAGR through 2013 for our markets. The mid-point of 2014-2015 same -community leasing projection was used for 2014 revenue growth. 13 1.3% 2.2% 5.0% 2013 1.4% 2.2% 3.5% 2014* 1.4% 1.8% 2015* EdR Market and Revenue Growth Enrollment Growth Supply Growth EdR Same-Community Revenue Growth New supply slowed 9% from 2014 to 2015

. . Region Owned Beds EdRfff NOI %(2) 3 Year Enrollment Growth– Universities Served 2015 New Supply % Variance West 3,227 12% 1.9% 0.3% 1.6% Mid Atlantic 6,201 25% 0.8% 2.6% (1.8)% North 3,707 10% 0.3% 1.8% (1.5)% South Central 9,342 33% 2.0% 2.4% (0.4)% South East 7,307 15% 1.4% 1.5% (0.1)% Mid West 2,636 5% 2.2% 4.3% (2.1)% Total 32,420 100% 1.4% 1.8% (0.4)% 14 New supply slowed 9% from 2014 to 2015 Stable and Predictable Student Housing Market 2015 New Supply: EdR Markets 2015 New Supply to Enrollment(1) Conclusion: Overall market occupancy approximately 95%. The 40 basis points supply in excess of enrollment growth is insignificant and does not consider cannibalization of older outdated “other housing.” (1) All markets served by EdR and all announced deliveries. Data was obtained from the National Center for Education Statistics, Axiometrics and local market data. (2) Includes 2014 and 2015 development deliveries, the planned acquisition of The District on Apache at Arizona State University and the presale at Florida International University. NOI is based on current 2014 forecasted net operating income with annualization of 2014 developments and acquisitions and proforma NOI for 2015 developments. Other Housing 49% On-Campus Housing 26% Housing Mix EdR Markets Off-campus Purpose Built Student Housing 25%

. . Impact of New Supply Stable and Predictable Student Housing Market Example of Pent-Up Demand/Modernization in EdR Markets University 2013 New Supply 2013 Enrollment Growth Fall 2013 EdR Same-Community Revenue Growth University of Mississippi (1) 12.6% 6.7% 5.2% Georgia Southern University 19.1% 0.2% 5.4% University of Missouri 9.8% 0.0% (4.7%) Florida State University 4.0% (2.2%) (2.0%) Weighted Average 9.3% 0.0% 0.5% 15 (1) Excludes the Retreat at Oxford, which delivered in 2013 and was not in the same-community portfolio in 2013.

. . Currently Preleased Improvement to Prior Year Projected Rate Growth Prior Year Occupancy Below 90% (Tier 1) 91.8% 11.7% (0.6%) Prior Year Occupancy 90%-94.9% (Tier 2) 94.4% 2.9% 1.1% Prior Year Occupancy 95%-97.9% (Tier 3) 95.9% (0.7%) 2.5% Sub-Total 94.3% 3.7% Prior Year Occupancy 98% and Above (Tier 4) 99.4% (0.4%) 3.1% Total Same-Community 96.2% 2.2% 2.0% 16 2014-2015 Pre-leasing as of September 4th Stable and Predictable Student Housing Market SAME-COMMUNITY PROJECTED FALL REVENUE GROWTH +3-4%

. . Stable and Predictable Student Housing Market 17 • Enrollment trends are favorable. • New supply is manageable. • Modernization is in full swing. • Preleasing is strong for 2014-2015 lease term. Moving Forward Conclusion

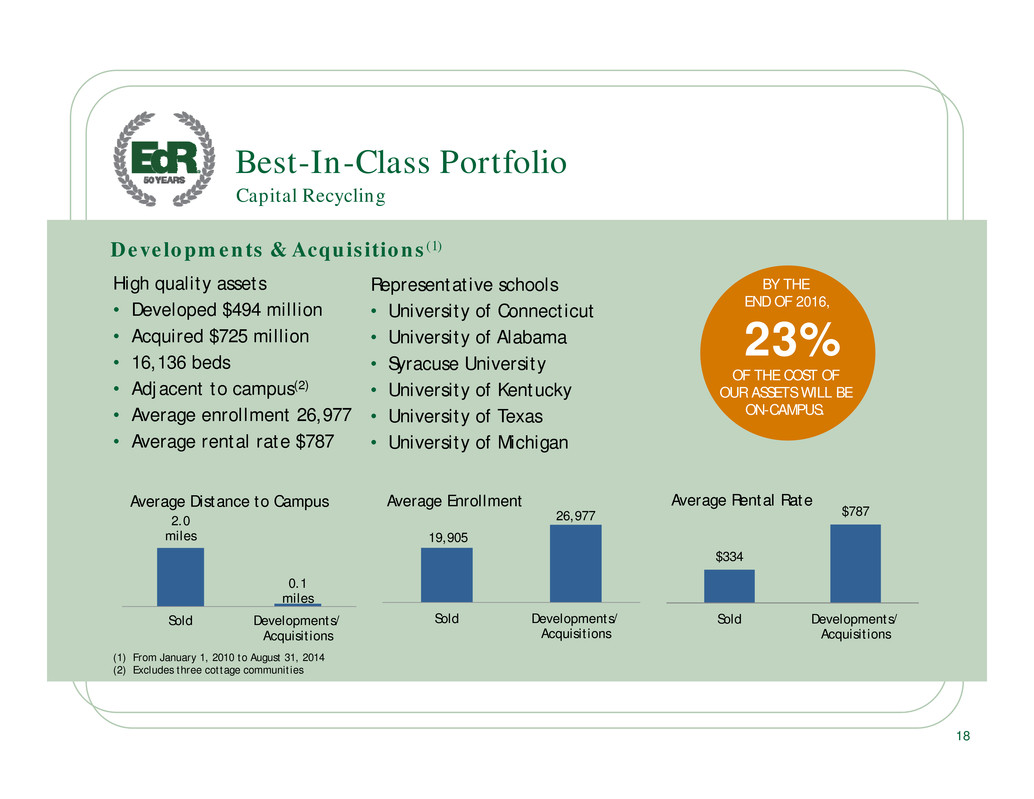
. . Developments & Acquisitions(1) High quality assets • Developed $494 million • Acquired $725 million • 16,136 beds • Adjacent to campus(2) • Average enrollment 26,977 • Average rental rate $787 Best-In-Class Portfolio Capital Recycling (1) From January 1, 2010 to August 31, 2014 (2) Excludes three cottage communities Representative schools • University of Connecticut • University of Alabama • Syracuse University • University of Kentucky • University of Texas • University of Michigan BY THE END OF 2016, 23% OF THE COST OF OUR ASSETS WILL BE ON-CAMPUS. 18 19,905 26,977 Sold Developments/ Acquisitions Average Enrollment 2.0 miles 0.1 miles Sold Developments/ Acquisitions Average Distance to Campus $334 $787 Sold Developments/ Acquisitions Average Rental Rate

. . Capital Recycling Best-In-Class Portfolio • Sold properties are older, less desirable communities farther from campus. • Approximately 75% of EdR’s 2014 NOI is from pedestrian/ONE Plan communities. Conclusion: Disconnect in valuation as private market valuation of less desirable communities is same as EdR’s public market valuation Cap Rates – Sold Assets University Date Sold Distance to Campus Age Bed/Bath Parity Sales Price ($mm) Economic Cap Rate The Pointe at Western Michigan Western Michigan Dec-13 3.7 miles 14 years No $21.0 6.7% The Reserve on West 31st Kansas Mar-14 3.5 miles 16 years No $14.0 6.6% College Station at W. Lafayette Purdue Mar-14 3.3 miles 14 years No $27.9 5.7% Pointe West South Carolina Jul-14 1.9 miles 11 years No $16.4 7.6% Reserve on South College Auburn Jul-14 0.4 miles 15 years No $13.5 5.9% Weighted Average Cap Rate $92.8 6.4% 19 6.0% EdR’s Implied Economic Cap Rate(1) (1) Estimate based on EdR research and share price of $10.60 as of August 11, 2014

. . Best-In-Class Portfolio EdR(1) Median distance to campus 0.1 miles Average distance to campus 0.5 miles Average full-time enrollment 27,401 Average rental rate $640 Average age 9 years Percent of National Top 150 schools 70% Summary Community Statistics (1) Represents EdR statistics at December 31, 2013 and includes only open and operating communities. 20

. . Distance to Campus Best-In-Class Portfolio Source: Respective company earnings supplements or investor presentations 75% OF EdR NOI IS EITHER ON CAMPUS OR PEDESTRIAN TO CAMPUS 21 69% 72% 46% EdR ACC CCG On or Pedestrian to Campus Percent of Beds

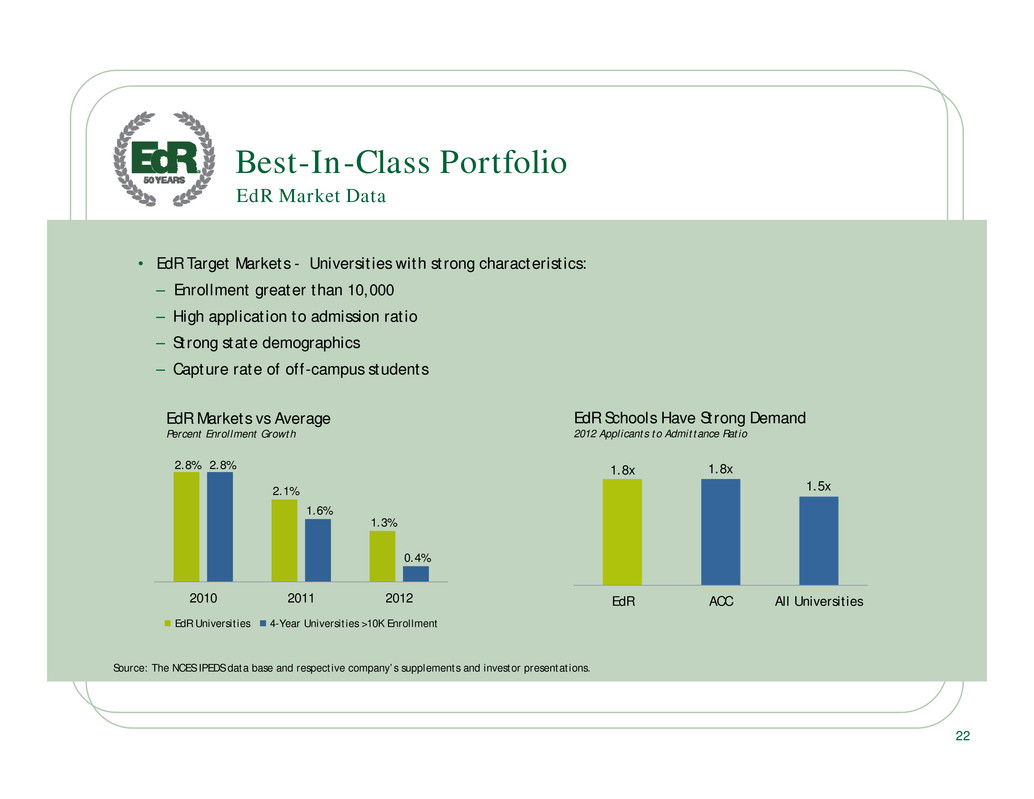
. . Best-In-Class Portfolio • EdR Target Markets - Universities with strong characteristics: – Enrollment greater than 10,000 – High application to admission ratio – Strong state demographics – Capture rate of off-campus students EdR Market Data Source: The NCES IPEDS data base and respective company’s supplements and investor presentations. 2.8% 2.1% 1.3% 2.8% 1.6% 0.4% 2010 2011 2012 EdR Markets vs Average Percent Enrollment Growth 1.8x 1.8x 1.5x EdR ACC All Universities EdR Schools Have Strong Demand 2012 Applicants to Admittance Ratio 22 EdR Universities 4-Year Universities >10K Enrollment

. . 23 Same-Community Leasing Results Best-In-Class Portfolio Source: Respective company’s disclosures 4.3% 2.8% EdR ACC Same-Community Fall Revenue Growth 2010-2013 (CAGR) DELIVERED MARKET LEADING LEASING RESULTS OVER LAST FOUR YEARS FOCUSED MANAGEMENT TEAM TRANSFORMED THE COMPANY’S PORTFOLIO

. . Embedded External Growth Year of Delivery EdR’s Share of Costs (in millions) University Markets Properties Beds 2014(1) $304 6 10 4,612 2015 208 4 6 2,948 2016 84 1 2 1,141 Total $596 11 18 8,701 Announced Development Deliveries CURRENT DEVELOPMENTS WILL INCREASE TOTAL GROSS ASSETS BY NEARLY 39%(2) 24 (1) These assets were delivered and opened in August for the 2014-2015 lease year. (2) Based on gross asset value as of June 30, 2014 as disclosed in the Q2-14 supplement, less development costs incurred on the developments.

. . 25 Announced Developments Embedded External Growth *EdR is 50% owner in The Marshall and Georgia Heights developments which are not included in Wholly-Owned Communities Portfolio University Property 2013 Enrollment Beds EdR’s Share of Cost (In Millions) Distance to Campus (miles) University of Colorado The Lotus 26,148 195 $ 21 Adjacent University of Kentucky Multiple 25,658 2,381 138 On-Campus Duke University 605 West 15,386 384 42 1.0 University of Connecticut The Oaks on the Square Phase III 22,185 116 13 Adjacent University of Minnesota* The Marshall 38,767 994 47 Two Blocks Florida International University 109 Tower 32,180 542 43 Adjacent 2014 - Total/Weighted Average 26,366 4,612 $ 304 University of Kentucky Woodland Glen III, IV, V 25,658 1,610 101 On-Campus University of Georgia* Georgia Heights 31,364 292 28 Adjacent University of Connecticut The Oaks on the Square Phase IV 22,185 390 45 Adjacent University of Louisville The Retreat at Louisville 16,367 656 34 Adjacent 2015 - Total/Weighted Average 24,482 2,948 $ 208 University of Kentucky Limestone Park I & II 25,658 1,141 84 On-Campus 2016 - Total/Weighted Average 25,658 1,141 $ 84 On-Campus Total/Weighted Average 25,618 8,701 $596 0.1

. . Embedded External Growth Announced Developments Median distance to campus On-campus Average distance to campus 0.1 miles Average full-time enrollment 25,618 Average rental rate $832 Average Development Yields 7.0% - 8.0% Community Metrics – Announced Developments 26

. . • Best risk-adjusted return • Universities more accepting – Speed of completion – Reduced development and operating costs – Other demands on institutional funds – Modernization of on-campus housing • Significant competitive advantages – Proven on-campus development and management expertise – Well-capitalized balance sheet – Size and depth of resources – Public company transparency – Long-term owner of assets Unique P3 Opportunities – The ONE PlanSM 23% of EdR’s NOI will be from ONE Plan assets in 2014. Note: P3 equals Public-Private Partnership (1) Based on average economic yield of 7.5% and cap rates of 5.25% and 5.75% (2) Current and announced ONE Plan investments at Syracuse University, Texas Christian University, University of Texas-Austin and University of Kentucky 27 $26 $81 $111 $204 $342 $443 $527 2010 2011 2012 2013 2014 2015 2016 ONE Plan investments Market Value(1) $687-$753 Year-End Cumulative Cost in Millions (2) CAGR-65%

. . Unique P3 Opportunities – The ONE PlanSM On-Campus Opportunities • Coming from zero in 2008 through 2016, EdR and ACC will have invested a combined $1.6 billion in on-campus equity developments. • Programs have gained university acceptance. • Meetings with many universities and responding to RFQs and RFPs • Activity is as high as ever for primarily one-off transactions. • University System of Georgia on-campus privatized housing initiative Market Potential 28

. . External Growth Priorities • Highly fragmented • REITs own less than 5% • Outdated housing stock • Consolidation and development opportunities aplenty 29 Student Housing Marketplace

. . $93 $34 $10 $7 $92 $39 $7 $56 $22 $65 $123 $66 2014 2015 2016 2017 2018 2019 2020 2021 Unsecured Revolving Credit Facility - Variable Rate Unsecured Term Loan - Fixed Rate Mortgage Debt - Fixed Rate Mortgage Debt - Variable Rate Construction Loans - Variable Rate Proforma Debt Maturities(3) (In Millions) Capital Management (1) All data is as of June 30, 2014 per the company’s 2Q14 financial supplement except as noted. (2) Most recently announced quarterly dividend annualized. Based on stock price of $10.85 as of August 28, 2014. (3) Term loans entered into in January 2014 are reflected as fixed rate debt as the Company entered into swaps covering the total term loan balance. Prudent Financing Strategy • Appropriate Leverage Levels – Debt to Gross Assets: 33% – Net Debt to Enterprise Value: 29% – Net Debt to Adjusted EBITDA: 5.6x – Variable rate debt 33% of total debt • Strong Coverage Levels – Interest Coverage Ratio: 4.4x • Well-staggered debt maturities • $500 million unsecured Credit Facility expandable to $700 million • Attractive and well covered dividend(2) – Dividend Yield: 4.4% • Projected 39% debt-to-gross assets at the end of 2014, with announced deals Excellent Capital Structure(1) 30 $100 $121$126 $46

. . 24% 44% 50% 56% 66% 2010 2011 2012 2013 2014* Unencumbered Assets (% of Gross Assets) 2010 2011 2012 2013 2014* Interest Coverage 2.2x 2.7x 4.2x 4.6x 4.3x Source: Company disclosures. *Forecast based on current portfolio with no capital transactions and no additional funding requirements beyond announced developments. 31 Debt Metrics Capital Management

. . Safe Harbor Statement Statements about the Company’s business that are not historical facts are “forward-looking statements,” which relate to expectations, beliefs, projections, future plans and strategies, anticipated events or trends, and similar expressions. In some cases, you can identify forward-looking statements by the use of forward-looking terminology such as “may,” “will,” “should,” “expects,” “intends,” “plans,” “anticipates,” “believes,” “estimates,” “predicts,” “potential,” or the negative of these words and phrases or similar words or phrases which are predictions of or indicate future events or trends and which do not relate solely to historical matters. Forward-looking statements are based on current expectations. You should not rely on our forward-looking statements because the matters that they describe are subject to known and unknown risks and uncertainties that could cause the Company’s business, financial condition, liquidity, results of operations, Core FFO, FFO and prospects to differ materially from those expressed or implied by such statements. Such risks are set forth under the captions “Risk Factors,” “Forward-Looking Statements” and “Management’s Discussion and Analysis of Financial Condition and Results of Operations” (or similar captions) in our most recent Annual Report on Form 10-K and our quarterly reports on Form 10-Q, and as described in our other filings with the Securities and Exchange Commission. Forward-looking statements speak only as of the date on which they are made, and, except as otherwise may be required by law, the Company undertakes no obligation to update publicly or revise any guidance or other forward-looking statement, whether as a result of new information, future developments, or otherwise, except as required by law. Under the Private Securities Litigation Reform Act of 1995 32
