Attached files
| file | filename |
|---|---|
| 8-K - 8-K - Pattern Energy Group Inc. | d784866d8k.htm |
| Exhibit 99.1
|
Exhibit 99.1
Michael Garland | President & CEO
Michael Lyon | CFO
SEPTEMBER 2014
|
|
SAFE HARBOR STATEMENT
The following information contains, or may be deemed to contain, “forward-looking statements” (as defined in the U.S. Private Securities Litigation Reform Act of 1995 and Canadian securities laws). The words “may,” “plan,” “forecast,” “seek,” “target,” “goal,” “believe,” “expect,” “anticipate,” “intend,” “estimate” and other expressions that are predictions of or indicate future events and trends and that do not relate to historical matters identify forward-looking statements. You should not place undue reliance on these forward-looking statements about Pattern Energy Group Inc. (the “Company”). By their nature, forward-looking statements are not statements of historical facts and involve risks and uncertainties because they relate to events and depend on circumstances that may or may not occur in the future, many of which are outside the Company’s control. Such risks and uncertainties could cause the actual results, performance or achievements of the Company to be materially different from its current expectations and include, but are not limited to: the Company’s ability to complete construction of its construction projects and transition them into financially successful operating projects; fluctuations in supply, demand, prices and other conditions for electricity; the Company’s electricity generation, projections thereof and factors affecting production including wind and other conditions, other weather conditions, availability and curtailment; changes in law; and the Company’s ability to keep pace with and take advantage of new technologies.
In particular, this presentation contains the Company’s Adjusted EBITDA and cash available for distribution, which are not generally accepted accounting principles in the United States (“U.S. GAAP”). Adjusted EBITDA and cash available for distribution have been disclosed because the Company believes that these measures may assist investors in evaluating its financial performance and its ability to pay dividends. Neither Adjusted EBITDA nor cash available for distribution should be considered the sole measure of the Company’s performance and should not be considered in isolation from, or as a substitute for, the Company’s U.S. GAAP measures, including, but not limited to, the most directly comparable U.S. GAAP measures, net income (loss) and net cash provided by (used in) operating activities, respectively. The forecasts included in this presentation should not be relied upon as fact or as an accurate representation of future results. Assumptions and estimates underlying the forecast are inherently uncertain and the Company’s future operating results are subject to a wide variety of risks and uncertainties, including significant business, economic, and competitive risks and uncertainties. There can be no assurance that such assumptions will be realized or that the Company will generate cash available for distribution during the forecast periods at the levels forecasted, in which event the Company may not be able to pay cash dividends at the Company’s initial dividend level or at all.
All forward-looking statements speak only as of the date made, and the Company expressly disclaims any intention or obligation to revise or publicly update any forward-looking statements, including Adjusted EBITDA and cash available for distribution, whether as a result of new information, future events, or otherwise except as may be required by applicable law. For additional information regarding known material risks that could cause our actual results to differ from our projected results please read “Risk Factors” in our annual report on Form 10-K for the year ended December 31, 2013.
| 2 |
|
|
|
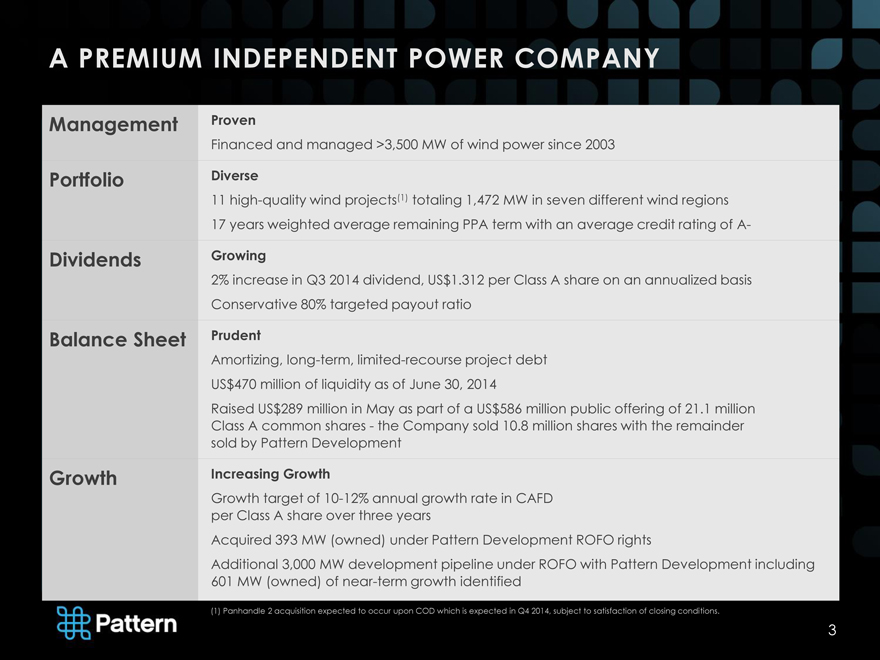
A PREMIUM INDEPENDENT POWER COMPANY
Management Proven
Financed and managed >3,500 MW of wind power since 2003
Portfolio Diverse
11 high-quality wind projects(1) totaling 1,472 MW in seven different wind regions
17 years weighted average remaining PPA term with an average credit rating of A-
Dividends Growing
2% increase in Q3 2014 dividend, US$1.312 per Class A share on an annualized basis
Conservative 80% targeted payout ratio
Balance Sheet Prudent
Amortizing, long-term, limited-recourse project debt
US$470 million of liquidity as of June 30, 2014
Raised US$289 million in May as part of a US$586 million public offering of 21.1 million
Class A common shares—the Company sold 10.8 million shares with the remainder
sold by Pattern Development
Growth Increasing Growth
Growth target of 10-12% annual growth rate in CAFD
per Class A share over three years
Acquired 393 MW (owned) under Pattern Development ROFO rights
Additional 3,000 MW development pipeline under ROFO with Pattern Development including
601 MW (owned) of near-term growth identified
(1) Panhandle 2 acquisition expected to occur upon COD which is expected in Q4 2014, subject to satisfaction of closing conditions.
| 3 |
|
|
|
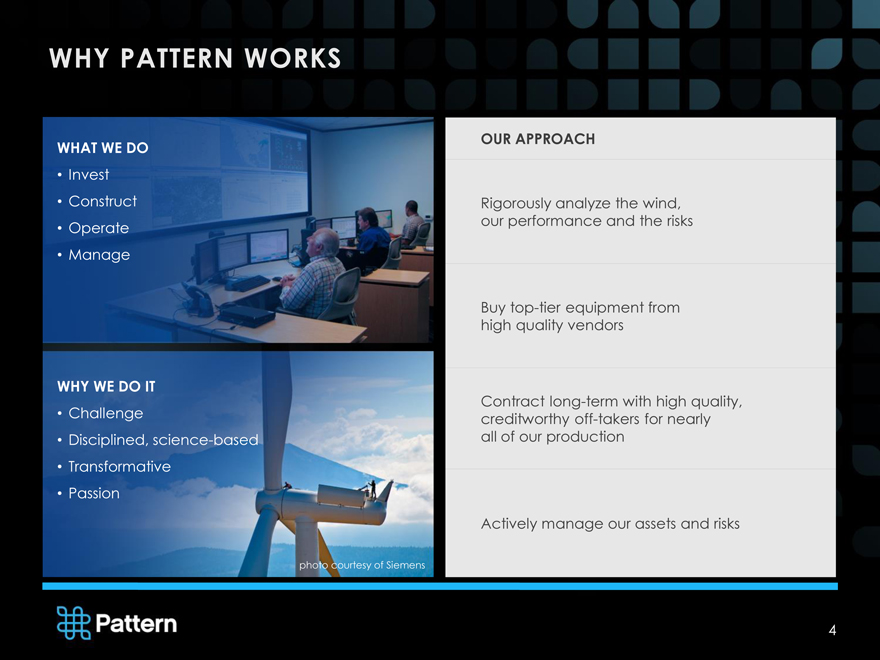
WHY PATTERN WORKS
WHAT WE DO
Invest
Construct
Operate
Manage
WHY WE DO IT
Challenge
Disciplined, science-based
Transformative
Passion
OUR APPROACH
Rigorously analyze the wind, our performance and the risks
Buy top-tier equipment from high quality vendors
Contract long-term with high quality, creditworthy off-takers for nearly all of our production
Actively manage our assets and risks
photo courtesy of Siemens
| 4 |
|
|
|
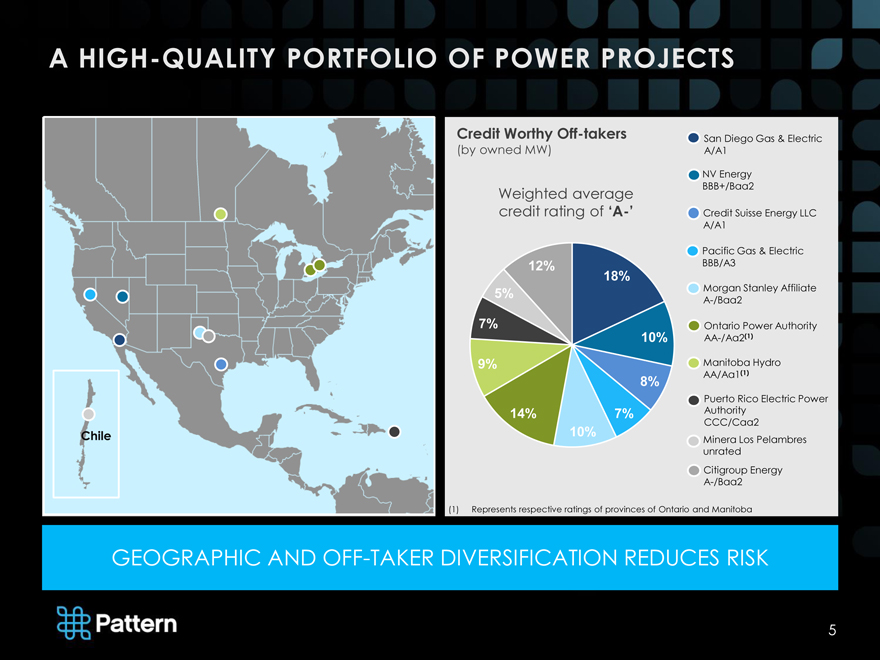
A HIGH-QUALITY PORTFOLIO OF POWER PROJECTS
Chile
Credit Worthy Off-takers San Diego Gas & Electric
(by owned MW) A/A1
NV Energy
Weighted average BBB+/Baa2
credit rating of ‘A-’ Credit Suisse Energy LLC
A/A1
Pacific Gas & Electric
12% BBB/A3
18%
5% Morgan Stanley Affiliate
A-/Baa2
7% Ontario Power Authority
10% AA-/Aa2(1)
9% Manitoba Hydro
8% AA/Aa1(1)
Puerto Rico Electric Power
14% 7% Authority
CCC/Caa2
10% Minera Los Pelambres
unrated
Citigroup Energy
A-/Baa2
| (1) |
|
Represents respective ratings of provinces of Ontario and Manitoba |
GEOGRAPHIC AND OFF-TAKER DIVERSIFICATION REDUCES RISK
| 5 |
|
|
|
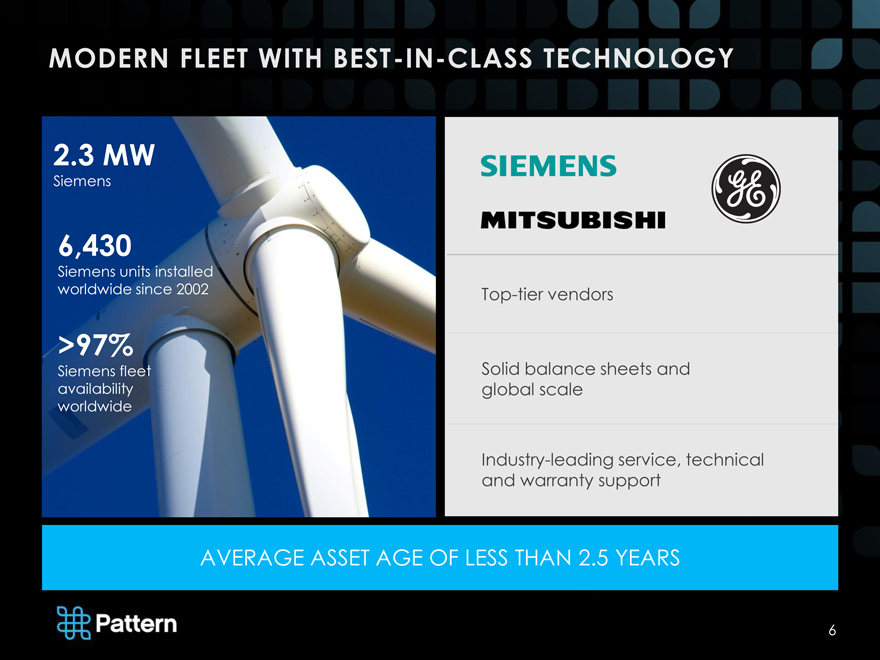
MODERN FLEET WITH BEST-IN-CLASS TECHNOLOGY
2.3 MW
Siemens
6,430
Siemens units installed worldwide since 2002
>97%
Siemens fleet availability worldwide
Top-tier vendors
Solid balance sheets and
global scale
Industry-leading service, technical
and warranty support
AVERAGE ASSET AGE OF LESS THAN 2.5 YEARS
| 6 |
|
|
|
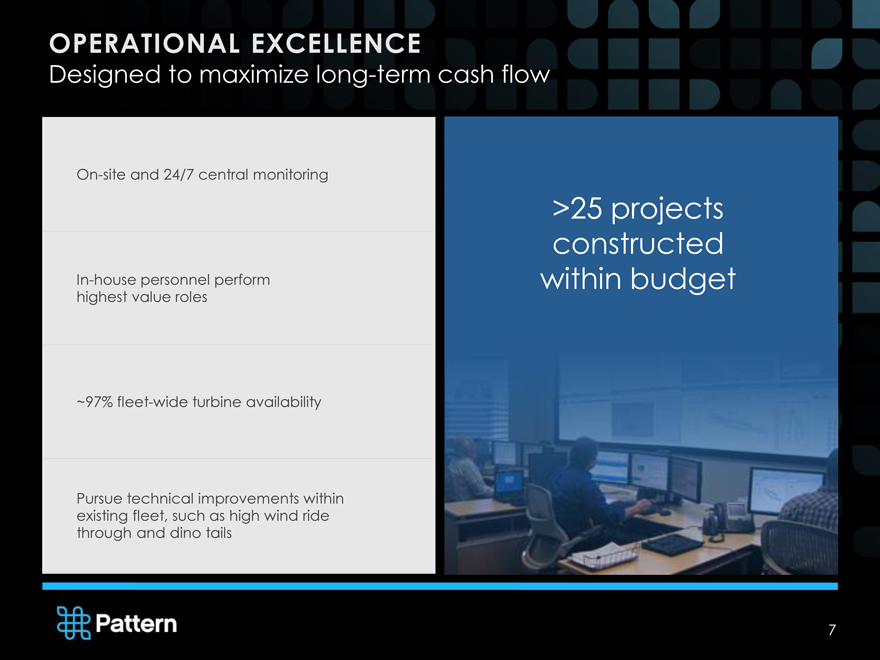
OPERATIONAL EXCELLENCE
Designed to maximize long-term cash flow
On-site and 24/7 central monitoring
In-house personnel perform highest value roles
~97% fleet-wide turbine availability
Pursue technical improvements within existing fleet, such as high wind ride through and dino tails
>25 projects constructed within budget
| 7 |
|
|
|

A HIGH-QUALITY PORTFOLIO OF POWER PROJECTS
Owned Contract % Under
Owned % MW Status Revenue Off-Taker COD Turbines Tenor Contract
Dec-2012/
Ocotillo, CA 100% 265 Operational PPA SDG&E Siemens 2033 100%
Jul-2013
Spring Valley, NV 100% 152 Operational PPA NV Energy Aug-2012 Siemens 2032 100%
Manitoba
St. Joseph, Manitoba 100% 138 Operational PPA Apr-2011 Siemens 2039 100%
Hydro
South Kent, Ontario Power
50% 135 Operational PPA Mar-2014 Siemens 2034 100%
Ontario Authority
Gulf Wind, TX 40% 113 Operational Hedge Credit Suisse Jul-2009 Mitsubishi 2019 ~58%
Hatchet Ridge, CA 100% 101 Operational PPA PG&E Dec-2010 Siemens 2025 100%
Santa Isabel, 100% 101 Operational PPA PREPA Dec-2012 Siemens 2037 100%
Puerto Rico
Citigroup
Panhandle 1, TX 79% 172 Operational Hedge Jun-2014 GE 2026 ~77%
Energy
Minera Los
El Arrayán, Chile 70% 80 Operational Hedge Jun-2014 Siemens 2034 ~75%
Pelambres
Morgan Stanley
Panhandle 2, TX(1) 81% 147 Construction Hedge Dec-2014 E Siemens 2027 ~80%
Affiliate
Grand Renewable, Ontario Power
45% 67 Construction PPA Dec-2014 E Siemens 2035 100%
Ontario Authority
Total Combined(1) 1,472 17 years 89%
(1) Panhandle 2 acquisition expected to occur upon COD which is expected in Q4 2014, subject to satisfaction of closing conditions.
| 8 |
|
|
|

DELIVERING ON GROWTH
El Arrayan
80 MW of a 115 MW wind project
Commenced operations June 2014
Panhandle 1
172 MW of a 218 MW wind project
Commenced operations June 2014
Grand Renewable
67 MW of a 149 MW project
Expected commercial operations Q4 2014
2(1)
Panhandle
147 MW of a 182 MW wind project
Expected commercial operations Q4 2014
| 2 |
|
MORE PROJECTS EXPECTED TO REACH COMMERCIAL OPERATION IN 2014 |
(1) Panhandle 2 acquisition expected to occur upon COD which is expected in Q4 2014, subject to satisfaction of closing conditions.
9
|
|

FINANCIALS
|
|

Q2 FINANCIAL SUMMARY
USD millions Q2 2014 Q2 2013 change YTD 2014 YTD 2013 change
(except gross margin)
Cash Available $16.1 $16.2 (1)% $33.9 $30.7 10%
for Distribution
Adjusted $58.8 $46.0 28% $96.0 $80.4 19%
EBITDA
GWh 770 497 55% 1,316 965 36%
Revenue $65.0 $58.7 11% $114.6 $102.5 12%
Gross Profit $27.0 $26.2 3% $39.3 $34.5 14%
Gross Margin 41.5% 44.6% na 34.3% 33.7% na
11
|
|

SUSTAINABLE DIVIDEND POLICY
DIVIDEND POLICY
Review financial results and prospects quarterly for dividend declaration Consideration of any expected contribution to sustainable CAFD from projects acquired from Pattern Development or third parties
ENHANCED DIVIDEND SUSTAINABILITY
Class B shares will convert into Class A shares on a 1-for-1 basis on December 31, 2014
DIVIDEND INCREASES
Period Paid/Payable Dividend per % increase
Class A share
Q1 2014 April 30 $0.3125 na
Q2 2014 July 20 $0.322 3%
Q3 2014 October 30 $0.328 2%
TARGET PAYOUT RATIO OF 80% PROVIDES
DIVIDEND STABILITY AND STRONG BASE FOR GROWTH
12
|
|

PRUDENT CAPITAL STRUCTURE
Corporate Debt None; except for corporate revolver
Project Debt Amortizing, long-term, non-recourse project debt of $1.8 billion with an average
annual debt service coverage ratio of more than 1.7x
Construction Our two projects currently under construction are fully financed with equity
Financing funded at construction start and debt committed(1)
Hedges Fixed rate debt or hedges on 100% of the project debt
CAPITAL STRUCTURE SET TO SUPPORT GROWTH
| (1) |
|
Acquisition of one of our projects is expected to occur upon COD, subject to satisfaction of closing conditions. |
13
|
|

GROWTH STRATEGY & OUTLOOK
|
|

KEY INVESTMENT CRITERIA
1 2 3
Accretive to Cash
Available for North America Low Risk Profile
Distribution per share
4 5 6
Ability to Control Utility Scale Proven Technologies
and Operate
TARGETED 10-12% ANNUAL GROWTH RATE IN CAFD PER SHARE OVER THREE YEARS
15
|
|

WIND INDUSTRY IS INTEGRAL TO NORTH AMERICAN ENERGY MIX
Number 1 or 2 source of new U.S. generating capacity in six of last seven years
8% of U.S. and Canadian supply by 2020 (est.) Long-term price stability for utilities 2-3 cents/kWh in Texas and Oklahoma
Power Efficiency Improvements
2,500 2014 Technology
2,000
2009
Technology
(kW) 1,500
Power
1,000 74% at improvement 8 m/sec
500
| 3 |
|
4 5 6 7 8 9 10 11 12 13 14 |
Wind Speed (meters per second)
TECHNOLOGY IMPROVEMENTS DRIVING WIND TOWARD GRID PARITY
16
|
|

LARGE OPPORTUNITY FOR GROWTH
10-12%
Targeted annual 3
growth rate in
CAFD per share
over three years
2
41%
41% 2,073 MW
601 MW
1,472 MW(1) 1
1,041 MW 431 MW
IPO 2014 Identified Future Third
Existing Portfolio ROFO ROFO Party
Projects Projects Acquisitions
GROWTH STRATEGY
3,000 MW of existing development pipeline through Pattern Development drop down acquisitions
1 5 Identified ROFO projects
2 Future ROFO projects from other Pattern Development projects
Third party acquisitions in large fragmented industry
3 Focus on acquisition of late-stage development and operating assets
Pursuing asset and corporate acquisition opportunities
OUR SPECIALIZED EXPERTISE CREATES ACQUISITION OPPORTUNITIES
(1) Panhandle 2 acquisition expected to occur upon COD which is expected in Q4 2014, subject to satisfaction of closing conditions.
17
|
|

5 ADDITIONAL OPPORTUNITIES IN ROFO PORTFOLIO
2 3
5
1 4
Chile
Existing Pattern assets
Near-term opportunities through Pattern Development purchase rights
Nameplate Wind
Real Inter-
MW Revenue Permits Data Status
Estate connection
(gross/owned) (years)
6 year Operational
1. Gulf Wind 283 / 76 9
hedge COD 2009
20 year PPA In construction
2. K2 270 / 90 5
with OPA COD 2015E
20 year PPA In financing
3. Armow 180 / 90 6
with OPA COD 2015E
25 year PPA In financing
4. Meikle 185 / 185 with BC 6
Hydro COD 2016E
10 year In financing
5. Logan’s Gap 200 / 160 PPA with 8
Walmart COD 2015E
Total 1,118 / 601
AT LEAST 2 ADDITIONAL NEAR-TERM OPPORTUNITIES FOR ROFO BY YEAR END TOTALING ~200-300 MW (OWNED)
18
|
|

SOLAR STRATEGY
Consistent approach based on our wind experience
PATTERN DEVELOPMENT
Development and drop downs provide best opportunities
THIRD PARTY ACQUISITIONS
Significant number of opportunities Moderately lower risk than wind – economics generally not as attractive
Utility scale
Long term contracts Creditworthy off-takers Same geographies
High quality suppliers and contractors Perform value added service: contract out commodity services
EXPERTISE TO EXECUTE IN THE RAPIDLY GROWING SOLAR MARKET
|
|

SHARED VISION AND ALIGNED INTERESTS
Pattern Development Pattern
Operations Development
1,472 MW portfolio (11 projects)(1) 3,000 MW pipeline
Executive management
Operating personnel Management services Development business
Operating and in Administrative and
construction assets Support services technical staff
Construction-ready
Purchase Rights Access to Growth projects
INSULATES PATTERN FROM DEVELOPMENT COSTS AND RISKS
(1) Panhandle 2 acquisition expected to occur upon COD which is expected in Q4 2014, subject to satisfaction of closing conditions.
20
|
|

MILESTONES
Grand Renewable South Kent Panhandle 1 El Arrayan COD
acquisition COD acquisition Panhandle 1 COD
Panhandle 2 agreement
acquisition
agreement
Q1 ‘14 Q2 ‘14 Q3 ‘14 Q4 ‘14
Pattern Assets Grand Renewable COD
Panhandle 2 COD
Pattern Development Logan’s Gap Armow financial closing
(ROFO) projects K2 financing contracted
Gulf Wind call right
21
|
|

Michael Garland | President & CEO
Michael Lyon | CFO
SEPTEMBER 2014
|
|

ADJUSTED EBITDA1
(NON-GAAP RECONCILIATION)
Three Months Six Months
Ended June 30, Ended June 30,
USD, millions (unless otherwise noted) 2014 2013 2014 2013
Net loss $7,167 $43,988 $(14,732) $25,204
Plus:
Interest expense, net of interest income 15,525 15,788 29,943 31,672
Tax (benefit) provision 4,065 (7,688) 2,033 (7,394)
Depreciation and accretion 21,284 17,998 42,461 40,564
EBITDA $48,041 $70,086 $59,705 $90,046
Unrealized loss on energy derivative 6,549 5,078 14,282 11,881
Unrealized loss (gain) on derivatives 2,942 (8,202) 6,665 (10,133)
Interest rate derivative settlements 1,035 — 2,052 -
Net gain on transactions (14,537) (7,200) (14,537) (7,200)
Plus, proportionate share from equity accounted investments:
Interest expense, net of interest income 4,944 (50) 5,197 (52)
Tax provision (benefit) 102 (12) 102 (48)
Depreciation and accretion 4,537 10 4,724 11
Unrealized loss on interest rate and currency derivatives 5,236 (13,731) 17,831 (3,948)
Realized loss (gain) on interest rate and currency
derivatives — (14) 22 (153)
Adjusted EBITDA $58,849 $45,965 $96,043 $80,404
23
|
|

CASH AVAILABLE FOR DISTRIBUTION 1
(NON—GAAP RECONCILIATION)
Three Months Six Months
Ended June 30, Ended June 30,
USD, millions (unless otherwise noted) 2014 2013 2014 2013
Net cash provided by operating activities $44,417 $33,266 $60,822 $41,657
Changes in current operating assets and liabilities (12,336) (938) (5,685) 11,757
Network upgrade reimbursement 618 618 1,236 618
Release of restricted cash to fund general and 7 — 61 -
administrative costs
Operations and maintenance capital expenditures (40) (156) (94) (375)
Transaction costs for acquisitions 1,128 — 1,128 -
Less:
Distributions to noncontrolling interests (1,470) (1,000) (1,470) (1,168)
Principal payments paid from operating cash flows (16,266) (15,584) (22,096) (21,815)
Cash available for distribution $16,058 $16,206 $33,902 $30,674
24
|
|

1SUMMARY NON-GAAP FINANCIAL MEASURES
Adjusted EBITDA represents net income before net interest expense, income taxes and depreciation and accretion, including our proportionate share of net interest expense, income taxes and depreciation and accretion for joint venture investments that are accounted for under the equity method. Adjusted EBITDA also excludes the effect of certain mark-to-market adjustments and infrequent items not related to normal or ongoing operations, such as early payment of debt and realized derivative gain or loss from refinancing transactions, and gain or loss related to acquisitions or divestitures. We disclose Adjusted EBITDA, which is a non-U.S. GAAP measure, because management believes this metric assists investors and analysts in comparing our operating performance across reporting periods on a consistent basis by excluding items that our management believes are not indicative of our core operating performance. We use Adjusted EBITDA to evaluate our operating performance. You should not consider Adjusted EBITDA as an alternative to net income (loss), determined in accordance with U.S. GAAP, or as an alternative to net cash provided by operating activities, determined in accordance with U.S. GAAP, as an indicator of our cash flows.
Adjusted EBITDA has limitations as an analytical tool. Some of these limitations are:
Adjusted EBITDA:
does not reflect our cash expenditures or future requirements for capital expenditures or contractual commitments; does not reflect changes in, or cash requirements for, our working capital needs;
does not reflect the significant interest expense, or the cash requirements necessary to service interest or principal payments, on our debt; does not reflect our income tax expense or the cash requirement to pay our taxes; and does not reflect the effect of certain mark-to-market adjustments and non-recurring items;
although depreciation and accretion are non-cash charges, the assets being depreciated and accreted will often have to be replaced in the future, and Adjusted EBITDA does not reflect any cash requirements for such replacements; and other companies in our industry may calculate Adjusted EBITDA differently than we do, limiting its usefulness as a comparative measure.
Because of these limitations, Adjusted EBITDA should not be considered in isolation or as a substitute for performance measures calculated in accordance with U.S. GAAP.
Cash available for distribution represents cash provided by (used in) operating activities as adjusted to (i) add or subtract changes in operating assets and liabilities, (ii) subtract net deposits into restricted cash accounts, which are required pursuant to the cash reserve requirements of financing agreements, to the extent they are paid from operating cash flows during a period, (iii) subtract cash distributions paid to noncontrolling interests, which currently reflects the cash distributions to our joint venture partners in our Gulf Wind project in accordance with the provisions of its governing partnership agreement and will in the future reflect distribution to other joint-venture partners, (iv) subtract scheduled project-level debt repayments in accordance with the related loan amortization schedule, to the extent they are paid from operating cash flows during a period, (v) subtract non-expansionary capital expenditures, to the extent they are paid from operating cash flows during a period, and (vi) add or subtract other items as necessary to present the cash flows we deem representative of our core business operations.
We disclose cash available for distribution because management recognizes that it will be used as a supplemental measure by investors and analysts to evaluate our liquidity. However, cash available for distribution has limitations as an analytical tool because it excludes depreciation and accretion, does not capture the level of capital expenditures necessary to maintain the operating performance of our projects, is not reduced for principal payments on our project indebtedness except to the extent it is paid from operating cash flows during a period, and excludes the effect of certain other cash flow items, all of which could have a material effect on our financial condition and results from operations. Cash available for distribution is a non-U.S. GAAP measure and should not be considered an alternative to net income, net cash provided by (used in) operating activities or any other liquidity measure determined in accordance with U.S. GAAP, nor is it indicative of funds available to fund our cash needs. In addition, our calculation of cash available for distribution is not necessarily comparable to cash available for distribution as calculated by other companies. Investors should not rely on this measure as a substitute for any U.S. GAAP measure, including net income (loss) and net cash provided by (used in) operating activities.
25