Attached files
| file | filename |
|---|---|
| EX-32 - EXHIBIT 32 - Pattern Energy Group Inc. | pegi2016123110kexhbit32.htm |
| EX-31.2 - EXHIBIT 31.2 - Pattern Energy Group Inc. | pegi2016123110kexhbit312.htm |
| EX-31.1 - EXHIBIT 31.1 - Pattern Energy Group Inc. | pegi2016123110kexhbit311.htm |
| EX-23.2 - EXHIBIT 23.2 - Pattern Energy Group Inc. | pegi2016123110kexhbit232.htm |
| EX-23.1 - EXHIBIT 23.1 - Pattern Energy Group Inc. | pegi2016123110kexhbit231.htm |
| EX-21.1 - EXHIBIT 21.1 - Pattern Energy Group Inc. | pegi2016123110kexhbit211.htm |
UNITED STATES
SECURITIES AND EXCHANGE COMMISSION
WASHINGTON, D.C. 20549
FORM 10-K
(Mark One)
x | ANNUAL REPORT PURSUANT TO SECTION 13 or 15(d) OF THE SECURITIES EXCHANGE ACT OF 1934 |
For the Fiscal Year Ended December 31, 2016.
-OR-
¨ | TRANSITION REPORT PURSUANT TO SECTION 13 OR 15(d) OF THE SECURITIES EXCHANGE ACT OF 1934 |
Commission File Number 001-36087
PATTERN ENERGY GROUP INC.
(Exact name of Registrant as specified in its charter)
Delaware | 90-0893251 | |
(State or other jurisdiction of incorporation or organization) | (I.R.S. Employer Identification No.) | |
Pier 1, Bay 3, San Francisco, CA 94111
(Address of principal executive offices) (Zip Code)
Registrant’s telephone number, including area code: (415) 283-4000
Securities registered pursuant to Section 12(b) of the Act:
Title of Each Class | Name of Each Exchange on Which Registered | |
Class A Common Stock, par value $0.01 per share | NASDAQ Global Select Market Toronto Stock Exchange | |
Securities registered pursuant to Section 12 (g) of the Act: None
Indicate by check mark if the registrant is a well-known seasoned issuer, as defined in Rule 405 of the Securities Act. Yes ý No ¨
Indicate by check mark if the registrant is not required to file reports pursuant to Section 13 or Section 15(d) of the Act. Yes ¨ No ý
Indicate by check mark whether the registrant (1) has filed all reports required to be filed by Section 13 or 15(d) of the Securities Exchange Act of 1934 during the preceding 12 months (or for such shorter period that the registrant was required to file such reports), and (2) has been subject to such filing requirements for the past 90 days. Yes ý No ¨
Indicate by check mark whether the registrant has submitted electronically and posted on its corporate Web site, if any, every Interactive Data File required to be submitted and posted pursuant to Rule 405 of Regulation S-T (§232.405 of this chapter) during the preceding 12 months (or for such shorter period that the registrant was required to submit and post such files). Yes ý No ¨
Indicate by check mark if disclosure of delinquent filers pursuant to Item 405 of Regulation S-K is not contained herein, and will not be contained, to the best of registrant’s knowledge, in definitive proxy or information statements incorporated by reference in Part III of this Form 10-K or any amendment to this Form 10-K. ¨
Indicate by check mark whether the registrant is a large accelerated filer, an accelerated filer, a non-accelerated filer, or a smaller reporting company. See the definitions of "large accelerated filer," "accelerated filer" and "smaller reporting company" in Rule 12b-2 of the Exchange Act.
Large accelerated filer | x | Accelerated filer | ¨ | |
Non-accelerated filer | ¨ | Smaller reporting company | ¨ | |
Indicate by check mark whether the registrant is a shell company (as defined in Rule 12b-2 of the Exchange Act.) Yes ¨ No ý
The aggregate market value of the voting stock and non-voting stock held by non-affiliates of the registrant based upon the last trading price of the registrant’s Class A common stock as reported on the NASDAQ Global Market on June 30, 2016 was approximately $1,308,543,222. This excludes 17,962,513 shares of Class A common stock held by directors, officers and Pattern Renewables LP and certain of its affiliates. Exclusion of shares does not reflect a determination that persons are affiliates for any other purpose.
The registrant’s Class A common stock began trading on the NASDAQ Global Market under the symbol "PEGI" and on the Toronto Stock Exchange under the symbol "PEG" on October 2, 2013.
On February 24, 2017, the registrant had 87,409,790 shares of Class A common stock, $0.01 par value per share, outstanding.
DOCUMENTS INCORPORATED BY REFERENCE
Portions of the registrant’s definitive proxy statement relating to its 2017 annual meeting of stockholders (the "2017 Proxy Statement") are incorporated by reference into Part III of this Form 10-K where indicated. The 2017 Proxy Statement will be filed with the U.S. Securities and Exchange Commission within 120 days after the end of the fiscal year to which this report relates.
1
TABLE OF CONTENTS
Item 1. | ||
Item 1A. | ||
Item 1B. | ||
Item 2. | ||
Item 3. | ||
Item 4. | ||
Item 5. | ||
Item 6. | ||
Item 7. | ||
Item 7A. | ||
Item 8. | ||
Item 9. | ||
Item 9A. | ||
Item 9B. | ||
Item 10. | ||
Item 11. | ||
Item 12. | ||
Item 13. | ||
Item 14. | ||
Item 15. | ||
2
CAUTIONARY NOTICE REGARDING FORWARD-LOOKING STATEMENTS
This Annual Report on Form 10-K ("Form 10-K") contains statements that may constitute forward-looking statements. You can identify these statements by forward-looking words such as "anticipate," "believe," "could," "estimate," "expect," "intend," "may," "plan," "potential," "should," "will," "would," or similar words. You should read statements that contain these words carefully because they discuss our current plans, strategies, prospects, and expectations concerning our business, operating results, financial condition, and other similar matters. While we believe that these forward-looking statements are reasonable as and when made, there may be events in the future that we are not able to predict accurately or control, and there can be no assurance that future developments affecting our business will be those that we anticipate. Our forward-looking statements involve significant risks and uncertainties (some of which are beyond our control) and assumptions that could cause actual results to differ materially from our historical experience and our present expectations or projections. Important factors that could cause our actual results to differ from those in the forward-looking statements, include but are not limited to, those summarized below and further described in Part I, Item 1A "Risk Factors:"
• | our ability to complete acquisitions of power projects; |
• | our ability to complete construction of construction projects and transition them into financially successful operating projects; |
• | fluctuations in supply, demand, prices and other conditions for electricity, other commodities and renewable energy credits (RECs); |
• | our electricity generation, our projections thereof and factors affecting production, including wind and other conditions, other weather conditions, availability and curtailment; |
• | changes in law, including applicable tax laws; |
• | public response to and changes in the local, state, provincial and federal regulatory framework affecting renewable energy projects, including the U.S. federal production tax credit (PTC), investment tax credit (ITC) and potential reductions in Renewable Portfolio Standards (RPS) requirements; |
• | the ability of our counterparties to satisfy their financial commitments or business obligations; |
• | the availability of financing, including tax equity financing, for our power projects; |
• | an increase in interest rates; |
• | our substantial short-term and long-term indebtedness, including additional debt in the future; |
• | competition from other power project developers; |
• | development constraints, including the availability of interconnection and transmission; |
• | potential environmental liabilities and the cost and conditions of compliance with applicable environmental laws and regulations; |
• | our ability to operate our business efficiently, manage capital expenditures and costs effectively and generate cash flow; |
• | our ability to retain and attract executive officers and key employees; |
• | our ability to keep pace with and take advantage of new technologies; |
• | the effects of litigation, including administrative and other proceedings or investigations, relating to our wind power projects under construction and those in operation; |
• | conditions in energy markets as well as financial markets generally, which will be affected by interest rates, foreign currency exchange rate fluctuations and general economic conditions; |
• | the effectiveness of our currency risk management program; |
• | the effective life and cost of maintenance of our wind turbines and other equipment; |
• | the increased costs of, and tariffs on, spare parts; |
• | scarcity of necessary equipment; |
• | negative public or community response to wind power projects; |
• | the value of collateral in the event of liquidation; and |
• | other factors discussed under "Risk Factors." |
3
Readers are cautioned not to place undue reliance on forward-looking statements, which speak only as of the date hereof. We undertake no obligation to publicly update or revise any forward-looking statements after the date they are made, whether as a result of new information, future events or otherwise.
Statistical Data
The statistical data used throughout this Form 10-K, other than data relating specifically solely to us, are based upon independent industry publications, government publications, reports by market research firms or other published independent sources. We did not commission any of these publications or reports. These publications generally state that they have obtained information from sources believed to be reliable, but do not guarantee the accuracy or completeness of such information. While we believe that each of these studies and publications is reliable, we have not independently verified such data and make no representation as to the accuracy of such information.
CURRENCY AND EXCHANGE RATE INFORMATION
In this Form 10-K, references to "C$" and "Canadian dollars" are to the lawful currency of Canada and references to "$", "US$" and "U.S. dollars" are to the lawful currency of the United States. All dollar amounts herein are in U.S. dollars, unless otherwise stated.
Our historical consolidated financial statements are presented in U.S. dollars. The following chart sets forth for each of 2016, 2015 and 2014, the high, low, period average and period end noon buying rates of Canadian dollars expressed as Canadian dollars per US$1.00.
Canadian Dollars per US$1.00 | |||||||||||||||||||
High | Low | Period Average | Period End | ||||||||||||||||
Year | |||||||||||||||||||
2016 | C$ | 1.4589 | C$ | 1.2544 | C$ | 1.3248 | C$ | 1.3427 | |||||||||||
2015 | 1.3987 | 1.1601 | 1.2788 | 1.3835 | |||||||||||||||
2014 | 1.1643 | 1.0614 | 1.1045 | 1.1501 | |||||||||||||||
The noon buying rate in Canadian dollars on February 24, 2017 was US$1.00 = C$1.3104.
The above rates differ from the actual rates used in our consolidated historical financial statements and the calculation of cash available for distribution and dividends we declared and paid described elsewhere in this Form 10-K. Our inclusion of these exchange rates is not meant to suggest that the U.S. dollar amounts actually represent such Canadian dollar amounts or that such amounts could have been converted into Canadian dollars at any particular rate or at all.
For information on the impact of fluctuations in exchange rates on our operations, see Item 1A "Risk Factors—Risks Related to Our Projects—Currency exchange rate fluctuations may have an impact on our financial results and condition" and Item 7A "Quantitative and Qualitative Disclosure about Market Risk—Foreign Currency Exchange Rate Risk."
4
MEANING OF CERTAIN REFERENCES
Unless the context provides otherwise, references herein to "we," "our," "us," "our company" and "Pattern" refer to Pattern Energy Group Inc., a Delaware corporation, together with its consolidated subsidiaries. In addition, unless the context requires otherwise, any reference in this Form 10-K to:
• | "employee transfer" refers to the event contemplated by the Multilateral Management Services Agreement pursuant to which we have the option, exercisable by delivery of written notice of exercise to Pattern Development 1.0 at any time prior to December 31 2017, to require Pattern Development 1.0 to cause the employees of Pattern Development 1.0 and its subsidiaries to become employees of us and our subsidiaries. From and after the occurrence of the employee transfer event, we, Pattern Development 1.0 and Pattern Development 2.0 will cooperate to cause such employee transfer to occur by the six month anniversary of the employee transfer event or as soon as reasonably practical thereafter; |
• | "FERC" refers to the U.S. Federal Energy Regulatory Commission; |
• | "FIT" refers to feed-in-tariff regime; |
• | "FPA" refers to the Federal Power Act; |
• | "Identified ROFO Projects" refers to projects that we have identified as development projects, owned by either of the Pattern Development Companies and subject to our Project Purchase Rights. As of February 24, 2017, the Identified ROFO Projects consist of Meikle, Conejo Solar, Belle River, Henvey Inlet, Mont Sainte-Marguerite, North Kent, Tsugaru, Ohorayama, Kanagi Solar and Futtsu Solar projects owned by Pattern Development 1.0 and Grady owned by Pattern Development 2.0 The Tsugaru, Ohorayama, Kanagi Solar and Futtsu Solar projects are held through Pattern Development 1.0’s majority stake investment in Green Power Investment Corporation (GPI) based in Tokyo, Japan; |
• | "IPPs" refers to independent power producers; |
• | "ISOs" refers to independent system organizations, which are organizations that administer wholesale electricity markets; |
• | "ITCs" refers to investment tax credits; |
• | "Multilateral Management Services Agreement" (MSA) refers to the multilateral services agreement between us and each of the Pattern Development Companies; |
• | "MW" refers to megawatts; |
• | "MWh" refers to megawatt hours; |
• | "Non-Competition Agreement" refers to a non-competition agreement between us and each of the Pattern Development Companies pursuant to which the Pattern Development Companies agree that, for so long as any of our respective Purchase Rights are exercisable, the Pattern Development Companies will not compete with us for acquisitions of power generation or transmission projects from third parties; |
• | "Pattern Development Companies" refers collectively to Pattern Development 1.0 and Pattern Development 2.0 and their respective subsidiaries (other than us and our subsidiaries); |
• | "Pattern Development Purchase Rights" refer collectively to our right to acquire Pattern Development 1.0 or substantially all of its assets, as contemplated by the Purchase Rights Agreement between us and Pattern Development 1.0 (Pattern Development 1.0 Purchase Right) and to our right to acquire Pattern Development 2.0 or substantially all of its assets, as contemplated by the Purchase Rights Agreement between us and Pattern Development 2.0 (Pattern Development 2.0 Purchase Right); |
• | “Pattern Development 1.0” refers to Pattern Energy Group LP, a Delaware limited partnership, and, where the context so requires, its subsidiaries (excluding us); |
• | “Pattern Development 2.0” refers to Pattern Energy Group 2 LP, a Delaware limited partnership, and, where the context so requires, its subsidiaries; |
• | "power sale agreements" refer to PPAs and/or hedging arrangements, as applicable; |
• | "PPAs" refer to power purchase agreements; |
5
• | "Project Purchase Rights" refers collectively to our right of first offer with respect to any power project that Pattern Development 1.0 decides to sell, as contemplated by the Purchase Rights Agreement between us and Pattern Development 1.0, and our right of first offer with respect to any power project that Pattern Development 2.0 decides to sell, as contemplated by the Purchase Rights Agreement between us and Pattern Development 2.0 (in each case including any Identified ROFO Projects); |
• | "Purchase Rights" refers collectively to the Project Purchase Rights, and the Pattern Development Purchase Rights, as contemplated by the Purchase Rights Agreement between us and Pattern Development 1.0 and the Purchase Rights Agreement between us and Pattern Development 2.0; |
• | "RECs" refers to renewable energy credits; |
• | "Riverstone" refers to Riverstone Holdings LLC; |
• | "ROFO" refers to right of first offer; |
• | "RPS" refers to Renewable Portfolio Standards; |
• | "Sarbanes-Oxley Act" refers to the Sarbanes-Oxley Act of 2002; and |
• | "U.S. Treasury" refers to the U.S. Department of the Treasury. |
6
PART I
Item 1. Business
Overview
We are an independent power company focused on owning and operating power projects with stable long-term cash flows in attractive markets with potential for continued growth of our business.
We hold interests in 18 wind power projects, including the Broadview project which we have committed to acquire in April 2017, located in the United States, Canada and Chile that use proven, best-in-class technology and have a total owned capacity of 2,644 MW. Each of our projects has contracted to sell all or a majority of its output pursuant to long-term, fixed-price or variable price, power sale agreements. Ninety-one percent of the electricity to be generated by our projects will be sold under our power sale agreements which have a weighted average remaining contract life of approximately 14 years as of December 31, 2016.
We were organized in the state of Delaware in October 2012. We issued 100 shares in October 2012 to Pattern Renewables LP, a 100% owned subsidiary of Pattern Development 1.0 and subsequently in October 2013 conducted an initial public offering.
Our Relationship with the Pattern Development Companies
In December 2016, certain investment funds managed by Riverstone Holdings LLC, which own interests in Pattern Development 1.0, engaged in a transaction in which (a) certain assets of Pattern Development 1.0 consisting principally of early and mid-stage U.S. development assets (including the Grady project which is an Identified ROFO Project) were transferred to a newly formed entity, Pattern Development 2.0, and (b) Pattern Development 1.0 retained the remainder of its assets consisting principally of the other Identified ROFO Projects, non-U.S. development assets, and its ownership interest in our Class A common stock. The purpose of the transaction was to facilitate additional long-term capital raises by the Pattern Development 2.0 to support the growth in the development pipeline. We also entered into other agreements with Pattern Development 2.0 which are substantially the same as existing agreements we have previously entered into with Pattern Development 1.0, including a purchase rights agreement. Pattern Development 2.0 is structured to allow us to potentially invest in Pattern Development 2.0 in the future.
As of December 31, 2016, Pattern Development 1.0 owned approximately 19% of our outstanding Class A common stock. Our continuing relationship with the Pattern Development Companies provides us with access to a pipeline of acquisition opportunities. We believe the Pattern Development Companies’ focus on project development combined with our Project Purchase Rights will complement our acquisition strategy, which focuses on the identification and acquisition of operational and construction-ready power projects.
7
Structure of Our Company
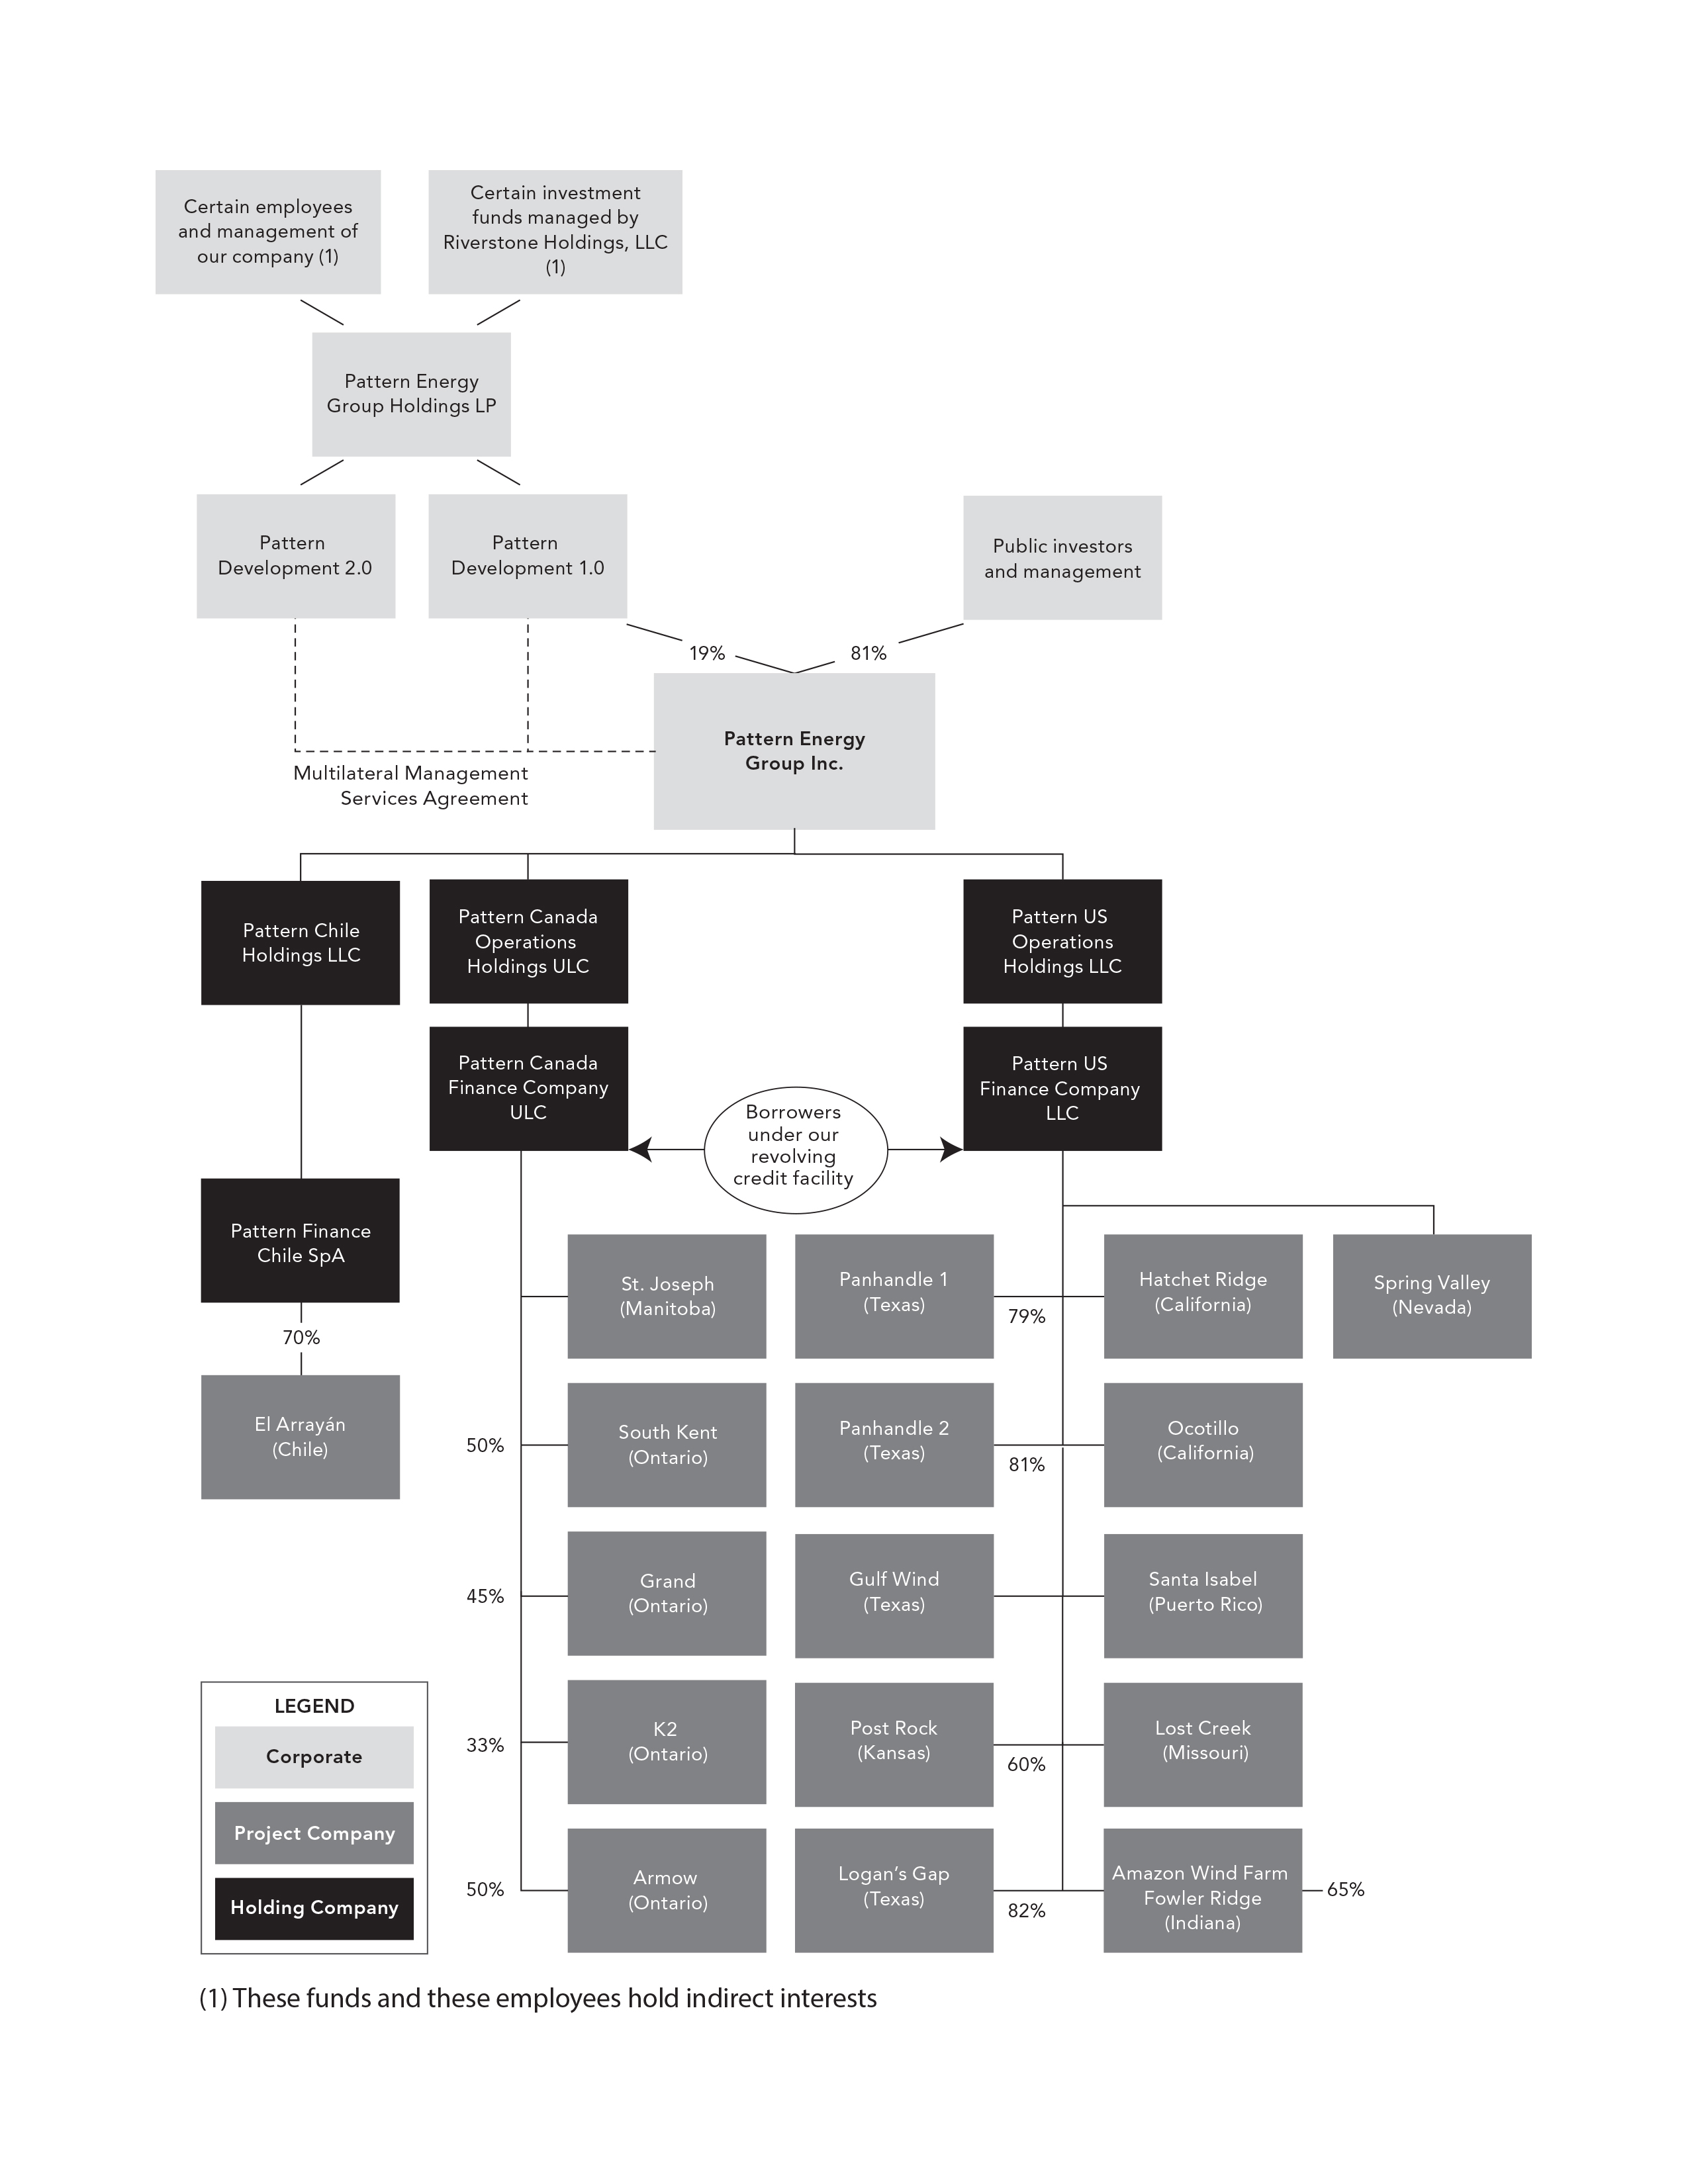
8
Industry
Wind power has been one of the fastest growing sources of electricity generation in North America and globally over the past decade. According to the Global Wind Energy Council (GWEC), global installed wind capacity grew by 55 GW last year, bringing the worldwide total to nearly 487 GW at the end of 2016. Wind power is supplying more new power generation than any other technology, and government projections indicate that renewable energy will continue to grow at a faster rate than fossil fuels over the next two decades, according to the International Energy Agency.
The growth in the industry is largely attributable to renewable energy’s increasing cost competitiveness with other power generation technologies, the advantages of wind power over other renewable energy sources, and growing public support for renewable energy driven by energy security and environmental concerns. As global demand for electricity generation from wind power has increased, technology enhancements, supported by U.S. government incentives have reduced the cost of wind power by approximately 66% over the last six years according to the Department of Energy’s 2014 Wind Technologies Market Report.
Given supply diversity requirements, falling equipment costs, the inherent stability of the cost of wind power as an energy resource and an active market for the purchase and sale of power projects, we believe that our markets present substantial growth opportunities. We require a relatively small share of a very large market to meet our growth objectives, and we believe we will achieve growth through the acquisition of operational and construction-ready projects from the Pattern Development Companies and other third parties.
While we currently operate primarily in wind power markets, we expect to continue to evaluate other types of independent power projects for possible acquisition, including renewable energy projects other than wind power projects.
Our Current Markets
The GWEC expects the North American market to add about 60 GW over the next five years. The United States is the largest producer of wind power in the world. U.S. federal, state and local governments have established various incentives to support the development of renewable energy. These incentives make the development of renewable energy projects more competitive by providing accelerated depreciation, tax credits for a portion of the development costs, decreasing the costs associated with developing such projects or creating demand for renewable energy assets through RPS programs.
In 2015, the total wind power capacity in the United States reached 74,471 MW, representing 41% of new capacity additions and meeting approximately 4.7% of total electricity demand, according to GWEC. The U.S. Energy Information Administration expects that for the third consecutive year, more than half of the new capacity additions in 2016 were renewable technologies, especially wind and solar. According to the American Wind Energy Association, the country’s total wind power capacity reached 82,183 MW at the end of 2016, with an additional 18,300 MW under construction or in advanced development. The success of wind power in the United States is evidenced by over $128.0 billion being invested in the U.S. economy by new wind power projects over the last 10 years.
The Canadian wind power industry has also experienced dramatic growth in recent years. Installed wind power generating capacity in Canada reached 11,898 MW as of December 2016, according to the Canadian Wind Energy Association. Ontario, one of our markets, leads the nation with 4,781 MW installed. In 2015, wind energy in Canada supplied approximately 5% of the country’s electricity demand.
Chile has an abundant wind energy resource, which the Chile National Energy Commission estimates could reach 40 GW of installed wind energy capacity. The country’s total wind power capacity was 933 MW at the end of 2015, according to GWEC.
Our Developing Markets
Although we do not yet have assets or Identified ROFO Projects in Mexico, it is a key potential market for us as the Pattern Development Companies are actively working in the country and we expect to add Mexican projects to the Identified ROFO Projects list in the future. Mexico’s Congress has enacted sweeping reforms to its electric generation industry in recent years, opening new opportunities for private investment in generation and creating a mandate to obtain at least 35% of its generation from clean sources by 2024. The government expects energy demand to increase 4% annually over the next decade and has a target of 2,000 MW of additional wind capacity per year until 2023.
In June 2015, we added two Japanese wind projects and two Japanese solar projects to our list of Identified ROFO Projects. Following the nuclear meltdown at the Fukushima Daiichi plant in 2011, the Japanese government has placed a greater emphasis on the development of renewable resources in order to reduce its reliance on nuclear power, releasing its Innovative Strategy for Energy and the Environment plan, which calls for renewable power generation to triple compared to 2010, reaching about 30% of total generation. In 2012, Japan also introduced a FIT program that offers fixed-term, fixed-price contracts (up to 20 years) to renewable power projects. The tariff will be re-
9
assessed every year based on the latest market experience in Japan. At the end of 2015, 3,038 MW of wind capacity was operating in Japan, accounting for approximately 0.5% of the total electricity demand.
The map below provides a depiction of our projects and IROFO projects geographically:
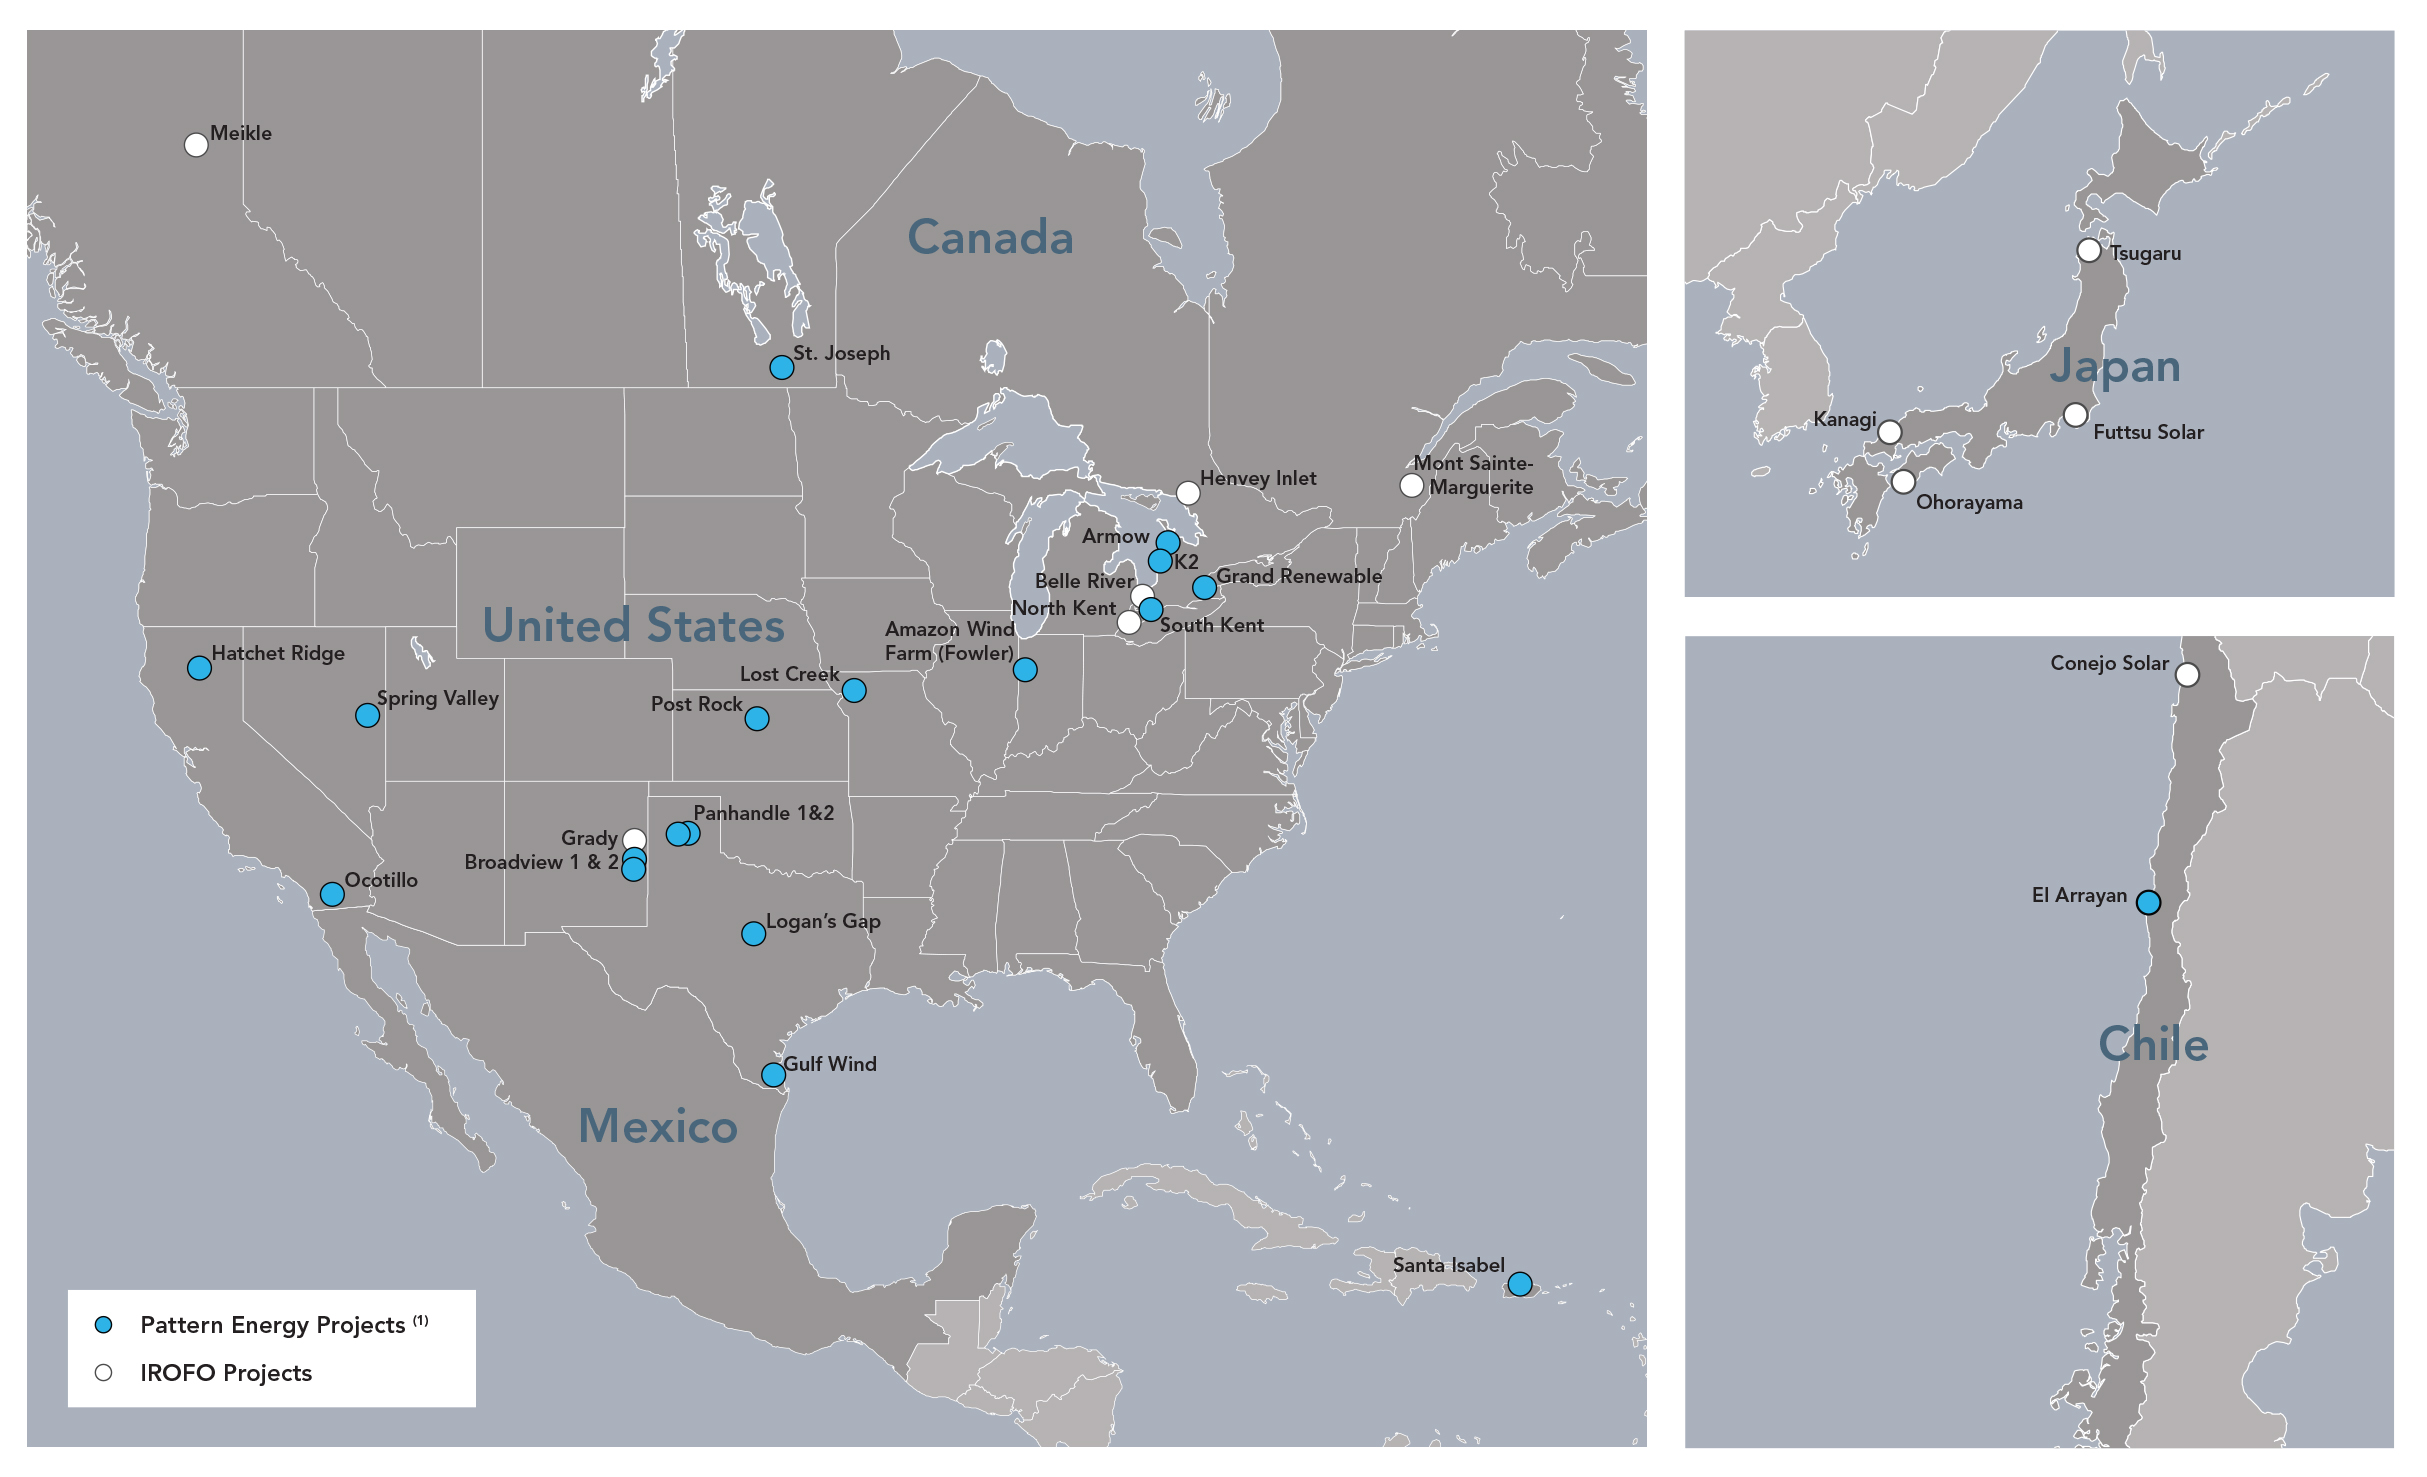
(1) | Includes Broadview, a 324 MW wind project and the associated independent 35-mile 345 kV Western Interconnect transmission line, which we have committed to acquire in April 2017. |
Our Core Values and Financial Objectives
We intend to maximize long-term value for our stockholders in an environmentally responsible manner and with respect for the communities in which we operate. Our business is built around three core values of creative energy and spirit, pride of ownership and follow-through, and a team first attitude, which guide us in:
• | creating a safe and high-integrity work environment for our employees; |
• | applying rigorous analysis to all aspects of our business in a timely, disciplined and functionally integrated manner to understand patterns in wind regimes, technology developments, market trends and regulatory, financial and legal constraints; and |
• | working proactively with our stakeholders to address environmental and community concerns, which we believe is a socially responsible approach that also benefits our business by reducing operating risks at our projects. |
Our financial objectives, which we believe will maximize long-term value for our stockholders, are to:
• | produce stable and sustainable cash available for distribution; |
• | selectively grow our project portfolio and our dividend per Class A share of common stock; and |
• | maintain a strong balance sheet and flexible capital structure. |
10
Our Business Strategy
To achieve our financial objectives while adhering to our core values, we intend to execute the following business strategies:
Maintaining and Increasing the Value of Our Projects
We intend to efficiently operate our projects to meet projected revenue and cash available for distribution. We expect to maximize the long-term value of our projects by focusing on value-oriented project availability (by ensuring our projects are operational when the wind is strong and power sale agreement prices are at their highest) and by regularly scheduled and preventative maintenance. We believe that good operating performance begins with a long-term maintenance program for our equipment. We also seek to improve performance or lower operating costs by working closely with our equipment vendors and considering contracting with third parties, when appropriate.
We believe it is important to employ our own personnel in aspects of our business that we deem critical to the value of our projects. We are in the process of revising long-term turbine manufacturer service arrangements at certain of our projects pursuant to which the turbine manufacturer will continue to provide routine and corrective maintenance service, but we would become responsible for a portion of the maintenance and repairs, including on major component parts. We employ on-site personnel, maintain a 24/7 operations control center to monitor our projects and control all critical aspects of commercial asset management.
Selectively Growing Our Business
Our strategy for growth is focused on the acquisition of operational and construction-ready power projects from the Pattern Development Companies and other third parties that we believe will contribute to the growth of our business and enable us to increase our dividend per share of Class A common stock over time. We expect that projects we may acquire in the future will represent a logical extension of our existing business and be consistent with our risk profile, and that any incremental assumption of risk will require commensurate expectations of higher returns. As a result, our near-term growth strategy will remain focused on largely contracted cash flows with creditworthy counterparties and operating or in-construction projects.
We expect that new opportunities will arise from our relationship with the Pattern Development Companies, which provide us with the opportunity to acquire projects that they successfully develop and efficiently complete construction and achieve commercial operations at these projects.
From time to time, we may also consider the disposal of a project, particularly if we believe we can utilize funds realized from such a disposal in a more productive manner or generate a higher return on investment. In addition, from time to time we have had conversations with potential investors who have expressed interest in discussing a range of potential transactions which have included investing together with us in projects, including our owned projects and Identified ROFO Projects, or otherwise making investments which might potentially provide us an additional source of capital. No assurances can be given that any transaction will result from such potential interest, or (if a transaction did result from such discussions) what the final structure and terms of such a transaction would be or whether such a transaction would result in the realization of benefits expected or contemplated.
Maintaining a Prudent Capital Structure and Financial Flexibility
We intend to maintain a conservative approach to our capital structure to protect our ability to meet our financial obligations, pay our regular dividends and to fund investments for future growth. Power projects by their nature require significant capital investment, and as a result, we seek to protect our business through careful management of our capital structure.
The foundation of our capital structure is built on project finance arrangements intended to ensure risk segmentation across our large project portfolio, and our practice has been to structure our project finance arrangements comprised of a mix of debt, tax equity and equity to conform to investment grade-like credit standards. Specifically, we seek to structure our project finance arrangements to:
• | match assets with liabilities based on a project’s off-take tenor and currency denomination; |
• | fix or hedge project debt on a long term basis; |
• | amortize our third party project finance capital within the tenor of the off-take arrangement; and |
• | apply conservative debt service coverage or tax equity structuring standards. |
Our project capital structure is supplemented with a corporate capital layer that primarily relies on equity capital. Our corporate indebtedness, which includes unsecured senior notes with an aggregate principal amount of $350.0 million which we issued in January 2017 (the 2024 Unsecured Senior Notes), is modest, serviced from project distributions (after corporate overhead) and intended to ensure
11
broad capital access. We seek to ensure financial flexibility and stability through our corporate revolving credit facility, maturity staging, minimization of interest rate exposure, and maintenance of our credit ratings. Our foreign currency denominated project dividends are further managed through a short-to-medium term foreign exchange program. We believe this approach, together with a strategic consideration of project-level financial restructuring and recapitalization opportunities, will contribute to our ability to maintain and, over time, increase our cash available for distribution.
Working Closely With Our Stakeholders
We believe that close working relationships with our various stakeholders, including suppliers, power sales agreement counterparties, regulators, the local communities where we are located and environmental organizations and with the Pattern Development Companies and other developers enable us to best support our existing projects and will help us access attractive, construction-ready projects.
Competition
We compete with other wind power, infrastructure funds and renewable energy companies, as well as conventional power companies, to acquire profitable construction-ready and operating projects. In addition, competitive conditions may be substantially affected by various forms of energy legislation and regulation considered from time to time by federal, state, provincial and local legislatures and administrative agencies.
Competitive Strengths
We believe we compete with other industry participants by having high quality projects which are positioned to generate stable long-term cash flows which in turn give us access to low-cost project-level debt and strong stakeholder relationships. Some of the key attributes of our projects include long-term fixed priced power sale agreements, a geographically diverse market with varying wind regimes and regulatory environment; and state-of-the-art wind turbines. Further contributing to our competitive strength is our approach to project selection which focuses on the acquisition of projects that are operational and have long term power sales agreements with creditworthy counterparties. We believe our relationship with the Pattern Development Companies provides us with access to a pipeline of acquisition opportunities that also supplements our competitive strengths. Pattern Development 1.0's ownership interest in us is 19%.
Our Projects
We hold interests in 18 wind power projects, located in the United States, Canada and Chile, including the Broadview project which we have committed to acquire in April 2017, that use proven, best-in-class technology and have a total owned capacity of 2,644 MW. Each of our projects has contracted to sell all or a majority of its output pursuant to a long-term, fixed-price or variable price PSAs. Each of our projects has gone through a rigorous vetting process in order to meet our investment and our lenders’ financing criteria. As a result, our projects generally have the following characteristics:
• | multi-year on-site wind data analysis tied to one or more long-term wind energy reference sources; |
• | long-term power sale agreements designed to ensure a predictable revenue stream; |
• | contractually secured real estate property and easement rights for a period well in excess of the project’s expected useful life and contractual obligations; |
• | a firm right to interconnect to the electricity grid through interconnection agreements, which define the cost allocation and schedule for interconnection, as well as any upgrades required to connect the project to the transmission system; |
• | long-term, limited-recourse, amortizing project financing designed to match the long-lived nature of our power projects and the related power sales agreements; |
• | secured construction and operating permits and other requisite federal, state or provincial and local permits, and regulatory approvals; |
• | fixed-price turbine supply and construction contracts with guaranteed completion dates; |
• | an operations and maintenance service program based on our own on-site personnel and central operations management as well as equipment warranties (for at least the first two years of operation) and service arrangements with qualified contractors experienced in wind project maintenance; and |
• | safety, environmental and community programs to support our existing projects and relationships in the communities in which we operate. |
12
The following table provides an overview of our wind projects:
Operating Project | Location | Commencement of Commercial Operations | Rated Capacity in MW(1) | Our Owned Capacity(2) | Type | Contracted Volume(3) | Counterparty | Counterparty Credit Rating(4) | Contract Expiration | |||||||||||
Hatchet Ridge | California | 2010 | 101 | 101 | PPA | 100% | Pacific Gas & Electric | BBB+/A3 | 2025 | |||||||||||
Ocotillo | California | 2012(5) | 265 | 265 | PPA | 100% | San Diego Gas & Electric | A/A1 | 2033 | |||||||||||
Spring Valley | Nevada | 2012 | 152 | 152 | PPA | 100% | NV Energy | A/Baa2 | 2032 | |||||||||||
Gulf Wind | Texas | 2009 | 283 | 283 | Hedge | 58% | Morgan Stanley | BBB+/A3 | 2019 | |||||||||||
Panhandle 1 | Texas | 2014 | 218 | 172 | Hedge | 80% | Citigroup Energy Inc. | BBB+/NA | 2027 | |||||||||||
Panhandle 2 | Texas | 2014 | 182 | 147 | Hedge | 80% | Morgan Stanley | BBB+/A3 | 2027 | |||||||||||
Logan's Gap | Texas | 2015 | 200 | 164 | PPA | 58% | Wal-Mart Stores, Inc. | AA/Aa2 | 2025 | |||||||||||
Logan's Gap | Hedge | 17% | Merrill Lynch Commodities, Inc. | BBB+/Baa1 | 2028 | |||||||||||||||
Post Rock | Kansas | 2012 | 201 | 120 | PPA | 100% | Westar Energy, Inc. | BBB+/Baa1 | 2032 | |||||||||||
Lost Creek | Missouri | 2010 | 150 | 150 | PPA | 100% | Associated Electric Cooperative, Inc. | AA/A2 | 2030 | |||||||||||
Amazon Wind Farm Fowler Ridge | Indiana | 2015 | 150 | 116 | PPA | 100% | Amazon.com, Inc. | AA-/NA | 2028 | |||||||||||
St. Joseph | Manitoba | 2011 | 138 | 138 | PPA | 100% | Manitoba Hydro | AA-/Aa2 | 2039 | |||||||||||
Santa Isabel | Puerto Rico | 2012 | 101 | 101 | PPA | 100% | Puerto Rico Electric Power Authority | D/Caa3 | 2037 | |||||||||||
El Arrayán | Chile | 2014 | 115 | 81 | Hedge | 74% | Minera Los Pelambres | NA | 2034 | |||||||||||
Grand | Ontario | 2014 | 149 | 67 | PPA | 100% | Independent Electricity System Operator(7) | NA/Aa2 | 2034 | |||||||||||
South Kent | Ontario | 2014 | 270 | 135 | PPA | 100% | Independent Electricity System Operator(7) | NA/Aa2 | 2034 | |||||||||||
K2 | Ontario | 2015 | 270 | 90 | PPA | 100% | Independent Electricity System Operator(7) | NA/Aa2 | 2035 | |||||||||||
Armow | Ontario | 2015 | 180 | 90 | PPA | 100% | Independent Electricity System Operator(7) | NA/Aa2 | 2035 | |||||||||||
Broadview(6) | New Mexico | 2017 | 324 | 272 | PPA | 100% | Southern California Edison | BBB+/A2 | 2037 | |||||||||||
3,449 | 2,644 | |||||||||||||||||||
(1) | Rated capacity represents the maximum electricity generating capacity of a project in MW. As a result of wind and other conditions, a project or a turbine will not operate at its rated capacity at all times and the amount of electricity generated may be less than its rated capacity. The amount of electricity generated may vary based on a variety of factors. |
(2) | Owned capacity represents the maximum, or rated, electricity generating capacity of the project in MW multiplied by our percentage ownership interest in the distributable cash flow of the project. |
(3) | Represents the approximate percentage of a project’s total estimated average annual MWh of electricity generation contracted under power purchase agreements or hedge arrangements. |
(4) | Reflects the counterparty’s or counterparty guarantor's corporate credit ratings issued by either Standard and Poor's (S&P) or Moody’s, or both S&P and Moody's, as of December 31, 2016. |
(5) | In 2013, 42 MW of owned capacity was added to our owned capacity. |
(6) | In June 2016, we committed to acquire from Pattern Development 1.0 an 84% interest in Broadview, a 324 MW wind project and a 99% interest in the associated independent 35-mile 345 kV Western Interconnect transmission line. |
(7) | Independent Electricity System Operator (IESO) acts as the settlement agent under the respective PPA. |
Identified Right of First Offer Projects
Our continuing relationship with the Pattern Development Companies provides us with access to a pipeline of acquisition opportunities. Currently, the Pattern Development Companies have a 5,900 MW pipeline of development projects, all of which are subject to our right of first offer. We target achieving a total owned capacity of 5,000 MW by year end 2019 through a combination of acquisitions from the Pattern Development Companies and other third parties capitalizing on the large and fragmented global renewable energy market. Our business is primarily focused in the U.S., Canada and Chile; however, we expect opportunities in Japan and Mexico will form part of our growth strategy.
Below is a summary of the Identified ROFO Projects that we expect to acquire from Pattern Development 1.0 and Pattern Development 2.0 in connection with our Project Purchase Rights:
Capacity (MW) | ||||||||||||||||
Identified ROFO Projects | Status | Location | Construction Start(1) | Commercial Operations(2) | Contract Type | Rated(3) | Owned Capacity(4) | |||||||||
Pattern Development 1.0 Projects | ||||||||||||||||
Kanagi Solar | Operational | Japan | 2014 | 2016 | PPA | 14 | 6 | |||||||||
Futtsu Solar | Operational | Japan | 2014 | 2016 | PPA | 42 | 19 | |||||||||
Conejo Solar | Operational | Chile | 2015 | 2016 | PPA | 104 | 104 | |||||||||
Meikle | Operational | British Columbia | 2015 | 2017 | PPA | 180 | 180 | |||||||||
Belle River | In construction | Ontario | 2016 | 2017 | PPA | 100 | 43 | |||||||||
Ohorayama | In construction | Japan | 2016 | 2018 | PPA | 33 | 31 | |||||||||
Mont Sainte-Marguerite | In construction | Québec | 2017 | 2017 | PPA | 147 | 147 | |||||||||
Henvey Inlet | Late stage development | Ontario | 2017 | 2018 | PPA | 300 | 150 | |||||||||
North Kent | Late stage development | Ontario | 2017 | 2018 | PPA | 100 | 43 | |||||||||
Tsugaru | Late stage development | Japan | 2017 | 2019 | PPA | 126 | 63 | |||||||||
Pattern Development 2.0 Projects | ||||||||||||||||
Grady | Late stage development | New Mexico | 2018 | 2019 | PPA | 220 | 176 | |||||||||
1,366 | 962 | |||||||||||||||
(1) | Represents year of actual or anticipated commencement of construction. |
(2) | Represents year of actual or anticipated commencement of commercial operations. |
(3) | Rated capacity represents the maximum electricity generating capacity of a project in MW. As a result of wind and other conditions, a project or a turbine will not operate at its rated capacity at all times and the amount of electricity generated may be less than its rated capacity. The amount of electricity generated may vary based on a variety of factors. |
(4) | Owned capacity represents the maximum, or rated, electricity generating capacity of the project in MW multiplied by either Pattern Development 1.0's or Pattern Development 2.0's percentage ownership interest in the distributable cash flow of the project. |
Government Incentives and Tax Credits
Renewable energy sources in the United States have benefited from various federal and state governmental incentives, such as production tax credits and investment tax credits. Production tax credits and investment tax credits for wind energy on the federal level were extended in December of 2015, under the Consolidated Appropriations Act which extended the expiration date for tax credits for wind facilities commencing construction, with a five year phase-down beginning for wind projects commencing construction after December 31, 2014.
Hedging Activity
Most of our revenue is subject to long-term PPAs. To the extent that PPAs are not available in a given market, but market prices allow for acceptable project economics, we will enter into hedging agreements to obtain a fixed price for the energy output of our projects, typically by hedging volumes that are expected to be exceeded 99.0% of the time. Those hedging agreements are executed for a monthly or hourly production profile that matches the forecasted production profile of the project.
Most of our interest rate exposure is hedged either through fixed-rate debt arrangements or hedging of floating rate loans. We enter into interest rate hedging agreements to convert floating-rate debt to fixed-rate debt for some of our projects, usually at the time we close
14
construction or term financing of a project. We also monitor our corporate-level interest rate exposure and may, from time to time, enter into interest rate hedges in order to mitigate our exposure.
We have a currency risk management program. The objective of the program is to mitigate the foreign exchange rate risk arising from transactions or cash flows that have a direct or underlying exposure in non-U.S. dollar denominated currencies in order to reduce volatility in our cash flow, which may have an adverse impact to our short-term liquidity or financial condition.
Geographic information
The table below provides information about our consolidated operations by country. Revenue is recorded in the country in which it is earned and assets are recorded in the country in which they are located (in thousands):
Revenue | Property, Plant and Equipment, net | |||||||||||||||||||||||
Year ended December 31, | December 31, | |||||||||||||||||||||||
2016 | 2015 | 2014 | 2016 | 2015 | 2014 | |||||||||||||||||||
United States | $ | 285,187 | $ | 258,542 | $ | 201,408 | $ | 2,652,122 | $ | 2,791,259 | $ | 1,810,414 | ||||||||||||
Canada | 39,207 | 39,178 | 46,593 | 177,093 | 184,115 | 233,690 | ||||||||||||||||||
Chile | 29,658 | 32,111 | 17,492 | 305,947 | 319,246 | 332,947 | ||||||||||||||||||
Total | $ | 354,052 | $ | 329,831 | $ | 265,493 | $ | 3,135,162 | $ | 3,294,620 | $ | 2,377,051 | ||||||||||||
Customers
We sell our electricity and RECs primarily to local utilities under long-term, fixed-price PPAs or, in limited instances, local liquid ISO markets. For the year ended December 31, 2016, significant customers representing greater than 10% of total revenue were San Diego Gas & Electric and Morgan Stanley Capital Group Inc., which accounted for 14.6% and 10.9% of our total revenue, respectively.
15
Suppliers
There are a limited number of turbine suppliers and, although demand for turbines in the past has generally been high relative to manufacturing capacity, we believe that current turbine manufacturing capacity is adequate. Our turbine supply strategy is largely based on maintaining strong relationships with leading turbine suppliers to secure our supply needs.
Project | Supplier | Number of Turbines | Turbine Type | |||
Hatchet Ridge | Siemens | 44 | SWT-2.3-93 | |||
Ocotillo | Siemens | 112 | SWT-2.3-108 | |||
Spring Valley | Siemens | 66 | SWT-2.3-101 | |||
Gulf Wind | Mitsubishi | 118 | MWT 95/2.4 | |||
Panhandle 1 | General Electric | 118 | 1.85 - 87 | |||
Panhandle 2 | Siemens | 79 | SWT-2.3-108 | |||
Logan’s Gap | Siemens | 87 | SWT-2.3-108 | |||
Post Rock | General Electric | 134 | 1.5-82.5 | |||
Lost Creek | General Electric | 100 | 1.5-82.5 | |||
Amazon Wind Farm Fowler Ridge | Siemens | 65 | SWT-2.3-108 | |||
St. Joseph | Siemens | 60 | SWT-2.3-101 | |||
Santa Isabel | Siemens | 44 | SWT-2.3-108 | |||
El Arrayán | Siemens | 50 | SWT-2.3-101 | |||
Grand | Siemens | 67 | SWT-2.3-101 | |||
South Kent | Siemens | 124 | SWT-2.3-101 | |||
K2 | Siemens | 140 | SWT-2.3-101 | |||
Armow | Siemens | 91 | SWT-2.3-101 | |||
Broadview(1) | Siemens | 141 | SWT-2.3-108 | |||
(1) | We have committed to acquire the Broadview project and expect to close in April 2017. |
Data from Siemens, which supplies the turbines for the majority of our fleet, indicates that worldwide fleet availability for the 2.3MW turbine class exceeds 97%, and our Siemens fleet availability also met 97% in 2016. Apart from Siemens we have relationships with other reputable turbine manufacturers such as General Electric and Mitsubishi. Our future projects may utilize turbines from these and other manufacturers.
Other important suppliers include engineering and construction companies, such as M. A. Mortenson Company, RES-Americas and Blattner Energy, Inc., with whom we contract to perform civil engineering, electrical work and other infrastructure construction for our projects.
We currently utilize service providers to provide maintenance services to our project equipment. These services are currently provided by the turbine manufacturers, such as Siemens or General Electric, at most of our project sites. We believe there are currently adequate independent service provider alternatives to the turbine manufacturers to meet our needs, and in some cases we do utilize such alternative providers. As discussed earlier, we are in the process of revising long-term turbine manufacturer service arrangements at certain of our projects pursuant to which the turbine manufacturer will continue to provide routine and corrective maintenance service, but we would become responsible for a portion of the maintenance and repairs, including on major component parts.
Regulatory Matters
Our operations are subject to regulation by various federal and state government agencies, including, but, not limited to, the following:
U.S. Federal Energy Regulatory Commission (FERC)
Our current projects in operation in the United States are operating as Exempt Wholesale Generators (EWGs) as defined under the Public Utility Holding Company Act of 2005, as amended, (PUHCA) and therefore are exempt from certain regulation under PUHCA. Other than Gulf Wind, Panhandle 1, Panhandle 2, and Logan’s Gap, our operating projects in the United States are, however, public utilities under the Federal Power Act subject to rate regulation by FERC. Our future projects in the United States will also likely be subject to
16
such rate regulation once they are placed into service. Our projects in the United States that are subject to FERC rate regulation are required to obtain acceptance of their rate schedules for wholesale sales of energy (i.e., not retail sales to consumers), capacity and ancillary services, including their ability to charge “market-based rates.”
Independent System Operators (ISOs)
Most of our North American projects are located in regions in which the wholesale electric markets are administered by ISOs and Regional Transmission Organizations (RTOs). Several of our current operating projects are subject to the California ISO (CAISO), which is the ISO that prescribes rules for the terms of participation in the California energy market; ERCOT, which is the ISO that prescribes the rules for and terms of participation in the Texas energy market; and the Independent Electricity System Operator (IESO) which is the ISO that administers the wholesale electricity market in Ontario.
North American Electric Reliability Corporation
All of our current operating projects located in North America are also subject to the reliability standards of the North American Electric Reliability Corporation (NERC). If we fail to comply with the mandatory reliability standards, we could be subject to sanctions, including substantial monetary penalties.
Regulatory Matters - Canada
All of our current operating projects in Canada are subject to exclusive provincial regulatory authority with respect to the generation and production of electricity, which varies across provincial jurisdictions. In Canada, activities related to owning and operating wind projects and participating in wholesale and retail energy markets are regulated at the provincial level. In Ontario, for example, electricity generation facilities must be licensed by the Ontario Energy Board and may also be required to complete registrations and maintain market participant status with the IESO, in which case they must agree to be bound by and comply with the provisions of the market rules for the Ontario electricity market as well as the mandatory reliability standards of the NERC.
Environmental Regulation
Our operations are required to comply with various environmental, health and safety laws and regulations in each of the jurisdictions in which we operate. These existing and future laws and regulations may impact existing and new projects, require us to obtain and maintain permits and approvals, comply with all environmental laws and regulations applicable within each jurisdiction and implement environmental, health and safety programs and procedures to monitor and control risks associated with the construction, operation and decommissioning of regulated or permitted energy assets, all of which involve a significant investment of time and resources. Existing initiatives and rules, some of which could potentially have a material effect (either positive or negative) on us, are as follows:
Avian/Bat Regulations and Wind Turbine Siting Guidelines
We are subject to numerous environmental regulations and guidelines related to threatened and endangered species and their habitats, as well as avian and bat species, for the ongoing operations of our facilities. Environmental laws in the U.S., including the Endangered Species Act, the Migratory Bird Treaty Act, and the Bald and Golden Eagle Protection Act as well as similar environmental laws in Canada (such as the Species at Risk Act, the Migratory Birds Convention Act and the Endangered Species Act of 2007), among others, provide for the protection of migratory birds, eagles and bats and endangered species of birds and bats and their habitats. In addition to regulations, voluntary wind turbine siting guidelines established by the U.S. Fish and Wildlife Service set forth siting, monitoring and coordination protocols that are designed to support wind development in the U.S. while also protecting both birds and bats and their habitats.
Regulation of Greenhouse Gas (GHG) Emissions
The U.S. Congress and certain states and regions, as well as the Government of Canada and its provinces, have taken and continue to take certain actions, such as finalizing regulation or setting targets and goals, regarding the reduction of GHG emissions and the increase of renewable energy generation.
Environmental Matters— Domestic
We are required to obtain a range of environmental permits and other approvals to build and operate our projects, including, but not limited to, those described below from U.S. federal, state and local governmental authorities. In addition to being subject to these regulatory requirements, we could experience and have experienced significant opposition from third parties when we initially apply for permits or
17
when there is an appeal proceeding after permits are issued. The delay or denial of a permit or the imposition of conditions that are costly or difficult to comply with can impair or even prevent the development of a project or can increase the cost so substantially that the project is no longer attractive to us.
Federal Clean Water Act
Frequently, our U.S. projects are located near wetlands, and we are required to obtain permits under the Clean Water Act for the discharge of dredged or fill material into waters of the United States, including wetlands and streams. The Clean Water Act also requires that we mitigate any loss of wetland functions and values that accompanies our activities, obtain permits under the Clean Water Act for water discharges, such as storm water runoff associated with construction activities, and to follow a variety of best management practices to ensure that water quality is protected and impacts are minimized.
Federal Bureau of Land Management Permits
As some of our U.S. projects are located on lands administered by the Bureau of Land Management, we are required to obtain rights-of-way from the Bureau of Land Management. The Bureau of Land Management encourages the development of wind power within acceptable areas, consistent with Environmental Policy Act of 2005 and the Bureau of Land Management’s energy and mineral policy.
National Environmental Policy Act
Our U.S. projects may also be subject to environmental review under the U.S. National Environmental Policy Act (NEPA) which requires federal agencies to evaluate the environmental impact of all "major federal actions" significantly affecting the quality of the human environment. The granting of a land lease, a federal permit or similar authorization for a major development project, or the interconnection of a significant private project into a federal project generally is considered a "major federal action" that requires review under NEPA. As part of the NEPA review, the federal agency considers a broad array of environmental impacts, including impacts on air quality, water quality, wildlife, historical and archaeological resources, geology, socioeconomics and aesthetics and alternatives to the project. A federal agency may decide to deny a permit based on its environmental review under NEPA, though in most cases a project would be redesigned to reduce impacts or agree to provide some form of mitigation to offset impacts before a denial is issued.
National Historic Preservation Act
U.S. federal agencies consider a project’s impact on historical or archeological resources under the U.S. National Historic Preservation Act and may require us to conduct archeological surveys or take other measures to protect these resources. The National Historic Preservation Act requires federal agencies to evaluate the impact of all federally funded or permitted projects on historic properties (buildings, archaeological sites, etc.)
Other State and Local Programs
In addition to federal requirements, our U.S. projects, and any future U.S. projects we may acquire, are subject to a variety of state environmental review and permitting requirements. Many states where our projects are located, or may in the future be located, have laws that require state agencies to evaluate a broad array of environmental impacts before granting state permits. The state environmental review process often resembles the federal NEPA process and may be more stringent than the federal review. Our projects also often require state law based permits in addition to federal permits.
Our projects also are subject to local environmental and regulatory requirements, including county and municipal land use, zoning, building and transportation requirements. Local or state regulatory agencies may require modeling and measurement of permissible sound levels in connection with the permitting and approval of our projects. Local or state agencies also may require us to develop decommissioning plans for dismantling the project at the end of its functional life and establish financial assurances for carrying out the decommissioning plan.
Environmental Matters—Canada
We are required to obtain a range of environmental permits and other approvals to build and operate our Canadian projects, including, but not limited to, those described below from Canadian federal, provincial and local governmental authorities. In addition to being subject to these regulatory requirements, we could experience and have experienced significant opposition from third parties, including, but not limited to, environmental non-governmental organizations, neighborhood groups, municipalities and First Nations when the permits were initially applied for or when there is an appeal proceeding after permits are issued. The delay or denial of a permit or the
18
imposition of conditions that are costly or difficult to comply with can impair or even prevent the development of a project or can increase the cost so substantially that the project is no longer attractive to us.
Ontario Renewable Energy Approvals
Our projects in Ontario are subject to Ontario’s Environmental Protection Act, which requires proponents of significant renewable energy projects to obtain a Renewable Energy Approval (REA). The REA application requires a variety of studies on environmental, archeological and heritage issues. Significant public consultation, as well as consultation with indigenous communities, is also required. Before issuing a REA, the Ontario Ministry of the Environment evaluates a broad range of potential impacts, including on wildlife, wetlands and water resources, communities, scenic areas, species and heritage resources, as well as impacts on people. This review can be time consuming and expensive, and an approval can be rejected or approved with conditions that are costly or difficult to comply with. REAs are also subject to appeal by third parties and can result and have resulted in lengthy appeal tribunal hearings.
Quebec Environmental Impact Assessment
Quebec`s Environmental Impact Assessment (EIA) is a required permit for wind energy projects with a nameplate capacity above 10 MW. The EIA requires a variety of studies related to environmental, archeological and heritage issues. Significant public consultation, as well as consultation with indigenous communities, is also required. The culmination of this permitting process is the issuing of a project specific decree by the provincial council of ministers. Before issuing the decree, the Quebec Ministry of Environment evaluates a broad range of potential impacts, including on wildlife, wetlands and water resources, communities, scenic areas, species and heritage resources, as well as impacts on people.
Quebec Commission for the Protection of Agricultural Land
In addition to the EIA process, the other major permit in Quebec is granted by the Quebec Commission for the Protection of Agricultural Land. This permit is only required on land that is zoned agricultural. This permitting body will push proponents to minimize footprints during both the construction phase and the operations phase.
Manitoba Environment Act
The Manitoba Environment Act requires proponents of significant projects to submit a proposal with the Manitoba Conservation Environmental Assessment & Licensing Branch, and to comply with Manitoba’s environmental assessment process under the Environment Act. This process will consider a similar range of impacts on the environment, the heritage and scenic values of an area and on people, communities and wildlife as the Ontario process, and brings with it similar risks.
Endangered Species Legislation
Our Canadian renewable energy projects may be subject to endangered species legislation, either federally or provincially, which prohibits and imposes stringent penalties for harming endangered or threatened species and their habitats. Our projects may also be subject to the Migratory Birds Convention Act, which protects the habitat of migratory species, and which may also trigger federal "Species at Risk" requirements. Because the operation of wind turbines may result in injury or fatalities to birds and bats, avian and bat risk assessments are generally required both prior to permits being issued for projects and after commercial operations. In Ontario, if any of the affected species are listed as endangered or threatened, permits under the Endangered Species Act may also be required.
Other Approvals
Our Canadian projects, and any future projects we may acquire, are subject to a variety of other federal, provincial and municipal permitting and zoning requirements. Most provinces where our projects are located or may be located have laws that require provincial agencies to evaluate a broad array of environmental impacts before granting permits and approvals. These agencies evaluate similar issues as the permitting regimes above, including impact on wildlife, historic sites, aesthetics, wetlands and water resources, scenic areas, endangered and threatened species and communities. In addition, federal government approvals dealing with, among other things, aeronautics, fisheries, navigation or species protection may be required and could in some cases trigger additional environmental assessment requirements. Additional requirements related to the permitting of transmission lands may be applicable in some cases. Our projects are also subject to certain municipal requirements, including land use and zoning requirements except where superseded by Ontario’s Green Energy and Green Economy Act, 2009, as well as requirements for building permits and other municipal approvals that can be difficult or costly to comply with and impair or prevent the development of a project.
19
Environmental Matters – Chile
We are required to obtain a range of environmental permits and other approvals from various governmental agencies in Chile to build and operate our projects, including, but not limited to, items described below.
Ministry of Environment
The Ministry of the Environment is responsible for the formulation and implementation of environmental policies, including those affecting the wind industry, plans and programs, as well as for the formulation of environmental quality and emission standards, the protection and conservation of biological diversity, renewable natural resources and water resources, and for promoting sustainable development and the integrity of environmental policy and regulations.
Environmental Assessment Service
The Environmental Assessment Service is responsible for assessing whether projects that might have an adverse effect on the environment, including wind projects, comply with Chilean environmental laws and regulations.
Superintendency of Environment
The Superintendency of the Environment’s primary responsibilities are monitoring compliance with the terms of the corresponding environmental licenses, as well as monitoring compliance with government plans to prevent environmental damage or to clean or restore contaminated geographical areas. The Superintendency of the Environment has the power to suspend activities that it deems to have an adverse environmental impact, even if such activities comply with a previously approved environmental impact assessment. In case of noncompliance with environmental regulations, it is enabled to apply fines, revoke the environmental license of a project or determine its closure.
The Environmental Courts, and Health and Safety
The Environmental Courts are principally responsible for hearing appeals of determinations made by the Superintendency of the Environment and for adjudicating claims for environmental damage.
Companies in the wind energy sector, like all companies, must comply with the general principles concerning employee health and safety contained in the Chilean Sanitary Code, Labor Code and other labor and health regulations. The Chilean Health Ministry and the Department of Labor are responsible for the enforcement of those standards, with the authority to impose fines among other sanctions. In addition, the Superintendence of Electricity and Fuels has the responsibility to monitor compliance and also the authority to impose fines and stop operations of violators.
Management, Disposal and Remediation of Hazardous Substances
We own and lease real property and may be subject to requirements regarding the storage, use and disposal of petroleum products and hazardous substances, including spill prevention, control and counter-measure requirements. If our owned or leased properties are contaminated, whether during or prior to our ownership or operation, we could be responsible for the costs of investigation and cleanup and for any related liabilities, including claims for damage to property, persons or natural resources. That responsibility may arise even if we were not at fault and did not cause or were not aware of the contamination. In addition, waste we generate is at times sent to third-party disposal facilities. If those facilities become contaminated, we and any other persons who arranged for the disposal or treatment of hazardous substances at those sites may be jointly and severally responsible for the costs of investigation and remediation, as well as for any claims for damage to third parties, their property or natural resources.
Employees
As of December 31, 2016, we had 140 full-time employees. None of our employees are represented by a labor union or covered by any collective bargaining agreement.
Available Information
We make our United States Securities and Exchange Commission (SEC) filings, including our annual report on Form 10-K, quarterly reports on Form 10-Q, current reports on Form 8-K, and any amendments to those reports, available free of charge on our website, www.patternenergy.com, as soon as reasonably practicable after those documents are electronically filed with or furnished to the SEC.
20
The information and materials available on our website are not incorporated by reference into this Form 10-K. The SEC maintains a website that contains reports, proxy and information statements, and other information regarding registrants that file electronically with the SEC at www.sec.gov.
Item 1A. | Risk Factors. |
RISK FACTORS
You should carefully consider the following risks, together with other information provided to you in this Form 10-K. If any of the following risks were to occur, our business prospects, financial condition, results of operations and liquidity could be materially adversely affected. In that case, we might have to decrease, or may not be able to pay, dividends on our Class A shares, the trading price of our Class A shares could decline and you could lose all or part of your investment. The risks described below are not the only risks facing our company. Risks and uncertainties not currently known to us or that we currently deem to be immaterial also may materially adversely affect our business prospects, financial condition and results of operations and liquidity.
Risks Related to Our Projects
Electricity generated from wind energy depends heavily on suitable wind conditions and wind turbines being available for operation. If wind conditions are unfavorable or below our expectations, or our wind turbines are not available for operation, our projects’ electricity generation and the revenue generated from our projects may be substantially below our expectations.
The revenue generated by our projects is principally dependent on the number of MWh generated in a given time period. The quantity of electricity generation from a wind power project depends heavily on wind conditions, which are variable. Variability in wind conditions can cause our project revenues to vary significantly from period to period. We base our decisions about which projects to acquire as well as our electricity generation estimates, in part, on the findings of long-term wind and other meteorological studies conducted on the project site and its region, which measure the wind’s speed, prevailing direction and seasonal variations. Projections of wind resources also rely upon assumptions about turbine placement, wind turbine power curves, interference between turbines and the effects of vegetation, land use and terrain, which involve uncertainty and require us to exercise considerable judgment. We may make incorrect assumptions in conducting these wind and other meteorological studies. Any of these factors could cause our projects to generate less electricity than we expect and reduce our revenue from electricity sales, which could have a material adverse effect on our business prospects, financial condition and results of operations.
Even if an operating project’s historical wind resources are consistent with our long-term estimates, the unpredictable nature of wind conditions often results in daily, monthly and yearly material deviations from the average wind resources we may anticipate during a particular period. If the wind resources at a project are materially below the average levels we expect for a particular period, our revenue from electricity sales from the project could correspondingly be less than expected. A diversified portfolio of projects located in different geographical areas tends to reduce the magnitude of the deviation, but material deviations may still occur. Our cash available for distribution is most directly affected by the volume of electricity generated and sold by our projects. However, for a static portfolio of projects, our consolidated expenses, including operating expenses and interest payments on indebtedness, have less variability than the volume of electricity generated and sold. Accordingly, decreases in the volume of electricity generated and sold by our projects typically result in a proportionately greater decrease in our cash available for distribution. See Item 7 “Management’s Discussion and Analysis of Financial Condition and Results of Operation-Factors that Significantly Affect our Business-Factors Affecting our Operational Results-Electricity Sales and Energy Derivative Settlements of Our Operating Projects.”
A reduction in electricity generation and sales, whether due to the inaccuracy of wind energy assessments or otherwise, could lead to a number of material adverse consequences for our business, including:
• | our projects’ failure to produce sufficient electricity to meet our commitments under our PPAs, hedge arrangements or contracts for sale of RECs, which could result in our having to purchase electricity or RECs on the open market to cover our obligations or result in the payment of damages or the termination of a PPA; |
• | our projects not generating sufficient cash flow to make payments of principal and interest as they become due on project-related debt, or distributing sufficient cash flow to pay dividends to holders of our Class A shares. For example, certain of our projects have experienced lower than expected production and merchant power prices resulting in those projects failing to pass financial tests that measure cumulative cash distributions to the members. This will result in a temporary change of the cash percentage to be directed to the tax equity members until the shortfall is remedied. See “-Risks Related to Ownership of our Class A Shares - |
21
Our cash available for distribution to holders of our Class A shares may be reduced as a result of restrictions on our subsidiaries’ cash distributions to us under the terms of their indebtedness;” and
• | our projects’ hedging arrangements being ineffective or more costly. |
Our projects rely on a limited number of key power purchasers. The power purchaser for our Santa Isabel project has been downgraded.
There are a limited number of possible power purchasers for electricity and RECs produced in a given geographic location. Because our projects depend on sales of electricity and RECs to certain key power purchasers, our projects are highly dependent upon these power purchasers fulfilling their contractual obligations under their respective PPAs. Our projects’ power purchasers may not comply with their contractual payment obligations or may become subject to insolvency or liquidation proceedings during the term of the relevant contracts and, in such event, we may not be able to find another purchaser on similar or favorable terms or at all. In addition, we are exposed to the creditworthiness of our power purchasers and there is no guarantee that any power purchaser will maintain its credit rating, if any. To the extent that any of our projects’ power purchasers are, or are controlled by, governmental entities, our projects may also be subject to legislative or other political action that impairs their contractual performance. Failure by any key power purchasers to meet its contractual commitments or the insolvency or liquidation of one or more of our power purchasers could have a material adverse effect on our business prospects, financial condition and results of operations.
Our 101 MW Santa Isabel project located on the south coast of Puerto Rico sells 100% of its electricity generation including environmental attributes to the Puerto Rico Electric Power Authority (PREPA) under a 20-year PPA. PREPA’s credit ratings have been downgraded and as of February 24, 2017 were Caa3, D, and C, as rated by each of Moody’s, Standard & Poor’s, and Fitch, respectively, all of which are below investment grade. Furthermore, PREPA entered into a restructuring support agreement with certain lenders, bondholders and bond insurers which would implement a plan that would reduce PREPA’s bonds and fuel credit lines debt burden and provide principal debt service relief for five years. However, restructuring under such agreement has not occurred because several conditions precedent remain pending. While as of February 24, 2017, PREPA is current with respect to payments due under the PPA, a failure by PREPA to perform its payment obligations under the PPA, a failure to consummate the restructuring support agreement or to negotiate a new restructuring agreement with its creditors, or the initiation of bankruptcy proceedings for PREPA by its oversight board may affect its obligations under the PPA which could have an adverse effect on our business prospects, financial condition and results of operations.
A prolonged environment of low prices for natural gas, other conventional fuel sources, or competing renewable resources could have a material adverse effect on our long-term business prospects, financial condition and results of operations.
Historically low prices for traditional fossil fuels, particularly natural gas, could cause demand for wind power and solar power to decrease and adversely affect both the price available to us under power sale agreements that we may enter into in the future and the price of the electricity we generate for sale on a spot-market basis. Nine percent of our owned capacity will be subject to spot-market pricing. See Item 7A "Quantitative and Qualitative Disclosures about Market Risk—Commodity Price Risk." Low spot-market power prices, if combined with other factors, could have a material adverse effect on our results of operations and cash available for distribution. Additionally, cheaper conventional fuel sources or competing renewable resources (which may also arise through excessive building of renewable resources in a limited geographic area resulting in congestion and potential curtailment) could also have a negative impact on the power prices we are able to negotiate upon the expiration of our current power sale agreements or upon entering into a power sale agreement for a subsequently acquired power project. As a result, the price of our electricity or RECs subject to the open market could be materially and adversely affected, which could, in turn, have a material adverse effect on our results of operations and cash available for distribution. Accordingly, our future growth prospects could be adversely affected if we remain solely focused on renewable energy projects and are unable to transition to conventional power projects such as gas-fired power projects.
22
Operation and maintenance problems at our renewable energy projects including natural events may cause our electricity generation to fall below our expectations.
Our electricity generation levels depend upon our ability to maintain the working order of our wind turbines and balance of the plant. A natural disaster, severe weather, accident, failure of major equipment, shortage of or inability to acquire critical replacement or spare parts, failure in the operation of any future transmission facilities that we may acquire, including the failure of interconnection to available electricity transmission or distribution networks, could damage or require us to shut down our turbines or related equipment and facilities, impeding our ability to maintain and operate our facilities and decreasing electricity generation levels and our revenues. Our Ocotillo project experienced a blade failure in November 2016. The blade type that failed is used at several of our projects, and we are working with Siemens to complete a root cause analysis, examine whether a serial defect exists, and inspect similar blades in our fleet. While the inspection and repair of blades has affected turbine availability at Ocotillo, the project is covered by warranty agreements which provide liquidated damage compensation. No assurances can be given that potential equipment deficiencies will not in fact continue to occur, that we will always have warranty coverage for any such defects, that the warranty provider would fulfill its obligations under such warranty coverage (including any liquidated damages compensation provisions), or that any such effects will not have a material adverse effect on our business prospects, financial condition and results of operation.
We typically enter into warranty agreements with the turbine manufacturer for two to ten-year terms, however, such agreements are typically subject to an aggregate maximum liability cap and there can be no assurance that the manufacturer or third-party service provider will be able to fulfill its contractual obligations. In addition, such agreements can vary as to what equipment maintenance risks are fully assumed by the service provider and what equipment failure risks will be repaired at the owner’s cost. As warranty terms with the manufacturer expire we may and have entered into service agreements with the OEMs or other third party service providers.
For example, we intend to enter into revised long-term turbine manufacturer service arrangements at certain of our projects pursuant to which the turbine manufacturer continues to provide routine and corrective maintenance service, but we are responsible for a portion of the maintenance and repairs, including on major component parts. While the intended revised service arrangements reduce fixed contract costs, in the event of unexpectedly high turbine component failures for which we as owner have assumed responsibility, we may face decreased revenues of a project and increased project expense which could have a material adverse effect on our business prospects, financial condition, results of operations and ability to make cash distributions to our investors. We expect over time in the future to take on additional risks as an owner, including self-performing maintenance and service work with our own technicians instead of utilizing service providers, which will have continuing expected cost benefits, but will similarly come with additional increased risks and reduced third party warranty and guarantee protections.
Replacement and spare parts for wind turbines and key pieces of electrical equipment may be difficult or costly to acquire or may be unavailable. Sources for some significant spare parts and other equipment are often located outside of the jurisdictions in which our power projects operate. Additionally, our operating projects generally do not hold spare substation main transformers. These transformers are designed specifically for each wind power project, and order lead times can be lengthy. If one of our projects had to replace any of its substation main transformers, it would be unable to sell all of its power until a replacement is installed. To the extent we experience a prolonged interruption at one of our operating projects due to natural events or operational problems and such events are not fully covered by insurance, our electricity generation levels and revenues could materially decrease, which could have a material adverse effect on our business prospects, financial condition and results of operation.
Climate change may have the long-term effect of changing wind patterns at our projects which could have a material adverse effect on our business prospects, financial condition, results of operations and ability to make cash distributions to our investors
In addition, climate change may have the long-term effect of changing wind patterns at our projects. Changing wind patterns could cause changes in expected electricity generation. These events could also degrade equipment or components and the interconnection and transmission facilities’ lives or maintenance costs. We may face decreased revenues of a project and increased project expense which could have a material adverse effect on our business prospects, financial condition, results of operations and ability to make cash distributions to our investors.
We have a limited operating history and our growth may make it difficult for us to manage our project expansion efficiently.
We have a relatively new portfolio of assets, including several projects that have only recently commenced commercial operations. Stockholders should consider our prospects in light of the risks and uncertainties growing companies encounter in rapidly evolving industries such as ours. Also, our anticipated near-term growth could make it difficult for us to manage our project expansion efficiently due to an inability to employ a sufficient number of skilled personnel or otherwise to effectively manage our capital expenditures and control our costs, including the requisite general and administrative costs necessary to achieve our anticipated growth. These challenges could adversely affect our ability to manage our current or future operating projects in an efficient manner and complete construction of
23
our construction projects in a timely manner, either of which could have a material adverse effect on our business prospects, financial condition and results of operation.
Our operations are subject to numerous environmental, health and safety laws and regulations.
Our projects are subject to numerous environmental, health and safety laws and regulations in each of the jurisdictions in which our projects operate or will operate. These laws and regulations require our projects to obtain and maintain permits and approvals, undergo environmental impact assessments and review processes and implement environmental, health and safety programs and procedures to control risks associated with the siting, construction, operation and decommissioning of power projects. For example, to obtain permits some projects are, in certain cases, required to undertake programs to protect and maintain local endangered or threatened species. If such programs are not successful, our projects could be subject to increased levels of mitigation, penalties or revocation of our permits.
Violations of environmental and other laws, regulations and permit requirements, including certain violations of laws protecting wetlands, migratory birds, bald and golden eagles and threatened or endangered species, may also result in criminal sanctions or injunctions. In addition, if our projects do not comply with applicable laws, regulations or permit requirements, or if there are endangered or threatened species fatalities at our projects, we may be required to pay penalties or fines or curtail or cease operations of the affected projects. For example, in connection with a permit we obtained at our Spring Valley wind facility, we had to adopt a mitigation plan with respect to injuries and fatalities to golden eagles, and were required to establish a process in the event of incidents, including reporting to the U.S. Fish and Wildlife Service. We have followed such required processes in connection with three golden eagle incidents since January 1, 2013, and, in addition, we have filed an application for an eagle take permit which is under consideration by the U.S. Fish and Wildlife Service. While we have entered into an agreement with U.S. Fish and Wildlife to fund additional research into mitigation measures and incurred nominal fines with respect to the prior eagle incidents, no assurances can be given that we will not be required to implement further increased levels of mitigation, or face additional penalties, fines, or other measures as a result of golden eagle incidents at our Spring Valley facility or any of our other wind facilities. In addition, no assurances can be given that our eagle take permit will be approved.
Certain environmental laws impose liability on current and previous owners and operators of real property for the cost of removal or remediation of hazardous substances, even if the owner or operator did not know of, or was not responsible for, the release of such hazardous substances. In addition to actions brought by governmental agencies, private plaintiffs may also bring claims arising from the presence of hazardous substances on a property or exposure to such substances. Our projects’ liabilities at properties we own or operate arising from past releases of, or exposure to, hazardous substances could have a material adverse effect on our business prospects, financial condition and results of operations.
Environmental, health and safety laws, regulations and permit requirements may change and become more stringent. Any such changes could require our projects to incur additional material costs or cause our projects to suffer adverse consequences. For example, the Ministry of Environment in Ontario has established regulatory requirements governing noise restrictions for wind farms which are an integral part of the permitting framework for our projects in certain jurisdictions. In the event of changes in either the regulatory requirements or permitting framework, there is risk that our projects that were designed for compliance within the existing framework and requirements for noise could still be evaluated by regulators as noncompliant. These risks are enhanced because testing for compliance with noise requirements is technically complex, carries some degree of uncertainty, and does not have significant precedent in that market. In the event of a determination of noncompliance, there is risk that the necessary mitigation, which would likely need to occur during periods of higher wind speeds, could require curtailment of energy production at the facility, with a resulting reduction in revenues.
Our projects’ costs of complying with current and future environmental, health and safety laws, regulations and permit requirements (including any change in noise regulations), and any liabilities, fines or other sanctions resulting from violations of them, could have a material adverse effect on our business prospects, financial condition and results of operations.
We may be unable to complete any future construction projects on time, and our construction costs could increase to levels that make a project too expensive to complete or make the return on our investment in that project less than expected.
While we currently do not have projects in construction, there may be delays or unexpected developments in completing any future construction projects, which could cause the construction costs of these projects to exceed our expectations. Our construction projects are typically constructed under fixed-price and fixed-schedule contracts with construction and equipment suppliers. However, these contracts typically provide for limitations on the liability of these contractors to pay us liquidated damages for cost overruns and construction delays. We may suffer significant construction delays or construction cost increases as a result of underperformance of these contractors and equipment suppliers, as well as other suppliers, to our projects. No assurances can be given that disputes with our project construction providers will not arise in the future, and if they do, we can reach a settlement, such settlement amount would be covered by the remaining budgeted project contingencies or otherwise be favorable, arbitration or legal action would not be commenced, or we
24
would not have to bear increased costs associated with any such disputes which could make the return on our investment in the project less than expected.
Additionally, various other factors could contribute to construction-cost overruns and construction delays, including:
• | inclement weather conditions; |
• | failure to receive turbines or other critical components and equipment necessary to maintain the operating capacity of our projects, in a timely manner or at all; |
• | failure to complete interconnection to transmission networks, which relies on several third parties, including interconnection facilities provided by local utilities; |
• | failure to maintain all necessary rights to land access and use; |
• | failure to receive quality and timely performance of third-party services; |
• | failure to maintain environmental and other permits or approvals; |
• | failure to meet domestic content requirements; |
• | appeals of environmental and other permits or approvals that we hold; |
• | lawful or unlawful protests by or work stoppages resulting from local community objections to a project; |
• | shortage of skilled labor on the part of our contractors; |
• | adverse environmental and geological conditions; and |
• | force majeure or other events out of our control. |
Any of these factors could give rise to construction delays and construction costs in excess of our expectations. These circumstances could prevent our construction projects from commencing operations or from meeting our original expectations about how much electricity they will generate or the returns they will achieve. In addition, substantial delays could cause defaults under our financing agreements or under PPAs that require completion of project construction by a certain date at specified performance levels or could result in the loss or reduction of expected tax benefits. Our inability to transition our construction projects into financially successful operating projects would have a material adverse effect on our business prospects, financial condition and results of operations and our ability to pay dividends.
Our projects rely on interconnections to transmission lines and other transmission facilities that are owned and operated by third parties. Our projects are exposed to interconnection and transmission facility development and curtailment risks, which may delay the completion of any construction projects or reduce the return to us on those investments.
Our projects depend upon interconnection to electric transmission lines owned and operated by regulated utilities to deliver the electricity we generate. A failure or delay in the operation or development of these interconnection or transmission facilities could result in our losing revenues because such a failure or delay could limit the amount of power our operating projects deliver or delay the completion of any construction projects. In addition, certain of our operating projects’ generation of electricity may be curtailed without compensation due to transmission limitations or limitations on the electricity grid’s ability to accommodate intermittent electricity generating sources, reducing our revenues and impairing our ability to capitalize fully on a particular project’s potential. Such a failure or curtailment at levels above our expectations could have a material adverse effect on our business prospects, financial condition and results of operations.
In the future we may acquire projects with their own generator leads to available electricity transmission or distribution networks. In some cases, these facilities may cover significant distances. A failure in our operation of these facilities that causes the facilities to be temporarily out of service, or subject to reduced service, could result in lost revenues because it could limit the amount of electricity our operating projects are able to deliver. In addition, in many of the markets in which we operate or are looking to expand, should there be any excess capacity available in those generator lead facilities, and should a third party request access to such capacity, the relevant regulatory authority in such jurisdiction, such as FERC in the United States, or other authorities might, require our projects to provide service over such facilities for that excess capacity to the requesting third party at regulated rates. Should this occur in markets with such regulations, the projects could be subject to additional regulatory risks and costly compliance burdens associated with being considered the owner and operator of a transmission facility.
25
The loss of one or more of our executive officers or key employees may adversely affect our ability to effectively manage our operating projects and complete any construction projects on schedule.
We depend on our experienced management team and the loss of one or more key executives could have a negative impact on our business. We also depend on our ability to retain and motivate key employees and attract qualified new employees. Because the wind power industry is relatively new, there is a scarcity of experienced employees in the wind power industry. We may not be able to replace departing members of our management team or key employees. Integrating new executives into our management team and training new employees with no prior experience in the power industry could prove disruptive to our projects, require a disproportionate amount of resources and management attention and ultimately prove unsuccessful. An inability to attract and retain sufficient technical and managerial personnel could limit our ability to effectively manage our operating projects and complete any construction projects on schedule and within budget, which could have a material adverse effect on our business prospects, financial condition and results of operations.
The employee transfer may adversely affect our costs.
Under the Multilateral Management Services Agreement we entered into with both Pattern Development 1.0 and Pattern Development 2.0 in December 2016, which amended the prior Bilateral Management Services Agreement with Pattern Development 1.0, we continue to have the option to cause the employees of Pattern Development 1.0 to become our employees. We refer to this event as the employee transfer. We have the option, exercisable at any time prior to December 31, 2017 to require the employee transfer event to occur. Following the occurrence of the employee transfer event, we will be faced with increased costs associated with employing a larger number of employees. If either Pattern Development 1.0 or Pattern Development 2.0 reduce the scope of their development activities and are therefore not paying us for the services of the transferred employees pursuant to the terms of the MSA and our development activities remain insignificant, we may not immediately require the services of all such employees. Such events could have a material adverse effect on our business prospects, financial condition and results of operation.
Our use and enjoyment of real property rights for our projects may be adversely affected by the rights of lienholders and leaseholders that are superior to those of the grantors of those real property rights to our projects.
Our projects generally are, and any of our future projects are likely to be, located on land occupied pursuant to long-term easements, leases and rights-of-way. The ownership interests in the land subject to these easements, leases and rights-of-way may be subject to mortgages securing loans or other liens (such as tax liens) and other easement, lease rights and rights-of-way of third parties (such as leases of oil or mineral rights) that were created prior to our projects’ easements, leases and rights-of-way. As a result, certain of our projects’ rights under these easements, leases or rights-of-way may be subject, and subordinate, to the rights of those third parties. We perform title searches, obtain title insurance and enter into non-disturbance agreements to protect ourselves against these risks. Such efforts may, however, be inadequate to protect our operating projects against all risk of loss of our rights to use the land on which our projects are located, which could have a material adverse effect on our business prospects, financial condition and results of operations. In addition, certain lands, such as lands under the jurisdiction of the United States Department of Interior's Bureau of Land Management (BLM), are subject to contractual rights that permit the BLM to adjust rent due on properties and other obligations, such as the amount of required reclamation security, to market terms. Any such loss or curtailment of our rights to use the land on which our projects are located, any increase in rent due, or any increase in other obligations with respect to such lands could have a material adverse effect on our business prospects, financial condition and results of operations.
Our operating projects are, and other future projects may be, subject to various governmental regulations, approvals, and compliance requirements that regulate the sale of electricity, which could have a material adverse effect on our business prospects, financial condition and results of operations.
Our current projects in operation in the United States are operating as EWGs as defined under PUHCA and therefore are exempt from certain regulation under PUHCA. Other than Gulf Wind, Panhandle 1, Panhandle 2, and Logan’s Gap, our operating projects in the United States are, however, public utilities under the Federal Power Act subject to rate regulation by FERC. Our future projects in the United States will also likely be subject to such rate regulation once they are placed into service. Our projects in the United States that are subject to FERC rate regulation are required to obtain acceptance of their rate schedules for wholesale sales of energy (i.e., not retail sales to consumers), capacity and ancillary services, including their ability to charge “market-based rates.” FERC may revoke or revise an entity’s authorization to make wholesale sales at market-based rates if FERC subsequently determines that such entity and its affiliates can exercise horizontal or vertical market power, create barriers to entry or engage in abusive affiliate transactions or market manipulation. In addition, public utilities in the United States are subject to FERC reporting requirements that impose administrative burdens and that, if violated, can expose the company to criminal and civil penalties or other risks.
Most of our North American projects are located in regions in which the wholesale electric markets are administered by ISOs and RTOs. Several of our current operating projects are subject to CAISO which is the ISO that prescribes rules for the terms of participation in the
26
California energy market; the Electric Reliability Council of Texas (ERCOT), which is the ISO that prescribes the rules for and terms of participation in the Texas energy market; and IESO, which is the ISO that administers the wholesale electricity market in Ontario. The Southwest Power Pool is the RTO and regional market administrator for our Post Rock project. Lost Creek is in the Associated Electric Cooperative, Inc. a subregion of the SERC Reliability Corporation. Amazon Wind Farm (Fowler Ridge) is in the PJM RTO. Many of these entities can impose rules, restrictions and terms of service that are quasi-regulatory in nature and can have a material adverse impact on our business. For example, ISOs and RTOs have developed bid-based locational pricing rules for the energy markets that they administer. In addition, most ISOs and RTOs have also developed bidding, scheduling and market behavior rules, both to curb the potential exercise of market power by electricity generating companies and to ensure certain market functions and system reliability. These actions could materially adversely affect our ability to sell, and the price we receive for, our energy, capacity and ancillary services.
All of our current operating projects located in North America are also subject to the reliability standards of the NERC. If we fail to comply with the mandatory reliability standards, we could be subject to sanctions, including substantial monetary penalties. Although our U.S. projects are not subject to state utility regulation because our projects sell power exclusively on a wholesale basis, we are subject to certain state regulations that may affect the sale of electricity from our projects, the operations of our projects, as well as the potential for state electricity taxes. All of our current operating projects in Canada are subject to exclusive provincial regulatory authority with respect to the generation and production of electricity, which varies across provincial jurisdictions. Changes in regulatory treatment at the state and provincial level are difficult to predict and could have a significant impact on our ability to operate and on our financial condition and results of operations.
Our industry could be subject to increased regulatory oversight.
Our industry could be subject to increased regulatory oversight. Changing regulatory policies and other actions by governments and third parties with respect to curtailment of electricity generation, electricity grid management restrictions, interconnection rules and transmission may all have the effect of limiting the revenues from, and increasing the operating costs of, our projects which could have a material adverse effect on our business, financial condition and results of operations.
Due to regulatory restructuring initiatives at the federal, provincial and state levels, the electricity industry has undergone changes over the past several years. Future government initiatives will further change the electricity industry. Some of these initiatives may delay or reverse the movement towards competitive markets. We cannot predict the future design of wholesale power markets or the ultimate effect that on-going regulatory changes will have on our business prospects, financial condition and results of operations.
Our projects are not able to insure against all potential risks and may become subject to higher insurance premiums.
Our projects are exposed to the risks inherent in the construction and operation of wind power projects, such as breakdowns, manufacturing defects, natural disasters, terrorist attacks and sabotage. We are also exposed to environmental risks. We have insurance policies covering certain risks associated with our business. Our insurance policies do not, however, cover losses as a result of certain force majeure events or terrorism. In addition, our insurance policies for our projects may cover losses as a result of certain types of natural disasters or sabotage, among other things, but such coverage is not always available in the insurance market on commercially reasonable terms and is often capped at predetermined limits that may not be adequate. In addition, our insurance policies are subject to annual review by our insurers and may not be renewed on similar or favorable terms or at all. A serious uninsured loss or a loss significantly exceeding the limits of our insurance policies could have a material adverse effect on our business prospects, financial condition and results of operations.
Currency exchange rate fluctuations may have an impact on our financial results and condition.
We have exposures to currency exchange rate fluctuations, primarily the Canadian dollar, related to owning and operating part of our business outside of the United States. As a result, a portion of our revenue for the years ended December 31, 2016, 2015 and 2014 was denominated in currencies other than the U.S. dollar, and we expect net revenue from non-U.S. dollar markets to continue to represent a portion of our net revenue. We manage our currency exposure through a variety of methods, including efforts to match our asset and liabilities in the same currencies, mainly by raising local currency debt. In addition, we have implemented a currency hedging program to manage short and medium term fluctuations in our dividends from our wind facilities located outside the United States. However, any measures that we have implemented or may implement in the future to reduce the effect of currency exchange rate fluctuations and other risks of our global operations may not be effective or may be expensive. We cannot provide assurance that currency exchange rate fluctuations will not otherwise have a material adverse effect on our financial condition or results of operations or cause significant fluctuations in quarterly and annual results of operations.
Foreign currency translation risk arises upon the translation of balance sheet and statement of operations items of our non-U.S. dollar denominated subsidiaries whose functional currency is a currency other than the U.S. dollar into the functional currency and reporting currency of us (which is the U.S. dollar) for purposes of preparing the consolidated financial statements included elsewhere in this Form
27
10-K presented in U.S. dollars. The assets and liabilities of our non-U.S. dollar denominated subsidiaries are translated at the closing rate at the date of reporting and statement of operations items are translated at the average rate for the period. All resulting exchange differences are recognized in a separate component of equity, “Foreign currency translation, net of tax,” and are recorded in “Other comprehensive income (loss), net of tax.” These foreign currency translation differences may have significant negative or positive impacts. Our foreign currency translation risk mainly relates to our operations in Canada.
In addition, foreign currency transaction risk arises when we or our subsidiaries enter into transactions where the settlement occurs in a currency other than the functional currency of us or our subsidiary. Exchange differences (gains and losses) arising on the settlement of monetary items or on translation of monetary items at rates different from those at which they were translated on initial recognition during the period or in previous financial statements are recognized the consolidated statement of operations in the period in which they arise. In order to reduce significant foreign currency transaction risk from our operating activities, we may use forward exchange contracts to hedge forecasted cash inflows and outflows. Furthermore, most non-U.S. dollar denominated debts are held by non-U.S. dollar denominated subsidiaries in the same functional currency of those subsidiary operations.
Our cross-border operations require us to comply with anti-corruption laws and regulations of the U.S. government and various non-U.S. jurisdictions.
Doing business in multiple countries requires us and our subsidiaries to comply with the laws and regulations of the U.S. government and various non-U.S. jurisdictions. Our failure to comply with these rules and regulations may expose us to liabilities. These laws and regulations may apply to our companies, individual directors, officers, employees and agents and may restrict our operations, trade practices, investment decisions and partnering activities. In particular, our non-U.S. operations are subject to U.S. and foreign anti-corruption laws and regulations, such as the Foreign Corrupt Practices Act of 1977 (FCPA). The FCPA prohibits U.S. companies and their officers, directors, employees and agents acting on their behalf from corruptly offering, promising, authorizing or providing anything of value to foreign officials for the purposes of influencing official decisions or obtaining or retaining business or otherwise obtaining favorable treatment. The FCPA also requires companies to make and keep books, records and accounts that accurately and fairly reflect transactions and dispositions of assets and to maintain a system of adequate internal accounting controls. As part of our business, we deal with state-owned business enterprises, the employees and representatives of which may be considered foreign officials for purposes of the FCPA. As a result, business dealings between our employees or our agents and any such foreign official could expose our company to the risk of violating anti-corruption laws even if such business practices may be customary or are not otherwise prohibited between our company and a private third-party. Violations of these legal requirements are punishable by criminal fines and imprisonment, civil penalties, disgorgement of profits, injunctions, debarment from government contracts as well as other remedial measures. We have established policies and procedures designed to assist us and our personnel in complying with applicable U.S. and non-U.S. laws and regulations; however, we cannot assure stockholders that these policies and procedures will completely eliminate the risk of a violation of these legal requirements, and any such violation (inadvertent or otherwise) could have a material adverse effect on our business prospects, financial condition and results of operations.
We own, and in the future may acquire, certain projects in joint ventures, and our joint venture partners’ interests may conflict with our and our stockholders’ interests.
We own certain projects in joint ventures, including South Kent, Armow, Grand and K2 in each of which we have a 50%, 50%, 45% and 33% interest, respectively, and El Arrayán, in which we have a 70% interest. In the future, we may acquire or invest in other projects with a joint venture partner, including certain projects which may be owned by one of the Pattern Development Companies. Joint ventures inherently involve a lesser degree of control over business operations, which could result in an increase in the financial, legal, operational or compliance risks associated with a project, including, but not limited to, variances in accounting and internal control requirements. To the extent we do not have a controlling interest in a project, our joint venture partners could take actions that decrease the value of our investment and lower our overall return. In addition, conflicts of interest may arise in the future between our company and our stockholders, on the one hand, and our joint venture partners, on the other hand, where our joint venture partners’ business interests are inconsistent with our and our stockholders’ interests. Further, disagreements or disputes between us and our joint venture partners may arise which could result in litigation, increase our expenses and potentially limit the time and effort our officers and directors are able to devote to our business, all of which could have a material adverse effect on our business prospects, financial condition and results of operations.
Security breaches, including cybersecurity breaches, and other disruptions could compromise our business operations and critical and proprietary information and expose us to liability, which could adversely affect our business prospects, financial condition and reputation.
In the ordinary course of our business, we store sensitive data and proprietary information regarding our business, employees, shareholders, offtakers, service providers, business partners and other individuals in our data center and on our network. Additionally, we use and are dependent upon information technology systems that utilize sophisticated operational systems and network infrastructure to run our wind
28
farms. Through our 24/7 operations control center, we can, among other things, monitor and control each wind turbine, monitor regional and local climate, track real time market prices and, for some of our projects, monitor certain environmental activities. The secure maintenance of information and information technology systems is critical to our operations. Despite security measures we have employed, including certain measures implemented pursuant to mandatory NERC Critical Infrastructure Protection standards, our infrastructure may be increasingly vulnerable to attacks by hackers or terrorists as a result of the rise in the sophistication and volume of cyberattacks. Also, our information and information technology systems may be breached due to viruses, human error, malfeasance or other malfunctions and disruptions. Any such attack or breach could: (i) compromise our turbines and wind farms thereby adversely affecting generation and transmission to the grid; (ii) adversely affect our operations; (iii) corrupt data; or (iv) result in unauthorized access to the information stored on our networks, including, company proprietary information and employee data causing the information to be publicly disclosed, lost or stolen or result in incidents that could result in harmful effects on the environment and human health, including loss of life. Any such attack, breach, access, disclosure or other loss of information could result in lost revenue, the inability to conduct critical business functions, legal claims or proceedings, regulatory penalties, increased regulation, increased protection costs for enhanced cyber security systems or personnel, damage to our reputation and/or the rendering of our disclosure controls and procedures ineffective, all of which could adversely affect our business prospects, financial condition and reputation.
Risks Related to Future Growth and Acquisitions
The growth of our business depends on locating and acquiring interests in additional attractive independent power and transmission projects.
Our business strategy includes acquiring power projects that are either operational, construction-ready, or in limited circumstances, under development. We intend to pursue opportunities to acquire projects from third-party owners where we may submit bids from time to time, and from each of the Pattern Development Companies pursuant to our respective Purchase Rights. In addition, we and the equity owners of Pattern Development 2.0 have begun discussions regarding a potential investment by us in a portion of the business of Pattern Development 2.0.
Various factors could affect the availability of attractive projects to grow our business, including:
• | competing bids for a project, including a project subject to our respective Purchase Rights, from other owners, including companies that may have substantially greater capital and other resources than we do; |
• | fewer third-party acquisition opportunities than we expect, which could result from, among other things, available projects having less desirable economic returns or higher risk profiles than we believe suitable for our business plan and investment strategy; |
• | failure by either of the Pattern Development Companies to complete the development of (i) an Identified ROFO Projects, which could result from, among other things, permitting challenges, failure to procure the requisite financing, equipment or interconnection, local opposition to the project which may entail litigation, or an inability to satisfy the conditions to effectiveness of project agreements such as PPAs and (ii) any of the other projects in its respective development pipeline, in a timely manner, or at all, in either case, which could limit our acquisition opportunities under our respective Purchase Rights; |
• | our failure to exercise our respective Purchase Rights or acquire assets from Pattern Development 1.0 or Pattern Development 2.0; |
• | our failure to successfully develop and finance projects, to the extent that we decide to pursue development activities with respect to new power projects. See also “- Our growth strategy is dependent upon the acquisition of attractive power projects developed by third-parties, including Pattern Development 1.0 and Pattern Development 2.0, and an inability of such development companies to obtain the requisite financing to develop and construct projects could have a material adverse effect on our ability to grow our business." In addition, we also must also potentially anticipate obtaining funds from equity or debt financings to complete an acquisition or construction of an acquired project which exposes us to similar financing risks; |
• | local opposition to wind turbine installations is growing in certain markets due to concerns about noise, health and other alleged impacts of wind power projects. In addition, indigenous communities in the United States and Canada, including Native Americans and First Nations, are becoming more involved in the development of wind power projects and have certain treaty rights that can negatively affect the viability of power projects. As a result, for these and other reasons, litigation and challenges to wind power projects has increased; and |
• | limited access to capital, or an increase in the cost of our capital, may impair our ability to buy certain projects or buy them at the time we had expected. |
29
Any of these factors could prevent us from executing our growth strategy or otherwise have a material adverse effect on our business prospects, financial condition and results of operations. See also “We may also potentially invest in Pattern Development 2.0 in the future which would expose ourselves directly to project development risks.”
Additionally, even if we consummate acquisitions that we believe will be accretive to cash available for distribution per share, those acquisitions may in fact result in a decrease in cash available for distribution per Class A share as a result of incorrect assumptions in our evaluation of such acquisitions, unforeseen consequences or other external events beyond our control. Furthermore, if we consummate any future acquisitions, our capitalization and results of operations may change significantly, and stockholders will not generally have the opportunity to evaluate the economic, financial and other relevant information that we will consider in determining the application of these funds and other resources.
Capital market conditions can have an effect on both our timing and ability to consummate future acquisitions. In addition, we must also potentially anticipate obtaining funds from equity or debt financings to complete construction or pay capital costs of an acquired project which exposes us to financing risks.
Since we often finance acquisitions of clean energy projects partially or wholly through the issuance of additional Class A shares or the issuance of notes or other debt instruments, we may need to be able to access the capital markets on commercially reasonable terms when acquisition opportunities arise. For example, we utilized in part proceeds from an underwritten public offering of our Class A shares in August 2016 and at-the-market offerings under an equity distribution agreement we entered into in May 2016 for investment in acquisition opportunities and to repay other debt previously incurred to finance acquisition opportunities. We also issued senior notes in January 2017 to help finance the acquisition of the Broadview project and to repay other debt previously incurred to finance acquisition opportunities. Our ability to access the equity and debt capital markets is dependent on, among other factors, the overall state of the capital markets and investor appetite for investment in clean energy projects in general and our Class A shares and our debt securities in particular. Volatility in the market price of our Class A shares or our credit rating may prevent or limit our ability to utilize our equity or debt securities as a source of capital to help fund acquisition opportunities.
During 2016, the prices for our Class A shares traded on The NASDAQ Global Select Market ranged from a high of $25.13 to a low of $14.56. On February 24, 2017, the last reported sale price of our Class A shares on such market was $21.09. In connection with the issuance of senior notes in January 2017, we obtained a BB-/Ba3 credit rating from Standard & Poor’s and Moody’s, respectively. An inability to obtain equity or debt financing on commercially reasonable terms could significantly limit our timing and ability to consummate future acquisitions, and to effectuate our growth strategy. In addition, the issuance of additional Class A shares in connection with acquisitions, particularly if consummated at depressed price levels or consummated at price levels that declined significantly between the signing and closing of an acquisition, could cause significant shareholder dilution, expose us to risks of being unable to consummate an acquisition we had had agreed to due to an inability to obtain financing, and reduce the cash distribution per share if the acquisitions are not sufficiently accretive.
In addition, we must also potentially anticipate obtaining funds from equity or debt financings, including tax equity transactions, or from other sources in order to fund any required construction and other capital costs of the acquired projects. The availability of tax equity financing with respect to any future acquisitions by us may also be affected by other aspects of any comprehensive U.S. federal tax reform, such as a reduction of federal tax rates, potentially reducing the federal tax benefits of an investment in renewable energy assets to tax equity investors. Such a reduction of these tax benefits could cause a material adverse effect on the willingness of investors to provide tax equity financing.
We currently intend to acquire power projects that are at least at the stage of being construction-ready, which is generally the point in time when the project is able to procure construction financing and secure tax equity investor commitments.
In the event we determine it is not economical to utilize, or we are unable to utilize our equity or debt securities as a source of capital to fund acquisition opportunities, or as a source of capital to complete any construction outstanding or pay capital costs of acquired projects, we may need to consider utilizing other sources of capital, such as cash on hand, borrowings under our existing credit facilities, or arranging additional credit facilities, none of which may be available or may not be available at attractive terms. Our inability to effectively consummate future acquisitions, or to finance construction or other capital costs cost-effectively, could have a material adverse effect on our ability to grow our business and make cash distributions to our shareholders.
Acquisition and disposal of power projects involves numerous risks.
Our strategy includes acquiring power projects. The acquisition of power projects involves numerous risks, many of which may not be able to be discovered through our due diligence process, including exposure to previously existing liabilities and unanticipated costs associated with the pre-acquisition period; difficulty in integrating the acquired projects into our existing business; and, if the projects
30
are in new markets, the risks of entering markets where we have limited experience. While we will perform our due diligence on prospective acquisitions, we may not be able to discover all potential operational deficiencies in such projects or problematic wind characteristics. A failure to achieve the financial returns we expect when we acquire power projects could have a material adverse effect on our ability to implement our growth strategy and, ultimately, our business prospects, financial condition and results of operations.
In addition, from time to time, we may believe it in the best interests of ourselves and our stockholders to dispose of power projects. Reasons for a disposal may include limited opportunities in a market, changes in business environment or law which reduces the attractiveness of a market, excessive competition in the market, changes in business strategy, or a belief we can utilize funds realized from such a disposal in a more productive manner or generate a higher return on investment. The disposal of power projects involves numerous risks, many of which are outside of our control, including the ability to locate an attractive buyer of a power project, the management attention required to devote to the disposal, the ability to obtain a favorable price for a power project, the length of time required to complete the disposal process, and the potential difficulty of re-entering a market in the future after exiting a market. In the event we decide to dispose of a power project, no assurances can be given that we would be successful in consummating the disposal in a timely manner (or at all), that we would achieve an attractive (or positive) financial return from the disposal, or that we would be successful in re-deploying funds generated from any disposal in a manner that would generate higher returns.
Our growth strategy is dependent upon the acquisition of attractive power projects developed by third-parties, including Pattern Development 1.0 and Pattern Development 2.0, and an inability of such development companies to obtain the requisite financing to develop and construct projects could have a material adverse effect on our ability to grow our business.
Power project development is a capital intensive, high-risk business that relies heavily on and, therefore, is subject to the availability of debt and equity financing sources to fund projected construction and other projected capital expenditures. As a result, in order to successfully develop a power project, development companies, including Pattern Development 1.0 and Pattern Development 2.0, from which we may seek to acquire power projects, must obtain at-risk funds sufficient to complete the development phase of their projects. Any significant disruption in the credit and capital markets, or a significant increase in interest rates, could make it difficult for development companies to successfully develop attractive projects. If development companies from which we seek to acquire projects are unable to raise funds when needed, the ability to grow our project portfolio may be limited, which could have a material adverse effect on our ability to implement our growth strategy and, ultimately, our business prospects, financial condition and results of operations.
We may also potentially invest in project development in the future which would expose ourselves directly to project development risks.
Pattern Development 2.0 is structured to allow us to potentially invest in Pattern Development 2.0 in the future. While no assurances can be given we will invest in Pattern Development 2.0, in the event we did invest in Pattern Development 2.0 or otherwise invest in project development directly, we would expose ourselves directly to project development risks, including permitting challenges, failure to secure PPAs, failure to procure the requisite financing, equipment or interconnection, or an inability to satisfy the conditions to effectiveness of project agreements such as PPAs. Generally, project development may entail risks of making investments in assets that are not profitable, and we could be exposed to significant investment activities that require capital prior to having certainty that a project can move forward. We may lose money invested without generating returns. No assurances can be given that we would be successful in project development activities we undertake, whether through any investment in Pattern Development 2.0 or otherwise, which can diminish our capital available for investment in operating power projects and adversely impact our business prospects, financial condition and results of operations.
Our ability to grow our cash available for distribution is substantially dependent on our ability to make acquisitions from Pattern Development 1.0, Pattern Development 2.0 or third parties on economically favorable terms.
Our goal of growing our cash available for distribution and increasing dividends to our Class A stockholders is substantially dependent on our ability to make and finance acquisitions on terms that result in an increase in cash available for distribution per Class A share. To grow our cash available for distribution per Class A share through acquisitions, we must be able to acquire new generation assets, such as the Identified ROFO Projects, on economically favorable terms. If we are unable to make accretive acquisitions from the Pattern Development Companies or third parties because we are unable to identify attractive acquisition opportunities, negotiate acceptable purchase contracts, obtain financing on economically acceptable terms (as a result of the then current market value of our Class A shares or otherwise) or are outbid by competitors, we may not be able to realize our targeted growth in cash available for distribution per Class A share.
31
The energy industry in the markets in which we operate, as well as the markets we are looking to expand into, benefit from governmental support that is subject to change. With respect to the U.S. market, the current U.S. administration has proposed environmental and tax policies that may create regulatory uncertainty in the clean energy sector.
The energy industry in the markets in which we operate and are looking to expand into, including both fossil fuel and renewable energy sources, in general benefits from various forms of governmental support. Renewable energy sources in Canada benefit from federal and provincial incentives, such as RPS programs, accelerated cost recovery deductions, the availability of off-take contracts through RFP and standard offer programs including the Hydro-Quebec call for tenders, the Ontario feed-in tariff and large renewable procurement programs, and other commercially oriented incentives. Renewable energy sources in the United States have benefited from various federal and state governmental incentives, such as PTCs, ITCs, ITC cash grants, loan guarantees, RPS programs and accelerated tax depreciation. PTCs and ITCs for wind energy on the federal level were extended in December 2015. The extension extended the expiration date for tax credits for wind facilities with a five year phase-down for wind projects commencing construction after December 31, 2014. Renewable energy sources in Chile benefit from the Renewable and Non-Conventional Energy Law, which stipulates that by 2025 a portion of the total energy withdrawn from the grid, starting with 5% in 2015 and progressively increasing up to 20% by 2025, shall be produced with renewable and non-conventional technologies. Such obligations translate into “green attributes” which can be freely traded. In 2012, Japan introduced a feed-in-tariff program that offered fixed term, fixed price contracts of up to 20 years to renewable power projects. The Mexican congress has established a mandate that at least 35% of its energy consumption be supplied by clean sources by 2024. While such developments extending various forms of governmental support provide general benefits to the wind power industry in which we operate, to the extent that these governmental incentive programs may be amended or changed in the future, particularly if amendments or changes are unexpected or unfavorable and after we have developed long-term business plans and strategies based upon them, it could adversely affect the price of electricity sold to power purchasers generated by developed or planned wind power projects, decrease demand for wind power, or reduce the number of projects available to us for acquisition, any of which could have a material adverse effect on our ability to implement our growth strategy and, ultimately, our business prospects, financial condition and results of operations. For example, in February 2016, the U.S. Supreme Court issued a stay prohibiting the implementation of the Clean Power Plan, a regulation issued by the U.S. Environmental Protection Agency aimed at reducing use of existing coal-fired electricity generation facilities and increasing renewable generation in order to reduce greenhouse gas emissions, pending a challenge to such regulation before a U.S. Court of Appeals The current U.S. administration has also proposed environmental policies that may create regulatory uncertainty in the clean energy sector, including the sectors in which we operate, and may lead to a reduction or removal of various clean energy programs and initiatives designed to curtail climate change. Such a reduction or removal of incentives may diminish the markets in which we operate. The current administration has also made public statements regarding comprehensive income tax reform including reducing the corporate tax rate. While such reductions may have certain positive impacts on our financial results as applied to our own corporate taxes, a reduction in the corporate tax rate could also have adverse consequences, such as diminishing the capacity of potential investors in our projects to benefit from incentives and reduce the value of accelerated depreciation deductions. The current administration also made public statements regarding overturning or modifying policies of or regulations enacted by the prior administration that placed limitations on coal and gas electric generation, mining and/or exploration. Any effort to overturn federal and state laws, regulations or policies that are supportive of wind energy generation or that remove costs or other limitations on other types of generation that compete with wind energy projects could materially and adversely affect our business prospects, financial condition or results of operations.
Wind power procurement in Canada is a provincial matter, with relatively irregular, infrequent and competitive procurement windows.
Each province in Canada has its own regulatory framework and renewable energy policy, with few material federal policies to drive the growth of renewable energy. Renewable energy developers must anticipate the future policy direction in each of the provinces, and secure viable projects before they can bid to procure a PPA through highly competitive PPA auctions. Most markets are relatively small. Energy policy in our key market of Ontario is subject to a political process, including with respect to its FIT program, and renewable energy procurement may change dramatically as a result of changes in the provincial government or political climate.
We face competition primarily from other renewable energy IPPs and, in particular, other wind power companies.
We believe our primary competitors are infrastructure funds and some wind power companies or IPPs focused on renewable energy generation. We compete with these companies to acquire well-developed projects with projected stable cash flows that can be built in a cost-effective manner. We also compete with other wind power developers and operators for the limited pool of personnel with requisite industry knowledge and experience. Furthermore, in recent years, there have been times of increased demand for wind turbines and their related components, causing turbine suppliers to have difficulty meeting the demand. If these conditions return in the future, turbine and other component manufacturers may give priority to other market participants, including our competitors, who may have resources greater than ours.
We compete with other renewable energy companies (and power companies in general) for the lowest cost financing, which provides the highest returns for our projects. Once we have acquired a construction project and put it into operation, we may compete on price if we
32
sell electricity into power markets at wholesale market prices. Depending on the regulatory framework and market dynamics of a region, we may also compete with other wind power companies and other renewable energy generators, when our projects bid on or negotiate for long-term power sale agreements or sell electricity or RECs into the spot-market. Our ability to compete on price with other wind power companies and other renewable energy IPPs may be negatively impacted if the regulatory framework of a region favors other sources of renewable energy over wind power.
We have no control over where our competitors may erect wind power projects. Our competitors may erect wind power projects adjacent to our wind projects that may cause upwind array losses to occur at our wind projects. Upwind array losses reflect the diminished wind resource available at a project resulting from interference with available wind caused by adjacent wind turbines. An adjacent wind power project that causes upwind array losses could have a material adverse effect on our revenues and results of operations.
Any change in power consumption levels could have a material adverse effect on our business prospects, financial condition and results of operations.
The amount of wind power consumed by the electric utility industry is affected primarily by the overall demand for electricity, environmental and other governmental regulations and the price and availability of fuels such as nuclear, coal, natural gas and oil as well as other sources of renewable energy. A decline in prices for these fuels could cause demand for wind power to decrease and adversely affect the demand for renewable energy. For example, low natural gas prices have led, in some instances, to increased natural gas consumption by electricity-generating utilities in lieu of other power sources. To the extent renewable energy and wind power, in particular, becomes less cost-competitive on an overall basis as a result of a lack of governmental incentives, cheaper alternatives or otherwise, demand for wind power and other forms of renewable energy could decrease. Slow growth in overall demand for electricity or a long-term reduction in the demand for renewable energy could have a material adverse effect on our plan to grow our business and could, in turn, have a material adverse effect on our business prospects, financial condition and results of operations.
Some states and provinces with renewable energy targets have met their targets, or will meet them in the near future, which could cause demand for new wind and solar power capacity to decrease.
Renewable Portfolio Standard programs in the United States represent sixty percent of the growth in non-hydro renewable energy generation since 2000. Enactment of new RPS policies has waned but states continue to hone existing policies. Roughly half of all RPS states have raised their overall RPS targets or carve-outs since initial RPS adoption. Recent legislation in California, Hawaii, Oregon and Vermont extended targets to 2030 and beyond. However, other states are starting to approach their final targets. Five states reached the final year of their RPS in 2015. Most others will do so in 2020 or 2025. Many bills have also been proposed to repeal, reduce, or freeze RPS programs, though only two have been enacted.
While some Canadian provinces have recently increased their renewable energy targets - Saskatchewan 50% by 2030 and Alberta 30% by 2030 - others have reduced their demand for renewables, including Ontario, which recently halted its Large Renewable Procurement Process. Additionally, hydro power dominates when it comes to meeting renewable energy targets.
As a result of achieving targets, and if such U.S. states and Canadian provinces do not increase non-hydro renewable energy targets in the future, demand for additional wind and solar power generating capacity could decrease, which could have a material adverse effect on our business prospects, financial condition, and results of operations.
New projects being developed that we may acquire may need governmental approvals and permits, including environmental approvals and permits, for construction and operation. Any failure to obtain or maintain in effect necessary permits could adversely affect the amount of our growth.
The design, construction and operation of wind power projects are highly regulated, require various governmental approvals and permits, including environmental approvals and permits, and may be subject to the imposition of related conditions that vary by jurisdiction. In some cases, these approvals and permits require periodic renewal and a subsequently issued permit may not be consistent with the permit initially issued. In other cases, these permits may require compliance with terns that can change over time. We cannot predict whether all permits required for a given project will be granted or whether the conditions associated with the permits, as such conditions may change over time, will be achievable. The denial or loss of a permit essential to a project, or the imposition of impractical conditions upon renewal or over time, could impair our ability to construct and operate a project. In addition, we cannot predict whether seeking the permits will attract significant opposition or whether the permitting process will be lengthened due to complexities, legal claims or appeals. Delay in the review and permitting process for a project can impair or delay our ability to construct or acquire a project or increase the cost such that the project is no longer attractive to us.
33
In developing certain of our projects Pattern Development 1.0 experienced delays in obtaining non-appealable permits and we, Pattern Development 1.0, and/or Pattern Development 2.0 may experience delays in the future. For example, when we acquired our Ocotillo project, it was then the subject of four active lawsuits brought by a variety of project opponents, all of which challenged the prior issuance of Ocotillo’s primary environmental analysis and right-of-way entitlement. We had commenced commercial operations at the Ocotillo project in anticipation of securing favorable rulings on these lawsuits. In Ontario, in prior years anti-wind advocacy groups have opposed the Renewable Energy Approval environmental permit granted to our South Kent, Grand, K2 and Armow wind projects by commencing proceedings before the Ontario Environmental Review Tribunal. Each of these appeals ultimately was unsuccessful and dismissed by the Tribunal.
We are subject to the risk of being unable to complete construction of our projects, or continue operation of our projects, if any of the key permits are revoked or permit conditions are violated. If this were to occur at any future project, we would likely lose a significant portion of our investment in the project and could incur a loss as a result, which would have a material adverse effect on our business prospects, financial condition and results of operations.
If we are unable to make an offer, or make an attractive offer, in the event Pattern Development 1.0 delivered notice that it is seeking a purchaser for the Meikle wind facility, or Conejo, Futtsu, or Kanagi solar facilities, or any other project on the identified ROFO list, we may be unable to acquire such project from Pattern Development 1.0 or Pattern Development 2.0 pursuant to our respective Project Purchase Right.
While each of the Meikle wind facility, and Conejo, Futtsu, and Kanagi solar facilities, which are each Identified ROFO Projects, reached commercial operations in 2016, Pattern Development 1.0 has not yet delivered notice that it is seeking a purchaser for such projects under our Project Purchase Right with Pattern Development 1.0. Generally, we have a Project Purchase Right with each of Pattern Development 1.0 and Pattern Development 2.0, and although Pattern Development 1.0 and Pattern Development 2.0 may choose to seek a purchaser of a project at a time of its choosing whether earlier in the project’s development stage or later at a time, we have generally anticipated that Pattern Development 1.0 and Pattern Development 2.0 will seek a purchaser of its development projects upon construction-readiness following commencement of its construction. We do not control either Pattern Development 1.0 or Pattern Development 2.0, and Pattern Development 1.0 and Pattern Development 2.0 may deem it necessary or desirable to deliver such notice to us that is seeking a purchaser for its projects at any time for its own capital, liquidity, shareholder, or other requirements. While it is uncertain if or when Pattern Development 1.0 may deliver a notice that it is seeking a purchaser for any of the Meikle, Conejo, Futtsu or Kanagi facilities under our Project Purchase Right with Pattern Development 1.0, in the event Pattern Development 1.0 delivered such a notice, or Pattern Development 1.0 or Pattern Development 2.0 delivered notice for another project on the identified ROFO list, for which we are unable to, or do not, deliver a written first rights project offer or make an attractive offer to purchase its entire interest in such project, such respective Pattern Development Company may reject our first rights project offer. Pattern Development 1.0 and Pattern Development 2.0 (as the case may be) may then be able to sell the project to a third party (including a competitor), provided it is at a price not less than 105% of our first rights project offer and other terms not materially less favorable. If this occurred, we would not acquire such project from Pattern Development 1.0 or Pattern Development 2.0 (as the case may be). An inability to acquire the Meikle, Conejo, Futtsu or Kanagi facilities, or any other project on the identified ROFO list, under our respective Project Purchase Right with Pattern Development 1.0 or Pattern Development 2.0 could materially adversely affect our ability to implement our growth strategy.
In spite of our Pattern Development 1.0 Purchase Rights and Pattern Development 2.0 Purchase Rights, it is possible that Pattern Development 1.0 and/or Pattern Development 2.0, respectively, itself might be sold to third parties. In addition, each of our respective Project Purchase Rights, Pattern Development 1.0 Purchase Rights and Pattern Development 2.0 Purchase Rights may expire, and the Amended and Restated Non-Competition Agreement with Pattern Development 1.0 and Pattern Development 2.0 might terminate.
To the extent we do not exercise our Pattern Development 1.0 Purchase Rights and/or Pattern Development 2.0 Purchase Rights (or upon their expiration), Pattern Development 1.0 and /or Pattern Development 2.0, respectively, itself or substantially all of its respective assets may be sold to third parties, including our competitors. Even if we are interested in exercising the Pattern Development 1.0 Purchase Rights and/or Pattern Development 2.0 Purchase Rights, Pattern Development 1.0 and/or Pattern Development 2.0 may offer at an inopportune time for us, or we may not be able to reach an agreement on pricing or other terms. If we are unable to reach an agreement with Pattern Development 1.0, Pattern Development 2.0, or its respective equity owners or if we decline to make an offer, Pattern Development 1.0, Pattern Development 2.0, or its respective equity owners may seek alternative buyers, which could have a material adverse effect on our ability to implement our growth strategy and, ultimately, our business prospects, financial condition and results of operations.
Additionally, our Project Purchase Right with Pattern Development 1.0 and our Pattern Development 1.0 Purchase Rights terminate upon the fifth anniversary of the completion of our initial public offering, or October 2, 2018. Our Project Purchase Right with Pattern Development 2.0 and our Pattern Development 2.0 Purchase Rights terminate upon the fifth anniversary of the date of entry into the agreement creating such rights, or December 8, 2021. In each instance with Pattern Development 1.0 and Pattern Development 2.0,
34
however, such rights are subject to automatic five-year renewals unless either party dissents at the time of renewal. In addition, our respective Project Purchase Right with Pattern Development 1.0 and Pattern Development 2.0, and our Pattern Development 1.0 Purchase Rights and Pattern Development 2.0 Purchase Rights terminate upon the third occasion on which we decline to exercise our respective Project Purchase Right with respect to an operational or construction-ready project and following which Pattern Development 1.0 or Pattern Development 2.0, as the case may be, has sold the project to an unrelated third party. Following termination of our respective Project Purchase Right, and our Pattern Development 1.0 Purchase Rights and Pattern Development 2.0 Purchase Rights, Pattern Development 1.0 or Pattern Development 2.0, as the case may be, will be under no obligation to offer any of its projects to us, which could have a material adverse effect on our ability to implement our growth strategy and ultimately on our business prospects, financial condition and results of operations.
Once our respective Purchase Rights with Pattern Development 1.0 and/or Pattern Development 2.0 terminate, the Non-Competition Agreement with respect to Pattern Development 1.0 or Pattern Development 2.0, as the case may be, will also terminate, and at such time, such respective Pattern Development Company will no longer be restricted from competing with us for acquisitions.
The loss of one or more of our or Pattern Development 1.0’s or Pattern Development 2.0’s officers, or key employees, may adversely affect our ability to implement our growth strategy.
In addition to relying on our management team for managing our projects, our growth strategy relies on our and Pattern Development 1.0’s and Pattern Development 2.0’s officers and key employees for their strategic guidance and expertise in the selection of projects that we may acquire in the future. Because the wind power industry is relatively new, there is a scarcity of experienced officers and employees in the wind power industry. As a result, if one or more of our or Pattern Development 1.0’s or Pattern Development 2.0’s officers or key employees leaves or retires, and none of us, Pattern Development 1.0 or Pattern Development 2.0, are able to find a suitable replacement, our ability to implement our growth strategy may be diminished, which could have a material adverse effect on our business prospects, financial condition and results of operations.
While we currently own only wind power projects, in the future, we may decide to expand our acquisition strategy to include other types of power projects or transmission projects. Any future acquisition of non-wind power projects or transmission projects may present unforeseen challenges and result in a competitive disadvantage relative to our more-established competitors.
In the future, we may expand our acquisition strategy to include other types of power projects or transmission projects. For example, since 2014, we have announced the addition of various solar projects to our list of Identified ROFO Projects and, in connection the commitment to acquire the Broadview project, we will be acquiring the associated independent 35 mile 345 kV Western Interconnect transmission line from Pattern Development 1.0. There can be no assurance that we will be able to identify other attractive non-wind or transmission acquisition opportunities or acquire such projects at a price and on terms that are attractive or that, once acquired, such projects will operate profitably. Additionally, these acquisitions could expose us to increased operating costs, unforeseen liabilities or risks, and regulatory and environmental concerns associated with entering new sectors of the power industry, including requiring a disproportionate amount of our management’s attention and resources, which could have an adverse impact on our business as well as place us at a competitive disadvantage relative to more established non-wind energy market participants. A failure to successfully integrate such acquisitions into our existing project portfolio as a result of unforeseen operational difficulties or otherwise, could have a material adverse effect on our business prospects, financial condition and results of operations.
We are subject to risks associated with litigation or administrative proceedings that could materially impact our operations, including proceedings in the future related to power projects we subsequently acquire.
We are subject to risks and costs, including potential negative publicity, associated with lawsuits, in particular, with respect to environmental claims and lawsuits, claims contesting the construction or operation of our projects, or shareholder suits. See Item 3 "Legal Proceedings.” The result of and costs associated with defending any such lawsuit, regardless of the merits and eventual outcome, may be material and could have a material adverse effect on our operations. In the future, we may be involved in legal proceedings, disputes, administrative proceedings, claims and other litigation that arise in the ordinary course of business related to a power project that we subsequently acquire. For example, individuals and interest groups may sue to challenge the issuance of a permit for a power project or seek to enjoin construction or operation of a power project. We may also become subject to claims from individuals who live in the proximity of our power projects based on alleged negative health effects related to acoustics caused by wind turbines or alleged contamination of groundwater. In addition, we have been and may subsequently become subject to legal proceedings or claims contesting the construction or operation of our power projects. Any such legal proceedings or disputes could delay our ability to complete construction of a power project in a timely manner, or at all, or materially increase the costs associated with commencing or continuing commercial operations at a power project. Settlement of claims and unfavorable outcomes or developments relating to these proceedings or disputes, such as judgments for monetary damages, injunctions or denial or revocation of permits, could have a material adverse effect on our ability to implement our growth strategy and, ultimately, our business prospects, financial condition and results of operations.
35
Risks Related to Our Financial Activities
Our substantial amount of indebtedness may adversely affect our ability to operate our business and impair our ability to pay dividends.
Our consolidated indebtedness not including financing costs as of February 24, 2017, including the issuance in January 2017 of senior notes and utilization of a portion of the funds received to paydown a portion of the revolving credit facility, was approximately $1.8 billion. Despite our current consolidated debt levels, we or our subsidiaries may still incur substantially more debt or take other actions which would intensify the risks discussed below.
Our substantial indebtedness could have important consequences, including, for example:
• | failure to comply with the covenants in the agreements governing these obligations could result in an event of default under those agreements, or, under certain circumstances, cross-default to other debt instruments, which could be difficult to cure, or result in our bankruptcy; |
• | in the event a project is unable to meet its debt service obligations through its own project cash flows, excess cash flow from other projects may be required to help service such obligations, thereby reducing funds available to pay dividends; |
• | in the event a project is unable to meet its debt service obligations, it may result in a foreclosure on the project collateral and loss of the project; |
• | our limited financial flexibility could reduce our ability to plan for and react to unexpected opportunities; and |
• | our substantial debt service obligations make us vulnerable to adverse changes in general economic, credit and capital markets, industry and competitive conditions and adverse changes in government regulation and place us at a disadvantage compared with competitors with less debt. |
Any of these consequences could have a material adverse effect on our business prospects, financial condition and results of operations. If we do not comply with our obligations under our debt instruments, we may be required to refinance all or part of our existing debt, borrow additional amounts or sell securities, which we may not be able to do on favorable terms or at all. In addition, increases in interest rates and changes in debt covenants may reduce the amounts that we can borrow, reduce our cash flows and increase the equity investment we may be required to make to complete any construction of our projects. These increases could cause some of our projects to become economically unattractive. If we are unable to raise additional capital or generate sufficient operating cash flow to repay our indebtedness, we could be in default under our lending agreements and could be required to delay construction of our wind power projects, reduce overhead costs, reduce the scope of our projects or abandon or sell some or all of our projects, all of which could have a material adverse effect on our business prospects, financial condition and results of operations.
Our indebtedness may limit the amount of cash flow available to invest in the ongoing needs of our business which could have a material adverse effect on business prospects, financial condition and results of operations.
Subject to the limits contained in our revolving credit facility, we may incur substantial additional debt from time to time to finance working capital, capital expenditures, investments or acquisitions, or for other purposes. If we do so, the risks related to our level of indebtedness could intensify. Specifically, a high level of indebtedness could have important consequences due to the adverse ways in which it affects us, including the following:
• | requiring us to dedicate a substantial portion of our cash flow from operations to payments on our indebtedness, thereby reducing the availability of our cash flow to fund working capital, capital expenditures, dividend payments, development activity, acquisitions and other general corporate purposes; |
• | increasing our vulnerability to adverse general economic or industry conditions; |
• | limiting our flexibility in planning for, or reacting to, changes in our business or the industries in which we operate; |
• | making us more vulnerable to increases in interest rates, as borrowings under our revolving credit facility are at variable rates; |
• | limiting our ability to obtain additional financing in the future for working capital or other purposes; and |
• | placing us at a competitive disadvantage compared to our competitors that have less indebtedness. |
Our ability to comply with restrictions and covenants under the terms of our indebtedness may be affected by events beyond our control including prevailing economic, financial and industry conditions. As a result, there can be no assurance that we will be able to comply with these restrictions and covenants, and any such default under our debt agreements could have a material adverse effect on our business by, among other things, limiting our ability to take advantage of financing, merger and acquisition or other corporate opportunities.
36
Despite our current consolidated debt levels, we or our subsidiaries may still incur substantially more debt or take other actions which would intensify the risks discussed above.
Despite our current consolidated debt levels, we and our subsidiaries may be able to incur substantial additional debt in the future, subject to the restrictions contained in our revolving credit facility and our future debt instruments, some of which may be secured debt. Although our revolving credit facility contains restrictions on the incurrence of additional indebtedness, these restrictions are subject to a number of qualifications and exceptions and could be amended or waived, and the indebtedness incurred in compliance with these restrictions could be substantial and may also be secured. Accordingly, we may, in compliance with these restrictions, incur additional debt, secure existing or future debt, recapitalize our debt or take a number of other actions that are not limited by the terms of our existing indebtedness and that could have the effect of intensifying the risks discussed above.
We may not have the ability to raise the funds necessary to make payments in cash which may be required under the terms of the notes we have issued upon conversion settlement, repayment at maturity, or upon exercise of a repurchase obligation, and our debt agreements may limit our ability to pay cash upon conversion, repurchase or redemption of these notes.
Holders of the convertible notes we issued in July 2015 have the right to require us to repurchase all or a portion of their convertible notes upon the occurrence of a fundamental change at a repurchase price equal to 100% of the principal amount of the notes to be repurchased, plus accrued and unpaid interest, if any. In addition, upon conversion of the convertible notes, unless we elect to deliver solely our Class A shares to settle such conversion (other than paying cash in lieu of delivering any fractional share), we will be required to make cash payments in respect of the convertible notes being converted. In addition, holders of the senior notes we issued in January 2017 may have the right to require us to repurchase all or a portion of their notes upon a change of control triggering event at a repurchase price equal to 101% of the principal amount of the notes to be repurchased, plus accrued and unpaid interest, if any.
However, we may not have enough available cash or be able to obtain financing at the time we are required to make repurchases of notes surrendered therefor, pay cash at their maturity, or (with respect to convertible notes) pay cash upon conversion settlement. In addition, our ability to repurchase the notes or to pay cash upon conversions of the convertible notes may be limited by law, regulatory authority or agreements governing our indebtedness. Our failure to repurchase notes at a time when the repurchase is required by the indenture or (with respect to the convertible notes) to pay any cash payable on future conversions of the convertible notes pursuant to the indenture would constitute a default under the indenture governing the issuance of the respective notes. A fundamental change, change of control triggering event, or a default under the indenture could also lead to a default under agreements governing our or our subsidiaries’ indebtedness. If the repayment of the related indebtedness were to be accelerated after any applicable notice or grace periods, we may not have sufficient funds to repay the indebtedness and repurchase the notes or make cash payments upon redemptions thereof.
The conditional conversion feature of the convertible notes we have issued, if triggered, may adversely affect our financial condition and operating results.
The convertible notes we issued in July 2015 have a conditional conversion feature. In the event the conditional conversion feature of the convertible notes is triggered, holders of convertible notes will be entitled to convert such notes at any time during specified periods at their option. If one or more holders elect to convert their convertible notes, unless we elect to satisfy our conversion obligation by delivering solely our Class A shares (other than paying cash in lieu of delivering any fractional share), we would be required to settle a portion or all of our conversion obligation through the payment of cash, which could adversely affect our liquidity. In addition, even if holders do not elect to convert their convertible notes, we could be required under applicable accounting rules to reclassify all or a portion of the outstanding principal of the convertible notes as a current rather than long-term liability, which would result in a material reduction of our net working capital.
Provisions in the indentures governing our outstanding notes may deter or prevent a business combination that may be favorable to investors.
If a fundamental change occurs prior to the maturity date of the convertible notes we issued in July 2015 or a change of control triggering event occurs prior to the maturity date of the senior notes we issued in January 2017, holders of such notes may have the right, at their option, to require us to repurchase all or a portion of their respective notes. In addition, if a make-whole fundamental change occurs prior to the maturity date of the convertible notes, we will in some cases be required to increase the conversion rate for a holder that elects to convert its convertible notes in connection with such make-whole fundamental change. Furthermore, our indentures prohibit us from engaging in certain mergers or acquisitions unless, among other things, the surviving entity assumes our obligations thereunder. These and other provisions in our indentures could deter or prevent a third party from acquiring us even when the acquisition may be favorable to investors.
37
If our subsidiaries default on their obligations under their project-level debt, we may decide to make payments to lenders to prevent foreclosure on the collateral securing the project-level debt, which would, without such payments, cause us to lose certain of our wind power projects.
Our subsidiaries incur various types of debt. Non-recourse debt is repayable solely from the applicable project’s revenues and is secured by the project’s physical assets, major contracts, cash accounts and, in many cases, our ownership interest in the project subsidiary. Limited recourse debt is debt where we have provided a limited guarantee, and recourse debt is debt where we have provided a full guarantee, which means if our subsidiaries default on these obligations, we will be liable directly to those lenders, although in the case of limited recourse debt only to the extent of our limited recourse obligations. To satisfy these obligations, we may be required to use amounts distributed by our other subsidiaries as well as other sources of available cash, reducing our cash available to execute our business plan and pay dividends to holders of our Class A shares. In addition, if our subsidiaries default on their obligations under non-recourse financing agreements, we may decide to make payments to prevent the lenders of these subsidiaries from foreclosing on the relevant collateral. Such a foreclosure would result in our losing our ownership interest in the subsidiary or in some or all of its assets. The loss of our ownership interest in one or more of our subsidiaries or some or all of their assets could have a material adverse effect on our business prospects, financial condition and results of operations and, in turn, on our cash available for distribution.
We are subject to indemnity and guarantee obligations.
We provide a variety of indemnities in the ordinary course of business to contractual counterparties and to our lenders and other financial partners. For example, the Hatchet Ridge indemnity indemnifies MetLife Capital, Limited Partnership, the owner participant, under the Hatchet Ridge Wind Lease Financing against certain tax losses. In addition, we have entered into tax equity partnership agreements in connection with four of our projects which also provide for specific allocations in certain circumstances.
In addition, although we primarily rely on limited recourse or non-recourse financing at our project-level entities we sometimes provide specific indemnities to support such financings. For example, some of our subsidiaries in the United States had obtained construction bridge loans to finance a portion of project construction costs, and in certain cases, such loans were secured by the ITC cash grant proceeds received from the U.S. Treasury. We have assumed certain indemnities that were originally provided by Pattern Development 1.0 to certain of these bridge lenders and other on-going term lenders in the event that the ITC cash grant is recaptured by the U.S. Treasury, in whole or in part. The cash grant indemnities are in effect for five years from the date the relevant project commences commercial operations. If, for any of those subsidiaries which received the ITC cash grant, the ITC cash grant is recaptured, in whole or in part, we may be required to make payments under the indemnities to prevent the lenders of those subsidiaries from foreclosing on the relevant project collateral. Payment by us under a cash grant indemnity could have a material adverse effect on our business prospects, financial condition and results of operations and, in turn, on our cash available for distribution.
Our failure to pay any of these indemnities would enable the applicable project lenders to foreclose on the project collateral. The payments we may be obligated to make pursuant to these indemnities could have a material adverse effect on our business prospects, financial condition and results of operations and, in turn, on our cash available for distribution.
Our variable rate indebtedness subjects us to interest rate risk, which could cause our debt service obligations to increase significantly.
Certain borrowings under our revolving credit facility are subject to variable rates of interest, primarily based on the International Continental Exchange London Interbank Offered Rate (LIBOR), and expose us to interest rate risk. LIBOR tends to fluctuate based on general economic conditions, general interest rates, Federal Reserve rates and the supply of and demand for credit in the London interbank market. Increases in the interest rate generally, and particularly when coupled with any significant variable rate indebtedness, could materially adversely impact our interest expenses. If interest rates were to increase, our debt service obligations on the variable rate indebtedness would increase even though the amount borrowed remained the same, and our net income and cash flows, including cash available for servicing our indebtedness, will correspondingly decrease. A hypothetical increase or decrease in interest rates by 1% would have increased or decreased interest expense related to our revolving credit facility by $2.6 million, $1.6 million, $0.1 million for the years ended December 31, 2016, 2015 and 2014, respectively. To the extent we borrow under our revolving credit facility, we are not required to enter into interest rate swaps to hedge such indebtedness. If we decide not to enter into hedges on such indebtedness, our interest expense on such indebtedness will fluctuate based on LIBOR or other variable interest rates. Consequently, we may have difficulties servicing such unhedged indebtedness and funding our other fixed costs, and our available cash flow for general corporate requirements may be materially adversely affected. In the future, we may enter into interest rate swaps that involve the exchange of floating for fixed rate interest payments in order to reduce interest rate volatility. However, we may not maintain interest rate swaps with respect to all of our variable rate indebtedness, and any swaps we enter into may not fully mitigate our interest rate risk.
38
Our hedging activities may not adequately manage our exposure to commodity and financial risk, which could result in significant losses or require us to use cash collateral to meet margin requirements, each of which could have a material adverse effect on our business prospects, financial condition, results of operations and liquidity, which could impair our ability to execute favorable financial hedges in the future.
Certain of the electricity we generate is sold on the open market at spot-market prices. In order to stabilize all or a portion of the revenue from such sales, we have entered, and may in the future enter, into financial swaps, day-ahead sales transaction or other hedging arrangements. We may acquire additional assets in the future with similar hedging agreements. In an effort to stabilize our revenue from electricity sales from these projects, we evaluate the electricity sale options for each of our projects, including the appropriateness of entering into a PPA, a physical sale, a financial swap, or combination of these arrangements. If we sell our electricity into an ISO market without a PPA, we may enter into a physical sale or financial swap to stabilize all or a portion of our estimated revenue stream. Under the term of our existing physical sales, we are obligated to physically deliver electricity to a common delivery point. Under these arrangements, we sell the electricity produced at our facility to the ISO at the project node and buy energy at the common delivery point to meet the delivery obligations under the physical sale. The delivery obligations under the physical sale are for specified volumes in each hour for an overall quantity that we estimate we are highly likely to produce. Under the terms of our existing financial swaps, we are not obligated to physically deliver or purchase electricity. Instead, we receive payments for specified quantities of electricity based on a fixed price and are obligated to pay our counterparty the real time market price for the same quantities of electricity. These financial swaps cover quantities of electricity that we estimate we are highly likely to produce. Gains or losses under the physical sales and financial swaps are designed to be offset by decreases or increases in our revenues from real time market sales of electricity in liquid ISO markets. However, the actual amount of electricity we generate from operations may be materially different from our estimates for a variety of reasons, including variable wind conditions and wind turbine availability. If a project does not generate the volume of electricity covered by the associated physical sale or financial swap contract, we could incur significant losses if electricity prices in the market rise substantially above the fixed price provided for in the physical sale or financial swap. If a project generates more electricity than is contracted in the physical sale or financial swap, the excess production will not be hedged and the related revenues will be exposed to market price fluctuations.
We would also incur financial losses as a result of adverse changes in the mark-to-market values of the financial swaps or if the counterparties to our hedging contracts fail to make payments when due. We could also experience a reduction in cash flow if we are required to post margin in the form of cash collateral to secure our delivery or payment obligations under these hedging agreements. We are not currently required to post cash collateral or issue letters of credit to backstop our obligations under our hedging arrangements after commercial operation has been achieved, but we may be required to do so in the future. If we were required to do so, our available cash or available borrowing capacity under the credit facilities under which these letters of credit are issued would be correspondingly reduced.
We enter into PPAs when we sell our electricity into markets other than deregulated ISO markets or where we believe it is otherwise advisable. Under a PPA, we contract to sell all or a fixed proportion of the electricity generated by one of our projects, sometimes bundled with RECs and capacity or other environmental attributes, to a power purchaser which is often a utility or large commercial entity. We do this to stabilize our revenues from that project. We are exposed to the risk that the power purchaser will fail to perform under a PPA, with the result that we will have to sell our electricity at the market price sometime in the future, which could be substantially lower than the price provided in the applicable PPA. In most instances, we also commit to sell minimum levels of generation. If the project generates less than the committed minimum volumes, we may be required to buy the shortfall of electricity (or RECs and other environmental attributes) on the open market or make payments of liquidated damages or be in default under a PPA, which could result in its termination.
We sometimes seek to sell forward a portion of our RECs or other environmental attributes to fix the revenues from those attributes and hedge against future declines in prices of RECs or other environmental attributes. If our projects do not generate the amount of electricity required to earn the RECs or other environmental attributes sold forward or if for any reason the electricity we generate does not produce RECs or other environmental attributes for a particular state, we may be required to make up the shortfall of RECs or other environmental attributes through purchases on the open market or make payments of liquidated damages. Further, current market conditions may limit our ability to hedge sufficient volumes of our anticipated RECs or other environmental attributes, leaving us exposed to the risk of falling prices for RECs or other environmental attributes. Future prices for RECs or other environmental attributes are also subject to the risk that regulatory changes will adversely affect prices.
Risks Related to Ownership of our Class A Shares
We are a holding company with no operations of our own, and we depend on our power projects for cash to fund all of our operations and expenses, including to make dividend payments.
Our operations are conducted almost entirely through our power projects and our ability to generate cash to meet our debt service obligations or to pay dividends is dependent on the earnings and the receipt of funds from our project subsidiaries through distributions
39
or intercompany loans. Our power projects’ ability to generate adequate cash depends on a number of factors, including wind conditions, timely completion of any construction projects, the price of electricity, payments by key power purchasers, increased competition, foreign currency exchange rates, compliance with all applicable laws and regulations and other factors. See Item 1A "Risk Factors-Risks Related to Our Projects.” Our ability to declare and pay regular quarterly cash dividends is subject to our obtaining sufficient cash distributions from our project subsidiaries after the payment of operating costs, debt service and other expenses. See Item 5 “Market for Registrant’s Common Equity and Related Stockholder Matters-Cash Dividend to Investors.” We may lack sufficient available cash to pay dividends to holders of our Class A shares due to shortfalls attributable to a number of operational, commercial or other factors, including insufficient cash flow generation by our projects, as well as unknown liabilities, the cost associated with governmental regulation, increases in our operating or general and administrative expenses, principal and interest payments on our and our subsidiaries’ outstanding debt, tax expenses, working capital requirements and anticipated cash needs.
Our cash available for distribution to holders of our Class A shares may be reduced as a result of restrictions on our subsidiaries’ cash distributions to us under the terms of their indebtedness, or in the event certain specified events occurred under our tax equity arrangements that change the percentage of cash distributions to be made to the tax equity investors.
We intend to declare and pay regular quarterly cash dividends on all of our outstanding Class A shares. However, in any period, our ability to pay dividends to holders of our Class A shares depends on the performance of our subsidiaries and their ability to distribute cash to us as well as all of the other factors discussed under Item 5 “Market for Registrant’s Common Equity and Related Stockholder Matters-Cash Dividend to Investors.” The ability of our subsidiaries to make distributions to us may be restricted by, among other things, the provisions of existing and future indebtedness and the provisions existing and future tax equity arrangements.
Restrictions on distributions to us by our subsidiaries under our revolving credit facility and the agreements governing their respective project-level debt could limit our ability to pay anticipated dividends to holders of our Class A shares. These agreements contain financial tests and covenants that our subsidiaries must satisfy prior to making distributions. We may agree to similar restrictions on distributions under future debt instruments we may enter into in connection with future note or bond offerings. If any of our subsidiaries is unable to satisfy these restrictions or is otherwise in default under such agreements, it would be prohibited from making distributions to us that could, in turn, limit our ability to pay dividends to holders of our Class A shares. For example, while no similar instances occurred in 2016, low wind conditions contributed to two of our projects not satisfying financial tests required to permit distributions during certain quarters of 2015. The terms of our project indebtedness typically require commencement of commercial operations prior to our ability to receive cash distributions from a project. The terms of any such indebtedness also typically include cash management or similar provisions, pursuant to which revenues generated by projects subject to such indebtedness are immediately, or upon the occurrence of certain events, swept into an account for the benefit of the lenders under such debt agreements. As a result, project revenues typically only become available to us after the funding of reserve accounts for, among other things, operations and maintenance expenses, debt service, taxes and insurance at the project level. In some instances, projects may be required to sweep cash to reserve funds intended to mitigate the results of pending litigation or other potentially adverse events.
In addition, the terms of operating agreements for our wind facilities with tax equity investors, which include Panhandle 1, Panhandle 2, Post Rock, Logan’s Gap and Amazon Wind Farm Fowler Ridge, generally provide for specified allocations of distributions between the tax equity investors and ourselves which change at a specified point when the tax equity investor has realized a target after tax internal rate of return. In the event this change has not occurred by a targeted date, the tax equity investor begins to receive a greater allocation of distributions until the targeted rate of return has been achieved. In addition, the operating agreements also provide for earlier increases in the percentage of distributable cash to be allocated to the tax equity investors if the project fails to achieve certain defined minimum performance levels that are likely to cause the tax equity investors to not achieve the targeted after tax return by the targeted date and for increases under certain circumstances to match allocations of taxable income that are made to mitigate a negative capital account balance for such tax equity investors. As a result, in the event our share of distributable cash from these projects is changed as a result of one of these events, our distributions from such wind facilities may be less than expected that could, in turn, limit our ability to pay dividends to holders of our Class A shares.
For example, each of the Panhandle 1 and Logan’s Gap wind facilities have experienced lower than expected production and merchant power prices resulting in each of those projects failing to pass financial tests that measure cumulative cash distributions to the members. This will result in a change of the cash percentage to be allocated to the tax equity members until the shortfall is remedied.
If our projects do not generate sufficient cash available for distribution, we may be required to fund dividends from working capital, borrowings under our revolving credit facility, proceeds from future offerings, the sale of assets or by obtaining other debt or equity financing, which may not be available, any of which could have a material adverse effect on the price of our Class A shares and on our ability to pay dividends at anticipated levels or at all.
40
Our ability to pay regular dividends on our Class A shares is subject to the discretion of our Board of Directors.
Our Class A stockholders have no contractual or other legal right to dividends. The payment of future dividends on our Class A shares is at the discretion of our Board of Directors and depends on, among other things, our earnings, financial condition, capital requirements, level of indebtedness, statutory and contractual restrictions applying to the payment of dividends and other considerations that our Board of Directors deems relevant. Our Board of Directors has the authority to establish cash reserves for the prudent conduct of our business, and the establishment of or increase in those reserves could result in a reduction in cash available for distribution to pay dividends on our Class A shares at anticipated levels. Accordingly, we may not be able to make, or may have to reduce or eliminate, the payment of dividends on our Class A shares, which could adversely affect the market price of our Class A shares.
We have identified material weaknesses in our disclosure controls and procedures which, if not corrected, could affect the reliability of our consolidated financial statements and have other adverse consequences.
Section 404 of the Sarbanes-Oxley Act and the related SEC rules requires management to assess the effectiveness of the design and operation of our disclosure controls and procedures and to include in this Annual Report on Form 10-K a management report on that assessment. Under Section 404 and the SEC rules, a company cannot conclude that its disclosure controls and procedures are effective if there exist any material weaknesses in the design and operation of such controls. A material weakness is a deficiency, or combination of control deficiencies, in internal control over financial reporting, such that there is a reasonable possibility that a material misstatement of our annual or interim financial statements will not be prevented or detected on a timely basis.
An evaluation was performed under the supervision and with the participation of our management, including our Chief Executive Officer and Chief Financial Officer, on the design and operating effectiveness of our disclosure controls and procedures, and based on this evaluation, our Chief Executive Officer and Chief Financial Officer concluded that as of December 31, 2016, our disclosure controls and procedures were not effective at a reasonable assurance level as a result of material weaknesses identified. Our management believes that our internal control over financial reporting was not effective due to the aggregation of internal control deficiencies related to the implementation, design, maintenance and operating effectiveness of various transaction, process level, and monitoring controls. Additionally, our management believes that our procure-to-pay procedures were not effective as of December 31, 2016 because of a material weakness based on the aggregation of internal control deficiencies relating to the design, enforcement and effective communication of changes to our delegation of authority policy. We received an adverse opinion on our internal control over financial reporting as of December 31, 2016 from our external auditor. See Item 9A “Controls and Procedures” of this Annual Report on Form 10-K.
Our management has developed, and begun to implement, a plan to remediate the material weaknesses. We cannot, however, assure you that we will be able to implement the plan, or to correct these material weaknesses in a timely manner. Furthermore, during the course of re-design of existing processes and controls, implementation of additional processes and controls and testing of the operating effectiveness of such re-designed and additional processes and controls, we may identify additional control deficiencies that could give rise to other material weaknesses, in addition to the currently identified material weaknesses. We expect the remediation plan to extend over multiple financial reporting periods in 2017. Any failure in the effectiveness of internal control over financial reporting, particularly if it results in misstatements in our financial statements, could cause us to fail to meet our reporting obligations and could adversely affect investor perceptions of our company which could cause the market price of our shares to decline, and we could be subject to sanctions or investigations by the stock exchanges on which we list, the SEC, the Canadian Securities Administrators or other regulatory authorities, and could adversely affect our ability to access the capital markets.
Risks Regarding Our Cash Dividend Policy
While we believe that we will have sufficient available cash to enable us to pay the aggregate dividend on our Class A shares for the year ending December 31, 2017, we may be unable to pay the quarterly dividend or any amount on our Class A shares during these periods or any subsequent period. Holders of our Class A shares have no contractual or other legal right to receive cash dividends from us on a quarterly or other basis and, while we currently intend to at least maintain our current dividend and to grow our business and continue to increase our dividend per Class A share over time, our cash dividend policy is subject to all the risks inherent in our business and may be changed at any time. Some of the reasons for such uncertainties in our stated cash dividend policy include the following factors:
• | Our revolving credit facility includes customary affirmative and negative covenants that will subject certain of our project subsidiaries to restrictions on making distributions to us. Our subsidiaries are also subject to restrictions on distributions under the agreements governing their respective project-level debt. Additionally, we may incur debt in the future to acquire new power projects, the terms of which will likely require commencement of commercial operations prior to our ability to receive cash distributions from such acquired projects. These agreements also likely will contain financial tests and covenants that our subsidiaries must satisfy prior to making distributions. In the future, we may also enter into debt instruments in connection with |
41
note or bond offerings which may also contain restrictions on making distributions. The current financial tests and covenants applicable to our subsidiaries are described in Item 7 “Management’s Discussion and Analysis of Financial Condition and Results of Operations-Description of Credit Agreements.” If any of our subsidiaries is unable to satisfy these financial tests and covenants or are otherwise in default under our financing agreements, it would be prohibited from making distributions to us, which could, in turn, limit our ability to pay dividends to holders of our Class A shares at our intended level or at all. See "-Risks Related to our Financial Activities-Our substantial amount of indebtedness may adversely affect our ability to operate our business and impair our ability to pay dividends."
• | Under the terms of operating agreements for our wind facilities with tax equity investors, the share of distributable cash we may receive from these projects may change under certain circumstances, and if these circumstances occurred and were adverse, our distributions from such wind facilities may be less than expected. For example, each of the Panhandle 1 and Logan’s Gap wind facilities have experienced lower than expected production and merchant power prices resulting in each of those projects failing to pass financial tests that measure cumulative cash distributions to the members. This will result in a change of the cash percentage to be allocated to the tax equity members until the shortfall is remedied. See "-Our cash available for distribution to holders of our Class A shares may be reduced as a result of restrictions on our subsidiaries' cash distributions to us under the terms of their indebtedness, or in the event certain specified events occurred under our tax equity arrangements that change the percentage of cash distributions to be made to the tax equity investors." |
• | Our Board of Directors will have the authority to establish cash reserves for the prudent conduct of our business, and the establishment of or increase in those reserves would reduce the cash available to pay our dividends. |
• | We may lack sufficient cash available for distribution to pay our dividends due to operational, commercial or other factors, some of which are outside of our control, including insufficient cash flow generation by our projects, as well as unexpected operating interruptions, insufficient wind resources, legal liabilities, the cost associated with governmental regulation, changes in governmental subsidies or regulations, increases in our operating or selling, general and administrative expenses, principal and interest payments on our and our subsidiaries’ outstanding debt, tax expenses, working capital requirements and anticipated cash reserve needs. |
We are an SEC foreign issuer under Canadian securities laws and, therefore, are exempt from certain requirements of Canadian securities laws applicable to other Canadian reporting issuers.
Although we are a reporting issuer in Canada, we are an SEC foreign issuer under Canadian securities laws and are exempt from certain Canadian securities laws relating to continuous disclosure obligations and proxy solicitation if we comply with certain reporting requirements applicable in the United States, provided that the relevant documents filed with the SEC are filed in Canada and sent to our Class A stockholders in Canada to the extent and in the manner and within the time required by applicable U.S. requirements. In some cases the disclosure obligations applicable in the United States are different or less onerous than the comparable disclosure requirements applicable in Canada for a Canadian reporting issuer that is not exempt from Canadian disclosure obligations. Therefore, there may be less or different publicly available information about us than would be available if we were a Canadian reporting issuer that is not exempt from such Canadian disclosure obligations.
Pattern Development 1.0’s and Pattern Development 2.0’s general partner and its officers and directors have fiduciary or other obligations to act in the best interests of the owners of such entities, which could result in a conflict of interest with us and our stockholders.
Pattern Development 1.0 holds approximately 19% of our outstanding Class A shares, representing in the aggregate an approximate 19% voting interest in our company. We are party to the Multilateral Management Services Agreement, pursuant to which each of our executive officers (including our Chief Executive Officer) is a shared executive and devotes time to each of our company, Pattern Development 1.0, and Pattern Development 2.0 as needed to conduct the respective businesses. As a result, these shared executives have fiduciary and other duties to these Pattern Development Companies. Conflicts of interest may arise in the future between our company (including our stockholders other than Pattern Development 1.0), and Pattern Development 2.0 (and their respective owners and affiliates). Our directors and executive officers owe fiduciary duties to the holders of our shares. However, Pattern Development 1.0’s and Pattern Development 2.0’s general partner and certain of its officers and directors also have a fiduciary duty to act in the best interest of Pattern Development 1.0’s and Pattern Development 2.0’s limited partners, respectively, which interest may differ from or conflict with that of our company and our other stockholders.
42
Pattern Development 1.0’s share ownership may limit other stockholders ability to influence corporate matters.
Pattern Development 1.0 or its affiliates hold approximately 19% of the combined voting power of our shares, and this concentration of voting power may limit other stockholders’ ability to influence corporate matters, and as a result, actions may be taken that other stockholders may not view as beneficial. As a result of its ownership in our company, Pattern Development 1.0 has significant influence over all matters that require approval by our stockholders, including the election of directors, as well as substantial influence over our company, including with respect to decisions relating to our capital structure, issuing additional Class A shares or other equity securities, paying dividends on our Class A shares, incurring additional debt, making acquisitions, selling properties or other assets, merging with other companies and undertaking other extraordinary transactions. In any of these matters, the interests of Pattern Development 1.0 and its affiliates may differ from or conflict with the interests of our other stockholders.
Certain of our executive officers will continue to have an economic interest in, and all of our executive officers will continue to provide services to Pattern Development 1.0 and Pattern Development 2.0, which could result in conflicts of interest.
All of our executive officers provide services to Pattern Development 1.0 and Pattern Development 2.0 pursuant to the terms of the Multilateral Management Services Agreement between our company, Pattern Development 1.0, and Pattern Development 2.0, and, as a result, in some instances, have fiduciary or other obligations to such Pattern Development Companies. However, none of our Chief Financial Officer, Chief Investment Officer, or Senior Vice President, Operations receives compensation from, or has an economic interest in, either Pattern Development 1.0 or Pattern Development 2.0. Additionally, while none of our Chief Executive Officer, Executive Vice President, Business Development, and Executive Vice President and General Counsel, receive compensation from either Pattern Development 1.0 or Pattern Development 2.0, such officers have economic interests in such Pattern Development Companies and, accordingly, the benefit to such Pattern Development Companies from a transaction between such Pattern Development Company and our company will proportionately inure to their benefit as holders of economic interests in such Pattern Development Company. Each of Pattern Development 1.0 and Pattern Development 2.0 are related parties under the applicable securities laws governing related party transactions and, as a result, any material transaction between our company and Pattern Development 1.0 or Pattern Development 2.0 is subject to our corporate governance guidelines, which require prior approval of any such transaction by the conflicts committee, which is comprised solely of independent members of our Board of Directors. Those of our executive officers who have economic interests in Pattern Development 1.0 or Pattern Development 2.0 may be conflicted when advising the conflicts committee or otherwise participating in the negotiation or approval of such transactions. These executive officers have significant project- and industry-specific expertise that could prove beneficial to the conflicts committee’s decision-making process and the absence of such strategic guidance could have a material adverse effect on our company’s ability to evaluate any such transaction and, in turn, on our business prospects, financial condition and results of operations.
Riverstone is under no obligation to offer us an opportunity to participate in any business opportunities that it may consider from time to time, including those in the energy industry, and, as a result, Riverstone’s existing and future portfolio companies may compete with us for investment or business opportunities.
Conflicts of interest could arise in the future between us, on the one hand, and Riverstone, including its portfolio companies, on the other hand, concerning among other things, potential competitive business activities or business opportunities. Riverstone is a private equity firm in the business of making investments in entities primarily in the energy industry. As a result, Riverstone’s existing and future portfolio companies (other than Pattern Development 1.0 and Pattern Development 2.0, which are subject to the Amended and Restated Non-Competition Agreement) may compete with us for investment or business opportunities. These conflicts of interest may not be resolved in our favor.
Subject to the terms of the Amended and Restated Non-Competition Agreement with, and our respective Purchase Rights granted to us by, each of Pattern Development 1.0 and Pattern Development 2.0, we have expressly renounced any interest or expectancy in, or in being offered an opportunity to participate in, any business opportunity that may be from time to time presented to Riverstone or any of its officers, directors, agents, stockholders, members or partners or business opportunities that such parties participate in or desire to participate in, even if the opportunity is one that we might reasonably have pursued or had the ability or desire to pursue if granted the opportunity to do so, and no such person shall be liable to us for breach of any fiduciary or other duty, as a director or officer or controlling stockholder or otherwise, by reason of the fact that such person pursues or acquires any such business opportunity, directs any such business opportunity to another person or fails to present any such business opportunity, or information regarding any such business opportunity, to us unless, in the case of any such person who is our director or officer, any such business opportunity is expressly offered to such director or officer solely in his or her capacity as our director or officer. In view of Riverstone’s policies and practices with respect to the apportionment of business opportunities presented to the investment funds managed or advised by it and their respective portfolio companies, a business opportunity presented to such fund or portfolio company may generally be pursued by such fund (or other Riverstone funds, as applicable) or directed to any such portfolio company.
43
As a result, Riverstone may become aware, from time to time, of certain business opportunities, such as acquisition opportunities, and may direct such opportunities to other businesses in which it has invested, in which case we may not become aware of or otherwise have the ability to pursue such opportunities. Further, such businesses may choose to compete with us for these opportunities. As a result, our renouncing our interest and expectancy in any business opportunity that may be from time to time presented to Riverstone could adversely impact our business or prospects if attractive business opportunities are procured by such parties for their own benefit rather than for ours.
Our actual or perceived failure to deal appropriately with conflicts of interest with the Pattern Development Companies could damage our reputation, increase our exposure to potential litigation and have a material adverse effect on our business prospects, financial condition and results of operations.
Our conflicts committee is required to review, and make recommendations to the full Board of Directors regarding, any future transactions involving the acquisition of an asset or investment in an opportunity offered to us by Pattern Development 1.0 or Pattern Development 2.0 to determine whether the offer is fair and reasonable (including any acquisitions by us of assets of Pattern Development 1.0 or Pattern Development 2.0 pursuant to our respective Purchase Rights). However, our establishment of a conflicts committee may not prevent holders of our shares from filing derivative claims against us related to these conflicts of interest and related party transactions. Regardless of the merits of their claims, we may be required to expend significant management time and financial resources on the defense of such claims. Additionally, to the extent we fail to appropriately deal with any such conflicts, it could negatively impact our reputation and ability to raise additional funds and the willingness of counterparties to do business with us, all of which could have a material adverse effect on our business prospects, financial condition and results of operations.
Market interest and foreign exchange rates may have an effect on the value of our Class A shares.
One of the factors that influences the price of our Class A shares will be the effective dividend yield of our Class A shares (i.e., the yield as a percentage of the then market price of our Class A shares) relative to market interest rates. An increase in market interest rates, which are currently at low levels relative to historical rates, may lead prospective purchasers of our Class A shares to expect a higher dividend yield and, our inability to increase our dividend as a result of an increase in borrowing costs, insufficient cash available for distribution or otherwise, could result in selling pressure on, and a decrease in the market price of, our Class A shares as investors seek alternative investments with higher yield. Additionally, we intend to pay a regular quarterly dividend in U.S. dollars and, as a result, to the extent the value of the U.S. dollar dividend decreases relative to Canadian dollars, the market price of our Class A shares in Canada could decrease.
The price of our Class A shares may fluctuate significantly, and stockholders could lose all or part of their investment.
Volatility in the market price of our shares may prevent stockholders from being able to sell their Class A shares at or above the price stockholders paid for their shares. The market price of our Class A shares could fluctuate significantly for various reasons, including:
• | our operating and financial performance and prospects; |
• | our quarterly or annual results of operations or those of other companies in our industry; |
• | a change in interest rates or changes in currency exchange rates; |
• | the public’s reaction to our press releases, our other public announcements and our filings with the Canadian securities regulators and the SEC; |
• | changes in, or failure to meet, earnings estimates or recommendations by research analysts who track our Class A shares or the stock of other companies in our industry; |
• | the failure of research analysts to cover our Class A shares; |
• | strategic actions by us, our power purchasers or our competitors, such as acquisitions or restructurings; |
• | new laws or regulations or new interpretations of existing laws or regulations applicable to our business; |
• | changes in accounting standards, policies, guidance, interpretations or principles; |
• | material litigation or government investigations; |
• | changes in applicable tax laws; |
• | changes in general conditions in the United States, Canadian and global economies or financial markets, including those resulting from war, incidents of terrorism or responses to such events; |
• | changes in key personnel; |
44
• | sales of Class A shares by us or members of our management team; |
• | termination of lock-up agreements with our management team and principal stockholders; |
• | the granting or exercise of employee stock options; |
• | volume of trading in our Class A shares; and |
• | the realization of any risks described under “Risk Factors.” |
Volatility in the stock markets has had a significant impact on the market price of securities issued by many companies, including companies in our industry and yieldcos. The changes frequently appear to occur without regard to the operating performance of the affected companies. Hence, the price of our Class A shares could fluctuate based upon factors that have little or nothing to do with our company, and these fluctuations could materially reduce the share price of our Class A shares and cause stockholders to lose all or part of their investment. Further, in the past, market fluctuations and price declines in a company’s stock have led to securities class action litigation. If such a suit were to arise, it could have a substantial cost and divert our resources regardless of the outcome.
We incur increased costs and demands upon management as a result of complying with the laws and regulations affecting public companies, which could harm our operating results.
As a public company, we incur significant legal, accounting, investor relations and other expenses that we did not incur as a private company, including costs associated with public company reporting requirements. We also have incurred and will incur costs associated with current corporate governance requirements, Section 404 and other provisions of the Sarbanes-Oxley Act and the Dodd-Frank Wall Street Reform and Consumer Protection Act of 2010, as well as rules implemented by the SEC, the Canadian Securities Administrators and the stock exchanges on which our Class A shares are traded.
The expenses incurred by public companies for reporting and corporate governance purposes have increased dramatically over the past several years. Greater expenditures may be necessary in the future with the advent of new laws and regulations pertaining to public companies. If we are not able to comply with these requirements in a timely manner, the market price of our Class A shares could decline and we could be subject to sanctions or investigations by the SEC, the Canadian Securities Administrators, the applicable stock exchanges or other regulatory authorities, which would require additional financial and management resources.
As a result of the FPA and FERC’s regulations in respect of transfers of control, absent prior authorization by FERC, neither we nor Pattern Development 1.0 can convey, nor will an investor in our company generally be permitted to obtain, a direct and/or indirect voting interest in 10% or more of our issued and outstanding voting securities, and a violation of this limitation could result in civil or criminal penalties under the FPA and possible further sanctions imposed by FERC under the FPA.
We are a holding company with U.S. operating subsidiaries that are “public utilities” (as defined in the FPA) and, therefore, subject to FERC’s jurisdiction under the FPA. As a result, the FPA requires us or Pattern Development 1.0, as the case may be, either to (i) obtain prior authorization from FERC to transfer an amount of our voting securities sufficient to convey direct or indirect control over any of our public utility subsidiaries or (ii) qualify for a blanket authorization granted under or an exemption from FERC’s regulations in respect of transfers of control. Similar restrictions apply to purchasers of our voting securities who are a “holding company” under the PUHCA, in a holding company system that includes a transmitting utility or an electric utility, or an “electric holding company,” regardless of whether our voting securities were purchased in our initial public offering, subsequent offerings by us or Pattern Development 1.0, in open market transactions or otherwise. A purchaser of our voting securities would be a “holding company” under the PUHCA and an electric holding company if the purchaser acquired direct or indirect control over 10% or more of our voting securities or if FERC otherwise determined that the purchaser could directly or indirectly exercise control over our management or policies (e.g., as a result of contractual board or approval rights). Under the PUHCA, a “public-utility company” is defined to include an “electric utility company,” which is any company that owns or operates facilities used for the generation, transmission or distribution of electric energy for sale, and which includes EWGs such as our U.S. operating subsidiaries. Accordingly, absent prior authorization by FERC or an increase to the applicable percentage ownership under a blanket authorization, for the purposes of sell-side transactions by us or Pattern Development 1.0 and buy-side transactions involving purchasers of our securities that are electric holding companies, no purchaser can acquire 10% or more of our issued and outstanding voting securities. A violation of these regulations by us or Pattern Development 1.0, as sellers, or an investor, as a purchaser of our securities, could subject the party in violation to civil or criminal penalties under the FPA, including civil penalties of up to $1 million per day per violation and other possible sanctions imposed by FERC under the FPA.
As a result of the FPA and FERC’s regulations in respect of transfers of control, and consistent with the requirements for blanket authorizations granted thereunder or exemptions therefrom, absent prior authorization by FERC, no purchaser of our Class A common stock in the open market, or in subsequent offerings of our voting securities, will be permitted to purchase an amount of our securities that would cause such purchaser and its affiliate and associate companies to collectively hold 10% or more of our voting securities
45
outstanding. Additionally, investors should manage their investment in us in a manner consistent with FERC’s regulations in respect of obtaining direct or indirect “control” of our company. Accordingly, absent prior authorization by FERC, investors in our Class A common stock are advised not to acquire a direct and/or indirect voting interest in 10% or more of our issued and outstanding voting securities, whether in connection with an offering by us or Pattern Development 1.0 or in open market purchases or otherwise.
Provisions of our organizational documents and Delaware law might discourage, delay or prevent a change of control of our company or changes in our management and, as a result, depress the trading price of our Class A shares.
Our amended and restated certificate of incorporation and amended and restated bylaws contain provisions that could discourage, delay or prevent a change in control of our company or changes in our management that the stockholders of our company may deem advantageous. These provisions:
• | authorize the issuance of blank check preferred stock that our Board of Directors could issue to increase the number of outstanding shares and to discourage a takeover attempt; |
• | prohibit our stockholders from calling a special meeting of stockholders; |
• | prohibit stockholder action by written consent, which requires all stockholder actions to be taken at a meeting of our stockholders; |
• | provide that the Board of Directors is expressly authorized to adopt, or to alter or repeal our bylaws; and |
• | establish advance notice requirements for nominations for election to our Board of Directors or for proposing matters that can be acted upon by stockholders at stockholder meetings. |
These anti-takeover defenses could discourage, delay or prevent a transaction involving a change in control of our company. These provisions could also discourage proxy contests and make it more difficult for stockholders to elect directors of their choosing and cause us to take corporate actions other than those desired.
Future sales of our shares in the public market could lower our Class A share price, and any additional capital raised by us through the sale of equity or convertible debt securities may dilute stockholders’ ownership in us and may adversely affect the market price of our Class A shares.
In addition to follow-on offerings of our Class A shares in each of 2014 and 2015, in August 2016 we completed a follow-on offering in which a total of 11,300,000 Class A shares were sold. We also established an “at-the-market” equity distribution program in May 2016 under which we sold approximately 1.2 million shares in 2016. In addition, previously in July 2015, we issued $225.0 million aggregate principal amount of 4.00% Convertible Senior Notes due 2020. If we sell, or if Pattern Development 1.0 sells, additional large numbers of our Class A shares, or if we issue a large number of shares of our Class A common stock in connection with future acquisitions, financings, or other circumstances, the market price of our Class A shares could decline significantly. Moreover, the perception in the public market that we or Pattern Development 1.0 might sell Class A shares could depress the market price of those shares.
In addition, in May 2014, Pattern Development 1.0 entered into a loan agreement pursuant to which it may pledge our Class A shares owned by it to secure a $100.0 million loan. As of December 31, 2016, substantially all of our Class A shares owned by Pattern Development 1.0, approximating 17.0 million Class A shares, have been pledged as security for such loan. If Pattern Development 1.0 were to default on its obligations under the loan, the lenders would have the right to sell shares to satisfy Pattern Development 1.0’s obligation. Such an event could cause our stock price to decline. We cannot predict the size of future issuances of our Class A shares or sales of securities convertible into our Class A shares, or the effect, if any, that any such future issuances or sales will have on the market price of our shares. Sales of substantial amounts of our shares (including sales pursuant to Pattern Development 1.0’s registration rights and shares issued in connection with an acquisition) or securities convertible into our shares, or the perception that such sales could occur, may adversely affect prevailing market prices for our Class A shares.
Item 1B. | Unresolved Staff Comments. |
46
Item 2. | Properties. |
Leased Facilities
Our corporate headquarters and executive offices are located in San Francisco, California and we additionally lease office space in Houston, Texas.
Our Projects
We hold interests in 18 wind power projects, including the Broadview project which we have committed to acquire in early 2017. Our projects are located in the United States, Canada and Chile and have a total owned capacity of 2,644 MW. We typically finance our wind projects through project entity specific debt secured by each project's assets with no recourse to us. For details on our operating wind power projects, please see Item 1 "Business - Our Projects" in this Form 10-K.
Item 3. | Legal Proceedings. |
Shareholder Class Action Lawsuit
We and certain of our executive officers have been named as defendants in a putative shareholder class action lawsuit filed in the United States District Court for the Northern District of California in November 2016 alleging that defendants violated the Securities Exchange Act of 1934, as amended, and Rule 10b-5 promulgated thereunder by making allegedly false and misleading statements and omissions relating to disclosures related to our internal controls. The complaint was filed on behalf of the putative class of stockholders who purchased shares of our Class A common stock between May 9, 2016 and November 4, 2016, and seeks monetary damages on behalf of the purported class. In January 2017, the court appointed a lead plaintiff of the putative class. The lead plaintiff has since agreed to voluntarily dismiss the case with prejudice. The parties have filed a stipulation with the court to this effect.
Other Proceedings
During the third quarter of 2015, rights to appeal prior decisions granting the Renewable Energy Approval (REA) under Ontario's Environmental Protection Act for our K2 facility were exhausted without further appeal. As a result, a stay of a previously filed civil suit against the K2 facility pending final determination of the REA was lifted, allowing such suit to move forward if the claimants so choose to continue such suit. Such civil suit had claimed, among other things, nuisance based on both the construction and operation of the facility. Since the third quarter of 2016, various motions have been filed by each of K2 and the claimants in the civil suit. A hearing on such motions was held in January 2017 and the parties are awaiting a decision from the court. We do not believe this proceeding will have a material adverse effect on our business, financial position or liquidity based on the information currently available to us, but can give no assurance, that it will ultimately be resolved favorably to K2.
We are also subject, from time to time, to various other routine legal proceedings and claims arising out of the normal course of business. These proceedings primarily involve claims from landowners related to calculation of land royalties and warranty claims we initiate against equipment suppliers. The outcome of these legal proceedings and claims cannot be predicted with certainty. Nevertheless, we believe the outcome of any of such currently existing proceedings, even if determined adversely, would not have a material adverse effect on our financial condition or results of operations.
Item 4. | Mine Safety Disclosures. |
Not applicable.
47
PART II
Item 5. | Market for Registrant’s Common Equity and Related Stockholder Matters. |
Our Class A common stock is traded on the National Association of Securities Dealers Automated Quotations (NASDAQ) Global Select Market under the trading symbol “PEGI” and on the Toronto Stock Exchange (TSX) under the trading symbol “PEG.” On February 24, 2017, the last reported sale price of our Class A common stock on the NASDAQ Global Select Market was $21.09 per share and on the TSX was C$27.63 per share.
The following table sets forth, for the periods indicated, the high and low sales prices for our Class A common stock on the NASDAQ Global Select Market:
2016 | 2015 | |||||||||||||||
High | Low | High | Low | |||||||||||||
Fourth Quarter | $ | 23.01 | $ | 18.68 | $ | 24.09 | $ | 16.96 | ||||||||
Third Quarter | $ | 25.13 | $ | 22.27 | $ | 29.81 | $ | 18.18 | ||||||||
Second Quarter | $ | 23.02 | $ | 17.70 | $ | 32.00 | $ | 27.13 | ||||||||
First Quarter | $ | 21.01 | $ | 14.56 | $ | 31.20 | $ | 24.13 | ||||||||
The following table sets forth, for the periods indicated, the range of high and low sales prices for our Class A common stock on the TSX:
2016 | 2015 | |||||||||||||||
High | Low | High | Low | |||||||||||||
Fourth Quarter | C$ | 30.65 | C$ | 25.01 | C$ | 31.58 | C$ | 22.79 | ||||||||
Third Quarter | C$ | 33.00 | C$ | 29.01 | C$ | 38.66 | C$ | 24.75 | ||||||||
Second Quarter | C$ | 29.74 | C$ | 23.24 | C$ | 38.20 | C$ | 32.96 | ||||||||
First Quarter | C$ | 29.20 | C$ | 20.50 | C$ | 38.50 | C$ | 28.81 | ||||||||
On August 12, 2016, we completed an underwritten public offering of our Class A common stock. In total, 10,000,000 shares of our Class A common stock were sold. In connection with the equity offering, the underwriters had a 30-day option to purchase up to an additional 1,500,000 shares of Class A common stock to cover over-allotments. On August 22, 2016, the underwriters partially exercised their over-allotment option and purchased an additional 1,300,000 shares of Class A common stock. Aggregate net proceeds of the equity offering, including the proceeds of the over-allotment option, were approximately $258.6 million after deduction of underwriting discounts, commissions, and transaction expenses.
On May 9, 2016, we entered into an Equity Distribution Agreement. Pursuant to the terms of the Equity Distribution Agreement, we may offer and sell shares of our Class A common stock, par value $0.01 per share, from time to time through the Agents, as our sales agents for the offer and sale of the shares, up to an aggregate sales price of $200.0 million. For the year ended December 31, 2016, we sold 1,240,504 shares under the Equity Distribution Agreement and net proceeds under the issuances were $27.5 million.
Holders of Record
Because many of our shares of Class A common stock are held by brokers and other institutions on behalf of stockholders, we are unable to estimate the total number of stockholders represented by these record holders. As of February 24, 2017, there were approximately 10 stockholders of record of our Class A common stock.
48
Stock performance chart
This performance graph shall not be deemed “soliciting material” or to be “filed” with the SEC for purposes of Section 18 of the Securities Exchange Act of 1934, as amended, or the "Exchange Act," or otherwise subject to the liabilities under that Section, and shall not be deemed to be incorporated by reference into any filing of Pattern Energy Group Inc. under the Securities Act of 1933, as amended, or the "Securities Act."
The following graph shows a comparison from September 27, 2013 (the date our Class A common stock commenced trading on the NASDAQ) through December 31, 2016 of the cumulative total stockholder return for our Class A common stock, the NASDAQ Composite Index (NASDAQ Composite) and the Philadelphia Utility Sector Index. The graph assumes that $100 was invested at the market close on September 27, 2013 in the Class A common stock of Pattern Energy Group Inc., the NASDAQ Composite and the Philadelphia Utility Sector Index and also assumes reinvestments of dividends. The stock price performance of the following graph is not necessarily indicative of future stock price performance.
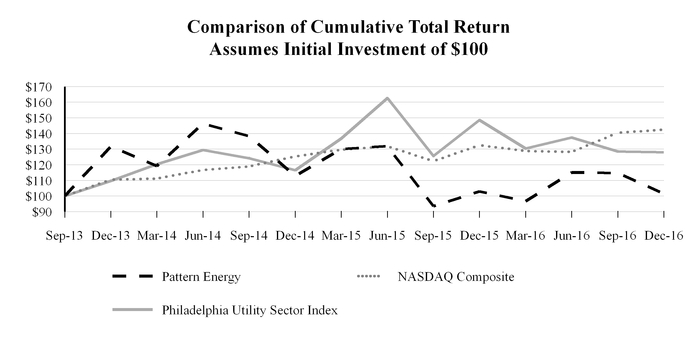
49
Cash Dividend to Investors
We intend to pay regular quarterly dividends in U.S. dollars to holders of our Class A stock. The following table sets forth the dividends declared on shares of Class A common stock for the periods indicated. On February 24, 2017, we increased our dividend to $0.41375 per share of Class A common stock, or $1.655 per share of Class A common stock on an annualized basis, commencing with respect to dividends paid on April 28, 2017 to holders of record on March 31, 2017.
Dividends Declared | |||
2017 | |||
First Quarter | $ | 0.4138 | |
2016 | |||
Fourth Quarter | $ | 0.4080 | |
Third Quarter | $ | 0.4000 | |
Second Quarter | $ | 0.3900 | |
First Quarter | $ | 0.3810 | |
2015 | |||
Fourth Quarter | $ | 0.3720 | |
Third Quarter | $ | 0.3630 | |
Second Quarter | $ | 0.3520 | |
First Quarter | $ | 0.3420 | |
We have established our quarterly dividend level based on a targeted cash available for distribution payout ratio of 80%, after considering the annual cash available for distribution that we expect our projects will be able to generate and with due regard to retaining a portion of the cash available for distribution to grow our business. We intend to grow our business primarily through the acquisition of operational power projects, which, we believe, will facilitate the growth of our cash available for distribution and enable us to increase our dividend per share of Class A common stock over time. We may in the future raise capital and make investments in new power projects upon or near the commencement of construction of such projects and therefore prior to the expected commencement of operations of the new projects, which could result in a passage of time of twelve or more months before we begin to receive any cash flow contributions from such projects to our cash available for distribution. In connection with these investments, we may increase our dividends prior to the receipt of such cash flow contributions, which would likely cause our payout ratio to temporarily exceed our targeted run-rate payout ratio. However, the determination of the amount of cash dividends to be paid to holders of our Class A common stock will be made by our Board of Directors and will depend upon our financial condition, results of operations, cash flow, long-term prospects and any other matters that our Board of Directors deem relevant. See Item 1A “Risk Factors—Risks Related to Ownership of our Class A Shares—Risks Regarding our Cash Dividend Policy.”
We expect to pay a quarterly dividend on or about the 30th day following each fiscal quarter to holders of record of our Class A common stock on the last day of such quarter.
Our cash available for distribution is likely to fluctuate from quarter to quarter, perhaps significantly, as a result of variability in wind conditions and other factors. Accordingly, during quarters in which we generate cash available for distribution in excess of the amount required to pay our stated quarterly dividend, we may reserve a portion of the excess to fund dividends in future quarters. In addition, we may use sources of cash not included in our calculation of cash available for distribution, such as certain net cash provided by financing and investing activities, to pay dividends to holders of our Class A common stock in quarters in which we do not generate sufficient cash available for distribution to fund our stated quarterly dividend. Although these other sources of cash may be substantial and available to fund a dividend payment in a particular period, we exclude these items from our calculation of cash available for distribution because we consider them non-recurring or otherwise not representative of the operating cash flows we typically expect to generate. See Item 7 “Management's Discussion and Analysis of Financial Condition and Results of Operations—Key Metrics—Cash Available for Distribution."
50
Repurchase of Equity Securities
The table below provides information with respect to repurchases of our Class A common stock during the fourth quarter ended December 31, 2016. All shares were tendered to us in satisfaction of employee tax withholding obligations upon the vesting of restricted stock grants under our 2013 Equity Incentive Award Plan. We currently do not have a stock repurchase plan in place.
Period | Total Number of Shares Purchased | Average Price Paid Per Share | |||||
12/1/16-12/31/16 | 42,620 | $ | 20.16 | ||||
42,620 | $ | 20.16 | |||||
For information on the equity compensation plans see Item 12 "Security Ownership of Certain Beneficial Owners and Management and Related Stockholder Matters."
51
Item 6. | Selected Financial Data. |
Set forth below is our summary historical consolidated financial data. This information may not be indicative of our future results of operations, financial position and cash flows and should be read in conjunction with the consolidated financial statements and notes thereto and Item 7 “Management’s Discussion and Analysis of Financial Condition and Results of Operations” presented elsewhere in this Form 10-K. We believe that the assumptions underlying the preparation of our historical consolidated financial statements are reasonable.
Year Ended December 31, | ||||||||||||||||||||
2016 | 2015 | 2014 | 2013 | 2012 | ||||||||||||||||
(in thousands, except per share data) | ||||||||||||||||||||
Statement of operations data: | ||||||||||||||||||||
Total revenue(1) | $ | 354,052 | $ | 329,831 | $ | 265,493 | $ | 201,573 | $ | 114,528 | ||||||||||
Operating income (expense) | 237 | 34,440 | 54,981 | 47,728 | 19,022 | |||||||||||||||
Net income (loss) | (52,299 | ) | (55,607 | ) | (39,999 | ) | 10,072 | (13,376 | ) | |||||||||||
Net loss attributable to noncontrolling interest | (35,188 | ) | (23,074 | ) | (8,709 | ) | (6,887 | ) | (7,089 | ) | ||||||||||
Net income (loss) attributable to Pattern Energy | $ | (17,111 | ) | $ | (32,533 | ) | $ | (31,290 | ) | $ | 16,959 | $ | (6,287 | ) | ||||||
Less: Net income attributable to Pattern Energy prior to the initial public offering on October 2, 2013 | (30,295 | ) | ||||||||||||||||||
Net loss attributable to Pattern Energy subsequent to the initial public offering | $ | (13,336 | ) | |||||||||||||||||
Loss per share data: | ||||||||||||||||||||
Class A common stock: basic and diluted loss per share | (0.22 | ) | (0.46 | ) | (0.56 | ) | (0.17 | ) | N/A | |||||||||||
Class B common stock: basic and diluted loss per share | N/A | N/A | (0.49 | ) | (0.48 | ) | N/A | |||||||||||||
Dividends: | ||||||||||||||||||||
Dividends declared per Class A common share | 1.58 | 1.43 | 1.30 | 0.31 | N/A | |||||||||||||||
Deemed dividends per Class B common share | N/A | N/A | 1.41 | — | N/A | |||||||||||||||
Balance sheet data: | ||||||||||||||||||||
Total assets(1)(2) | 3,752,767 | 3,829,592 | 2,795,287 | 1,872,233 | 1,999,347 | |||||||||||||||
Revolving credit facility | 180,000 | 355,000 | 50,000 | — | — | |||||||||||||||
Long-term debt including current portion, net of financing costs(2) | 1,383,672 | 1,415,886 | 1,413,858 | 1,217,820 | 1,254,187 | |||||||||||||||
Total liabilities | 1,874,023 | 2,053,830 | 1,630,553 | 1,304,229 | 1,409,935 | |||||||||||||||
(1) | Total revenues and total assets increased during the years ended and as of December 31, 2015 and 2014 compared to the years ended and as of December 31, 2014 and 2013, respectively, primarily due to acquisitions and the commencement of operations at various project wind farms. For further details of acquisitions, see Note 3, Acquisitions, in the notes to consolidated financial statements. |
(2) | In 2015, we early adopted ASU 2015-03, “Interest – Imputation of Interest: Simplifying the Presentation of Debt Issuance Costs." As a result, we reclassified deferred financing costs from other assets to long-term debt. In the table above, prior year presentation of long-term debt reflects the reclassification of deferred financing costs. |
52
Item 7. | Management’s Discussion and Analysis of Financial Condition and Results of Operations |
The following discussion and analysis of our financial condition and results of operations should be read in conjunction with our financial statements and related notes included elsewhere in this Form 10-K. The following discussion contains "forward-looking statements" that reflect our future plans, estimates, beliefs and expected performance. Our actual results may differ materially from those currently anticipated and expressed in such forward-looking statements as a result of a number of factors, including those we discuss under Item 1A "Risk Factors" elsewhere in this Form 10-K. We caution that assumptions, expectations, projections, intentions or beliefs about future events may, and often do, vary from actual results and the differences can be material. See "Cautionary Notice Regarding Forward-Looking Statements."
Overview
We are an independent power company focused on owning and operating power projects with stable long-term cash flows in attractive markets with potential for continued growth of our business. We hold interests in 18 wind power projects, including the Broadview project which we have committed to acquire in April 2017. Our projects are located in the United States, Canada and Chile and use proven, best-in-class technology and have a total owned capacity of 2,644 MW. Each of our projects has contracted to sell all or a majority of its output pursuant to a long-term, fixed-price or variable price power sale agreement. Ninety-one percent of the electricity to be generated by our projects will be sold under our power sale agreements which have a weighted average remaining contract life of approximately 14 years as of December 31, 2016.
We intend to maximize long-term value for our stockholders in an environmentally responsible manner and with respect for the communities in which we operate. Our business is built around three core values of creative energy and spirit, pride of ownership and follow-through, and a team first attitude, which guide us in creating a safe, high-integrity work environment, applying rigorous analysis to all aspects of our business, and proactively working with our stakeholders to address environmental and community concerns. Our financial objectives, which we believe will maximize long-term value for our stockholders, are to produce stable and sustainable cash available for distribution, selectively grow our project portfolio and our dividend per Class A share and maintain a strong balance sheet and flexible capital structure.
Our growth strategy is focused on the acquisition of operational and construction-ready power projects from the Pattern Development Companies and other third parties that we believe will contribute to the growth of our business and enable us to increase our dividend per share of Class A common stock over time. The Pattern Development Companies are leading developers of renewable energy and transmission projects. Our continuing relationship with the Pattern Development Companies provides us with access to a pipeline of acquisition opportunities. Currently, the Pattern Development Companies have a 5,900 MW pipeline of development projects, all of which are subject to our right of first offer. We target achieving a total owned capacity of 5,000 MW by year end 2019 through a combination of acquisitions from the Pattern Development Companies and other third parties capitalizing on the large and fragmented global renewable energy market. Our business is primarily focused in the U.S., Canada and Chile; however, we expect opportunities in Japan and Mexico will form part of our growth strategy.
The discussion and analysis below has been organized as follows:
• | Recent Developments |
• | Factors that Significantly Affect our Business |
◦ | Trends Affecting our Industry |
◦ | Factors Affecting our Operational Results |
• | Key Metrics |
• | Results of Operations |
53
• | Liquidity and Capital Resources |
◦ | Sources of Liquidity |
◦ | Uses of Liquidity |
◦ | Covenants, Distribution Conditions and Events of Default |
• | Critical Accounting Policies and Estimates |
Recent Developments
In January 2017, we issued unsecured senior notes with an aggregate principal amount of $350.0 million (the 2024 Unsecured Senior Notes). Net proceeds to us were approximately $345.0 million, after deducting the initial purchasers’ discount, commissions and transaction expenses. We intend to use approximately $215 million of the net proceeds to partially fund our acquisition of the Broadview projects, as described below and used $128 million of proceeds to repay borrowings incurred under the Revolving Credit Facility to finance the purchase of the Armow project as discussed below. The 2024 Unsecured Senior Notes bear interest at a rate of 5.875% per year, payable semiannually in arrears on February 1 and August 1, beginning on August 1, 2017 and maturing on February 1, 2024, unless repurchased or redeemed at an earlier date. The 2024 Unsecured Senior Notes are guaranteed on a senior unsecured basis by Pattern US Finance Company, one of our subsidiaries.
On October 17, 2016, we acquired from Pattern Development 1.0 a 50% limited partnership interest in SP Armow Wind Ontario LP (the Armow Project Company), as well as 100% of the issued and outstanding shares in the capital of Pattern Armow GP Holdings Inc. for consideration of approximately $132.6 million, plus accrued estimated proportionate debt of approximately $197.1 million U.S. dollar equivalent. The Armow Project Company operates the approximately 180 MW wind farm located in the Municipality of Kincardine in Bruce County, Ontario, Canada which achieved commercial operations in December 2015. The purchase price was funded through a draw under our Revolving Credit Facility and available cash, which as discussed above was paid upon the issuance of the 2024 Senior Unsecured Senior Notes.
On August 12, 2016, we completed an underwritten public offering of our Class A common stock. In total, 10,000,000 shares of our Class A common stock were sold. In connection with the equity offering, the underwriters had a 30-day option to purchase up to an additional 1,500,000 shares of Class A common stock to cover over-allotments. On August 22, 2016, the underwriters partially exercised their over-allotment option and purchased an additional 1,300,000 shares of Class A common stock. Aggregate net proceeds of the equity offering, including the proceeds of the over-allotment option, were approximately $258.6 million after deduction of underwriting discounts, commissions, and transaction expenses.
On June 30, 2016, we committed to acquire from Pattern Development 1.0 an 84% interest in Broadview, a 324 MW wind project and a 99% interest in the associated independent 35-mile 345 kV Western Interconnect transmission line for a purchase price of approximately $269.0 million (Broadview Acquisition), which will be funded at the commencement of commercial operations, currently estimated to occur in April 2017. We intend to fund the Broadview Acquisition partially with proceeds from the issuance of the 2024 Unsecured Senior Notes and by the assumption of project-level borrowings of approximately $54 million.
On May 9, 2016, we entered into an Equity Distribution Agreement. Pursuant to the terms of the Equity Distribution Agreement, we may offer and sell shares of our Class A common stock, from time to time through the Agents, as our sales agents for the offer and sale of the shares, up to an aggregate sales price of $200.0 million. For the year ended December 31, 2016, we sold 1,240,504 shares under the Equity Distribution Agreement and net proceeds under the issuances were $27.5 million.
Factors that Significantly Affect our Business
Our results of operations in the near-term, as well as our ability to grow our business and revenue from electricity sales over time, could be impacted by a number of factors, including trends affecting our industry and factors affecting our operating results as discussed below:
Trends Affecting our Industry
The growth in the industry is largely attributable to renewable energy’s increasing cost competitiveness with other power generation technologies, the advantages of wind power over other renewable energy sources, and growing public support for renewable energy driven by energy security and environmental concerns.
54
We believe that the key drivers for the long-term growth of renewable power include:
• | increased demand for renewable energy resulting from regulatory or policy initiatives. Notable initiatives include country, state or provincial RPS programs; |
• | governmental incentives for renewable energy including feed-in-tariff regimes, carbon credits and the U.S. federal based production or investment tax credits, which were extended through December 2019 (wind) and December 2022 (solar), that improve the cost competitiveness of renewable energy compared to traditional sources; |
• | new demand created by corporate and industrial buyers directly procuring renewable electricity on a large scale; |
• | efficiency and capital cost improvements in wind, solar and other renewable energy technologies, enabling wind and other forms of renewable energy to compete successfully in more markets; |
• | environmental and social factors supporting increasing levels of wind, solar and other renewable technologies in the generation mix; |
• | regulatory barriers, market pressure and public acceptance challenges increase the time, cost and difficulty of permitting new fossil fuel-fired facilities, notably coal, and nuclear facilities; |
• | decommissioning of aging coal-fired and nuclear facilities is expected to leave a gap in electricity supply; and |
• | policy initiatives to include such externalities as the cost of carbon pollution, methane leakage and water usage in conventional fossil fuel-fired electricity generation over time will increase costs of conventional generation. |
In general, we continue to believe that there will be additional acquisition opportunities in the United States in the short term and that the longer-term growth trend will continue.
Our Outlook
Our projects are generally unaffected by short-term trends given that 91% of the electricity to be generated by our projects is to be sold under our fixed-price power sale agreements, which have a weighted average remaining life of approximately 14 years as of December 31, 2016.
Our near-term growth strategy will focus on wind power projects, but will also include evaluation of solar power opportunities, and is largely insulated from short-term trends. We have three solar projects on our list of Identified ROFO Projects, one in Chile and two in Japan. We expect that most of our short-term growth will come from opportunities to acquire the Identified ROFO Projects, but we will evaluate unaffiliated third-party asset acquisition opportunities, as well. In addition, we have begun to evaluate our potential investment in Pattern Development 2.0 as discussed below.
Factors Affecting our Operational Results
The primary factors that will affect our financial results are (i) acquisitions, (ii) potential investment in Pattern Development 2.0, (iii) electricity sales and energy derivative settlements of our operating projects, (iv) impact of derivative instruments, (v) project operations, (vi) general and administrative cost containment, and (vii) debt financing.
Acquisitions
Our ability to grow our cash available for distribution is substantially dependent on our ability to make acquisitions. During 2016, we acquired a 50% interest in Armow, which increased operating capacity by 90 MW and committed to the Broadview acquisition which will further increase our operating capacity by 272 MW. The acquisition of these projects impacted or will impact our operating results and earnings from equity method investments. Our aggregate owned capacity is 2,644 MW. We expect that the acquisition of operational power projects from the Pattern Development Companies and other third parties will contribute to our operational results.
55
Below is a summary of the Identified ROFO Projects that we expect to acquire from the Pattern Development Companies in connection with our Project Purchase Rights:
Capacity (MW) | ||||||||||||||||
Identified ROFO Projects | Status | Location | Construction Start(1) | Commercial Operations(2) | Contract Type | Rated(3) | Owned Capacity(4) | |||||||||
Pattern Development 1.0 Projects | ||||||||||||||||
Kanagi Solar | Operational | Japan | 2014 | 2016 | PPA | 14 | 6 | |||||||||
Futtsu Solar | Operational | Japan | 2014 | 2016 | PPA | 42 | 19 | |||||||||
Conejo Solar | Operational | Chile | 2015 | 2016 | PPA | 104 | 104 | |||||||||
Meikle | Operational | British Columbia | 2015 | 2017 | PPA | 180 | 180 | |||||||||
Belle River | In construction | Ontario | 2016 | 2017 | PPA | 100 | 43 | |||||||||
Ohorayama | In construction | Japan | 2016 | 2018 | PPA | 33 | 31 | |||||||||
Mont Sainte-Marguerite | In construction | Québec | 2017 | 2017 | PPA | 147 | 147 | |||||||||
Henvey Inlet | Late stage development | Ontario | 2017 | 2018 | PPA | 300 | 150 | |||||||||
North Kent | Late stage development | Ontario | 2017 | 2018 | PPA | 100 | 43 | |||||||||
Tsugaru | Late stage development | Japan | 2017 | 2019 | PPA | 126 | 63 | |||||||||
Pattern Development 2.0 Projects | ||||||||||||||||
Grady | Late stage development | New Mexico | 2018 | 2019 | PPA | 220 | 176 | |||||||||
1,366 | 962 | |||||||||||||||
(1) | Represents year of actual or anticipated commencement of construction. |
(2) | Represents year of actual or anticipated commencement of commercial operations. |
(3) | Rated capacity represents the maximum electricity generating capacity of a project in MW. As a result of wind and other conditions, a project or a turbine will not operate at its rated capacity at all times and the amount of electricity generated may be less than its rated capacity. The amount of electricity generated may vary based on a variety of factors. |
(4) | Owned capacity represents the maximum, or rated, electricity generating capacity of the project in MW multiplied by either Pattern Development 1.0's or Pattern Development 2.0's percentage ownership interest in the distributable cash flow of the project. |
Potential Investment in Pattern Development 2.0
In December 2016, certain investment funds managed by Riverstone Holdings LLC, which own interests in Pattern Development 1.0, engaged in a transaction in which (a) certain assets of Pattern Development 1.0 consisting principally of early and mid-stage U.S. development assets (including the Grady project which is an Identified ROFO Project) were transferred to a newly formed entity, Pattern Development 2.0, and (b) Pattern Development 1.0 retained the remainder of its assets consisting principally of the other Identified ROFO Projects, non-U.S. development assets, and its ownership interest in our Class A common stock. The purpose of the transaction was to facilitate additional long-term capital raises by Pattern Development 2.0 to support the growth in the development pipeline. We also entered into other agreements with Pattern Development 2.0 which are substantially the same as existing agreements we have previously entered into with Pattern Development 1.0, including a purchase rights agreement. Pattern Development 2.0 is structured to allow us to potentially invest in Pattern Development 2.0 in the future.
During 2017, we will continue to evaluate the potential benefits and risks of an investment in Pattern Development 2.0. Strategic benefits include a strengthened link to Pattern Development 2.0's development pipeline and increased return on investment expectations commensurate with increased development risk. To the extent we invest in Pattern Development 2.0 we will be initially exposed to capital requirements prior to having certainty that a project can move forward. As projects are successfully completed, we anticipate that our return on our capital investment will increase. However, there are risks in project development that we have not yet been exposed to including, but not limited to, permitting challenges, failure to secure PPAs, failure to procure the requisite financing, equipment or interconnection, or an inability to satisfy the conditions to effectiveness of project agreements such as PPAs.
Electricity Sales and Energy Derivative Settlements of our Operating Projects
Our electricity sales and energy derivative settlements are primarily determined by the price of electricity and any environmental attributes we sell under our power sale agreements and the amount of electricity that we produce, which is in turn principally the result of the wind conditions at our project sites and the performance of our equipment. We base our estimates of each project’s capacity to generate electricity on the findings of our internal and external experts’ long-term meteorological studies, which include on-site data collected from equipment on the property and relevant reference wind data from other sources, as well as specific equipment power curves and estimates for the
56
performance of our equipment over time. Ninety-one percent of the electricity to be generated across our projects is currently committed under long-term, fixed-price power sale agreements which have a weighted average remaining contract life of approximately 14 years as of December 31, 2016.
Our wind analysis evaluates the wind’s speed and prevailing direction, atmospheric conditions, and wake and seasonal variations for each project. The result of our meteorological analysis is a probabilistic assessment of a project’s likely output. A P50 level of production indicates we believe a 50% probability exists that the electricity generated from a project will exceed a specified aggregate amount of electricity generation during a given period. While we plan for variability around this P50 production level, it generally provides the foundation for our base case expectation. The variability is measured in a spectrum of possible output levels such as a P75 output level, which indicates that over a specified period of time, such as one or ten years, the P75 output level would be exceeded 75% of the time. Similarly, the P25 output level would be exceeded 25% of the time. We often use P95, P90 and P75 production levels to plan ahead for low-wind years, while recognizing that we should also have corresponding high-wind years.
In addition to annual P50 variability, we also expect seasonal variability to occur. Variability increases as the period of review shortens, so it is likely that we will experience more variability in monthly or quarterly production than we do for annual production. Therefore, our periodic cash flow and payout ratios will also reflect more variability during periods shorter than a year. As a result, we use cash reserves to help manage short term production and cash flow variability.
When analyzed together, a portfolio’s probability of exceeding a specific output level changes when all the projects are considered as a portfolio instead of on a stand-alone basis. Due to the geographical separation between our projects, the uncertainty variables and wind speed correlations are diverse enough across the portfolio to provide reduction in the overall uncertainty, which we refer to as the portfolio effect. For example, the sum of our individual projects’ P75 output levels is approximately 93% of the aggregate P50 output level (which is unaffected by the portfolio effect), while the P75 output level, when taking into account the portfolio effect, is approximately 96% of our aggregate P50 output level. On a portfolio basis, our P90 and P95 production estimates for the annual electricity generation of our seventeen operating projects are approximately 92% and 89%, respectively, of our estimated P50 output levels. The portfolio effect results in an improvement in the production stability across the portfolio. A greater diversity of projects in the portfolio has the effect of increasing the frequency of occurrences aggregated around the expected result (probability level).
Our electricity generation is also dependent on the equipment that we use. We have selected high-quality equipment with a goal of having a concentration of turbines from top manufacturers. With a combination of high-quality equipment and scale and in-house operating capability, we have structured our projects such that we may expect high availability and long-term production from the equipment, develop operating expertise and experience, which can be shared among our operators, obtain a high level of attention and focus from the manufacturers and common operating practices. Given our manufacturers’ global fleet sizes and strong balance sheets, the warranties that we secure for our turbines and our operating approach described below, we are confident in our expectations for reliable long-term turbine operation.
Impact of Derivative Instruments
Where possible, we have sought to protect ourselves against electricity and interest rate exposures with a relatively longer term hedging strategy. We expect to hedge exposure to foreign currency exchange rates in the future over shorter periods of time. Accordingly, we have experienced in the past, and expect to record in the future, substantial volatility in the components of our net income that relate to the mark-to-market adjustments on our undesignated energy and interest rate derivatives.
We believe that mark-to-market adjustments that we make to the fair value of our derivative assets and liabilities are generally mirrored by changes in the economic value of the related operating or financial assets, such as our wind projects and our project loans, for which the application of accounting principles generally accepted in the United States (U.S. GAAP) does not permit us to record such economic gains and losses. For this reason, and because one of our principal financial objectives is to produce stable and sustainable cash available for distribution, we believe that the economic value to our shareholders reflected in these derivative instruments, outweighs the risk of volatility in net income that we expect to report. Accordingly, we believe it is useful to investors to consider supplemental financial measures that we report, such as Adjusted Earnings Before Interest, Taxes, Depreciation, Amortization and Accretion (EBITDA), where we have subtracted and added back, as applicable, the unrealized gains and losses arising from mark-to-market adjustments on our derivative instruments, and cash available for distribution.
57
Project Operations
Turbine Availability
Our ability to generate electricity in an efficient and cost-effective manner is impacted by our ability to maintain the operating capacity of our projects. We use reliable and proven wind turbines and other equipment for each of our projects. For the years ended December 31, 2016 and 2015, our turbine availability across our projects was 97.0% and 97.3% respectively, which is in line with industry standards for original investment projections reviewed by independent engineering firms.
Operations and maintenance - self-perform
We are currently in the process of revising long-term turbine manufacturer service arrangements at certain of our projects pursuant to which the turbine manufacturer continues to provide routine and corrective maintenance service, but we are responsible for a portion of the maintenance and repairs, including on major component parts. These revised service arrangements will reduce our fixed contract costs. We expect over time in the future to take on additional risks as an owner, including self-performing maintenance and service work with our own technicians instead of utilizing service providers, which will have continuing expected cost benefits, but will similarly come with additional increased risks and reduced third party warranty and guarantee protections. Migration to the self-perform model is expected at five of our projects by the end of 2017 with additional projects transitioning to this model thereafter.
General and Administrative Cost Containment
In addition to reducing our project expense through a transition to self-perform, we are also focused on measures to reduce our general and administrative expenses, including our net related party charges to and from Pattern Development 1.0. Our operating expenses as a percentage of our CAFD has been declining from 46% in 2014, 40% in 2015 and 38% in 2016 and we expect this trend to continue in 2017. We are investing in a number of efficiency initiatives (principally automation and other process improvements) in accounting, procurement, human resources, loan administration, and asset management, among others, that we believe will also result in a lower administrative cost structure. In the short term, we expect that these initiatives along with measures we take to remediate our material weaknesses in internal controls in 2017 may result in higher audit, consulting and staffing expenses; however, in future years, we anticipate that the consequent changes we make to our control environment together with the efficiency initiatives will reduce general and administrative costs starting in 2018.
Debt Financing
We intend to use a portion of our revenue from electricity sales to cover our subsidiaries’ interest expense and principal payments on borrowings under their respective project financing facilities. Our interest expense primarily reflects (i) imputed interest on the lease financing of our Hatchet Ridge project, (ii) periodic interest on the term loan financing arrangements, including the effects of interest rate swaps, at our other operating projects, (iii) interest on our convertible senior notes issued in 2015 and 2024 Unsecured Senior Notes issued in 2017 and (iv) interest on short-term loan facilities, including any borrowings under our revolving credit facility.
We believe that our projects have been financed on average with stronger coverage ratios than is typical in our industry. A debt service coverage ratio is generally defined as a project’s operating cash flows divided by scheduled payments of principal and interest for a period. While we believe that the commercial bank market generally seeks a minimum average annual debt service coverage ratio for wind power projects, based on P50 output levels, of between 1.4 and 1.5 to 1.0, our projects, on a portfolio basis, have an expected average annual debt service coverage ratio over the remaining scheduled loan amortization periods of approximately 2.0 to 1.0.
Key Metrics
We regularly review a number of financial measurements and operating metrics to evaluate our performance, measure our growth and make strategic decisions. In addition to traditional U.S. GAAP performance and liquidity measures, such as total revenue, cost of revenue, net loss and net cash provided by operating activities, we also consider cash available for distribution as a supplemental liquidity measure and Adjusted EBITDA, MWh sold and average realized electricity price in evaluating our operating performance. We disclose cash available for distribution, which is a non-U.S. GAAP measure, because management recognizes that it will be used as a supplemental measure by investors and analysts to evaluate our liquidity. We disclose Adjusted EBITDA, which is a non-U.S. GAAP measure, because management believes this metric assists investors and analysts in comparing our operating performance across reporting periods on a consistent basis by excluding items that our management believes are not indicative of our core operating performance. Each of these key metrics is discussed below.
58
Limitations to Key Metrics
We disclose cash available for distribution because management recognizes that it will be used as a supplemental measure by investors and analysts to evaluate our liquidity. However, cash available for distribution has limitations as an analytical tool because it excludes depreciation, amortization and accretion, does not capture the level of capital expenditures necessary to maintain the operating performance of our projects, is not reduced for principal payments on our project indebtedness except to the extent they are paid from operating cash flows during a period, and excludes the effect of certain other cash flow items, all of which could have a material effect on our financial condition and results from operations. Cash available for distribution is a non-U.S. GAAP measure and should not be considered an alternative to net cash provided by operating activities or any other liquidity measure determined in accordance with U.S. GAAP, nor is it indicative of funds available to fund our cash needs. In addition, our calculation of cash available for distribution is not necessarily comparable to cash available for distribution as calculated by other companies.
We disclose Adjusted EBITDA, which is a non-U.S. GAAP measure, because management believes this metric assists investors and analysts in comparing our operating performance across reporting periods on a consistent basis by excluding items that our management believes are not indicative of our core operating performance. We use Adjusted EBITDA to evaluate our operating performance. You should not consider Adjusted EBITDA as an alternative to net (loss) income, determined in accordance with U.S. GAAP.
Adjusted EBITDA has limitations as an analytical tool. Some of these limitations are:
• | Adjusted EBITDA |
• | does not reflect our cash expenditures or future requirements for capital expenditures or contractual commitments; |
• | does not reflect changes in, or cash requirements for, our working capital needs; |
• | does not reflect the significant interest expense, or the cash requirements necessary to service interest or principal payments, on our debt, or our proportional interest in the interest expense of our unconsolidated investments or the cash requirements necessary to service interest or principal payments on the debt borne by our unconsolidated investments; |
• | does not reflect our income taxes or the cash requirement to pay our taxes; or our proportional interest in income taxes of our unconsolidated investments or the cash requirements necessary to pay the taxes of our unconsolidated investments; |
• | does not reflect depreciation, amortization and accretion which are non-cash charges; or our proportional interest in depreciation, amortization and accretion of our unconsolidated investments. The assets being depreciated, amortized and accreted will often have to be replaced in the future, and Adjusted EBITDA does not reflect any cash requirements for such replacements; and |
• | does not reflect the effect of certain mark-to-market adjustments and non-recurring items or our proportional interest in the mark-to-market adjustments at our unconsolidated investments. |
• | We do not have control, nor have any legal claim to the portion of the unconsolidated investees' revenues and expenses allocable to our joint venture partners. As we do not control, but do exercise significant influence, we account for the unconsolidated investments in accordance with the equity method of accounting. Net earnings (losses) from these investments are reflected within our consolidated statements of operations in "Earnings (loss) in unconsolidated investments, net." Adjustments related to our proportionate share from unconsolidated investments include only our proportionate amounts of interest expense, income taxes, depreciation, amortization and accretion, and mark-to-market adjustments included in "Earnings (loss) in unconsolidated investments, net;" and |
• | Other companies in our industry may calculate Adjusted EBITDA differently than we do, limiting its usefulness as a comparative measure. |
Because of these limitations, Adjusted EBITDA should not be considered in isolation or as a substitute for performance measures calculated in accordance with U.S. GAAP.
Cash Available for Distribution
We define cash available for distribution as net cash provided by operating activities as adjusted for certain other cash flow items that we associate with our operations. It is a non-U.S. GAAP measure of our ability to generate cash to service our dividends.
Cash available for distribution represents cash provided by operating activities as adjusted to (i) add or subtract changes in operating assets and liabilities, (ii) subtract net deposits into restricted cash accounts, which are required pursuant to the cash reserve requirements of financing agreements, to the extent they are paid from operating cash flows during a period, (iii) subtract cash distributions paid to
59
noncontrolling interests, (iv) subtract scheduled project-level debt repayments in accordance with the related loan amortization schedule, to the extent they are paid from operating cash flows during a period, (v) subtract non-expansionary capital expenditures, to the extent they are paid from operating cash flows during a period, (vi) add cash distributions received from unconsolidated investments, to the extent such distributions were derived from operating cash flows and (vii) add or subtract other items as necessary to present the cash flows we deem representative of our core business operations.
The most directly comparable U.S. GAAP measure to cash available for distribution is net cash provided by operating activities. The following table is a reconciliation of our net cash provided by operating activities to cash available for distribution for the periods presented (unaudited and in thousands):
Year ended December 31, | ||||||||||||
2016 | 2015 | 2014 | ||||||||||
Net cash provided by operating activities | $ | 163,664 | $ | 117,849 | $ | 110,448 | ||||||
Changes in operating assets and liabilities | (11,000 | ) | (6,880 | ) | (9,002 | ) | ||||||
Network upgrade reimbursement | 4,821 | 2,472 | 2,472 | |||||||||
Release of restricted cash to fund project and general and administrative costs | 640 | 1,611 | 223 | |||||||||
Operations and maintenance capital expenditures | (1,017 | ) | (779 | ) | (267 | ) | ||||||
Distributions from unconsolidated investments | 41,698 | 34,216 | 7,891 | |||||||||
Reduction of other asset - Gulf Wind energy derivative deposit | — | 6,205 | — | |||||||||
Other | (302 | ) | (323 | ) | 1,730 | |||||||
Less: | ||||||||||||
Distributions to noncontrolling interests | (17,896 | ) | (7,882 | ) | (2,100 | ) | ||||||
Principal payments paid from operating cash flows | (47,634 | ) | $ | (54,041 | ) | $ | (49,246 | ) | ||||
Cash available for distribution | $ | 132,974 | $ | 92,448 | $ | 62,149 | ||||||
Cash available for distribution was $133.0 million for the year ended December 31, 2016 as compared to $92.4 million in the prior year. This $40.5 million increase in cash available for distribution was due to additional revenues of $47.3 million (excluding unrealized loss on energy derivative and amortization of PPAs) primarily from projects which were acquired or commenced commercial operations during 2015. In addition, we received an increase of $22.5 million in cash distributions from our unconsolidated investments when compared to the same period in the prior year which was due to full year operations at K2 and the acquisition of Armow in the fourth quarter of 2016, reduced principal payments of project-level debt by $6.4 million, decreased net losses on transactions of $3.1 million, and increased related party income of $2.4 million. These increases were partially offset by increased project expenses of $14.2 million, operating expenses of $13.1 million, increased distributions to noncontrolling interests of $10.0 million, and the $6.2 million cash distribution from the partial refund of a deposit associated with the Gulf Wind energy derivative in 2015.
Cash available for distribution was $92.4 million for the year ended December 31, 2015 as compared to $62.1 million in the prior year. This $30.3 million increase in cash available for distribution was due to additional revenues of $63.1 million (excluding unrealized loss on energy derivative and amortization of PPAs) primarily from projects which commenced commercial operations or were acquired during 2014 and 2015. In addition, we received an increase of $26.3 million in cash distributions from our unconsolidated investments when compared to the same period in the prior year which was due to full year operation at each of South Kent and Grand in 2015 compared to partial year operation in 2014 and the acquisition of K2 in the second quarter of 2015. Cash available for distribution was also impacted by a $6.2 million cash distribution from the partial refund of a deposit associated with the Gulf Wind energy derivative. These increases were partially offset by increases in project expenses of $36.8 million, operating expenses of $9.1 million, interest expense of $10.2 million, primarily from projects which commenced commercial operations during 2014 and 2015. In addition, increases in cash available for distribution were offset by increased distributions to noncontrolling interests of $5.8 million and increased principal payments of $4.8 million.
Adjusted EBITDA
We define Adjusted EBITDA as net income (loss) before net interest expense, income taxes, and depreciation, amortization and accretion, including our proportionate share of net interest expense, income taxes, and depreciation, amortization and accretion of unconsolidated investments. Adjusted EBITDA also excludes the effect of certain mark-to-market adjustments and infrequent items not related to normal or ongoing operations, such as early payment of debt, realized derivative gain or loss from refinancing transactions, gain or loss related to acquisitions or divestitures, and adjustments from unconsolidated investments. In calculating Adjusted EBITDA, we exclude mark-to-market adjustments to the value of our derivatives because we believe that it is useful for investors to understand, as a supplement to
60
net income (loss) and other traditional measures of operating results, the results of our operations without regard to periodic, and sometimes material, fluctuations in the market value of such assets or liabilities.
During the year ended December 31, 2016, our equity method balances for South Kent and Grand were below zero. In accordance with ASC 323, Investments - Equity Method and Joint Ventures, we suspended recognition of South Kent's and Grand's equity method earnings or losses and accumulated other comprehensive income (loss), until the fourth quarter of 2016 when South Kent's and Grand's cumulative equity method earnings and other comprehensive income exceeded cumulative distributions received, cumulative equity method losses and, where applicable, cumulative other comprehensive income (loss) during the suspension period. As we have no explicit or implicit commitment to fund losses at the unconsolidated investments, we have recorded gains resulting from distributions received in excess of the carrying amount of our unconsolidated investments. Our definition of Adjusted EBITDA has accordingly been modified for periods where equity method accounting was suspended to include adjustments (gains on distributions and suspended equity losses) from unconsolidated investments.
The most directly comparable U.S. GAAP measure to Adjusted EBITDA is net income (loss). The following table reconciles net income (loss) to Adjusted EBITDA for the periods presented (unaudited and in thousands):
Year ended December 31, | ||||||||||||
2016 | 2015 | 2014 | ||||||||||
Net loss | $ | (52,299 | ) | $ | (55,607 | ) | $ | (39,999 | ) | |||
Plus: | ||||||||||||
Interest expense, net of interest income | 76,598 | 75,309 | 66,729 | |||||||||
Tax provision | 8,679 | 4,943 | 3,136 | |||||||||
Depreciation, amortization and accretion | 184,002 | 145,322 | 104,417 | |||||||||
EBITDA | $ | 216,980 | $ | 169,967 | $ | 134,283 | ||||||
Unrealized loss on energy derivative (1) | 22,767 | 791 | 3,878 | |||||||||
Loss on undesignated derivatives, net | 3,324 | 5,490 | 15,743 | |||||||||
Realized loss on designated derivatives | — | 11,221 | — | |||||||||
Early extinguishment of debt | — | 4,941 | — | |||||||||
Net (gain) loss on transactions | 326 | 3,400 | (13,843 | ) | ||||||||
Adjustments from unconsolidated investments (2) | (659 | ) | — | — | ||||||||
Plus, proportionate share from unconsolidated investments: | ||||||||||||
Interest expense, net of interest income | 32,103 | 23,537 | 14,081 | |||||||||
Tax provision (benefit) | — | — | 102 | |||||||||
Depreciation, amortization and accretion | 27,763 | 22,680 | 13,720 | |||||||||
Loss on undesignated derivatives, net | 1,552 | 8,514 | 30,148 | |||||||||
Adjusted EBITDA | $ | 304,156 | $ | 250,541 | $ | 198,112 | ||||||
(1) | Amount is included in electricity sales on the consolidated statements of operations. |
(2) | Adjustments for the year ended December 31, 2016, consists of $19.9 million gains on distributions from unconsolidated investments and ($19.2) million of suspended equity earnings. See Note 7. Unconsolidated Investments in the Notes to Consolidated Financial Statements in this Form 10-K, for further discussion. |
Adjusted EBITDA for the year ended December 31, 2016 was $304.2 million compared to $250.5 million in the prior year, an increase of $53.6 million, or approximately 21.4%. The increase in Adjusted EBITDA during 2016 as compared to 2015 was primarily attributable to projects which were acquired or commenced commercial operations in 2015.
Adjusted EBITDA for the year ended December 31, 2015 was $250.5 million compared to $198.1 million in the prior year, an increase of $52.4 million, or approximately 26.5%. The increase in Adjusted EBITDA during 2015 as compared to 2014 was primarily attributable to projects which commenced commercial operations or were acquired in 2014 and 2015.
MWh Sold and Average Realized Electricity Price
The number of consolidated MWh, unconsolidated investments proportional MWh and proportional MWh sold, as well as consolidated average realized price per MWh and the proportional average realized price per MWh sold, are the operating metrics that help explain trends in our revenue, earnings from our unconsolidated investments and net income (loss) attributable to us.
61
• | Consolidated MWh sold for any period presented, represents 100% of MWh sold by wholly-owned and partially-owned subsidiaries in which we have a controlling interest and are consolidated in our consolidated financial statements; |
• | Noncontrolling interest MWh represents that portion of partially-owned subsidiaries not attributable to us; |
• | Controlling interest in consolidated MWh is the difference between the consolidated MWh sold and the noncontrolling interest MWh; |
• | Unconsolidated investments proportional MWh is our proportion in MWh sold from our equity method investments; |
• | Proportional MWh sold for any period presented, represents the sum of the controlling interest and our percentage interest in our unconsolidated investments; and |
• | Average realized electricity price for each of consolidated MWh sold, unconsolidated investments proportional MWh sold and proportional MWh sold represents (i) total revenue from electricity sales for each of the respective MWh sold, discussed above, excluding unrealized gains and losses on our energy derivative and the amortization of finite-lived intangible assets and liabilities, divided by (ii) the respective MWh sold. |
The following table presents selected operating performance metrics for the periods presented (unaudited):
Year ended December 31, | |||||||||||||||
MWh sold | 2016 | 2015 | Change | % Change | |||||||||||
Consolidated MWh sold | 6,745,525 | 5,257,976 | 1,487,549 | 28.3 | % | ||||||||||
Less: noncontrolling MWh | (940,358 | ) | (877,847 | ) | (62,511 | ) | 7.1 | % | |||||||
Controlling interest in consolidated MWh | 5,805,167 | 4,380,129 | 1,425,038 | 32.5 | % | ||||||||||
Unconsolidated investments proportional MWh | 1,001,105 | 756,546 | 244,559 | 32.3 | % | ||||||||||
Proportional MWh sold | 6,806,272 | 5,136,675 | 1,669,597 | 32.5 | % | ||||||||||
Average realized electricity price per MWh | |||||||||||||||
Consolidated average realized electricity price per MWh | $ | 55 | $ | 62 | $ | (7 | ) | (11.1 | )% | ||||||
Unconsolidated investments proportional average realized electricity price per MWh | $ | 112 | $ | 118 | $ | (6 | ) | (4.8 | )% | ||||||
Proportional average realized electricity price per MWh | $ | 66 | $ | 73 | $ | (7 | ) | (9.3 | )% | ||||||
Our consolidated MWh sold for the year ended December 31, 2016 was 6,745,525 MWh, as compared to 5,257,976 MWh for the year ended December 31, 2015, an increase of 1,487,549 MWh, or 28.3%. The change in consolidated MWh sold was primarily attributable to:
• | an increase in volume of 153,835 MWh from projects which commenced commercial operations prior to 2015; and |
• | an increase in volume of 460,159 MWh from projects acquired in 2015; and |
• | an increase in volume of 873,556 MWh from projects which completed construction during 2015. |
Our proportional MWh sold for the year ended December 31, 2016 was 6,806,272 MWh, as compared to 5,136,675 MWh for the year ended December 31, 2015, an increase of 1,669,597 MWh, or 32.5%. The change in proportional MWh sold was primarily attributable to:
• | an increase in volume of 1,425,038 MWh from controlling interest in consolidated MWh; and |
• | an increase in volume of 244,559 MWh from unconsolidated investments due to the acquisition of Armow in October 2016 and K2 in June 2015. |
Our consolidated average realized electricity price was $55 per MWh for the year ended December 31, 2016 as compared to $62 per MWh for the year ended December 31, 2015. The decrease of $7 per MWh was primarily due to an increase in volume of lower priced PPAs coupled with lower spot market pricing as a result of increased supply at certain electric hubs.
Proportional average realized electricity price was $66 per MWh for the year ended December 31, 2016 as compared to $73 per MWh for the year ended December 31, 2015. The $7 per MWh decrease in the proportional average realized electricity price was primarily due to an increase in volume of lower priced PPAs coupled with lower spot market pricing as a result of increased supply of energy at
62
certain electric hubs partially offset by an increase in volume of higher priced contracts at our unconsolidated investments primarily due to Armow which was acquired in October 2016 and K2 which was acquired in June 2015.
The following table presents selected operating performance metrics for the periods presented (unaudited):
Year ended December 31, | |||||||||||||||
MWh sold | 2015 | 2014 | Change | % Change | |||||||||||
Consolidated MWh sold | 5,257,976 | 3,241,277 | 2,016,699 | 62.2 | % | ||||||||||
Less: noncontrolling MWh | (877,847 | ) | (586,020 | ) | (291,827 | ) | 49.8 | % | |||||||
Controlling interest in consolidated MWh | 4,380,129 | 2,655,257 | 1,724,872 | 65.0 | % | ||||||||||
Unconsolidated investments proportional MWh | 756,546 | 295,976 | 460,570 | 155.6 | % | ||||||||||
Proportional MWh sold | 5,136,675 | 2,951,233 | 2,185,442 | 74.1 | % | ||||||||||
Average realized electricity price per MWh | |||||||||||||||
Consolidated average realized electricity price per MWh | $ | 62 | $ | 80 | $ | (18 | ) | (22.5 | )% | ||||||
Unconsolidated investments proportional average realized electricity price per MWh | $ | 118 | $ | 134 | $ | (16 | ) | (11.9 | )% | ||||||
Proportional average realized electricity price per MWh | $ | 73 | $ | 90 | $ | (17 | ) | (18.9 | )% | ||||||
Our consolidated MWh sold for the year ended December 31, 2015 was 5,257,976 MWh, as compared to 3,241,277 MWh for the year ended December 31, 2014, an increase of 2,016,699 MWh, or 62.2%. The change in consolidated MWh sold was primarily attributable to:
• | an increase in volume of 1,173,786 MWh from projects which commenced commercial operations during 2014; |
• | an increase in volume of 718,275 MWh from projects acquired in 2015; and |
• | an increase in volume of 271,695 MWh from projects which completed construction during 2015. |
Offsetting the increases in consolidated MWh sold were decreases of 147,506 MWh in volume from projects in operation prior to 2014.
Our proportional MWh sold in the year ended December 31, 2015 was 5,136,675 MWh, as compared to 2,951,233 MWh for the year ended December 31, 2014, representing an increase of 2,185,442 MWh or approximately 74.1%. This change in proportional MWh sold during 2015 as compared to 2014 was primarily attributable to
• | an increase in volume of 1,724,872 MWh from controlling interest in consolidated MWh; and |
• | an increase in volume of 460,570 MWh from unconsolidated investments due to the acquisition of K2 in June 2015 and commencement of operations of South Kent and Grand in 2014. |
Our consolidated average realized electricity price was $62 per MWh for the year ended December 31, 2015 as compared to $80 per MWh for the year ended December 31, 2014. The decrease of $18 per MWh was primarily due to new projects which were acquired or commenced commercial operation in 2014 and 2015 at PPA pricing approximately 50% lower, on average, than projects in operation prior to 2014.
Proportional average realized electricity price was $73 per MWh for the year ended December 31, 2015 as compared to $90 per MWh for the year ended December 31, 2014. The $17 per MWh decrease in the proportional average realized electricity price was primarily due to the impact of foreign exchange on revenue denominated in the Canadian dollar at our Canadian projects and, similar to consolidated average realized electricity prices, new projects which were acquired or commenced commercial operation in 2014 and 2015 at PPA pricing approximately 50% lower, on average, than projects in operation prior to 2014.
63
Results of Operations
The following table provides selected financial information for the periods presented (in thousands, except percentages):
Year ended December 31, | 2016 vs. 2015 | 2015 vs. 2014 | ||||||||||||||||||||||||
2016 | 2015 | 2014 | $ Change | % Change | $ Change | % Change | ||||||||||||||||||||
Total revenue | $ | 354,052 | $ | 329,831 | $ | 265,493 | $ | 24,221 | 7.3 | % | $ | 64,338 | 24.2 | % | ||||||||||||
Total cost of revenue | 303,342 | 257,995 | 182,192 | 45,347 | 17.6 | 75,803 | 41.6 | |||||||||||||||||||
Total operating expenses | 50,473 | 37,396 | 28,320 | 13,077 | 35.0 | 9,076 | 32.0 | |||||||||||||||||||
Total other expense | 43,857 | 85,104 | 91,844 | (41,247 | ) | (48.5 | ) | (6,740 | ) | (7.3 | ) | |||||||||||||||
Net loss before income tax | (43,620 | ) | (50,664 | ) | (36,863 | ) | 7,044 | (13.9 | ) | (13,801 | ) | 37.4 | ||||||||||||||
Tax provision | 8,679 | 4,943 | 3,136 | 3,736 | 75.6 | 1,807 | 57.6 | |||||||||||||||||||
Net loss | (52,299 | ) | (55,607 | ) | (39,999 | ) | 3,308 | (5.9 | ) | (15,608 | ) | 39.0 | ||||||||||||||
Net loss attributable to noncontrolling interest | (35,188 | ) | (23,074 | ) | (8,709 | ) | (12,114 | ) | 52.5 | (14,365 | ) | 164.9 | ||||||||||||||
Net loss attributable to Pattern Energy | $ | (17,111 | ) | $ | (32,533 | ) | $ | (31,290 | ) | $ | 15,422 | (47.4 | )% | $ | (1,243 | ) | 4.0 | % | ||||||||
Year Ended December 31, 2016 Compared to Year Ended December 31, 2015 and
Year Ended December 31, 2015 Compared to Year Ended December 31, 2014
Total Revenue
Total revenue for the year ended December 31, 2016 was $354.1 million compared to $329.8 million for the year ended December 31, 2015, an increase of $24.2 million, or approximately 7.3%. The increase in total revenue for the year ended December 31, 2016 as compared to the prior year was primarily attributable to:
• | $48.9 million in additional electricity sales from projects which were acquired or commenced commercial operations during 2015; and |
• | a $2.2 million increase from related party revenue related to management fees. |
The increases in total revenues were partially offset by:
• | $22.0 million in higher unrealized losses due to higher forward electricity price curves when compared to the prior period; and |
• | a $5.2 million decrease in electricity sales from projects which were in operation prior to 2015. |
Total revenue for the year ended December 31, 2015 was $329.8 million compared to $265.5 million for the year ended December 31, 2014, an increase of $64.3 million, or approximately 24.2%. The change in total revenue for the year ended December 31, 2015 as compared to the prior year was primarily attributable to:
• | $42.3 million in additional electricity sales from projects which commenced commercial operations during 2014; |
• | $33.0 million from projects acquired in 2015; |
• | $6.3 million from projects which completed construction during 2015; and |
• | $3.1 million in lower unrealized losses due to lower forward electricity price curves when compared to the prior year. |
The increases in total revenues were partially offset by:
• | $13.2 million in lower electricity sales from projects in operation prior to 2014; and |
• | $5.6 million decrease in other revenues associated with performance of our turbines in accordance with contracted terms with our turbine manufacturers. |
Cost of revenue
Cost of revenue for the year ended December 31, 2016 was $303.3 million compared to $258.0 million for the year ended December 31, 2015, an increase of $45.3 million, or approximately 17.6%. The increase in cost of revenue during 2016 as compared to 2015 was primarily attributable to:
• | an $11.9 million increase in expenses associated with turbine operations and maintenance for new projects which were acquired or became commercially operable during 2015 as discussed above; and |
64
• | a $31.1 million increase in depreciation for projects which became commercially operable during 2015. |
Cost of revenue for the year ended December 31, 2015 was $258.0 million compared to $182.2 million for the year ended December 31, 2014, an increase of $75.8 million, or approximately 41.6%. The increase in cost of revenue during 2015 as compared to 2014 was primarily attributable to:
• | an $17.3 million increase in expenses associated with turbine operations and maintenance for new projects which were acquired or became commercially operable during 2014 and 2015 as discussed above; |
• | an $8.1 million increase in property taxes, a $3.1 million increase in land lease and royalties associated with new projects, and a $5.0 million increase in other expenses; |
• | a $20.4 million increase in depreciation for projects which became commercially operable during 2014; and |
• | a $25.4 million increase in depreciation for projects which were acquired or became commercially operable during 2015. |
Operating expenses
Operating expenses for the year ended December 31, 2016 were $50.5 million compared to $37.4 million for the year ended December 31, 2015, an increase of $13.1 million, or approximately 35.0%. The increase in operating expenses during 2016 as compared to 2015 was primarily attributable to:
• | a $5.0 million increase in employee related costs primarily to support growth in employee headcount; |
• | a $5.6 million net increase in professional and audit fees, office related lease expenses, travel and entertainment; and |
• | a $2.3 million increase in related party expenses. |
Operating expenses for the year ended December 31, 2015 were $37.4 million compared to $28.3 million for the year ended December 31, 2014, an increase of $9.1 million, or approximately 32.0%. The increase in operating expenses during 2015 as compared to 2014 was primarily attributable to:
• | a $4.3 million increase in payroll and non-cash stock based compensation to support new projects which were acquired or became commercially operable during 2014 and 2015 as discussed above; and |
• | a $3.4 million increase in professional fees associated with being a public company. |
Other expense
Other expense for the year ended December 31, 2016 was $43.9 million compared to $85.1 million for the year ended December 31, 2015, a decrease of $41.2 million, or approximately 48.5%. The change was primarily attributable to:
• | a $14.1 million increase in equity in earnings in unconsolidated investments, net primarily due to increased recognition of gains on distributions from unconsolidated investments as a result of the 2016 suspension of equity method accounting for certain of our unconsolidated investments and increased project income from investments acquired in 2015 and late 2016; |
• | a $11.2 million realized loss on designated derivatives, net for the July 2015 termination of a designated interest rate swap; |
• | a $4.9 million early extinguishment of debt occurring in July and November of 2015; |
• | a $3.5 million increase in other income primarily from foreign currency transactions; |
• | a $3.1 million decrease in net losses on transactions; and |
• | a $2.2 million net increase in earnings from undesignated derivatives primarily due to increases in the interest rate curves compared to the interest rate curves in the prior year offset by decreases in foreign currency price curves compared to foreign currency price curves in the prior year. |
65
Other expense for the year ended December 31, 2015 was $85.1 million compared to $91.8 million for the year ended December 31, 2014, a decrease of $6.7 million, or approximately 7.3%. The change in other expense during 2015 as compared to 2014 was primarily attributable to:
• | a $41.4 million increase in equity in earnings in unconsolidated investments due primarily to gains of $21.6 million in interest rate derivatives compared to losses in the prior year, and a $22.1 million increase in project income; and |
• | a $10.3 million increase in (loss) gain on undesignated derivatives, net primarily due to decreased losses of $10.7 million from interest rate price curves compared to the interest rate price curves in the prior year; $5.1 million gains from foreign currency derivative settlements as foreign currency transaction rates were greater than contract rates, partially offset by reclassification from accumulated other comprehensive income of $5.5 million as a result of the de-designation of an interest rate swap at Spring Valley. |
These increases were partially offset by the following:
• | a $17.2 million decrease in net gain (loss) on transactions primarily due to $17.9 million gain recognized in 2014 for the purchase of El Arrayán project; |
• | an $11.2 million decrease in realized gain (loss) on designated derivatives, net due to the termination of interest rate swap and cap associated with the repayment of debt at Gulf Wind; |
• | a $10.2 million increase in interest expense primarily due to the issuance of convertible debt in July 2015, increased loan balances on the revolving credit facility and increased project-level debt due to acquisitions; and |
• | a $4.9 million loss primarily from loss on early extinguishment of debt at Gulf Wind of $4.1 million. |
Tax provision
The tax provision was $8.7 million for the year ended December 31, 2016 compared to $4.9 million for the year ended December 31, 2015. The expense of $8.7 million is principally related to our Canadian operations offset against tax benefits earned in our Chilean operations.
The tax provision was $4.9 million for the year ended December 31, 2015 compared to $3.1 million for the same period in the prior year. The expense of $4.9 million is principally related to our Canadian operations offset against tax benefits earned in our Chilean operations.
Effective tax rate
The Company's effective tax rate was (19.8)% in 2016 compared to (9.8)% in 2015. The decrease in the 2016 effective tax rate is primarily due to adjustments for income in non-taxable entities allocable to noncontrolling interest and foreign tax rate differential on pre-tax book income, partially offset by an increase in rates due to changes in the valuation allowances and tax credits.
Net loss
Net loss was $52.3 million for the year ended December 31, 2016, compared to $55.6 million for the prior year; a decrease in loss of $3.3 million or 5.9%. The decrease in net loss was primarily attributed to:
• | a $41.2 million decrease in other expense primarily related to an increase in earnings in unconsolidated investments, decreased net losses on transactions, expenses in 2015 for the early extinguishment of debt, and the termination of designated interest rate derivatives; and |
• | a $24.2 million increase in total revenue, as discussed above. |
The decrease in net loss was partially offset by:
• | a $45.3 million increase in cost of revenue associated with project related expenses and increased depreciation expense primarily for projects that were acquired or became commercially operable during 2015; |
• | a $13.1 million increase in operating expenses, as discussed above; and |
• | a $3.7 million increase in the tax provision. |
66
Net loss was $55.6 million for the year ended December 31, 2015, compared to $40.0 million for the prior year; an increase in loss of $15.6 million or 39.0%. The increase in loss was primarily attributed to:
• | a $75.8 million increase in cost of revenue associated with project related expense and increased depreciation expense primarily for projects that were acquired or became commercially operable during 2014 and 2015; |
• | a $9.1 million increase in operating expenses, as discussed above; and |
• | a $1.8 million increase in the tax provision. |
The increase in net loss was partially offset by:
• | a $64.3 million increase in total revenue associated with projects which commenced commercial operations during 2014 and 2015; and |
• | a $6.7 million decrease in other expense primarily associated with an increase in earnings from unconsolidated investments. |
Noncontrolling interest
The net loss attributable to noncontrolling interest was $35.2 million for the year ended December 31, 2016 compared to a $23.1 million net loss attributable to noncontrolling interest for the year ended December 31, 2015. The increased loss of $12.1 million, or approximately 52.5%, was primarily attributable to allocations of losses for tax equity projects which commenced commercial operations or were acquired during 2015 and for an increase in loss allocation for Panhandle 2 in 2016.
The net loss attributable to noncontrolling interest was $23.1 million for the year ended December 31, 2015 compared to an $8.7 million net loss attributable to noncontrolling interest for the year ended December 31, 2014. The increased loss of $14.4 million, or approximately 164.9%, was primarily attributable to allocations of losses for tax equity projects which commenced commercial operations or were acquired during 2014 and 2015.
Liquidity and Capital Resources
Our business requires substantial capital to fund (i) equity investments in our construction projects, (ii) current operational costs, (iii) debt service payments, (iv) dividends to our stockholders, (v) potential investments in new acquisitions, (vi) modifications to our projects, (vii) unforeseen events and (viii) other business expenses. As a part of our liquidity strategy, we plan to retain a portion of our cash flows in above-average wind years in order to have additional liquidity in below-average wind years.
Sources of Liquidity
Our sources of liquidity include cash generated by our operations, cash reserves, borrowings under our corporate and project-level credit agreements and further issuances of equity and debt securities.
The principal indicators of our liquidity are our unrestricted and restricted cash balances and availability under our revolving credit facility and project level facilities. Our available liquidity is as follows (in millions):
December 31, 2016 | |||
Unrestricted cash | $ | 83.9 | |
Restricted cash | 25.4 | ||
Revolving credit facility availability | 288.3 | ||
Project facilities: | |||
Post construction use | 99.2 | ||
Total available liquidity | $ | 496.8 | |
We believe that throughout 2017, we will have sufficient liquid assets, cash flows from operations, and borrowings available under our revolving credit facility to meet our financial commitments debt service obligations, contingencies and anticipated required capital expenditures for at least the next 24 months, not including capital required for additional project acquisitions. However, we are subject to business and operational risks that could adversely affect our cash flow. A material decrease in our cash flows would likely produce a
67
corresponding adverse effect on our borrowing capacity. In connection with our future capital expenditures and other investments, including any project acquisitions that we may make, we may, from time to time, issue debt or equity securities. Our ability to access the debt and equity markets is dependent on, among other factors, the overall state of the debt and equity markets and investor appetite for investment in clean energy projects in general and our Class A shares in particular. Volatility in the market price of our Class A shares may prevent or limit our ability to utilize our equity securities as a source of capital to help fund acquisitions. An inability to obtain debt or equity financing on commercially reasonable terms could significantly limit our timing and ability to consummate future acquisitions, and to effectuate our growth strategy.
Financing Developments
In January 2017, we issued the 2024 Unsecured Senior Notes with an aggregate principal amount of $350.0 million. Net proceeds to us were approximately $345.0 million, after deducting the initial purchasers’ discount, commissions and transaction expenses. We intend to use approximately $215 million of the net proceeds to partially fund our acquisition of the Broadview projects, as described above and used $128 million of proceeds to repay borrowings incurred under the Revolving Credit Facility to finance the purchase of the Armow project, as discussed above. The 2024 Unsecured Senior Notes bear interest at a rate of 5.875% per year, payable semiannually in arrears on February 1 and August 1, beginning on August 1, 2017 and maturing on February 1, 2024, unless repurchased or redeemed at an earlier date. The 2024 Unsecured Senior Notes are guaranteed on a senior unsecured basis by Pattern US Finance Company, one of our subsidiaries.
On August 12, 2016, we completed an underwritten public offering of our Class A common stock. In total, 10,000,000 shares of our Class A common stock were sold. In connection with the equity offering, the underwriters had a 30-day option to purchase up to an additional 1,500,000 shares of Class A common stock to cover over-allotments. On August 22, 2016, the underwriters partially exercised their over-allotment option and purchased an additional 1,300,000 shares of Class A common stock. Aggregate net proceeds of the equity offering, including the proceeds of the over-allotment option, were approximately $258.6 million after deduction of underwriting discounts, commissions, and transaction expenses.
On May 9, 2016, we entered into an Equity Distribution Agreement. Pursuant to the terms of the Equity Distribution Agreement, we may offer and sell shares of our Class A common stock, par value $0.01 per share, from time to time through the Agents, as our sales agents for the offer and sale of the shares, up to an aggregate sales price of $200.0 million. For the year ended December 31, 2016 we sold 1,240,504 shares under the Equity Distribution Agreement and net proceeds under the issuance were $27.5 million.
Subject to market conditions, we will continue to consider various forms of repricings, refinancings, and/or repayments of our project level finance facilities. No assurances, however, can be given that we will be able to consummate any such transactions, the transactions can be consummated on terms that are financially favorable to us, or that such transactions will have the intended financial effects of improving the consolidated statements of operations, net cash provided by operating activities, or cash available for distribution.
Cash Flows
We use traditional measures of cash flow, including net cash provided by operating activities, net cash used in investing activities and net cash provided by financing activities, as well as cash available for distribution discussed earlier, to evaluate our periodic cash flow results. Below is a summary of our cash flows for each period (in millions):
Year ended December 31, | |||||||||||
2016 | 2015 | 2014 | |||||||||
Net cash provided by operating activities | $ | 163.7 | $ | 117.8 | $ | 110.4 | |||||
Net cash used in investing activities | (124.3 | ) | (759.1 | ) | (362.6 | ) | |||||
Net cash provided by (used in) financing activities | (76.7 | ) | 643.7 | 267.3 | |||||||
Effect of exchange rate changes on cash, cash equivalents and restricted cash | 0.3 | (5.5 | ) | (2.0 | ) | ||||||
Net change in cash, cash equivalents and restricted cash | $ | (36.9 | ) | $ | (3.1 | ) | $ | 13.1 | |||
Net cash provided by operating activities
Net cash provided by operating activities was $163.7 million for the year ended December 31, 2016 as compared to $117.8 million in the prior year, an increase of $45.8 million, or approximately 38.9%. The increase in cash provided by operating activities was primarily due to higher revenues of $47.3 million (excluding unrealized loss on energy derivative and amortization of PPAs) from projects which were acquired since May 2015 or which commenced commercial operations since September 2015, increased distributions from unconsolidated investments of $15.0 million, increase in working capital of $4.1 million, a decrease in transaction costs of $3.1 million,
68
and a $2.4 million increase in related party income. These increases were partially offset by increased project expenses of $14.2 million and operating expenses of $13.1 million.
Net cash provided by operating activities was $117.8 million for the year ended December 31, 2015 as compared to $110.4 million in the prior year, an increase of $7.4 million, or approximately 6.7%. The increase in cash provided by operating activities was primarily the result of higher revenue of approximately $63.1 million, excluding unrealized loss on energy derivative and amortization of PPAs. Offsetting these increases in revenue were increases of $36.8 million in project expenses, $9.1 million in operating expenses, and $10.2 million in interest expense.
Net cash used in investing activities
Net cash used in investing activities was $124.3 million for the year ended December 31, 2016, which consisted primarily of $135.8 million for the acquisition of a 50% interest in Armow, net of cash and restricted cash acquired, $32.9 million for capital expenditures primarily related to payments made in 2016 for projects that became commercially operable in 2015 and capital expenditures incurred in 2015 and leasehold improvements and furniture and fixtures, partially offset by $41.7 million in distributions from unconsolidated investments.
Net cash used in investing activities was $759.1 million for the year ended December 31, 2015, which consisted primarily of $422.4 million for acquisitions, net of cash and restricted cash acquired, which primarily includes $222.1 million for both Lost Creek and Post Rock, $65.2 million for Amazon Wind Farm Fowler Ridge and $128.4 million for an unconsolidated investment in K2, in addition to $380.5 million for capital expenditures primarily related to the construction at Logan’s Gap and Amazon Wind Farm Fowler Ridge. These increases were partially offset by $38.2 million of distributions from unconsolidated investments.
Net cash used in investing activities was $362.6 million for the year ended December 31, 2014, which consisted primarily of $119.5 million for capital expenditures, $283.8 million for acquisitions, net of cash and restricted cash acquired, including $109.1 million for Panhandle 1, $123.6 million for Panhandle 2, $34.2 million for the additional 38.5% interest in El Arrayán and $15.1 million for Logan’s Gap. This is partially offset by $22.0 million of distributions from unconsolidated investments and a $17.5 million increase in other assets driven by cash received from a refund of security deposit related to an energy hedge arrangement upon commercial operations of Panhandle 2.
Net cash provided by (used in) financing activities
Net cash used in financing activities for the year ended December 31, 2016 was $76.7 million. Net cash used in financing activities consisted primarily of the following:
• | $350.0 million in repayments of the Revolving Credit Facility; |
• | $120.2 million of dividend payments; |
• | $47.6 million in repayment of long-term debt; and |
• | $17.9 million in distributions to noncontrolling interests. |
Net cash used in financing activities were partially offset by:
• | $286.3 million of net proceeds from equity issuances, net of expenses; and |
• | $175.0 million in draws on the Revolving Credit Facility. |
Net cash provided by financing activities for the year ended December 31, 2015 was $643.7 million. Net cash provided by financing activities consisted primarily of the following:
• | $317.4 million of net proceeds from our February 2015 equity offering, net of expense; |
• | $405.0 million in draws on the Revolving Credit Facility; |
• | $329.1 million of proceeds from construction debt related to our construction projects; |
• | $165.0 million of proceeds from issuance of long term debt; |
• | $218.9 million from the July 2015 issuance of convertible debt, net of issuance costs; and |
• | $336.0 million in capital contributions from noncontrolling interests. |
69
Net cash provided by financing activities were partially offset by:
• | $785.9 million in repayments of debt; |
• | $121.2 million of payments for the purchase of the noncontrolling interest at Gulf Wind and Lost Creek; |
• | $100.0 million in repayments of the Revolving Credit Facility; |
• | $90.6 million of dividend payments; |
• | $13.7 million in payments for deferred financing costs; and |
• | $11.1 million in payments for interest rate derivatives. |
Net cash provided by financing activities for the year ended December 31, 2014 was $267.3 million, which consisted of $286.8 million of proceeds from our May 2014 equity offering, net of transaction costs, $200.8 million in capital contributions from noncontrolling investees of Panhandle 1 and Panhandle 2, $50.0 million drawn on a credit facility, partially offset by a $259.4 million repayment of long-term debt, of which $195.4 million relates to the repayment of the Panhandle 2 construction loan, and $52.3 million of dividend payments.
Uses of Liquidity
Cash Dividends to Investors
We intend to pay regular quarterly dividends in U.S. dollars to holders of our Class A common stock. On February 24, 2017, we increased our dividend to $0.41375 per Class A share, or $1.655 per Class A share on an annualized basis, commencing with respect to dividends to be paid on April 28, 2017 to holders of record on March 31, 2017. Cash paid for dividends for the year ended December 31, 2016 was $120.2 million.
We established our initial quarterly dividend level based on a targeted cash available for distribution payout ratio of 80%, after considering the annual cash available for distribution that we expect our projects will be able to generate following the commencement of commercial operations at all of our construction projects and with due regard to retaining a portion of the cash available for distribution to grow our business. We intend to grow our business primarily through the acquisition of operational and construction-ready power projects, which, we believe, will facilitate the growth of our cash available for distribution and enable us to increase our dividend per share of Class A common stock over time. We may in the future raise capital and make investments in new power projects upon or near the commencement of construction of such projects and therefore prior to the expected commencement of operations of the new projects, which could result in a passage of time of twelve or more months before we begin to receive any cash flow contributions from such projects to our cash available for distribution. In connection with these investments, we may increase our dividends prior to the receipt of such cash flow contributions, which would likely cause our payout ratio to temporarily exceed our targeted run-rate payout ratio. However, the determination of the amount of cash dividends to be paid to holders of our Class A common stock will be made by our Board of Directors and will depend upon our financial condition, results of operations, cash flow, long-term prospects and any other matters that our Board of Directors deem relevant.
We expect to pay a quarterly dividend on or about the 30th day following each fiscal quarter to holders of record of our Class A common stock on the last day of such quarter.
Capital Expenditures and Investments
In 2016, total cash used for capital expenditures was $32.9 million. We do not include capital expenditures at our projects held at our unconsolidated equity investments. Cash paid for acquisitions was $135.8 million.
We expect to make investments in additional projects. We have committed to acquire from Pattern Development 1.0 the Broadview Acquisition for a purchase price of approximately of $269.0 million, which is currently estimated to occur in April 2017. We intend to fund the Broadview Acquisition partially with proceeds from the issuance of the 2024 Unsecured Senior Notes and by the assumption of project-level borrowings of approximately $54 million.
We also evaluate, from time to time, third-party acquisition opportunities. We believe that we will have sufficient cash and Revolving Credit Facility capacity to complete the funding of future construction commitments we may have, but this may be affected by any other acquisitions or investments that we make. To the extent that we make any such investments or acquisitions, we will evaluate capital markets and other corporate financing sources available to us at the time.
70
In addition, we will make investments from time to time at our operating projects. Operational capital expenditures are those capital expenditures required to maintain our long-term operating capacity. Capital expenditures for the projects are generally made at the project level using project cash flows and project reserves, although funding for major capital expenditures may be provided by additional project debt or equity. Therefore, the distributions that we receive from the projects may be made net of certain capital expenditures needed at the projects.
For the year ending December 31, 2017, we have budgeted $4.4 million for operational capital expenditures and $5.5 million for expansion capital expenditures.
Contractual Obligations
We have a variety of contractual obligations and other commercial commitments that represent prospective cash requirements in addition to our capital expenditure programs. See also Note 8, Debt, and Note 17, Commitments and Contingencies, in the notes to consolidated financial statements for additional discussion of contractual obligations.
The following table summarizes estimates of future commitments related to the various agreements that we have entered into (in thousands):
Contractual Obligations | Less Than 1 Year | 1-3 Years | 3-5 Years | More Than 5 Years | Total | |||||||||||||||
Revolving credit facility(3) | $ | 180,000 | $ | — | $ | — | $ | — | $ | 180,000 | ||||||||||
Corporate-level debt principal payments(1) | — | — | 225,000 | 350,000 | 575,000 | |||||||||||||||
Corporate-level interest payments on debt instruments(1) | 20,322 | 60,507 | 51,493 | 55,551 | 187,873 | |||||||||||||||
Project-level debt principal payments | 51,761 | 127,158 | 263,221 | 758,322 | 1,200,462 | |||||||||||||||
Project-level interest payments on debt instruments | 54,713 | 103,700 | 87,916 | 212,665 | 458,994 | |||||||||||||||
Acquisition, purchase, and other commitments(2) | 269,276 | 964 | 798 | 4,055 | 275,093 | |||||||||||||||
Operating leases | 13,714 | 28,610 | 29,970 | 256,334 | 328,628 | |||||||||||||||
Service and maintenance agreements | 53,534 | 75,114 | 63,357 | 118,198 | 310,203 | |||||||||||||||
Asset retirement obligations | — | — | — | 44,783 | 44,783 | |||||||||||||||
Total | $ | 643,320 | $ | 396,053 | $ | 721,755 | $ | 1,799,908 | $ | 3,561,036 | ||||||||||
(1) | Includes the principal and interest payments for the $350 million of 2024 Unsecured Senior Notes issued in January 2017. |
(2) | Includes the Broadview Acquisition commitment expected to be consummated in April 2017. |
(3) | As of February 24, 2017, no amounts were drawn on the revolving credit facility, not including letters of credit. |
Credit Agreements for Equity Method Investments
Below is a summary of our proportion of debt in unconsolidated investments, as of December 31, 2016 (in thousands):
Total Project Debt | Percentage of Ownership | Our Portion of Unconsolidated Project Debt | |||||||||
South Kent | $ | 477,371 | 50.0 | % | $ | 238,686 | |||||
Grand | 274,732 | 45.0 | % | 123,629 | |||||||
K2 | 584,273 | 33.3 | % | 194,738 | |||||||
Armow | 384,993 | 50.0 | % | 192,497 | |||||||
Unconsolidated investments - debt | $ | 1,721,369 | $ | 749,550 | |||||||
Off-Balance Sheet Arrangements
As of December 31, 2016, we did not have any significant off-balance sheet arrangements, as defined in Item 303(a)(4)(ii) of Regulation S-K.
71
Covenants, Distribution Conditions and Events of Default
Corporate-Level Debt
Revolving Credit Facility
Our Revolving Credit Facility has customary covenants, prepayment provisions and events of default. The most restrictive of such provisions is the maintenance coverage ratio that requires the subsidiary borrowers to maintain a leverage ratio (the ratio of borrower debt to borrower cash flow) that does not exceed 5.50:1.00 and an interest coverage ratio (the ratio of borrower cash flow to borrower interest expense) that is not less than 1.75:1.00.
In addition, certain of our subsidiaries are subject to usual and customary affirmative and negative covenants under our Revolving Credit Facility. Specifically, with limited exceptions, such subsidiaries are prohibited from distributing funds to us unless the following conditions are met: (i) no event of default under the corporate credit facility has occurred and is continuing or would be caused by such distribution and (ii) the corporate credit facility borrowers are in compliance with the leverage ratio test and the interest coverage ratio test, both before and after giving effect to such distribution.
Convertible Notes
The indenture for the convertible notes contains customary terms and covenants, including that upon certain events of default occurring and continuing, either the trustee or the holders of not less than 25% in aggregate principal amount of the convertible notes then outstanding may declare the unpaid principal of the convertible notes and accrued and unpaid interest, if any, thereon immediately due and payable. In the case of certain events of bankruptcy, insolvency or reorganization relating to us, the principal amount of the convertible notes together with accrued and unpaid interest, if any, thereon will automatically become and be immediately due and payable.
2024 Unsecured Senior Notes
Under the 2024 Unsecured Senior Notes issued in January 2017, we have agreed to certain restrictions on our or the subsidiary guarantor's ability to incur secured debt and our ability to consolidate, merge or sell all or substantially all of our assets. These covenants are subject to a number of important limitations and exceptions.
Consolidated Project-Level Debt and Unconsolidated Investments Project-Level Debt
Under the respective credit agreements for each of Hatchet Ridge, St. Joseph, Spring Valley, Santa Isabel, Ocotillo, El Arrayán, and Lost Creek, our projects are subject to certain covenants, events of default and distribution conditions. In addition, the respective credit agreements for each of our unconsolidated investments South Kent, Grand, K2 and Armow contain certain covenants, events of default and distribution conditions. While terms may vary between the individual credit agreements, the most significant and restrictive include the following:
• | restrict the project’s ability to incur debt, grant liens, sell or lease assets, transfer equity interests, dissolve, pay distributions and change its business. |
In general, the distribution conditions included in the credit agreements are as follows:
• | to the extent the project has letter of credit facilities under the project debt, there are no letter of credit loans outstanding; |
• | to the extent the project has reserve requirements, accounts are fully funded; |
• | any mandatory prepayment required as a result of the occurrence of an upwind array event has been made; |
• | no default has occurred and such distribution will not result in an event of default; and |
• | the annual debt service coverage ratio is equal to or greater than 1.20:1.00. |
Distributions from Unconsolidated Investments
In general, distributions result from excess cash flows from our unconsolidated investments, which represent revenues received from the sale of electricity, as reduced by operating expenses, interest and principal payments on project level debt provided that specified
72
distribution requirements are met under the project loan agreement. Project financing arrangements typically limit the timing of such distributions from the project entity to the same frequency as the scheduled principal and interest payments made by such project entity, which is usually on a quarterly basis although some financing arrangements instead call for monthly or semiannual payments. Distributions from our unconsolidated investments may be affected by the underlying performance of the windfarm for each project entity, significant underperformance of the windfarm could result in distributions not being made for some period of time. Overall, however, we expect that we will receive distributions throughout the term of the PSA.
Tax Equity Partnership
Generally, tax equity partnerships have specific commercial terms that dictate distributions of cash and allocation of tax items among the partners, who are divided into one of two categories: tax equity and cash investor. A disproportionate share of income and cash is given to tax equity in order for them to achieve a target after-tax yield or “flip” near year 10 of project operations. The target yield and flip term vary by agreement and are dependent on project performance. Prior to the flip, tax items (income, PTCs) are commonly allocated 99% to the tax equity. On the other hand, distributable cash is divided among the partners in percentages that do not match the tax items. Cash distribution percentages can be temporarily increased for tax equity in the event that certain cumulative distribution thresholds are not achieved. We expect this to occur for certain projects in 2017. Once tax equity reaches their target yield, the allocations and distributions “flip” to different amounts. After the flip, income and cash are typically allocated 5% to the tax equity and 95% to the cash investor. REC sales are often specially addressed in each agreement with most of the cash and income directed to the cash investor both pre and post-flip.
Tax equity partnership imposes a range of affirmative and negative covenants that are similar to what a term lender would require, such as, financial reporting, insurance maintenance and prudent operator standards. Most of these restrictions end once the flip point occurs and any deficit restoration obligation of the tax equity has been eliminated. There are also covenants that specifically seek to preserve the tax attributes of the project that are not customary for project term lenders.
If tax equity suffers any losses or damages as the result of a breach of representation, covenant, or other obligation by the cash investor in its capacity as managing member, tax equity may provide notice to the cash investor and require that any distributions otherwise required to be paid to the cash investor shall, instead, be paid to tax equity to cover any damages.
Critical Accounting Policies and Estimates
Our discussion and analysis of our financial condition and results of operations are based on our consolidated historical financial statements that are included elsewhere in this Form 10-K, which have been prepared in accordance with U.S. GAAP. In applying the critical accounting policies set forth below, our management uses its judgment to determine the appropriate assumptions to be used in making certain estimates. These estimates are based on management’s experience, the terms of existing contracts, management’s observance of trends in the wind power industry, information provided by our power purchasers and information available to management from other outside sources, as appropriate. These estimates are subject to an inherent degree of uncertainty.
We use estimates, assumptions and judgments for certain items, including the calculation of our acquisitions, noncontrolling interest balances, and derivatives. These estimates, assumptions and judgments are derived and continually evaluated based on available information, experience and various assumptions we believe to be reasonable under the circumstances. To the extent these estimates are materially incorrect and need to be revised, our operating results may be materially adversely affected.
Acquisitions
Business Combinations, Asset Acquisitions, and Equity Method Investments
When we acquire a controlling interest in an entity deemed to be a business, the purchase is accounted for using the acquisition method, and the fair value of the purchase consideration is allocated to the tangible and intangible assets acquired and the liabilities assumed based on their estimated fair values. Contingent consideration is also recognized and measured at fair value as of the acquisition date. The excess, if any, of the fair value of the purchase consideration over the fair values of the identifiable net assets is recorded as goodwill. Conversely, the excess, if any, of the net fair value of the identifiable net assets over the fair value of the purchase consideration is recorded as a gain. Transaction costs associated with business combinations are expensed as incurred.
When we acquire assets and liabilities that do not constitute a business, the fair value of the purchase consideration, including transaction costs of the asset acquisition, is assumed to be equal to the fair value of the net assets acquired. The purchase consideration, including the transaction costs, is allocated to the individual assets and liabilities assumed based on their relative fair values. Contingent consideration associated with the acquisition is generally recognized when the contingency is resolved and the consideration is paid or becomes payable.
73
An asset acquisition does not result in the recognition of goodwill, and transaction costs are capitalized as part of the cost of the asset or group of assets acquired.
When we acquire a noncontrolling interest in an entity where it is not the primary beneficiary, does not control any of the ongoing activities of the entity, and does not meet consolidation requirements of Accounting Standards Codification (ASC) 810, Consolidation, and Accounting Standards Update (ASU) 2015-02, Consolidation (Topic 810): Amendments to the Consolidation Analysis, the investment is initially recognized as an equity method investment at cost. Any difference between the cost of an investment and the amount of underlying equity in net assets of an investee are considered basis differences. Basis difference related to the property, plant and equipment will be amortized over the estimated economic useful life of the underlying long-lived assets, while basis difference related to the PPA will be amortized over the remaining term of the PPA. Transaction costs associated with equity method investments are included in the investment.
Additionally, if the projects in which we hold these investments recognize an impairment under the provisions of ASC 360, Property, Plant and Equipment, we would record our impairment loss and would evaluate our investment for an other than temporary decline in value under ASC 323, Investments—Equity Method and Joint Ventures.
Significant judgment is required in determining the acquisition date fair value of the assets acquired and liabilities assumed using either an income, market, or cost based valuation method. The valuations require management to make significant estimates and assumptions. These estimates and assumptions are inherently uncertain, and as a result, actual results may differ from estimates. Significant estimates include, but are not limited to, revenue and operating expense growth, future expected cash flows, and discount rates.
For business combinations and asset acquisitions, during the measurement period, which is one year from the acquisition date, we may record adjustments to the assets acquired and liabilities assumed. Upon the conclusion of the measurement period, any subsequent adjustments are recorded to earnings.
The allocation of the purchase price directly affects the following items in our consolidated financial statements:
• | The amount of purchase price allocated to the various tangible and intangible assets, liabilities and noncontrolling interests on our consolidated balance sheets; |
• | The amounts of purchase price allocated to the value of above-market and below-market power purchase agreement, which is subsequently amortized to electricity sales over the remaining terms of each respective arrangement; and |
• | The period of time over which tangible and intangible assets are depreciated or amortized varies, and thus, changes in the amounts allocated to these assets will have a direct impact on our results of operations. |
Noncontrolling Interests
Noncontrolling interests represent the portion of our net income (loss), net assets and comprehensive income (loss) that is not allocable to us and is calculated based on our ownership percentage, for certain projects.
For those projects where economic benefits are not allocated based on pro rata ownership percentage, we have determined that the appropriate methodology for calculating the noncontrolling interest balances that reflects the substantive economic arrangements in the operating agreements is a balance sheet approach using the hypothetical liquidation at book value (HLBV) method.
Under the HLBV method, the amounts reported as noncontrolling interests in the consolidated balance sheets represent the amounts third-party investors would hypothetically receive at each balance sheet reporting date under the liquidation provisions of the operating partnership agreements, assuming the net assets of our projects were liquidated at amounts determined in accordance with U.S. GAAP and distributed to the investors. Therefore, the noncontrolling interest balances in these projects are reported as a component of equity in the consolidated balance sheets.
The third-party interests in the results of operations for those projects using HLBV is determined as the difference in noncontrolling interests in the consolidated balance sheets at the start and end of each reporting period, after taking into account any capital transactions between our projects and the third-party investors.
Factors used in the HLBV calculation include U.S. GAAP income, taxable income, capital contributions, production tax credits, and distributions, and the stipulated targeted equity investor return specified in the projects' operating agreements.
74
Changes in these factors could have a significant impact on the amounts that investors would receive upon a hypothetical liquidation. The use of the HLBV methodology to allocate income to the noncontrolling interest holders may create volatility in our consolidated statements of operations as the application of HLBV can drive changes in net income or loss attributable to noncontrolling interests from quarter to quarter.
Derivatives
We enter into derivative transactions primarily for the purpose of reducing exposure to fluctuations in interest rates, foreign currency exchange rates and electricity prices. We have entered into interest rate swap agreements and have designated certain of these derivatives as cash flow hedges of expected interest payments on variable rate debt. We also enter into foreign exchange currency transactions to hedge the distributions in Canadian dollars from our operational Canadian project entities. These foreign exchange currency derivatives currently do not qualify for hedge accounting. We may also enter into interest rate caps and energy derivative agreements. Currently, we do not hold interest rate cap arrangements. Furthermore, the energy derivative agreements do not qualify for hedge accounting.
We recognize our derivative instruments at fair value in the consolidated balance sheets, unless the derivative instruments qualify for the normal purchase normal sale (NPNS) scope exception to derivative accounting. Accounting for changes in the fair value of a derivative instrument depends on whether the derivative instrument has been designated as part of a hedging relationship and on the type of hedging relationship.
For derivative instruments that are designated as cash flow hedges, the effective portion of change in fair value of the derivative is reported as a component of other comprehensive income (loss). Changes in the fair value of these derivatives are subsequently reclassified into earnings in the period that the hedged transaction affects earnings. The ineffective portion of change, if any, in fair value is recorded as a component of net income (loss) on the consolidated statements of operations. The change in fair value for undesignated derivative instruments is reported as a component of net income (loss) on the consolidated statements of operations. Certain of our energy derivative agreements qualify for the NPNS scope exception and therefore are not accounted for as derivatives.
Energy prices are subject to wide swings as supply and demand are impacted by, among many other unpredictable items, weather, market liquidity, generating facility availability, customer usage, storage, and transmission and transportation constraints. Interest rate risk exists primarily on variable-rate debt for which the cash flows vary based upon fluctuations in interest rates. Also, foreign currency exchange rates are subject to fluctuations in market movements and can be impacted by, among other factors, economic conditions, inflation rate, political stability and public debt. We do not hedge all of our commodity price, foreign currency exchange rate and interest rate risks, thereby exposing the unhedged portion to changes in market prices.
Market price quotations for certain electricity and natural gas trading hubs related to energy derivative agreements are not as readily obtainable due to the lengths of the contracts. Given that limited market data exists for these contracts, as well as for those contracts that are not actively traded, we use forward price curves derived from third-party models based on perceived pricing relationships to major trading hubs that are based on unobservable inputs. The estimated fair value of energy derivative agreements is a function of underlying forward energy prices, related volatility, counterparty creditworthiness, and duration of the contracts. The assumptions used in the valuation models are critical and any changes in assumptions could have a significant impact on the estimated fair value of the contract.
Item 7A. | Quantitative and Qualitative Disclosures about Market Risk. |
We have significant exposure to commodity prices, interest rates and foreign currency exchange rates, as described below. To mitigate these market risks, we have entered into multiple derivatives. We have not applied hedge accounting treatment to all of our derivatives, therefore we are required to mark some of our derivatives to market through earnings on a periodic basis, which will result in non-cash adjustments to our earnings and may result in volatility in our earnings, in addition to potential cash settlements for any losses.
Commodity Price Risk
We manage our commodity price risk for electricity sales primarily through the use of fixed price long-term power purchase agreements with creditworthy counterparties. Our financial results reflect approximately 812,957 MWh and 616,752 MWh of electricity sales in the years ended December 31, 2016 and 2015, respectively, that were subject to spot-market pricing. A hypothetical increase or decrease of $1.49 per MWh and $2.30 per MWh (or an approximately 10% change) in these spot market prices would have increased or decreased revenue by $1.2 million and $1.4 million, for the years ended December 31, 2016 and 2015, respectively.
75
Interest Rate Risk
As of December 31, 2016, our long-term debt, including the convertible senior notes, is both fixed and variable rate debt. As long term debt is not carried at fair value on the consolidated balance sheets, changes in fair value would impact earnings and cash flows only if we were to reacquire all or a portion of these instruments prior to their maturity. The fair market value of our outstanding convertible senior notes, or "debentures," is subject to interest rate risk, market price risk and other factors due to the convertible feature of the debentures. The fair market value of the debentures will generally increase as interest rates fall and decrease as interest rates rise. In addition, the fair market value of the debentures will generally increase as the market price of our Class A common stock increases and decrease as the market price of our Class A common stock falls. The interest and market value changes affect the fair market value of the debentures, but do not impact our financial position, cash flows or results of operations due to the fixed nature of the debt obligations, except to the extent changes in the fair value of the debentures, or value of Class A common stock, permit the holders of the debentures to convert into shares. As of December 31, 2016, the estimated fair value of our debt was $1.4 billion and the carrying value of our debt was $1.4 billion. The fair value of variable interest rate long-term debt is approximated by its carrying cost. A hypothetical increase or decrease in market interest rates by 1% would have resulted in a $33.6 million decrease or $36.8 million increase in the fair value of our fixed rate debt.
We are exposed to fluctuations in interest rate risk as a result of our variable rate debt and outstanding amounts due under our revolving credit facility. A hypothetical increase or decrease in interest rates by 1% would have increased or decreased interest expense related to our Revolving Credit Facility by $2.6 million for the year ended December 31, 2016.
We may use a variety of derivative instruments, with respect to our variable rate debt, to manage our exposure to fluctuations in interest rates, including interest rate swaps and interest rate caps. As a result, our interest rate risk is limited to the unhedged portion of the variable rate debt. As of December 31, 2016, the unhedged portion of our variable rate debt was $48.8 million. A hypothetical increase or decrease in interest rates by 1% would not have a material impact to interest expense.
Foreign Currency Exchange Rate Risk
Our wind power projects are located in the United States, Canada and Chile. As a result, our financial results could be significantly affected by factors such as changes in foreign currency exchange rates or weak economic conditions in the foreign markets in which we operate. When the U.S. dollar strengthens against foreign currencies, the relative value in revenue earned in the respective foreign currency decreases. When the U.S. dollar weakens against foreign currencies, the relative value in revenue earned in the respective foreign currency increases. A majority of our power sale agreements and operating expenditures are transacted in U.S. dollars, with a growing portion transacted in currencies other than the U.S. dollar, primarily the Canadian dollar. For the year ended December 31, 2016, our financial results included C$41.8 million, or $31.0 million calculated based on the monthly average exchange rate, in Canadian dollar denominated net income, from our Canadian operations. A hypothetical increase or decrease of 10% in exchange rates between the Canadian and U.S. dollar would have increased or decreased net earnings of our Canadian operations by $3.1 million and $1.7 million for the years ended December 31, 2016 and 2015, respectively.
In January 2015, we established a currency risk management program. The objective of the program is to mitigate the foreign exchange rate risk arising from transactions or cash flows that have a direct or underlying exposure in non-U.S. dollar denominated currencies in order to reduce volatility in our cash flow, which may have an adverse impact to our short-term liquidity or financial condition. For the year ended December 31, 2016, we recognized an unrealized loss on foreign currency forward contracts of $3.0 million in loss on undesignated derivatives, net in the consolidated statements of operations. We also recognized a realized gain of $1.5 million in loss on undesignated derivatives, net in the consolidated statements of operations related to foreign currency forward contracts that matured during the year ended December 31, 2016.
As of December 31, 2016, a 10% devaluation in the Canadian dollar to the United States dollar would result in our consolidated balance sheets being negatively impacted by a $25.0 million cumulative translation adjustment in accumulated other comprehensive loss.
Item 8. | Financial Statements and Supplementary Data. |
The financial statements and schedules are listed in Part IV, Item 15 of this Form 10-K, beginning at page F-1, Index to Consolidated Financial Statements, and are incorporated by reference herein.
76
Item 9. | Changes in and Disagreements with Accountants on Accounting and Financial Disclosure. |
Item 9A. | Controls and Procedures. |
Evaluation of Disclosure Controls and Procedures
Our management, with the participation of our chief executive officer and chief financial officer, has evaluated the effectiveness of our disclosure controls and procedures pursuant to Rules 13a-15(e) and 15d-15(e) under the Securities Exchange Act of 1934, as amended, or the "Exchange Act," as of the end of the period covered by this Form 10-K.
Based on this evaluation, our chief executive officer and chief financial officer concluded that, as of December 31, 2016, our disclosure controls and procedures to provide reasonable assurance that information we are required to disclose in reports that we file or submit under the Exchange Act is recorded, processed, summarized, and reported within the time periods specified in the SEC’s rules and forms, and that such information is accumulated and communicated to our management, including our chief executive officer and chief financial officer, as appropriate, to allow timely decisions regarding required disclosure were not effective at the reasonable assurance level as a result of the material weaknesses discussed below.
However, after giving full consideration to these material weaknesses, and the additional analyses and other procedures that we performed to ensure that our consolidated financial statements included in this Annual Report on Form 10-K were prepared in accordance with U.S. GAAP, our management has concluded that our consolidated financial statements present fairly, in all material respects, our financial position, results of operations and cash flows for the periods disclosed in conformity with U.S. GAAP.
Management’s Annual Report on Internal Control over Financial Reporting
Our management is responsible for establishing and maintaining adequate internal control over financial reporting, as defined in Rule 13a-15(f) under the Exchange Act. Management conducted an assessment of the effectiveness of our internal control over financial reporting based on the criteria set forth in Internal Control – Integrated Framework issued by the Committee of Sponsoring Organizations of the Treadway Commission (2013 framework).
A “material weakness” is a deficiency, or combination of deficiencies, in internal control over financial reporting, such that there is a reasonable possibility that a material misstatement of our annual or interim financial statements will not be prevented or detected on a timely basis.
Based on our assessment as of December 31, 2016, our management believes that our internal control over financial reporting was not effective due to the aggregation of internal control deficiencies related to the implementation, design, maintenance and operating effectiveness of various transaction, process level, and monitoring controls. These deficiencies largely have arisen during fiscal 2016 because of growth of the Company, increases in employee headcount to support growth, and frequent changes in organizational structure that were not adequately supported by elements of our internal control over financial reporting. The deficiencies can be grouped generally as follows:
• | Our training program was not effective at ensuring internal control responsibilities were properly communicated to and performed by new and existing personnel. Specifically, training was not timely communicated regarding the required documentation to demonstrate and ensure that controls consistently operated at a sufficient level of precision to prevent and detect potential errors. This led to inconsistent performance of controls throughout the control environment. |
• | Our accounting policies and procedures were not effective in providing reasonable assurance that accounting transactions are consistently recorded as necessary to permit the preparation of financial statements in accordance with generally accepted accounting principles. This led to varied understanding of the risk of material misstatement to the financial statements and the related inconsistent performance of controls throughout the environment. |
• | Our monitoring controls and management review controls were not effective at ensuring the timely detection and prevention of all potential material errors within our consolidated financial statements. In addition, we need to improve our review of the completeness and accuracy of information used to execute these controls, including key spreadsheets. This led to varying levels of review by management in the performance of monitoring and key spreadsheet related controls. |
77
• | Our controls for the review of contracts were not effective to ensure the completeness of contracts reviewed or to ensure the appropriate identification and timely accounting for provisions within our contracts. This led to inconsistent performance of contract review controls. |
• | Additionally, based on our assessment, our management believes that our procure-to-pay procedures were not effective as of December 31, 2016 because an aggregation of internal control deficiencies resulted in a material weakness relating to the design, operation, enforcement and effective communication of changes to our delegation of authority policy. |
Remediation Plan and Efforts with Respect to Material Weaknesses
Our management has developed a plan to remediate the material weaknesses in our internal control over financial reporting as follows:
• | Enhance accounting and internal control training programs; |
• | Improve documentation of accounting and entity level policies and procedures to support our internal control infrastructure; |
• | Re-design certain existing processes and controls to improve their operation and implement additional processes and controls; |
• | Expand our key spreadsheet controls; and |
• | Improve our contract review process. |
Remediation Efforts with Respect to Material Weaknesses
During the fourth quarter of 2016, management initiated remediation efforts which include the following:
• | Management began to outline a formal training program and conducted initial training sessions for control owners and accounting staff. Training is expected to be ongoing throughout 2017. |
• | Management completed steps to improve documentation of its formal accounting policies. Entity level policies and procedures documentation is ongoing through 2017. |
Our management expects the remediation plan to extend over multiple financial reporting periods throughout 2017.
During the course of re-design of existing processes and controls, implementation of additional processes and controls and testing of the operating effectiveness of such re-designed controls and additional processes and controls, we may identify additional control deficiencies that could give rise to other material weaknesses, in addition to the material weaknesses described above. As we continue to evaluate and work to improve our internal control over financial reporting, we may determine to take additional measures to address material weaknesses or determine to modify certain of the remediation measures.
Change in Internal Control Over Financial Reporting
Except for the matters discussed in this Item 9A, there was no change in our internal control over financial reporting identified in connection with the evaluation required by Rule 13a-15(d) of the Exchange Act that occurred during the period covered by this report that has materially affected, or is reasonably likely to materially affect, our internal control over financial reporting.
78
Report of Independent Registered Public Accounting Firm
The Board of Directors and Stockholders
Pattern Energy Group Inc.
We have audited Pattern Energy Group Inc.’s internal control over financial reporting as of December 31, 2016, based on criteria established in Internal Control-Integrated Framework issued by the Committee of Sponsoring Organizations of the Treadway Commission (2013 framework), (the COSO criteria). Pattern Energy Group Inc.’s management is responsible for maintaining effective internal control over financial reporting, and for its assessment of the effectiveness of internal control over financial reporting included in the accompanying Management’s Annual Report on Internal Control over Financial Reporting. Our responsibility is to express an opinion on the company’s internal control over financial reporting based on our audit.
We conducted our audit in accordance with the standards of the Public Company Accounting Oversight Board (United States). Those standards require that we plan and perform the audit to obtain reasonable assurance about whether effective internal control over financial reporting was maintained in all material respects. Our audit included obtaining an understanding of internal control over financial reporting, assessing the risk that a material weakness exists, testing and evaluating the design and operating effectiveness of internal control based on the assessed risk, and performing such other procedures as we considered necessary in the circumstances. We believe that our audit provides a reasonable basis for our opinion.
A company’s internal control over financial reporting is a process designed to provide reasonable assurance regarding the reliability of financial reporting and the preparation of financial statements for external purposes in accordance with generally accepted accounting principles. A company’s internal control over financial reporting includes those policies and procedures that (1) pertain to the maintenance of records that, in reasonable detail, accurately and fairly reflect the transactions and dispositions of the assets of the company; (2) provide reasonable assurance that transactions are recorded as necessary to permit preparation of financial statements in accordance with generally accepted accounting principles, and that receipts and expenditures of the company are being made only in accordance with authorizations of management and directors of the company; and (3) provide reasonable assurance regarding prevention or timely detection of unauthorized acquisition, use, or disposition of the company’s assets that could have a material effect on the financial statements.
Because of its inherent limitations, internal control over financial reporting may not prevent or detect misstatements. Also, projections of any evaluation of effectiveness to future periods are subject to the risk that controls may become inadequate because of changes in conditions, or that the degree of compliance with the policies or procedures may deteriorate.
A material weakness is a deficiency, or combination of deficiencies, in internal control over financial reporting, such that there is a reasonable possibility that a material misstatement of the company’s annual or interim financial statements will not be prevented or detected on a timely basis. The following material weaknesses have been identified in the following categories and included in management’s assessment:
• | Ineffective training program to ensure internal control responsibilities were properly communicated to and performed by new and existing personnel. |
• | Ineffective accounting policies and procedures to provide reasonable assurance that accounting transactions are consistently recorded as necessary to permit the preparation of financial statements in accordance with generally accepted accounting principles. |
• | Ineffective monitoring controls and management review controls to ensure timely detection and prevention of all potentially material errors. |
• | Ineffective contract review controls to ensure the completeness of contracts reviewed or to ensure the appropriate identification and timely accounting for related provisions. |
• | Ineffective procure-to-pay control procedures. |
We also have audited, in accordance with the standards of the Public Company Accounting Oversight Board (United States), the consolidated balance sheets of Pattern Energy Group Inc. as of December 31, 2016 and 2015, and the related consolidated statements of operations, comprehensive (loss) income, stockholders' equity and cash flows for each of the three years in the period ended December 31, 2016. These material weaknesses were considered in determining the nature, timing and extent of audit tests applied in our audit of
79
the 2016 financial statements, and this report does not affect our report dated March 1, 2017, which expressed an unqualified opinion on those financial statements.
In our opinion, because of the effect of the material weakness described above on the achievement of the objectives of the control criteria, Pattern Energy Group Inc. has not maintained effective internal control over financial reporting as of December 31, 2016, based on the COSO criteria.
/s/ Ernst & Young LLP
San Francisco, California
March 1, 2017
Item 9B. | Other Information. |
On February 24, 2017, the Board of Directors appointed Mr. Richard A. Ostberg as an officer in the role of Senior Vice President, Controller effective March 2, 2017. In this role, Mr. Ostberg will serve as our principal accounting officer. Prior to joining us, Mr. Ostberg served as chief financial officer of SourceGas, a natural gas utility serving customers in four states, from 2013 to 2016. Mr. Ostberg was with Xcel Energy from 2007 to 2013 as their assistant controller initially and later as their associate vice president of revenue requirements. Prior to Xcel, Mr. Ostberg served as chief risk and compliance officer of Markwest Energy Partners from 2005 to 2007. He began his career with Deloitte and Touche and is a former certified public accountant.
80
PART III
Certain information required by Part III is omitted from this Form 10-K because the registrant will file with the U.S. Securities and Exchange Commission a definitive proxy statement pursuant to Regulation 14A in connection with the solicitation of proxies for the Company’s Annual Meeting of Stockholders, or the 2017 Proxy Statement, within 120 days after the end of the fiscal year covered by this Form 10-K, and certain information included therein is incorporated herein by reference.
Item 10. | Directors, Executive Officers and Corporate Governance. |
The information required under this Item 10 is incorporated by reference to our 2017 Proxy Statement.
Item 11. | Executive Compensation. |
The information required under this Item 11 is incorporated by reference to our 2017 Proxy Statement.
Item 12. | Security Ownership of Certain Beneficial Owners and Management and Related Stockholder Matters. |
The information required under this Item 12 is incorporated by reference to our 2017 Proxy Statement.
Item 13. | Certain Relationships and Related Transactions, and Director Independence. |
The information required under this Item 13 is incorporated by reference to our 2017 Proxy Statement.
Item 14. | Principal Accounting Fees and Services. |
The information required under this Item 14 is incorporated by reference to our 2017 Proxy Statement.
81
PART IV
Item 15. | Exhibits and Financial Statement Schedules. |
(a) | Documents filed as part of this report | ||||
(1 | ) | Consolidated financial statements—Pattern Energy Group Inc. | |||
(2 | ) | Financial Statement Schedules | |||
(3 | ) | Exhibits | |||
82
The following documents are filed or furnished as part of this Form 10-K. The Company will furnish a copy of any exhibit listed to requesting stockholders upon payment of the Company’s reasonable expenses in furnishing those materials.
Exhibit No. | Description Of Exhibits | |
3.1 | Amended and Restated Certificate of Incorporation of Pattern Energy Group Inc. (Incorporated by reference to Exhibit 3.1 to the Company's Registration Statement on Form S-1/A dated September 20, 2013 (Registration No. 333-190538)). | |
3.2 | Amended and Restated Bylaws of Pattern Energy Group Inc. (Incorporated by reference to Exhibit 3.2 to the Company's Registration Statement on Form S-1/A dated September 3, 2013 (Registration No. 333-190538)). | |
4.1 | Form of Class A Stock Certificate (Incorporated by reference to Exhibit 3.2 to the Company's Registration Statement on Form S-1/A dated September 3, 2013 (Registration No. 333-190538)). | |
4.2 | Form of Senior Indenture (Incorporated by reference to Exhibit 4.3 to the Company's Registration Statement on Form S-3 dated October 8, 2014 (Registration No. 333-199217). | |
4.3 | Form of Subordinated Indenture (Incorporated by reference to Exhibit 4.5 to the Company's Registration Statement on Form S-3 dated October 8, 2014 (Registration No. 333-199217). | |
4.4 | Indenture, dated July 28, 2015, among Pattern Energy Group Inc., as issuer, Pattern US Finance Company LLC, as subsidiary guarantor, and Deutsche Bank Trust Company Americas, as trustee, related to 4.00% Convertible Senior Notes due 2020 (Incorporated by reference to Exhibit 4.1 to the Company’s Current Report on Form 8-K dated July 28, 2015). | |
4.5 | Indenture, dated as of January 25, 2017, among Pattern Energy Group Inc., Pattern US Finance Company LLC, as guarantor, and Deutsche Bank Trust Company Americas, as trustee, related to 5.875% Senior Notes due 2024 (Incorporated by reference to Exhibit 4.1 to the Company's Current Report on Form 8-K dated January 20, 2017). | |
10.1 | Amended and Restated Credit and Guaranty Agreement, among Pattern US Finance Company LLC, Pattern Canada Finance Company ULC, as borrowers, certain subsidiaries of the borrowers, the lenders party thereto from time to time, Royal Bank of Canada, as Swingline Lender, Administrative Agent and Collateral Agent, Bank of Montreal, as Syndication Agent, and Morgan Stanley Senior Funding, Inc., as Documentation Agent, dated as of December 17, 2014(the “Amended and Restated Credit and Guaranty Agreement) (Incorporated by reference to Exhibit 10.1 to the Company's Current Report on Form 8-K dated December 17, 2014). | |
10.2 | Amendment No. 2 dated as of September 28, 2015 to the Amended and Restated Credit and Guaranty Agreement (Incorporated by reference to Exhibit 10.1 to the Company’s Current Report on Form 8-K dated September 28, 2015). | |
10.3 | Amendment No. 3 dated as of November 20, 2015 to the Amended and Restated Credit and Guaranty Agreement (Incorporated by reference to Exhibit 10.1 to the Company’s Current Report on Form 8-K dated November 17, 2015). | |
10.4 | Pattern Energy Group Inc. 2013 Equity Incentive Award Plan (Incorporated by reference to Exhibit 10.2 to the Company's Registration Statement on Form S-1/A dated September 3, 2013 (Registration No. 333-190538)). | |
10.5 | Form of Pattern Energy Group Inc. 2013 Incentive Bonus Plan. (Incorporated by reference to Exhibit 10.3 to the Company's Registration Statement on Form S-1/A dated September 3, 2013 (Registration No. 333-190538)). | |
10.6 | Form of Stock Option Agreement under 2013 Equity Incentive Award Plan (Incorporated by reference to Exhibit 10.4 to the Company's Registration Statement on Form S-1/A dated September 3, 2013 (Registration No. 333-190538)). | |
10.7 | Form of Restricted Stock Agreement under 2013 Equity Incentive Award Plan. (Incorporated by reference to Exhibit 10.5 to the Company's Registration Statement on Form S-1/A dated September 20, 2013 (Registration No. 333-190538)). | |
10.8 | Form of Restricted Stock Unit Agreement under 2013 Equity Incentive Award Plan. (Incorporated by reference to Exhibit 10.6 to the Company's Registration Statement on Form S-1/A dated September 3, 2013 (Registration No. 333-190538)). | |
10.9 | Form of Deferred Restricted Stock Unit Agreement under 2013 Equity Incentive Award Plan. (Incorporated by reference to Exhibit 10.2 to the Company's Current Report on Form 8-K dated December 17, 2014). | |
10.10 | Form of Indemnification Agreement between the Registrant and each of its Executive Officers and Directors. (Incorporated by reference to Exhibit 10.7 to the Company's Registration Statement on Form S-1/A dated September 3, 2013 (Registration No. 333-190538)). | |
10.11 | Registration Rights Agreement between the Company and Pattern Energy Group LP, dated as of October 2, 2013. (Incorporated by reference to Exhibit 10.1 to the Company's Current Report on Form 8-K dated September 26, 2013). | |
10.12 | Contribution Agreement among the Company, Pattern Renewables LP, Pattern Energy Group LP, and Pattern Renewable Holdings Canada ULC, dated as of October 2, 2013. (Incorporated by reference to Exhibit 10.2 to the Company's Current Report on Form 8-K dated September 26, 2013). | |
10.13 | Purchase Rights Agreement among the Company, Pattern Energy Group LP, Pattern Energy Group Holdings LP and Pattern Energy GP LLC, dated as of October 2, 2013. (Incorporated by reference to Exhibit 10.3 to the Company's Current Report on Form 8-K dated September 26, 2013). | |
83
Exhibit No. | Description Of Exhibits | |
10.14 | Purchase and Sale Agreement, dated as of December 20, 2013, by and between Pattern Canada Operations Holdings ULC and Pattern Energy Group LP (Grand PSA). (Incorporated by reference to Exhibit 10.6 to the Company's Current Report on Form 8-K dated December 20, 2013). | |
10.15 | Purchase and Sale Agreement, dated as of December 20, 2013, by and among Pattern Energy Group Inc., Panhandle B Holdco 2 LLC and Pattern Energy Group LP (PH2 PSA) (Incorporated by reference to Exhibit 10.6 to the Company's Current Report on Form 8-K dated December 20, 2013). | |
10.16 | Management, Operation and Maintenance Agreement, dated as of December 20, 2013, by and between Pattern Panhandle Wind 2 LLC and Pattern Operators LP (PH2 MOMA) (Incorporated by reference to Exhibit 10.6 to the Company's Current Report on Form 8-K dated December 20, 2013). | |
10.17 | Project Administration Agreement, dated as of December 20, 2013, by and between Pattern Panhandle Wind 2 LLC and Pattern Operators LP (PH2 PAA) (Incorporated by reference to Exhibit 10.6 to the Company's Current Report on Form 8-K dated December 20, 2013). | |
10.18 | Purchase and Sale Agreement, dated as of May 1, 2014, by and among Pattern Energy Group Inc., Pattern Renewables LP and Pattern Energy Group LP (PH1 PSA) (Incorporated by reference to Exhibit 2.1 to the Company's Current Report on Form 8-K dated May 2, 2014). | |
10.19 | Purchase and Sale Agreement by and among Pattern Energy Group Inc., as Purchaser, Pattern Renewables LP, as Seller, and (solely for purposes of Section 7.1) Pattern Energy Group LP, as Guarantor, dated as of December 19, 2014 (Logan’s Gap PSA) (Incorporated by reference to Exhibit 2.1 to the Company's Current Report on Form 8-K dated December 19, 2014). | |
10.20 | Purchase and Sale Agreement, by and between Pattern Energy Group Inc., Pattern Renewables Development Company LLC, and (as guarantor for certain obligations) Pattern Energy Group LP dated April 29, 2015 (Amazon Wind Farm Fowler Ridge PSA) (Incorporated by reference to Exhibit 2.1 to the Company’s Current Report on Form 8-K dated April 29, 2015). | |
10.21 | Purchase and Sale Agreement, by and between Wind Capital Group, LLC, Lincoln County Wind Project Finco, LLC and Pattern Energy Group Inc., dated April 1, 2015 (Incorporated by reference to Exhibit 2.1 to the Company’s Current Report on Form 8-K dated May 15, 2015). | |
10.22 | Purchase and Sale Agreement between Pattern Canada Finance Company ULC and Pattern Energy Group LP dated April 4, 2015 (K2 PSA) (Incorporated by reference to Exhibit 2.1 to the Company’s Current Report on Form 8-K dated June 17, 2015). | |
10.23 | Purchase Agreement between Pattern Gulf Wind Equity 2 LLC, as seller, and Pattern Gulf Wind Equity LLC, as buyer, dated July 20, 2015 (Incorporated by reference to the Exhibit 10.1 to the Company’s Current Report on Form 8-K dated July 20, 2015). | |
10.24 | Employment Agreement between Pattern Energy Group Inc. and Michael M. Garland dated October 2, 2013 (Incorporated by reference to Exhibit 10.19 to the Company's Annual Report on Form 10-K for the fiscal year ended December 31, 2013). | |
10.25 | Employment Agreement between Pattern Energy Group Inc. and Hunter H. Armistead dated October 2, 2013 (Incorporated by reference to Exhibit 10.20 to the Company's Annual Report on Form 10-K for the fiscal year ended December 31, 2013). | |
10.26 | Employment Agreement between Pattern Energy Group Inc. and Daniel M. Elkort dated October 2, 2013 (Incorporated by reference to Exhibit 10.21 to the Company's Annual Report on Form 10-K for the fiscal year ended December 31, 2013). | |
10.27 | Employment Agreement between Pattern Energy Group Inc. and Esben Pedersen dated October 2, 2013 (Incorporated by reference to Exhibit 10.16 to the Company's Registration Statement on Form S-1 dated April 25, 2014 (Registration No. 333-195488)). | |
10.28 | Purchase and Sale Agreement, dated as of June 30, 2016, by and between Pattern Energy Group Inc., Pattern Renewables LP, and Pattern Energy Group LP (Incorporated by reference to Exhibit 2.1 to the Company's Current Report on Form 8-K filed July 1, 2016). | |
10.29 | Purchase and Sale Agreement, dated September 21, 2016, by and between Pattern Canada Finance Company ULC, a Nova Scotia unlimited liability company, and Pattern Energy Group LP, a Delaware limited partnership (Incorporated by reference to Exhibit 2.1 to the Company's Current Report on Form 8-K filed September 23, 2016). | |
10.30 | Employment Agreement between Pattern Energy Group Inc. and Michael J. Lyon dated October 2, 2013 (Incorporated by reference to Exhibit 10.1 to the Company’s Quarterly Report on Form 10-Q dated May 7, 2015). | |
10.31 | Assignment and Assumption of Lease and Consent of Landlord Agreement, effective as of January 1, 2016, by and between Pattern Energy Group LP, Pattern Energy Group Inc., and AMB Pier One, LLC (Incorporated by reference to Exhibit 10.1 to the Company's Current Report on Form 8-K dated January 25, 2016). | |
10.32 | Purchase Rights Agreement among Pattern Energy Group Inc., Pattern Energy Group 2 LP, and (solely with respect to Article III thereto) Pattern Energy Group Holdings 2 LP and Pattern Energy Group Holdings 2 GP LLC, dated as of December 8, 2016 (Incorporated by reference to Exhibit 10.1 to the Company's Current Report on Form 8-K dated December 8, 2016). | |
84
Exhibit No. | Description Of Exhibits | |
10.33 | Multilateral Management Services Agreement among Pattern Energy Group Inc., Pattern Energy Group LP and Pattern Energy Group 2 LP, dated as of December 8, 2016 (Incorporated by reference to Exhibit 10.2 to the Company's Current Report on Form 8-K dated December 8, 2016). | |
10.34 | Amended and Restated Non-Competition Agreement among Pattern Energy Group Inc., Pattern Energy Group LP and Pattern Energy Group 2 LP, dated as of December 8, 2016 (Incorporated by reference to Exhibit 10.3 to the Company's Current Report on Form 8-K dated December 8, 2016). | |
10.35 | Service Mark License Agreement between Pattern Energy Group Inc. and Pattern Energy Group 2 LP, dated as of December 8, 2016 (Incorporated by reference to Exhibit 10.4 to the Company's Current Report on Form 8-K dated December 8, 2016). | |
21.1** | Subsidiaries of the Company | |
23.1** | Consent of Independent Registered Public Accounting Firm | |
23.2** | Consent of PricewaterhouseCoopers LLP | |
24.1 | Powers of Attorney (included in the signature pages to this filing). | |
31.1** | Certifications of the Chief Executive Officer pursuant to Exchange Act Rules 13a-14(a) and 15d-14(a), as adopted pursuant to Section 302 of the Sarbanes-Oxley Act of 2002 | |
31.2** | Certifications of the Chief Financial Officer pursuant to Exchange Act Rules 13a-14(a) and 15d-14(a), as adopted pursuant to Section 302 of the Sarbanes-Oxley Act of 2002 | |
32* | Certifications of the Company’s Chief Executive Officer and Chief Financial Officer pursuant to 18 U.S.C. Section 1350, as adopted pursuant to Section 906 of the Sarbanes-Oxley Act of 2002. | |
99.1 | Amendment No. 4 dated as of May 27, 2016 to the Amended and Restated Credit and Guaranty Agreement dated as of December 17, 2014, among Pattern US Finance Company LLC, Pattern Canada Finance Company ULC, Royal Bank of Canada (acting through its New York Branch), as Administrative Agent and the other parties party thereto (Incorporated by reference to Exhibit 99.1 to the Company's Quarterly Report on Form 10-Q filed on August 5, 2016). | |
101.INS** | XBRL Instance Document | |
101.SCH** | XBRL Taxonomy Extension Schema Document | |
101.CAL** | XBRL Taxonomy Extension Calculation Linkbase Document | |
101.DEF** | XBRL Taxonomy Extension Definition Linkbase Document | |
101.LAB** | XBRL Taxonomy Extension Label Linkbase Document | |
101.PRE** | XBRL Taxonomy Extension Presentation Linkbase Document | |
* | These certifications accompany this Report pursuant to Section 906 of the Sarbanes-Oxley Act of 2002 and shall not be deemed “filed” by the Company for purposes of Section 18 of the Exchange Act. |
** Filed herewith.
85
SIGNATURES
Pursuant to the requirements of Section 13 or 15(d) of the Securities Exchange Act of 1934, the registrant has duly caused this report to be signed on its behalf by the undersigned, thereunto duly authorized.
Date: | March 1, 2017 | Pattern Energy Group Inc. | |
By | /s/ Michael M. Garland | ||
Michael M. Garland | |||
President and Chief Executive Officer | |||
POWER OF ATTORNEY
KNOW ALL PERSONS BY THESE PRESENTS, that each person whose signature appears below constitutes and appoints Dyann Blaine and Michael Lyon, and each of them, as his or her true and lawful attorneys-in-fact and agents, with full power of substitution and re-substitution, for him or her and in his or her name, place and stead, in any and all capacities, to sign any and all amendments to this Annual Report on Form 10-K, and to file the same, with all exhibits thereto, and other documents in connection therewith, with the Securities and Exchange Commission, granting unto said attorneys-in-fact and agents, and each of them, full power and authority to do and perform each and every act and thing requisite and necessary to be done in connection therewith, as fully to all intents and purposes as he or she might or could do in person, hereby ratifying and confirming that all said attorneys-in-fact and agents, or any of them or their or his or her substitute or substitutes, may lawfully do or cause to be done by virtue hereof.
Pursuant to the requirements of the Securities Exchange Act of 1934, this Annual Report on Form 10-K has been signed by the following persons on behalf of the registrant and in the capacities and on the dates indicated:
Signature | Title | Date | ||
/s/ MICHAEL M. GARLAND | President, Chief Executive Officer and Director of Pattern Energy Group Inc. (Principal Executive Officer) | March 1, 2017 | ||
Michael M. Garland | ||||
/s/ ALAN R. BATKIN | Director and Chairman of Pattern Energy Group Inc. | March 1, 2017 | ||
Alan R. Batkin | ||||
/s/ PATRICIA S. BELLINGER | Director of Pattern Energy Group Inc. | March 1, 2017 | ||
Patricia S. Bellinger | ||||
/s/ THE LORD BROWNE OF MADINGLEY | Director of Pattern Energy Group Inc. | March 1, 2017 | ||
The Lord Browne of Madingley | ||||
/s/ DOUGLAS G. HALL | Director of Pattern Energy Group Inc. | March 1, 2017 | ||
Douglas G. Hall | ||||
/s/ MICHAEL B. HOFFMAN | Director of Pattern Energy Group Inc. | March 1, 2017 | ||
Michael B. Hoffman | ||||
/s/ PATRICIA M. NEWSON | Director of Pattern Energy Group Inc. | March 1, 2017 | ||
Patricia M. Newson | ||||
/s/ MICHAEL J. LYON | Chief Financial Officer of Pattern Energy Group Inc. (Principal Financial Officer and Principal Accounting Officer) | March 1, 2017 | ||
Michael J. Lyon | ||||
86
INDEX TO CONSOLIDATED FINANCIAL STATEMENTS
F-1
Report of Independent Registered Public Accounting Firm
Board of Directors and Stockholders
Pattern Energy Group Inc.
We have audited the accompanying consolidated balance sheets of Pattern Energy Group Inc. as of December 31, 2016 and 2015, and the related consolidated statements of operations, comprehensive (loss) income, stockholders' equity and cash flows for each of the three years in the period ended December 31, 2016. Our audits also included the financial statement Schedule I listed in the Index at Item 15(a). These financial statements and schedule are the responsibility of the Company's management. Our responsibility is to express an opinion on these financial statements and schedule based on our audits. We did not audit the financial statements of SP Armow Wind Ontario LP, South Kent Wind LP, and Grand Renewable Wind LP partnerships in which the Company has a 50%, 50% and 45% interest, respectively. In the consolidated financial statements, the Company’s investment in SP Armow Wind Ontario LP, South Kent Wind LP and Grand Renewable Wind LP is stated at $136,243,000 and $11,920,000 at December 31, 2016 and 2015, respectively, and the Company’s equity in the net earnings (loss) of SP Armow Wind Ontario LP, South Kent Wind LP and Grand Renewable Wind LP is stated at $24,704,000, $12,233,000 and ($24,775,000) for the years ended December 31, 2016, 2015 and 2014, respectively. The statements for SP Armow Wind Ontario LP, South Kent Wind LP and Grand Renewable Wind LP were audited by other auditors whose reports have been furnished to us, and our opinion, insofar as it relates to the amounts included for SP Armow Wind Ontario LP, South Kent Wind LP and Grand Renewable Wind LP, is based solely on the reports of the other auditors.
We conducted our audits in accordance with the standards of the Public Company Accounting Oversight Board (United States). Those standards require that we plan and perform the audit to obtain reasonable assurance about whether the financial statements are free of material misstatement. An audit includes examining, on a test basis, evidence supporting the amounts and disclosures in the financial statements. An audit also includes assessing the accounting principles used and significant estimates made by management, as well as evaluating the overall financial statement presentation. We believe that our audits and the reports of other auditors provide a reasonable basis for our opinion.
In our opinion, based on our audits and the reports of other auditors, the financial statements referred to above present fairly, in all material respects, the consolidated financial position of Pattern Energy Group Inc. at December 31, 2016 and 2015, and the consolidated results of its operations and its cash flows for each of the three years in the period ended December 31, 2016, in conformity with U.S. generally accepted accounting principles. Also, in our opinion, the related financial statement schedule, when considered in relation to the basic financial statements taken as a whole, presents fairly in all material respects the information set forth therein.
We also have audited, in accordance with the standards of the Public Company Accounting Oversight Board (United States), Pattern Energy Group Inc.’s internal control over financial reporting as of December 31, 2016, based on criteria established in Internal Control-Integrated Framework issued by the Committee of Sponsoring Organizations of the Treadway Commission (2013 framework), and our report dated March 1, 2017 expressed an adverse opinion thereon.
/s/ Ernst & Young LLP
San Francisco, California
March 1, 2017
F-2
Pattern Energy Group Inc. Consolidated Balance Sheets (In thousands of U.S. dollars, except share data) | |||||||
December 31, | |||||||
2016 | 2015 | ||||||
Assets | |||||||
Current assets: | |||||||
Cash and cash equivalents (Note 6) | $ | 83,932 | $ | 94,808 | |||
Restricted cash (Note 6) | 11,793 | 14,609 | |||||
Funds deposited by counterparty | 43,635 | — | |||||
Trade receivables (Note 6) | 37,510 | 45,292 | |||||
Related party receivable | 1,134 | 734 | |||||
Reimbursable interconnection costs | — | 38 | |||||
Derivative assets, current | 17,578 | 24,338 | |||||
Prepaid expenses (Note 6) | 13,803 | 14,498 | |||||
Other current assets (Note 6) | 6,216 | 6,891 | |||||
Deferred financing costs, current, net of accumulated amortization of $9,350 and $5,192 as of December 31, 2016 and December 31, 2015, respectively | 2,456 | 2,121 | |||||
Total current assets | 218,057 | 203,329 | |||||
Restricted cash (Note 6) | 13,646 | 36,875 | |||||
Property, plant and equipment, net (Note 6) | 3,135,162 | 3,294,620 | |||||
Unconsolidated investments | 233,294 | 116,473 | |||||
Derivative assets | 26,712 | 44,014 | |||||
Deferred financing costs | 4,052 | 4,572 | |||||
Net deferred tax assets | 5,559 | 6,804 | |||||
Finite-lived intangible assets, net (Note 6) | 91,895 | 97,722 | |||||
Other assets (Note 6) | 24,390 | 25,183 | |||||
Total assets | $ | 3,752,767 | $ | 3,829,592 | |||
(Continued)
Pattern Energy Group Inc. Consolidated Balance Sheets (In thousands of U.S. dollars, except share data) | |||||||
December 31, | |||||||
2016 | 2015 | ||||||
Liabilities and equity | |||||||
Current liabilities: | |||||||
Accounts payable and other accrued liabilities (Note 6) | $ | 31,305 | $ | 42,776 | |||
Accrued construction costs (Note 6) | 1,098 | 23,565 | |||||
Counterparty deposit liability | 43,635 | — | |||||
Related party payable | 1,295 | 1,646 | |||||
Accrued interest (Note 6) | 9,545 | 9,035 | |||||
Dividends payable | 35,960 | 28,022 | |||||
Derivative liabilities, current | 11,918 | 14,343 | |||||
Revolving credit facility | 180,000 | 355,000 | |||||
Current portion of long-term debt, net | 48,716 | 44,144 | |||||
Other current liabilities (Note 6) | 3,403 | 2,156 | |||||
Total current liabilities | 366,875 | 520,687 | |||||
Long-term debt, net | 1,334,956 | 1,371,742 | |||||
Derivative liabilities | 24,521 | 28,659 | |||||
Net deferred tax liabilities | 31,759 | 22,183 | |||||
Finite-lived intangible liability, net | 54,663 | 58,132 | |||||
Other long-term liabilities (Note 6) | 61,249 | 52,427 | |||||
Total liabilities | 1,874,023 | 2,053,830 | |||||
Commitments and contingencies (Note 17) | |||||||
Equity: | |||||||
Class A common stock, $0.01 par value per share: 500,000,000 shares authorized; 87,410,687 and 74,644,141 shares outstanding as of December 31, 2016 and December 31, 2015, respectively | 875 | 747 | |||||
Additional paid-in capital | 1,145,760 | 982,814 | |||||
Accumulated loss | (94,270 | ) | (77,159 | ) | |||
Accumulated other comprehensive loss | (62,367 | ) | (73,325 | ) | |||
Treasury stock, at cost; 110,964 and 65,301 shares of Class A common stock as of December 31, 2016 and December 31, 2015, respectively | (2,500 | ) | (1,577 | ) | |||
Total equity before noncontrolling interest | 987,498 | 831,500 | |||||
Noncontrolling interest | 891,246 | 944,262 | |||||
Total equity | 1,878,744 | 1,775,762 | |||||
Total liabilities and equity | $ | 3,752,767 | $ | 3,829,592 | |||
(Concluded)
See accompanying notes to consolidated financial statements.
F-3
Pattern Energy Group Inc. Consolidated Statements of Operations (In thousands of U.S. dollars, except share data) | |||||||||||
Year ended December 31, | |||||||||||
2016 | 2015 | 2014 | |||||||||
Revenue: | |||||||||||
Electricity sales | $ | 346,000 | $ | 324,275 | $ | 254,669 | |||||
Related party revenue | 5,793 | 3,640 | 3,317 | ||||||||
Other revenue | 2,259 | 1,916 | 7,507 | ||||||||
Total revenue | 354,052 | 329,831 | 265,493 | ||||||||
Cost of revenue: | |||||||||||
Project expense | 128,852 | 114,619 | 77,775 | ||||||||
Depreciation and accretion | 174,490 | 143,376 | 104,417 | ||||||||
Total cost of revenue | 303,342 | 257,995 | 182,192 | ||||||||
Gross profit | 50,710 | 71,836 | 83,301 | ||||||||
Operating expenses: | |||||||||||
General and administrative | 40,573 | 29,807 | 22,533 | ||||||||
Related party general and administrative | 9,900 | 7,589 | 5,787 | ||||||||
Total operating expenses | 50,473 | 37,396 | 28,320 | ||||||||
Operating income (expense) | 237 | 34,440 | 54,981 | ||||||||
Other income (expense): | |||||||||||
Interest expense | (78,004 | ) | (77,907 | ) | (67,694 | ) | |||||
Loss on undesignated derivatives, net | (3,324 | ) | (5,490 | ) | (15,743 | ) | |||||
Realized loss on designated derivatives | — | (11,221 | ) | — | |||||||
Earnings (losses) in unconsolidated investments, net | 30,192 | 16,119 | (25,295 | ) | |||||||
Related party income | 5,074 | 2,665 | 2,612 | ||||||||
Early extinguishment of debt | — | (4,941 | ) | — | |||||||
Net gain (loss) on transactions | (326 | ) | (3,400 | ) | 13,843 | ||||||
Other income (expense), net | 2,531 | (929 | ) | 433 | |||||||
Total other expense | (43,857 | ) | (85,104 | ) | (91,844 | ) | |||||
Net loss before income tax | (43,620 | ) | (50,664 | ) | (36,863 | ) | |||||
Tax provision | 8,679 | 4,943 | 3,136 | ||||||||
Net loss | (52,299 | ) | (55,607 | ) | (39,999 | ) | |||||
Net loss attributable to noncontrolling interest | (35,188 | ) | (23,074 | ) | (8,709 | ) | |||||
Net loss attributable to Pattern Energy | $ | (17,111 | ) | $ | (32,533 | ) | $ | (31,290 | ) | ||
Weighted average number of shares: | |||||||||||
Class A common stock - Basic and diluted | 79,382,388 | 70,535,568 | 42,361,959 | ||||||||
Class B common stock - Basic and diluted | N/A | N/A | 15,555,000 | ||||||||
Loss per share | |||||||||||
Class A common stock: | |||||||||||
Basic and diluted loss per share | $ | (0.22 | ) | $ | (0.46 | ) | $ | (0.56 | ) | ||
Class B common stock: | |||||||||||
Basic and diluted loss per share | N/A | N/A | $ | (0.49 | ) | ||||||
Dividends declared per Class A common share | $ | 1.58 | $ | 1.43 | $ | 1.30 | |||||
Deemed dividends per Class B common share | N/A | N/A | $ | 1.41 | |||||||
See accompanying notes to consolidated financial statements.
F-4
Pattern Energy Group Inc.
Consolidated Statements of Comprehensive Income (Loss)
(In thousands of U.S. Dollars)
Year ended December 31, | |||||||||||
2016 | 2015 | 2014 | |||||||||
Net loss | $ | (52,299 | ) | $ | (55,607 | ) | $ | (39,999 | ) | ||
Other comprehensive income (loss): | |||||||||||
Foreign currency translation, net of zero tax impact | 4,785 | (28,947 | ) | (10,875 | ) | ||||||
Derivative activity: | |||||||||||
Effective portion of change in fair market value of derivatives, net of tax benefit of $833, $1,860 and $1,138, respectively | (6,751 | ) | (16,163 | ) | (33,444 | ) | |||||
Reclassifications to net loss due to termination/de-designation of interest rate derivatives, net of zero tax impact | — | 17,139 | — | ||||||||
Reclassifications to net loss, net of tax impact of $949, $670 and $404, respectively | 7,462 | 12,234 | 13,774 | ||||||||
Total change in effective portion of change in fair market value of derivatives | 711 | 13,210 | (19,670 | ) | |||||||
Proportionate share of equity investee's derivative activity: | |||||||||||
Effective portion of change in fair market value of derivatives, net of tax (provision) benefit of ($375), $2,394 and $1,855, respectively | 1,039 | (6,640 | ) | (5,991 | ) | ||||||
Reclassifications to net loss, net of tax impact of $1,656, $870 and $0, respectively | 4,594 | 2,412 | — | ||||||||
Total change in effective portion of change in fair market value of derivatives | 5,633 | (4,228 | ) | (5,991 | ) | ||||||
Total other comprehensive income (loss), net of tax | 11,129 | (19,965 | ) | (36,536 | ) | ||||||
Comprehensive loss | (41,170 | ) | (75,572 | ) | (76,535 | ) | |||||
Less comprehensive loss attributable to noncontrolling interest: | |||||||||||
Net loss attributable to noncontrolling interest | (35,188 | ) | (23,074 | ) | (8,709 | ) | |||||
Derivative activity: | |||||||||||
Effective portion of change in fair market value of derivatives, net of tax benefit of $44, $185 and $341, respectively | (119 | ) | (1,740 | ) | (3,422 | ) | |||||
Reclassifications to net loss, net of tax impact of $107, $201 and $121, respectively | 290 | 2,088 | 3,601 | ||||||||
Total change in effective portion of change in fair market value of derivatives | 171 | 348 | 179 | ||||||||
Comprehensive loss attributable to noncontrolling interest | (35,017 | ) | (22,726 | ) | (8,530 | ) | |||||
Comprehensive loss attributable to Pattern Energy | $ | (6,153 | ) | $ | (52,846 | ) | $ | (68,005 | ) | ||
See accompanying notes to consolidated financial statements.
F-5
Pattern Energy Group Inc. Consolidated Statement of Stockholders’ Equity (In thousands of U.S. Dollars, except share data) | ||||||||||||||||||||||||||||||||||||||||||||
Class A Common Stock | Class B Common Stock | Treasury Stock | Additional Paid-in Capital | Accumulated Income (Loss) | Accumulated Other Comprehensive Income (Loss) | Total | Noncontrolling Interest | Total Equity | ||||||||||||||||||||||||||||||||||||
Shares | Amount | Shares | Amount | Shares | Amount | |||||||||||||||||||||||||||||||||||||||
Balances at December 31, 2013 | 35,531,720 | 355 | 15,555,000 | 156 | (934 | ) | (24 | ) | 489,412 | (13,336 | ) | (8,353 | ) | 468,210 | 99,794 | 568,004 | ||||||||||||||||||||||||||||
Issuance of Class A common stock, net of issuance costs | 10,810,810 | 108 | — | — | — | — | 286,785 | — | — | 286,893 | — | 286,893 | ||||||||||||||||||||||||||||||||
Issuance of Class A restricted common stock | 175,915 | 2 | — | — | — | — | 3,494 | — | — | 3,496 | — | 3,496 | ||||||||||||||||||||||||||||||||
Issuance of Class A common stock upon exercise of stock options | 14,861 | — | — | — | — | — | 327 | — | — | 327 | — | 327 | ||||||||||||||||||||||||||||||||
Repurchase of shares for employee tax withholding | — | — | — | — | (24,531 | ) | (693 | ) | — | — | — | (693 | ) | — | (693 | ) | ||||||||||||||||||||||||||||
Conversion of Class B common stock to Class A common stock | 15,555,000 | 156 | (15,555,000 | ) | (156 | ) | — | — | — | — | — | — | — | — | ||||||||||||||||||||||||||||||
Stock-based compensation | — | — | — | — | — | — | 610 | — | — | 610 | — | 610 | ||||||||||||||||||||||||||||||||
Refund of issuance costs related to the initial public offering | — | — | — | — | — | — | 286 | — | — | 286 | — | 286 | ||||||||||||||||||||||||||||||||
Dividends declared | — | — | — | — | — | — | (56,976 | ) | — | — | (56,976 | ) | — | (56,976 | ) | |||||||||||||||||||||||||||||
Recognition of beneficial conversion feature on Class B convertible common stock | — | — | — | — | — | — | (21,901 | ) | — | — | (21,901 | ) | — | (21,901 | ) | |||||||||||||||||||||||||||||
Adjustment to paid-in capital for beneficial conversion feature recognition | — | — | — | — | — | — | 21,901 | — | — | 21,901 | — | 21,901 | ||||||||||||||||||||||||||||||||
Accretion of the Class B beneficial conversion feature | — | — | — | — | — | — | 21,901 | — | — | 21,901 | — | 21,901 | ||||||||||||||||||||||||||||||||
Deemed dividends on Class B convertible common stock | — | — | — | — | — | — | (21,901 | ) | — | — | (21,901 | ) | — | (21,901 | ) | |||||||||||||||||||||||||||||
Contribution from noncontrolling interests | — | — | — | — | — | — | — | — | — | — | 406,163 | 406,163 | ||||||||||||||||||||||||||||||||
Fair value of noncontrolling interest in El Arrayán | — | — | — | — | — | — | — | — | — | — | 35,259 | 35,259 | ||||||||||||||||||||||||||||||||
Distribution to noncontrolling interests | — | — | — | — | — | — | — | — | — | — | (2,100 | ) | (2,100 | ) | ||||||||||||||||||||||||||||||
Net loss | — | — | — | — | — | — | — | (31,290 | ) | (31,290 | ) | (8,709 | ) | (39,999 | ) | |||||||||||||||||||||||||||||
Other comprehensive income (loss), net of tax | — | — | — | — | — | — | — | — | (36,715 | ) | (36,715 | ) | 179 | (36,536 | ) | |||||||||||||||||||||||||||||
Balances at December 31, 2014 | 62,088,306 | 621 | — | — | (25,465 | ) | (717 | ) | 723,938 | (44,626 | ) | (45,068 | ) | 634,148 | 530,586 | 1,164,734 | ||||||||||||||||||||||||||||
Issuance of Class A common stock, net of issuance costs | 12,435,000 | 124 | — | — | — | — | 316,828 | — | — | 316,952 | — | 316,952 | ||||||||||||||||||||||||||||||||
Issuance of Class A common stock under equity incentive award plan, net | 186,136 | 2 | — | — | — | — | (2 | ) | — | — | — | — | — | |||||||||||||||||||||||||||||||
Repurchase of shares for employee tax withholding | — | — | — | — | (39,836 | ) | (860 | ) | — | — | — | (860 | ) | — | (860 | ) | ||||||||||||||||||||||||||||
Stock-based compensation | — | — | — | — | — | — | 4,462 | — | — | 4,462 | — | 4,462 | ||||||||||||||||||||||||||||||||
Dividends declared | — | — | — | — | — | — | (102,893 | ) | — | — | (102,893 | ) | — | (102,893 | ) | |||||||||||||||||||||||||||||
Dividend equivalents declared upon vesting of deferred restricted stock units | — | — | — | — | — | — | 23 | — | — | 23 | — | 23 | ||||||||||||||||||||||||||||||||
Acquisition of Post Rock | — | — | — | — | — | — | — | — | — | — | 205,100 | 205,100 | ||||||||||||||||||||||||||||||||
Conversion option of convertible senior notes, net of issuance costs | — | — | — | — | — | — | 23,743 | — | — | 23,743 | — | 23,743 | ||||||||||||||||||||||||||||||||
Buyout of noncontrolling interests | — | — | — | — | — | — | 16,715 | — | (7,944 | ) | 8,771 | (95,047 | ) | (86,276 | ) | |||||||||||||||||||||||||||||
Contributions from noncontrolling interests | — | — | — | — | — | — | — | — | — | — | 334,231 | 334,231 | ||||||||||||||||||||||||||||||||
Distributions to noncontrolling interests | — | — | — | — | — | — | — | — | — | — | (7,882 | ) | (7,882 | ) | ||||||||||||||||||||||||||||||
Net loss | — | — | — | — | — | — | — | (32,533 | ) | — | (32,533 | ) | (23,074 | ) | (55,607 | ) | ||||||||||||||||||||||||||||
Other comprehensive income (loss), net of tax | — | — | — | — | — | — | — | — | (20,313 | ) | (20,313 | ) | 348 | (19,965 | ) | |||||||||||||||||||||||||||||
Balances at December 31, 2015 | 74,709,442 | 747 | — | — | (65,301 | ) | (1,577 | ) | 982,814 | (77,159 | ) | (73,325 | ) | 831,500 | 944,262 | 1,775,762 | ||||||||||||||||||||||||||||
Issuance of Class A common stock, net of issuance costs | 12,540,504 | 125 | — | — | — | — | 285,994 | — | — | 286,119 | — | 286,119 | ||||||||||||||||||||||||||||||||
Issuance of Class A common stock under equity incentive award plan, net | 271,705 | 3 | — | — | — | — | (3 | ) | — | — | — | — | — | |||||||||||||||||||||||||||||||
Repurchase of shares for employee tax withholding | — | — | — | — | (45,663 | ) | (923 | ) | — | — | — | (923 | ) | — | (923 | ) | ||||||||||||||||||||||||||||
Stock-based compensation | — | — | — | — | — | — | 5,391 | — | — | 5,391 | — | 5,391 | ||||||||||||||||||||||||||||||||
Dividends declared | — | — | — | — | — | — | (128,502 | ) | — | — | (128,502 | ) | — | (128,502 | ) | |||||||||||||||||||||||||||||
Distributions to noncontrolling interests | — | — | — | — | — | — | — | — | — | — | (17,896 | ) | (17,896 | ) | ||||||||||||||||||||||||||||||
Other | — | — | — | — | — | — | 66 | — | — | 66 | (103 | ) | (37 | ) | ||||||||||||||||||||||||||||||
Net loss | — | — | — | — | — | — | — | (17,111 | ) | — | (17,111 | ) | (35,188 | ) | (52,299 | ) | ||||||||||||||||||||||||||||
Other comprehensive income, net of tax | — | — | — | — | — | — | — | — | 10,958 | 10,958 | 171 | 11,129 | ||||||||||||||||||||||||||||||||
Balances at December 31, 2016 | 87,521,651 | $ | 875 | — | $ | — | (110,964 | ) | $ | (2,500 | ) | $ | 1,145,760 | $ | (94,270 | ) | $ | (62,367 | ) | $ | 987,498 | $ | 891,246 | $ | 1,878,744 | |||||||||||||||||||
See accompanying notes to consolidated financial statements.
F-6
Pattern Energy Group Inc. Consolidated Statements of Cash Flows (In thousands of U.S. dollars) | |||||||||||
Year ended December 31, | |||||||||||
2016 | 2015 | 2014 | |||||||||
Operating activities | |||||||||||
Net loss | $ | (52,299 | ) | $ | (55,607 | ) | $ | (39,999 | ) | ||
Adjustments to reconcile net loss to net cash provided by operating activities: | |||||||||||
Depreciation and accretion | 174,490 | 143,376 | 104,417 | ||||||||
Amortization of financing costs | 6,968 | 7,435 | 6,309 | ||||||||
Loss on derivatives, net | 22,239 | 2,219 | 15,546 | ||||||||
Stock-based compensation | 5,391 | 4,462 | 4,105 | ||||||||
Net gain on transactions | — | — | (16,526 | ) | |||||||
Deferred taxes | 8,247 | 4,494 | 2,948 | ||||||||
(Earnings) loss in unconsolidated investments, net | (30,192 | ) | (16,180 | ) | 25,295 | ||||||
Distribution from unconsolidated investments | 15,015 | — | — | ||||||||
Amortization of power purchase agreements, net | 3,049 | 1,946 | — | ||||||||
Amortization of debt discount/premium, net | 4,226 | 1,660 | — | ||||||||
Realized loss on derivatives, net | — | 11,221 | — | ||||||||
Early extinguishment of debt | — | 4,722 | — | ||||||||
Other reconciling items | (4,470 | ) | 1,221 | — | |||||||
Changes in operating assets and liabilities: | |||||||||||
Funds deposited by counterparty | (43,635 | ) | — | — | |||||||
Trade receivables | 7,796 | (2,254 | ) | (8,255 | ) | ||||||
Prepaid expenses | 709 | 1,272 | (4,100 | ) | |||||||
Other current assets | (3,909 | ) | (2,929 | ) | 17,016 | ||||||
Other assets (non-current) | 1,379 | (2,336 | ) | (649 | ) | ||||||
Accounts payable and other accrued liabilities | (2,546 | ) | 4,716 | 3,667 | |||||||
Counterparty deposit liability | 43,635 | — | — | ||||||||
Related party receivable/payable | (742 | ) | 711 | (942 | ) | ||||||
Accrued interest | 458 | 4,489 | 1,377 | ||||||||
Other current liabilities | 1,227 | 515 | — | ||||||||
Long-term liabilities | 6,628 | 2,696 | 239 | ||||||||
Net cash provided by operating activities | 163,664 | 117,849 | 110,448 | ||||||||
Investing activities | |||||||||||
Cash paid for acquisitions, net of cash and restricted cash acquired | (135,778 | ) | (422,413 | ) | (283,848 | ) | |||||
Capital expenditures | (32,901 | ) | (380,458 | ) | (119,506 | ) | |||||
Distribution from unconsolidated investments | 41,698 | 38,240 | 22,019 | ||||||||
Other assets | 2,696 | 5,559 | 21,432 | ||||||||
Other investing activities | 31 | (3 | ) | (2,651 | ) | ||||||
Net cash used in investing activities | (124,254 | ) | (759,075 | ) | (362,554 | ) | |||||
F-7
Pattern Energy Group Inc. Consolidated Statements of Cash Flows (In thousands of U.S. dollars) | |||||||||||
Year ended December 31, | |||||||||||
2016 | 2015 | 2014 | |||||||||
Financing activities | |||||||||||
Proceeds from public offering, net of issuance costs | $ | 286,298 | $ | 317,432 | $ | 286,757 | |||||
Proceeds from issuance of convertible senior notes, net of issuance costs | — | 218,929 | — | ||||||||
Proceeds from exercise of stock options | — | — | 327 | ||||||||
Repurchase of shares for employee tax withholding | (923 | ) | (860 | ) | (693 | ) | |||||
Dividends paid | (120,207 | ) | (90,582 | ) | (52,344 | ) | |||||
Payment for deferred equity issuance costs | — | — | (550 | ) | |||||||
Buyout of noncontrolling interest | — | (121,224 | ) | — | |||||||
Capital contributions - noncontrolling interest | — | 336,043 | 200,805 | ||||||||
Capital distributions - noncontrolling interest | (17,896 | ) | (7,882 | ) | (2,100 | ) | |||||
Refund of deposit for letters of credit | — | 3,425 | (3,422 | ) | |||||||
Payment for deferred financing costs | (542 | ) | (13,667 | ) | (11,856 | ) | |||||
Proceeds from revolving credit facility | 175,000 | 405,000 | 50,000 | ||||||||
Repayment of revolving credit facility | (350,000 | ) | (100,000 | ) | — | ||||||
Proceeds from construction loans | — | 329,070 | 59,778 | ||||||||
Proceeds from long-term debt | — | 164,973 | — | ||||||||
Repayment of long-term debt | (47,634 | ) | (785,923 | ) | (259,437 | ) | |||||
Payment for interest rate derivatives | — | (11,061 | ) | — | |||||||
Other financing activities | (759 | ) | — | — | |||||||
Net cash provided by (used in) financing activities | (76,663 | ) | 643,673 | 267,265 | |||||||
Effect of exchange rate changes on cash, cash equivalents and restricted cash | 332 | (5,501 | ) | (2,018 | ) | ||||||
Net change in cash, cash equivalents and restricted cash | (36,921 | ) | (3,054 | ) | 13,141 | ||||||
Cash, cash equivalents and restricted cash at beginning of period | 146,292 | 149,346 | 136,205 | ||||||||
Cash, cash equivalents and restricted cash at end of period | $ | 109,371 | $ | 146,292 | $ | 149,346 | |||||
Supplemental disclosures | |||||||||||
Cash payments for income taxes | $ | 375 | $ | 342 | $ | 131 | |||||
Cash payments for interest expense, net of capitalized interest | 69,666 | 62,607 | 53,776 | ||||||||
Acquired property, plant and equipment from acquisitions | — | 581,834 | 1,013,365 | ||||||||
Schedule of non-cash activities | |||||||||||
Change in property, plant and equipment | $ | 540 | $ | 15,695 | $ | (47,908 | ) | ||||
Non-cash deemed dividends on Class B convertible common stock | — | — | 21,901 | ||||||||
Non-cash increase in additional paid-in capital from buyout of noncontrolling interests | — | 16,715 | — | ||||||||
Amortization of deferred financing costs—included as construction in progress | — | — | 343 | ||||||||
Equity issuance costs paid in prior period related to current period offerings | — | 433 | — | ||||||||
See accompanying notes to consolidated financial statements.
F-8
Pattern Energy Group Inc.
Notes to Consolidated Financial Statements
1. Organization
Pattern Energy Group Inc. (Pattern Energy or the Company) was organized in the state of Delaware on October 2, 2012. Pattern Energy issued 100 shares in October 2012 to Pattern Renewables LP, a 100% owned subsidiary of Pattern Energy Group LP (Pattern Development 1.0) and subsequently in October 2013 conducted an initial public offering. Pattern Energy is an independent energy generation company focused on constructing, owning and operating energy projects with long-term energy sales contracts located in the United States, Canada and Chile. Pattern Development 1.0 owns a 19% interest in the Company. The Pattern Development Companies are leading developers of renewable energy and transmission projects.
The Company consists of the consolidated operations of certain entities and assets contributed by, or purchased principally from, Pattern Development 1.0, except for purchases of Lost Creek, Post Rock and certain additional interests in El Arrayán (each as defined below, which were purchased from third-parties). Each of the Company's wind projects are consolidated into the Company's subsidiaries which are organized by geographic location as follows:
• | Pattern US Operations Holdings LLC (which consists primarily of 100% ownership of Hatchet Ridge Wind, LLC (Hatchet Ridge), Spring Valley Wind LLC (Spring Valley), Pattern Santa Isabel LLC (Santa Isabel), Ocotillo Express LLC (Ocotillo), Pattern Gulf Wind LLC (Gulf Wind) and Lost Creek Wind, LLC (Lost Creek), as well as the following consolidated controlling interest in Pattern Panhandle Wind LLC (Panhandle 1), Pattern Panhandle Wind 2 LLC (Panhandle 2), Post Rock Wind Power Project, LLC (Post Rock), Logan's Gap Wind LLC (Logan's Gap), and Fowler Ridge IV Wind Farm LLC (Amazon Wind Farm Fowler Ridge)); |
• | Pattern Canada Operations Holdings ULC (which consists primarily of 100% ownership of St. Joseph Windfarm Inc. (St. Joseph) and noncontrolling interests in South Kent Wind LP (South Kent), Grand Renewable Wind LP (Grand), K2 Wind Ontario Limited Partnership (K2), and SP Armow Wind Ontario LP (Armow) which are accounted for as unconsolidated investments); and |
• | Pattern Chile Holdings LLC (which includes a controlling interest in Parque Eólico El Arrayán SpA (El Arrayán)). |
2. Summary of Significant Accounting Policies
Basis of Presentation and Principles of Consolidation
The accompanying consolidated financial statements have been prepared in accordance with the accounting principles generally accepted in the United States (U.S. GAAP). They include the results of wholly-owned and partially-owned subsidiaries in which the Company has a controlling interest with all significant intercompany accounts and transactions eliminated.
Use of Estimates
The preparation of financial statements in conformity with U.S. GAAP requires management to make estimates and assumptions that affect the reported amounts of assets and liabilities, disclosures of contingent assets and liabilities at the date of the financial statements, and the reported amounts of revenues and expenses during the reporting period. Actual results could differ from those estimates, and such differences may be material to the consolidated financial statements.
Change in Depreciable Lives of Property, Plant and Equipment
The Company periodically reviews the estimated economic useful lives of its fixed assets. In 2015, based on technical review of various wind farm characteristics, the expected economic useful lives of certain wind farms were longer than the estimated economic useful lives used for depreciation purposes in the Company’s financial statements. As a result, effective January 1, 2015, the Company changed its estimate of the economic useful lives of wind farms for which construction began after 2011, from 20 to 25 years. All other wind farms continue to depreciate over an estimated economic useful life of 20 years.
Reclassification
Certain prior period balances have been reclassified to conform to the current period presentation in the Company’s consolidated financial statements and the accompanying notes.
F-9
The Company has revised its disclosure presentation of the components of deferred tax assets and deferred tax liabilities in Note 13, Income Taxes as of December 31, 2015 to correct immaterial classification errors in its disclosures. These disclosure reclassifications had no impact on the Company's consolidated balance sheets or consolidated statements of operations.
Cash and Cash Equivalents
Cash and cash equivalents consist of cash balances and highly-liquid investments with original maturities of three months or less.
Restricted Cash
Restricted cash consists of cash balances which are restricted as to withdrawal or usage and includes cash to collateralize bank letters of credit related primarily to interconnection rights, power sale agreements (PSA) and for certain reserves required under the Company’s loan agreements.
Reconciliation of Cash and Cash Equivalents and Restricted Cash as presented on the Statements of Cash Flows
Year ended December 31, | ||||||||||||
2016 | 2015 | 2014 | ||||||||||
Beginning | ||||||||||||
Cash and cash equivalents at beginning of period | $ | 94,808 | $ | 101,656 | $ | 103,569 | ||||||
Restricted cash - current | 14,609 | 7,945 | — | |||||||||
Restricted cash | 36,875 | 39,745 | 32,636 | |||||||||
Cash, cash equivalents and restricted cash | 146,292 | 149,346 | 136,205 | |||||||||
Ending | ||||||||||||
Cash and cash equivalents at end of period | 83,932 | 94,808 | 101,656 | |||||||||
Restricted cash - current | 11,793 | 14,609 | 7,945 | |||||||||
Restricted cash | 13,646 | 36,875 | 39,745 | |||||||||
Cash, cash equivalents and restricted cash | 109,371 | 146,292 | 149,346 | |||||||||
Net change in cash, cash equivalents and restricted cash | $ | (36,921 | ) | $ | (3,054 | ) | $ | 13,141 | ||||
Funds Deposited by Counterparty
As a result of a counterparty's credit rating downgrade, the Company received cash collateral related to an energy derivative agreement, as discussed in Note 12, Derivative Instruments. The Company does not have the right to pledge, invest, or use the cash collateral for general corporate purposes. As of December 31, 2016, the Company has recorded a current asset of $43.6 million to funds deposited by counterparty and a current liability of $43.6 million to counterparty deposit liability representing the cash collateral received and corresponding obligation to return the cash collateral, respectively. The cash was deposited into a separate custodial account for which the Company is not entitled to the interest earned on the cash collateral.
Trade Receivables
The Company’s trade receivables are generated by selling energy and renewable energy credits in the California, Texas, Nevada, Manitoba (Canada), Puerto Rico and Chilean energy markets, primarily to creditworthy utilities. The Company believes that all amounts are collectible and an allowance for doubtful accounts is not required as of December 31, 2016 and 2015.
Derivatives
The Company may enter into interest rate swaps, interest rate caps, forwards and other agreements to manage its interest rate, electricity price and foreign exchange rate risk. The Company recognizes its derivative instruments as assets or liabilities at fair value in the consolidated balance sheets, unless the derivative instruments qualify for the "normal purchase normal sale" (NPNS) scope exception to derivative accounting.
F-10
Contracts used in normal business operations that are settled by physical delivery, among other criteria, are eligible for and may be designated as NPNS. NPNS contracts do not meet the definition of derivatives, and therefore, contracts associated with the sale of energy are recognized as electricity sales and contracts associated with the production of electricity are recognized as project expense on the consolidated statements of operations.
The Company does not have contracts subject to master netting agreements with counterparties, as such assets and liabilities are presented gross on the consolidated balance sheets. Accounting for changes in the fair value of a derivative instrument depends on whether it has been designated as part of a hedging relationship and on the type of hedging relationship. For derivative instruments that qualify and are designated as cash flow hedges, the effective portion of change in fair value of the derivative is reported as a component of other comprehensive income (loss) (OCI), and is reclassified into earnings in the same period or periods during which the hedged transaction affects earnings. The ineffective portion of change in fair value is recorded as a component of net income (loss) on the consolidated statements of operations. The Company discontinues hedge accounting when it has determined that a derivative contract no longer qualifies as an effective hedge or when it is no longer probable that the hedged forecasted transaction will occur. When the Company discontinues hedge accounting, associated deferred amounts in other comprehensive income are immediately recognized into earnings and future changes in fair value, if any, are recognized in earnings. For undesignated derivative instruments, the change in fair value is reported as a component of net income (loss) on the consolidated statements of operations.
Fair Value of Financial Instruments
Accounting Standards Codification (ASC) 820, Fair Value Measurement, defines fair value as the price at which an asset could be exchanged or a liability transferred in an orderly transaction between knowledgeable, willing parties in the principal or most advantageous market for the asset or liability. Where available, fair value is based on observable market prices or derived from such prices. Where observable prices or inputs are not available, valuation models are applied which may involve some level of management estimation and judgment, the degree of which is dependent on the price transparency for the instruments or market and the instruments’ complexity. See Note 12, Fair Value Measurement.
Deferred Financing Costs
Financing costs incurred with securing a construction loan are recorded in the Company’s consolidated balance sheets as an offset to the construction loan and amortized over the contractual life of the loan to construction in progress using the effective interest method. Financing costs incurred with securing a term loan are recorded in the Company’s consolidated balance sheets as an offset to the term loan and amortized to interest expense in the Company’s consolidated statements of operations over the contractual life of the loan using the effective interest method. If the term loan has not been drawn on, financing costs incurred with securing the term loan are recorded in the Company’s consolidated balance sheets as an asset.
Financing costs related to a revolving credit facility or a letter of credit facility are recorded in the Company’s consolidated balance sheets as an asset and amortized to interest expense in the Company’s consolidated statements of operations on a straight-line basis over the contractual term of the arrangement.
Reimbursable Interconnection Costs
The Company may, from time to time, pay to construct interconnection network upgrades on behalf of the Company’s utility customers. The interconnection upgrades are owned by each utility customer who will reimburse the Company with interest either when the project reaches commercial operation or as energy is delivered over the life of the Power Purchase Agreement (PPA).
Construction in Progress
Construction in-progress represents the accumulation of project development costs and construction costs, including the costs incurred for the purchase of major equipment such as turbines for which the Company has taken legal title, civil engineering, electrical and other related costs. Other capitalized costs include reclassified deferred development costs, amortization of intangible assets, amortization of deferred financing costs, capitalized interest and other costs required to place a project into commercial operation. Deferred development costs represent the accumulated costs of initial permitting, environmental reviews, land rights and obligations and preliminary design and engineering work. The Company expenses all project development costs until a project is determined to be technically feasible and likely to achieve commercial success. The Company begins capitalizing deferred development costs as a component of construction in progress on the date the project commences construction. Once the project achieves commercial operation, the Company reclassifies the amounts recorded in construction in progress to property, plant and equipment.
F-11
Property, Plant and Equipment
Property, plant and equipment represents the costs of completed and operational projects transferred from construction in progress, as well as other costs incurred for purchasing assets such as land, computer equipment and software, furniture and fixtures, leasehold improvements and other equipment. Property, plant and equipment are stated at cost, less accumulated depreciation. Depreciation is calculated using the straight-line method over the respective assets’ useful lives. Wind farms for which construction began before 2011 are depreciated over 20 years and wind farms for which construction began after 2011 are depreciated over 25 years. The remaining assets are depreciated over two to five years. Improvements to property, plant and equipment deemed to extend the useful economic life of an asset are capitalized. Repair and maintenance costs are expensed as incurred.
U.S. Treasury Grants
The Company received United States Department of the Treasury (U.S. Treasury) grants on certain wind power projects as defined under Section 1603 of the American Recovery and Reinvestment Act of 2009, as amended by the Tax Relief Unemployment Insurance Reauthorization and Job Creation Act of December 2010, upon approval by the U.S. Treasury Department. The Company records the U.S. Treasury grant proceeds as a deduction from the carrying amount of the related asset which results in a reduction of depreciation expense over the life of the asset. The Company records a catch-up adjustment in the period in which the grant is approved to recognize the portion of the grant that proportionally matches the depreciation for the period between the date of placement in service of the wind power project and approval by the U.S. Treasury Department. See Note 4, Property, Plant and Equipment.
Finite-Lived Intangible Assets and Intangible Liability
Finite-lived intangible assets and intangible liability primarily include PPAs, land easements, land options and mining rights. PPAs obtained through acquisitions are valued at the time of acquisition and the difference between the contract price and the estimated fair value results in an intangible asset or an intangible liability. If the contract price is higher than the estimated fair value, the Company will recognize an intangible asset. If the contract price is lower than the estimated fair value, the Company will recognize an intangible liability. Land easements, land options and mining rights are recognized at the carryover basis from the seller as these amounts approximate fair value.
The Company generally amortizes its finite-lived intangible assets and intangible liability using the straight-line method over the remaining term of the related PPA. The Company amortizes land easements, land options and mining rights using the straight-line method over the term of their estimated useful lives, which represents the term of the land easements and land option and mining rights agreements, ranging from approximately 5-25 years. The Company periodically evaluates whether events or changes in circumstances have occurred that indicate the carrying amount of finite-lived intangible assets may not be recoverable, or information indicates that impairment may exist.
Accounting for Impairment of Long-Lived Assets
The Company periodically evaluates long-lived assets for potential impairment whenever events or changes in circumstances have occurred that indicate that impairment may exist, or the carrying amount of the long-lived asset may not be recoverable. An impairment loss is recognized only if the carrying amount of a long-lived asset is not recoverable based on its estimated future undiscounted cash flows. An impairment loss is calculated based on the excess of the carrying value of the long-lived asset over the fair value of such long-lived asset, with the fair value determined based on an estimate of discounted future cash flows. During the years ended December 31, 2016 and 2015 the Company recorded impairment charges of $0.4 million and $0.4 million, respectively related to the write-off of certain furniture, fixtures and equipment in project expenses in the consolidated statements of operations.
F-12
Variable Interest Entities
In February 2015, the Financial Accounting Standards Board (FASB) issued an accounting standards update that modified consolidation guidance. The standard makes changes to both the variable interest entity model and the voting interest entity model, including modifying the evaluation of whether limited partnerships or similar legal entities are variable interest entities (VIEs) or voting interest entities (VOEs) and amending the guidance for assessing how relationships of related parties affect the consolidation analysis of VIEs. The standard was effective for the Company beginning January 1, 2016. The adoption of the standard did not result in any changes to the previous consolidation conclusions; however, it did result in a limited number of entities being considered VIEs and the related disclosure requirements are included in these consolidated financial statements.
VIEs are entities that lack one or more of the characteristics of a voting interest entity. The Company has a controlling financial interest in a VIE when its variable interest or interests provide it with (i) the power to direct the activities of the VIE that most significantly impact the VIE’s economic performance and (ii) the obligation to absorb losses of the VIE or the right to receive benefits from the VIE that could potentially be significant to the VIE.
VOEs are entities in which (i) the total equity investment at risk is sufficient to enable the entity to finance its activities independently and (ii) the equity holders have the power to direct the activities of the entity that most significantly impact its economic performance, the obligation to absorb the losses of the entity and the right to receive the residual returns of the entity. The usual condition for a controlling financial interest in a voting interest entity is ownership of a majority voting interest. If the Company has a majority voting interest in a voting interest entity, the entity is consolidated.
ASC 810, Consolidation (ASC 810), defines the criteria for determining the existence of VIEs and provides guidance for consolidation. The Company consolidates VIEs where the Company is the primary beneficiary. The primary beneficiary of a VIE is the party that has the power to direct the activities that most significantly impact the performance of the entity and the obligation to absorb losses or the right to receive benefits that could potentially be significant to the entity. Investments or joint ventures in which the Company does not have a majority ownership interest, does not give the Company the ability to exercise significant influence and are not VIEs for which the Company is considered the primary beneficiary are accounted for using the equity method. These amounts are included in unconsolidated investments in the consolidated balance sheets.
Acquisitions
Business Combinations
The Company accounts for its business combinations by recognizing the identifiable assets acquired, the liabilities assumed, and any non-controlling interest in the acquiree at the acquisition date. The purchase is accounted for using the acquisition method, and the fair value of purchase consideration is allocated to the tangible and intangible assets acquired and the liabilities assumed, based on their estimated fair values. Contingent consideration is also recognized and measured at fair value as of the acquisition date. The excess, if any, of the fair value of the purchase consideration over the fair values of the identifiable net assets is recorded as goodwill. Conversely, the excess, if any, of the net fair values of the identifiable net assets over the fair value of the purchase consideration is recorded as a gain. Such valuations require management to make significant estimates and assumptions, especially with respect to intangible assets. These estimates and assumptions are inherently uncertain, and as a result, actual results may differ from estimates. Significant estimates include, but are not limited to, future expected cash flows, useful lives and discount rates. During the measurement period, which is one year from the acquisition date, we may record adjustments to the assets acquired and liabilities assumed, with a corresponding offset to either goodwill or gain, depending on whether the fair value of purchase consideration is in excess of or less than net assets acquired. Upon the conclusion of the measurement period, any subsequent adjustments are recorded to earnings. Transaction costs associated with business combinations are expensed as incurred.
Asset Acquisitions
When the Company acquires assets and liabilities that do not constitute a business, the fair value of the purchase consideration, including the transaction costs of the asset acquisition, is assumed to be equal to the fair value of the net assets acquired. The purchase consideration, including the transaction costs, is allocated to the individual assets and liabilities assumed based on their relative fair values. Contingent consideration associated with the acquisition is generally recognized only when the contingency is resolved. No goodwill is recognized in an asset acquisition. Transaction costs associated with asset acquisitions are capitalized as part of the costs of the group of assets acquired.
F-13
Equity Method Investments
When the Company acquires a noncontrolling interest in an entity where it is not the primary beneficiary, does not control any of the ongoing activities of the entity, and does not meet consolidation requirements of Accounting Standards Codification (ASC) 810 and Accounting Standards Update (ASU) 2015-02, the investment is initially recognized as an equity method investment at cost. Any difference between the cost of an investment and the amount of underlying equity in net assets of an investee are considered basis differences. Basis differences related to the property, plant and equipment will be amortized over the estimated economic useful life of the underlying long-lived assets while basis differences related to the PPA will be amortized over the remaining term of the PPA. Transactions costs associated with equity method investments are included in the investment.
When the Company receives distributions in excess of the carrying value of its investment, and the Company is not liable for the obligations of the investee nor otherwise committed to provide financial support, the Company recognizes such excess distributions as equity method earnings in the period the distributions occur. Additionally, when the Company's carrying value in an unconsolidated investment is zero and the Company is not liable for the obligations of the investee nor otherwise committed to provide financial support, the Company will not recognize equity in earnings (losses) or equity in other comprehensive income of unconsolidated investments. When the investee subsequently reports income, the Company does not record its share of such income until it equals the amount of distributions in excess of the carrying value that were previously recognized in income and previously unrecognized losses. During the years ended December 31, 2016, 2015 and 2014, the Company had no such obligations, commitments or requirements to provide additional funding to its unconsolidated investments.
As a result, equity income or loss reported on the Company's income statement for certain unconsolidated investments may differ from a mathematical calculation of net income or loss attributable to the Company's equity interest based upon the factor of its equity interest and the net income or loss attributable to equity owners as shown on investee companies' income statements.
To the extent that cumulative comprehensive income exceeds cumulative distributions received, the Company records the distribution as distributions from unconsolidated investments on the Company's consolidated statements of cash flows within operating cash flows. All other distributions are recorded as distributions from unconsolidated investments on the Company's consolidated statements of cash flows within investing activities.
Noncontrolling Interests
Noncontrolling interests represent the portion of the Company’s net income (loss), net assets and comprehensive income (loss) that is not allocable to the Company and is calculated based on ownership percentage, for applicable projects.
For the noncontrolling interests in the Company’s Panhandle 1, Panhandle 2, Post Rock, Logan's Gap and Amazon Wind Farm Fowler Ridge projects, and the Company's Gulf Wind project prior to the acquisition of the noncontrolling interests in July 2015, the Company has determined that the operating partnership agreements do not allocate economic benefits pro rata to its two classes of investors and the appropriate methodology for calculating the noncontrolling interest balance that reflects the substantive profit sharing arrangement is a balance sheet approach using the hypothetical liquidation at book value (HLBV) method.
Under the HLBV method, the amounts reported as noncontrolling interest in the consolidated balance sheets and consolidated statements of operations represent the amounts the third party would hypothetically receive at each balance sheet reporting date under the liquidation provisions of the operating partnership agreement assuming the net assets of the projects were liquidated at recorded amounts determined in accordance with U.S. GAAP and distributed to the investors. The noncontrolling interest in the results of operations and comprehensive income (loss) is determined as the difference in noncontrolling interests in the consolidated balance sheets at the start and end of each reporting period, after taking into account any capital transactions between the projects and the third party. The noncontrolling interest balances in the projects are reported as a component of equity in the consolidated balance sheets.
Asset Retirement Obligation
The Company records asset retirement obligations (AROs) for the estimated costs of decommissioning turbines, removing above-ground installations and restoring sites, at the time when a contractual decommissioning obligation is incurred. AROs represent the present value of the expected costs and timing of the related decommissioning activities. The ARO assets and liabilities are recorded in property, plant and equipment and other long-term liabilities, respectively, in the consolidated balance sheets. The Company records accretion expense, which represents the increase in the asset retirement obligations, over the remaining or operational life of the associated wind project. Accretion expense is recorded as cost of revenue in the consolidated statements of operations using accretion rates based on credit adjusted risk-free interest rates. Changes resulting from revisions to the timing or amount of the original estimate of cash flows are recognized as an increase or a decrease in the asset retirement cost, or income when the asset retirement cost is depleted.
F-14
Contingent Liabilities
The Company’s contingent liabilities represent deferred and contingent obligations recognized in accordance with ASC 450, Contingencies (ASC 450) related to projects either acquired through business combinations or asset acquisitions. Contingent obligations that are acquired through business combinations are recorded at fair value on the date of acquisition while contingent obligations that are acquired through asset acquisitions are recorded when the contingency is resolved. The Company’s contingent liabilities related to turbine availability warranties with turbine manufacturers and turbine availability guarantees associated with long-term turbine service arrangements are reported at net realizable value. Pursuant to these warranties and guarantees, if a turbine operates at less than minimum availability during the warranty or guarantee period, the manufacturer or service provider is obligated to pay, as liquidated damages, an amount for each percent that the turbine operates below the minimum availability threshold at the end of the warranty period. However, the Company does not recognize liquidated damages that remain contingent until the end of the warranty period. In addition, pursuant to certain of these warranties and guarantees, if a turbine operates at more than a specified availability during the warranty or guarantee period, the Company has an obligation to pay a bonus to the turbine manufacturer or service provider at the end of the warranty period. The Company records contingent liabilities at each reporting period associated with these bonuses expected to be paid at the end of the warranty period.
Concentrations of Credit Risk
Financial instruments that potentially subject the Company to concentrations of credit risk consist primarily of cash and cash equivalents, trade receivables, reimbursable interconnection costs and derivative instruments. The Company’s cash and cash equivalents are with high quality institutions. The Company has exposure to credit risk to the extent cash and cash equivalent balances, including restricted cash, exceed amounts covered by federal deposit insurance; however, the Company believes that its credit risk is immaterial. In addition, reimbursable interconnection costs are with large creditworthy utility companies and the Company’s derivative instruments are placed with counterparties that are creditworthy institutions.
The Company sells electricity and renewable energy credits (RECs) primarily to creditworthy utilities under long-term, fixed-priced PSAs. During the year ended December 31, 2016, Standard & Poor’s Rating Services further downgraded the credit rating of the Puerto Rico Electric Power Authority (PREPA) from CC to D. Through December 31, 2016, Moody’s Investor Service’s credit rating of PREPA remains unchanged at Caa3. As of February 24, 2017, PREPA was current with respect to payments due under the PPA and the next payment will be due from PREPA under the PPA on approximately March 22, 2017.
The table below presents significant customers who accounted for greater than 10% of total revenue and PREPA, and the related maximum amount of credit loss based on their percentages of total trade receivables as of December 31, 2016, 2015 and 2014:
Year ended December 31, | |||||||||||||||||
2016 | 2015 | 2014 | |||||||||||||||
Revenue | Trade Receivables | Revenue | Trade Receivables | Revenue | Trade Receivables | ||||||||||||
San Diego Gas & Electric | 14.6 | % | 5.1 | % | 17.1 | % | 16.6 | % | 22.1 | % | 14.1 | % | |||||
Morgan Stanley Capital Group Inc. | 10.9 | % | 4.4 | % | 5.9 | % | 7.8 | % | — | % | — | % | |||||
PREPA | 6.0 | % | 6.1 | % | 8.4 | % | 8.6 | % | 9.3 | % | 6.9 | % | |||||
Revenue Recognition
The Company sells electricity and related RECs under the terms of PSAs, PPAs or at market prices. Revenue is recognized based upon the amount of electricity delivered at rates specified under the contracts, or at market prices for spot market transactions, assuming all other revenue recognition criteria are met. When renewable energy credits are sold as a separate component, revenue is recognized at the time title to the energy credits is transferred to the buyer. Depending on the terms of the PSA, the Company may account for the contracts as operating leases pursuant to ASC 840, Leases (ASC 840), or derivative instruments pursuant to ASC 815, Derivatives and Hedging (ASC 815). In considering ASC 840, it was determined that certain of the Company's PPAs are operating leases. ASC 840, requires minimum lease payments to be recognized over the term of the lease and contingent rents to be recorded when the achievement of the contingency becomes probable. All energy sales under the PPAs, which are considered leases, are contingent rent due to the inherent uncertainty and variability associated with a fuel source (i.e., wind) that is outside the control of the parties to the PPA. None of the operating leases have minimum lease payments; therefore, revenue from these contracts and any related renewable energy attributes are recognized as electricity sales when delivered. Contingent rents for the years ending December 31, 2016, 2015 and 2014 were $259.4 million, $242.2 million and $205.2 million, respectively. Contracts that meet the NPNS scope exception to derivative accounting are accounted for under the accrual method, where revenues are recorded in the period they are earned.
F-15
Energy derivative instruments that reduce exposure to changes in commodity prices may allow the Company to lock in a fixed price per megawatt hour (MWh) for a specified amount of annual electricity generation over the life of the swap contract. Monthly settlement amounts under energy hedges are accounted for as energy derivative settlements in the consolidated statements of operations. Changes in the fair value of energy hedges are recorded in electricity sales in the consolidated statements of operations.
The Company recognizes revenue for warranty settlements in other revenue upon resolution of outstanding contingencies. Any cash receipts for amounts subject to future adjustment or repayment are deferred in other liabilities until the final settlement amount is considered fixed and determinable.
Cost of Revenue
The Company’s cost of revenue is comprised of direct costs of operating and maintaining its wind project facilities, including labor, turbine service arrangements, land lease royalties, depreciation, accretion, property taxes and insurance.
Stock-Based Compensation
The Company accounts for stock-based compensation related to stock options granted to employees by estimating the fair value of the stock-based awards using the Black-Scholes option-pricing model. The Black-Scholes option pricing model includes assumptions regarding dividend yields, expected volatility, expected option term, and risk-free interest rates. Expense is recognized by amortizing the fair value of the stock options granted using a straight-line method over the applicable vesting period; accordingly, stock-based compensation is netted for estimated forfeitures. The Company estimates expected volatility based on the historical volatility of comparable publicly traded companies for a period that is equal to the expected term of the options. The risk-free interest rate is based on the U.S. treasury yield curve in effect at the time of grant for a period commensurate with the estimated expected term of the stock option. The expected term of options granted is derived using the "simplified" method as allowed under the provisions of the ASC 718, Compensation—Stock Compensation, and represents the period of time that options granted are expected to be outstanding.
The Company accounts for stock-based compensation related to restricted stock award grants and restricted stock unit grants by amortizing the fair value of the restricted stock award grants, which is the grant date market price, over the applicable vesting period. For certain restricted stock award grants, the Company measures the fair value at the grant date using a Monte Carlo simulation model and amortizes the fair value over the longer of the requisite period or performance period. The Monte Carlo simulation model includes assumptions regarding dividend yields, expected volatility, risk-free interest rates and initial total shareholder return (TSR) performance.
Stock-based compensation expense is recorded as a component of general and administrative expenses in the Company’s consolidated statements of operations.
Income Taxes
The Company accounts for income taxes under the asset and liability method, which requires the recognition of deferred tax assets and liabilities for the expected future tax consequences of events that have been included in the financial statements. Under this method, deferred tax assets and liabilities are determined on the basis of the differences between the financial statement and tax basis of assets and liabilities using enacted tax rates in effect for the year in which the differences are expected to reverse. The effect of a change in tax rates on deferred tax assets and liabilities is recognized in income in the period that includes the enactment date. The Company recognizes deferred tax assets to the extent that it believes these assets are more likely than not to be realized. In making such a determination, the Company considers all available positive and negative evidence, including future reversals of existing taxable temporary differences, projected future taxable income, tax-planning and results of recent operations. If the Company determines that it would be able to realize its deferred tax assets in the future in excess of their net recorded amount, it would make an adjustment to the deferred tax asset valuation allowance, which would reduce the provision for income taxes. The Company records uncertain tax positions in accordance with ASC 740, Income Taxes, on the basis of a two-step process whereby (1) it determines whether it is more likely than not that the tax positions will be sustained on the basis of the technical merits of the position and (2) for those tax positions that meet the more-likely-than-not recognition threshold, it recognizes the largest amount of tax benefit that is more than 50% likely to be realized upon ultimate settlement with the related tax authority. The Company has a policy to classify interest and penalties associated with uncertain tax positions together with the related liability, and the expenses incurred related to such accruals, if any, are included in the provision for income taxes.
F-16
Comprehensive Income (Loss)
Comprehensive income (loss) consists of net income (loss) and other comprehensive income (loss), net of tax. Other comprehensive income (loss), net of tax included in accumulated other comprehensive income (loss) in the consolidated statements of stockholders’ equity, is comprised primarily of changes in foreign currency translation adjustments and the effective portion of changes in the fair value of derivatives designated as cash flow hedges.
Foreign Currency Translation
The assets and liabilities of foreign subsidiaries, where the local currency is the functional currency, are translated from their respective functional currencies into U.S. dollars at the rates in effect at the balance sheet date and revenue and expense amounts are translated at average rates during the period, with resulting foreign currency translation adjustments recorded in other comprehensive income (loss), net of tax, in the consolidated statements of stockholders’ equity and comprehensive income (loss). Where the U.S. dollar is the functional currency, re-measurement adjustments are recorded in other (expense) income, net in the accompanying consolidated statements of operations.
Segment Data and Geographic Information
Segment data
Operating segments are defined as components of a company about which separate financial information is available that is evaluated regularly by the chief operating decision maker in deciding how to allocate resources and in assessing performance. The Company’s chief operating decision maker is the chief executive officer. Based on the financial information presented to and reviewed by the chief operating decision maker in deciding how to allocate the resources and in assessing the Company’s performance, the Company has determined its wind projects represent individual operating segments with similar economic characteristics that meet the criteria for aggregation into a single reporting segment for financial statement purposes.
Geographic information
The table below provides information, by country, about the Company’s consolidated operations. Revenue is recorded in the country in which it is earned and assets are recorded in the country in which they are located (in thousands):
Revenue | Property, Plant and Equipment, net | |||||||||||||||||||
Year ended December 31, | December 31, | |||||||||||||||||||
2016 | 2015 | 2014 | 2016 | 2015 | ||||||||||||||||
United States | $ | 285,187 | $ | 258,542 | $ | 201,408 | $ | 2,652,122 | $ | 2,791,259 | ||||||||||
Canada | 39,207 | 39,178 | 46,593 | 177,093 | 184,115 | |||||||||||||||
Chile | 29,658 | 32,111 | 17,492 | 305,947 | 319,246 | |||||||||||||||
Total | $ | 354,052 | $ | 329,831 | $ | 265,493 | $ | 3,135,162 | $ | 3,294,620 | ||||||||||
Recently Adopted Accounting Standards
In November 2016, the FASB issued ASU 2016-18, Statement of Cash Flows (Topic 230): Restricted Cash (ASU 2016-18), which requires that a statement of cash flows explain the change during the period in the total of cash, cash equivalents, and amounts generally described as restricted cash or restricted cash equivalents. As a result, amounts generally described as restricted cash and restricted cash equivalents should be included with cash and cash equivalents when reconciling the beginning-of-period and end-of-period total amounts shown on the statement of cash flows. The amendments do not provide a definition of restricted cash or restricted cash equivalents. The Company elected to early adopt the provisions of ASU 2016-18 as of December 31, 2016 and has revised its consolidated statements of cash flows for the years ended December 31, 2015 and 2014 to reflect amounts described as restricted cash and restricted cash equivalents included with cash and cash equivalents in the reconciliation of beginning of period and end of period total amounts shown on the consolidated statements of cash flows. Consequently, transfers between cash and restricted cash will not be presented as a separate line item in the operating, investing or financing sections of the cash flow statement. A reconciliation of cash and cash equivalents and restricted cash as presented on the consolidated balance sheets to the consolidated statements of cash flows is included in the significant accounting policies above.
F-17
In August 2016, the FASB issued ASU 2016-15, Statement of Cash Flows (Topic 230): Classification of Certain Cash Receipts and Cash Payments (ASU 2016-15), which provides guidance on specific cash flow issues. ASU 2016-15 is effective for fiscal years beginning after December 15, 2017, and interim periods within those fiscal years. Early adoption is permitted, including adoption in an interim period. The adoption of ASU 2016-15 during the third quarter of fiscal 2016 did not have a material impact on the Company’s consolidated financial statements and related disclosures.
In March 2016, the FASB issued ASU 2016-05, Derivatives and Hedging (Topic 815): Effect of Derivative Contract Novations on Existing Hedge Accounting Relationships (ASU 2016-05), which clarifies that a change in the counterparty to a derivative instrument that has been designated as the hedging instrument does not, in and of itself, require dedesignation of that hedging relationship provided that all other hedge accounting criteria remain intact. ASU 2016-05 is effective for annual periods beginning after December 15, 2017, including interim reporting periods therein, with early adoption permitted. The Company early adopted ASU 2016-05. The adoption of ASU 2016-05 on January 1, 2016 had no impact on the Company's consolidated financial statements and related disclosures.
In September 2015, the FASB issued ASU 2015-16, Business Combinations: Simplifying the Accounting for Measurement-Period Adjustments (ASU 2015-16), which requires an acquirer to recognize adjustments to provisional amounts that are identified during the measurement period in the reporting period in which the adjustment amounts are determined. The amendments under ASU 2015-16 require that the acquirer record, in the same period's financial statements, the effect on earnings of changes in depreciation, amortization, or other income effects, if any, as a result of the change to the provisional amounts, calculated as if the accounting had been completed at the acquisition date. ASU 2015-16 also requires an entity to present separately on the face of the income statement or disclose in the notes the portion of the amount recorded in current-period earnings by line item that would have been recorded in previous reporting periods, if the adjustment to the provisional amounts had been recognized as of the acquisition date. ASU 2015-16 was effective for annual reporting periods beginning after December 15, 2015 and interim periods within those fiscal years. The amendments in this update should be applied prospectively to adjustments to provisional amounts that occur after the effective date with earlier application permitted for financial statements that have not been issued. The adoption of ASU 2015-16 on January 1, 2016 did not have a material impact on the Company’s consolidated financial statements and related disclosures.
In August 2014, the FASB issued ASU 2014-15, Presentation of Financial Statements Going Concern: Disclosure of Uncertainties about an Entity’s Ability to Continue as a Going Concern (ASU 2014-15) which requires an entity’s management to evaluate whether there is substantial doubt about the entity’s ability to continue as a going concern and to provide related footnote disclosures. ASU 2014-15 is effective for interim and annual periods ending after December 15, 2016, with early adoption permitted for interim and annual reporting periods for which the financial statements have not been previously issued. The adoption of ASU 2014-15 on December 31, 2016 had no impact on the Company’s consolidated financial statements and related disclosures.
In June 2014, the FASB issued ASU 2014-12, Compensation – Stock Compensation (ASU 2014-12) which requires an entity to treat a performance target that affects vesting that could be achieved after an employee completes the requisite service period as a performance condition. The performance target should not be reflected in estimating the grant-date fair value of the award. Compensation cost should be recognized in the period in which it becomes probable that the performance target will be achieved and should represent the compensation cost attributable to the period(s) for which the requisite service has already been rendered. If the performance target becomes probable of being achieved before the end of the requisite service period, the remaining unrecognized compensation cost should be recognized prospectively over the remaining requisite service period. The total amount of compensation cost recognized during and after the requisite service period should reflect the number of awards that are expected to vest and should be adjusted to reflect those awards that ultimately vest. The requisite service period ends when the employee can cease rendering service and still be eligible to vest in the award if the performance target is achieved. ASU 2014-12 is effective for interim and annual periods beginning after December 15, 2015, with early adoption permitted either prospectively or retrospectively to all prior periods presented. The adoption of ASU 2014-12 on January 1, 2016 did not have a material impact on the Company's consolidated financial statements and related disclosures.
Recently Issued Accounting Standards Not Yet Adopted
In February 2017, the FASB issued ASU 2017-05, Other Income-Gains and Losses from the Derecognition of Nonfinancial Assets (Subtopic 610-20): Clarifying the Scope of Asset Derecognition Guidance and Accounting for Partial Sales of Nonfinancial Assets (ASU 2017-05). This ASU is meant to clarify the scope of ASC Subtopic 610-20, Other Income-Gains and Losses from the Derecognition of Nonfinancial Assets and to add guidance for partial sales of nonfinancial assets. ASU 2017-05 is to be applied using a full retrospective method or a modified retrospective method as outlined in the guidance and is effective at the same time as ASU 2014-09. Further, the Company is required to adopt ASU 2017-05 at the same time that it adopts the guidance in ASU 2014-09. The Company is currently assessing the future impact of this update on its consolidated financial statements and related disclosures.
In January 2017, the FASB issued ASU 2017-03, Amendments to SEC Paragraphs Pursuant to Staff Announcements (ASU 2017-03). The amendment provides guidance to the Company in relation to the disclosure of the impact that ASU 2014-09, ASU 2016-02 and ASU
F-18
2016-13 will have on the Company’s financial statements when adopted. Specifically, registrants should consider additional qualitative disclosures if the impact of an issued but not yet adopted ASU is unknown or cannot be reasonably estimated and to include a description of the effect of the accounting policies that the registrant expects. The Company has implemented this guidance within its current disclosures.
In January 2017, the FASB issued ASU 2017-01, Clarifying the Definition of a Business (ASU 2017-01), which provides a screen to determine when a set is not a business. The screen requires that when substantially all of the fair value of the gross assets acquired (or disposed of) is concentrated in a single identifiable asset or a group of similar identifiable assets, the set is not a business. This screen reduces the number of transactions that need to be further evaluated. ASU 2017-01 is effective for annual periods beginning after December 15, 2017, including interim periods within those periods. Early application of this ASU is allowed for transactions for which the acquisition date occurs before the issuance date or effective date of this amendment, only if the transaction has not been reported in previously issued financial statements. Early application of this ASU is also permitted for transactions in which a subsidiary is deconsolidated or a group of assets is derecognized that occur before the issuance date or effective date of the amendments, only if the transaction has not been reported in previously issued financial statements. The amendments should be applied prospectively on or after the effective date and no disclosures are required at transition. The Company is currently assessing the future impact of this update on its consolidated financial statements and related disclosures.
In June 2016, the FASB issued ASU 2016-13, Financial Instruments —Credit Losses (Topic 326): Measurement of Credit Losses on Financial Instruments (ASU 2016-13), which requires the measurement of all expected credit losses for financial assets including trade receivables held at the reporting date based on historical experience, current conditions, and reasonable and supportable forecasts. ASU 2016-13 is effective for fiscal years, and interim periods within those fiscal years, beginning after December 15, 2019. The adoption of ASU 2016-13 is not expected to have a material impact on its consolidated financial statements and related disclosures.
In March 2016, the FASB issued ASU 2016-09, Compensation-Stock Compensation (Topic 718): Improvements to Employee Share-Based Payment Accounting (ASU 2016-09), which simplifies several aspects of the accounting for share-based payment award transactions, including the income tax consequences, classification of awards as either equity or liabilities, and classification on the statement of cash flows. ASU 2016-09 is effective for annual periods beginning after December 15, 2016, and interim periods within those annual periods. The Company adopted ASU 2016-09, effective January 1, 2017. The adoption of ASU 2016-09 did not have a material impact on the Company’s consolidated financial statements and related disclosures.
In February 2016, the FASB issued ASU 2016-02, Leases, (ASU 2016-02) which requires lessees to recognize right-of-use assets and lease liabilities, for all leases, with the exception of short-term leases, at the commencement date of each lease. Under the new guidance, lessor accounting is largely unchanged. ASU 2016-02 simplifies the accounting for sale and leaseback transactions primarily because lessees must recognize lease assets and liabilities. ASU 2016-02 is effective for annual periods beginning after December 15, 2018, and interim periods within those annual periods. Early adoption is permitted. The amendments of this update should be applied using a modified retrospective approach, which requires lessees and lessors to recognize and measure leases at the beginning of the earliest period presented. The Company is in the initial stages of evaluating the impact of the new standard on its accounting policies, processes and system requirements. The Company has assigned internal resources in addition to the engagement of a third party service provider to assist in evaluation. The Company is also assessing the accounting impact of the ASU 2016-02 as it applies to its PPAs, land leases, office leases and equipment leases. As the Company progresses further in its analysis, the scope of this assessment could be expanded to review other types of contracts.
In May 2014, the FASB issued a new standard, ASU 2014-09, which creates ASC Topic 606, Revenue from Contracts with Customers and supersedes ASC Topic 605, Revenue Recognition (ASU 2014-09). The new standard replaces industry-specific guidance and establishes a single five-step model to identify and recognize revenue. The core principle of the new standard is that an entity should recognize revenue upon transfer of control of promised goods or services to customers in an amount that reflects the consideration to which an entity expects to be entitled in exchange for those goods or services. Additionally, the new standard requires the entity to disclose further quantitative and qualitative information regarding the nature and amount of revenues arising from contracts with customers, as well as other information about the significant judgments and estimates used in recognizing revenues from contracts with customers. In March 2016, the FASB issued ASU 2016-08, Revenue from Contracts with Customers (Topic 606) Principal versus Agent Considerations (Reporting Revenue Gross versus Net), which clarifies how to apply the implementation guidance on principal versus agent considerations related to the sale of goods or services to a customer as updated by ASU 2014-09. In April 2016, the FASB issued ASU 2016-10, Revenue from Contracts with Customers (Topic 606) Identifying Performance Obligations and Licensing, which clarifies two aspects of Topic 606: identifying performance obligations and the licensing implementation guidance, while retaining the related principles for those areas, as updated by ASU 2014-09. In May 2016, the FASB issued ASU 2016-12, Revenue from Contracts with Customers (Topic 606): Narrow-Scope Improvements and Practical Expedients (ASU 2016-12), which makes narrow scope amendments to Topic 606 including implementation issues on collectability, non-cash consideration and completed contracts at transition. In December 2016, the FASB issued ASU 2016-20, Technical Corrections and Improvements to Topic 606, "Revenue from Contracts with Customers" (ASU 2016-20), which
F-19
make additional narrow scope amendments to Topic 606 including loan guarantee fees, impairment testing of contract costs, provisions for losses on construction-type and production-type contracts.
The new standard permits adoption by either using (i) the full retrospective approach for all periods presented in the period of adoption or (ii) a modified retrospective approach with the cumulative effect of initially applying the new standard recognized at the date of initial application and providing certain additional disclosures. The new standard is effective for annual reporting periods beginning after December 15, 2017, with early adoption permitted for annual reporting periods beginning after December 15, 2016. The Company does not plan to early adopt, and accordingly, will adopt the new standard effective January 1, 2018.
The Company currently plans to adopt using the modified retrospective approach. However, a final decision regarding the adoption method had not been finalized at this time. The Company's final determination will depend on a number of factors, such as the significance of the impact of the new standard on its financial results and its ability to analyze the information necessary to assess the impact on its prior period consolidated financial statements, as necessary.
The Company is in the initial stages of evaluating the impact of the new standard on its accounting policies, processes and system requirements. The Company has assigned internal resources in addition to the engagement of a third party service provider to assist in evaluation. The Company is also assessing the accounting impact of the new standard as it applies certain elements of its revenue arrangements such as contracts that contain the sale of electricity and related renewable energy credits, contracts that contain volume variability, and contracts that contain modification clauses. As the Company progresses further in its analysis, the scope of this assessment could be expanded to include other contract elements that could have an accounting impact under the new standard.
The Company continues to assess the potential impacts of the new standard and cannot reasonably estimate quantitative information related to the impact of the new standard on its consolidated financial statements at this time.
3. Acquisitions
Business Combinations
Wind Capital Group Acquisition
On May 15, 2015, pursuant to a Purchase and Sale Agreement, the Company acquired 100% of the membership interests in Lost Creek Wind Finco, LLC (Lost Creek Finco) from Wind Capital Group LLC, an unrelated third party, and 100% of the membership interests in Lincoln County Wind Project Holdco, LLC (Lincoln County Holdco) from Lincoln County Wind Project Finco, LLC, an unrelated third party. Lost Creek Finco owns 100% of the Class B membership interests in Lost Creek Wind Holdco, LLC (Lost Creek Wind Holdco), a company which owns a 100% interest in the Lost Creek wind project. Lincoln County Holdco owns 100% of the Class B membership interests in Post Rock Wind Power Project, LLC, a company which owns a 100% interest in the Post Rock wind project. The acquisition of 100% of the membership interests in Lost Creek Finco and Lincoln County Holdco was for an aggregate consideration of approximately $242.0 million, paid at closing. The Company also assumed certain project level indebtedness and ordinary course performance guarantees securing project obligations. Lost Creek is a 150 megawatt (MW) wind project in King City, Missouri, and Post Rock is a 201MW wind project in Ellsworth and Lincoln Counties, Kansas.
The Company acquired assets and operating contracts for Lost Creek and Post Rock, including assumed liabilities. The identifiable assets and liabilities assumed were recorded at their fair values, which corresponded to the sum of the cash purchase price and the fair value of the other investors’ noncontrolling interests.
F-20
The accounting for the Lost Creek and Post Rock acquisition was completed as of March 31, 2016 at which point the fair values became final. The fair value of the assets acquired and liabilities assumed in connection with the acquisition are as follows (in thousands):
May 15, 2015 | |||
Cash and cash equivalents | $ | 3,501 | |
Restricted cash, current | 11,787 | ||
Trade receivables | 7,910 | ||
Prepaid expenses | 1,232 | ||
Other current assets | 444 | ||
Restricted cash | 4,592 | ||
Property, plant and equipment | 543,347 | ||
Finite-lived intangible assets | 97,400 | ||
Other assets | 17,632 | ||
Accounts payable and other accrued liabilities | (2,611 | ) | |
Accrued interest | (951 | ) | |
Derivative liabilities, current | (3,759 | ) | |
Current portion of long-term debt, net of financing costs | (7,463 | ) | |
Finite-lived intangible liabilities | (60,300 | ) | |
Asset retirement obligations | (7,192 | ) | |
Long-term debt, net of financing costs | (108,838 | ) | |
Derivative liabilities | (14,631 | ) | |
Total consideration before temporary equity and noncontrolling interests | 482,100 | ||
Less: temporary equity | (35,000 | ) | |
Less: noncontrolling interests | (205,100 | ) | |
Total consideration after temporary equity and noncontrolling interests | $ | 242,000 | |
Current assets, non-current restricted cash, accounts payable and other accrued liabilities and accrued interest were recorded at carrying value, which is representative of the fair value on the date of acquisition. Property, plant and equipment, finite-lived intangible asset, finite-lived intangible liability and debt were recorded at fair value estimated using the income approach. The fair values of other assets, derivatives and asset retirement obligations were recorded at fair value using a combination of market data, operational data and discounted cash flows and were adjusted by a discount rate factor reflecting current market conditions at the time of acquisition.
The noncontrolling interest in Post Rock was recorded at fair value estimated using a projected cash flow stream of distributable cash and tax benefits anticipated based on the existing Partnership Agreement, discounted to present value with a discount rate reflecting the estimated return on investment required by participants in the tax equity market. The noncontrolling interest in Lost Creek was recorded at fair value estimated using the purchase price from a purchase agreement executed on May 15, 2015 between the Company and the tax equity investor.
The Company incurred transaction-related expenses of $1.7 million which were recorded in net gain (loss) on transactions in the consolidated statements of operations for the year ended December 31, 2015.
On July 30, 2015, the Company acquired 100% of the Class A membership interests in Lost Creek Wind Holdco for a cash purchase price of approximately $35.2 million. As a result, Lost Creek became wholly owned as of July 30, 2015.
The Company has determined that the operating partnership agreement does not allocate economic benefits pro rata to its two classes of investors and will use the HLBV method to calculate the noncontrolling interest balance that reflects the substantive profit sharing arrangement.
Logan’s Gap Acquisition
On December 19, 2014, the Company acquired 100% of the membership interests in the Logan’s Gap wind project, through the acquisition of Logan’s Gap B Member LLC, from Pattern Development 1.0, for a purchase price of approximately $15.1 million and an assumed contingent liability to a third party in the amount of $8.0 million associated with the close of construction financing and the achievement of either commercial operation or tax equity funding. The wind project achieved commercial operation in September 2015, and is located in Comanche County, Texas. The construction of the project was being financed primarily by construction debt and the Company. Following construction, the institutional tax equity investors invested in the project, pursuant to an executed equity commitment agreement,
F-21
so that the construction loan was paid and that long term financing for the project is equity based. Following the achievement of commercial operation, in September 2015, the Company and certain tax equity investors made capital contributions to fund the repayment of the Logan's Gap construction loan. As a result, the Company and the tax equity investors hold initial ownership interests of 82% and 18%, respectively, in the project’s distributable cash flows.
The Company acquired the assets and operating contracts for Logan’s Gap, including assumed liabilities. The identifiable assets acquired and liabilities assumed were recorded at their fair values which corresponded to the sum of the cash purchase price.
The accounting for the Logan’s Gap acquisition was completed as of March 31, 2015 at which point the fair values became final. The following table summarizes the provisional amounts recognized for assets acquired and liabilities assumed as of December 19, 2014, as well as adjustments made through March 31, 2015, when the allocation became final. During the quarter ended March 31, 2015, the Company adjusted the initial valuation and increased prepaid expenses and other current assets by $0.1 million, increased deferred financing costs, current by $0.8 million, increased construction in progress by $0.1 million and increased accrued construction costs by $0.9 million.
The consolidated fair value of the assets acquired and liabilities assumed in connection with the Logan’s Gap acquisition are as follows (in thousands):
December 19, 2014 | |||
Cash and cash equivalents | $ | 2 | |
Restricted cash, current | 5,003 | ||
Prepaid expenses and other current assets | 1,790 | ||
Deferred financing costs, current | 2,882 | ||
Construction in progress | 23,821 | ||
Property, plant and equipment | 116 | ||
Other assets | 80 | ||
Accrued construction costs | (5,617 | ) | |
Current portion of contingent liabilities | (7,975 | ) | |
Related party payable | (5,003 | ) | |
Total consideration | $ | 15,099 | |
Current assets, current liabilities, property, plant and equipment, other assets, accrued construction costs and related party payable were recorded at carrying value, which is representative of the fair value on the date of acquisition. Construction in progress was recorded at fair value which is representative of the development effort, including the developer’s profit, and contracts acquired on the date of acquisition.
The Company recorded $8.0 million in contingent obligations, payable to a third party, at fair value upon the acquisition of the project. As of December 31, 2015, $6.3 million of the contingent obligation was paid. The remaining $1.7 million is recorded in accounts payable and other accrued liabilities on the consolidated balance sheets as of December 31, 2016.
The Company incurred $0.1 million and $0.3 million of transaction-related expenses which were recorded in net gain (loss) on transactions in the consolidated statements of operations for the years ended December 31, 2015 and 2014, respectively.
The Company has determined that the operating partnership agreement does not allocate economic benefits pro rata to its two classes of investors and will use the HLBV method to calculate the noncontrolling interest balance that reflects the substantive profit sharing arrangement.
Panhandle 2 Acquisition
On November 10, 2014, the Company acquired 100% of the membership interests in the Panhandle 2 wind project through the acquisition of Panhandle B Member 2 LLC, from Pattern Development 1.0, for a purchase price of approximately $123.8 million.
Concurrent with the closing, certain tax equity investors made capital contributions to acquire 100% of the Class A membership interests in Panhandle 2 and were admitted as noncontrolling members in the entity and the Company received 100% of the Class B membership interest, resulting in the tax equity investors and the Company holding initial ownership interests of 19% and 81%, respectively, in the
F-22
project’s distributable cash flows. The 182 MW wind project, located in Carson County, Texas, achieved commercial operation on November 7, 2014.
The Company acquired the assets and operating contracts for Panhandle 2, including assumed liabilities. The identifiable assets acquired and liabilities assumed were recorded at their fair values which corresponded to the sum of the cash purchase price. Since the closing of the tax equity event occurred simultaneously with the acquisition, the Company considered the price paid by the noncontrolling investors (an entry price) to be a clear indication of what a market participant would pay and a reasonable measurement of fair value (an exit price) of the noncontrolling interest at initial recognition. The short-term debt presented in the table below consists of a construction loan that was repaid in full following the acquisition.
The accounting for the Panhandle 2 acquisition was completed as of March 31, 2015 at which point the fair values became final. The following table summarizes the final amounts recognized for assets acquired and liabilities assumed as of November 10, 2014.
The consolidated fair value of the assets acquired and liabilities assumed in connection with the Panhandle 2 acquisition are as follows (in thousands):
November 10, 2014 | |||
Cash and cash equivalents | $ | 240 | |
Trade receivables | 1,156 | ||
Prepaid expenses and other current assets | 28,997 | ||
Property, plant and equipment | 315,109 | ||
Accrued construction costs | (24,197 | ) | |
Related party payable | (121 | ) | |
Short-term debt | (195,351 | ) | |
Asset retirement obligation | (2,003 | ) | |
Total consideration | $ | 123,830 | |
Current assets, accrued construction costs and related party payable were recorded at carrying value, which is representative of the fair value on the date of acquisition. In addition, the short-term debt was recorded at carrying value, representative of the fair value, which was repaid immediately after acquisition.
Property, plant and equipment were recorded at the cost of construction plus the developer’s profit margin, which represents fair value. The asset retirement obligation was recorded at fair value using a combination of market data, operational data and discounted cash flows and was adjusted by a discount rate factor reflecting then current market conditions.
The Company incurred $0.2 million and $0.6 million of transaction-related expenses which were recorded in net gain (loss) on transactions in the consolidated statements of operations for the years ended December 31, 2014 and 2013, respectively.
The Company has determined that the operating partnership agreement does not allocate economic benefits pro rata to its two classes of investors and will use the HLBV method to calculate the noncontrolling interest balance that reflects the substantive profit sharing arrangement.
Panhandle 1 Acquisition
On June 30, 2014, the Company acquired 100% of the Class B membership interest in the Panhandle 1 wind project, representing a 79% initial ownership interest in the project’s distributable cash flow, through the acquisition of Panhandle Wind Holdings LLC, from Pattern Development 1.0, for a purchase price of approximately $124.4 million. The 218 MW wind project, located in Carson County, Texas, achieved commercial operation on June 25, 2014.
Concurrent with the closing, certain tax equity investors made capital contributions to acquire 100% of the Class A membership interests in Panhandle 1 and have been admitted as noncontrolling members in the entity, with a 21% initial ownership interest in the project’s distributable cash flow.
The Company acquired the assets and operating contracts for Panhandle 1, including assumed liabilities. The identifiable assets acquired and liabilities assumed were recorded at their fair values, which corresponded to the sum of the cash purchase price and the initial balance of the other investors’ noncontrolling interests. Since the closing of the tax equity event occurred simultaneously with the acquisition,
F-23
the Company considered the price paid by the noncontrolling investors (an entry price) to be a clear indication of what a market participant would pay and a reasonable measurement of fair value (an exit price) of the noncontrolling interest at initial recognition.
The accounting for the Panhandle 1 acquisition was completed as of December 31, 2014 at which point the fair values became final. The following table summarizes the provisional amounts recognized for assets acquired and liabilities assumed as of June 30, 2014, as well as adjustments made through December 31, 2014, when the allocation became final.
The consolidated fair value of the assets acquired and liabilities assumed in connection with the Panhandle 1 acquisition are as follows (in thousands):
June 30, 2014 | |||
Cash and cash equivalents | $ | 1,038 | |
Trade receivables | 1,850 | ||
Prepaid expenses and other current assets | 71 | ||
Restricted cash, non-current | 14,293 | ||
Property, plant and equipment | 332,953 | ||
Accounts payable and other accrued liabilities | (148 | ) | |
Accrued construction costs | (12,806 | ) | |
Related party payable | (44 | ) | |
Asset retirement obligation | (2,557 | ) | |
Total consideration before non-controlling interest | 334,650 | ||
Less: tax equity noncontrolling interest contributions | (210,250 | ) | |
Total consideration after non-controlling interest | $ | 124,400 | |
Current assets, restricted cash, current liabilities, accrued construction costs and related party payable were recorded at carrying value, which is representative of the fair value on the date of acquisition.
Property, plant and equipment were recorded at the cost of construction plus the developer’s profit margin, which represents fair value. The asset retirement obligation was recorded at fair value using a combination of market data, operational data and discounted cash flows and was adjusted by a discount rate factor reflecting then current market conditions.
The Company incurred $0.5 million of transaction-related expenses which were recorded in net gain (loss) on transactions in the consolidated statements of operations for the year ended December 31, 2014.
The Company has determined that the operating partnership agreement does not allocate economic benefits pro rata to its two classes of investors and will use the HLBV method to calculate the noncontrolling interest balance that reflects the substantive profit sharing arrangement.
El Arrayán Acquisition
On June 25, 2014, the Company acquired 100% of the issued and outstanding common stock of AEI El Arrayán Chile SpA (AEI El Arrayán), an entity holding a 38.5% indirect interest in El Arrayán, for a total purchase price of $45.3 million, pursuant to the terms of a Stock Purchase Agreement (the Agreement). The Company owned a 31.5% indirect interest in El Arrayán prior to acquiring the additional 38.5% interest in order to obtain majority control (70%) of the project, as a part of its growth strategy. El Arrayán is a 115 MW wind power project, located in Ovalle, Chile, which achieved commercial operation on June 4, 2014.
Prior to the acquisition, the Company accounted for the investment under the equity method of accounting. Because the Company acquired an additional 38.5% indirect interest in El Arrayán, in accordance with ASC 805, Business Combinations, the acquisition was accounted for as a "business combination achieved in stages." Accordingly, the Company remeasured the previously held equity interest in El Arrayán and adjusted it to fair value based on the Company’s existing equity interest in the fair value of the underlying assets and liabilities of El Arrayán. The fair value of the Company’s equity interest at the acquisition date was $37.0 million (31.5% of implied equity value of $117.5 million per below). The difference between the fair value of the Company’s ownership in El Arrayán and the Company’s carrying value of its investment of $19.1 million resulted in a gain of $17.9 million recorded in net gain (loss) on transactions in the consolidated statements of operations for the year ended December 31, 2014. The Company recognized additional deferred tax liability due to differences in accounting and tax bases resulting from the Company’s existing ownership interest in El Arrayán, which has been included in the consolidated statements of operations. The Company now holds a 70% controlling interest in the wind project and consolidates the accounts of El Arrayán. In accordance with ASC 805, the Company considered whether any control premium or noncontrolling interest
F-24
discount adjustment was necessary; however, based upon the relevant facts, the Company concluded that a proportionate allocation of the total fair value was reasonable. Therefore, no control premium or noncontrolling interest discount was applied in calculating the fair value of the Company's equity interest.
The Company acquired the assets and operating contracts for AEI El Arrayán, including assumed liabilities. The identifiable assets acquired and liabilities assumed were recorded at their fair values.
The accounting for the AEI El Arrayán acquisition was completed as of December 31, 2014 at which point the fair values became final. The following table summarizes the final amounts recognized for assets acquired and liabilities assumed as of June 25, 2014.
The consolidated fair value of the assets acquired and liabilities assumed in connection with the AEI El Arrayán acquisition are as follows (in thousands):
Consolidated interest June 25, 2014 | |||
Cash and cash equivalents | $ | 713 | |
Trade receivables | 3,829 | ||
VAT receivable | 17,031 | ||
Prepaid expenses and other current assets | 174 | ||
Restricted cash, non-current | 10,392 | ||
Property, plant and equipment | 341,417 | ||
Intangible assets | 1,121 | ||
Net deferred tax assets | 5,455 | ||
Accounts payable and other accrued liabilities | (6,830 | ) | |
Accrued construction costs | (9,495 | ) | |
Accrued interest | (2,592 | ) | |
Derivative liabilities, current | (1,942 | ) | |
Current portion of long-term debt | (16,586 | ) | |
Long-term debt | (209,295 | ) | |
Derivative liabilities, non-current | (501 | ) | |
Asset retirement obligation | (2,354 | ) | |
Net deferred tax liabilities | (13,001 | ) | |
Total consideration | 117,536 | ||
Less: non-controlling interest | (35,259 | ) | |
Controlling interest | $ | 82,277 | |
Current assets, restricted cash, deferred tax assets, accounts payable and other accrued liabilities, accrued construction costs, debt, accrued interest and deferred tax liabilities were recorded at carrying value, which is representative of the fair value on the date of acquisition. Debt and derivative liabilities were recorded at fair value. Property, plant and equipment were recorded at the cost of construction plus the developer’s profit margin, which represents fair value. The asset retirement obligation was recorded at fair value using a combination of market data, operational data and discounted cash flows and was adjusted by a discount rate factor reflecting then current market conditions.
The Company recognized deferred tax liabilities due to differences in accounting and tax bases resulting from the Company’s acquisition of incremental interest in El Arrayán and the remeasurement of the project’s remaining noncontrolling interest at fair value.
The Company incurred $0.4 million of transaction-related expenses which were recorded in net gain (loss) on transactions in the consolidated statements of operations for the year ended December 31, 2014.
F-25
Supplemental pro forma data (unaudited)
The unaudited pro forma statements of operations data below gives effect to the Lost Creek, Post Rock, Logan's Gap, Panhandle 2, Panhandle 1, and El Arrayán acquisitions as if they had occurred on January 1, 2014. The pro forma net loss for the years ended December 31, 2015 and 2014 was adjusted to exclude nonrecurring transaction related expenses of $1.8 million and $2.9 million, respectively. In addition, the 2014 pro forma net loss was adjusted to exclude a nonrecurring gain of $17.9 million, upon the acquisition of AEI El Arrayán. The unaudited pro forma data is presented for illustrative purposes only and is not intended to be indicative of actual results that would have been achieved had these acquisitions been consummated as of January 1, 2014. The unaudited pro forma data should not be considered representative of the Company’s future financial condition or results of operations.
Year ended December 31, | |||||||
Unaudited pro forma data (in thousands) | 2015 | 2014 | |||||
Pro forma total revenue | $ | 351,094 | $ | 326,094 | |||
Pro forma total expenses | 411,746 | 389,180 | |||||
Pro forma net loss | (60,652 | ) | (63,086 | ) | |||
Less: pro forma net loss attributable to noncontrolling interest | (29,091 | ) | (21,591 | ) | |||
Pro forma net loss attributable to Pattern Energy | $ | (31,561 | ) | $ | (41,495 | ) | |
Prior to the acquisition of AEI El Arrayán, net loss was recorded in earnings (losses) in unconsolidated investments, net in the consolidated statements of operations. From January 1, 2014 to June 25, 2014, the Company recorded net loss of $0.4 million in earnings (losses) on unconsolidated investments, net related to El Arrayán.
The following table presents the amounts included in the consolidated statements of operations for Lost Creek and Post Rock from their respective dates of acquisition through December 31, 2015:
Year ended December 31, | |||
Unaudited data (in thousands) | 2015 | ||
Total revenue | $ | 31,093 | |
Total expenses | 34,574 | ||
Net loss | (3,481 | ) | |
Less: net loss attributable to noncontrolling interest | (5,114 | ) | |
Net loss attributable to Pattern Energy | $ | 1,633 | |
Noncontrolling Interest Acquisition
Gulf Wind
On July 28, 2015, the Company acquired Pattern Development 1.0’s 27% interest in the Gulf Wind project for a cash purchase price of approximately $13.0 million. Concurrently, the Company acquired 100% of MetLife Capital, Limited Partnership’s Class A membership interest in the Gulf Wind project for a cash purchase price of approximately $72.8 million. As a result of the acquisitions, the Company owns 100% of the membership interests in the Gulf Wind project. The Company's additional paid-in capital was increased by $17.2 million, representing the difference between the aggregate purchase price and carrying values of the noncontrolling interests as of July 28, 2015.
Asset Acquisition
Amazon Wind Farm Fowler Ridge
On April 29, 2015, the Company acquired 100% of the membership interests in Fowler Ridge IV Wind Farm LLC through the acquisition of Fowler Ridge IV B Member LLC from Pattern Development 1.0, pursuant to a Purchase and Sale Agreement, for a purchase price of approximately $37.5 million, paid at closing, in addition to $0.6 million of capitalized transaction-related expenses, and contingent payments of up to $29.1 million, payable upon tax equity funding. The 150MW wind project, named Amazon Wind Farm Fowler Ridge, located in Benton County, Indiana, achieved commercial operation on December 4, 2015. Following the achievement of commercial operation, the Company and certain tax equity investors made capital contributions to fund the repayment of the construction loan. As a result, the Company and the tax equity investors hold initial ownership interests of 65% and 35%, respectively, in the project’s initial distributable cash flows.
F-26
The Company acquired certain assets and assumed certain liabilities of Amazon Wind Farm Fowler Ridge, including various operating contracts, deferred development costs, tangible assets, real property interests, governmental approvals and other assets. The fair value of the purchase consideration, including transaction costs of the asset acquisition, is assumed to be equal to the fair value of the net assets acquired and is allocated to the individual assets acquired and liabilities assumed based on their relative fair value. The accounting for the Amazon Wind Farm Fowler Ridge acquisition was completed as of March 31, 2016 at which point the fair values became final. The fair value of the assets acquired and liabilities assumed in connection with the Amazon Wind Farm Fowler Ridge acquisition are as follows (in thousands):
April 29, 2015 | |||
Prepaid expenses and other current assets | $ | 1,753 | |
Deferred financing costs, current | 2,132 | ||
Turbine advances | 4,000 | ||
Construction in progress | 34,487 | ||
Finite-lived intangible assets, net of accumulated amortization | 2,247 | ||
Accrued construction costs | (6,549 | ) | |
Total consideration | $ | 38,070 | |
The Company capitalized $0.6 million of transaction-related expenses for the year ended December 31, 2015.
In connection with the acquisition, the Company was required to make additional contingent payments to Pattern Development 1.0 upon tax equity funding. On December 18, 2015, pursuant to the purchase and sale agreement between the Company and Pattern Development 1.0, the Company settled the contingent obligation and made a payment of $27.2 million upon tax equity funding.
The Company also acquired $14.8 million of contingent obligations, which were paid as of December 31, 2015, consisting in part of a $5.0 million contingent obligation, which was paid subsequent to the close of construction financing, and assumption of an estimated $7.3 million third party contingent liability, which was recognized and paid subsequent to the acquisition at the time of commissioning of the first wind turbine in October 2015. The Company also assumed a $2.5 million liability, which was also recognized and paid in October 2015 to a third party upon energization of the project’s substation.
The Company has determined that the operating partnership agreement does not allocate economic benefits pro rata to its two classes of investors and will use the HLBV method to calculate the noncontrolling interest balance that reflects the substantive profit sharing arrangement. Below is a description of the allocation of distributions related to Amazon Wind Farm Fowler Ridge.
Unconsolidated Investments
Armow
On October 17, 2016, the Company acquired from Pattern Development 1.0 a 50% equity interest in Armow for approximately $132.3 million, in addition to $0.3 million of capitalized transaction-related expenses, plus assumed estimated proportionate debt, net of deferred financing cost, of approximately $193.6 million. Armow is a joint venture established to develop, construct and operate a wind power project located in Ontario, Canada. The project operates under a 20-year PPA and commenced commercial operation in December 2015. The Company’s investment in Armow was funded through general corporate funds and borrowings under the revolving credit facility. The Company is a noncontrolling investor in Armow, but has significant influence over Armow. Accordingly, the investment is being accounted for using the equity method of accounting.
The cost of the Company’s investment in Armow was $138.2 million higher than the Company’s underlying equity in the net assets of Armow. This equity method basis difference was comprised of $89.8 million related to property, plant and equipment and $48.4 million related to the PPA. The basis differences were based on preliminary calculations and valuations, and the estimates and assumptions are subject to change as additional information is obtained. The difference between the purchase price paid, including transaction costs of $132.6 million and the equity method basis differences of $138.2 million was due to the Armow project having a negative equity balance of $5.6 million as of the acquisition date primarily due to losses incurred on its interest rate derivative.
K2
On June 17, 2015, the Company acquired from Pattern Development 1.0 a one-third equity interest in K2 for approximately $128.0 million, in addition to $0.4 million of capitalized transaction-related expenses, plus assumed estimated proportionate debt at term conversion of approximately $221.8 million. In November 2015, upon term conversion, an additional $4.0 million of contingent
F-27
consideration became due payable to the seller, resulting in an adjusted purchase price of approximately $132.4 million. K2 is a joint venture established to develop, construct and own a wind power project located in Ontario, Canada. The project has a 20-year PPA and commenced commercial operation in May 2015. The Company’s investment in K2 was funded through general corporate funds and borrowings under the revolving credit facility. The Company is a noncontrolling investor in K2, but has significant influence over K2. Accordingly, the investment is accounted for under the equity method of accounting.
The cost of the Company’s investment in K2 was $115.6 million higher than the Company’s underlying equity in the net assets of K2. This equity method basis difference was comprised of $61.9 million related to property, plant and equipment and $53.7 million related to the PPA. The accounting for the acquisition was completed as of March 31, 2016 at which point the valuations became final.
4. Property, Plant and Equipment
The following presents the categories within property, plant and equipment (in thousands):
December 31, | |||||||
2016 | 2015 | ||||||
Operating wind farms | $ | 3,707,823 | $ | 3,700,140 | |||
Furniture, fixtures and equipment | 9,307 | 3,500 | |||||
Land | 141 | 141 | |||||
Subtotal | 3,717,271 | 3,703,781 | |||||
Less: accumulated depreciation | (582,109 | ) | (409,161 | ) | |||
Property, plant and equipment, net | $ | 3,135,162 | $ | 3,294,620 | |||
The Company recorded depreciation expense related to property, plant and equipment of $171.7 million, $141.2 million and $102.9 million for the years ended December 31, 2016, 2015 and 2014, respectively.
The Company has received $253.4 million from the U.S. Department of the Treasury under cash grants in lieu of investment tax credits for its Ocotillo, Santa Isabel and Spring Valley wind farms. The Company recorded the grant proceeds as a deduction from the carrying amount of the related wind farm assets.
F-28
5. Finite-Lived Intangible Assets and Liability
The following presents the major components of the finite-lived intangible assets and liability (in thousands):
December 31, 2016 | |||||||||||||
Weighted Average Remaining Life | Gross | Accumulated Amortization | Net | ||||||||||
Intangible assets | |||||||||||||
Power purchase agreement | 13 | $ | 97,400 | $ | (10,632 | ) | $ | 86,768 | |||||
Other intangible assets | 15 | 5,666 | (539 | ) | 5,127 | ||||||||
Total intangible assets | $ | 103,066 | $ | (11,171 | ) | $ | 91,895 | ||||||
Intangible liability | |||||||||||||
Power purchase agreement | 16 | $ | 60,300 | $ | (5,637 | ) | $ | 54,663 | |||||
December 31, 2015 | |||||||||||||
Weighted Average Remaining Life | Gross | Accumulated Amortization | Net | ||||||||||
Intangible assets | |||||||||||||
Power purchase agreement | 14 | $ | 97,400 | $ | (4,114 | ) | $ | 93,286 | |||||
Other intangible assets | 17 | 4,679 | (243 | ) | 4,436 | ||||||||
Total intangible assets | $ | 102,079 | $ | (4,357 | ) | $ | 97,722 | ||||||
Intangible liability | |||||||||||||
Power purchase agreement | 17 | $ | 60,300 | $ | (2,168 | ) | $ | 58,132 | |||||
The Company presents amortization of the PPA asset and PPA liability as an offset to electricity sales in the consolidated statements of operations, which resulted in net expense of $3.0 million and $1.9 million in electricity sales for the years ended December 31, 2016 and 2015, respectively. For the years ended December 31, 2016, 2015 and 2014, the Company recorded amortization expense of $0.3 million, $0.1 million and $0.2 million, respectively, related to other intangible assets in depreciation and accretion in the consolidated statements of operations.
The following table presents estimated future amortization for the next five years related to the PPA asset and PPA liability and other intangible assets:
Year ended December 31, | Power Purchase Agreements, Net | Other Intangible Assets | ||||||
2017 | $ | 3,031 | $ | 363 | ||||
2018 | 3,031 | 363 | ||||||
2019 | 3,031 | 363 | ||||||
2020 | 3,049 | 363 | ||||||
2021 | 3,031 | 363 | ||||||
Thereafter | 16,932 | 3,312 | ||||||
6. Variable Interest Entities
As a result of the adoption of ASU 2015-02 which is further discussed in Note 2, Summary of Significant Accounting Policies, effective as of January 1, 2016, certain operating entities that were formerly consolidated under the voting interest consolidation model are now consolidated in accordance with the VIE consolidation model.
The Company determined that the operating entities Logan's Gap, Panhandle 1, Panhandle 2, Post Rock and Amazon Wind Farm Fowler Ridge are VIEs primarily because the tax equity interests lack substantive kick-out and participating rights. The Company determined that as the managing member it is the primary beneficiary of each VIE by reference to the power and benefits criterion under ASC 810.
F-29
The Company considered responsibilities within the contractual agreements, which grant it the power to direct the activities of the VIE that most significantly impact the VIE's economic performance. Such activities include management of the wind farms' operations and maintenance, budgeting, policies and procedures. In addition, the Company has the obligation to absorb losses or the right to receive benefits that could potentially be significant to the VIEs on the basis of the income allocations and cash distributions.
The following presents the carrying amounts of the consolidated VIEs' assets and liabilities included in the consolidated balance sheet (in thousands). Assets presented below are restricted for settlement of the consolidated VIEs' obligations and all liabilities presented below can only be settled using the VIE resources.
December 31, 2016 | |||
Assets | |||
Current assets: | |||
Cash and cash equivalents | $ | 12,745 | |
Restricted cash | 4,291 | ||
Trade receivables | 6,290 | ||
Prepaid expenses | 4,468 | ||
Other current assets | 1,456 | ||
Total current assets | 29,250 | ||
Restricted cash | 3,203 | ||
Property, plant and equipment, net | 1,538,793 | ||
Finite-lived intangible assets, net | 2,070 | ||
Other assets | 13,622 | ||
Total assets | $ | 1,586,938 | |
Liabilities | |||
Current liabilities: | |||
Accounts payable and other accrued liabilities | $ | 12,635 | |
Accrued construction costs | 709 | ||
Accrued interest | 77 | ||
Other current liabilities | 2,090 | ||
Total current liabilities | 15,511 | ||
Finite-lived intangible liability, net | 54,663 | ||
Other long-term liabilities | 20,081 | ||
Total liabilities | $ | 90,255 | |
7. Unconsolidated Investments
The Company's unconsolidated investments consist of the following for the periods presented below (in thousands):
December 31, | Percentage of Ownership | ||||||||||||
December 31, | |||||||||||||
2016 | 2015 | 2016 | 2015 | ||||||||||
Armow | $ | 131,247 | $ | — | 50.0 | % | N/A | ||||||
South Kent | 1,537 | 6,185 | 50.0 | % | 50.0 | % | |||||||
Grand | 3,459 | 5,735 | 45.0 | % | 45.0 | % | |||||||
K2 | 97,051 | 104,553 | 33.3 | % | 33.3 | % | |||||||
Unconsolidated investments | $ | 233,294 | $ | 116,473 | |||||||||
F-30
Armow
The Company is a noncontrolling investor in a joint venture established to develop, construct, and own a wind power project located in Ontario, Canada. The project has a 20-year PPA, and commenced commercial operation in December 2015. See Note 3, Acquisitions - Unconsolidated Investments, for disclosure on the acquisition of the 50% interest in Armow.
South Kent
The Company is a noncontrolling investor in a joint venture established to develop, construct, and own a wind power project located in Ontario, Canada. The project has a 20-year PPA, and commenced commercial operation in March 2014.
Grand
The Company is a noncontrolling investor in a joint venture established to develop, construct, and own a wind power project located in Ontario, Canada. The project has a 20-year PPA and commenced commercial operation in December 2014.
K2
The Company is a noncontrolling investor in a joint venture established to develop, construct and own a wind power project located in Ontario, Canada. The project has a 20-year PPA and commenced commercial operation in May 2015. See Note 3, Acquisitions - Unconsolidated Investments, for disclosure on the acquisition of the one-third equity interest in K2.
Basis Amortization of Unconsolidated Investments
The cost of the Company’s investment in the net assets of unconsolidated investments was higher than the fair value of the Company’s equity interest in the underlying net assets of its unconsolidated investments. The basis differences were attributable to property, plant and equipment and PPAs and are being amortized over the particular assets useful life. For the years ended December 31, 2016, 2015 and 2014, the Company recorded basis difference amortization for its unconsolidated investments of $6.5 million, $2.9 million and $0.1 million, respectively, in earnings (losses) in unconsolidated investments, net on the consolidated statements of operations.
Suspension of Equity Method Accounting
During the year ended December 31, 2016 the Company's equity method balances for South Kent and Grand were zero. In accordance with ASC 323, Investments - Equity Method and Joint Ventures, the Company suspended recognition of South Kent's and Grand's equity method earnings or losses and accumulated other comprehensive income (loss), until the fourth quarter of 2016 when South Kent's and Grand's cumulative equity method earnings and other comprehensive income exceeded cumulative distributions received, cumulative equity method losses and, where applicable, cumulative other comprehensive income (loss) during the suspension period. As the Company has no explicit or implicit commitment to fund losses at the unconsolidated investments, the Company has recorded gains resulting from distributions received in excess of the carrying amount of its unconsolidated investments. For the year ended December 31, 2016, earnings (loss) in unconsolidated investments, net as reported on the consolidated statement of operations attributable to South Kent and Grand includes $19.9 million in distributions received in excess of the carrying amount of the Company's investment and equity earnings of $0.6 million.
During the suspension period, the Company maintains a memo ledger that records the components of the suspended activity. During the year ended December 31, 2016, the memo ledger balance was made up of distributions received in excess of the carrying amount of the Company's investment of $19.9 million, suspended equity losses of $4.6 million and suspended other comprehensive income of $0.7 million which were offset by equity earnings of $23.8 million during the fourth quarter of 2016 when cumulative equity method earnings and other comprehensive income exceeded cumulative distributions received, cumulative equity method losses and, where applicable, cumulative other comprehensive income (loss) during the suspension period. As a result the Company's memo ledger as of December 31, 2016 is $0.0 million.
F-31
Aggregate Financial Data for Unconsolidated Investees
The following summarizes the balance sheets and statements of operations, in aggregate, for the unconsolidated investees (in thousands):
December 31, | |||||||
2016 | 2015 | ||||||
Current assets | $ | 105,539 | $ | 94,834 | |||
Non-current assets | 1,792,879 | 1,430,224 | |||||
Total assets | $ | 1,898,418 | $ | 1,525,058 | |||
Current liabilities | $ | 100,000 | $ | 96,656 | |||
Non-current liabilities | 1,803,962 | 1,406,779 | |||||
Total liabilities | 1,903,962 | 1,503,435 | |||||
Total equity | (5,544 | ) | 21,623 | ||||
Total liabilities and equity | $ | 1,898,418 | $ | 1,525,058 | |||
Year ended December 31, | |||||||||||
2016 | 2015 | 2014 | |||||||||
Revenue | $ | 266,476 | $ | 201,155 | $ | 81,942 | |||||
Cost of revenue | 98,567 | 77,695 | 37,908 | ||||||||
Operating expenses | 2,174 | 2,666 | 3,265 | ||||||||
Other expense | 79,608 | 73,540 | 91,359 | ||||||||
Net income (loss) | $ | 86,127 | $ | 47,254 | $ | (50,590 | ) | ||||
F-32
8. Debt
The Company’s debt consists of the following for periods presented below (in thousands):
As of December 31, 2016 | |||||||||||||||||
December 31, | Contractual Interest Rate | Effective Interest Rate | |||||||||||||||
2016 | 2015 | Maturity | |||||||||||||||
Corporate-level | |||||||||||||||||
Revolving credit facility | $ | 180,000 | $ | 355,000 | varies | (1 | ) | 2.99 | % | December 2018 | |||||||
Convertible senior notes 2020 | 225,000 | 225,000 | 4.00 | % | 6.60 | % | July 2020 | ||||||||||
Project-level | |||||||||||||||||
Fixed interest rate | |||||||||||||||||
El Arrayán EKF term loan | 103,904 | 107,160 | 5.56 | % | 5.56 | % | March 2029 | ||||||||||
Santa Isabel term loan | 107,090 | 109,973 | 4.57 | % | 4.57 | % | September 2033 | ||||||||||
Variable interest rate | |||||||||||||||||
Ocotillo commercial term loan (2) | 193,257 | 208,119 | 2.75 | % | 3.81 | % | (3 | ) | August 2020 | ||||||||
Lost Creek term loan | 103,846 | 110,846 | 2.89 | % | 6.50 | % | (3 | ) | September 2027 | ||||||||
El Arrayán commercial term loan | 94,458 | 97,418 | 3.98 | % | 5.15 | % | (3 | ) | March 2029 | ||||||||
Spring Valley term loan | 130,658 | 132,670 | 2.75 | % | 5.26 | % | (3 | ) | June 2030 | ||||||||
Ocotillo development term loan | 102,300 | 104,500 | 3.10 | % | 4.41 | % | (3 | ) | August 2033 | ||||||||
St. Joseph term loan (2) | 162,356 | 158,181 | 2.57 | % | 3.85 | % | (3 | ) | November 2033 | ||||||||
Imputed interest rate | |||||||||||||||||
Hatchet Ridge financing lease obligation | 202,593 | 214,580 | 1.43 | % | 1.43 | % | December 2032 | ||||||||||
1,605,462 | 1,823,447 | ||||||||||||||||
Unamortized premium/discount, net (4) | (17,019 | ) | (21,244 | ) | |||||||||||||
Unamortized financing costs | (24,771 | ) | (31,317 | ) | |||||||||||||
Total debt, net | $ | 1,563,672 | $ | 1,770,886 | |||||||||||||
As reflected on the consolidated balance sheets | |||||||||||||||||
Revolving credit facility | $ | 180,000 | $ | 355,000 | |||||||||||||
Current portion of long-term debt, net of financing costs | 48,716 | 44,144 | |||||||||||||||
Long term debt, net of financing costs | 1,334,956 | 1,371,742 | |||||||||||||||
Total debt, net | $ | 1,563,672 | $ | 1,770,886 | |||||||||||||
(1) | Refer to Revolving Credit Facility below for interest rate details. |
(2) | The amortization for the Ocotillo commercial term loan and the St. Joseph term loan are through June 2030 and September 2036, respectively, which differs from the stated maturity date of such loans due to prepayment requirements. |
(3) | Includes impact of interest rate derivatives. See Note 10, Derivative Instruments, for discussion of interest rate derivatives. |
(4) | Premium amount is related to the Lost Creek term loan and discount amount is related to the Convertible Senior Notes due 2020. |
F-33
The following are principal payments, excluding deferred financing costs, due under the Company's debt as of December 31, 2016 for the following years (in thousands):
Amount | ||||
2017 | $ | 231,761 | ||
2018 | 60,615 | |||
2019 | 66,543 | |||
2020 | 426,794 | |||
2021 | 61,427 | |||
Thereafter | 758,322 | |||
Total | $ | 1,605,462 | ||
Interest and commitment fees incurred and interest expense for debt consisted of the following (in thousands):
Year ended December 31, | |||||||||||
2016 | 2015 | 2014 | |||||||||
Corporate-level interest and commitment fees incurred | $ | 18,171 | $ | 9,983 | $ | 2,635 | |||||
Project-level interest and commitment fees incurred | 47,994 | 64,903 | 61,431 | ||||||||
Capitalized interest, commitment fees, and letter of credit fees | — | (6,607 | ) | (2,856 | ) | ||||||
Amortization of debt discount/premium, net | 4,226 | 1,660 | — | ||||||||
Amortization of financing costs | 6,968 | 7,435 | 6,309 | ||||||||
Other interest | 645 | 533 | 175 | ||||||||
Interest expense | $ | 78,004 | $ | 77,907 | $ | 67,694 | |||||
Corporate Level Debt
Revolving Credit Facility
The Company's $500 million Revolving Credit Facility expires in December 2018 (Revolving Credit Facility). The Revolving Credit Facility is secured by pledges of the capital stock and ownership interests in certain of the Company’s holding company subsidiaries. The Revolving Credit Facility contains a broad range of covenants that, subject to certain exceptions, restrict the Company’s holding company subsidiaries' ability to incur debt, grant liens, sell or lease assets, transfer equity interests, dissolve, pay distributions and change its business. As of December 31, 2016, the Company's holding company subsidiaries are in compliance with covenants contained in the Revolving Credit Facility.
The loans under the Company's Revolving Credit Facility are either base rate loans or Eurodollar rate loans. The base rate loans accrue interest at the fluctuating rate per annum equal to the greatest of the (i) the prime rate, (ii) the federal funds rate plus 0.50% and (iii) the Eurodollar rate that would be in effect for a Eurodollar rate loan with an interest period of one month plus 1.0%, plus an applicable margin ranging from 1.25% to 1.75% (corresponding to applicable leverage ratios of the borrower). The Eurodollar rate loans accrue interest at a rate per annum equal to International Continental Exchange London Interbank Offered Rate (LIBOR), as published by Reuters plus an applicable margin ranging from 2.25% to 2.75% (corresponding to applicable leverage ratios of the borrower). Under the Revolving Credit Facility, the Company pays a revolving commitment fee equal to the average of the daily difference between revolving commitments and the total utilization of revolving commitments times 0.50%. The Company also pays letter of credit fees.
As of December 31, 2016 and 2015, letters of credit of $31.7 million and $27.2 million, respectively, were issued under the Revolving Credit Facility.
Convertible Senior Notes due 2020
In July 2015, the Company issued $225 million aggregate principal amount of 4.00% convertible senior notes due 2020 (2020 Notes). The 2020 Notes bear interest at a rate of 4.00% per year, payable semiannually in arrears on January 15 and July 15 of each year, beginning on January 15, 2016. The 2020 Notes will mature on July 15, 2020. The 2020 Notes were sold in a private placement. Upon conversion, the Company may, at its discretion, pay cash, shares of the Company’s Class A common stock, or a combination of cash and stock. The 2020 Notes are set at an initial conversation rate of 35.4925 shares of Class A common stock per $1,000 principal amount of 2020 Notes, which is equivalent to an initial conversion price of approximately $28.175 per share of Class A common stock. The conversion rate is
F-34
subject to adjustment in some events (including, but not limited to, certain cash dividends made to holders of the Company's Class A common stock which exceed the initial dividend threshold of $0.363 per quarter per share). The conversion rate would be adjusted to offset the effect of the portion of the dividend in excess of $0.363, provided that the adjustment would result a change of at least 1% in the then effective conversion rate. As of December 31, 2016, no adjustment was required. The conversion rate will not be adjusted for any accrued and unpaid interest. The 2020 Notes are not redeemable prior to maturity.
The 2020 Notes are guaranteed on a senior unsecured basis by a subsidiary of the Company and are general unsecured obligations of the Company. The obligations rank senior in rights of payment to the Company’s subordinated debt, equal in right of payment to the Company’s unsubordinated debt and effectively junior in right of payment to any of the Company’s secured indebtedness to the extent of the value of the assets securing such indebtedness.
The following table presents a summary of the equity and liability components of the 2020 Notes (in thousands):
December 31, | |||||||
2016 | 2015 | ||||||
Principal | $ | 225,000 | $ | 225,000 | |||
Less: | |||||||
Unamortized debt discount | (18,196 | ) | (22,624 | ) | |||
Unamortized financing costs | (3,894 | ) | (5,014 | ) | |||
Carrying value of convertible senior notes | $ | 202,910 | $ | 197,362 | |||
Carrying value of the equity component (1) | $ | 23,743 | $ | 23,743 | |||
(1) | Included in the consolidated balance sheets as additional paid-in capital, net of $0.7 million in equity issuance costs. |
During the year ended December 31, 2016, in relation to the 2020 Notes, the Company recorded $9.2 million, $1.1 million and $4.4 million related to the contractual coupon interest, amortization of financing costs and amortization of debt discount, respectively, in interest expense in its consolidated statements of operations.
Project-level Financing Arrangements
The Company typically finances its wind projects through project entity specific debt secured by each project's assets with no recourse to the Company. Typically, these financing arrangements provide for a construction loan, which upon completion may be converted into a term loan or repaid through capital contributions from the Company and tax equity investors.
Collateral for project level facilities typically include each project's tangible assets and contractual rights and cash on deposit with the depository agents. Each loan agreement contains a broad range of covenants that, subject to certain exceptions, restrict each project's ability to incur debt, grant liens, sell or lease certain assets, transfer equity interests, dissolve, make distributions and change their business. As of December 31, 2016, all projects were in compliance with their financing covenants.
St. Joseph
On November 17, 2015, St. Joseph extinguished its existing credit facility consisting of a term loan of approximately C$212.5 million and maturing in March 2031 and entered into a C$244.0 million credit agreement that provided a term loan facility, a letter of credit facility and an interest hedge facility (St. Joseph Credit Agreement) maturing in November 2033. Pursuant to the terms of the St. Joseph Credit Agreement, the prior lenders to the project were repaid in full with borrowings from a new group of lenders. The interest rate on the St. Joseph term loan was reduced from a fixed rate of 5.95% to a Canadian Dollar Offered Rate (CDOR) plus 1.625% (increasing by 0.125% every three years). The size of the St. Joseph Credit Agreement was increased to C$219.0 million to include finance fees and costs associated with the new arrangement. The St. Joseph Credit Agreement also established approximately C$25.0 million in new letter of credit facilities for the project to support various reserve requirements and security obligations under the PPA.
In connection with the St. Joseph Credit Agreement, St. Joseph entered into interest rate swaps with each of the new lenders to manage exposure to interest rate risk. The interest rate swaps were designed to effectively set 90% of the St. Joseph Credit Agreement interest rate at 4.0% (increasing by 0.125% every three years). See Note 10, Derivative Instruments, for additional information.
As a result of the repayment of the existing term loan of approximately C$212.5 million, the Company recognized a loss on debt extinguishment of approximately $0.8 million, which includes unamortized deferred financing costs and legal fees incurred as a result of the extinguishment, for the year ended December 31, 2015.
F-35
Spring Valley
On October 20, 2015, Spring Valley entered into an amendment to its financing agreement with existing lenders. Pursuant to the terms of the refinancing, the interest rate on the term loan for the facility was reduced from LIBOR plus 2.38% (increasing 0.25% every four years) to LIBOR plus 1.75% (increasing by 0.125% every four years). Through proceeds from the Revolving Credit Facility, the Company also made a prepayment of $29.7 million towards the outstanding principal balance on Spring Valley's term loan facility which reduced the outstanding balance of the term loan to approximately $133.2 million.
In connection with the prepayment of $29.7 million, the Company discontinued the cash flow hedge designation on a portion of the interest rate swap associated with the original outstanding principal balance prior to prepayment. See Note 10, Derivative Instruments, for additional information.
The Company accounted for the Spring Valley refinancing event as a debt modification for all lenders. In accordance with ASC 470-50, Debt Modifications and Extinguishments (ASC 470-50), the amendment fees of $0.9 million and the remaining $5.0 million of unamortized debt issuance costs related to the original debt will be amortized over the remaining term of the modified debt using the effective interest method.
Lost Creek
On September 3, 2015, Lost Creek entered into a Second Amended and Restated Credit Agreement (Lost Creek Term Loan) which, among other things, reduced the interest rate from LIBOR plus 2.75% (with periodic increases of 0.25%) to LIBOR plus 1.65% (increasing by 0.125% every four years) and extended the maturity of the Lost Creek Term Loan from March 2021 to September 2027. Under ASC 470-50, these amendments to the Lost Creek Term Loan are considered a modification of debt on a lender-by-lender basis. As a result, the capitalized amendment fees of $1.5 million paid to lenders are amortized over the remaining term of the modified debt using the effective interest method. In addition, the Company expensed third party legal and other fees of approximately $0.7 million, which are included in other income (expense), net in the Company's consolidated statements of operations.
The Lost Creek Term Loan includes a collateral agreement that requires proceeds from the sale of energy from the Lost Creek wind project be remitted directly to the depositary agent of the Lost Creek Term Loan to provide for debt service payments and operating costs required under the Lost Creek Term Loan. The Lost Creek Term Loan also replaced the existing debt service and operating and maintenance reserves with a $10.7 million revolving credit facility provided by certain lenders in the event Lost Creek is unable to make payments towards debt service reserve requirements and operating and maintenance reserve requirements.
The Lost Creek Term Loan is subject to certain covenants, including limitations on additional indebtedness, limitations on liens, requirements for periodic financial and operational information, and compliance with certain required financial ratios. The Lost Creek Term Loan also contains voluntary prepayment provisions which provide for the right to prepay the Lost Creek Term Loan without premium or penalty and contains mandatory prepayments for such events as upwind array events. As of December 31, 2016, there has been no requirement to make any such mandatory prepayments of amounts borrowed under the term loan. Additionally, the Lost Creek Term Loan restricts payment of dividends, distributions, and returns of capital to affiliates of Lost Creek unless provided by the Lost Creek Term Loan.
Gulf Wind
On July 28, 2015, the Company acquired the noncontrolling interests in the Gulf Wind project, resulting in a 100% ownership of the membership interests in the Gulf Wind project. See Note 14, Stockholders' Equity - Noncontrolling Interests, for additional information. Subsequent to the acquisitions, on July 30, 2015, the Company prepaid 100% of the outstanding balance of the Gulf Wind project’s term loan of $154.1 million, resulting in a loss on extinguishment of debt, primarily related to the write-off of deferred financing costs, of approximately $4.1 million. As a result of the early extinguishment of debt, the Company terminated the related interest rate swaps and cap. See Note 10, Derivative Instruments, for additional information.
Amazon Wind Farm Fowler Ridge
On April 29, 2015, Amazon Wind Farm Fowler Ridge entered into a $199.1 million construction loan facility and $22.5 million of letter of credit facilities, as required by the PPA and renewable energy credit agreement. The interest rate on the construction loan facility was 1.69%. The Company also entered into a Letter of Credit, Reimbursement and Loan Agreement pursuant to which the $11.2 million REC letter of credit facility expired on April 29, 2016 and the $11.3 million PPA letter of credit facility expires on April 29, 2020.
F-36
On December 18, 2015, the Company and certain tax equity investors made capital contributions to fund the repayment of the Amazon Wind Farm Fowler Ridge construction loan facility. As of December 31, 2015, the balance of the construction loan facility was zero. See Note 14, Stockholders' Equity - Noncontrolling Interests, for additional information.
Financing Lease Obligations
In December 2010, Hatchet Ridge entered into a sale-leaseback agreement to finance the project facility for 22 years. The Company evaluated the agreement in accordance with ASC 840 and ASC 360, Property Plant and Equipment, and determined that due to continuing involvement with the project facility, the Company is precluded from treating the agreement as a sale-lease back transaction and accounts for the agreement as a financing lease obligation.
Collateral for the agreement includes Hatchet Ridge’s tangible assets and contractual rights and cash on deposit with the depository agent. Its loan agreement contains a broad range of covenants that, subject to certain exceptions, restrict Hatchet Ridge’s ability to incur debt, grant liens, sell or lease assets, transfer equity interests, dissolve, pay distributions and change its business.
Payments under the financing lease for the years ended December 31, 2016, 2015 and 2014, were $15.0 million, $16.9 million and $15.0 million, respectively.
9. Asset Retirement Obligation
The Company’s asset retirement obligations represent the estimated cost of decommissioning the turbines, removing above-ground installations and restoring the sites at the end of its estimated economic useful life. Effective January 1, 2015, the Company changed its estimate of the useful lives of wind farms for which construction began after 2011, from 20 years to 25 years. As a result, during the year ended December 31, 2015, the Company recorded a one-time adjustment of $1.9 million to reduce the carrying balance of the asset retirement obligations to reflect the change in estimated useful life of the underlying wind farms and related estimate associated with the timing of the original undiscounted cash flows.
The following table presents a reconciliation of the beginning and ending aggregate carrying amounts of asset retirement obligation (in thousands):
December 31, | ||||||||
2016 | 2015 | |||||||
Beginning asset retirement obligations | $ | 42,197 | $ | 29,272 | ||||
Net additions during the year | — | 13,189 | ||||||
Foreign currency translation adjustment | 63 | (411 | ) | |||||
Adjustment related to change in useful life | — | (1,907 | ) | |||||
Accretion expense | 2,523 | 2,054 | ||||||
Ending asset retirement obligations | $ | 44,783 | $ | 42,197 | ||||
10. Derivative Instruments
The Company employs a variety of derivative instruments to manage its exposure to fluctuations in electricity prices, interest rates and foreign currency exchange rates. Energy prices are subject to wide swings as supply and demand are impacted by, among many other unpredictable items, weather, market liquidity, generating facility availability, customer usage, storage, and transmission and transportation constraints. Interest rate risk exists primarily on variable-rate debt for which the cash flows vary based upon movement in interest rates. Additionally, the Company is exposed to foreign currency exchange rate risk primarily from its business operations in Canada and Chile. The Company’s objectives for holding these derivative instruments include reducing, eliminating and efficiently managing the economic impact of these exposures as effectively as possible. The Company does not hedge all of its electricity price risk, interest rate risks, and foreign currency exchange rate risks, thereby exposing the unhedged portions to changes in market prices.
As of December 31, 2016, the Company had other energy-related contracts that did not meet the definition of a derivative instrument or qualified for the NPNS exception and were therefore exempt from fair value accounting treatment.
F-37
The following tables present the fair values of the Company's derivative instruments on a gross basis as reflected on the Company’s consolidated balance sheets (in thousands):
December 31, 2016 | ||||||||||||||||
Derivative Assets | Derivative Liabilities | |||||||||||||||
Current | Long-Term | Current | Long-Term | |||||||||||||
Fair Value of Designated Derivatives: | ||||||||||||||||
Interest rate swaps | $ | — | $ | 40 | $ | 8,289 | $ | 21,058 | ||||||||
Fair Value of Undesignated Derivatives: | ||||||||||||||||
Interest rate swaps | — | 1,788 | 3,238 | 3,463 | ||||||||||||
Energy derivative | 16,209 | 24,707 | — | — | ||||||||||||
Foreign currency forward contracts | 1,369 | 177 | 391 | — | ||||||||||||
Total Fair Value | $ | 17,578 | $ | 26,712 | $ | 11,918 | $ | 24,521 | ||||||||
December 31, 2015 | ||||||||||||||||
Derivative Assets | Derivative Liabilities | |||||||||||||||
Current | Long-Term | Current | Long-Term | |||||||||||||
Fair Value of Designated Derivatives: | ||||||||||||||||
Interest rate swaps | $ | — | $ | — | $ | 10,034 | $ | 24,360 | ||||||||
Fair Value of Undesignated Derivatives: | ||||||||||||||||
Interest rate swaps | — | 559 | 4,309 | 4,299 | ||||||||||||
Energy derivative | 20,856 | 42,827 | — | — | ||||||||||||
Foreign currency forward contracts | 3,482 | 628 | — | — | ||||||||||||
Total Fair Value | $ | 24,338 | $ | 44,014 | $ | 14,343 | $ | 28,659 | ||||||||
The following table summarizes the notional amounts of the Company's outstanding derivative instruments (in thousands except for MWh):
December 31, | ||||||||||
Unit of Measure | 2016 | 2015 | ||||||||
Designated Derivative Instruments | ||||||||||
Interest rate swaps | USD | $ | 365,443 | $ | 379,808 | |||||
Interest rate swaps | CAD | $ | 196,425 | $ | 196,988 | |||||
Undesignated Derivative Instruments | ||||||||||
Interest rate swaps | USD | $ | 257,389 | $ | 275,424 | |||||
Energy derivative | MWh | 1,201,691 | 1,707,350 | |||||||
Foreign currency forward contracts | CAD | $ | 95,800 | $ | 62,300 | |||||
Derivatives Designated as Hedging Instruments
Cash Flow Hedges
The Company has interest rate swap agreements to hedge variable rate project-level debt. Under these interest rate swaps, the projects make fixed-rate interest payments and the counterparties to the agreements make variable-rate interest payments. For interest swaps that are designated and qualify as cash flow hedges, the effective portion of the gain or loss on the derivative is reported as a component of accumulated other comprehensive loss and reclassified into earnings in the period or periods during which a cash settlement occurs. The designated interest rate swaps have remaining maturities ranging from approximately 10.8 years to 19.8 years.
F-38
The following table presents gains and losses on derivative contracts designated and qualifying as cash flow hedges recognized in accumulated other comprehensive loss, net of tax, as well as amounts reclassified to earnings for the following periods (in thousands):
Year ended December 31, | ||||||||||||||
Description | 2016 | 2015 | 2014 | |||||||||||
Gains (losses) recognized in accumulated OCI | Effective portion of change in fair value | $ | (6,751 | ) | $ | (16,163 | ) | $ | (33,444 | ) | ||||
Gains (losses) reclassified from accumulated OCI into: | ||||||||||||||
Interest expense | Derivative settlements | $ | (7,462 | ) | $ | (12,234 | ) | $ | (13,774 | ) | ||||
Realized loss on designated derivatives, net | Termination of derivatives | $ | — | $ | (11,221 | ) | $ | — | ||||||
Loss on undesignated derivatives, net | De-designation of derivatives | $ | — | $ | (5,918 | ) | $ | — | ||||||
Gains (losses) recognized in interest expense | Ineffective portion | $ | 346 | $ | (809 | ) | $ | — | ||||||
The Company estimates that $7.0 million in accumulated other comprehensive loss will be reclassified into earnings over the next twelve months.
Spring Valley
On October 20, 2015, in connection with the amendment to Spring Valley's term loan, the Company made a prepayment of $29.7 million towards the outstanding principal balance on Spring Valley's term loan which reduced the balance to approximately $133.2 million. See Note 8, Debt - Spring Valley, for additional information. As a result, the Company discontinued the cash flow hedge designation on a portion of the interest rate swaps associated with the original outstanding principal balance prior to prepayment and reclassified approximately $5.9 million from accumulated other comprehensive loss to loss on undesignated derivatives, net in the Company's consolidated statements of operations.
Gulf Wind
On July 28, 2015, in connection with the early extinguishment of Gulf Wind's term loan, the Company terminated the related interest rate swaps which resulted in the reclassification of $11.2 million in accumulated other comprehensive loss to realized loss on designated derivatives, net in the consolidated statements of operations.
Derivatives Not Designated as Hedging Instruments
The following table presents gains and losses on derivatives not designated as hedges (in thousands):
Year ended December 31, | |||||||||||||||||
Derivative Type | Financial Statement Line Item | Description | 2016 | 2015 | 2014 | ||||||||||||
Interest rate derivatives | Loss on undesignated derivatives, net | Change in fair value, net of settlements | $ | 3,137 | $ | (5,758 | ) | (1 | ) | $ | (11,668 | ) | |||||
Interest rate derivatives | Loss on undesignated derivatives, net | Derivative settlements | $ | (4,965 | ) | $ | (4,838 | ) | $ | (4,075 | ) | ||||||
Energy derivative | Electricity sales | Change in fair value, net of settlements | $ | (22,767 | ) | $ | (792 | ) | $ | (3,878 | ) | ||||||
Energy derivative | Electricity sales | Derivative settlements | $ | 21,586 | $ | 20,568 | $ | 13,525 | |||||||||
Foreign currency forward contracts | Loss on undesignated derivatives, net | Change in fair value, net of settlements | $ | (2,955 | ) | $ | 4,110 | $ | — | ||||||||
Foreign currency forward contracts | Loss gain on undesignated derivatives, net | Derivative settlements | $ | 1,459 | $ | 996 | $ | — | |||||||||
(1) | Amount includes the reclassification of $5.9 million from accumulated other comprehensive loss related to the dedesignation of certain interest rate derivative instruments at Spring Valley. |
Interest Rate Derivatives
Interest Rate Swaps
The Company has interest rate swap agreements to hedge variable rate project-level debt. Under these interest rate swaps, the projects make fixed-rate interest payments and the counterparties to the agreements make variable-rate interest payments. For interest rate swaps
F-39
that are not designated and do not qualify as cash flow hedges, the changes in fair value are recorded in loss on undesignated derivatives, net in the consolidated statements of operations as these hedges are not accounted for under hedge accounting. The undesignated interest rate swaps have remaining maturities ranging from approximately 4.2 years to 13.5 years.
Interest Rate Cap
In 2010, Gulf Wind entered into an interest rate cap to manage its exposure to future interest rates when its long-term debt was expected to be refinanced at the end of the ten-year term. The cap provided Gulf Wind the right to receive payments and protected the Company if future interest rates exceeded approximately 6.0%.
On July 28, 2015, in connection with the early extinguishment of Gulf Wind's term loan, the Company terminated the related interest rate cap which resulted in a net loss of $0.2 million, recognized in loss on undesignated derivatives, net in the consolidated statements of operations and primarily represents a realization of losses previously recorded within accumulated other comprehensive loss.
Energy Derivative
In 2010, Gulf Wind acquired an energy derivative instrument to manage its exposure to variable electricity prices over the life of the arrangement. The energy price swap fixes the price for a predetermined volume of production (the notional volume) over the life of the swap contract, through April 2019, by locking in a fixed price per MWh. The notional volume agreed to by the parties is approximately 504,220 MWh per year. The energy derivative instrument does not meet the criteria required to adopt hedge accounting. As a result, changes in fair value are recorded in electricity sales in the consolidated statements of operations.
As a result of the counterparty's credit rating downgrade, the Company received cash collateral related to the energy derivative agreement. The Company does not have the right to pledge, invest, or use the cash collateral for general corporate purposes. As of December 31, 2016, the Company has recorded a current asset of $43.6 million to funds deposited by counterparty and a current liability of $43.6 million to counterparty deposit liability representing the cash collateral received and corresponding obligation to return the cash collateral, respectively. The cash was deposited into a separate custodial account for which the Company is not entitled to the interest earned on the cash collateral.
Foreign Currency Forward Contracts
In January 2015, the Company established a currency risk management program. The objective of the program is to mitigate the foreign exchange rate risk arising from transactions or cash flows that have a direct or underlying exposure in non-U.S. dollar denominated currencies in order to reduce volatility in the Company’s cash flow, which may have an adverse impact to the Company's short-term liquidity or financial condition. A majority of the Company’s PSAs and operating expenditures are transacted in U.S. dollars, with a growing portion transacted in currencies other than the U.S. dollar, primarily the Canadian dollar. The Company enters into foreign currency forward contracts at various times to mitigate currency exchange rate risk on Canadian dollar denominated cash flows. These instruments have remaining maturities ranging from one to eighteen months. The foreign currency forward contracts are considered non-designated derivative instruments and are not used for trading or speculative purposes. As a result, changes in fair value and settlements are recorded in loss on undesignated derivatives, net in the consolidated statements of operations.
F-40
11. Accumulated Other Comprehensive Loss
The following table summarizes changes in the accumulated other comprehensive loss balance, net of tax, by component:
Foreign Currency | Effective Portion of Change in Fair Value of Derivatives | Proportionate Share of Equity Investee's OCI | Total | |||||||||||||
Balances at December 31, 2013 | $ | (8,463 | ) | $ | (7,002 | ) | $ | (1,912 | ) | $ | (17,377 | ) | ||||
Other comprehensive loss before reclassifications | (10,875 | ) | (33,444 | ) | (5,991 | ) | (50,310 | ) | ||||||||
Amounts reclassified from accumulated other comprehensive loss | — | 13,774 | — | 13,774 | ||||||||||||
Net current period other comprehensive loss | (10,875 | ) | (19,670 | ) | (5,991 | ) | (36,536 | ) | ||||||||
Balances at December 31, 2014 | (19,338 | ) | (26,672 | ) | (7,903 | ) | (53,913 | ) | ||||||||
Other comprehensive loss before reclassifications | (28,947 | ) | (16,163 | ) | (6,640 | ) | (51,750 | ) | ||||||||
Amounts reclassified from accumulated other comprehensive loss due to termination/de-designation of interest rate derivatives | — | 17,139 | — | 17,139 | ||||||||||||
Amounts reclassified from accumulated other comprehensive loss | — | 12,234 | 2,412 | 14,646 | ||||||||||||
Net current period other comprehensive loss | (28,947 | ) | 13,210 | (4,228 | ) | (19,965 | ) | |||||||||
Balances at December 31, 2015 | (48,285 | ) | (13,462 | ) | (12,131 | ) | (73,878 | ) | ||||||||
Other comprehensive income (loss) before reclassifications | 4,785 | (6,751 | ) | 1,039 | (927 | ) | ||||||||||
Amounts reclassified from accumulated other comprehensive loss | — | 7,462 | 4,594 | 12,056 | ||||||||||||
Net current period other comprehensive income | 4,785 | 711 | 5,633 | 11,129 | ||||||||||||
Balances at December 31, 2016 | $ | (43,500 | ) | $ | (12,751 | ) | $ | (6,498 | ) | $ | (62,749 | ) | ||||
Less: accumulated other comprehensive loss attributable to noncontrolling interest, December 31, 2016 | — | (382 | ) | — | (382 | ) | ||||||||||
Accumulated other comprehensive loss attributable to Pattern Energy, December 31, 2016 | $ | (43,500 | ) | $ | (12,369 | ) | $ | (6,498 | ) | $ | (62,367 | ) | ||||
12. Fair Value Measurement
The Company’s fair value measurements incorporate various factors, including the credit standing and performance risk of the counterparties, the applicable exit market, and specific risks inherent in the instrument. Nonperformance and credit risk adjustments on risk management instruments are based on current market inputs when available, such as credit default hedge spreads. When such information is not available, internal models may be used.
Assets and liabilities recorded at fair value in the consolidated financial statements are categorized based upon the level of judgment associated with the inputs used to measure their fair value. Hierarchical levels directly related to the amount of subjectivity associated with the inputs to valuation of these assets or liabilities are set forth below. Transfers between levels are recognized at the end of each quarter. The Company did not recognize any transfers between levels during the periods presented.
F-41
Level 1—Inputs are unadjusted, quoted prices in active markets for identical assets or liabilities at the measurement date.
Level 2—Inputs (other than quoted prices included in Level 1) are either directly or indirectly observable for the asset or liability through correlation with market data at the measurement date and for the duration of the instrument’s anticipated life.
Level 3—Unobservable inputs that are supported by little or no market activity and that are significant to the fair value of the assets or liabilities and which reflect management’s best estimate of what market participants would use in pricing the asset or liability at the measurement date. Consideration is given to the risk inherent in the valuations technique and the risk inherent in the inputs to the model.
Financial Instruments
The carrying value of financial instruments classified as current assets and current liabilities approximates their fair value, based on the nature and short maturity of these instruments, and they are presented in the Company’s financial statements at carrying cost. The fair values of cash and cash equivalents and restricted cash are classified as Level 1 in the fair value hierarchy. Certain other assets and liabilities were measured at fair value upon initial recognition and unless conditions give rise to an impairment, are not remeasured.
Financial Instruments Measured at Fair Value on a Recurring Basis
The Company’s financial assets and liabilities which require fair value measurement on a recurring basis are classified within the fair value hierarchy as follows (in thousands):
December 31, 2016 | |||||||||||||||
Level 1 | Level 2 | Level 3 | Total | ||||||||||||
Assets | |||||||||||||||
Interest rate swaps | $ | — | $ | 1,828 | $ | — | $ | 1,828 | |||||||
Energy derivative | — | — | 40,916 | 40,916 | |||||||||||
Foreign currency forward contracts | — | 1,546 | — | 1,546 | |||||||||||
$ | — | $ | 3,374 | $ | 40,916 | $ | 44,290 | ||||||||
Liabilities | |||||||||||||||
Interest rate swaps | $ | — | $ | 36,048 | $ | — | $ | 36,048 | |||||||
Foreign currency forward contracts | — | 391 | — | 391 | |||||||||||
$ | — | $ | 36,439 | $ | — | $ | 36,439 | ||||||||
December 31, 2015 | |||||||||||||||
Level 1 | Level 2 | Level 3 | Total | ||||||||||||
Assets | |||||||||||||||
Interest rate swaps | $ | — | $ | 559 | $ | — | $ | 559 | |||||||
Energy derivative | — | — | 63,683 | 63,683 | |||||||||||
Foreign currency forward contracts | — | 4,110 | — | 4,110 | |||||||||||
$ | — | $ | 4,669 | $ | 63,683 | $ | 68,352 | ||||||||
Liabilities | |||||||||||||||
Interest rate swaps | $ | — | $ | 43,002 | $ | — | $ | 43,002 | |||||||
$ | — | $ | 43,002 | $ | — | $ | 43,002 | ||||||||
Level 2 Inputs
Derivative instruments subject to re-measurement are presented in the financial statements at fair value. The Company's interest rate swaps were valued by discounting the net cash flows using the forward LIBOR curve with the valuations adjusted by the Company’s credit default hedge rate. The Company’s foreign currency forward contracts were valued using the income approach based on the present value of the forward rates less the contract rates, multiplied by the notional amounts.
F-42
Level 3 Inputs
The fair value of the energy derivative instrument is determined based on a third-party valuation model. The methodology and inputs are evaluated by management for consistency and reasonableness by comparing inputs used by the third-party valuation provider to another third-party pricing service for identical or similar instruments and also agreeing inputs used in the third-party valuation model to the derivative contract for accuracy. Any significant changes are further evaluated for reasonableness by obtaining additional documentation from the third-party valuation provider.
The energy derivative instrument is valued by discounting the projected net cash flows over the remaining life of the derivative instrument using forward electricity prices which are derived from observable prices, such as forward gas curves, adjusted by a non-observable heat rate for when the contract term extends beyond a period for which market data is available. The significant unobservable input in calculating the fair value of the energy derivative instrument is forward electricity prices. Significant increases or decreases in this unobservable input would result in a significantly lower or higher fair value measurement.
The following table presents a reconciliation of the energy derivative contract measured at fair value on a recurring basis using significant unobservable inputs (in thousands):
2016 | 2015 | |||||||
Balance at beginning of year | $ | 63,683 | $ | 64,475 | ||||
Total gains (losses) included in electricity sales | (1,181 | ) | 19,776 | |||||
Settlements | (21,586 | ) | (20,568 | ) | ||||
Balance at end of year | $ | 40,916 | $ | 63,683 | ||||
During the years ended December 31, 2016, 2015 and 2014, the Company recognized unrealized losses of $22.8 million, $0.8 million, and $3.9 million relating to energy derivative asset held at December 31, 2016, 2015, and 2014, respectively.
The valuation techniques and significant unobservable inputs used in recurring Level 3 fair value measurements were as follows (in thousands, for fair value):
December 31, 2016 | Fair Value | Valuation Technique | Significant Unobservable Inputs | Range | ||||
Energy derivative | $40,916 | Discounted cash flow | Forward electricity prices | $15.83 - $81.76(1) | ||||
Discount rate | 1.00% - 1.52% | |||||||
December 31, 2015 | Fair Value | Valuation Technique | Significant Unobservable Inputs | Range | ||||
Energy derivative | $63,683 | Discounted cash flow | Forward electricity prices | $12.48 - $74.94(1) | ||||
Discount rate | 0.61% - 1.46% | |||||||
(1) | Represents price per MWh |
Financial Instruments not Measured at Fair Value
The following table presents the carrying amount and fair value and the fair value hierarchy of the Company’s financial liabilities that are not measured at fair value in the consolidated balance sheets, but for which fair value is disclosed (in thousands):
Fair Value | |||||||||||||||||||
As reflected on the balance sheet | Level 1 | Level 2 | Level 3 | Total | |||||||||||||||
December 31, 2016 | |||||||||||||||||||
Long-term debt, including current portion | $ | 1,383,672 | $ | — | $ | 1,382,038 | $ | — | $ | 1,382,038 | |||||||||
December 31, 2015 | |||||||||||||||||||
Long-term debt, including current portion | $ | 1,415,886 | $ | — | $ | 1,382,149 | $ | — | $ | 1,382,149 | |||||||||
Long term debt including the convertible senior notes are presented on the consolidated balance sheets, net of financing costs, discounts and premiums. The fair value of variable interest rate long-term debt is approximated by its carrying cost. The fair value of fixed interest
F-43
rate long-term debt is estimated based on observable market prices or parameters or derived from such prices or parameters. Where observable prices or inputs are not available, valuation models are applied, using the net present value of cash flow streams over the term using estimated market rates for similar instruments and remaining terms.
13. Income Taxes
The following table presents significant components of the provision for income taxes (in thousands):
Year ended December 31, | ||||||||||||
2016 | 2015 | 2014 | ||||||||||
Current: | ||||||||||||
Federal | $ | — | $ | — | $ | — | ||||||
State | — | — | — | |||||||||
Foreign | 378 | 489 | 182 | |||||||||
Total current expense | 378 | 489 | 182 | |||||||||
Deferred: | ||||||||||||
Federal | — | — | — | |||||||||
State | — | — | — | |||||||||
Foreign | 8,301 | 4,454 | 2,954 | |||||||||
Total deferred expense | 8,301 | 4,454 | 2,954 | |||||||||
Total provision for income taxes | $ | 8,679 | $ | 4,943 | $ | 3,136 | ||||||
The following table presents the domestic and foreign components of net (loss) income before income tax provision (in thousands):
Year ended December 31, | ||||||||||||
2016 | 2015 | 2014 | ||||||||||
U.S. | $ | (71,405 | ) | $ | (66,883 | ) | $ | (34,788 | ) | |||
Foreign | 27,785 | 16,219 | (2,075 | ) | ||||||||
Total | $ | (43,620 | ) | $ | (50,664 | ) | $ | (36,863 | ) | |||
The following table presents a reconciliation of the statutory U.S. federal income tax rate to the Company’s effective tax rate, as a percentage of income before taxes for the following periods:
Year ended December 31, | |||||||||
2016 | 2015 | 2014 | |||||||
Computed tax at statutory rate | 35.0 | % | 35.0 | % | 35.0 | % | |||
Adjustment for income in non-taxable entities allocable to noncontrolling interest | (25.6 | )% | (13.0 | )% | (7.6 | )% | |||
Foreign rate differential | |||||||||
Tax rate differential on pre-tax book income | (16.9 | )% | (6.6 | )% | 5.6 | % | |||
Local tax on branch profits/(losses)—Puerto Rico | — | % | 0.3 | % | 1.6 | % | |||
Permanent book/tax differences (domestic only) | (0.2 | )% | (0.1 | )% | (0.1 | )% | |||
Valuation allowance | (18.8 | )% | (25.1 | )% | (33.4 | )% | |||
Chilean shareholder benefit due to tax regime change | 0.7 | % | 0.4 | % | (3.6 | )% | |||
Tax credits | 7.6 | % | — | % | — | % | |||
Change in tax rate due to change in Chilean tax regime | — | % | — | % | (6.2 | )% | |||
Other | (1.6 | )% | (0.7 | )% | 0.1 | % | |||
ARRA Section 1603 grant-basis reduction deferred tax assets | — | % | — | % | — | % | |||
Effective income tax rate | (19.8 | )% | (9.8 | )% | (8.6 | )% | |||
F-44
The following table presents significant components of the Company’s deferred tax assets and deferred tax liabilities as follows (in thousands):
2016 | 2015 | |||||||
Deferred tax assets: | ||||||||
Accruals and prepaids | $ | 2,331 | $ | 592 | ||||
Basis difference in derivatives | 3,411 | 7,392 | ||||||
Hatchet Ridge financing | 27,521 | 27,096 | ||||||
Asset retirement obligation | 9,012 | 9,064 | ||||||
Unrealized loss on derivatives | 6,372 | 9,132 | ||||||
Net operating loss carryforwards | 339,203 | 242,100 | ||||||
Partnership interest | — | 18,536 | ||||||
Basis difference in foreign subsidiaries | — | 104 | ||||||
Tax credits | 9,939 | 6,501 | ||||||
Total gross deferred tax assets | 397,789 | 320,517 | ||||||
Less: Valuation allowance | (144,056 | ) | (135,273 | ) | ||||
Total gross deferred tax assets net of valuation allowance | $ | 253,733 | $ | 185,244 | ||||
Deferred tax liabilities: | ||||||||
Property, plant and equipment | $ | (246,267 | ) | $ | (193,833 | ) | ||
Partnership interest | (27,440 | ) | — | |||||
Basis difference in foreign subsidiaries | (865 | ) | — | |||||
Deferred interest, commitment fees and financing costs | (4,543 | ) | — | |||||
Other deferred tax liabilities | (818 | ) | (6,790 | ) | ||||
Total gross deferred tax liabilities | (279,933 | ) | (200,623 | ) | ||||
Total net deferred tax assets/(liabilities) | $ | (26,200 | ) | $ | (15,379 | ) | ||
The deferred tax assets and deferred tax liabilities resulted primarily from temporary differences between book and tax basis of assets and liabilities. The Company regularly assesses the likelihood that future taxable income levels will be sufficient to ultimately realize the tax benefits of the deferred tax assets. Should the Company determine that future realization of the tax benefits is not more likely than not, additional valuation allowance would be established which would increase the Company’s tax provision in the period of such determination. The net deferred tax assets and net deferred tax liabilities as of December 31, 2016 and 2015 are attributed primarily to the Company’s Canadian, Puerto Rican and Chilean entities. The net change in valuation allowance increased by $9 million during the year ended December 31, 2016. The increase was primarily driven by operating losses in the US federal and state jurisdictions.
As of December 31, 2016, the Company has U.S federal and state net operating loss (NOL) carryforwards in the amount of $817 million and $141 million, respectively, which begin to expire in the year ending December 31, 2032 for federal and state purposes. The Company also has foreign net operating loss carryforwards in Canada of $88 million which begin to expire in the year ending December 31, 2029, foreign net operating loss carryforwards in Puerto Rico of $4 million that begins to expire in the year ending December 31, 2022, and foreign net operating loss carryforwards in Chile of $64 million that can be carried forward indefinitely. The Company's production tax credits of $11 million begin to expire in the year ending December 31, 2033.
Internal Revenue Code Section 382 places a limitation (the Section 382 Limitation) on the amount of taxable income that can be offset by NOL and credit carryforwards, as well as built-in loss items, after a change in control (generally greater than 50% change in ownership) of a loss corporation. California has similar rules. The Company did not have any historic U.S. NOLs prior to October 2, 2013 except for NOLs from its Puerto Rico entity which may be subject to Section 382 Limitation.
The Company experienced a change in ownership on May 14, 2014. As a result, the Company’s NOL carryforwards and credits generated through the date of change are subject to an annual limitation under Section 382. Accordingly, if the Company generates sufficient taxable income, the NOL carryforwards or credits prior to the change in ownership are not expected to expire.
F-45
The Company is required to recognize in the financial statements the impact of a tax position, if that position is more likely than not of being sustained on audit, based on the technical merits of the position. As of December 31, 2016, the Company does not have any unrecognized tax benefits and does not have any tax positions for which it is reasonably possible that the amount of gross unrecognized tax benefits will increase or decrease within 12 months after the year ended December 31, 2016.
The Company files income tax returns in the U.S. federal jurisdiction, various state jurisdictions and foreign jurisdictions for its Canadian, Chilean and Puerto Rican operations. The Company’s U.S. and foreign income tax returns for 2012 to 2016 are subject to examination.
The Company has a policy to classify accrued interest and penalties associated with uncertain tax positions together with the related liability, and the expenses incurred related to such accruals are included in the provision for income taxes. The Company did not incur any interest expenses or penalties or have outstanding liabilities on the balance sheet associated with unrecognized tax benefits for the years ended December 31, 2016, 2015 and 2014.
The Company operates under a tax holiday in Puerto Rico which enacted a special tax rate of 4% for businesses dedicated to the production of energy for consumption through the use of renewal sources. The Company previously operated under the "Economic Incentives for the Development of Puerto Rico Act" (Act 73) which was enacted in order to promote the development of green energy projects through economic incentives to reduce the island’s dependency on oil. On September 15, 2016, the Company surrendered operations under Act 73 and commenced operations under the "Green Energy Incentives Act of Puerto Rico" (Act 83) which affords the Company identical tax benefits to Act 73 and extends the special tax rate for 25 years at the date of conversion. The impact of the tax holiday increased foreign deferred tax expense by $0.2 million for the year ended December 31, 2016. The impact of the tax holiday on basic and diluted net income (loss) per Class A common stock for the year ended December 31, 2016 was $0.002.
14. Stockholders' Equity
Preferred Stock
The Company has 100,000,000 shares of authorized preferred stock issuable in one or more series. The Company’s Board of Directors is authorized to determine the designation, powers, preferences and relative, participating, optional or other special rights of any such series. As of December 31, 2016 and 2015, there was no preferred stock issued and outstanding.
Common Stock
On August 12, 2016, the Company completed an underwritten public offering of its Class A common stock. In total, 10,000,000 shares of the Company's Class A common stock were sold. In connection with the equity offering, the underwriters had a 30-day option to purchase up to an additional 1,500,000 shares of Class A common stock to cover over-allotments. On August 22, 2016, the underwriters partially exercised their over-allotment option and purchased an additional 1,300,000 shares of Class A common stock. Aggregate net proceeds of the equity offering, including the proceeds of the over-allotment option, were approximately $258.6 million after deduction of underwriting discounts, commissions, and transaction expenses.
On May 9, 2016, the Company entered into an Equity Distribution Agreement. Pursuant to the terms of the Equity Distribution Agreement, the Company may offer and sell shares of the Company’s Class A common stock, par value $0.01 per share, from time to time through the Agents, as the Company’s sales agents for the offer and sale of the shares, up to an aggregate sales price of $200.0 million. For the year ended December 31, 2016, the Company sold 1,240,504 shares under the Equity Distribution Agreement and net proceeds under the issuances were $27.5 million and the aggregate compensation paid by the Company to the Agents with respect to such sales was $0.3 million.
On July 28, 2015, the Company completed an underwritten public offering of its Class A common stock. In total, 5,435,000 shares of the Company's Class A common stock were sold. Net proceeds generated for the Company were approximately $120.8 million after deduction of underwriting discounts, commissions and transaction expenses.
On February 9, 2015, the Company completed an underwritten public offering of its Class A common stock. In total, 12,000,000 shares of the Company’s Class A common stock were sold. Of this amount, the Company issued and sold 7,000,000 shares of its Class A common stock and Pattern Development 1.0, the selling stockholder, sold 5,000,000 shares of Class A common stock. The Company received net proceeds of approximately $196.2 million after deducting underwriting discounts and commissions and estimated offering expenses payable by the Company. The Company did not receive any proceeds from the sale of shares sold by Pattern Development 1.0.
F-46
On May 14, 2014, the Company completed an underwritten public offering of its Class A common stock resulting in a reduction of Pattern Development 1.0’s interest in the Company from approximately 63% to 35%. Consequently, the Company is no longer subject to ASC 805-50-30-5, Transactions between Entities under Common Control. All transactions with Pattern Development 1.0 after May 14, 2014 are recognized at fair value on the measurement date in accordance with the ASC 805, Business Combinations.
Voting Rights
Holders of the Company’s Class A common stock as of December 31, 2016 are entitled to one vote per share on all matters submitted to a vote of stockholders and will vote as a single class under all circumstances.
Dividend Rights
Holders of Class A common stock are eligible to receive dividends on common stock held when funds are available and as approved by the Board of Directors. The following table presents cash dividends declared on Class A common stock for the periods presented:
Dividends Per Share | Declaration Date | Record Date | Payment Date | ||||||
2016: | |||||||||
Fourth Quarter | $ | 0.4080 | November 4, 2016 | December 30, 2016 | January 31, 2017 | ||||
Third Quarter | $ | 0.4000 | August 3, 2016 | September 30, 2016 | October 31, 2016 | ||||
Second Quarter | $ | 0.3900 | May 4, 2016 | June 30, 2016 | July 29, 2016 | ||||
First Quarter | $ | 0.3810 | February 24, 2016 | March 31, 2016 | April 29, 2016 | ||||
Liquidation Rights
In the event of any liquidation, dissolution or winding-up of the Company, holders of Class A common stock will be entitled to share ratably in the Company’s assets that remain after payment or provision for payment of all of its debts and obligations and after liquidation payments to holders of outstanding shares of preferred stock, if any.
Class B Common Stock
The Company’s Class B common stock converted on a one to one basis into Class A common stock on December 31, 2014. As a result, the shares of Class B common stock were retired and the Company is no longer authorized to issue shares of Class B common stock.
Noncontrolling Interests
The following table presents the balances for noncontrolling interests by project and the Company's respective ownership percentage (in thousands, except percentages). See Note 3, Acquisitions, for additional information.
Noncontrolling Ownership Percentage | ||||||||||||||
December 31, | December 31, | |||||||||||||
2016 | 2015 | 2016 | 2015 | |||||||||||
El Arrayán | $ | 32,237 | $ | 34,224 | 30 | % | 30 | % | ||||||
Logan's Gap | 180,092 | 190,397 | 18 | % | 18 | % | ||||||||
Panhandle 1 | 190,415 | 195,791 | 21 | % | 21 | % | ||||||||
Panhandle 2 | 170,139 | 184,773 | 19 | % | 19 | % | ||||||||
Post Rock | 178,676 | 196,346 | 40 | % | 40 | % | ||||||||
Amazon Wind Farm Fowler Ridge | 139,687 | 142,731 | 35 | % | 35 | % | ||||||||
Noncontrolling interest | $ | 891,246 | $ | 944,262 | ||||||||||
F-47
The following table presents the components of total noncontrolling interest as reported in stockholders’ equity in the consolidated balance sheets (in thousands). See Note 3, Acquisitions, for additional information.
Capital | Accumulated Income (Loss) | Accumulated Other Comprehensive Income (Loss) | Noncontrolling Interest | ||||||||||||
Balances at December 31, 2013 | $ | 90,217 | $ | 18,601 | $ | (9,024 | ) | $ | 99,794 | ||||||
Contributions from noncontrolling interests | 406,163 | — | — | 406,163 | |||||||||||
Fair value of noncontrolling interest in El Arrayán | 35,259 | — | — | 35,259 | |||||||||||
Distributions to noncontrolling interests | (2,100 | ) | — | — | (2,100 | ) | |||||||||
Net loss | — | (8,709 | ) | — | (8,709 | ) | |||||||||
Other comprehensive income, net of tax | — | — | 179 | 179 | |||||||||||
Balances at December 31, 2014 | 529,539 | 9,892 | (8,845 | ) | 530,586 | ||||||||||
Acquisition of Post Rock | 205,100 | — | — | 205,100 | |||||||||||
Buyout of noncontrolling interests | (88,747 | ) | (14,244 | ) | 7,944 | (95,047 | ) | ||||||||
Contributions from noncontrolling interests | 334,231 | — | — | 334,231 | |||||||||||
Distributions to noncontrolling interests | (7,882 | ) | — | — | (7,882 | ) | |||||||||
Net loss | — | (23,074 | ) | — | (23,074 | ) | |||||||||
Other comprehensive income, net of tax | — | — | 348 | 348 | |||||||||||
Balances at December 31, 2015 | 972,241 | (27,426 | ) | (553 | ) | 944,262 | |||||||||
Distributions to noncontrolling interests | (17,896 | ) | — | — | (17,896 | ) | |||||||||
Other | (103 | ) | — | — | (103 | ) | |||||||||
Net loss | — | (35,188 | ) | — | (35,188 | ) | |||||||||
Other comprehensive loss, net of tax | — | — | 171 | 171 | |||||||||||
Balances at December 31, 2016 | $ | 954,242 | $ | (62,614 | ) | $ | (382 | ) | $ | 891,246 | |||||
Allocations of Distributions and Tax Allocations for Tax Equity Partnerships
Generally, tax equity partnerships have specific commercial terms that dictate distributions of cash and allocation of tax items among the partners, who are divided into one of two categories: tax equity and cash investor. A disproportionate share of income and cash is given to tax equity in order for them to achieve a target after-tax yield or “flip” near year 10 of project operations. The target yield and flip term vary by agreement and are dependent on project performance. Prior to the flip, tax items (income, US Federal production tax credits) are commonly allocated 99% to the tax equity. On the other hand, distributable cash is divided among the partners in percentages that do not match the tax items. Cash distribution percentages can be temporarily increased for tax equity in the event that certain cumulative distribution thresholds are not achieved. Once tax equity reaches their target yield, the allocations and distributions “flip” to different amounts. After the flip, income and cash are typically allocated 5% to the tax equity and 95% to the cash investor. REC sales are often specially addressed in each agreement with most of the cash and income directed to the cash investor both pre and post-flip.
Tax equity partnership imposes a range of affirmative and negative covenants that are similar to what a term lender would require, such as, financial reporting, insurance maintenance and prudent operator standards. Most of these restrictions end once the flip point occurs and any deficit restoration obligation of the tax equity has been eliminated. There are also covenants that specifically seek to preserve the tax attributes of the project that are not customary for project term lenders.
If tax equity suffers any losses or damages as the result of a breach of representation, covenant, or other obligation by the cash investor in its capacity as managing member, tax equity may provide notice to the cash investor and require that any distributions otherwise required to be paid to the cash investor shall, instead, be paid to tax equity to cover any damages.
15. Equity Incentive Award Plan
Under the 2013 Equity Incentive Award Plan (2013 Plan), the Company may issue 3,000,000 aggregate number of shares of Class A common stock for equity awards including incentive and nonqualified stock options, restricted stock awards (RSAs) and restricted stock units (RSUs) to employees, directors and consultants. RSAs provide the holder with immediate voting rights, but are restricted in all other respects until released. RSUs generally entitle the holders the right to receive the underlying shares of the Company's Class A
F-48
common stock upon vesting. Upon cessation of services to the Company, any nonvested RSAs and RSUs will be forfeited. All nonvested RSAs and RSUs accrue dividends and distributions, which are subject to vesting and paid in cash upon release. Accrued dividends and distributions are forfeitable to the extent that the underlying awards do not vest. During 2016, the Company granted 287,904 RSAs to certain employees and 25,768 RSUs to certain directors. There were 2,264,763 aggregate number of Class A shares available for issuance under the 2013 Plan as of December 31, 2016.
Stock-Based Compensation
Stock-based compensation expenses related to, RSAs, RSUs and stock options are recorded as a component of general and administrative expenses in the Company’s consolidated statements of operations and totaled $5.4 million, $4.5 million and $4.1 million for the years ended December 31, 2016, 2015 and 2014, respectively.
Restricted Stock Awards
The Company measures the fair value of time-based RSAs at the grant date and accounts for stock-based compensation by amortizing the fair value on a straight line basis over the related vesting period.
The following table summarizes RSA activity under the 2013 Plan for the year ended December 31, 2016:
Shares | Weighted-Average Grant-Date Fair Value | ||||||
Nonvested at December 31, 2015 | 122,868 | $ | 27.71 | ||||
Granted | 151,462 | $ | 18.76 | ||||
Vested | (86,103) | $ | 24.02 | ||||
Forfeited | (16,199 | ) | $ | 23.12 | |||
Repurchased for employee tax withholding | (45,663) | $ | 23.99 | ||||
Nonvested at December 31, 2016 | 126,365 | $ | 21.45 | ||||
For the years ended December 31, 2016, 2015 and 2014, the total fair value of RSAs vested was $2.1 million, $1.7 million and $2.2 million, respectively. The weighted-average grant date fair values per RSA granted during the same periods were $18.76, $29.58 and $27.63, respectively.
As of December 31, 2016, the total unrecorded stock-based compensation expense for nonvested RSAs was $2.6 million, which is expected to be amortized over a weighted-average period of 1.7 years.
RSAs that contain Market Conditions
In 2016 and 2015, the Company granted TSR-RSAs to certain senior management personnel. The number of awards granted represented the maximum number of shares of Class A common stock that may be earned; however, the number of vested TSR-RSAs is assessed at the end of a three-year performance period in accordance with the level of total shareholder return of the Company's stock price achieved relative to a peer group during the specified period. Following the date of grant, rights to dividends will accrue on the maximum number of shares and may be forfeited if the market or service conditions are not achieved.
F-49
The Company measures the fair value of these restricted stock awards at the grant date using a Monte Carlo simulation model and amortizes the fair value over the longer of the requisite period or performance period. The Company estimates expected volatility based on the actual volatility of the Company's daily closing share price since listing on September 27, 2013 and the historical volatility of comparable publicly traded companies for a period that is equal to the performance period. The risk-free interest rate is based on the yield on U.S. government bonds for a period commensurate with the performance period. The assumptions used to estimate the fair value of TSR-RSAs are as follows:
Years ended December 31, | ||||
2016 | 2015 | |||
Expected stock price volatility(1) | 35% | 30% | ||
Expected dividend yield | N/A | N/A | ||
Risk-free interest rate | 1.11% | 0.80% | ||
Expected performance period in years(2) | 2.8 | 2.7 | ||
(1) | The expected volatility was estimated using the historical volatility derived from the Company's Class A common stock. |
(2) | The expected performance period was estimated based on the length of the remaining performance period from the grant date. |
The following table summarizes TSR-RSAs activity under the 2013 Plan for the year ended December 31, 2016:
Shares | Weighted-Average Grant-Date Fair Value | ||||||
Nonvested at December 31, 2015 | 85,268 | $ | 39.16 | ||||
Granted | 136,442 | $ | 20.63 | ||||
Vested | — | — | |||||
Forfeited | — | — | |||||
Repurchased for employee tax withholding | — | — | |||||
Nonvested at December 31, 2016 | 221,710 | $ | 27.76 | ||||
For the years ended December 31, 2016 and 2015, the weighted-average grant-date fair value per TSR-RSAs granted was $20.63 and $39.16, respectively.
As of December 31, 2016, the total unrecorded stock-based compensation expense related to nonvested TSR-RSAs was $2.3 million, which is expected to be amortized over a weighted-average period of 1.9 years.
RSAs that contain Performance Conditions
During the year ended December 31, 2014, the Company recorded compensation expense of $0.6 million related to RSAs, granted in March 2014, that were released to senior management personnel when certain performance conditions were met. These awards included 27,717 shares of restricted stock, with a weighted average grant date fair value of $27.03 that were vested upon the Company achieving its cash available for distribution target as of December 31, 2014. On December 31, 2014, the performance condition was met.
Restricted Stock Units
In 2016 and 2015, the Company granted time-based deferred RSUs to certain directors. Deferred RSUs are equity awards that entitle the holder the right to receive shares of the Company's Class A common stock upon vesting and are settled on, or as soon as administratively possible after the settlement date which is January 1 following the date of the director's termination of service. The Company measures the fair value of deferred RSUs at the grant date and accounts for stock-based compensation by amortizing the fair value on a straight line basis over the related vesting period.
During the year ended December 31, 2016, there were RSU grants of 25,768 shares, all of which vested. For the years ended December 31, 2016 and 2015, the total fair value of deferred RSUs vested was $0.5 million and $0.6 million, respectively. The weighted-average grant date fair value of stock awards granted during the same periods was $20.29 and $25.94, respectively. As of December 31, 2016, there were no nonvested deferred RSUs.
F-50
Stock Options
During the year ended December 31, 2014, the Company issued 14,861 shares as a result of employee stock option exercises. Cash received on exercise was $0.3 million and the total intrinsic value of stock options exercised was $0.1 million. Intrinsic value is defined as the amount by which the fair value of the underlying stock exceeds the exercise price at the time of stock option exercise. The Company did not grant stock option awards under the 2013 Plan during the years ended December 31, 2016, 2015, and 2014.
During the years ended December 31, 2016 and December 31, 2015, no options were exercised, forfeited or expired. As of December 31, 2016, there were 429,962 shares outstanding and exercisable with a weighted-average exercise price of $22.00 per share and a weighted average remaining contractual life of 6.7 years. All were vested or expected to vest, net of estimated forfeitures, and their aggregate intrinsic value was zero.
16. Loss Per Share
Basic loss per share is computed by dividing net loss attributable to common stockholders by the weighted average number of common shares outstanding during the reportable period. Diluted loss per share is computed by adjusting basic loss per share for the effect of all potential common shares unless they are anti-dilutive. For purpose of this calculation, potentially dilutive securities are determined by applying the treasury stock method to the assumed exercise of in-the-money stock options and the assumed vesting of outstanding RSAs and release of deferred RSUs. Potentially dilutive securities related to convertible senior notes are determined using the if-converted method.
The Company's vested deferred RSUs have non-forfeitable rights to dividends prior to release and are considered participating securities. The Company's Class B common stock, which was converted to Class A common stock on a one-to-one basis on December 31, 2014 were deemed to be participating securities as Class B common stockholders had the same rights, including voting and liquidation rights, as Class A common stockholders, except with respect to net income and dividends as Class B common shareholders were not entitled to distributions. Class B common stock had deemed dividends which represented the accretion of the beneficial conversion feature. Accordingly, they were included in the computation of basic and diluted loss per share, pursuant to the two-class method. Under the two-class method, distributed and undistributed earnings allocated to participating securities are excluded from net loss attributable to common stockholders for purposes of calculating basic and diluted loss per share. However, net losses are not allocated to participating securities since they are not contractually obligated to share in the losses of the Company.
For the years ended December 31, 2016, 2015 and 2014, the Company excluded 8.0 million, 3.5 million and 15.6 million, respectively, of potentially dilutive securities from the diluted EPS calculation as their effect is anti-dilutive.
F-51
The computations for Class A basic and diluted loss per share are as follows (in thousands except share data):
Year ended December 31, | |||||||||||
2016 | 2015 | 2014 | |||||||||
Numerator for basic and diluted loss per share: | |||||||||||
Net loss attributable to Pattern Energy | $ | (17,111 | ) | $ | (32,533 | ) | $ | (31,290 | ) | ||
Less: dividends declared on Class A common shares | (128,423 | ) | (102,861 | ) | (56,976 | ) | |||||
Less: deemed dividends on Class B common shares | — | — | (21,901 | ) | |||||||
Less: earnings allocated to participating securities | (53 | ) | (32 | ) | — | ||||||
Undistributed loss attributable to common stockholders | $ | (145,587 | ) | $ | (135,426 | ) | $ | (110,167 | ) | ||
Denominator for loss per share: | |||||||||||
Weighted average number of shares: | |||||||||||
Class A common stock - basic and diluted | 79,382,388 | 70,535,568 | 42,361,959 | ||||||||
Class B common stock - basic and diluted | N/A | N/A | 15,555,000 | ||||||||
Calculation of basic and diluted earnings (loss) per share: | |||||||||||
Class A common stock: | |||||||||||
Dividends | $ | 1.62 | $ | 1.46 | $ | 1.34 | |||||
Undistributed loss | (1.83 | ) | (1.92 | ) | (1.90 | ) | |||||
Basic loss per share | $ | (0.22 | ) | $ | (0.46 | ) | $ | (0.56 | ) | ||
Class A common stock: | |||||||||||
Diluted loss per share | $ | (0.22 | ) | $ | (0.46 | ) | $ | (0.56 | ) | ||
Class B common stock: | |||||||||||
Deemed dividends | N/A | N/A | $ | 1.41 | |||||||
Undistributed loss | N/A | N/A | (1.90 | ) | |||||||
Basic and diluted loss per share | N/A | N/A | $ | (0.49 | ) | ||||||
Dividends declared per Class A common share | $ | 1.58 | $ | 1.43 | $ | 1.30 | |||||
Deemed dividends per Class B common share | N/A | N/A | $ | 1.41 | |||||||
17. Commitments and Contingencies
Commitments
The following table summarizes estimates of future commitments related to the various agreements that the Company has entered into (in thousands):
2017 | 2018 | 2019 | 2020 | 2021 | Thereafter | Total | ||||||||||||||||||||||
Acquisition, purchase and other commitments | $ | 269,276 | $ | 528 | $ | 436 | $ | 424 | $ | 374 | $ | 4,055 | $ | 275,093 | ||||||||||||||
Operating leases | 13,714 | 14,067 | 14,543 | 14,703 | 15,267 | 256,334 | 328,628 | |||||||||||||||||||||
Service and maintenance agreements | 53,534 | 40,908 | 34,206 | 31,374 | 31,983 | 118,198 | 310,203 | |||||||||||||||||||||
Total commitments | $ | 336,524 | $ | 55,503 | $ | 49,185 | $ | 46,501 | $ | 47,624 | $ | 378,587 | $ | 913,924 | ||||||||||||||
Acquisition, Purchase and Other Commitments
On June 30, 2016, the Company committed to acquire from Pattern Development 1.0 an 84% interest in a 324 MW wind project and a 99% interest in the associated independent 35-mile 345 kV Western Interconnect transmission line (Broadview) for a purchase price of approximately $269.0 million that the Company expects to be funded at the commencement of commercial operations, currently estimated
F-52
to occur in April 2017. In addition, the acquisition of Broadview will include an assumption of a land lease and service and maintenance agreements which have not been included in the table above.
The Company has entered into various commitments with service providers related to the Company’s projects and operations of its business. Outstanding commitments include donations to local community and government organizations.
Operating Leases
The Company has entered into various long-term operating lease agreements related to lands for its wind farms. For the years ended December 31, 2016, 2015 and 2014, the Company recorded rent expenses of $13.1 million, $12.0 million and $8.8 million, respectively, in project expense in its consolidated statements of operations.
On February 3, 2016, the Company entered into a lease agreement for office facilities in Houston, Texas, effective August 2016, to replace the Pattern Development 1.0 leased office facilities which expired in June 2016. In addition, effective January 1, 2016, Pattern Development 1.0 assigned to the Company, all of Pattern Development 1.0’s rights, title, commitments and interest under an office lease, dated as of September 9, 2009, with respect office space in San Francisco. As a result of this lease assignment, the Company assumed remaining rental commitments under the lease plus certain annual operating expense reimbursements and customary security deposits. Concurrently with the lease assignment, the Company entered into an extension through 2026 of the office lease, which previously terminated at the end of February 2017. Total future commitments are included in operating leases in the table above. For the year ended December 31, 2016, the Company recorded office lease expense of $2.9 million in general and administrative expense and $0.1 million in project expense in its consolidated statements of operations.
Service and Maintenance Agreements
The Company has entered into service and maintenance agreements with third party contractors to provide turbine operations and maintenance services and modifications and upgrades for varying periods over the next 18 years. The computation of outstanding commitments includes an estimated annual price adjustment for inflation of 2%, where applicable. For the years ended December 31, 2016, 2015 and 2014, the Company recorded service and maintenance expense under these agreements of $53.4 million, $42.9 million and $26.7 million, respectively, in project expense in its consolidated statements of operations.
Letters of Credit
Power Sale Agreements
The Company owns and operates wind power projects, and has entered into various long-term PSAs that terminate from 2019 to 2039. The terms of these agreements generally provide for the annual delivery of a minimum amount of electricity at fixed prices and in some cases include price escalation over the term of the agreement. Under the terms of these agreements, as of December 31, 2016, the Company issued irrevocable letters of credits to guarantee its performance for the duration of the agreements totaling $106.9 million.
Project Finance Agreements
The Company has various project finance and lease agreements which obligate the Company to provide certain reserves to enhance its credit worthiness and facilitate the availability of credit. As of December 31, 2016, the Company issued irrevocable letters of credit totaling $108.5 million to ensure performance under these various project finance agreements.
Contingencies
Turbine Operating Warranties and Service Guarantees
The Company has various turbine availability warranties from its turbine manufacturers and service guarantees from its service and maintenance providers. Pursuant to these guarantees, if a turbine operates at less than minimum availability during the guarantee period, the service provider is obligated to pay, as liquidated damages at the end of the warranty period, an amount for each percent that the turbine operates below the minimum availability threshold. In addition, pursuant to certain of these guarantees, if a turbine operates at more than a specified availability during the guarantee period, the Company has an obligation to pay a bonus to the service provider at the end of the warranty period. As of December 31, 2016, the Company recorded liabilities of $2.9 million associated with bonuses payable to turbine manufacturers and service and maintenance providers.
F-53
Legal Matters
From time to time, the Company has become involved in claims and legal matters arising in the ordinary course of business. Management is not currently aware of any matters that will have a material adverse effect on the financial position, results of operations, or cash flows of the Company.
Indemnity
The Company provides a variety of indemnities in the ordinary course of business to contractual counterparties and to its lenders and other financial partners. The Company is party to certain indemnities for the benefit of project finance lenders and tax equity partners of certain projects. These consist principally of indemnities that protect the project finance lenders from, among other things, the potential effect of any recapture by the U.S. Department of the Treasury of any amount of the Cash Grants previously received by the projects and eligibility of production tax credits and certain legal matters, limited to the amount of certain related costs and expenses.
18. Related Party Transactions
Management fees
The Company provides management services and receives a fee for such services under agreements with its joint venture investees, South Kent, Grand, K2, Armow and El Arrayán, prior to the AEI EL Arrayán acquisition on June 25, 2014, in addition to various Pattern Development subsidiaries and equity method investments which are recorded as related party revenue on the consolidated statement of operations.
Management Services Agreement and Shared Management
The Company has entered into a Multilateral Management Services Agreement (MSA) with Pattern Development 1.0 and Pattern Development 2.0 (together, the Pattern Development Companies), which provides for the Company and the Pattern Development Companies to benefit, primarily on a cost-reimbursement basis, from the parties’ respective management and other professional, technical and administrative personnel, all of whom report to the Company’s executive officers. Costs and expenses incurred at the Pattern Development Companies or their respective subsidiaries on the Company's behalf will be allocated to the Company. Conversely, costs and expenses incurred at the Company or its respective subsidiaries on the behalf of a Pattern Development Company will be allocated to the respective Pattern Development Company.
Pursuant to the MSA, certain of the Company’s executive officers, including its Chief Executive Officer (shared PEG executives), also serve as executive officers of the Pattern Development Companies and devote their time to both the Company and the Pattern Development Companies as is prudent in carrying out their executive responsibilities and fiduciary duties. The shared PEG executives have responsibilities for both the Company and the respective Pattern Development Companies and, as a result, these individuals do not devote all of their time to the Company’s business. Under the terms of the MSA, each of the respective Pattern Development Companies is required to reimburse the Company for an allocation of the compensation paid to such shared PEG executives reflecting the percentage of time spent providing services to such Pattern Development Company. The MSA costs are included in related party general and administrative and related party income, as applicable, on the consolidated statements of operations.
Employee Savings Plan
The Company participates in a 401(k) plan sponsored and maintained by Pattern Development 1.0, established on August 3, 2009 and restated on October 3, 2013. The Company also sponsors a Canadian Registered Retirement Savings Plan (RRSP), established on October 2, 2013. Participants in the plans are allowed to defer a portion of their compensation, not to exceed the respective Internal Revenue Service or Canada Revenue Agency annual allowance contribution guidelines, and are 100% vested in their respective deferrals and earnings. Participants may choose from a variety of investment options. The Company contributes 5% of base compensation to each employee’s 401(k) or RRSP account, up to the annual compensation limit. For the years ended December 31, 2016, 2015 and 2014, the Company contributed $0.7 million, $0.5 million and $0.3 million, respectively which was recorded as general and administrative expense on the consolidated statements of operations.
F-54
Related Party Transactions
The table below presents amounts due from and related parties as included in the consolidated balance sheets for the following periods (in millions):
December 31, 2016 | |||||||
2016 | 2015 | ||||||
Related party receivable: | |||||||
Amounts due from Pattern Development 1.0 | $ | 0.4 | $ | 0.2 | |||
Amounts due from Pattern Development 2.0 | 0.2 | — | |||||
Amounts due from unconsolidated investments | 0.5 | 0.5 | |||||
Total related party receivable | $ | 1.1 | $ | 0.7 | |||
Related party payable: | |||||||
Amounts due to Pattern Development 1.0 | $ | 1.3 | $ | 1.6 | |||
Total related party payable | $ | 1.3 | $ | 1.6 | |||
The table below presents the revenue and expenses recognized for management services and under the MSA, as included in the statements of operations for the following periods (in thousands):
Years Ended December 31, | |||||||||||
2016 | 2015 | 2014 | |||||||||
Related party revenue | $ | 5,793 | $ | 3,640 | $ | 3,317 | |||||
Related party income | $ | 5,074 | $ | 2,665 | $ | 2,612 | |||||
Related party general and administrative expense | $ | 9,900 | $ | 7,589 | $ | 5,787 | |||||
Purchase Agreements
During the years ended December 31, 2016 and 2015 the Company entered into the following acquisitions with Pattern Development 1.0 which are further detailed in Note 3, Acquisitions (in millions):
Acquisitions from Pattern Development 1.0 | Date of Acquisition | Purchase Price | Debt Assumed | |||||||
Armow | October 17, 2016 | $ | 132.3 | $ | 193.6 | |||||
Gulf Wind | July 28, 2015 | $ | 13.0 | $ | — | |||||
Amazon Wind Fowler Ridge | April 29, 2015 | $ | 37.5 | $ | — | |||||
K2 | June 17, 2015 | $ | 132.4 | $ | 221.8 | |||||
During the years ended December 31, 2016 and 2015 the Company made the following contingent obligation payments related to acquisitions with Pattern Development 1.0 (in millions):
Contingent obligations payments: | 2016 | 2015 | ||||||
Grand | $ | — | $ | 1.8 | ||||
K2 | $ | 4.0 | $ | — | ||||
Amazon Wind Fowler Ridge | $ | — | $ | 27.2 | ||||
F-55
19. Selected Quarterly Financial Data (Unaudited)
The following tables summarize the Company’s unaudited quarterly consolidated statements of operations for each of the eight quarters in the two year period ended December 31, 2016. The quarterly consolidated statements of operations data were prepared on a basis consistent with the audited consolidated financial statements included in this Annual Report on Form 10-K.
Quarterly financial data in thousands, except per share data:
Three months ended | ||||||||||||||||
December 31, | September 30, | June 30, | March 31, | |||||||||||||
2016 | 2016 | 2016 | 2016 | |||||||||||||
Revenue | $ | 81,061 | $ | 91,914 | $ | 93,438 | $ | 87,639 | ||||||||
Gross profit | $ | 5,490 | $ | 16,837 | $ | 16,401 | $ | 11,982 | ||||||||
Net income (loss) | $ | 3,445 | $ | (11,050 | ) | $ | (15,646 | ) | $ | (29,048 | ) | |||||
Net loss attributable to noncontrolling interest | $ | (10,350 | ) | $ | (7,037 | ) | $ | (12,423 | ) | $ | (5,378 | ) | ||||
Net income (loss) attributable to Pattern Energy | $ | 13,795 | $ | (4,013 | ) | $ | (3,223 | ) | $ | (23,670 | ) | |||||
Basic and diluted earnings (loss) per share—Class A common stock | $ | 0.16 | $ | (0.05 | ) | $ | (0.04 | ) | $ | (0.32 | ) | |||||
Cash dividends declared per Class A common share | $ | 0.41 | $ | 0.40 | $ | 0.39 | $ | 0.38 | ||||||||
Three months ended | ||||||||||||||||
December 31, | September 30, | June 30, | March 31, | |||||||||||||
2015 | 2015 | 2015 | 2015 | |||||||||||||
Revenue | $ | 90,597 | $ | 89,697 | $ | 84,671 | $ | 64,866 | ||||||||
Gross profit | $ | 16,674 | $ | 22,250 | $ | 22,348 | $ | 10,564 | ||||||||
Net income (loss) | $ | (3,873 | ) | $ | (35,332 | ) | $ | 5,657 | $ | (22,059 | ) | |||||
Net loss attributable to noncontrolling interest | $ | (6,327 | ) | $ | (5,927 | ) | $ | (8,660 | ) | $ | (2,160 | ) | ||||
Net income (loss) attributable to Pattern Energy | $ | 2,454 | $ | (29,405 | ) | $ | 14,317 | $ | (19,899 | ) | ||||||
Basic and diluted earnings (loss) per share—Class A common stock | $ | 0.03 | $ | (0.40 | ) | $ | 0.21 | $ | (0.30 | ) | ||||||
Cash dividends declared per Class A common share | $ | 0.37 | $ | 0.36 | $ | 0.35 | $ | 0.34 | ||||||||
20. Subsequent Events
On February 24, 2017, the Company approved an increased dividend for the first quarter 2017, payable on April 28, 2017, to holders of record on March 31, 2017, in the amount of $0.41375 per Class A share, which represents $1.655 on an annualized basis. This represents a 1.4% increase from the fourth quarter of 2016.
In January 2017, the Company issued unsecured senior notes with an aggregate principal amount of $350.0 million (the 2024 Unsecured Senior Notes). Net proceeds to the Company were approximately $345.0 million, after deducting the initial purchasers’ discount, commissions and transaction expenses. The 2024 Unsecured Senior Notes bear interest at a rate of 5.875% per year, payable semiannually in arrears on February 1 and August 1, beginning on August 1, 2017 and maturing on February 1, 2024, unless repurchased or redeemed at an earlier date. The 2024 Unsecured Senior Notes are guaranteed on a senior unsecured basis by Pattern US Finance Company, one of the Company's subsidiaries.
F-56
Schedule I—Condensed Parent-Company Financial Statements
Pattern Energy Group Inc.
Condensed Financial Information of Parent
Balance Sheets
(In thousands of U.S. dollars, except share data)
December 31, 2016 | December 31, 2015 | ||||||
Assets | |||||||
Current assets: | |||||||
Cash and cash equivalents | $ | 12,014 | $ | 26,938 | |||
Related party receivable | 4,653 | 3,050 | |||||
Derivative assets, current | 1,369 | 3,482 | |||||
Prepaid expenses | 583 | 487 | |||||
Other current assets | 229 | 381 | |||||
Deferred financing costs, current, net of accumulated amortization | 11 | — | |||||
Total current assets | 18,859 | 34,338 | |||||
Restricted cash | 250 | 250 | |||||
Property, plant and equipment, net of accumulated depreciation | 4,362 | — | |||||
Investments in subsidiaries | 987,300 | 918,270 | |||||
Investments in affiliates | 233,294 | 116,473 | |||||
Derivative assets | 177 | 628 | |||||
Deferred financing costs, net of accumulated amortization | 75 | — | |||||
Intangible assets, net of accumulated amortization | 1,052 | — | |||||
Other assets | 138 | — | |||||
Total assets | $ | 1,245,507 | $ | 1,069,959 | |||
Liabilities and equity | |||||||
Current liabilities: | |||||||
Accounts payable and other accrued liabilities | $ | 9,107 | $ | 7,590 | |||
Related party payable | 1,310 | 1,643 | |||||
Accrued interest | 4,328 | 3,842 | |||||
Dividend payable | 35,960 | 28,022 | |||||
Derivative liabilities, current | 391 | — | |||||
Total current liabilities | 51,096 | 41,097 | |||||
Long-term debt, net of financing costs of $5,468 and $5,014 as of December 31, 2016 and 2015, respectively | 202,910 | 197,362 | |||||
Other long-term liabilities | 4,003 | — | |||||
Total liabilities | 258,009 | 238,459 | |||||
Equity: | |||||||
Class A common stock, $0.01 par value per share: 500,000,000 shares authorized; 87,410,687 and 74,644,141 shares outstanding as of December 31, 2016 and 2015, respectively | 875 | 747 | |||||
Additional paid-in capital | 1,118,200 | 955,254 | |||||
Accumulated loss | (66,710 | ) | (49,599 | ) | |||
Accumulated other comprehensive loss | (62,367 | ) | (73,325 | ) | |||
Treasury stock, at cost; 110,964 and 65,301 shares of Class A common stock as of December 31, 2016 and 2015, respectively | (2,500 | ) | (1,577 | ) | |||
Total equity | 987,498 | 831,500 | |||||
Total liabilities and equity | $ | 1,245,507 | $ | 1,069,959 | |||
See accompanying notes to parent company financial statements
S- 1
Pattern Energy Group Inc.
Condensed Financial Information of Parent
Statements of Operations and Comprehensive Income (Loss)
(In thousands of U.S. dollars)
Year ended December 31, | |||||||||||
2016 | 2015 | 2014 | |||||||||
Revenue | $ | — | $ | — | $ | — | |||||
Expenses | 39,206 | 29,483 | 23,089 | ||||||||
Operating loss | (39,206 | ) | (29,483 | ) | (23,089 | ) | |||||
Other income (expense): | |||||||||||
Interest expense | (14,692 | ) | (6,107 | ) | — | ||||||
Earnings (loss) from subsidiaries | 3,054 | (19,058 | ) | 18,064 | |||||||
Earnings (loss) from affiliates | 30,192 | 16,119 | (25,295 | ) | |||||||
Gain (loss) on undesignated derivatives, net | (1,496 | ) | 5,107 | — | |||||||
Related party income | 5,074 | 2,665 | 2,612 | ||||||||
Other expenses, net | 130 | (1,558 | ) | (3,566 | ) | ||||||
Other income (expense), net | 22,262 | (2,832 | ) | (8,185 | ) | ||||||
Net income (loss) before income tax | (16,944 | ) | (32,315 | ) | (31,274 | ) | |||||
Tax provision | 167 | 218 | 16 | ||||||||
Net loss | (17,111 | ) | (32,533 | ) | (31,290 | ) | |||||
Other comprehensive income (loss): | |||||||||||
Proportionate share of subsidiaries' other comprehensive income (loss), net of tax benefit of ($53), $1,206 and $514, respectively | 5,325 | (16,085 | ) | (30,724 | ) | ||||||
Proportionate share of affiliates' other comprehensive income (loss) activity, net of tax benefit (provision) of ($2,031), $1,524 and $1,855, respectively | 5,633 | (4,228 | ) | (5,991 | ) | ||||||
Total other comprehensive income (loss), net of tax | 10,958 | (20,313 | ) | (36,715 | ) | ||||||
Comprehensive income (loss) | $ | (6,153 | ) | $ | (52,846 | ) | $ | (68,005 | ) | ||
See accompanying notes to parent company financial statements
S- 2
Pattern Energy Group Inc.
Condensed Financial Information of Parent
Condensed Statements of Cash Flows
(In thousands of U.S. dollars)
Year ended December 31, | |||||||||||
2016 | 2015 | 2014 | |||||||||
Operating activities | |||||||||||
Net loss | $ | (17,111 | ) | $ | (32,533 | ) | $ | (31,290 | ) | ||
Adjustments to reconcile net loss to net cash used in operating activities: | |||||||||||
Depreciation and accretion | 198 | — | — | ||||||||
Amortization of financing costs | 1,102 | 472 | — | ||||||||
Amortization of debt discount | 4,428 | 1,794 | — | ||||||||
Gain on derivatives | 2,955 | (4,110 | ) | — | |||||||
Stock-based compensation | 5,391 | 4,462 | 4,105 | ||||||||
Net loss on transactions | — | — | 1,473 | ||||||||
(Earnings) loss from subsidiaries | (3,054 | ) | 19,058 | (18,064 | ) | ||||||
(Earnings) loss from affiliates | (30,192 | ) | (16,119 | ) | 25,295 | ||||||
Other reconciling items | (493 | ) | — | — | |||||||
Changes in operating assets and liabilities: | |||||||||||
Prepaid expenses | (97 | ) | 35 | (93 | ) | ||||||
Other current assets | (14 | ) | 43 | (3,452 | ) | ||||||
Other assets (non-current) | (138 | ) | — | — | |||||||
Accounts payable and other accrued liabilities | 1,691 | 473 | 1,999 | ||||||||
Long-term liabilities | 3,713 | — | — | ||||||||
Related party receivable/payable | (1,935 | ) | (183 | ) | (639 | ) | |||||
Accrued interest payable | 486 | 3,842 | — | ||||||||
Net cash used in operating activities | (33,070 | ) | (22,766 | ) | (20,666 | ) | |||||
Investing activities | |||||||||||
Cash paid for acquisitions, net of cash acquired | (65,042 | ) | — | ||||||||
Capital expenditures | (3,889 | ) | — | — | |||||||
Distributions received from subsidiaries | 307,978 | 244,969 | 108,581 | ||||||||
Contribution to subsidiaries | (449,710 | ) | (613,089 | ) | (362,533 | ) | |||||
Other assets | (1,236 | ) | — | — | |||||||
Other investing activities | (172 | ) | — | — | |||||||
Net cash used in investing activities | (147,029 | ) | (433,162 | ) | (253,952 | ) | |||||
S- 3
Year ended December 31, | |||||||||||
2016 | 2015 | 2014 | |||||||||
Financing activities | |||||||||||
Proceeds from public offering, net of expenses | 286,298 | 317,432 | 286,757 | ||||||||
Proceeds from issuance of convertible senior notes, net of issuance costs | — | 218,929 | — | ||||||||
Proceeds from exercise of stock options | — | — | 327 | ||||||||
Refund for deposit for letters of credit | — | 3,425 | — | ||||||||
Repurchase of shares for employee tax withholding | (923 | ) | (860 | ) | (693 | ) | |||||
Dividends paid | (120,207 | ) | (90,582 | ) | (52,344 | ) | |||||
Payment for deferred equity issuance costs | — | — | (433 | ) | |||||||
Other financing activities | 7 | — | — | ||||||||
Net cash provided by financing activities | 165,175 | 448,344 | 233,614 | ||||||||
Net change in cash, cash equivalents and restricted cash | (14,924 | ) | (7,584 | ) | (41,004 | ) | |||||
Cash, cash equivalents and restricted cash at beginning of period | 27,188 | 34,772 | 75,776 | ||||||||
Cash, cash equivalents and restricted cash at end of period | $ | 12,264 | $ | 27,188 | $ | 34,772 | |||||
Supplemental disclosures | |||||||||||
Cash payments for income taxes | $ | 167 | $ | 218 | $ | 16 | |||||
Equity issuance costs paid in prior period related to current period offerings | $ | — | $ | 433 | $ | — | |||||
Cash payments for interest expense, net of capitalized interest | $ | 8,675 | $ | — | $ | — | |||||
Schedule of non-cash activities | |||||||||||
Non-cash increase in additional paid-in capital from buyout of noncontrolling interests | $ | — | $ | 16,715 | $ | — | |||||
See accompanying notes to parent company financial statements
S- 4
Pattern Energy Group Inc.
Note to Parent Company Financial Statements
Supplemental Notes
1. Summary of Significant Accounting Policies
Basis of Presentation
The condensed, standalone financial statements of Pattern Energy Group Inc. (parent company) have been presented in accordance with Rule 12-04, Schedule I of Regulation S-X as the restricted net assets of the subsidiaries of the parent company exceed 25% of the consolidated net assets of the parent company and its subsidiaries. The condensed parent company financial statements have been prepared in accordance with United States generally accepted accounting principles and should be read in conjunction with the parent company’s consolidated financial statements and the accompanying notes thereto.
Reconciliation of Cash and Cash Equivalents and Restricted Cash as presented on the Statements of Cash Flows
Year ended December 31, | ||||||||||||
2016 | 2015 | 2014 | ||||||||||
Beginning | ||||||||||||
Cash and cash equivalents at beginning of period | $ | 26,938 | $ | 34,772 | $ | 75,776 | ||||||
Restricted cash | 250 | — | — | |||||||||
Cash, cash equivalents and restricted cash | 27,188 | 34,772 | 75,776 | |||||||||
Ending | ||||||||||||
Cash and cash equivalents at end of period | 12,014 | 26,938 | 34,772 | |||||||||
Restricted cash | 250 | 250 | — | |||||||||
Cash, cash equivalents and restricted cash | 12,264 | 27,188 | 34,772 | |||||||||
Net change in cash, cash equivalents and restricted cash | $ | (14,924 | ) | $ | (7,584 | ) | $ | (41,004 | ) | |||
Investments
For purposes of these financial statements, the parent company’s wholly owned and majority owned subsidiaries are recorded based on its proportionate share of the subsidiaries’ assets. The parent company’s share of net income of its unconsolidated subsidiaries is included in income using the equity method.
Debt
2024 Unsecured Senior Notes
In January 2017, the Company issued unsecured senior notes with an aggregate principal amount of $350.0 million (the 2024 Unsecured Senior Notes). Net proceeds to the Company were approximately $345.0 million, after deducting the initial purchasers’ discount, commissions and transaction expenses. The 2024 Unsecured Senior Notes bear interest at a rate of 5.875% per year, payable semiannually in arrears on February 1 and August 1, beginning on August 1, 2017 and maturing on February 1, 2024, unless repurchased or redeemed at an earlier date. The 2024 Unsecured Senior Notes are guaranteed on a senior unsecured basis by Pattern US Finance Company, one of the Company's subsidiaries.
Convertible Senior Notes due 2020
In July 2015, the Company issued $225 million aggregate principal amount of 4.00% convertible senior notes due 2020 (2020 Notes). The 2020 Notes bear interest at a rate of 4.00% per year, payable semiannually in arrears on January 15 and July 15 of each year, beginning on January 15, 2016. The 2020 Notes will mature on July 15, 2020. The 2020 Notes were sold in a private placement. Upon conversion, the Company may, at its discretion, pay cash, shares of the Company’s Class A common stock, or a combination of cash and stock. The 2020 Notes are set at an initial conversation rate of 35.4925 shares of Class A common stock per $1,000 principal amount of 2020 Notes,
which is equivalent to an initial conversion price of approximately $28.175 per share of Class A common stock. The conversion rate is subject to adjustment in some events (including, but not limited to, certain cash dividends made to holders of the Company's Class A common stock which exceed the initial dividend threshold of $0.363 per quarter per share). The conversion rate would be adjusted to offset the effect of the portion of the dividend in excess of $0.363, provided that the adjustment would result a change of at least 1% in the then effective conversion rate. As of December 31, 2016, no adjustment was required. The conversion rate will not be adjusted for any accrued and unpaid interest. The 2020 Notes are not redeemable prior to maturity.
The 2020 Notes are guaranteed on a senior unsecured basis by a subsidiary of the Company and are general unsecured obligations of the Company. The obligations rank senior in rights of payment to the Company’s subordinated debt, equal in right of payment to the Company’s unsubordinated debt and effectively junior in right of payment to any of the Company’s secured indebtedness to the extent of the value of the assets securing such indebtedness.
The following table presents a summary of the equity and liability components of the 2020 Notes (in thousands):
December 31, | |||||||
2016 | 2015 | ||||||
Principal | $ | 225,000 | $ | 225,000 | |||
Less: | |||||||
Unamortized debt discount | (18,196 | ) | (22,624 | ) | |||
Unamortized financing costs | (3,894 | ) | (5,014 | ) | |||
Carrying value of convertible senior notes | $ | 202,910 | $ | 197,362 | |||
Carrying value of the equity component (1) | $ | 23,743 | $ | 23,743 | |||
(1) | Included in the consolidated balance sheets as additional paid-in capital, net of $0.7 million in equity issuance costs. |
During the year ended December 31, 2016, in relation to the 2020 Notes, the Company recorded $9.2 million, $1.1 million and $4.4 million related to the contractual coupon interest, amortization of financing costs and amortization of debt discount, respectively, in interest expense in its consolidated statements of operations.
Commitments
Operating Leases
2017 | 2018 | 2019 | 2020 | 2021 | Thereafter | Total | |||||||||||||||
Operating leases | 2,840,928 | 4,875,989 | 5,402,911 | 5,541,779 | 5,684,289 | 27,350,251 | 51,696,147 | ||||||||||||||
On February 3, 2016, the Company entered into a lease agreement for office facilities in Houston, Texas, effective August 2016, to replace the Pattern Development 1.0-leased office facilities which expired in June 2016. In addition, effective January 1, 2016, Pattern Development 1.0 assigned to the Company, all of Pattern Development 1.0’s rights, title, commitments and interest under an office lease, dated as of September 9, 2009, with respect office space in San Francisco. As a result of this lease assignment, the Company assumed remaining rental commitments under the lease plus certain annual operating expense reimbursements and customary security deposits. Concurrently with the lease assignment, the Company entered into an extension through 2026 of the office lease, which previously terminated at the end of February 2017. Total future commitments are included in operating leases in the table above.
S- 6
South Kent Wind LP
Financial Statements
December 31, 2016, 2015 and 2014
(In thousands of Canadian Dollars)
S- 7
South Kent Wind LP
S- 8

March 1, 2017
Independent auditor’s report
To the Partners of
South Kent Wind LP
We have audited the accompanying balance sheets of South Kent Wind LP as of December 31, 2016 and 2015 and the related statement of operations and comprehensive income (loss), changes in partners’ equity, and cash flows for each of the years in the three-year period ended December 31, 2016. Management is responsible for these financial statements. Our responsibility is to express an opinion on these financial statements based on our audits.
We conducted our audits in accordance with the standards of the Public Company Accounting Oversight Board (United States). Those standards require that we plan and perform the audit to obtain reasonable assurance about whether the financial statements are free of material misstatement. Our audits of the financial statements included examining, on a test basis, evidence supporting the amounts and disclosures in the financial statements, assessing the accounting principles used and significant estimates made by management, and evaluating the overall financial statement presentation. We were not engaged to perform an audit of the company’s internal control over financial reporting. Our audits included consideration of internal control over financial reporting as a basis for designing audit procedures that are appropriate in the circumstances, but not for the purpose of expressing an opinion on the effectiveness of the company’s internal control over financial reporting. Accordingly, we express no such opinion. Our audits also included performing such other procedures as we considered necessary in the circumstances. We believe that our audits provide a reasonable basis for our opinion.
In our opinion, the financial statements referred to above present fairly, in all material respects, the financial position of South Kent Wind LP as of December 31, 2016 and 2015 and the results of its operations and its cash flows for each of the years in the three-year period ended December 31, 2016 in conformity with accounting principles generally accepted in the United States of America.
/s/ PricewaterhouseCoopers LLP
Chartered Professional Accountants, Licensed Public Accountants
PricewaterhouseCoopers LLP
PwC Tower, 18 York Street, Suite 2600, Toronto, Ontario, Canada M5J 0B2
T: +1 416 863 1133, F: +1 416 365 8215, www.pwc.com/ca
“PwC” refers to PricewaterhouseCoopers LLP, an Ontario limited liability partnership.
S- 9
South Kent Wind LP
Balance Sheets
As of December 31, 2016 and 2015
(In thousands of Canadian Dollars)
2016 | 2015 | |||||||
ASSETS | ||||||||
Current assets: | ||||||||
Cash and cash equivalents | $ | 16,074 | $ | 23,370 | ||||
Restricted cash (note 3) | 2,057 | 6,551 | ||||||
Accrued revenue (note 2) | 21,706 | 18,167 | ||||||
Other current assets | 429 | 448 | ||||||
Total current assets | 40,266 | 48,536 | ||||||
Property, plant and equipment - net of accumulated depreciation of $86,966 and $57,634 in 2016 and 2015, respectively (note 4) | 650,010 | 679,183 | ||||||
Intangible assets - net of accumulated amortization of $770 and $727 in 2016 and 2015, respectively (note 5) | 668 | 711 | ||||||
Total assets | $ | 690,944 | $ | 728,430 | ||||
LIABILITIES & EQUITY | ||||||||
Current liabilities: | ||||||||
Accounts payable and other accrued liabilities | $ | 2,705 | $ | 6,220 | ||||
Accounts payable and other accrued liabilities - related parties (note 11) | 193 | 190 | ||||||
Current portion of long-term debt, net of financing costs of $3,426 and $3,546 in 2016 and 2015, respectively (notes 2 and 6) | 22,347 | 18,564 | ||||||
Current portion of long-term contingent liabilities (note 10) | 1,050 | 1,021 | ||||||
Derivative liabilities, current (note 8) | 11,397 | 12,835 | ||||||
Other current liabilities | 160 | - | ||||||
Total current liabilities | 37,852 | 38,830 | ||||||
Long-term debt, net of financing costs of $11,391 and $14,817 in 2016 and 2015, respectively (notes 2 and 6) | 604,550 | 626,897 | ||||||
Long-term contingent liabilities, net of current (note 10) | 8,000 | 8,500 | ||||||
Derivative liabilities (note 8) | 36,876 | 38,707 | ||||||
Asset retirement obligation (note 7) | 6,153 | 5,829 | ||||||
Total liabilities | 693,431 | 718,763 | ||||||
Commitments and contingencies (note 10) | ||||||||
Equity: | ||||||||
Partners’ capital | (61,730) | 2,700 | ||||||
Accumulated net income | 59,243 | 6,967 | ||||||
Total partners’ equity | (2,487) | 9,667 | ||||||
Total liabilities and equity | $ | 690,944 | $ | 728,430 | ||||
See accompanying notes to financial statements.
S- 10
South Kent Wind LP
Statements of Operations and Comprehensive Income (Loss)
For the years ended December 31, 2016, 2015 and 2014
(In thousands of Canadian Dollars)
2016 | 2015 | 2014 | ||||||||||
Revenue (note 2): | ||||||||||||
Energy delivered | $ | 87,142 | $ | 102,076 | $ | 72,633 | ||||||
Compensation for forgone energy | 38,326 | 22,345 | 10,749 | |||||||||
Other revenue | 2,297 | 2,981 | 1,597 | |||||||||
Total revenue | 127,765 | 127,402 | 84,979 | |||||||||
Cost of revenue: | ||||||||||||
Project expenses | 13,064 | 13,232 | 9,715 | |||||||||
Project expenses - related parties (note 11) | 1,469 | 1,446 | 1,075 | |||||||||
Depreciation, amortization and accretion | 29,698 | 29,710 | 28,493 | |||||||||
Total cost of revenue | 44,231 | 44,388 | 39,283 | |||||||||
Gross profit | 83,534 | 83,014 | 45,696 | |||||||||
Operating expenses: | ||||||||||||
General and administrative | 504 | 929 | 756 | |||||||||
General and administrative - related parties (note 11) | 516 | 507 | 463 | |||||||||
Total operating expenses | 1,020 | 1,436 | 1,219 | |||||||||
Operating income | 82,514 | 81,578 | 44,477 | |||||||||
Other expense: | ||||||||||||
Interest expense (note 6) | (32,596) | (35,342) | (29,133) | |||||||||
Unrealized gain (loss) on derivatives (note 8) | 3,269 | (18,428) | (52,057) | |||||||||
Other expense, net | (912) | (1,099) | (290) | |||||||||
Total other expense | (30,238) | (54,869) | (81,480) | |||||||||
Net income (loss) | 52,276 | 26,709 | (37,003) | |||||||||
Other comprehensive income | - | - | - | |||||||||
Comprehensive income (loss) | $ | 52,276 | $ | 26,709 | $ | (37,003 | ) | |||||
See accompanying notes to financial statements.
S- 11
South Kent Wind LP
Statements of Changes in Partners’ Equity
For the years ended December 31, 2016, 2015 and 2014
(In thousands of Canadian Dollars)
Partners’ capital | Accumulated net income (loss) | Total | ||||||||||
Balance at January 1, 2014 | $ | 103,164 | $ | 17,261 | $ | 120,425 | ||||||
Cash distribution | (49,752) | - | (49,752) | |||||||||
Net loss | - | (37,003) | (37,003) | |||||||||
Balance at December 31, 2014 | 53,412 | (19,742) | 33,670 | |||||||||
Cash distribution | (50,712) | - | (50,712) | |||||||||
Net income | - | 26,709 | 26,709 | |||||||||
Balance at December 31, 2015 | 2,700 | 6,967 | 9,667 | |||||||||
Cash distribution | (64,430) | - | (64,430) | |||||||||
Net income | - | 52,276 | 52,276 | |||||||||
Balance at December 31, 2016 | $ | (61,730 | ) | $ | 59,243 | $ | (2,487 | ) | ||||
See accompanying notes to financial statements.
S- 12
South Kent Wind LP
Statements of Cash Flows
For the years ended December 31, 2016, 2015 and 2014
(In thousands of Canadian Dollars)
2016 | 2015 | 2014 | ||||||||||
Cash flows from operating activities: | ||||||||||||
Net income (loss) | $ | 52,276 | $ | 26,709 | $ | (37,003 | ) | |||||
Adjustment to reconcile net income (loss) to net cash provided by (used in) operating activities: | ||||||||||||
Unrealized loss (gain) on derivatives | (3,269) | 18,428 | 52,057 | |||||||||
Depreciation, amortization and accretion | 29,698 | 29,710 | 28,493 | |||||||||
Amortization of deferred financing costs | 3,546 | 3,388 | 2,184 | |||||||||
Interest expense added on principal | - | - | 8,092 | |||||||||
Changes in assets and liabilities, net: | ||||||||||||
Accrued revenue | (3,539) | (2,204) | (15,963) | |||||||||
Accounts payable and other accrued liabilities | 103 | (2,555) | 3,628 | |||||||||
Other, net | 182 | 168 | 724 | |||||||||
Net cash provided by operating activities | 78,997 | 73,644 | 42,212 | |||||||||
Cash flows from investing activities: | ||||||||||||
Capital expenditures | (4,247) | (247) | (113,235) | |||||||||
Decrease in restricted cash | 4,494 | 8,302 | 34,612 | |||||||||
Increase in restricted cash | (1) | (836) | (21,741) | |||||||||
Net cash provided by (used in) investing activities | 246 | 7,219 | (100,364) | |||||||||
Cash flows from financing activities: | ||||||||||||
Proceeds from long-term debt | - | 5,106 | 126,106 | |||||||||
Repayment of long-term debt | (22,109) | (23,185) | (1,914) | |||||||||
Deferred financing costs paid | - | (5,129) | - | |||||||||
Distribution to partners | (64,430) | (50,712) | (49,752) | |||||||||
Net cash (used in) provided by financing activities | (86,539) | (73,920) | 74,440 | |||||||||
Net change in cash and cash equivalents | (7,296) | 6,943 | 16,288 | |||||||||
Cash and cash equivalents - Beginning of year | 23,370 | 16,427 | 139 | |||||||||
Cash and cash equivalents - End of year | $ | 16,074 | $ | 23,370 | $ | 16,427 | ||||||
Supplemental disclosure: | ||||||||||||
Cash payments for interest and commitment fees | $ | 28,894 | $ | 31,954 | $ | 17,422 | ||||||
See accompanying notes to financial statements.
S- 13
South Kent Wind LP
Statements of Cash Flows
For the years ended December 31, 2016, 2015 and 2014
(In thousands of Canadian Dollars)
2016 | 2015 | 2014 | ||||||||||
Schedule of non-cash activities: | ||||||||||||
Remeasurement of asset retirement obligation | $ | — | $ | 1,027 | $ | — | ||||||
Accrued construction costs | $ | — | $ | — | 3,586 | |||||||
Construction loan - capitalized interest | $ | — | $ | — | 4,987 | |||||||
Capitalized depreciation and amortization | $ | — | $ | — | $ | 601 | ||||||
See accompanying notes to financial statements.
S- 14
South Kent Wind LP
Notes to Financial Statements
December 31, 2016 and 2015
(In thousands of Canadian Dollars)
1 | General information |
The Partnership
South Kent Wind LP (the Partnership), a limited partnership under the laws of the Province of Ontario, was formed on January 10, 2011, as a joint venture project between Samsung Renewable Energy Inc. (Samsung) and Pattern South Kent LP Holdings LP, a subsidiary of Pattern Renewable Holdings Canada ULC (PRHC), each as 49.99% limited partners of the Partnership, and South Kent Wind GP Inc. (the GP), as the 0.02% general partner of the Partnership. The Partnership was created to develop, build and operate a wind power project in the Regional Municipality of Chatham-Kent with generation capacity totaling approximately 270 megawatts (MW) of power (the Project).
On February 24, 2013, Samsung transferred all of its LP interest in the Partnership to SRE SKW LP Holdings LP, an affiliate of Samsung.
On October 2, 2013, in a series of transactions: (i) Pattern South Kent GP Holdings Inc., a wholly owned subsidiary of PRHC, transferred all of the general partner interests in Pattern South Kent LP Holdings LP to PRHC, causing Pattern South Kent LP Holdings LP to be dissolved by operation of law and PRHC to acquire the LP interests in the Partnership that previously were held by Pattern South Kent LP Holdings LP; (ii) PRHC transferred its LP interest in the Partnership and its ownership interest in Pattern South Kent GP Holdings Inc., which owned PRHC’s ownership interest in the GP, to Pattern Canada Operations Holdings ULC (PCOH), a wholly owned subsidiary of Pattern Energy Group Inc. (Pattern); and (iii) Pattern South Kent GP Holdings Inc. was dissolved.
On December 17, 2014, PCOH transferred all of its LP interest in the Partnership to Pattern Canada Finance Company ULC, a wholly owned subsidiary of PCOH.
The Partnership is controlled by its general partner, the GP, also a joint venture controlled by affiliates of Samsung and Pattern. As of December 31, 2016 and 2015, the Partnership’s ownership interests were distributed as follows:
2016 | 2015 | |||
SRE SKW LP Holdings LP | 49.99% | 49.99% | ||
Pattern Canada Finance Company ULC | 49.99 | 49.99 | ||
South Kent Wind GP Inc. | 0.02 | 0.02 | ||
Total | 100.00% | 100.00% | ||
The Project
The Project is a 270 MW wind project consisting of 124 Siemens wind turbine generators located in the Regional Municipality of Chatham-Kent, Ontario. On March 28, 2014 the Project achieved COD and commenced commercial operations.
The Partnership has a power purchase agreement (PPA) with the Independent Electricity System Operator (IESO) for a period of 20 years from the COD. The IESO oversees the wholesale electricity market, where the price of energy is determined. It also administers the rules that govern the market and, through an arm's-length market monitoring function, ensures that it is operated fairly and efficiently. The IESO is an agent among the market participants in Ontario and is neither exposed to, nor benefits from, any transactions. In such capacity, the IESO executes agreements to help the market meet the renewable energy mandates of the government of the Province of Ontario. There are approximately 70 electric distribution companies in Ontario, all of which have government mandates to purchase renewable energy. The PPA provides for guaranteed pricing from IESO that removes volatility caused by fluctuations in market rates. The Ontario government established the Global Adjustment (GA) which is designed to adjust consumer rates depending on the price of energy. The IESO establishes a monthly variable GA rate based on GA costs and Ontario electricity demand which effectively establishes a pass through mechanism to the consumer and eliminates the IESO's economic exposure to our contract price.
S- 15
South Kent Wind LP
Notes to Financial Statements
December 31, 2016 and 2015
(In thousands of Canadian Dollars)
2 Summary of significant accounting policies
The principal accounting policies applied in the preparation of these financial statements are set out below. These policies have been consistently applied to the periods presented, unless otherwise stated.
Basis of preparation
The accompanying financial statements are presented using accounting principles generally accepted in the United States of America (U.S. GAAP). The preparation of U.S. GAAP financial statements requires management to make certain estimates and assumptions that affect the reported amounts of assets and liabilities and the disclosure of contingent assets and liabilities at the date of the financial statements and the reported amounts of revenue and expenses during the reporting period. Because the use of estimates is inherent in the financial reporting process, actual results could differ from those estimates.
In recording transactions and balances resulting from business operations, the Partnership uses estimates based on the best information available. Estimates are used for such items as accrued revenue, asset retirement obligation, valuation of derivative contracts and acquisition of contingencies.
These financial statements do not include assets, liabilities, revenue and expenses of the GP and limited partners. The financial statements of the Partnership reflect no provision or liability for income taxes because profits and losses of the Partnership are allocated to the partners and are included in the income tax returns of the partners. Income and losses for tax purposes may differ from the financial statement amounts and the partners’ equity reflected in the financial statements does not necessarily reflect their tax basis.
Functional and presentation currency
Items included in the financial statements of the Partnership are measured using the currency of the primary economic environment in which the Partnership operates (the functional currency). The financial statements are presented in Canadian Dollars, which is the Partnership’s functional and presentation currency.
Fair value of financial instruments
ASC 820, Fair Value Measurements, defines fair value as the price at which an asset could be exchanged or a liability transferred in an orderly transaction between knowledgeable, willing parties in the principal or most advantageous market for the asset or liability. Where available, fair value is based on observable market prices or derived from such prices. Where observable prices or inputs are not available, valuation models are applied. These valuation techniques involve some level of management estimation and judgment, the degree of which is dependent on the price transparency for the instruments or market and the instruments’ complexity.
Cash and cash equivalents
Cash and cash equivalents include cash on hand, deposits held at call with banks and other short-term highly liquid investments with original maturities of three months or less.
Restricted cash
Restricted cash mainly consists of cash reserves required under the Partnership’s loan agreements and security deposits required to collateralize commercial bank letter of credit facilities related to easement rights (note 3).
Trade receivables
The Partnership’s trade receivables are generated by selling energy in Ontario, Canada through the IESO as a settlement agent. The allowance for doubtful accounts, if needed, is computed based upon management’s estimates of uncollectible accounts. As of December 31, 2016 and 2015, the Partnership has no outstanding trade receivables.
S- 16
South Kent Wind LP
Notes to Financial Statements
December 31, 2016 and 2015
(In thousands of Canadian Dollars)
Accrued revenue
Accrued revenue represents revenues recognized on contracts for which billings have not been presented to customers as of the balance sheet date. These amounts are billed and generally collected within two months.
Concentration of credit risk
Financial instruments that potentially subject the Partnership to concentrations of credit risk consist primarily of cash and cash equivalents and restricted cash. The Partnership places its cash and cash equivalents and restricted cash with creditworthy institutions located in Canada, which the management believes to have minimal risk. At times, such balances may be in excess of the Canada Deposit Insurance Corporation (CDIC) insurance coverage limit. CDIC insurance currently covers up to $100 per depositor at each insured bank.
The Partnership’s derivative agreements expose the Partnership to losses under certain circumstances, such as the counterparty defaulting on its obligations under the swap agreements or if the swap agreements provide an imperfect hedge. Counterparties to the Partnership’s derivative contracts are major financial institutions that have been accorded investment grade ratings.
Property, plant and equipment
Property, plant and equipment are stated at historical cost, less accumulated depreciation. Historical cost includes expenditure that is directly attributable to the acquisition of the items. Subsequent costs are included in the asset’s carrying value or recognized as separate assets, as appropriate, only when it is probable that the future economic benefits associated with the item will flow to the Partnership and the cost of the item can be reliably measured.
The asset retirement obligation included in property, plant and equipment is stated at the present value of future cash flows of asset retirement obligation at the time of COD.
Depreciation on property, plant and equipment is calculated using the straight-line method to allocate their cost to their residual values over their estimated useful life. The power plant is depreciated over 25 years and the remaining assets are depreciated over 5 years. The assets’ residual values and useful lives are reviewed and adjusted, if appropriate, at the end of each reporting period. Repair and maintenance costs are expensed as incurred.
Intangible assets (lease options)
Lease options are recognized at fair value at the acquisition date and subsequently accounted for at cost. Lease options have a finite useful life and are carried at cost less accumulated amortization. Amortization is calculated using the straight-line method to allocate the cost of lease options over the period of expected future benefit (i.e., the contract period of each lease option). Separately acquired lease options are capitalized on the basis of the costs incurred to enter into the respective contract.
Impairment of long-lived assets
The Partnership periodically evaluates whether events have occurred that would require revision of the remaining useful life of equipment and improvements and purchased intangible assets or render them not recoverable. If such circumstances arise, the Partnership uses an estimate of the undiscounted value of expected future operating cash flows to determine whether the long-lived assets are impaired. If the aggregate undiscounted cash flows are less than the carrying amount of the assets, the resulting impairment charge to be recorded is calculated based on the excess of the carrying value of the assets over the fair value of such assets, with the fair value determined based on an estimate of discounted future cash flows. Through December 31, 2016, no impairment charges were recorded.
Deferred financing costs
Financing costs incurred in connection with obtaining construction and term financing, which include direct financing, legal and other upfront costs of borrowing, are capitalized and recorded as a reduction to long-term debt and amortized over the lives of the respective loans using the effective-interest method. Amortization of deferred financing costs is capitalized during construction or expensed following COD.
S- 17
South Kent Wind LP
Notes to Financial Statements
December 31, 2016 and 2015
(In thousands of Canadian Dollars)
Interest capitalization
The Partnership capitalizes interest and related financing fees from non-recourse debt used to finance projects in construction. Capitalization is discontinued when a project reaches commercial operation.
Derivatives
The Partnership recognizes its derivative instruments as either assets or liabilities in the balance sheets at fair value. The accounting for changes in the fair value (i.e., gains or losses) of a derivative instrument depends on whether it qualifies and has been designated as part of a hedging relationship and, further, on the type of hedging relationship.
For derivative instruments that are designated and qualify as a cash flow hedge (i.e., hedging the exposure to variability in expected future cash flows that are attributable to a particular risk), the effective portion of the gain or loss on the derivative instrument is reported as a component of other comprehensive income (OCI). Changes in the fair value of these derivatives are subsequently reclassified into earnings in the period the hedged transaction affects earnings. The ineffective portion of changes in fair value is recorded as a component of net income (loss) in the statements of operations and comprehensive income (loss).
For undesignated derivative instruments, their change in fair value is reported as a component of net income (loss) in the statements of operations and comprehensive income (loss).
The Partnership enters into derivative transactions for the purpose of managing exposure to fluctuations in interest rates, such as interest rate swaps. Interest rate swaps are instruments used to fix the interest rate on variable interest rate debt.
Accounts payable and other accrued liabilities
Trade payables are obligations to pay for goods or services that have been acquired in the ordinary course of business from suppliers. Payables with payment terms extended beyond one year from the balance sheet dates are presented as non-current liabilities.
Contingent liabilities
Contingent liabilities are recognized when: the Partnership has a present legal obligation as a result of past events; it is probable that an outflow of resources will be required to settle the obligation; and the amount has been reasonably estimated.
Asset retirement obligation
The Partnership records an asset retirement obligation for the estimated costs of decommissioning turbines, removing above-ground installations and restoring sites, at the time when a contractual decommissioning obligation materializes. The Partnership records accretion expense, which represents the increase in the asset retirement obligation, over the remaining life of the associated wind project. Accretion expense is recorded as cost of revenue in the statements of operations and comprehensive income (loss) using accretion rates based on a credit adjusted risk free interest rate of 5.54%.
Revenue recognition
Revenue is recognized based upon the amount of electricity delivered or curtailed at rates specified under the contracts, assuming all other revenue recognition criteria are met. When curtailment revenue is earned, it is recorded as compensation for forgone revenue. The Partnership evaluates its PPA to determine whether it is in substance a lease or derivative and, if applicable, recognizes revenue pursuant to ASC 840 Leases and ASC 815 Derivatives and Hedging, respectively. As of December 31, 2016, the PPA was not considered a lease or a derivative instrument, as multiple market participants purchase the energy at market-based prices with IESO working as a settlement agent. As a result, revenue (including any revenue from the price guaranteed by IESO), is recognized on an accrual basis.
The Partnership recognizes revenue under other revenue for warranty settlements and liquidated damages from a turbine manufacturer upon resolution of outstanding contingencies and for economic development adder from the IESO based on the amount of energy delivered. Any cash receipts for amounts subject to future adjustment or repayment are deferred in other liabilities until the final settlement amount is considered fixed and determinable.
S- 18
South Kent Wind LP
Notes to Financial Statements
December 31, 2016 and 2015
(In thousands of Canadian Dollars)
Cost of revenue
The Partnership’s cost of revenue is comprised of direct costs of operating and maintaining its project facilities, including labor, turbine service arrangements, metering service and shadow settlement, environmental fee, land lease royalties, property tax, insurance, depreciation, amortization and accretion.
Comprehensive income
Comprehensive income consists of net income and other comprehensive income. Other comprehensive income is included in accumulated other comprehensive income in the accompanying statements of changes in partners’ equity.
Reclassification
Certain prior period balances have been reclassified to conform to current period presentation of the Partnership’s financial statements and accompanying notes. Such reclassifications did not have an impact on net income (loss) or cash flows.
Recent accounting pronouncements
In November 2016, the FASB issued ASU 2016-18, Statement of Cash Flows (Topic 230): Restricted Cash (ASU 2016-18), which requires that a statement of cash flows explain the change during the period in the total of cash, cash equivalents, and amounts generally described as restricted cash or restricted cash equivalents. As a result, amounts generally described as restricted cash and restricted cash equivalents should be included with cash and cash equivalents when reconciling the beginning-of-period and end-of-period total amounts shown on the statement of cash flows. The amendments do not provide a definition of restricted cash or restricted cash equivalents. The Partnership is currently assessing the future impact of this guidance on its financial statements and related disclosures and expects to adopt these updates beginning January 1, 2017.
In August 2016, the FASB issued ASU 2016-15, Statement of Cash Flows (Topic 230): Classification of Certain Cash Receipts and Cash Payments (ASU 2016-15), which provides guidance on specific cash flow issues. ASU 2016-15 is effective for fiscal years beginning after December 15, 2017, and interim periods within those fiscal years. Early adoption is permitted, including adoption in an interim period. The adoption of ASU 2016-15 on December 31, 2016 did not have a material impact on the Partnership’s financial statements and related disclosures.
In June 2016, the FASB issued ASU 2016-13, Financial Instruments —Credit Losses (Topic 326): Measurement of Credit Losses on Financial Instruments (ASU 2016-13), which requires the measurement of all expected credit losses for financial assets including trade receivables held at the reporting date based on historical experience, current conditions, and reasonable and supportable forecasts. ASU 2016-13 is effective for fiscal years, and interim periods within those fiscal years, beginning after December 15, 2019. The adoption of ASU 2016-13 is not expected to have a material impact on its financial statements and related disclosures.
In May 2014, the FASB issued ASU 2014-09, which creates FASB Accounting Standards Codification (ASC) Topic 606, Revenue from Contracts with Customers and supersedes ASC Topic 605, Revenue Recognition (ASU 2014-09). The guidance replaces industry-specific guidance and establishes a single five-step model to identify and recognize revenue. The core principle of the guidance is that an entity should recognize revenue upon transfer of control of promised goods or services to customers in an amount that reflects the consideration to which an entity expects to be entitled in exchange for those goods or services. Additionally, the guidance requires the entity to disclose further quantitative and qualitative information regarding the nature and amount of revenues arising from contracts with customers, as well as other information about the significant judgments and estimates used in recognizing revenues from contracts with customers. The effective date of ASU 2014-09 was deferred by the issuance of ASU 2015-14, Revenue from Contracts with Customers: Deferral of the Effective Date, (Topic 606) by one year to make the guidance of ASU 2014-09 effective for annual reporting periods beginning after December 15, 2017, including interim periods therein. Early adoption is permitted, but not prior to the original effective date, which was for annual reporting periods beginning after December 15, 2016. In March 2016, the FASB issued ASU 2016-08, Revenue from Contracts with Customers (Topic 606) Principal versus Agent Considerations (Reporting Revenue Gross versus Net), which clarifies how to apply the implementation guidance on principal versus agent considerations related to the sale of goods or services to a customer as updated by ASU 2014-09. In April 2016, the FASB issued ASU 2016-10, Revenue from Contracts with Customers (Topic 606) Identifying Performance Obligations and Licensing, which clarifies two aspects of Topic 606: identifying performance obligations and the licensing implementation guidance, while retaining the related principles for those areas, as updated by ASU 2014-09. In May 2016, the FASB issued ASU 2016-12,
S- 19
South Kent Wind LP
Notes to Financial Statements
December 31, 2016 and 2015
(In thousands of Canadian Dollars)
Revenue from Contracts with Customers (Topic 606): Narrow-Scope Improvements and Practical Expedients (ASU 2016-12), which makes narrow scope amendments to Topic 606 including implementation issues on collectability, non-cash consideration and completed contracts at transition. In December 2016, the FASB issued ASU 2016-20, Technical Corrections and Improvements to Topic 606, "Revenue from Contracts with Customers" (ASU 2016-20), which make additional narrow scope amendments to Topic 606 including loan guarantee fees, impairment testing of contract costs, provisions for losses on construction-type and production-type contracts. The Partnership is currently assessing the future impact of this guidance on its financial statements and related disclosures and expects to adopt these updates beginning January 1, 2018.
In March 2016, the FASB issued ASU 2016-05, Derivatives and Hedging (Topic 815): Effect of Derivative Contract Novations on Existing Hedge Accounting Relationships (ASU 2016-05), which clarifies that a change in the counterparty to a derivative instrument that has been designated as the hedging instrument does not, in and of itself, require dedesignation of that hedging relationship provided that all other hedge accounting criteria remain intact. ASU 2016-05 is effective for annual periods beginning after December 15, 2017, including interim reporting periods therein, with early adoption permitted. The adoption of ASU 2016-05 on January 1, 2016 had no impact on the Partnership's financial statements and related disclosures.
In February 2016, the Financial Accounting Standards Board ("FASB") issued Accounting Standards Update ("ASU") 2016-02, "Leases," which requires lessees to recognize right-of-use assets and lease liabilities, for all leases, with the exception of short-term leases, at the commencement date of each lease. Under the new guidance, lessor accounting is largely unchanged. ASU 2016-02 simplifies the accounting for sale and leaseback transactions primarily because lessees must recognize lease assets and liabilities. ASU 2016-02 is effective for annual periods beginning after December 15, 2018, and interim periods within those annual periods. Early adoption is permitted. The amendments of this update should be applied using a modified retrospective approach, which requires lessees and lessors to recognize and measure leases at the beginning of the earliest period presented. The Partnership is currently assessing the future impact of this update on its financial statements and related disclosures and expects to adopt this update beginning January 1, 2019.
In August 2015, the FASB issued ASU 2015-14, “Revenue from Contracts with Customers: Deferral of the Effective Date” to amend ASU 2015-09 “Revenue from Contracts with Customers” to defer the effective date of ASU 2014-09 for all entities by one year. The guidance in ASU 2014-09 provides companies with a single model for use in accounting for revenue arising from contracts with customers and supersedes current revenue recognition guidance, including industry-specific revenue guidance. The core principle of the model is to recognize revenue when control of the goods or services transfers to the customer, as opposed to recognizing revenue when the risks and rewards transfer to the customer under the existing revenue guidance. As a result of this amendment, ASU 2014-09 is now effective for annual reporting periods beginning after December 15, 2018 and interim periods within those fiscal years. Early adoption is permitted only as of annual reporting periods beginning after December 15, 2015 and interim periods within those fiscal years. The guidance permits companies to either apply the requirements retrospectively to all prior periods presented, or apply the requirements in the year of adoption, through a cumulative adjustment. The Partnership is currently assessing the future impact of this update on its financial statements and related disclosures and expects to adopt this update beginning January 1, 2018.
In June 2015, the FASB issued ASU 2015-10, “Technical Corrections and Improvements” which covers a wide range of topics in the Accounting Standards Codification (the “Codification”). The amendments in this update represent changes to clarify the Codification, correct unintended application of guidance, or make minor improvements to the Codification that are not expected to have a significant effect on current accounting practice or create a significant administrative cost on most entities. The amendments in ASU 2015-10 were effective immediately upon issuance and the adoption did not have material impact on the Partnership's financial statements and related disclosures.
In April 2015, the Financial Accounting Standard Board (FASB) issued ASU 2015-03, “Interest – Imputation of Interest: Simplifying the Presentation of Debt Issuance Costs” to simplify the presentation of debt issuance costs by requiring that debt issuance costs related to a recognized debt liability be presented in the balance sheet as a direct deduction from the carrying amount of the debt liability, consistent with debt discounts. The recognition and measurement guidance for debt issuance costs are not affected by the amendments in this ASU. ASU 2015-03 is effective for public companies for fiscal years beginning after December 15, 2015, and interim periods within those fiscal years and should be applied retrospectively. Early adoption is permitted for financial statements that have not been previously issued. Upon transition, an entity is required to comply with the applicable disclosures for a change in accounting principle. The Partnership adopted ASU 2015-03 in April 2015 and applied the change in accounting principle to the financial statements as of December 31, 2015. As a result, the Partnership reclassified $18,363 and $16,621 in total deferred financing costs to long-term debt, of which $3,546 and $2,916 have been reclassified to current portion of long-term debt, as of December
S- 20
South Kent Wind LP
Notes to Financial Statements
December 31, 2016 and 2015
(In thousands of Canadian Dollars)
31, 2015 and December 31, 2014, respectively, on the Partnership’s balance sheets. The adoption of ASU 2015-3 had no impact on the Partnership’s results of operations and cash flows.
3 | Restricted cash |
The following table presents the components of restricted cash:
December 31 | ||||||||
2016 | 2015 | |||||||
Completion reserve account | $ | 2,032 | $ | 2,210 | ||||
Siemens incentive reserve account | - | 4,316 | ||||||
10% holdback account for contractors | 25 | 25 | ||||||
Subtotal | 2,057 | 6,551 | ||||||
Less: Current portion | (2,057 | ) | (6,551 | ) | ||||
Restricted cash, non-current | - | - | ||||||
The amount in the completion reserve account is reserved to pay outstanding project costs specified during term conversion (note 6). Upon full payment of outstanding project costs, the remaining balance will be released from restricted cash.
As the Siemens Three-Year Employment Objective under the Operational Incentive Agreement between Samsung, an affiliate of PRHC and Siemens Canada Limited (Siemens) was achieved by December 31, 2015, the amount reserved in the Siemens incentive account was released and paid to Siemens in 2016.
4 | Property, plant and equipment |
The following is a summary of property, plant and equipment, at cost less accumulated depreciation, at December 31:
December 31, | ||||||||
2016 | 2015 | |||||||
Power plant | $ | 731,212 | $ | 731,053 | ||||
Furniture, fixtures and equipment | 501 | 501 | ||||||
Asset retirement obligation - asset | 5,263 | 5,263 | ||||||
Subtotal | 736,976 | 736,817 | ||||||
Less: Accumulated depreciation | (86,966) | (57,634) | ||||||
$ | 650,010 | $ | 679,183 | |||||
Depreciation expense of $29,332, $29,361, and $28,185 was charged to the statements of operations and comprehensive income (loss) for the years ended December 31, 2016, 2015 and 2014, respectively.
S- 21
5 | Intangible assets |
December 31, | ||||
2016 | 2015 | |||
Beginning net book value | 711 | 754 | ||
Amortization expense | (43) | (43) | ||
Closing net book value | 668 | 711 | ||
December 31, | ||||
2016 | 2015 | |||
Cost | 1,438 | 1,438 | ||
Accumulated amortization | (770) | (727) | ||
Net book value | 668 | 711 | ||
Amortization expense of $43, $43, and $48 was charged to the statements of operations and comprehensive income (loss) for the years ended December 31, 2016, 2015 and 2014, respectively.
6 | Long-term debt |
On March 8, 2013, the Partnership entered into a credit agreement with a group of lenders for a $683,817 construction facility that was convertible to a term loan upon achievement of the COD, letter of credit facility and an interest rate hedge facility for a term of construction period plus seven years at a rate of Canadian Dealer Offered Rate (CDOR) plus 2.5% per annum for the first four years and CDOR plus 2.75% per annum thereafter. The funds from these facilities were utilized to finance the construction of the Project and to run the Project’s operations. The Partnership achieved COD on March 28, 2014, and the construction facility converted to a term loan on August 28, 2014.
In connection with the credit agreement, the Partnership entered into interest rate swaps that would fix the interest rate for 90% of the outstanding notional amount.
On May 7, 2015, the Partnership amended the credit agreement to reduce the related interest rate to Canadian Dealer Offered Rate (CDOR) plus 1.625% per annum. A fee facility was added with a principal amount of $5,106 to cover all fees for the amendment. The modifications have resulted in a current effective interest rate of 2.565%. Interest expense through the maturity date of August 2021 will be reduced accordingly.
Collateral under the financing agreement consists of substantially all of the Partnership’s assets. Its loan agreement contains a broad range of covenants that, subject to certain exceptions, restrict the Partnership’s ability to incur debt, grant liens, sell or lease assets, transfer equity interest, dissolve, pay distributions and change its business. The Partnership is in compliance with all loan covenants. All of the limited and general partners and shareholders of general partners pledged shares of partnership units or common stock owned as collateral for the loan.
S- 22
South Kent Wind LP
Notes to Financial Statements
December 31, 2016 and 2015
(In thousands of Canadian Dollars)
Terms and conditions of outstanding borrowings were as follows:
As of December 31, 2016 | |||||||||||||
Principal | Deferred financing costs | Net of financing costs | Interest rate | Maturity date | |||||||||
Term loan | $ | 641,714 | $ | (14,817) | $ | 626,897 | 2.565% | August 2021 | |||||
Less: current portion | (25,773) | 3,426 | (22,347) | ||||||||||
Net of current | $ | 615,941 | $ | (11,391) | $ | 604,550 | |||||||
As of December 31, 2015 | |||||||||||||
Principal | Deferred financing costs | Net of financing costs | Interest rate | Maturity date | |||||||||
Term loan | $ | 663,824 | $ | (18,363) | $ | 645,461 | 2.505% | August 2021 | |||||
Less: current portion | (22,110) | 3,546 | (18,564) | ||||||||||
Net of current | $ | 641,714 | $ | (14,817) | $ | 626,897 | |||||||
Future maturities of long-term debt are as follows as of December 31, 2016:
2017 | $ | 25,773 |
2018 | 26,819 | |
2019 | 28,144 | |
2020 | 29,974 | |
2021 | 37,033 | |
Thereafter | 493,971 | |
$ | 641,714 | |
The following table presents a reconciliation of interest expense presented in the Partnerships’ statements of operations and comprehensive income (loss) for the years ended December 31, 2016, 2015 and 2014:
2016 | 2015 | 2014 | ||||||
Interest incurred | $ | 29,050 | $ | 31,954 | $ | 31,450 | ||
Commitment fees incurred | - | - | 703 | |||||
Amortization of deferred financing costs | 3,546 | 3,388 | 2,741 | |||||
Less: Capitalized interest, commitment and amortization | - | - | (5,761) | |||||
Interest expense | $ | 32,596 | $ | 35,342 | $ | 29,133 | ||
Letters of credit facilities
On August 28, 2014, letters of credit of $40,600 and $12,000 were issued upon term conversion for debt service reserve and operations and maintenance reserve, respectively, with a seven-year term. Funds, when and if drawn on the facility, accrue interest at 0.625% plus Prime Rate, and at the partners’ option, the rate can be converted to a rate of CDOR plus 1.625% per annum. In addition, the Partnership shall pay letter of credit fees on the basis of the undrawn amount of the facility at 1.625% per annum. As of December 31, 2016 and 2015, the letters of credit facility did not have an outstanding balance, and no amounts were drawn in 2016 and 2015. Letter of credit fees of $857, $1,015 and $450 were charged to other expense in the statements of operations and comprehensive income (loss) for the years ended December 31, 2016, 2015 and 2014, respectively.
S- 23
South Kent Wind LP
Notes to Financial Statements
December 31, 2016 and 2015
(In thousands of Canadian Dollars)
7 | Asset retirement obligation |
The Partnership’s asset retirement obligation represents the estimated cost of decommissioning the turbines, removing above-ground installations and restoring the sites at the end of its estimated useful life. Effective January 1, 2015, the Partnership changed its estimate of the useful life of the power plant from 20 years to 25 years. As a result, during the year ended December 31, 2015, the Partnership recorded a one-time adjustment of $1,027 to reduce the carrying amount of the asset retirement obligations to reflect the change in estimate associated with the timing of the original undiscounted cash flows.
The following table presents a reconciliation of the beginning and ending aggregate carrying amounts of the asset retirement obligation:
December 31, | ||||||
2016 | 2015 | |||||
Asset retirement obligation - Beginning of year | $ | 5,829 | $ | 6,550 | ||
Adjustment related to change in useful life | - | (1,027) | ||||
Accretion expense | 324 | 306 | ||||
Asset retirement obligation - End of year | $ | 6,153 | $ | 5,829 | ||
8 | Derivatives |
The Partnership uses interest rate derivatives to manage its exposure to fluctuations in interest rates. Interest rate risk exists primarily on variable-rate debt for which the cash flows vary based upon movement in market prices. The Partnership’s objectives for holding these derivative instruments include reducing, eliminating and efficiently managing the economic impact of interest rate exposures as effectively as possible. The Partnership does not hedge all of its interest rate risks, thereby exposing the unhedged portions to changes in market prices.
As of December 31, 2016, the Partnership had other energy-related contracts that did not meet the definition of a derivative instrument and were therefore exempt from fair value accounting treatment.
The following tables present the fair values of the Partnership's derivative instruments on a gross basis as reflected on the Partnership’s balance sheets:
December 31, 2016 | December 31, 2015 | |||||||||||
Derivative liabilities | Derivative liabilities | |||||||||||
Current | Long-term | Current | Long-term | |||||||||
Fair value of undesignated derivatives: | ||||||||||||
Interest rate swaps | $ | 11,397 | $ | 36,876 | $ | 12,835 | $ | 38,707 | ||||
Total fair value | $ | 11,397 | $ | 36,876 | $ | 12,835 | $ | 38,707 | ||||
The following table summarizes the notional amounts of the Partnership's outstanding derivative instruments:
December 31, | ||||||||
Unit of measure | 2016 | 2015 | ||||||
Undesignated derivative instruments | ||||||||
Interest rate swaps | CAD | $ | 572,947 | $ | 592,846 | |||
S- 24
South Kent Wind LP
Notes to Financial Statements
December 31, 2016 and 2015
(In thousands of Canadian Dollars)
The changes in the fair value of these swaps are recognized directly into earnings as follows:
December 31, | ||||||||
2016 | 2015 | |||||||
Gains (losses) recognized in earnings | $ | 3,269 | $ | (18,428) | ||||
9 | Fair value measurement |
The Partnership’s fair value measurements incorporate various factors, including the credit standing and performance risk of the counterparties, the applicable exit market, and specific risks inherent in the instrument. Non-performance and credit risk adjustments on risk management instruments are based on current market inputs when available, such as credit default hedge spreads. When such information is not available, internal models are used.
Assets and liabilities recorded at fair value in the financial statements are categorized based on the level of judgment associated with the inputs used to measure their fair value. Hierarchical levels directly related to the amount of subjectivity associated with the inputs to valuation of these assets or liabilities are as follows:
Level 1 - Inputs are unadjusted, quoted prices in active markets for identical assets or liabilities at the measurement date.
Level 2 - Inputs (other than quoted prices included in Level 1) are either directly or indirectly observable for the asset or liability through correlation with market data at the measurement date and for the duration of the instrument’s anticipated life.
Level 3 - Unobservable inputs that are supported by little or no market activity and that are significant to the fair value of the assets or liabilities and which reflect management’s best estimate of what market participants would use in pricing the asset or liability at the measurement date. Consideration is given to the risk inherent in the valuation technique and the risk inherent in the inputs to the model.
Short-term financial instruments consist principally of cash and cash equivalents, restricted cash, and accounts payable and other accrued liabilities. Based on the nature and short maturity of these instruments, their fair value is approximated using carrying cost and they are presented in the financial statements at carrying cost.
Long-term debt is presented on the balance sheets at amortized cost. The fair value of the Partnership’s long-term debt is approximately $641,714 and $663,824 as of December 31, 2016 and 2015, respectively. It is estimated based on current rates that would be available for debt of similar terms which is not significantly different from its stated value.
Derivatives are presented in the financial statements at fair value. The interest rate swaps were valued by discounting the net cash flows using the forward CDOR curve with the valuations adjusted by the Project’s credit default swap rate.
The Partnership’s financial assets (liabilities) which require fair value measurement on a recurring basis are classified within the fair value hierarchy as follows:
Level 1 | Level 2 | Level 3 | |||||||
December 31, 2016 | |||||||||
Interest rate swaps | $ | - | $ | (48,273) | $ | - | |||
December 31, 2015 | |||||||||
Interest rate swaps | $ | - | $ | (51,542) | $ | - | |||
S- 25
South Kent Wind LP
Notes to Financial Statements
December 31, 2016 and 2015
(In thousands of Canadian Dollars)
10 | Commitments and contingencies |
1) | Commitments |
Power Purchase Agreement
The Partnership entered into a PPA with the Ontario Power Authority on August 2, 2011, which subsequently merged with the IESO. The term of the PPA provides for the annual delivery of electricity to the Ontario electricity grid at specified prices with price escalation for 20% of the contracted price over the duration of the PPA, which is 20 years from COD.
Land Lease Agreements
The Partnership has entered into various long-term land lease agreements. The annual fees range from minimum rent payments varying by lease to maximum rent payments of a certain percentage of energy delivered revenues, varying by lease.
Lease payments, including amortization of the lease option, of $2,949, $3,253, and $2,433 were charged to the statements of operations and comprehensive income (loss) for the years ended December 31, 2016, 2015 and 2014, respectively.
The future payments related to these leases as of December 31, 2016 are as follows:
2017 | $ | 4,129 | |
2018 | 4,144 | ||
2019 | 4,161 | ||
2020 | 4,180 | ||
2021 | 4,198 | ||
Thereafter | 52,573 | ||
Total | $ | 73,385 | |
Service and Maintenance Agreement
The Partnership has entered into service and maintenance agreements with Siemens to provide and carry out turbine maintenance and service activities for the Project until April 2017. Based on the terms of the agreements, Siemens shall be entitled to receive a daily base fee per turbine that may be subject to periodic price adjustments for inflation, over the terms of the agreements. As of December 31, 2016, outstanding commitments with Siemens were $1,947, including an estimated annual price adjustment for inflation of 2%, where applicable, payable over the full term of the agreement.
2) | Contingencies |
Community Fund Agreement
On April 17, 2013, the GP, in its capacity as general partner and on behalf of the Partnership, entered into the South Kent Wind Community Fund Agreement with Chatham-Kent Community Foundation, in which the Partnership committed to twenty annual contributions of $500 plus an initial contribution of $1,000. In April 2013, the initial $1,000 was paid upon close of construction financing and capitalized to property, plant and equipment. The remaining payments are recorded as a contingent liability in the amount of $8,500.
Turbine Availability Warranty
The Partnership has a turbine availability warranty from its turbine manufacturer. Pursuant to the warranty, if a turbine operates at less than minimum availability during the warranty period, the turbine manufacturer is obligated to pay, as liquidated damages, an amount for each percent that the turbine operates below the minimum availability threshold. In addition, if a turbine operates at
S- 26
South Kent Wind LP
Notes to Financial Statements
December 31, 2016 and 2015
(In thousands of Canadian Dollars)
more than a specified availability during the warranty period, the Partnership has an obligation to pay a bonus to the turbine manufacturer. As of December 31, 2016, the Partnership recorded a liability of $550 associated with bonuses payable to the turbine manufacturer.
11 | Related party transactions |
The Partnership is controlled by the GP, which is jointly controlled by Samsung and Pattern in accordance with the terms of the Shareholder Agreement. Certain terms of the Samsung Pattern Joint Venture Wind Development Agreement, entered into between Samsung and an affiliate of PRHC on July 27, 2010, directed the responsibilities of Samsung and PRHC during the development of the Project.
The following transactions were carried out with related parties:
a) | Management, Operation, and Maintenance Agreement (MOMA) |
On March 8, 2013, the Partnership entered into a MOMA with Pattern Operators Canada ULC, which is owned by PCOH to operate and manage the maintenance of the wind plant and to perform certain other services pertaining to the wind plant in accordance with terms and conditions set forth in the MOMA.
$1,469, $1,446 and $1,075 were charged to the project expense in the statements of operations and comprehensive income (loss) for the years ended December 31, 2016, 2015 and 2014, respectively.
b) | Project Administration Agreement (PAA) |
On March 8, 2013, the Partnership entered into the PAA with SRE Wind PA LP (PA), which is 100% owned by Samsung to supply project administrative services.
$516, $507 and $463 were invoiced to the Partnership for the years ended December 31, 2016, 2015 and 2014, respectively, and expensed as general and administrative expense in the statements of operations and comprehensive income (loss).
c) | The Partnership recorded the following balances with related parties: |
2016 | 2015 | |||||
Related party payable to Pattern Operators Canada ULC | $ | 144 | $ | 142 | ||
Related party payable to SRE Wind PA LP | $ | 49 | $ | 48 | ||
12 | Subsequent events |
There were no material subsequent events.
S- 27
Grand Renewable Wind LP
Financial Statements
December 31, 2016, 2015 and 2014
(In thousands of Canadian Dollars)
S- 28
Grand Renewable Wind LP
S- 29

March 1, 2017
Independent auditor’s report
To the Partners of
Grand Renewable Wind LP
We have audited the accompanying balance sheets of Grand Renewable Wind LP as of December 31, 2016 and 2015 and the related statement of operations and comprehensive income (loss), changes in partners’ equity, and cash flows for each of the years in the three-year period ended December 31, 2016. Management is responsible for these financial statements. Our responsibility is to express an opinion on these financial statements based on our audits.
We conducted our audits in accordance with the standards of the Public Company Accounting Oversight Board (United States). Those standards require that we plan and perform the audit to obtain reasonable assurance about whether the financial statements are free of material misstatement. Our audits of the financial statements included examining, on a test basis, evidence supporting the amounts and disclosures in the financial statements, assessing the accounting principles used and significant estimates made by management, and evaluating the overall financial statement presentation. We were not engaged to perform an audit of the company’s internal control over financial reporting. Our audits included consideration of internal control over financial reporting as a basis for designing audit procedures that are appropriate in the circumstances, but not for the purpose of expressing an opinion on the effectiveness of the company’s internal control over financial reporting. Accordingly, we express no such opinion. Our audits also included performing such other procedures as we considered necessary in the circumstances. We believe that our audits provide a reasonable basis for our opinion.
In our opinion, the financial statements referred to above present fairly, in all material respects, the financial position of Grand Renewable Wind LP as of December 31, 2016 and 2015 and the results of its operations and its cash flows for each of the years in the three-year period ended December 31, 2015 in conformity with accounting principles generally accepted in the United States of America.
/s/ PricewaterhouseCoopers LLP
Chartered Professional Accountants, Licensed Public Accountants
PricewaterhouseCoopers LLP
PwC Tower, 18 York Street, Suite 2600, Toronto, Ontario, Canada M5J 0B2
T: +1 416 863 1133, F: +1 416 365 8215, www.pwc.com/ca
“PwC” refers to PricewaterhouseCoopers LLP, an Ontario limited liability partnership.
S- 30
Grand Renewable Wind LP
Balance Sheets
As of December 31, 2016 and 2015
(In thousands of Canadian Dollars)
2016 | 2015 | ||||||||
ASSETS | |||||||||
Current assets: | |||||||||
Cash and cash equivalents | $ | 3,673 | $ | 5,371 | |||||
Restricted cash (note 3) | 4,334 | 3,455 | |||||||
Accrued revenue (note 2) | 11,085 | 9,230 | |||||||
Other current assets | 348 | 446 | |||||||
Total current assets | 19,440 | 18,502 | |||||||
Restricted cash (note 3) | — | 8,986 | |||||||
Property, plant and equipment - net of accumulated depreciation of $36,060 and $18,687 in 2016 and 2015, respectively (note 4) | 397,105 | 414,214 | |||||||
Intangible assets - net of accumulated amortization of $174 and $91 in 2016 and 2015, respectively (note 5) | 1,498 | 1,581 | |||||||
Total assets | $ | 418,043 | $ | 443,283 | |||||
LIABILITIES & EQUITY | |||||||||
Current liabilities: | |||||||||
Accounts payable and other accrued liabilities | $ | 1,865 | $ | 3,338 | |||||
Accounts payable and other accrued liabilities - related parties (note 11) | 329 | 5,445 | |||||||
Current portion of long-term debt, net of financing costs of $1,413 and $1,597 in 2016 and 2015, respectively (notes 2 and 6) | 13,125 | 12,300 | |||||||
Derivative liabilities, current (note 8) | 7,767 | 8,643 | |||||||
Other current liabilities (note 10) | 524 | 345 | |||||||
Total current liabilities | 23,610 | 30,071 | |||||||
Long-term debt, net of financing costs of $5,643 and $6,707 in 2016 and 2015, respectively (notes 2 and 6) | 349,132 | 362,606 | |||||||
Derivative liabilities (note 8) | 46,260 | 45,887 | |||||||
Asset retirement obligation (note 7) | 2,809 | 2,637 | |||||||
Total liabilities | 421,811 | 441,201 | |||||||
Commitments and contingencies (note 10) | |||||||||
Equity: | |||||||||
Partners’ capital | 28,230 | 47,680 | |||||||
Accumulated net loss | (5,896) | (11,740) | |||||||
Accumulated other comprehensive loss | (26,102) | (33,858) | |||||||
Total partners’ equity | (3,768) | 2,082 | |||||||
Total liabilities and equity | $ | 418,043 | $ | 443,283 | |||||
See accompanying notes to financial statements.
S- 31
Grand Renewable Wind LP
Statements of Operations and Comprehensive Income (Loss)
For the years ended December 31, 2016, 2015 and 2014
(In thousands of Canadian Dollars)
2016 | 2015 | 2014 | ||||||||||
Revenue (note 2): | ||||||||||||
Energy delivered | $ | 44,353 | $ | 56,138 | $ | 3,429 | ||||||
Compensation for forgone energy | 19,172 | 5,227 | — | |||||||||
Other revenue | 713 | 1,046 | 62 | |||||||||
Total revenue | 64,238 | 62,411 | 3,491 | |||||||||
Cost of revenue: | ||||||||||||
Project expenses | 8,270 | 8,179 | 4 | |||||||||
Project expenses - related parties (note 11) | 1,258 | 1,244 | 75 | |||||||||
Depreciation, amortization and accretion | 17,545 | 17,498 | 1,326 | |||||||||
Total cost of revenue | 27,073 | 26,921 | 1,405 | |||||||||
Gross profit | 37,165 | 35,490 | 2,086 | |||||||||
Operating expenses: | ||||||||||||
General and administrative | 1,125 | 1,546 | 1,345 | |||||||||
General and administrative - related parties (note 11) | 412 | 406 | 288 | |||||||||
Total operating expenses | 1,537 | 1,952 | 1,633 | |||||||||
Operating income | 35,628 | 33,538 | 453 | |||||||||
Other (expense) income: | ||||||||||||
Interest expense (note 6) | (21,648) | (21,958) | (1,697) | |||||||||
Unrealized loss on derivatives (note 8) | (7,253) | (3,354) | (16,072) | |||||||||
Other (expense) income, net | (883) | (434) | (149) | |||||||||
Total other expense | (29,784) | (25,746) | (17,918) | |||||||||
Net income (loss) | 5,844 | 7,792 | (17,465) | |||||||||
Other comprehensive income (loss): | ||||||||||||
Derivative activity (notes 8 and 10): | ||||||||||||
Effective portion of change in fair value of derivatives | (826) | (14,397) | (18,934) | |||||||||
Reclassifications to net income (loss) | 8,582 | 8,320 | — | |||||||||
Total change in effective portion of change in fair market value of derivatives | 7,756 | (6,077) | (18,934) | |||||||||
Comprehensive income (loss) | $ | 13,600 | $ | 1,715 | $ | (36,399 | ) | |||||
See accompanying notes to financial statements.
S- 32
Grand Renewable Wind LP
Statements of Changes in Partners’ Equity
For the years ended December 31, 2016, 2015 and 2014
(In thousands of Canadian Dollars)
Partners’ capital | Accumulated net income (loss) | Accumulated other comprehensive loss | Total | |||||||||||||
Balance at January 1, 2014 | $ | 67,990 | $ | (2,067 | ) | $ | (8,847 | ) | $ | 57,076 | ||||||
Other comprehensive loss | — | — | (18,934) | (18,934) | ||||||||||||
Net loss | — | (17,465) | — | (17,465) | ||||||||||||
Balance at December 31, 2014 | 67,990 | (19,532) | (27,781) | 20,677 | ||||||||||||
Cash distribution | (20,310) | — | — | (20,310) | ||||||||||||
Other comprehensive loss | — | — | (6,077) | (6,077) | ||||||||||||
Net income | — | 7,792 | — | 7,792 | ||||||||||||
Balance at December 31, 2015 | 47,680 | (11,740) | (33,858) | 2,082 | ||||||||||||
Cash distribution | (19,450) | — | — | (19,450) | ||||||||||||
Other comprehensive income | — | — | 7,756 | 7,756 | ||||||||||||
Net income | — | 5,844 | — | 5,844 | ||||||||||||
Balance at December 31, 2016 | $ | 28,230 | $ | (5,896 | ) | $ | (26,102 | ) | $ | (3,768 | ) | |||||
See accompanying notes to financial statements.
S- 33
Grand Renewable Wind LP
Statements of Cash Flows
For the years ended December 31, 2016, 2015 and 2014
(In thousands of Canadian Dollars)
2016 | 2015 | 2014 | ||||||||||
Cash flows from operating activities: | ||||||||||||
Net income (loss) | $ | 5,844 | $ | 7,792 | $ | (17,465 | ) | |||||
Adjustments to reconcile net income (loss) to net cash provided by (used in) operating activities | ||||||||||||
Unrealized loss on derivatives | 7,253 | 3,354 | 16,072 | |||||||||
Depreciation, amortization and accretion | 17,628 | 17,582 | 1,332 | |||||||||
Amortization of deferred financing costs | 1,248 | 1,593 | 158 | |||||||||
Interest expense added on principal | — | 5,832 | 736 | |||||||||
Changes in assets and liabilities, net: | ||||||||||||
Accrued revenue | (1,855) | (5,732) | (3,498) | |||||||||
Sales tax recoverable | — | 6,586 | — | |||||||||
Accounts payable and other accrued liabilities | (4,546) | (15,460) | — | |||||||||
Other, net | 210 | (1,963) | 482 | |||||||||
Net cash provided by (used in) operating activities | 25,782 | 19,584 | (2,183) | |||||||||
Cash flows from investing activities: | ||||||||||||
Capital expenditures | (2,240) | (18,082) | (209,808) | |||||||||
Net changes in accounts payable and other accrued liabilities related to investing activities | — | — | (48,624) | |||||||||
Decrease in restricted cash | 8,124 | 8,039 | 13,456 | |||||||||
Increase in restricted cash | (17) | (14,252) | (12,862) | |||||||||
Net cash provided by (used in) investing activities | 5,867 | (24,295) | (257,838) | |||||||||
Cash flows from financing activities: | ||||||||||||
Proceeds from long-term debt | — | 39,968 | 258,230 | |||||||||
Repayment of long-term debt | (13,897) | (12,172) | — | |||||||||
Distribution to partners | (19,450) | (20,310) | — | |||||||||
Net cash (used in) provided by financing activities | (33,347) | 7,486 | 258,230 | |||||||||
Net change in cash and cash equivalents | (1,697) | 2,775 | (1,791) | |||||||||
Cash and cash equivalents - Beginning of year | 5,371 | 2,596 | 4,387 | |||||||||
Cash and cash equivalents - End of year | $ | 3,673 | $ | 5,371 | $ | 2,596 | ||||||
Supplemental disclosure: | ||||||||||||
Cash payments for interest and commitment fees | $ | 20,291 | $ | 16,218 | $ | — | ||||||
Schedule of non-cash activities: | ||||||||||||
Remeasurement of asset retirement obligation | $ | — | $ | 598 | $ | — | ||||||
Accrued construction costs | $ | — | $ | — | $ | 1,976 | ||||||
Construction loan - capitalized interest | $ | — | $ | — | $ | 9,103 | ||||||
Capitalized depreciation and amortization | $ | — | $ | — | $ | 870 | ||||||
See accompanying notes to financial statements.
S- 34
Grand Renewable Wind LP
Notes to Financial Statements
December 31, 2016 and 2015
(In thousands of Canadian Dollars)
1 | General information |
The Partnership
Grand Renewable Wind LP (the Partnership), a limited partnership under the laws of the Province of Ontario, was formed on January 10, 2011 as a joint venture project between Samsung Renewable Energy Inc. (Samsung) and Pattern Grand LP Holdings LP, a subsidiary of Pattern Renewable Holdings Canada ULC (PRHC), each as 49.99% limited partners of the Partnership, and Grand Renewable Wind GP Inc. (the GP), as the 0.02% general partner of the Partnership. The Partnership was created to develop, build and operate a wind power project in Haldimand County with generation capacity totaling approximately 149 megawatts (MW) of power (the Project).
On February 24, 2013, Samsung transferred its LP interest in the Partnership to SRE GRW LP Holdings LP, an affiliate of Samsung.
On December 20, 2013, in a series of transactions: (i) Pattern Grand GP Holdings Inc., a wholly owned subsidiary of PRHC, transferred all of the general partner interests in Pattern Grand LP Holdings LP to PRHC, causing Pattern Grand LP Holdings LP to be dissolved by operation of law and PRHC to acquire the LP interests in the Partnership that previously were held by Pattern Grand LP Holdings LP, (ii) PRHC transferred its LP interest in the Partnership and its ownership interest in Pattern Grand GP Holdings Inc., which owned PRHC’s ownership interest in the GP, to Pattern Canada Operations Holdings ULC, (PCOH), a wholly owned subsidiary of Pattern Energy Group Inc. (Pattern), and (iii) Pattern Grand GP Holdings Inc. was dissolved.
On December 17, 2014, PCOH transferred all of its LP interest in the Partnership to Pattern Canada Finance Company ULC, a wholly owned subsidiary of PCOH.
Six Nations agreements
On May 25, 2012, the Partnership entered into certain agreements with the Six Nations of the Grand River, a band within the meaning of the Indian Act (Canada) through its elected council (the Six Nations), in which the Partnership provides an option for economic participation by way of an annual royalty from the Partnership or the right to purchase a 10% interest in the Partnership.
On June 11, 2013, the Six Nations exercised its option to purchase a 10% LP interest in the Partnership and the Partnership Agreement was amended and restated to reflect such ownership. Affiliates of Samsung and Pattern each maintain a 45% interest in the Partnership. The Six Nations is not involved in the GP.
The Partnership is controlled by its general partner, the GP, also a joint venture controlled by affiliates of Samsung and Pattern. The Partnership’s ownership interests were distributed as follows:
December 31, | ||||
2016 | 2015 | |||
SRE GRW LP Holdings LP | 44.99% | 44.99% | ||
Pattern Canada Finance Company ULC | 44.99 | 44.99 | ||
Six Nations of the Grand River | 10.00 | 10.00 | ||
Grand Renewable Wind GP Inc. | 0.02 | 0.02 | ||
Total | 100.00% | 100.00% | ||
The Project
The Project is a 149 MW wind project consisting of 67 Siemens wind turbine generators located in Haldimand County, Ontario. On December 9, 2014 the Project achieved COD and commenced commercial operations.
The Partnership has a power purchase agreement (PPA) with the Independent Electricity System Operator (IESO) for a period of 20 years from the COD. The IESO oversees the wholesale electricity market, where the price of energy is determined. It also administers the rules that govern the market and, through an arm's-length market monitoring function, ensures that it is operated fairly and efficiently. The IESO is an agent among the market participants in Ontario and is neither exposed to, nor benefits from,
S- 35
Grand Renewable Wind LP
Notes to Financial Statements
December 31, 2016 and 2015
(In thousands of Canadian Dollars)
any transactions. In such capacity, the IESO executes agreements to help the market meet the renewable energy mandates of the government of the Province of Ontario. There are approximately 70 electric distribution companies in Ontario, all of which have government mandates to purchase renewable energy. The PPA provides for guaranteed pricing from IESO that removes volatility caused by fluctuations in market rates. The Ontario government established the Global Adjustment (GA) which is designed to adjust consumer rates depending on the price of energy. The IESO establishes a monthly variable GA rate based on GA costs and Ontario electricity demand which effectively establishes a pass through mechanism to the consumer and eliminates the IESO's economic exposure to our contract price.
A 100 MW solar facility developed by an affiliate of Samsung is sharing the usage and ownership of the transmission line and substation. The Project connected to the IESO-controlled grid by way of a 20 km transmission line sited in the municipal road allowance.
2 | Summary of significant accounting policies |
The principal accounting policies applied in the preparation of these financial statements are set out below. These policies have been consistently applied to the periods presented, unless otherwise stated.
Basis of preparation
The accompanying financial statements are presented using accounting principles generally accepted in the United States of America (U.S. GAAP). The preparation of U.S. GAAP financial statements requires management to make certain estimates and assumptions that affect the reported amounts of assets and liabilities and the disclosure of contingent assets and liabilities at the date of the financial statements and the reported amounts of revenue and expenses during the reporting period. Because the use of estimates is inherent in the financial reporting process, actual results could differ from those estimates.
In recording transactions and balances resulting from business operations, the Partnership uses estimates based on the best information available. Estimates are used for such items as accrued revenue, asset retirement obligation, valuation of long-term derivative contracts and acquisition contingencies.
These financial statements do not include assets, liabilities, revenue and expenses of the GP and limited partners. The financial statements of the Partnership reflect no provision or liability for income taxes because profits and losses of the Partnership are allocated to the partners and are included in the income tax returns of the partners. Income and losses for tax purposes may differ from the financial statement amounts and the partners’ equity reflected in the financial statements does not necessarily reflect their tax basis.
Functional and presentation currency
Items included in the financial statements of the Partnership are measured using the currency of the primary economic environment in which the Partnership operates (the functional currency). The financial statements are presented in Canadian dollars, which is the Partnership’s functional and presentation currency.
Fair value of financial instruments
ASC 820, Fair Value Measurements, defines fair value as the price at which an asset could be exchanged or a liability transferred in an orderly transaction between knowledgeable, willing parties in the principal or most advantageous market for the asset or liability. Where available, fair value is based on observable market prices or derived from such prices. Where observable prices or inputs are not available, valuation models are applied. These valuation techniques involve some level of management estimation and judgment, the degree of which is dependent on the price transparency for the instruments or market and the instruments’ complexity.
Cash and cash equivalents
Cash and cash equivalents include cash on hand, deposits held at call with banks and other short-term highly liquid investments with original maturities of three months or less.
S- 36
Grand Renewable Wind LP
Notes to Financial Statements
December 31, 2016 and 2015
(In thousands of Canadian Dollars)
Restricted cash
Restricted cash mainly consists of cash reserves required under the Partnership’s loan agreements (note 3).
Trade receivables
The Partnership’s trade receivables are generated by selling energy in Ontario, Canada through the IESO as a settlement agent. The allowance for doubtful accounts, if needed, is computed based upon management’s estimates of uncollectible accounts. As of December 31, 2016 and 2015, the Partnership has no outstanding trade receivables.
Accrued revenue
Accrued revenue represents revenues recognized on contracts for which billings have not been presented to customers as of the balance sheet date. These amounts are billed and generally collected within two months.
Concentration of credit risk
Financial instruments that potentially subject the Partnership to concentrations of credit risk consist primarily of cash and cash equivalents and restricted cash. The Partnership places its cash and cash equivalents and restricted cash with creditworthy institutions located in Canada, which the management believes to have minimal risk. At times, such balances may be in excess of the Canada Deposit Insurance Corporation (CDIC) insurance coverage limit. CDIC insurance currently covers up to $100 per depositor at each insured bank.
The Partnership’s derivative agreements expose the Partnership to losses under certain circumstances, such as the counterparty defaulting on its obligations under the swap agreements or if the swap agreements provide an imperfect hedge. Counterparties to the Partnership’s derivative contracts are major financial institutions that have been accorded investment grade ratings.
Property, plant and equipment
Property, plant and equipment are stated at historical cost, less accumulated depreciation. Historical cost includes expenditure that is directly attributable to the acquisition of the items. Subsequent costs are included in the asset’s carrying value or recognized as separate assets, as appropriate, only when it is probable that the future economic benefits associated with the item will flow to the Partnership and the cost of the item can be reliably measured.
The asset retirement obligation included in property, plant and equipment is stated at the present value of future cash flows of asset retirement obligation at the time of COD.
Depreciation on property, plant and equipment is calculated using the straight-line method to allocate their cost to their residual values over their estimated useful lives. The power plant is depreciated over 25 years and the remaining assets are depreciated over 5 years. The assets’ residual values and useful lives are reviewed and adjusted, if appropriate, at the end of each reporting period. Repair and maintenance costs are expensed as incurred.
Intangible assets
Amortization is calculated using the straight-line method and recorded against revenue over the remaining term of the PPA.
Impairment of long-lived assets
The Partnership periodically evaluates whether events have occurred that would require revision of the remaining useful life of equipment and improvements and purchased intangible assets, or render them not recoverable. If such circumstances arise, the Partnership uses an estimate of the undiscounted value of expected future operating cash flows to determine whether the long-lived assets are impaired. If the aggregate undiscounted cash flows are less than the carrying amount of the assets, the resulting impairment charge to be recorded is calculated based on the excess of the carrying value of the assets over the fair value of such assets, with the fair value determined based on an estimate of discounted future cash flows. Through December 31, 2016, no impairment charges were recorded.
S- 37
Grand Renewable Wind LP
Notes to Financial Statements
December 31, 2016 and 2015
(In thousands of Canadian Dollars)
Deferred financing costs
Financing costs incurred in connection with obtaining construction and term financing, which include direct financing, legal and other upfront costs of borrowing, are capitalized and recorded as a reduction to long-term debt and amortized over the lives of the respective loans using the effective-interest method. Amortization of deferred financing costs is capitalized during construction or expensed following COD.
Interest capitalization
The Partnership capitalizes interest and related financing fees from non-recourse debt used to finance projects in construction. Capitalization is discontinued when a project reaches commercial operation.
Derivatives
The Partnership recognizes its derivative instruments as either assets or liabilities in the balance sheets at fair value. The accounting for changes in the fair value (i.e., gains or losses) of a derivative instrument depends on whether it qualifies and has been designated as part of a hedging relationship and the type of hedging relationship.
For derivative instruments that are designated and qualify as a cash flow hedge (i.e., hedging the exposure to variability in expected future cash flows that are attributable to a particular risk), the effective portion of the gain or loss on the derivative instrument is reported as a component of other comprehensive income (OCI) or loss (OCL). Changes in the fair value of these derivatives are subsequently reclassified into earnings in the period that the hedged transaction affects earnings. The ineffective portion of changes in fair value is recorded as a component of net income (loss) in the statements of operations and comprehensive income (loss).
For undesignated derivative instruments, their change in fair value is reported as a component of net income in the statements of operations and comprehensive income (loss).
The Partnership enters into derivative transactions for the purpose of managing exposure to fluctuations in interest rates, such as interest rate swaps. Interest rate swaps are instruments used to fix the interest rate on variable interest rate debt.
Accounts payable and other accrued liabilities
Trade payables are obligations to pay for goods or services that have been acquired in the ordinary course of business from suppliers. Payables with payment terms extended beyond one year from the balance sheet dates are presented as non-current liabilities.
Contingent liabilities
Contingent liabilities are recognized when: the Partnership has a present legal obligation as a result of past events; it is probable that an outflow of resources will be required to settle the obligation; and the amount has been reasonably estimated.
Asset retirement obligation
The Partnership records an asset retirement obligation for the estimated costs of decommissioning turbines, removing above-ground installations and restoring sites, at the time when a contractual decommissioning obligation materializes. The Partnership records accretion expense, which represents the increase in the asset retirement obligation, over the remaining life of the associated wind project. Accretion expense is recorded as cost of revenue in the statements of operations and comprehensive income (loss) using accretion rates based on a credit adjusted risk free interest rate of 6.51%.
Revenue recognition
Revenue is recognized based upon the amount of electricity delivered or curtailed at rates specified under the contracts, assuming all other revenue recognition criteria are met. When curtailment revenue is earned, it is recorded as compensation for forgone revenue. The Partnership evaluates its PPA to determine whether it is in substance a lease or derivative and, if applicable, recognizes revenue pursuant to ASC 840 Leases and ASC 815 Derivatives and Hedging, respectively. As of December 31, 2016, the PPA was not considered a lease or a derivative instrument, as multiple market participants purchase the energy at market-based prices with
S- 38
Grand Renewable Wind LP
Notes to Financial Statements
December 31, 2016 and 2015
(In thousands of Canadian Dollars)
IESO working as a settlement agent. As a result, revenue (including any revenue from the price guaranteed by IESO), is recognized on an accrual basis.
The Partnership recognizes revenue for warranty settlements and liquidated damages from a turbine manufacturer in other revenue upon resolution of outstanding contingencies. Any cash receipts for amounts subject to future adjustment or repayment are deferred in other liabilities until the final settlement amount is considered fixed and determinable.
Cost of revenue
The Partnership’s cost of revenue is comprised of direct costs of operating and maintaining its project facilities, including labor, turbine service arrangements, metering service and shadow settlement, environmental fee, land lease royalties, property tax, insurance, depreciation, amortization and accretion.
Comprehensive income
Comprehensive income consists of net income and other comprehensive income. Other comprehensive income is included in accumulated other comprehensive income in the accompanying statements of changes in partners’ equity.
Reclassification
Certain prior period balances have been reclassified to conform to current period presentation of the Partnership’s financial statements and accompanying notes. Such reclassifications did not have an impact on net income (loss) or cash flows.
Recent accounting pronouncements
In November 2016, the FASB issued ASU 2016-18, Statement of Cash Flows (Topic 230): Restricted Cash (ASU 2016-18), which requires that a statement of cash flows explain the change during the period in the total of cash, cash equivalents, and amounts generally described as restricted cash or restricted cash equivalents. As a result, amounts generally described as restricted cash and restricted cash equivalents should be included with cash and cash equivalents when reconciling the beginning-of-period and end-of-period total amounts shown on the statement of cash flows. The amendments do not provide a definition of restricted cash or restricted cash equivalents. The Partnership is currently assessing the future impact of this guidance on its financial statements and related disclosures and expects to adopt these updates beginning January 1, 2017.
In August 2016, the FASB issued ASU 2016-15, Statement of Cash Flows (Topic 230): Classification of Certain Cash Receipts and Cash Payments (ASU 2016-15), which provides guidance on specific cash flow issues. ASU 2016-15 is effective for fiscal years beginning after December 15, 2017, and interim periods within those fiscal years. Early adoption is permitted, including adoption in an interim period. The adoption of ASU 2016-15 on December 31, 2016 did not have a material impact on the Partnership’s financial statements and related disclosures.
In June 2016, the FASB issued ASU 2016-13, Financial Instruments —Credit Losses (Topic 326): Measurement of Credit Losses on Financial Instruments (ASU 2016-13), which requires the measurement of all expected credit losses for financial assets including trade receivables held at the reporting date based on historical experience, current conditions, and reasonable and supportable forecasts. ASU 2016-13 is effective for fiscal years, and interim periods within those fiscal years, beginning after December 15, 2019. The adoption of ASU 2016-13 is not expected to have a material impact on its financial statements and related disclosures.
In May 2014, the FASB issued ASU 2014-09, which creates FASB Accounting Standards Codification (ASC) Topic 606, Revenue from Contracts with Customers and supersedes ASC Topic 605, Revenue Recognition (ASU 2014-09). The guidance replaces industry-specific guidance and establishes a single five-step model to identify and recognize revenue. The core principle of the guidance is that an entity should recognize revenue upon transfer of control of promised goods or services to customers in an amount that reflects the consideration to which an entity expects to be entitled in exchange for those goods or services. Additionally, the guidance requires the entity to disclose further quantitative and qualitative information regarding the nature and amount of revenues arising from contracts with customers, as well as other information about the significant judgments and estimates used in recognizing revenues from contracts with customers. The effective date of ASU 2014-09 was deferred by the issuance of ASU 2015-14, Revenue from Contracts with Customers: Deferral of the Effective Date, (Topic 606) by one year to make the guidance of ASU 2014-09 effective for annual reporting periods beginning after December 15, 2017, including interim periods therein. Early adoption is
S- 39
Grand Renewable Wind LP
Notes to Financial Statements
December 31, 2016 and 2015
(In thousands of Canadian Dollars)
permitted, but not prior to the original effective date, which was for annual reporting periods beginning after December 15, 2016. In March 2016, the FASB issued ASU 2016-08, Revenue from Contracts with Customers (Topic 606) Principal versus Agent Considerations (Reporting Revenue Gross versus Net), which clarifies how to apply the implementation guidance on principal versus agent considerations related to the sale of goods or services to a customer as updated by ASU 2014-09. In April 2016, the FASB issued ASU 2016-10, Revenue from Contracts with Customers (Topic 606) Identifying Performance Obligations and Licensing, which clarifies two aspects of Topic 606: identifying performance obligations and the licensing implementation guidance, while retaining the related principles for those areas, as updated by ASU 2014-09. In May 2016, the FASB issued ASU 2016-12, Revenue from Contracts with Customers (Topic 606): Narrow-Scope Improvements and Practical Expedients (ASU 2016-12), which makes narrow scope amendments to Topic 606 including implementation issues on collectability, non-cash consideration and completed contracts at transition. In December 2016, the FASB issued ASU 2016-20, Technical Corrections and Improvements to Topic 606, "Revenue from Contracts with Customers" (ASU 2016-20), which make additional narrow scope amendments to Topic 606 including loan guarantee fees, impairment testing of contract costs, provisions for losses on construction-type and production-type contracts. The Partnership is currently assessing the future impact of this guidance on its financial statements and related disclosures and expects to adopt these updates beginning January 1, 2018.
In March 2016, the FASB issued ASU 2016-05, Derivatives and Hedging (Topic 815): Effect of Derivative Contract Novations on Existing Hedge Accounting Relationships (ASU 2016-05), which clarifies that a change in the counterparty to a derivative instrument that has been designated as the hedging instrument does not, in and of itself, require dedesignation of that hedging relationship provided that all other hedge accounting criteria remain intact. ASU 2016-05 is effective for annual periods beginning after December 15, 2017, including interim reporting periods therein, with early adoption permitted. The adoption of ASU 2016-05 on January 1, 2016 had no impact on the Partnership's financial statements and related disclosures.
In February 2016, the Financial Accounting Standards Board ("FASB") issued Accounting Standards Update ("ASU") 2016-02, "Leases," which requires lessees to recognize right-of-use assets and lease liabilities, for all leases, with the exception of short-term leases, at the commencement date of each lease. Under the new guidance, lessor accounting is largely unchanged. ASU 2016-02 simplifies the accounting for sale and leaseback transactions primarily because lessees must recognize lease assets and liabilities. ASU 2016-02 is effective for annual periods beginning after December 15, 2018, and interim periods within those annual periods. Early adoption is permitted. The amendments of this update should be applied using a modified retrospective approach, which requires lessees and lessors to recognize and measure leases at the beginning of the earliest period presented. The Partnership is currently assessing the future impact of this update on its financial statements and related disclosures and expects to adopt this update beginning January 1, 2019.
In August 2015, the FASB issued ASU 2015-14, “Revenue from Contracts with Customers: Deferral of the Effective Date” to amend ASU 2015-09 “Revenue from Contracts with Customers” to defer the effective date of ASU 2014-09 for all entities by one year. The guidance in ASU 2014-09 provides companies with a single model for use in accounting for revenue arising from contracts with customers and supersedes current revenue recognition guidance, including industry-specific revenue guidance. The core principle of the model is to recognize revenue when control of the goods or services transfers to the customer, as opposed to recognizing revenue when the risks and rewards transfer to the customer under the existing revenue guidance. As a result of this amendment, ASU 2014-09 is now effective for annual reporting periods beginning after December 15, 2018 and interim periods within those fiscal years. Early adoption is permitted only as of annual reporting periods beginning after December 15, 2015 and interim periods within those fiscal years. The guidance permits companies to either apply the requirements retrospectively to all prior periods presented, or apply the requirements in the year of adoption, through a cumulative adjustment. The Partnership is currently assessing the future impact of this update on its financial statements and related disclosures and expects to adopt this update beginning January 1, 2018.
In June 2015, the FASB issued ASU 2015-10, “Technical Corrections and Improvements” which covers a wide range of topics in the Accounting Standards Codification (the “Codification”). The amendments in this update represent changes to clarify the Codification, correct unintended application of guidance, or make minor improvements to the Codification that are not expected to have a significant effect on current accounting practice or create a significant administrative cost on most entities. The amendments in ASU 2015-10 were effective immediately upon issuance and the adoption did not have material impact on the Partnership's financial statements and related disclosures.
In April 2015, the Financial Accounting Standard Board (FASB) issued ASU 2015-03, “Interest – Imputation of Interest: Simplifying the Presentation of Debt Issuance Costs” to simplify the presentation of debt issuance costs by requiring that debt issuance costs related to a recognized debt liability be presented in the balance sheet as a direct deduction from the carrying amount of the debt
S- 40
Grand Renewable Wind LP
Notes to Financial Statements
December 31, 2016 and 2015
(In thousands of Canadian Dollars)
liability, consistent with debt discounts. The recognition and measurement guidance for debt issuance costs are not affected by the amendments in this ASU. ASU 2015-03 is effective for public companies for fiscal years beginning after December 15, 2015, and interim periods within those fiscal years and should be applied retrospectively. Early adoption is permitted for financial statements that have not been previously issued. Upon transition, an entity is required to comply with the applicable disclosures for a change in accounting principle. The Partnership adopted ASU 2015-03 in April 2015 and applied the change in accounting principle to the financial statements as of December 31, 2015. As a result, the Partnership reclassified $8,304 and $9,897 in total deferred financing costs to long-term debt, of which $1,597 and $1,627 have been reclassified to current portion of long-term debt, as of December 31, 2015 and December 31, 2014, respectively, on the Partnership’s balance sheets. The adoption of ASU 2015-3 had no impact on the Partnership’s results of operations and cash flows.
3 | Restricted cash |
The following table presents the components of restricted cash:
December 31, | ||||||||
2016 | 2015 | |||||||
Completion reserve account | $ | 4,334 | $ | 8,986 | ||||
Siemens incentive reserve account | — | 2,234 | ||||||
10% holdback account for contractors | — | 1,221 | ||||||
Subtotal | 4,334 | 12,441 | ||||||
Less: Current portion | (4,334) | (3,455) | ||||||
Restricted cash, non-current | $ | — | $ | 8,986 | ||||
The amount in the completion reserve account is reserved to pay outstanding project costs specified during term conversion (note 6). Upon full payment of outstanding project costs, the remaining balance will be released from restricted cash.
As the Siemens Three-Year Employment Objective under the Operational Incentive Agreement between Samsung, an affiliate of PRHC and Siemens Canada Limited (Siemens) was achieved by December 31, 2015, the amount reserved in the Siemens incentive account was released and paid to Siemens in 2016.
4 | Property, plant and equipment |
The following is a summary of property, plant and equipment, at cost less accumulated depreciation, at December 31:
December 31, | ||||||||
2016 | 2015 | |||||||
Power plant | $ | 430,421 | $ | 430,198 | ||||
Furniture, fixtures and equipment | 281 | 240 | ||||||
Asset retirement obligation - asset | 2,463 | 2,463 | ||||||
Subtotal | 433,165 | 432,901 | ||||||
Less: Accumulated depreciation | (36,060) | (18,687) | ||||||
$ | 397,105 | $ | 414,214 | |||||
Depreciation expense of $17,373, $17,337and $1,326 was charged to the statements of operations and comprehensive income (loss) for the years ended December 31, 2016, 2015 and 2014, respectively.
S- 41
Grand Renewable Wind LP
Notes to Financial Statements
December 31, 2016 and 2015
(In thousands of Canadian Dollars)
5 | Intangible assets |
December 31, | ||||||||
2016 | 2015 | |||||||
Beginning net book value | $ | 1,581 | $ | 1,665 | ||||
Amortization expense | (83) | (84) | ||||||
Closing net book value | $ | 1,498 | $ | 1,581 | ||||
December 31, | ||||||||
2016 | 2015 | |||||||
Cost | $ | 1,672 | $ | 1,672 | ||||
Accumulated amortization | (174) | (91) | ||||||
Net book value | $ | 1,498 | $ | 1,581 | ||||
Cash consideration of $1,672 was paid to the IESO to extend the end of PPA term by 74 days from September 24, 2034 to December 8, 2034, which is recorded in intangible assets on the balance sheets as of December 31, 2016 and 2015.
Amortization expense of $83, $84, and $7 was charged as a reduction to revenue in the statements of operations and comprehensive income (loss) for the years ended December 31, 2016, 2015 and 2014, respectively.
6 | Long-term debt |
On September 13, 2013, the Partnership signed a credit facility agreement with a syndicate of lenders consisting of 11 different financial institutions for a term of construction period plus 7 years at a rate of Canadian Dealer Offered Rate (CDOR) plus 2.25% per annum. The credit facilities under the agreement include $395,383 construction facility, term facility, letter of credit facility and an interest rate hedge facility. The funds from these facilities were utilized to finance the construction of the Project and to run the Project’s operations
The Partnership reached full commercial operations in December 2014, and the construction facility converted to term loan on July 29, 2015. The loan matures on July 29, 2022. In connection with the financing agreement, the Partnership entered into interest rate swaps on 90% of the loan commitment. Interest payments on the construction facility were deferred prior to term conversion and added to the loan principal at the time of conversion.
Collateral under the financing agreement consists of substantially all of the Partnership’s assets. The loan agreement contains a broad range of covenants that, subject to certain exceptions, restrict the Partnership’s ability to incur debt, grant liens, sell or lease assets, transfer equity interest, dissolve, pay distributions and change its business. The Partnership is in compliance with all loan covenants. All of the limited and general partners and shareholders of general partners pledged shares of partnership units or common stock owned as collateral for the loan.
Terms and conditions of outstanding borrowings were as follows:
As of December 31, 2016 | |||||||||||||||||
Principal | Deferred financing costs | Net of financing costs | Interest rate | Maturity date | |||||||||||||
Term loan | $ | 369,313 | $ | (7,056 | ) | $ | 362,257 | 3.19 | % | July 2022 | |||||||
Less: current portion | (14,538) | 1,413 | (13,125) | ||||||||||||||
Net of current | $ | 354,775 | $ | (5,643 | ) | $ | 349,132 | ||||||||||
S- 42
Grand Renewable Wind LP
Notes to Financial Statements
December 31, 2016 and 2015
(In thousands of Canadian Dollars)
As of December 31, 2015 | |||||||||||||||||
Principal | Deferred financing costs | Net of financing costs | Interest rate | Maturity date | |||||||||||||
Term loan | $ | 383,210 | $ | (8,304 | ) | $ | 374,906 | 3.13 | % | July 2022 | |||||||
Less: current portion | (13,897) | 1,597 | (12,300) | ||||||||||||||
Net of current | $ | 369,313 | $ | (6,707 | ) | $ | 362,606 | ||||||||||
Future maturities of long-term debt are as follows as of December 31, 2016:
2017 | $ | 14,538 | ||
2018 | 17,371 | |||
2019 | 18,418 | |||
2020 | 19,525 | |||
2021 | 19,680 | |||
Thereafter | 279,781 | |||
$ | 369,313 | |||
The following table presents a reconciliation of interest expense presented in the Partnerships’ statements of operations and comprehensive income (loss) for the years ended December 31, 2016, 2015 and 2014:
2016 | 2015 | 2014 | ||||||||||
Interest incurred | $ | 20,400 | $ | 20,023 | $ | 10,320 | ||||||
Commitment fees incurred | — | 342 | 1,516 | |||||||||
Amortization of deferred financing costs | 1,248 | 1,593 | 1,016 | |||||||||
Less: Capitalized interest, commitment and amortization | — | — | (11,155) | |||||||||
Interest expense | $ | 21,648 | $ | 21,958 | $ | 1,697 | ||||||
Letters of credit facilities
On July 29, 2015, letters of credit of $24,000, $8,000 and $5,000 were issued upon term conversion for a debt service reserve, operations and maintenance reserve, and decommissioning reserve, respectively, with a seven-year term. Funds, when and if drawn on the facility, accrue interest at 1.25% plus Prime Rate, and at the partners’ option, the rate can be converted to a rate of CDOR plus 2.25% per annum. In addition, the Partnership shall pay letter of credit fees on the basis of the undrawn amount of the facility at 2.25% per annum. As of December 31, 2016, the letters of credit facility did not have an outstanding balance, and no amounts were drawn in 2016. Letter of credit fees of $835 and $354 were charged to other expense in the statements of operations and comprehensive income (loss) for the year ended December 31, 2016 and 2015, respectively.
7 | Asset retirement obligation |
The Partnership’s asset retirement obligation represents the estimated cost of decommissioning the turbines, removing above-ground installations and restoring the sites at the end of its estimated useful life. Effective January 1, 2015, the Partnership changed its estimate of the useful life of the power plant from 20 years to 25 years. As a result, during the year ended December 31, 2015, the Partnership recorded a one-time adjustment of $598 to reduce the carrying amount of the asset retirement obligations to reflect the change in estimate associated with the timing of the original undiscounted cash flows.
S- 43
Grand Renewable Wind LP
Notes to Financial Statements
December 31, 2016 and 2015
(In thousands of Canadian Dollars)
The following table presents a reconciliation of the beginning and ending aggregate carrying amount of the asset retirement obligation:
December 31, | ||||||||
2016 | 2015 | |||||||
Asset retirement obligation - Beginning of year | $ | 2,637 | $ | 3,074 | ||||
Adjustment related to change in useful life | - | (598) | ||||||
Accretion expense | 172 | 161 | ||||||
Asset retirement obligation - End of year | $ | 2,809 | $ | 2,637 | ||||
8 | Derivatives |
The Partnership uses interest rate derivatives to manage its exposure to fluctuations in interest rates. Interest rate risk exists primarily on variable-rate debt for which the cash flows vary based upon movement in market prices. The Partnership’s objectives for holding these derivative instruments include reducing, eliminating and efficiently managing the economic impact of interest rate exposures as effectively as possible. The Partnership does not hedge all of its interest rate risks, thereby exposing the unhedged portions to changes in market prices.
As of December 31, 2016, the Partnership had other energy-related contracts that did not meet the definition of a derivative instrument and were therefore exempt from fair value accounting treatment.
The following tables present the fair values of the Partnership's derivative instruments on a gross basis as reflected on the Partnership’s balance sheets:
December 31, 2016 | December 31, 2015 | |||||||||||||||
Derivative liabilities | Derivative liabilities | |||||||||||||||
Current | Long-term | Current | Long-term | |||||||||||||
Fair value of designated derivatives: | ||||||||||||||||
Interest rate swaps | $ | 7,767 | $ | 18,335 | $ | 8,643 | $ | 25,215 | ||||||||
Fair value of undesignated derivatives: | ||||||||||||||||
Interest rate swaps | $ | — | $ | 27,925 | $ | — | $ | 20,672 | ||||||||
Total fair value | $ | 7,767 | $ | 46,260 | $ | 8,643 | $ | 45,887 | ||||||||
The following table summarizes the notional amounts of the Partnership's outstanding derivative instruments:
December 31 | ||||||||||
Unit of measure | 2016 | 2015 | ||||||||
Designated derivative instruments | ||||||||||
Interest rate swaps | CAD | $ | 335,082 | $ | 347,590 | |||||
The following table presents losses on derivative contracts designated and qualifying as cash flow hedges recognized in accumulated other comprehensive loss, as well as, losses on other derivative contracts and amounts reclassified to earning for the following periods:
December 31 | ||||||||||
Description | 2016 | 2015 | ||||||||
Income (losses) recognized in accumulated OCL | Effective portion | $ | 7,756 | $ | (6,077 | ) | ||||
Losses recognized in earnings on other derivative contracts | Effective portion | $ | (7,253 | ) | $ | (3,354 | ) | |||
Losses reclassified from accumulated OCL into interest expense | Derivative settlements | $ | (8,582 | ) | $ | (8,320 | ) | |||
S- 44
Grand Renewable Wind LP
Notes to Financial Statements
December 31, 2016 and 2015
(In thousands of Canadian Dollars)
No ineffectiveness was recorded on these swaps for the years ended December 31, 2016 and 2015. The Partnership estimates that $8,061 in accumulated other comprehensive loss will be reclassified into earnings over the next twelve months.
9 | Fair value measurement |
The Partnership’s fair value measurements incorporate various factors, including the credit standing and performance risk of the counterparties, the applicable exit market, and specific risks inherent in the instrument. Non-performance and credit risk adjustments on risk management instruments are based on current market inputs when available, such as credit default hedge spreads. When such information is not available, internal models are used.
Assets and liabilities recorded at fair value in the financial statements are categorized based upon the level of judgment associated with the inputs used to measure their fair value. Hierarchical levels directly related to the amount of subjectivity associated with the inputs to valuation of these assets or liabilities are as follows:
Level 1 - Inputs are unadjusted, quoted prices in active markets for identical assets or liabilities at the measurement date.
Level 2 - Inputs (other than quoted prices included in Level 1) are either directly or indirectly observable for the asset or liability through correlation with market data at the measurement date and for the duration of the instrument’s anticipated life.
Level 3 - Unobservable inputs that are supported by little or no market activity and that are significant to the fair value of the assets or liabilities and which reflect management’s best estimate of what market participants would use in pricing the asset or liability at the measurement date. Consideration is given to the risk inherent in the valuation technique and the risk inherent in the inputs to the model.
Short-term financial instruments consist principally of cash and cash equivalents, restricted cash, and accounts payable and other accrued liabilities. Based on the nature and short maturity of these instruments their fair value is approximated using carrying cost and they are presented in the financial statements at carrying cost.
Long term debt is presented on the balance sheets at amortized cost. The fair value of the Partnership’s long-term debt is approximately $388,317 and $404,231 as of December 31, 2016 and 2015, respectively. It is estimated based on current rates that would be available for debt of similar terms which is not significantly different from its stated value.
Derivatives are presented in the financial statements at fair value. The interest rate swaps were valued by discounting the net cash flows using the forward CDOR curve with the valuations adjusted by the Project’s credit default swap rate.
The Partnership’s financial assets (liabilities) which require fair value measurement on a recurring basis are classified within the fair value hierarchy as follows:
Level 1 | Level 2 | Level 3 | ||||||||||
December 31, 2016 | ||||||||||||
Interest rate swaps | $ | — | $ | (54,027 | ) | $ | — | |||||
December 31, 2015 | ||||||||||||
Interest rate swaps | $ | — | $ | (54,530 | ) | $ | — | |||||
10 | Commitments and contingencies |
1) | Commitments |
Power Purchase Agreement
The Partnership entered into a PPA with the Ontario Power Authority on August 2, 2011, which subsequently merged with the IESO. The term of the PPA provides for the annual delivery of electricity to the Ontario electricity grid at specified prices with price escalation for 20% of the contracted price over the duration of the PPA, which is 20 years from COD.
S- 45
Grand Renewable Wind LP
Notes to Financial Statements
December 31, 2016 and 2015
(In thousands of Canadian Dollars)
Land Lease Agreements
The Partnership has entered into various long-term land lease agreements. The annual fees range from minimum rent payments varying by lease to maximum rent payments of a certain percentage of energy delivered revenues, varying by lease.
Lease payments, including amortization of the lease option, of $1,936, $1,864 and $0 were charged to the statements of operations and comprehensive income (loss) for the years ended December 31, 2016, 2015 and 2014, respectively.
The future payments related to these leases as of December 31, 2016 are as follows:
2017 | $ | 1,840 | ||
2018 | 1,877 | |||
2019 | 1,914 | |||
2020 | 1,953 | |||
2021 | 1,991 | |||
Thereafter | 32,430 | |||
Total | $ | 42,005 | ||
Service and Maintenance Agreement
The Partnership has entered into service and maintenance agreements with Siemens to provide and carry out turbine maintenance and service activities for the Project until January 2018. Based on the terms of the agreements, Siemens shall be entitled to receive a daily base fee per turbine that may be subject to periodic price adjustments for inflation, over the terms of the agreements. As of December 31, 2016, outstanding commitments with Siemens were $4,000, including an estimated annual price adjustment for inflation of 2%, where applicable, payable over the full term of the agreement.
1) | Contingencies |
Community Vibrancy Fund
On September 26, 2011, the Partnership entered into a Community Vibrancy Fund (CVF) Agreement with the Corporation of Haldimand County, in which the Partnership will make annual payments into a fund managed by the municipality in amounts of $3.5 per MW of the Project installed capacity plus $5 per kilometer (km) of high voltage overhead transmission line that is installed in municipal right-of-way. The payments are calculated annually and are owed for the 20-year term of the PPA. In exchange for CVF payments, the municipality undertakes certain obligations to support the Project, including entering into a road use agreement in which the Project may utilize municipal right-of-ways for collection and transmission lines.
Turbine Availability Warranty
The Partnership has a turbine availability warranty from its turbine manufacturer. Pursuant to the warranty, if a turbine operates at less than minimum availability during the warranty period, the turbine manufacturer is obligated to pay, as liquidated damages, an amount for each percent that the turbine operates below the minimum availability threshold. In addition, if a turbine operates at more than a specified availability during the warranty period, the Partnership has an obligation to pay a bonus to the turbine manufacturer. As of December 31, 2016, the Partnership recorded a liability of $409 associated with bonuses payable to the turbine manufacturer.
11 | Related party transactions |
The Partnership is controlled by the GP, which is jointly controlled by Samsung and Pattern in accordance with the terms of the Shareholder Agreement. Certain terms of the Samsung and Pattern Joint Venture Wind Development Agreement, entered into between Samsung and an affiliate of PRHC on July 27, 2010, directed the responsibilities of Samsung and PRHC during the development of the Project.
S- 46
Grand Renewable Wind LP
Notes to Financial Statements
December 31, 2016 and 2015
(In thousands of Canadian Dollars)
The following transactions were carried out with related parties:
a) | Management, Operation, and Maintenance Agreement (MOMA) |
Balance of Plant MOMA
On September 13, 2013, the Partnership entered into a MOMA with Pattern Operators Canada ULC, which is owned by PCOH to operate and manage the maintenance of the wind plant and to perform certain other services pertaining to the wind plant in accordance with terms and conditions set in the MOMA.
The amounts of $1,206, $1,187 and $787 were invoiced to the Partnership for the years ended December 31, 2016, 2015 and 2014, respectively, of which $0, $0 and $715 was capitalized to property, plant and equipment as of December 31, 2016, 2015 and 2014, respectively, and $1,206, $1,187and $73 were charged to the statements of operations and comprehensive income (loss) for the years ended December 31, 2016, 2015 and 2014, respectively.
Transmission Line MOMA (TL MOMA)
On September 13, 2013, the Partnership and Grand Renewable Solar LP entered into TL MOMA with Pattern Operators Canada ULC, which is 100% owned by an affiliate of Pattern, to operate and manage the maintenance of the transmission line and common assets of the substation and to perform certain other services pertaining to the wind plant in accordance with terms and conditions set in TL MOMA.
The amounts of $52, $57 and $2 were charged to the statements of operations and comprehensive income for the years ended December 31, 2016, 2015 and 2014, respectively.
b) | Engineering Procurement and Construction Contract (EPC contract) |
Balance of Plant EPC
On September 13, 2013, the Partnership entered into the Balance of Plant EPC contract with SRE GRW EPC LP, which is 100% owned by Samsung to build the balance of plant, and $0 and $1,576 were capitalized to property, plant and equipment on the balance sheets as of December 31, 2016 and 2015, respectively.
Transmission Line EPC
On September 13, 2013, the Partnership entered into TL EPC contract with Grand Renewable Solar LP, and SRE GRW EPC LP, which is 100% owned by Samsung to build the transmission line, and $(1) and $188 were capitalized to property, plant and equipment on the balance sheets as of December 31, 2016 and 2015, respectively.
c) | Project Administration Agreement (PAA) |
On September 31, 2013, the Partnership entered into PAA with SRE Wind PA LP (PA), which is 100% owned by Samsung to receive project administrative services.
$412, $406 and $288 were charged to the statements of operations and comprehensive income (loss) for the years ended December 31, 2016, 2015 and 2014, respectively.
d) | Transmission Facilities Co-ownership Agreement (TFCA) |
On March 8, 2013, the Partnership entered into the TFCA with a planned 100 MW solar project developed by an affiliate of Samsung which provides for the co-ownership of the transmission line and substation of the Project. Under the co-ownership agreement, the Project and the solar project each contributed 50% of the construction and operating costs of the transmission line and substation and each received a 50% undivided interest in such shared facilities.
S- 47
Grand Renewable Wind LP
Notes to Financial Statements
December 31, 2016 and 2015
(In thousands of Canadian Dollars)
e) | The Partnership recorded the following balances with related parties: |
2016 | 2015 | |||||||
Related party payable to Pattern Operators Canada ULC | $ | 290 | $ | 187 | ||||
Related party payable to SRE Wind PA LP | $ | 39 | $ | 38 | ||||
Related party payable and accrued liabilities to SRE GRW EPC LP | $ | — | $ | 1,220 | ||||
Accrued liabilities to prime-sub contractor | $ | — | $ | 4,000 | ||||
12 | Subsequent events |
There were no material subsequent events.
S- 48
SP Armow Wind Ontario LP
Financial Statements
As of December 31, 2016 and
for the period from October 18
to December 31, 2016
(In thousands of Canadian Dollars)
S- 49
SP Armow Wind Ontario LP
S- 50

March 1, 2017
Independent Auditor’s Report
To the Partners of
SP Armow Wind Ontario LP
We have audited the accompanying balance sheet of SP Armow Wind Ontario LP as of December 31, 2016 and the related statements of operations and comprehensive income, changes in partners’ equity, and cash flows for the period from October 18, 2016 to December 31, 2016. Management is responsible for these financial statements. Our responsibility is to express an opinion on these financial statements based on our audit.
We conducted our audit in accordance with the standards of the Public Company Accounting Oversight Board (United States). Those standards require that we plan and perform the audit to obtain reasonable assurance about whether the financial statements are free of material misstatement. Our audit of the financial statements included examining, on a test basis, evidence supporting the amounts and disclosures in the financial statements, assessing the accounting principles used and significant estimates made by management, and evaluating the overall financial statement presentation. We were not engaged to perform an audit of the company’s internal control over financial reporting. Our audit included consideration of internal control over financial reporting as a basis for designing audit procedures that are appropriate in the circumstances, but not for the purpose of expressing an opinion on the effectiveness of the company’s internal control over financial reporting. Accordingly, we express no such opinion. Our audit also included performing such other procedures as we considered necessary in the circumstances. We believe that our audit provide a reasonable basis for our opinion.
In our opinion, the financial statements referred to above present fairly, in all material respects, the financial position of SP Armow Wind Ontario LP as of December 31, 2016 and the results of its operations and its cash flows for the period from October 18, 2016 to December 31, 2016 in conformity with accounting principles generally accepted in the United States of America.
/s/ PricewaterhouseCoopers LLP
Chartered Professional Accountants, Licensed Public Accountants
PricewaterhouseCoopers LLP
PwC Tower, 18 York Street, Suite 2600, Toronto, Ontario, M5J 0B2
T: +1 416 863 1133, F: +1 416 365 8215
“PwC” refers to PricewaterhouseCoopers LLP, an Ontario limited liability partnership.
S- 51
SP Armow Wind Ontario LP
Balance Sheet
As of December 31, 2016
(In thousands of Canadian Dollars)
ASSETS | |||
Current assets: | |||
Cash and cash equivalents | $ | 21,856 | |
Restricted cash (note 3) | 814 | ||
Accrued revenue (note 2) | 13,115 | ||
Other current assets | 1,456 | ||
Total current assets | 37,242 | ||
Restricted cash (note 3) | 7,086 | ||
Property, plant and equipment - net of accumulated depreciation of $23,724 (note 4) | 522,867 | ||
Other assets | 923 | ||
Total assets | $ | 568,118 | |
LIABILITIES & EQUITY | |||
Current liabilities: | |||
Accounts payable and other accrued liabilities | $ | 3,642 | |
Accounts payable and other accrued liabilities - related parties (note 11) | 374 | ||
Current portion of long-term debt, net of financing costs of $1,381 (notes 2 and 5) | 6,020 | ||
Contingent liabilities (note 9) | 446 | ||
Derivative liabilities, current (note 7) | 7,357 | ||
Other current liabilities | 1,959 | ||
Total current liabilities | 19,798 | ||
Long-term debt, net of financing costs of $6,480 (notes 2 and 5) | 503,653 | ||
Derivative liabilities (note 7) | 35,555 | ||
Asset retirement obligation (note 6) | 5,023 | ||
Total liabilities | 564,029 | ||
Commitments and contingencies (note 9) | |||
Equity: | |||
Partners’ capital | 13,567 | ||
Accumulated net income | 33,434 | ||
Accumulated other comprehensive loss | (42,912) | ||
Total partners’ equity | 4,089 | ||
Total liabilities and equity | $ | 568,118 | |
See accompanying notes to financial statements.
S- 52
SP Armow Wind Ontario LP
Statement of Operations and Comprehensive Income
For the period October 18, 2016 to December 31, 2016
(In thousands of Canadian Dollars)
Revenue (note 2): | |||
Energy delivered | $ | 16,498 | |
Compensation for forgone energy | 6,473 | ||
Other revenue | 300 | ||
Total revenue | 23,271 | ||
Cost of revenue: | |||
Project expenses | 2,040 | ||
Project expenses - related parties (note 10) | 277 | ||
Depreciation, amortization and accretion | 4,544 | ||
Total cost of revenue | 6,861 | ||
Gross profit | 16,410 | ||
Operating expenses: | |||
General and administrative | 237 | ||
General and administrative - related parties (note 10) | 83 | ||
Total operating expenses | 320 | ||
Operating income | 16,090 | ||
Other expense: | |||
Interest expense (note 5) | (4,898) | ||
Other expense, net | (148) | ||
Total other expense | (5,046) | ||
Net income | 11,044 | ||
Other comprehensive income: | |||
Derivative activity (notes 7 and 8): | |||
Effective portion of change in fair value of derivatives | 17,064 | ||
Reclassifications to net income | 2,154 | ||
Total change in effective portion of change in fair market value of derivatives | 19,218 | ||
Comprehensive income | $ | 30,262 | |
See accompanying notes to financial statements.
S- 53
SP Armow Wind Ontario LP
Statement of Changes in Partners’ Equity
For the period October 18, 2016 to December 31, 2016
(In thousands of Canadian Dollars)
Partners’ capital | Accumulated net income | Accumulated other comprehensive loss | Total | |||||||||
Balance at October 18, 2016 | $ | 25,020 | $ | 22,390 | $ | (62,130) | $ | (14,720) | ||||
Other comprehensive income | - | - | 19,218 | 19,218 | ||||||||
Net income | - | 11,044 | - | 11,044 | ||||||||
Cash distribution | (11,453) | - | - | (11,453) | ||||||||
Balance at December 31, 2016 | $ | 13,567 | $ | 33,434 | $ | (42,912) | $ | 4,089 | ||||
See accompanying notes to financial statements.
S- 54
SP Armow Wind Ontario LP
Statement of Cash Flows
For the period October 18, 2016 to December 31, 2016
(In thousands of Canadian Dollars)
Cash flows from operating activities: | |||
Net income | $ | 11,044 | |
Adjustments to reconcile net income to net cash used in operating activities: | |||
Depreciation, amortization and accretion | 4,544 | ||
Amortization of deferred financing costs | 285 | ||
Changes in assets and liabilities, net: | |||
Accrued revenue | (2,654) | ||
Accounts payable and other accrued liabilities | 424 | ||
Other, net | (4,869) | ||
Net cash provided by operating activities | 8,774 | ||
Cash flows from investing activities: | |||
Capital expenditures | (326) | ||
Net changes in sales taxes recoverable and accounts payable and other accrued liabilities related to investing activities | (851) | ||
Decrease in restricted cash | 458 | ||
Net cash used in investing activities | (719) | ||
Cash flows from financing activities: | |||
Distribution to partners | (11,453) | ||
Net cash used in financing activities | (11,453) | ||
Net change in cash and cash equivalents | (3,605) | ||
Cash and cash equivalents - Beginning of the period | 25,254 | ||
Cash and cash equivalents - End of the period | $ | 21,856 | |
Supplemental disclosure: | |||
Cash payments for interest | $ | 7,482 | |
See accompanying notes to financial statements.
S- 55
SP Armow Wind Ontario LP
Notes to Financial Statements
December 31, 2016
(In thousands of Canadian Dollars)
1 | General information |
The Partnership
SP Armow Wind Ontario LP (the Partnership), a limited partnership under the laws of the Province of Ontario, was formed on August 29, 2011 as a joint venture project between Samsung Renewable Energy Inc. (Samsung) and Pattern Armow LP Holdings LP, a subsidiary of Pattern Renewable Holdings Canada ULC (PRHC), each as 49.99% limited partners of the Partnership, and SP Armow Wind Ontario GP Inc. (the GP), as the 0.02% general partner of the Partnership. The Partnership was created to develop, build and operate a wind power project in Kincardine, Bruce County with generation capacity totaling approximately 180 megawatts (MW) of power (the Project).
On August 6, 2014, Samsung transferred all of its LP interest in the Partnership to SRE Armow LP Holdings LP, an affiliate of Samsung.
On October 17, 2016, Pattern Armow LP Holdings LP transferred all of its LP interest in the Partnership to Pattern Canada Finance Company ULC, a wholly owned subsidiary of Pattern Energy Group Inc. (Pattern).
The Partnership is controlled by its general partner, the GP, also a joint venture controlled by affiliates of Samsung and Pattern. As of December 31, 2016 and 2015, the Partnership’s ownership interests were distributed as follows:
2016 | 2015 | |||||
SRE Armow LP Holdings LP | 49.99 | % | 49.99 | % | ||
Pattern Armow LP Holdings LP | - | 49.99 | % | |||
Pattern Canada Finance Company ULC | 49.99 | % | - | |||
SP Armow Wind Ontario GP Inc. | 0.02 | % | 0.02 | % | ||
100.00 | % | 100.00 | % | |||
The Project
The Project is a 179 MW wind project consisting of 91 Siemens wind turbine generators located in Haldimand County, Ontario. On December 7, 2015 the Project achieved COD and commenced commercial operations.
The Partnership has a power purchase agreement (PPA) with the Independent Electricity System Operator (IESO) for a period of 20 years from the COD. The IESO oversees the wholesale electricity market, where the price of energy is determined. It also administers the rules that govern the market and, through an arm's-length market monitoring function, ensures that it is operated fairly and efficiently. The IESO is an agent among the market participants in Ontario and is neither exposed to, nor benefits from, any transactions. In such capacity, the IESO executes agreements to help the market meet the renewable energy mandates of the government of the Province of Ontario. There are approximately 70 electric distribution companies in Ontario, all of which have government mandates to purchase renewable energy. The PPA provides for guaranteed pricing from IESO that removes volatility caused by fluctuations in market rates. The Ontario government established the Global Adjustment (GA) which is designed to adjust consumer rates depending on the price of energy. The IESO establishes a monthly variable GA rate based on GA costs and Ontario electricity demand which effectively establishes a pass through mechanism to the consumer and eliminates the IESO's economic exposure to our contract price.
2 | Summary of significant accounting policies |
The principal accounting policies applied in the preparation of these financial statements are set out below. These policies have been consistently applied to the period presented, unless otherwise stated.
Basis of presentation
In accordance with Rule 3-09 of Regulation S-X, full financial statements of significant equity investments are required to be presented in the annual report of the investor. For purposes of S-X 3-09, the investee’s separate annual financial statements should
S- 56
SP Armow Wind Ontario LP
Notes to Financial Statements
December 31, 2016
(In thousands of Canadian Dollars)
only depict the period of the fiscal year in which it was accounted for by the equity method by the investor. On Oct 17, 2016, Pattern purchased its interest in the partnership. Accordingly, the accompanying financial statements have been prepared for the period from October 18, 2016 to December 31, 2016 (stub period).
Basis of preparation
The accompanying financial statements have been prepared in accordance with accounting principles generally accepted in the United States of America (U.S. GAAP). The preparation of U.S. GAAP financial statements requires management to make certain estimates and assumptions that affect the reported amounts of assets and liabilities and the disclosure of contingent assets and liabilities at the date of the financial statements and the reported amounts of revenue and expenses during the reporting period. Because the use of estimates is inherent in the financial reporting process, actual results could differ from those estimates.
In recording transactions and balances resulting from business operations, the Partnership uses estimates based on the best information available. Estimates are used for such items as accrued revenue, asset retirement obligation, valuation of derivative contracts and acquisition of contingencies.
These financial statements do not include assets, liabilities, revenue and expenses of the GP and limited partners. The financial statements of the Partnership reflect no provision or liability for income taxes because profits and losses of the Partnership are allocated to the partners and are included in the income tax returns of partners. Income and losses for tax purposes may differ from the financial statement amounts and the partners’ equity reflected in the financial statements does not necessarily reflect their tax basis.
Functional and presentation currency
Items included in the financial statements of the Partnership are measured using the currency of the primary economic environment in which the Partnership operates (the functional currency). The financial statements are presented in Canadian dollars, which is the Partnership’s functional and presentation currency.
Fair value of financial instruments
ASC 820, Fair Value Measurements, defines fair value as the price at which an asset could be exchanged or a liability transferred in an orderly transaction between knowledgeable, willing parties in the principal or most advantageous market for the asset or liability. Where available, fair value is based on observable market prices or derived from such prices. Where observable prices or inputs are not available, valuation models are applied.
These valuation techniques involve some level of management estimation and judgment, the degree of which is dependent on the price transparency for the instruments or market and the instruments’ complexity.
Cash and cash equivalents
Cash and cash equivalents include cash on hand, deposits held at call with banks and other short-term highly liquid investments with original maturities of three months or less.
Restricted cash
Restricted cash consists of cash reserves required under the Partnership’s loan agreements and security deposits required to collateralize commercial bank letter of credit facilities related primarily to a power purchase agreement (PPA) and road use agreements (note 3).
Trade receivables
The Partnership’s trade receivables are generated by selling energy in Ontario, Canada through the IESO as a settlement agent. The allowance for doubtful accounts, if needed, is computed based upon management’s estimates of uncollectible accounts. As of December 31, 2016, the Partnership has no outstanding trade receivables.
S- 57
SP Armow Wind Ontario LP
Notes to Financial Statements
December 31, 2016
(In thousands of Canadian Dollars)
Accrued revenue
Accrued revenue represents revenues recognized on contracts for which billings have not been presented to customers as of the balance sheet date. These amounts are billed and generally collected within two months.
Concentration of credit risk
Financial instruments that potentially subject the Partnership to concentrations of credit risk consist primarily of cash and cash equivalents and restricted cash. The Partnership places its cash and cash equivalents and restricted cash with creditworthy institutions located in Canada, which management believes to have minimal risk. At times, such balances may be in excess of the Canada Deposit Insurance Corporation (CDIC) insurance coverage limit. CDIC insurance currently covers up to $100 per depositor at each insured bank.
The Partnership’s derivative agreements expose the Partnership to losses under certain circumstances, such as the counterparty defaulting on its obligations under the swap agreements or if the swap agreements provide an imperfect hedge. Counterparties to the Partnership’s derivative contracts are major financial institutions that have been accorded investment grade ratings.
Property, plant and equipment
Property, plant and equipment are stated at historical cost, less accumulated depreciation. Historical cost includes expenditure that is directly attributable to the acquisition of the items. Subsequent costs are included in the asset’s carrying value or recognized as separate assets, as appropriate, only when it is probable that the future economic benefits associated with the item will flow to the Partnership and the cost of the item can be reliably measured.
The asset retirement obligation included in property, plant and equipment is stated at the present value of future cash flows of asset retirement obligation at the time of COD.
Depreciation on property, plant and equipment is calculated using the straight-line method to allocate their cost to their residual values over their estimated useful lives. The power plant is depreciated over 25 years and the remaining assets are depreciated over 5 years. The assets’ residual values and useful lives are reviewed and adjusted, if appropriate, at the end of each reporting period. Repair and maintenance costs are expensed as incurred.
Impairment of long-lived assets
The Partnership periodically evaluates whether events have occurred that would require revision of the remaining useful life of equipment and improvements or render them not recoverable. If such circumstances arise, the Partnership uses an estimate of the undiscounted value of expected future operating cash flows to determine whether the long-lived assets are impaired. If the aggregate undiscounted cash flows are less than the carrying amount of the assets, the resulting impairment charge to be recorded is calculated based on the excess of the carrying value of the assets over the fair value of such assets, with the fair value determined based on an estimate of discounted future cash flows. Through December 31, 2016, no impairment charges were recorded.
Deferred financing costs
Financing costs incurred in connection with obtaining construction and term financing, which include direct financing, legal and other upfront costs of borrowing, are capitalized and recorded as a reduction to long-term debt and amortized over the lives of the respective loans using the effective-interest method. Amortization of deferred financing costs is capitalized during construction or expensed following COD.
Interest capitalization
The Partnership capitalizes interest and related financing fees from non-recourse debt used to finance projects in construction. Capitalization is discontinued when a project reaches commercial operation.
S- 58
SP Armow Wind Ontario LP
Notes to Financial Statements
December 31, 2016
(In thousands of Canadian Dollars)
Derivatives
The Partnership recognizes its derivative instruments as either assets or liabilities in the balance sheets at fair value. The accounting for changes in the fair value (i.e., gains or losses) of a derivative instrument depends on whether it qualifies and has been designated as part of a hedging relationship and, further, on the type of hedging relationship.
For derivative instruments that are designated and qualify as a cash flow hedge (i.e., hedging the exposure to variability in expected future cash flows that are attributable to a particular risk), the effective portion of the gain or loss on the derivative instrument is reported as a component of other comprehensive income (OCI). Changes in the fair value of these derivatives are subsequently reclassified into earnings in the period the hedged transaction affects earnings. The ineffective portion of changes in fair value is recorded as a component of net income in the statement of operations and comprehensive income.
For undesignated derivative instruments, their change in fair value is reported as a component of net income in the statement of operations and comprehensive income.
The Partnership enters into derivative transactions for the purpose of managing exposure to fluctuations in interest rates, such as interest rate swaps. Interest rate swaps are instruments used to fix the interest rate on variable interest rate debt.
Accounts payable and other accrued liabilities
Trade payables are an obligation to pay for goods or services that have been acquired in the ordinary course of business from suppliers. Payables with payment terms extended beyond one year from the balance sheet dates are presented as non-current liabilities.
Contingent liabilities
Contingent liabilities are recognized when: the Partnership has a present legal obligation as a result of past events; it is probable that an outflow of resources will be required to settle the obligation; and the amount has been reasonably estimated.
Asset retirement obligation
The Partnership records an asset retirement obligation for the estimated costs of decommissioning turbines, removing above-ground installations and restoring sites, at the time when a contractual decommissioning obligation materializes. The Partnership records accretion expense, which represents the increase in the asset retirement obligation, over the remaining life of the associated wind project. Accretion expense is recorded as cost of revenue in the statement of operations and comprehensive income using accretion rates based on a credit adjusted risk free interest rate of 4.989%.
Revenue recognition
Revenue is recognized based upon the amount of electricity delivered or curtailed at rates specified under the contracts, assuming all other revenue recognition criteria are met. When curtailment revenue is earned it is recorded as compensation for forgone revenue. The Partnership evaluates its PPA to determine whether it is in substance a lease or derivative and, if applicable, recognizes revenue pursuant to ASC 840 Leases and ASC 815 Derivatives and Hedging, respectively. As of December 31, 2016, the PPA was not considered a lease or a derivative instrument, as multiple market participants purchase the energy at market-based prices with IESO working as a settlement agent. As a result, revenue (including any revenue from the price guaranteed by IESO), is recognized on an accrual basis.
The Partnership recognizes revenue for warranty settlements and liquidated damages from a turbine manufacturer in other revenue upon resolution of outstanding contingencies. Any cash receipts for amounts subject to future adjustment or repayment are deferred in other liabilities until the final settlement amount is considered fixed and determinable.
Cost of revenue
The Partnership’s cost of revenue is comprised of direct costs of operating and maintaining its project facilities, including labor, turbine service arrangements, metering service and shadow settlement, environmental fee, land lease royalties, property tax, insurance, depreciation, amortization and accretion.
S- 59
SP Armow Wind Ontario LP
Notes to Financial Statements
December 31, 2016
(In thousands of Canadian Dollars)
Comprehensive income
Comprehensive income consists of net income and other comprehensive income. Other comprehensive income is included in accumulated other comprehensive loss in the accompanying statement of changes in partners’ equity.
Recent accounting pronouncements
In November 2016, the FASB issued ASU 2016-18, Statement of Cash Flows (Topic 230): Restricted Cash (ASU 2016-18), which requires that a statement of cash flows explain the change during the period in the total of cash, cash equivalents, and amounts generally described as restricted cash or restricted cash equivalents. As a result, amounts generally described as restricted cash and restricted cash equivalents should be included with cash and cash equivalents when reconciling the beginning-of-period and end-of-period total amounts shown on the statement of cash flows. The amendments do not provide a definition of restricted cash or restricted cash equivalents. The Partnership is currently assessing the future impact of this guidance on its financial statements and related disclosures and expects to adopt these updates beginning January 1, 2017.
In August 2016, the FASB issued ASU 2016-15, Statement of Cash Flows (Topic 230): Classification of Certain Cash Receipts and Cash Payments (ASU 2016-15), which provides guidance on specific cash flow issues. ASU 2016-15 is effective for fiscal years beginning after December 15, 2017, and interim periods within those fiscal years. Early adoption is permitted, including adoption in an interim period. The adoption of ASU 2016-15 on December 31, 2016 did not have a material impact on the Partnership’s financial statements and related disclosures.
In June 2016, the FASB issued ASU 2016-13, Financial Instruments —Credit Losses (Topic 326): Measurement of Credit Losses on Financial Instruments (ASU 2016-13), which requires the measurement of all expected credit losses for financial assets including trade receivables held at the reporting date based on historical experience, current conditions, and reasonable and supportable forecasts. ASU 2016-13 is effective for fiscal years, and interim periods within those fiscal years, beginning after December 15, 2019. The adoption of ASU 2016-13 is not expected to have a material impact on its financial statements and related disclosures.
In May 2014, the FASB issued ASU 2014-09, which creates FASB Accounting Standards Codification (ASC) Topic 606, Revenue from Contracts with Customers and supersedes ASC Topic 605, Revenue Recognition (ASU 2014-09). The guidance replaces industry-specific guidance and establishes a single five-step model to identify and recognize revenue. The core principle of the guidance is that an entity should recognize revenue upon transfer of control of promised goods or services to customers in an amount that reflects the consideration to which an entity expects to be entitled in exchange for those goods or services. Additionally, the guidance requires the entity to disclose further quantitative and qualitative information regarding the nature and amount of revenues arising from contracts with customers, as well as other information about the significant judgments and estimates used in recognizing revenues from contracts with customers. The effective date of ASU 2014-09 was deferred by the issuance of ASU 2015-14, Revenue from Contracts with Customers: Deferral of the Effective Date, (Topic 606) by one year to make the guidance of ASU 2014-09 effective for annual reporting periods beginning after December 15, 2017, including interim periods therein. Early adoption is permitted, but not prior to the original effective date, which was for annual reporting periods beginning after December 15, 2016. In March 2016, the FASB issued ASU 2016-08, Revenue from Contracts with Customers (Topic 606) Principal versus Agent Considerations (Reporting Revenue Gross versus Net), which clarifies how to apply the implementation guidance on principal versus agent considerations related to the sale of goods or services to a customer as updated by ASU 2014-09. In April 2016, the FASB issued ASU 2016-10, Revenue from Contracts with Customers (Topic 606) Identifying Performance Obligations and Licensing, which clarifies two aspects of Topic 606: identifying performance obligations and the licensing implementation guidance, while retaining the related principles for those areas, as updated by ASU 2014-09. In May 2016, the FASB issued ASU 2016-12, Revenue from Contracts with Customers (Topic 606): Narrow-Scope Improvements and Practical Expedients (ASU 2016-12), which makes narrow scope amendments to Topic 606 including implementation issues on collectability, non-cash consideration and completed contracts at transition. In December 2016, the FASB issued ASU 2016-20, Technical Corrections and Improvements to Topic 606, "Revenue from Contracts with Customers" (ASU 2016-20), which make additional narrow scope amendments to Topic 606 including loan guarantee fees, impairment testing of contract costs, provisions for losses on construction-type and production-type contracts. The Partnership is currently assessing the future impact of this guidance on its financial statements and related disclosures and expects to adopt these updates beginning January 1, 2018.
In March 2016, the FASB issued ASU 2016-05, Derivatives and Hedging (Topic 815): Effect of Derivative Contract Novations on Existing Hedge Accounting Relationships (ASU 2016-05), which clarifies that a change in the counterparty to a derivative instrument that has been designated as the hedging instrument does not, in and of itself, require dedesignation of that hedging relationship
S- 60
SP Armow Wind Ontario LP
Notes to Financial Statements
December 31, 2016
(In thousands of Canadian Dollars)
provided that all other hedge accounting criteria remain intact. ASU 2016-05 is effective for annual periods beginning after December 15, 2017, including interim reporting periods therein, with early adoption permitted. The adoption of ASU 2016-05 on January 1, 2016 had no impact on the Partnership's financial statements and related disclosures.
In February 2016, the Financial Accounting Standards Board ("FASB") issued Accounting Standards Update ("ASU") 2016-02, "Leases," which requires lessees to recognize right-of-use assets and lease liabilities, for all leases, with the exception of short-term leases, at the commencement date of each lease. Under the new guidance, lessor accounting is largely unchanged. ASU 2016-02 simplifies the accounting for sale and leaseback transactions primarily because lessees must recognize lease assets and liabilities. ASU 2016-02 is effective for annual periods beginning after December 15, 2018, and interim periods within those annual periods. Early adoption is permitted. The amendments of this update should be applied using a modified retrospective approach, which requires lessees and lessors to recognize and measure leases at the beginning of the earliest period presented. The Partnership is currently assessing the future impact of this update on its financial statements and related disclosures and expects to adopt this update beginning January 1, 2019.
In August 2015, the FASB issued ASU 2015-14, “Revenue from Contracts with Customers: Deferral of the Effective Date” to amend ASU 2015-09 “Revenue from Contracts with Customers” to defer the effective date of ASU 2014-09 for all entities by one year. The guidance in ASU 2014-09 provides companies with a single model for use in accounting for revenue arising from contracts with customers and supersedes current revenue recognition guidance, including industry-specific revenue guidance. The core principle of the model is to recognize revenue when control of the goods or services transfers to the customer, as opposed to recognizing revenue when the risks and rewards transfer to the customer under the existing revenue guidance. As a result of this amendment, ASU 2014-09 is now effective for annual reporting periods beginning after December 15, 2018 and interim periods within those fiscal years. Early adoption is permitted only as of annual reporting periods beginning after December 15, 2015 and interim periods within those fiscal years. The guidance permits companies to either apply the requirements retrospectively to all prior periods presented, or apply the requirements in the year of adoption, through a cumulative adjustment. The Partnership is currently assessing the future impact of this update on its financial statements and related disclosures and expects to adopt this update beginning January 1, 2018.
In June 2015, the FASB issued ASU 2015-10, “Technical Corrections and Improvements” which covers a wide range of topics in the Accounting Standards Codification (the “Codification”). The amendments in this update represent changes to clarify the Codification, correct unintended application of guidance, or make minor improvements to the Codification that are not expected to have a significant effect on current accounting practice or create a significant administrative cost on most entities. The amendments in ASU 2015-10 were effective immediately upon issuance and the adoption did not have material impact on the Partnership's financial statements and related disclosures.
In April 2015, the Financial Accounting Standard Board (FASB) issued ASU 2015-03, “Interest – Imputation of Interest: Simplifying the Presentation of Debt Issuance Costs” to simplify the presentation of debt issuance costs by requiring that debt issuance costs related to a recognized debt liability be presented in the balance sheet as a direct deduction from the carrying amount of the debt liability, consistent with debt discounts. The recognition and measurement guidance for debt issuance costs are not affected by the amendments in this ASU. ASU 2015-03 is effective for public companies for fiscal years beginning after December 15, 2015, and interim periods within those fiscal years and should be applied retrospectively. Early adoption is permitted for financial statements that have not been previously issued. Upon transition, an entity is required to comply with the applicable disclosures for a change in accounting principle. The Partnership adopted ASU 2015-03 in April 2015 and applied the change in accounting principle to the financial statements. The adoption of ASU 2015-3 had no impact on the Partnership’s results of operations and cash flows.
3 | Restricted cash |
The following table presents the components of restricted cash as of December 31, 2016.
Completion reserve account | $ | 5,086 | |
Security deposits for letters of guarantee | 2,010 | ||
10% holdback account for contractors | 804 | ||
Subtotal | 7,900 | ||
Less: Current portion | (814) | ||
Restricted cash, non-current | $ | 7,086 | |
S- 61
SP Armow Wind Ontario LP
Notes to Financial Statements
December 31, 2016
(In thousands of Canadian Dollars)
The amount completion reserve account is reserved to pay outstanding project costs specified during term conversion (note 5). Upon full payment of outstanding project costs, the remaining balance will be released from restricted cash.
The Partnership provided $2,000 to the Municipality of Kincardine and $10 to the County of Bruce, respectively, as the security deposits for road use.
The 10% holdback account relates to amounts withheld from payments to contractors in compliance with local regulations, which will be released to contractors when specific performance conditions are substantially met.
4 | Property, plant and equipment |
The following is a summary of property, plant and equipment, at cost less accumulated depreciation, as of December 31, 2016.
Power plant | $ | 541,654 | |
Machinery and equipment | 168 | ||
Asset retirement obligation – asset | 4,769 | ||
Subtotal | 546,591 | ||
Less: Accumulated depreciation | (23,724) | ||
$ | 522,867 | ||
Depreciation expense of $4,494 was charged to the statement of operations and comprehensive income for the stub period ended December 31, 2016.
5 | Long-term debt |
On October 24, 2014, the Partnership signed a credit facility agreement with a syndicate of lenders consisting of 10 different financial institutions for a term of construction period plus 7 years at a rate of Canadian Dealer Offered Rate (CDOR) plus 1.625% per annum. The credit facilities under the agreement include $533,000 construction facility, term facility, letter of credit facility and an interest rate hedge facility. The funds from these facilities were utilized to finance the construction of the Project and to run the Project’s operations.
The Partnership reached full commercial operations in December 2015, and the construction facility converted to term loan on May 20, 2016. The loan matures on May 20, 2023. In connection with the financing agreement, the Partnership entered into interest rate swaps on 90% of the loan commitment. Interest payments on the construction facility were deferred prior to term conversion and added to the loan principal at the time of conversion.
Collateral under the financing agreement consists of substantially all of the Partnership’s assets. The loan agreement contains a broad range of covenants that, subject to certain exceptions, restrict the Partnership’s ability to incur debt, grant liens, sell or lease assets, transfer equity interest, dissolve, pay distributions and change its business. The Partnership is in compliance with all loan covenants. All of the limited and general partners and shareholders of general partners pledged shares of partnership units or common stock owned as collateral for the loan.
Terms and conditions of outstanding borrowings were as follows as of December 31, 2016.
Principal | Deferred financing costs | Net of financing costs | Interest rate | Maturity date | ||||||||||
Term loan | $ | 517,534 | $ | (7,861) | $ | 509,673 | 2.525 | % | May 20, 2023 | |||||
Less: current portion | (7,401) | 1,381 | (6,020) | |||||||||||
Net of current | $ | 510,133 | $ | (6,480) | $ | 503,653 | ||||||||
S- 62
SP Armow Wind Ontario LP
Notes to Financial Statements
December 31, 2016
(In thousands of Canadian Dollars)
The following are the amounts due for long-term debt as of December 31, 2016:
2017 | $ | 7,401 | |
2018 | 20,310 | ||
2019 | 23,352 | ||
2020 | 25,250 | ||
2021 | 26,514 | ||
Thereafter | 414,707 | ||
$ | 517,534 | ||
The following table presents a reconciliation of interest expense presented in the Partnerships’ statement of operations and comprehensive income for the stub period ended December 31, 2016:
Interest incurred | $ | 4,613 | |
Amortization of financing cost | 285 | ||
Interest expense | $ | 4,898 | |
Letter of credit facilities
On May 20, 2016, letters of credit of $30,000 and $11,000 were issued upon term conversion for a debt service reserve and operations and maintenance reserve, respectively, with a seven-year term. Funds, when and if drawn on the facility, accrue interest at 0.625% plus Prime Rate, and at the partners’ option, the rate can be converted to a rate of CDOR plus 1.625% per annum. In addition, the Partnership shall pay letter of credit fees on the basis of the undrawn amount of the facility at 1.625% per annum. As of December 31, 2016, the letters of credit facility did not have an outstanding balance, and no amounts were drawn in 2016. Letter of credit fees of $140 were charged to other expense in the statement of operations and comprehensive income for the stub period ended December 31, 2016.
6 | Asset retirement obligation |
The Partnership’s asset retirement obligation represents the estimated cost of decommissioning the turbines, removing above-ground installations and restoring the sites at a date that is 25 years from the commencement of commercial operations.
The following table presents a reconciliation of the beginning and ending aggregate carrying amount of the asset retirement obligation:
Asset retirement obligation, beginning of the period | $ | 4,973 | |
Accretion expense | 50 | ||
Asset retirement obligation, end of the period | $ | 5,023 | |
7 | Derivatives |
The Partnership uses interest rate derivatives to manage its exposure to fluctuations in interest rates. Interest rate risk exists primarily on variable-rate debt for which the cash flows vary based upon movement in market prices. The Partnership’s objectives for holding these derivative instruments include reducing, eliminating and efficiently managing the economic impact of interest rate exposures as effectively as possible. The Partnership does not hedge all of its interest rate risks, thereby exposing the unhedged portions to changes in market prices.
As of December 31, 2016, the Partnership had energy-related contracts that did not meet the definition of a derivative instrument and were therefore exempt from fair value accounting treatment.
S- 63
SP Armow Wind Ontario LP
Notes to Financial Statements
December 31, 2016
(In thousands of Canadian Dollars)
The following tables present the fair values of the Partnership's derivative instruments on a gross basis as reflected on the Partnership’s balance sheet as of December 31, 2016:
Derivative liabilities | |||||||
Current | Non-current | ||||||
Fair value of designated derivatives: | |||||||
Interest rate swaps | $ | 7,357 | $ | 35,555 | |||
Total fair value | $ | 7,357 | $ | 35,555 | |||
The following table summarizes the notional amount of the Partnership's outstanding derivative instruments as of December 31, 2016:
Unit of measure | Amount | ||||
Designated derivative instruments | |||||
Interest rate swaps | CAD | $ | 478,597 | ||
The following table presents income on derivative contracts designated and qualifying as cash flow hedges recognized in accumulated other comprehensive loss for the stub period ended December 31, 2016:
Description | 2016 | ||||
Gain recognized in accumulated OCL | Effective portion | $ | 19,218 | ||
Losses reclassified from accumulated OCL into interest expense | Derivative settlements | $ | (2,154) | ||
No ineffectiveness was recorded on these swaps for the stub period ended December 31, 2016. The Partnership estimates that $8,249 in accumulated other comprehensive loss will be reclassified into earnings over the next twelve months.
8 | Fair value measurement |
The Partnership’s fair value measurements incorporate various factors, including the credit standing and performance risk of the counterparties, the applicable exit market, and specific risks inherent in the instrument. Non-performance and credit risk adjustments on risk management instruments are based on current market inputs when available, such as credit default swap spreads. When such information is not available, internal models are used.
Assets and liabilities recorded at fair value in the financial statements are categorized based on the level of judgment associated with the inputs used to measure their fair value. Hierarchical levels directly related to the amount of subjectivity associated with the inputs to valuation of these assets or liabilities are as follows:
Level 1 - Inputs are unadjusted, quoted prices in active markets for identical assets or liabilities at the measurement date.
Level 2 - Inputs (other than quoted prices included in Level 1) are either directly or indirectly observable for the asset or liability through correlation with market data at the measurement date and for the duration of the instrument’s anticipated life.
Level 3 - Unobservable inputs that are supported by little or no market activity and that are significant to the fair value of the assets or liabilities and which reflect management’s best estimate of what market participants would use in pricing the asset or liability at the measurement date. Consideration is given to the risk inherent in the valuation technique and the risk inherent in the inputs to the model.
Short-term financial instruments consist principally of cash and cash equivalents, restricted cash, sales tax recoverable, accounts payable and other accrued liabilities. Based on the nature and short maturity of these instruments their fair value is approximated using carrying cost and they are presented in the financial statements at carrying cost.
S- 64
SP Armow Wind Ontario LP
Notes to Financial Statements
December 31, 2016
(In thousands of Canadian Dollars)
Long-term debt is presented on the balance sheets at amortized cost. The fair value of variable interest rate for long-term debt is approximated by its carrying cost.
Derivatives are presented in the financial statements at fair value. The interest rate swaps were valued by discounting the net cash flows using the forward CDOR curve with the valuations adjusted by the counterparties’ credit default swap rate.
The following table presents the fair values according to each defined level.
Financial assets (liabilities) measured on a recurring basis:
Level 1 | Level 2 | Level 3 | |||||||
December 31, 2016 | |||||||||
Interest rate swaps | $ | - | $ | (42,912) | $ | - | |||
9 | Commitments and contingencies |
1) | Commitments |
Power purchase agreement
The Partnership entered into a PPA with the Ontario Power Authority on August 2, 2011, which subsequently merged with the IESO. The term of the PPA provides for the annual delivery of electricity to the Ontario electricity grid at specified prices with price escalation for 20% of the contracted-price over the duration of the PPA, which is 20 years from COD.
Land lease agreements
The Partnership has entered into various long-term land lease agreements. The annual fees range from minimum rent payments to maximum rent payments of a certain percentage of energy delivered revenues, varying by lease.
Lease payments, including amortization of the lease option, of $369 were charged to the statement of operations and comprehensive income for the stub period ended December 31, 2016.
The future payments related to these leases as of December 31, 2016 are as follows:
2017 | $ | 1,932 | |
2018 | 1,935 | ||
2019 | 2,051 | ||
2020 | 2,051 | ||
2021 | 2,054 | ||
Thereafter | 38,441 | ||
Total | $ | 48,464 | |
Service and Maintenance Agreement
The Partnership has entered into service and maintenance agreements with Siemens to provide and carry out turbine maintenance and service activities for the Project until January 2019. Based on the terms of the agreements, Siemens shall be entitled to receive a daily base fee per turbine that may be subject to periodic price adjustments for inflation, over the terms of the agreements. As of December 31, 2016, outstanding commitments with Siemens were $10,592, including an estimated annual price adjustment for inflation of 2%, where applicable, payable over the full term of the agreement.
S- 65
SP Armow Wind Ontario LP
Notes to Financial Statements
December 31, 2016
(In thousands of Canadian Dollars)
2) | Contingencies |
Development Agreement
On May 21, 2014, the Partnership entered into a Development Agreement (DA) with the Corporation of the Municipality of Kincardine, in which the Partnership committed to twenty annual contributions of $630 plus an initial contribution of $1,030. The initial contribution was recorded under other assets in 2015 and is amortized over the terms of the agreements. In exchange for DA payments, the municipality undertakes certain obligations to support the Project, including entering into a road use agreement.
Turbine Availability Warranty
The Partnership has a turbine availability warranty from its turbine manufacturer. Pursuant to the warranty, if a turbine operates at less than minimum availability during the warranty period, the turbine manufacturer is obligated to pay, as liquidated damages, an amount for each percent that the turbine operates below the minimum availability threshold. In addition, if a turbine operates at more than a specified availability during the warranty period, the Partnership has an obligation to pay a bonus to the turbine manufacturer. As of December 31, 2016, the Partnership recorded a liability of $446 associated with bonuses payable to the turbine manufacturer.
10 | Related party transactions |
The Partnership is controlled by the GP, which is jointly controlled by Samsung and Pattern in accordance with the terms of the Shareholder Agreement. Certain terms of the Samsung Pattern Joint Venture Wind Development Agreement, entered into between Samsung and an affiliate of PRHC on July 27, 2010, directed the responsibilities of Samsung and PRHC during the development of the Project.
The following transactions were carried out with related parties:
a) | Management, Operation, and Maintenance Agreement (MOMA) |
On October 24, 2014, the Partnership entered into a MOMA with Pattern Operators Canada ULC, which is owned by an affiliate of Pattern to operate and manage the maintenance of the wind plant and to perform certain other services pertaining to the wind plant in accordance with terms and conditions set forth in the MOMA.
The amount of $277 was charged to the statement of operations and comprehensive income for the stub period ended December 31, 2016.
b) | Engineering Procurement and Construction Contract (EPC Contract) |
On October 24, 2014, the Partnership entered into an EPC Contract with SRE Armow EPC LP, which is 100% owned by Samsung, to build the balance of plant.
There was no transaction incurred during the stub period.
c) | Project Administration Agreement (PAA) |
On October 24, 2014, the Partnership entered into the PAA with SRE Wind PA LP (PA), which is 100% owned by Samsung to supply project administrative services.
The amount of $83 was charged to the statement of operations and comprehensive income for the stub period ended December 31, 2016.
S- 66
SP Armow Wind Ontario LP
Notes to Financial Statements
December 31, 2016
(In thousands of Canadian Dollars)
d) | The Partnership recorded the following balances with related parties: |
2016 | |||
Related party payable to Pattern Operators Canada ULC | $ | 128 | |
Related party payable to SRE Wind PA LP | $ | 38 | |
Related party payable to SRE Armow EPC LP | $ | 208 | |
11 | Subsequent events |
The Partnership made a distribution to one of its limited partners in the amount of $11,453 on December 14, 2016. Subsequent to year end, the Partnership made a distribution to the other limited partner in the amount of $11,453 on January 12, 2017.
S- 67
FINANCIAL STATEMENTS
K2 Wind Ontario Limited Partnership
As of December 31, 2016 and 2015 and
for the year ended December 31, 2016 (audited) and
for the period from June 17, 2015 to December 31, 2015 (unaudited)
with Report of Independent Registered Public Accounting Firm
S- 68
K2 Wind Ontario Limited Partnership
Audited Financial Statements
As of December 31, 2016 and 2015 and
for the year ended December 31, 2016 (audited) and
for the period from June 17, 2015 to December 31, 2015 (unaudited)
Contents | Page | |
Report of Independent Registered Public Accounting Firm | ||
Audited Financial Statements | ||
Balance Sheets | ||
Statements of Operations and Comprehensive Income (Loss) | ||
Statements of Changes in Partners' Capital (Deficit) | ||
Statements of Cash Flows | ||
Notes to Financial Statements | ||
S- 69
Report of Independent Registered Public Accounting Firm
The Partners
K2 Wind Ontario Limited Partnership
We have audited the accompanying balance sheet of K2 Wind Ontario Limited Partnership as of December 31, 2016, and the related statements of operations and comprehensive income (loss), changes in partners’ capital (deficit) and cash flows for the year ended December 31, 2016. These financial statements are the responsibility of the Partnership’s management. Our responsibility is to express an opinion on these financial statements based on our audits.
We conducted our audit in accordance with the standards of the Public Company Accounting Oversight Board (United States). Those standards require that we plan and perform the audit to obtain reasonable assurance about whether the financial statements are free of material misstatement. We were not engaged to perform an audit of the Partnership’s internal control over financial reporting. Our audits included consideration of internal control over financial reporting as a basis for designing audit procedures that are appropriate in the circumstances, but not for the purpose of expressing an opinion on the effectiveness of the Partnership’s internal control over financial reporting. Accordingly, we express no such opinion. An audit also includes examining, on a test basis, evidence supporting the amounts and disclosures in the financial statements, assessing the accounting principles used and significant estimates made by management, and evaluating the overall financial statement presentation. We believe that our audit provides a reasonable basis for our opinion.
In our opinion, the financial statements referred to above present fairly, in all material respects, the financial position of K2 Wind Ontario Limited Partnership at December 31, 2016, and the results of its operations and its cash flows for the year ended December 31, 2016, in conformity with U.S. generally accepted accounting principles.
We have not audited, reviewed or compiled the summarized comparative information presented herein as of December 31, 2015 and for the period from June 17, 2015 to December 31, 2015, and, accordingly, we express no opinion on it.
/s/ Ernst & Young LLP
San Francisco, CA
March 1, 2017
S- 70
K2 Wind Ontario Limited Partnership | |||||||
Balance Sheets | |||||||
(In thousands of Canadian Dollars) | |||||||
December 31, | |||||||
2016 (Audited) | 2015 (Unaudited) | ||||||
Assets | |||||||
Current assets: | |||||||
Cash and cash equivalents | $ | 17,975 | $ | 38,711 | |||
Trade receivables | 25,091 | 19,375 | |||||
Prepaid expenses | 1,751 | 1,542 | |||||
Restricted cash | — | 4,163 | |||||
Other current assets | 49 | 265 | |||||
Deferred financing costs | 61 | 61 | |||||
Related party receivable | — | 68 | |||||
Total current assets | 44,927 | 64,185 | |||||
Restricted cash | 8,081 | 16,307 | |||||
Property, plant and equipment, net of accumulated depreciation of $55,895 and $20,859 as of December 31, 2016 and 2015, respectively | 820,929 | 857,016 | |||||
Deferred financing costs | 939 | 1,001 | |||||
Total assets | $ | 874,876 | $ | 938,509 | |||
Liabilities and partners' (deficit) capital | |||||||
Current liabilities: | |||||||
Accounts payable and other accrued liabilities | $ | 5,569 | $ | 6,965 | |||
Accrued interest | 3,277 | 3,894 | |||||
Accrued construction costs | 668 | 3,071 | |||||
Related party payable | 155 | 4,646 | |||||
Derivative liabilities, current | 13,339 | 14,938 | |||||
Other current liabilities | 289 | 265 | |||||
Current portion of long-term debt, net of financing costs of $1,340 and $1,518 as of December 31, 2016 and 2015, respectively | 29,872 | 31,063 | |||||
Total current liabilities | 53,169 | 64,842 | |||||
Long-term debt, net of financing costs of $11,503 and $12,736 as of December 31, 2016 and 2015, respectively | 742,704 | 772,683 | |||||
Asset retirement obligation | 5,004 | 4,745 | |||||
Derivative liabilities | 79,286 | 78,069 | |||||
Total liabilities | 880,163 | 920,339 | |||||
Commitments and contingencies (Note 8) | |||||||
Partners' capital (deficit): | |||||||
Contributed surplus | 10,933 | 82,778 | |||||
Accumulated income (loss) | 76,406 | 28,399 | |||||
Accumulated other comprehensive income (loss) | (92,626 | ) | (93,007 | ) | |||
Total partners' capital (deficit) | (5,287 | ) | 18,170 | ||||
Total liabilities and partners' capital (deficit) | $ | 874,876 | $ | 938,509 | |||
See accompanying notes. | |||||||
S- 71
K2 Wind Ontario Limited Partnership | |||||||
Statements of Operations and Comprehensive Income (Loss) | |||||||
(In thousands of Canadian Dollars) | |||||||
Year ended December 31, 2016 (Audited) | Period from June 17, 2015 to December 31, 2015 (Unaudited) | ||||||
Revenue: | |||||||
Electricity sales | $ | 99,525 | $ | 69,125 | |||
Compensation for forgone energy | 40,389 | 228 | |||||
Total revenue | 139,914 | 69,353 | |||||
Cost of revenue: | |||||||
Operations and maintenance | 11,042 | 5,405 | |||||
General and administrative | 6,066 | 4,179 | |||||
Depreciation and accretion | 35,295 | 19,140 | |||||
Total cost of revenue | 52,403 | 28,724 | |||||
Operating income (loss) | 87,511 | 40,629 | |||||
Other income (expense): | |||||||
Interest expense | (39,503 | ) | (13,469 | ) | |||
Other income (expense), net | (1 | ) | 84 | ||||
Total other income (expense) | (39,504 | ) | (13,385 | ) | |||
Net income (loss) | 48,007 | 27,244 | |||||
Other comprehensive income (loss): | |||||||
Effective portion of change in fair market value of derivatives | (15,597 | ) | (24,305 | ) | |||
Reclassifications to net income (loss) | 15,978 | 1,466 | |||||
Total other comprehensive income (loss) | 381 | (22,839 | ) | ||||
Total comprehensive income (loss) | $ | 48,388 | $ | 4,405 | |||
See accompanying notes. | |||||||
S- 72
K2 Wind Ontario Limited Partnership | |||||||||||||||
Statements of Changes in Partners' Capital (Deficit) | |||||||||||||||
(In thousands of Canadian Dollars) | |||||||||||||||
Contributed Surplus | Accumulated Income (Loss) | Accumulated Other Comprehensive Income (Loss) | Total | ||||||||||||
Balances at June 17, 2015 (Unaudited) | $ | 130,783 | $ | 1,155 | $ | (70,168 | ) | $ | 61,770 | ||||||
Distributions | (48,005 | ) | — | — | (48,005 | ) | |||||||||
Net income (loss) | — | 27,244 | — | 27,244 | |||||||||||
Other comprehensive income (loss) | — | — | (22,839 | ) | (22,839 | ) | |||||||||
Balance at December 31, 2015 (Audited) | 82,778 | 28,399 | (93,007 | ) | 18,170 | ||||||||||
Distributions | (71,845 | ) | — | — | (71,845 | ) | |||||||||
Net income (loss) | — | 48,007 | — | 48,007 | |||||||||||
Other comprehensive income (loss) | — | — | 381 | 381 | |||||||||||
Balance at December 31, 2016 (Audited) | $ | 10,933 | $ | 76,406 | $ | (92,626 | ) | $ | (5,287 | ) | |||||
See accompanying notes. | |||||||||||||||
S- 73
K2 Wind Ontario Limited Partnership | |||||||
Statements of Cash Flows | |||||||
(In thousands of Canadian Dollars) | |||||||
Year ended December 31, 2016 (Audited) | Period from June 17, 2015 to December 31, 2015 (Unaudited) | ||||||
Operating activities | |||||||
Net income (loss) | $ | 48,007 | $ | 27,244 | |||
Adjustments to reconcile net income (loss) to net cash provided by operating activities: | |||||||
Depreciation and accretion | 35,295 | 19,140 | |||||
Amortization of financing costs | 1,460 | 737 | |||||
Changes in operating assets and liabilities: | |||||||
Trade receivables | (5,717 | ) | (12,897 | ) | |||
Prepaid expenses | (208 | ) | (167 | ) | |||
Other current assets | 215 | 19,891 | |||||
Accounts payable and other accrued liabilities | 2,337 | 5,434 | |||||
Related party payable | — | (412 | ) | ||||
Accrued interest | (617 | ) | 3,894 | ||||
Contingent liabilities | 24 | (3,324 | ) | ||||
Net cash provided by (used in) operating activities | 80,796 | 59,540 | |||||
Investing activities | |||||||
Capital expenditures | (9,433 | ) | (81,043 | ) | |||
Net cash provided by (used in) investing activities | (9,433 | ) | (81,043 | ) | |||
Financing activities | |||||||
Payment for deferred financing costs | (62 | ) | (25 | ) | |||
Proceeds from long-term debt | — | 94,842 | |||||
Capital distributions | (71,845 | ) | (48,005 | ) | |||
Repayment of long-term debt | (32,581 | ) | — | ||||
Net cash provided by (used in) financing activities | (104,488 | ) | 46,812 | ||||
Net change in cash and cash equivalents and restricted cash | (33,125 | ) | 25,309 | ||||
Cash and cash equivalents and restricted cash at beginning | 59,181 | 33,872 | |||||
Cash and cash equivalents and restricted cash at end of year | $ | 26,056 | $ | 59,181 | |||
Supplemental disclosures | |||||||
Cash payments for interest expense, net of capitalized interest | $ | 38,780 | $ | 1,125 | |||
Schedule of non-cash activities | |||||||
Change in property, plant and equipment associated with accrued liabilities and capitalized interest | 792 | $ | 39,986 | ||||
See accompanying notes. | |||||||
S- 74
K2 Wind Ontario Limited Partnership
Notes to Financial Statements
1. General information
Business
K2 Wind Ontario Limited Partnership (K2 Wind or the Partnership), a limited partnership under the laws of the Province of Ontario, was formed on July 27, 2011, as a joint venture project between Capital Power L.P., Samsung Renewable Energy Inc. (Samsung) and Pattern Renewable Holdings Canada ULC (PRHC), each holding a 33.33% ownership interest as limited partners of the Partnership, and K2 Wind Ontario Inc. (the GP), holding a 0.01% ownership interest as general partner of the Partnership.
The GP is a corporation jointly owned among affiliates of Samsung, Pattern, and Capital Power. The Samsung affiliate originally owned a 50% GP interest and the Pattern and Capital Power affiliates each originally owned a 25% GP interest.
On June 17, 2015, Pattern K2 LP Holdings LP transferred all of its interests in K2 Wind to PRHC and PRHC subsequently transferred all of its interests in K2 Wind to Pattern Canada Finance Company ULC, a wholly owned subsidiary of Pattern Energy Group Inc. (Pattern).
On March 15, 2016 Samsung transferred a portion of its GP interest so that each of the Samsung, Pattern and Capital Power affiliates then held equal 33.33% interests in the GP.
On July 7, 2016, CP K2 Holdings Inc.’s LP interest in K2 Wind, was transferred through an internal reorganization to Capital Power LP Holdings Inc., an entity wholly owned by Capital Power.
On August 5, 2016, Samsung sold its LP interest in K2 Wind to K2 Wind Co LP and its GP interest to K2 Wind Co GP Inc. K2 Wind Co LP and K2 Wind Co GP Inc. are owned by a consortium of Axium Infrastructure Canada II LP, ATRF INF (DB) LTD. and The Manufacturers Life Insurance Company.
The partners’ liability and losses for K2 Wind are limited to each limited partner’s capital contribution plus any unpaid capital contributions agreed to by the partners. The partners shall not be required to make additional capital contributions, or have any personal liability, in respect of the liabilities or the obligations of K2 Wind.
The Project
K2 Wind owns a 270 megawatt (MW) wind project consisting of 140 wind turbine generators located in the township of Ashfield Colborne Wawanosh in Ontario, Canada (the Project). The Project reached its commercial operation date (COD) on May 29, 2015.
The Partnership has a power purchase agreement (PPA) with the Independent Electricity System Operator (IESO) for a period of 20 years from the COD. The IESO oversees the wholesale electricity market, where the price of energy is determined. It also administers the rules that govern the market and, through an arm's-length market monitoring function, ensures that it is operated fairly and efficiently. The IESO is an agent among the market participants in Ontario and is neither exposed to, nor benefits from, any transactions. In such capacity, the IESO executes agreements to help the market meet the renewable energy mandates of the government of the Province of Ontario. There are approximately 70 electric distribution companies in Ontario, all of which have government mandates to purchase renewable energy. The PPA provides for guaranteed pricing from IESO that removes volatility caused by fluctuations in market rates. The Ontario government established the Global Adjustment (GA) which is designed to adjust consumer rates depending on the price of energy. The IESO establishes a monthly variable GA rate based on GA costs and Ontario electricity demand which effectively establishes a pass through mechanism to the consumer and eliminates the IESO's economic exposure to our contract price.
2. Summary of Significant Accounting Policies
Basis of Presentation
The accompanying financial statements are presented using U.S. generally accepted accounting principles (U.S. GAAP). The preparation of U.S. GAAP basis financial statements requires management to make certain estimates and assumptions that affect the reported amounts and disclosures in the financial statements and the reported amounts of assets and liabilities, and to disclose contingent assets and liabilities at the date of the financial statements and the reported amounts of revenues and expenses during the reporting periods. Because the use of estimates is inherent in the financial reporting process, actual results could differ from those estimates.
These financial statements do not include assets, liabilities, revenue and expenses of the GP and limited partners.
S- 75
K2 Wind Ontario Limited Partnership
Notes to Financial Statements
Use of Estimates
The preparation of financial statements in conformity with U.S. GAAP requires management to make estimates and assumptions that affect the reported amounts of assets and liabilities, disclosures of contingent assets and liabilities at the date of the financial statements, and the reported amounts of revenues and expenses during the reporting period. Actual results could differ from those estimates, and such differences may be material to the financial statements.
Functional and Presentation Currency
Items included in the financial statements of the Partnership are measured using the currency of the primary economic environment in which the Partnership operates, the (functional currency). The financial statements are presented in Canadian dollars, which is the Partnership’s functional and presentation currency.
Fair Value of Financial Instruments
Accounting Standards Codification (ASC) 820, Fair Value Measurement (ASC 820), defines fair value as the price at which an asset could be exchanged or a liability transferred in an orderly transaction between knowledgeable, willing parties in the principal or most advantageous market for the asset or liability. Where available, the fair value is based on observable market prices or derived from such prices. Where observable prices or inputs are not available, valuation models are applied.
These valuation techniques involve some level of management estimation and judgment, the degree of which is dependent on the price transparency for the instruments or market and the instrument’s complexity.
Cash and Cash Equivalents
Cash and cash equivalents consist of cash in banks and highly liquid investments with original maturities of three months or less.
Restricted Cash
Restricted cash consists of cash balances required to collateralize commercial bank letter of credit facilities related primarily to the PPA and for reserves required under the Partnership’s credit agreements. Non-current restricted cash includes $5.0 million and $12.5 million as of December 31, 2016 and December 31, 2015, respectively, of construction completion costs that were moved into a restricted cash account upon conversion of the construction loan to term loan.
Reconciliation of Cash and Cash Equivalents and Restricted Cash as presented on the Statements of Cash Flows
Year ended | Period ended | |||||||
December 31, 2016 | December 31, 2015 | |||||||
Beginning | ||||||||
Cash and cash equivalents at beginning of period | $ | 38,711 | $ | 772 | ||||
Restricted cash - current | 4,163 | 8,355 | ||||||
Restricted cash | 16,307 | 24,745 | ||||||
Cash, cash equivalents and restricted cash | 59,181 | 33,872 | ||||||
Ending | ||||||||
Cash and cash equivalents at end of period | 17,975 | 38,711 | ||||||
Restricted cash - current | — | 4,163 | ||||||
Restricted cash | 8,081 | 16,307 | ||||||
Cash, cash equivalents and restricted cash | 26,056 | 59,181 | ||||||
Net change in cash, cash equivalents and restricted cash | $ | (33,125 | ) | $ | 25,309 | |||
S- 76
K2 Wind Ontario Limited Partnership
Notes to Financial Statements
Trade Receivable
The Partnership’s trade receivables are generated by selling energy in Ontario, Canada through the IESO as a settlement agent. The Partnership believes that all amounts are collectible and an allowance for doubtful accounts is not required as of December 31, 2016 and 2015.
Property, Plant and Equipment
The Facility is recorded at historical cost on the balance sheets. The Facility is being depreciated using the straight-line method over its 25-year life beginning at the COD. Capitalized assets acquired in support of the plant operations are recorded at cost and depreciated using the straight-line method over the estimated useful life of the asset.
The remaining assets are depreciated over two to five years. Improvements to property, plant and equipment deemed to extend the useful economic life of an asset are capitalized. Repair and maintenance costs are expensed as incurred.
Interest Capitalization
The Partnership capitalizes interest and related financing fees related to the long-term debt used to finance projects in construction. Capitalization was discontinued when the project achieved commercial operation.
Impairment of Long-Lived Assets
The Partnership periodically evaluates long-lived assets for potential impairment whenever events or changes in circumstances have occurred that indicate that impairment may exist, or the carrying amount of the long-lived asset may not be recoverable. An impairment loss is recognized only if the carrying amount of a long-lived asset is not recoverable based on its estimated future undiscounted cash flows. An impairment loss is calculated based on the excess of the carrying value of the long-lived asset over the fair value of such long-lived asset, with the fair value determined based on an estimate of discounted future cash flows. During the period ended December 31, 2016 and 2015 (unaudited), no impairment losses were recorded in the statements of operations and comprehensive income (loss).
Deferred Financing Costs
Financing costs incurred in connection with obtaining construction and term financing are deferred and amortized over the lives of the respective loans using the effective-interest method. Deferred financing costs are capitalized and recorded as an offset to the respective loans in the Partnership's balance sheets and are amortized to interest expense in the statements of operations and comprehensive income (loss).
Deferred financing incurred in connection with obtaining letters of credit are recorded as a separate asset in the Partnership's balance sheets and are amortized using the straight-line method over the life of the term loan to interest expense in the statements of operations and comprehensive income (loss).
Derivatives and Risk Management
The Partnership may enter into interest rate swaps, interest rate caps, forwards and other agreements to manage its interest rate risk. The Partnership recognizes its derivative instruments as assets or liabilities at fair value in the balance sheets. The Partnership does not have contracts subject to master netting agreements with counterparties, as such assets and liabilities are presented gross on the balance sheets.
Accounting for changes in the fair value of a derivative instrument depends on whether it has been designated as part of a hedging relationship and on the type of hedging relationship. For derivative instruments that qualify and are designated as cash flow hedges, the effective portion of change in fair value of the derivative is reported as a component of other comprehensive income (loss) (OCI) until the contract settles and the hedged item is recognized in earnings. The ineffective portion of change in fair value is recorded as a component of net income (loss) on the statements of operations and comprehensive income (loss). The Partnership discontinues hedge accounting when it has determined that a derivative contract no longer qualifies as an effective hedge or when it is no longer probable that the hedged forecasted transaction will occur.
S- 77
K2 Wind Ontario Limited Partnership
Notes to Financial Statements
Concentration of Credit Risk
Financial instruments that potentially subject the Partnership to concentrations of credit risk consist primarily of cash and cash equivalents, restricted cash, debt, derivatives and revenue. The Partnership places its cash and restricted cash with high-quality institutions. The Partnership’s derivative instruments are placed with counterparties that are credit worthy institutions.
Contingent Liabilities
Contingent liabilities are recognized when the Partnership has a present legal obligation as a result of past events for which it is probable that an outflow of resources will be required to settle the obligation, and the amount can be reasonably estimated. Contingent liabilities are not recognized for future operating losses.
Other Liabilities
Other liabilities are recognized when the Partnership has a present legal obligation as a result of past events for which it is probable that an outflow of resources will be required to settle the obligation, and the amount can be reasonably estimated.
Asset Retirement Obligations
The Partnership records an asset retirement obligation (ARO) for the estimated costs of decommissioning turbines, removing above-ground installations and restoring sites, at the time when a contractual decommissioning obligation is incurred. The ARO represents the present value of the expected costs and timing of the related decommissioning activities. The ARO asset and liability is recorded in property, plant and equipment and other long-term liabilities, respectively, on the accompanying balance sheets. The Partnership records accretion expense, which represents the increase in the ARO, over the remaining or operational life of the Facility. Accretion expense is recorded as operating costs in the statements of operations and comprehensive income (loss) using accretion rates based on credit adjusted risk-free interest rates. Changes resulting from revisions to the timing or amount of the original estimate of cash flows are recognized as an increase or a decrease in the asset retirement cost, or income when the asset retirement cost is depleted.
Income Taxes
The financial statements of the Partnership reflect no provision or liability for income taxes because profits and losses of the Partnership are allocated to the partners and are included in the income tax returns of the partners.
Income and losses for tax purposes may differ from the financial statement amounts and the partners’ capital (deficit) reflected in the financial statements does not necessarily reflect their tax basis.
Revenue Recognition
The Partnership sells the electricity it generates through the IESO. Revenue is recognized based upon the amount of electricity delivered or curtailed at rates specified under the contracts, assuming all other revenue recognition criteria are met. Revenue earned from curtailment is recorded as compensation for forgone energy in the statements of operations and comprehensive income (loss). The Partnership evaluates its PPA to determine whether it is in substance a lease or derivative and, if applicable, recognizes revenue pursuant to ASC 840 Leases and ASC 815 Derivatives and Hedging, respectively. As of December 31, 2016, the PPA was not considered a lease or a derivative instrument, as multiple market participants purchase the energy at market-based prices with IESO working as a settlement agent. As a result, revenue (including any revenue from the price guaranteed by IESO), is recognized on an accrual basis.
Cost of Revenue
The Partnership’s cost of revenue is comprised of direct costs of operating and maintaining its project facilities, including labor, turbine service arrangements, metering service and shadow settlement, environmental fee, land lease royalties, property tax, insurance, depreciation and accretion.
Recently Adopted Accounting Pronouncements
In November 2016, the Financial Accounting Standards Board (FASB) issued Accounting Standards Update (ASU) 2016-18, Statement of Cash Flows (Topic 230): Restricted Cash (ASU 2016-18), which requires that a statement of cash flows explain the change during the period in the total of cash, cash equivalents, and amounts generally described as restricted cash or restricted cash equivalents. As a result, amounts generally described as restricted cash and restricted cash equivalents should be included with cash and cash equivalents when
S- 78
K2 Wind Ontario Limited Partnership
Notes to Financial Statements
reconciling the beginning-of-period and end-of-period total amounts shown on the statement of cash flows. The amendments do not provide a definition of restricted cash or restricted cash equivalents. The Partnership elected to early adopt the provisions of ASU 2016-18 as of December 31, 2016 and has revised its consolidated statements of cash flows for the years ended December 31, 2015 and 2014 to reflect amounts described as restricted cash and restricted cash equivalents included with cash and cash equivalents in the reconciliation of beginning of period and end of period total amounts shown on the consolidated statements of cash flows. Consequently, transfers between cash and restricted cash will not be presented as a separate line item in the operating, investing or financing sections of the cash flow statement. A reconciliation of cash and cash equivalents and restricted cash as presented on the consolidated balance sheets to the consolidated statements of cash flows is included in the significant accounting policies above.
In August 2016, the FASB issued ASU 2016-15, Statement of Cash Flows (Topic 230): Classification of Certain Cash Receipts and Cash Payments (ASU 2016-15), which provides guidance on specific cash flow issues. ASU 2016-15 is effective for fiscal years beginning after December 15, 2017, and interim periods within those fiscal years. Early adoption is permitted, including adoption in an interim period. The adoption of ASU 2016-15 during the third quarter of fiscal 2016 did not have a material impact on the Partnership’s consolidated financial statements and related disclosures.
In March 2016, the FASB issued ASU 2016-05, Derivatives and Hedging (Topic 815): Effect of Derivative Contract Novations on Existing Hedge Accounting Relationships (ASU 2016-05), which clarifies that a change in the counterparty to a derivative instrument that has been designated as the hedging instrument does not, in and of itself, require dedesignation of that hedging relationship provided that all other hedge accounting criteria remain intact. ASU 2016-05 is effective for annual periods beginning after December 15, 2017, including interim reporting periods therein, with early adoption permitted. The adoption of ASU 2016-05 on January 1, 2016 had no impact on the Partnership's consolidated financial statements and related disclosures.
In August 2014, the FASB issued ASU 2014-15, Presentation of Financial Statements Going Concern: Disclosure of Uncertainties about an Entity’s Ability to Continue as a Going Concern which requires an entity’s management to evaluate whether there is substantial doubt about the entity’s ability to continue as a going concern and to provide related footnote disclosures. ASU 2014-15 is effective for interim and annual periods ending after December 15, 2016, with early adoption permitted for interim and annual reporting periods for which the financial statements have not been previously issued. The adoption of ASU 2014-15 on December 31, 2016 had no impact on the Partnership’s consolidated financial statements and related disclosures.
Recently Issued Not Yet Adopted Accounting Pronouncements
In February 2017, the FASB issued ASU 2017-05 (ASU 2017-05), Other Income-Gains and Losses from the Derecognition of Nonfinancial Assets(Subtopic 610-20): Clarifying the Scope of Asset Derecognition Guidance and Accounting for Partial Sales of Nonfinancial Assets. ASU 2017-05 is meant to clarify the scope of ASC Subtopic 610-20, Other Income-Gains and Losses from the Derecognition of Nonfinancial Assets and to add guidance for partial sales of nonfinancial assets. ASU 2017-05 is to be applied using a full retrospective method or a modified retrospective method as outlined in the guidance and is effective at the same time as ASU 2014-09. Further, the Partnership is required to adopt this guidance at the same time that it adopts the guidance in ASU 2014-09 which creates ASC Topic 606, Revenue from Contracts with Customers and supersedes ASC Topic 605, Revenue Recognition (ASU 2014-09). The Partnership is currently assessing the future impact of this update on its consolidated financial statements and related disclosures.
In June 2016, the FASB issued ASU 2016-13, Financial Instruments -Credit Losses (Topic 326): Measurement of Credit Losses on Financial Instruments (ASU 2016-13), which requires the measurement of all expected credit losses for financial assets including trade receivables held at the reporting date based on historical experience, current conditions, and reasonable and supportable forecasts. ASU 2016-13 is effective for fiscal years, and interim periods within those fiscal years, beginning after December 15, 2019. The adoption of ASU 2016-13 is not expected to have a material impact on its consolidated financial statements and related disclosures.
In February 2016, the FASB issued ASU 2016-02, Leases, which requires lessees to recognize right-of-use assets and lease liabilities, for all leases, with the exception of short-term leases, at the commencement date of each lease. Under the new guidance, lessor accounting is largely unchanged. ASU 2016-02 simplifies the accounting for sale and leaseback transactions primarily because lessees must recognize lease assets and liabilities. ASU 2016-02 is effective for annual periods beginning after December 15, 2018, and interim periods within those annual periods. Early adoption is permitted. The amendments of this update should be applied using a modified retrospective approach, which requires lessees and lessors to recognize and measure leases at the beginning of the earliest period presented. The Partnership is currently in the initial stages of evaluating the impact of the new standard on its accounting policies, processes and system requirements. The Partnership has assigned internal resources in addition to the engagement of a third party service provider to assist in evaluation. The Partnership is also assessing the future accounting impact of this update on its consolidated financial statements and related disclosures as it applies to its PPAs, land leases, office leases and equipment leases. As the Partnership progresses further in its analysis, the scope of this assessment could be expanded to review other types of contracts.
S- 79
K2 Wind Ontario Limited Partnership
Notes to Financial Statements
In May 2014, the FASB issued ASU 2014-09. The new standard replaces industry-specific guidance and establishes a single five-step model to identify and recognize revenue. The core principle of the new standard is that an entity should recognize revenue upon transfer of control of promised goods or services to customers in an amount that reflects the consideration to which an entity expects to be entitled in exchange for those goods or services. Additionally, the new standard requires the entity to disclose further quantitative and qualitative information regarding the nature and amount of revenues arising from contracts with customers, as well as other information about the significant judgments and estimates used in recognizing revenues from contracts with customers. In March 2016, the FASB issued ASU 2016-08, Revenue from Contracts with Customers (Topic 606) Principal versus Agent Considerations (Reporting Revenue Gross versus Net), which clarifies how to apply the implementation guidance on principal versus agent considerations related to the sale of goods or services to a customer as updated by ASU 2014-09. In April 2016, the FASB issued ASU 2016-10, Revenue from Contracts with Customers (Topic 606) Identifying Performance Obligations and Licensing, which clarifies two aspects of Topic 606: identifying performance obligations and the licensing implementation guidance, while retaining the related principles for those areas, as updated by ASU 2014-09. In May 2016, the FASB issued ASU 2016-12, Revenue from Contracts with Customers (Topic 606): Narrow-Scope Improvements and Practical Expedients (ASU 2016-12), which makes narrow scope amendments to Topic 606 including implementation issues on collectability, non-cash consideration and completed contracts at transition. In December 2016, the FASB issued ASU 2016-20, Technical Corrections and Improvements to Topic 606, "Revenue from Contracts with Customers" (ASU 2016-20), which make additional narrow scope amendments to Topic 606 including loan guarantee fees, impairment testing of contract costs, provisions for losses on construction-type and production-type contracts.
The new standard permits adoption by either using (i) the full retrospective approach for all periods presented in the period of adoption or (ii) a modified retrospective approach with the cumulative effect of initially applying the new standard recognized at the date of initial application and providing certain additional disclosures. The new standard is effective for annual reporting periods beginning after December 15, 2017, with early adoption permitted for annual reporting periods beginning after December 15, 2016. The Partnership does not plan to early adopt, and accordingly, will adopt the new standard effective January 1, 2018. The Partnership is currently assessing the future impact of this update on its consolidated financial statements and related disclosures.
In June 2015, the FASB issued ASU 2015-10, Technical Corrections and Improvements which covers a wide range of topics in the Codification. The amendments in this update represent changes to clarify the Accounting Standards Codification (the Codification), correct unintended application of guidance, or make minor improvements to the Codification that are not expected to have a significant effect on current accounting practice or create a significant administrative cost on most entities. The amendments in ASU 2015-10 were effective immediately upon issuance and the adoption did not have material impact on the Partnership's financial statements and related disclosures.
3. Property, Plant and Equipment
The aggregate cost of property, plant and equipment and accumulated depreciation were as follows (in thousands):
December 31, | |||||||
2016 | 2015 | ||||||
Land | $ | 1,067 | $ | 1,067 | |||
Operating wind farm | 875,705 | 876,756 | |||||
Furniture, fixtures, and equipment | 52 | 52 | |||||
Subtotal | 876,824 | 877,875 | |||||
Accumulated depreciation | (55,895 | ) | (20,859 | ) | |||
Property, plant and equipment, net | $ | 820,929 | $ | 857,016 | |||
The Partnership recorded depreciation expense related to property, plant and equipment of $35.0 million and $19.0 million (unaudited) for the year ended December 31, 2016 and for the period ended December 31, 2015, respectively.
4. Long-Term Debt
The Partnership has a term loan in the amount of $818.0 million with an amortization period of 18 years, at a variable rate interest at Canadian Dollar Offered Rate (CDOR) plus 1.75% per annum. The loan has a maturity date on November 20, 2022 due to prepayment requirements in the partnership’s credit agreement. In connection with the term loan, the Partnership entered into interest rate swaps on 90% of the loan commitment. The interest rate swaps are organized in two tranches with fixed effective interest rates of 3.11% and 4.45% for years 1-7 and years 8-18, respectively. As of December 31, 2016, $785.4 million was outstanding under the term loan including the current portion, and no amount was drawn on the letter of credit facilities.
S- 80
K2 Wind Ontario Limited Partnership
Notes to Financial Statements
Collateral under the financing agreement consists of substantially all of the Partnership’s assets. Its loan agreement contains a broad range of covenants that, subject to certain exceptions, restrict the Partnership’s ability to incur debt, grant liens, sell or lease assets, transfer equity interest, dissolve, pay distributions and change its business. All the limited partners, general partners and shareholders of general partners pledged shares of partnership units or common stock owned as collateral for the loan. As of December 31, 2016, the Partnership was in compliance with all loan covenants.
Terms and conditions of outstanding borrowings were as follows (in thousands):
As of December 31, 2016 | ||||||||||||||
December 31, | Contractual Interest Rate | Effective Interest Rate | Maturity Date | |||||||||||
2016 | 2015 | |||||||||||||
Principal | $ | 785,419 | $ | 818,000 | 2.65% | 3.94% | November 2022 | |||||||
Unamortized financing costs | (12,843 | ) | (14,254 | ) | ||||||||||
Current portion | (29,872 | ) | (31,063 | ) | ||||||||||
Long-term debt, less current portion | $ | 742,704 | $ | 772,683 | ||||||||||
The following are the amounts due under the Partnership’s term loan for the next five years and thereafter as of December 31, 2016 (in thousands):
2017 | $ | 31,212 | |||
2018 | 33,714 | ||||
2019 | 37,328 | ||||
2020 | 39,338 | ||||
2021 | 41,466 | ||||
Thereafter | 602,361 | ||||
Total long-term debt, including current maturities | $ | 785,419 | |||
Interest and commitment fees incurred and interest expense for long-term debt consisted of the following (in thousands):
Year ended December 31, 2016 (Audited) | Period from June 17, 2015 to December 31, 2015 (Unaudited) | ||||||
Interest and commitment fees incurred | $ | 36,984 | $ | 12,405 | |||
Letter of credit fees incurred | 1,059 | 327 | |||||
Amortization of financing costs | 1,460 | 737 | |||||
Interest expense | $ | 39,503 | $ | 13,469 | |||
The Partnership has two letter of credit facilities available in the amount of $60.5 million as set out in the partnership’s credit agreement. As of December 31, 2016 and 2015, no amounts had been drawn on these letters of credit.
5. Asset Retirement Obligation
The Partnership’s ARO represents the estimated cost of decommissioning the turbines, removing above-ground installations and restoring the sites at a date that is 25 years from the COD. As of December 31, 2016 and 2015, the Partnership recorded $5.0 million and $4.8 million, respectively, in ARO using a project specific credit adjusted risk free rate at COD of 5.46%.
S- 81
K2 Wind Ontario Limited Partnership
Notes to Financial Statements
The following table presents a reconciliation of the beginning and ending aggregate carrying amounts of the ARO for the following periods (in thousands):
December 31, | |||||||
2016 (Audited) | 2015 (Unaudited) | ||||||
Beginning asset retirement obligation (from June 17, 2015) | $ | 4,745 | $ | 4,610 | |||
Accretion expense | 259 | 135 | |||||
Ending asset retirement obligation | $ | 5,004 | $ | 4,745 | |||
6. Derivatives and Risk Management
The Partnership uses interest rate derivatives to manage its exposure to fluctuation in interest rates. Interest rate risk exists primarily on variable-rate debt for which the cash flows vary based upon movement in interest rates. The Partnerships’ objectives for holding these derivative instruments include reducing, eliminating and efficiently managing the economic impact of interest rate exposure as effectively as possible. The Partnership does not hedge of all of its interest rate risk, thereby exposing the unhedged portion to changes in market prices.
The following tables present the fair values of the Partnership's designated derivative instruments on a gross basis as reflected on the Partnership’s balance sheets (in thousands):
December 31, | ||||||||||||||||
2016 | 2015 | |||||||||||||||
Derivative Liabilities | Current | Long-Term | Current | Long-Term | ||||||||||||
Interest rate swaps | $ | 13,339 | $ | 79,286 | $ | 14,938 | $ | 78,069 | ||||||||
Total Fair Value | $ | 13,339 | $ | 79,286 | $ | 14,938 | $ | 78,069 | ||||||||
The following table summarizes the notional amounts of the Partnership's outstanding designated derivative instruments (in thousands):
December 31, | ||||||||||
Unit of Measure | 2016 | 2015 | ||||||||
Interest rate swaps | CAD | $ | 706,877 | $ | 735,744 | |||||
The Partnership’s interest rate swaps have remaining maturities ranging from approximately 5.7 years to 16.4 years.
The following table presents gains and losses on derivative contracts designated and qualifying as cash flow hedges recognized in accumulated other comprehensive income (loss), as well as, amounts reclassified to earning for the following periods (in thousands):
December 31, | ||||||||||
Description | 2016 (Audited) | 2015 (Unaudited) | ||||||||
Gains (losses) recognized in accumulated OCI | Effective portion | $ | (15,597 | ) | $ | (24,305 | ) | |||
Gains (losses) reclassified from accumulated OCI into: | ||||||||||
Interest expense | Derivative settlements | $ | 15,978 | $ | 1,466 | |||||
The Partnership estimates that $13.3 million in accumulated other comprehensive income (loss) will be reclassified into earnings over the next twelve months.
No ineffectiveness was recorded on these swaps for the year ended December 31, 2016 and for the period ended December 31, 2015. The changes in the fair value of these swaps are recognized into other comprehensive income (loss).
No margin cash collateral was received or recorded from the counterparty during the year ended December 31, 2016 and for the period ended December 31, 2015.
S- 82
K2 Wind Ontario Limited Partnership
Notes to Financial Statements
7. Fair Value Measurements
The Partnership’s fair value measurements incorporate various factors, including the credit standing and performance risk of the counterparties, the applicable exit market, and specific risks inherent in the instrument. Non-performance and credit risk adjustments on risk management instruments are based on current market inputs when available, such as credit default hedge spreads. When such information is not available, internal models may be used.
Assets and liabilities recorded at fair value in the combined financial statements are categorized based upon the level of judgment associated with the inputs used to measure their fair value. Hierarchical levels directly related to the amount of subjectivity associated with the inputs to valuation of these assets or liabilities are as follows:
Level 1 — Inputs are unadjusted, quoted prices in active markets for identical assets or liabilities at the measurement date.
Level 2 — Inputs (other than quoted prices included in Level 1) are either directly or indirectly observable for the asset or liability through correlation with market data at the measurement date and for the duration of the instrument’s anticipated life.
Level 3 — Unobservable inputs that are supported by little or no market activity and that are significant to the fair value of the assets or liabilities and which reflect management’s best estimate of what market participants would use in pricing the asset or liability at the measurement date. Consideration is given to the risk inherent in the valuations technique and the risk inherent in the inputs to the model.
The carrying value of financial instruments classified as current assets and current liabilities approximates their fair value, based on the nature and short maturity of these instruments, and they are presented in the Partnership’s financial statements at carrying cost. The fair values of cash and cash equivalents and restricted cash are classified as Level 1 in the fair value hierarchy. Certain other assets and liabilities were measured at fair value upon initial recognition and unless conditions give rise to an impairment, are not remeasured.
Long term debt is presented on the balance sheets at amortized cost. The fair value of variable interest rate long-term debt is approximated by its carrying cost, and is classified as Level 2 in the fair value hierarchy.
The Partnership’s financial assets and (liabilities) which require fair value measurement on a recurring basis are classified within the fair value hierarchy as follows (in thousands):
Fair Value Measurements Units | ||||||||||||
Level 1 | Level 2 | Level 3 | ||||||||||
December 31, 2016 | ||||||||||||
Interest rate swaps | $ | — | $ | 92,625 | $ | — | ||||||
Total Fair Value | $ | — | $ | 92,625 | $ | — | ||||||
December 31, 2015 | ||||||||||||
Interest rate swaps | $ | — | $ | 93,007 | $ | — | ||||||
Total Fair Value | $ | — | $ | 93,007 | $ | — | ||||||
Level 2 Inputs
Derivative instruments subject to re-measurement are presented in the financial statements at fair value. The Partnership's interest rate swaps were valued by discounting the net cash flows using the forward Canadian dollar offered rate curve with the valuations adjusted by the Partnership’s credit default hedge rate.
S- 83
K2 Wind Ontario Limited Partnership
Notes to Financial Statements
8. Commitments, Contingencies and Warranties
Commitments
The Partnership has entered into various purchase, construction, as well as other commitments, land leases, and turbine operations and maintenance agreements. Detailed below are estimates of future commitments under these arrangements as of December 31, 2016 (in thousands):
2017 | 2018 | 2019 | 2020 | 2021 | Thereafter | Total | ||||||||||||||||||||||
Purchase and other commitments | $ | 710 | $ | 712 | $ | 715 | $ | 718 | $ | 721 | $ | 9,419 | $ | 12,995 | ||||||||||||||
Land leases | 2,896 | 2,944 | 2,955 | 2,956 | 2,957 | 66,962 | 81,670 | |||||||||||||||||||||
Service and maintenance | 4,593 | — | — | — | — | — | 4,593 | |||||||||||||||||||||
Total Commitments | $ | 8,199 | $ | 3,656 | $ | 3,670 | $ | 3,674 | $ | 3,678 | $ | 76,381 | $ | 99,258 | ||||||||||||||
Purchase and other commitments
The Partnership has entered into various commitments with service providers related to the projects and operations of its business. Outstanding commitments include those related to construction, and commitments related to donations to local community and government organizations.
In March 2013, the Partnership entered into an agreement with the local township in which the Partnership will make annual payments into a fund managed by the township in amounts of $2,600 per nameplate MW of the Project installed capacity. The payments are calculated annually and are owed for the 20-year term of the PPA. In exchange for payments, the township undertakes certain obligations to support the Project, including entering into a road use agreement in which the Project may utilize municipal right-of-ways for collection and transmission lines.
The partnership has also made various public statements that payments will be made to local landowners, for which the partnership will not receive any future benefits. The Partnership considers these statements to be cancellable and not legally binding; therefore the Partnership has not recognized a liability for these amounts, nor are the payments included in the table above. Payments under the statements are approximately $0.5 million per year for the next 18 years.
Land leases
The Partnership has acquired leases for land where the wind farm will be located through the exercise of land options acquired from Capital Power and also executed new land lease agreements in 2014. The leases provide for the land interests necessary for the construction and operation of the project. The Partnership recorded $2.7 million and $1.7 million (unaudited) of lease expense in the statements of operations and comprehensive income (loss) for the year ended December 31, 2016 and for the period ended December 31, 2015, respectively.
Service and maintenance
The Partnership has entered into service and maintenance agreements with third party contractors to provide turbine operations and maintenance services and modifications and upgrades for a two year period beginning after the COD. The computation of outstanding commitments includes an estimated annual price adjustment for inflation of 2%, where applicable. For the year ended December 31, 2016 and for the period ended December 31, 2015, the Partnership recorded service and maintenance expense under these agreements of $7.1 million and $3.8 million (unaudited), respectively, in project expense in the statements of operations.
Warranties and Guarantees
Turbine Operating Warranties and Service Guarantees
The Partnership entered in to a warranty agreement with Siemens for a two-year period from the commissioning of each turbine. Pursuant to the warranty, if the turbines operate at less than a specified percentage of availability during each consecutive thirty month period, Siemens is obligated to pay liquidated damages to the Partnership. In addition, the Partnership will pay Siemens a bonus if the availability of the turbines exceeds a certain specified availability percentage during the thirty-month period. The Partnership recorded a liability of
S- 84
K2 Wind Ontario Limited Partnership
Notes to Financial Statements
$1.0 million and $0.3 million (unaudited) associated with bonuses to Siemens for the year ended December 31, 2016 and for the period ended December 31, 2015, respectively.
Siemens
On March 8, 2013, an Operational Incentive Agreement was entered into among Samsung, an affiliate of PRHC and Siemens. The agreement defines operational objectives, the terms and conditions upon which the Partnership may make operational incentive payments to Siemens for achieving one or more of such operational objectives under the turbine supply agreements for joint development projects. Siemens earned an initial payment of $1.1 million, which was paid in 2013 for having satisfied the Peak Capacity Objective defined under the agreement.
Pursuant to the terms of the agreement, a liability of $3.6 million was recognized by the Partnership as of December 31, 2015 and subsequently paid in July 2016.
Legal Proceedings
Renewable Energy Approval
During the third quarter of 2015, rights to appeal prior decisions granting the Renewable Energy Approval, or (REA), under Ontario's Environmental Protection Act for the Project were exhausted without further appeal. As a result, a stay of a previously filed civil suit against the Project pending final determination of the REA was lifted, allowing such suit to move forward if the claimants so choose to continue such suit. Such civil suit had claimed, among other things, nuisance based on both the construction and operation of the facility. Since the third quarter of 2016, various motions have been filed by each of the Project and the claimants in the civil suit. A hearing on such motions was held in January 2017 and the parties are awaiting a decision from the court. We do not believe this proceeding will have a material adverse effect on our business, financial position or liquidity based on the information currently available to us, but can give no assurance, that it will ultimately be resolved favorably to the Project.
9. Related Party Transactions
The Partnership is controlled by the GP, which was jointly controlled by Pattern, Samsung, and Capital Power in accordance with the Unanimous Shareholder Agreement dated December 5, 2011. At December 31, 2016, the GP was jointly controlled by Pattern, Axium and Capital Power following Samsung's sale of interest in the Partnership.
The following transactions were carried out with the related parties:
Management, Operation, and Maintenance Agreement (MOMA)
On March 20, 2014, the Partnership entered into the MOMA with Pattern Operators Canada ULC (POC), which is owned by an affiliate of Pattern to operate and manage the maintenance of the wind plant and to perform certain other services pertaining to the wind plant in accordance with terms and conditions set in the MOMA.
The fixed annual fee for the service is $0.9 million pro-rated for the period from March 20, 2013 until the COD and thereafter the annual fee was increased to $1.4 million until expiry of the contract in 2035. Additionally, the Partnership recorded expense of $1.4 million and $0.8 million (unaudited) to operations and maintenance expense in the statements of operations and comprehensive income (loss) for the year ended December 31, 2016 and for the period ended December 31, 2015, respectively. As of December 31, 2016 and 2015, the Partnership recorded $0.1 million and $0.3 million, respectively, in related party payable.
Project Administration Agreement (PAA)
On March 20, 2014, the Partnership entered into the PAA with POC, which is 100% owned by an affiliate to receive project administrative services. A fixed annual fee of $0.4 million is payable during the period between the COD until expiry of the PPA in 2035. The Partnership recorded expense of $0.4 million and $0.2 million (unaudited) to general and administrative expense in the statements of operations and comprehensive income (loss) for the year ended December 31, 2016 and for the period ended December 31, 2015, respectively. As of December 31, 2016 and 2015, the Partnership recorded $0.0 million and $0.1 million, respectively, in related party payable.
S- 85
K2 Wind Ontario Limited Partnership
Notes to Financial Statements
Engineering Procurement and Construction Contract (EPC)
On March 20, 2014, the Partnership entered into the EPC with SRE K2 EPC LP, which is 100% owned by Samsung to build the project. As of December 31, 2015, $228.6 million was capitalized and recorded to construction in progress on the balance sheet. This amount includes $32.5 million for the period ended December 31, 2015 for services from AMEC Americas Limited and Black & McDonald Limited, a third party construction subcontractor. As of December 31, 2015, the Partnership recorded $4.3 million in related party payable.
Following the sale of Samsung's interest in K2 Wind on August 5, 2016, AMEC Black & McDonald ceased to be a related party to K2 Wind. At the time of the sale, $1.4 million related to the EPC was reclassified from related party payable to construction reserve liability. As of December 31, 2016, the Partnership has paid the EPC in full.
Pad mount transformer sold to Grand Renewable Wind LP
During the period ended December 31, 2015, the Partnership provided Grand Renewable Wind LP (GRW), an affiliate of K2 Wind, with a pad mount transformer for approximately $0.1 million, which was included in related party receivable as of December 31, 2015.
10. Subsequent Events
The Partnership evaluated subsequent events through March 1, 2017, which is the date these financial statements were available to be issued and noted that there were no subsequent events to disclose.
S- 86