Attached files
| file | filename |
|---|---|
| EX-32 - EX-32 - Pattern Energy Group Inc. | d842437dex32.htm |
| EX-31.1 - EX-31.1 - Pattern Energy Group Inc. | d842437dex311.htm |
| EX-23.1 - EX-23.1 - Pattern Energy Group Inc. | d842437dex231.htm |
| EX-31.2 - EX-31.2 - Pattern Energy Group Inc. | d842437dex312.htm |
| EX-21.1 - EX-21.1 - Pattern Energy Group Inc. | d842437dex211.htm |
| EX-23.2 - EX-23.2 - Pattern Energy Group Inc. | d842437dex232.htm |
| EXCEL - IDEA: XBRL DOCUMENT - Pattern Energy Group Inc. | Financial_Report.xls |
Table of Contents
UNITED STATES
SECURITIES AND EXCHANGE COMMISSION
WASHINGTON, D.C. 20549
FORM 10-K
| x | ANNUAL REPORT PURSUANT TO SECTION 13 or 15(d) OF THE SECURITIES EXCHANGE ACT OF 1934 |
For the Fiscal Year Ended December 31, 2014.
-OR-
| ¨ | TRANSITION REPORT PURSUANT TO SECTION 13 OR 15(d) OF THE SECURITIES EXCHANGE ACT OF 1934 |
Commission File Number 001-36087
PATTERN ENERGY GROUP INC.
(Exact name of Registrant as specified in its charter)
| Delaware | 90-0893251 | |
| (State or other jurisdiction of incorporation or organization) |
(I.R.S. Employer Identification No.) |
Pier 1, Bay 3, San Francisco, CA 94111
(Address of principal executive offices) (Zip Code)
Registrant’s telephone number, including area code: (415) 283-4000
Securities registered pursuant to Section 12(b) of the Act:
| Title of Each Class |
Name of Each Exchange on Which Registered | |
| Class A Common Stock, par value $0.01 per share | NASDAQ Global Market Toronto Stock Exchange |
Indicate by check mark if the registrant is a well-known seasoned issuer, as defined in Rule 405 of the Securities Act. Yes x No ¨
Indicate by check mark if the registrant is not required to file reports pursuant to Section 13 or Section 15(d) of the Act. Yes ¨ No x
Indicate by check mark whether the registrant (1) has filed all reports required to be filed by Section 13 or 15(d) of the Securities Exchange Act of 1934 during the preceding 12 months (or for such shorter period that the registrant was required to file such reports), and (2) has been subject to such filing requirements for the past 90 days. Yes x No ¨
Indicate by check mark whether the registrant has submitted electronically and posted on its corporate Web site, if any, every Interactive Data File required to be submitted and posted pursuant to Rule 405 of Regulation S-T (§232.405 of this chapter) during the preceding 12 months (or for such shorter period that the registrant was required to submit and post such files). Yes x No ¨
Indicate by check mark if disclosure of delinquent filers pursuant to Item 405 of Regulation S-K is not contained herein, and will not be contained, to the best of registrant’s knowledge, in definitive proxy or information statements incorporated by reference in Part III of this Form 10-K or any amendment to this Form 10-K. ¨
Indicate by check mark whether the registrant is a large accelerated filer, an accelerated filer, a non-accelerated filer, or a smaller reporting company. See the definitions of “large accelerated filer”, “accelerated filer” and” “smaller reporting company” in Rule 12b-2 of the Exchange Act.
| Large accelerated filer | x | Accelerated filer | ¨ | |||
| Non-accelerated filer | ¨ | Smaller reporting company | ¨ |
Indicate by check mark whether the registrant is a shell company (as defined in Rule 12b-2 of the Exchange Act.) Yes ¨ No x
The aggregate market value of the voting stock and non-voting stock held by non-affiliates of the registrant based upon the last trading price of the registrant’s Class A common stock as reported on the NASDAQ Global Market on June 30, 2014 was approximately $1,308,252,717. This excludes 39,512,314 shares of Class A common stock held by directors, officers and Pattern Renewables LP and certain of its affiliates. Exclusion of shares does not reflect a determination that persons are affiliates for any other purpose.
The registrant’s Class A common stock began trading on the NASDAQ Global Market under the symbol “PEGI” and on the Toronto Stock Exchange under the symbol “PEG” on October 2, 2013.
On February 26, 2015, the registrant had 69,062,463 shares of Class A common stock, $0.01 par value per share, outstanding.
DOCUMENTS INCORPORATED BY REFERENCE
Portions of the registrant’s definitive proxy statement relating to its 2015 annual meeting of stockholders (the “2015 Proxy Statement”) are incorporated by reference into Part III of this Form 10-K where indicated. The 2015 Proxy Statement will be filed with the U.S. Securities and Exchange Commission within 120 days after the end of the fiscal year to which this report relates.
Table of Contents
2
Table of Contents
CAUTIONARY NOTICE REGARDING FORWARD-LOOKING STATEMENTS
This Annual Report on Form 10-K (“Form 10-K”) contains statements that may constitute forward-looking statements. You can identify these statements by forward-looking words such as “anticipate,” “believe,” “could,” “estimate,” “expect,” “intend,” “may,” “plan,” “potential,” “should,” “will,” “would,” or similar words. You should read statements that contain these words carefully because they discuss our current plans, strategies, prospects, and expectations concerning our business, operating results, financial condition, and other similar matters. While we believe that these forward-looking statements are reasonable as and when made, there may be events in the future that we are not able to predict accurately or control, and there can be no assurance that future developments affecting our business will be those that we anticipate. Our forward-looking statements involve significant risks and uncertainties (some of which are beyond our control) and assumptions that could cause actual results to differ materially from our historical experience and our present expectations or projections. Known material factors that could cause our actual results to differ from those in the forward-looking statements are those described in Part I, Item 1A “Risk Factors.”
Readers are cautioned not to place undue reliance on forward-looking statements, which speak only as of the date hereof. We undertake no obligation to publicly update or revise any forward-looking statements after the date they are made, whether as a result of new information, future events or otherwise.
MEANING OF CERTAIN REFERENCES
Unless the context provides otherwise, references herein to “we,” “our,” “us,” “our company” and “Pattern” refer to Pattern Energy Group Inc., a Delaware corporation, together with its consolidated subsidiaries. In addition, unless the context requires otherwise, any reference in this Form 10-K to:
| • | “Conversion Event” refers to the event pursuant to which all of our Class B shares automatically converted into Class A shares on a one-for-one basis on December 31, 2014; |
| • | “FERC” refers to the U.S. Federal Energy Regulatory Commission; |
| • | “FIT” refers to feed-in-tariff regime; |
| • | “FPA” refers to the Federal Power Act; |
| • | “Gulf Wind Call Right” refers to the right to acquire the Pattern Development retained Gulf Wind interest at any time between October 2, 2014 and October 2, 2015, at its then current fair market value; |
| • | “Identified ROFO Projects” refers to nine projects that we identified as development projects, each owned by Pattern Development and subject to our Project Purchase Right, that were predominantly operational or construction ready, including the Gulf Wind, Armow, K2, Meikle, Conejo Solar, Belle River, Henvey Inlet, Amazon and Mont Sainte-Marguerite projects; |
| • | “IPPs” refers to independent power producers; |
| • | “ISOs” refers to independent system organizations, which are organizations that administer wholesale electricity markets; |
| • | “ITCs” refers to investment tax credits; |
| • | “Management Services Agreement” refers to the bilateral services agreement between us and Pattern Development; |
| • | “MW” refers to megawatts; |
| • | “MWh” refers to megawatt hours; |
3
Table of Contents
| • | “Non-Competition Agreement” refers to a non-competition agreement between us and Pattern Development pursuant to which Pattern Development agrees that, for so long as any of our Purchase Rights are exercisable, it will not compete with us for acquisitions of power generation or transmission projects from third parties; |
| • | “OCC” refers to our operations control center; |
| • | “Pattern Development” refers to Pattern Energy Group LP and its subsidiaries (other than us and our subsidiaries); |
| • | “Pattern Development’s retained Gulf Wind interest” refers to the retained interest of approximately 27% in the Gulf Wind project, owned by Pattern Development; |
| • | “power sale agreements” refer to PPAs and/or hedging arrangements, as applicable; |
| • | “PPAs” refer to power purchase agreements; |
| • | “Project Purchase Right” refers to a right of first offer with respect to any power project that Pattern Development decides to sell, including the Identified ROFO Projects; |
| • | “PTCs” refers to production tax credits; |
| • | “PUHCA” refers to the Public Utility Holding Company Act of 2005, as amended; |
| • | “Purchase Rights” refers to the Project Purchase Rights, and the rights to acquire the Pattern Development retained Gulf Wind interest, and the right to acquire Pattern Development itself or substantially all of its assets, as contemplated by the Purchase Rights Agreement between us and Pattern Development; |
| • | “RECs” refers to renewable energy credits; |
| • | “reintegration event” refers to the event contemplated by the Management Services Agreement pursuant to which, upon the completion of the first 20 consecutive trading day period during which our total market capitalization is no less than $2.5 billion, the employees of Pattern Development will become our employees; |
| • | “Riverstone” refers to Riverstone Holdings LLC; |
| • | “ROFO” refers to right of first offer; |
| • | “RPS” refers to Renewable Portfolio Standards; |
| • | “Sarbanes-Oxley Act” refers to the Sarbanes-Oxley Act of 2002; |
| • | “Shared PEG Executives” refers to certain of our executive officers, including our Chief Executive Officer, who also serve as executive officers of Pattern Development and devote their time to both our company and Pattern Development as is prudent in carrying out their executive responsibilities and fiduciary duties; |
| • | “Samsung” means Samsung C&T Corporation; and |
| • | “U.S. Treasury” refers to the U.S. Department of the Treasury. |
CURRENCY AND EXCHANGE RATE INFORMATION
In this Form 10-K, references to “C$” and “Canadian dollars” are to the lawful currency of Canada and references to “$”, “US$” and “U.S. dollars” are to the lawful currency of the United States. All dollar amounts herein are in U.S. dollars, unless otherwise stated.
4
Table of Contents
Our historical consolidated financial statements are presented in U.S. dollars. The following chart sets forth for each of 2014, 2013, 2012 and 2011, the high, low, period average and period end noon buying rates of Canadian dollars expressed as Canadian dollars per US$1.00.
| Canadian Dollars per US$1.00 | ||||||||||||||||
| High | Low | Period Average(1) | Period End | |||||||||||||
| Year |
||||||||||||||||
| 2014 |
C$ | 1.1643 | C$ | 1.0614 | C$ | 1.1045 | C$ | 1.1501 | ||||||||
| 2013 |
1.0697 | 0.9839 | 1.0300 | 1.0637 | ||||||||||||
| 2012 |
1.0417 | 0.9710 | 0.9995 | 0.9958 | ||||||||||||
| 2011 |
1.0605 | 0.9448 | 0.9887 | 1.0168 | ||||||||||||
| (1) | The average of the noon buying rates on the last business day of each month during the relevant one-year period and, in respect of monthly or interim period information, the average of the noon buying rates on each business day for the relevant period. |
The noon buying rate in Canadian dollars on February 26, 2015 was US$1.00 = C$1.2490.
The above rates differ from the actual rates used in our consolidated historical financial statements and the calculation of cash available for distribution and dividends we declared and paid described elsewhere in this Form 10-K. Our inclusion of these exchange rates is not meant to suggest that the U.S. dollar amounts actually represent such Canadian dollar amounts or that such amounts could have been converted into Canadian dollars at any particular rate or at all.
For information on the impact of fluctuations in exchange rates on our operations, see “Item 1A—Risk Factors—Risks Related to Our Projects—Currency exchange rate fluctuations may have an impact on our financial results and condition” and “Item 7A—Quantitative and Qualitative Disclosure About Market Risk—Foreign Currency Exchange Rate Risk”.
5
Table of Contents
Overview
We are an independent power company focused on owning and operating power projects with stable long-term cash flows in attractive markets with potential for continued growth of our business. We hold interests in twelve wind power projects located in the United States, Canada and Chile that use proven, best-in-class technology and have a total owned capacity of 1,636 MW. The projects consist of eleven operating projects and one project under construction. Our one construction project, the Logan’s Gap project, which we acquired from Pattern Development on December 19, 2014, is scheduled to commence commercial operations prior to the end of 2015. Each of our projects has contracted to sell all or a majority of its output pursuant to a long-term, fixed-price power sale agreement with a creditworthy counterparty. One of our counterparties, PREPA, has been downgraded by Standard & Poor’s Rating Services and Moody’s Investor Service to CCC and Caa3, respectively, from prior investment grade ratings. See “Risk Factors—Our projects rely on a limited number of key power purchases. The power purchaser for our Santa Isabel project has been downgraded”. Eighty-nine percent of the electricity to be generated by our projects will be sold under these power sale agreements which have a weighted average remaining contract life of approximately 16 years.
We intend to use a substantial portion of the cash available for distribution generated from our projects to pay regular quarterly dividends to holders of our Class A shares. On February 24, 2015, we increased our quarterly dividend to $0.342 per Class A share, or $1.368 per Class A share on an annualized basis, from $0.335 per Class A share, or $1.34 per Class A share on an annualized basis, commencing with respect to dividends paid on April 30, 2015 to shareholders of record as of March 31, 2015. The dividend amount, if any, may be changed in the future without advance notice. We established our quarterly dividend level based on a target payout ratio of approximately 80% after considering our expected sustainable cash flow to be generated from our operating projects together with the additional cash available for distribution that we estimate our construction project will generate. The declaration and amount of our future dividends, if any, will be subject to our actual earnings and capital requirements and the discretion of our Board of Directors.
Our growth strategy is focused on the acquisition of operational and construction-ready power projects from Pattern Development and other third parties that we believe will contribute to the growth of our business and enable us to increase our dividend per Class A share over time. We expect that our continuing relationship with Pattern Development, a leading developer of renewable energy projects, will be an important source of growth for our business.
Our Core Values and Financial Objectives
We intend to maximize long-term value for our stockholders in an environmentally responsible manner and with respect for the communities in which we operate. Our business is built around three core values:
| • | creating a safe, high-integrity, exciting work environment for our employees; |
| • | applying rigorous analysis to all aspects of our business in a timely, disciplined and functionally integrated manner to understand patterns in wind regimes, technology developments, market trends and regulatory, financial and legal constraints; and |
| • | working proactively with our stakeholders to address environmental and community concerns, which we believe is a socially responsible approach that also benefits our business by reducing operating risks at our projects. |
Our financial objectives, which we believe will maximize long-term value for our stockholders, are to:
| • | produce stable and sustainable cash available for distribution; |
6
Table of Contents
| • | selectively grow our project portfolio and our dividend; and |
| • | maintain a strong balance sheet and flexible capital structure. |
Our Projects
The following table provides an overview of our projects:
| Location and Start-up |
Capacity (MW) | Power Sale Agreements | ||||||||||||||||||||||||||||
| Projects |
Location |
Construction |
Commercial |
Rated(3) | Owned(4) | Type | Contracted Volume(5) |
Counterparty |
Counterparty |
Expiration | ||||||||||||||||||||
| Operating Projects |
| |||||||||||||||||||||||||||||
| Gulf Wind |
Texas | Q1 2008 | Q3 2009 | 283 | 113 | Hedge | (7) | ~58 | % | Credit Suisse Energy LLC | A/A1 | 2019 | ||||||||||||||||||
| Hatchet Ridge |
California | Q4 2009 | Q4 2010 | 101 | 101 | PPA | 100 | % | Pacific Gas & Electric | BBB/A3 | 2025 | |||||||||||||||||||
| St. Joseph |
Manitoba | Q1 2010 | Q2 2011 | 138 | 138 | PPA | 100 | % | Manitoba Hydro | AA/Aa1(8) | 2039 | |||||||||||||||||||
| Spring Valley |
Nevada | Q3 2011 | Q3 2012 | 152 | 152 | PPA | 100 | % | NV Energy | BBB+/Baa2 | 2032 | |||||||||||||||||||
| Santa Isabel |
Puerto Rico | Q4 2011 | Q4 2012 | 101 | 101 | PPA | 100 | % | Puerto Rico Electric Power Authority | CCC/Caa3 | 2035 | |||||||||||||||||||
| Ocotillo |
California | Q3 2012 | Q4 2012 | 223 | 223 | PPA | 100 | % | San Diego Gas & Electric | A/A1 | 2033 | |||||||||||||||||||
| Q2 2013 | 42 | 42 | PPA | 100 | % | San Diego Gas & Electric | A/A1 | 2033 | ||||||||||||||||||||||
| South Kent |
Ontario | Q1 2013 | Q2 2014 | 270 | 135 | PPA | 100 | % | Independent Electricity System Operator |
AA-/Aa2(9) | 2034 | |||||||||||||||||||
| El Arrayán |
Chile | Q3 2012 | Q2 2014 | 115 | 81 | Hedge | (10) | ~74 | % | Minera Los Pelambres | NA | 2034 | ||||||||||||||||||
| Panhandle 1 |
Texas | Q3 2013 | Q2 2014 | 218 | 172 | Hedge | (11) | ~80 | % | Citigroup Energy Inc. | A-/Baa2 | 2027 | ||||||||||||||||||
| Panhandle 2 |
Texas | Q4 2013 | Q4 2014 | 182 | 147 | Hedge | (11) | ~80 | % | Morgan Stanley | A-/Baa2 | 2027 | ||||||||||||||||||
| Grand |
Ontario | Q3 2013 | Q4 2014 | 149 | 67 | PPA | 100 | % | Independent Electricity System Operator |
AA-/Aa2(9) | 2034 | |||||||||||||||||||
|
|
|
|
|
|||||||||||||||||||||||||||
| 1,974 | 1,472 | |||||||||||||||||||||||||||||
|
|
|
|
|
|||||||||||||||||||||||||||
| Construction Projects |
||||||||||||||||||||||||||||||
| Logan’s Gap |
Texas | Q4 2014 | Q4 2015 | 200 | 164 | PPA | ~58 | % | Wal-Mart Stores, Inc. | AA/Aa2 | 2025 | |||||||||||||||||||
| Hedge | (12) | ~17 | % | Merrill Lynch Commodities, Inc. | A-/Baa2 | 2028 | ||||||||||||||||||||||||
|
|
|
|
|
|||||||||||||||||||||||||||
| 200 | 164 | |||||||||||||||||||||||||||||
|
|
|
|
|
|||||||||||||||||||||||||||
| 2,174 | 1,636 | |||||||||||||||||||||||||||||
|
|
|
|
|
|||||||||||||||||||||||||||
| (1) | Represents date of commencement of construction. |
| (2) | Represents date of actual or anticipated commencement of commercial operations. |
| (3) | Rated capacity represents the maximum electricity generating capacity of a project in MW. As a result of wind and other conditions, a project or a turbine will not operate at its rated capacity at all times and the amount of electricity generated will be less than its rated capacity. The amount of electricity generated may vary based on a variety of factors discussed elsewhere in this Form 10-K. See Item 1A “Risk Factors.” |
| (4) | Owned capacity represents the maximum, or rated, electricity generating capacity of the project in MW multiplied by our percentage ownership interest in the distributable cash flow of the project. |
| (5) | Represents the percentage of a project’s total estimated average annual MWh of electricity generation contracted under power sale agreements. |
| (6) | Reflects the counterparty’s corporate credit ratings issued by S&P/Moody’s as of December 31, 2014. |
| (7) | Represents a 10-year fixed-for-floating power price swap. See Item 2 “Properties—Operating Projects—Gulf Wind.” |
| (8) | Reflects the corporate credit ratings of the Province of Manitoba, which owns 100% of Manitoba Hydro-Electric. |
| (9) | Reflects the corporate credit ratings of the Province of Ontario, which owns 100% of the Independent Electricity System Operator (“IESO”), formerly the Ontario Power Authority. |
| (10) | Represents a 20-year fixed-for-floating swap. See Item 2 “Properties—Operating Projects—El Arrayán.” |
| (11) | Represents a fixed-for-floating swap of more than ten years duration. See Item 2 “Properties—Operating Projects—Panhandle 1 and Panhandle 2.” |
| (12) | Represents a 13-year fixed-for-floating swap. See Item 2 “Properties—Construction Project—Logan’s Gap.” |
7
Table of Contents
Each of our projects has gone through a rigorous vetting process in order to meet our investment and our lenders’ financing criteria. The development of each project was managed and overseen by our management team over a period of several years and each project was designed to meet or exceed industry, environmental, community and safety standards applicable for industrial-scale power projects. As a result, our projects generally have the following characteristics:
| • | multi-year on-site wind data analysis tied to one or more long-term wind energy reference sources. Pattern Development employs a full-time, five-person meteorological team that manages and verifies third party wind analysis. Our wind analysis is carefully vetted through detailed studies by internal and independent experts in meteorology and statistics to derive an expected production profile based on daily and seasonal wind patterns, structural interference, topography and atmospheric conditions. Our average on-site wind data collection is over four years (or approximately seven years including post-construction data collection); |
| • | long-term power sale agreements designed to ensure a predictable revenue stream. As is typical in our industry, we sell our electricity at a fixed price on a contingent, as-produced basis such that only the electricity that we generate is sold to and must be purchased by the counterparty at the agreed price. Our power sale agreements have a weighted average remaining contract life of approximately 16 years; |
| • | contractually secured real estate property and easement rights for a period well in excess of the project’s expected useful life and contractual obligations. Each of our projects has land rights for 30 years or more; |
| • | a firm right to interconnect to the electricity grid through interconnection agreements, which define the cost allocation and schedule for interconnection, as well as any upgrades required to connect the project to the transmission system. Our interconnection agreements allow our projects to connect to the electricity transmission system. Market rules and protocols generally govern dispatch of our electricity generation and allow it to flow freely into the grid as it is produced, except in very limited circumstances where our projects can be curtailed, for example during system emergencies. Our projects in Ontario are subject to economic dispatch; however, we are compensated by our power purchaser for curtailed production in excess of a specified annual threshold. To date, except for compensated curtailment, our projects have on average been curtailed less than 1% per year; |
| • | long-term, limited-recourse, amortizing project financing designed to match the long-lived nature of our power projects and the related power sales agreements. The interest rates on our long-term loans are fixed for the tenor of the loans or are subject to fixed-for-floating swaps that match the amortization schedules of the debt; |
| • | all necessary construction and operating permits and other requisite federal, state or provincial and local permits, and regulatory approvals secured, which critical permits typically include federal aviation, state or provincial environmental approvals and local zoning and land-use permits and are designed to protect the community, cultural resources, plants, animal and other affected resources at or near the facility; |
| • | fixed-price turbine supply and construction contracts with guaranteed completion dates to ensure that our projects are completed on time and within the estimated budget. The construction period for our projects has typically been less than one year, although in certain instances circumstances warrant a longer construction period; |
| • | an operations and maintenance service program based on our own on-site personnel and central operations management as well as equipment warranties and service arrangements with qualified contractors experienced in wind project maintenance. We have existing turbine equipment warranties for approximately 82% of our operating turbine units; and |
| • | safety, environmental and community programs to support our existing projects and relationships in the communities in which we operate. |
For additional information regarding each of our projects, see Item 2 “Properties.” Our ability to transition each of our construction projects to commercial operations and achieve anticipated power output at all of our operating projects is subject to numerous risks and uncertainties as described under Item 1A “Risk Factors.”
8
Table of Contents
Our Strategy
We intend to make profitable investments in environmentally responsible power projects, while embracing a long-term commitment to the communities in which we operate. To achieve our financial objectives while adhering to our core values, we intend to execute the following business strategies:
Maintaining and Increasing the Value of Our Projects
We intend to efficiently operate our projects to meet projected revenues and cash available for distribution. We expect to maximize the long-term value of our projects by focusing on value-oriented project availability (by ensuring our projects are operational when the wind is strong and PPA prices are at their highest) and by regularly scheduled and preventative maintenance. We believe that good operating performance begins with a long-term maintenance program for our equipment. We also seek to improve performance or lower operating costs by working closely with our equipment vendors and considering contracting with third parties, if appropriate.
We believe it is important to employ our own personnel in aspects of our business that we deem critical to the value of our projects but to contract with reliable third parties for on-going major maintenance of our turbines and similar specialized services such as repairs on our substations or transmission lines. As a result, we employ on-site personnel, maintain a 24/7 operations control center to monitor our projects and control all critical aspects of commercial asset management. We also believe it is important to invest in our employees to give our operating personnel the tools to pursue our objectives through regular training, performance incentives, integrating teams of different experts, use of advanced software programming and regular upgrading of our automated systems. See Item 1 “Business—Organization of Our Business.”
Completing Our Construction Projects on Schedule and Within Budget
We promote the success of our business by completing our construction projects on schedule and within budget, transitioning projects under construction to commercial operation on a timely basis and efficiently operating our projects to maximize project revenues and minimize operating costs. We expect our one construction project to increase our owned capacity by 164 MW in 2015, for an aggregate of 1,636 MW together with our currently operating projects.
We utilize experienced, creditworthy contractors and proven technology to build high-quality power projects. In addition, over the past 12 years, our management team has overseen the construction and commencement of commercial operations of 30 wind power projects, and our project and construction management capabilities are well respected throughout our industry. By capitalizing on these significant construction and operational resources available to us, including those available to us through the Management Services Agreement, we intend to complete the construction and commence commercial operations at our construction projects in accordance with construction schedules and within budget.
Maintaining a Prudent Capital Structure and Financial Flexibility
We intend to maintain a conservative approach to our capital structure to protect our ability to pay regular dividends and fund investments to provide for future growth. Power projects by their nature require significant upfront capital investment and as a result we believe it prudent to match these long-lived assets with long-term debt and/or equity. The average maturity of our project-level term debt is approximately 11 years, although our scheduled loan amortization is typically 18 years or more, and we have an expected average annual debt service coverage ratio over the remaining scheduled loan amortization periods of approximately 1.7 to 1.0. This prudent capital structure coupled with our predictable price for our electricity and our standard operations and maintenance programs help to achieve a stable cash flow profile.
Three of our projects, Panhandle 1, Panhandle 2 and Logan’s Gap, with an aggregate owned capacity of 483 MW, are, or will be, financed in part by long-term tax equity investments and do not have any long-term project debt.
Consistent with our existing indebtedness, we expect to typically utilize fixed-rate indebtedness (or swapping any variable rate indebtedness) with strong debt service coverage ratios to finance projects. We believe this approach, together with a strategic consideration of project-level financial restructuring and recapitalization opportunities, will contribute to our ability to maintain and, over time, increase our cash available for distribution.
9
Table of Contents
Working Closely With Our Stakeholders
We believe that close working relationships with our various stakeholders, including suppliers, power sales agreement counterparties, regulators, the local communities where we are located and environmental organizations and with Pattern Development and other developers enable us to best support our existing projects and will help us access attractive, construction-ready projects. For example, by working closely with the regulatory agencies and the community, we believe that we create an environment within which if problems are identified we can work constructively and efficiently to resolve the problems and minimize the impact to our operations.
Selectively Growing Our Business
Our strategy for growth is focused on the acquisition of operational and construction-ready power projects from Pattern Development and other third parties that we believe will contribute to the growth of our business and enable us to increase our dividend per Class A share over time. We expect that projects we may acquire in the future will represent a logical extension of our existing business and be consistent with our risk profile, and that any incremental assumption of risk will require commensurate expectations of higher returns. As a result, our near-term growth strategy will remain focused on largely contracted cash flows with creditworthy counterparties and operating or in-construction projects.
We expect that new opportunities will arise from our relationship with Pattern Development, which provides us with the opportunity to acquire projects that it successfully develops and efficiently completing construction and achieving commercial operations at these projects
Below is a summary of the Identified ROFO Projects that we expect to acquire from Pattern Development in connection with our Purchase Rights in the next two years. We have commenced discussions with Pattern Development with respect to the acquisition of each of the K2 and Amazon projects pursuant to our Purchase Rights, and, in the case of the Amazon project, Pattern Development has made an application to FERC seeking prior authorization to transfer its interest in such project to us. The filing of the application with FERC does not obligate us to enter into any transaction and no agreement as to the material terms has been reached with respect to either the K2 or Amazon projects. The terms of such transaction, if any, and the timing thereof, remain subject to discussions among the parties. For additional discussion on the Identified ROFO Projects, see Item 7 “Management’s Discussion and Analysis of Financial Condition and Results of Operations–Recent Transactions”.
| Capacity (MW) | ||||||||||||||||||
| Identified ROFO Projects |
Status |
Location |
Construction Start(1) |
Commercial Operations(2) |
Contract Type |
Rated(3) | Pattern Development- Owned(4) |
|||||||||||
| Gulf Wind(5) |
Operational | Texas | 2008 | 2009 | Hedge | 283 | 76 | |||||||||||
| K2 |
In construction | Ontario | 2014 | 2015 | PPA | 270 | 90 | |||||||||||
| Armow |
In construction | Ontario | 2014 | 2015 | PPA | 180 | 90 | |||||||||||
| Meikle |
Ready for financing | British Columbia | 2015 | 2016 | PPA | 185 | 185 | |||||||||||
| Conejo Solar |
Ready for financing | Chile | 2015 | 2016 | PPA | 104 | 73 | |||||||||||
| Belle River |
Securing final permits | Ontario | 2016 | 2017 | PPA | 100 | 50 | |||||||||||
| Henvey Inlet |
Late stage development | Ontario | 2016 | 2017 | PPA | 300 | 150 | |||||||||||
| Amazon |
Ready for financing | Indiana | 2015 | 2015 / 2016 | PPA | 150 | 116 | |||||||||||
| Mont Sainte-Marguerite |
Late stage development | Québec | 2016 | 2017 / 2018 | PPA | 147 | 147 | |||||||||||
|
|
|
|
|
|||||||||||||||
| 1,719 | 977 | |||||||||||||||||
|
|
|
|
|
|||||||||||||||
| 1) | Represents date of actual or anticipated commencement of construction. |
| 2) | Represents date of actual or anticipated commencement of commercial operations. |
| 3) | Rated capacity represents the maximum electricity generating capacity of a project in MW. As a result of wind and other conditions, a project or a turbine will not operate at its rated capacity at all times and the amount of electricity generated will be less than its rated capacity. The amount of electricity generated may vary based on a variety of factors discussed elsewhere in this Form 10-K. |
10
Table of Contents
| 4) | Pattern Development-owned capacity represents the maximum, or rated, electricity generating capacity of the project multiplied by Pattern Development’s percentage ownership interest in the distributable cash flow of the project. |
| 5) | We have a call right to acquire Pattern Development’s retained interest in the Gulf Wind project, at fair market value, at any time between October 2, 2014 and October 2, 2015. |
Our management team will rigorously review and analyze new market opportunities and selectively consider opportunities offered by Pattern Development as well as those offered by other third parties, either independently or jointly with Pattern Development. From time to time, we may submit bids in connection with third party acquisition opportunities. These bids can be binding bids or non-binding bids, can be for single assets or a group of assets, and (if accepted) can be material acquisitions for us. There can be no assurance any such bids will be accepted. We believe our management team provides us with the experience to bring both currently owned and subsequently acquired domestic and international power projects online.
Reintegration of Pattern Development Employees
Under the terms of the Management Services Agreement, upon the completion of the first 20 consecutive trading day period during which our total market capitalization is no less than $2.5 billion, the employees of Pattern Development will become our employees. We refer to this event as the employee reintegration. For the purposes of determining the employee reintegration date, total market capitalization will be determined by multiplying the number of our issued and outstanding Class A shares and the closing price of our Class A shares as reported on the then primary stock exchange on which our Class A shares are listed. We will not be required to make any payments to Pattern Development upon the occurrence of the employee reintegration, other than the payment of any statutory severance payments that may as a result be due and payable to employees in certain jurisdictions outside the United States. The employee reintegration will result in our complete internalization of the administrative, technical and other services that were initially provided to us by Pattern Development under the Management Services Agreement. The occurrence of the employee reintegration will neither alter our Purchase Rights nor the terms of the Management Services Agreement.
Upon the employee reintegration, we expect that our principal focus will continue to be owning operational and under-construction power projects. However, the employee reintegration is expected to enhance our long-term ability to independently develop projects and grow our business. Following the employee reintegration, we will continue to provide management and other services to Pattern Development (including services from the reintegrated departments of Pattern Development) to the extent required by Pattern Development’s remaining development activities, and Pattern Development will continue to pay us for those services primarily on a cost reimbursement basis.
Competitive Strengths
We believe our key competitive strengths include:
Our High-Quality Projects
We believe our high-quality projects are better positioned to generate stable long-term cash flows compared to typical projects in the industry and will generate available cash in excess of our initial dividend level, providing us the financial resources for investing in new opportunities. Having high-quality projects also provides us access to low-cost project-level debt and strong stakeholder relationships. The key attributes and strengths of our projects are:
Long-Term, Fixed-Price Power Sale Agreements. We believe our long-term, fixed-price power sale agreements with eleven distinct creditworthy counterparties will deliver stable long-term revenues, although we note that the credit rating of PREPA, the Puerto Rican counterparty to our Santa Isabel project’s PPA, was downgraded a number of times in 2014. Our power sale agreements cover 89% of the electricity to be generated across our projects with a weighted average remaining contract life of approximately 16 years.
11
Table of Contents
Geographically Diverse Markets and Wind Regimes. Our geographically diverse projects are located across regions generally characterized by high demand for renewable energy, documented reliable wind resources, deregulated energy markets and favorable renewable energy policies. The geographic diversity of our projects—from California to Puerto Rico, and Manitoba to Chile—helps insulate us against regional wind fluctuations as well as the possibility of adverse regulatory conditions in any one jurisdiction.
State-of-the-Art Wind Turbine Technologies. Our projects utilize state-of-the-art, proven, reliable wind turbine technologies. Our projects utilize Siemens 2.3 MW, Mitsubishi MWT95/2.4 and GE 1.85-87 wind turbines, some of the most reliable and proven turbine technologies available in the market. The wind turbines were in each case specifically selected for the site conditions to ensure optimal performance and longevity of the machines. Our turbines have an average age of approximately two years.
Our Strong Reputation in the Industry
We believe the success of our team has created a highly respected organization which attracts talented people and new opportunities. Our integrity, expertise, and solutions-oriented approach is attractive to stakeholders and parties providing services to our existing projects as well as those who are looking for buyers of their assets.
Our Spring Valley project received the Wind Project of the Year Award in 2012 from POWER-GEN International (the publisher of Power Engineering and Renewable Energy World), which we believe is considered among the most prestigious awards in the renewable energy industry. Our El Arrayán project also won two Chilean International Renewable Energy Awards, presented at the Chilean International Renewable Energy Congress (CIREC) 2012 annual conference in Santiago. The awards were the Best Renewable Energy Project in 2012 (Mejor proyecto de Energía Renovable de 2012) and the Best Renewable Energy Joint Venture (Mejor colaboración entre dos empresas). In 2013, our Ocotillo project received an award for its outstanding environmental analysis and documentation from the California Association of Environmental Professionals and also received the Renewable Project Finance Deal of the Year award from Power Finance & Risk published by Power Intelligence. Also in 2013, our Santa Isabel project won the Outstanding Project of the Year Award in Land Surveying and Environmental Engineering from the Professional College of Engineers and Land Surveyors of Puerto Rico.
Our Approach to Project Selection
Our approach to project selection aims to deliver superior financial results and minimize long-term operating risks by focusing on the acquisition of projects that are operational or construction-ready and have long-term power sales agreements with creditworthy counterparties. Once we identify an attractive opportunity, we apply rigorous analysis in a timely, disciplined and functionally integrated manner to evaluate the wind regime, technology options, site design improvement, regional market trends and regulatory, financial and legal constraints. The most attractive projects offer the proper combination of land accessibility, power transmission capacity, attractive power sales markets and favorable and dependable winds. We believe the members of our management team are recognized by their industry peers as skilled in identifying, analyzing and executing successful power project acquisitions.
Our approach to project selection has also enabled us to successfully execute new projects in a complex renewable energy market characterized by economic, political and regulatory changes that affect energy investment opportunities. Examples include the cyclical nature of U.S. federal incentives and the challenge of realizing the full value of these incentives, increasing environmental and permitting concerns, reduced PPA opportunities that are influenced by changing power markets, a cyclical wind turbine supply environment that alternates between tight and loose supply constraints, changes in wind turbine technology, changes in availability of debt markets, and changes in electricity market structure. Our management team has had success in identifying and executing attractive acquisitions through all of these changing circumstances. For example, through our
12
Table of Contents
innovative approach to our business, we developed a financial structure to realize value for PTCs, implemented ground-breaking radar technology to protect bird and bat populations, became one of the first IPPs to capture value from a number of newly deregulated markets and found long-term debt solutions even when the debt markets were highly constrained.
As a fundamental principle, we seek to acquire projects that will contribute measurable improvements in our Adjusted EBITDA and our cash available for distribution and that will have a risk profile consistent with our current business objectives. In addition, we view projects as long-term partnerships with all stakeholders, and the benefits that we pledge to the community are fundamental to creating a positive environment for a project’s long-term success.
Our Relationship with Pattern Development
Our continuing relationship with Pattern Development provides us with access to a pipeline of acquisition opportunities. We believe Pattern Development’s ownership position in our company incentivizes Pattern Development to support the successful execution of our objectives and business strategy, including through the preparation of projects to the stage where they are construction-ready. Pattern Development has a dedicated development team of professionals with significant experience across the spectrum of power project development:
| • | site selection; |
| • | meteorological and market analysis; |
| • | land acquisition; |
| • | transmission rights; |
| • | power contract negotiation; |
| • | project financing; |
| • | construction management; |
| • | government relations; |
| • | community outreach; and |
| • | environmental permitting. |
Pattern Development also has teams devoted to engineering, legal and project financing that enable it to develop and construct projects through to commercial operations. We believe Pattern Development’s focus on project development combined with our project Purchase Rights will complement our acquisition strategy, which focuses on the identification and acquisition of operational and construction-ready power projects.
Our Proven Management Team
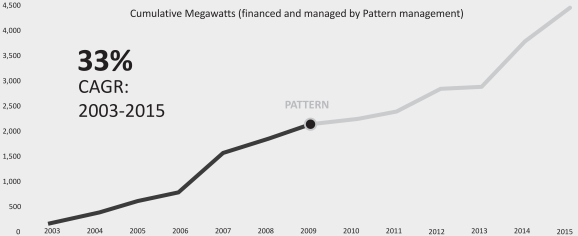
Our proven management team has extensive experience in all aspects of the independent power business, a demonstrated track record of success in power project investment management, operation and construction. Our management team and Pattern Development’s team include professionals who have a history of financial and technological innovation in the power industry as well as a proven track record in managing energy assets during both periods of growth and economic challenge. Before forming Pattern Development in 2009, our and Pattern Development’s management teams developed, financed, constructed or acquired and operated 2,100 MW of wind power projects, as well as transmission projects and other power projects. Since the formation of Pattern Development in 2009, the Pattern Development management team has acquired and developed the operational and in-construction wind power projects that comprise our owned capacity of 1,636 MW, including a 57% increase in owned capacity since the time of our initial public offering, and a 4,500 MW portfolio of
13
Table of Contents
development assets, which we have preferential rights to acquire as described above in Item 1 “Business—Our Relationship with Pattern Development.” Additionally, our and Pattern Development’s management teams have extensive acquisition, finance and commodity-hedging expertise, allowing us to react to opportunities, optimize our capital structure and manage risk. We believe our and Pattern Development’s management teams’ extensive experience and involvement in bringing domestic and international power and infrastructure projects, from the initial development stage through financing to on-going operations and maintenance, positions us to operate our projects efficiently and generate strong cash available for distribution.
Organization of Our Business
Our business is organized around our current projects. In the future, we expect that our business will include additional operating and construction-ready projects acquired from Pattern Development and other third parties. In addition to our executive officers, we employ 58 full-time staff in key functional areas associated with construction and engineering, operations and maintenance, and commercial management. We rely on some services to be performed by third parties, including Pattern Development, but have all the core functions required for overseeing constructing, operating and managing of our projects.
Operations and Maintenance
Our operations team’s objective is to maximize revenues from each of our projects rather than focus solely on technical plant performance metrics. In order for us to maximize our revenues, we seek to operate and maintain our equipment so that we can ensure our equipment is productive during times of optimal wind resources and power prices. Our approach to achieving efficient operations involves the following key strategic objectives:
| • | Safety. We believe that the safety of our workers, our contractors, our visitors and the community is paramount and takes precedence over all other aspects of operations. We demonstrate this through promoting a strong safety culture, implementing a formal safety management program, employing a full time in-house safety program manager and conducting annual site safety audits. |
| • | Equipment reliability and fleet management. We have selected high-quality equipment with a goal of having a concentration of equipment from top manufacturers. We employ the Siemens 2.3 MW turbine at ten of our twelve project sites, the Mitsubishi MWT95/2.4 at one site and the General Electric GE 1.85-87 at the twelfth site. With a combination of high-quality equipment and scale, we have structured our fleet such that we may: |
| • | expect high availability and long-term production from the equipment; |
14
Table of Contents
| • | develop operating expertise and experience, which can be shared among our operators; |
| • | obtain a high level of attention and focus from the manufacturer; and |
| • | maintain a shared spare parts inventory and common operating practices. |
| • | Long-term service and maintenance. Good operating performance begins with a long-term maintenance approach to the equipment. While approximately 82% of our operating turbine units remain under original or extended warranty, on-going maintenance and replacement of parts is essential to equipment longevity. All of our wind turbines are managed either under service or warranty agreements that ensure regular repair and replacement of parts. In some situations, we conduct competitive solicitations between the manufacturers as well as top-tier, third-party, independent service providers for conducting wind turbine service and maintenance. As a matter of operating practice, our turbine service program typically does not require shut down of the entire facility and is performed around the project’s production profile to minimize lost revenue. |
| • | Inspection. As our warranty contracts and service arrangements expire, we conduct extensive third-party end of warranty inspections to identify any potential equipment or service issues which can be remedied by the manufacturer pursuant to their contractual obligations under the warranty and ensure the projects start their post-warranty periods with reliably functioning equipment. |
| • | Staff training. We employ highly experienced personnel from a variety of power generation sectors. In addition, we bring into the organization a broad base of best industry practices. After hiring, we provide our operators with on-going training, in-house and from manufacturers and from third parties, to keep them current on latest industry practices and experiences. |
| • | Focus on our value-added capabilities. In order to maximize efficiencies, we concentrate our resources on our core operating areas. In particular, we believe it is critical to have on-site management personnel that are our employees and provide oversight of all site activities to ensure our safety and financial objectives have priority. We contract with third parties, often the turbine manufacturer, for on-going major maintenance of the turbines and similar specialized services such as repairs on our substations or transmission lines. |
| • | Maximize structural efficiencies. Our operating resources are allocated across three key areas, site operations, our 24/7 OCC and other central support services. |
| • | Site-operators. All of our projects have our employees as on-site operators, which allows for direct management of the projects and all contractors working on site. In addition, these individuals also strive for a high level of involvement in the communities we serve, including with respect to our power purchasers, the regulatory agencies and local communities. Each of our projects has the latest, state-of-the-art supervisory control and data acquisition systems that help us efficiently assess operating faults and plan preventative maintenance. |
| • | 24/7 Operations Control Center. Our OCC, located in Houston, Texas, focuses on monitoring and controlling each of our 882 wind turbines to prevent downtime, monitoring regional and local climate, tracking real time market prices and, for some of our projects, monitoring certain environmental activities. In addition, the OCC supports various other central activities such as safety, power marketing, and regulatory compliance, and it maintains constant communications with each of our site operators, which frees our site operators to concentrate on day-to-day equipment and safety activities. |
| • | Central Support Services. In addition to our OCC, our Houston office also hosts the balance of our operations organization which provides critical support to the operating projects. This team includes our operations management team and specialists in safety, environmental management, regulatory compliance, contract management, turbine specialists and asset administration. |
| • | Equipment improvements. We believe that our foundation of reliable and proven equipment allows us to make further operating improvements over time. For example, we have retrofitted the blades at our |
15
Table of Contents
| Hatchet Ridge and St. Joseph sites with vortex generators and dino tails to improve the shape of the power curve and thus the production at these sites. We are also in continuing discussions with the turbine manufacturers and other innovative suppliers regarding new technologies to identify additional promising solutions which will improve our projects’ performance and increase our electricity generation. |
Commercial Management
Our commercial management group is tasked with protecting the long-term value of our projects’ commercial arrangements. We have adopted a commercial strategy of managing our projects and other assets with an in-house commercial management group acting as “owners’ representatives.” The role of the commercial management group is to oversee contract management, environmental management, community relations, power marketing and finance and to closely monitor the performance of each project from an owner’s point of view in order to maximize financial performance and minimize risk. Although the commercial management group manages the day-to-day aspects of commercial management, functional and managerial expertise is often brought in to support key areas such as legal, finance and power marketing.
| • | Contract Management. With a group of seasoned managers, our commercial management group optimizes the commercial performance of our assets, services the project debt, manages project agreements and compliance with relevant laws, regulations and rules and has ultimate responsibility for the financial performance of each project. The team also manages our real estate obligations as well as our corporate insurance program, local government obligations, home office, remote facilities and mobile assets. Our commercial management group also facilitates a seamless transfer of responsibilities from the development team through construction to commercial operations in order to ensure all contractual and regulatory obligations are clearly captured and tracked in a formal compliance program. |
| • | Environmental Management and Community Relations. Adaptive environmental management is increasingly the standard by which power projects are managed. Our company has been a leader in adopting strategies to minimize environmental impacts, such as bird and bat fatalities. Each project has different circumstances so our environmental and community programs range from hiring of local personnel and historical preservation to use of advanced radar systems to monitor birds and bats and presence of on-site biologists to assist in species recognition and mitigation management. By proactively addressing the concerns of the regions, our environmental management and community relations programs seek to minimize additional costs and burdens from a potential increase in regulations or law suits. |
| • | Power Marketing. A crucial element of a successful project is assuring revenue from the sale of power and other environmental attributes. We manage the risk associated with fluctuations in electricity prices across our business by seeking to commit the electricity we generate under long-term, fixed-price power sale agreements and have secured 89% of our electricity sales under such arrangements. Our uncontracted power and renewable attributes are sold in the spot-market or under shorter term contracts to optimize revenue realization. We believe this management philosophy will result in a steady, predictable source of revenue for each of our projects. |
| • | Finance. Our projects are typically funded with construction financing during the construction phase which converts to long-term financing when the project commences commercial operations. Debt at each individual project is project financed, which means that, with very limited exceptions, the lenders have no or only limited recourse to other assets of the company other than the assets that are being financed. Debt for our projects is typically provided by commercial banks and institutional lenders that have the expertise to evaluate the risks associated with the construction and operation of a wind power project, including evaluation of the equipment technology, construction, operations and wind resources. These lenders provide construction financing for many sizable industrial and infrastructure projects. Since debt comprises a significant portion of total project capitalization, achievement of construction |
16
Table of Contents
| financing is a general indication that lenders and their independent consultants have carefully evaluated the project and find it viable for long-term financing. Given the complexity involved in financing large infrastructure assets, projects are often completed with a syndicate of lenders, and the credibility we have established among the financial community allows lenders to have confidence in the quality of our projects and enables us to secure competitive financing terms and other financing efficiencies for our projects. Over the years, our team has developed close relationships with many of the active renewable energy lenders. |
Engineering and Construction
The key leadership in our engineering and construction group resides within our company, which provides us with the in-house capabilities required to evaluate and manage a project’s design and construction processes. We will rely as necessary upon additional personnel from third-party sources and Pattern Development with respect to the construction of our projects. We also typically enter into fixed-price construction contracts for our projects’ with a guaranteed completion date to encourage completion on time and within budget.
Project design involves close and frequent communication with both field development personnel as well as the construction contractor in order to develop a project that conforms to local geotechnical and topographic characteristics while accommodating permitting and real estate restrictions. Pattern Development also strives to integrate experience obtained from operating projects in order to design projects with optimal maintenance and equipment-availability profiles. During construction, we are responsible for overseeing the construction contractor and turbine-vendor activities to ensure that the construction schedule is met. Collaboration among engineers and managers on each of our projects and our major equipment suppliers allows us to efficiently transition from construction to commercial operations and to identify and process technical improvements over the life-cycle of each project.
Our engineering and construction team is comprised of highly experienced project and construction managers and includes personnel who have supervised the design and on budget completion of construction of 30 wind power projects over the last twelve years. We set, and ensure compliance with, design specifications and take an active role in supervising field work, safety compliance, quality control and adherence to project schedules. Each project has a dedicated resident construction manager, and other engineering and construction functions are centralized, which allows the group to efficiently scale its resources to support our developing global platform and growth strategy.
Investing
We are organized in a manner that will allow us to independently and comprehensively evaluate investments in new projects. Key members of our management team, including Messrs. Garland, Armistead, Elkort, Lyon, and Pedersen, have spent extensive periods of their careers in the investment advisory, principal investment and finance fields.
As a major part of our growth strategy, we intend to seek to acquire projects that would contribute measurable amounts to our Adjusted EBITDA and our cash available for distribution. Our approach to project selection is focused on projects (i) with strong economics that will support our long-term financial goals, as determined by intensive analysis and in-depth due diligence, (ii) in which we can add value and which have characteristics that are strategically compatible with our other projects and overall business, and (iii) which meet our core values, including our commitments to environmental stewardship and being a good neighbor in the communities in which our projects are located. To achieve proper investment management, we have implemented processes to ensure rigorous analysis and proper internal approval controls, including preparing formal investment approval documentation, maintaining strict limits on delegation of authority for making capital commitments, and vetting our assumptions with independent technical experts and advisors. In addition, we believe that alignment and independence is critical to successful investing. As a result, we require that
17
Table of Contents
our executive officers maintain a minimum ownership interest in our company. Our Board of Directors has formed a conflicts committee to review specific matters that the Board of Directors believes may involve conflicts of interest, primarily transactions with Pattern Development or its affiliates to determine whether such transactions are fair to and in the best interest of us and our stockholders.
We view projects as long-term partnerships with all the stakeholders, and the benefits that we pledge to the community are fundamental to creating a positive environment for a project’s long-term success.
Competition
We compete with other wind power, infrastructure funds and renewable energy companies, as well as conventional power companies, to acquire profitable construction-ready and operating projects. In addition, competitive conditions may be substantially affected by various forms of energy legislation and regulation considered from time to time by federal, state, provincial and local legislatures and administrative agencies. Such laws and regulations may substantially increase the costs of acquiring, constructing and operating projects, and some of our competitors may be better able to adapt to and operate under such laws and regulations.
Suppliers
Operating equipment for wind power projects primarily consists of turbines. Turbine costs represent the majority of our wind power project investment costs. There are a limited number of turbine suppliers and, although demand for turbines in the past has generally been high relative to manufacturing capacity, we believe that current turbine manufacturing capacity is adequate. Our turbine supply strategy is largely based on maintaining strong relationships with leading turbine suppliers to secure our supply needs.
| Project |
Supplier | Number of Turbines |
Turbine Type | |||
| Operating Projects |
||||||
| Gulf Wind |
Mitsubishi | 118 | MWT 95/2.4 | |||
| Hatchet Ridge |
Siemens | 44 | SWT-2.3-93 | |||
| St. Joseph |
Siemens | 60 | SWT-2.3-101 | |||
| Spring Valley |
Siemens | 66 | SWT-2.3-101 | |||
| Santa Isabel |
Siemens | 44 | SWT-2.3-108 | |||
| Ocotillo |
Siemens | 112 | SWT-2.3-108 | |||
| South Kent |
Siemens | 124 | SWT-2.3-101 | |||
| El Arrayán |
Siemens | 50 | SWT-2.3-101 | |||
| Panhandle 1 |
General Electric | 118 | 1.85 - 87_60Hz_80m | |||
| Panhandle 2 |
Siemens | 79 | SWT-2.3-108 | |||
| Grand |
Siemens | 67 | SWT-2.3-101 | |||
| Construction Projects |
||||||
| Logan’s Gap |
Siemens | 87 | SWT-2.3-108 |
To date, our projects listed above have purchased or agreed to purchase 733 turbines from Siemens. Siemens has been active in the wind power industry since 1980. It has a reputation for conservative engineering, robust design and high reliability. The SWT-2.3MW turbine technology has a significant and well established track record. First installed in February 2005, Siemens has installed 6,971 SWT-2.3MW turbines worldwide, with 3,429 in the United States, as of the most current Siemens reference list dated September 30, 2014. Siemens data indicates that fleet availability for the 2.3MW turbine class exceeds 97%, and our Siemens fleet availability was 97.4% in 2014. Apart from Siemens we have relationships with other reputable turbine manufacturers such as General Electric and Mitsubishi. Some of our future projects may utilize turbines from these and other manufacturers.
Our Ocotillo and Santa Isabel (Siemens) and Gulf Wind (MHI) projects have experienced certain blade failures in the last two years. We believe the Siemens blade failures have been fully addressed. Since commercial
18
Table of Contents
operation of Gulf Wind, four blades have failed. We have been working with MHI to complete a root cause analysis, testing of the 354 blades at the project, and development of a protocol for determining which blades might have sufficient deficiencies that could pose a threat to long-term reliable operation. As of February 15, 2015, MHI has replaced, or is scheduled to replace, 55 blades under the equipment warranty. While the testing and replacement of blades has adversely affected turbine availability at Gulf Wind, MHI has compensated us for the turbine down time under our equipment warranty. MHI has agreed to extend the equipment warranty until November 2015 while we continue discussions on addressing a longer term arrangement to address these potential deficiencies, although we can give no assurance that we will be able to reach any longer term agreement with MHI.
Other important suppliers include engineering and construction companies, such as M. A. Mortenson Company, RES-Americas and Blattner Energy, Inc., with whom we contract to perform civil engineering, electrical work and other infrastructure construction for our projects. We believe there are a sufficient number of capable engineering and construction companies available in our markets to meet our needs.
In March 2014, certain of the Company’s operating projects entered into long-term service and maintenance agreements with the turbine supplier to provide turbine maintenance and incremental improvements for varying periods over the next twelve years. Under the terms of each of these agreements, the turbine supplier will provide full turbine warranty, including parts and performance, and maintenance services and certain equipment modifications at agreed project sites, which are expected to provide incremental increases in the net capacity factors of the affected projects.
In addition to providing greater certainty to our future equipment maintenance costs, we believe that extending the warranty coverage under these long-term service agreements also provides greater protection against potential warranty issues that could arise later in the equipment life.
Customers
We sell our electricity and environmental attributes, including RECs, primarily to local utilities under long-term, fixed-price PPAs or, in limited instances, local liquid ISO markets. For the year ended December 31, 2014, San Diego Gas & Electric (“SDG&E”), Manitoba Hydro, Electric Reliability Council of Texas (“ERCOT”), NV Energy, Inc. (“NV Energy”) and Pacific Gas and Electric Company (“PG&E”) accounted for 22%, 14%, 14%, 11%, and 11%, respectively, of our total revenue.
Hedging Activity
To the extent that PPAs are not available in a given market, but market prices allow for acceptable project economics, we will enter into hedging agreements to obtain a fixed price for the energy output of our projects. We enter into these hedging agreements to reduce our exposure to potential volatility in spot-market electricity prices. We typically seek to hedge volumes that are expected to be exceeded 99.0% of the time. Those hedging agreements are executed for a monthly or hourly production profile that matches the forecasted production profile of the project. We will also consider hedging agreements beyond the initial volume up to an amount that is expected to be exceeded over half the time. Those hedging agreements are executed, on an overnight basis, in order to reduce volatility of our cash flows.
We also enter into interest rate hedging agreements to convert floating-rate debt to fixed-rate debt for some of our projects. Additionally, we occasionally enter into currency exchange rate hedging agreements to manage construction costs that may be payable or receivable in a foreign currency and do not have a same currency offset.
19
Table of Contents
In 2015, we expect to initiate a program of exchange rate management due to the substantial portion of our electricity sales that are Canadian dollar denominated. For additional information regarding our hedging activities, please read Item 7A “Quantitative and Qualitative Disclosure about Market Risk.”
Structure of Our Company
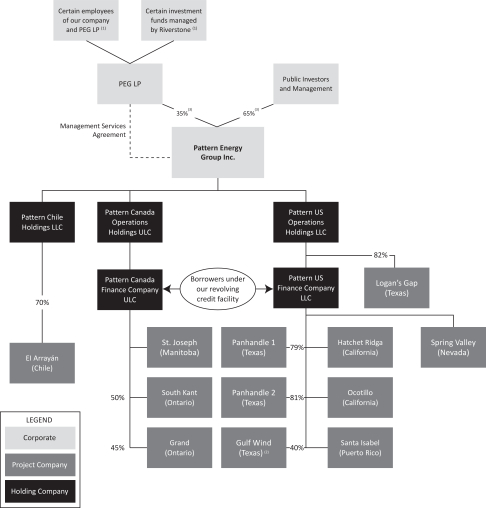
| (1) | These funds and these employees hold indirect interests in Pattern Development. |
| (2) | Pattern Development holds an interest of approximately 27% in Gulf Wind, representing Pattern Development-owned capacity of 76 MW. |
| (3) | Subsequent to our issuance of shares and the sale of the shares held by Pattern Development on February 9, 2015, Pattern Development’s ownership interest in us was reduced to approximately 25%, while public and management ownership increased to approximately 75%. |
Employees
As of December 31, 2014, we had 69 full-time employees of whom 21 are based in our corporate headquarters, 25 are based at our project sites and 23 are based at our other offices, including our OCC, in Houston, Texas. None of our employees are represented by a labor union or covered by any collective bargaining agreement. We consider our employee relations to be good.
20
Table of Contents
Insurance
We maintain insurance on terms generally carried by companies engaged in similar business and owning similar properties in the United States, Canada and Chile and whose projects are financed in a manner similar to our projects. As is common in the wind industry, however, we do not insure fully against all the risks associated with our business either because insurance is not available or because the premiums for some coverage are prohibitive. For example, we do not maintain war risk insurance. We maintain varying levels of insurance for the development, construction and operation phases of our projects, including property insurance, which, depending on the location of each project, may include catastrophic windstorm, flood and earthquake coverage (CAT coverage); transportation insurance; advance loss of profits insurance; business interruption insurance; general liability and umbrella liability insurance; time element pollution liability insurance; auto liability insurance; workers’ compensation and employer’s liability insurance; and (except in Chile) title insurance. The “all risk” property insurance coverage is currently maintained in amounts based on the full replacement value of our projects (subject to certain sub-limits for windstorm, flood and earthquake risks) and the business interruption insurance generally provides 15 months of coverage in amounts that vary from project to project based on the revenue generation potential of each project. All types of coverage are subject to applicable deductibles. We generally do not maintain insurance for certain environmental risks, such as environmental contamination.
Industry
Wind power has been one of the fastest growing sources of electricity generation in North America and globally over the past decade. According to the Global Wind Energy Council, or “GWEC,” from 2001 through 2013, total net electricity generation from wind power in the United States and Canada grew at a CAGR of 27% and 37%, respectively. The growth in the industry is largely attributable to renewable energy’s increasing cost competitiveness with other power generation technologies, the advantages of wind power over other renewable energy sources and growing public support for renewable energy driven by concerns regarding security of energy supply and the environment. As global demand for electricity generation from wind power has increased, technology enhancements—supported by U.S. government incentives—have reduced the cost of wind power by more than 80% over the last twenty years, according to the American Wind Energy Association, or “AWEA.”
The United States is the largest producer of wind power in the world. According to the U.S. Department of Energy, or “DOE,” wind power was the second largest source of new electricity generating capacity in the United States after natural gas for six of the seven years between 2005 and 2011. According to AWEA, wind power became the leading source of new electricity generating capacity in the United States for the first time in 2012. In addition, according to AWEA, the American wind energy industry installed 4,854 MW in 2014 and the U.S. now has an installed wind capacity of 65,879 MW with over 12,700 MW of wind currently under construction. The success of wind power in the United States is evidenced by over $120 billion in investments to date, according to AWEA.
Renewable energy sources in the United States have benefited from various federal and state governmental incentives, such as production tax credits and investment tax credits. Production tax credits and investment tax credits for wind energy expired on January 1, 2014, unless construction began before January 1, 2015 and further extensions are under consideration for renewal in 2015. Whether the credits will be extended in the future, and the form of any such extension, is uncertain.
The Canadian wind power industry has also experienced dramatic growth in recent years. In 2014, Canada experienced 1,416 MW of new installed wind power generating capacity. This investment resulted in wind power generating capacity in Canada reaching approximately 9,219 MW as of December 2014. According to the Canadian Wind Energy Association, or “CanWEA,” new installed wind power generating capacity is expected to average 1,500 MW annually over the next four years. Ontario, one of our markets, is the national leader in installed capacity, with approximately 2.4 gigawatts, or “GW,” of wind power generating capacity, although recent changes to the Ontario government FIT regime may make future projects less attractive and PPAs more difficult to obtain. CanWEA forecasts total wind power generating capacity in Canada to exceed 12 GW by 2016.
21
Table of Contents
Chile, also one of our markets, has an abundant wind resource, which GWEC estimates could provide the potential for more than 40 GW of generating capacity. In the first nine months of 2014, Chile installed 382MW of wind capacity, tripling 2013’s 130MW of new build, according to the state-run Renewable Energy Centre (CER). That brought the country’s total wind power capacity to 737MW, more than double the 335MW cumulative figure at the end of 2013.
Following the nuclear meltdown at the Fukushima Daiichi plant in 2011, the Japanese government has placed a greater emphasis on the development of renewable resources in order to reduce its reliance on nuclear power, having released its Innovative Strategy for Energy and the Environment in September 2012. By 2030, the plan calls for renewable power generation to triple compared to 2010, reaching about 30% of total generation. In 2012, Japan also introduced a feed-in-tariff program that offers fixed-term, fixed-price contracts (up to 20 years) to renewable power projects.
Mexico’s Congress has enacted sweeping reforms to its electric generation industry over the past year, opening new opportunities for private investment in generation and creating an obligation to obtain at least 35% of its generation from clean sources by 2024. High prices and strong load growth were key factors in encouraging the reforms, and Mexico’s SENER (Secretaria de Energia) has published rules for interconnection and the new market regime. Mexico has substantial wind and solar resources, and thus far has only developed a few thousand megawatts of wind generation from the pre-reform system. It is anticipated that several thousand megawatts of wind generation will be developed over the next few years.
Given supply diversity requirements, falling equipment costs, the inherent stability of the cost of wind power as an energy resource and an active market for the purchase and sale of power projects, we believe that our markets present a substantial opportunity for growth. We require a relatively small share of a very large market to meet our growth objectives and we believe we will achieve growth through the acquisition of operational and construction-ready projects from Pattern Development and other third parties.
While we currently operate solely in wind power markets, we expect to continue to evaluate other types of independent power projects for possible acquisition, including renewable energy projects other than wind power projects and non-renewable energy projects. In September 2014, we announced the addition of our first solar project, the 104MW Conejo Solar photovoltaic power project in Chile, to our list of Identified ROFO Projects.
Regulatory Matters
Environmental Regulation
We are subject to various environmental, health and safety laws and regulations in each of the jurisdictions in which we operate. These laws and regulations require us to obtain and maintain permits and approvals, undergo environmental review processes and implement environmental, health and safety programs and procedures to monitor and control risks associated with the siting, construction, operation and decommissioning of wind power projects, all of which involve a significant investment of time and can be expensive.
We incur costs in the ordinary course of business to comply with these laws, regulations and permit requirements. We do not anticipate material unplanned capital expenditures for environmental controls for our operating projects in the next several years. However, these laws and regulations frequently change and often become more stringent, or subject to more stringent interpretation or enforcement. Future changes could require us to incur materially higher costs.
Failure to comply with these laws, regulations and permit requirements may result in administrative, civil and criminal penalties, imposition of investigatory, cleanup and site restoration costs and liens, denial or revocation of permits or other authorizations and issuance of injunctions to limit or cease operations. In addition, claims for damages to persons or property or for injunctive relief have been brought and may in the future result from environmental and other impacts of our activities.
22
Table of Contents
Environmental Permitting—United States
We are required to obtain from U.S. federal, state and local governmental authorities a range of environmental permits and other approvals to build and operate our projects, including, but not limited to, those described below. In addition to being subject to these regulatory requirements, we could experience and have experienced significant opposition from third parties when we initially apply for permits or when there is an appeal proceeding after permits are issued. The delay or denial of a permit or the imposition of conditions that are costly or difficult to comply with can impair or even prevent the development of a project or can increase the cost so substantially that the project is no longer attractive to us.
Federal Clean Water Act
Frequently, our U.S. projects are located near wetlands, and we are required to obtain permits under the U.S. Clean Water Act from the U.S. Army Corps of Engineers, or the “Army Corps,” for the discharge of dredged or fill material into waters of the United States, including wetlands and streams. The Army Corps may also require us to mitigate any loss of wetland functions and values that accompanies our activities. In addition, we are required to obtain permits under the Clean Water Act for water discharges, such as storm water runoff associated with construction activities, and to follow a variety of best management practices to ensure that water quality is protected and impacts are minimized. Certain activities, such as installing a power line across a navigable river, may also require permits under the Rivers and Harbors Appropriation Act of 1899.
Federal Bureau of Land Management Permits
As some of our U.S. projects are located on lands administered by the Bureau of Land Management, we are required to obtain rights-of-way from the Bureau of Land Management. The Bureau of Land Management encourages the development of wind power within acceptable areas, consistent with Environmental Policy Act of 2005 and the Bureau of Land Management’s energy and mineral policy. Obtaining a grant requires that the proposed project prepare a plan of development and demonstrate that it will adhere to the Bureau of Land Management’s best management practices for wind power development, including meeting criteria for protecting biological, archeological and cultural resources.
National Environmental Policy Act and Endangered Species Requirements
Our U.S. projects may also be subject to environmental review under the U.S. National Environmental Policy Act, or “NEPA,” which requires federal agencies to evaluate the environmental impact of all “major federal actions” significantly affecting the quality of the human environment. The granting of a land lease, a federal permit or similar authorization for a major development project, or the interconnection of a significant private project into a federal project generally is considered a “major federal action” that requires review under NEPA. As part of the NEPA review, the federal agency considers a broad array of environmental impacts, including impacts on air quality, water quality, wildlife, historical and archeological resources, geology, socioeconomics and aesthetics and alternatives to the project. The NEPA review process, especially if it involves preparing a full Environmental Impact Statement, can be time-consuming and expensive. A federal agency may decide to deny a permit based on its environmental review under NEPA, though in most cases a project would be redesigned to reduce impacts or agree to provide some form of mitigation to offset impacts before a denial is issued.
Federal agencies granting permits for our U.S. projects also consider the impact on endangered and threatened species and their habitat under the U.S. Endangered Species Act, which prohibits and imposes stringent penalties for harming endangered or threatened species and their habitats. Our projects also need to consider the Migratory Bird Treaty Act and the Bald and Golden Eagle Protection Act, which protect migratory birds and bald and golden eagles and are administered by the U.S. Fish and Wildlife Service. Most states also have similar laws. Because the operation of wind turbines may result in injury or fatalities to birds and bats, federal and state agencies often recommend or require that we conduct avian and bat risk assessments prior to issuing permits for our projects. They may also require ongoing monitoring or mitigation activities as a condition
23
Table of Contents
to approving a project. In addition, U.S. federal agencies consider a project’s impact on historical or archeological resources under the U.S. National Historic Preservation Act and may require us to conduct archeological surveys or take other measures to protect these resources. Among other things, the National Historic Preservation Act requires federal agencies to evaluate the impact of all federally funded or permitted projects on historic properties (buildings, archaeological sites, etc.) through a process known as “Section 106 Review”.
Other State and Local Programs
In addition to federal requirements, our U.S. projects, and any future U.S. projects we may acquire, are subject to a variety of state environmental review and permitting requirements. Many states where our projects are located, or may in the future be located, have laws that require state agencies to evaluate a broad array of environmental impacts before granting state permits. The state environmental review process often resembles the federal NEPA process and may be more stringent than the federal review. Our projects also often require state law based permits in addition to federal permits. State agencies evaluate similar issues as federal agencies, including the project’s impact on wildlife, historic sites, aesthetics, wetlands and water resources, agricultural operations and scenic areas. States may impose different or additional monitoring or mitigation requirements than federal agencies. Additional approvals may be required for specific aspects of a project, such as stream or wetland crossings, impacts to designated significant wildlife habitats, storm water management and highway department authorizations for oversize loads and state road closings during construction. Permitting requirements related to transmission lines may be required in certain cases.
Our projects also are subject to local environmental and regulatory requirements, including county and municipal land use, zoning, building and transportation requirements. Permitting at the local municipal or county level often consists of obtaining a special use or conditional use permit under a land use ordinance or code, or, in some cases, rezoning in connection with the project. Obtaining a permit usually depends on our demonstrating that the project will conform to development standards specified under the ordinance so that the project is compatible with existing land uses and protects natural and human environments. Local or state regulatory agencies may require modeling and measurement of permissible sound levels in connection with the permitting and approval of our projects. Local or state agencies also may require us to develop decommissioning plans for dismantling the project at the end of its functional life and establish financial assurances for carrying out the decommissioning plan.
Environmental Permitting—Canada
We are required to obtain from Canadian federal, provincial and local governmental authorities a range of environmental permits and other approvals to build and operate our Canadian projects, including, but not limited to, those described below. In addition to being subject to these regulatory requirements, we could experience and have experienced significant opposition from third parties, including, but not limited to, environmental non-governmental organizations, neighborhood groups, municipalities and First Nations when the permits were initially applied for or when there is an appeal proceeding after permits are issued. The delay or denial of a permit or the imposition of conditions that are costly or difficult to comply with can impair or even prevent the development of a project or can increase the cost so substantially that the project is no longer attractive to us.
Ontario Renewable Energy Approvals
Our projects in Ontario are subject to Ontario’s Environmental Protection Act, which requires proponents of significant renewable energy projects to obtain a Renewable Energy Approval (“REA”). The REA application requires a variety of studies on environmental, archeological and heritage issues. Significant public consultation, as well as consultation with indigenous communities, is also required. Before issuing a REA, the Ontario Ministry of the Environment evaluates a broad range of potential impacts, including on wildlife, wetlands and water resources, communities, scenic areas, species and heritage resources, as well as impacts on people and
24
Table of Contents
communities. This review can be time consuming and expensive, and an approval can be rejected or approved with conditions that are costly or difficult to comply with. Renewable energy approvals are also subject to appeal by third parties and can result and have resulted in lengthy appeal tribunal hearings.
Manitoba Environment Act
The Manitoba Environment Act requires proponents of significant projects to submit a proposal with the Manitoba Conservation Environmental Assessment & Licensing Branch, and to comply with Manitoba’s environmental assessment process under the Environment Act. This process will consider a similar range of impacts on the environment, the heritage and scenic values of an area and on people, communities and wildlife as the Ontario process, and brings with it similar risks.
Endangered Species Legislation
Our Canadian renewable energy projects may be subject to endangered species legislation, either federally or provincially, which prohibits and imposes stringent penalties for harming endangered or threatened species and their habitats. Our projects may also be subject to the Migratory Birds Convention Act, which protects the habitat of migratory species, and which may also trigger federal “Species at Risk” requirements. Because the operation of wind turbines may result in injury or fatalities to birds and bats, avian and bat risk assessments are generally required both prior to permits being issued for projects and after commercial operations. In Ontario, if any of the affected species are listed as endangered or threatened, permits under the Endangered Species Act may also be required.
Other Approvals
Our Canadian projects, and any future projects we may acquire, are subject to a variety of other federal, provincial and municipal permitting and zoning requirements. Most provinces where our projects are located or may be located have laws that require provincial agencies to evaluate a broad array of environmental impacts before granting permits and approvals. These agencies evaluate similar issues as the permitting regimes above, including impact on wildlife, historic sites, esthetics, wetlands and water resources, scenic areas, endangered and threatened species and communities. In addition, federal government approvals dealing with, among other things, aeronautics, fisheries, navigation or species protection may be required and could in some cases trigger additional environmental assessment requirements. Additional requirements related to the permitting of transmission lands may be applicable in some cases. Our projects are also subject to certain municipal requirements, including land use and zoning requirements except where superseded by Ontario’s Green Energy and Green Economy Act, 2009, as well as requirements for building permits and other municipal approvals that can be difficult or costly to comply with and impair or prevent the development of a project.
Environmental Permitting – Chile
Ministry of Environment, Environmental Assessment Service and Superintendency of Environment
The Ministry of the Environment, the Environmental Assessment Service and the Superintendency of Environment are primarily responsible for environmental issues in Chile, including those affecting the wind industry. The Ministry of the Environment is responsible for the formulation and implementation of environmental policies, plans and programs, as well as for the protection and conservation of biological diversity and renewable natural resources and water resources and for promoting sustainable development and the integrity of environmental policy and regulations. The Environmental Assessment Service is responsible for assessing whether projects that might have an adverse effect on the environment comply with Chilean environmental laws and regulations. The Environmental Assessment Service coordinates the environmental impact assessment process, whose final qualifications are granted by the competent regional Environmental Assessment Commission. The Superintendency of the Environment’s primary responsibilities are monitoring compliance with the terms of the corresponding environmental licenses, as well as monitoring compliance with government
25
Table of Contents
plans to prevent environmental damage or to clean or restore contaminated geographical areas. The Superintendency of the Environment has the power to suspend, terminate, or impose fines, for activities that it deems to have an adverse environmental impact, even if such activities comply with a previously approved environmental impact assessment.
The Environmental Courts, and Health and Safety
The Environmental Courts are principally responsible for hearing appeals of determinations made by the Superintendency of the Environment and for adjudicating claims for environmental damage.
Companies in the wind energy sector, like all Chilean companies, must comply with the general principles concerning employee health and safety contained in the Chilean Sanitary Code, Labor Code and other labor and health regulations. The Chilean Health Ministry and the Department of Labor are responsible for the enforcement of those standards, with the authority to impose fines among other sanctions. In addition, the Superintendence of Electricity and Fuels has the responsibility to monitor compliance and also the authority to impose fines and stop operations of violators.
Management, Disposal and Remediation of Hazardous Substances
We own and lease real property and may be subject to requirements regarding the storage, use and disposal of petroleum products and hazardous substances, including spill prevention, control and counter-measure requirements. If our owned or leased properties are contaminated, whether during or prior to our ownership or operation, we could be responsible for the costs of investigation and cleanup and for any related liabilities, including claims for damage to property, persons or natural resources. That responsibility may arise even if we were not at fault and did not cause or were not aware of the contamination. In addition, waste we generate is at times sent to third-party disposal facilities. If those facilities become contaminated, we and any other persons who arranged for the disposal or treatment of hazardous substances at those sites may be jointly and severally responsible for the costs of investigation and remediation, as well as for any claims for damage to third parties, their property or natural resources.
Intellectual Property
In September 2014, we exercised our right to acquire the name “Pattern” and the Pattern logo from Pattern Development, and granted to Pattern Development a license to use the name “Pattern” and the Pattern logo. We have registrations and pending applications for registration of marks in the United States, Canada and Chile. We do not own any intellectual property material to the conduct of our business. We also own various information that includes, without limitation, financial, business, scientific, technical, economic, and engineering information, formulas, designs, methods, techniques, processes, and procedures, all of which is protected confidential and proprietary information.
| Item 1A. | Risk Factors. |
RISK FACTORS
You should carefully consider the following risks, together with other information provided to you in this Form 10-K. If any of the following risks were to occur, our business, financial condition, results of operations and liquidity could be materially adversely affected. In that case, we might have to decrease, or may not be able to pay, dividends on our Class A shares, the trading price of our Class A shares could decline and you could lose all or part of your investment. The risks described below are not the only risks facing our company. Risks and uncertainties not currently known to us or that we currently deem to be immaterial also may materially adversely affect our business, financial condition and results of operations and liquidity.
26
Table of Contents
Risks Related to Our Projects
Electricity generated from wind energy depends heavily on suitable wind conditions and wind turbines being available for operation. If wind conditions are unfavorable or below our expectations, or our wind turbines are not available for operation, our projects’ electricity generation and the revenue generated from our projects may be substantially below our expectations.
The revenue generated by our projects is principally dependent on the number of MWh generated in a given time period. The quantity of electricity generation from a wind power project depends heavily on wind conditions, which are variable. Variability in wind conditions can cause our project revenues to vary significantly from period to period. We base our decisions about which projects to acquire as well as our electricity generation estimates, in part, on the findings of long-term wind and other meteorological studies conducted on the project site and its region, which measure the wind’s speed, prevailing direction and seasonal variations. Projections of wind resources also rely upon assumptions about turbine placement, wind turbine power curves, interference between turbines and the effects of vegetation, land use and terrain, which involve uncertainty and require us to exercise considerable judgment. We may make incorrect assumptions in conducting these wind and other meteorological studies. Any of these factors could cause our projects to generate less electricity than we expect and reduce our revenue from electricity sales, which could have a material adverse effect on our business, financial condition and results of operations.
Even if an operating project’s historical wind resources are consistent with our long-term estimates, the unpredictable nature of wind conditions often results in daily, monthly and yearly material deviations from the average wind resources we may anticipate during a particular period. If the wind resources at a project are materially below the average levels we expect for a particular period, our revenue from electricity sales from the project could correspondingly be less than expected. A diversified portfolio of projects located in different geographical areas tends to reduce the magnitude of the deviation, but material deviations may still occur. Our cash available for distribution is most directly affected by the volume of electricity generated and sold by our projects. However, for a static portfolio of projects, our consolidated expenses, including operating expenses and interest payments on indebtedness, have less variability than the volume of electricity generated and sold. Accordingly, decreases in the volume of electricity generated and sold by our projects typically result in a proportionately greater decrease in our cash available for distribution. See Item 7 “Management’s Discussion and Analysis of Financial Condition and Results of Operation—Factors that Significantly Affect our Business—Factors Affecting our Operational Results-Electricity Sales and Energy Derivative Settlements of Our Operating Project.”
A reduction in electricity generation and sales, whether due to the inaccuracy of wind energy assessments or otherwise, could lead to a number of material adverse consequences for our business, including:
| • | our projects’ hedging arrangements being ineffective or more costly; |
| • | our projects’ failure to produce sufficient electricity to meet our commitments under our PPAs, hedge arrangements or contracts for sale of RECs, which could result in our having to purchase electricity or RECs on the open market to cover our obligations or result in the payment of damages or the termination of a PPA; and |
| • | our projects not generating sufficient cash flow to make payments of principal and interest as they become due on project-related debt, or distributing sufficient cash flow to pay dividends to holders of our Class A shares. |
We may be unable to complete our current and any future construction projects on time, and our construction costs could increase to levels that make a project too expensive to complete or make the return on our investment in that project less than expected.
There may be delays or unexpected developments in completing our current and any future construction projects, which could cause the construction costs of these projects to exceed our expectations. Most of our construction projects are constructed under fixed-price and fixed-schedule contracts with construction and
27
Table of Contents
equipment suppliers. However, these contracts provide for limitations on the liability of these contractors to pay us liquidated damages for cost overruns and construction delays. We may suffer significant construction delays or construction cost increases as a result of underperformance of these contractors and equipment suppliers, as well as other suppliers, to our projects. For example, while we maintained a Q4 2014 commercial operation date, during the second half of 2014 we received claims for significant cost increases and schedule relief in the construction of Grand. Samsung C&T Canada Ltd. (a subsidiary of Samsung C&T Corporation), the project construction provider, has in correspondence asserted claims against Grand and the third party owner of an adjacent 100 MW solar project that jointly owns transmission facilities with Grand that were constructed by the project construction provider, totaling approximately C$56.3 million. Grand has, in turn, in correspondence asserted claims against the project construction provider totaling approximately C$53.1 million. Legal action has not yet been commenced by any party against the other in connection with the dispute, and the parties are seeking to resolve the dispute without arbitration. While we continue to be in ongoing discussions with the project construction provider with whom we had a fixed-priced and fixed-schedule contract regarding the validity of their claims and believe it may be possible to negotiate a settlement to the dispute where Grand’s remaining budgeted project contingencies could cover some or all of the settlement amount, no assurances can be given that we can reach a settlement, such settlement amount would be covered entirely by the remaining budgeted project contingencies or otherwise be favorable, arbitration or legal action will not be commenced, or we will not have to bear increased costs associated with this dispute which could make the return on our investment in the project less than expected. To the extent any settlement amount would not be covered entirely by the remaining budgeted project contingencies at Grand, we would be responsible for 45% of the uncovered amount, representing our proportional ownership interest in the project. Grand does not believe it is possible at this point to estimate the amount of any damages to be paid or received in connection with the dispute, and no reserve has been recorded in Grand’s financial statements. One of our partners in Grand is a related party to the project construction provider.
Additionally, various other factors could contribute to construction-cost overruns and construction delays, including:
| • | inclement weather conditions; |
| • | failure to receive turbines or other critical components and equipment necessary to maintain the operating capacity of our projects, in a timely manner or at all; |
| • | failure to complete interconnection to transmission networks, which relies on several third parties, including interconnection facilities provided by local utilities; |
| • | failure to maintain all necessary rights to land access and use; |
| • | failure to receive quality and timely performance of third-party services; |
| • | failure to maintain environmental and other permits or approvals; |
| • | failure to meet domestic content requirements; |
| • | appeals of environmental and other permits or approvals that we hold; |
| • | lawful or unlawful protests by or work stoppages resulting from local community objections to a project; |
| • | shortage of skilled labor on the part of our contractors; |
| • | adverse environmental and geological conditions; and |
| • | force majeure or other events out of our control. |
Any of these factors could give rise to construction delays and construction costs in excess of our expectations. These circumstances could prevent our construction projects from commencing operations or from meeting our original expectations about how much electricity they will generate or the returns they will achieve. In addition, substantial delays could cause defaults under our financing agreements or under PPAs that require completion of project construction by a certain date at specified performance levels or could result in the loss or
28
Table of Contents
reduction of expected tax benefits. Our inability to transition our construction projects into financially successful operating projects would have a material adverse effect on our business, financial condition and results of operations and our ability to pay dividends.
Our projects rely on a limited number of key power purchasers. The power purchaser for our Santa Isabel project has been downgraded.
There are a limited number of possible power purchasers for electricity and RECs produced in a given geographic location. Because our projects depend on sales of electricity and RECs to certain key power purchasers, our projects are highly dependent upon these power purchasers fulfilling their contractual obligations under their respective PPAs. Our projects’ power purchasers may not comply with their contractual payment obligations or may become subject to insolvency or liquidation proceedings during the term of the relevant contracts and, in such event, we may not be able to find another purchaser on similar or favorable terms or at all. In addition, we are exposed to the creditworthiness of our power purchasers and there is no guarantee that any power purchaser will maintain its credit rating, if any. To the extent that any of our projects’ power purchasers are, or are controlled by, governmental entities, our projects may also be subject to legislative or other political action that impairs their contractual performance. Failure by any key power purchasers to meet its contractual commitments or the insolvency or liquidation of one or more of our power purchasers could have a material adverse effect on our business, financial condition and results of operations.
For example, our 101 MW Santa Isabel project located on the south coast of Puerto Rico sells 100% of its electricity generation including environmental attributes to PREPA under a 20-year PPA. The credit ratings of PREPA and the Commonwealth of Puerto Rico were downgraded multiple times in 2014. As of February 26, 2015, the credit rating of PREPA was Caa3, CCC, and CC by each of Moody’s, Standard & Poor’s, and Fitch, respectively, which ratings are all below investment grade. In addition, in June 2014, Puerto Rico enacted legislation purportedly to establish a regime for public corporations in Puerto Rico like PREPA to restructure their debt and other obligations. The validity of such legislation was challenged in U.S. federal court, and in February 2015, the court declared such legislation unconstitutional. The Secretary of Justice of Puerto Rico indicated the government will consider its next steps after reviewing the court’s decision. PREPA has entered into a forbearance agreement until March 2015 with certain of its lenders, and as a part of that agreement has hired a chief restructuring officer to produce a restructuring plan. While as of March 2, 2015, PREPA is current with respect to payments due under the PPA, a failure by PREPA to perform its payment obligations under the PPA, or a restructuring of its obligations under judicially determined valid legislation, may affect its obligations under the PPA which could have a material adverse effect on our business, financial condition and results of operations.
A prolonged environment of low prices for natural gas, other conventional fuel sources, or competing renewable resources could have a material adverse effect on our long-term business prospects, financial condition and results of operations.
Historically low prices for traditional fossil fuels, particularly natural gas, could cause demand for wind power to decrease and adversely affect both the price available to us under power sale agreements that we may enter into in the future and the price of the electricity we generate for sale on a spot-market basis. Approximately 11% of the electricity generated from our projects will be subject to spot-market pricing through at least April 2019. Low spot-market power prices, if combined with other factors, could have a material adverse effect on our results of operations and cash available for distribution. Additionally, cheaper conventional fuel sources or competing renewable resources could also have a negative impact on the power prices we are able to negotiate upon the expiration of our current power sale agreements or upon entering into a power sale agreement for a subsequently acquired power project. As a result, the price of our power or RECs subject to the open market could be materially and adversely affected, which could, in turn, have a material adverse effect on our results of operations and cash available for distribution. Accordingly, in such event, our future growth prospects could be adversely affected if we remain solely focused on renewable energy projects and are unable to transition to conventional power projects such as gas-fired power projects.
29
Table of Contents
Natural events and operational problems may cause our power production to fall below our expectations.
Our electricity generation levels depend upon our ability to maintain the working order of our wind turbines and balance of the plant. A natural disaster, severe weather, accident, failure of major equipment, shortage of or inability to acquire critical replacement or spare parts, failure in the operation of any future transmission facilities that we may acquire, including the failure of interconnection to available electricity transmission or distribution networks, could damage or require us to shut down our turbines or related equipment and facilities, impeding our ability to maintain and operate our facilities and decreasing electricity generation levels and our revenues. For example, our Ocotillo and Santa Isabel (Siemens) and Gulf Wind (MHI) projects have experienced certain blade failures in the last two years. We believe the Siemens blade failures have been fully addressed. Since commercial operation of Gulf Wind, four blades have failed. We have been working with MHI to complete a root cause analysis, testing of the 354 blades at the project, and development of a protocol for determining which blades might have sufficient deficiencies that could pose a threat to long-term reliable operation. As of February 15, 2015, MHI has replaced, or is scheduled to replace, 55 blades under the equipment warranty. While the testing and replacement of blades has adversely affected turbine availability at Gulf Wind, MHI has compensated us for all of the turbine down time under our equipment warranty. MHI has agreed to extend the equipment warranty until November 2015 while we continue discussions on addressing a longer term arrangement to address these potential deficiencies, although we can give no assurance that we will be able to reach any longer term agreement with MHI. If these potential deficiencies do in fact occur and result in blade failures, replacement costs or other effects, and MHI does not address such deficiencies under the equipment warranty or other arrangement, any such effects could have a material adverse effect on our business, financial condition and results of operation.
In addition, climate change may have the long-term effect of changing wind patterns at our projects. Changing wind patterns could cause changes in expected electricity generation. These events could also degrade equipment or components and the interconnection and transmission facilities’ lives or maintenance costs. Even though our projects enter into warranty agreements with the turbine manufacturer for two- to ten-year terms, such agreements are typically subject to an aggregate maximum cap and there can be no assurance that the supplier will be able to fulfill its contractual obligations.
In addition, replacement and spare parts for wind turbines and key pieces of electrical equipment may be difficult or costly to acquire or may be unavailable. Sources for some significant spare parts and other equipment are often located outside of the jurisdictions in which our power projects operate. Additionally, our operating projects generally do not hold spare substation main transformers. These transformers are designed specifically for each wind power project, and order lead times can be lengthy. If one of our projects had to replace any of its substation main transformers, it would be unable to sell all of its power until a replacement is installed. To the extent we experience a prolonged interruption at one of our operating projects due to natural events or operational problems and such events are not fully covered by insurance, our electricity generation levels could materially decrease, which could have a material adverse effect on our business, financial condition and results of operation.
We have a limited operating history and our growth may make it difficult for us to manage our project expansion efficiently.
We have a relatively new portfolio of assets, including several projects that have only recently commenced commercial operations or that we expect will commence commercial operations prior to the end of 2015. Stockholders should consider our prospects in light of the risks and uncertainties growing companies encounter in rapidly evolving industries such as ours. Also, our anticipated near-term growth could make it difficult for us to manage our project expansion efficiently due to an inability to employ a sufficient number of skilled personnel or otherwise to effectively manage our capital expenditures and control our costs, including the requisite general and administrative costs necessary to achieve our anticipated growth. These challenges could adversely affect our ability to manage our current or future operating projects in an efficient manner and complete construction of our construction projects in a timely manner, either of which could have a material adverse effect on our business, financial condition and results of operation.
30
Table of Contents
Our operations are subject to numerous environmental, health and safety laws and regulations.
Our projects are subject to numerous environmental, health and safety laws and regulations in each of the jurisdictions in which our projects operate or will operate. These laws and regulations require our projects to obtain and maintain permits and approvals, undergo environmental impact assessments and review processes and implement environmental, health and safety programs and procedures to control risks associated with the siting, construction, operation and decommissioning of power projects. For example, to obtain permits some projects are, in certain cases, required to undertake programs to protect and maintain local endangered or threatened species. If such programs are not successful, our projects could be subject to increased levels of mitigation, penalties or revocation of our permits.
If our projects do not comply with applicable laws, regulations or permit requirements, or if there are endangered or threatened species fatalities at our projects, we may be required to pay penalties or fines or curtail or cease operations of the affected projects. Violations of environmental and other laws, regulations and permit requirements, including certain violations of laws protecting wetlands, migratory birds, bald and golden eagles and threatened or endangered species, may also result in criminal sanctions or injunctions.
Certain environmental laws impose liability on current and previous owners and operators of real property for the cost of removal or remediation of hazardous substances, even if the owner or operator did not know of, or was not responsible for, the release of such hazardous substances. In addition to actions brought by governmental agencies, private plaintiffs may also bring claims arising from the presence of hazardous substances on a property or exposure to such substances. Our projects’ liabilities at properties we own or operate arising from past releases of, or exposure to, hazardous substances could have a material adverse effect on our business, financial condition and results of operations.
Environmental, health and safety laws, regulations and permit requirements may change or become more stringent. Any such changes could require our projects to incur additional material costs. Our projects’ costs of complying with current and future environmental, health and safety laws, regulations and permit requirements, and any liabilities, fines or other sanctions resulting from violations of them, could have a material adverse effect on our business, financial condition and results of operations.
Our projects rely on interconnections to transmission lines and other transmission facilities that are owned and operated by third parties. Our projects are exposed to interconnection and transmission facility development and curtailment risks, which may delay the completion of our construction projects or reduce the return to us on those investments.
Our projects depend upon interconnection to electric transmission lines owned and operated by regulated utilities to deliver the electricity we generate. A failure or delay in the operation or development of these interconnection or transmission facilities could result in our losing revenues because such a failure or delay could limit the amount of power our operating projects deliver or delay the completion of our construction projects. In addition, certain of our operating projects’ generation of electricity may be curtailed without compensation due to transmission limitations or limitations on the electricity grid’s ability to accommodate intermittent electricity generating sources, reducing our revenues and impairing our ability to capitalize fully on a particular project’s potential. Such a failure or curtailment at levels above our expectations could have a material adverse effect on our business, financial condition and results of operations.
In the future we may acquire projects with their own generator leads to available electricity transmission or distribution networks. In some cases, these facilities may cover significant distances. A failure in our operation of these facilities that causes the facilities to be temporarily out of service, or subject to reduced service, could result in lost revenues because it could limit the amount of electricity our operating projects are able to deliver. In addition, should there be any excess capacity available in those generator lead facilities, and should a third party request access to such capacity, FERC would, or other authorities might, require our projects to provide service over such facilities for that excess capacity to the requesting third party at regulated rates. Should this occur, the
31
Table of Contents
projects could be subject to additional regulatory risks and costly compliance burdens associated with being considered the owner and operator of a transmission facility.
The loss of one or more of our executive officers or key employees may adversely affect our ability to effectively manage our operating projects and complete our construction projects on schedule.
We depend on our experienced management team and the loss of one or more key executives could have a negative impact on our business. We also depend on our ability to retain and motivate key employees and attract qualified new employees. Because the wind power industry is relatively new, there is a scarcity of experienced employees in the wind power industry. We may not be able to replace departing members of our management team or key employees. Integrating new executives into our management team and training new employees with no prior experience in the power industry could prove disruptive to our projects, require a disproportionate amount of resources and management attention and ultimately prove unsuccessful. An inability to attract and retain sufficient technical and managerial personnel could limit our ability to effectively manage our operating projects and complete our construction projects on schedule and within budget, which could have a material adverse effect on our business, financial condition and results of operations.
The reintegration event may adversely affect our costs.
Following the occurrence of the reintegration event, we will be faced with increased costs associated with employing a larger number of employees. If Pattern Development reduces the scope of its development activities and is therefore not paying us for the services of the reintegrated employees pursuant to the terms of the Management Services Agreement and our development activities remain insignificant, we may not immediately require the services of all such employees. Such events could have a material adverse effect on our business, financial condition and results of operation.
Our use and enjoyment of real property rights for our projects may be adversely affected by the rights of lienholders and leaseholders that are superior to those of the grantors of those real property rights to our projects.
Our projects generally are, and any of our future projects are likely to be, located on land occupied pursuant to long-term easements, leases and rights-of-way. The ownership interests in the land subject to these easements, leases and rights-of-way may be subject to mortgages securing loans or other liens (such as tax liens) and other easement, lease rights and rights-of-way of third parties (such as leases of oil or mineral rights) that were created prior to our projects’ easements, leases and rights-of-way. As a result, certain of our projects’ rights under these easements, leases or rights-of-way may be subject, and subordinate, to the rights of those third parties. We perform title searches, obtain title insurance and enter into non-disturbance agreements to protect ourselves against these risks. Such efforts may, however, be inadequate to protect our operating projects against all risk of loss of our rights to use the land on which our projects are located, which could have a material adverse effect on our business, financial condition and results of operations. In addition, certain lands, such as lands under the jurisdiction of the U.S. Department of Interior’s Bureau of Land Management, or the “Bureau of Land Management,” are subject to contractual rights that permit the Bureau of Land Management to adjust rent due on properties to market terms. Any such loss or curtailment of our rights to use the land on which our projects are located and any increase in rent due on such lands could have a material adverse effect on our business, financial condition and results of operations.
Our operating projects are, and other future projects may be, subject to various governmental regulations, approvals, and compliance requirements that regulate the sale of electricity, which could have a material adverse effect on our business, financial condition and results of operations.
Our current projects in operation in the United States are operating as “Exempt Wholesale Generators,” or “EWGs,” as defined under the Public Utility Holding Company Act of 2005, as amended, or “PUHCA,” and
32
Table of Contents
therefore are exempt from certain regulation under PUHCA. Other than Gulf Wind, Panhandle 1 and Panhandle 2, our operating projects in the United States are, however, public utilities under the Federal Power Act subject to rate regulation by FERC. Our future projects in the United States will also likely be subject to such rate regulation once they are placed into service. Our projects in the United States that are subject to FERC rate regulation are required to obtain acceptance of their rate schedules for wholesale sales of energy (i.e., not retail sales to consumers), capacity and ancillary services, including their ability to charge “market-based rates.” FERC may revoke or revise an entity’s authorization to make wholesale sales at market-based rates if FERC subsequently determines that such entity and its affiliates can exercise horizontal or vertical market power, create barriers to entry or engage in abusive affiliate transactions or market manipulation. In addition, public utilities in the United States are subject to FERC reporting requirements that impose administrative burdens and that, if violated, can expose the company to criminal and civil penalties or other risks.
Most of our North American projects are located in regions in which the wholesale electric markets are administered by ISOs and Regional Transmission Organizations, or “RTOs.” Several of our current operating projects are subject to the California ISO, or “CAISO,” which is the ISO that prescribes rules for the terms of participation in the California energy market; ERCOT, which is the ISO that prescribes the rules for and terms of participation in the Texas energy market; and the Independent Electricity System Operator, or “IESO,” which is the ISO that administers the wholesale electricity market in Ontario. Many of these entities can impose rules, restrictions and terms of service that are quasi-regulatory in nature and can have a material adverse impact on our business. For example, ISOs and RTOs have developed bid-based locational pricing rules for the energy markets that they administer. In addition, most ISOs and RTOs have also developed bidding, scheduling and market behavior rules, both to curb the potential exercise of market power by electricity generating companies and to ensure certain market functions and system reliability. These actions could materially adversely affect our ability to sell, and the price we receive for, our energy, capacity and ancillary services.
All of our current operating projects located in North America are also subject to the reliability standards of the North American Electric Reliability Corporation, or “NERC.” If we fail to comply with the mandatory reliability standards, we could be subject to sanctions, including substantial monetary penalties. Although our U.S. projects are not subject to state utility regulation because our projects sell power exclusively on a wholesale basis, we are subject to certain state regulations that may affect the sale of electricity from our projects, the operations of our projects, as well as the potential for state electricity taxes. Changes in regulatory treatment at the state level are difficult to predict and could have a significant impact on our ability to operate and on our financial condition and results of operations.
Our industry could be subject to increased regulatory oversight.
Our industry could be subject to increased regulatory oversight. Changing regulatory policies and other actions by governments and third parties with respect to curtailment of electricity generation, electricity grid management restrictions, interconnection rules and transmission may all have the effect of limiting the revenues from, and increasing the operating costs of, our projects which could have a material adverse effect on our business, financial condition and results of operations.
Due to regulatory restructuring initiatives at the federal, provincial and state levels, the electricity industry has undergone changes over the past several years. Future government initiatives will further change the electricity industry. Some of these initiatives may delay or reverse the movement towards competitive markets. We cannot predict the future design of wholesale power markets or the ultimate effect that on-going regulatory changes will have on our business, financial condition and results of operations.
Our projects are not able to insure against all potential risks and may become subject to higher insurance premiums.
Our projects are exposed to the risks inherent in the construction and operation of wind power projects, such as breakdowns, manufacturing defects, natural disasters, terrorist attacks and sabotage. We are also exposed to
33
Table of Contents
environmental risks. We have insurance policies covering certain risks associated with our business. Our insurance policies do not, however, cover losses as a result of certain force majeure events. In addition, our insurance policies for our projects may cover losses as a result of certain types of natural disasters, terrorist attacks or sabotage, among other things, but such coverage is not always available in the insurance market on commercially reasonable terms and is often capped at predetermined limits. In addition, our insurance policies are subject to annual review by our insurers and may not be renewed on similar or favorable terms or at all. A serious uninsured loss or a loss significantly exceeding the limits of our insurance policies could have a material adverse effect on our business, financial condition and results of operations.
Currency exchange rate fluctuations may have an impact on our financial results and condition.
We have exposures to currency exchange rate fluctuations, primarily the Canadian dollar, related to buying, selling and financing our business in currencies other than the local currencies of the countries in which we operate. A portion of our revenue for the years ended December 31, 2014, 2013 and 2012 was denominated in currencies other than the U.S. dollar, and we expect net revenue from non-U.S. dollar markets to continue to represent a portion of our net revenue. Currency exchange rate fluctuations may disrupt the business of our suppliers by making their purchases of raw materials more expensive and more difficult to finance. Historically, we have reduced our exposure by aligning our costs with the currency in which we obtain revenues or, if that is impracticable, through financial instruments that provide offsets or limits to our exposures. However, any measures that we may implement in the future to reduce the effect of currency exchange rate fluctuations and other risks of our global operations may not be effective or may be expensive. We cannot provide assurance that currency exchange rate fluctuations will not otherwise have a material adverse effect on our financial condition or results of operations or cause significant fluctuations in quarterly and annual results of operations.
In addition, foreign currency translation risk arises upon the translation of statement of financial position and income statement items of our foreign subsidiaries whose functional currency is a currency other than the U.S. dollar into U.S. dollars for purposes of preparing the consolidated financial statements included elsewhere in this Form 10-K, which are presented in U.S. dollars. The assets and liabilities of our non-U.S. dollar denominated subsidiaries are translated at the closing rate at the date of reporting and income statement items are translated at the average rate for the period. All resulting exchange differences are recognized in a separate component of equity, “Foreign currency translation, net of tax,” and are recorded in “Other comprehensive income, net of tax”. These currency translation differences may have significant negative or positive impacts. Upon the disposal of a non-U.S. dollar denominated subsidiary, the cumulative amount of exchange differences relating to that non-U.S. dollar denominated subsidiary are reclassified from equity to profit or loss. Our foreign currency translation risk mainly relates to our operations in Canada and Chile.
Foreign currency transaction risk arises when we or our subsidiaries enter into transactions where the settlement occurs in a currency other than the functional currency of us or our subsidiary. Exchange differences (gains and losses) arising on the settlement of monetary items or on translation of monetary items at rates different from those at which they were translated on initial recognition during the period or in previous financial statements are recognized in profit or loss in the period in which they arise. In order to reduce significant foreign currency transaction risk from our operating activities, we may use forward exchange contracts to hedge forecasted cash inflows and outflows. Furthermore, most non-U.S. dollar denominated debts are held by non-U.S. dollar denominated subsidiaries in the same functional currency of those subsidiary operations.
Our cross-border operations require us to comply with anti-corruption laws and regulations of the U.S. government and various non-U.S. jurisdictions.
Doing business in multiple countries requires us and our subsidiaries to comply with the laws and regulations of the U.S. government and various non-U.S. jurisdictions. Our failure to comply with these rules and regulations may expose us to liabilities. These laws and regulations may apply to our companies, individual directors, officers, employees and agents and may restrict our operations, trade practices, investment decisions
34
Table of Contents
and partnering activities. In particular, our non-U.S. operations are subject to U.S. and foreign anti-corruption laws and regulations, such as the Foreign Corrupt Practices Act of 1977, or the “FCPA.” The FCPA prohibits U.S. companies and their officers, directors, employees and agents acting on their behalf from corruptly offering, promising, authorizing or providing anything of value to foreign officials for the purposes of influencing official decisions or obtaining or retaining business or otherwise obtaining favorable treatment. The FCPA also requires companies to make and keep books, records and accounts that accurately and fairly reflect transactions and dispositions of assets and to maintain a system of adequate internal accounting controls. As part of our business, we deal with state-owned business enterprises, the employees and representatives of which may be considered foreign officials for purposes of the FCPA. As a result, business dealings between our employees and any such foreign official could expose our company to the risk of violating anti-corruption laws even if such business practices may be customary or are not otherwise prohibited between our company and a private third-party. Violations of these legal requirements are punishable by criminal fines and imprisonment, civil penalties, disgorgement of profits, injunctions, debarment from government contracts as well as other remedial measures. We have established policies and procedures designed to assist us and our personnel in complying with applicable U.S. and non-U.S. laws and regulations; however, we cannot assure stockholders that these policies and procedures will completely eliminate the risk of a violation of these legal requirements, and any such violation (inadvertent or otherwise) could have a material adverse effect on our business, financial condition and results of operations.
We own, and in the future may acquire, certain projects in joint ventures, and our partners’ interests may conflict with our and our stockholders’ interests.
We own, and in the future may acquire, certain projects in joint ventures, including South Kent and Grand, in each of which we have a 50% and 45% interest, respectively, and El Arrayán, in which we have a 70% interest. In the future, we may invest in other projects with a joint venture partner, including certain Pattern Development-owned projects. Joint ventures inherently involve a lesser degree of control over business operations, which could result in an increase in the financial, legal, operational or compliance risks associated with a project, including, but not limited to, variances in accounting and internal control requirements. To the extent we do not have a controlling interest in a project, our joint venture partners could take actions that decrease the value of our investment and lower our overall return. In addition, conflicts of interest may arise in the future between our company and our stockholders, on the one hand, and our joint venture partners, on the other hand, where our joint venture partners’ business interests are inconsistent with our and our stockholders’ interests. Further, disagreements or disputes between us and our joint venture partners could result in litigation, which could increase our expenses and potentially limit the time and effort our officers and directors are able to devote to our business, all of which could have a material adverse effect on our business, financial condition and results of operations.
Security breaches, including cybersecurity breaches, and other disruptions could compromise our business operations and critical and proprietary information and expose us to liability, which could adversely affect our business, financial condition and reputation.
In the ordinary course of our business, we store sensitive data and proprietary information regarding our business, employees, shareholders, offtakers, service providers, business partners and other individuals in our data center and on our network. Additionally, we use and are dependent upon information technology systems that utilize sophisticated operational systems and network infrastructure to run our wind farms. Through our 24/7 operations control center, we can, among other things, monitor and control each wind turbine, monitor regional and local climate, track real time market prices and, for some of our projects, monitor certain environmental activities. The secure maintenance of information and information technology systems is critical to our operations. Despite security measures we have employed, including certain measures implemented pursuant to mandatory NERC Critical Infrastructure Protection standards, our infrastructure may be increasingly vulnerable to attacks by hackers or terrorists as a result of the rise in the sophistication and volume of cyberattacks. Also, our information and information technology systems may be breached due to viruses, human error, malfeasance or other malfunctions and disruptions. Any such attack or breach could: (i) compromise our turbines and wind
35
Table of Contents
farms thereby adversely affecting generation and transmission to the grid; (ii) adversely affect our operations; (iii) corrupt data; or (iv) result in unauthorized access to the information stored on our networks, including, company proprietary information and employee data causing the information to be publicly disclosed, lost or stolen or result in incidents that could result in harmful effects on the environment and human health, including loss of life. Any such attack, breach, access, disclosure or other loss of information could result in lost revenue, the inability to conduct critical business functions, legal claims or proceedings, regulatory penalties, increased regulation, increased protection costs for enhanced cyber security systems or personnel, damage to our reputation and/or the rendering of our disclosure controls and procedures ineffective, all of which could adversely affect our business and financial condition.
Risks Related to Our Acquisition Strategy and Future Growth
The growth of our business depends on locating and acquiring interests in additional attractive independent power and transmission projects at favorable prices.
Our business strategy includes acquiring power and transmission projects that are either operational, construction-ready, or in limited circumstances, under development. We intend to pursue opportunities to acquire projects from third-party IPPs where we may submit bids from time to time and from Pattern Development pursuant to our Purchase Rights. Various factors could affect the availability of attractive projects to grow our business, including:
| • | competing bids for a project, including a project subject to our Purchase Rights, from other IPPs, including companies that may have substantially greater capital and other resources than we do; |
| • | fewer third-party acquisition opportunities than we expect, which could result from, among other things, available projects having less desirable economic returns or higher risk profiles than we believe suitable for our business plan and investment strategy; |
| • | Pattern Development’s failure to complete the development of (i) the Identified ROFO Projects, which could result from, among other things, permitting challenges, failure to procure the requisite financing, equipment or interconnection, or an inability to satisfy the conditions to effectiveness of project agreements such as PPAs and (ii) any of the other projects in its development pipeline, in a timely manner, or at all, in either case, which could limit our acquisition opportunities under our Purchase Rights; |
| • | our failure to exercise our Purchase Rights or acquire assets from Pattern Development; |
| • | our failure to successfully develop and finance projects, to the extent that we decide to pursue development activities with respect to new power projects; and |
| • | local opposition to wind turbine installations is growing in certain markets due to concerns about noise, health and other alleged impacts of wind power projects. In addition, indigenous communities in the United States and Canada, including Native Americans and First Nations, are becoming more involved in the development of wind power projects and have certain treaty rights that can negatively affect the viability of power projects. As a result, for these and other reasons, litigation and challenges to wind power projects has increased. |
Any of these factors could prevent us from executing our growth strategy or otherwise have a material adverse effect on our business, financial condition and results of operations.
Additionally, even if we consummate acquisitions that we believe will be accretive to cash available for distribution per share, those acquisitions may in fact result in a decrease in cash available for distribution per Class A share as a result of incorrect assumptions in our evaluation of such acquisitions, unforeseen consequences or other external events beyond our control. Furthermore, if we consummate any future acquisitions, our capitalization and results of operations may change significantly, and stockholders will not generally have the opportunity to evaluate the economic, financial and other relevant information that we will consider in determining the application of these funds and other resources.
36
Table of Contents
Acquisition of power projects involves numerous risks.
Our strategy includes acquiring power projects. The acquisition of power projects involves numerous risks, many of which may not be able to be discovered through our due diligence process, including exposure to previously existing liabilities and unanticipated costs associated with the pre-acquisition period; difficulty in integrating the acquired projects into our existing business; and, if the projects are in new markets, the risks of entering markets where we have limited experience. While we will perform our due diligence on prospective acquisitions, we may not be able to discover all potential operational deficiencies in such projects or problematic wind characteristics. A failure to achieve the financial returns we expect when we acquire power projects could have a material adverse effect on our ability to implement our growth strategy and, ultimately, our business, financial condition and results of operations.
Our growth strategy is dependent upon the acquisition of attractive power projects developed by third-parties, including Pattern Development, and an inability of such development companies to obtain the requisite financing to develop and construct projects could have a material adverse effect on our ability to grow our business.
Power project development is a capital intensive, high-risk business that relies heavily on and, therefore, is subject to the availability of debt and equity financing sources to fund projected construction and other projected capital expenditures. As a result, in order to successfully develop a power project, development companies, including Pattern Development, from which we may seek to acquire power projects, must obtain at-risk funds sufficient to complete the development phase of their projects. We, on the other hand, must anticipate obtaining funds from equity or debt financings, including tax equity transactions, or from government grants in order to successfully complete our acquisitions and fund the required construction and other capital costs of the acquired projects. We currently intend to acquire power projects that are construction-ready, which is generally the point in time when the project is able to procure construction financing. Any significant disruption in the credit and capital markets, or a significant increase in interest rates, could make it difficult for development companies to successfully develop attractive projects as well as limit a project’s ability to obtain financing to complete the construction of a project we may seek to acquire. If development companies from which we seek to acquire projects are unable to raise funds when needed or if we or they are unable to secure construction financing, the ability to grow our project portfolio may be limited, which could have a material adverse effect on our ability to implement our growth strategy and, ultimately, our business, financial condition and results of operations.
Our ability to grow our cash available for distribution is substantially dependent on our ability to make acquisitions from Pattern Development or third parties on economically favorable terms.
Our goal of growing our cash available for distribution and increasing dividends to our Class A stockholders is substantially dependent on our ability to make and finance acquisitions on terms that result in an increase in cash available for distribution per Class A share. We target a 10% to 12% annual growth rate in our cash available for distribution per share over three years from 2014. To grow our cash available for distribution per Class A share through acquisitions, we must be able to acquire new generation assets, such as the Identified ROFO Projects, on economically favorable terms. If we are unable to make accretive acquisitions from Pattern Development or third parties because we are unable to identify attractive acquisition opportunities, negotiate acceptable purchase contracts, obtain financing on economically acceptable terms (as a result of the then current market value of our Class A shares or otherwise) or are outbid by competitors, we may not be able to realize our targeted growth in cash available for distribution per Class A share.
The energy industry in Canada, the United States and Chile benefits from governmental support that is subject to change.
The energy industry in Canada and the United States, including both fossil fuel and renewable energy sources, in general benefits from various forms of governmental support. Renewable energy sources in Canada benefit from federal and provincial incentives, such as RPS programs, accelerated cost recovery deductions, the
37
Table of Contents
availability of off-take contracts through RFPs and the Ontario FIT program and other commercially oriented incentives. Renewable energy sources in the United States have benefited from various federal and state governmental incentives, such as PTCs, ITCs, ITC cash grants, loan guarantees, RPS programs and accelerated tax depreciation. ITC cash grants expired with respect to wind energy on January 1, 2013. PTCs and ITCs for wind energy expired on January 1, 2014, unless construction began before January 1, 2015 and further extensions are under consideration for renewal in 2015. Whether the credits will be extended in the future, and the form of any such extension, is uncertain. Renewable energy sources in Chile benefit from the Renewable and Non-Conventional Energy Law, which guarantees a fixed-price for renewable energy until 2024. The existence of these incentives is reflected in, and allows us to reduce, the price we charge for electricity generated by our projects. To the extent that these governmental incentive programs are not renewed or similar incentives are not made available, new wind power projects may need to increase the price of electricity sold to power purchasers, which could result in decreased demand for wind power, and could reduce the number of projects available to us for acquisition which could have a material adverse effect on our ability to implement our growth strategy and, ultimately, our business, financial condition and results of operations.
Wind power procurement in Canada is a provincial matter, with relatively irregular, infrequent and competitive procurement windows.
Each province in Canada has its own regulatory framework and renewable energy policy, with few material federal policies to drive the growth of renewable energy. Renewable energy developers must anticipate the future policy direction in each of the provinces, secure viable projects before they can bid to procure a PPA through highly competitive PPA auctions. Most markets are relatively small. Energy policy in our key market of Ontario is subject to a political process, including with respect to its FIT program, and renewable energy procurements may change dramatically as a result of changes in the provincial government or political climate.
We face competition primarily from other renewable energy IPPs and, in particular, other wind power companies.
We believe our primary competitors are infrastructure funds and some wind power companies or IPPs focused on renewable energy generation. We compete with these companies to acquire well-developed projects with projected stable cash flows that can be built in a cost-effective manner. We also compete with other wind power developers and operators for the limited pool of personnel with requisite industry knowledge and experience. Furthermore, in recent years, there have been times of increased demand for wind turbines and their related components, causing turbine suppliers to have difficulty meeting the demand. If these conditions return in the future, turbine and other component manufacturers may give priority to other market participants, including our competitors, who may have resources greater than ours.
We compete with other renewable energy companies (and power companies in general) for the lowest cost financing, which provides the highest returns for our projects. Once we have acquired a construction project and put it into operation, we may compete on price if we sell electricity into power markets at wholesale market prices. Depending on the regulatory framework and market dynamics of a region, we may also compete with other wind power companies and other renewable energy generators, when our projects bid on or negotiate for long-term power sale agreements or sell electricity or RECs into the spot-market. Our ability to compete on price with other wind power companies and other renewable energy IPPs may be negatively impacted if the regulatory framework of a region favors other sources of renewable energy over wind power.
We have no control over where our competitors may erect wind power projects. Our competitors may erect wind power projects adjacent to our wind projects that may cause upwind array losses to occur at our wind projects. Upwind array losses reflect the diminished wind resource available at a project resulting from interference with available wind caused by adjacent wind turbines. An adjacent wind power project that causes upwind array losses could have a material adverse effect on our revenues and results of operations.
38
Table of Contents
Any change in power consumption levels could have a material adverse effect on our business, financial condition and results of operations.
The amount of wind power consumed by the electric utility industry is affected primarily by the overall demand for electricity, environmental and other governmental regulations and the price and availability of fuels such as nuclear, coal, natural gas and oil as well as other sources of renewable energy. A decline in prices for these fuels could cause demand for wind power to decrease and adversely affect the demand for renewable energy. For example, low natural gas prices have led, in some instances, to increased natural gas consumption by electricity-generating utilities in lieu of other power sources. To the extent renewable energy and wind power, in particular, becomes less cost-competitive on an overall basis as a result of a lack of governmental incentives, cheaper alternatives or otherwise, demand for wind power and other forms of renewable energy could decrease. Slow growth in overall demand for electricity or a long-term reduction in the demand for renewable energy could have a material adverse effect on our plan to grow our business and could, in turn, have a material adverse effect on our results of operations and cash available for distribution.
Some states and provinces with RPS programs have met, or will in the near future, meet such targets through projects under contract, which could cause demand for new wind power and other power capacity to decrease.
Some states with RPS targets have met, or in the near future will meet, their targets through the recent increase in renewable energy development activity. For example, California, which has one of the most aggressive RPS in the United States, is poised to meet its current target of 25% renewable energy generation by 2016 and has the potential to meet its goal of 33% renewable power generation by 2020 with already-proposed new renewable power projects. Ontario anticipates meeting its renewable energy target of 10.7 GW, which excludes hydroelectric sources, by 2018. As a result of achieving these targets, and if these U.S. states and Canadian provinces do not increase their targets in the near future, demand for additional wind power generating capacity could decrease. To the extent other states and provinces do not become market leaders in their stead or increase their RPS targets, demand for power from wind power and other renewable energy projects could decrease in the future, which could have a material adverse effect on our business and our growth.
New projects being developed that we may acquire may need governmental approvals and permits, including environmental approvals and permits, for construction and operation. Any failure to obtain necessary permits could adversely affect the amount of our growth.
The design, construction and operation of wind power projects are highly regulated, require various governmental approvals and permits, including environmental approvals and permits, and may be subject to the imposition of related conditions that vary by jurisdiction. In some cases, these approvals and permits require periodic renewal and a subsequently issued permit may not be consistent with the permit initially issued. We cannot predict whether all permits required for a given project will be granted or whether the conditions associated with the permits will be achievable. The denial or loss of a permit essential to a project or the imposition of impractical conditions upon renewal could impair our ability to construct and operate a project. In addition, we cannot predict whether the permits will attract significant opposition or whether the permitting process will be lengthened due to complexities, legal claims or appeals. Delay in the review and permitting process for a project can impair or delay our ability to construct or acquire a project or increase the cost such that the project is no longer attractive to us.
In developing certain of our projects Pattern Development experienced delays in obtaining non-appealable permits and we may experience delays in the future. For example, when we acquired our Ocotillo project, it was then the subject of four active lawsuits brought by a variety of project opponents, all of which have challenged the prior issuance of Ocotillo’s primary environmental analysis and right-of-way entitlement. We had commenced commercial operations at the Ocotillo project in anticipation of securing favorable rulings on these lawsuits. See Item 3—“Legal Proceedings.” In Ontario, anti-wind advocacy groups opposed the environmental permit granted to our South Kent and Grand projects. The permits were appealed before the Environmental
39
Table of Contents
Review Tribunal, which later dismissed the appeals. We are subject to the risk of being unable to complete our projects if any of the key permits are revoked. If this were to occur at any future project, we would likely lose a significant portion of our investment in the project and could incur a loss as a result, which would have a material adverse effect on our business, financial condition and results of operations.
Our strategic relationship with Pattern Development through which we expect Pattern Development to help us locate and obtain new projects is limited. Our Purchase Rights may expire and if we do not exercise our Project Purchase Right or if we are not competitive with third party offers, Pattern Development is generally not restricted from competing with us, other than with respect to the Non-Competition Agreement, and, in certain circumstances, Pattern Development may sell its projects to third parties.
To the extent we do not exercise our Purchase Rights (or upon their expiration), Pattern Development may sell its projects (including the Pattern Development retained Gulf Wind interest) or Pattern Development itself or substantially all of its assets may be sold to third parties, including our competitors. Even if we are interested in acquiring an asset or investing in an opportunity offered to us by Pattern Development, Pattern Development may offer at an inopportune time for us, or we may not be able to reach an agreement on pricing or other terms. If we are unable to reach an agreement with Pattern Development or its equity owners or if we decline to make an offer, Pattern Development or its equity owners may seek alternative buyers, which could have a material adverse effect on our ability to implement our growth strategy and, ultimately, our business, financial condition and results of operations.
Additionally, our Gulf Wind Call Right terminates upon the second anniversary of the completion of our initial public offering, or October 2, 2015, and our Project Purchase Right and our Pattern Development Purchase Right terminate upon the fifth anniversary of the completion of our initial public offering, or October 2, 2018, but are subject to automatic five-year renewals unless either party dissents at the time of renewal. In addition, our Project Purchase Right and our Pattern Development Purchase Right terminate upon the third occasion on which we decline to exercise our Project Purchase Right with respect to an operational or construction-ready project and following which Pattern Development has sold the project to an unrelated third party. Following termination of our Project Purchase Right and our Pattern Development Purchase Right, Pattern Development will be under no obligation to offer any of its projects to us, which could have a material adverse effect on our ability to implement our growth strategy and ultimately on our business, financial condition and results of operations.
Once our Purchase Rights terminate, the Non-Competition Agreement with Pattern Development will also terminate, and at such time, Pattern Development will no longer be restricted from competing with us for acquisitions.
The loss of one or more of our or Pattern Development’s executive officers or key employees may adversely affect our ability to implement our growth strategy.
In addition to relying on our management team for managing our projects, our growth strategy relies on our and Pattern Development’s executive officers and key employees for their strategic guidance and expertise in the selection of projects that we may acquire in the future. Because the wind power industry is relatively new, there is a scarcity of experienced executives and employees in the wind power industry. As a result, if one or more of our or Pattern Development’s executive officers or key employees leaves and neither we nor Patten Development are able to find a suitable replacement, our ability to implement our growth strategy may be diminished, which could have a material adverse effect on our business, financial condition and results of operations.
While we currently own only wind power projects, in the future, we may decide to expand our acquisition strategy to include other types of power projects or transmission projects. Any future acquisition of non-wind power projects or transmission projects may present unforeseen challenges and result in a competitive disadvantage relative to our more-established competitors.
In the future, we may expand our acquisition strategy to include other types of power projects or transmission projects. In September 2014, we announced the addition of our first solar project, Conejo Solar, a
40
Table of Contents
104MW photovoltaic solar power project being constructed in Chile, to our list of Identified ROFO Projects. There can be no assurance that we will be able to identify other attractive non-wind or transmission acquisition opportunities or acquire such projects at a price and on terms that are attractive or that, once acquired, such projects will operate profitably. Additionally, these acquisitions could expose us to increased operating costs, unforeseen liabilities or risks, and regulatory and environmental concerns associated with entering new sectors of the power industry, including requiring a disproportionate amount of our management’s attention and resources, which could have an adverse impact on our business as well as place us at a competitive disadvantage relative to more established non-wind energy market participants. A failure to successfully integrate such acquisitions into our existing project portfolio as a result of unforeseen operational difficulties or otherwise, could have a material adverse effect on our business, financial condition and results of operations.
We are subject to risks associated with litigation or administrative proceedings that could materially impact our operations, including proceedings in the future related to power projects we subsequently acquire.
We are subject to risks and costs, including potential negative publicity, associated with lawsuits, in particular, with respect to environmental claims and lawsuits or claims contesting the construction or operation of our projects. See “Item 3—Legal Proceedings.” The result of and costs associated with defending any such lawsuit, regardless of the merits and eventual outcome, may be material and could have a material adverse effect on our operations. In the future, we may be involved in legal proceedings, disputes, administrative proceedings, claims and other litigation that arise in the ordinary course of business related to a power project that we subsequently acquire. For example, individuals and interest groups may sue to challenge the issuance of a permit for a power project or seek to enjoin construction or operation of a power project. We may also become subject to claims from individuals who live in the proximity of our power projects based on alleged negative health effects related to acoustics caused by wind turbines. In addition, we have been and may subsequently become subject to legal proceedings or claims contesting the construction or operation of our power projects. Any such legal proceedings or disputes could delay our ability to complete construction of a power project in a timely manner, or at all, or materially increase the costs associated with commencing or continuing commercial operations at a power project. Settlement of claims and unfavorable outcomes or developments relating to these proceedings or disputes, such as judgments for monetary damages, injunctions or denial or revocation of permits, could have a material adverse effect on our ability to implement our growth strategy and, ultimately, our business, financial condition and results of operations.
Risks Related to Our Financial Activities
Our substantial amount of indebtedness may adversely affect our ability to operate our business and impair our ability to pay dividends.
Our consolidated indebtedness as of December 31, 2014 is approximately $1.50 billion, or approximately 56% of our total capitalization of $2.67 billion at such date.
Of this amount, approximately $437.0 million represents project-level debt that matures prior to 2021. We do not have available cash or short-term liquid investments sufficient to repay all of this medium-term indebtedness and we have not obtained commitments for refinancing this debt. Therefore, we may not be able to extend the maturity of this indebtedness or to otherwise successfully refinance current maturities if the project finance markets deteriorate substantially or we choose not to raise corporate-level debt in place of project-level debt. Refinancing such indebtedness may force us to accept then-prevailing market terms that are less favorable than the existing indebtedness. If, for any reason, we are unable to refinance the existing indebtedness, those projects may be in default of their existing obligations, which may result in a foreclosure on the project collateral and loss of the project. Any such events could have a material adverse effect on our business, financial condition and results of operations.
41
Table of Contents
Our substantial indebtedness could have important consequences, including, for example:
| • | failure to comply with the covenants in the agreements governing these obligations could result in an event of default under those agreements, which could be difficult to cure, or result in our bankruptcy; |
| • | our debt service obligations require us to dedicate a substantial portion of our cash flow to pay principal and interest on our debt, thereby reducing the funds available to us and our ability to borrow to operate and grow our business; |
| • | our limited financial flexibility could reduce our ability to plan for and react to unexpected opportunities; and |
| • | our substantial debt service obligations make us vulnerable to adverse changes in general economic, credit and capital markets, industry and competitive conditions and adverse changes in government regulation and place us at a disadvantage compared with competitors with less debt. |
Any of these consequences could have a material adverse effect on our business, financial condition and results of operations. If we do not comply with our obligations under our debt instruments, we may be required to refinance all or part of our existing debt, borrow additional amounts or sell securities, which we may not be able to do on favorable terms or at all. In addition, increases in interest rates and changes in debt covenants may reduce the amounts that we can borrow, reduce our cash flows and increase the equity investment we may be required to make to complete construction of our projects. These increases could cause some of our projects to become economically unattractive. If we are unable to raise additional capital or generate sufficient operating cash flow to repay our indebtedness, we could be in default under our lending agreements and could be required to delay construction of our wind power projects, reduce overhead costs, reduce the scope of our projects or abandon or sell some or all of our projects, all of which could have a material adverse effect on our business, financial condition and results of operations.
If our subsidiaries default on their obligations under their project-level debt, we may decide to make payments to lenders to prevent foreclosure on the collateral securing the project-level debt, which would, without such payments, cause us to lose certain of our wind power projects.
Our subsidiaries incur various types of debt. Non-recourse debt is repayable solely from the applicable project’s revenues and is secured by the project’s physical assets, major contracts, cash accounts and, in many cases, our ownership interest in the project subsidiary. Limited recourse debt is debt where we have provided a limited guarantee, and recourse debt is debt where we have provided a full guarantee, which means if our subsidiaries default on these obligations, we will be liable directly to those lenders, although in the case of limited recourse debt only to the extent of our limited recourse obligations. To satisfy these obligations, we may be required to use amounts distributed by our other subsidiaries as well as other sources of available cash, reducing our cash available to execute our business plan and pay dividends to holders of our Class A shares. In addition, if our subsidiaries default on their obligations under non-recourse financing agreements, we may decide to make payments to prevent the lenders of these subsidiaries from foreclosing on the relevant collateral. Such a foreclosure would result in our losing our ownership interest in the subsidiary or in some or all of its assets. The loss of our ownership interest in one or more of our subsidiaries or some or all of their assets could have a material adverse effect on our business, financial condition and results of operations and, in turn, on our cash available for distribution.
We are subject to indemnity obligations.
We provide a variety of indemnities in the ordinary course of business to contractual counterparties and to our lenders and other financial partners. For example, the Hatchet Ridge indemnity indemnifies MetLife Capital, Limited Partnership (“MetLife”), the owner participant, under the Hatchet Ridge Wind Lease Financing against certain tax losses.
42
Table of Contents
In addition, although we primarily rely on limited recourse or non-recourse financing at our project-level entities we sometimes provide specific indemnities to support such financings. For example, some of our subsidiaries in the United States had obtained construction bridge loans to finance a portion of project construction costs, and in certain cases, such loans were secured by the ITC cash grant proceeds received from the U.S. Treasury. We have assumed certain indemnities that were originally provided by Pattern Development to certain of these bridge lenders and other on-going term lenders in the event that the ITC cash grant is recaptured by the U.S. Treasury, in whole or in part. The cash grant indemnities are in effect for five years from the date the relevant project commences commercial operations. If, for any of those subsidiaries which received the ITC cash grant, the ITC cash grant is recaptured, in whole or in part, we may be required to make payments under the indemnities to prevent the lenders of those subsidiaries from foreclosing on the relevant project collateral. Payment by us under a cash grant indemnity could have a material adverse effect on our business, financial condition and results of operations and, in turn, on our cash available for distribution.
Our failure to pay any of these indemnities would enable the applicable project lenders to foreclose on the project collateral. The payments we may be obligated to make pursuant to these indemnities could have a material adverse effect on our business, financial condition and results of operations and, in turn, on our cash available for distribution. See “Item 7—Management’s Discussion and Analysis of Financial Condition and Results of Operations—Description of Credit Agreements.”
Our hedging activities may not adequately manage our exposure to commodity and financial risk, which could result in significant losses or require us to use cash collateral to meet margin requirements, each of which could have a material adverse effect on our business, financial condition, results of operations and liquidity, which could impair our ability to execute favorable financial hedges in the future.
Certain of the electricity we generate is sold on the open market at spot-market prices. In order to stabilize all or a portion of the revenue from such sales, we have entered, and may in the future enter, into financial swaps, day-ahead sales transaction or other hedging arrangements. We may acquire additional assets in the future with similar hedging agreements. In an effort to stabilize our revenue from electricity sales from these projects, we evaluate the electricity sale options for each of our projects, including the appropriateness of entering into a PPA, a physical sale, a financial swap, or combination of these arrangements. If we sell our electricity into an ISO market without a PPA, we may enter into a physical sale or financial swap to stabilize all or a portion of our estimated revenue stream. Under the term of our existing physical sales, we are obligated to physically deliver electricity to a common delivery point. Under these arrangements, we sell the electricity produced at our facility to the ISO at the project node and buy energy at the common delivery point to meet the delivery obligations under the physical sale. The delivery obligations under the physical sale are for specified volumes in each hour for an overall quantity that we estimate we are highly likely to produce. Under the terms of our existing financial swaps, we are not obligated to physically deliver or purchase electricity. Instead, we receive payments for specified quantities of electricity based on a fixed-price and are obligated to pay our counterparty the market price for the same quantities of electricity. These financial swaps cover quantities of electricity that we estimate we are highly likely to produce. Gains or losses under the physical sales and financial swaps are designed to be offset by decreases or increases in our revenues from spot sales of electricity in liquid ISO markets. However, the actual amount of electricity we generate from operations may be materially different from our estimates for a variety of reasons, including variable wind conditions and wind turbine availability. If a project does not generate the volume of electricity covered by the associated physical sale or swap contract, we could incur significant losses if electricity prices in the market rise substantially above the fixed-price provided for in the physical sale or financial swap. If a project generates more electricity than is contracted in the physical sale or financial swap, the excess production will not be hedged and the related revenues will be exposed to market-price fluctuations.
We would also incur financial losses as a result of adverse changes in the mark-to-market values of the financial swaps or if the counterparties to our hedging contracts fail to make payments when due. We could also experience a reduction in cash flow if we are required to post margin in the form of cash collateral to secure our delivery or payment obligations under these hedging agreements. We are not currently required to post cash
43
Table of Contents
collateral or issue letters of credit to backstop our obligations under our hedging arrangements after commercial operation has been achieved, but we may be required to do so in the future. However, if we were required to do so, our available cash or available borrowing capacity under the credit facilities under which these letters of credit are issued would be correspondingly reduced.
We enter into PPAs when we sell our electricity into markets other than deregulated ISO markets or where we believe it is otherwise advisable. Under a PPA, we contract to sell all or a fixed proportion of the electricity generated by one of our projects, sometimes bundled with RECs and capacity or other environmental attributes, to a power purchaser, often a utility. We do this to stabilize our revenues from that project. We are exposed to the risk that the power purchaser will fail to perform under a PPA, with the result that we will have to sell our electricity at the market price, which could be substantially lower than the price provided in the applicable PPA. In most instances, we also commit to sell minimum levels of generation. If the project generates less than the committed volumes, we may be required to buy the shortfall of electricity on the open market or make payments of liquidated damages or be in default under a PPA, which could result in its termination.
We sometimes seek to sell forward a portion of our RECs or other environmental attributes to fix the revenues from those attributes and hedge against future declines in prices of RECs or other environmental attributes. If our projects do not generate the amount of electricity required to earn the RECs or other environmental attributes sold forward or if for any reason the electricity we generate does not produce RECs or other environmental attributes for a particular state, we may be required to make up the shortfall of RECs or other environmental attributes through purchases on the open market or make payments of liquidated damages. Further, current market conditions may limit our ability to hedge sufficient volumes of our anticipated RECs or other environmental attributes, leaving us exposed to the risk of falling prices for RECs or other environmental attributes. Future prices for RECs or other environmental attributes are also subject to the risk that regulatory changes will adversely affect prices.
Risks Related to Ownership of our Class A Shares
We are a holding company with no operations of our own, and we depend on our power projects for cash to fund all of our operations and expenses, including to make dividend payments.
Our operations are conducted almost entirely through our power projects and our ability to generate cash to meet our debt service obligations or to pay dividends is dependent on the earnings and the receipt of funds from our project subsidiaries through distributions or intercompany loans. Our power projects’ ability to generate adequate cash depends on a number of factors, including wind conditions, timely completion of our construction projects, the price of electricity, payments by key power purchasers, increased competition, foreign currency exchange rates, compliance with all applicable laws and regulations and other factors. See “Item 1A—Risk Factors—Risks Related to Our Projects.” Our ability to declare and pay regular quarterly cash dividends is subject to our obtaining sufficient cash distributions from our project subsidiaries after the payment of operating costs, debt service and other expenses. See Item 5 “Market for Registrant’s Common Equity and Related Stockholder Matters—Cash Dividend Policy.” We may lack sufficient available cash to pay dividends to holders of our Class A shares due to shortfalls attributable to a number of operational, commercial or other factors, including insufficient cash flow generation by our projects, as well as unknown liabilities, the cost associated with governmental regulation, increases in our operating or general and administrative expenses, principal and interest payments on our and our subsidiaries’ outstanding debt, tax expenses, working capital requirements and anticipated cash needs.
Our cash available for distribution to holders of our Class A shares may be reduced as a result of restrictions on our subsidiaries’ cash distributions to us under the terms of their indebtedness.
We intend to declare and pay regular quarterly cash dividends on all of our outstanding Class A shares. However, in any period, our ability to pay dividends to holders of our Class A shares depends on the performance
44
Table of Contents
of our subsidiaries and their ability to distribute cash to us as well as all of the other factors discussed under Item 5 “Market for Registrant’s Common Equity and Related Stockholder Matters—Cash Dividend Policy.” The ability of our subsidiaries to make distributions to us may be restricted by, among other things, the provisions of existing and future indebtedness.
Restrictions on distributions to us by our subsidiaries under our revolving credit facility and the agreements governing their respective project-level debt could limit our ability to pay anticipated dividends to holders of our Class A shares. These agreements contain financial tests and covenants that our subsidiaries must satisfy prior to making distributions. If any of our subsidiaries is unable to satisfy these restrictions or is otherwise in default under such agreements, it would be prohibited from making distributions to us that could, in turn, limit our ability to pay dividends to holders of our Class A shares. The terms of our project indebtedness typically require commencement of commercial operations prior to our ability to receive cash distributions from a project. The terms of any such indebtedness also typically include cash management or similar provisions, pursuant to which revenues generated by projects subject to such indebtedness are immediately, or upon the occurrence of certain events, swept into an account for the benefit of the lenders under such debt agreements. As a result, project revenues typically only become available to us after the funding of reserve accounts for, among other things, debt service, taxes and insurance at the project level. In some instances, projects may be required to sweep cash to reserve funds intended to mitigate the results of pending litigation or other potentially adverse events. If our projects do not generate sufficient cash available for distribution, we may be required to fund dividends from working capital, borrowings under our revolving credit facility, proceeds from future offerings, the sale of assets or by obtaining other debt or equity financing, which may not be available, any of which could have a material adverse effect on the price of our Class A shares and on our ability to pay dividends at anticipated levels or at all. See “Item 7—Management’s Discussion and Analysis of Financial Condition and Results of Operations—Description of Credit Agreements.”
Our ability to pay regular dividends on our Class A shares is subject to the discretion of our Board of Directors.
Our Class A stockholders have no contractual or other legal right to dividends. The payment of future dividends on our Class A shares will be at the discretion of our Board of Directors and will depend on, among other things, our earnings, financial condition, capital requirements, level of indebtedness, statutory and contractual restrictions applying to the payment of dividends and other considerations that our Board of Directors deems relevant. Our Board of Directors will have the authority to establish cash reserves for the prudent conduct of our business, and the establishment of or increase in those reserves could result in a reduction in cash available for distribution to pay dividends on our Class A shares at anticipated levels. Accordingly, we may not be able to make, or may have to reduce or eliminate, the payment of dividends on our Class A shares, which could adversely affect the market price of our Class A shares.
If we fail to maintain proper and effective internal controls, our ability to produce accurate and timely financial statements could be impaired and investors’ views of us could be harmed.
U.S. securities laws require, among other things, that we maintain effective internal control over financial reporting and disclosure controls and procedures. Because we ceased being an emerging growth company as defined in the JOBS Act on December 31, 2014, we must perform system and process evaluation and testing of our internal control over financial reporting to allow management to report on the effectiveness of our internal control over financial reporting, as required by Section 404 of the Sarbanes-Oxley Act. If we are not able to comply with these requirements in a timely manner, or if we identify deficiencies in our internal control over financial reporting that are deemed to be material weaknesses, the market price of our shares could decline and we could be subject to sanctions or investigations by the stock exchanges on which we list, the SEC, the Canadian Securities Administrators or other regulatory authorities, which would require additional financial and management resources. During 2014, we filed with the SEC amendments to our quarterly reports on Form 10-Q for each of the quarters ended March 31, 2014 and June 30, 2014 to correct errors therein. Management reported
45
Table of Contents
material weaknesses in our system of internal control over financial reporting as of March 31, 2014, June 30, 2014 and September 30, 2014. We had a material weakness in internal control over financial reporting with respect to design and operation of controls over the methodology used to calculate earnings per share for the three months ended March 31, 2014. In addition, management determined that a material weakness existed in internal control over financial reporting related to the review and application of technical accounting principles. While management has taken actions to remediate the material weaknesses and believes such material weaknesses have been remedied, we may be incorrect in such assessment. Moreover, a number of our transactions, including business combinations and other acquisitions, require complex accounting and significant accounting estimates which can result in errors in the reported amounts of acquired assets or liabilities. Accordingly, additional material weaknesses may occur in the future, and we may be unable to provide holders of our securities with the required financial information in a timely and reliable manner which could subject us to litigation and regulatory enforcement actions.
Even if we conclude, from time to time, that our internal control over financial reporting provides reasonable assurance regarding the reliability of financial reporting and the preparation of financial statements for external purposes in accordance with U.S. GAAP, because of its inherent limitations, internal control over financial reporting may not prevent or detect fraud or misstatements. This, in turn, could have an adverse impact on trading prices for our Class A shares, and could adversely affect our ability to access the capital markets.
Risks Regarding Our Cash Dividend Policy
We do not have a sufficient operating history as an independent company upon which to rely in evaluating whether we will have sufficient cash available for distribution and other sources of liquidity to allow us to pay dividends on our Class A shares at our current quarterly dividend levels on an annualized basis. While we believe that we will have sufficient available cash to enable us to pay the aggregate dividend on our Class A shares for the year ending December 31, 2015, we may be unable to pay the quarterly dividend or any amount on our Class A shares during these periods or any subsequent period. Holders of our Class A shares have no contractual or other legal right to receive cash dividends from us on a quarterly or other basis and, while we currently intend to at least maintain our current dividend and to grow our business and continue to increase our dividend per Class A share over time, our cash dividend policy is subject to all the risks inherent in our business and may be changed at any time. Some of the reasons for such uncertainties in our stated cash dividend policy include the following factors:
| • | Our revolving credit facility includes customary affirmative and negative covenants that will subject certain of our project subsidiaries to restrictions on making distributions to us. See Item 7 “Management’s Discussion and Analysis of Financial Condition and Results of Operations—Description of Credit Agreements—Revolving Credit Facility.” Our subsidiaries are also subject to restrictions on distributions under the agreements governing their respective project-level debt. Additionally, we may incur debt in the future to acquire new power projects, the terms of which will likely require commencement of commercial operations prior to our ability to receive cash distributions from such acquired projects. These agreements likely will contain financial tests and covenants that our subsidiaries must satisfy prior to making distributions. The current financial tests and covenants applicable to our subsidiaries are described in Item 7 “Management’s Discussion and Analysis of Financial Condition and Results of Operations— Description of Credit Agreements.” If any of our subsidiaries is unable to satisfy these restrictions or is otherwise in default under our financing agreements, it would be prohibited from making distributions to us, which could, in turn, limit our ability to pay dividends to holders of our Class A shares at our intended level or at all. |
| • | Our Board of Directors will have the authority to establish cash reserves for the prudent conduct of our business, and the establishment of or increase in those reserves would reduce the cash available to pay our dividends. |
| • | We may lack sufficient cash available for distribution to pay our dividends due to operational, commercial or other factors, some of which are outside of our control, including insufficient cash flow |
46
Table of Contents
| generation by our projects, as well as unexpected operating interruptions, insufficient wind resources, legal liabilities, the cost associated with governmental regulation, changes in governmental subsidies or regulations, increases in our operating or selling, general and administrative expenses, principal and interest payments on our and our subsidiaries’ outstanding debt, tax expenses, working capital requirements and anticipated cash reserve needs. |
We are an SEC foreign issuer under Canadian securities laws and, therefore, are exempt from certain requirements of Canadian securities laws applicable to other Canadian reporting issuers.
Although we are a reporting issuer in Canada, we are an SEC foreign issuer under Canadian Securities laws and are exempt from certain Canadian securities laws relating to continuous disclosure obligations and proxy solicitation if we comply with certain reporting requirements applicable in the United States, provided that the relevant documents filed with the SEC are filed in Canada and sent to our Class A stockholders in Canada to the extent and in the manner and within the time required by applicable U.S. requirements. In some cases the disclosure obligations applicable in the United States are different or less onerous than the comparable disclosure requirements applicable in Canada for a Canadian reporting issuer that is not exempt from Canadian disclosure obligations. Therefore, there may be less or different publicly available information about us than would be available if we were a Canadian reporting issuer that is not exempt from such Canadian disclosure obligations.
Pattern Development’s general partner and its officers and directors have fiduciary or other obligations to act in the best interests of Pattern Development’s owners, which could result in a conflict of interest with us and our stockholders.
Pattern Development holds approximately 25% of our outstanding Class A shares, representing in the aggregate an approximate 25% voting interest in our company. Upon the occurrence of the Conversion Event on December 31, 2014, Pattern Development and the management holders who had previously held our Class B shares became entitled to receive dividends, beginning on January 1, 2015, on these shares which have been converted to Class A shares. We are party to the Management Services Agreement, pursuant to which each of our executive officers (including our Chief Executive Officer), with the exception of our Chief Financial Officer and Senior Vice President, Operations, is a shared PEG executive and devotes time to both our company and Pattern Development as needed to conduct our respective businesses. As a result, these shared PEG executives have fiduciary and other duties to Pattern Development. Conflicts of interest may arise in the future between our company (including our stockholders other than Pattern Development) and Pattern Development (and its owners and affiliates). Our directors and executive officers owe fiduciary duties to the holders of our shares. However, Pattern Development’s general partner and certain of its officers and directors also have a fiduciary duty to act in the best interest of Pattern Development’s limited partners, which interest may differ from or conflict with that of our company and our other stockholders.
Pattern Development’s share ownership may limit other stockholders ability to influence corporate matters.
Pattern Development or its affiliates hold approximately 25% of the combined voting power of our shares, and this concentration of voting power may limit other stockholders’ ability to influence corporate matters, and as a result, actions may be taken that other stockholders may not view as beneficial. As a result of its ownership in our company, Pattern Development has significant influence over all matters that require approval by our stockholders, including the election of directors. In addition, even though a recent sale of shares by Pattern Development resulted in a decrease of its ownership interest in our company from 35% to 25% such that it is no longer entitled to certain contractual approval rights pursuant to the Shareholder Approval Rights Agreement (see “Item 5. Market for Registrant’s Common Equity and Related Stockholder Matters”), Pattern Development or its affiliates through its remaining shareholdings still may have the ability to exercise substantial influence over our company, including with respect to decisions relating to our capital structure, issuing additional Class A shares or other equity securities, paying dividends on our Class A shares, incurring additional debt, making acquisitions,
47
Table of Contents
selling properties or other assets, merging with other companies and undertaking other extraordinary transactions. In any of these matters, the interests of Pattern Development and its affiliates may differ from or conflict with the interests of our other stockholders.
Certain of our executive officers will continue to have an economic interest in, as well as provide services to Pattern Development, which could result in conflicts of interest.
Certain of our executive officers provide services to Pattern Development pursuant to the terms of the Management Services Agreement between our company and Pattern Development and, as a result, in some instances, have fiduciary or other obligations to Pattern Development. Additionally, our Chief Executive Officer, Executive Vice President, Business Development, Executive Vice President and General Counsel, Senior Vice President, Fiscal and Administrative Services and Senior Vice President, Engineering and Construction have economic interests in Pattern Development and, accordingly, the benefit to Pattern Development from a transaction between Pattern Development and our company will proportionately inure to their benefit as holders of economic interests in Pattern Development. Pattern Development is a related party under the applicable securities laws governing related party transactions and, as a result, any material transaction between our company and Pattern Development (except the occurrence of the reintegration event) is subject to our corporate governance guidelines, which require prior approval of any such transaction by the conflicts committee, which is comprised solely of independent members of our Board of Directors. Those of our executive officers who have economic interests in Pattern Development may be conflicted when advising the conflicts committee or otherwise participating in the negotiation or approval of such transactions. These executive officers have significant project- and industry-specific expertise that could prove beneficial to the conflicts committee’s decision-making process and the absence of such strategic guidance could have a material adverse effect on our company’s ability to evaluate any such transaction and, in turn, on our business, financial condition and results of operations.
Riverstone is under no obligation to offer us an opportunity to participate in any business opportunities that it may consider from time to time, including those in the energy industry, and, as a result, Riverstone’s existing and future portfolio companies may compete with us for investment or business opportunities.
Conflicts of interest could arise in the future between us, on the one hand, and Riverstone, including its portfolio companies, on the other hand, concerning among other things, potential competitive business activities or business opportunities. Riverstone is a private equity firm in the business of making investments in entities primarily in the energy industry. As a result, Riverstone’s existing and future portfolio companies (other than Pattern Development, which is subject to the Non-Competition Agreement) may compete with us for investment or business opportunities. These conflicts of interest may not be resolved in our favor.
Subject to the terms of the Non-Competition Agreement with, and our Purchase Rights granted to us by, Pattern Development, we have expressly renounced any interest or expectancy in, or in being offered an opportunity to participate in, any business opportunity that may be from time to time presented to Riverstone or any of its officers, directors, agents, stockholders, members or partners or business opportunities that such parties participate in or desire to participate in, even if the opportunity is one that we might reasonably have pursued or had the ability or desire to pursue if granted the opportunity to do so, and no such person shall be liable to us for breach of any fiduciary or other duty, as a director or officer or controlling stockholder or otherwise, by reason of the fact that such person pursues or acquires any such business opportunity, directs any such business opportunity to another person or fails to present any such business opportunity, or information regarding any such business opportunity, to us unless, in the case of any such person who is our director or officer, any such business opportunity is expressly offered to such director or officer solely in his or her capacity as our director or officer. Riverstone has advised us that it does not have a formal policy regarding business opportunities presented to the investment funds managed or advised by it and their respective portfolio companies, but Riverstone’s practice has been that any business opportunities may be pursued by any such fund or directed to any such portfolio company except when the business opportunity has been presented to an employee of Riverstone or its affiliates solely in his or her capacity as a director of a portfolio company.
48
Table of Contents
As a result, Riverstone may become aware, from time to time, of certain business opportunities, such as acquisition opportunities, and may direct such opportunities to other businesses in which it has invested, in which case we may not become aware of or otherwise have the ability to pursue such opportunities. Further, such businesses may choose to compete with us for these opportunities. As a result, our renouncing our interest and expectancy in any business opportunity that may be from time to time presented to Riverstone could adversely impact our business or prospects if attractive business opportunities are procured by such parties for their own benefit rather than for ours.
Our actual or perceived failure to deal appropriately with conflicts of interest with Pattern Development could damage our reputation, increase our exposure to potential litigation and have a material adverse effect on our business, financial condition and results of operations.
Our conflicts committee is required to review, and make recommendations to the full Board of Directors regarding, any future transactions involving the acquisition of an asset or investment in an opportunity offered to us by Pattern Development to determine whether the offer is fair and reasonable (including any acquisitions by us of assets of Pattern Development pursuant to our Purchase Rights). However, our establishment of a conflicts committee may not prevent holders of our shares from filing derivative claims against us related to these conflicts of interest and related party transactions. Regardless of the merits of their claims, we may be required to expend significant management time and financial resources on the defense of such claims. Additionally, to the extent we fail to appropriately deal with any such conflicts, it could negatively impact our reputation and ability to raise additional funds and the willingness of counterparties to do business with us, all of which could have a material adverse effect on our business, financial condition and results of operations.
Market interest and foreign exchange rates may have an effect on the value of our Class A shares.
One of the factors that influences the price of our Class A shares will be the effective dividend yield of our Class A shares (i.e., the yield as a percentage of the then market price of our Class A shares) relative to market interest rates. An increase in market interest rates, which are currently at low levels relative to historical rates, may lead prospective purchasers of our Class A shares to expect a higher dividend yield and, our inability to increase our dividend as a result of an increase in borrowing costs, insufficient cash available for distribution or otherwise, could result in selling pressure on, and a decrease in the market price of, our Class A shares as investors seek alternative investments with higher yield. Additionally, we intend to pay a regular quarterly dividend in U.S. dollars and, as a result, to the extent the value of the U.S. dollar dividend decreases relative to Canadian dollars, the market price of our Class A shares in Canada could decrease.
The price of our Class A shares may fluctuate significantly, and stockholders could lose all or part of their investment.
Volatility in the market price of our shares may prevent stockholders from being able to sell their Class A shares at or above the price stockholders paid for their shares. The market price of our Class A shares could fluctuate significantly for various reasons, including:
| • | our operating and financial performance and prospects; |
| • | our quarterly or annual results of operations or those of other companies in our industry; |
| • | a change in interest rates or changes in currency exchange rates; |
| • | the public’s reaction to our press releases, our other public announcements and our filings with the Canadian securities regulators and the SEC; |
| • | changes in, or failure to meet, earnings estimates or recommendations by research analysts who track our Class A shares or the stock of other companies in our industry; |
| • | the failure of research analysts to cover our Class A shares; |
| • | strategic actions by us, our power purchasers or our competitors, such as acquisitions or restructurings; |
49
Table of Contents
| • | new laws or regulations or new interpretations of existing laws or regulations applicable to our business; |
| • | changes in accounting standards, policies, guidance, interpretations or principles; |
| • | material litigation or government investigations; |
| • | changes in applicable tax laws; |
| • | changes in general conditions in the United States, Canadian and global economies or financial markets, including those resulting from war, incidents of terrorism or responses to such events; |
| • | changes in key personnel; |
| • | sales of Class A shares by us or members of our management team; |
| • | termination of lock-up agreements with our management team and principal stockholders; |
| • | the granting or exercise of employee stock options; |
| • | volume of trading in our Class A shares; and |
| • | the realization of any risks described under “Risk Factors.” |
In addition, volatility in the stock markets has had a significant impact on the market price of securities issued by many companies, including companies in our industry. The changes frequently appear to occur without regard to the operating performance of the affected companies. Hence, the price of our Class A shares could fluctuate based upon factors that have little or nothing to do with our company, and these fluctuations could materially reduce the share price of our Class A shares and cause stockholders to lose all or part of their investment. Further, in the past, market fluctuations and price declines in a company’s stock have led to securities class action litigation. If such a suit were to arise, it could have a substantial cost and divert our resources regardless of the outcome.
We incur increased costs and demands upon management as a result of complying with the laws and regulations affecting public companies, which could harm our operating results, and such costs may increase when we cease to be an emerging growth company.
As a public company, we incur significant legal, accounting, investor relations and other expenses that we did not incur as a private company, including costs associated with public company reporting requirements. We also have incurred and will incur costs associated with current corporate governance requirements, Section 404 and other provisions of the Sarbanes-Oxley Act and the Dodd-Frank Act of 2010, as well as rules implemented by the SEC, the Canadian Securities Administrators and the stock exchanges on which our Class A shares are traded.
The expenses incurred by public companies for reporting and corporate governance purposes have increased dramatically over the past several years. Greater expenditures may be necessary in the future with the advent of new laws and regulations pertaining to public companies. If we are not able to comply with these requirements in a timely manner, the market price of our Class A shares could decline and we could be subject to sanctions or investigations by the SEC, the Canadian Securities Administrators, the applicable stock exchanges or other regulatory authorities, which would require additional financial and management resources.
As a result of the FPA and FERC’s regulations in respect of transfers of control, absent prior authorization by FERC, neither we nor Pattern Development can convey, nor will an investor in our company generally be permitted to obtain, a direct and/or indirect voting interest in 10% or more of our issued and outstanding voting securities, and a violation of this limitation could result in civil or criminal penalties under the FPA and possible further sanctions imposed by FERC under the FPA.
We are a holding company with U.S. operating subsidiaries that are “public utilities” (as defined in the FPA) and, therefore, subject to FERC’s jurisdiction under the FPA. As a result, the FPA requires us or Pattern
50
Table of Contents
Development, as the case may be, either to (i) obtain prior authorization from FERC to transfer an amount of our voting securities sufficient to convey direct or indirect control over any of our public utility subsidiaries or (ii) qualify for a blanket authorization granted under or an exemption from FERC’s regulations in respect of transfers of control. Similar restrictions apply to purchasers of our voting securities who are a “holding company” under the Public Utility Holding Company Act of 2005, or “PUHCA,” in a holding company system that includes a transmitting utility or an electric utility, or an “electric holding company,” regardless of whether our voting securities were purchased in our initial public offering, subsequent offerings by us or Pattern Development, in open market transactions or otherwise. A purchaser of our voting securities would be a “holding company” under the PUHCA and an electric holding company if the purchaser acquired direct or indirect control over 10% or more of our voting securities or if FERC otherwise determined that the purchaser could directly or indirectly exercise control over our management or policies (e.g., as a result of contractual board or approval rights). Under the PUHCA, a “public-utility company” is defined to include an “electric utility company,” which is any company that owns or operates facilities used for the generation, transmission or distribution of electric energy for sale, and which includes EWGs such as our U.S. operating subsidiaries. Accordingly, absent prior authorization by FERC or a general increase to the applicable percentage ownership under a blanket authorization, for the purposes of sell-side transactions by us or Pattern Development and buy-side transactions involving purchasers of our securities that are electric holding companies, no purchaser can acquire 10% or more of our issued and outstanding voting securities. A violation of these regulations by us or Pattern Development, as sellers, or an investor, as a purchaser of our securities, could subject the party in violation to civil or criminal penalties under the FPA, including civil penalties of up to $1 million per day per violation and other possible sanctions imposed by FERC under the FPA.
As a result of the FPA and FERC’s regulations in respect of transfers of control, and consistent with the requirements for blanket authorizations granted thereunder or exemptions therefrom, absent prior authorization by FERC, no purchaser of our common shares in open market, or in subsequent offerings of our voting securities, will be permitted to purchase an amount of our securities that would cause such purchaser and its affiliate and associate companies to collectively hold 10% or more of our voting securities outstanding. Additionally, investors should manage their investment in us in a manner consistent with FERC’s regulations in respect of obtaining direct or indirect “control” of our company. Accordingly, absent prior authorization by FERC, investors in our common shares that are electric holding companies are advised not to acquire a direct and/or indirect voting interest in 10% or more of our issued and outstanding voting securities, whether in connection with an offering by us or Pattern Development, open market purchases or otherwise.
Provisions of our organizational documents and Delaware law might discourage, delay or prevent a change of control of our company or changes in our management and, as a result, depress the trading price of our Class A shares.
Our amended and restated certificate of incorporation and amended and restated bylaws contain provisions that could discourage, delay or prevent a change in control of our company or changes in our management that the stockholders of our company may deem advantageous. These provisions:
| • | authorize the issuance of blank check preferred stock that our Board of Directors could issue to increase the number of outstanding shares and to discourage a takeover attempt; |
| • | prohibit our stockholders from calling a special meeting of stockholders; |
| • | prohibit stockholder action by written consent, which requires all stockholder actions to be taken at a meeting of our stockholders; |
| • | provide that the Board of Directors is expressly authorized to adopt, or to alter or repeal our bylaws; and |
| • | establish advance notice requirements for nominations for election to our Board of Directors or for proposing matters that can be acted upon by stockholders at stockholder meetings. |
51
Table of Contents
These anti-takeover defenses could discourage, delay or prevent a transaction involving a change in control of our company. These provisions could also discourage proxy contests and make it more difficult for stockholders to elect directors of their choosing and cause us to take corporate actions other than those desired.
Future sales of our shares in the public market could lower our Class A share price, and any additional capital raised by us through the sale of equity or convertible debt securities may dilute stockholders’ ownership in us and may adversely affect the market price of our Class A shares.
In May 2014, we completed a follow-on offering of our Class A shares. In total, 21,117,171 Class A shares were sold. Of this amount, we sold 10,810,810 Class A shares and Pattern Development, a selling stockholder, sold 10,306,361 of our Class A shares. In addition, in February 2015, we completed another follow-on offering of our Class A shares. In total 12,000,000 Class A shares were sold. Of this amount, we issued and sold 7,000,000 Class A shares and Pattern Development, a selling shareholder, sold 5,000,000 of our Class A shares. If we sell, or if Pattern Development sells, additional large numbers of our Class A shares, or if we issue a large number of shares of our Class A common stock in connection with future acquisitions, financings, or other circumstances, the market price of our Class A shares could decline significantly. Moreover, the perception in the public market that we or Pattern Development might sell Class A shares could depress the market price of those shares.
In addition, on May 6, 2014, Pattern Development entered into a loan agreement pursuant to which it may pledge up to 18,700,000 Class A shares to secure a $100.0 million loan. If Pattern Development were to default on its obligations under the loan, the lenders, upon the expiration of certain lock-up agreements, would have the right to sell shares to satisfy Pattern Development’s obligation. Such an event could cause our stock price to decline. We cannot predict the size of future issuances of our Class A shares or the effect, if any, that future issuances or sales of our shares will have on the market price of our shares. Sales of substantial amounts of our shares (including sales pursuant to Pattern Development’s registration rights and shares issued in connection with an acquisition), or the perception that such sales could occur, may adversely affect prevailing market prices for our Class A shares.
| Item 1B. | Unresolved Staff Comments. |
None
| Item 2. | Properties. |
Leased Facilities
We conduct business activities from Pattern Development-leased office facilities in San Francisco, Houston, San Diego, Santiago and Toronto. We believe that our existing office facilities are in good condition and suitable for the conduct of our business.
Our Projects
We own interests in twelve wind power projects, consisting of eleven operating projects and one construction project. Each of our projects has contracted to sell all or a majority of its output pursuant to a long-term, fixed-price power sale agreement with a creditworthy counterparty. One of our PPA counterparties, PREPA, has been downgraded. Refer to Item 1A “Risk Factors—Our projects rely on a limited number of key power purchases. The power purchaser for our Santa Isabel project has been downgraded”. We expect any project we acquire in the future will be party to a similar agreement, but we may acquire projects with greater levels of uncontracted capacity.
52
Table of Contents
Operating Projects
Gulf Wind
Gulf Wind is a 283 MW project located on the Gulf Coast in Kenedy County, Texas. The project consists of 118 2.4 MW Mitsubishi MWT95/2.4 turbines and commenced commercial operations in 2009. Pattern Development acquired this operational project in March 2010. Gulf Wind is held by a tax equity partnership with MetLife. We, Pattern Development, and MetLife currently own approximately 40%, 27% and 33% of Gulf Wind, respectively.
The project is located in the South Zone of the ERCOT market and sells 100% of its power output into the ERCOT market, receiving the locational marginal price, or “LMP.” Approximately 58% of the project’s expected annual electricity generation has been hedged under a 10-year fixed-for-floating swap with Credit Suisse Energy LLC. This financial hedging agreement settles using the South Trading Hub hourly locational marginal price, or “LMP”, weighted by the settlement volume in each hour. The notional settlement volume is different each hour (but fixed for the hedge term) to reflect the project’s expected production profile. Gulf Wind’s obligations under the hedge are secured by a first priority lien on substantially all of the assets of Gulf Wind and a first priority lien on the membership interests in the operating project entity up to approximately $73 million, both of which are first in priority relative to the second priority liens associated with the debt financing up to approximately $250 million and which are second in priority over the third-priority liens in favor of Credit Suisse Energy LLC in excess of the first and second lien caps.
The project is connected to the Electric Transmission Texas 345 kV transmission system and is located in Kenedy County, TX and is entirely on land owned by a single private landowner. Gulf Wind entered into an easement agreement with a single landowner on May 9, 2007 for an initial term of 30 years and with an option to extend for an additional 10 years. The land, which is primarily grassland and dunes, is part of a very large ranch. In addition to our wind operations, the ranch is also used for cattle raising, oil & gas production, and private hunting outings. Due to the afternoon sea breeze effect along the coast, Gulf Wind benefits from an average daily wind production profile that generally follows the typical electricity demand load profile, which is heaviest during the daytime.
Hatchet Ridge
Hatchet Ridge is a 101 MW project located in Burney, California. The project consists of 44 2.3 MW Siemens turbines and commenced commercial operations in December 2010. The project is connected to the PG&E transmission system.
The project sells 100% of its electricity generation, including environmental attributes, to PG&E under a 15-year PPA that expires in 2025. The price under the PPA is a stated price per MWh, adjusted by seasonal time of day multipliers, with no escalation. Hatchet Ridge is required to post performance security in the amount of $21.2 million to secure damages under the PPA. The PPA also contains customary termination and event of default provisions. Under the terms of the PPA, Hatchet Ridge is required to pay liquidated damages for failure to produce a certain amount of energy in each of two consecutive years.
The project is located in Shasta County, CA, along a gentle ridge top, and is entirely on land owned by two private landowners, subject to 30-year wind power ground lease agreements.
St. Joseph
St. Joseph is a 138 MW project located near St. Joseph, Manitoba, just north of the U.S. border. The project consists of 60 2.3 MW Siemens turbines and commenced commercial operations in April 2011. The project is connected to the Manitoba Hydro transmission system. St. Joseph was the second commercial wind power project, and is the largest, in Manitoba.
53
Table of Contents
The project sells 100% of its electricity generation, including environmental attributes, to Manitoba Hydro under a 27-year PPA that expires in 2039. The price under the PPA is a stated price per MWh at inception of the PPA, with approximately 20% of the stated price escalating annually at the consumer price index for Canada, or “Canadian CPI.” The project will additionally receive the ecoEnergy federal incentive of C$10/MWh for approximately ten years for up to 423,108 MWh of production per year. Under the PPA, if there is a sale of the project, Manitoba Hydro has a right of first offer to purchase the St. Joseph project for a fixed minimum purchase price on terms specified by us. In addition to customary termination and event of default provisions, the PPA will terminate upon the exercise by Manitoba Hydro of its right of first offer to purchase the St. Joseph project, and St. Joseph will trigger an event of default, if after the first three contract years, it fails to supply at least 80% of certain minimal energy obligations for two consecutive years.
The project is located on approximately 125 square kilometers of agricultural land in the Rural Municipalities of Montcalm and Rhineland, Province of Manitoba. The project is constructed on privately owned lands pursuant to right-of-way agreements with 64 private landowners, with 40-year terms and all on substantially the same form of agreement covering all of turbine sites, collection lines, roads and an operations and maintenance building for the project. In addition, the project purchased a small parcel of property for the project substation.
Spring Valley
Spring Valley is a 152 MW project located in White Pine County, Nevada. The project consists of 66 2.3 MW Siemens turbines and commenced commercial operations in August 2012. The project is connected to the NV Energy transmission system. Spring Valley was Nevada’s first commercial wind power project.
The project sells 100% of its electricity generation, including environmental attributes, to NV Energy, under a 20-year PPA that expires in 2032. The price under the PPA is a stated price per MWh escalating at 1.0% per year. Spring Valley is required to reimburse NV Energy for replacement costs for any annual energy shortfall and post operating security in the amount of $6.3 million for the performance of its obligations under the PPA. The PPA also contains customary termination and event of default provisions. In connection with the PPA and subject to certain pricing conditions, NV Energy was granted an option to acquire up to 50% of the equity membership interests in Spring Valley held by our project-level operating subsidiary, which option expired in August 2014. Prior to the option expiration, in August 2014, NV Energy delivered notice that it was exercising its option to acquire up to 50% of the equity membership interests in our Spring Valley project held by our project-level operating subsidiary. Following a 120-day period under the option to negotiate terms and conditions that are acceptable to us, the option lapsed. NV Energy no longer holds an option to acquire an interest in our Spring Valley project.
The project is located in White Pine County, NV on federal land administered by the Bureau of Land Management. Spring Valley was granted a right-of-way from the Bureau of Land Management with a 30-year term, which terminates on December 31, 2040.
Santa Isabel
Santa Isabel is a 101 MW project located on the south coast of Puerto Rico. The project consists of 44 2.3 MW Siemens turbines and commenced commercial operations during the fourth quarter of 2012. The project is connected to the Puerto Rico Electric Power Authority, or “PREPA,” transmission system. Santa Isabel is Puerto Rico’s first commercial wind power project and is reflective of the Puerto Rican government’s efforts to diversify its energy sources away from fossil fuels by fostering local renewable energy projects.
The project sells 100% of its electricity generation including environmental attributes to PREPA under a 20-year PPA, expiring in 2030, with automatic 5-year extensions unless terminated at the end of any term or extension by us, and PREPA may terminate after year 25 if there is a liquid spot-market for electricity or the
54
Table of Contents
agreement has been in effect for 30 years. Under the PPA, PREPA has agreed to purchase electricity from us subject to a 75 MW per hour cap, with such cap increasing to 95 MW during certain hours of certain months. If the project is capable of generating electricity in excess of the applicable cap, PREPA has the option, but not the obligation, to purchase any such surplus electricity actually generated at the PPA price. The price for energy under the PPA and the price for RECs under a separate purchase agreement are both a stated price per MWh. Each price escalates at 1.5% per year. In the case that project electricity generation exceeds a threshold multiple of contractual electricity generation in a given year, the price for energy under the PPA reduces until output drops below contractual output for such year. Santa Isabel is required to post operating security in the amount of $3.0 million for the performance of its obligations under the PPA. In addition to customary termination and event of default provisions, the PPA may terminate if Santa Isabel fails to generate a threshold energy output during any 12 consecutive months.
The project is located on land owned by the Puerto Rico Land Authority, or “PRLA,” which is actively farmed by private operations under land leases with the PRLA. The project entered into a deed of lease, easements and restrictive covenants with the PRLA on October 6, 2011, with a 30-year initial term, together with up to 45 years in renewal options, comprising substantially all project infrastructure, including all turbine sites, collection lines, roads, substation and operations and maintenance buildings for the project. The project also has entered into transmission line leases for the transmission line corridor from the project substation to the point of interconnection with PREPA with four private landowners.
Ocotillo
Ocotillo is a 265 MW project located in western Imperial County, California. The project consists of 112 2.37 MW Siemens turbines. We initially commenced commercial operations on 223 MW of Ocotillo’s electricity generating capacity during the fourth quarter of 2012 and commenced commercial operations on the remaining 42 MW of electricity generating capacity from Ocotillo’s additional 18 turbines in July 2013. The project connects to the San Diego Gas & Electric, or “SDG&E,” 500 kV transmission system and has a large generator interconnection agreement with SDG&E and CAISO.
The project sells 100% of its electricity generation, including capacity and environmental attributes, to SDG&E under a 20-year PPA. The PPA has a stated price per MWh with no escalation. Ocotillo is required to post performance security in the amount of $26.7 million to secure damages. The PPA also contains customary termination and event of default provisions. Under the PPA, Ocotillo is required to pay liquidated damages for failure to produce a certain amount of energy in the two previous years.
Ocotillo is the subject of active lawsuits brought by a variety of project opponents. See Item 3 “Legal Proceedings.”
The project is located on approximately 12,500 acres in Imperial County, CA and is almost entirely on federal land administered by Bureau of Land Management. The project was granted a right-of-way from the Bureau of Land Management with a 30-year term, which terminates on December 31, 2041. All the project’s turbine sites, a substation and an operations and maintenance building are located on land administered by the Bureau of Land Management. The project has entered into collection and distribution line easements with two private landowners for a portion of the underground collection system. In addition, the project has purchased a small parcel of land for a portion of the underground collection system. The project also has a lease agreement in place with a private landowner for an additional 26 acres of private land.
South Kent
South Kent is a 270 MW project located in the municipality of Chatham-Kent in southern Ontario. The project consists of 124 2.3 MW Siemens turbines that have been de-rated to a range from 1.903 MW to 2.221 MW in order to facilitate permitting compliance. The project connects to the Hydro One Networks, Inc., or “HONI,” 230 kV transmission system at the existing Chatham switching station. The South Kent project commenced construction in the first quarter of 2013 and commenced commercial operations in March 2014.
55
Table of Contents
The project sells 100% of its electricity generation, including environmental attributes, to the IESO under a 20-year PPA. The PPA has a stated price, which indexes at Canadian CPI from September 2009 until December 31 of the year prior to commencement of commercial operations which was in March 2014; thereafter 20% of the PPA price escalates at Canadian CPI. The PPA was granted in connection with the Green Energy Investment Agreement, an agreement among Samsung, Korea Electric Power Corporation and the Province of Ontario. This agreement supports growth in domestic renewable energy through both jobs creation and support of wind power and solar power projects. The PPA also provides for compensation by the IESO for certain energy the project is unable to produce due to curtailments directed by the grid operator.
The project is a 50/50 joint venture between us and Samsung. Samsung has customary rights to purchase our interest in South Kent upon any subsequent sale of the project by us.
The project is located on approximately 165 distinct private land parcels and includes a conglomeration of multiple acquired wind power projects and greenfield acquired lands. The project has renegotiated and standardized each of the land agreements that were assumed along with the acquired projects. All land parcels containing project infrastructure are contracted under registered right-of-way agreements, providing for real estate interests in favor of the project in the form of easements-in-gross in respect of each land parcel, enforceable for a term of not less than 40 years.
The project’s generation tie to the HONI transmission system is located on real estate comprised primarily of 26 kilometers of an abandoned railway corridor running across the project area, together with additional private land transmission easements.
El Arrayán
El Arrayán is a 115 MW project located on the coast of Chile, near Ovalle in the Fourth Region. We owned a 31.5% indirect interest in El Arrayán prior to acquiring an additional 38.5% interest in order to obtain majority control (70%) of the project, as a part of our growth strategy. The project consists of 50 2.3 MW Siemens turbines and began commercial operations in June 2014. The project is connected to the Sistema Interconectado Central’s, or “SIC,” 220kV transmission system. El Arrayán is Chile’s largest commercial wind power project and is reflective of the Chilean government’s efforts to diversify its energy sources away from fossil fuels by fostering local renewable energy projects.
The project sells electricity generation into the Chilean spot-market at the prevailing market price at the time of sale. Approximately 70% of the project’s expected output has been hedged under a 20-year fixed-for-floating swap with Minera Los Pelambres, or “MLP,” one of the world’s largest copper mines. The hedge price escalates at 1.5% annually. The hedge includes the transfer of environmental attributes to MLP. The project has also entered into a 20-year PPA with MLP to acquire from the market and supply MLP with up to 40 MW of capacity and related energy. This PPA is purely a cost pass-through arrangement intended to firm the power supplied to MLP, under which MLP will reimburse the project for amounts supplied. MLP is a subsidiary of AMSA, who owns a 30% noncontrolling interest in the project.
The project is located on coastal land and is leased from a single landowner. The land is not presently used for any residential or other commercial purposes. The project entered into a lease agreement with Sociedad Inmobiliaria Correa y Compańía Limitada on January 4, 2012, with a 30-year term covering the project site and comprising all of the turbine sites, collection lines, roads, a project substation and an operations and maintenance building for the project. The project has entered into agreements with four private landowners for the approximately 22 kilometer transmission line corridor from the project substation to the point of interconnection with Transelec S.A.
Mining rights are entirely separate from surface rights in Chile and must be controlled in order to prevent interference by a third party. The project has mining rights for all of its infrastructure including the turbines and operational facilities, the interconnecting transmission line and all main roads which are not public.
56
Table of Contents
Panhandle 1
Panhandle 1 is a 218 MW project located in the Texas Panhandle, in Carson County, Texas. The project consists of 118 GE 1.85 MW turbines and commenced commercial operations in June 2014.
The project is located in the West Zone of the ERCOT market and will sell 100% of its power output into the ERCOT market, receiving the LMP from ERCOT for its actual generation. Approximately 80% of the project’s expected annual electricity generation has been hedged under a physical power hedge with an affiliate of Citigroup with a tenor in excess of ten years. This hedging agreement settles using the North Trading Hub hourly LMP weighted by the settlement volume in each hour. The hourly notional settlement volume varies to match the project’s expected hourly production profile. Panhandle 1’s obligations under the hedge will be secured by a first priority lien on substantially all of the assets of Panhandle 2 and a first priority lien on the membership interests in the project entity.
The project is connected to the ERCOT grid via a new 345kV transmission line owned by Cross Texas Transmission, LLC, which is part of the Texas Competitive Renewable Energy Zone (“CREZ”) program. The project is located on private land pursuant to 40-year easement agreements with approximately 30 private landowners, all of which agreements are in substantially the same form. The project’s operations and maintenance building is shared with the neighboring Panhandle 2 project.
Panhandle 2
Panhandle 2 is a 181.7 MW project located in the Texas Panhandle in Carson County, Texas. The project consists of 79 2.3 MW Siemens SWT 2.3-108 turbines and commenced commercial operations in November 2014.
The project is located in the West Zone of the ERCOT market and will sell 100% of its power output to ERCOT at the project’s point of interconnection. The project will receive the LMP from ERCOT for its actual generation. Approximately 80% of the project’s expected annual electricity generation has been hedged under a physical power hedge with an affiliate of Morgan Stanley with a tenor in excess of ten years. This hedging agreement settles using the North Trading Hub hourly LMP weighted by the settlement volume in each hour. The hourly notional settlement volume varies to match the project’s hourly average production profile. Panhandle 2’s obligations under the hedge are secured by a first priority lien on substantially all of the assets of Panhandle 2 and a first priority lien on the membership interests in the project entity.
The project is connected to the ERCOT grid via a new 345kV transmission line owned by Cross Texas Transmission, LLC, which is part of the Texas Competitive Renewable Energy Zone (“CREZ”) program. The project is located on private land pursuant to 40-year easement agreements with approximately 15 private landowners, all of which agreements are in substantially the same form. The project’s operations and maintenance building is shared with the neighboring Panhandle 1 project.
Grand
Grand is a 148.6 MW project located in Haldimand County in southern Ontario. The project consists of 67 2.3 MW Siemens turbines that have been de-rated to a range from 2.126 MW to 2.221 MW in order to facilitate permitting compliance. The project is connected to the HONI transmission system via a shared transmission line that is co-owned with an adjacent solar facility. The project has executed a co-ownership agreement with that solar facility that ensures unimpeded access across the shared transmission line to the HONI system. The Grand project commenced construction in the third quarter of 2013 and commenced commercial operations in December 2014.
The project sells 100% of its electricity generation, including environmental attributes, to the IESO under a 20-year PPA. The PPA has a stated price, which indexes at Canadian CPI from September 2009 until the
57
Table of Contents
December 31 of the year prior to commencement of commercial operations which was in the fourth quarter of 2014; thereafter 20% of the PPA price escalates at Canadian CPI. The PPA was granted in connection with the Green Energy Investment Agreement, an agreement among Samsung, Korea Electric Power Corporation and the Province of Ontario. This agreement supports growth in domestic renewable energy through both jobs creation and support of wind power and solar power projects. The PPA also provides for compensation by the IESO for certain energy the project is unable to produce due to curtailments directed by the grid operator.
The project is a 45/45/10 joint venture between us, Samsung and the Six Nations. Samsung has customary rights to purchase our interest in South Kent upon any subsequent sale of the project by us.
The Project occupies a combination of leased privately owned farm properties (as to 58 turbines) and leased lands owned and managed by Ontario Infrastructure and Lands Corporation (“OILC”) (as to 9 turbines). All parcels containing Project infrastructure are governed by the terms of standardized leases and easements with terms of a minimum of 45 years (including all renewal periods). The Project’s transmission line is located primarily on a major public road allowance pursuant to a Road Use Agreement (with a registered easement).
The transmission facilities also include a collector substation located on OILC lands, underground transition stations located on two private properties and an interconnection station located on lands controlled by a local aggregate producer. Collector lines and ancillary project infrastructure are located within a public road allowance throughout Haldimand County pursuant to a Road Use Agreement with the municipality.
Construction Project
Logan’s Gap
Logan’s Gap is a 200 MW project that will be built in Comanche County, Texas. The project will consist of 87 Siemens 2.3 MW wind turbines. Located near the Dallas-Fort Worth area, Logan’s Gap Wind will be the Company’s fourth wind project in Texas, serving three different regions throughout the state.
The project is located in the North zone of the ERCOT market and will sell 100% of its power output to ERCOT at the project’s point of interconnection with ERCOT. The project will receive the LMP from ERCOT. Approximately 58% of the expected output of the project will be sold under a 10-year power purchase agreement with Wal-Mart Stores, Inc. An additional 17% of the project’s expected annual electricity generation has been hedged under a physical power hedge with an affiliate of the Bank of America Merrill Lynch. Both the power purchase agreement and the physical hedge settle using the North Trading Hub hourly LMP weighted by the settlement volume in each hour. The hourly notional settlement varies to match the project’s expected hourly production profile. Logan’s Gap’s obligations under the PPA are secured by a Letter of Credit and the obligations under the hedge are secured by a first priority lien on substantially all of the assets of Logan’s Gap and a first priority lien on the membership interests in the project entity.
The project will connect to Oncor’s 138kV Comanche-Zephyr line, which crosses the project site and supplies power to the Dallas-Fort Worth area. The project is located on private land pursuant to 30-year easement agreements with approximately 15 private landowners, all of which agreements are in substantially the same form.
| Item 3. | Legal Proceedings. |
Ocotillo
On April 25, 2012, the County of Imperial certified a Final Environmental Impact Report and Environmental Impact Statement, and entered into a project implementation agreement, or “County Agreement,” regarding the Ocotillo project. On May 11, 2012, the Bureau of Land Management issued a Record of Decision, or “ROD,” and granted a right-of-way relating to the Ocotillo project. The ROD, right-of-way and County
58
Table of Contents
Agreement, which we collectively refer to as the “Approvals,” allow Ocotillo to construct the project. Following issuance of the Approvals, a total of six lawsuits, including one in state court, were filed by various local opposition groups alleging that the Approvals were not appropriately issued. In three lawsuits, the plaintiffs sought preliminary equitable relief to enjoin the construction of the project while the court decided the claims, and in each instance, the court rejected such request and allowed project construction to continue. The project has since been completed and has achieved commercial operations. In addition, the courts have subsequently dismissed all of the lawsuits. At present, three of the dismissals are on appeal to the U.S. Court of Appeals for the Ninth Circuit. The time to appeal two of the dismissed cases has lapsed. The appeal of the state lawsuit has been abandoned.
We do not believe these proceedings will have a material adverse effect on our business, financial position or liquidity based on the information currently available to us, principally because attempts to enjoin the construction of the project have failed, and, subject to the pending appeals described above, the actively adjudicated lawsuits have all been dismissed. We believe, but can give no assurance, that the remaining litigation will ultimately be resolved favorably to the project.
Other Proceedings
We are also subject, from time to time, to various other routine legal proceedings and claims arising out of the normal course of business. These proceedings primarily involve claims from landowners related to calculation of land royalties and warranty claims we initiate against equipment suppliers. The outcome of these legal proceedings and claims cannot be predicted with certainty. Nevertheless, we believe the outcome of any of such currently existing proceedings, even if determined adversely, would not have a material adverse effect on our financial condition or results of operations.
| Item 4. | Mine Safety Disclosures. |
Not applicable.
59
Table of Contents
| Item 5. | Market for Registrant’s Common Equity and Related Stockholder Matters. |
Our Class A common stock began trading on September 27, 2013 on the NASDAQ Global Market under the trading symbol “PEGI” and on the Toronto Stock Exchange (“TSX”) under the trading symbol “PEG”. On February 26, 2015, the last reported sale price of our Class A common stock on the NASDAQ Global Market was $28.12 per share and on the TSX was C$35.08 per share.
The following table sets forth, for the periods indicated, the high and low sales prices for our Class A common stock on the NASDAQ Global Market:
| 2014 | 2013 | |||||||||||||||
| High | Low | High | Low | |||||||||||||
| Fourth Quarter |
$ | 32.03 | $ | 22.68 | $ | 30.81 | $ | 22.26 | ||||||||
| Third Quarter |
$ | 34.51 | $ | 29.61 | $ | 24.30 | $ | 22.81 | ||||||||
| Second Quarter |
$ | 34.15 | $ | 24.35 | N/A | N/A | ||||||||||
| First Quarter |
$ | 31.79 | $ | 25.82 | N/A | N/A | ||||||||||
The following table sets forth, for the periods indicated, the range of high and low sales prices for our Class A common stock on the TSX:
| 2014 | 2013 | |||||||||||||||
| High | Low | High | Low | |||||||||||||
| Fourth Quarter |
C$ | 35.73 | C$ | 26.63 | C$ | 32.30 | C$ | 23.10 | ||||||||
| Third Quarter |
C$ | 36.70 | C$ | 32.51 | C$ | 24.95 | C$ | 23.50 | ||||||||
| Second Quarter |
C$ | 35.39 | C$ | 26.82 | N/A | N/A | ||||||||||
| First Quarter |
C$ | 34.99 | C$ | 26.64 | N/A | N/A | ||||||||||
On February 9, 2015, we completed a follow-on offering of our Class A common stock. In total, 12,000,000 shares of Class A common stock were sold. Of this amount, we issued and sold 7,000,000 shares of our Class A common stock and Pattern Development, the selling stockholder, sold 5,000,000 shares of Class A common stock. We received net proceeds of approximately $196.6 million after deducting underwriting discounts and commissions and estimated offering expenses payable by us. We did not receive any proceeds from the sale of shares sold by Pattern Development. In connection with our initial public offering, we entered into a shareholder approval rights agreement, or the “Shareholder Approval Rights Agreement”, with Pattern Development. Pursuant to the Shareholder Approval Rights Agreement, for so long as Pattern Development beneficially owned at least 33 1 / 3 % of our shares, Pattern Development’s consent was necessary for us to take certain material corporate actions, including: (i) consolidation with or merger into an unaffiliated entity; (ii) certain acquisitions of stock or assets of a third-party; (iii) adoption of a plan of liquidation, dissolution or winding up; (iv) certain dispositions of our subsidiaries’ assets; (v) the incurrence of indebtedness in excess of a specified amount; (vi) a change in the size of our board of directors (subject to certain exceptions); and (vii) issuing equity securities with preferential rights to the Class A common stock. Upon its sale of 5,000,000 shares of Class A stock in connection with the follow-on offering on February 9, 2015, Pattern Development ceased to own at least 33 1 / 3 % of our outstanding common stock, and the term of the Shareholder Approval Rights Agreement expired.
On December 31, 2014, our shares of Class B common stock automatically converted into shares of our Class A common stock on a share-for-share basis, as a result of the occurrence of the Conversion Event. The holders of converted Class B common stock were not eligible for dividends declared for Class A holders of record on December 31, 2014.
In May 2014, we completed a follow-on offering of our Class A common stock. In total, 21,117,171 shares of Class A Common stock were sold. Of this amount, we issued and sold 10,810,810 shares of Class A common
60
Table of Contents
stock and Pattern Development, a selling stockholder, sold 10,306,361 shares of Class A common stock, including 2,754,413 shares upon exercise in full of the underwriters’ overallotment option. Net proceeds generated for us were approximately $286.8 million after deducting underwriting discounts and commissions and transaction expenses. We did not receive any proceeds from the sale of the shares sold by Pattern Development.
Holders of Record
Because many of our shares of Class A common stock are held by brokers and other institutions on behalf of stockholders, we are unable to estimate the total number of stockholders represented by these record holders. As of February 26, 2015, there were approximately 10 stockholders of record of our Class A common stock.
Stock performance chart
This performance graph shall not be deemed “soliciting material” or to be “filed” with the SEC for purposes of Section 18 of the Securities Exchange Act of 1934, as amended (Exchange Act), or otherwise subject to the liabilities under that Section, and shall not be deemed to be incorporated by reference into any filing of Pattern Energy under the Securities Act of 1933, as amended, or the Exchange Act.
The following graph shows a comparison from September 27, 2013 (the date our Class A common stock commenced trading on the NASDAQ Global Select Market) through December 31, 2014 of the cumulative total stockholder return for our Class A common stock, the NASDAQ Composite Index (“NASDAQ Composite”) and the Bloomberg Global Wind Index. The graph assumes that $100 was invested at the market close on September 27, 2013 in the Class A common stock of Pattern Energy, the NASDAQ Composite and the Bloomberg Global Wind Index and also assumes reinvestments of dividends. The stock price performance of the following graph is not necessarily indicative of future stock price performance.
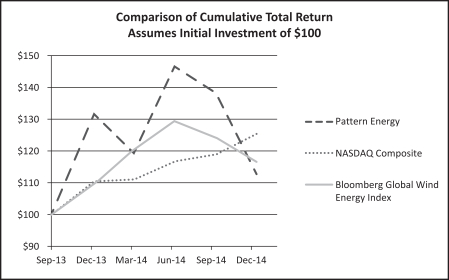
61
Table of Contents
Cash Dividend Policy
We intend to pay regular quarterly dividends in U.S. dollars to holders of our Class A shares. The following table sets forth the dividends declared on shares of Class A common stock for the periods indicated. On November 26, 2013, we announced the initiation of a quarterly dividend on our Class A common stock. On February 24, 2015, the Company increased its dividend to $0.342 per Class A share, or $1.368 per Class A share on an annualized basis, commencing with respect to dividends paid on April 30, 2015 to holders of record on March 31, 2015.
| Dividends Declared | ||||
| Year Ended December 31, 2014 |
||||
| Fourth Quarter |
$ | 0.3350 | ||
| Third Quarter |
$ | 0.3280 | ||
| Second Quarter |
$ | 0.3220 | ||
| First Quarter |
$ | 0.3125 | ||
| Year Ended December 31, 2013 |
||||
| Fourth Quarter |
$ | 0.3125 | ||
| Third Quarter |
— | |||
We have established our quarterly dividend level based on a targeted cash available for distribution payout ratio of 80% both prior to and following the Conversion Event, after considering the annual cash available for distribution that we expect our projects will be able to generate following the commencement of commercial operations at all of our construction projects and with due regard to retaining a portion of the cash available for distribution to grow our business. We intend to grow our business primarily through the acquisition of operational and construction-ready power projects, which, we believe, will facilitate the growth of our cash available for distribution and enable us to increase our dividend per Class A share over time. However, the determination of the amount of cash dividends to be paid to holders of our Class A shares will be made by our Board of Directors and will depend upon our financial condition, results of operations, cash flow, long-term prospects and any other matters that our Board of Directors deem relevant. See Item 1A “Risk Factors—Risks Related to Ownership of our Class A Shares—Risks Regarding our Cash Dividend Policy.”
We expect to pay a quarterly dividend on or about the 30th day following each fiscal quarter to holders of record of our Class A shares on the last day of such quarter.
Our cash available for distribution is likely to fluctuate from quarter to quarter, perhaps significantly, as a result of variability in wind conditions and other factors. Accordingly, during quarters in which we generate cash available for distribution in excess of the amount required to pay our stated quarterly dividend, we may reserve a portion of the excess to fund dividends in future quarters. In addition, we may use sources of cash not included in our calculation of cash available for distribution, such as certain net cash provided by financing and investing activities, to pay dividends to holders of our Class A shares in quarters in which we do not generate sufficient cash available for distribution to fund our stated quarterly dividend. Although these other sources of cash may be substantial and available to fund a dividend payment in a particular period, we exclude these items from our calculation of cash available for distribution because we consider them non-recurring or otherwise not representative of the operating cash flows we typically expect to generate.
Cash Available for Distribution
Our management team considers various financial performance and liquidity measures, including net income, Adjusted EBITDA and cash available for distribution, in assessing the amount of cash that we expect our projects will be able to generate during a given period. Adjusted EBITDA and cash available for distribution are non-U.S. GAAP financial measures that we intend to use to assist us in determining whether we are generating cash flow at a level that can sustain, or support an increase in, our dividend.
62
Table of Contents
We believe that an understanding of cash available for distribution is useful to investors in evaluating our ability to pay dividends pursuant to our stated cash dividend policy. We define “cash available for distribution” as net cash provided by operating activities, determined in accordance with U.S. GAAP, as adjusted by:
| • | adding or subtracting changes in operating assets and liabilities; |
| • | subtracting net deposits into restricted cash accounts, which are required pursuant to the cash reserve requirements of financing agreements, to the extent they are paid from operating cash flows during a period; |
| • | subtracting cash distributions paid to noncontrolling interests; |
| • | subtracting scheduled project-level debt repayments in accordance with the related loan amortization schedule, to the extent they are paid from operating cash flows during a period; |
| • | subtracting non-expansionary capital expenditures, to the extent they are paid from operating cash flows during a period; |
| • | adding cash distributions received from unconsolidated investments, to the extent such distributions were derived from operating cash flows; and |
| • | adding or subtracting other items as necessary to present the cash flows we deem representative of our core business operations. |
Repurchase of Equity Securities
The table below provides information with respect to repurchases of our Class A common stock during the fourth quarter ended December 31, 2014. All shares were tendered to us in satisfaction of employee tax withholding obligations upon the vesting of restricted stock grants under our 2013 Equity Incentive Award Plan. We currently do not have a stock repurchase plan in place.
| Period |
Total Number of Shares Purchased |
Average Price Paid Per Share |
||||||
| 10/1/14 - 10/31/2014 |
323 | $ | 29.12 | |||||
| 11/1/14 - 11/30/2014 |
323 | $ | 26.53 | |||||
| 12/1/14 - 12/31/2014 |
12,105 | $ | 24.36 | |||||
|
|
|
|
|
|||||
| 12,751 | $ | 24.53 | ||||||
|
|
|
|
|
|||||
Unregistered Sales of Equity Securities and Use of Proceeds
None.
63
Table of Contents
| Item 6. | Selected Financial Data. |
Set forth below is our summary historical consolidated financial data. The consolidated statements of operations data for the years ended December 31, 2014, 2013 and 2012 and the consolidated balance sheet data as of December 31, 2014 and 2013 are derived from our audited consolidated financial statements included in this Form 10-K. The consolidated statements of operations data for the years ended December 31, 2011 and 2010 and the consolidated balance sheet data as of December 31, 2012, 2011 and 2010 are derived from our audited consolidated financial statements not included in this Form 10-K. This information may not be indicative of our future results of operations, financial position and cash flows and should be read in conjunction with the consolidated financial statements and notes thereto and Item 7 “Management’s Discussion and Analysis of Financial Condition and Results of Operations” presented elsewhere in this Form 10-K. We believe that the assumptions underlying the preparation of our historical consolidated financial statements are reasonable.
| Year Ended December 31, | ||||||||||||||||||||
| 2014 | 2013 | 2012 | 2011 | 2010 | ||||||||||||||||
| (in thousands, except per share data) | ||||||||||||||||||||
| Statement of Operations Data: |
||||||||||||||||||||
| Total revenue |
$ | 265,493 | $ | 201,573 | $ | 114,528 | $ | 135,859 | $ | 49,574 | ||||||||||
| Total cost of revenue |
182,192 | 140,857 | 83,870 | 70,767 | 31,481 | |||||||||||||||
|
|
|
|
|
|
|
|
|
|
|
|||||||||||
| Gross profit |
83,301 | 60,716 | 30,658 | 65,092 | 18,093 | |||||||||||||||
|
|
|
|
|
|
|
|
|
|
|
|||||||||||
| Total operating expenses |
28,320 | 12,988 | 11,636 | 9,668 | 10,155 | |||||||||||||||
|
|
|
|
|
|
|
|
|
|
|
|||||||||||
| Operating income |
54,981 | 47,728 | 19,022 | 55,424 | 7,938 | |||||||||||||||
|
|
|
|
|
|
|
|
|
|
|
|||||||||||
| Total other income (expense) |
(91,844 | ) | (33,110 | ) | (36,002 | ) | (28,829 | ) | (1,572 | ) | ||||||||||
|
|
|
|
|
|
|
|
|
|
|
|||||||||||
| Net income (loss) before income tax |
(36,863 | ) | 14,618 | (16,980 | ) | 26,595 | 6,366 | |||||||||||||
| Tax (benefit) provision |
3,136 | 4,546 | (3,604 | ) | 689 | (672 | ) | |||||||||||||
|
|
|
|
|
|
|
|
|
|
|
|||||||||||
| Net income (loss) |
(39,999 | ) | 10,072 | (13,376 | ) | 25,906 | 7,038 | |||||||||||||
| Net (loss) income attributable to noncontrolling interest |
(8,709 | ) | (6,887 | ) | (7,089 | ) | 16,981 | 2,474 | ||||||||||||
|
|
|
|
|
|
|
|
|
|
|
|||||||||||
| Net income (loss) attributable to controlling interest |
$ | (31,290 | ) | $ | 16,959 | $ | (6,287 | ) | $ | 8,925 | $ | 4,564 | ||||||||
|
|
|
|
|
|
|
|
|
|
|
|||||||||||
| Less: Net income attributable to controlling interest prior to the IPO on October 2, 2013 |
(30,295 | ) | ||||||||||||||||||
|
|
|
|||||||||||||||||||
| Net loss attributable to controlling interest subsequent to the IPO |
$ | (13,336 | ) | |||||||||||||||||
|
|
|
|||||||||||||||||||
| Earnings (loss) per share |
||||||||||||||||||||
| Class A common stock: basic and diluted loss per share |
(0.56 | ) | (0.17 | ) | N/A | N/A | N/A | |||||||||||||
| Class B common stock: basic and diluted loss per share |
(0.49 | ) | (0.48 | ) | N/A | N/A | N/A | |||||||||||||
| Cash dividends declared per Class A common share |
1.30 | 0.31 | N/A | N/A | N/A | |||||||||||||||
| Deemed dividends per Class B common share |
1.41 | N/A | N/A | N/A | N/A | |||||||||||||||
| Shares used in calculation of Class A basic and diluted loss per share |
42,362 | 35,448 | N/A | N/A | N/A | |||||||||||||||
| Shares used in calculation of Class B basic and diluted loss per share |
15,555 | 15,555 | N/A | N/A | N/A | |||||||||||||||
| December 31, | ||||||||||||||||||||
| 2014 | 2013 | 2012 | 2011 | 2010 | ||||||||||||||||
| (in thousands) | ||||||||||||||||||||
| Balance Sheet Data: |
||||||||||||||||||||
| Cash |
$ | 101,656 | $ | 103,569 | $ | 17,574 | $ | 47,673 | $ | 8,928 | ||||||||||
| Construction in progress |
26,195 | — | 6,081 | 201,245 | 291,089 | |||||||||||||||
| Property, plant and equipment , net |
2,350,856 | 1,476,142 | 1,668,302 | 784,859 | 500,403 | |||||||||||||||
| Total assets |
2,832,042 | 1,903,631 | 2,035,730 | 1,390,426 | 1,058,493 | |||||||||||||||
| Long-term debt |
1,450,613 | 1,249,218 | 1,290,570 | 867,548 | 637,964 | |||||||||||||||
| Total liabilities |
1,667,308 | 1,335,627 | 1,446,318 | 943,728 | 722,549 | |||||||||||||||
| Total equity before noncontrolling interest |
634,148 | 468,210 | 514,111 | 362,226 | 255,160 | |||||||||||||||
| Noncontrolling interest |
530,586 | 99,794 | 75,301 | 84,472 | 80,784 | |||||||||||||||
| Total equity |
1,164,734 | 568,004 | 589,412 | 446,698 | 335,944 | |||||||||||||||
64
Table of Contents
Item 7. Management’s Discussion and Analysis of Financial Condition and Results of Operations
The following discussion and analysis of our financial condition and results of operations should be read in conjunction with our financial statements and related notes included elsewhere in this Form 10-K. The following discussion contains “forward-looking statements” that reflect our future plans, estimates, beliefs and expected performance. Our actual results may differ materially from those currently anticipated and expressed in such forward-looking statements as a result of a number of factors, including those we discuss under Item 1A “Risk Factors” elsewhere in this Form 10-K. We caution that assumptions, expectations, projections, intentions or beliefs about future events may, and often do, vary from actual results and the differences can be material. See “Cautionary Notice Regarding Forward-Looking Statements.”
Overview
We are an independent power company focused on owning and operating power projects with stable long-term cash flows in attractive markets with potential for continued growth of our business. We hold interests in twelve wind power projects located in the United States, Canada and Chile that use proven, best-in-class technology and have a total owned capacity of 1,636 MW. These projects consist of eleven operating projects with one project under construction. Our one construction project, the Logan’s Gap project, which we acquired from Pattern Development on December 19, 2014, is scheduled to commence commercial operations prior to the end of 2015. Each of our projects has contracted to sell all or a majority of its output pursuant to a long-term, fixed-price power sale agreement with a creditworthy counterparty. One of our counterparties, PREPA, has been downgraded. See “Risk Factors—Our projects rely on a limited number of key power purchasers. The power purchaser for our Santa Isabel project has been downgraded”. Eighty-nine percent of the electricity to be generated by our projects will be sold under these power sale agreements which have a weighted average remaining contract life of approximately 16 years.
We intend to maximize long-term value for our stockholders in an environmentally responsible manner and with respect for the communities in which we operate. Our business is built around the core values of creating a safe, high-integrity and exciting work environment; applying rigorous analysis to all aspects of our business; and proactively working with our stakeholders in addressing environmental and community concerns. Our financial objectives, which we believe will maximize long-term value for our stockholders, are to produce stable and sustainable cash available for distribution, selectively grow our project portfolio and our dividend and maintain a strong balance sheet and flexible capital structure.
Our growth strategy is focused on the acquisition of operational and construction-ready power projects from Pattern Development and other third parties that we believe will contribute to the growth of our business and enable us to increase our dividend per share over time. We expect our continuing relationship with Pattern Development, a leading developer of renewable energy and transmission projects, will be an important source of growth for our business. In addition, we also expect opportunities in Japan and Mexico, to form part of our growth strategy. Currently, Pattern Development has a 4,500 MW pipeline of development projects, all of which are subject to our right of first offer.
Factors that Significantly Affect our Business
Our results of operations in the near-term as well as our ability to grow our business and revenue from electricity sales over time could be impacted by a number of factors, including those affecting our industry generally and those that could specifically affect our existing projects and our ability to grow.
Recent Transactions
On February 19, 2015, we announced that Pattern Development has signed a joint venture agreement with CEMEX Energia, a subsidiary of CEMEX, S.A.B. de C.V. to jointly develop renewable energy projects
65
Table of Contents
throughout Mexico. Pattern Development and CEMEX Energia have set a goal of developing 1,000 MW of renewable generation in Mexico over the next five years. Pattern Development’s 4,500 MW pipeline of development projects also includes 1,000 MW of Mexican wind and solar power projects, all of which are subject to our Purchase Rights.
On February 9, 2015, we completed a follow-on offering of our Class A common stock. In total, 12,000,000 shares of Class A common stock were sold. Of this amount, we issued and sold 7,000,000 shares of our Class A common stock and Pattern Development, the selling stockholder, sold 5,000,000 shares of Class A common stock. We received net proceeds of approximately $196.6 million after deducting underwriting discounts and commissions and estimated offering expenses payable by us. We intend to use the net proceeds from the offering for working capital and general corporate purposes, including investment in one or more acquisition opportunities from Pattern Development, or third parties, which we are considering, and the potential repayment of outstanding indebtedness under our existing revolving credit facility. We did not receive any proceeds from the sale of shares sold by Pattern Development.
On January 28, 2015, we announced that Pattern Development acquired a majority stake in Green Power Investment Corporation (“GPI”), based in Tokyo, Japan. GPI has 1,000 MW in various stages of development, spread across a number of existing near and longer term development projects. Pattern Development’s expected interest in the GPI projects is included in its 4,500 MW pipeline of development projects, all of which are subject to our Purchase Rights.
Since September 2014, we have added five new Identified ROFO Projects to our list of identified projects that we expect to acquire from Pattern Development in connection with our Purchase Rights:
| • | On February 13, 2015, Pattern Development announced that it had entered into a 25-year PPA with Hydro-Québec in connection with a 147 MW wind power project proposed to be built in the Chaudière-Appalaches region, approximately 50 kilometers south of Québec City. Pattern Development expects to retain the full interest in the Mont Sainte-Marguerite Wind project. The project is expected to begin commercial operation in late 2017. |
| • | On January 20, 2015, Pattern Development announced that it had entered into a 13-year PPA with a subsidiary of Amazon.com in connection with a 150 MW wind power project proposed to be built in Indiana. Pattern Development expects to retain an owned capacity in the project of approximately 116 MW. The project is expected to begin commercial operation in late 2015 or early 2016. |
| • | On November 5, 2014, Pattern Development announced the addition of 150 MW of the 300 MW Henvey Inlet wind power project to our list of Identified ROFO list. The project has a 20-year power purchase agreement with Ontario Power Authority, and is expected to begin construction in 2016. |
| • | On September 30, 2014, Pattern Development announced that its Conejo Solar photovoltaic power project in Chile had secured a 22-year PPA with an affiliate of Antofagasta Minerals SA. The 104 MW Conejo Solar project, which will be constructed approximately 30 kilometers east of Taltal in Chile’s Atacama Desert, was originated by Pattern Development and upon completion will be the largest solar energy project in Chile with a PPA. The project’s PPA is with Minera Los Pelambres for approximately 70% of the project’s output over the term of the agreement. Conejo Solar is 100% owned by Pattern Development. A third party has an option to buy a 30% stake in the project. |
| • | On September 30, 2014, Pattern Development announced that, together with Samsung Renewable Energy, Inc. (Samsung), it has signed a 20-year PPA with the Ontario Power Authority for the 100 MW Belle River Wind project in Ontario. Samsung and Pattern Development will jointly develop, own and operate the Belle River Wind project, which will be built in Lakeshore, Ontario. |
66
Table of Contents
Trends Affecting our Industry
Wind and solar power have been among the fastest growing sources of electricity generation in North America and globally over the past decade. This rapid growth is largely attributable to wind and solar power’s increasing cost competitiveness with other electricity generation sources, the advantages of wind and solar power over other renewable energy sources and growing public support for renewable energy driven by concerns about security of energy supply and the environment. We expect these trends to continue to drive future growth in the wind power industry.
We believe that the key drivers for the long-term growth of wind power in North America include:
| • | overall and regional demand for new power plants resulting from regulatory or policy initiatives, such as state or provincial RPS programs or EPA’s 111d carbon regulations, motivating utilities to procure electricity supply from renewable resources; |
| • | efficiency and capital cost improvements in wind, solar and other renewable energy technologies, enabling wind and other forms of renewable energy to compete successfully in more markets; |
| • | governmental incentives, including PTCs, which improve the cost competitiveness of renewable energy compared to traditional sources; |
| • | environmental and social factors supporting increasing levels of wind, solar and other renewable technologies in the generation mix: |
| • | regulatory barriers increase the time, cost and difficulty of permitting new fossil fuel-fired facilities, notably coal, and nuclear facilities; |
| • | decommissioning of aging coal-fired and nuclear facilities is expected to leave a gap in electricity supply; and |
| • | policy initiatives to include the cost of carbon pollution in conventional fossil fuel-fired electricity generation will increase costs of conventional generation; and |
| • | price volatility for natural gas used for electricity generation. |
Uncertainty related to the demand for power, generally, and thus the need for new power projects, and the expiration of U.S. federal incentives resulted in a reduction in the build rate of wind and solar power and other renewable energy projects in 2013, compared to 2012. In 2014, 4,854 MW were installed in the U.S; however, after the most recent PTC extension, over 10 GW is under construction in 2015. We expect adverse effects of PTC uncertainty to be partially or fully offset in certain markets by regional requirements for new power projects due to older power project retirements, passage of an extension or modification of the U.S. federal tax incentives or other government actions in support of new wind power projects, a potential return to higher natural gas prices, desire, on the part of regulatory commissions and ratepayers, for more stable power sale agreements such as those which wind and solar power projects are ideally suited to provide, and increased difficulty in permitting conventional power projects. In the long term, we believe that substantial growth potential remains in the U.S. market.
In addition, we continue to see more opportunities to acquire wind and solar projects in the North America market than has been typical for the past decade. Three factors are driving this accelerated activity level:
| • | We believe that many project developers have scaled back their wind project development teams and investment activity in reaction to the prior or anticipated potential expirations of PTC and ITC cash grant programs and continued uncertainty about federal, state and provincial energy policies and as a result of perceptions about slower market growth in the near term; |
67
Table of Contents
| • | A number of large European utilities that have been major participants in the U.S. wind power market appear to be strengthening their consolidated balance sheets due to their own home market issues by selling portions of their U.S. investment portfolios; and |
| • | The emergence of “yieldcos” has provided a new class of investors with an appetite for investment in contract-based renewable power projects. |
In general, we continue to believe that there will be additional acquisition opportunities in the United States in the short term and that the longer-term growth trend will continue. We have seen this occur in previous periods when tax credit extensions were uncertain, and we consider it likely to happen again in the coming years. We are a relatively small company involved in a large and somewhat fragmented market in which we believe our fully integrated approach to the business allows us to assess and execute on market opportunities quickly.
Our Outlook
Our projects are generally unaffected by the short-term trends discussed above, given that 89% of the electricity to be generated by our projects is to be sold under our fixed-price power sale agreements, which have a weighted average remaining life of approximately 16 years, as well as, the geographic diversity of our projects and the limited impact that uncertainty related to U.S. federal incentives will have upon completion of construction projects we may have in the United States, Canada and Chile.
Our near-term growth strategy will focus on wind power projects, but will also include evaluation of solar power opportunities, and is largely insulated from the short-term trends. In September 2014, we announced the addition of our first solar project, the 104 MW Conejo Solar photovoltaic power project in Chile to our list of Identified ROFO projects. We expect that most of our short-term growth will come from opportunities to acquire the Identified ROFO Projects, including, among others, those located in Ontario, which have executed power sale agreements with terms substantially similar to our South Kent and Grand PPAs, Pattern Development’s Amazon project, which has already qualified for PTCs and has a long-term power sale agreement, pursuant to our Purchase Rights and the Pattern Development retained Gulf Wind interest pursuant to our Gulf Wind Call Right.
Factors Affecting Our Operational Results
The primary factors that will affect our financial results are (i) the timing of commencement of commercial operations at our construction projects, (ii) the amount and price of electricity sales by our operating projects, (iii) accounting for derivative instruments, (iv) acquisitions of new projects, (v) achievement of efficient project operations, and (v) interest expense on our corporate- and project-level debt.
Timing of Commencement of Commercial Operations at Our Construction Projects
During 2014, five of our construction projects reached commercial operations and have contributed an additional operating capacity of 602 MW. In December 2014, we acquired another construction project, Logan’s Gap, that we expect will contribute an additional operating capacity of 164 MW in 2015, for an aggregate owned capacity of 1,636 MW. Our near-term operating results will, in part, depend upon our ability to transition our Logan’s Gap project into commercial operations in accordance with our existing construction budgets and schedules. The following table sets forth our construction project as well as its power capacity and our anticipated date of its commencement of commercial operations.
| Location | Construction Start |
Commercial Operations |
MW | |||||||||||
| Projects |
Rated | Owned | ||||||||||||
| Logan’s Gap |
Texas | Q4 2014 | Q4 2015 | 200 | 164 | |||||||||
|
|
|
|
|
|||||||||||
| 200 | 164 | |||||||||||||
|
|
|
|
|
|||||||||||
68
Table of Contents
We construct our projects under fixed-price and fixed-schedule contracts with major equipment suppliers and experienced balance-of-plant constructors. Under our management team’s supervision, the construction of our South Kent, El Arrayán, Panhandle 1, Panhandle 2 and Grand projects were completed in 2014. Including their time together before forming Pattern Energy, our management team has constructed and placed into service 30 wind power projects with an aggregate generating capacity of over 3,500 MW. In 2015, we expect that our Logan’s Gap project will commence commercial operations and add an additional 164 MW of owned capacity to our operating project portfolio.
Electricity Sales and Energy Derivative Settlements of Our Operating Projects
Our electricity sales and energy derivative settlements are primarily determined by the price of electricity and any environmental attributes we sell under our power sale agreements and the amount of electricity that we produce, which is in turn principally the result of the wind conditions at our project sites and the performance of our equipment. Eighty-nine percent of the electricity to be generated across our projects is currently committed under long-term, fixed-price power sale agreements which have a weighted average remaining contract life of approximately 16 years.
Wind conditions and equipment performance represent the primary factors affecting our near-term operating results because these variables impact the volume of the electricity that we are able to generate from our operating projects.
Our revenue from electricity sales and energy derivative settlements during a period is primarily a function of the amount of electricity generated by our projects. The electricity generated from our power projects depends primarily on wind and weather conditions at each specific site and the performance of our equipment. We base our estimates of each project’s capacity to generate electricity on the findings of our internal and external experts’ long-term meteorological studies, which includes on-site data collected from equipment on the property and relevant reference wind data from other sources, as well as specific equipment power curves and estimates for the performance of our equipment over time.
Our wind analysis evaluates the wind’s speed and prevailing direction, atmospheric conditions, and wake and seasonal variations for each project. The result of our meteorological analysis is a probabilistic assessment of a project’s likely output. A P50 level of production indicates we believe a 50% probability exists that the electricity generated from a project will exceed a specified aggregate amount of electricity generation during a given period. While we plan for variability around this P50 production level, it generally provides the foundation for our base case expectation. The variability is measured in a spectrum of possible output levels such as a P75 output level, which indicates that over a specified period of time, such as one or ten years, the P75 output level would be exceeded 75% of the time. Similarly, the P25 output level would be exceeded 25% of the time. We often use P95, P90 and P75 production levels to plan ahead for low-wind years, while recognizing that we should also have corresponding high-wind years.
In addition to annual P50 variability, we also expect seasonal variability to occur. Variability increases as the period of review shortens, so it is likely that we will experience more variability in monthly or quarterly production than we do for annual production. Therefore, our periodic cash flow and payout ratios will also reflect more variability during periods shorter than a year. As a result, we use cash reserves to help manage short term production and cash flow variability.
When analyzed together, a portfolio’s probability of exceedance changes when all the projects are considered as a portfolio instead of on a stand-alone basis. Due to the geographical separation between our projects, the uncertainty variables and wind speed correlations are diverse enough across the portfolio to provide improvement in the overall uncertainty, which we refer to as the portfolio effect. For example, the sum of our individual projects’ P75 output levels is approximately 92% of the aggregate P50 output level (which is unaffected by the portfolio effect), while the P75 output level, when taking into account the portfolio effect, is
69
Table of Contents
approximately 95% of our aggregate P50 output level. On a portfolio basis, our P90 and P95 production estimates for the annual electricity generation of our twelve projects, once they are all fully operational, are approximately 91% and 88%, respectively, of our estimated P50 output levels. The portfolio effect results in an improvement in the production stability across the portfolio. A greater diversity of projects in the portfolio has the effect of increasing the frequency of occurrences aggregated around the expected result (probability level). This is demonstrated in the following diagram:
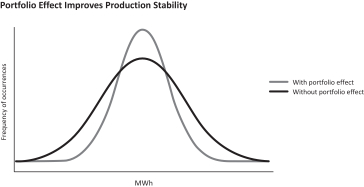
Our electricity generation is also dependent on the equipment that we use. We have selected high-quality equipment with a goal of having a concentration of turbines from top manufacturers. We employ (or will employ) the Siemens 2.3 MW turbine at ten of our twelve project sites, the Mitsubishi MWT95/2.4 turbine at our Gulf Wind site and the GE 1.85 87 turbine at our Panhandle 1 site. With a combination of high-quality equipment and scale, we have structured our projects such that we may expect high availability and long-term production from the equipment, develop operating expertise and experience, which can be shared among our operators, obtain a high level of attention and focus from the manufacturers and maintain a shared spare parts inventory and common operating practices. Given our manufacturers’ global fleet sizes and strong balance sheets, the warranties that we secure for our turbines and our operating approach described below, we are confident in our expectations for reliable long-term turbine operation.
Accounting for Derivative Instruments
We have, and expect to continue to enter into, contracts to hedge against risks related to fluctuations in energy prices and interest rates on our project loans and foreign currency exchange rates. We recognize derivative instruments as assets or liabilities at fair value in our consolidated balance sheets, unless the derivative instruments qualify for the “normal purchase normal sale” (“NPNS”) scope exception to derivative accounting. Our method of accounting for a change in the fair value (i.e., gains or losses) of a derivative instrument depends on whether it has been designated as part of a hedging relationship and, if so, on the type of hedging relationship. For derivative instruments that are not designated, such as our energy derivatives and certain of our interest rate derivatives, changes in fair value are recorded as a component of net income on our consolidated statement of operations. Certain of our electricity price derivatives that qualify for the NPNS scope exception to derivative accounting are accounted for under the accrual method of accounting. For derivative instruments that are designated as cash flow hedges, the effective portion of the change in the fair value of the instrument is recorded as a component of other comprehensive income. Changes in the fair value of derivative instruments designated as cash flow hedges are subsequently reclassified into net income in the period that the hedged transaction affects earnings. The ineffective portion of changes in the fair value of designated hedges is also recorded as a component of current net income.
70
Table of Contents
The fair value of a derivative is a function of a number of factors, including the duration and notional volume of the derivative and forward price curve for the product or item to which the derivative applies. In general, there is more volatility in the fair value of derivative instruments that are designed to protect long-dated risks, such as an 18-year loan amortization profile, than those with short durations, such as a two-year foreign currency fixed-for-floating swap. Where possible, we have sought to protect ourselves against electricity and interest rate exposures with a relatively longer term hedging strategy. We expect to hedge exposure to foreign currency exchange rates in the future over shorter periods of time. Accordingly, we have experienced in the past, and expect to record in the future, substantial volatility in the components of our net income that relate to the mark-to-market adjustments on our undesignated energy and interest rate derivatives.
We believe that mark-to-market adjustments that we make to the fair value of our derivative assets and liabilities are generally mirrored by changes in the economic value of the related operating or financial assets, such as our wind projects and our project loans, for which the application of accounting principles generally accepted in the United States (“U.S. GAAP”) does not permit us to record such economic gains and losses. For this reason, and because one of our principal financial objectives is to produce stable and sustainable cash available for distribution, we believe that the economic value to our stockholders reflected in these derivative instruments, outweighs the risk of volatility in net income that we expect to report. Accordingly, we believe it is useful to investors to consider supplemental financial measures that we report, such as Adjusted EBITDA, where we have subtracted and added back, as applicable, the unrealized gains and losses arising from mark-to-market adjustments on our derivative instruments, and cash available for distribution.
Acquisitions of New Projects
We expect that the acquisition of operational and construction-ready power projects from Pattern Development and other third parties will contribute to our operational results. Below is a summary of the Identified ROFO Projects that we expect to acquire from Pattern Development in connection with our Purchase Rights:
| Identified ROFO Projects |
Status | Location | Construction Start (1) |
Commercial Operations (2) |
Contract Type |
Rated(3) | Pattern Development- Owned(4) |
|||||||||||
| Gulf Wind(5) |
Operational | Texas | 2008 | 2009 | Hedge | 283 | 76 | |||||||||||
| K2 |
In construction | Ontario | 2014 | 2015 | PPA | 270 | 90 | |||||||||||
| Armow |
In construction | Ontario | 2014 | 2015 | PPA | 180 | 90 | |||||||||||
| Meikle |
Ready for financing | British Columbia | 2015 | 2016 | PPA | 185 | 185 | |||||||||||
| Conejo Solar |
Ready for financing | Chile | 2015 | 2016 | PPA | 104 | 73 | |||||||||||
| Belle River |
Securing final permits | Ontario | 2016 | 2017 | PPA | 100 | 50 | |||||||||||
| Henvey Inlet |
Late stage development | Ontario | 2016 | 2017 | PPA | 300 | 150 | |||||||||||
| Amazon |
Ready for financing | Indiana | 2015 | Late 2015 / Early 2016 |
PPA | 150 | 116 | |||||||||||
| Mont Sainte-Marguerite |
Late stage development | Québec | 2016 | 2017 | PPA | 147 | 147 | |||||||||||
|
|
|
|
|
|||||||||||||||
| 1,719 | 977 | |||||||||||||||||
|
|
|
|
|
|||||||||||||||
| (1) | Represents date of actual or anticipated commencement of construction. |
| (2) | Represents date of actual or anticipated commencement of commercial operations. |
| (3) | Rated capacity represents the maximum electricity generating capacity of a project in MW. As a result of wind and other conditions, a project or a turbine will not operate at its rated capacity at all times and the amount of electricity generated will be less than its rated capacity. The amount of electricity generated may vary based on a variety of factors discussed elsewhere in this Form 10-K. |
| (4) | Pattern Development-owned capacity represents the maximum, or rated, electricity generating capacity of the project multiplied by Pattern Development’s percentage ownership interest in the distributable cash flow of the project. |
| (5) | We have a call right to acquire Pattern Development’s retained interest in the Gulf Wind project, at fair market value, at any time between October 2, 2014 and October 2, 2015. |
71
Table of Contents
Project Operations
Our ability to generate electricity in an efficient and cost-effective manner is impacted by our ability to maintain the operating capacity of our projects. We use reliable and proven wind turbines and other equipment for each of our projects.
For the years ended December 31, 2014, 2013 and 2012, our turbine availability across our projects was 95.7%, 88.3% and 97.6%, respectively. For the year ended December 31, 2014, Gulf Wind had higher than normal downtime due primarily to blade issues which were compensated by the manufacturer under warranty. The remainder of the fleet, including the several new sites that went through startup in 2014, had an average turbine availability of 97.2%, which is in line with industry standards for original investment projections reviewed by independent engineering firms. For the year ended December 31, 2013, our turbine availability was lower than industry standards due primarily to the blade issue at our Santa Isabel and Ocotillo projects and certain equipment issues at our Spring Valley project, which were covered under manufacturer’s warranty (including compensation for downtime) and have since been fully remedied.
See Item 1 “Business—Organization of Our Business—Operations and Maintenance.” To accomplish this level of availability, we provide forward-looking wind forecasts to each of our sites twice a day. Our site managers use this information to plan the maintenance activities for those days, in order to schedule maintenance during low wind periods, where impact to revenues is minimized. In addition, for sites with power prices that vary during different periods, we schedule work to avoid known or anticipated high price periods.
In addition, as a result of the importance we place on safety and implementation of a safety management program, the Company has experienced no significant lost time events, worksite accidents, or other significant environmental, health or safety, or “EHS,” issues with its employees and facilities in 2014 or 2013. Certain contractors or subcontractors at our construction sites have had worksite accidents, and we continue to work with these third parties to improve their safety performance.
Debt Financing
We intend to use a portion of our revenue from electricity sales to cover our subsidiaries’ interest expense and principal payments on borrowings under their respective project financing facilities. In the near-term, our interest expense primarily reflects (i) imputed interest on the lease financing of our Hatchet Ridge project, (ii) periodic interest on the term loan financing arrangements at our other operating projects and (iii) interest on short-term loan facilities, including any borrowings under our revolving credit facility.
We believe that our projects have been financed on average with stronger coverage ratios than is typical in our industry. A debt service coverage ratio is generally defined as a project’s operating cash flows divided by scheduled payments of principal and interest for a period. While we believe that the commercial bank market generally seeks a minimum average annual debt service coverage ratio for wind power projects, based on P50 output levels, of between 1.4 and 1.5 to 1.0, our projects, on a portfolio basis, have an expected average annual debt service coverage ratio over the remaining scheduled loan amortization periods of approximately 1.7 to 1.0.
Key Metrics
We regularly review a number of financial measurements and operating metrics to evaluate our performance, measure our growth and make strategic decisions. In addition to traditional U.S. GAAP performance and liquidity measures, such as revenue, cost of revenue, net income and cash provided by (used in) operating activities, we also consider proportional MWh sold, average realized electricity price and Adjusted EBITDA in evaluating our operating performance and cash available for distribution as supplemental liquidity measures. Each of these key metrics is discussed below.
72
Table of Contents
Proportional MWh Sold and Average Realized Electricity Price
The number of MWh sold and the average realized price per MWh sold are the operating metrics that determine our revenue, as well as the revenue of our unconsolidated investments. As a result of the commencement of commercial operations at our South Kent, El Arrayán, Panhandle 1 and Panhandle 2 projects, each of which is a partially owned project, we believe it is appropriate to focus on our proportional interest in the production of our project interests. Accordingly, we are reporting proportional MWh sold (in lieu of MWh sold, which we have previously reported) and revising our calculation of average realized electricity price to reflect our proportional interest in both revenues and MWh sold. Additionally, as a result we only include in these reported figures our proportional interest in the production at our Gulf Wind project where, previously, the noncontrolling interest in the production was included in our determination of MWh sold and average realized electricity price. Proportional MWh sold for any period presented, represents the sum of the product of (i) the number of MWh sold by each of our projects multiplied by (ii) our percentage interest in each projects’ distributable cash flow. For any period presented, average realized electricity price represents (i) the sum of the products of: (a) total revenue from electricity sales and energy derivative settlements at each of our projects and (b) our percentage interest in each project’s distributable cash flow, divided by (ii) our proportional MWh sold.
Adjusted EBITDA
We define Adjusted EBITDA as net income before net interest expense, income taxes and depreciation and accretion, including our proportionate share of net interest expense, income taxes and depreciation and accretion of joint venture investments that are accounted for under the equity method. Adjusted EBITDA is a non-U.S. GAAP measure. Adjusted EBITDA also excludes the effect of certain mark-to-market adjustments and infrequent items not related to normal or ongoing operations, such as early payment of debt and realized derivative gain or loss from refinancing transactions, and gain or loss related to acquisitions or divestitures. In calculating Adjusted EBITDA, we exclude mark-to-market adjustments to the value of our derivatives because we believe that it is useful for investors to understand, as a supplement to net income and other traditional measures of operating results, the results of our operations without regard to periodic, and sometimes material, fluctuations in the market value of such assets or liabilities.
The most directly comparable U.S. GAAP measure to adjusted EBITDA is net (loss) income. The following table reconciles net (loss) income to Adjusted EBITDA for the periods presented and is unaudited (in thousands):
| Year ended December 31, | ||||||||||||
| 2014 | 2013 | 2012 | ||||||||||
| Net (loss) income |
$ | (39,999 | ) | $ | 10,072 | $ | (13,376 | ) | ||||
| Plus: |
||||||||||||
| Interest expense, net of interest income |
66,729 | 61,118 | 35,457 | |||||||||
| Tax provision (benefit) |
3,136 | 4,546 | (3,604 | ) | ||||||||
| Depreciation and accretion |
104,417 | 83,180 | 49,027 | |||||||||
|
|
|
|
|
|
|
|||||||
| EBITDA |
$ | 134,283 | $ | 158,916 | $ | 67,504 | ||||||
|
|
|
|
|
|
|
|||||||
| Unrealized loss on energy derivative |
3,878 | 11,272 | 6,951 | |||||||||
| Unrealized loss (gain) on derivatives |
11,668 | (15,601 | ) | 4,953 | ||||||||
| Interest rate derivative settlements |
4,075 | 2,099 | — | |||||||||
| Net gain on transactions |
(13,843 | ) | (5,995 | ) | (4,173 | ) | ||||||
| Plus, proportionate share from equity accounted investments: |
||||||||||||
| Interest expense, net of interest income |
14,081 | 267 | 44 | |||||||||
| Tax provision (benefit) |
102 | (172 | ) | (65 | ) | |||||||
| Depreciation and accretion |
13,720 | 20 | — | |||||||||
| Unrealized loss (gain) on interest rate and currency derivatives |
30,126 | (9,076 | ) | 27 | ||||||||
| Realized loss on interest rate and currency derivatives |
22 | 39 | — | |||||||||
|
|
|
|
|
|
|
|||||||
| Adjusted EBITDA |
$ | 198,112 | $ | 141,769 | $ | 75,241 | ||||||
|
|
|
|
|
|
|
|||||||
73
Table of Contents
Cash Available for Distribution
We define cash available for distribution as net cash provided by operating activities as adjusted for certain other cash flow items that we associate with our operations. It is a non-U.S. GAAP measure of our ability to generate cash to service our dividends. In September 2014, we received our first cash distribution from an unconsolidated investment, South Kent. Our definition of cash available for distribution has accordingly been modified from prior periods to include distributions from unconsolidated investments, to the extent such distributions were derived from operating cash flows. Cash available for distribution represents cash provided by operating activities as adjusted to (i) add or subtract changes in operating assets and liabilities, (ii) subtract net deposits into restricted cash accounts, which are required pursuant to the cash reserve requirements of financing agreements, to the extent they are paid from operating cash flows during a period, (iii) subtract cash distributions paid to noncontrolling interests (iv) subtract scheduled project-level debt repayments in accordance with the related loan amortization schedule, to the extent they are paid from operating cash flows during a period, (v) subtract non-expansionary capital expenditures, to the extent they are paid from operating cash flows during a period, (vi) add cash distributions received from unconsolidated investments, to the extent such distributions were derived from operating cash flows and (vii) add or subtract other items as necessary to present the cash flows we deem representative of our core business operations.
The most directly comparable U.S. GAAP measure to both cash available for distribution before principal payments and cash available for distribution is net cash provided by (used in) operating activities. The following table is a reconciliation of our net cash provided by operating activities to both cash available for distribution before principal payments and cash available for distribution for the periods presented (unaudited and in thousands):
| Year ended December 31, | ||||||||||||
| 2014 | 2013 | 2012 | ||||||||||
| Net cash provided by operating activities |
$ | 110,448 | $ | 78,152 | $ | 35,051 | ||||||
| Changes in current operating assets and liabilities |
(9,002 | ) | 8,237 | 6,885 | ||||||||
| Network upgrade reimbursement |
2,472 | 1,854 | 6,263 | |||||||||
| Use of operating cash to fund maintenance and debt reserves |
— | — | (1,047 | ) | ||||||||
| Release of restricted cash to fund general and administrative costs |
223 | 318 | — | |||||||||
| Operations and maintenance capital expenditures |
(267 | ) | (819 | ) | (623 | ) | ||||||
| Transaction costs for acquisitions |
1,730 | — | — | |||||||||
| Distributions from unconsolidated investment |
7,891 | — | — | |||||||||
| Less: |
||||||||||||
| Distributions to noncontrolling interests |
(2,100 | ) | (2,292 | ) | (1,298 | ) | ||||||
| Principal payments paid from operating cash flows(1) |
(49,246 | ) | (42,829 | ) | (27,546 | ) | ||||||
|
|
|
|
|
|
|
|||||||
| Cash available for distribution |
$ | 62,149 | $ | 42,621 | $ | 17,685 | ||||||
|
|
|
|
|
|
|
|||||||
| (1) | Excludes $7,495 of principal pre-payments on our Ocotillo project which were paid from ITC cash grant proceeds in 2013 |
74
Table of Contents
Results of Operations
Year Ended December 31, 2014 Compared to Year Ended December 31, 2013
The following table provides selected financial information for the periods presented (in thousands, except percentages):
| Year ended December 31, | ||||||||||||||||
| 2014 | 2013 | $ Change | % Change | |||||||||||||
| Revenue |
$ | 265,493 | $ | 201,573 | $ | 63,920 | 32 | % | ||||||||
|
|
|
|
|
|
|
|
|
|||||||||
| Project expense |
77,775 | 57,677 | (20,098 | ) | -35 | % | ||||||||||
| Depreciation and accretion |
104,417 | 83,180 | (21,237 | ) | -26 | % | ||||||||||
|
|
|
|
|
|
|
|
|
|||||||||
| Total cost of revenue |
182,192 | 140,857 | (41,335 | ) | -29 | % | ||||||||||
|
|
|
|
|
|
|
|
|
|||||||||
| Gross profit |
83,301 | 60,716 | 22,585 | 37 | % | |||||||||||
|
|
|
|
|
|
|
|
|
|||||||||
| General and administrative |
22,533 | 4,819 | (17,714 | ) | -368 | % | ||||||||||
| Related party general and administrative |
5,787 | 8,169 | 2,382 | 29 | % | |||||||||||
|
|
|
|
|
|
|
|
|
|||||||||
| Total operating expenses |
28,320 | 12,988 | (15,332 | ) | -118 | % | ||||||||||
|
|
|
|
|
|
|
|
|
|||||||||
| Operating income |
54,981 | 47,728 | 7,253 | 15 | % | |||||||||||
| Total other expense |
(91,844 | ) | (33,110 | ) | (58,734 | ) | -177 | % | ||||||||
|
|
|
|
|
|
|
|
|
|||||||||
| Net (loss) income before income tax |
(36,863 | ) | 14,618 | (51,481 | ) | -352 | % | |||||||||
| Tax provision |
3,136 | 4,546 | 1,410 | 31 | % | |||||||||||
|
|
|
|
|
|
|
|
|
|||||||||
| Net (loss) income |
(39,999 | ) | 10,072 | (50,071 | ) | -497 | % | |||||||||
| Net loss attributable to noncontrolling interest |
(8,709 | ) | (6,887 | ) | 1,822 | 26 | % | |||||||||
|
|
|
|
|
|
|
|
|
|||||||||
| Net (loss) income attributable to controlling interest |
$ | (31,290 | ) | $ | 16,959 | $ | (48,249 | ) | -285 | % | ||||||
|
|
|
|
|
|
|
|
|
|||||||||
Proportional MWh sold and average realized electricity price. Our proportional MWh sold in the year ended December 31, 2014 was 2,914,810 MWh, as compared to 1,771,772 MWh in the year ended December 31, 2013, representing an increase of 1,143,038 MWh or approximately 65%. This increase in proportional MWh sold during 2014 as compared to 2013 was primarily attributable to the commencement of commercial operations at South Kent, El Arrayán, Panhandle 1 and Panhandle 2 at various times during the year and an increase in production from an additional 42 MW at Ocotillo for the full year of 2014. Our average realized electricity price was approximately $88 per MWh during the year ended December 31, 2014 as compared to approximately $88 per MWh in the prior year.
Revenue. Revenue for the year ended December 31, 2014 was $265.5 million compared to $201.6 million for the year ended December 31, 2013, an increase of $63.9 million, or approximately 32%. The increase in revenue for the year ended December 31, 2014 as compared to the prior year was primarily attributable to the commencement of commercial operations at both El Arrayán and Panhandle 1 in June 2014 and Panhandle 2 in November 2014 and an increase in production at Ocotillo. In addition, we realized a $7.4 million loss on valuation of the Gulf Wind energy derivative. The value of our energy derivative, and the amount of unrealized gain or loss we record, increases and decreases due to our monthly derivative settlements and changes in forward electricity prices, which are derived from and impacted by changes in forward natural gas prices. These increases to revenue were offset by $14.4 million less warranty settlement revenue as compared to 2013.
Cost of revenue. Cost of revenue for the year ended December 31, 2014 was $182.2 million compared to $140.9 million for the year ended December 31, 2013, an increase of $41.3 million, or approximately 29%. The increase in cost of revenue during 2014 as compared to 2013 was primarily attributable to the commencement of commercial operations at both El Arrayán and Panhandle 1 in June 2014, Panhandle 2 in November 2014, and depreciation and project expense associated with a full year of operations for the additional 42 MW at Ocotillo.
75
Table of Contents
As each new project commences commercial operations, we incur new incremental and ongoing costs for maintenance and services agreements, property taxes, insurance, land lease, depreciation and other costs associated with managing, operating and maintaining the facility, including adding site employees and other operations staff.
Operating expenses. Operating expenses for the year ended December 31, 2014 were $28.3 million compared to $13.0 million for the year ended December 31, 2013, an increase of $15.3 million, or approximately 118%. The increase in operating expenses during 2014 as compared to 2013 was primarily attributable to an increase in expenses associated with being a public company and supporting and acquiring new projects. In 2014, we recorded $4.1 million of noncash employee stock-based compensation expense, compared to $0.5 million recorded in the prior year. After the initial public offering in 2013, we recorded direct payroll costs and employee-related, audit and consulting expenses, and other administrative expenses, that were previously allocated to us from Pattern Development, and which were reflected in related party general and administrative expense.
Other expense. Other expense for the year ended December 31, 2014 was $91.8 million compared to $33.1 million for the year ended December 31, 2013. The increase of $58.7 million, or approximately 177%, in other expense during 2014 as compared to 2013 was primarily attributable to a $33.1 million increase in equity losses in unconsolidated investments which were primarily related to unrealized loss on interest rate derivatives on the unconsolidated investees’ financial statements. In addition, we had a $11.7 million unrealized loss on interest rate derivatives at the Ocotillo project compared to a $15.6 million gain for the year ended December 31, 2013. A decrease in the forward interest rate curve during the year ended December 31, 2014 resulted in both of these unrealized losses. Offsetting these increased losses is a $7.8 million increase in net gain on transactions, principally related to our acquisition of an additional 38.5% interest in the El Arrayán project.
Tax provision. The tax provision was $3.1 million for the year ended December 31, 2014 compared to $4.5 million for the same period in the prior year. The expense of $3.1 million is primarily related to the fair value remeasurement of our original 31.5% interest in El Arrayán and the effect of a tax regime change in Chile, offset against tax benefits earned in our Canadian operations.
Noncontrolling interest. The net loss attributable to noncontrolling interest was $8.7 million for the year ended December 31, 2014 compared to a $6.9 million net loss attributable to noncontrolling interest for the year ended December 31, 2013. The increased loss allocation for the year ended December 31, 2014 was primarily attributable to the reduction of the unrealized loss on energy derivative and lower hedge settlements at Gulf Wind during the year ended December 31, 2014. In addition, the commencement of operations at El Arrayán and Panhandle 1 in June 2014 and Panhandle 2 in November 2014 contributed to the net loss attributable to noncontrolling interest as a result of our tax equity financing structure which resulted in book losses being attributed to the tax equity investor.
Adjusted EBITDA. Adjusted EBITDA for the year ended December 31, 2014 was $198.1 million compared to $141.8 million for the same period in the prior year, an increase of $56.3 million, or approximately 40%. The increase in Adjusted EBITDA during 2014 as compared to 2013 was primarily attributable to the commencement of commercial operations at South Kent in March 2014, both El Arrayán and Panhandle 1 in June 2014, Panhandle 2 in November 2014 and the final 42 MW at Ocotillo in July 2013 recognized for the full year in 2014. For a reconciliation of net income to Adjusted EBITDA, see “Item 7—Management’s Discussion and Analysis of Financial Condition and Results of Operations—Key Metrics—Adjusted EBITDA.”
76
Table of Contents
Year Ended December 31, 2013 Compared to Year Ended December 31, 2012
The following table provides selected financial information for the periods presented (in thousands, except percentages):
| Year ended December 31, | ||||||||||||||||
| 2013 | 2012 | $ Change | % Change | |||||||||||||
| Revenue |
$ | 201,573 | $ | 114,528 | $ | 87,045 | 76 | % | ||||||||
|
|
|
|
|
|
|
|
|
|||||||||
| Project expense |
57,677 | 34,843 | (22,834 | ) | -66 | % | ||||||||||
| Depreciation and accretion |
83,180 | 49,027 | (34,153 | ) | -70 | % | ||||||||||
|
|
|
|
|
|
|
|
|
|||||||||
| Total cost of revenue |
140,857 | 83,870 | (56,987 | ) | -68 | % | ||||||||||
|
|
|
|
|
|
|
|
|
|||||||||
| Gross profit |
60,716 | 30,658 | 30,058 | 98 | % | |||||||||||
|
|
|
|
|
|
|
|
|
|||||||||
| Development expense |
— | 174 | 174 | 100 | % | |||||||||||
| General and administrative |
4,819 | 858 | (3,961 | ) | -462 | % | ||||||||||
| Related party general and administrative |
8,169 | 10,604 | 2,435 | 23 | % | |||||||||||
|
|
|
|
|
|
|
|
|
|||||||||
| Total operating expenses |
12,988 | 11,636 | (1,352 | ) | -12 | % | ||||||||||
|
|
|
|
|
|
|
|
|
|||||||||
| Operating income |
47,728 | 19,022 | 28,706 | 151 | % | |||||||||||
| Total other expense |
(33,110 | ) | (36,002 | ) | 2,892 | 8 | % | |||||||||
|
|
|
|
|
|
|
|
|
|||||||||
| Net income (loss) before income tax |
14,618 | (16,980 | ) | 31,598 | 186 | % | ||||||||||
| Tax provision (benefit) |
4,546 | (3,604 | ) | (8,150 | ) | -226 | % | |||||||||
|
|
|
|
|
|
|
|
|
|||||||||
| Net income (loss) |
10,072 | (13,376 | ) | 23,448 | 175 | % | ||||||||||
| Net loss attributable to noncontrolling interest |
(6,887 | ) | (7,089 | ) | (202 | ) | -3 | % | ||||||||
|
|
|
|
|
|
|
|
|
|||||||||
| Net income (loss) attributable to controlling interest |
$ | 16,959 | $ | (6,287 | ) | $ | 23,246 | 370 | % | |||||||
|
|
|
|
|
|
|
|
|
|||||||||
Proportional MWh sold and average realized electricity price. Our proportional MWh sold during the year ended December 31, 2013 was 1,771,772 MWh as compared to 1,177,027 MWh sold in the year ended December 31, 2012, representing an increase of 594,745 MWh, or approximately 51%. This increase in proportional MWh sold during 2013 as compared to 2012 was primarily attributable to the commencement of commercial operations at Spring Valley in August 2012 and both Santa Isabel and Ocotillo in December 2012. Our average realized electricity price was approximately $88 per MWh in the year ended December 31, 2013 as compared to approximately $78 per MWh in the year ended December 31, 2012. The average realized electricity price in 2013 was higher than the comparable period in 2012 because the pricing terms under the Spring Valley, Santa Isabel and Ocotillo project PPAs are each higher than our overall average realized price applicable in 2012.
Revenue. Revenue for the year ended December 31, 2013 was $201.6 million compared to $114.5 million for the year ended December 31, 2012, an increase of $87.1 million, or approximately 76%. This increase in revenue during 2013 as compared to 2012 was the result of an increase of $71.5 million in electricity sales primarily attributable to the commencement of commercial operations at Spring Valley in August 2012 and both Santa Isabel and Ocotillo in December 2012. In addition, during the year ended December 31, 2013 we recorded other revenue of $21.9 million related to non-refundable warranty settlement payments we received from a turbine supplier during the period as a result of the turbines at the Ocotillo and Santa Isabel projects being off line for a portion of the period. The increase in electricity sales in 2013 as compared to 2012 was offset by a decrease of $4.3 million in period-over-period revenue due to energy derivative valuation. In 2013, we recorded a $11.3 million unrealized loss on energy derivative compared to a $7.0 million unrealized loss in 2012. The value of our energy derivative, and the amount of unrealized gain or loss we record, increases and decreases due to our monthly derivative settlements and changes in forward electricity prices, which are derived from and impacted by changes in forward natural gas prices.
77
Table of Contents
Cost of revenue. Cost of revenue for the year ended December 31, 2013 was $140.9 million compared to $83.9 million for the year ended December 31, 2012, an increase of $57.0 million, or approximately 68%. The increase in cost of revenue during 2013 as compared to 2012 was primarily attributable to the commencement of commercial operations at Spring Valley in August 2012 and both Santa Isabel and Ocotillo in December 2012 with depreciation and accretion contributing $34.2 million of the $57.0 million increase in 2013 as compared to 2012. As each new project commences commercial operations, we incur new incremental and ongoing costs for maintenance and services agreements, property taxes, insurance, land lease and other costs associated with managing, operating and maintaining the facility, including adding site employees and operations center staff.
General and administrative expense. General and administrative expense for the year ended December 31, 2013 was $4.8 million compared to $0.9 million for the year ended December 31, 2012, an increase of $3.9 million, or approximately 462%. After the initial public offering, we recorded direct payroll costs and employee-related, audit and consulting expenses costs, and other administrative costs that were previously allocated to us from Pattern Development and which were reflected in related party general and administrative expense. In addition, we incur additional general and administrative costs related to being a public company, such as directors’ fees.
Related party general and administrative expense. Related party general and administrative expense for the year ended December 31, 2013 was $8.2 million compared to $10.6 million for the year ended December 31, 2012, a decrease of $2.4 million, or approximately 23%, resulting primarily from lower cash bonus expense in 2013, as compared to 2012, offset by the increased staffing and overhead costs related to commercial operations commencing at Spring Valley, Santa Isabel and Ocotillo as well as our ownership in El Arrayán and South Kent as construction on these projects advanced in 2013.
Other expense. Other expense for the year ended December 31, 2013 was $33.1 million compared to $36.0 million for the year ended December 31, 2012. The decrease of $2.9 million in other expense during 2013, as compared to 2012, was primarily related to a $7.9 million increase in equity in earnings in unconsolidated investments, which was primarily attributable to interest rate swaps that were entered into during 2013, which were deemed to be derivatives and not designated as hedges. The gain on these interest rate swaps was attributable to an increase in the forward interest rate curve after these interest rate swaps were entered into. In addition, there was a $20.6 million increase in unrealized gain on derivatives as a portion of our interest rate swaps on the Ocotillo project are not designated as hedges and there was an increase in the forward interest rate curve, which decreases our liability under these interest rate swaps and increases our unrealized gain on derivatives. During the year ended December 31, 2013, we also recorded a $7.2 million gain on the sale of Puerto Rico tax credits at the Santa Isabel project and $1.2 million of transaction expense related to our acquisition of Grand and Panhandle 2 projects as compared to a $4.2 million gain on the sale of a portion of the El Arrayán project in 2012. Offsetting these gains was a $27.1 million increase in interest expense in 2013 attributable to the commencement of commercial operations at Spring Valley in August 2012 and at Santa Isabel and Ocotillo in December 2012 and the resultant cessation of interest capitalization and treatment of interest as expense under the related facilities.
Tax provision. The tax provision was $4.5 million for the year ended December 31, 2013 compared to a $3.6 million benefit for the year ended December 31, 2012. The 2012 benefit was principally the result of the Santa Isabel project holding company being subject to U.S. income taxes and the impact of receipt of a U.S. Treasury cash grant by the Santa Isabel project on a stand-alone basis in 2012 which then required a valuation allowance in 2013 as the Santa Isabel project is included in our consolidated U.S. income tax return as a result of the Contribution Transactions.
Noncontrolling interest. The allocation to noncontrolling interest was a $6.9 million loss for the year ended December 31, 2013 compared to $7.1 million of loss for the year ended December 31, 2012. The noncontrolling interest income or loss calculation is based on the hypothetical liquidation at book value method of accounting for the earnings attributable to the noncontrolling interests’ ownership in Gulf Wind.
78
Table of Contents
Adjusted EBITDA. Adjusted EBITDA for the year ended December 31, 2013 was $141.8 million compared to $75.2 million for the year ended December 31, 2012, an increase of $66.6 million. The increase in Adjusted EBITDA during 2013 as compared to 2012 was primarily attributable to the commencement of operations at Spring Valley in August 2012 and at Santa Isabel and Ocotillo in December 2012. For a reconciliation of net income to Adjusted EBITDA, see “Item 7—Management’s Discussion and Analysis of Financial Condition and Results of Operations—Key Metrics—Adjusted EBITDA.”
Liquidity and Capital Resources
Our business requires substantial capital to fund (i) equity investments in our construction projects, (ii) current operational costs, (iii) debt service payments, (iv) dividends to our stockholders, (v) potential investments in new acquisitions (vi) modifications to our projects, (vii) unforeseen events and (viii) other business expenses. As a part of our liquidity strategy, we plan to retain a portion of our cash flows in above-average wind years in order to have additional liquidity in below-average wind years. Our sources of liquidity include cash generated by our operations, ITC cash grants, cash reserves, borrowings under our corporate and project-level credit agreements and further issuances of equity and debt securities.
The principal indicators of our liquidity are our restricted and unrestricted cash balances and availability under our credit agreements. As of December 31, 2014, our available liquidity was $683.2 million, including unrestricted cash on hand of $101.7 million, restricted cash on hand of $47.7 million, $254.9 million available under our revolving credit agreements and $278.9 million available under project financings consisting of $90.5 million for post construction use and $188.4 million for construction use.
We believe that throughout 2015, we will have sufficient liquid assets, cash flows from operations, and borrowings available under our revolving credit facility to meet our financial commitments, debt service obligations, contingencies and anticipated required capital expenditures for at least the next 24 months, without taking into account capital required for additional project acquisitions. Additionally, we believe that our construction project has been sufficiently capitalized such that we will not need to seek additional financing arrangements in order to complete construction and achieve commercial operations at the project. However, we are subject to business and operational risks that could adversely affect our cash flow. A material decrease in our cash flows would likely produce a corresponding adverse effect on our borrowing capacity. In connection with our future capital expenditures and other investments, including any project acquisitions that we may make, we may, from time to time, issue debt or equity securities.
Cash Flows
We use traditional measures of cash flow, including net cash provided by operating activities, net cash used in investing activities and net cash provided by financing activities as well as cash available for distribution to evaluate our periodic cash flow results.
Year Ended December 31, 2014 Compared to Year Ended December 31, 2013
Net Cash Provided by Operating Activities
Net cash provided by operating activities was $110.4 million for the year ended December 31, 2014 as compared to $78.2 million for the same period in the prior year, an increase of $32.2 million, or approximately 41%. The increase in cash provided by operating activities was primarily the result of higher revenue of $56.5 million, excluding unrealized loss on energy derivative, which was primarily attributable to the commencement of commercial operations at both El Arrayán and Panhandle 1 in June 2014 and increased production at Ocotillo. In addition to the increase was a $16.9 million net change in operating assets and liabilities. Offsetting these increases in revenue were increases of $20.1 million in project expenses, $11.7 million in operating expenses, excluding an $3.6 million increase in noncash employee stock-based compensation expense, and $6.1 million in interest expense and related derivative settlements.
79
Table of Contents
Net Cash (Used in) Provided by Investing Activities
Net cash used in investing activities was $379.4 million for the year ended December 31, 2014, which consisted primarily of $119.5 million for capital expenditures, $306.6 million of acquisitions, net of cash acquired including $123.4 million for Panhandle 1, $123.6 million for Panhandle 2, $44.6 million for the additional 38.5% interest in El Arrayán and $15.1 million for Logan’s Gap. This is partially offset by $22.0 million of distributions from unconsolidated investments and a $17.5 million increase in other assets driven by cash received from a refund of security deposit related to an energy hedge arrangement upon commercial operations of Panhandle 2. Net cash provided by investing activities was $72.4 million for the year ended December 31, 2013, which consisted of $173.4 million of ITC grant proceeds at Ocotillo and Santa Isabel, $14.3 million of proceeds from the sale of investments and tax credits, and a net reduction in our reimbursable interconnection receivable of $49.7 million, offset by $123.5 million of capital expenditures primarily at Ocotillo and Santa Isabel and a funding of restricted cash primarily at Ocotillo under the credit agreement.
Net Cash Provided by (Used in) Financing Activities
Net cash provided by financing activities for the year ended December 31, 2014 was $269.0 million, which consisted of $286.8 million of proceeds from our May 2014 equity offering, net of transaction costs, $200.8 million in capital contributions from noncontrolling investees of Panhandle 1 and Panhandle 2, $50.0 million drawn on a credit facility, partially offset by a $210.2 million repayment of short-term debt, of which $195.4 million relates to the repayment of the Panhandle 2 construction loan, and $52.3 million of dividend payments. Net cash used in financing activities for the year ended December 31, 2013 was $63.4 million, which was attributable to $317.9 million of net initial public offering proceeds, $138.6 million of loan proceeds primarily at Santa Isabel and Ocotillo and $32.7 million of capital contributions prior to the initial public offering offset by $232.6 million of distributions to Pattern Development in conjunction with the Contribution Transactions, $49.4 million related to the acquisition of Grand from Pattern Development, repayment of $114.1 million of construction and bridge loans at Santa Isabel and Ocotillo, $98.9 million of capital distributions prior to our initial public offering, and $50.3 million of long-term debt repayments.
Cash Available for Distribution
Cash available for distribution was $62.1 million for the year ended December 31, 2014 as compared to $42.6 million for the same period in the prior year. This $19.5 million increase in cash available for distribution was primarily the result of higher revenue of $56.5 million (excluding unrealized loss on energy derivative), which was primarily attributable to the commencement of commercial operations at both the El Arrayán and Panhandle 1 in June 2014 and increased production at Ocotillo. In addition, we recorded a $7.9 million cash distribution from unconsolidated investments. Offsetting these increases in electricity sales were increases of $20.1 million in project expenses, $11.7 million in operating expenses, excluding a noncash employee stock-based compensation expense increase of $3.6 million, $6.4 million in principal payments from operating cash and $6.1 million in interest expense and related derivative settlements. For a reconciliation of net income to cash available for distribution, see “Item 7—Management’s Discussion and Analysis of Financial Condition and Results of Operations—Key Metrics—Cash Available for Distribution.”
Year Ended December 31, 2013 Compared to Year Ended December 31, 2012
Net Cash Provided by Operating Activities
Net cash provided by operating activities was $78.2 million for the year ended December 31, 2013 as compared to $35.1 million for the year ended December 31, 2012. Electricity sales were $71.5 million higher during 2013 as compared to 2012, which was primarily attributable to the commencement of commercial operations at Spring Valley in August 2012 and both Santa Isabel and Ocotillo in December 2012. In addition, during the year ended December 31, 2013, we recorded other revenue of $21.9 million related to non-refundable warranty settlement payments we received from a turbine supplier during the period as a result of the turbines at the Ocotillo and Santa Isabel projects being off line for a portion of 2013. Offsetting these increases in electricity sales and other revenue is an $8.7 million increase in the period-over-period reduction of cash flow provided by
80
Table of Contents
operations related to an increase in trade receivables consistent with our terms under the power sales agreements, a period-over-period increase of $19.4 million in project expenses, and a period-over-period increase in cash interest expense of $22.8 million.
Net Cash Provided by (Used in) Investing Activities
Net cash provided by investing activities was $72.4 million for the year ended December 31, 2013, which consisted of $173.4 million of ITC grant proceeds at Ocotillo and Santa Isabel, $14.3 million of proceeds from the sale of investments and tax credits, and a net reduction in our reimbursable interconnection receivable of $49.7 million, offset by $123.5 million of capital expenditures primarily at Ocotillo and Santa Isabel and a funding of restricted cash primarily at Ocotillo under the credit agreement. Net cash used in investing activities was $639.0 million for the year ended December 31, 2012 which consisted of $641.4 million of capital expenditures at Spring Valley, Santa Isabel and Ocotillo, $22.4 million of investments in our unconsolidated investments, and $47.1 million in net payments for interconnection network upgrades primarily at our Ocotillo project offset by ITC cash grant proceeds of $79.9 million.
Net Cash (Used in) Provided by Financing Activities
Net cash used in financing activities for the year ended December 31, 2013 was $63.4 million, which was attributable to $317.9 million of net initial public offering proceeds, $138.6 million of loan proceeds primarily at Santa Isabel and Ocotillo and $32.7 million of capital contributions prior to the initial public offering offset by $232.6 million of distributions to Pattern Development in conjunction with the Contribution Transactions, $49.4 million related to the acquisition of Grand from Pattern Development, repayment of $114.1 million of construction and bridge loans at Santa Isabel and Ocotillo, $98.9 million of capital distributions prior to our initial public offering, and $50.3 million of long-term debt repayments. Net cash provided by financing activities for the year ended December 31, 2012 was $573.2 million which was primarily attributable to $281.5 million of capital contributions, $497.2 million of loan borrowings at Spring Valley, Santa Isabel and Ocotillo, offset by $80.9 million of loan repayments and $114.2 million of capital distributions.
Cash Available for Distribution
Cash available for distribution was $42.6 million for the year ended December 31, 2013 as compared to $17.7 million for the year ended December 31, 2012, an increase of $24.9 million. This increase in cash available for distribution was the result of higher electricity sales of $71.5 million, which was primarily attributable to the commencement of commercial operations at Spring Valley in August 2012, and at Santa Isabel and Ocotillo in December 2012. Also, during the year ended December 31, 2013, we recorded other revenue of $21.9 million related to warranty settlement payments we received from a turbine supplier during the period as a result of the turbines at the Ocotillo and Santa Isabel projects being off line for a portion of the period. Offsetting these increases in electricity sales and other revenue is a period-over-period increase of $19.4 million in project expenses, a period-over-period increase in cash interest expense of $22.8 million, a $15.3 million increase in principal payments from operating cash flows as the additional projects commenced operations in late 2012 and a $4.4 million increase in network upgrade reimbursements. For a reconciliation of net income to cash available for distribution, see “Item 7—Management’s Discussion and Analysis of Financial Condition and Results of Operations—Key Metrics—Cash Available for Distribution.”
Capital Expenditures and Investments
We currently own only those projects that we acquired through the Contribution Transactions and those which we additionally acquired from Pattern Development and third parties in December 2013 and all of 2014. Each of the acquired project entities has secured all of the required project equity needed to complete the construction and achieve commercial operations at our construction projects. In addition, funding for all remaining planned construction costs, including contingency allowances, is available under financing
81
Table of Contents
commitments from project lenders. All capital expenditures and investments in 2014 have either been funded by us or Pattern Development or are available from project finance lenders under project-level credit facilities. For 2014, total capital expenditures were $119.5 million. For 2015, we expect to make capital expenditures of $171.0 million at our owned construction project. We do not record capital expenditures at our projects held at our consolidated equity investees.
We expect to make investments in additional projects. Although we have no commitments to make any such acquisitions, we consider it reasonably likely that we may have the opportunity to acquire certain other Pattern Development projects under our purchase rights within the next 24 month period. We believe that we will have sufficient cash and revolving credit facility capacity to complete the funding of Logan’s Gap construction commitment, but this may be affected by any other acquisitions or investments that we make. We also have a call right to purchase Pattern Development’s interest in the Gulf Wind project at fair market value, which is exercisable during the period from October 2, 2014 to October 2, 2015. To the extent that we make any such investments or acquisitions, we will evaluate capital markets and other corporate financing sources available to us at the time.
In addition, we will make investments from time to time at our operating projects. Operational capital expenditures are those capital expenditures required to maintain our long-term operating capacity. Capital expenditures for the projects are generally made at the project level using project cash flows and project reserves, although funding for major capital expenditures may be provided by additional project debt or equity. Therefore, the distributions that we receive from the projects may be made net of certain capital expenditures needed at the projects.
For the year ending December 31, 2015 we have budgeted $0.5 million for operational capital expenditures and $1.5 million for expansion capital expenditures.
Description of Credit Agreements
Revolving Credit Facility
On December 17, 2014, certain of our subsidiaries entered into an Amended and Restated Credit and Guaranty Agreement which increased our available limit under our existing revolving corporate credit facility from $145 million to $350 million. The facility has a four-year term and is comprised of a revolving loan facility, a letter of credit facility and a swing-line facility. The facility is secured by pledges of the capital stock and ownership interests in certain of our holding company subsidiaries.
As of December 31, 2014, letters of credit of $45.1 million have been issued under the facility and we have an outstanding drawn loan balance of $50.0 million under the facility.
Interest Rate and Fees
The loans under our revolving credit facility are either base rate loans or Eurodollar rate loans. The base rate loans accrue interest at the fluctuating rate per annum equal to the greatest of the (i) the prime rate, (ii) the federal funds rate plus 0.50% and (iii) the Eurodollar rate that would be in effect for a Eurodollar rate loan with an interest period of one month plus 1.0%, plus an applicable margin ranging from 1.25% to 1.75% (corresponding to applicable leverage ratios of the borrower). The Eurodollar rate loans accrue interest at a rate per annum equal to LIBOR, as published by Reuters plus an applicable margin ranging from 2.25% to 2.75% (corresponding to applicable leverage ratios of the borrower). Under the facility, we pay a revolving commitment fee equal to the average of the daily difference between revolving commitments and the total utilization of revolving commitments times 0.50%. We also pay letter of credit fees.
Maintenance Covenants
Our revolver requires the subsidiary borrowers to maintain a leverage ratio (the ratio of borrower debt to borrower cash flow) that does not exceed 5.50:1.00 and an interest coverage ratio (the ratio of borrower cash flow to borrower interest expense) that is not less than 1.75:1.00.
82
Table of Contents
Distribution Conditions
Certain of our subsidiaries are subject to usual and customary affirmative and negative covenants under our revolving credit facility. Specifically, with limited exceptions, such subsidiaries are prohibited from distributing funds to us unless the following conditions are met: (i) no event of default under the corporate credit facility has occurred and is continuing or would be caused by such distribution and (ii) the corporate credit facility borrowers are in compliance with the leverage ratio test and the interest coverage ratio test, both before and after giving effect to such declaration.
Prepayments, Certain Covenants and Events of Default
Our revolving credit facility also has customary covenants, prepayment provisions and events of default.
Gulf Wind Senior Secured Credit Agreement
In February 2010, Pattern Gulf Wind LLC, or “Gulf Wind LLC,” entered into a first lien senior secured credit agreement, or the “Gulf Wind Credit Agreement.” The Gulf Wind Credit Agreement provides up to $195.4 million in term loan borrowings, or the “Gulf Wind Term Loan,” and will mature in March 2020. Borrowings under the Gulf Wind Term Loan were used to refinance the construction financing for the Gulf Wind project.
The Gulf Wind Credit Agreement also provides for an operations and maintenance reserve loan facility in an amount up to $8.1 million and a debt service reserve loan facility in an amount up to $12.5 million. As of December 31, 2014 approximately $156.1 million of indebtedness was outstanding under the Gulf Wind Credit Agreement, all of which was outstanding under the term loan. In connection with the facility, Gulf Wind LLC entered into interest rate swaps and cap agreements to reduce its exposure to variable interest rates during the term of the facility and to hedge its exposure to refinancing rate risk.
Interest Rate and Fees
Base rate loans accrue interest at the greater of (i) the base rate, which is (a) the greater of the prime rate and (b) the federal funds rate plus 0.50%, plus the applicable margin under the Gulf Wind Credit Agreement and (ii) LIBOR plus 3.00% per annum, the base rate floor. The base rate floor for term loans and debt service reserve loans is 3% plus LIBOR with an interest period of three months. The base rate floor for reactive power upgrade loans and operations and maintenance reserve loans is 3% plus LIBOR with an interest period of one month. LIBOR loans accrue interest at LIBOR plus the applicable margin under the Gulf Wind Credit Agreement. Gulf Wind LLC is also required to pay quarterly commitment fees on the operations and maintenance loan commitment, the debt service reserve loan commitment and the reactive power upgrade loan commitment. Our effective annual interest rate, after taking into account our fixed-for-floating LIBOR rate swaps, is approximately 6.6%.
Distribution Conditions
Gulf Wind LLC may distribute excess cash flows to its owners provided that specified distribution requirements are met. The distribution requirements include that: (i) there are no operations and maintenance or debt service reserve loans outstanding; (ii) no event of default or inchoate default has occurred and is continuing; (iii) the debt service coverage ratio is equal to or greater than 1.20:1.00; and (iv) no adverse pre-existing condition remains unremedied after certain trigger dates set for each respective pre-existing condition that when taken together with the other adverse pre-existing conditions, could reasonably be expected to have a material adverse effect.
Prepayments, Certain Covenants and Events of Default
The Gulf Wind Credit Agreement contains a broad range of covenants that, subject to certain exceptions, restrict Gulf Wind’s ability to incur debt, grant liens, sell or lease assets, transfer equity interests, dissolve, pay
83
Table of Contents
dividends and change its business. Gulf Wind LLC may voluntarily prepay the facility, in whole or in part, at any time without premium or penalty (except for liquidation costs and interest fix fees, if applicable), and in certain circumstances, must make mandatory prepayments of loans under the facility. From March 16, 2018 until March 16, 2020, the maturity date, all distributable cash is required to be applied as a mandatory prepayment of the loans.
Hatchet Ridge Wind Lease Financing
In December 2010, Hatchet Ridge Wind, LLC, or “Hatchet Ridge LLC,” as lessee, entered into two participation agreements, each for a 50% undivided interest in the Hatchet Ridge project, to implement a first lien lease financing, or the “Hatchet Ridge Leveraged Lease Financing,” with each of Hatchet Ridge Wind 2010-A and Hatchet Ridge Wind 2010-B, each an owner lessor, Wells Fargo Delaware Trust Company National Association, as the owner trustee, MetLife Renewables Holding, LLC, as owner participant, and Wilmington Trust Company, as trustee under each lease indenture, and Credit Agricole Corporate and Investment Bank, as PPA letter of credit provider.
The financing was structured as two sale-leaseback transactions, each for a 50% undivided interest in the Hatchet Ridge project. Borrowings under each lease financing were used to refinance the construction financing for the Hatchet Ridge wind project. Pursuant to the sale-leaseback financings (i) MetLife Renewables Holding, LLC funded an equity investment in the Hatchet Ridge wind project, (ii) Hatchet Ridge LLC sold an undivided interest in the Hatchet Ridge wind project to Hatchet Ridge Wind 2010-A and Hatchet Ridge Wind 2010-B, each a “Hatchet Ridge Undivided Interest,” for a purchase price and Hatchet Ridge Wind 2010-A and Hatchet Ridge Wind 2010-B each leased their respective undivided interest back to Hatchet Ridge LLC, (iii) Hatchet Ridge Wind 2010-A and Hatchet Ridge Wind 2010-B each sold lease notes to Wilmington Trust Company, as pass-through trustee, and (iv) Wilmington Trust Company entered into a pass-through trust agreement with Hatchet Ridge LLC, pursuant to which Wilmington Trust Company used the proceeds of the sale of certificates to MetLife Renewables Holding, LLC to purchase the lease notes from Hatchet Ridge Wind 2010-A and Hatchet Ridge Wind 2010-B, respectively.
In addition, Credit Agricole Corporate and Investment Bank and Hatchet Ridge LLC entered into a letter of credit and reimbursement agreement, or the “Hatchet Ridge LC Agreement,” pursuant to which Credit Agricole Corporate and Investment Bank issued a PPA letter of credit to the power purchaser as payment security for Hatchet Ridge LLC’s obligations under the PPA. In the event of a draw under the PPA letter of credit that is not reimbursed by Hatchet Ridge LLC, such amount becomes a PPA letter of credit loan. Each of Hatchet Ridge Wind 2010-A and Hatchet Ridge Wind 2010-B entered into a PPA letter of credit guarantee pursuant to which Hatchet Ridge Wind 2010-A and Hatchet Ridge Wind 2010-B, respectively, guarantee Hatchet Ridge LLC’s obligations to repay any draws under the PPA letter of credit and any amounts owed to Credit Agricole Corporate and Investment Bank under the Hatchet Ridge LC Agreement.
In addition, as partial consideration for the purchase price, Hatchet Ridge Wind 2010-A and Hatchet Ridge 2010-B each issued a note in favor of Hatchet Ridge LLC in an amount of $40.1 million secured by a right to receive Hatchet Ridge Wind 2010-A and Hatchet Ridge Wind 2010-B’s respective cash grant from the U.S. Treasury. The cash grant notes were fully paid once the cash grant proceeds were received from the U.S. Treasury. The financing is non-recourse to us.
Interest Rate
Our effective annual interest rate under the Hatchet Ridge Leveraged Lease Financing is approximately 1.4%.
Distribution Conditions
Hatchet Ridge LLC may distribute excess cash flows to its owner provided that specified distribution requirements are met. The distribution requirements include that: (i) the reserves and other accounts are fully
84
Table of Contents
funded; (ii) that there are no PPA letter of credit loans outstanding; (iii) that no lease event of default has occurred and is continuing and (iv) the rent service coverage ratio is equal to or greater than 1.20:1.00.
Prepayments, Certain Covenants and Events of Default
The financing documents contain a broad range of covenants that, subject to certain exceptions, restrict Hatchet Ridge LLC’s ability to incur debt, grant liens, sell or lease assets, transfer equity interests, dissolve, pay dividends and change its business. Hatchet Ridge LLC may redeem the lease notes, in whole, at its option, at any time on or after December 14, 2015, and, in certain circumstances, must redeem the lease notes, in whole, at a price that includes a make whole premium. In addition, in certain circumstances, the note securing the PPA letter of credit loan is subject to mandatory redemption, in whole.
St. Joseph Amended Credit and Security Agreement
In April 2011, St. Joseph Wind Farm Inc., or “St. Joseph Inc.,” entered into an amended credit and security agreement or the “St. Joseph Credit Agreement.” The St. Joseph Credit Agreement provides up to C$250.0 million in construction loan borrowings. Construction loan borrowings under the St. Joseph Credit Agreement were used to finance the construction of the St. Joseph wind power project and converted upon completion of construction of the St. Joseph wind power project to a term loan, which will mature in May 2031. The St. Joseph Credit Agreement also provides for a revolving reserve loan facility in an amount up to C$10.0 million. As of December 31, 2014, C$220.1 million of indebtedness was outstanding under the St. Joseph Credit Agreement, all of which was outstanding under the term loan. The financing is limited recourse to us.
Interest Rate and Fees
The term loan accrues interest at a rate of approximately 5.9% per annum, compounded monthly; our effective annual interest rate is approximately 5.95%. The reserve loan advances accrue interest at 4% plus the Canadian Dealer Offered Rate, or “CDOR,” with the interest payable monthly.
Distribution Conditions
St. Joseph Inc. may distribute excess cash flows to its owner six months after the interim commercial operations date, which was April 1, 2011, provided that specified distribution requirements are met. The distribution requirements include that: (i) no reserve loans are outstanding; (ii) payment of the distribution would not violate any law or terms of any agreement to which St. Joseph Inc. or the collateral are subject; (iii) the debt service coverage ratio is greater than or equal to 1.20:1.00 for the immediately preceding 12-month period and is projected to be greater than or equal to 1.00:1.00 with electricity production based on the relevant monthly value of the estimated annual electricity such that no advance under any reserve loan is anticipated; and (iv) no cash sweep is then in effect.
Prepayments, Certain Covenants and Events of Default
The St. Joseph Credit Agreement contains standard covenants that, among other things and subject to certain exceptions, restrict St. Joseph Inc.’s ability to incur debt, grant liens, sell or lease certain assets, transfer equity interests, dissolve, make distributions and change its business. St. Joseph Inc. may voluntarily prepay the term loan, in whole or in part, and the reserve loans at any time without premium or penalty, and, in certain circumstances, must make mandatory prepayments of the reserve loans.
Spring Valley Credit Facilities
In August 2011, Spring Valley Wind LLC, or “Spring Valley LLC,” entered into a financing agreement, or the “Spring Valley Financing Agreement.” The Spring Valley Financing Agreement currently provides for up to
85
Table of Contents
approximately $199.7 million in borrowings and is expected to mature in March 2031. Borrowings under the Spring Valley Financing Agreement were used to finance the construction of the Spring Valley wind project and consisted of a cash grant bridge loan of up to $53.3 million, a construction loan of up to $178.9 million, an operations and maintenance reserve letter of credit facility in an amount up to $5.4 million, a debt service reserve letter of credit facility in an amount up to $9.1 million and a PPA letter of credit facility in an amount up to $6.3 million. Additionally, the $53.3 million cash grant bridge loan that was borrowed under the Spring Valley Financing Agreement was repaid from an ITC cash grant Spring Valley LLC received following the commencement of commercial operations. The construction loan converted into the term loan upon completion of construction of the Spring Valley wind project and satisfaction of certain other specified conditions.
As of December 31, 2014, approximately $167.3 million of indebtedness was outstanding under the Spring Valley Financing Agreement, all of which was outstanding under the term loan. We have agreed to indemnify Spring Valley LLC in the event of disallowance of the ITC cash grant. Other than the indemnification, the financing is non-recourse to us.
Interest Rate and Fees
The reserve loans are either base rate loans or LIBOR loans. Reserve loans that are LIBOR loans accrue interest at LIBOR plus 2.00% per annum and reserve loans that are base rate loans accrue interest at the base rate plus 1.00% per annum. Construction loans, term loans and letter of credit loans that are LIBOR loans accrue interest at LIBOR plus 2.375% per annum, and those that are base rate loans accrue interest at the base rate plus 1.375% per annum. Other than with respect to the construction loans, the amount of interest payable on base rate loans is increased by 25 basis points every four years after the conversion of the construction loan to a term loan. Our effective annual interest rate, after taking into account our fixed-for-floating LIBOR swaps, is approximately 5.5%.
Spring Valley LLC is also required to pay quarterly commitment fees on the operations and maintenance reserve letter of credit commitment, the debt service reserve letter of credit loan commitment and the PPA letter of credit loan commitment.
Distribution Conditions
Spring Valley LLC may distribute excess cash flows to its owner provided that specified distribution requirements are met. The distribution requirements include that distributions may be made only if: (i) the initial repayment date and the term conversion of the construction loan have occurred; (ii) the reserve and other accounts are fully funded; (iii) all outstanding cash grant bridge loans, letter of credit loans and other letter of credit reimbursement obligations have been repaid; (iv) any mandatory prepayment required as a result of the occurrence of an upwind array event has been made; (v) no default or event of default has occurred; (vi) the annual debt service coverage ratio is equal to or greater than 1.20:1.00; and (vii) a satisfactory ruling or settlement has occurred in connection with the litigation challenging the Bureau of Land Management Rights-of-Way.
Prepayments, Certain Covenants and Events of Default
The Spring Valley Financing Agreement contains a broad range of covenants that, subject to certain exceptions, restrict Spring Valley LLC’s ability to incur debt, grant liens, sell or lease assets, transfer equity interests, dissolve, pay dividends and change its business. Spring Valley LLC may voluntarily prepay the facility, in whole or in part, at any time without premium or penalty (except for liquidation costs and interest fix fees, if applicable) and, in certain circumstances, must make mandatory prepayments of loans under the facility.
Santa Isabel Senior Financing Agreement
In October 2011, Pattern Santa Isabel LLC, or “Santa Isabel LLC,” entered into a first lien senior secured financing agreement, or the “Santa Isabel Financing Agreement.” The Santa Isabel Financing Agreement
86
Table of Contents
provides up to approximately $192.4 million in borrowings. Borrowings under the Santa Isabel Financing Agreement were used to finance the construction of the Santa Isabel wind project and include a cash grant bridge loan of up to $57.5 million and a construction loan of up to $119.0 million. The cash grant bridge loan was repaid from an ITC cash grant that Santa Isabel LLC received in June 2013. The construction loan converted into a term loan in May 2013.
The Santa Isabel Financing Agreement also provides for an operations and maintenance reserve loan facility in an amount up to $6.7 million, debt service reserve loan facility in an amount up to $6.2 million and a PPA collateral facility in an amount up to $3.0 million. As of December 31, 2014, approximately $112.6 million of indebtedness was outstanding under the Santa Isabel Financing Agreement. We agreed to indemnify Santa Isabel LLC in the event of disallowance of the ITC cash grant. Other than the indemnification, the financing is non-recourse to us.
Interest Rate and Fees
The operations and maintenance reserve loans, debt service reserve loans and PPA collateral loans are either base rate loans or LIBOR loans. Reserve loans that are LIBOR loans accrue interest at LIBOR plus 2.00% per annum, and reserve loans that are base rate loans accrue interest at the greater of (i) the prime rate and (ii) the federal funds rate plus 0.50%, plus 1.00% per annum, but increase by 12.5 basis points every three years after the earlier of March 31, 2013 and term conversion. Construction loans and term loans are fixed rate loans and accrue interest at 1.94% per annum plus a margin of 2.625%, for a total annual interest rate of 4.565%.
Santa Isabel LLC is also required to pay quarterly commitment fees on the operations and maintenance reserve loan commitment the debt service reserve loan commitment, the PPA collateral commitment and PPA collateral advance fees.
Distribution Conditions
Santa Isabel LLC may distribute excess cash flows to its owner provided that specified distribution requirements are met. The distribution requirements include that: (i) distributions may be made only following the last banking day of 2012; (ii) the occurrence of the term conversion of the construction loan; (iii) the reserve and other accounts are fully funded; (iv) all outstanding operations and maintenance reserve loans, debt service reserve loans and PPA collateral loans have been repaid and all PPA collateral reimbursement obligations have been paid; (v) any mandatory prepayment required as a result of the occurrence of an upwind array event has been made; (vi) no default or event of default has occurred; and (vii) the annual debt service coverage ratio is equal to or greater than 1.20:1.00.
Prepayments, Certain Covenants and Events of Default
The Santa Isabel Financing Agreement contains a broad range of covenants that, subject to certain exceptions, restrict Santa Isabel LLC’s ability to incur debt, grant liens, sell or lease assets, transfer equity interests, dissolve, pay dividends and change its business. Santa Isabel LLC may, with certain exceptions, voluntarily prepay the facility, in whole or in part, at any time without premium or penalty except for liquidation costs and make-whole payments with respect to the fixed rate loans, and, in certain circumstances, must make mandatory prepayments of loans under the facility.
Ocotillo Senior Financing Agreement
Ocotillo Express LLC, or “Ocotillo LLC,” entered into a first lien senior secured financing agreement, or the “Ocotillo Financing Agreement,” with a group of commercial banks and a development bank in October 2012. The commercial bank tranche was re-priced in October 2014. The Ocotillo Financing Agreement provides up to approximately $467.3 million in borrowings. Borrowings under the Ocotillo Financing Agreement were used to
87
Table of Contents
finance the construction of the Ocotillo wind project and are comprised of a network upgrade bridge loan of up to approximately $56.6 million and two construction loans of up to approximately $351.5 million. The two construction loans consist of a development bank tranche of $110 million and a commercial bank tranche of up to approximately $241.5 million and mature 20 years and 7 years after the occurrence of term conversion, respectively. The network upgrade bridge loan was repaid from reimbursements by the interconnecting utility of reimbursable network upgrade costs. The construction loans converted into term loans upon completion of construction of the Ocotillo wind project.
The Ocotillo Financing Agreement also provides for an operations and maintenance reserve letter of credit facility in an amount up to $10.5 million, a debt service reserve letter of credit facility in an amount up to $22.0 million and a PPA letter of credit facility in an amount up to $26.7 million. We have agreed to indemnify Ocotillo in the event of disallowance of the ITC cash grant and for certain legal expenses in connection with certain pending legal proceedings at the project level. See Item 3 “Legal Proceedings.” Other than these indemnifications, the financing is non-recourse to us.
Interest Rate and Fees
The commercial bank tranche construction loans and the term loans are either base rate loans or LIBOR loans, and accrue interest at the base rate or LIBOR (as applicable), plus the applicable margin. Base rate loans accrue interest at the greatest of (i) the prime rate, (ii) the federal funds rate plus 0.50% and (iii) the LIBOR plus 1.00%. The applicable margin for the commercial bank tranche construction loan was 3.00%. The applicable margin for development bank tranche construction and term loans is 2.10%. Our estimated annual effective interest rate on the development bank tranche, after taking into consideration our fixed-for-floating rate swaps on 90% of the loan commitment, is approximately 4.6%. In October 2014, the Ocotillo Financing Agreement was amended to include a margin rate decrease of 1.0% for the commercial bank tranche. The applicable margin for commercial bank tranche term loans is now, after the re-pricing, 1.75% and increases by 0.25% on the fourth anniversary of the term conversion date. The effective annual interest rate for the commercial bank tranche term loan, after taking into consideration our fixed-for-floating rate swaps on 90% of the loan commitment, is approximately 3.9%. The applicable margin for each of the PPA, the operations and maintenance and the debt service reserve letter of credit loans is now, after the re-pricing, 1.75%, respectively, from term conversion until the 4th anniversary of the term conversion date, and 2.00%, thereafter. As of December 31, 2014, approximately $328.9 million of indebtedness was outstanding under the Ocotillo Financing Agreement.
Ocotillo is also required to pay quarterly commitment fees on the commercial bank tranche construction loan commitment, the development bank tranche construction loan commitment, and each of the LC commitments.
Distribution Conditions
Ocotillo LLC may distribute excess cash flows to its owner provided that specified distribution requirements are met. The distribution requirements include, among other things, that: (i) there are no letter of credit loans or network upgrade bridge loans outstanding; (ii) the term conversion of the construction loans has occurred; (iii) the multipurpose reserve account is fully funded; (iv) no default or inchoate default has occurred and such distribution will not result in an event of default; and (v) the annual debt service coverage ratio is equal to or greater than 1.20:1.00.
Prepayments, Certain Covenants and Events of Default
The Ocotillo Financing Agreement contains a broad range of covenants that, subject to certain exceptions, limit Ocotillo LLC’s ability to incur debt, grant liens, sell or lease assets, transfer equity interests, dissolve, pay dividends and change its business. Ocotillo LLC may voluntarily prepay the facility, in whole or in part, at any time without premium or penalty except for liquidation costs or interest fix fees, as applicable, and, in certain circumstances, must make mandatory prepayments of loans under the facility.
88
Table of Contents
Currently, Ocotillo LLC’s right of way grant to utilize federal land is the subject of litigation. We do not believe this matter will have a material adverse effect on our business, but the Ocotillo Financing Agreement contains provisions that provide lender protection to the extent that the litigation causes or would reasonably be expected to cause a material degradation in Ocotillo LLC’s prospects, either though reduced revenues or increased costs. Such provisions include limited cash traps and mandatory pre-payments, if needed.
El Arrayán Senior Financing Agreement
In May 2012, Parque Eólico El Arrayán SPA, or “El Arrayán SPA,” entered into a first lien senior secured credit agreement, or the “El Arrayán Credit Agreement.” The El Arrayán Credit Agreement provides up to approximately $225.5 million in borrowings. Borrowings under the El Arrayán Credit Agreement were being used to finance the construction of the El Arrayán wind project and are comprised of a commercial tranche of up to $100.0 million and an export credit agency tranche provided by Eksport Kredit Fonden of Denmark, or the “EKF Tranche,” of up to $110.0 million, and letter of credit facility in an amount of up to $15 million. The construction loan converted into a term loan upon completion of construction of El Arrayán on August 15, 2014.
As of December 31, 2014, approximately $209.3 million of indebtedness was outstanding under the El Arrayán Credit Agreement. The financing is non-recourse to us.
Interest Rate and Fees
The commercial tranche construction and term loans are, with certain exceptions, LIBOR loans and accrue interest at LIBOR plus 2.75% per annum from the closing until the sixth anniversary of closing, 3.00% from the sixth anniversary to the tenth anniversary of closing, 3.25% from the tenth anniversary to the fourteenth anniversary of closing, and 3.50% after the fourteenth anniversary of closing. The EKF Tranche term loans accrue interest at a fixed rate of 5.56%, in each case, plus a margin of 0.25% from the sixth anniversary to the tenth anniversary of the closing, 0.50% from the tenth anniversary to the fourteenth anniversary of closing, and 0.75% after the fourteenth anniversary of closing. After taking into consideration our fixed-for-floating rate swaps on 95.8% of the commercial tranche term loan, our estimated effective annual interest rate on the term loan is approximately 5.64%.
El Arrayán SPA is also required to pay semi-annual commitment fees on the letter of credit commitments. El Arrayán SPA also pays arranger fees and agency fees.
Distribution Conditions
El Arrayán SPA may distribute excess cash flows to its owner provided that specified distribution requirements are met. The distribution requirements include that: (i) the date is six months after term conversion or September 30, 2014 has occurred; (ii) the first repayment date has occurred, (iii) no default or event of default has occurred and is continuing; (iv) the reserve accounts are fully funded or the applicable letters of credit have been issued and are available for drawing; and (v) the debt service coverage ratio for the two preceding semi-annual periods is not less than 1.20:1:00.
Prepayments, Certain Covenants and Events of Default
The El Arrayán Credit Agreement contains a broad range of covenants that, subject to certain exceptions, restrict El Arrayán SPA’s ability to incur debt, grant liens, sell or lease assets, transfer equity interests, dissolve, pay dividends and change its business. El Arrayán SPA may, with certain exceptions, voluntarily prepay the facility at any time without premium or penalty except for breakage costs, and, in certain circumstances, must make mandatory prepayments of loans under the facility.
El Arrayán Value Added Tax Facility
In May 2012, El Arrayán SPA also entered into a $20.0 million value added tax facility with Corpbanca. Under the value added tax facility El Arrayán SPA may borrow funds to pay for value added tax payments due
89
Table of Contents
from the project; the last day to borrow funds was November 3, 2014. The value added tax facility has an interest rate of Chilean Interbank Rate plus 1.00% and will terminate in November 2015. As of December 31, 2014, the outstanding balance under the value added tax facility was $2.0 million.
South Kent Senior Financing Agreement
In March 2013, South Kent Wind LP entered into a first lien senior secured financing agreement, or the “South Kent Financing Agreement.” The South Kent Financing Agreement provides up to approximately C$683.8 million in borrowings. Borrowings under the South Kent Financing Agreement were used to finance the construction of the South Kent project and were comprised of a construction loan of up to approximately C$683.8 million. The construction loan converted into a term loan upon completion of construction of the South Kent project on March 28, 2014. The term loan matures seven years after the occurrence of the term conversion. The financing is non-recourse to us. As of December 31, 2014, the outstanding balance of the loan was approximately C$681.9 million.
The South Kent Financing Agreement also provides for an operations and maintenance reserve letter of credit facility in an amount up to C$12.0 million and a debt service reserve letter of credit facility in an amount up to C$40.6 million, which we collectively refer to as the “letter of credit loans.”
Interest Rate and Fees
The construction loan, the letter of credit loans, and, after the term conversion, the term loans are either prime rate loans or Canadian Dealer Offered Rate, or “CDOR” loans, and accrue interest at the prime rate or CDOR (as applicable), plus the applicable margin. Prime rate loans accrue interest at a rate per annum equal to the sum of the Canadian Prime Rate in effect from time to time plus 1.50% (increasing to 1.75% after the fourth anniversary of term conversion). CDOR loans accrue interest at a rate per annum equal to the sum of CDOR for the applicable interest period plus 2.50% (increasing to 2.75% after the fourth anniversary of term conversion). After taking into consideration our fixed-for-floating rate swaps on 90% of the loan commitment, our estimated effective annual interest rate on the term loan is approximately 5.58%.
South Kent Wind LP is also required to pay quarterly commitment fees on the construction loan commitment and each of the letter of credit loan commitments.
Distribution Conditions
South Kent Wind LP may distribute excess cash flows to its owners provided that specified distribution requirements are met. The distribution requirements include, among other things, that: (i) there are no letter of credit loans outstanding; (ii) the term conversion of the construction loan has occurred; (iii) no default or inchoate default has occurred and such distribution will not result in an event of default; and (iv) the annual debt service coverage ratio is equal to or greater than 1.20:1.00.
Prepayments, Certain Covenants and Events of Default
The South Kent Financing Agreement contains a broad range of covenants that, subject to certain exceptions, limit South Kent Wind LP’s ability to incur debt, grant liens, sell or lease assets, transfer equity interests, dissolve, pay dividends and change its business. South Kent Wind LP may voluntarily prepay the facility, in whole or in part, at any time without premium or penalty except for liquidation costs or interest fix fees, as applicable, and, in certain circumstances, must make mandatory prepayments of loans under the facility.
Grand Credit Agreement
In September 2013, Grand entered into a credit agreement or the “Grand Credit Agreement.” The Grand Credit Agreement provides up to C$395.4 million in construction loan borrowings and up to C$37.0 million of
90
Table of Contents
letters of credit under a letter of credit facility. Construction loan borrowings were used to finance the construction of the Grand wind power project, which was completed in December 2014, and is expected to be converted to a term loan in early 2015. The term loan will mature seven years after the term conversion date of the construction loan. The outside maturity date of the term loan and the letter of credit facility is no later than June 30, 2022. Letters of credit under the letter of credit facility can be issued in connection with debt service reserve requirements, O&M reserve requirements, and decommissioning requirements. As of December 31, 2014, C$349.6 million of indebtedness was outstanding under the Grand Credit Agreement, all of which was outstanding under the term loan and $0 was outstanding under the letter of credit facility. The financing is non-recourse to us.
Interest Rate and Fees
Loans are either prime rate loans or CDOR loans. If the construction loan is a prime rate loan it accrues interest at the greater of (i) lenders prime rate, or (ii) 30-day CDOR plus 1%, plus an applicable margin of 1.25%; If the construction loan is a CDOR loan it accrues interest at the applicable CDOR per interest period plus 2.25%. After conversion, if the term loan is a prime rate loan it will accrue interest at the greater of (i) lenders prime rate, or (ii) 30-day CDOR plus 1%, plus an applicable margin of 1.25%; If the term loan is a CDOR loan it will accrue interest at the applicable CDOR per interest period plus 2.25%. The letter of credit loans are drawn as prime rate borrowings that subsequently convert to CDOR loans and accrue the same interest as the construction or term loans, as the case may be.
Grand is also required to pay quarterly commitment fees on and undrawn amount of the construction loan commitment and the letter of credit loan commitment.
Distribution Conditions
Grand may distribute excess cash flows to its owner provided that specified distribution requirements are met. The distribution requirements include that: (i) term conversion shall have occurred, (ii) the first payment of scheduled principal shall have been paid by Grand, (iii) the debt service coverage ratio at the end of Grand’s immediately preceding fiscal quarter is 1.2:1.00 or greater, (iv) all outstanding letter of credit loans shall have been paid; and (vi) no default or event of default shall have occurred and is continuing or would result from the distribution.
Prepayments, Certain Covenants and Events of Default
The Grand Credit Agreement contains standard covenants that, among other things and subject to certain exceptions, restrict Grand’s ability to incur debt, grant liens, sell or lease certain assets, transfer equity interests, dissolve, make distributions and change its business. Grand may voluntarily prepay the construction or term loan, in whole or in part, at any time without premium or penalty, provided it shall have first prepaid any outstanding letter of credit loans, and, in certain circumstances, must make mandatory prepayments of the loans.
Logan’s Gap Credit Agreement
In December 2014, Logan’s Gap entered into a financing agreement or the “Logan’s Gap Financing Agreement.” The Logan’s Gap Financing Agreement provides up to $247.1 million in construction loan borrowings and up to $35.7 million of letters of credit under a letter of credit facility. The construction loans and letters of credit are due and payable by December 31, 2015. Construction loan borrowings are being used to finance the construction of the Logan’s Gap project and will be paid off upon completion of construction of the project in connection with a tax equity financing of the project. As of December 31, 2014, $84.4 million of indebtedness was outstanding under the Logan’s Gap Financing Agreement, $58.7 million of which was outstanding under the construction loan and $25.7 million was outstanding under the letter of credit facility. In December 2014, Logan’s Gap also entered into a Letter of Credit and Reimbursement Agreement pursuant to which, following the repayment of the construction financing loan, a replacement letter of credit of up to $15.0 million will be issued in favor of the hedge counterparty, which is non-recourse to us.
91
Table of Contents
Interest Rate and Fees
The loans are either base rate loans or LIBOR loans. Loans that are LIBOR loans accrue interest at LIBOR plus 1.375% per annum, and loans that are base rate loans accrue interest at the greater of (i) the prime rate (ii) the federal funds rate plus 0.50%, or (iii) LIBOR rate plus 1.00% per annum, in each case plus 0.375% per annum.
Logan’s Gap is also required to pay quarterly commitment fees on and undrawn amount of the construction loan commitment and the letter of credit loan commitments.
Prepayments, Certain Covenants and Events of Default
The Logan’s Gap Financing Agreement contains standard covenants that, among other things and subject to certain exceptions, restrict Logan’s Gap’s ability to incur debt, grant liens, sell or lease certain assets, transfer equity interests, dissolve, make distributions and change its business. Logan’s Gap may voluntarily prepay the construction loan in whole or in part, at any time without premium or penalty, provided it shall have first prepaid any outstanding letter of credit loans, and, in certain circumstances, must make mandatory prepayments of the loans.
Logan’s Gap Tax Equity Commitment
Pursuant to an Equity Capital Contribution Agreement dated December 19, 2014, we and various tax equity investors, the “Class A Equity Investors”, undertook a commitment to make equity capital contributions to Logan’s Gap Holdings LLC, which owns the project company, Logan’s Gap Wind LLC. We and the Class A Equity Investors will make our respective equity capital contributions upon the project achieving commercial operations, and satisfaction of other conditions precedent, anticipated to occur during the fourth quarter of 2015. Upon making this investment, the Class A Equity Investors will acquire Class A member interests in the project and the Class A members will be entitled to receive allocations of cash distributions and tax items of Logan’s Gap Holdings consistent with other tax equity transactions and we will receive the remainder of such allocations and distributions.
Gulf Wind Tax Equity Partnership Transaction
Gulf Wind LLC is owned 100% by Pattern Gulf Wind Holdings LLC, or “Pattern Gulf Holdings.” On August 25, 2010, a subsidiary of Pattern Development assigned its interest in Pattern Gulf Holdings to a newly formed subsidiary, Pattern Gulf Wind Equity LLC. On September 3, 2010, Pattern Gulf Wind Equity LLC, or “Pattern Equity,” sold an interest, or the “Class A Member interest,” in Pattern Gulf Holdings to MetLife Capital, Limited Partnership, or the “Class A Member,” in a tax equity partnership transaction, pursuant to which the Class A Member is entitled to receive allocations of cash distributions and tax items of Pattern Gulf Holdings that vary over time as described below. Pattern Equity and the Class A Member agreed that the fair value of Class A Member interest was approximately 46% of the aggregate fair value of the sum of all equity interests in Pattern Gulf Holdings. We currently own 60% of the existing Class B member interests in Pattern Gulf Holdings and one of our subsidiaries is the managing member of Pattern Gulf Holdings. Throughout the remainder of this description, we and Pattern Development (as a result of its ownership of the Pattern Development retained Gulf Wind interest) together are collectively referred to as the “Class B Members.”
Allocation of Distributions
In accordance with the terms of the operating agreement of Pattern Gulf Holdings, prior to the earlier of the flip point (the point at which the Class A Member has realized a specified internal rate of return) or December 31, 2015, the Class A Member shall receive approximately 33% of all distributions from Pattern Gulf Holdings. If the flip point has not been reached by December 31, 2015, the Class A Member shall begin
92
Table of Contents
receiving approximately 66% of the Pattern Gulf Holdings’ cash distributions from January 1, 2016 until the flip point has been reached. After the flip point, the Class A Member will receive 7.25% of the distributions, but not less than the amount that will offset certain Class A Member tax liabilities, or the “Tax Make-Whole Payment.” In each case, the Class B Members will receive the remainder of all distributable cash.
Allocation of Tax Items
Prior to the flip point, Pattern Gulf Holdings’ tax items consisting of income, gain, loss and deductions, or the “Tax Items,” are allocated as follows: prior to the earlier of the flip point and December 31, 2015, 99% of the Tax Items are allocated to the Class A Member and 1% to Pattern Equity. If the flip point has not occurred by December 31, 2015, the Class A Member shall begin receiving approximately 66% of the Tax Items from January 1, 2016 until the flip point has been reached and the balance to the Class B Members. After the flip point, the Class A Member receives the greater of (i) 7.25% of the Tax Items and (ii) an amount of income or gain equal to the Tax Make-Whole Payment, and the balance, to the Class B Members.
The Class A Member’s Right to Escrow Distributions
If the Class A Member suffers any losses or damages as the result of a breach of representation by Pattern Equity or breach of covenant or other obligations by Pattern Equity, in its capacity as managing member of Pattern Gulf Holdings, the Class A Member may provide notice to Pattern Equity and require that any distributions otherwise required to be paid to the Class B Member shall, instead, be paid to the Class A Member to cover any damages caused to the Class A Member. Any distributions that Pattern Equity agrees to pay to the Class A Member are paid to the Class A Member to satisfy their damages. To the extent the parties do not agree on the damages caused to the Class A Member, the Class B Members’ distributions are required to be paid into escrow with a third party commercial bank. Such escrowed amounts will be released from escrow upon the joint instruction of both parties, or, following a judgment or court order settling the dispute between the parties.
Management of Pattern Gulf Holdings
Pattern Gulf Holdings and the project are managed by one of our subsidiaries. The Class A Member is not involved in the day-to-day management of Pattern Gulf Holdings or the project. As is customary for transactions of this type, the managing member of Pattern Gulf Holdings is required to obtain the Class A Member’s consent for certain major decisions concerning the project and set forth in the operating agreement of Pattern Gulf Holdings. Such major decisions include, for example, incurring indebtedness other than permitted indebtedness, encumbering project assets, sale of project assets, terminating material principal project documents, certain changes in method of accounting, merging and consolidating the project and such other major actions. In the event that Pattern Equity becomes insolvent, dissolves or encounters a regulatory impediment preventing its ownership of the project, the Class A Member has an option to buy out Pattern Equity’s interests in the project.
Panhandle 1 Tax Equity Partnership Transaction
Pattern Panhandle Wind LLC, or “Panhandle Wind,” was 100% owned by our subsidiaries Panhandle B Member LLC, or the “Class B Member,” and Panhandle Alternate B Member LLC (which subsequently transferred 100% of its interests in the project to the Class B Member). Pursuant to an Equity Capital Contribution Agreement dated August 19, 2013, upon completion of construction, various Class A equity investors, or the “Class A Equity Investors” or “Class A Members,” and the Class B Member made equity capital contributions to Panhandle Wind and the Class B Member sold an interest in Panhandle Wind, or “the Class A Member Interest,” to the Class A Equity Investors in a tax equity partnership transaction, pursuant to which the Class A Members are entitled to receive allocations of cash distributions and tax items of Panhandle Wind that vary over time as described below. The Class B Members and the Class A Members agreed that the fair value of the Class A Member Interest was approximately 62% of the aggregate fair value of the sum of all equity interests in Panhandle Wind. We currently own 100% of the existing Class B member interests in Panhandle Wind and our subsidiary, the Class B Member, is the managing member of Panhandle Wind.
93
Table of Contents
Allocation of Distributions
In accordance with the terms of the operating agreement of Panhandle Wind, prior to the earlier of the flip point (the point at which the Class A Members have realized a specified internal rate of return) or June 29, 2023, the Class A Members shall receive approximately 21% of all distributions from Panhandle Wind. After the flip point, the Class A Members will receive 5% of the distributions, but not less than the amount that will offset certain Class A Member tax liabilities. In each case, the Class B Members will receive the remainder of all distributable cash. Distributions related to the sale of renewable energy credits (RECs) are made primarily to the Class B Members.
Allocation of Tax Items
Prior to the flip point, Panhandle Winds’ tax items consisting of income, gain, loss and deductions, or the “Tax Items,” are allocated as follows: prior to the flip point, 99% of the Tax Items are allocated to the Class A Members and 1% to the Class B Members. After the flip point, the Class A Members receive 5% of the Tax Items and the balance will be received by the Class B Members. Tax items related to the sale of RECs are allocated primarily to the Class B Member.
The Class A Member’s Right to Escrow Distributions
If the Class A Members suffer any losses or damages as the result of a breach of representation by the Class B Members or breach of covenant or other obligations by the Class B Member, in its capacity as managing member of Panhandle Wind, the Class A Members may provide notice to the Class B Member and require that any distributions otherwise required to be paid to the Class B Members shall, instead, be paid to the Class A Members to cover any damages caused to the Class A Members. Any distributions that the Class B Member agrees to pay to the Class A Members are paid to the Class A Members to satisfy their damages. To the extent the parties do not agree on the damages caused to the Class A Members, the Class B Member’s distributions are required to be paid into escrow with a third party commercial bank. Such escrowed amounts will be released from escrow upon the joint instruction of both parties, or, following a judgment or court order settling the dispute between the parties.
Management of Panhandle Wind
The project is managed by one of our subsidiaries. The Class A Members are not involved in the day-to-day management of the project. As is customary for transactions of this type, the managing member is required to obtain the Class A Members’ consent for certain major decisions concerning the project and set forth in the operating agreement of the project. Such major decisions include, for example, incurring indebtedness other than permitted indebtedness, encumbering project assets, sale of project assets, terminating material project documents, certain changes in method of accounting, merging and consolidating the project and such other major actions. In the event that the Class B Members become insolvent, dissolve or encounter a regulatory impediment preventing their ownership of the project, the Class A Members have an option to buy out the Class B Members’ interests in the project.
Panhandle 2 Tax Equity Partnership Transaction
Panhandle Wind 2 Holdings LLC, or “Panhandle Wind Holdings 2,” was 100% owned by our subsidiary Panhandle B Member 2 LLC, the “Class B Member”. Pursuant to an Equity Capital Contribution Agreement dated December 20, 2013, various class A equity investors, the “Class A Equity Investors” or “Class A Members,” and the Class B Member agreed to make equity capital contributions to Panhandle Wind Holdings 2 at the completion of construction, the Class B Member sold an interest, or the “Class A Member Interest,” in Panhandle Wind Holdings 2 to the Class A Equity Investors in a tax equity partnership transaction, pursuant to which the Class A Members are entitled to receive allocations of cash distributions and tax items of Panhandle
94
Table of Contents
Wind Holdings 2 that vary over time as described below. The Pattern B Member and the Class A Members agreed that the fair value of Class A Member interest was approximately 63% of the aggregate fair value of the sum of all equity interests in Panhandle Wind Holdings 2. We currently own 100% of the existing Class B Member interests in Panhandle Wind Holdings 2 and one of our subsidiaries is the managing member of Panhandle Wind Holdings 2.
Allocation of Distributions
In accordance with the terms of the operating agreement of Panhandle Wind Holdings 2, prior to the earlier of the flip point (the point at which the Class A Members have realized a specified internal rate of return) or November 30, 2023, the Class A Members shall receive approximately 19% of all distributions from Panhandle Wind Holdings 2. If the amount of distributions is below a determined schedule, the Class A Members shall receive 40% of distributable cash and the Class B Members shall receive the remainder of distributable cash. After the flip point, the Class A Members will receive 5% of the distributions, but not less than the amount that will offset certain Class A Members’ tax liabilities. In each case, the Class B Members will receive the remainder of all distributable cash. Distributions related to the sale of renewable energy credits (RECs) are made primarily to the Class B Member.
Allocation of Tax Items
Prior to the flip point, Panhandle Wind Holdings 2’s tax items consisting of income, gain, loss and deductions, or the “Tax Items,” are allocated as follows: 99% of the Tax Items are allocated to the Class A Members and 1% to the Class B Members. After the flip point, the Class A Members receive 5%, and the balance will be received by the Class B Members. Tax items related to the sale of RECs are allocated primarily to the Class B Member.
The Class A Member’s Right to Escrow Distributions
If the Class A Members suffer any losses or damages as the result of a breach of representation by the Class B Member or breach of covenant or other obligations by the Class B Member, in its capacity as managing member of Panhandle Wind Holdings 2, the Class A Members may provide notice to the Class B Member and require that any distributions otherwise required to be paid to the Class B Member shall, instead, be paid to the Class A Members to cover any damages caused to the Class A Members. Any distributions that the Class B Member agrees to pay to the Class A Members are paid to the Class A Members to satisfy their damages. To the extent the parties do not agree on the damages caused to the Class A Members, the Class B Member’s distributions are required to be paid into escrow with a third party commercial bank. Such escrowed amounts will be released from escrow upon the joint instruction of both parties, or, following a judgment or court order settling the dispute between the parties.
Management of Panhandle Wind Holdings
The project is managed by one of our subsidiaries. The Class A Members are not involved in the day-to-day management of the project. As is customary for transactions of this type, the managing member is required to obtain the Class A Members’ consent for certain major decisions concerning the project and set forth in the operating agreement of the project. Such major decisions include, for example, incurring indebtedness other than permitted indebtedness, encumbering project assets, sale of project assets, terminating material project documents, certain changes in method of accounting, merging and consolidating the project and such other major actions. In the event that the Class B Member becomes insolvent, dissolves or encounters a regulatory impediment preventing its ownership of the project, the Class A Members have an option to buy out the Class B Member’s interests in the project.
95
Table of Contents
Contractual Obligations
We have a variety of contractual obligations and other commercial commitments that represent prospective cash requirements in addition to our capital expenditure programs. See also Note 8, Long-term Debt, and Note 17, Commitments and Contingencies, in the consolidated financial statements for additional discussion of contractual obligations.
The following table summarizes our contractual obligations as of December 31, 2014 (in thousands):
| Contractual Obligations |
Less Than | More Than | ||||||||||||||||||
| Total | 1 Year | 1-3 Years | 3-5 Years | 5 Years | ||||||||||||||||
| Long term debt principal payments |
$ | 1,450,613 | $ | 121,561 | $ | 133,154 | $ | 156,364 | $ | 1,039,534 | ||||||||||
| Long term debt interest payments |
547,801 | 61,241 | 113,461 | 103,324 | 269,775 | |||||||||||||||
| Purchase, construction, and other commitments |
200,678 | 194,809 | 802 | 736 | 4,331 | |||||||||||||||
| Land leases |
169,075 | 5,971 | 10,818 | 10,843 | 141,443 | |||||||||||||||
| Operations and maintenance |
353,413 | 40,118 | 88,970 | 75,453 | 148,872 | |||||||||||||||
| Asset retirement obligations |
25,167 | — | — | — | 25,167 | |||||||||||||||
|
|
|
|
|
|
|
|
|
|
|
|||||||||||
| Total |
$ | 2,746,747 | $ | 423,700 | $ | 347,205 | $ | 346,720 | $ | 1,629,122 | ||||||||||
|
|
|
|
|
|
|
|
|
|
|
|||||||||||
In addition, below is a summary of our proportion of debt in unconsolidated investments, as of December 31, 2014 (in thousands):
| Our Portion of | ||||||||||||
| Total |
Percentage of | Unconsolidated | ||||||||||
| Project Debt | Ownership | Project Debt | ||||||||||
| South Kent |
$ | 586,982 | 50.0 | % | $ | 293,491 | ||||||
| Grand |
300,921 | 45.0 | % | 135,414 | ||||||||
|
|
|
|
|
|||||||||
| Unconsolidated investments - debt |
$ | 887,903 | $ | 428,905 | ||||||||
|
|
|
|
|
|||||||||
Off-Balance Sheet Arrangements
We are not a party to any off-balance sheet arrangements.
Critical Accounting Policies and Estimates
Our discussion and analysis of our financial condition and results of operations are based on our consolidated historical financial statements that are included elsewhere in this Form 10-K, which have been prepared in accordance with U.S. GAAP. In applying the critical accounting policies set forth below, our management uses its judgment to determine the appropriate assumptions to be used in making certain estimates. These estimates are based on management’s experience, the terms of existing contracts, management’s observance of trends in the wind power industry, information provided by our power purchasers and information available to management from other outside sources, as appropriate. These estimates are subject to an inherent degree of uncertainty.
We use estimates, assumptions and judgments for certain items, including the calculation of our acquisitions, noncontrolling interest balances, the depreciable lives of property, plant and equipment, impairment of long-lived assets, derivatives, income taxes, asset retirement obligations, revenue recognition, certain components of cost of revenue and exemptions and the valuation of stock-based compensation. These estimates, assumptions and judgments are derived and continually evaluated based on available information, experience and various assumptions we believe to be reasonable under the circumstances. To the extent these estimates are materially incorrect and need to be revised, our operating results may be materially adversely affected.
96
Table of Contents
Acquisitions
Business Combinations
When we acquire a controlling interest, the purchase is accounted for using the acquisition method, and the fair value of purchase consideration is allocated to the tangible and intangible assets acquired and liabilities assumed based on their estimated fair values. The excess, if any, of the fair value of purchase consideration over the fair values of these identifiable assets and liabilities is recorded as goodwill. Conversely, the excess, if any, of the net fair values of identifiable assets and liabilities over the fair value of purchase consideration is recorded as gain. Such valuations require management to make significant estimates and assumptions, especially with respect to intangible assets. These estimates and assumptions are inherently uncertain, and as a result, actual results may differ from estimates. Significant estimates include, but are not limited to, future expected cash flows, useful lives and discount rates. During the measurement period, which is one year from the acquisition date, we may record adjustments to the assets acquired and liabilities assumed, with a corresponding offset to either goodwill or gain, depending on whether the fair value of purchase consideration is in excess of or less than net assets acquired. Upon the conclusion of the measurement period, any subsequent adjustments are recorded to earnings.
Equity Method Investments
When we acquire a noncontrolling interest the investment is accounted for using the equity method of accounting and is initially recognized at cost.
Noncontrolling Interests
Noncontrolling interests represent the portion of our net (loss) income, net assets and comprehensive (loss) income that is not allocable to us and is calculated based on our ownership percentage, for certain projects.
For the noncontrolling interests in our Gulf Wind, Panhandle 1 and Panhandle 2 projects, we have determined that the operating partnership agreements do not allocate economic benefits pro rata to our two classes of investors and the appropriate methodology for calculating our noncontrolling interest balance that reflects the substantive profit sharing arrangement is a balance sheet approach using the hypothetical liquidation at book value (“HLBV”) method.
Under the HLBV method, the amounts reported as noncontrolling interest in the consolidated balance sheets and consolidated statements of operations represent the amounts the third party would hypothetically receive at each balance sheet reporting date under the liquidation provisions of the operating partnership agreement assuming the net assets of Gulf Wind, Panhandle 1 and Panhandle 2 were liquidated at recorded amounts determined in accordance with U.S. GAAP and distributed to the investors. The third-party interest in the results of operations of Gulf Wind, Panhandle 1 and Panhandle 2 and our net income (loss) and comprehensive income (loss) is determined as the difference in noncontrolling interests in the consolidated balance sheets at the start and end of each reporting period, after taking into account any capital transactions between Gulf Wind, Panhandle 1, Panhandle 2 and the third party. The noncontrolling interest balances in Gulf Wind, Panhandle 1 and Panhandle 2 are reported as a component of equity in the consolidated balance sheets.
Property, Plant and Equipment
Property, plant and equipment represents the costs of completed and operational projects transferred from construction in progress, as well as land, computer equipment and software, furniture and fixtures, leasehold improvements and other equipment. Property, plant and equipment are stated at cost, less accumulated depreciation. Depreciation is calculated using the straight-line method over the respective assets’ useful lives. Wind farms are depreciated over 20 years and the remaining assets are depreciated over three to five years. Land is not depreciated. Improvements to property, plant and equipment represents the costs of completed and operational projects transferred from construction in property, plant and equipment deemed to extend the useful economic life of an asset are capitalized. Repair and maintenance costs are expensed as incurred.
97
Table of Contents
Impairment of Long-Lived Assets
We periodically evaluate long-lived assets for potential impairment whenever events or changes in circumstances have occurred that indicate that impairment may exist, or the carrying amount of the long-lived asset may not be recoverable. An impairment loss is recognized only if the carrying amount of a long-lived asset is not recoverable based on its estimated future undiscounted cash flows. An impairment loss is calculated based on the excess of the carrying value of the long-lived asset over the fair value of such long-lived asset , with the fair value determined based on an estimate of discounted future cash flows.
Derivatives
We have, and we intend to, enter into derivative transactions for the purpose of reducing exposure to fluctuations in interest rates, electricity prices and foreign currency exchange rates. We entered into interest rate swap agreements and have designated these derivatives as cash flow hedges of expected interest payments on variable rate debt. We have also entered into an interest rate cap and an electricity price derivative. Our interest rate cap and energy derivative agreement do not qualify for hedge accounting.
We recognize our derivative instruments at fair value in the consolidated balance sheet, unless the derivative instruments qualify for the “normal purchase normal sale” (“NPNS”) scope exception to derivative accounting. Accounting for changes in the fair value (i.e., gains or losses) of a derivative instrument depends on whether the derivative instrument has been designated as part of a hedging relationship and on the type of hedging relationship.
For derivative instruments that are designated as cash flow hedges, the effective portion of change in fair value of the derivative is reported as a component of other comprehensive (loss) income. Changes in the fair value of these derivatives are subsequently reclassified into earnings in the period that the hedged transaction affects earnings. The ineffective portion of change in fair value is recorded as a component of net (loss) income on the consolidated statement of operations. For undesignated derivative instruments their change in fair value is reported as a component of net (loss) income on the consolidated statement of operations. Certain of our electricity price derivatives that qualify for the NPNS scope exception to derivative accounting are accounted for under the accrual method of accounting.
Income Taxes
Prior to October 2, 2013, our predecessor did not provide for income taxes as it was treated as a pass-through entity for U.S. federal and state income tax purposes, except for several specific circumstances involving its Canadian entities, which are subject to Canadian income taxes, its Chilean entities, which are subject to Chilean income taxes, a U.S. entity that is subject to Puerto Rican taxes and a U.S. entity which became subject to U.S. income taxes in 2012. Federal and state income taxes were assessed at the owner level and each owner was liable for its own tax payments. Certain consolidated entities are corporations or have elected to be taxed as corporations. In these circumstances, income tax was accounted for under the asset and liability method.
Subsequent to October 2, 2013, following the Contribution Transactions, we account for income taxes under the asset and liability method, which requires the recognition of deferred tax assets and liabilities for the expected future tax consequences of events that have been included in the financial statements. Under this method, deferred tax assets and liabilities are determined on the basis of the differences between the financial statement and tax basis of assets and liabilities using enacted tax rates in effect for the year in which the differences are expected to reverse. The effect of a change in tax rates on deferred tax assets and liabilities is recognized in income in the period that includes the enactment date. We recognize deferred tax assets to the extent that we believe these assets are more likely than not to be realized. In making such a determination, we consider all available positive and negative evidence, including future reversals of existing taxable temporary differences, projected future taxable income, tax-planning and results of recent operations. If we determine that we would be
98
Table of Contents
able to realize deferred tax assets in the future in excess of their net recorded amount, we would make an adjustment to the deferred tax asset valuation allowance, which would reduce the provision for income taxes. We record uncertain tax positions in accordance with Accounting Standards Codification (“ASC”) 740 on the basis of a two-step process whereby (1) we determine whether it is more likely than not that the tax positions will be sustained on the basis of the technical merits of the position and (2) for those tax positions that meet the more-likely-than-not recognition threshold, we recognize the largest amount of tax benefit that is more than 50 percent likely to be realized upon ultimate settlement with the related tax authority. We have a policy to classify interest and penalties associated with uncertain tax positions together with the related liability, and the expenses incurred related to such accruals, if any are included in the provision for income taxes.
Asset Retirement Obligation
We record asset retirement obligations for the estimated costs of decommissioning turbines, removing above-ground installations and restoring sites, at the time when a contractual decommissioning obligation materializes. We record accretion expense, which represents the increase in the asset retirement obligations, over the remaining or operational life of the associated wind project. Accretion expense is recorded as a component of cost of revenue in the statement of operations using accretion rates based on credit adjusted risk-free interest rates.
Revenue Recognition
We sell the electricity we generate under the terms of our power sale agreements or at spot-market prices. Revenue is recognized based upon the amount of electricity delivered at rates specified under the contracts, assuming all other revenue recognition criteria are met. We evaluate our PPAs to determine whether they are, in substance, leases or derivatives and, if applicable, recognize revenue pursuant to ASC 840 Leases and ASC 815 Derivatives and Hedging, respectively.
We also generate renewable energy credits as we produce electricity. Certain of these energy credits are sold independently in an open market and revenue is recognized at the time title to the energy credits is transferred to the buyer.
We acquired a ten-year energy derivative instrument under the terms of our acquisition of Gulf Wind, which fixes approximately 58% of our expected electricity sales at Gulf Wind through April 2019. The energy derivative instrument reduces exposure to changes in commodity prices by allowing us to lock in a fixed price per MWh for a specified amount of annual electricity production. The monthly settlement amounts under the energy hedge are accounted for as energy derivative settlements in the consolidated statements of operations. The change in the fair value of the energy hedge is classified as energy derivative revenue in the consolidated statements of operations.
Cost of Revenue
Our cost of revenue is comprised of direct costs of operating and maintaining our power projects, including labor, turbine service arrangements, land lease royalties, depreciation, amortization, property taxes and insurance.
Stock-Based Compensation
We account for stock-based compensation related to stock options granted to employees by estimating the fair value of the stock-based awards using the Black-Scholes option-pricing model. The fair value of the stock options granted is amortized over the applicable vesting period. The Black-Scholes option pricing model includes assumptions regarding dividend yields, expected volatility, expected option term, expected forfeiture rate and risk-free interest rates. We estimate expected volatility based on the historical volatility of comparable publicly traded companies for a period that is equal to the expected term of the options. The risk-free interest rate is based
99
Table of Contents
on the U.S. treasury yield curve in effect at the time of grant for a period commensurate with the estimated expected life. The expected term of options granted is derived using the “simplified” method as allowed under the provisions of the ASC 718 Compensation—Stock Compensation, and represents the period of time that options granted are expected to be outstanding.
We account for stock-based compensation related to restricted stock award grants by amortizing the fair value of the restricted stock award grants, which is the grant date market price, over the applicable vesting period.
We record stock-based compensation expense as a component of general and administrative expenses in our consolidated statements of operations.
JOBS Act
In April 2012, the JOBS Act was enacted. Section 107 of the JOBS Act provides that an emerging growth company can take advantage of the extended transition period provided in Section 7(a)(2)(B) of the U.S. Securities Act for complying with new or revised accounting standards. In other words, an emerging growth company can delay the adoption of certain accounting standards until those standards would otherwise apply to private companies. We ceased being an emerging growth company as defined in the JOBS Act on December 31, 2014, as we became a large accelerated filer, and so we no longer have the option to delay the adoption of these accounting standards. We must also now perform system and process evaluation and testing of our internal control over financial reporting to allow management to report on the effectiveness of our internal control over financial reporting, as required by Section 404 of the Sarbanes-Oxley Act.
Item 7A. Quantitative and Qualitative Disclosures about Market Risk
We have significant exposure to commodity prices, interest rates and foreign currency exchange rates, as described below. To mitigate commodity price and interest rate risks, we have entered into multiple derivatives. We have not applied hedge accounting treatment to all of our derivatives, therefore we are required to mark some of our derivatives to market through earnings on a reporting basis, which will result in non-cash adjustments to our earnings and may result in volatility in our earnings, in addition to potential cash settlements for any losses.
Commodity Price Risk
We manage our commodity price risk for electricity sales through the use of long-term power sale agreements with creditworthy counterparties. Our financial results reflect approximately 613,249 MWh and 308,000 MWh of electricity sales in the years ended December 31, 2014 and 2013, respectively, that were not subject to power sale agreements and were subject to spot-market pricing. A hypothetical increase or decrease of $3.59 per MWh and $3.04 per MWh (or an approximately 10% change) in these spot-market prices would have increased or decreased earnings by $2.1 million and $0.9 million, respectively, for the years ended December 31, 2014 and 2013, respectively.
Interest Rate Risk
We use a variety of derivative instruments to manage our exposure to fluctuations in interest rates, including interest rate swaps and interest rate caps, primarily in the context of our project-level indebtedness. We generally match the tenor and amount of these instruments to the tenor and amount, respectively, of the related debt financing. We also will have exposure to changes in interest rates with respect to our revolving credit agreement to the extent that we make draws under that facility. A hypothetical increase or decrease in short-term interest rates by 1% would not have a material impact to earnings for the years ended December 31, 2014 and 2013, respectively.
100
Table of Contents
Foreign Currency Exchange Rate Risk
A majority of our power sale agreements and operating expenditures are U.S. dollar denominated and the remaining is Canadian dollar denominated. We manage our foreign currency exchange rate risk through the consideration of forward exchange rate derivatives. Beginning in 2015, we have implemented a hedging program whereby we enter into forward exchange rate derivatives to manage our foreign currency exposure at our St. Joseph, South Kent and Grand projects. A hypothetical increase or decrease of US$0.10 per Canadian dollar would have increased or decreased our consolidated earnings (loss) by $1.2 million and $0.3 million for the years ended December 31, 2014 and 2013, respectively.
| Item 8. | Financial Statements and Supplementary Data. |
The financial statements and schedules are listed in Part IV, Item 15 of this Form 10-K, beginning at page F-1, Index to Consolidated Financial Statements, and are incorporated by reference herein.
| Item 9. | Changes in and Disagreements with Accountants on Accounting and Financial Disclosure. |
None.
| Item 9A. | Controls and Procedures. |
Evaluation of Disclosure Controls and Procedures
Our management, with the participation of our chief executive officer and chief financial officer, has evaluated the effectiveness of our disclosure controls and procedures pursuant to Rules 13a-15(e) and 15d-15(e) under the Securities Exchange Act of 1934, as amended (Exchange Act), as of the end of the period covered by this Form 10-K.
Based on this evaluation, our chief executive officer and chief financial officer concluded that, as of December 31, 2014, our disclosure controls and procedures are designed at a reasonable assurance level and are effective to provide reasonable assurance that information we are required to disclose in reports that we file or submit under the Exchange Act is recorded, processed, summarized, and reported within the time periods specified in the SEC’s rules and forms, and that such information is accumulated and communicated to our management, including our chief executive officer and chief financial officer, as appropriate, to allow timely decisions regarding required disclosure.
Inherent Limitations Over Internal Controls
In designing and evaluating the disclosure controls and procedures, management recognizes that any controls and procedures, no matter how well designed and operated, can provide only reasonable assurance of achieving the desired control objectives. In addition, the design of disclosure controls and procedures must reflect the fact that there are resource constraints and that management is required to apply its judgment in evaluating the benefits of possible controls and procedures relative to their costs.
Management’s Annual Report on Internal Control over Financial Reporting
Our management is responsible for establishing and maintaining adequate internal control over financial reporting, as defined in Rule 13a-15(f) under the Exchange Act. Management conducted an assessment of the effectiveness of our internal control over financial reporting based on the criteria set forth in Internal Control – Integrated Framework issued by the Committee of Sponsoring Organizations of the Treadway Commission (2013 framework).
101
Table of Contents
Based on this evaluation, management concluded that our internal control over financial reporting was effective as of December 31, 2014. Our independent registered public accounting firm, Ernst & Young LLP, has issued an audit report on our internal control over financial reporting, which appears below.
As permitted by SEC regulations related to material business combinations during the year, management’s evaluation of internal controls did not include an evaluation of the internal control activities of El Arrayán, which we acquired a majority interest in on June 25, 2014. El Arrayán is included in our 2014 consolidated financial statements and constituted $352,926,000 and $118,751,000 of total and net assets, respectively, as of December 31, 2014 and $17,472,000 and $5,302,000 of revenues and net loss, respectively, for the year then ended.
Change in Internal Control Over Financial Reporting
Management previously identified and disclosed a material weakness in internal control over financial reporting with respect to the design and operation of controls over the methodology used to calculate earnings per share for the three months ended March 31, 2014. In addition, in connection with performing controls over financial statement close for the third quarter, management identified an error in the calculation of earnings per share initially reported for the three and six months ended June 30, 2014. Specifically, management did not correctly consider that the commercial operations date of South Kent on March 28, 2014 results in the recognition of a beneficial conversion feature and a deemed distribution to the holders of Class B common stock resulting from accretion of the beneficial conversion feature. As a result, management determined that a material weakness then existed in internal control over financial reporting related to the review and application of technical accounting principles. A material weakness is a deficiency, or a combination of deficiencies, in internal control over financial reporting, such that there is a reasonable possibility that a material misstatement of our annual or interim financial statements will not be prevented or detected on a timely basis.
We implemented remediation efforts to address the material weakness in controls over the calculation of earnings per share and to address the material weakness in controls over the review and application of technical accounting principles and took the following actions:
| • | Increased our technical accounting resources; |
| • | Enhanced the lines of communication between those preparing technical accounting memoranda and those applying the guidance to the calculation of earnings per share and provided additional instruction to our accounting staff on the calculation of earnings per share; and |
| • | Implemented a new control for tracking forward-looking business changes with accounting implications and communicating these to the appropriate staff. |
Management continuously reviews disclosure controls and procedures, and internal control over financial reporting, and accordingly may, from time to time, make changes aimed at enhancing their effectiveness to ensure that its systems evolve with its business. As of December 31, 2014, management has determined that, as a result of its remediation efforts, it no longer has material weaknesses in internal controls over earnings per share calculations and application of technical accounting principles.
102
Table of Contents
Report of Independent Registered Public Accounting Firm
Board of Directors and Stockholders
Pattern Energy Group Inc.
We have audited Pattern Energy Group Inc.’s internal control over financial reporting as of December 31, 2014, based on criteria established in Internal Control—Integrated Framework issued by the Committee of Sponsoring Organizations of the Treadway Commission (2013 framework) (the COSO criteria). Pattern Energy Group Inc.’s management is responsible for maintaining effective internal control over financial reporting, and for its assessment of the effectiveness of internal control over financial reporting included in the accompanying Management’s Annual Report on Internal Control over Financial Reporting. Our responsibility is to express an opinion on the company’s internal control over financial reporting based on our audit.
We conducted our audit in accordance with the standards of the Public Company Accounting Oversight Board (United States). Those standards require that we plan and perform the audit to obtain reasonable assurance about whether effective internal control over financial reporting was maintained in all material respects. Our audit included obtaining an understanding of internal control over financial reporting, assessing the risk that a material weakness exists, testing and evaluating the design and operating effectiveness of internal control based on the assessed risk, and performing such other procedures as we considered necessary in the circumstances. We believe that our audit provides a reasonable basis for our opinion.
A company’s internal control over financial reporting is a process designed to provide reasonable assurance regarding the reliability of financial reporting and the preparation of financial statements for external purposes in accordance with generally accepted accounting principles. A company’s internal control over financial reporting includes those policies and procedures that (1) pertain to the maintenance of records that, in reasonable detail, accurately and fairly reflect the transactions and dispositions of the assets of the company; (2) provide reasonable assurance that transactions are recorded as necessary to permit preparation of financial statements in accordance with generally accepted accounting principles, and that receipts and expenditures of the company are being made only in accordance with authorizations of management and directors of the company; and (3) provide reasonable assurance regarding prevention or timely detection of unauthorized acquisition, use, or disposition of the company’s assets that could have a material effect on the financial statements.
Because of its inherent limitations, internal control over financial reporting may not prevent or detect misstatements. Also, projections of any evaluation of effectiveness to future periods are subject to the risk that controls may become inadequate because of changes in conditions, or that the degree of compliance with the policies or procedures may deteriorate.
As indicated in the accompanying Management’s Annual Report on Internal Control over Financial Reporting, management’s assessment of and conclusion on the effectiveness of internal control over financial reporting did not include the internal controls of AEI El Arrayán Chile SpA, which is included in the 2014 consolidated financial statements of Pattern Energy Group Inc. and constituted $352,926,000 and $118,751,000 of total and net assets, respectively, as of December 31, 2014 and $17,472,000 and $5,302,000 of revenues and net loss, respectively, for the year then ended. Our audit of internal control over financial reporting of Pattern Energy Group Inc. also did not include an evaluation of the internal control over financial reporting of AEI El Arrayán Chile SpA.
In our opinion, Pattern Energy Group Inc. maintained, in all material respects, effective internal control over financial reporting as of December 31, 2014, based on the COSO criteria.
We also have audited, in accordance with the standards of the Public Company Accounting Oversight Board (United States), the consolidated balance sheets of Pattern Energy Group Inc. as of December 31, 2014 and 2013, and the related consolidated statements of operations, comprehensive (loss) income, stockholders’ equity, and
103
Table of Contents
cash flows for each of the three years in the period ended December 31, 2014 of Pattern Energy Group Inc. and our report dated March 2, 2015 expressed an unqualified opinion thereon.
/s/ Ernst & Young LLP
San Francisco, California
March 2, 2015
104
Table of Contents
| Item 9B. | Other Information. |
None.
Certain information required by Part III is omitted from this Form 10-K because the registrant will file with the U.S. Securities and Exchange Commission a definitive proxy statement pursuant to Regulation 14A in connection with the solicitation of proxies for the Company’s Annual Meeting of Stockholders, or the 2015 Proxy Statement, within 120 days after the end of the fiscal year covered by this Form 10-K, and certain information included therein is incorporated herein by reference.
| Item 10. | Directors, Executive Officers and Corporate Governance. |
The information required under this Item 10 is incorporated by reference to our 2015 Proxy Statement.
| Item 11. | Executive Compensation. |
The information required under this Item 11 is incorporated by reference to our 2015 Proxy Statement.
| Item 12. | Security Ownership of Certain Beneficial Owners and Management and Related Stockholder Matters. |
The information required under this Item 12 is incorporated by reference to our 2015 Proxy Statement.
| Item 13. | Certain Relationships and Related Transactions, and Director Independence. |
The information required under this Item 13 is incorporated by reference to our 2015 Proxy Statement.
| Item 14. | Principal Accounting Fees and Services. |
The information required under this Item 14 is incorporated by reference to our 2015 Proxy Statement.
105
Table of Contents
| Item 15. | Exhibits and Financial Statement Schedules. |
| (a) |
Documents filed as part of this report | |||||
| (1) |
Consolidated financial statements—Pattern Energy Group Inc. | |||||
| Report of Independent Registered Public Accounting Firm | F-2 | |||||
| Consolidated Balance Sheets as of December 31, 2014 and December 31, 2013 | F-3 | |||||
| Consolidated Statements of Operations for the years ended December 31, 2014, 2013 and 2012 | F-4 | |||||
| F-5 | ||||||
| Consolidated Statement of Stockholders’ Equity for the years ended December 31, 2014, 2013 and 2012 |
F-6 | |||||
| Consolidated Statements of Cash Flows for the years ended December 31, 2014, 2013 and 2012 | F-7 | |||||
| Notes to Consolidated Financial Statements | F-9 | |||||
| (2) |
Financial Statement Schedules | |||||
| a) Schedule I—Condensed Parent-Company Financial Statements | S-1 | |||||
| b) Schedule II—South Kent Wind LP Financial Statements | S-5 | |||||
| c) Schedule III—Grand Renewables Wind LP Financial Statements | S-29 | |||||
| (3) |
Exhibits | |||||
The following documents are filed or furnished as part of this Form 10-K. The Company will furnish a copy of any exhibit listed to requesting stockholders upon payment of the Company’s reasonable expenses in furnishing those materials.
| Exhibit No. |
Description Of Exhibits | |
| 3.1 | Amended and Restated Certificate of Incorporation of Pattern Energy Group Inc. (Incorporated by reference to Exhibit 3.1 to the Registrant’s Registration Statement on Form S-1/A dated September 20, 2013 (Registration No. 333-190538)). | |
| 3.2 | Amended and Restated Bylaws of Pattern Energy Group Inc. (Incorporated by reference to Exhibit 3.2 to the Registrant’s Registration Statement on Form S-1/A dated September 3, 2013 (Registration No. 333-190538)). | |
| 4.1 | Form of Class A Stock Certificate (Incorporated by reference to Exhibit 3.2 to the Registrant’s Registration Statement on Form S-1/A dated September 3, 2013 (Registration No. 333-190538)). | |
| 4.2 | Form of Senior Indenture (Incorporated by reference to Exhibit 4.3 to the Registrant’s Registration Statement on Form S-3 dated October 8, 2014 (Registration No. 333-199217). | |
| 4.3 | Form of Subordinated Indenture (Incorporated by reference to Exhibit 4.5 to the Registrant’s Registration Statement on Form S-3 dated October 8, 2014 (Registration No. 333-199217). | |
| 10.1 | Amended and Restated Credit and Guaranty Agreement, among Pattern US Finance Company LLC, Pattern Canada Finance Company ULC, as borrowers, certain subsidiaries of the borrowers, the lenders party thereto from time to time, Royal Bank of Canada, as Swingline Lender, Administrative Agent and Collateral Agent, Bank of Montreal, as Syndication Agent, and Morgan Stanley Senior Funding, Inc., as Documentation Agent, dated as of December 17, 2014. (Incorporated by reference to Exhibit 10.1 to the Registrant’s Current Report on Form 8-K dated December 17, 2014). | |
106
Table of Contents
| Exhibit No. |
Description Of Exhibits | |
| 10.2 | Pattern Energy Group Inc. 2013 Equity Incentive Award Plan (Incorporated by reference to Exhibit 10.2 to the Registrant’s Registration Statement on Form S-1/A dated September 3, 2013 (Registration No. 333-190538)). | |
| 10.3 | Form of Pattern Energy Group Inc. 2013 Incentive Bonus Plan. (Incorporated by reference to Exhibit 10.3 to the Registrant’s Registration Statement on Form S-1/A dated September 3, 2013 (Registration No. 333-190538)). | |
| 10.4 | Form of Stock Option Agreement under 2013 Equity Incentive Award Plan. (Incorporated by reference to Exhibit 10.4 to the Registrant’s Registration Statement on Form S-1/A dated September 3, 2013 (Registration No. 333-190538)). | |
| 10.5 | Form of Restricted Stock Agreement under 2013 Equity Incentive Award Plan. (Incorporated by reference to Exhibit 10.5 to the Registrant’s Registration Statement on Form S-1/A dated September 20, 2013 (Registration No. 333-190538)). | |
| 10.6 | Form of Restricted Stock Unit Agreement under 2013 Equity Incentive Award Plan. (Incorporated by reference to Exhibit 10.6 to the Registrant’s Registration Statement on Form S-1/A dated September 3, 2013 (Registration No. 333-190538)). | |
| 10.7 | Form of Deferred Restricted Stock Unit Agreement under 2013 Equity Incentive Award Plan. (Incorporated by reference to Exhibit 10.2 to the Registrant’s Current Report on Form 8-K dated December 17, 2014). | |
| 10.8 | Form of Indemnification Agreement between the Registrant and each of its Executive Officers and Directors. (Incorporated by reference to Exhibit 10.7 to the Registrant’s Registration Statement on Form S-1/A dated September 3, 2013 (Registration No. 333-190538)). | |
| 10.9 | Registration Rights Agreement between the Company and Pattern Energy Group LP, dated as of October 2, 2013. (Incorporated by reference to Exhibit 10.1 to the Registrant’s Current Report on Form 8-K dated September 26, 2013). | |
| 10.1 | Contribution Agreement among the Company, Pattern Renewables LP, Pattern Energy Group LP, and Pattern Renewable Holdings Canada ULC, dated as of October 2, 2013. (Incorporated by reference to Exhibit 10.2 to the Registrant’s Current Report on Form 8-K dated September 26, 2013). | |
| 10.11 | Purchase Rights Agreement among the Company, Pattern Energy Group LP, Pattern Energy Group Holdings LP and Pattern Energy GP LLC, dated as of October 2, 2013. (Incorporated by reference to Exhibit 10.3 to the Registrant’s Current Report on Form 8-K dated September 26, 2013). | |
| 10.12 | Bilateral Management Services Agreement between the Company and Pattern Energy Group LP, dated as of October 2, 2013. (Incorporated by reference to Exhibit 10.4 to the Registrant’s Current Report on Form 8-K dated September 26, 2013). | |
| 10.13 | Non-Competition Agreement between the Company and Pattern Energy Group LP, dated October 2, 2013. (Incorporated by reference to Exhibit 10.5 to the Registrant’s Current Report on Form 8-K dated September 26, 2013). | |
| 10.14 | Shareholder Approval Rights Agreement between the Company and Pattern Energy Group LP, dated as of October 2, 2013. (Incorporated by reference to Exhibit 10.6 to the Registrant’s Current Report on Form 8-K dated September 26, 2013). | |
| 10.15 | Purchase and Sale Agreement, dated as of December 20, 2013, by and between Pattern Canada Operations Holdings ULC and Pattern Energy Group LP (Grand PSA) . (Incorporated by reference to Exhibit 10.6 to the Registrant’s Current Report on Form 8-K dated December 20, 2013). | |
107
Table of Contents
| Exhibit No. |
Description Of Exhibits | |
| 10.16 | Purchase and Sale Agreement, dated as of December 20, 2013, by and among Pattern Energy Group Inc., Panhandle B Holdco 2 LLC and Pattern Energy Group LP (PH2 PSA) (Incorporated by reference to Exhibit 10.6 to the Registrant’s Current Report on Form 8-K dated December 20, 2013). | |
| 10.17 | Management, Operation and Maintenance Agreement, dated as of December 20, 2013, by and between Pattern Panhandle Wind 2 LLC and Pattern Operators LP (PH2 MOMA) (Incorporated by reference to Exhibit 10.6 to the Registrant’s Current Report on Form 8-K dated December 20, 2013). | |
| 10.18 | Project Administration Agreement, dated as of December 20, 2013, by and between Pattern Panhandle Wind 2 LLC and Pattern Operators LP (PH2 PAA) (Incorporated by reference to Exhibit 10.6 to the Registrant’s Current Report on Form 8-K dated December 20, 2013). | |
| 10.19 | Purchase and Sale Agreement, dated as of May 1, 2014, by and among Pattern Energy Group Inc., Pattern Renewables LP and Pattern Energy Group LP (PH1 PSA) (Incorporated by reference to Exhibit 2.1 to the Registrant’s Current Report on Form 8-K dated May 2, 2014). | |
| 10.20 | Purchase and Sale Agreement by and among Pattern Energy Group Inc., as Purchaser, Pattern Renewables LP, as Seller, and (solely for purposes of Section 7.1) Pattern Energy Group LP, as Guarantor, dated as of December 19, 2014 (Logan’s Gap PSA) (Incorporated by reference to Exhibit 2.1 to the Registrant’s Current Report on Form 8-K dated December 19, 2014). | |
| 10.21 | Employment Agreement between Pattern Energy Group Inc. and Michael M. Garland dated October 2, 2013 (Incorporated by reference to Exhibit 10.19 to the Registrant’s Annual Report on Form 10-K for the fiscal year ended December 31, 2013). | |
| 10.22 | Employment Agreement between Pattern Energy Group Inc. and Hunter H. Armistead dated October 2, 2013 (Incorporated by reference to Exhibit 10.20 to the Registrant’s Annual Report on Form 10-K for the fiscal year ended December 31, 2013). | |
| 10.23 | Employment Agreement between Pattern Energy Group Inc. and Daniel M. Elkort dated October 2, 2013 (Incorporated by reference to Exhibit 10.21 to the Registrant’s Annual Report on Form 10-K for the fiscal year ended December 31, 2013). | |
| 10.24 | Employment Agreement between Pattern Energy Group Inc. and Esben Pedersen dated October 2, 2013 (Incorporated by reference to Exhibit 10.16 to the Registrant’s Registration Statement on Form S-1 dated April 25, 2014 (Registration No. 333-195488)). | |
| 21.1 | Subsidiaries of the Registrant | |
| 23.1 | Consent of Independent Registered Public Accounting Firm | |
| 23.2 | Consent of PricewaterhouseCoopers LLP | |
| 24.1 | Powers of Attorney (included in the signature pages to this filing). | |
| 31.1 | Certifications of the Chief Executive Officer pursuant to Exchange Act Rules 13a-14(a) and 15d-14(a), as adopted pursuant to Section 302 of the Sarbanes-Oxley Act of 2002 | |
| 31.2 | Certifications of the Chief Financial Officer pursuant to Exchange Act Rules 13a-14(a) and 15d-14(a), as adopted pursuant to Section 302 of the Sarbanes-Oxley Act of 2002 | |
| 32* | Certifications of the Company’s Chief Executive Officer and Chief Financial Officer pursuant to 18 U.S.C. Section 1350, as adopted pursuant to Section 906 of the Sarbanes-Oxley Act of 2002. | |
108
Table of Contents
| Exhibit No. |
Description Of Exhibits | |
| 101.INS | XBRL Instance Document | |
| 101.SCH | XBRL Taxonomy Extension Schema Document | |
| 101.CAL | XBRL Taxonomy Extension Calculation Linkbase Document | |
| 101.DEF | XBRL Taxonomy Extension Definition Linkbase Document | |
| 101.LAB | XBRL Taxonomy Extension Label Linkbase Document | |
| 101.PRE | XBRL Taxonomy Extension Presentation Linkbase Document | |
| * | These certifications accompany this Report pursuant to Section 906 of the Sarbanes-Oxley Act of 2002 and shall not be deemed “filed” by the Company for purposes of Section 18 of the Exchange Act. |
109
Table of Contents
SIGNATURES
Pursuant to the requirements of Section 13 or 15(d) of the Securities Exchange Act of 1934, the registrant has duly caused this report to be signed on its behalf by the undersigned, thereunto duly authorized.
| Date: March 2, 2015 | Pattern Energy Group Inc. | |||||
| By | /s/ Michael M. Garland | |||||
| Michael M. Garland | ||||||
| President and Chief Executive Officer | ||||||
POWER OF ATTORNEY
KNOW ALL PERSONS BY THESE PRESENTS, that each person whose signature appears below constitutes and appoints Dyann Blaine and Michael Lyon, and each of them, as his or her true and lawful attorneys-in-fact and agents, with full power of substitution and re-substitution, for him or her and in his or her name, place and stead, in any and all capacities, to sign any and all amendments to this Annual Report on Form 10-K, and to file the same, with all exhibits thereto, and other documents in connection therewith, with the Securities and Exchange Commission, granting unto said attorneys-in-fact and agents, and each of them, full power and authority to do and perform each and every act and thing requisite and necessary to be done in connection therewith, as fully to all intents and purposes as he or she might or could do in person, hereby ratifying and confirming that all said attorneys-in-fact and agents, or any of them or their or his or her substitute or substitutes, may lawfully do or cause to be done by virtue hereof.
Pursuant to the requirements of the Securities Exchange Act of 1934, this Annual Report on Form 10-K has been signed by the following persons on behalf of the registrant and in the capacities and on the dates indicated:
| Signature |
Title |
Date | ||
| /s/ MICHAEL M. GARLAND Michael M. Garland |
President, Chief Executive Officer and Director of Pattern Energy Group Inc. (Principal Executive Officer) |
March 2, 2015 | ||
| /s/ ALAN R. BATKIN Alan R. Batkin |
Director and Chairman of Pattern Energy Group Inc. |
March 2, 2015 | ||
| /s/ PATRICIA S. BELLINGER Patricia S. Bellinger |
Director of Pattern Energy Group Inc. | March 2, 2015 | ||
| /s/ THE LORD BROWNE OF MADINGLEY The Lord Browne of Madingley |
Director of Pattern Energy Group Inc. | March 2, 2015 | ||
| /s/ DOUGLAS G. HALL Douglas G. Hall |
Director of Pattern Energy Group Inc. | March 2, 2015 | ||
| /s/ MICHAEL B. HOFFMAN Michael B. Hoffman |
Director of Pattern Energy Group Inc. | March 2, 2015 | ||
110
Table of Contents
| Signature |
Title |
Date | ||
| /s/ PATRICIA M. NEWSON Patricia M. Newson |
Director of Pattern Energy Group Inc. | March 2, 2015 | ||
| /s/ MICHAEL J. LYON Michael J. Lyon |
Chief Financial Officer of Pattern Energy Group Inc. (Principal Financial Officer) |
March 2, 2015 | ||
| /s/ ERIC S. LILLYBECK Eric S. Lillybeck |
Senior Vice President, Fiscal and Administrative Services of Pattern Energy Group Inc. (Principal Accounting Officer) |
March 2, 2015 | ||
111
Table of Contents
INDEX TO CONSOLIDATED FINANCIAL STATEMENTS
F-1
Table of Contents
Report of Independent Registered Public Accounting Firm
Board of Directors and Stockholders
Pattern Energy Group Inc.
We have audited the accompanying consolidated balance sheets of Pattern Energy Group Inc. as of December 31, 2014 and 2013, and the related consolidated statements of operations, comprehensive income (loss), stockholders’ equity, and cash flows for each of the three years in the period ended December 31, 2014. Our audits also included the financial statement Schedule I listed in the Index at Item 15(a). These financial statements and schedule are the responsibility of the Company’s management. Our responsibility is to express an opinion on these financial statements and schedule based on our audits. We did not audit the financial statements of South Kent Wind LP and Grand Renewable Wind LP, partnerships in which the Company has a 50% and 45% interest, respectively. In the consolidated financial statements, the Company’s investment in South Kent Wind LP and Grand Renewable Wind LP is stated at $29,079,000 and $107,055,000 at December 31, 2014 and 2013, respectively, and the Company’s equity in the net loss of South Kent Wind LP and Grand Renewable Wind LP is stated at $24,775,000 and $8,212,000, for the years ended December 31, 2014 and 2013, respectively. Those statements were audited by other auditors whose report has been furnished to us, and our opinion, insofar as it relates to the amounts included for South Kent Wind LP and Grand Renewable Wind LP, is based solely on the report of the other auditors.
We conducted our audits in accordance with the standards of the Public Company Accounting Oversight Board (United States). Those standards require that we plan and perform the audit to obtain reasonable assurance about whether the financial statements are free of material misstatement. An audit includes examining on a test basis, evidence supporting the amounts and disclosures in the financial statements. An audit also includes assessing the accounting principles used and significant estimates made by management, and evaluating the overall financial statement presentation. We believe that our audits and the report of other auditors provide a reasonable basis for our opinion.
In our opinion, based on our audits and the reports of other auditors, the financial statements referred to above present fairly, in all material respects, the consolidated financial position of Pattern Energy Group Inc. at December 31, 2014 and 2013, and the consolidated results of its operations and its cash flows for each of the three years in the period ended December 31, 2014, in conformity with U.S. generally accepted accounting principles. Also, in our opinion, the related financial statement Schedule I, when considered in relation to the basic financial statements taken as a whole, presents fairly in all material respects the information set forth therein.
We also have audited, in accordance with the standards of the Public Company Accounting Oversight Board (United States), Pattern Energy Group Inc.’s internal control over financial reporting as of December 31, 2014, based on criteria established in Internal Control-Integrated Framework issued by the Committee of Sponsoring Organizations of the Treadway Commission (2013 framework), and our report dated March 2, 2015 expressed an unqualified opinion thereon.
/s/ Ernst & Young LLP
San Francisco, California
March 2, 2015
F-2
Table of Contents
Pattern Energy Group Inc.
(In thousands of U.S. Dollars, except share data)
| December 31, | December 31, | |||||||
| 2014 | 2013 | |||||||
| Assets |
||||||||
| Current assets: |
||||||||
| Cash and cash equivalents |
$ | 101,656 | $ | 103,569 | ||||
| Restricted cash |
7,945 | — | ||||||
| Trade receivables |
35,759 | 20,951 | ||||||
| Related party receivable |
671 | 167 | ||||||
| Reimbursable interconnection costs |
2,532 | 3,967 | ||||||
| Derivative assets, current |
18,506 | 13,937 | ||||||
| Current deferred tax assets |
318 | 573 | ||||||
| Prepaid expenses and other current assets |
27,954 | 11,415 | ||||||
| Deferred financing costs, current, net of accumulated amortization of $22,749 and $16,225 as of December 31, 2014 and 2013, respectively |
13,615 | 5,456 | ||||||
|
|
|
|
|
|||||
| Total current assets |
208,956 | 160,035 | ||||||
| Restricted cash |
39,745 | 32,636 | ||||||
| Turbine advances |
79,637 | — | ||||||
| Construction in progress |
26,195 | — | ||||||
| Property, plant and equipment, net of accumulated depreciation of $278,291 and $179,778 as of December 31, 2014 and 2013, respectively |
2,350,856 | 1,476,142 | ||||||
| Unconsolidated investments |
29,079 | 107,055 | ||||||
| Derivative assets |
49,369 | 82,167 | ||||||
| Deferred financing costs |
30,053 | 30,336 | ||||||
| Net deferred tax assets |
5,474 | 2,017 | ||||||
| Other assets |
12,678 | 13,243 | ||||||
|
|
|
|
|
|||||
| Total assets |
$ | 2,832,042 | $ | 1,903,631 | ||||
|
|
|
|
|
|||||
| Liabilities and equity |
||||||||
| Current liabilities: |
||||||||
| Accounts payable and other accrued liabilities |
$ | 24,793 | $ | 15,550 | ||||
| Accrued construction costs |
20,132 | 3,204 | ||||||
| Related party payable |
5,757 | 1,245 | ||||||
| Accrued interest |
3,634 | 495 | ||||||
| Dividends payable |
15,734 | 11,103 | ||||||
| Derivative liabilities, current |
16,307 | 16,171 | ||||||
| Revolving credit facility |
50,000 | — | ||||||
| Current portion of long-term debt |
121,561 | 48,851 | ||||||
| Current net deferred tax liabilities |
149 | — | ||||||
| Current portion of contingent liabilities |
4,000 | — | ||||||
|
|
|
|
|
|||||
| Total current liabilities |
262,067 | 96,619 | ||||||
| Long-term debt |
1,329,052 | 1,200,367 | ||||||
| Derivative liabilities |
17,467 | 7,439 | ||||||
| Asset retirement obligations |
29,272 | 20,834 | ||||||
| Net deferred tax liabilities |
20,418 | 9,930 | ||||||
| Other long-term liabilities |
9,032 | 438 | ||||||
|
|
|
|
|
|||||
| Total liabilities |
1,667,308 | 1,335,627 | ||||||
|
|
|
|
|
|||||
| Equity: |
||||||||
| Class A common stock, $0.01 par value per share: 500,000,000 shares authorized; 62,088,306 and 35,531,720 shares issued as of December 31, 2014 and 2013, respectively; 62,062,841 and 35,530,786 shares outstanding as of December 31, 2014 and 2013, respectively |
621 | 355 | ||||||
| Class B convertible common stock, $0.01 par value per share: 20,000,000 shares authorized; 0 and 15,555,000 shares issued as of December 31, 2014 and 2013, respectively; 0 and 15,555,000 outstanding as of December 31, 2014 and 2013, respectively |
— | 156 | ||||||
| Additional paid-in capital |
723,938 | 489,412 | ||||||
| Accumulated loss |
(44,626 | ) | (13,336 | ) | ||||
| Accumulated other comprehensive loss |
(45,068 | ) | (8,353 | ) | ||||
| Treasury stock, at cost; 25,465 and 934 shares of Class A common stock as of December 31, 2014 and 2013, respectively |
(717 | ) | (24 | ) | ||||
|
|
|
|
|
|||||
| Total equity before noncontrolling interest |
634,148 | 468,210 | ||||||
| Noncontrolling interest |
530,586 | 99,794 | ||||||
|
|
|
|
|
|||||
| Total equity |
1,164,734 | 568,004 | ||||||
|
|
|
|
|
|||||
| Total liabilities and equity |
$ | 2,832,042 | $ | 1,903,631 | ||||
|
|
|
|
|
|||||
See accompanying notes to consolidated financial statements.
F-3
Table of Contents
Pattern Energy Group Inc.
Consolidated Statements of Operations
(In thousands of U.S. Dollars, except share data)
| Year ended December 31, | ||||||||||||
| 2014 | 2013 | 2012 | ||||||||||
| Revenue: |
||||||||||||
| Electricity sales |
$ | 245,022 | $ | 173,270 | $ | 101,835 | ||||||
| Energy derivative settlements |
13,525 | 16,798 | 19,644 | |||||||||
| Unrealized loss on energy derivative |
(3,878 | ) | (11,272 | ) | (6,951 | ) | ||||||
| Related party revenue |
3,317 | 911 | — | |||||||||
| Other revenue |
7,507 | 21,866 | — | |||||||||
|
|
|
|
|
|
|
|||||||
| Total revenue |
265,493 | 201,573 | 114,528 | |||||||||
|
|
|
|
|
|
|
|||||||
| Cost of revenue: |
||||||||||||
| Project expense |
77,775 | 57,677 | 34,843 | |||||||||
| Depreciation and accretion |
104,417 | 83,180 | 49,027 | |||||||||
|
|
|
|
|
|
|
|||||||
| Total cost of revenue |
182,192 | 140,857 | 83,870 | |||||||||
|
|
|
|
|
|
|
|||||||
| Gross profit |
83,301 | 60,716 | 30,658 | |||||||||
|
|
|
|
|
|
|
|||||||
| Operating expenses: |
||||||||||||
| Development expense |
— | — | 174 | |||||||||
| General and administrative |
22,533 | 4,819 | 858 | |||||||||
| Related party general and administrative |
5,787 | 8,169 | 10,604 | |||||||||
|
|
|
|
|
|
|
|||||||
| Total operating expenses |
28,320 | 12,988 | 11,636 | |||||||||
|
|
|
|
|
|
|
|||||||
| Operating income |
54,981 | 47,728 | 19,022 | |||||||||
|
|
|
|
|
|
|
|||||||
| Other income (expense): |
||||||||||||
| Interest expense |
(67,694 | ) | (63,614 | ) | (36,502 | ) | ||||||
| Interest rate derivative settlements |
(4,075 | ) | (2,099 | ) | — | |||||||
| Unrealized (loss) gain on derivatives |
(11,668 | ) | 15,601 | (4,953 | ) | |||||||
| Equity in (losses) earnings in unconsolidated investments |
(25,295 | ) | 7,846 | (40 | ) | |||||||
| Related party income |
2,612 | 665 | — | |||||||||
| Net gain on transactions |
13,843 | 5,995 | 4,173 | |||||||||
| Other income, net |
433 | 2,496 | 1,320 | |||||||||
|
|
|
|
|
|
|
|||||||
| Total other expense |
(91,844 | ) | (33,110 | ) | (36,002 | ) | ||||||
|
|
|
|
|
|
|
|||||||
| Net (loss) income before income tax |
(36,863 | ) | 14,618 | (16,980 | ) | |||||||
| Tax provision (benefit) |
3,136 | 4,546 | (3,604 | ) | ||||||||
|
|
|
|
|
|
|
|||||||
| Net (loss) income |
(39,999 | ) | 10,072 | (13,376 | ) | |||||||
| Net loss attributable to noncontrolling interest |
(8,709 | ) | (6,887 | ) | (7,089 | ) | ||||||
|
|
|
|
|
|
|
|||||||
| Net (loss) income attributable to controlling interest |
$ | (31,290 | ) | $ | 16,959 | $ | (6,287 | ) | ||||
|
|
|
|
|
|
|
|||||||
| Earnings per share information: |
||||||||||||
| Less: Net income attributable to controlling interest prior to the IPO on October 2, 2013 |
(30,295 | ) | ||||||||||
|
|
|
|||||||||||
| Net loss attributable to controlling interest subsequent to the IPO |
$ | (13,336 | ) | |||||||||
|
|
|
|||||||||||
| Cash dividends declared on Class A common shares |
(56,976 | ) | (11,103 | ) | ||||||||
| Deemed dividends on Class B common shares |
(21,901 | ) | — | |||||||||
|
|
|
|
|
|||||||||
| Net loss attributable to common stockholders |
$ | (110,167 | ) | $ | (24,439 | ) | ||||||
|
|
|
|
|
|||||||||
| Weighted average number of shares: |
||||||||||||
| Class A common stock—Basic and diluted |
42,361,959 | 35,448,056 | ||||||||||
| Class B common stock—Basic and diluted |
15,555,000 | 15,555,000 | ||||||||||
| Earnings (loss) per share |
||||||||||||
| Class A common stock: |
||||||||||||
| Basic and diluted loss per share |
$ | (0.56 | ) | $ | (0.17 | ) | ||||||
|
|
|
|
|
|||||||||
| Class B common stock: |
||||||||||||
| Basic and diluted loss per share |
$ | (0.49 | ) | $ | (0.48 | ) | ||||||
|
|
|
|
|
|||||||||
| Cash dividends declared per Class A common share |
$ | 1.30 | $ | 0.31 | ||||||||
|
|
|
|
|
|||||||||
| Deemed dividends per Class B common share |
$ | 1.41 | $ | — | ||||||||
|
|
|
|
|
|||||||||
| 2012 pro forma information: |
||||||||||||
| Unaudited pro forma net income after tax: |
||||||||||||
| Net loss before income tax |
$ | (16,980 | ) | |||||||||
| Pro forma tax provision |
818 | |||||||||||
|
|
|
|||||||||||
| Pro forma net loss |
$ | (17,798 | ) | |||||||||
|
|
|
|||||||||||
See accompanying notes to consolidated financial statements.
F-4
Table of Contents
Pattern Energy Group Inc.
Consolidated Statements of Comprehensive (Loss) Income
(In thousands of U.S. Dollars)
| Year ended December 31, | ||||||||||||
| 2014 | 2013 | 2012 | ||||||||||
| Net (loss) income |
$ (39,999) | $ | 10,072 | $ | (13,376 | ) | ||||||
| Other comprehensive (loss) income: |
||||||||||||
| Foreign currency translation, net of tax impact of $0, $0, and $0, respectively |
(10,875 | ) | (8,309 | ) | 2,749 | |||||||
| Derivative activity: |
||||||||||||
| Effective portion of change in fair market value of derivatives, net of tax benefit of $734, $0 and $0, respectively |
(5,896 | ) | 48,818 | (5,469 | ) | |||||||
| Reclassifications to net loss, net of tax impact of $404, $0 and $0, respectively |
(13,774 | ) | (11,943 | ) | (5,701 | ) | ||||||
|
|
|
|
|
|
|
|||||||
| Total change in effective portion of change in fair market value of derivatives |
(19,670 | ) | 36,875 | (11,170 | ) | |||||||
| Proportionate share of equity investee’s other comprehensive (loss) income activity, net of tax benefit (provision) of $1,855, ($615) and $302, respectively |
(5,991 | ) | 2,473 | (1,475 | ) | |||||||
|
|
|
|
|
|
|
|||||||
| Total other comprehensive (loss) income, net of tax |
(36,536 | ) | 31,039 | (9,896 | ) | |||||||
|
|
|
|
|
|
|
|||||||
| Comprehensive (loss) income |
(76,535 | ) | 41,111 | (23,272 | ) | |||||||
|
|
|
|
|
|
|
|||||||
| Less comprehensive (loss) income attributable to noncontrolling interest: |
||||||||||||
| Net loss attributable to noncontrolling interest |
(8,709 | ) | (6,887 | ) | (7,089 | ) | ||||||
| Derivative activity: |
||||||||||||
| Effective portion of change in fair market value of derivatives, net of tax benefit of $220, $0 and $0, respectively |
3,780 | 6,992 | 1,116 | |||||||||
| Reclassifications to net loss, net of tax impact of $121, $0 and $0, respectively |
(3,601 | ) | (1,904 | ) | (1,900 | ) | ||||||
|
|
|
|
|
|
|
|||||||
| Total change in effective portion of change in fair market value of derivatives |
179 | 5,088 | (784 | ) | ||||||||
|
|
|
|
|
|
|
|||||||
| Comprehensive loss attributable to noncontrolling interest |
(8,530 | ) | (1,799 | ) | (7,873 | ) | ||||||
|
|
|
|
|
|
|
|||||||
| Comprehensive (loss) income attributable to controlling interest |
$ | (68,005 | ) | $ | 42,910 | $ | (15,399 | ) | ||||
|
|
|
|
|
|
|
|||||||
See accompanying notes to consolidated financial statements.
F-5
Table of Contents
Pattern Energy Group Inc.
Consolidated Statement of Stockholders’ Equity
(In thousands of U.S. Dollars, except share data)
| Controlling Interest | Noncontrolling Interest | |||||||||||||||||||||||||||||||||||||||||||||||||||||||||||||||
| Additional Paid-in |
Accumulated Income |
Accumulated Comprehensive |
Accumulated Income |
Accumulated Comprehensive |
||||||||||||||||||||||||||||||||||||||||||||||||||||||||||||
| Class A Common Stock |
Class B Common Stock |
Treasury Stock | Total | |||||||||||||||||||||||||||||||||||||||||||||||||||||||||||||
| Shares | Amount | Shares | Amount | Capital | Capital | (Deficit) | Income (Loss) | Shares | Amount | Total | Capital | (Deficit) | Income (Loss) | Total | Equity | |||||||||||||||||||||||||||||||||||||||||||||||||
| Balances at January 1, 2012 |
— | $ | — | — | $ | — | $ | — | $ | 378,188 | $ | 9,190 | $ | (25,152 | ) | — | $ | — | $ | 362,226 | $ | 75,475 | $ | 19,455 | $ | (10,458 | ) | $ | 84,472 | $ | 446,698 | |||||||||||||||||||||||||||||||||
| Contribution |
— | — | — | — | — | 281,519 | — | — | — | — | 281,519 | — | — | — | — | 281,519 | ||||||||||||||||||||||||||||||||||||||||||||||||
| Distribution |
— | — | — | — | — | (114,236 | ) | — | — | — | — | (114,236 | ) | (1,298 | ) | — | — | (1,298 | ) | (115,534 | ) | |||||||||||||||||||||||||||||||||||||||||||
| Issuance of common stock |
100 | — | — | — | 1 | — | — | — | — | — | 1 | — | — | — | — | 1 | ||||||||||||||||||||||||||||||||||||||||||||||||
| Net loss |
— | — | — | — | — | — | (6,287 | ) | — | — | — | (6,287 | ) | — | (7,089 | ) | — | (7,089 | ) | (13,376 | ) | |||||||||||||||||||||||||||||||||||||||||||
| Other comprehensive loss, net of tax |
— | — | — | — | — | — | — | (9,112 | ) | — | — | (9,112 | ) | — | — | (784 | ) | (784 | ) | (9,896 | ) | |||||||||||||||||||||||||||||||||||||||||||
|
|
|
|
|
|
|
|
|
|
|
|
|
|
|
|
|
|
|
|
|
|
|
|
|
|
|
|
|
|
|
|
|
|||||||||||||||||||||||||||||||||
| Balances at December 31, 2012 |
100 | — | — | — | 1 | 545,471 | 2,903 | (34,264 | ) | — | — | 514,111 | 74,177 | 12,366 | (11,242 | ) | 75,301 | 589,412 | ||||||||||||||||||||||||||||||||||||||||||||||
| Contribution |
— | — | — | — | — | 32,677 | — | — | — | — | 32,677 | — | — | — | — | 32,677 | ||||||||||||||||||||||||||||||||||||||||||||||||
| Distribution |
— | — | — | — | — | (104,634 | ) | — | — | — | — | (104,634 | ) | (1,426 | ) | — | — | (1,426 | ) | (106,060 | ) | |||||||||||||||||||||||||||||||||||||||||||
| Additional paid-in capital |
— | — | — | — | 2 | — | — | — | — | — | 2 | — | 2 | |||||||||||||||||||||||||||||||||||||||||||||||||||
| Net income (loss) |
— | — | — | — | — | — | 30,295 | — | — | — | 30,295 | — | (690 | ) | — | (690 | ) | 29,605 | ||||||||||||||||||||||||||||||||||||||||||||||
| Other comprehensive income, net of tax |
— | — | — | — | — | — | — | 20,633 | — | — | 20,633 | — | — | 3,559 | 3,559 | 24,192 | ||||||||||||||||||||||||||||||||||||||||||||||||
|
|
|
|
|
|
|
|
|
|
|
|
|
|
|
|
|
|
|
|
|
|
|
|
|
|
|
|
|
|
|
|
|
|||||||||||||||||||||||||||||||||
| Balances at October 1, 2013 |
100 | — | — | — | 3 | 473,514 | 33,198 | (13,631 | ) | — | — | 493,084 | 72,751 | 11,676 | (7,683 | ) | 76,744 | 569,828 | ||||||||||||||||||||||||||||||||||||||||||||||
| Interest in Gulf Wind retained by Pattern Development |
— | — | — | — | — | (18,332 | ) | (13,122 | ) | 2,870 | — | — | (28,584 | ) | 18,332 | 13,122 | (2,870 | ) | 28,584 | — | ||||||||||||||||||||||||||||||||||||||||||||
| Assumption of liabilities related to Contribution Transactions |
— | — | — | — | — | (4,207 | ) | — | — | — | — | (4,207 | ) | — | — | — | — | (4,207 | ) | |||||||||||||||||||||||||||||||||||||||||||||
| Issuance of common stock for Contribution Transactions |
19,445,000 | 194 | 15,555,000 | 156 | 470,701 | (450,975 | ) | (20,076 | ) | — | — | — | — | — | — | — | — | — | ||||||||||||||||||||||||||||||||||||||||||||||
| Deemed distribution for Contribution Transactions |
— | — | — | — | (232,640 | ) | — | — | — | — | — | (232,640 | ) | — | (232,640 | ) | ||||||||||||||||||||||||||||||||||||||||||||||||
| Issuance of Class A common stock related to the IPO, net of issuance costs |
16,000,000 | 160 | — | — | 316,882 | — | — | — | — | — | 317,042 | — | — | — | — | 317,042 | ||||||||||||||||||||||||||||||||||||||||||||||||
| Issuance of Class A restricted common stock |
83,183 | 1 | — | — | 155 | — | — | — | — | — | 156 | — | — | — | — | 156 | ||||||||||||||||||||||||||||||||||||||||||||||||
| Issuance of Class A common stock |
3,437 | — | — | — | 93 | — | — | — | — | — | 93 | — | — | — | 93 | |||||||||||||||||||||||||||||||||||||||||||||||||
| Repurchase of shares for employee tax withholding |
— | — | — | — | — | — | — | — | (934 | ) | (24 | ) | (24 | ) | — | — | — | — | (24 | ) | ||||||||||||||||||||||||||||||||||||||||||||
| Stock-based compensation |
— | — | — | — | 263 | — | — | — | — | — | 263 | — | — | — | — | 263 | ||||||||||||||||||||||||||||||||||||||||||||||||
| Dividends declared on Class A common stock |
— | — | — | — | (11,103 | ) | — | — | — | — | — | (11,103 | ) | — | — | — | — | (11,103 | ) | |||||||||||||||||||||||||||||||||||||||||||||
| Acquisition from Pattern Development |
— | — | — | — | (54,942 | ) | — | — | (2,910 | ) | — | — | (57,852 | ) | — | — | — | — | (57,852 | ) | ||||||||||||||||||||||||||||||||||||||||||||
| Distribution to noncontrolling interest |
— | — | — | — | — | — | — | — | — | — | — | (866 | ) | — | — | (866 | ) | (866 | ) | |||||||||||||||||||||||||||||||||||||||||||||
| Net loss |
— | — | — | — | — | — | (13,336 | ) | — | — | — | (13,336 | ) | — | (6,197 | ) | — | (6,197 | ) | (19,533 | ) | |||||||||||||||||||||||||||||||||||||||||||
| Other comprehensive income, net of tax |
— | — | — | — | — | — | — | 5,318 | — | — | 5,318 | — | — | 1,529 | 1,529 | 6,847 | ||||||||||||||||||||||||||||||||||||||||||||||||
|
|
|
|
|
|
|
|
|
|
|
|
|
|
|
|
|
|
|
|
|
|
|
|
|
|
|
|
|
|
|
|
|
|||||||||||||||||||||||||||||||||
| Balances at December 31, 2013 |
35,531,720 | 355 | 15,555,000 | 156 | 489,412 | — | (13,336 | ) | (8,353 | ) | (934 | ) | (24 | ) | 468,210 | 90,217 | 18,601 | (9,024 | ) | 99,794 | 568,004 | |||||||||||||||||||||||||||||||||||||||||||
| Issuance of Class A common stock related to the public offering, net of issuance costs |
10,810,810 | 108 | — | — | 286,785 | — | — | — | — | — | 286,893 | — | — | — | — | 286,893 | ||||||||||||||||||||||||||||||||||||||||||||||||
| Issuance of Class A restricted common stock |
175,915 | 2 | — | — | 3,494 | — | — | — | — | — | 3,496 | — | — | — | — | 3,496 | ||||||||||||||||||||||||||||||||||||||||||||||||
| Issuance of Class A common stock upon exercise of stock options |
14,861 | — | — | — | 327 | — | — | — | — | — | 327 | — | — | — | — | 327 | ||||||||||||||||||||||||||||||||||||||||||||||||
| Repurchase of shares for employee tax withholding |
— | — | — | — | — | — | — | — | (24,531 | ) | (693 | ) | (693 | ) | — | — | — | — | (693 | ) | ||||||||||||||||||||||||||||||||||||||||||||
| Conversion of Class B common stock to Class A common stock |
15,555,000 | 156 | (15,555,000 | ) | (156 | ) | — | — | — | — | — | — | — | — | — | — | — | — | ||||||||||||||||||||||||||||||||||||||||||||||
| Stock-based compensation |
— | — | — | — | 610 | — | — | — | — | — | 610 | — | — | — | — | 610 | ||||||||||||||||||||||||||||||||||||||||||||||||
| Refund of issuance costs related to the IPO |
— | — | — | — | 286 | — | — | — | — | — | 286 | — | — | — | — | 286 | ||||||||||||||||||||||||||||||||||||||||||||||||
| Dividends declared on Class A common stock |
— | — | — | — | (56,976 | ) | — | — | — | — | — | (56,976 | ) | — | — | — | — | (56,976 | ) | |||||||||||||||||||||||||||||||||||||||||||||
| Recognition of beneficial conversion feature on Class B convertible common stock |
— | — | — | — | (21,901 | ) | — | — | — | — | — | (21,901 | ) | — | — | — | — | (21,901 | ) | |||||||||||||||||||||||||||||||||||||||||||||
| Adjustment to paid-in capital for beneficial conversion feature recognition |
— | — | — | — | 21,901 | — | — | — | — | — | 21,901 | — | — | — | — | 21,901 | ||||||||||||||||||||||||||||||||||||||||||||||||
| Accretion of the Class B beneficial conversion feature |
— | — | — | — | 21,901 | — | — | — | — | — | 21,901 | — | — | — | — | 21,901 | ||||||||||||||||||||||||||||||||||||||||||||||||
| Deemed dividends on Class B convertible common stock |
— | — | — | — | (21,901 | ) | — | — | — | — | — | (21,901 | ) | — | — | — | — | (21,901 | ) | |||||||||||||||||||||||||||||||||||||||||||||
| Sale of Class A membership interests in Panhandle 1 |
— | — | — | — | — | — | — | — | — | — | — | 210,250 | — | — | 210,250 | 210,250 | ||||||||||||||||||||||||||||||||||||||||||||||||
| Sale of Class A membership interests in Panhandle 2, net of tax equity transaction costs |
— | — | — | — | — | — | — | — | — | — | — | 193,363 | — | — | 193,363 | 193,363 | ||||||||||||||||||||||||||||||||||||||||||||||||
| Fair value of noncontrolling interest in El Arrayan |
— | — | — | — | — | — | — | — | — | — | — | 35,259 | — | — | 35,259 | 35,259 | ||||||||||||||||||||||||||||||||||||||||||||||||
| Contribution from noncontrolling interest |
— | — | — | — | — | — | — | — | — | — | — | 2,550 | — | — | 2,550 | 2,550 | ||||||||||||||||||||||||||||||||||||||||||||||||
| Distribution to noncontrolling interest |
— | — | — | — | — | — | — | — | — | — | — | (2,100 | ) | — | — | (2,100 | ) | (2,100 | ) | |||||||||||||||||||||||||||||||||||||||||||||
| Net loss |
— | — | — | — | — | — | (31,290 | ) | — | — | — | (31,290 | ) | — | (8,709 | ) | — | (8,709 | ) | (39,999 | ) | |||||||||||||||||||||||||||||||||||||||||||
| Other comprehensive (loss) income, net of tax |
— | — | — | — | — | — | — | (36,715 | ) | — | — | (36,715 | ) | — | — | 179 | 179 | (36,536 | ) | |||||||||||||||||||||||||||||||||||||||||||||
|
|
|
|
|
|
|
|
|
|
|
|
|
|
|
|
|
|
|
|
|
|
|
|
|
|
|
|
|
|
|
|
|
|||||||||||||||||||||||||||||||||
| Balances at December 31, 2014 |
62,088,306 | $ | 621 | — | $ | — | $ | 723,938 | $ | — | $ | (44,626 | ) | $ | (45,068 | ) | (25,465 | ) | $ | (717 | ) | $ | 634,148 | $ | 529,539 | $ | 9,892 | $ | (8,845 | ) | $ | 530,586 | $ | 1,164,734 | ||||||||||||||||||||||||||||||
|
|
|
|
|
|
|
|
|
|
|
|
|
|
|
|
|
|
|
|
|
|
|
|
|
|
|
|
|
|
|
|
|
|||||||||||||||||||||||||||||||||
See accompanying notes to consolidated financial statements.
F-6
Table of Contents
Pattern Energy Group Inc.
Consolidated Statement of Cash Flows
(In thousands of U.S. Dollars)
| Year ended December 31, | ||||||||||||
| 2014 | 2013 | 2012 | ||||||||||
| Operating activities |
||||||||||||
| Net (loss) income |
$ | (39,999 | ) | $ | 10,072 | $ | (13,376 | ) | ||||
| Adjustments to reconcile net (loss) income to net cash provided by operating activities: |
||||||||||||
| Depreciation and accretion |
104,417 | 83,180 | 49,027 | |||||||||
| Amortization of financing costs |
6,309 | 6,816 | 2,546 | |||||||||
| Unrealized loss (gain) on derivatives |
15,546 | (4,329 | ) | 11,904 | ||||||||
| Stock-based compensation |
4,105 | 511 | — | |||||||||
| Net gain on transactions |
(16,526 | ) | (5,995 | ) | (4,173 | ) | ||||||
| Deferred taxes |
2,948 | 4,546 | (3,604 | ) | ||||||||
| Equity in losses (earnings) in unconsolidated investments |
25,295 | (7,846 | ) | 40 | ||||||||
| Changes in operating assets and liabilities: |
||||||||||||
| Trade receivables |
(8,255 | ) | (8,721 | ) | (298 | ) | ||||||
| Reimbursable interconnection receivable |
— | (11 | ) | — | ||||||||
| Prepaid expenses and other current assets |
12,916 | (2,698 | ) | (5,842 | ) | |||||||
| Other assets (non-current) |
(649 | ) | (566 | ) | (428 | ) | ||||||
| Accounts payable and other accrued liabilities |
3,667 | 3,036 | (379 | ) | ||||||||
| Related party receivable/payable |
(942 | ) | 190 | (100 | ) | |||||||
| Accrued interest payable |
1,377 | (33 | ) | (78 | ) | |||||||
| Contingent liabilities |
— | — | (188 | ) | ||||||||
| Long-term liabilities |
239 | — | — | |||||||||
|
|
|
|
|
|
|
|||||||
| Net cash provided by operating activities |
110,448 | 78,152 | 35,051 | |||||||||
|
|
|
|
|
|
|
|||||||
| Investing activities |
||||||||||||
| Receipt of ITC Cash Grant |
— | 173,446 | 79,910 | |||||||||
| Cash paid for acquisitions, net of cash acquired |
(306,584 | ) | (30,070 | ) | — | |||||||
| Proceeds from sale of investments |
— | 14,254 | 4,173 | |||||||||
| Decrease in restricted cash |
46,700 | 66,517 | 28,431 | |||||||||
| Increase in restricted cash |
(40,790 | ) | (80,569 | ) | (36,576 | ) | ||||||
| Capital expenditures |
(119,506 | ) | (123,517 | ) | (641,422 | ) | ||||||
| Deferred development costs |
— | (528 | ) | (7,093 | ) | |||||||
| Distribution from unconsolidated investments |
22,019 | 10,463 | — | |||||||||
| Contribution to unconsolidated investments |
(2,651 | ) | (9,678 | ) | (22,387 | ) | ||||||
| Reimbursable interconnection receivable |
3,892 | 49,715 | (47,055 | ) | ||||||||
| Other assets (non-current) |
17,540 | 2,358 | 3,066 | |||||||||
|
|
|
|
|
|
|
|||||||
| Net cash (used in) provided by investing activities |
(379,380 | ) | 72,391 | (638,953 | ) | |||||||
|
|
|
|
|
|
|
|||||||
See accompanying notes to consolidated financial statements.
F-7
Table of Contents
Pattern Energy Group Inc.
Consolidated Statement of Cash Flows
(In thousands of U.S. Dollars)
| Year ended December 31, | ||||||||||||
| 2014 | 2013 | 2012 | ||||||||||
| Financing activities |
||||||||||||
| Proceeds from public offering, net of expenses |
$ | 286,757 | $ | 317,926 | $ | — | ||||||
| Proceeds from exercise of stock options |
327 | — | — | |||||||||
| Repurchase of shares for employee tax withholding |
(693 | ) | (24 | ) | — | |||||||
| Dividends paid |
(52,344 | ) | — | — | ||||||||
| Payment for acquisition from Pattern Development |
— | (49,430 | ) | — | ||||||||
| Capital distributions—Contribution Transactions |
— | (232,640 | ) | — | ||||||||
| Capital contributions—Pattern Development |
— | 32,679 | 281,519 | |||||||||
| Capital contributions—noncontrolling interest |
200,805 | — | — | |||||||||
| Capital distributions—Pattern Development |
— | (98,886 | ) | (114,236 | ) | |||||||
| Capital distributions—noncontrolling interest |
(2,100 | ) | (2,292 | ) | (1,298 | ) | ||||||
| Decrease in restricted cash |
19,627 | 122,689 | 26,669 | |||||||||
| Increase in restricted cash |
(17,903 | ) | (127,369 | ) | (15,850 | ) | ||||||
| Deposit for letters of credit |
(3,422 | ) | — | — | ||||||||
| Payment for deferred financing costs |
(11,856 | ) | (294 | ) | (19,989 | ) | ||||||
| Payment for deferred equity issuance costs |
(550 | ) | — | — | ||||||||
| Proceeds from revolving credit facility |
50,000 | 56,000 | — | |||||||||
| Repayment of revolving credit facility |
— | (56,000 | ) | — | ||||||||
| Repayment of short-term debt |
(210,191 | ) | — | — | ||||||||
| Proceeds from short-term debt |
59,778 | — | — | |||||||||
| Repayment of long-term debt |
(49,246 | ) | (50,324 | ) | (27,546 | ) | ||||||
| Proceeds from long-term debt |
— | 138,620 | 497,226 | |||||||||
| Repayment of construction and grant loans |
— | (114,056 | ) | (53,328 | ) | |||||||
|
|
|
|
|
|
|
|||||||
| Net cash provided by (used in) financing activities |
268,989 | (63,401 | ) | 573,167 | ||||||||
|
|
|
|
|
|
|
|||||||
| Effect of exchange rate changes on cash and cash equivalents |
(1,970 | ) | (1,147 | ) | 637 | |||||||
|
|
|
|
|
|
|
|||||||
| Net change in cash and cash equivalents |
(1,913 | ) | 85,995 | (30,098 | ) | |||||||
| Cash and cash equivalents at beginning of period |
103,569 | 17,574 | 47,672 | |||||||||
|
|
|
|
|
|
|
|||||||
| Cash and cash equivalents at end of period |
$ | 101,656 | $ | 103,569 | $ | 17,574 | ||||||
|
|
|
|
|
|
|
|||||||
| Supplemental disclosure |
||||||||||||
| Cash payments for income taxes |
$ | 131 | $ | — | $ | — | ||||||
| Cash payments for interest expense, net of capitalized interest |
53,776 | 53,295 | 33,215 | |||||||||
| Acquired capitalized assets for El Arrayán, Panhandle 1, Panhandle 2, and Logan’s Gap |
1,013,365 | — | — | |||||||||
| Schedule of non-cash activities |
||||||||||||
| Change in fair value of designated interest rate swaps |
(22,847 | ) | 36,875 | (11,170 | ) | |||||||
| Change in fair value of contingent liabilities |
— | — | (2,015 | ) | ||||||||
| Amortization of deferred financing costs—included as construction in progress |
343 | 175 | 3,824 | |||||||||
| Change in property, plant and equipment |
(47,908 | ) | (109,281 | ) | 79,181 | |||||||
| Transfer of capitalized assets to South Kent joint venture |
— | 49,275 | — | |||||||||
| Non-cash distribution to Pattern Development |
— | (5,748 | ) | — | ||||||||
| Assumption of contingent liability related to Contribution Transactions |
(4,207 | ) | — | |||||||||
| Assumption of contingent liability upon acquisition of Logan’s Gap |
(4,000 | ) | — | — | ||||||||
| Accrued IPO stock issuance costs |
— | (884 | ) | — | ||||||||
| Non-cash deemed dividends on Class B convertible common stock |
21,901 | — | — | |||||||||
See accompanying notes to consolidated financial statements.
F-8
Table of Contents
Pattern Energy Group Inc.
Notes to Consolidated Financial Statements
| 1. | Organization |
Pattern Energy Group Inc. (“Pattern Energy” or the “Company”) was organized in the state of Delaware on October 2, 2012. Pattern Energy issued 100 shares on October 17, 2012 to Pattern Renewables LP, a 100% owned subsidiary of Pattern Energy Group LP (“Pattern Development”). On September 24, 2013, Pattern Energy’s charter was amended, and the number of shares that Pattern Energy is authorized to issue was increased to 620,000,000 total shares; 500,000,000 of which are designated Class A common stock, 20,000,000 of which were designated Class B common stock, and 100,000,000 of which are designated Preferred Stock. On December 31, 2014, the Company’s Class B common stock was converted into Class A common stock on a one-for-one basis.
Pattern Energy is an independent energy generation company focused on constructing, owning and operating energy projects with long-term energy sales contracts located in the United States, Canada and Chile. The Company consists of the consolidated operations of certain entities and assets contributed by, or purchased principally from, Pattern Development. The Company owns 100% of Hatchet Ridge Wind, LLC (“Hatchet Ridge”), St. Joseph Windfarm Inc. (“St. Joseph”), Spring Valley Wind LLC (“Spring Valley”), Pattern Santa Isabel LLC (“Santa Isabel”), Ocotillo Express LLC (“Ocotillo”) and Logan’s Gap B Member LLC (“Logan’s Gap”). The Company owns a controlling interest in Pattern Gulf Wind Holdings LLC (“Gulf Wind”), Parque Eólico El Arrayán SpA (“El Arrayán”), Panhandle Wind Holdings LLC (“Panhandle 1”) and Panhandle B Member 2 LLC (“Panhandle 2”) and noncontrolling interests in South Kent Wind LP (“South Kent”) and Grand Renewable Wind LP (“Grand”). The principal business objective of the Company is to produce stable and sustainable cash flows through the generation and sale of energy and to selectively grow our project portfolio.
Pattern Energy was formed by Pattern Development for the purpose of an initial public offering (“IPO”). For periods prior to October 2, 2013, Pattern Energy was a shell company, with expenses of less than $10,000 for 2013 and 2012. In accordance with ASC 805-50-30-6, the historical financial statements of Pattern Energy’s predecessor, which consist of the combined financial statements of a combination of entities and assets contributed by Pattern Development to Pattern Energy, are consolidated with Pattern Energy from the beginning of the earliest period presented.
Initial Public Offering and Contribution Transactions
On October 2, 2013, Pattern Energy issued 16,000,000 shares of Class A common stock in an IPO generating net proceeds of approximately $317.0 million. Concurrent with the IPO, Pattern Energy issued 19,445,000 shares of Class A common stock and 15,555,000 shares of Class B common stock to Pattern Development and utilized approximately $232.6 million of the net proceeds of the IPO as additional consideration to Pattern Development for certain entities and assets contributed to Pattern Energy (“Contribution Transactions”) consisting of interests in eight wind power projects, including six projects in operation (Gulf Wind, Hatchet Ridge, St. Joseph, Spring Valley, Santa Isabel and Ocotillo), and two projects that were under construction (El Arrayán and South Kent) at the time of the IPO. In accordance with the Financial Accounting Standard Board’s (“FASB”) Accounting Standards Codification (“ASC”) 805-50-30-5, Transactions between Entities under Common Control, Pattern Energy recognized the assets and liabilities contributed by Pattern Development at their historical carrying amounts at the date of the Contribution Transactions. On October 8, 2013, Pattern Energy’s underwriters exercised in full their overallotment option to purchase 2,400,000 shares of Class A common stock from Pattern Development, the selling stockholder, pursuant to the overallotment option granted by Pattern Development.
In connection with the Contribution Transactions, Pattern Development retained a 40% interest in Gulf Wind previously held by it such that, at the completion of the IPO, Pattern Energy, Pattern Development and the joint venture partner held interests of approximately 40%, 27% and 33%, respectively, of the distributable cash flow of Gulf Wind, together with certain allocated tax items.
F-9
Table of Contents
Effective with Pattern Energy’s IPO, Pattern Development’s project operations and maintenance personnel and certain of its executive officers became Pattern Energy employees and their employment with Pattern Development was terminated. Pattern Development retained those employees whose primary responsibilities relate to project development, legal, financial or other administrative functions. Pattern Energy entered into a bilateral services agreement with Pattern Development, or the “Management Services Agreement”, that provides for Pattern Energy and Pattern Development to benefit, primarily on a cost-reimbursement basis, from the respective management and other professional, technical and administrative personnel of the respective companies, all of whom report to and are managed by Pattern Energy’s executive officers.
May 2014 Public Offering
On May 14, 2014, the Company completed an underwritten public offering of its Class A common stock. In total, 21,117,171 shares of its Class A common stock were sold. Of this amount, the Company issued and sold 10,810,810 shares of Class A common stock and Pattern Development, the selling stockholder, sold 10,306,361 shares of Class A common stock, including 2,754,413 shares upon exercise in full of the underwriters’ overallotment option. Net proceeds generated for the Company were approximately $286.8 million after deducting underwriting discounts and commissions and transaction expenses. The Company did not receive any proceeds from the sale of the shares sold by Pattern Development.
As a result of the sale of the shares held by Pattern Development, its ownership interest in the Company was reduced from approximately 63% to 35%. Consequently, the Company is no longer subject to ASC 805-50-30-5, Transactions between Entities under Common Control. All future transactions with Pattern Development will be recognized at fair value on the measurement date in accordance with ASC 805 – Business Combinations.
| 2. | Summary of Significant Accounting Policies |
Basis of Presentation and Principles of Consolidation
The accompanying consolidated financial statements have been prepared in accordance with the accounting principles generally accepted in the United States (“U.S. GAAP”). They include the results of wholly-owned and partially-owned subsidiaries in which the Company has a controlling interest with all significant intercompany accounts and transactions eliminated.
Use of Estimates
The preparation of financial statements in conformity with U.S. GAAP requires management to make estimates and assumptions that affect the reported amounts of assets and liabilities, disclosures of contingent assets and liabilities at the date of the financial statements, and the reported amounts of revenues and expenses during the reporting period. Actual results could differ from those estimates, and such differences may be material to the consolidated financial statements.
Reclassification
Certain prior period balances have been reclassified to conform to current period presentation of the Company’s consolidated financial statements and accompanying notes. Such reclassifications have no effect on previously reported balance sheet subtotals, results of operations or retained earnings.
Unaudited Pro Forma Income Tax
In order to present the tax effect of the Contribution Transactions, the Company has presented a 2012 pro forma income tax provision as if the Contribution Transactions occurred effective January 1, 2012 and as if the Company were under control of a Subchapter C-Corporation for U.S. federal income tax purposes.
F-10
Table of Contents
Variable Interest Entities
ASC 810, Consolidation of Variable Interest Entities, defines the criteria for determining the existence of Variable Interest Entities (“VIEs”) and provides guidance for consolidation. The Company consolidates VIEs where the Company is the primary beneficiary. The primary beneficiary of a VIE is the party that has the power to direct the activities that most significantly impact the performance of the entity and the obligation to absorb losses or the right to receive benefits that could potentially be significant to the entity.
Investments or joint ventures in which the Company does not have a majority ownership interest and are not VIEs for which the Company is considered the primary beneficiary are accounted for using the equity method. These amounts are included in unconsolidated investments in the consolidated balance sheets.
Acquisitions
Business Combinations
When the Company acquires a controlling interest, the purchase is accounted for using the acquisition method, and the fair value of purchase consideration is allocated to the tangible and intangible assets acquired and liabilities assumed based on their estimated fair values. The excess, if any, of the fair value of purchase consideration over the fair values of these identifiable assets and liabilities is recorded as goodwill. Conversely, the excess, if any, of the net fair values of identifiable assets and liabilities over the fair value of purchase consideration is recorded as gain. Such valuations require management to make significant estimates and assumptions, especially with respect to intangible assets. These estimates and assumptions are inherently uncertain, and as a result, actual results may differ from estimates. Significant estimates include, but are not limited to, future expected cash flows, useful lives and discount rates. During the measurement period, which is one year from the acquisition date, we may record adjustments to the assets acquired and liabilities assumed, with a corresponding offset to either goodwill or gain, depending on whether the fair value of purchase consideration is in excess of or less than net assets acquired. Upon the conclusion of the measurement period, any subsequent adjustments are recorded to earnings.
Equity Method Investments
When the Company acquires a noncontrolling interest the investment is accounted for using the equity method of accounting and is initially recognized at cost.
Noncontrolling Interests
Noncontrolling interests represent the portion of the Company’s net (loss) income, net assets and comprehensive (loss) income that is not allocable to the Company and is calculated based on ownership percentage, for certain projects.
For the noncontrolling interests in the Company’s Gulf Wind, Panhandle 1 and Panhandle 2 projects, the Company has determined that the operating partnership agreements do not allocate economic benefits pro rata to its two classes of investors and the appropriate methodology for calculating the noncontrolling interest balance that reflects the substantive profit sharing arrangement is a balance sheet approach using the hypothetical liquidation at book value (“HLBV”) method.
Under the HLBV method, the amounts reported as noncontrolling interest in the consolidated balance sheets and consolidated statements of operations represent the amounts the third party would hypothetically receive at each balance sheet reporting date under the liquidation provisions of the operating partnership agreement assuming the net assets of Gulf Wind, Panhandle 1 and Panhandle 2 were liquidated at recorded amounts determined in accordance with U.S. GAAP and distributed to the investors. The third-party interest in the results of operations of Gulf Wind, Panhandle 1 and Panhandle 2 and the Company’s net (loss) income and comprehensive (loss)
F-11
Table of Contents
income is determined as the difference in noncontrolling interests in the consolidated balance sheets at the start and end of each reporting period, after taking into account any capital transactions between Gulf Wind, Panhandle 1, Panhandle 2 and the third party. The noncontrolling interest balances in Gulf Wind, Panhandle 1 and Panhandle 2 are reported as a component of equity in the consolidated balance sheets.
Foreign Currency Translation
The assets and liabilities of foreign subsidiaries, where the local currency is the functional currency, are translated from their respective functional currencies into U.S. dollars at the rates in effect at the balance sheet date and revenue and expense amounts are translated at average rates during the period, with resulting foreign currency translation adjustments recorded in other comprehensive (loss) income, net of tax, in the accompanying consolidated statements of stockholders’ equity and comprehensive (loss) income. Where the U.S. dollar is the functional currency, re-measurement adjustments are recorded in other income, net in the accompanying consolidated statements of operations.
Gains and losses realized from transactions, including related party balances not considered permanent investments, that are denominated in currencies other than an entity’s functional currency are included in other income, net in the accompanying consolidated statements of operations.
Concentrations of Credit Risk
Financial instruments that potentially subject the Company to concentrations of credit risk consist primarily of cash and cash equivalents, trade receivables and derivative assets. The Company places its cash and cash equivalents with high quality institutions.
The Company sells electricity and environmental attributes, including renewable energy credits, primarily to creditworthy utilities under long-term, fixed-priced power purchase agreements (“PPAs”) and, in some cases, through individual renewable energy credits sale agreements. During the year ended December 31, 2014, Standard & Poor’s Rating Services (“S&P”) and Moody’s Investor Service (“Moody’s”) downgraded the credit rating of the Puerto Rico Electric Power Authority (“PREPA”) from BBB and Baa3 to CCC and Caa3, respectively. On December 31, 2014, the amount of trade receivables due from PREPA was $2.5 million. As of March 2, 2015, PREPA was current with respect to payments due under the PPA and the next payment will be due from PREPA under the PPA on approximately March 19, 2015.
The table below presents significant customers who accounted for the following percentages of total revenues and the related maximum amount of credit loss based on their percentages of total trade receivables as of December 31, 2014:
| Year ended December 31, | ||||||||||||||||||||||||
| 2014 | 2013 | 2012 | ||||||||||||||||||||||
| Revenue | Trade Receivables |
Revenue | Trade Receivables |
Revenue | Trade Receivables |
|||||||||||||||||||
| San Diego Gas & Electric |
22.09 | % | 14.13 | % | 16.31 | % | 26.21 | % | 0.17 | % | 9.09 | % | ||||||||||||
| Manitoba Hydro |
14.47 | % | 9.39 | % | 16.69 | % | 17.18 | % | 30.23 | % | 14.08 | % | ||||||||||||
| Electric Reliability Council of Texas |
14.34 | % | 15.93 | % | 11.59 | % | 2.59 | % | 17.24 | % | 3.41 | % | ||||||||||||
| NV Energy, Inc. |
11.07 | % | 9.98 | % | 11.57 | % | 6.54 | % | 8.82 | % | 29.16 | % | ||||||||||||
| Pacific Gas & Electric |
10.93 | % | 9.54 | % | 13.77 | % | 14.47 | % | 21.79 | % | 13.81 | % | ||||||||||||
The Company’s interest rate derivative assets are placed with counterparties that are creditworthy institutions. An additional derivative asset was generated from Credit Suisse Energy LLC, the counterparty to a 10-year fixed-for-floating swap related to annual electricity generation at the Company’s Gulf Wind project. The Company’s reimbursements for prepaid interconnection network upgrades are with large creditworthy utility companies.
F-12
Table of Contents
Fair Value of Financial Instruments
ASC 820, Fair Value Measurements, defines fair value as the price at which an asset could be exchanged or a liability transferred in an orderly transaction between knowledgeable, willing parties in the principal or most advantageous market for the asset or liability. Where available, fair value is based on observable market prices or derived from such prices. Where observable prices or inputs are not available, valuation models are applied.
These valuation techniques involve some level of management estimation and judgment, the degree of which is dependent on the price transparency for the instruments or market and the instruments’ complexity. See Note 12 on Fair Value Measurements.
U.S. Treasury Grants
The Company received U.S. Treasury grants on certain wind power projects as defined under Section 1603 of the American Recovery and Reinvestment Act of 2009, as amended by the Tax Relief Unemployment Insurance Reauthorization and Job Creation Act of December 2010, upon approval by the U.S. Treasury Department. The Company records the U.S. Treasury grant proceeds as a deduction from the carrying amount of the related asset which results in a reduction of depreciation expense over the life of the asset. The Company records a catch-up adjustment in the period in which the grant is approved to recognize the portion of the grant that proportionally matches the depreciation for the period between the date of placement in service of the wind power project and approval by the U.S. Treasury Department. See Note 5 on Property, Plant and Equipment.
Cash and Cash Equivalents
Cash and cash equivalents consist of all cash balances and highly-liquid investments with original maturities of three months or less. The Company maintains cash and cash equivalents, which consist principally of demand deposits with high credit quality financial institutions. The Company has exposure to credit risk to the extent cash and cash equivalent balances, including restricted cash, exceed amounts covered by federal deposit insurance. The Company believes that its credit risk is immaterial.
Restricted Cash
Restricted cash consists of cash balances which are restricted as to withdrawal or usage and includes cash to collateralize bank letters of credit related primarily to interconnection rights, PPAs and for certain reserves required under the Company’s loan agreements.
Trade Receivables
The Company’s trade receivables are generated by selling energy and renewable energy credits in the California, Texas, Nevada, Manitoba (Canada), Puerto Rico and Chilean energy markets. The Company believes that all amounts are collectible and an allowance for doubtful accounts is not required as of December 31, 2014 and 2013.
Reimbursable Interconnection Costs
The Company may, from time to time, pay to construct interconnection network upgrades on behalf of the Company’s utility customers. The interconnection upgrades are owned by each utility customer who will reimburse the Company with interest when the project reaches commercial operations.
Turbine Advances
Turbine advances represent amounts advanced to turbine suppliers for the manufacture of wind turbines in accordance with turbine supply agreements for the Company’s wind power projects and for which the Company has not taken title. Turbine advances are reclassified to construction in progress when the Company takes legal
F-13
Table of Contents
title to the related turbines and are reclassified to property, plant and equipment when the project achieves commercial operation. Depreciation does not commence until projects enter commercial operation and turbine assets are placed in service.
Deferred Development Costs
Deferred development costs represent the accumulated costs of initial permitting, environmental reviews, land rights and obligations and preliminary design and engineering work. The Company expenses all project development costs until a project is determined to be technically feasible and likely to achieve commercial success. Upon commencement of construction, deferred development costs are recorded as a component of construction in progress. Upon achievement of commercial operation, construction in progress, which includes deferred development costs, is reclassified to property, plant and equipment.
Construction in Progress
Construction in progress represents the accumulated costs of projects in construction. Construction costs include turbines for which the Company has taken legal title, civil engineering, electrical and other related costs. Other capitalized costs include reclassified deferred development costs, amortization of intangible assets, amortization of deferred financing costs, capitalized interest and other costs required to place a project into commercial operation. Construction in progress is reclassified to property, plant and equipment when the project achieves commercial operation.
Finite-Lived Intangible Assets
Finite-lived intangible assets relate to easements and land options and mining rights. The Company amortizes finite-lived intangible assets using the straight-line method over the term of their estimated useful lives, which represents the term of the easements and land option and mining rights agreements, ranging from eleven months to twenty years. The Company periodically evaluates whether events or changes in circumstances have occurred that indicate the carrying amount of finite-lived intangible assets may not be recoverable, or information indicates that impairment may exist.
Property, Plant and Equipment
Property, plant and equipment represents the costs of completed and operational projects transferred from construction in progress, as well as land, computer equipment and software, furniture and fixtures, leasehold improvements and other equipment. Property, plant and equipment are stated at cost, less accumulated depreciation. Depreciation is calculated using the straight-line method over the respective assets’ useful lives. Wind farms are depreciated over twenty years and the remaining assets are depreciated over two to five years. Land is not depreciated. Improvements to property, plant and equipment deemed to extend the useful economic life of an asset are capitalized. Repair and maintenance costs are expensed as incurred.
Accounting for Impairment of Long-Lived Assets
The Company periodically evaluates long-lived assets for potential impairment whenever events or changes in circumstances have occurred that indicate that impairment may exist, or the carrying amount of the long-lived asset may not be recoverable. An impairment loss is recognized only if the carrying amount of a long-lived asset is not recoverable based on its estimated future undiscounted cash flows. An impairment loss is calculated based on the excess of the carrying value of the long-lived asset over the fair value of such long-lived asset , with the fair value determined based on an estimate of discounted future cash flows. Through December 31, 2014, no impairment charges have been recorded.
F-14
Table of Contents
Derivatives
The Company recognizes its derivative instruments as assets or liabilities at fair value in the consolidated balance sheets, unless the derivative instruments qualify for the “normal purchase normal sale” (“NPNS”) scope exception to derivative accounting. Accounting for changes in the fair value (i.e., gains or losses) of a derivative instrument depends on whether it has been designated as part of a hedging relationship and on the type of hedging relationship.
For derivative instruments that are designated as cash flow hedges, the effective portion of change in fair value of the derivative is reported as a component of other comprehensive (loss) income (“OCI”). Changes in the fair value of these derivatives are subsequently reclassified into earnings in the period that the hedged transaction affects earnings. The ineffective portion of change in fair value is recorded as a component of net (loss) income on the consolidated statement of operations. For undesignated derivative instruments, the change in fair value is reported as a component of net (loss) income on the consolidated statement of operations. Certain of our electricity price derivatives that qualify for the NPNS scope exception to derivative accounting are accounted for under the accrual method of accounting.
The Company enters into derivative transactions for the purpose of reducing exposure to fluctuations in interest rates and electricity prices. The Company has entered into interest rate swaps, an interest rate cap and an electricity price derivative.
Interest rate swaps are instruments used to fix the interest rate on variable interest rate debt.
An interest rate cap is an instrument that is used to reduce exposure to future variable interest rates when the related debt is expected to be refinanced.
The Company entered into an electricity price arrangement, which qualifies as a derivative, that fixes the price of approximately 58% of the electricity expected to be produced and sold by Gulf Wind through April 2019, and which reduces the Company’s exposure to spot electricity prices.
Deferred Financing Costs
Financing costs incurred in connection with obtaining construction and term financing are deferred and amortized over the lives of the respective loans using the effective-interest method. Amortization of deferred financing costs is capitalized during construction and recorded as interest expense in the consolidated statements of operations following commencement of commercial operation.
Income Taxes
Prior to October 2, 2013, the Company’s predecessor did not provide for income taxes as it was treated as a pass-through entity for U.S. federal and state income tax purposes, except for several specific circumstances involving its Canadian entities that are subject to Canadian income taxes, its Chilean entities, that are subject to Chilean income taxes, a U.S. entity that is subject to Puerto Rican taxes and a U.S. entity that became subject to U.S. income taxes in 2012. Federal and state income taxes were assessed at the owner level and each owner was liable for its own tax payments. Certain consolidated entities are corporations or have elected to be taxed as corporations. In these circumstances, income tax was accounted for under the asset and liability method.
Subsequent to October 2, 2013, following the Contribution Transactions, the Company accounts for income taxes under the asset and liability method, which requires the recognition of deferred tax assets and liabilities for the expected future tax consequences of events that have been included in the financial statements. Under this method, deferred tax assets and liabilities are determined on the basis of the differences between the financial statement and tax basis of assets and liabilities using enacted tax rates in effect for the year in which the differences are expected to reverse. The effect of a change in tax rates on deferred tax assets and liabilities is recognized in income in the period that includes the enactment date. The Company recognizes deferred tax assets to the extent that it believes these assets are more likely than not to be realized. In making such a determination,
F-15
Table of Contents
the Company considers all available positive and negative evidence, including future reversals of existing taxable temporary differences, projected future taxable income, tax-planning and results of recent operations. If the Company determines that it would be able to realize its deferred tax assets in the future in excess of their net recorded amount, it would make an adjustment to the deferred tax asset valuation allowance, which would reduce the provision for income taxes. The Company records uncertain tax positions in accordance with ASC 740 on the basis of a two-step process whereby (1) it determines whether it is more likely than not that the tax positions will be sustained on the basis of the technical merits of the position and (2) for those tax positions that meet the more-likely-than-not recognition threshold, it recognizes the largest amount of tax benefit that is more than 50 percent likely to be realized upon ultimate settlement with the related tax authority. The Company has a policy to classify interest and penalties associated with uncertain tax positions together with the related liability, and the expenses incurred related to such accruals, if any, are included in the provision for income taxes.
Contingent Liabilities
The Company’s contingent liabilities represent deferred and contingent obligations related to projects acquired through business combinations and contingent bonuses payable to turbine service and maintenance providers associated with long-term turbine service and maintenance arrangements. Contingent liabilities are reported at fair value at each reporting period.
Asset Retirement Obligation
The Company records asset retirement obligations for the estimated costs of decommissioning turbines, removing above-ground installations and restoring sites, at the time when a contractual decommissioning obligation materializes. The Company records accretion expense, which represents the increase in the asset retirement obligations, over the remaining or operational life of the associated wind project. Accretion expense is recorded as cost of revenue in the statement of operations using accretion rates based on credit adjusted risk-free interest rates.
Revenue Recognition
The Company sells the electricity it generates under the terms of power sale agreements (“PSAs”) or at spot-market prices. Revenue is recognized based upon the amount of electricity delivered at rates specified under the contracts, assuming all other revenue recognition criteria are met. The Company evaluates its PSAs to determine whether they are in substance leases or derivatives and, if applicable, recognizes revenue pursuant to ASC 840, Leases and ASC 815, Derivatives and Hedging, respectively. As of December 31, 2014, there were no PSAs that are accounted for as leases or derivatives and revenue is recognized on an accrual basis.
The Company also generates renewable energy credits as it produces electricity. Certain of these energy credits are sold independently in an open market and revenue is recognized at the time title to the energy credits is transferred to the buyer.
The Company acquired a ten-year energy derivative instrument as part of its acquisition of Gulf Wind in 2010, which fixes approximately 58% of the project’s expected electricity generation through April 2019. The energy derivative instrument reduces exposure to changes in commodity prices by allowing the Company to lock in a fixed price per MWh for a specified amount of annual electricity generation. The monthly settlement amounts under the energy hedge are accounted for as energy derivative settlements in the consolidated statements of operations. The change in the fair value of the energy hedge is classified as unrealized (loss) gain on energy derivative revenue in the consolidated statements of operations.
The Company recognizes revenue for warranty settlements and liquidated damages from turbine manufacturers in other revenue upon resolution of outstanding contingencies. Any cash receipts for amounts subject to future adjustment or repayment are deferred in other liabilities until the final settlement amount is considered fixed and determinable.
F-16
Table of Contents
Cost of Revenue
The Company’s cost of revenue is comprised of direct costs of operating and maintaining its wind project facilities, including labor, turbine service arrangements, land lease royalties, depreciation, accretion, property taxes and insurance.
Stock-Based Compensation
The Company accounts for stock-based compensation related to stock options granted to employees by estimating the fair value of the stock-based awards using the Black-Scholes option-pricing model. The fair value of the stock options granted is amortized over the applicable vesting period. The Black-Scholes option pricing model includes assumptions regarding dividend yields, expected volatility, expected option term, expected forfeiture rate and risk-free interest rates. The Company estimates expected volatility based on the historical volatility of comparable publicly traded companies for a period that is equal to the expected term of the options. The risk-free interest rate is based on the U.S. treasury yield curve in effect at the time of grant for a period commensurate with the estimated expected term of the stock option. The expected term of options granted is derived using the “simplified” method as allowed under the provisions of the ASC 718, Compensation—Stock Compensation, and represents the period of time that options granted are expected to be outstanding.
The Company accounts for stock-based compensation related to restricted stock award grants by amortizing the fair value of the restricted stock award grants, which is the grant date market price, over the applicable vesting period.
Stock-based compensation expense is recorded as a component of general and administrative expenses in the Company’s consolidated statements of operations.
Comprehensive (Loss) Income
Comprehensive (loss) income consists of net (loss) income and other comprehensive (loss) income, net of tax. Other comprehensive (loss) income, net of tax included in accumulated other comprehensive (loss) income in the accompanying consolidated statements of stockholders’ equity, is comprised of changes in foreign currency translation adjustments and changes in the fair value of derivatives designated as hedges.
Segment Data
Operating segments are defined as components of a company about which separate financial information is available that is evaluated regularly by the chief operating decision maker in deciding how to allocate resources and in assessing performance. The Company’s chief operating decision maker is the chief executive officer. Based on the financial information presented to and reviewed by the chief operating decision maker in deciding how to allocate the resources and in assessing the Company’s performance, the Company has determined its wind projects represent individual operating segments with similar economic characteristics that meet the criteria for aggregation into a single reporting segment for financial statement purposes.
Recently Issued Accounting Standards
In February 2015, the Financial Accounting Standards Board (“FASB”) issued ASU 2015-02, “Consolidation: Amendments to the Consolidation Analysis” to modify the analysis that companies must perform in order to determine whether a legal entity should be consolidated. ASU 2015-02 simplifies current guidance by reducing the number of consolidation models; eliminating the risk that a reporting entity may have to consolidate based on a fee arrangement with another legal entity; placing more weight on the risk of loss in order to identify the party that has a controlling financial interest; reducing the number of instances that related party guidance needs to be applied when determining the party that has a controlling financial interest; and changing rules for companies in certain industries that ordinarily employ limited partnership or VIE structures. ASU 2015-02 is effective for public companies beginning after December 15, 2015 and interim periods within those fiscal periods. Early adoption on a modified retrospective or full retrospective basis is permitted. The Company is currently assessing the future impact of this update on its consolidated financial statements.
F-17
Table of Contents
In November 2014, the FASB issued ASU 2014-17, “Business Combinations: Pushdown Accounting”, which provides an entity with an option to apply pushdown accounting in its separate financial statements upon occurrence of an event in which an acquirer obtains control of the acquired entity. The amendments in ASU 2014-17 are effective November 18, 2014. After the effective date, an acquired entity can make an election to apply the guidance to future change-in-control events or to its most recent change-in-control event. However, if the financial statements for the period in which the most recent change-in-control event occurred already have been issued or made available to be issued, the application of this guidance would be a change in accounting principle. The Company does not anticipate that the adoption of this update will have a material impact on its consolidated financial statements.
In November 2014, the FASB issued ASU 2014-16, “Derivatives and Hedging – Determining Whether the Host Contract in a Hybrid Financial Instrument Issued in the Form of a Share is More Akin to Debt or to Equity”, which provides clarification on how current U.S. GAAP should be interpreted in evaluating the economic characteristics and risks of a host contract in a hybrid financial instrument that is issued in the form of a share. ASU 2014-16 is effective for interim and annual periods beginning after December 15, 2015, with early adoption permitted. The Company is currently assessing the future impact of this update on its consolidated financial statements.
In August 2014, the FASB issued Accounting Standards Update (“ASU”) 2014-15, “Presentation of Financial Statements – Going Concern: Disclosure of Uncertainties about an Entity’s Ability to Continue as a Going Concern”, which requires an entity’s management to evaluate whether there is substantial doubt about the entity’s ability to continue as a going concern and to provide related footnote disclosures. ASU 2014-15 is effective for interim and annual periods beginning after December 15, 2016, with early adoption permitted for interim and annual reporting periods for which the financial statements have not been previously issued. The Company does not anticipate that the adoption of this update will have a material impact on its consolidated financial statements.
In June 2014, the FASB issued ASU 2014-12, “Compensation – Stock Compensation” which requires an entity to treat a performance target that affects vesting that could be achieved after an employee completes the requisite service period as a performance condition. The performance target should not be reflected in estimating the grant-date fair value of the award. Compensation cost should be recognized in the period in which it becomes probable that the performance target will be achieved and should represent the compensation cost attributable to the period(s) for which the requisite service has already been rendered. If the performance target becomes probable of being achieved before the end of the requisite service period, the remaining unrecognized compensation cost should be recognized prospectively over the remaining requisite service period. The total amount of compensation cost recognized during and after the requisite service period should reflect the number of awards that are expected to vest and should be adjusted to reflect those awards that ultimately vest. The requisite service period ends when the employee can cease rendering service and still be eligible to vest in the award if the performance target is achieved. ASU 2014-12 is effective for interim and annual periods beginning after December 15, 2015, with early adoption permitted either prospectively or retrospectively to all prior periods presented. The Company does not anticipate that the adoption of this update will have a material impact on its financial condition, results of operations or cash flows.
In May 2014, the FASB issued ASU 2014-09, “Revenue from Contracts with Customers”. The standard provides companies with a single model for use in accounting for revenue arising from contracts with customers and supersedes current revenue recognition guidance, including industry-specific revenue guidance. The core principle of the model is to recognize revenue when control of the goods or services transfers to the customer, as opposed to recognizing revenue when the risks and rewards transfer to the customer under the existing revenue guidance. ASU 2014-09 is effective for annual reporting periods beginning after December 15, 2016. Early adoption is not permitted. The guidance permits companies to either apply the requirements retrospectively to all prior periods presented, or apply the requirements in the year of adoption, through a cumulative adjustment. The Company is currently assessing the future impact of this update on its consolidated financial statements.
F-18
Table of Contents
| 3. | Acquisitions |
El Arrayán Acquisition
On June 25, 2014, the Company acquired 100% of the issued and outstanding common stock of AEI El Arrayán Chile SpA (“AEI El Arrayán”), an entity holding a 38.5% indirect interest in El Arrayán, for a total purchase price of $45.3 million, pursuant to the terms of a Stock Purchase Agreement (the “Agreement”). The Company owned a 31.5% indirect interest in El Arrayán prior to acquiring the additional 38.5% interest in order to obtain majority control (70%) of the project, as a part of its growth strategy. El Arrayán is a 115 MW wind power project company, located in Ovalle, Chile, which achieved commercial operations on June 4, 2014.
Prior to the acquisition, the Company accounted for the investment under the equity method of accounting. Because the Company acquired an additional 38.5% indirect interest in El Arrayán, in accordance with ASC 805 Business Combinations, the acquisition was accounted for as a “business combination achieved in stages”. Accordingly, the Company remeasured the previously held equity interest in El Arrayán and adjusted it to fair value based on the Company’s existing equity interest in the fair value of the underlying assets and liabilities of El Arrayán. The fair value of the Company’s equity interest at the acquisition date was $37.0 million (31.5% of implied equity value of $117.5 million per below). The difference between the fair value of the Company’s ownership in El Arrayán and the Company’s carrying value of its investment of $19.1 million resulted in a gain of $17.9 million recorded in net gain on transactions in the consolidated statements of operations for the year ended December 31, 2014. The Company recognized additional deferred tax liability due to differences in accounting and tax bases resulting from the Company’s existing ownership interest in El Arrayán, which has been included in the consolidated statements of operations. The Company now holds a 70% controlling interest in the wind project and consolidates the accounts of El Arrayán.
The Company acquired the assets and operating contracts for AEI El Arrayán, including assumed liabilities. The identifiable assets acquired and liabilities assumed were recorded at their fair values.
The consolidated fair value of the assets acquired and liabilities assumed in connection with the AEI El Arrayán acquisition are as follows (in thousands):
| Consolidated interest June 25, 2014 |
||||
| Cash and cash equivalents |
$ | 713 | ||
| Trade receivables |
3,829 | |||
| VAT receivable |
17,031 | |||
| Prepaid expenses and other current assets |
174 | |||
| Restricted cash, non-current |
10,392 | |||
| Property, plant and equipment |
341,417 | |||
| Intangible assets |
1,121 | |||
| Net deferred tax assets |
5,455 | |||
| Accounts payable and other accrued liabilities |
(6,830 | ) | ||
| Accrued construction costs |
(9,495 | ) | ||
| Accrued interest |
(2,592 | ) | ||
| Derivative liabilities, current |
(1,942 | ) | ||
| Current portion of long-term debt |
(16,586 | ) | ||
| Long-term debt |
(209,295 | ) | ||
| Derivative liabilities, non-current |
(501 | ) | ||
| Asset retirement obligation |
(2,354 | ) | ||
| Net deferred tax liabilities |
(13,001 | ) | ||
|
|
|
|||
| Total consideration |
117,536 | |||
|
|
|
|||
| Less: non-controlling interest |
(35,259 | ) | ||
|
|
|
|||
| Controlling interest |
$ | 82,277 | ||
|
|
|
|||
F-19
Table of Contents
Current assets, restricted cash, deferred tax assets, current liabilities, accrued construction costs, debt, accrued interest and deferred tax liabilities were recorded at carrying value, which is representative of the fair value on the date of acquisition. Derivative liabilities were recorded at fair value. Property, plant and equipment were recorded at the cost of construction plus the developer’s profit margin, which represents fair value. The asset retirement obligation was recorded at fair value using a combination of market data, operational data and discounted cash flows and was adjusted by a discount rate factor reflecting then current market conditions.
The Company recognized deferred tax liabilities due to differences in accounting and tax bases resulting from the Company’s acquisition of incremental interest in El Arrayán and the remeasurement of the project’s remaining noncontrolling interest at fair value.
The Company incurred $0.4 million of transaction-related expenses which were recorded in net gain on transactions in the consolidated statements of operations for the year ended December 31, 2014.
Panhandle 1 Acquisition
On June 30, 2014, the Company acquired 100% of the Class B membership interests in the Panhandle 1 wind project, representing a 79% initial ownership interest in the project’s distributable cash flow, through the acquisition of Panhandle Wind Holdings LLC, from Pattern Development, for a purchase price of approximately $124.4 million. The 218 MW wind project, located in Carson County, Texas, achieved commercial operations on June 25, 2014.
Prior to the closing, certain tax equity investors made capital contributions to acquire 100% of the Class A membership interests in Panhandle 1 and have been admitted as noncontrolling members in the entity, with a 21% initial ownership interest in the project’s distributable cash flow. The Company has determined that the operating partnership agreement does not allocate economic benefits pro rata to its two classes of investors and will use the HLBV method to calculate the noncontrolling interest balance that reflects the substantive profit sharing arrangement.
The Company acquired the assets and operating contracts for Panhandle 1, including assumed liabilities. The identifiable assets acquired and liabilities assumed were recorded at their fair values, which corresponded to the sum of the cash purchase price and the initial balance of the other investors’ noncontrolling interests.
The consolidated fair value of the assets acquired and liabilities assumed in connection with the Panhandle 1 acquisition are as follows (in thousands):
| June 30, 2014 | ||||
| Cash and cash equivalents |
$ | 1,038 | ||
| Trade receivables |
1,850 | |||
| Prepaid expenses and other current assets |
71 | |||
| Restricted cash, non-current |
14,293 | |||
| Property, plant and equipment |
332,953 | |||
| Accounts payable and other accrued liabilities |
(148 | ) | ||
| Accrued construction costs |
(12,806 | ) | ||
| Related party payable |
(44 | ) | ||
| Asset retirement obligation |
(2,557 | ) | ||
|
|
|
|||
| Total consideration before non-controlling interest |
334,650 | |||
|
|
|
|||
| Less: tax equity noncontrolling interest contributions |
(210,250 | ) | ||
|
|
|
|||
| Total consideration after non-controlling interest |
$ | 124,400 | ||
|
|
|
|||
F-20
Table of Contents
Current assets, restricted cash, current liabilities, accrued construction costs and related party payable were recorded at carrying value, which is representative of the fair value on the date of acquisition.
Property, plant and equipment were recorded at the cost of construction plus the developer’s profit margin, which represents fair value. The asset retirement obligation was recorded at fair value using a combination of market data, operational data and discounted cash flows and was adjusted by a discount rate factor reflecting then current market conditions.
The Company incurred $0.5 million of transaction-related expense which was recorded in net (loss) gain on transactions in the consolidated statements of operations for the year ended December 31, 2014.
Panhandle 2 Acquisition
On November 10, 2014, the Company acquired 100% of the membership interests in the Panhandle 2 wind project through the acquisition of Panhandle B Member 2 LLC, from Pattern Development, for a purchase price of approximately $123.8 million.
Subsequent to the closing, certain tax equity investors made capital contributions to acquire 100% of the Class A membership interests in Panhandle 2 and were admitted as noncontrolling members in the entity and the Company received 100% of the Class B membership interests, resulting in the tax equity investors and the Company holding initial ownership interests of 19% and 81%, respectively, in the project’s distributable cash flows. The 182 MW wind project, located in Carson County, Texas, achieved commercial operations on November 7, 2014. The Company has determined that the operating partnership agreement does not allocate economic benefits pro rata to its two classes of investors and will use the HLBV method to calculate the noncontrolling interest balance that reflects the substantive profit sharing arrangement.
The Company acquired the assets and operating contracts for Panhandle 2, including assumed liabilities. The identifiable assets acquired and liabilities assumed were recorded at their fair values which corresponded to the sum of the cash purchase price. The short-term debt presented in the table below consists of a construction loan that was repaid in full following the acquisition.
The consolidated fair value of the assets acquired and liabilities assumed in connection with the Panhandle 2 acquisition are as follows (in thousands):
| November 10, 2014 | ||||
| Cash and cash equivalents |
$ | 240 | ||
| Trade receivables |
1,156 | |||
| Prepaid expenses and other current assets |
28,997 | |||
| Property, plant and equipment |
315,109 | |||
| Accrued construction costs |
(24,197 | ) | ||
| Related party payable |
(121 | ) | ||
| Short-term debt |
(195,351 | ) | ||
| Asset retirement obligation |
(2,003 | ) | ||
|
|
|
|||
| Total consideration |
$ | 123,830 | ||
|
|
|
|||
Current assets, accrued construction costs and related party payable were recorded at carrying value, which is representative of the fair value on the date of acquisition. In addition, the short-term debt was recorded at carrying value, representative of the fair value, which was repaid immediately after acquisition.
F-21
Table of Contents
Property, plant and equipment were recorded at the cost of construction plus the developer’s profit margin, which represents fair value. The asset retirement obligation was recorded at fair value using a combination of market data, operational data and discounted cash flows and was adjusted by a discount rate factor reflecting then current market conditions.
The accounting for this acquisition is preliminary. The fair value estimates for the assets acquired and liabilities assumed were based on preliminary calculations and valuations, and the estimates and assumptions are subject to change as additional information is obtained for the estimates during the measurement period (up to one year from the acquisition date). The Company incurred $0.2 million and $0.6 million of transaction-related expense which was recorded in net gain on transactions in the consolidated statements of operations for the years ended December 31, 2014 and 2013, respectively.
Logan’s Gap Acquisition
On December 19, 2014, the Company acquired 100% of the membership interests in the Logan’s Gap wind project, through the acquisition of Logan’s Gap B Member LLC, from Pattern Development, for a purchase price of approximately $15.1 million and an assumed contingent liability to a third party in the amount of $8.0 million associated with the close of construction financing and the achievement of either commercial operation or tax equity funding. The wind project is currently under construction and is located in Comanche County, Texas. The construction of the project is being financed primarily by construction debt and Pattern Energy equity. Following construction, it is expected that institutional tax equity investors will invest in the project, pursuant to an executed equity commitment agreement, so that the construction loan will be paid off such that long term financing for the project will be equity based. Upon tax equity funding, it is expected that the Company and the institutional tax equity investors will have initial ownership interests of 82% and 18%, respectively, in the project’s distributable cash flows.
The Company acquired the assets and operating contracts for Logan’s Gap, including assumed liabilities. The identifiable assets acquired and liabilities assumed were recorded at their fair values which corresponded to the sum of the cash purchase price. The consolidated fair value of the assets acquired and liabilities assumed in connection with the Logan’s Gap acquisition are as follows (in thousands):
| December 19, 2014 | ||||
| Cash and cash equivalents |
$ | 2 | ||
| Restricted cash, current |
5,003 | |||
| Prepaid expenses and other current assets |
1,722 | |||
| Deferred financing costs, current |
2,117 | |||
| Construction in progress |
23,770 | |||
| Property, plant and equipment |
116 | |||
| Other assets |
80 | |||
| Accrued construction costs |
(4,733 | ) | ||
| Current portion of contingent liabilities |
(7,975 | ) | ||
| Related party payable |
(5,003 | ) | ||
|
|
|
|||
| Total consideration |
$ | 15,099 | ||
|
|
|
|||
Current assets, current liabilities, property, plant and equipment, other assets, accrued construction costs and related party payable were recorded at carrying value, which is representative of the fair value on the date of acquisition. Construction in progress was recorded at fair value which is representative of the development effort, including the developer’s profit, and contracts acquired on the date of acquisition.
The Company recorded $8.0 million in contingent obligations, payable to a third party, at fair value upon acquisition. Of this amount, $4.0 million was paid in December 2014, upon construction financing, and the remaining $4.0 million liability is payable upon the earlier of commercial operations or tax equity funding, which is expected to occur in the fourth quarter of 2015.
F-22
Table of Contents
The accounting for this acquisition is preliminary. The fair value estimates for the assets acquired and liabilities assumed were based on preliminary calculations and valuations, and the estimates and assumptions are subject to change as additional information is obtained for the estimates during the measurement period (up to one year from the acquisition date). The Company incurred $0.3 million of transaction-related expense which was recorded in net gain on transactions in the consolidated statements of operations for the year ended December 31, 2014.
Supplemental pro forma data (unaudited)
The unaudited pro forma statement of operations data below gives effect to the AEI El Arrayán, Panhandle 1, Panhandle 2 and Logan’s Gap acquisitions as if they had occurred on January 1, 2013. The 2014 pro forma net loss was adjusted to exclude nonrecurring transaction related expenses of $2.9 million and a nonrecurring $17.9 million gain on acquisition of El Arrayán. The unaudited pro forma data is presented for illustrative purposes only and is not intended to be indicative of actual results that would have been achieved had these acquisitions been consummated as of January 1, 2013. The unaudited pro forma data should not be considered representative of the Company’s future financial condition or results of operations.
| Year ended December 31, |
||||||||
| Unaudited pro forma data (in thousands) |
2014 | 2013 | ||||||
| Pro forma total revenue |
$ | 268,116 | $ | 201,573 | ||||
| Pro forma total expenses |
326,990 | 192,762 | ||||||
|
|
|
|
|
|||||
| Pro forma net (loss) income |
(58,874 | ) | 8,811 | |||||
| Less: pro forma net loss attributable to noncontrolling interest |
(8,662 | ) | (7,176 | ) | ||||
|
|
|
|
|
|||||
| Pro forma net (loss) income attributable to controlling interest |
$ | (50,212 | ) | $ | 15,987 | |||
|
|
|
|
|
|||||
Prior to the acquisition of AEI El Arrayán, net loss was recorded in equity in (losses) earnings in unconsolidated investments in the consolidated statement of operations. From January 1, 2014 to June 25, 2014, the Company recorded net loss of $0.4 million in equity in (losses) earnings on unconsolidated investments related to El Arrayán.
The following table presents the amounts included in the consolidated statements of operations for AEI El Arrayán, Panhandle 1, Panhandle 2 and Logan’s Gap since their respective dates of acquisition:
| Year ended December 31, |
||||
| Unaudited data (in thousands) |
2014 | |||
| Total revenue |
$ | 30,841 | ||
| Total expenses |
41,232 | |||
|
|
|
|||
| Net loss |
(10,391 | ) | ||
| Less: net loss attributable to noncontrolling interest |
(6,673 | ) | ||
|
|
|
|||
| Net loss attributable to controlling interest |
$ | (3,718 | ) | |
|
|
|
|||
| 4. | Prepaid expenses and other current assets |
The following table presents the components of prepaid expenses and other current assets (in thousands):
| December 31, | ||||||||
| 2014 | 2013 | |||||||
| Prepaid expenses |
$ | 15,275 | $ | 10,132 | ||||
| Prepaid construction costs |
5,155 | — | ||||||
| Sales tax |
786 | 50 | ||||||
| Other current assets: |
||||||||
| Deposit for letters of credit |
3,425 | — | ||||||
| Deferred equity issuance costs |
2,331 | — | ||||||
| Other |
982 | 1,233 | ||||||
|
|
|
|
|
|||||
| Prepaid expenses and other current assets |
$ | 27,954 | $ | 11,415 | ||||
|
|
|
|
|
|||||
F-23
Table of Contents
| 5. | Property, Plant and Equipment |
The following presents the categories within property, plant and equipment (in thousands):
| December 31, | ||||||||
| 2014 | 2013 | |||||||
| Operating wind farms |
$ | 2,624,640 | $ | 1,652,119 | ||||
| Furniture, fixtures and equipment |
4,366 | 3,785 | ||||||
| Land |
141 | 16 | ||||||
|
|
|
|
|
|||||
| Subtotal |
2,629,147 | 1,655,920 | ||||||
| Less: accumulated depreciation |
(278,291 | ) | (179,778 | ) | ||||
|
|
|
|
|
|||||
| Property, plant and equipment, net |
$ | 2,350,856 | $ | 1,476,142 | ||||
|
|
|
|
|
|||||
The Company recorded depreciation expense related to property, plant and equipment of $102.9 million, $82.0 million and $48.3 million for the years ended December 31, 2014, 2013 and 2012, respectively.
In June 2013, the Company received $115.9 million and $57.6 million, from the U.S. Department of the Treasury, for Ocotillo and Santa Isabel, respectively, under a cash grant in lieu of investment tax credit (“Cash Grant”). In December 2012, the Company received $79.9 million for Spring Valley under a Cash Grant from the U.S. Department of the Treasury. The Company recorded the cash proceeds as a deduction from the carrying amount of the related wind farm assets which resulted in the assets being recorded at lower amounts.
The Cash Grants received for Ocotillo, Santa Isabel, and Spring Valley reduced depreciation expense recorded in the consolidated statements of operations by approximately $12.7 million, $13.0 million and $1.5 million for the years ended December 31, 2014, 2013 and 2012, respectively.
| 6. | Unconsolidated Investments |
The following presents projects that are accounted for under the equity method of accounting (in thousands):
| Percentage of Ownership | ||||||||||||||||
| December 31, | December 31, | |||||||||||||||
| 2014 | 2013 | 2014 | 2013 | |||||||||||||
| South Kent |
$ | 17,360 | $ | 59,488 | 50.0 | % | 50.0 | % | ||||||||
| Grand |
11,719 | 26,464 | 45.0 | % | 45.0 | % | ||||||||||
| El Arrayán |
— | 21,103 | N/A | 31.5 | % | |||||||||||
|
|
|
|
|
|||||||||||||
| Unconsolidated investments |
$ | 29,079 | $ | 107,055 | ||||||||||||
|
|
|
|
|
|||||||||||||
South Kent
The Company is a noncontrolling investor in a joint venture established to develop, construct, and own a wind power project located in Ontario, Canada. The project has a 20-year PPA and commenced commercial operations on March 28, 2014.
Grand
On December 20, 2013, the Company acquired from Pattern Development a 45% equity interest in Grand for $79.5 million, plus a contingent payment of up to C$5.0 million, or $4.3 million based on the exchange rate as of December 31, 2014, as calculated based on final budget to actual amounts and distributions payable upon term conversion which has been updated from the Company’s original estimate to 2015. Grand is a joint venture
F-24
Table of Contents
established to develop, construct, and own a wind power project located in Ontario, Canada. The project has a 20-year PPA and commenced commercial operations on December 9, 2014. The Company’s investment in Grand was paid from general corporate funds. The Company is a noncontrolling investor in Grand and the investment is accounted for under the equity method of accounting.
El Arrayán
On June 25, 2014, the Company increased its total ownership interest in El Arrayán to 70%. See Note 3, Acquisitions, for disclosure on the acquisition of El Arrayán. As such, the Company has consolidated the operations of El Arrayán as of the acquisition date and is no longer accounting for this investment under the equity method of accounting.
The following summarizes the aggregated balance sheets of El Arrayán as of December 31, 2014 and 2013, and its operating results for the period from January 1, 2014 to June 25, 2014 and the years ended December 31, 2013 and 2012, respectively (in thousands):
| December 31, | ||||||||
| 2014 | 2013 | |||||||
| Current assets |
$ | — | $ | 16,362 | ||||
| Non-current assets |
— | 260,187 | ||||||
|
|
|
|
|
|||||
| Total assets |
$ | — | $ | 276,549 | ||||
|
|
|
|
|
|||||
| Current liabilities |
$ | — | $ | 9,224 | ||||
| Non-current liabilities |
— | 197,597 | ||||||
|
|
|
|
|
|||||
| Total liabilities |
— | 206,821 | ||||||
|
|
|
|
|
|||||
| Total equity |
— | 69,728 | ||||||
|
|
|
|
|
|||||
| Total liabilities and equity |
$ | — | $ | 276,549 | ||||
|
|
|
|
|
|||||
| December 31, | ||||||||||||
| 2014 | 2013 | 2012 | ||||||||||
| Revenue |
$ | 1,821 | $ | — | $ | — | ||||||
| Other (income) expense |
3,083 | 941 | 384 | |||||||||
|
|
|
|
|
|
|
|||||||
| Net loss |
$ | (1,262 | ) | $ | (941 | ) | $ | (384 | ) | |||
|
|
|
|
|
|
|
|||||||
| 7. | Accounts payable and other accrued liabilities |
The following table presents the components of accounts payable and other accrued liabilities (in thousands):
| December 31, | ||||||||
| 2014 | 2013 | |||||||
| Accounts payable |
$ | 673 | $ | 168 | ||||
| Other accrued liabilities |
9,202 | 6,329 | ||||||
| Warranty settlement payments |
639 | 2,187 | ||||||
| LTSA upgrades liability |
680 | — | ||||||
| Land lease rent payable |
2,115 | 953 | ||||||
| Payroll liabilities |
4,453 | 2,162 | ||||||
| Property tax payable |
4,625 | 3,490 | ||||||
| Sales tax payable |
2,406 | 261 | ||||||
|
|
|
|
|
|||||
| Accounts payable and other accrued liabilities |
$ | 24,793 | $ | 15,550 | ||||
|
|
|
|
|
|||||
F-25
Table of Contents
| 8. | Long term debt |
The Company’s long term debt as of December 31, 2014 and 2013 is presented below (in thousands):
| December 31, | Interest Rate as of December 31, |
Interest Type |
||||||||||||||||||
| 2014 | 2013 | 2014 | 2013 | Maturity | ||||||||||||||||
| Hatchet Ridge term loan |
$ | 228,288 | $ | 239,865 | 1.43 | % | 1.43 | % | Imputed | December 2032 | ||||||||||
| Gulf Wind term loan |
156,122 | 166,448 | 3.23 | % | 3.25 | % | Variable | March 2020 | ||||||||||||
| St. Joseph term loan |
189,472 | 215,330 | 5.88 | % | 5.88 | % | Fixed | May 2031 | ||||||||||||
| Spring Valley term loan |
167,261 | 173,110 | 2.62 | % | 2.63 | % | Variable | June 2030 | ||||||||||||
| Santa Isabel term loan |
112,609 | 115,721 | 4.57 | % | 4.57 | % | Fixed | September 2033 | ||||||||||||
| El Arrayan commercial term loan |
99,665 | — | 2.92 | % | N/A | Variable | March 2029 | |||||||||||||
| El Arrayan EKF term loan |
109,630 | — | 5.56 | % | N/A | Fixed | March 2029 | |||||||||||||
| Ocotillo commercial term loan |
222,175 | 230,944 | 1.98 | % | 3.00 | % | Variable | August 2020 | ||||||||||||
| Ocotillo development term loan |
106,700 | 107,800 | 2.33 | % | 2.35 | % | Variable | August 2033 | ||||||||||||
| Logan’s Gap construction loan |
58,691 | — | 1.64 | % | N/A | Variable | December 2015 | |||||||||||||
|
|
|
|
|
|||||||||||||||||
| 1,450,613 | 1,249,218 | |||||||||||||||||||
| Less: current portion |
(121,561 | ) | (48,851 | ) | ||||||||||||||||
|
|
|
|
|
|||||||||||||||||
| $ | 1,329,052 | $ | 1,200,367 | |||||||||||||||||
|
|
|
|
|
|||||||||||||||||
The following are principal payments due under long-term debt as of December 31, 2014 (in thousands):
| For the year ending December 31, |
||||
| 2015 |
$ | 121,561 | ||
| 2016 |
65,877 | |||
| 2017 |
67,277 | |||
| 2018 |
72,750 | |||
| 2019 |
83,613 | |||
| Thereafter |
1,039,535 | |||
|
|
|
|||
| $ | 1,450,613 | |||
|
|
|
Interest and commitment fees incurred, and interest expense recorded in the Company’s consolidated statements of operations are as follows (in thousands):
| Year ended December 31, | ||||||||||||
| 2014 | 2013 | 2012 | ||||||||||
| Interest and commitment fees incurred |
$ | 59,864 | $ | 57,478 | $ | 43,496 | ||||||
| Capitalized interest, commitment fees, and letter of credit fees |
(2,856 | ) | (4,210 | ) | (10,259 | ) | ||||||
| Letter of credit fees |
4,377 | 3,530 | 720 | |||||||||
| Amortization of financing costs |
6,309 | 6,816 | 2,545 | |||||||||
|
|
|
|
|
|
|
|||||||
| Interest expense |
$ | 67,694 | $ | 63,614 | $ | 36,502 | ||||||
|
|
|
|
|
|
|
|||||||
Hatchet Ridge
In December 2010, Hatchet Ridge entered into sale-leaseback transactions to finance the facility for 22 years. In accordance with ASC 840, Leases, Hatchet Ridge accounts for the sale-leaseback as a financing transaction.
Collateral for the sale-leaseback financing includes Hatchet Ridge’s tangible assets and contractual rights and cash on deposit with the depository agent. Its loan agreement contains a broad range of covenants that, subject to certain exceptions, restrict Hatchet Ridge’s ability to incur debt, grant liens, sell or lease assets, transfer equity interests, dissolve, pay distributions and change its business.
F-26
Table of Contents
Gulf Wind
The Company acquired Gulf Wind in March 2010. Concurrent with its acquisition, Gulf Wind entered into a $195.4 million credit facility. The Gulf Wind credit facility has a term of ten years. In connection with the facility, Gulf Wind entered into interest rate swaps and cap agreements to reduce its exposure to variable interest rates of the term of the facility and to hedge its exposure to re-financing rate risk.
Collateral for the Gulf Wind credit facility includes Gulf Wind’s tangible assets and contractual rights and cash on deposit with the depository agent. Its loan agreement contains a broad range of covenants that, subject to certain exceptions, restrict Gulf Wind’s ability to incur debt, grant liens, sell or lease assets, transfer equity interests, dissolve, pay distributions and change its business.
St. Joseph
In March 2010, St. Joseph entered into a C$250.0 million construction and term loan facility that was converted to a 20-year term loan in May 2011.
Collateral for the St. Joseph facility includes St. Joseph’s tangible assets and contractual rights and cash on deposit with the depository agent. Its loan agreement contains a broad range of covenants that, subject to certain exceptions, restrict St. Joseph’s ability to incur debt, grant liens, sell or lease certain assets, transfer equity interests, dissolve, make distributions and change its business.
Spring Valley
In August 2011, Spring Valley entered into a $178.9 million construction loan facility and a $53.3 million cash grant bridge loan. Spring Valley reached commercial operations on August 16, 2012 and the construction loan was converted to a term loan on November 16, 2012. The cash grant bridge loan was repaid in December 2012 from funds the Company received under a Cash Grant from the U.S. Department of Treasury following the wind project being placed in service. In connection with the term loan, Spring Valley entered into interest rate swaps for the term of the loan to hedge its exposure to variable interest rates following term conversion of the facility.
Collateral for the loan consists of Spring Valley’s tangible assets and contractual rights, and cash on deposit with the depository agent. Its loan agreement contains a broad range of covenants that, subject to certain exceptions, restrict Spring Valley’s ability to incur debt, grant liens, sell or lease assets, transfer equity interests, dissolve, pay distributions and change its business.
Santa Isabel
In October 2011, Santa Isabel entered into a $119.0 million construction loan facility and a $57.5 million cash grant bridge loan facility. On December 5, 2012, Santa Isabel achieved commercial operations under the terms of its PPA. The construction loan converted to a term loan on May 15, 2013 and matures on September 30, 2033. The cash grant bridge loan was repaid from funds the Company received under a Cash Grant in May 2013.
Collateral for the Santa Isabel facility consists of Santa Isabel’s tangible assets and contractual rights, and cash on deposit with the depository agent. Its loan agreement contains a broad range of covenants that, subject to certain exceptions, restrict Santa Isabel’s ability to incur debt, grant liens, sell or lease assets, transfer equity interests, dissolve, pay distributions and change its business.
Ocotillo
In October 2012, Ocotillo entered into a $467.3 million financing agreement comprised of two construction loan facilities totaling $351.5 million, a network upgrade bridge loan facility of $56.6 million and a letter of credit facility of $59.2 million. The two loan facilities consist of a development bank tranche of $110.0 million and a commercial bank tranche of $241.5 million. Ocotillo reached full commercial operations in July 2013, and the two construction loans converted to term loans on September 20, 2013 and mature 20 years and 7 years after the
F-27
Table of Contents
term loan conversion, respectively. The network upgrade bridge loan was repaid in August 2013 from reimbursements received from the utility related to the construction of network upgrade costs. In connection with the financing agreement, the Company entered into interest rate swaps on 90% of the loan commitment. In addition, in September 2013, Ocotillo prepaid $2.2 million of the development bank loan and $5.3 million of the commercial bank loan pursuant to a proposal initiated by Ocotillo and accepted by the lenders. In October 2014, the financing agreement was amended to include a margin rate decrease of 1.0% for the commercial bank tranche.
Collateral under the Ocotillo financing agreement consists of Ocotillo’s tangible assets and contractual rights, and cash on deposit with the depository agent. Its loan agreement contains a broad range of covenants that, subject to certain exceptions, restrict Ocotillo’s ability to incur debt, grant liens, sell or lease assets, transfer equity interests, dissolve, pay distributions and change its business.
El Arrayán
In May 2012, El Arrayán entered into a first lien senior secured credit agreement (“El Arrayán Credit Agreement”) which provides up to approximately $225.0 million in borrowings. Borrowings under the El Arrayán Credit Agreement were used to finance the construction of the El Arrayán wind project and are comprised of a commercial tranche of up to $100.0 million and an export credit agency tranche provided by Eksport Kredit Fonden of Denmark (“EKF Tranche”) of up to $110.0 million, and letter of credit facility in an amount of up to $15.0 million. In connection with the El Arrayán Credit Agreement, the Company entered into interest rate swaps on 95.8% of the commercial tranche term loan. The project commenced commercial operations in June 2014 and the construction loan converted into term loans on August 14, 2014. The financing is non-recourse to El Arrayán.
The commercial tranche loan is a LIBOR loan and accrues interest at LIBOR plus 2.75% per annum from the closing until the sixth anniversary of closing, 3.00% from the sixth anniversary to the tenth anniversary of closing, 3.25% from the tenth anniversary to the fourteenth anniversary of closing, and 3.50% after the fourteenth anniversary of closing. The EKF Tranche term loan accrues interest at a fixed rate of 5.56%, in each case, plus a margin of 0.25% from the sixth anniversary to the tenth anniversary of the closing, 0.50% from the tenth anniversary to the fourteenth anniversary of closing, and 0.75% after the fourteenth anniversary of closing.
El Arrayán—Value Added Tax (VAT) Facility
In addition to the El Arrayán Credit Agreement, in May 2012, El Arrayán entered into a $20.0 million VAT facility with Corpbanca. Under the VAT facility El Arrayán may borrow funds to pay for VAT payments due from the project. The last day to borrow funds under the VAT facility was November 3, 2014. The VAT facility has an interest rate of Chilean Interbank Rate plus 1.00% and terminates in November 2015. El Arrayán is also required to pay a commitment fee on the undrawn portion of the VAT facility. As of December 31, 2014, the outstanding balance on the VAT facility was $2.0 million.
Logan’s Gap
In December 2014, Logan’s Gap entered into a $282.8 million financing agreement comprised of a $247.1 million construction loan and letter of credit facilities to provide letter of credit loans in an amount totaling up to $35.7 million. Under the financing agreement, the scheduled maturity date is December 31, 2015 (which date may be extended to March 31, 2016, subject to certain conditions), at which time the loans will be repaid from capital contributions from equity investors and the letters of credit terminated. Pursuant to a Letter of Credit and Reimbursement Agreement, a commercial bank will then issue a letter of credit up to $15.0 million in favor of the project’s hedge counterparty.
Collateral under the Logan’s Gap financing agreement consists of Logan’s Gap tangible assets and contractual rights, and cash on deposit with the depository agent. The loan agreement contains a broad range of covenants that, subject to certain exceptions, restrict Logan’s Gap’s ability to incur debt, grant liens, sell or lease assets, transfer equity interests, dissolve, pay distributions and change its business.
F-28
Table of Contents
Revolving Credit Facility
On November 15, 2012, the Company entered into a $120.0 million revolving credit agreement (“Existing Credit Agreement”) for working capital with a four-year term comprised of a revolving loan facility and a letter of credit facility. The revolving credit agreement has an “accordion feature” under which the Company has the right to increase available borrowings by up to $35.0 million if its lenders or other additional lenders are willing to lend on the same terms and meet certain other conditions.
Collateral for the revolving credit facility consists of the Company’s membership interests in certain of the Company’s holding company subsidiaries. The revolving credit facility contains a broad range of covenants that, subject to certain exceptions, restrict the Company’s ability to incur debt, grant liens, sell or lease assets, transfer equity interests, dissolve, pay distributions and change its business.
In March 2014, the Company exercised the accordion feature by increasing available borrowings by an additional $25.0 million, resulting in an aggregate facility amount of $145.0 million. Simultaneously, the Ocotillo project was added to the collateral pool that supports the revolving credit facility.
In December 2014, the Company entered into an Amended and Restated Credit and Guaranty Agreement which increased the available borrowings under the Existing Credit Agreement from $145 million to $350.0 million. Simultaneously, the Panhandle 1, Panhandle 2, South Kent and Grand projects were added to the collateral pool that supports the revolving credit facility.
As of December 31, 2014 and 2013, letters of credit of $45.1 million and $44.8 million, respectively, have been issued and loans of $50.0 million and $56.0 were drawn in 2014 and 2013, respectively. As of December 31, 2014, the outstanding balance on the revolving credit facility is $50.0 million. There was no outstanding balance on the revolving credit facility in the prior year.
Loans, when and if drawn, are either base rate loans or Eurodollar rate loans. The base rate loans accrue interest at the fluctuating rate per annum equal to the greatest of the (i) the prime rate, (ii) the federal funds rate plus 0.50% and (iii) the Eurodollar rate that would be in effect for a Eurodollar rate loan with an interest period of one month plus 1.0%, plus an applicable margin ranging from 1.25% to 1.75%. The Eurodollar rate loans accrue interest at a rate per annum equal to LIBOR, plus an applicable margin ranging from 2.25% to 2.75%. Under the facility, the Company is required to pay a revolving commitment fee equal to the average of the daily difference between revolving commitments and the total utilization of revolving commitments times 0.50%. In addition, the Company is required to pay letter of credit fees. The facility is secured by pledges of the capital stock and ownership interests in certain of the Company’s holding company subsidiaries. The revolving credit facility contains a broad range of covenants that, subject to certain exceptions, restrict the Company’s ability to incur debt, grant liens, sell or lease assets, transfer equity interests, dissolve, pay distributions and change its business.
| 9. | Asset Retirement Obligations |
The Company’s asset retirement obligations represent the estimated cost of decommissioning the turbines, removing above-ground installations and restoring the sites at a date that is 20 years from the commencement of commercial operation of the facility.
The following table presents a reconciliation of the beginning and ending aggregate carrying amounts of asset retirement obligations as of December 31, 2014, 2013 and 2012 (in thousands):
| December 31, | ||||||||||||
| 2014 | 2013 | 2012 | ||||||||||
| Beginning asset retirement obligations |
$ | 20,834 | $ | 19,056 | $ | 10,342 | ||||||
| Additions during the year |
7,195 | 767 | 7,971 | |||||||||
| Foreign currency translation adjustment |
(228 | ) | (172 | ) | 59 | |||||||
| Accretion expense |
1,471 | 1,183 | 684 | |||||||||
|
|
|
|
|
|
|
|||||||
| Ending asset retirement obligations |
$ | 29,272 | $ | 20,834 | $ | 19,056 | ||||||
|
|
|
|
|
|
|
|||||||
F-29
Table of Contents
| 10. | Derivative Instruments |
The Company employs a variety of derivative instruments to manage its exposure to fluctuations in interest rates and electricity prices. The following tables present the amounts that are recorded in the Company’s consolidated balance sheets as of December 31, 2014, 2013 and 2012 (in thousands):
Undesignated Derivative Instruments Classified as Assets (Liabilities):
| As of | Year ended | |||||||||||||||||
| Fair Market Value | YTD Gain (Loss) | |||||||||||||||||
| Derivative Type |
Project | Quantity | Maturity Dates |
Current Portion |
Long-Term Portion |
Recognized into Income |
||||||||||||
| December 31, 2014 |
||||||||||||||||||
| Interest rate swaps |
Ocotillo | 6 | 6/30/2030 | $ | (3,403 | ) | $ | 2,523 | $ | (11,339 | ) | |||||||
| Interest rate cap |
Gulf Wind | 1 | 12/31/2024 | — | 352 | (329 | ) | |||||||||||
| Energy derivative |
Gulf Wind | 1 | 4/30/2019 | 18,506 | 45,969 | (3,878 | ) | |||||||||||
|
|
|
|
|
|
|
|||||||||||||
| $ | 15,103 | $ | 48,844 | $ | (15,546 | ) | ||||||||||||
|
|
|
|
|
|
|
|||||||||||||
| December 31, 2013 |
||||||||||||||||||
| Interest rate swaps |
Ocotillo | 6 | 6/30/2030 | $ | (3,899 | ) | $ | 14,358 | $ | 15,367 | ||||||||
| Interest rate cap |
Gulf Wind | 1 | 12/31/2024 | — | 681 | 234 | ||||||||||||
| Energy derivative |
Gulf Wind | 1 | 4/30/2019 | 13,937 | 54,416 | (11,272 | ) | |||||||||||
|
|
|
|
|
|
|
|||||||||||||
| $ | 10,038 | $ | 69,455 | $ | 4,329 | |||||||||||||
|
|
|
|
|
|
|
|||||||||||||
| December 31, 2012 |
||||||||||||||||||
| Interest rate swaps |
Ocotillo | 6 | 6/30/2030 | $ | (1,980 | ) | $ | (2,931 | ) | $ | (4,909 | ) | ||||||
| Interest rate cap |
Gulf Wind | 1 | 12/31/2024 | — | 447 | (44 | ) | |||||||||||
| Energy derivative |
Gulf Wind | 1 | 4/30/2019 | 17,177 | 62,448 | (6,951 | ) | |||||||||||
|
|
|
|
|
|
|
|||||||||||||
| $ | 15,197 | $ | 59,964 | $ | (11,904 | ) | ||||||||||||
|
|
|
|
|
|
|
|||||||||||||
| Designated Derivative Instruments Classified as Assets (Liabilities): | ||||||||||||||||||
| As of | Year ended | |||||||||||||||||
| Fair Market Value | YTD Gain (Loss) | |||||||||||||||||
| Derivative Type |
Project | Quantity | Maturity Dates |
Current Portion |
Long-Term Portion |
Recognized in OCI |
||||||||||||
| December 31, 2014 |
||||||||||||||||||
| Interest rate swaps |
Ocotillo | 6 | 6/30/2033 | $ | (1,917 | ) | $ | 525 | $ | (8,912 | ) | |||||||
| Interest rate swaps |
El Arrayan | 3 | 3/31/2032 | (1,822 | ) | (3,338 | ) | (1,983 | ) | |||||||||
| Interest rate swaps |
Gulf Wind | 7 | 3/15/2020 | (4,719 | ) | (6,915 | ) | 1,094 | ||||||||||
| Interest rate swaps |
Spring Valley | 2 | 6/28/2030 | (4,446 | ) | (7,214 | ) | (9,869 | ) | |||||||||
|
|
|
|
|
|
|
|||||||||||||
| $ | (12,904 | ) | $ | (16,942 | ) | $ | (19,670 | ) | ||||||||||
|
|
|
|
|
|
|
|||||||||||||
| December 31, 2013 |
||||||||||||||||||
| Interest rate swaps |
Ocotillo | 6 | 6/30/2033 | $ | (2,105 | ) | $ | 9,625 | $ | 10,434 | ||||||||
| Interest rate swaps |
Gulf Wind | 7 | 3/15/2020 | (5,289 | ) | (7,439 | ) | 9,398 | ||||||||||
| Interest rate swaps |
Spring Valley | 2 | 6/28/2030 | (4,878 | ) | 3,087 | 17,043 | |||||||||||
|
|
|
|
|
|
|
|||||||||||||
| $ | (12,272 | ) | $ | 5,273 | $ | 36,875 | ||||||||||||
|
|
|
|
|
|
|
|||||||||||||
| December 31, 2012 |
||||||||||||||||||
| Interest rate swaps |
Ocotillo | 6 | 6/30/2033 | $ | (952 | ) | $ | (1,962 | ) | $ | (2,914 | ) | ||||||
| Interest rate swaps |
Gulf Wind | 7 | 3/15/2020 | (5,558 | ) | (16,568 | ) | (1,835 | ) | |||||||||
| Interest rate swaps |
Spring Valley | 2 | 6/28/2030 | (4,972 | ) | (13,865 | ) | (6,421 | ) | |||||||||
|
|
|
|
|
|
|
|||||||||||||
| $ | (11,482 | ) | $ | (32,395 | ) | $ | (11,170 | ) | ||||||||||
|
|
|
|
|
|
|
|||||||||||||
F-30
Table of Contents
Gulf Wind
In 2010, Gulf Wind entered into interest rate swaps with each of its lenders to manage exposure to interest rate risk on its long-term debt. The interest rate swaps exchange variable interest rate payments for fixed interest rate payments that were approximately 6.6% for the years ended December 31, 2014, 2013 and 2012. The fixed interest rate is set at 6.6% for years two through eight and 7.1% and 7.6% for the last two years of the loan term, respectively. The interest rate swaps qualify for hedge accounting and were designated as cash flow hedges. No ineffectiveness was recorded for the years ended December 31, 2014, 2013 and 2012. The Company reclassified $5.5 million, $5.7 million and $5.7 million related to cash settlements into earnings from accumulated other comprehensive loss during the years ended December 31, 2014, 2013 and 2012, respectively.
In 2010, Gulf Wind also entered into an interest rate cap to manage exposure to future interest rates when its long-term debt is expected to be refinanced at the end of the ten-year term. The cap protects the Company if future interest rates exceed approximately 6.0%. The cap has an effective date of March 31, 2020, terminates on December 31, 2024, and has a notional amount of $42.1 million which reduced quarterly during its term. The cap is a derivative but does not qualify for hedge accounting and has not been designated. The Company recognized unrealized (losses) gains of ($0.3) million, $0.2 million and $0 for the years ended December 31, 2014, 2013 and 2012, respectively, in unrealized (loss) gain on derivatives in the consolidated statements of operations. The derivative instrument’s asset value as of December 31, 2014, 2013 and 2012, was approximately $0.4 million, $0.7 million and $0.4 million, respectively.
In 2010, Gulf Wind acquired an energy derivative instrument to manage its exposure to variable electricity prices. The energy price swap fixes the price of approximately 58% of its electricity generation through April 2019. The energy derivative instrument is a derivative but did not meet the criteria required to adopt hedge accounting. The energy derivative instrument’s fair value as of December 31, 2014, 2013 and 2012 was $64.5 million, $68.4 million and $79.6 million, respectively. Gulf Wind recognized unrealized losses of $3.9 million, $11.3 million, and $7.0 million for the years ended December 31, 2014, 2013 and 2012, respectively, reported in unrealized loss on energy derivative in the consolidated statements of operations.
Spring Valley
In 2011, Spring Valley entered into interest rate swaps with its lenders to manage exposure to interest rate risk on its long-term debt. The interest rate swaps exchange variable interest rate payments for fixed interest rate payments of approximately 5.5% for the first four years of its term debt and increases by 0.25% every four years, thereafter. The interest rate swaps qualified for hedge accounting and were designated as cash flow hedges. No ineffectiveness was recorded for the years ended December 31, 2014, 2013 and 2012. The Company reclassified $5.0 million, $5.1 million and $0 related to cash settlements into earnings from accumulated other comprehensive loss during the years ended December 31, 2014, 2013 and 2012, respectively.
Ocotillo
In October 2012, Ocotillo entered into interest rate swaps with its lenders to manage exposure to interest rate risk on its long-term debt. The interest rate swaps exchange variable interest rate payments for fixed interest rate payments of approximately 2.5% and 2.2% for the development bank term loans and the commercial bank term loans, respectively. The interest rate swaps for the development bank loans qualify for hedge accounting and were designated as cash flow hedges. No ineffectiveness was recorded for the years ended December 31, 2014, 2013 and 2012. The Company reclassified $2.2 million, $1.1 million and $0 into earnings from accumulated other comprehensive (loss) income, for the years ended December 31, 2014, 2013 and 2012, respectively, as quarterly hedge payments occur. The interest rate swaps for the commercial bank loans are undesignated derivatives that are used to mitigate exposure to variable interest rate debt. The Company recognized unrealized
F-31
Table of Contents
(losses) gains of ($11.3) million, $15.4 million and ($4.9) million for the years ended December 31, 2014, 2013 and 2012, respectively, in unrealized (loss) gain on derivatives in the consolidated statements of operations.
El Arrayán
In May 2012, El Arrayán entered into three interest rate swap agreements with its lenders to manage exposure to interest rate risk on its long term debt. The interest rate swaps exchange variable interest rate payments for fixed interest rate payments of approximately 3.4% for the first two years of its term debt and subsequently increased to 5.8%, and increases by 0.25% on every fourth anniversary of the closing date, thereafter. The interest rate swaps qualify for hedge accounting and were designated as cash flow hedges. No ineffectiveness was recorded for the year ended December 31, 2014. The Company reclassified $1.1 million, $0, and $0 related to cash settlements into earnings from accumulated other comprehensive loss, net of tax impact of $0.4 million, $0, and $0 during the years ended December 31, 2014, 2013 and 2012, respectively.
| 11. | Accumulated Other Comprehensive (Loss) Income |
The following table summarizes changes in the accumulated other comprehensive (loss) income balance by component:
| Effective Portion of | Proportionate | |||||||||||||||
| Foreign | Change in Fair Value | Share of Equity | ||||||||||||||
| Currency | of Derivatives | Investee’s OCI | Total | |||||||||||||
| Balances at January 1, 2012 |
$ | (2,903 | ) | $ | (32,707 | ) | $ | — | $ | (35,610 | ) | |||||
| Net current period other comprehensive income (loss) |
2,749 | (11,170 | ) | (1,475 | ) | (9,896 | ) | |||||||||
|
|
|
|
|
|
|
|
|
|||||||||
| Balances at December 31, 2012 |
(154 | ) | (43,877 | ) | (1,475 | ) | (45,506 | ) | ||||||||
| Net current period other comprehensive (loss) income |
(8,309 | ) | 36,875 | 2,473 | 31,039 | |||||||||||
| Grand acquisition |
— | — | (2,910 | ) | (2,910 | ) | ||||||||||
|
|
|
|
|
|
|
|
|
|||||||||
| Balances at December 31, 2013 |
(8,463 | ) | (7,002 | ) | (1,912 | ) | (17,377 | ) | ||||||||
| Net current period other comprehensive (loss) income |
(10,875 | ) | (19,670 | ) | (5,991 | ) | (36,536 | ) | ||||||||
|
|
|
|
|
|
|
|
|
|||||||||
| Balances at December 31, 2014 |
$ | (19,338 | ) | $ | (26,672 | ) | $ | (7,903 | ) | $ | (53,913 | ) | ||||
|
|
|
|
|
|
|
|
|
|||||||||
| 12. | Fair Value Measurements |
The Company’s fair value measurements incorporate various factors, including the credit standing and performance risk of the counterparties, the applicable exit market, and specific risks inherent in the instrument. Nonperformance and credit risk adjustments on risk management instruments are based on current market inputs when available, such as credit default hedge spreads. When such information is not available, internal models may be used.
Assets and liabilities recorded at fair value in the consolidated financial statements are categorized based upon the level of judgment associated with the inputs used to measure their fair value. Hierarchical levels directly related to the amount of subjectivity associated with the inputs to valuation of these assets or liabilities are as follows:
Level 1—Inputs are unadjusted, quoted prices in active markets for identical assets or liabilities at the measurement date.
Level 2—Inputs (other than quoted prices included in Level 1) are either directly or indirectly observable for the asset or liability through correlation with market data at the measurement date and for the duration of the instrument’s anticipated life.
F-32
Table of Contents
Level 3—Unobservable inputs that are supported by little or no market activity and that are significant to the fair value of the assets or liabilities and which reflect management’s best estimate of what market participants would use in pricing the asset or liability at the measurement date. Consideration is given to the risk inherent in the valuations technique and the risk inherent in the inputs to the model.
Short-term Financial Instruments
Short-term financial instruments consist principally of cash, cash equivalents, accounts receivable, accounts payable, other accrued liabilities and contingent liabilities. Based on the nature and short maturity of these instruments their fair value is approximated using carrying cost and they are presented in the Company’s financial statements at carrying cost. The fair values of cash, cash equivalents and restricted cash are classified as Level 1 in the fair value hierarchy. The fair values of accounts receivable, accounts payable, other accrued liabilities and contingent liabilities are classified as Level 2 in the fair value hierarchy.
Financial Instruments Measured at Fair Value on a Recurring Basis
The Company’s financial assets and (liabilities) which require fair value measurement on a recurring basis are classified within the fair value hierarchy as follows (in thousands):
| Fair Value | ||||||||||||||||
| Level 1 | Level 2 | Level 3 | Total | |||||||||||||
| December 31, 2014 |
||||||||||||||||
| Interest rate swaps |
$ | — | $ | (30,726 | ) | $ | — | $ | (30,726 | ) | ||||||
| Interest rate cap |
— | 352 | — | 352 | ||||||||||||
| Energy derivative |
— | — | 64,475 | 64,475 | ||||||||||||
|
|
|
|
|
|
|
|
|
|||||||||
| $ | — | $ | (30,374 | ) | $ | 64,475 | $ | 34,101 | ||||||||
|
|
|
|
|
|
|
|
|
|||||||||
| December 31, 2013 |
||||||||||||||||
| Interest rate swaps |
$ | — | $ | 3,460 | $ | — | $ | 3,460 | ||||||||
| Interest rate cap |
— | 681 | — | 681 | ||||||||||||
| Energy derivative |
— | — | 68,353 | 68,353 | ||||||||||||
|
|
|
|
|
|
|
|
|
|||||||||
| $ | — | $ | 4,141 | $ | 68,353 | $ | 72,494 | |||||||||
|
|
|
|
|
|
|
|
|
|||||||||
Level 2 Inputs
Derivative instruments subject to re-measurement are presented in the financial statements at fair value. The interest rate swaps and interest rate cap were valued by discounting the net cash flows using the forward LIBOR curve with the valuations adjusted by the Company’s credit default hedge rate. There were no transfers between Level 1 and Level 2 during the periods presented.
Level 3 Inputs
The fair value of the contingent liabilities is based upon the time of realization and the probability of the contingent event. An unobservable discount rate of 7% is used to determine the present value of the contractual liabilities and an unobservable probability factor of 75% was assigned to the contingent event prior to realization after considering contract terms, land rights, interconnect network, and environmental permits. The significant primary unobservable input used for contingent liabilities is the probability factor. Significant increases or decreases in this unobservable input would result in a significantly lower or higher fair value measurement.
F-33
Table of Contents
The energy derivative instrument was valued by discounting the projected net cash flows over the remaining life of the derivative instrument using forward energy curves adjusted by a nonperformance risk factor. The significant unobservable input in calculating the fair value of the energy derivative instrument is forward electricity prices, which are derived from and impacted by changes in forward natural gas prices. Significant increases or decreases in this unobservable input would result in a significantly lower or higher fair value measurement.
The following table presents a reconciliation of contingent liabilities and the energy derivative contract measured at fair value, in thousands, on a recurring basis using significant unobservable inputs for the years ended December 31, 2014, 2013 and 2012, respectively. There were no transfers between Level 2 and Level 3 during the periods presented.
| Contingent Liabilities |
Energy Derivative |
Total | ||||||||||
| Balance at December 31, 2011 |
$ | (5,986 | ) | $ | 86,577 | $ | 80,591 | |||||
| Settlements |
— | (19,644 | ) | (19,644 | ) | |||||||
| Change in fair value, net of settlements |
(2,015 | ) | 12,692 | 10,677 | ||||||||
|
|
|
|
|
|
|
|||||||
| Balances at December 31, 2012 |
(8,001 | ) | 79,625 | 71,624 | ||||||||
| Settlements |
8,001 | (16,798 | ) | (8,797 | ) | |||||||
| Change in fair value, net of settlements |
— | 5,526 | 5,526 | |||||||||
|
|
|
|
|
|
|
|||||||
| Balances at December 31, 2013 |
— | 68,353 | 68,353 | |||||||||
| Settlements |
— | (13,524 | ) | (13,524 | ) | |||||||
| Change in fair value, net of settlements |
— | 9,646 | 9,646 | |||||||||
|
|
|
|
|
|
|
|||||||
| Balances at December 31, 2014 |
$ | — | $ | 64,475 | $ | 64,475 | ||||||
|
|
|
|
|
|
|
|||||||
During the years ended December 31, 2014, 2013 and 2012, the Company recognized unrealized losses on energy derivative of $3.9 million, $11.3 million, and $7.0 million, respectively.
Financial Instruments not Measured at Fair Value
The following table presents the carrying amount and fair value, in thousands, and the fair value hierarchy of the Company’s financial liabilities that are not measured at fair value in the consolidated balance sheets as of December 31, 2014 and 2013, but for which fair value is disclosed.
| As reflected on the balance sheet |
Fair Value | |||||||||||||||||||
| Level 1 | Level 2 | Level 3 | Total | |||||||||||||||||
| December 31, 2014 |
||||||||||||||||||||
| Long-term debt, including current portion |
$ | 1,450,613 | $ | — | $ | 1,416,744 | $ | — | $ | 1,416,744 | ||||||||||
|
|
|
|
|
|
|
|
|
|
|
|||||||||||
| December 31, 2013 |
||||||||||||||||||||
| Long-term debt, including current portion |
$ | 1,249,218 | $ | — | $ | 1,165,119 | $ | — | $ | 1,165,119 | ||||||||||
|
|
|
|
|
|
|
|
|
|
|
|||||||||||
Long term debt is presented on the consolidated balance sheet at amortized cost. The fair value of variable interest rate long-term debt is approximated by its carrying cost. The fair value of fixed interest rate long-term debt is estimated based on observable market prices or parameters or derived from such prices or parameters. Where observable prices or inputs are not available, valuation models are applied, using the net present value of cash flow streams over the term using estimated market rates for similar instruments and remaining terms.
F-34
Table of Contents
| 13. | Income Taxes |
The following table presents significant components of the provision for income taxes (in thousands):
| Year ended December 31, | ||||||||||||
| 2014 | 2013 | 2012 | ||||||||||
| Current: |
||||||||||||
| Federal |
$ | — | $ | — | $ | — | ||||||
| State |
— | — | — | |||||||||
| Foreign |
182 | — | — | |||||||||
|
|
|
|
|
|
|
|||||||
| Total current expense (benefit) |
182 | — | — | |||||||||
| Deferred: |
||||||||||||
| Federal |
— | 2,961 | — | |||||||||
| State |
— | — | — | |||||||||
| Foreign |
2,954 | 1,585 | (3,604 | ) | ||||||||
|
|
|
|
|
|
|
|||||||
| Total deferred expense (benefit) |
2,954 | 4,546 | (3,604 | ) | ||||||||
|
|
|
|
|
|
|
|||||||
| Total provision for income taxes |
$ | 3,136 | $ | 4,546 | $ | (3,604 | ) | |||||
|
|
|
|
|
|
|
|||||||
The following table presents the domestic and foreign components of net income (loss) before income tax (benefit) expense (in thousands):
| Year ended December 31, | ||||||||||||
| 2014 | 2013 | 2012 | ||||||||||
| U.S. |
$ | (34,788 | ) | $ | 4,022 | $ | (17,810 | ) | ||||
| Foreign |
(2,075 | ) | 10,596 | 830 | ||||||||
|
|
|
|
|
|
|
|||||||
| Total |
$ | (36,863 | ) | $ | 14,618 | $ | (16,980 | ) | ||||
|
|
|
|
|
|
|
|||||||
The following table presents a reconciliation of the statutory U.S. federal income tax rate to the Company’s effective tax rate, as a percentage of income before taxes for the years ended December 31, 2014, 2013 and 2012:
| Year ended December 31, |
||||||||||||
| 2014 | 2013 | 2012 | ||||||||||
| Computed tax at statutory rate |
35.0 | % | 35.0 | % | 35.0 | % | ||||||
| Book/tax basis difference |
— | — | 27.2 | % | ||||||||
| Partnership income not subject to taxes |
— | — | (40.9 | %) | ||||||||
| Adjustment for income in non-taxable entities allocable to noncontrolling interest |
(7.6 | %) | 16.5 | % | — | |||||||
| Foreign rate differential |
— | — | — | |||||||||
| Tax rate differential on pre-tax book income, other |
5.6 | % | 2.1 | % | — | |||||||
| Local tax on branch profits/(losses)—Puerto Rico |
1.6 | % | 13.1 | % | — | |||||||
| Permanent book/tax differences (domestic only) |
(0.1 | %) | (2.2 | %) | — | |||||||
| Valuation Allowance |
(33.4 | %) | 187.2 | % | — | |||||||
| Deferred tax liability on Chilean shareholder liability due to tax regime change |
(3.6 | %) | — | — | ||||||||
| Change in tax rate due to change in Chilean tax regime |
(6.2 | %) | — | — | ||||||||
| Other |
0.1 | % | 3.1 | % | — | |||||||
| ARRA Section 1603 grant-basis reduction deferred tax assets |
— | (223.7 | %) | — | ||||||||
|
|
|
|
|
|
|
|||||||
| Effective income tax rate |
(8.6 | %) | 31.1 | % | 21.3 | % | ||||||
|
|
|
|
|
|
|
|||||||
F-35
Table of Contents
The following table presents significant components of the Company’s deferred tax assets and deferred tax liabilities as of December 31, 2014 and 2013 (in thousands):
| Year ended December 31, | ||||||||||||
| 2014 | 2013 | 2012 | ||||||||||
| Deferred tax assets/(liabilities)—current: |
||||||||||||
| Accruals, prepaids and other current deferred tax assets and liabilities |
$ | (344 | ) | $ | 2,399 | $ | — | |||||
| Basis difference in derivatives |
4,779 | 2,835 | — | |||||||||
|
|
|
|
|
|
|
|||||||
| Total gross deferred tax assets/(liabilities) |
4,435 | 5,234 | — | |||||||||
| Less: valuation allowance |
(4,266 | ) | (4,661 | ) | — | |||||||
|
|
|
|
|
|
|
|||||||
| Total net deferred tax assets/(liabilities)—current |
$ | 169 | $ | 573 | $ | — | ||||||
|
|
|
|
|
|
|
|||||||
| Deferred tax assets/(liabilities)—non-current: |
||||||||||||
| Property, plant and equipment |
$ | (104,767 | ) | $ | (36,548 | ) | $ | (47,894 | ) | |||
| Basis difference in foreign subsidiaries |
37,626 | 40,097 | — | |||||||||
| Partnership interest |
994 | (4,917 | ) | — | ||||||||
| Lease Hatchet Ridge |
28,044 | 29,314 | — | |||||||||
| Asset retirement obligation |
5,216 | 4,649 | — | |||||||||
| Equity method |
— | 3,794 | — | |||||||||
| Unrealized loss on derivatives |
— | (5,830 | ) | — | ||||||||
| Other temp differences |
256 | — | ||||||||||
| Net operating loss carryforwards |
130,248 | 61,441 | 45,302 | |||||||||
| Other non current deferred tax assets and liabilities |
(5,081 | ) | (4,595 | ) | (690 | ) | ||||||
| Change in tax status |
— | — | 4,599 | |||||||||
| Accruals not currently deductible |
— | — | 443 | |||||||||
|
|
|
|
|
|
|
|||||||
| Total gross deferred tax assets/(liabilities)—non-current |
92,536 | 87,405 | 1,760 | |||||||||
| Less: valuation allowance |
(107,480 | ) | (95,318 | ) | (482 | ) | ||||||
|
|
|
|
|
|
|
|||||||
| Total net deferred tax assets/(liabilities)—non-current |
$ | (14,944 | ) | $ | (7,913 | ) | $ | 1,278 | ||||
|
|
|
|
|
|
|
|||||||
| Total net deferred tax assets/(liabilities) |
$ | (14,775 | ) | $ | (7,340 | ) | $ | 1,278 | ||||
|
|
|
|
|
|
|
|||||||
The deferred tax assets and deferred tax liabilities resulted primarily from temporary differences between book and tax basis of assets and liabilities. The Company regularly assesses the likelihood that future taxable income levels will be sufficient to ultimately realize the tax benefits of the deferred tax assets. Should the Company determine that future realization of the tax benefits is not more likely than not, additional valuation allowance would be established which would increase the Company’s tax provision in the period of such determination. The net deferred tax assets and net deferred tax liabilities as of December 31, 2014 and 2013 are attributed primarily to the Company’s Canadian, Puerto Rican and Chilean entities. The net change in valuation allowance increased by $11.8 million and $99.5 million during the years ended December 31, 2014 and December 31, 2013, respectively.
As of December 31, 2014, the Company had U.S federal and state net operating loss carryforwards in the amount of $225.6 million and $25.5 million, respectively. These net operating loss carryforwards are available to reduce future taxable income and will begin to expire commencing in 2032 for federal and state purposes.
Internal Revenue Code Section 382 places a limitation ( the “Section 382 Limitation”) on the amount of taxable income that can be offset by net operating loss (“NOL”) and credit carryforwards, as well as built-in loss items,
F-36
Table of Contents
after a change in control (generally greater than 50% change in ownership) of a loss corporation. California has similar rules. The Company did not have any historic U.S. net operating losses prior to October 2, 2013 except for net operating losses from its Puerto Rico entity which may be subject to Section 382 limitation.
The Company experienced a change in ownership on May 14, 2014. As a result, the Company’s NOL carryforwards and credits generated through the date of change are subject to an annual limitation under Section 382. Accordingly, if the Company generates sufficient taxable income, the NOL carryforwards or credits prior to the change in ownership are not expected to expire unutilized due to the Section 382 Limitation as of May 14, 2014.
The Company is required to recognize in the financial statements the impact of a tax position, if that position is more likely than not of being sustained on audit, based on the technical merits of the position. As of December 31, 2014, the Company does not have any unrecognized tax benefits and does not have any tax positions for which it is reasonably possible that the amount of gross unrecognized tax benefits will increase or decrease within 12 months after the year ended December 31, 2014.
The Company files income tax returns in the U.S. federal jurisdiction, various state jurisdictions and foreign jurisdictions for its Canadian, Chilean and Puerto Rican operations. The Company’s U.S. and foreign income tax returns for 2010 and forward are subject to examination.
The Company has a policy to classify accrued interest and penalties associated with uncertain tax positions together with the related liability, and the expenses incurred related to such accruals are included in the provision for income taxes. The Company did not incur any interest expense or penalties associated with unrecognized tax benefits for the years ended December 31, 2014, 2013 and 2012.
The Company has not established deferred income taxes with respect to $7.6 million of undistributed earnings of its Chilean subsidiary, since any U.S. income tax liability would be offset in whole by allowable tax credits deriving from income taxes paid to that foreign jurisdiction.
The Company operates under a tax holiday in Puerto Rico which enacted a special tax rate of 4% for business dedicated to the production of energy for consumption through the use of renewal sources. Act No. 73 of 2008, as amended, known as the “Economic Incentives for the Development of Puerto Rico Act” (the “Act”), promotes the development of green energy projects through economic incentives to reduce the island’s dependency on oil. The Act provides for a 4% flat income tax rate on green energy income (“GEI”) in lieu of any income tax imposed by the Puerto Rico Code for a 15 year period and is scheduled to terminate on December 31, 2026. The impact of the tax holiday decreased foreign deferred tax expense by $2.1 million for 2014. The impact of the tax holiday on net income per share of Class A common stock- basic and diluted and Class B common stock- basic and diluted were $0.0502 and $0.1368, respectively.
| 14. | Stockholders’ Equity |
Common Stock
Below is a summary of the rights and preferences of the Company’s Class A and Class B common stock as of December 31, 2014 and 2013. The Company’s Class B common stock converted on a one-to-one basis into Class A common stock on December 31, 2014.
Voting Rights
Holders of the Company’s Class A common stock and Class B common stock are entitled to one vote per share on all matters submitted to a vote of stockholders and will vote as a single class under all circumstances, unless otherwise required by law. Shares held by Pattern Development are entitled to certain approval rights if Pattern Development beneficially owns not less than thirty-three and one-third percent of the Company’s outstanding common stock, pursuant to the Shareholder Approval Rights Agreement between the Company and Pattern Development dated October 2, 2013.
F-37
Table of Contents
Dividend Rights
Holders of Class A common stock are eligible to receive dividends on common stock held when funds are available and as approved by the Board of Directors. The Class B common stock converted after the determination of holders of record of Class A common stock, following the close of trading on December 31, 2014. On October 29, 2014, the Company declared its fourth quarter 2014 dividend, payable on January 30, 2015, to holders of record on December 31, 2014, in the amount of $0.335 per Class A common stock, which represents $1.34 on an annualized basis.
Liquidation Rights
In the event of any liquidation, dissolution or winding-up of the Company, holders of Class A common stock will be entitled to share ratably in the Company’s assets that remain after payment or provision for payment of all of its debts and obligations and after liquidation payments to holders of outstanding shares of preferred stock, if any.
Preferred Stock
The Company has 100,000,000 shares of authorized preferred stock issuable in one or more series. The Company’s Board of Directors is authorized to determine the designation, powers, preferences and relative, participating, optional or other special rights of any such series. As of December 31, 2014 and 2013, there was no preferred stock issued and outstanding.
Conversion
Upon the later of December 31, 2014 and the date on which its South Kent project achieves commercial operations (“Conversion Event”), all of the outstanding Class B common stock automatically convert, on a one-for-one basis, into Class A shares. There are no other conversion rights attached to Class B common stock. The Company’s South Kent project achieved commercial operations on March 28, 2014 and as a result, the Company’s Class B common stock converted into Class A common stock on December 31, 2014.
Class B Common Stock—Beneficial Conversion Feature
The contingency on the conversion of the Class B common stock was removed when the South Kent project achieved commercial operations on March 28, 2014. The removal of this contingency resulted in the recognition of a beneficial conversion feature in the Company’s additional paid-in capital account. The beneficial conversion feature represents the intrinsic value of the conversion feature, which is measured as the difference between the fair value of Class B common stock and the fair value of Class A common stock, into which the Class B common stock is convertible, as of October 2, 2013, which is the date of the Company’s initial public offering. The beneficial conversion feature is accreted on a straight-line basis from March 28, 2014 through December 31, 2014 into the Company’s additional paid-in capital account in the consolidated statements of stockholders’ equity, as there are no available retained earnings.
Noncontrolling Interests
The following table presents the noncontrolling interest balances, reported in stockholders’ equity in the consolidated balance sheets by project as of December 31, 2014 and 2013 (in thousands):
| Noncontrolling Ownership Percentage | ||||||||||||||||
| December 31, | December 31, | |||||||||||||||
| 2014 | 2013 | 2014 | 2013 | |||||||||||||
| Gulf Wind |
$ | 97,061 | $ | 99,794 | 60 | % | 60 | % | ||||||||
| El Arrayán |
35,624 | — | 30 | % | N/A | |||||||||||
| Panhandle 1 |
205,333 | — | 21 | % | N/A | |||||||||||
| Panhandle 2 |
192,568 | — | 19 | % | N/A | |||||||||||
|
|
|
|
|
|||||||||||||
| Noncontrolling interest |
$ | 530,586 | $ | 99,794 | ||||||||||||
|
|
|
|
|
|||||||||||||
F-38
Table of Contents
| 15. | Equity Incentive Award Plan |
In September 2013, the Company adopted the 2013 Equity Incentive Award Plan (“2013 Plan”), which permits the Company to issue 3,000,000 aggregate number of Class A common shares for equity awards including incentive and nonqualified stock options, restricted stock awards (“RSAs”) and restricted stock units to employees, directors and consultants. RSAs provide the holder with immediate voting rights, but are restricted in all other respects until released. Upon cessation of services to the Company, any unreleased RSAs will be cancelled. All unreleased RSAs accrue dividends and distributions, and are paid in cash upon release. During 2014, the Company granted 161,757 RSAs to certain employees and 16,332 RSAs to certain directors. As of December 31, 2014, 2,292,642 aggregate number of Class A shares were available for issuance under the 2013 Plan.
Stock-Based Compensation
The Company accounts for stock-based compensation related to stock options granted to employees by estimating the fair value of the stock-based awards using the Black-Scholes option-pricing model. The fair value of the stock options granted is amortized over the applicable vesting period. The Black-Scholes option pricing model includes assumptions regarding dividend yields, expected volatility, expected option term, expected forfeiture rate and risk-free interest rates. The Company estimates expected volatility based on the historical volatility of comparable publicly traded companies for a period that is equal to the expected term of the options. The risk-free interest rate is based on the U.S. treasury yield curve in effect at the time of grant for a period commensurate with the estimated expected life. The expected term of options granted is derived using the “simplified” method as allowed under the provisions of the ASC 718, Compensation—Stock Compensation, due to insufficient historical exercise history data to provide a reasonable basis upon which to estimate expected term due to the limited period of time its equity shares have been publicly traded. As such, expected term of options represents the period of time that options granted are expected to be outstanding.
The stock-based compensation expense related to stock options and RSAs is recorded as a component of general and administrative expenses in the Company’s consolidated statements of operations and totaled $4.1 million and $0.5 million for the years ended December 31, 2014 and 2013, respectively.
Stock Options
For the years ended December 31, 2014 and 2013, the fair value of employee stock options was estimated using the Black-Scholes option pricing model. The following weighted average assumptions were used:
| Year ended December 31, | ||||||||
| 2014 | 2013 | |||||||
| Stock options: |
||||||||
| Risk-free interest rate |
1.68 | % | 1.68 | % | ||||
| Expected life (in years) |
5.8 | 5.8 | ||||||
| Expected volatility |
36 | % | 36 | % | ||||
| Expected dividend yield |
5.7 | 5.7 | ||||||
The following table summarizes stock option activity under the 2013 Plan for the year ended December 31, 2014:
| Weighted Average | ||||||||||||||||
| Remaining | ||||||||||||||||
| Number of Options | Weighted Average | Contractual Life | Aggregate | |||||||||||||
| Outstanding | Exercise Price | (in years) | Instrinsic Value | |||||||||||||
| Outstanding at December 31, 2013 |
444,823 | $ | 22.00 | |||||||||||||
| Exercised |
(14,861 | ) | 22.00 | $ | 108,191 | |||||||||||
|
|
|
|
|
|||||||||||||
| Outstanding at December 31, 2014 |
429,962 | $ | 22.00 | 8.8 | $ | 1,143,699 | ||||||||||
|
|
|
|
|
|||||||||||||
| Exercisable at December 31, 2014 |
170,434 | $ | 22.00 | 8.8 | $ | 453,354 | ||||||||||
|
|
|
|
|
|||||||||||||
| Vested and expected to vest as of December 31, 2014 |
429,962 | $ | 22.00 | 8.8 | $ | 1,143,699 | ||||||||||
|
|
|
|
|
|||||||||||||
F-39
Table of Contents
The aggregate intrinsic value of options exercised was $0.1 million and $0 for the years ended December 31, 2014 and 2013. Intrinsic value is defined as the amount by which the fair value of the underlying stock exceeds the exercise price at the time of option exercise. The total cash received from employees as a result of employee stock option exercises during fiscal year 2014 was $0.3 million. No employee stock options were exercised during the year ended December 31, 2013.
As of December 31, 2014 the total unrecorded stock-based compensation expense for unvested stock options shares was $1.1 million, which is expected to be amortized over a weighted-average period of 1.8 years.
Restricted Stock Awards
The Company measures the fair value of RSAs at the grant date and accounts for stock-based compensation by amortizing the fair value on a straight line basis over the related vesting period.
The following table summarizes restricted stock awards activity under the 2013 Plan for the year ended December 31, 2014:
| Weighted Average | Aggregate | |||||||||||
| Number of RSAs | Grant Date | Intrinsic | ||||||||||
| Outstanding | Fair Value | Value | ||||||||||
| Balance at December 31, 2013 |
76,262 | 22.53 | ||||||||||
| Granted |
178,089 | 27.54 | ||||||||||
| Released |
(81,914 | ) | 26.64 | |||||||||
| Forfeited |
(2,174 | ) | 27.03 | |||||||||
| Repurchased for employee tax withholding |
(24,531 | ) | 26.44 | |||||||||
|
|
|
|||||||||||
| Balance at December 31, 2014 |
145,732 | $ | 25.62 | $ | 3,593,751 | |||||||
|
|
|
|||||||||||
For the years ended December 31, 2014 and 2013, the total fair value of restricted stock awards released was $2.9 million and $0.2 million, based on the weighted average grant date fair values of $26.64 and $24.15 for the years ended December 31, 2014 and 2013, respectively.
As of December 31, 2014, the total unrecorded stock-based compensation expense for unreleased restricted stock awards was $3.1 million, which is expected to be amortized over a weighted-average period of 1.8 years.
Restricted Stock Awards that contain Performance Conditions
During the year ended December 31, 2014, the Company recorded compensation expense of $0.6 million related to restricted stock awards, granted in March 2014, that will be released to senior management personnel once performance conditions have been met. These awards include 27,717 shares of restricted stock, with a weighted average grant date fair value of $27.03 that will be released if the Company reaches its cash available for distribution target as of December 31, 2014. On December 31, 2014, the performance condition was met.
As of December 31, 2014, there were no unvested restricted stock awards that contain performance conditions.
| 16. | Earnings Per Share |
The Company computes earnings (loss) per share (“EPS”) for Class A and Class B common stock using the two-class method. The Company computes diluted EPS for Class A and Class B common stock using either the two-class method or the if-converted method, whichever is more dilutive. Class B common stock was converted to Class A common stock on a one-to-one basis on December 31, 2014. The computation of diluted EPS of Class A common stock included the impact of the conversion of the Class B common stock, if dilutive for Class A common stock, using the two class method or the if-converted method, whichever was more dilutive. The rights, including voting and liquidation rights, of the holders of the Class A and Class B common stock were identical, except with respect to dividends, as the Class B common stock were not entitled to dividends.
F-40
Table of Contents
Basic EPS is computed for each class of common stock by allocating net income attributable to controlling interest to Class A common stock for dividends declared or accumulated during the current period that must be paid for the current period, and to Class B common stock for deemed dividends representing accretion from the beneficial conversion feature. Net loss attributable to common stockholders is allocated to Class A and Class B common stock proportionally, as if all of the losses for the period have been distributed. Net income attributable to common stockholders is allocated only to Class A common stock because Class B common stock is not entitled to receive distributions.
Diluted EPS is computed by dividing net income attributable to controlling interest by the weighted-average number of common shares and potentially dilutive common shares outstanding, for each respective class of common stock. Potentially dilutive common stock includes the dilutive effect of the common stock underlying in-the-money stock options and is calculated based on the average share price for each period using the treasury stock method. Potentially dilutive common stock also reflects the dilutive effect of unvested restricted stock awards.
The computations for basic and diluted earnings (loss) per share are as follows:
| Year ended December 31, | ||||||||
| 2014 | 2013 | |||||||
| Numerator for basic and diluted earnings (loss) per share: |
||||||||
| Net loss attributable to controlling interest |
$ | (31,290 | ) | $ | (13,336 | ) | ||
| Less: dividends declared |
(56,976 | ) | (11,103 | ) | ||||
| Less: deemed dividends |
(21,901 | ) | — | |||||
|
|
|
|
|
|||||
| Undistributed loss |
$ | (110,167 | ) | $ | (24,439 | ) | ||
| Denominator for basic and diluted loss per share: |
||||||||
| Weighted average number of shares: |
||||||||
| Class A common stock—basic |
42,361,959 | 35,448,056 | ||||||
| Add dilutive effect of: |
||||||||
| Stock options |
52,915 | 14,462 | ||||||
| Restricted stock awards |
27,401 | 38,131 | ||||||
| Class B common stock |
15,555,000 | 15,555,000 | ||||||
|
|
|
|
|
|||||
| Class A common stock—fully diluted |
57,997,275 | 51,055,649 | ||||||
| Less: antidilutive securities |
||||||||
| Stock options |
(52,915 | ) | (14,462 | ) | ||||
| Restricted stock awards |
(27,401 | ) | (38,131 | ) | ||||
| Class B common stock |
(15,555,000 | ) | (15,555,000 | ) | ||||
|
|
|
|
|
|||||
| Class A common stock—diluted (excluding antidilutive securities) |
42,361,959 | 35,448,056 | ||||||
| Class B common stock—basic and diluted |
15,555,000 | 15,555,000 | ||||||
| Calculation of basic and diluted earnings (loss) per share: |
||||||||
| Class A common stock: |
||||||||
| Dividends |
$ | 1.34 | $ | 0.31 | ||||
| Undistributed loss |
(1.90 | ) | (0.48 | ) | ||||
|
|
|
|
|
|||||
| Basic loss per share |
$ | (0.56 | ) | $ | (0.17 | ) | ||
|
|
|
|
|
|||||
| Class A common stock: |
||||||||
| Diluted loss per share |
$ | (0.56 | ) | $ | (0.17 | ) | ||
|
|
|
|
|
|||||
| Class B common stock: |
||||||||
| Deemed dividends |
$ | 1.41 | $ | — | ||||
| Undistributed loss |
(1.90 | ) | (0.48 | ) | ||||
|
|
|
|
|
|||||
| Basic and diluted loss per share |
$ | (0.49 | ) | $ | (0.48 | ) | ||
|
|
|
|
|
|||||
| Cash dividends declared per Class A common share |
$ | 1.30 | $ | 0.31 | ||||
|
|
|
|
|
|||||
| Deemed dividends per Class B common share |
$ | 1.41 | $ | — | ||||
|
|
|
|
|
|||||
F-41
Table of Contents
| 17. | Geographic Information |
The table below provides information, by country, about the Company’s consolidated operations. Revenue is recorded in the country in which it is earned and assets are recorded in the country in which they are located (in thousands):
| Revenue | Property, Plant and Equipment, net | |||||||||||||||||||
| Year ended December 31, | December 31, | |||||||||||||||||||
| 2014 | 2013 | 2012 | 2014 | 2013 | ||||||||||||||||
| United States |
$ | 201,408 | $ | 161,505 | $ | 73,089 | $ | 1,784,219 | $ | 1,210,319 | ||||||||||
| Canada |
46,593 | 40,068 | 41,439 | 233,690 | 265,823 | |||||||||||||||
| Chile |
17,492 | — | — | 332,947 | — | |||||||||||||||
|
|
|
|
|
|
|
|
|
|
|
|||||||||||
| Total |
$ | 265,493 | $ | 201,573 | $ | 114,528 | $ | 2,350,856 | $ | 1,476,142 | ||||||||||
|
|
|
|
|
|
|
|
|
|
|
|||||||||||
| 18. | Commitments, Contingencies and Warranties |
From time to time, the Company has become involved in claims and legal matters arising in the ordinary course of business. Management is not currently aware of any matters that will have a material adverse effect on the financial position, results of operations, or cash flows of the Company.
Power Purchase Agreements
The Company has various PPAs that terminate from 2025 to 2039. The terms of the PPAs generally provide for the annual delivery of a minimum amount of electricity at fixed prices and in some cases include price escalation over the term of the respective PPAs. As of December 31, 2014, under the terms of the PPAs, the Company issued irrevocable letters of credit totaling $57.2 million to ensure its performance for the duration of the PPAs.
Project Finance Agreements
The Company has various project finance agreements which obligate the Company to provide certain reserves to enhance its credit worthiness and facilitate the availability of credit. As of December 31, 2014, the Company issued irrevocable letters of credit totaling $107.1 million, of which $45.1 million was from the Company’s revolving credit facility, to ensure performance under these various project finance agreements.
Land Leases
The Company has entered into various long-term land leases. Rent expense, included in project expense in the consolidated statements of operations, was $8.8 million, $6.1 million and $4.2 million for the years ended December 31, 2014, 2013 and 2012, respectively.
The future minimum payments related to these leases as of December 31, 2014, are as follows (in thousands):
| For the year ending December 31, |
||||
| 2015 |
$ | 5,971 | ||
| 2016 |
5,406 | |||
| 2017 |
5,412 | |||
| 2018 |
5,418 | |||
| 2019 |
5,425 | |||
| Thereafter |
141,443 | |||
|
|
|
|||
| Total |
$ | 169,075 | ||
|
|
|
F-42
Table of Contents
Service and Maintenance Agreements
The Company has entered into service and maintenance agreements with third party contractors to provide operations and maintenance services, modifications and upgrades for varying periods over the next twelve years. As of December 31, 2014, outstanding commitments with these vendors were $353.4 million, payable over the full term of these agreements.
The following table presents operations and maintenance commitments over the next five years (in thousands):
| For the year ending December 31, |
||||
| 2015 |
$ | 40,118 | ||
| 2016 |
44,583 | |||
| 2017 |
44,387 | |||
| 2018 |
38,746 | |||
| 2019 |
36,707 | |||
| Thereafter |
148,872 | |||
|
|
|
|||
| Total |
$ | 353,413 | ||
|
|
|
Purchase, Construction and Other Commitments
The Company has entered into various commitments with service providers related to the Company’s projects and operations of its business. Outstanding commitments with these vendors, excluding operations and maintenance commitments were $16.7 million, as of December 31, 2014. The Company also has construction-related open commitments of $171.0 million as of December 31, 2014. In addition, the Company has a commitment to purchase $6.3 million of wind turbine spare parts from a third party contractor under a maintenance and service agreement.
The Company has total commitments of $6.7 million over approximately the next 20 years to local community and government organizations surrounding certain wind farms.
Turbine Availability Warranties
The Company has various turbine availability warranties from its turbine manufacturers. Pursuant to these warranties, if a turbine operates at less than minimum availability during the warranty period, the turbine manufacturer is obligated to pay, as liquidated damages, a fee for each percent that the turbine operates below the minimum availability threshold. In addition, pursuant to certain of these warranties, if a turbine operates at more than a specified availability during the warranty period, the Company has an obligation to pay a bonus to the turbine manufacturer. As of December 31, 2014 and 2013, the Company did not record a contingent liability associated with bonuses to the turbine manufacturers.
In 2013, the Company entered into warranty settlements with a turbine manufacturer for blade related wind turbine outages. The warranty settlements provide for total liquidated damage payments of approximately $21.9 million for the year ended December 31, 2013. During the year ended December 31, 2013, the Company received payments of $24.1 million, in connection with these warranty settlements. As of December 31, 2014 and 2013, the Company recorded $0.6 million and $2.2 million, respectively, in accrued liability, representing the maximum future refund of liquidated damage payments to the turbine manufacturer. The warranty settlements received, net of the maximum potential future refund to the wind turbine manufacturer were recorded as other revenue in the consolidated statements of operations.
Long-Term Service Guarantees
The Company has service guarantees from its turbine service and maintenance providers. These service guarantees are associated with long-term turbine service arrangements which commenced on various dates in 2014 and will commence on various dates in 2015 for certain wind projects. Pursuant to these guarantees, if a
F-43
Table of Contents
turbine operates at less than minimum availability during the guarantee period, the service provider is obligated to pay, as liquidated damages, a fee for each percent that the turbine operates below the minimum availability threshold. In addition, pursuant to certain of these guarantees, if a turbine operates at more than a specified availability during the guarantee period, the Company has an obligation to pay a bonus to the service provider. As of December 31, 2014, the Company recorded liabilities of $0.2 million associated with bonuses to service providers.
Contingent Liabilities
In 2014, the Company recorded a contingent obligation, payable to a third party, related to the acquisition of Logan’s Gap. Pursuant to the agreement, the Company is obligated to pay an additional $4.0 million upon the earlier of commercial operations or tax equity funding, which is expected to occur in the fourth quarter of 2015.
Indemnity
The Company provides a variety of indemnities in the ordinary course of business to contractual counterparties and to our lenders and other financial partners. Hatchet Ridge agreed to indemnify the lender that provided financing for Hatchet Ridge against certain tax losses in connection with its sale-leaseback financing transaction in December 2010. The indemnity agreement is effective for the duration of the sale-leaseback financing.
The Company is party to certain indemnities for the benefit of the Spring Valley, Santa Isabel and Ocotillo project finance lenders. These indemnity obligations consist principally of indemnities that protect the project finance lenders from the potential effect of any recapture by the U.S. Department of the Treasury, or “U.S. Treasury,” of any amount of the ITC cash grants previously received by the projects. The ITC cash grant indemnity obligations guarantee amounts of any cash grant made to each of the respective projects that may subsequently be recaptured. In addition, the Company is also party to an indemnity of our Ocotillo project finance lenders in connection with certain legal matters, which is limited to the amount of certain related costs and expenses.
Santa Isabel agreed to indemnify unrelated third parties against certain tax losses in connection with monetization of tax credits under the Economic Incentives for the Development of Puerto Rico Act of May 28, 2008 for $7.2 million.
| 19. | Related Party Transactions |
From inception to October 1, 2013, the Company’s project management and administrative activities were provided by Pattern Development. Costs associated with these activities were allocated to the Company and recorded in its consolidated statements of operations. Allocated costs include cash and non-cash compensation, other direct, general and administrative costs, and non-operating costs deemed allocable to the Company. Measurement of allocated costs is based principally on time devoted to the Company by officers and employees of Pattern Development. The Company believes the allocated costs presented in its consolidated statements of operations are a reasonable estimate of actual costs incurred to operate the business. The allocated costs are not the result of arms-length, free-market dealings.
Management Services Agreement and Shared Management
Effective October 2, 2013, the Company entered into a bilateral Management Services Agreement with Pattern Development which provides for the Company and Pattern Development to benefit, primarily on a cost-reimbursement basis, plus a 5% fee on certain direct costs, from the parties’ respective management and other professional, technical and administrative personnel, all of whom will report to and be managed by the Company’s executive officers. Pursuant to the Management Services Agreement, certain of the Company’s
F-44
Table of Contents
executive officers, including its Chief Executive Officer, will also serve as executive officers of Pattern Development and devote their time to both the Company and Pattern Development as is prudent in carrying out their executive responsibilities and fiduciary duties. The Company refers to the employees who will serve as executive officers of both the Company and Pattern Development as the “shared PEG executives.” The shared PEG executives will have responsibilities for both the Company and Pattern Development and, as a result, these individuals will not devote all of their time to the Company’s business. Under the terms of the Management Services Agreement, Pattern Development is required to reimburse the Company for an allocation of the compensation paid to such shared PEG executives reflecting the percentage of time spent providing services to Pattern Development.
The table below presents allocated costs prior to October 2, 2013 and net bilateral management service cost reimbursements on and after October 2, 2013 included in the consolidated statements of operations (in thousands):
| December 31, | ||||||||||||
| 2014 | 2013 | 2012 | ||||||||||
| Project expense |
$ | — | $ | 1,995 | $ | 1,998 | ||||||
| Related party general and administrative |
5,787 | 8,169 | 10,604 | |||||||||
| Related party income |
(2,612 | ) | (665 | ) | — | |||||||
| Other income, net |
— | (551 | ) | (210 | ) | |||||||
|
|
|
|
|
|
|
|||||||
| Total |
$ | 3,175 | $ | 8,948 | $ | 12,392 | ||||||
|
|
|
|
|
|
|
|||||||
Prior to the Contribution Transactions, the Company had purchase arrangements with Pattern Development under which the latter purchased various services and supplies on behalf of the Company and received reimbursement for these purchases. As of December 31, 2014 and 2013, the net amounts payable to Pattern Development for these purchases were $0.8 million and $1.2 million, respectively. In addition, the Company recorded a receivable of $0.1 million and $0 for the years ended December 31, 2014 and 2013, respectively, for IPO cost reimbursements due from Pattern Development.
Letters of credit, indemnities and guarantees
Pattern Development provided letters of credit that secure the Company’s obligations under PPAs and interconnection agreements. There were no letters of credit outstanding as of December 31, 2014 and 2013, respectively.
Pattern Development agreed to guarantee $14.0 million of El Arrayán’s payment obligations to a lender that has provided a $20 million credit facility for financing of El Arrayán’s recoverable, construction-period value added tax payments. The remaining $6.0 million of the credit facility has been guaranteed by another investor in El Arrayán.
Purchase and Sales Agreements
On December 20, 2013, the Company acquired a 45.0% equity interest in Grand from Pattern Development. Subject to the terms of this agreement, the Company may make an additional contingent payment of up to C$5.0 million, or $4.3 million based on the exchange rate as of December 31, 2014, as calculated based on final budget to actual amounts and distributions payable to Pattern Development upon term conversion.
On June 25, 2014, the Company acquired a 100% equity interest in AEI El Arrayán, an entity holding a 38.5% indirect interest in El Arrayán, for a total purchase price of approximately $45.3 million. The Company owned a 31.5% indirect interest in El Arrayán prior to acquiring the additional 38.5% interest in order to obtain majority control, or 70% interest, in the project. El Arrayán is a 115 MW wind power project, located in Ovalle, Chile.
F-45
Table of Contents
On June 30, 2014, the Company acquired 100% of the Class B membership interests in the Panhandle 1 wind project, representing a 79% initial ownership interest in the project’s distributable cash flow, through the acquisition of Panhandle Wind Holdings LLC, from Pattern Development, for a purchase price of approximately $124.4 million. This represents a 172 MW interest in the 218 MW wind project, located in Carson County, Texas.
On September 5, 2014, the Company exercised its right to acquire the name “Pattern” and the Pattern logo from Pattern Development pursuant to a Service Mark Purchase and Sale Agreement for a purchase price of $1. The Company granted to Pattern Development a license to use the name “Pattern” and the Pattern logo.
On November 10, 2014, the Company completed its acquisition of 100% of the Class B membership interests in the Panhandle 2 wind project, representing a 81% initial ownership interest in the project’s distributable cash flow, through the acquisition of Panhandle B Member 2, from Pattern Development, for a purchase price of approximately $123.8 million, which includes debt assumed of $195.4 million that was repaid immediately after acquisition. This represents a 147 MW interest in the 182 MW wind project, located in Carson County, Texas.
On December 19, 2014, the Company acquired 100% of the membership interests in Logan’s Gap from Pattern Development, for a purchase price of approximately $15.1 million. In connection with the acquisition, as of December 31, 2014, the Company has a related party payable of $5.0 million to Pattern Development. In addition, the Company has a contingent payment of up to $4.0 million to an unrelated third party at the earlier of (a) commercial operations or (b) tax equity funding. Logan’s Gap is a 164 MW wind project located in Comanche County, Texas.
Puerto Rico Electric Power Authority (PREPA)
The Company’s Santa Isabel project was in a dispute with PREPA over the appropriate rate being charged to the project for the electric services it uses. During the year ended December 31, 2013, the difference between what the Company believes is the appropriate monthly charge and PREPA’s bill was resolved in principle, and billing is now per the understanding between the parties. Pattern Development provided the Company with an indemnity to mitigate the economic impact on the Company of this dispute.
Management fees
The Company provides operations and management services and receives a fee for such services under agreements with its joint venture investees, South Kent, Grand and, prior to its acquisition on June 25, 2014, El Arrayán. Management fees of $3.3 million and $0.9 million were recorded as related party revenue in the consolidated statements of operations for the years ended December 31, 2014 and 2013, respectively and a related party receivable of $0.7 million and $0.2 million were recorded in the consolidated balance sheet as of December 31, 2014 and 2013, respectively. The Company eliminates the intercompany profit from management fees related to its ownership interest in South Kent and Grand. Management fees related to El Arrayán, earned subsequent to June 25, 2014, are eliminated upon consolidation.
Employee Savings Plan
The Company participates in a 401(k) plan sponsored and maintained by Pattern Development, established on August 3, 2009 and restated on October 3, 2013. The Company also sponsors a Canadian Registered Retirement Savings Plan (“RRSP”), established on October 2, 2013. Participants in the plans are allowed to defer a portion of their compensation, not to exceed the respective Internal Revenue Service (IRS) or Canada Revenue Agency (CRA) annual allowance contribution guidelines, and are 100% vested in their respective deferrals and earnings. Participants may choose from a variety of investment options. The Company contributes 5% of base compensation to each employee’s 401(k) or RRSP account, up to the annual compensation limit. For the years ended December 31, 2014 and 2013, the Company contributed $0.3 million and $0.1 million, respectively, which
F-46
Table of Contents
was recorded in the consolidated statements of operations as either general and administrative expense or cost of revenue. No such contributions were made during the year ended December 31, 2012.
| 20. | Selected Quarterly Financial Data (Unaudited) |
The following tables summarize the Company’s unaudited quarterly consolidated statements of operations for each of the eight quarters in the two year period ended December 31, 2014. The quarterly consolidated statements of operations data were prepared on a basis consistent with the audited consolidated financial statements included in Part III, Item 14, “Financial Statements and Supplementary Data” in this Annual Report on Form 10-K.
Quarterly financial data in thousands, except per share data:
| Three months ended | ||||||||||||||||
| December 31, 2014 |
September 30, 2014 |
June 30, 2014 |
March 31, 2014 |
|||||||||||||
| Revenue |
$ | 79,418 | $ | 71,519 | $ | 65,007 | $ | 49,549 | ||||||||
| Gross profit |
$ | 26,311 | $ | 17,669 | $ | 27,023 | $ | 12,298 | ||||||||
| Net (loss) income |
$ | (15,986 | ) | $ | (9,281 | ) | $ | 7,167 | $ | (21,899 | ) | |||||
| Net (loss) income attributable to noncontrolling interest |
$ | 4,406 | $ | (2,073 | ) | $ | (4,032 | ) | $ | (7,010 | ) | |||||
| Net (loss) income attributable to controlling interest |
$ | (20,392 | ) | $ | (7,208 | ) | $ | 11,199 | $ | (14,889 | ) | |||||
| Basic (loss) earnings per share—Class A |
$ | (0.36 | ) | $ | (0.15 | ) | $ | 0.17 | $ | (0.20 | ) | |||||
| Diluted (loss) earnings per share—Class A |
$ | (0.36 | ) | $ | (0.15 | ) | $ | 0.16 | $ | (0.29 | ) | |||||
| Basic and diluted earnings (loss) per share—Class B |
$ | (0.23 | ) | $ | (0.02 | ) | $ | 0.28 | $ | (0.51 | ) | |||||
| Cash dividends declared per Class A common share |
$ | 0.34 | $ | 0.33 | $ | 0.32 | $ | 0.31 | ||||||||
| Deemed dividends on Class B common shares |
$ | 0.46 | $ | 0.46 | $ | 0.48 | $ | — | ||||||||
| Three months ended | ||||||||||||||||
| December 31, 2013 |
September 30, 2013 |
June 30, 2013 |
March 31, 2013 |
|||||||||||||
| Revenue |
$ | 41,767 | $ | 57,257 | $ | 58,712 | $ | 43,837 | ||||||||
| Gross profit |
$ | 4,729 | $ | 21,471 | $ | 26,222 | $ | 8,294 | ||||||||
| Net (loss) income |
$ | (19,376 | ) | $ | 4,244 | $ | 43,988 | $ | (18,784 | ) | ||||||
| Net (loss) income attributable to noncontrolling interest |
$ | (6,197 | ) | $ | 3,248 | $ | (359 | ) | $ | (3,579 | ) | |||||
| Net (loss) income attributable to controlling interest |
$ | (13,179 | ) | $ | 996 | $ | 44,347 | $ | (15,205 | ) | ||||||
| Basic and diluted loss per share—Class A |
$ | (0.17 | ) | N/A | N/A | N/A | ||||||||||
| Basic and diluted loss per share—Class B |
$ | (0.48 | ) | N/A | N/A | N/A | ||||||||||
In connection with the preparation of the consolidated financial statements for the periods ended September 30, 2014, June 30, 2014 and March 31, 2014, errors in the reporting and computation and disclosure of earnings (loss) per share were identified.
For the three and nine month periods ended September 30, 2014, the Company determined it made an error in reporting the weighted average number of shares outstanding of Class A common stock which affected the earnings (loss) per share calculations reported.
The Company evaluated the materiality of this error in accordance with SEC Staff Accounting Bulletin No. 99, Materiality, and SEC Staff Accounting Bulletin No. 108, Considering the Effects of Prior Year Misstatements When Quantifying Misstatements in Current Year Financial Statements, and concluded that this error, individually and in the aggregate, was immaterial to the three and nine months ended September 30, 2014. While the adjustment was immaterial, the Company has elected to revise the previously reported weighted average shares outstanding and basic and diluted earnings per share, for the three and nine months ended September 30, 2014.
F-47
Table of Contents
For the three and six month periods ended June 30, 2014, the Company determined that the computation of earnings (loss) per share did not correctly consider the recognition of a beneficial conversion feature of the Class B common stock and the subsequent accretion of this beneficial conversion feature, as a result of the commencement of commercial operations at the Company’s South Kent project, on March 28, 2014. The recognition of this beneficial conversion feature and subsequent accretion had no net impact to the consolidated balance sheets, consolidated statement of stockholders’ equity or consolidated statements of cash flows, and no impact on net income in the consolidated statements of operations. However, the subsequent accretion of the beneficial conversion feature is considered a deemed dividend to the Class B common stockholders for the purposes of calculating net loss attributable to common stockholders and earnings (loss) per share. The deemed dividend does not represent a current or future distribution of the Company’s earnings.
For the three month period ended March 31, 2014, the Company determined that the computation and disclosure of Class A diluted earnings per share did not correctly consider that upon the commercial operation date of South Kent on March 28, 2014, the “if-converted” method of calculating diluted earnings (loss) per share would result in a more dilutive result than the previously applied “two-class” method of calculating diluted earnings (loss) per share. The more dilutive result of these two methods should have been reported on the Company’s consolidated statements of operations.
For each of the periods ended June 30, 2014 and March 31, 2014, the Company evaluated the materiality of the errors identified in accordance with SEC Staff Accounting Bulletin No. 99, Materiality, and SEC Staff Accounting Bulletin No. 108, Considering the Effects of Prior Year Misstatements When Quantifying Misstatements in Current Year Financial Statements, and concluded that the errors, individually and in the aggregate, were material and as a result, the Company’s Quarterly Report on Form 10-Q for the quarter ended June 30, 2014 and the Company’s Quarterly Report on Form 10-Q for the quarter ended March 31, 2014, were restated to correct errors in the computation and disclosure of earnings (loss) per share.
F-48
Table of Contents
The following table presents the basic and diluted earnings (loss) per share as previously reported and as revised for the three and nine months ended September 30, 2014:
| Three months ended September 30, 2014 |
Nine months ended September 30, 2014 |
|||||||||||||||
| As Reported | As Revised | As Reported | As Revised | |||||||||||||
| Numerator for basic and diluted earnings (loss) per share: |
||||||||||||||||
| Net loss attributable to controlling interest |
$ | (7,208 | ) | $ | (7,208 | ) | $ | (10,898 | ) | $ | (10,898 | ) | ||||
| Less: cash dividends declared on Class A common shares |
(15,258 | ) | (15,258 | ) | (41,395 | ) | (41,395 | ) | ||||||||
| Less: deemed dividends on Class B common shares |
(7,222 | ) | (7,222 | ) | (14,679 | ) | (14,679 | ) | ||||||||
|
|
|
|
|
|
|
|
|
|||||||||
| Net loss attributable to common stockholders |
$ | (29,688 | ) | $ | (29,688 | ) | $ | (66,972 | ) | $ | (66,972 | ) | ||||
| Denominator for basic and diluted loss per share: |
||||||||||||||||
| Weighted average number of shares: |
||||||||||||||||
| Class A common stock—basic |
40,980,989 | 46,317,932 | 38,342,998 | 41,022,962 | ||||||||||||
| Add dilutive effect of: |
||||||||||||||||
| Stock options |
133,197 | 133,197 | 112,252 | 112,252 | ||||||||||||
| Restricted stock awards |
191,451 | 191,451 | 191,451 | 191,451 | ||||||||||||
| Class B common stock |
15,555,000 | 15,555,000 | 15,555,000 | 15,555,000 | ||||||||||||
|
|
|
|
|
|
|
|
|
|||||||||
| Class A common stock—fully diluted |
56,860,637 | 62,197,580 | 54,201,701 | 56,881,665 | ||||||||||||
| Less: antidilutive securities |
||||||||||||||||
| Stock options |
(133,197 | ) | (133,197 | ) | (112,252 | ) | (112,252 | ) | ||||||||
| Restricted stock awards |
(191,451 | ) | (191,451 | ) | (191,451 | ) | (191,451 | ) | ||||||||
| Class B common stock |
(15,555,000 | ) | (15,555,000 | ) | — | — | ||||||||||
|
|
|
|
|
|
|
|
|
|||||||||
| Class A common stock—diluted (excluding antidilutive securities) |
40,980,989 | 46,317,932 | 53,897,998 | 56,577,962 | ||||||||||||
| Class B common stock—basic and diluted |
15,555,000 | 15,555,000 | 15,555,000 | 15,555,000 | ||||||||||||
| Calculation of basic and diluted earnings (loss) per share: |
||||||||||||||||
| Class A common stock: |
||||||||||||||||
| Dividends |
$ | 0.37 | $ | 0.33 | $ | 1.08 | $ | 1.01 | ||||||||
| Undistributed loss |
(0.53 | ) | (0.48 | ) | (1.24 | ) | (1.18 | ) | ||||||||
|
|
|
|
|
|
|
|
|
|||||||||
| Basic loss per share |
$ | (0.15 | ) | $ | (0.15 | ) | $ | (0.16 | ) | $ | (0.17 | ) | ||||
|
|
|
|
|
|
|
|
|
|||||||||
| Class A common stock: |
||||||||||||||||
| Diluted loss per share |
$ | (0.15 | ) | $ | (0.15 | ) | $ | (0.20 | ) | $ | (0.19 | ) | ||||
|
|
|
|
|
|
|
|
|
|||||||||
| Class B common stock: |
||||||||||||||||
| Deemed dividends |
$ | 0.46 | $ | 0.46 | $ | 0.94 | $ | 0.94 | ||||||||
| Undistributed loss |
(0.53 | ) | (0.48 | ) | (1.24 | ) | (1.18 | ) | ||||||||
|
|
|
|
|
|
|
|
|
|||||||||
| Basic and diluted loss per share |
$ | (0.06 | ) | $ | (0.02 | ) | $ | (0.30 | ) | $ | (0.24 | ) | ||||
|
|
|
|
|
|
|
|
|
|||||||||
| Cash dividends declared per Class A common share |
$ | 0.33 | $ | 0.33 | $ | 0.96 | $ | 0.96 | ||||||||
|
|
|
|
|
|
|
|
|
|||||||||
| Deemed dividends per Class B common share |
$ | 0.46 | $ | 0.46 | $ | 0.94 | $ | 0.94 | ||||||||
|
|
|
|
|
|
|
|
|
|||||||||
F-49
Table of Contents
The following table presents the basic and diluted earnings (loss) per share as previously reported and as revised for the three and six months ended June 30, 2014:
| Three months ended June 30, 2014 |
Six months ended June 30, 2014 |
|||||||||||||||
| As Reported | As Restated | As Reported | As Restated | |||||||||||||
| Numerator for basic and diluted earnings (loss) per share: |
||||||||||||||||
| Net income (loss) attributable to controlling interest |
$ | 11,199 | $ | 11,199 | $ | (3,690 | ) | $ | (3,690 | ) | ||||||
| Less: cash dividends declared on Class A common shares |
(14,981 | ) | (14,981 | ) | (26,138 | ) | (26,138 | ) | ||||||||
| Less: deemed dividends on Class B common shares |
— | (7,457 | ) | — | (7,457 | ) | ||||||||||
|
|
|
|
|
|
|
|
|
|||||||||
| Net loss attributable to common stockholders |
$ | (3,782 | ) | $ | (11,239 | ) | $ | (29,828 | ) | $ | (37,285 | ) | ||||
| Denominator for earnings (loss) per share: |
||||||||||||||||
| Weighted average number of shares: |
||||||||||||||||
| Class A common stock—basic |
41,174,697 | 41,174,697 | 38,331,595 | 38,331,595 | ||||||||||||
| Add dilutive effect of: |
||||||||||||||||
| Stock options |
107,979 | 107,979 | 100,814 | 100,814 | ||||||||||||
| Restricted stock awards |
227,543 | 227,543 | 227,543 | 227,543 | ||||||||||||
| Class B common stock |
15,555,000 | 15,555,000 | 15,555,000 | 15,555,000 | ||||||||||||
|
|
|
|
|
|
|
|
|
|||||||||
| Class A common stock—fully diluted |
57,065,219 | 57,065,219 | 54,214,952 | 54,214,952 | ||||||||||||
| Less: antidilutive securities |
||||||||||||||||
| Stock options |
— | — | — | (100,814 | ) | |||||||||||
| Restricted stock awards |
— | — | — | (227,543 | ) | |||||||||||
| Class B common stock |
— | (15,555,000 | ) | — | — | |||||||||||
|
|
|
|
|
|
|
|
|
|||||||||
| Class A common stock—diluted (excluding antidilutive securities) |
57,065,219 | 41,510,219 | 54,214,952 | 53,886,595 | ||||||||||||
| Class B common stock—basic and diluted |
15,555,000 | 15,555,000 | 15,555,000 | 15,555,000 | ||||||||||||
| Calculation of basic and diluted earnings (loss) per share: |
||||||||||||||||
| Class A common stock: |
||||||||||||||||
| Dividends |
$ | 0.36 | $ | 0.36 | $ | 0.68 | $ | 0.68 | ||||||||
| Undistributed loss |
(0.07 | ) | (0.20 | ) | (0.55 | ) | (0.69 | ) | ||||||||
|
|
|
|
|
|
|
|
|
|||||||||
| Basic earnings (loss) per share |
$ | 0.30 | $ | 0.17 | $ | 0.13 | $ | (0.01 | ) | |||||||
|
|
|
|
|
|
|
|
|
|||||||||
| Class A common stock: |
||||||||||||||||
| Diluted earnings (loss) per share |
$ | 0.20 | $ | 0.16 | $ | (0.07 | ) | $ | (0.07 | ) | ||||||
|
|
|
|
|
|
|
|
|
|||||||||
| Class B common stock: |
||||||||||||||||
| Deemed dividends |
$ | — | $ | 0.48 | $ | — | $ | 0.48 | ||||||||
| Undistributed loss |
(0.07 | ) | (0.20 | ) | (0.55 | ) | (0.69 | ) | ||||||||
|
|
|
|
|
|
|
|
|
|||||||||
| Basic and diluted earnings (loss) per share |
$ | (0.07 | ) | $ | 0.28 | $ | (0.55 | ) | $ | (0.21 | ) | |||||
|
|
|
|
|
|
|
|
|
|||||||||
| Cash dividends declared per Class A common share |
$ | — | $ | 0.32 | $ | — | $ | 0.63 | ||||||||
|
|
|
|
|
|
|
|
|
|||||||||
| Deemed dividends per Class B common share |
$ | — | $ | 0.48 | $ | — | $ | 0.48 | ||||||||
|
|
|
|
|
|
|
|
|
|||||||||
F-50
Table of Contents
The following table presents the basic and diluted earnings (loss) per share as previously reported and as revised for the three months ended March 31, 2014:
| Three months ended March 31, 2014 |
||||||||
| As Reported | As Restated | |||||||
| Numerator for basic and diluted earnings per share: |
||||||||
| Net income (loss) attributable to controlling interest |
$ | (14,889 | ) | $ | (14,889 | ) | ||
| Less: cash dividends declared on Class A common shares |
(11,179 | ) | (11,179 | ) | ||||
|
|
|
|
|
|||||
| Net loss attributable to common stockholders |
$ | (26,068 | ) | $ | (26,068 | ) | ||
| Denominator for loss per share: |
||||||||
| Weighted average number of shares: |
||||||||
| Class A common stock—basic |
35,533,166 | 35,533,166 | ||||||
| Add dilutive effect of: |
||||||||
| Stock options |
95,219 | 95,219 | ||||||
| Restricted stock awards |
238,546 | 238,546 | ||||||
| Class B common stock |
15,555,000 | 15,555,000 | ||||||
|
|
|
|
|
|||||
| Class A common stock—fully diluted |
51,421,931 | 51,421,931 | ||||||
| Less: antidilutive securities |
||||||||
| Stock options |
(95,219 | ) | — | |||||
| Restricted stock awards |
(238,546 | ) | — | |||||
| Class B common stock |
(15,555,000 | ) | — | |||||
|
|
|
|
|
|||||
| Class A common stock—diluted (excluding antidilutive securities) |
35,533,166 | 51,421,931 | ||||||
| Class B common stock—basic and diluted |
15,555,000 | 15,555,000 | ||||||
| Calculation of basic and diluted loss per share: |
||||||||
| Class A common stock: |
||||||||
| Dividends |
$ | 0.31 | $ | 0.31 | ||||
| Undistributed loss |
(0.51 | ) | (0.51 | ) | ||||
|
|
|
|
|
|||||
| Basic loss per share |
$ | (0.20 | ) | $ | (0.20 | ) | ||
|
|
|
|
|
|||||
| Class A common stock: |
||||||||
| Diluted loss per share |
$ | (0.20 | ) | $ | (0.29 | ) | ||
|
|
|
|
|
|||||
| Class B common stock: |
||||||||
|
|
|
|
|
|||||
| Basic and diluted loss per share |
$ | (0.51 | ) | $ | (0.51 | ) | ||
|
|
|
|
|
|||||
| 21. | Subsequent Events |
On February 24, 2015, the Company approved an increased dividend for the first quarter 2015, payable on April 30, 2015, to holders of record on March 31, 2015, in the amount of $0.342 per Class A share, which represents $1.368 on an annualized basis. This represents a 2% increase from the fourth quarter 2014 dividend of $0.335.
On February 9, 2015, the Company completed an underwritten public offering of its Class A common stock. In total, 12,000,000 shares of the Company’s Class A common stock were sold. Of this amount, the Company issued and sold 7,000,000 shares of its Class A common stock and Pattern Development, the selling stockholder, sold 5,000,000 shares of its Class A common stock. The Company received net proceeds of approximately $196.6 million after deducting underwriting discounts and commissions and estimated offering expenses payable by the Company. The Company did not receive any proceeds from the sale of shares sold by Pattern Development. As a result of the sale of shares by Pattern Development, its ownership interest in the Company decreased from 35% to 25% and it is no longer entitled to certain approval rights pursuant to the Shareholder Approval Rights Agreement dated October 2, 2013.
F-51
Table of Contents
Schedule I—Condensed Parent-Company Financial Statements
Pattern Energy Group Inc.
Condensed Financial Information of Parent
Balance Sheets
(In thousands of U.S. dollars, except share data)
| December 31, | December 31, | |||||||
| 2014 | 2013 | |||||||
| Assets |
||||||||
| Current assets: |
||||||||
| Cash and cash equivalents |
$ | 34,772 | $ | 75,776 | ||||
| Related party receivable |
1,982 | 1,000 | ||||||
| Current deferred tax assets |
307 | — | ||||||
| Prepaid expenses and other current assets |
4,484 | 446 | ||||||
|
|
|
|
|
|||||
| Total current assets |
41,545 | 77,222 | ||||||
| Investments in subsidiaries |
586,641 | 300,216 | ||||||
| Investments in affiliates |
29,079 | 107,055 | ||||||
| Net deferred tax assets |
147 | 573 | ||||||
| Other assets |
85 | — | ||||||
|
|
|
|
|
|||||
| Total assets |
$ | 657,497 | $ | 485,066 | ||||
|
|
|
|
|
|||||
| Liabilities and equity |
||||||||
| Current liabilities: |
||||||||
| Accounts payable and other accrued liabilities |
$ | 6,404 | $ | 4,513 | ||||
| Related party payable |
757 | 667 | ||||||
| Dividend payable |
15,734 | 11,103 | ||||||
| Current deferred tax liabilities |
147 | — | ||||||
|
|
|
|
|
|||||
| Total current liabilities |
23,042 | 16,283 | ||||||
| Net deferred tax liabilities |
307 | 573 | ||||||
|
|
|
|
|
|||||
| Total liabilities |
23,349 | 16,856 | ||||||
|
|
|
|
|
|||||
| Equity: |
||||||||
| Class A common stock, $0.01 par value per share: 500,000,000 shares authorized; 62,088,306 and 35,531,720 shares issued as of December 31, 2014 and 2013, respectively; 62,062,841 and 35,530,786 shares outstanding as of December 31, 2014 and 2013, respectively |
621 | 355 | ||||||
| Class B convertible common stock, $0.01 par value per share: 20,000,000 shares authorized; 0 and 15,555,000 shares issued as of December 31, 2014 and 2013, respectively; 0 and 15,555,000 outstanding as of December 31, 2014 and 2013, respectively |
— | 156 | ||||||
| Additional paid-in capital |
696,378 | 461,852 | ||||||
| Capital |
— | — | ||||||
| Accumulated (loss) income |
(17,066 | ) | 14,224 | |||||
| Accumulated other comprehensive loss |
(45,068 | ) | (8,353 | ) | ||||
| Treasury stock, at cost; 25,465 and 934 shares of Class A common stock as of December 31, 2014 and 2013, respectively |
(717 | ) | (24 | ) | ||||
|
|
|
|
|
|||||
| Total equity |
634,148 | 468,210 | ||||||
|
|
|
|
|
|||||
| Total liabilities and equity |
$ | 657,497 | $ | 485,066 | ||||
|
|
|
|
|
|||||
See accompanying notes to parent company financial statements
S-1
Table of Contents
Pattern Energy Group Inc.
Condensed Financial Information of Parent
Statements of Operations and Comprehensive Income (Loss)
(In thousands of U.S. dollars)
| Year ended December 31, | October 17, 2012 (initial capitalization) to December 31, 2012 |
|||||||||||
| 2014 | 2013 | |||||||||||
| Revenue |
$ | — | $ | — | $ | — | ||||||
|
|
|
|
|
|
|
|||||||
| Expenses |
23,089 | 3,630 | 7 | |||||||||
|
|
|
|
|
|
|
|||||||
| Operating loss |
(23,089 | ) | (3,630 | ) | (7 | ) | ||||||
|
|
|
|
|
|
|
|||||||
| Other income (expense): |
||||||||||||
| Equity in earnings (loss) from subsidiaries |
18,064 | 12,641 | (2,688 | ) | ||||||||
| Equity in (loss) earnings from affiliates |
(25,295 | ) | 7,846 | (40 | ) | |||||||
| Related party income |
2,612 | 665 | — | |||||||||
| Other expenses, net |
(3,566 | ) | (563 | ) | — | |||||||
|
|
|
|
|
|
|
|||||||
| Other (expense) income |
(8,185 | ) | 20,589 | (2,728 | ) | |||||||
|
|
|
|
|
|
|
|||||||
| Net (loss) income before income tax |
(31,274 | ) | 16,959 | (2,735 | ) | |||||||
| Tax provision |
16 | — | — | |||||||||
|
|
|
|
|
|
|
|||||||
| Net (loss) income |
(31,290 | ) | 16,959 | (2,735 | ) | |||||||
|
|
|
|
|
|
|
|||||||
| Other comprehensive income (loss), net of tax |
||||||||||||
| Proportionate share of subsidiaries’ other comprehensive (loss) income activity, net of tax benefit of $734, $0 and $0, respectively |
(30,724 | ) | 23,478 | 1,876 | ||||||||
| Proportionate share of equity investee’s other comprehensive (loss) income activity, net of tax benefit (provision) of $1,855, ($615) and $302, respectively |
(5,991 | ) | 2,473 | — | ||||||||
|
|
|
|
|
|
|
|||||||
| Total other comprehensive (loss) income, net of tax |
(36,715 | ) | 25,951 | 1,876 | ||||||||
|
|
|
|
|
|
|
|||||||
| Comprehensive (loss) income |
$ | (68,005 | ) | $ | 42,910 | $ | (859 | ) | ||||
|
|
|
|
|
|
|
|||||||
See accompanying notes to parent company financial statements
S-2
Table of Contents
Pattern Energy Group Inc.
Condensed Financial Information of Parent
Condensed Statements of Cash Flows
(In thousands of U.S. dollars)
| Year ended December 31, | October 17, 2012 (initial capitalization) to December 31, 2012 |
|||||||||||
| 2014 | 2013 | |||||||||||
| Operating activities |
||||||||||||
| Net (loss) income |
$ | (31,290 | ) | $ | 16,959 | $ | (2,735 | ) | ||||
| Adjustments to reconcile net (loss) income to net cash used in operating activities: |
||||||||||||
| Stock-based compensation |
4,105 | 511 | — | |||||||||
| Net loss on transactions |
1,473 | — | — | |||||||||
| Equity in (earnings) loss from subsidiaries |
(18,064 | ) | (12,641 | ) | 2,688 | |||||||
| Equity in loss (earnings) from affiliates |
25,295 | (7,846 | ) | 40 | ||||||||
| Changes in operating assets and liabilities: |
||||||||||||
| Prepaid expenses and other current assets |
(3,545 | ) | (446 | ) | — | |||||||
| Accounts payable and other accrued liabilities |
1,999 | 93 | 7 | |||||||||
| Related party receivable/payable |
(639 | ) | (1,007 | ) | — | |||||||
|
|
|
|
|
|
|
|||||||
| Net cash used in operating activities |
(20,666 | ) | (4,377 | ) | — | |||||||
|
|
|
|
|
|
|
|||||||
| Investing activities |
||||||||||||
| Distribution from subsidiaries |
108,581 | 233,226 | — | |||||||||
| Contribution to subsidiaries |
(362,533 | ) | (172,130 | ) | — | |||||||
|
|
|
|
|
|
|
|||||||
| Net cash (used in) provided by investing activities |
(253,952 | ) | 61,096 | — | ||||||||
|
|
|
|
|
|
|
|||||||
| Financing activities |
||||||||||||
| Proceeds from public offering, net of expenses |
286,757 | 317,926 | — | |||||||||
| Proceeds from exercise of stock options |
327 | — | — | |||||||||
| Repurchase of shares for employee tax withholding |
(693 | ) | (24 | ) | — | |||||||
| Capital contributions—Pattern Development |
— | 32,678 | 1 | |||||||||
| Capital distributions—Pattern Development |
— | (98,884 | ) | — | ||||||||
| Capital distributions—Contribution Transactions |
— | (232,640 | ) | — | ||||||||
| Dividends paid |
(52,344 | ) | — | — | ||||||||
| Payment for deferred equity issuance costs |
(433 | ) | — | — | ||||||||
|
|
|
|
|
|
|
|||||||
| Net cash provided by financing activities |
233,614 | 19,056 | 1 | |||||||||
| Net change in cash and cash equivalents |
(41,004 | ) | 75,775 | 1 | ||||||||
| Cash and cash equivalents at beginning of period |
75,776 | 1 | — | |||||||||
|
|
|
|
|
|
|
|||||||
| Cash and cash equivalents at end of period |
$ | 34,772 | $ | 75,776 | $ | 1 | ||||||
|
|
|
|
|
|
|
|||||||
| Schedule of non-cash activities |
||||||||||||
| Investments in subsidiaries |
$ | — | $ | — | $ | 514,117 | ||||||
See accompanying notes to parent company financial statements
S-3
Table of Contents
Pattern Energy Group Inc.
Note to Parent Company Financial Statements
Supplemental Notes
| 1. | Summary of Significant Accounting Policies |
Basis of Presentation
The condensed, standalone, financial statements of Pattern Energy Group Inc. (“parent company”) have been presented in accordance with Rule 12-04, Schedule I of Regulation S-X as the restricted net assets of the subsidiaries of the parent company exceed 25% of the consolidated net assets of the parent company and its subsidiaries. The condensed parent company financial statements have been prepared in accordance with United States generally accepted accounting principles (“U.S. GAAP”) and should be read in conjunction with the parent company’s consolidated financial statements and the accompanying notes thereto.
Investments
For purposes of these financial statements, the parent company’s wholly owned and majority owned subsidiaries are recorded based on its proportionate share of the subsidiaries’ assets. The parent company’s share of net income of its unconsolidated subsidiaries is included in income using the equity method.
S-4
Table of Contents
Financial Statements
December 31, 2014, 2013 and 2012
(In thousands of Canadian Dollars)
S-5
Table of Contents
| Contents |
Page | |
| S-7 | ||
| Financial Statements |
||
| S-10 | ||
| S-11 | ||
| S-12 | ||
| S-13 | ||
| S-14 | ||
S-6
Table of Contents

February 12, 2015
To the Partners of
South Kent Wind LP
We have audited the accompanying balance sheets of South Kent Wind LP as of December 31, 2014 and 2013 and the related statement of operations and comprehensive income (loss), changes in partners’ equity, and cash flows for each of the years in the two-year period ended December 31, 2014. Management is responsible for these financial statements. Our responsibility is to express an opinion on these financial statements based on our audits.
We conducted our audits in accordance with the standards of the Public Company Accounting Oversight Board (United States). Those standards require that we plan and perform the audit to obtain reasonable assurance about whether the financial statements are free of material misstatement. Our audits of the financial statements included examining, on a test basis, evidence supporting the amounts and disclosures in the financial statements, assessing the accounting principles used and significant estimates made by management, and evaluating the overall financial statement presentation. We were not engaged to perform an audit of the company’s internal control over financial reporting. Our audits included consideration of internal control over financial reporting as a basis for designing audit procedures that are appropriate in the circumstances, but not for the purpose of expressing an opinion on the effectiveness of the company’s internal control over financial reporting. Accordingly, we express no such opinion. Our audits also included performing such other procedures as we considered necessary in the circumstances. We believe that our audits provide a reasonable basis for our opinion.
In our opinion, the financial statements referred to above present fairly, in all material respects, the financial position of South Kent Wind LP as of December 31, 2014 and 2013 and the results of its operations and its cash flows for each of the years in the two-year period ended December 31, 2014 in conformity with accounting principles generally accepted in the United States of America.
/s/ PricewaterhouseCoopers LLP
Chartered Professional Accountants, Licensed Public Accountants
PricewaterhouseCoopers LLP
PwC Tower, 18 York Street, Suite 2600, Toronto, Ontario, Canada M5J 0B2
T: +1 416 863 1133, F: +1 416 365 8215, www.pwc.com/ca
“PwC” refers to PricewaterhouseCoopers LLP, an Ontario limited liability partnership.
S-7
Table of Contents
March 14, 2013
Independent Auditor’s Report
To the Partners of
South Kent Wind LP
We have audited the accompanying financial statements of South Kent Wind LP, which comprise the statements of operations and comprehensive income, changes in partners’ equity, and cash flows for the year ended December 31, 2012, and the related notes, which comprise a summary of significant accounting policies and other explanatory information.
Management’s responsibility for the financial statements
Management is responsible for the preparation and fair presentation of the financial statements in accordance with accounting principles generally accepted in the United States of America; this includes the design, implementation, and maintenance of internal control relevant to the preparation and fair presentation of financial statements that are free from material misstatement, whether due to fraud or error.
Auditor’s responsibility
Our responsibility is to express an opinion on the financial statements based on our audit. We conducted our audit in accordance with auditing standards generally accepted in the United States of America. Those standards require that we plan and perform the audit to obtain reasonable assurance about whether the financial statements are free from material misstatement.
An audit involves performing procedures to obtain audit evidence about the amounts and disclosures in the financial statements. The procedures selected depend on our judgment, including the assessment of the risks of material misstatement of the financial statements, whether due to fraud or error. In making those risk assessments, we consider internal control relevant to the entity’s preparation and fair presentation of the financial statements in order to design audit procedures that are appropriate in the circumstances, but not for the purpose of expressing an opinion on the effectiveness of the entity’s internal control. Accordingly, we express no such opinion. An audit also includes evaluating the appropriateness of accounting policies used and the reasonableness of significant accounting estimates made by management, as well as evaluating the overall presentation of the financial statements.
We believe that the audit evidence we have obtained is sufficient and appropriate to provide a basis for our audit opinion.
PricewaterhouseCoopers LLP
PwC Tower, 18 York Street, Suite 2600, Toronto, Ontario, Canada M5J 0B2
T: +1 416 863 1133, F: +1 416 365 8215, www.pwc.com/ca
“PwC” refers to PricewaterhouseCoopers LLP, an Ontario limited liability partnership.
S-8
Table of Contents
Opinion
In our opinion, the financial statements referred to above present fairly, in all material respects, the results of operations of South Kent Wind LP for the year ended December 31, 2012 in accordance with accounting principles generally accepted in the United States of America.
/s/ PricewaterhouseCoopers LLP
Chartered Professional Accountants, Licensed Public Accountants
PricewaterhouseCoopers LLP
PwC Tower, 18 York Street, Suite 2600, Toronto, Ontario, Canada M5J 0B2
T: +1 416 863 1133, F: +1 416 365 8215, www.pwc.com/ca
“PwC” refers to PricewaterhouseCoopers LLP, an Ontario limited liability partnership.
S-9
Table of Contents
South Kent Wind LP
As of December 31, 2014 and 2013
(In thousands of Canadian Dollars)
| 2014 | 2013 | |||||||
| ASSETS |
||||||||
| Current assets: |
||||||||
| Cash and cash equivalents |
$ | 16,427 | $ | 139 | ||||
| Restricted cash (note 3) |
3,087 | 26,888 | ||||||
| Sales tax recoverable |
151 | 13,591 | ||||||
| Accrued revenue (note 2) |
15,963 | — | ||||||
| Other current assets (note 4) |
615 | 1,515 | ||||||
|
|
|
|
|
|||||
| Total current assets |
36,243 | 42,133 | ||||||
| Restricted cash (note 3) |
10,930 | — | ||||||
| Advance payment |
— | 19,520 | ||||||
| Construction-in-progress (note 5) |
— | 625,637 | ||||||
| Property, plant and equipment - net of accumulated depreciation of $28,272 and $87 in 2014 and 2013, respectively (note 6) |
709,826 | 116 | ||||||
| Intangible assets - net of accumulated amortization of $684 and $592 in 2014 and 2013, respectively (note 7) |
754 | 431 | ||||||
| Deferred financing costs - net of accumulated amortization of $3,797 and $1,056 in 2014 and 2013, respectively |
16,621 | 19,362 | ||||||
| Derivative assets (note 11) |
— | 26,757 | ||||||
|
|
|
|
|
|||||
| Total assets |
$ | 774,374 | $ | 733,956 | ||||
|
|
|
|
|
|||||
| LIABILITIES & EQUITY |
||||||||
| Current liabilities: |
||||||||
| Accounts payable and other accrued liabilities |
$ | 3,910 | $ | 1,198 | ||||
| Accounts payable and other accrued liabilities - related parties (note 14) |
2,141 | 42,812 | ||||||
| Current portion of long-term debt (note 8) |
23,185 | 1,914 | ||||||
| Current portion of long-term contingent liabilities (note 13) |
500 | 1,565 | ||||||
| Derivative liabilities, current (note 11) |
10,008 | 7,815 | ||||||
| Accrued interest |
— | 176 | ||||||
|
|
|
|
|
|||||
| Total current liabilities |
39,744 | 55,480 | ||||||
| Long-term debt, net of current (note 8) |
658,717 | 542,718 | ||||||
| Long-term contingent liabilities, net of current (note 13) |
12,586 | 9,500 | ||||||
| Derivative liabilities (note 11) |
23,107 | — | ||||||
| Asset retirement obligation (note 10) |
6,550 | 5,833 | ||||||
|
|
|
|
|
|||||
| Total liabilities |
740,704 | 613,531 | ||||||
|
|
|
|
|
|||||
| Commitments and contingencies (note 13) |
||||||||
| Equity: |
||||||||
| Partners’ capital (note 9) |
53,412 | 103,164 | ||||||
| Accumulated net (loss) income |
(19,742 | ) | 17,261 | |||||
|
|
|
|
|
|||||
| Total partners’ equity |
33,670 | 120,425 | ||||||
|
|
|
|
|
|||||
| Total liabilities and equity |
$ | 774,374 | $ | 733,956 | ||||
|
|
|
|
|
|||||
See accompanying notes to financial statements.
S-10
Table of Contents
South Kent Wind LP
Statements of Operations and Comprehensive (Loss) Income
For the years ended December 31, 2014, 2013 and 2012
(In thousands of Canadian Dollars)
| 2014 | 2013 | 2012 | ||||||||||
| Revenue (note 2): |
||||||||||||
| Energy delivered |
$ | 72,633 | $ | — | $ | — | ||||||
| Compensation for forgone energy |
10,749 | — | — | |||||||||
| Other revenue |
1,597 | — | — | |||||||||
|
|
|
|
|
|
|
|||||||
| Total revenue |
84,979 | — | — | |||||||||
| Cost of revenue: |
||||||||||||
| Project expenses |
9,715 | — | — | |||||||||
| Project expenses - related parties (note 14) |
1,075 | — | — | |||||||||
| Depreciation, amortization and accretion |
28,493 | 33 | — | |||||||||
|
|
|
|
|
|
|
|||||||
| Total cost of revenue |
39,283 | 33 | — | |||||||||
|
|
|
|
|
|
|
|||||||
| Gross profit |
45,696 | (33 | ) | — | ||||||||
| Operating expenses: |
||||||||||||
| General and administrative |
756 | 661 | 27 | |||||||||
| General and administrative - related parties (note 14) |
463 | 556 | — | |||||||||
|
|
|
|
|
|
|
|||||||
| Total operating expenses |
1,219 | 1,217 | 27 | |||||||||
|
|
|
|
|
|
|
|||||||
| Operating income (loss) |
44,477 | (1,250 | ) | (27 | ) | |||||||
| Other income (expense): |
||||||||||||
| Interest expense |
(29,133 | ) | (583 | ) | — | |||||||
| Unrealized (loss) gain on derivatives (note 11) |
(52,057 | ) | 18,942 | — | ||||||||
| Other income (expense), net |
(290 | ) | 86 | 93 | ||||||||
|
|
|
|
|
|
|
|||||||
| Total other (expense) income |
(81,480 | ) | 18,445 | 93 | ||||||||
|
|
|
|
|
|
|
|||||||
| Net (loss) income |
(37,003 | ) | 17,195 | 66 | ||||||||
| Other comprehensive income |
— | — | — | |||||||||
|
|
|
|
|
|
|
|||||||
| Comprehensive (loss) income |
$ | (37,003 | ) | $ | 17,195 | $ | 66 | |||||
|
|
|
|
|
|
|
|||||||
See accompanying notes to financial statements.
S-11
Table of Contents
South Kent Wind LP
Statements of Changes in Partners’ Equity
For the years ended December 31, 2014, 2013 and 2012
(In thousands of Canadian Dollars)
| Partners’ capital |
Accumulated net income (loss) |
Total | ||||||||||
| Balance at January 1, 2012 |
$ | 22,420 | $ | — | $ | 22,420 | ||||||
| Cash contribution |
13,020 | — | 13,020 | |||||||||
| Net income |
— | 66 | 66 | |||||||||
|
|
|
|
|
|
|
|||||||
| Balance at December 31, 2012 |
35,440 | 66 | 35,506 | |||||||||
| Cash contribution |
9,016 | — | 9,016 | |||||||||
| Cash distribution |
(21,393 | ) | — | (21,393 | ) | |||||||
| Non-cash contribution |
80,101 | — | 80,101 | |||||||||
| Net income |
— | 17,195 | 17,195 | |||||||||
|
|
|
|
|
|
|
|||||||
| Balance at December 31, 2013 |
103,164 | 17,261 | 120,425 | |||||||||
| Cash distribution |
(49,752 | ) | — | (49,752 | ) | |||||||
| Net loss |
— | (37,003 | ) | (37,003 | ) | |||||||
|
|
|
|
|
|
|
|||||||
| Balance at December 31, 2014 |
$ | 53,412 | $ | (19,742 | ) | $ | 33,670 | |||||
|
|
|
|
|
|
|
|||||||
See accompanying notes to financial statements.
S-12
Table of Contents
South Kent Wind LP
For the years ended December 31, 2014, 2013 and 2012
(In thousands of Canadian Dollars)
| 2014 | 2013 | 2012 | ||||||||||
| Cash flows from operating activities: |
||||||||||||
| Net (loss) income |
$ | (37,003 | ) | $ | 17,195 | $ | 66 | |||||
| Adjustment to reconcile net (loss) income to net cash provided by (used in) operating activities: |
||||||||||||
| Unrealized loss (gain) on derivatives |
52,057 | (18,942 | ) | — | ||||||||
| Depreciation, amortization and accretion |
28,493 | 100 | — | |||||||||
| Amortization of deferred financing costs |
2,184 | — | — | |||||||||
| Bad debt expense |
— | 300 | — | |||||||||
| Interest expense added on principal |
8,092 | — | — | |||||||||
| Changes in assets and liabilities, net: |
||||||||||||
| Accrued revenue |
(15,963 | ) | — | — | ||||||||
| Sales tax recoverable |
(151 | ) | — | — | ||||||||
| Accounts payable and other accrued liabilities |
3,779 | — | — | |||||||||
| Other, net |
724 | — | (39 | ) | ||||||||
|
|
|
|
|
|
|
|||||||
| Net cash provided by (used in) operating activities |
42,212 | (1,347 | ) | 27 | ||||||||
|
|
|
|
|
|
|
|||||||
| Cash flows from investing activities: |
||||||||||||
| Consideration paid for the acquisitions of project assets |
(1,565 | ) | (1,346 | ) | — | |||||||
| Construction costs paid |
(105,376 | ) | (478,426 | ) | — | |||||||
| Property acquisition |
(6,294 | ) | (628 | ) | (178 | ) | ||||||
| Deferred development costs paid |
— | — | (12,749 | ) | ||||||||
| Decrease in restricted cash |
84,363 | — | — | |||||||||
| Increase in restricted cash |
(71,492 | ) | (21,488 | ) | — | |||||||
|
|
|
|
|
|
|
|||||||
| Net cash used in investing activities |
(100,364 | ) | (501,888 | ) | (12,927 | ) | ||||||
|
|
|
|
|
|
|
|||||||
| Cash flows from financing activities: |
||||||||||||
| Partners’ contribution |
— | 9,016 | — | |||||||||
| Proceeds from long-term debt |
126,106 | 535,754 | — | |||||||||
| Repayment of long-term debt |
(1,914 | ) | — | — | ||||||||
| Deferred financing costs paid |
— | (20,418 | ) | — | ||||||||
| Distribution to partners |
(49,752 | ) | (21,393 | ) | 13,020 | |||||||
|
|
|
|
|
|
|
|||||||
| Net cash provided by financing activities |
74,440 | 502,959 | 13,020 | |||||||||
|
|
|
|
|
|
|
|||||||
| Net change in cash and cash equivalents |
16,288 | (276 | ) | 120 | ||||||||
| Cash and cash equivalents - Beginning of year |
139 | 415 | 295 | |||||||||
|
|
|
|
|
|
|
|||||||
| Cash and cash equivalents - End of year |
$ | 16,427 | $ | 139 | $ | 415 | ||||||
|
|
|
|
|
|
|
|||||||
| Supplemental disclosure: |
||||||||||||
| Cash payments for interest and commitment fees |
$ | 17,422 | $ | 2,883 | $ | — | ||||||
| Schedule of non-cash activities: |
||||||||||||
| Transfer from deferred development costs to construction-in-progress |
$ | — | $ | 32,334 | $ | — | ||||||
| Transfer from construction-in-progress to property, plant and equipment |
$ | 716,552 | $ | — | $ | — | ||||||
| Accrued construction costs |
$ | 3,586 | $ | 42,443 | $ | — | ||||||
| Non-monetary asset contribution from partners |
$ | — | $ | 80,101 | $ | — | ||||||
| Construction loan - capitalized interest |
$ | 4,987 | $ | 8,878 | $ | — | ||||||
| Capitalized depreciation and amortization |
$ | 601 | $ | 1,201 | $ | 257 | ||||||
| Community fund commitment |
$ | — | $ | 10,000 | $ | — | ||||||
See accompanying notes to financial statements.
S-13
Table of Contents
South Kent Wind LP
December 31, 2014 and 2013
(In thousand of Canadian Dollars)
| 1 | General information |
The Partnership
South Kent Wind LP (the Partnership), a limited partnership under the laws of the Province of Ontario, was formed on January 10, 2011, as a joint venture project between Samsung Renewable Energy Inc. (Samsung) and Pattern South Kent LP Holdings LP, a subsidiary of Pattern Renewable Holdings Canada ULC (PRHC), each as 49.99% limited partners of the Partnership, and South Kent Wind GP Inc. (the GP), as the 0.02% general partner of the Partnership. The terms of the Partnership initially were governed by the Limited Partnership Agreement of the Partnership, dated January 10, 2011, which was subsequently superseded in its entirety by the Amended and Restated Limited Partnership Agreement of the Partnership, dated February 22, 2013. The Partnership was created to develop, build and operate a wind power project in the Regional Municipality of Chatham-Kent that is expected to generate 270 megawatts (MW) of power (the Project). The Project is part of Phase 1 of the Green Energy Investment Agreement that Samsung C&T Corp., a parent company of Samsung, entered into with the Government of Ontario in January 2010, subsequently amended in June 20, 2013.
On February 24, 2013, Samsung transferred all of its LP interest in the Partnership to SRE SKW LP Holdings LP, an affiliate of Samsung.
On October 2, 2013, in a series of transactions: (i) Pattern South Kent GP Holdings Inc., a wholly owned subsidiary of PRHC, transferred all of the general partner interests in Pattern South Kent LP Holdings LP to PRHC, causing Pattern South Kent LP Holdings LP to be dissolved by operation of law and PRHC to acquire the LP interests in the Partnership that previously were held by Pattern South Kent LP Holdings LP; (ii) PRHC transferred its LP interest in the Partnership and its ownership interest in Pattern South Kent GP Holdings Inc., which owned PRHC’s ownership interest in the GP, to Pattern Canada Operations Holdings ULC, an affiliate of Pattern Energy Group Inc. (Pattern); and (iii) Pattern South Kent GP Holdings Inc. was dissolved.
On December 17, 2014, Pattern Canada Operations Holdings ULC (PCOH) transferred all of its LP interest in the Partnership to Pattern Canada Finance Company ULC, a wholly owned subsidiary of PCOH.
The Partnership is controlled by its general partner, the GP, also a joint venture controlled by affiliates of Samsung and Pattern. The GP is governed by the Amended and Restated Unanimous Shareholder Agreement of the GP, dated March 6, 2013 (the Shareholder Agreement). As of December 31, 2014 and 2013, the Partnership’s ownership interests were distributed as follows:
| 2014 | 2013 | |||||||
| SRE SKW LP Holdings LP |
49.99 | % | 49.99 | % | ||||
| Pattern Canada Operations Holdings ULC |
— | 49.99 | % | |||||
| Pattern Canada Finance Company ULC |
49.99 | % | — | |||||
| South Kent Wind GP Inc. |
0.02 | % | 0.02 | % | ||||
|
|
|
|
|
|||||
| Total |
100.00 | % | 100.00 | % | ||||
|
|
|
|
|
|||||
S-14
Table of Contents
South Kent Wind LP
Notes to Financial Statements
December 31, 2014 and 2013
(In thousand of Canadian Dollars)
The Project
The Project is a 270 MW wind project consisting of 124 Siemens wind turbine generators located in the Regional Municipality of Chatham-Kent, Ontario.
On August 2, 2011, the Partnership entered into a power purchase agreement (PPA) with the Independent Electricity System Operator (IESO) related to the sale of 100% of the electrical output of the Project at prescribed electricity rates for a period of 20 years following Commercial Operation Date (COD). On March 28, 2014, the Project achieved COD and commenced commercial operations.
| 2 | Summary of significant accounting policies |
The principal accounting policies applied in the preparation of these financial statements are set out below. These policies have been consistently applied to the period presented, unless otherwise stated.
Basis of preparation
The accompanying financial statements are presented using accounting principles generally accepted in the United States of America (U.S. GAAP). The preparation of U.S. GAAP financial statements requires management to make certain estimates and assumptions that affect the reported amounts of assets and liabilities and the disclosure of contingent assets and liabilities at the date of the financial statements and the reported amounts of revenue and expenses during the reporting period. Because the use of estimates is inherent in the financial reporting process, actual results could differ from those estimates.
In recording transactions and balances resulting from business operations, the Partnership uses estimates based on the best information available. Estimates are used for such items as accrued revenue, asset retirement obligation, valuation of derivative contracts and acquisition contingencies.
These financial statements do not include assets, liabilities, revenue and expenses of the GP and limited partners. The financial statements of the Partnership reflect no provision or liability for income taxes because profits and losses of the Partnership are allocated to the partners and are included in the income tax returns of partners. Income and losses for tax purposes may differ from the financial statement amounts and the partners’ equity reflected in the financial statements does not necessarily reflect their tax basis.
Functional and presentation currency
Items included in the financial statements of the Partnership are measured using the currency of the primary economic environment in which the Partnership operates (the functional currency). The financial statements are presented in Canadian Dollars, which is the Partnership’s functional and presentation currency.
Fair value of financial instruments
ASC 820, Fair Value Measurements, defines fair value as the price at which an asset could be exchanged or a liability transferred in an orderly transaction between knowledgeable, willing parties in the principal or most advantageous market for the asset or liability. Where available, fair value is based on observable market prices or derived from such prices. Where observable prices or inputs are not available, valuation models are applied. These valuation techniques involve some level of management estimation and judgment, the degree of which is dependent on the price transparency for the instruments or market and the instruments’ complexity.
S-15
Table of Contents
South Kent Wind LP
Notes to Financial Statements
December 31, 2014 and 2013
(In thousand of Canadian Dollars)
Cash and cash equivalents
Cash and cash equivalents include cash on hand, deposits held at call with banks and other short-term highly liquid investments with original maturities of three months or less.
Restricted cash
Restricted cash consists of cash balances required to collateralize commercial bank letter of credit facilities related primarily to interconnect rights and power purchase agreements (PPAs) and for reserves required under the Partnership’s loan agreements (note 3).
Trade receivable
The Partnership’s trade receivables are generated by selling energy in Ontario, Canada, and allowance for doubtful accounts, if needed, is computed based upon management’s estimates of uncollectible accounts. As of December 31, 2014 and 2013, the Partnership has no outstanding trade receivables.
Accrued revenue
Accrued revenue represents revenues recognized on contracts for which billings have not been presented to customers as of the balance sheet date. These amounts are billed and generally collected within two months.
Concentration of credit risk and significant customer
Financial instruments that potentially subject the Partnership to concentrations of credit risk consist primarily of cash and cash equivalents, restricted cash and derivative assets. The Partnership places its cash and cash equivalents and restricted cash with high-quality institutions located in Canada, which the management believes to have minimal risk. At times, such balances may be in excess of the Canada Deposit Insurance Corporation (CDIC) insurance coverage limit. CDIC insurance currently covers up to $100 per depositor at each insured bank.
The IESO is the only customer of the Partnership, which is obligated to pay for 100% of the electrical output under a long-term, fixed priced PPA. There are no accounts receivable that are past due.
The Partnership’s derivative agreements expose the Partnership to losses under certain circumstances, such as the counterparty defaulting on its obligations under the swap agreements or if the swap agreements provide an imperfect hedge. Counterparties to the Partnership’s derivative contracts are major financial institutions that have been accorded investment grade ratings.
Construction-in-progress
Construction-in-progress represents the accumulated costs of projects in construction. Construction costs include turbines for which the Partnership has taken legal title, civil engineering, electrical and other related costs. Other capitalized costs include reclassified deferred development costs, amortization of intangible assets, amortization of deferred financing costs, capitalized interest and other costs required to place a project into commercial operation. Construction-in-progress is reclassified to property, plant and equipment when the Project begins commercial operations.
S-16
Table of Contents
South Kent Wind LP
Notes to Financial Statements
December 31, 2014 and 2013
(In thousand of Canadian Dollars)
Advance payments
Advance payments represent amounts advanced to turbine and other suppliers for the manufacture of wind turbines and other plant assets in accordance with supply agreements for the Partnership’s wind power project, which the Project has not taken title. Advance payments are reclassified to construction-in-progress when the Partnership takes legal title to the related turbines and other plant assets, and they are reclassified to property, plant and equipment when the Project achieves commercial operation. Depreciation does not commence until the Project enters commercial operation and assets are placed in service.
Property, plant and equipment
Property, plant and equipment are stated at historical cost, less accumulated depreciation. Historical cost includes expenditure that is directly attributable to the acquisition of the items. Subsequent costs are included in the asset’s carrying value or recognized as separate assets, as appropriate, only when it is probable the future economic benefits associated with the item will flow to the Partnership and the cost of the item can be measured reliably.
Asset retirement obligation included in property, plant and equipment is stated at the present value of future cash flows of asset retirement obligation.
Depreciation on property, plant and equipment is calculated using the straight-line method to allocate their cost to their residual values over their estimated useful lives. The power plant is depreciated over twenty years and the remaining assets are depreciated over five years. The assets’ residual values and useful lives are reviewed and adjusted, if appropriate, at the end of each reporting period. Repair and maintenance costs are expensed as incurred.
Intangible assets (lease options)
Lease options are recognized at fair value at the acquisition date and subsequently accounted for at cost. Lease options have a finite useful life and are carried at cost less accumulated amortization. Amortization is calculated using the straight-line method to allocate the cost of lease options over the period of expected future benefit (i.e., the contract period of each lease option). Separately acquired lease options are capitalized on the basis of the costs incurred to enter into the respective contract.
Impairment of long-lived assets
The Partnership periodically evaluates whether events have occurred that would require revision of the remaining useful life of equipment and improvements and purchased intangible assets or render them not recoverable. If such circumstances arise, the Partnership uses an estimate of the undiscounted value of expected future operating cash flows to determine whether the long-lived assets are impaired. If the aggregate undiscounted cash flows are less than the carrying amount of the assets, the resulting impairment charge to be recorded is calculated based on the excess of the carrying value of the assets over the fair value of such assets, with the fair value determined based on an estimate of discounted future cash flows. Through December 31, 2014, no impairment charges were recorded.
Interest capitalization
The Partnership capitalizes interest and related financing fees from non-recourse debt used to finance projects in construction. Capitalization is discontinued when a project reaches commercial operation.
S-17
Table of Contents
South Kent Wind LP
Notes to Financial Statements
December 31, 2014 and 2013
(In thousand of Canadian Dollars)
Derivatives
The Partnership recognizes its derivative instruments as either assets or liabilities in the balance sheets at fair value. The accounting for changes in the fair value (i.e., gains or losses) of a derivative instrument depends on whether it qualifies and has been designated as part of a hedging relationship and, further, on the type of hedging relationship.
For derivative instruments that are designated and qualify as a cash flow hedge (i.e., hedging the exposure to variability in expected future cash flows that are attributable to a particular risk), the effective portion of the gain or loss on the derivative instrument is reported as a component of other comprehensive income (OCI). Changes in the fair value of these derivatives are subsequently reclassified into earnings in the period the hedged transaction affects earnings. The ineffective portion of changes in fair value is recorded as a component of net income in the statements of operations and comprehensive income.
For undesignated derivative instruments, their change in fair value is reported as a component of net income in the statements of operations and comprehensive income.
The Partnership enters into derivative transactions for the purpose of reducing exposure to fluctuations in interest rates, such as interest rate swaps. Interest rate swaps are instruments used to fix the interest rate on variable interest rate debt.
Deferred financing costs
Financing costs incurred in connection with obtaining construction and term financing, which include direct financing, legal and other upfront costs of borrowing, are deferred and amortized over the lives of the respective loans using the effective-interest method. Amortization of deferred financing costs is capitalized during construction or expensed following commencement of commercial operation.
Accounts payable and other accrued liabilities
Trade payables are obligations to pay for goods or services that have been acquired in the ordinary course of business from suppliers. Payables with payment terms extended beyond one year from the balance sheet dates are presented as non-current liabilities.
Contingent liabilities
Contingent liabilities for environmental restoration, restructuring costs and other legal obligations are recognized when: the Partnership has a present legal obligation as a result of past events; it is probable that an outflow of resources will be required to settle the obligation; and the amount has been reasonably estimated. Contingent liabilities are not recognized for future operating losses.
Asset retirement obligation
The Partnership records an asset retirement obligation for the estimated costs of decommissioning turbines, removing above-ground installations and restoring sites, at the time when a contractual decommissioning obligation materializes. The Partnership records accretion expense, which represents the increase in the asset retirement obligation, over the remaining life of the associated wind project. Accretion expense is recorded as cost of revenue in the statements of operations and comprehensive income using accretion rates based on a credit adjusted risk free interest rates of 5.54%.
S-18
Table of Contents
South Kent Wind LP
Notes to Financial Statements
December 31, 2014 and 2013
(In thousand of Canadian Dollars)
Revenue recognition
The Partnership sells the electricity it generates under the terms of a PPA with the IESO. Revenue is recognized based upon the amount of electricity delivered at rates specified under the contracts, assuming all other revenue recognition criteria are met. The Partnership evaluates its PPA to determine whether it is in substance a lease or derivative and, if applicable, recognizes revenue pursuant to ASC 840 Leases and ASC 815 Derivatives and Hedging, respectively. As of December 31, 2014, the PPA is not accounted for as a lease or derivative and revenue is recognized on an accrual basis.
The Partnership recognizes revenue for warranty settlements and liquidated damages from a turbine manufacturer in other revenue upon resolution of outstanding contingencies. Any cash receipts for amounts subject to future adjustment or repayment are deferred in other liabilities until the final settlement amount is considered fixed and determinable.
Cost of revenue
The Partnership’s cost of revenue is comprised of direct costs of operating and maintaining its project facilities, including labor, turbine service arrangements, metering service and shadow settlement, environmental fee, land lease royalties, property tax, insurance, depreciation, amortization and accretion.
Comprehensive income
Comprehensive income consists of net income and other comprehensive income. Other comprehensive income is included in accumulated other comprehensive income in the accompanying statements of changes in partners’ equity.
Contributions
Contributions from joint venture partners are classified as partners’ equity.
Recent accounting pronouncement
In June 2014, the Financial Accounting Standards Board issued Accounting Standards Update (ASU) No. 2014-09, “Revenue from Contracts with Customers,” which outlines a comprehensive revenue recognition model and supersedes most current revenue recognition guidance. The new standard requires a company to recognize revenue upon transfer of goods or services to a customer at an amount that reflects the expected consideration to be received in exchange for those goods or services. This ASU will supersede the revenue recognition requirements in Topic 605, Revenue Recognition, and most industry-specific guidance, and creates a Topic 606 Revenue from Contracts with Customers. ASU 2014-09 will be effective for the Partnership beginning after December 15, 2016, including interim periods. The Partnership is still evaluating the impact of the adoption of ASU 2014-09.
S-19
Table of Contents
South Kent Wind LP
Notes to Financial Statements
December 31, 2014 and 2013
(In thousand of Canadian Dollars)
| 3 | Restricted cash |
The following table presents the components of restricted cash:
| December 31, | ||||||||
| 2014 | 2013 | |||||||
| Completion reserve account |
$ | 6,614 | $ | — | ||||
| Siemens incentive reserve account |
4,316 | — | ||||||
| Security deposit for letter of guarantee |
2,639 | 10,796 | ||||||
| 10% holdback account for contractors |
448 | 16,092 | ||||||
|
|
|
|
|
|||||
| Subtotal |
14,017 | 26,888 | ||||||
| Less: current portion |
(3,087 | ) | (26,888 | ) | ||||
|
|
|
|
|
|||||
| Restricted cash, non-current |
$ | 10,930 | $ | — | ||||
|
|
|
|
|
|||||
The amount in the completion reserve account is reserved to pay outstanding project costs specified during term conversion (note 8). Upon full payment of outstanding project costs, the remaining balance will be released from restricted cash.
The amount in the Siemens incentive account is reserved to pay operational incentive payments to Siemens if the Siemens Three-Year Employment Objective is satisfied by December 31, 2015 (note 13).
| 4 | Other current assets |
The following table presents the components of other current assets:
| December 31, | ||||||||
| 2014 | 2013 | |||||||
| Mortgage debt receivable, net of bad debt provision of $300 |
$ | — | $ | 828 | ||||
| Refundable deposit on COD |
86 | 86 | ||||||
| Prepaid expenses |
494 | 484 | ||||||
| Accrued interest income |
35 | 117 | ||||||
|
|
|
|
|
|||||
| $ | 615 | $ | 1,515 | |||||
|
|
|
|
|
|||||
| 5 | Construction-in-progress |
Construction-in-progress includes capitalized interest expense, deferred financing costs, and commitment fees of $0 and $12,584 as of December 31, 2014 and 2013, respectively. During 2014, $5,761 was capitalized to construction-in-progress. The project achieved COD on March 28, 2014 at which time all amounts capitalized to construction-in-progress were reclassified to property, plant and equipment.
S-20
Table of Contents
South Kent Wind LP
Notes to Financial Statements
December 31, 2014 and 2013
(In thousand of Canadian Dollars)
| 6 | Property, plant and equipment |
The following table reflects the categories within property, plant and equipment at historical cost:
| December 31, | ||||||||
| 2014 | 2013 | |||||||
| Power plant |
$ | 731,307 | $ | — | ||||
| Furniture, fixtures and equipment |
501 | 203 | ||||||
| Asset retirement obligation - asset |
6,290 | — | ||||||
|
|
|
|
|
|||||
| Subtotal |
738,098 | 203 | ||||||
| Less: Accumulated depreciation |
(28,272 | ) | (87 | ) | ||||
|
|
|
|
|
|||||
| $ | 709,826 | $ | 116 | |||||
|
|
|
|
|
|||||
Depreciation expense of $28,185, $33, and $0 was charged to the statements of operations and comprehensive income for the years ended December 31, 2014, 2013 and 2012, respectively, and $0 and $6 was charged to construction-in-progress in the balance sheets as of December 31, 2014 and 2013, respectively.
| 7 | Intangible assets |
| December 31, | ||||||||
| Lease options | 2014 | 2013 | ||||||
| Beginning net book value |
$ | 431 | $ | 82 | ||||
| Additions |
415 | 555 | ||||||
| Amortization expense |
(92 | ) | (206 | ) | ||||
|
|
|
|
|
|||||
| Closing net book value |
$ | 754 | $ | 431 | ||||
|
|
|
|
|
|||||
| December 31, | ||||||||
| Lease options | 2014 | 2013 | ||||||
| Cost |
$ | 1,438 | $ | 1,023 | ||||
| Accumulated amortization |
(684 | ) | (592 | ) | ||||
|
|
|
|
|
|||||
| Net book value |
$ | 754 | $ | 431 | ||||
|
|
|
|
|
|||||
Amortization expense of $48, $0, and $0 was charged to the statements of operations and comprehensive income for the years ended December 31, 2014, 2013 and 2012, respectively and $44 and $206 was capitalized to construction-in-progress on the balance sheets as of December 31, 2014 and 2013, respectively.
| 8 | Long-term debt |
On March 8, 2013, the Partnership signed a credit facility agreement with a syndicate of lenders consisting of 15 different financial institutions for a term of construction period plus seven years at a rate of Canadian Dealer Offered Rate (CDOR) plus 2.5% per annum for the first four years and CDOR plus 2.75% per annum
S-21
Table of Contents
South Kent Wind LP
Notes to Financial Statements
December 31, 2014 and 2013
(In thousand of Canadian Dollars)
thereafter. The credit facilities under the agreement include a $683,817 construction facility, letter of credit facility and an interest rate hedge facility. The funds from these facilities were utilized to finance the construction of the Project and to run the Project operations.
The Partnership reached full commercial operations in March 2014, and the construction facility converted to term loan on August 28, 2014. The loan matures on August 27, 2021. In connection with the financing agreement, the Partnership entered into interest rate swaps on 90% of the loan commitment. Interest payments on the construction facility were deferred prior to term conversion and added to the loan principal at the time of conversion.
Collateral under the financing agreement consists of substantially all of the Partnership’s assets. Its loan agreement contains a broad range of covenants that, subject to certain exceptions, restrict the Partnership’s ability to incur debt, grant liens, sell or lease assets, transfer equity interest, dissolve, pay distributions and change its business. All the limited and general partners and shareholders of general partners pledged shares of partnership units or common stock owned as collateral for the loan.
Terms and conditions of outstanding borrowings were as follows:
| December 31, | Interest rate as of December 31, |
Interest type |
Loan type |
|||||||||||||||||||||
| 2014 | 2013 | 2014 | 2013 | |||||||||||||||||||||
| Construction facility loan |
$ | — | $ | 544,632 | — | 3.75 | % | Variable | Project financing | |||||||||||||||
| Term loan |
681,902 | — | 3.78 | % | — | Variable | Project financing | |||||||||||||||||
| Less: Current portion |
(23,185 | ) | (1,914 | ) | ||||||||||||||||||||
|
|
|
|
|
|||||||||||||||||||||
| Net of current |
$ | 658,717 | $ | 542,718 | ||||||||||||||||||||
|
|
|
|
|
|||||||||||||||||||||
The following are the amounts due under long-term debt as of December 31, 2014:
| 2015 |
$ | 23,185 | ||
| 2016 |
22,109 | |||
| 2017 |
25,773 | |||
| 2018 |
26,819 | |||
| 2019 |
28,144 | |||
| Thereafter |
555,872 | |||
|
|
|
|||
| $ | 681,902 | |||
|
|
|
Interest and commitment fees incurred, and interest expense recorded in the statements of operations and comprehensive income are as follows:
| Interest incurred |
$ | 31,450 | ||
| Commitment fees incurred |
703 | |||
| Amortization of deferred financing costs |
2,741 | |||
| Capitalized interest, commitment and amortization |
(5,761 | ) | ||
|
|
|
|||
| Interest expense |
$ | 29,133 | ||
|
|
|
Revolving credit facility
On August 28, 2014, letters of credit of $40,600 and $12,000 were issued upon term conversion for debt service reserve and operations and maintenance reserve, respectively, with a seven-year term. As of December 31, 2014, the letters of credit facility did not have an outstanding balance, and no loans were drawn in 2014.
S-22
Table of Contents
South Kent Wind LP
Notes to Financial Statements
December 31, 2014 and 2013
(In thousand of Canadian Dollars)
Funds, when and if drawn on the facility, accrue interest at 1.5% plus Prime Rate, and at the Partners’ option the rate can be converted to a rate of CDOR plus 2.5% per annum for the first four years and CDOR plus 2.75% per annum thereafter.
| 9 | Contributions from/distributions to joint venture partners |
| 2014 | ||||||||||||||||
| SRE SKW LP Holdings LP1 |
Pattern Canada Finance Company ULC3 |
South Kent Wind GP Inc. |
Total | |||||||||||||
| Balance, Beginning of year |
$ | 51,572 | $ | 51,572 | $ | 20 | $ | 103,164 | ||||||||
|
|
|
|
|
|
|
|
|
|||||||||
| Cash distribution on |
||||||||||||||||
| Aug. 28, 2014 |
(18,828 | ) | (18,828 | ) | (8 | ) | (37,664 | ) | ||||||||
| Dec. 1, 2014 |
(6,412 | ) | (5,674 | ) | (2 | ) | (12,088 | ) | ||||||||
|
|
|
|
|
|
|
|
|
|||||||||
| (25,240 | ) | (24,502 | ) | (10 | ) | (49,752 | ) | |||||||||
|
|
|
|
|
|
|
|
|
|||||||||
| Balance, End of year |
$ | 26,332 | $ | 27,070 | $ | 10 | $ | 53,412 | ||||||||
|
|
|
|
|
|
|
|
|
|||||||||
| 2013 | ||||||||||||||||
| SRE SKW LP Holdings LP1 |
Pattern Canada Operations Holdings ULC2 |
South Kent Wind GP Inc. |
Total | |||||||||||||
| Balance, Beginning of year |
$ | 17,716 | $ | 17,716 | $ | 8 | $ | 35,440 | ||||||||
|
|
|
|
|
|
|
|
|
|||||||||
| Cash contribution on |
||||||||||||||||
| Jan. 3, 2013 |
1,699 | 1,699 | 2 | 3,400 | ||||||||||||
| Jan. 11, 2013 |
1,450 | 1,450 | — | 2,900 | ||||||||||||
| Feb. 5, 2013 |
1,350 | 1,350 | — | 2,700 | ||||||||||||
| Feb. 22, 2013 |
— | — | 4 | 4 | ||||||||||||
| Mar. 6, 2013 |
— | — | 12 | 12 | ||||||||||||
|
|
|
|
|
|
|
|
|
|||||||||
| 4,499 | 4,499 | 18 | 9,016 | |||||||||||||
|
|
|
|
|
|
|
|
|
|||||||||
| Cash distribution on |
||||||||||||||||
| Mar. 7, 2013 |
(1,126 | ) | (1,126 | ) | — | (2,252 | ) | |||||||||
| Mar. 8, 2013 |
(9,568 | ) | (9,568 | ) | (6 | ) | (19,142 | ) | ||||||||
|
|
|
|
|
|
|
|
|
|||||||||
| (10,694 | ) | (10,694 | ) | (6 | ) | (21,394 | ) | |||||||||
|
|
|
|
|
|
|
|
|
|||||||||
| Non-cash contribution - vend in |
||||||||||||||||
| Feb. 22, 2013 |
9,857 | 9,857 | — | 19,714 | ||||||||||||
| Mar. 6, 2013 |
29,500 | 29,500 | — | 59,000 | ||||||||||||
| Mar. 7, 2013 |
694 | 694 | — | 1,388 | ||||||||||||
|
|
|
|
|
|
|
|
|
|||||||||
| 40,051 | 40,051 | — | 80,102 | |||||||||||||
|
|
|
|
|
|
|
|
|
|||||||||
| Balance, End of year |
$ | 51,572 | $ | 51,572 | $ | 20 | $ | 103,164 | ||||||||
|
|
|
|
|
|
|
|
|
|||||||||
| 1 | On February 24, 2013, Samsung Renewable Energy Inc. transferred its ownership interest to SRE SKW LP Holdings LP at fair value. |
| 2 | On October 2, 2013, Pattern South Kent LP Holdings LP, in a series of transactions, transferred its ownership interest in South Kent Wind LP to Pattern Canada Operations Holdings ULC at fair value. |
| 3 | On December 17, 2014, Pattern Canada Operations Holdings ULC, in a series of transactions, transferred its ownership interest in South Kent Wind LP to Pattern Canada Finance Company ULC at fair value. |
S-23
Table of Contents
South Kent Wind LP
Notes to Financial Statements
December 31, 2014 and 2013
(In thousand of Canadian Dollars)
Pursuant to an agreement dated February 19, 2013 between the Partnership, Samsung, PRHC and certain of their respective affiliates, certain project development costs in the amount of $19,714 incurred by Pattern were contributed to the Partnership. In order to maintain the equal ownership within the Partnership, Samsung acquired an additional interest in the Partnership for consideration payable to PRHC in cash and through the exchange of ownership interest in another partnership entity related to both Samsung and PRHC. This transaction has no impact on the Partnership.
Pursuant to a series of Assignment and Assumption Agreements dated March 6, 2013 between and/or among Samsung, PRHC, the Partnership, and various affiliates of Samsung and PRHC, a construction deposit of $59,000 placed with an affiliate of Siemens AG by Samsung and Pattern was contributed to the Partnership in accordance with a Memorandum of Understanding (MOU) signed on October 30, 2012 on behalf of the Partnership.
Pursuant to a series of Assignment and Assumption Agreements dated March 6, 2013 between and/or among Samsung, PRHC, the Partnership, and various affiliates of Samsung and PRHC, certain project development costs, which were not part of the previous contribution on February 19, 2013, in the amount of $1,388 incurred by Pattern were contributed to the Partnership. Afterward, Samsung acquired additional interest in the Partnership for a cash consideration payable to an affiliate of PRHC. This transaction has no impact on the Partnership.
| 10 | Asset retirement obligation |
The Partnership’s asset retirement obligation represents the estimated cost of decommissioning the turbines, removing above-ground installations and restoring the sites at a date that is 20 years from the commencement of commercial operations.
The following table presents a reconciliation of the beginning and ending aggregate carrying amounts of the asset retirement obligation:
| December 31, | ||||||||
| 2014 | 2013 | |||||||
| Asset retirement obligation, beginning of year |
$ | 5,833 | $ | — | ||||
| Additions |
457 | 5,833 | ||||||
| Accretion expense |
260 | — | ||||||
|
|
|
|
|
|||||
| Asset retirement obligation, end of year |
$ | 6,550 | $ | 5,833 | ||||
|
|
|
|
|
|||||
| 11 | Derivatives |
On March 14, 2013, the Partnership entered into interest rate swaps to manage exposure to interest rate risk on its long-term debt. The interest rate swaps are undesignated derivatives that are used to mitigate exposure to variable interest rate debt by exchanging variable interest rate payments for fixed rate payments of 3.04%.
S-24
Table of Contents
South Kent Wind LP
Notes to Financial Statements
December 31, 2014 and 2013
(In thousand of Canadian Dollars)
The following table presents the amounts that are recorded in the Partnership’s balance sheets as of December 31, 2014 and 2013, respectively:
Undesignated derivative instruments classified as assets (liabilities)
| As of December 31, 2014 | For the year ended December 31, 2014 |
|||||||||||||||||||||||
| Fair market value | Gain (Loss) recognized |
Gain (Loss) recognized |
||||||||||||||||||||||
| Derivative type |
Quantity | Maturity date |
Current portion |
Non-current portion |
into earnings |
into OCI |
||||||||||||||||||
| Interest rate swaps |
13 | March 31, 2032 | $ | (10,008 | ) | $ | (23,107 | ) | $ | (52,057 | ) | $ | — | |||||||||||
|
|
|
|
|
|
|
|
|
|||||||||||||||||
| As of December 31, 2013 | For the year ended December 31, 2013 |
|||||||||||||||||||||||
| Fair market value | Gain recognized |
Gain recognized |
||||||||||||||||||||||
| Derivative type |
Quantity | Maturity date |
Current portion |
Non-current portion |
into earnings |
into OCI |
||||||||||||||||||
| Interest rate swaps |
13 | March 31, 2032 | $ | (7,815 | ) | $ | 26,757 | $ | 18,942 | $ | — | |||||||||||||
|
|
|
|
|
|
|
|
|
|||||||||||||||||
| 12 | Fair value measurement |
The Partnership’s fair value measurements incorporate various factors, including the credit standing and performance risk of the counterparties, the applicable exit market, and specific risks inherent in the instrument. Non-performance and credit risk adjustments on risk management instruments are based on current market inputs when available, such as credit default swap spreads. When such information is not available, internal models are used.
Assets and liabilities recorded at fair value in the financial statements are categorized based on the level of judgment associated with the inputs used to measure their fair value. Hierarchical levels directly related to the amount of subjectivity associated with the inputs to valuation of these assets or liabilities are as follows:
Level 1 - Inputs are unadjusted, quoted prices in active markets for identical assets or liabilities at the measurement date.
Level 2 - Inputs (other than quoted prices included in Level 1) are either directly or indirectly observable for the asset or liability through correlation with market data at the measurement date and for the duration of the instrument’s anticipated life.
Level 3 - Unobservable inputs that are supported by little or no market activity and that are significant to the fair value of the assets or liabilities and which reflect management’s best estimate of what market participants would use in pricing the asset or liability at the measurement date. Consideration is given to the risk inherent in the valuation technique and the risk inherent in the inputs to the model.
Short-term financial instruments consist principally of cash and cash equivalents, restricted cash, accounts payable, and other accrued liabilities. Based on the nature and short maturity of these instruments their fair value is approximated using carrying cost and they are presented in the financial statements at carrying cost.
S-25
Table of Contents
South Kent Wind LP
Notes to Financial Statements
December 31, 2014 and 2013
(In thousand of Canadian Dollars)
Long-term debt is presented on the balance sheets at amortized cost. The fair value of the Partnership’s long-term debt is approximately $747,795 as of December 31, 2014. It is estimated based on current rates that would be available for debt of similar terms which is not significantly different from its stated value.
Derivatives are presented in the financial statements at fair value. The interest rate swaps were valued by discounting the net cash flows using the forward CDOR curve with the valuations adjusted by the counterparties’ credit default swap rate.
The following table presents the fair values according to each defined level.
Financial assets (liabilities) measured on a recurring basis:
| Level 1 | Level 2 | Level 3 | ||||||||||
| December 31, 2014 |
||||||||||||
| Interest rate swaps |
$ | — | $ | (33,114 | ) | $ | — | |||||
|
|
|
|
|
|
|
|||||||
| December 31, 2013 |
||||||||||||
| Interest rate swaps |
$ | — | $ | 18,942 | $ | — | ||||||
|
|
|
|
|
|
|
|||||||
| 13 | Commitments and contingencies |
Power Purchase Agreement
The Partnership entered into a PPA with the Ontario Power Authority on August 2, 2011, which subsequently merged with the IESO. The contract capacity of the PPA is defined as 270 MW and the term of the PPA is 20 years from COD. As a result of the PPA, the electrical output from the Project was sold at electricity price equal to $0.146 per MWh in 2014, and 20% of the price will be increased by the Consumer Price Index in 2015 and every year thereafter. The Partnership has provided to the IESO initial security of $0.02 per kW of contract capacity. The Partnership provided a letter of guarantee amounting to $8,100 to the IESO in 2013, as the initial and incremental security agreed within the PPA. Korea Exchange Bank of Canada issued the letter of guarantee for the Partnership, based on a restricted term deposit of $8,100, which was canceled and subsequently the restricted term deposit was released on June 17, 2014 as the Project achieved COD.
On January 29, 2013 and August 22, 2013, the Partnership amended the PPA by way of an amending agreement with the IESO in connection with announced changes in the market rules governing the dispatch of certain intermittent generators, including those connected to the IESO-controlled grid. Among other provisions, the amendment limits the amount of economic curtailment to which the Project is subject.
Community Fund Agreement
On April 17, 2013, the GP, in its capacity as general partner and on behalf of the Partnership, entered into a South Kent Wind Community Fund Agreement with Chatham-Kent Community Foundation, in which the Partnership committed to twenty annual contributions of $500 plus an initial contribution of $1,000. In April 2013, the initial $1,000 was paid upon close of construction financing and recorded as construction-in-progress. The remaining payments were recorded as a liability in the amount of $9,500.
Operational Incentive Agreement
On March 8, 2013, an Operational Incentive Agreement was entered into between Samsung, an affiliate of PRHC and Siemens Canada Limited to define operational objectives and the terms and conditions upon
S-26
Table of Contents
South Kent Wind LP
Notes to Financial Statements
December 31, 2014 and 2013
(In thousand of Canadian Dollars)
which the Partnership may pay operational incentive payments to Siemens for achieving one or more of such operational objectives under the turbine supply agreements of certain projects under development by Samsung and affiliates of PRHC, including the Project. Siemens earned an initial payment of $1,079 in 2013 for having satisfied the Peak Capacity Objective defined under the agreement. $3,586 was recorded as long-term contingent liabilities which will be due to Siemens if the Siemens Thee-Year Employment Objective is satisfied by December 31, 2015 (Note 3).
The operational incentive payment shall not exceed any of the applicable maximums of (a) $0.02 per kW of the agreed de-rated capacity (270MWh) of wind turbines purchased under the TSA for the Project, and (b) an aggregate of $15,000 under all TSAs for all projects subject to the Operational Incentive Agreement, including the Project, and other affiliated wind projects.
Land Lease Agreements
Lease payments, including amortization of the lease option, of $2,433, $0, and $0 were charged to the statements of operations and comprehensive income for the years ended December 31, 2014, 2013 and 2012, respectively, and $44 and $714 were capitalized to construction-in-progress in the balance sheets as of December 31, 2014 and 2013 respectively.
The future minimum payments related to these leases as of December 31, 2014 are as follows:
| 2015 |
$ | 3,798 | ||
| 2016 |
3,805 | |||
| 2017 |
3,818 | |||
| 2018 |
3,832 | |||
| 2019 |
3,858 | |||
| Thereafter |
57,189 | |||
|
|
|
|||
| Total |
$ | 76,300 | ||
|
|
|
| 14 | Related party transactions |
The Partnership is controlled by the GP, which is jointly controlled by Samsung and Pattern in accordance with the terms of the Shareholder Agreement. Certain terms of the Samsung Pattern Joint Venture Wind Development Agreement, entered into between Samsung and an affiliate of PRHC on July 27, 2010, directed the responsibilities of Samsung and PRHC during the development of the Project.
The following transactions were carried out with related parties:
| a) | Management, Operation, and Maintenance Agreement (MOMA) |
On March 8, 2013, the Partnership entered into a MOMA with Pattern Operators Canada ULC, which is owned by an affiliate of Pattern to operate and manage the maintenance of the wind plant and to perform certain other services pertaining to the wind plant in accordance with terms and conditions set forth in the MOMA.
The fixed annual fee for the service is $855 pro-rated for the period from March 8, 2013 until COD and then was increased to $1,425 until the end of the term (20 years from COD). The amount of $214 and $627 was capitalized and recorded to construction-in-progress in the balance sheets as of December 31, 2014 and 2013, respectively, and $1,075, $0 and $0 was charged to the statements of operations and comprehensive income for the years ended December 31, 2014, 2013 and 2012, respectively.
S-27
Table of Contents
South Kent Wind LP
Notes to Financial Statements
December 31, 2014 and 2013
(In thousand of Canadian Dollars)
| b) | Engineering Procurement and Construction Contract (EPC Contract) |
On March 8, 2013, the Partnership entered into an EPC contract with SRE SKW EPC LP, which is 100% owned by Samsung, to build the balance of plant. $29,122 and $184,067 has been invoiced to the Partnership as of December 31, 2014 and 2013, respectively, which was capitalized and reclassed to property, plant and equipment in the balance sheets upon achievement of COD.
| c) | Project Administration Agreement (PAA) |
On March 8, 2013, the Partnership entered into the PAA with SRE Wind PA LP (PA), which is 100% owned by Samsung to supply project administrative services.
The fixed annual fee for the service was $350 retroactively pro-rated for the period from June 15, 2012 until COD, and then was increased to $500. $463 and $556 was invoiced to the Partnership for the years ended December 31, 2014 and 2013, respectively, and expensed in the statements of operations and comprehensive income. The amount expensed in 2013 included $192 of service fees related to 2012.
| d) | The Partnership recorded the following balances with related parties: |
| 2014 | 2013 | |||||||
| Related party payable and accrued liabilities |
$ | 2,141 | $ | 42,812 | ||||
| Deferred development costs transferred |
$ | — | $ | 79,450 | ||||
| e) | The Partnership recorded the following transactions with related parties: |
| 2014 | 2013 | 2012 | ||||||||||
| Project expenses |
$ | 1,075 | $ | — | $ | — | ||||||
| General and administrative |
$ | 463 | $ | 556 | $ | — | ||||||
| 15 | Subsequent events |
There were no material subsequent events.
S-28
Table of Contents
Financial Statements
December 31, 2014, 2013 and 2012
(in thousands of Canadian Dollars)
S-29
Table of Contents
| Contents |
Page | |||
| S-31 | ||||
| Financial Statements |
||||
| S-33 | ||||
| S-34 | ||||
| S-35 | ||||
| S-36 | ||||
| S-37 | ||||
S-30
Table of Contents
February 24, 2015
To the Partners of
Grand Renewable Wind LP
We have audited the accompanying balance sheets of Grand Renewable Wind LP as of December 31, 2014 and 2013 and the related statement of operations and comprehensive loss, changes in partners’ capital, and cash flows for each of the years in the two-year period ended December 31, 2014. Management is responsible for these financial statements. Our responsibility is to express an opinion on these financial statements based on our audits.
We conducted our audits in accordance with the standards of the Public Company Accounting Oversight Board (United States). Those standards require that we plan and perform the audit to obtain reasonable assurance about whether the financial statements are free of material misstatement. Our audits of the financial statements included examining, on a test basis, evidence supporting the amounts and disclosures in the financial statements, assessing the accounting principles used and significant estimates made by management, and evaluating the overall financial statement presentation. We were not engaged to perform an audit of the company’s internal control over financial reporting. Our audits included consideration of internal control over financial reporting as a basis for designing audit procedures that are appropriate in the circumstances, but not for the purpose of expressing an opinion on the effectiveness of the company’s internal control over financial reporting. Accordingly, we express no such opinion. Our audit also included performing such other procedures as we considered necessary in the circumstances. We believe that our audits provide a reasonable basis for our opinion.
In our opinion, the financial statements referred to above present fairly, in all material respects, the financial position of Grand Renewable Wind LP as of December 31, 2014 and 2013 and the results of its operations and its cash flows for each of the years in the two-year period ended December 31, 2014 in conformity with accounting principles generally accepted in the United States of America.
/s/ PricewaterhouseCoopers LLP
Chartered Professional Accountants, Licensed Public Accountants
PricewaterhouseCoopers LLP
PwC Tower, 18 York Street, Suite 2600, Toronto, Ontario, Canada M5J 0B2
T: +1 416 863 1133, F: +1 416 365 8215, www.pwc.com/ca
“PwC” refers to PricewaterhouseCoopers LLP, an Ontario limited liability partnership.
S-31
Table of Contents
May 31, 2013
Independent Auditor’s Report
To the Partners of
Grand Renewable Wind LP
We have audited the accompanying financial statements of Grand Renewable Wind LP, which comprise the statements of operations and comprehensive loss, changes in partners’ equity, and cash flows for the year ended December 31, 2012, and the related notes, which comprise a summary of significant accounting policies and other explanatory information.
Management’s responsibility for the financial statements
Management is responsible for the preparation and fair presentation of the financial statements in accordance with accounting principles generally accepted in the United States of America; this includes the design, implementation, and maintenance of internal control relevant to the preparation and fair presentation of financial statements that are free from material misstatement, whether due to fraud or error.
Auditor’s responsibility
Our responsibility is to express an opinion on the financial statements based on our audit. We conducted our audit in accordance with auditing standards generally accepted in the United States of America. Those standards require that we plan and perform the audit to obtain reasonable assurance about whether the financial statements are free from material misstatement.
An audit involves performing procedures to obtain audit evidence about the amounts and disclosures in the financial statements. The procedures selected depend on our judgment, including the assessment of the risks of material misstatement of the financial statements, whether due to fraud or error. In making those risk assessments, we consider internal control relevant to the entity’s preparation and fair presentation of the financial statements in order to design audit procedures that are appropriate in the circumstances, but not for the purpose of expressing an opinion on the effectiveness of the entity’s internal control. Accordingly, we express no such opinion. An audit also includes evaluating the appropriateness of accounting policies used and the reasonableness of significant accounting estimates made by management, as well as evaluating the overall presentation of the financial statements.
We believe that the audit evidence we have obtained is sufficient and appropriate to provide a basis for our audit opinion.
Opinion
In our opinion, the financial statements referred to above present fairly, in all material respects, the results of operations of Grand Renewable Wind LP for the year ended December 31, 2012 in accordance with accounting principles generally accepted in the United States of America.
/s/ PricewaterhouseCoopers LLP
Chartered Professional Accountants, Licensed Public Accountants
PricewaterhouseCoopers LLP
PwC Tower, 18 York Street, Suite 2600, Toronto, Ontario, Canada M5J 0B2
T: +1 416 863 1133, F: +1 416 365 8215, www.pwc.com/ca
“PwC” refers to PricewaterhouseCoopers LLP, an Ontario limited liability partnership.
S-32
Table of Contents
Grand Renewable Wind LP
As of December 31, 2014 and 2013
(In thousands of Canadian Dollars)
| 2014 | 2013 | |||||||
| ASSETS |
||||||||
| Current assets: |
||||||||
| Cash and cash equivalents |
$ | 2,596 | $ | 4,387 | ||||
| Restricted cash (note 3) |
6,228 | 6,822 | ||||||
| Sales tax recoverable |
6,586 | 12,265 | ||||||
| Accrued revenue (note 2) |
3,498 | — | ||||||
| Other current assets (note 4) |
337 | 819 | ||||||
|
|
|
|
|
|||||
| Total current assets |
19,245 | 24,293 | ||||||
| Advance payment |
— | 139,176 | ||||||
| Construction-in-progress (note 5) |
— | 46,933 | ||||||
| Property, plant and equipment - net of accumulated depreciation of $1,350 and $24 in 2014 and 2013, respectively (note 6) |
414,068 | 44 | ||||||
| Intangible assets - net of accumulated amortization of $7 and $0 in 2014 and 2013, respectively (note 7) |
1,665 | — | ||||||
| Deferred financing costs - net of accumulated amortization of $1,064 and $49 in 2014 and 2013, respectively |
9,897 | 10,912 | ||||||
|
|
|
|
|
|||||
| Total assets |
$ | 444,875 | $ | 221,358 | ||||
|
|
|
|
|
|||||
| LIABILITIES & EQUITY |
||||||||
| Current liabilities: |
||||||||
| Accounts payable and other accrued liabilities |
$ | 18,335 | $ | 70,035 | ||||
| Accounts payable and other accrued liabilities - related parties (note 15) |
4,274 | — | ||||||
| Current portion of long-term debt (note 9) |
9,172 | — | ||||||
| Current portion of long-term contingent liabilities (note 14) |
— | 761 | ||||||
| Derivative liabilities, current (note 12) |
7,040 | — | ||||||
| Other current liabilities (note 8) |
1,857 | 19 | ||||||
|
|
|
|
|
|||||
| Total current liabilities |
40,678 | 70,815 | ||||||
| Long-term debt, net of current (note 9) |
340,411 | 82,877 | ||||||
| Long-term contingent liabilities, net of current (note 14) |
1,976 | — | ||||||
| Derivative liabilities (note 12) |
38,059 | 10,094 | ||||||
| Asset retirement obligation (note 11) |
3,074 | 496 | ||||||
|
|
|
|
|
|||||
| Total liabilities |
424,198 | 164,282 | ||||||
| Commitments and contingencies (note 14) |
||||||||
| Equity: |
||||||||
| Partners’ capital (note 10) |
67,990 | 67,990 | ||||||
| Accumulated net loss |
(19,532 | ) | (2,067 | ) | ||||
| Accumulated other comprehensive loss |
(27,781 | ) | (8,847 | ) | ||||
|
|
|
|
|
|||||
| Total partners’ equity |
20,677 | 57,076 | ||||||
|
|
|
|
|
|||||
| Total liabilities and equity |
$ | 444,875 | $ | 221,358 | ||||
|
|
|
|
|
|||||
See accompanying notes to financial statements.
S-33
Table of Contents
Grand Renewable Wind LP
Statements of Operations and Comprehensive (Loss) Income
For the years ended December 31, 2014, 2013 and 2012
(In thousands of Canadian Dollars)
| 2014 | 2013 | 2012 | ||||||||||
| Revenue (note 2): |
||||||||||||
| Energy delivered |
$ | 3,355 | $ | — | $ | — | ||||||
| Other revenue |
136 | — | — | |||||||||
|
|
|
|
|
|
|
|||||||
| Total revenue |
3,491 | — | — | |||||||||
| Cost of revenue: |
||||||||||||
| Project expenses |
4 | — | — | |||||||||
| Project expenses - related parties (note 15) |
75 | — | — | |||||||||
| Depreciation, amortization and accretion |
1,326 | — | — | |||||||||
|
|
|
|
|
|
|
|||||||
| Total cost of revenue |
1,405 | — | — | |||||||||
|
|
|
|
|
|
|
|||||||
| Gross profit |
2,086 | — | — | |||||||||
| Operating expenses: |
||||||||||||
| General and administrative |
1,345 | 337 | 15 | |||||||||
| General and administrative - related parties (note 15) |
288 | 433 | — | |||||||||
|
|
|
|
|
|
|
|||||||
| Total operating expenses |
1,633 | 770 | 15 | |||||||||
|
|
|
|
|
|
|
|||||||
| Operating income (loss) |
453 | (770 | ) | (15 | ) | |||||||
| Other income (expense): |
||||||||||||
| Interest expense |
(1,697 | ) | (147 | ) | — | |||||||
| Unrealized loss on derivatives (note 12) |
(16,072 | ) | (1,247 | ) | — | |||||||
| Other (expense) income, net |
(149 | ) | 61 | 51 | ||||||||
|
|
|
|
|
|
|
|||||||
| Total other (expense) income |
(17,918 | ) | (1,333 | ) | 51 | |||||||
|
|
|
|
|
|
|
|||||||
| Net (loss) income |
(17,465 | ) | (2,103 | ) | 36 | |||||||
| Other comprehensive loss: |
||||||||||||
| Effective portion of change in fair value of derivatives (notes 12 and 13) |
(18,934 | ) | (8,847 | ) | — | |||||||
|
|
|
|
|
|
|
|||||||
| Comprehensive (loss) income |
$ | (36,399 | ) | $ | (10,950 | ) | $ | 36 | ||||
|
|
|
|
|
|
|
|||||||
See accompanying notes to financial statements.
S-34
Table of Contents
Grand Renewable Wind LP
Statements of Changes in Partners’ Equity
For the years ended December 31, 2014, 2013 and 2012
(In thousands of Canadian Dollars)
| Partners’ capital |
Accumulated net income (loss) |
Accumulated other comprehensive loss |
Total | |||||||||||||
| Balance at January 1, 2012 |
$ | 4,410 | $ | — | $ | — | $ | 4,410 | ||||||||
| Cash contribution |
3,330 | — | — | 3,330 | ||||||||||||
| Net income |
— | 36 | — | 36 | ||||||||||||
|
|
|
|
|
|
|
|
|
|||||||||
| Balance at December 31, 2012 |
7,740 | 36 | — | 7,776 | ||||||||||||
| Cash contribution |
32,410 | — | — | 32,410 | ||||||||||||
| Non-cash contribution |
27,840 | — | — | 27,840 | ||||||||||||
| Effective portion of change in fair value of derivatives |
— | — | (8,847 | ) | (8,847 | ) | ||||||||||
| Net loss |
— | (2,103 | ) | — | (2,103 | ) | ||||||||||
|
|
|
|
|
|
|
|
|
|||||||||
| Balance at December 31, 2013 |
67,990 | (2,067 | ) | (8,847 | ) | 57,076 | ||||||||||
| Effective portion of change in fair value of derivatives |
— | — | (18,934 | ) | (18,934 | ) | ||||||||||
| Net loss |
— | (17,465 | ) | — | (17,465 | ) | ||||||||||
|
|
|
|
|
|
|
|
|
|||||||||
| Balance at December 31, 2014 |
$ | 67,990 | $ | (19,532 | ) | $ | (27,781 | ) | $ | 20,677 | ||||||
|
|
|
|
|
|
|
|
|
|||||||||
See accompanying notes to financial statements.
S-35
Table of Contents
Grand Renewable Wind LP
For the years ended December 31, 2014, 2013 and 2012
(In thousands of Canadian Dollars)
| 2014 | 2013 | 2012 | ||||||||||
| Cash flows from operating activities: |
||||||||||||
| Net (loss) income |
$ | (17,465 | ) | $ | (2,103 | ) | $ | 36 | ||||
| Adjustments to reconcile net (loss) income to net cash (used in) provided by operating activities |
||||||||||||
| Unrealized loss on derivatives |
16,072 | 1,247 | — | |||||||||
| Depreciation, amortization and accretion |
1,332 | — | — | |||||||||
| Amortization of deferred financing costs |
158 | 3 | — | |||||||||
| Interest expense added on principal |
736 | — | — | |||||||||
| Changes in assets and liabilities, net: |
||||||||||||
| Accrued revenue |
(3,498 | ) | — | — | ||||||||
| Other, net |
482 | — | (22 | ) | ||||||||
|
|
|
|
|
|
|
|||||||
| Net cash (used in) provided by operating activities |
(2,183 | ) | (853 | ) | 14 | |||||||
|
|
|
|
|
|
|
|||||||
| Cash flows from investing activities: |
||||||||||||
| Consideration paid for acquisitions of project assets |
(761 | ) | (398 | ) | — | |||||||
| Construction costs paid |
(208,960 | ) | (94,961 | ) | — | |||||||
| Property acquisition |
(87 | ) | — | — | ||||||||
| Deferred development costs paid |
— | — | (3,202 | ) | ||||||||
| Net changes in accounts payable and other accrued liabilities related to investing activities |
(48,624 | ) | — | — | ||||||||
| Decrease in restricted cash |
13,456 | — | — | |||||||||
| Increase in restricted cash |
(12,862 | ) | (3,822 | ) | — | |||||||
|
|
|
|
|
|
|
|||||||
| Net cash used in investing activities |
(257,838 | ) | (99,181 | ) | (3,202 | ) | ||||||
|
|
|
|
|
|
|
|||||||
| Cash flows from financing activities: |
||||||||||||
| Proceeds from construction facility loan |
258,230 | 82,367 | — | |||||||||
| Deferred financing costs paid |
— | (10,962 | ) | — | ||||||||
| Proceeds from partners’ contributions |
— | 32,410 | 3,330 | |||||||||
|
|
|
|
|
|
|
|||||||
| Net cash provided by financing activities |
258,230 | 103,815 | 3,330 | |||||||||
|
|
|
|
|
|
|
|||||||
| Net change in cash and cash equivalents |
(1,791 | ) | 3,781 | 142 | ||||||||
| Cash and cash equivalents - Beginning of year |
4,387 | 606 | 464 | |||||||||
|
|
|
|
|
|
|
|||||||
| Cash and cash equivalents - End of year |
$ | 2,596 | $ | 4,387 | $ | 606 | ||||||
|
|
|
|
|
|
|
|||||||
| Schedule of non-cash activities: |
||||||||||||
| Transfer from deferred development costs to construction-in-progress |
$ | — | $ | 6,060 | $ | — | ||||||
| Transfer from construction-in-progress to property, plant and equipment |
$ | 400,252 | $ | — | $ | — | ||||||
| Accrued construction costs |
$ | 1,976 | $ | 17,142 | $ | — | ||||||
| Non-monetary asset contribution from partners |
$ | — | $ | 27,840 | $ | — | ||||||
| Construction loan - capitalized interest |
$ | 9,103 | $ | 510 | $ | — | ||||||
| Capitalized depreciation and amortization |
$ | 870 | $ | — | $ | — | ||||||
| Effective portion of change in fair value of derivatives |
$ | 18,934 | $ | 8,847 | $ | — | ||||||
See accompanying notes to financial statements.
S-36
Table of Contents
Grand Renewable Wind LP
December 31, 2014 and 2013
(In thousands of Canadian Dollars)
| 1 | General information |
The Partnership
Grand Renewable Wind LP (the Partnership), a limited partnership under the laws of the Province of Ontario, was formed on January 10, 2011 as a joint venture project between Samsung Renewable Energy Inc. (Samsung) and Pattern Grand LP Holdings LP, a subsidiary of Pattern Renewable Holdings Canada ULC (PRHC), each as 49.99% limited partners of the Partnership, and Grand Renewable Wind GP Inc. (the GP), as the 0.02% general partner of the Partnership. The terms of the Partnership initially were governed by the Limited Partnership Agreement of the Partnership, dated January 10, 2011, which was subsequently superseded in its entirety by the Amended and Restated Limited Partnership Agreement of the Partnership, dated June 11, 2013 (the Partnership Agreement). The Partnership was created to develop, build and operate a wind power project in Haldimand County that will generate approximately 149 megawatts (MW) of power (the Project). The Project is part of Phase 1 of the Green Energy Investment Agreement that Samsung C&T Corp., a parent company of Samsung, entered into with the Government of Ontario in January 2010.
On February 24, 2013, Samsung transferred its LP interest in the Partnership to SRE GRW LP Holdings LP, an affiliate of Samsung.
On December 20, 2013, in a series of transactions: (i) Pattern Grand GP Holdings Inc., a wholly owned subsidiary of PRHC, transferred all of the general partner interests in Pattern Grand LP Holdings LP to PRHC, causing Pattern Grand LP Holdings LP to be dissolved by operation of law and PRHC to acquire the LP interests in the Partnership that previously were held by Pattern Grand LP Holdings LP, (ii) PRHC transferred its LP interest in the Partnership and its ownership interest in Pattern Grand GP Holdings Inc., which owned PRHC’s ownership interest in the GP, to Pattern Canada Operations Holdings ULC, an affiliate of Pattern Energy Group Inc. (Pattern), and (iii) Pattern Grand GP Holdings Inc. was dissolved.
On December 17, 2014, Pattern Canada Operations Holdings ULC (PCOH) transferred all of its LP interest in the Partnership to Pattern Canada Finance Company ULC, a wholly owned subsidiary of PCOH.
Six Nations agreements
On May 25, 2012, the Partnership entered into the certain agreements with the Six Nations of the Grand River, a band within the meaning of the Indian Act (Canada) through its elected council (the Six Nations), in which the Partnership provides an option for economic participation by way of an annual royalty from the Partnership or the right to purchase a 10% interest in the Partnership.
On June 11, 2013, the Six Nations exercised its option to purchase a 10% LP interest in the Partnership and the Partnership Agreement was amended and restated to reflect such ownership. Affiliates of Samsung and Pattern each maintain a 45% interest in the Partnership. The Six Nations is not involved in the GP.
The Partnership is controlled by its general partner, the GP, also a joint venture controlled by affiliates of Samsung and Pattern. The GP is governed by the Amended and Restated Unanimous Shareholder Agreement of the GP, dated June 11, 2013 (the Shareholder Agreement). The Partnership’s ownership interests were distributed as follows:
| December 31, | ||||||||
| 2014 | 2013 | |||||||
| SRE GRW LP Holdings LP |
44.99% | 44.99% | ||||||
| Pattern Canada Operations Holdings ULC |
— | 44.99% | ||||||
| Pattern Canada Finance Company ULC |
44.99% | — | ||||||
| Six Nations of the Grand River |
10.00% | 10.00% | ||||||
| Grand Renewable Wind GP Inc. |
0.02% | 0.02% | ||||||
|
|
|
|
|
|||||
| Total |
100.00% | 100.00% | ||||||
|
|
|
|
|
|||||
S-37
Table of Contents
Grand Renewable Wind LP
Notes to Financial Statements
December 31, 2014 and 2013
(In thousands of Canadian Dollars)
The Project
The Project is a 149 MW wind project consisting of 67 Siemens wind turbine generators located in Haldimand County, Ontario.
On August 2, 2011, the Partnership entered into a power purchase agreement (PPA) with the Independent Electricity System Operator (IESO) related to the sale of 100% of the electrical output of the Project at prescribed electricity rates for a period of 20 years following Commercial Operation Date (COD).
On December 9, 2014, the Project achieved COD and commenced commercial operations.
A 100 MW solar facility developed by an affiliate of Samsung is sharing the usage and ownership of the transmission line and substation. The Project connected to the IESO-controlled grid by way of a 20 km transmission line sited in the municipal road allowance.
| 2 | Summary of significant accounting policies |
The principal accounting policies applied in the preparation of these financial statements are set out below. These policies have been consistently applied to the periods presented, unless otherwise stated.
Basis of preparation
The accompanying financial statements are presented using accounting principles generally accepted in the United States of America (U.S. GAAP). The preparation of U.S. GAAP financial statements requires management to make certain estimates and assumptions that affect the reported amounts of assets and liabilities and the disclosure of contingent assets and liabilities at the date of the financial statements and the reported amounts of revenue and expenses during the reporting period. Because the use of estimates is inherent in the financial reporting process, actual results could differ from those estimates.
In recording transactions and balances resulting from business operations, the Partnership uses estimates based on the best information available. Estimates are used for such items as accrued revenue, asset retirement obligation, valuation of long-term derivative contracts and acquisition contingencies.
These financial statements do not include assets, liabilities, revenue and expenses of the GP and limited partners. The financial statements of the Partnership reflect no provision or liability for income taxes because profits and losses of the Partnership are allocated to the partners and are included in the income tax returns of partners. Income and losses for tax purposes may differ from the financial statement amounts and the partners’ capital reflected in the financial statements does not necessarily reflect their tax basis.
Functional and presentation currency
Items included in the financial statements of the Partnership are measured using the currency of the primary economic environment in which the Partnership operates (the functional currency). The financial statements are presented in Canadian dollars, which is the Partnership’s functional and presentation currency.
Fair value of financial instruments
ASC 820, Fair Value Measurements, defines fair value as the price at which an asset could be exchanged or a liability transferred in an orderly transaction between knowledgeable, willing parties in the principal or
S-38
Table of Contents
Grand Renewable Wind LP
Notes to Financial Statements
December 31, 2014 and 2013
(In thousands of Canadian Dollars)
most advantageous market for the asset or liability. Where available, fair value is based on observable market prices or derived from such prices. Where observable prices or inputs are not available, valuation models are applied. These valuation techniques involve some level of management estimation and judgment, the degree of which is dependent on the price transparency for the instruments or market and the instruments’ complexity.
Cash and cash equivalents
Cash and cash equivalents include cash on hand, deposits held at call with banks and other short-term highly liquid investments with original maturities of three months or less.
Restricted cash
Restricted cash consists of cash balances required to collateralize commercial bank letter of credit facilities related primarily to interconnect rights, power purchase agreements (PPAs) and for reserves required under the Partnership’s loan agreements (note 3).
Trade receivable
The Partnership’s trade receivables are generated by selling energy in Ontario, Canada, and allowance for doubtful accounts, if needed, is computed based upon and management’s estimates of uncollectible accounts. As of December 31, 2014 and 2013, the Partnership has no outstanding trade receivables.
Accrued revenue
Accrued revenue represents revenues recognized on contracts for which billings have not been presented to customers as of the balance sheet date. These amounts are billed and generally collected within two months.
Concentration of credit risk and significant customer
Financial instruments that potentially subject the Partnership to concentrations of credit risk consist primarily of cash and cash equivalents and restricted cash. The Partnership places its cash and cash equivalents and restricted cash with high-quality institutions located in Canada, which the management believes to have minimal risk. At times, such balances may be in excess of the Canada Deposit Insurance Corporation (CDIC) insurance coverage limit. CDIC insurance currently covers up to $100 per depositor at each insured bank.
The IESO is the only customer of the Partnership, which is obligated to pay for 100% of the electrical output under a long-term, fixed priced PPA. There are no accounts receivable that are past due.
The Partnership’s derivative agreements expose the Partnership to losses under certain circumstances, such as the counterparty defaulting on its obligations under the swap agreements or if the swap agreements provide an imperfect hedge. Counterparties to the Partnership’s derivative contracts are major financial institutions that have been accorded investment grade ratings.
Construction-in-progress
Construction-in-progress represents the accumulated costs of projects in construction. Construction costs include turbines for which the Partnership has taken legal title, civil engineering, electrical and other related
S-39
Table of Contents
Grand Renewable Wind LP
Notes to Financial Statements
December 31, 2014 and 2013
(In thousands of Canadian Dollars)
costs. Other capitalized costs include reclassified deferred development costs, amortization of intangible assets, amortization of deferred financing costs, capitalized interest and other costs required to place a project into commercial operation. Construction-in-progress is reclassified to property, plant and equipment when the Project begins commercial operations.
Advance payments
Advance payments represent amounts advanced to turbine and other suppliers for the manufacture of wind turbines and other plant assets in accordance with supply agreements for the Partnership’s wind power project for which the Project has not taken title. Advance payments are reclassified to construction-in-progress when the Partnership takes legal title to the related turbines and other plant assets and are reclassified to property, plant and equipment when the Project achieves commercial operation. Depreciation does not commence until the Project enters commercial operation and assets are placed in service.
Property, plant and equipment
Property, plant and equipment are stated at historical cost, less accumulated depreciation. Historical cost includes expenditure that is directly attributable to the acquisition of the items. Subsequent costs are included in the asset’s carrying value or recognized as separate assets, as appropriate, only when it is probable that the future economic benefits associated with the item will flow to the Partnership and the cost of the item can be reliably measured.
Asset retirement obligations included in property, plant and equipment is stated at the present value of future cash flow of asset retirement obligation. Depreciation on property, plant and equipment is calculated using the straight-line method to allocate their cost to their residual values over their estimated useful lives. The power plant is depreciated over twenty years and the remaining assets are depreciated over five years. The assets’ residual values and useful lives are reviewed and adjusted, if appropriate, at the end of each reporting period. Repair and maintenance costs are expensed as incurred.
Intangible assets
Cash consideration of $1,672 was paid to the IESO to extend the end of PPA term by 74 days from September 24, 2034 to December 8, 2034, which was recorded in intangible assets on the balance sheets as of December 31, 2014.
Amortization is calculated using the straight-line method and recorded against revenue over the remaining term of the PPA.
Impairment of long-lived assets
The Partnership periodically evaluates whether events have occurred that would require revision of the remaining useful life of equipment and improvements and purchased intangible assets, or render them not recoverable. If such circumstances arise, the Partnership uses an estimate of the undiscounted value of expected future operating cash flows to determine whether the long-lived assets are impaired. If the aggregate undiscounted cash flows are less than the carrying amount of the assets, the resulting impairment charge to be recorded is calculated based on the excess of the carrying value of the assets over the fair value of such assets, with the fair value determined based on an estimate of discounted future cash flows. Through December 31, 2014, no impairment charges were recorded.
S-40
Table of Contents
Grand Renewable Wind LP
Notes to Financial Statements
December 31, 2014 and 2013
(In thousands of Canadian Dollars)
Interest capitalization
The Partnership capitalizes interest and related financing fees from non-recourse debt used to finance projects in construction. Capitalization is discontinued when a project reaches commercial operation.
Derivatives
The Partnership recognizes its derivative instruments as either assets or liabilities in the balance sheets at fair value. The accounting for changes in the fair value (i.e., gains or losses) of a derivative instrument depends on whether it qualifies and has been designated as part of a hedging relationship and the type of hedging relationship.
For derivative instruments that are designated and qualify as a cash flow hedge (i.e., hedging the exposure to variability in expected future cash flows that are attributable to a particular risk), the effective portion of the gain or loss on the derivative instrument is reported as a component of other comprehensive income (OCI) or loss (OCL). Changes in the fair value of these derivatives are subsequently reclassified into earnings in the period that the hedged transaction affects earnings. The ineffective portion of changes in fair value is recorded as a component of net income (loss) in the statements of operations and comprehensive income (loss).
For undesignated derivative instruments, their change in fair value is reported as a component of net income in the statements of operations and comprehensive income (loss).
The Partnership enters into derivative transactions for the purpose of managing exposure to fluctuations in interest rates, such as interest rate swaps. Interest rate swaps are instruments used to fix the interest rate on variable interest rate debt.
Deferred financing costs
Financing costs incurred in connection with obtaining construction and term financing, which include direct financing, legal and other upfront cost of borrowing, are deferred and amortized over the lives of the respective loans using the effective-interest method. Amortization of deferred financing costs is capitalized during construction or expensed following commencement of commercial operation.
Accounts payable and other accrued liabilities
Trade payables are obligations to pay for goods or services that have been acquired in the ordinary course of business from suppliers. Payables with payment terms extended beyond one year from the balance sheet dates are presented as non-current liabilities.
Contingent liabilities
Contingent liabilities for environmental restoration, restructuring costs and other legal obligations are recognized when: the Partnership has a present legal obligation as a result of past events; it is probable that an outflow of resources will be required to settle the obligation; and the amount has been reasonably estimated. Contingent liabilities are not recognized for future operating losses.
Asset retirement obligation
The Partnership records an asset retirement obligation for the estimated costs of decommissioning turbines, removing above-ground installations and restoring sites, at the time when a contractual decommissioning
S-41
Table of Contents
Grand Renewable Wind LP
Notes to Financial Statements
December 31, 2014 and 2013
(In thousands of Canadian Dollars)
obligation materializes. The Company records accretion expense, which represents the increase in the asset retirement obligation, over the remaining life of the associated wind project. Accretion expense is recorded as cost of revenue in the statements of operations and comprehensive (loss) income using accretion rates based on a credit adjusted risk free interest rate of 6.51%.
Revenue recognition
The Partnership sells the electricity it generates under the terms of a PPA with the IESO. Revenue is recognized based upon the amount of electricity delivered at rates specified under the contracts, assuming all other revenue recognition criteria are met. The Partnership evaluates its PPA to determine whether it is in substance a lease or derivative and, if applicable, recognizes revenue pursuant to ASC 840 Leases and ASC 815 Derivatives and Hedging, respectively. As of December 31, 2014, the PPA is not accounted for as a lease or derivative and revenue is recognized on an accrual basis.
The Partnership recognizes revenue for warranty settlements and liquidated damages from a turbine manufacturer in other revenue upon resolution of outstanding contingencies. Any cash receipts for amounts subject to future adjustment or repayment are deferred in other liabilities until the final settlement amount is considered fixed and determinable.
Cost of revenue
The Partnership’s cost of revenue is comprised of direct costs of operating and maintaining its project facilities, including labor, turbine service arrangements, metering service and shadow settlement, environmental fee, depreciation, amortization and accretion.
Comprehensive income
Comprehensive income consists of net income and other comprehensive income. Other comprehensive income is included in accumulated other comprehensive income in the accompanying statements of partners’ equity.
Contributions
Contributions from joint venture partners are classified as partners’ equity.
Recent accounting pronouncement
In June 2014, the Financial Accounting Standards Board issued Accounting Standards Update (ASU) No. 2014-09, “Revenue from Contracts with Customers,” which outlines a comprehensive revenue recognition model and supersedes most current revenue recognition guidance. The new standard requires a company to recognize revenue upon transfer of goods or services to a customer at an amount that reflects the expected consideration to be received in exchange for those goods or services. This ASU will supersede the revenue recognition requirements in Topic 605, Revenue Recognition, and most industry-specific guidance, and creates a Topic 606 Revenue from Contracts with Customers. ASU 2014-09 will be effective for the Partnership beginning after December 15, 2016, including interim periods. The Partnership is still evaluating the impact of the adoption of ASU 2014-09.
S-42
Table of Contents
Grand Renewable Wind LP
Notes to Financial Statements
December 31, 2014 and 2013
(In thousands of Canadian Dollars)
| 3 | Restricted cash |
The following table presents the components of restricted cash:
| December 31, | ||||||||
| 2014 | 2013 | |||||||
| Security deposits for letter of guarantee |
$ | 4,812 | $ | 4,749 | ||||
| 10% holdback account for contractors |
1,416 | 2,073 | ||||||
|
|
|
|
|
|||||
| Total |
$ | 6,228 | $ | 6,822 | ||||
|
|
|
|
|
|||||
The Partnership maintained a term deposit of $4,486 with Korea Exchange Bank of Canada that was restricted as security for the letter of guarantee provided to the OPA. The letter of guarantee was cancelled and the restricted term deposit was released on January 23, 2015 as the Project achieved COD.
| 4 | Other current assets |
The following table presents the components of other current assets:
| December 31, | ||||||||
| 2014 | 2013 | |||||||
| Accrued interest income |
$ | 2 | $ | 34 | ||||
| Advance payment |
4 | 203 | ||||||
| Prepaid expenses |
331 | 582 | ||||||
|
|
|
|
|
|||||
| $ | 337 | $ | 819 | |||||
|
|
|
|
|
|||||
| 5 | Construction-in-progress |
Construction-in-progress includes capitalized interest expense, deferred financing costs, and commitment fees of $0 and $1,399 in 2014 and 2013, respectively. During 2014, $11,155 was capitalized to construction-in-progress. The Project achieved COD on December 9, 2014 at which time all amounts capitalized to construction-in-progress we reclassified to property, plant and equipment.
| 6 | Property, plant and equipment |
The following table reflects the categories within property, plant and equipment at historical cost:
| December 31, | ||||||||
| 2014 | 2013 | |||||||
| Power plant |
$ | 412,201 | $ | — | ||||
| Furniture, fixture and equipment |
155 | 68 | ||||||
| Asset retirement obligation - asset |
3,062 | |||||||
|
|
|
|
|
|||||
| Subtotal |
415,418 | 68 | ||||||
| Less: Accumulated depreciation |
(1,350 | ) | (24 | ) | ||||
|
|
|
|
|
|||||
| $ | 414,068 | $ | 44 | |||||
|
|
|
|
|
|||||
S-43
Table of Contents
Grand Renewable Wind LP
Notes to Financial Statements
December 31, 2014 and 2013
(In thousands of Canadian Dollars)
Depreciation expense of $1,314, $0, and $0 was charged to the statements of operations and comprehensive income for the years ended December 31, 2014, 2013 and 2012, respectively, and $12 and $24 was capitalized to construction-in-progress on the balance sheets as of December 31, 2014 and 2013, respectively.
| 7 | Intangible assets |
| December 31, | ||||||||
| 2014 | 2013 | |||||||
| Beginning net book value |
$ | — | $ | — | ||||
| Additions (note 2) |
1,672 | — | ||||||
| Amortization expense |
(7 | ) | — | |||||
|
|
|
|
|
|||||
| Closing net book value |
$ | 1,665 | $ | — | ||||
|
|
|
|
|
|||||
| December 31, | ||||||||
| 2014 | 2013 | |||||||
| Cost |
$ | 1,672 | $ | — | ||||
| Accumulated amortization |
(7 | ) | — | |||||
|
|
|
|
|
|||||
| Net book value |
$ | 1,665 | $ | — | ||||
|
|
|
|
|
|||||
Amortization expense of $7, $0 and $0 was charged to the statements of operations and comprehensive income for the years ended December 31, 2014, 2013 and 2012, respectively.
| 8 | Other current liabilities |
The following table presents the components of other current liabilities:
| December 31, | ||||||||
| 2014 | 2013 | |||||||
| Accrued expenses |
$ | 5 | $ | 11 | ||||
| Accrued interest - construction facility loan |
1,852 | 8 | ||||||
|
|
|
|
|
|||||
| $ | 1,857 | $ | 19 | |||||
|
|
|
|
|
|||||
| 9 | Long-term debt |
On September 13, 2013, the Partnership signed a credit facilities agreement with a syndicate of lenders consisting of 11 different financial institutions for a term of construction period plus 7 years at a rate of Canadian Dealer Offered Rate (CDOR) plus 2.25% per annum. The credit facilities under the agreement include a construction facility of $395,383, term facility, letter of credit facility and an interest rate hedge facility. The funds from these facilities were utilized to finance the construction of the Project and to run the Project’s operations. The loan matures on March 31, 2022. In connection with the financing agreement, the Partnership entered into interest rate swaps on 90% of the loan commitment.
S-44
Table of Contents
Grand Renewable Wind LP
Notes to Financial Statements
December 31, 2014 and 2013
(In thousands of Canadian Dollars)
Collateral under the financing agreement consists of substantially all of the Partnership’s assets. The loan agreement contains a broad range of covenants that, subject to certain exceptions, restrict the Partnership’s ability to incur debt, grant liens, sell or lease assets, transfer equity interest, dissolve, pay distributions and change its business. All the limited and general partners and shareholders of general partners pledged shares of partnership units or common stock owned as collateral for the loan.
Terms and conditions of outstanding borrowings were as follows:
| Interest rate as of | Interest type |
Loan type |
||||||||||||||||||||||
| December 31, | December 31, | |||||||||||||||||||||||
| 2014 | 2013 | 2014 | 2013 | |||||||||||||||||||||
| Construction facility loan |
$ | 349,583 | $ | 82,877 | 3.54 | % | 3.47 | % | Variable | Project financing | ||||||||||||||
| Less: Current portion |
(9,172 | ) | — | |||||||||||||||||||||
|
|
|
|
|
|||||||||||||||||||||
| Net of current |
$ | 340,411 | $ | 82,877 | ||||||||||||||||||||
|
|
|
|
|
|||||||||||||||||||||
The following are the amounts due under long-term debt as of December 31, 2014:
| 2015 |
$ | 9,172 | ||
| 2016 |
13,897 | |||
| 2017 |
14,538 | |||
| 2018 |
17,371 | |||
| 2019 |
18,418 | |||
| Thereafter |
276,187 | |||
|
|
|
|||
| $ | 349,583 | |||
|
|
|
Interest and commitment fees incurred, and interest expense recorded in the Partnership’s statements of operations and comprehensive income are as follows:
| Interest incurred |
$ | 10,320 | ||
| Commitment fees incurred |
1,516 | |||
| Amortization of deferred financing costs |
1,016 | |||
| Capitalized interest, commitment and amortization |
(11,155 | ) | ||
|
|
|
|||
| Interest expense |
$ | 1,697 | ||
|
|
|
| 10 | Contributions from joint venture partners |
| 2014 | ||||||||||||||||||||
| SRE GRW LP Holdings LP1 |
Pattern Canada Finance Company ULC3 |
Six Nations of the Grand River |
Grand Renewable Wind GP Inc. |
Total | ||||||||||||||||
| Balance, Beginning and end of year |
$ | 30,589 | $ | 30,589 | $ | 6,798 | $ | 14 | $ | 67,990 | ||||||||||
|
|
|
|
|
|
|
|
|
|
|
|||||||||||
S-45
Table of Contents
Grand Renewable Wind LP
Notes to Financial Statements
December 31, 2014 and 2013
(In thousands of Canadian Dollars)
| 2013 | ||||||||||||||||||||
| SRE GRW LP Holdings LP1 |
Pattern Canada Operations Holdings ULC2 |
Six Nations of the Grand River |
Grand Renewable Wind GP Inc. |
Total | ||||||||||||||||
| Balance, Beginning of year |
$ | 3,869 | $ | 3,869 | $ | — | $ | 2 | $ | 7,740 | ||||||||||
|
|
|
|
|
|
|
|
|
|
|
|||||||||||
| Cash contribution on |
||||||||||||||||||||
| Feb. 04, 2013 |
700 | 700 | — | — | 1,400 | |||||||||||||||
| Feb. 22, 2013 |
— | — | — | 2 | 2 | |||||||||||||||
| Apr. 12, 2013 |
1,000 | 1,000 | — | — | 2,000 | |||||||||||||||
| Jun. 18, 2013 |
— | — | 2,148 | — | 2,148 | |||||||||||||||
| Jul. 24, 2013 |
668 | 668 | 149 | 1 | 1,486 | |||||||||||||||
| Sep. 05, 2013 |
— | — | 327 | 1 | 328 | |||||||||||||||
| Sep. 10, 2013 |
— | — | — | 3 | 3 | |||||||||||||||
| Sep. 12, 2013 |
11,267 | 11,267 | 2,504 | 5 | 25,043 | |||||||||||||||
|
|
|
|
|
|
|
|
|
|
|
|||||||||||
| 13,635 | 13,635 | 5,128 | 12 | 32,410 | ||||||||||||||||
|
|
|
|
|
|
|
|
|
|
|
|||||||||||
| Non-cash contribution - vend in |
||||||||||||||||||||
| Feb. 22, 2013 |
4,095 | 4,095 | — | — | 8,190 | |||||||||||||||
| Sep. 05, 2013 |
1,475 | 1,475 | — | — | 2,950 | |||||||||||||||
| Sep. 10, 2013 |
7,515 | 7,515 | 1,670 | — | 16,700 | |||||||||||||||
|
|
|
|
|
|
|
|
|
|
|
|||||||||||
| 13,085 | 13,085 | 1,670 | — | 27,840 | ||||||||||||||||
|
|
|
|
|
|
|
|
|
|
|
|||||||||||
| Balance, End of year |
$ | 30,589 | $ | 30,589 | $ | 6,798 | $ | 14 | $ | 67,990 | ||||||||||
|
|
|
|
|
|
|
|
|
|
|
|||||||||||
| 1 | On February 24, 2013, Samsung Renewable Energy Inc. transferred its ownership interest in the Partnership to SRE GRW LP Holdings LP at fair value. |
| 2 | On December 20, 2013, Pattern Grand LP Holdings LP, in a series of transactions, transferred its ownership interest in the Partnership to Pattern Canada Operations Holdings ULC at fair value. |
| 3 | On December 17, 2014, Pattern Canada Operations Holdings ULC, in a series of transactions, transferred its ownership interest in the Partnership to Pattern Canada Finance Company ULC at fair value. |
Pursuant to an agreement dated February 19, 2013 between the Partnership, Samsung, PRHC and certain of their respective affiliates, certain project development costs in the amount of $8,190 incurred by Samsung were contributed to the Partnership. In order to maintain the equal ownership within the Partnership, an affiliate of PRHC acquired an additional interest in the Partnership for a consideration payable to Samsung in cash and through the exchange of ownership interest in another partnership entity related to both Samsung and PRHC.
Pursuant to Assignment and Assumption Agreement dated September 3, 2013 between the Partnership, Samsung, PRHC and various affiliates of Samsung and PRHC, certain project development costs, which were not part of the previous contribution on February 19, 2013, in the amount of $2,950 incurred by Samsung were contributed to the Partnership. Afterward, Pattern acquired an additional interest in the Partnership for a cash consideration payable to Samsung.
Pursuant to Assignment and Assumption Agreements dated September 10, 2013 among affiliates of Samsung, PRHC, Six Nations and the Partnership, a construction deposit of $16,700 placed with an affiliate of Siemens AG by an affiliate of Samsung and an affiliate of PRHC was contributed to the Partnership in accordance with Memorandum of Understanding (MOU) signed on October 30, 2012 on behalf of the Partnership.
S-46
Table of Contents
Grand Renewable Wind LP
Notes to Financial Statements
December 31, 2014 and 2013
(In thousands of Canadian Dollars)
| 11 | Asset retirement obligation |
The Partnership’s asset retirement obligation represents the estimated cost of decommissioning the turbines, removing above-ground installations and restoring the sites at a date that is 20 years from the commencement of commercial operations.
The following table presents a reconciliation of the beginning and ending aggregate carrying amount of the asset retirement obligation:
| December 31, | ||||||||
| 2014 | 2013 | |||||||
| Asset retirement obligation - Beginning of year |
$ | 496 | $ | — | ||||
| Additions |
2,566 | 496 | ||||||
| Accretion expense |
12 | — | ||||||
|
|
|
|
|
|||||
| Asset retirement obligation - End of year |
$ | 3,074 | $ | 496 | ||||
|
|
|
|
|
|||||
| 12 | Derivatives |
On September 13, 2013, the Partnership entered into a series of interest rate swaps to manage exposure to interest rate risk on its long-term debt. The interest rate swaps exchange variable interest rate payments based on CDOR for fixed rate payments of approximately 3.40%. Certain swaps with terms that commenced at the same time that the Partnership entered into the credit facilities agreement qualify for hedge accounting and were designated as cash flow hedges. No ineffectiveness was recorded on these swaps for the years ended December 31, 2014 and 2013. As of December 31, 2014, the notional amounts of the designated and undesignated interest rate swaps were $355,845 and $0, respectively. Swaps with future start dates are undesignated derivatives and changes in the fair value of these swaps are recognized directly into earnings.
The following table presents the amounts that are recorded in the Partnership’s balance sheets as of December 31, 2014 and 2013, respectively:
Designated and undesignated derivative instruments classified as liabilities
| As of December 31, 2014 | For the year ended December 31, 2014 |
|||||||||||||||||||||
| Fair market value | Gain (Loss) recognized into earnings |
Gain (Loss) recognized into OCL |
||||||||||||||||||||
| Derivative type |
Quantity | Maturity dates |
Current portion |
Non- current portion |
||||||||||||||||||
| Interest rate swaps |
10 | Sep 30, 2021 | $ | 7,040 | $ | 20,741 | $ | — | $ | (18,934 | ) | |||||||||||
| Interest rate swaps |
10 | Sep 30, 2032 | — | 17,318 | (16,072 | ) | — | |||||||||||||||
|
|
|
|
|
|
|
|
|
|||||||||||||||
| $ | 7,040 | $ | 38,059 | $ | (16,072 | ) | $ | (18,934 | ) | |||||||||||||
|
|
|
|
|
|
|
|
|
|||||||||||||||
| As of December 31, 2013 | For the year ended December 31, 2013 |
|||||||||||||||||||||
| Fair market value | Gain (Loss) recognized into earnings |
Gain (Loss) recognized into OCL |
||||||||||||||||||||
| Derivative type |
Quantity | Maturity dates |
Current portion |
Non- current portion |
||||||||||||||||||
| Interest rate swaps |
10 | Sep 30, 2021 | $ | — | $ | 8,847 | $ | — | $ | (8,847 | ) | |||||||||||
| Interest rate swaps |
10 | Sep 30, 2032 | — | 1,247 | (1,247 | ) | — | |||||||||||||||
|
|
|
|
|
|
|
|
|
|||||||||||||||
| $ | — | $ | 10,094 | $ | (1,247 | ) | $ | (8,847 | ) | |||||||||||||
|
|
|
|
|
|
|
|
|
|||||||||||||||
S-47
Table of Contents
Grand Renewable Wind LP
Notes to Financial Statements
December 31, 2014 and 2013
(In thousands of Canadian Dollars)
| 13 | Fair value measurement |
The Partnership’s fair value measurements incorporate various factors, including the credit standing and performance risk of the counterparties, the applicable exit market, and specific risks inherent in the instrument. Non-performance and credit risk adjustments on risk management instruments are based on current market inputs when available, such as credit default hedge spreads. When such information is not available, internal models are used.
Assets and liabilities recorded at fair value in the financial statements are categorized based upon the level of judgment associated with the inputs used to measure their fair value. Hierarchical levels directly related to the amount of subjectivity associated with the inputs to valuation of these assets or liabilities are as follows:
Level 1 - Inputs are unadjusted, quoted prices in active markets for identical assets or liabilities at the measurement date.
Level 2 - Inputs (other than quoted prices included in Level 1) are either directly or indirectly observable for the asset or liability through correlation with market data at the measurement date and for the duration of the instrument’s anticipated life.
Level 3 - Unobservable inputs that are supported by little or no market activity and that are significant to the fair value of the assets or liabilities and which reflect management’s best estimate of what market participants would use in pricing the asset or liability at the measurement date. Consideration is given to the risk inherent in the valuations technique and the risk inherent in the inputs to the model.
Short-term financial instruments consist principally of cash and cash equivalents, restricted cash, accounts payable and other accrued liabilities. Based on the nature and short maturity of these instruments their fair value is approximated using carrying cost and they are presented in the financial statements at carrying cost.
Long term debt is presented on the balance sheets at amortized cost. The fair value of the Partnership’s long-term debt is approximately $418,757 as of December 31, 2014. It is estimated based on current rates that would be available for debt of similar terms which is not significantly different from its stated value.
Derivatives are presented in the financial statements at fair value. The interest rate swaps were valued by discounting the net cash flows using the forward CDOR curve with the valuations adjusted by the counterparties’ credit default swap rate.
The following table presents the fair values according to each defined level.
Financial assets (liabilities) measured on a recurring basis:
| Level 1 | Level 2 | Level 3 | ||||||||||
| December 31, 2014 |
||||||||||||
| Interest rate swaps |
$ | — | $ | (45,099 | ) | $ | — | |||||
|
|
|
|
|
|
|
|||||||
| December 31, 2013 |
||||||||||||
| Interest rate swaps |
$ | — | $ | (10,094 | ) | $ | — | |||||
|
|
|
|
|
|
|
|||||||
S-48
Table of Contents
Grand Renewable Wind LP
Notes to Financial Statements
December 31, 2014 and 2013
(In thousands of Canadian Dollars)
| 14 | Commitments and contingencies |
Power Purchase Agreement
The Partnership entered into a PPA with the Ontario Power Authority on August 2, 2011, which subsequently merged with the IESO. The contract capacity of the PPA is defined as 149 MW and the term of the PPA as 20 years from COD. As a result of the PPA, the electrical output from the Project was sold at electricity price equal to $0.146 per MWh in 2014, and 20% of the price will be increased by the Consumer Price Index in 2015 and every year thereafter. The Partnership obtained Notice to Proceed (NTP) under the PPA on June 26, 2013. The Partnership provided to the IESO the amount of the initial security defined as $0.02 per kW of contract capacity and incremental NTP security defined as $0.01 per kW of contract capacity after receiving the NTP. The Partnership provided a letter of guarantee amounting to $4,486 to the IESO in 2013, as the initial and incremental security agreed within the PPA. Korea Exchange Bank of Canada issued the letter of guarantee for the Partnership, based on a restricted term deposit of $4,486 as of December 31, 2014 and 2013, which was canceled and subsequently the restricted term deposit was released on January 23, 2015 as the Project achieved COD.
On January 29, 2013 and August 22, 2013, the Partnership amended the PPA by way of an amending agreement with the IESO in connection with announced changes in the market rules governing the dispatch of certain intermittent generators, including those connected to the IESO-controlled grid. Among other provisions, the amendment will limit the amount of economic curtailment to which the Project is subject.
Contingent payment under APA
Per those certain Asset Purchase Agreements between the GP, in its capacity as general partner and on behalf of the Partnership, and UDI Renewable Corporation (UDI), dated March 28, 2011, the Partnership was liable to pay $760 as of December 31, 2013. The Partnership is no longer liable since the Project achieved COD under the PPA on December 9, 2014.
Operational Incentive Agreement
On March 8, 2013, an Operational Incentive Agreement was entered into between Samsung, an affiliate of PRHC and Siemens Canada Limited to define operational objectives and the terms and conditions upon which the Partnership may pay operational incentive payments to Siemens for achieving one or more of such operational objectives under the turbine supply agreements of certain projects under development by Samsung and affiliates of PRHC, including the Project. Siemens earned an initial payment of $594 in 2013 for having satisfied the Peak Capacity Objective defined under the agreement. $1,976 was recorded as long-term contingent liabilities which will be due to Siemens if the Siemens Thee-Year Employment Objective is satisfied by December 31, 2015 (Note 3).
The operational incentive payment shall not exceed any of the applicable maximums of a) $0.02 per kW of the agreed de-rated capacity (148 MWh) of wind turbines purchased under any TSA for a given project, or b) an aggregate of $15,000 under all TSAs for all Phase 1 and Phase 2 Projects including other affiliated wind projects.
Land Lease Agreements
Lease payments of $430 and $742 were capitalized to construction-in-progress during 2014 and 2013, respectively.
S-49
Table of Contents
Grand Renewable Wind LP
Notes to Financial Statements
December 31, 2014 and 2013
(In thousands of Canadian Dollars)
Future minimum payments related to leases as of December 31, 2014 are as follows:
| 2015 |
$ | 1,794 | ||
| 2016 |
1,807 | |||
| 2017 |
1,837 | |||
| 2018 |
1,869 | |||
| 2019 |
1,900 | |||
| Thereafter |
35,293 | |||
|
|
|
|||
| Total |
$ | 44,500 | ||
|
|
|
Community Vibrancy Fund
On September 26, 2011, the Partnership entered into a Community Vibrancy Fund (CVF) Agreement with the Corporation of Haldimand County, in which the Partnership will make annual payments into a fund managed by the municipality in amounts of $3.5 per MW of the Project installed capacity plus $5 per kilometer (km) of high voltage overhead transmission line that is installed in municipal right-of-way. The payments are calculated annually and are owed for the 20-year term of the PPA. In exchange for CVF payments, the municipality undertakes certain obligations to support the Project, including entering into a road use agreement in which the Project may utilize municipal right-of-ways for collection and transmission lines.
Claims arising from construction
A dispute between the Partnership and, as it relates to jointly owned transmission facilities, the owner of an adjacent 100MW solar project that share such facilities on one side, and the EPC Contractor, which is a related party to a limited partner of the Partnership, on the other side has arisen regarding construction costs and delays in building and commissioning the wind farm and transmission facilities. The EPC Contractor has, based on the corresponding claims asserted by its prime subcontractor, asserted claims against the Partnership and the solar project with respect to this dispute totaling approximately $56,300 and the Partnership has asserted claims against the EPC Contractor (which asserted the corresponding claim against its prime subcontractor) with respect to this dispute totaling approximately $53,100. The dispute has not led to legal action by any of the parties against the other and the parties are seeking to resolve the dispute without arbitration through a settlement agreement.
As it is not possible at this point to estimate the amount of any damages to be paid or received by the Partnership in connection with this dispute, no reserve has been recorded in the Partnership’s financial statements. The Partnership does not expect the outcome of this dispute to have a material adverse impact on its operations or its financial position.
| 15 | Related party transactions |
The Partnership is controlled by the GP, which is jointly controlled by Samsung and Pattern in accordance with the terms of the Shareholder Agreement. Certain terms of the Samsung and Pattern Joint Venture Wind Development Agreement, entered into between Samsung and an affiliate of PRHC on July 27, 2010, directed the responsibilities of Samsung and PRHC during the development of the Project.
S-50
Table of Contents
Grand Renewable Wind LP
Notes to Financial Statements
December 31, 2014 and 2013
(In thousands of Canadian Dollars)
The following transactions were carried out with related parties:
| a) | Management, Operation, and Maintenance Agreement (MOMA) |
Balance of Plant MOMA
On September 13, 2013, the Partnership entered into MOMA with Pattern Operators Canada ULC, which is 100% owned by Pattern to operate and manage the maintenance of the wind plant and to perform certain other services pertaining to the wind plant in accordance with terms and conditions set in MOMA.
The fixed annual fee for the service is $762 pro-rated for the period from September 13, 2013 until COD and then was increased to $1,170 until the end of the term (20 years from COD). $787 and $165 was invoiced to the Partnership for the years ended December 31, 2014 and 2013, respectively, of which $715 and $165 was capitalized to construction-in-progress in 2014 and 2013, respectively, and $73, $0 and $0 was charged to the statements of operations and comprehensive income for the years ended December 31, 2014, 2013 and 2012, respectively.
Transmission Line MOMA (TL MOMA)
On September 13, 2013, the Partnership and Grand Renewable Solar LP entered into TL MOMA with Pattern Operators Canada ULC, which is 100% owned by an affiliate of Pattern, to operate and manage the maintenance of the transmission line and common assets of the substation and to perform certain other services pertaining to the wind plant in accordance with terms and conditions set in TL MOMA.
The fixed annual fee for the service provided to the Partnership is $50 pro-rated for the period from the date on which the transmission line is first connected to the IESO-controlled grid until the end of the term (20 years from COD).
| b) | Engineering Procurement and Construction Contract (EPC contract) |
Balance of Plant EPC
On September 13, 2013, the Partnership entered into Balance of Plant EPC contract with SRE GRW EPC LP, which is 100% owned by Samsung to build the balance of plant, and $95,780 and $11,997 was invoiced to the Partnership as of December 31, 2014 and 2013, respectively, which was capitalized to construction-in-progress on the balance sheets.
Transmission Line EPC
On September 13, 2013, the Partnership entered into TL EPC contract with Grand Renewable Solar LP, and SRE GRW EPC LP, which is 100% owned by Samsung to build the transmission line, and $14,732 and $2,396 was invoiced to the Partnership as of December 31, 2014 and 2013, respectively, which was capitalized to construction-in-progress on the balance sheets.
| c) | Project Administration Agreement (PAA) |
On September 31, 2013, the Partnership entered into PAA with SRE Wind PA LP (PA), which is 100% owned by Samsung to receive project administrative services.
The fixed annual fee for the service was $280 pro-rated for the period from June 15, 2012 until COD and then was increased to $400. $287 and $433 was invoiced to the Partnership for the years ended December 31, 2014 and 2013, respectively, which was recorded to the statements of operations and comprehensive (loss) income. The expensed amount in 2013 includes service fees for 2012, which was $192.
S-51
Table of Contents
Grand Renewable Wind LP
Notes to Financial Statements
December 31, 2014 and 2013
(In thousands of Canadian Dollars)
| d) | Transmission Facilities Co-ownership Agreement (TFCA) |
On March 8, 2013, the Partnership entered into the TFCA with a planned 100 MW solar project developed by an affiliate of Samsung which provides for the co-ownership of the transmission line and substation of the Project. Under the co-ownership agreement, the Project and the solar project each contributed 50% of the construction and operating costs of the transmission line and substation and each received a 50% undivided interest in such shared facilities.
| e) | The Partnership recorded the following balances with related parties: |
| 2014 | 2013 | |||||||
| Related party payable and accrued liabilities |
$ | 4,274 | $ | — | ||||
| Deferred development costs transferred |
$ | — | $ | 37,149 | ||||
| f) | The Partnership recorded the following transactions with related parties: |
| 2014 | 2013 | 2012 | ||||||||||
| Project expenses |
$ | 75 | $ | — | $ | — | ||||||
| General and administrative |
$ | 288 | $ | 433 | $ | — | ||||||
| 16 | Subsequent events |
On January 30, 2015, the amount of $6,062 was drawn from the construction facility.
On January 30, 2015, the Partnership has received written notice of a claim for lien in the amount of $6,224 filed by a subcontractor of the prime subcontractor.
S-52