Attached files
| file | filename |
|---|---|
| EX-31.2 - EXHIBIT 31.2 - United States Natural Gas Fund, LP | v384771_ex31-2.htm |
| EX-32.2 - EXHIBIT 32.2 - United States Natural Gas Fund, LP | v384771_ex32-2.htm |
| EX-31.1 - EXHIBIT 31.1 - United States Natural Gas Fund, LP | v384771_ex31-1.htm |
| EXCEL - IDEA: XBRL DOCUMENT - United States Natural Gas Fund, LP | Financial_Report.xls |
| EX-32.1 - EXHIBIT 32.1 - United States Natural Gas Fund, LP | v384771_ex32-1.htm |
UNITED STATES
SECURITIES AND EXCHANGE COMMISSION
Washington, D.C. 20549
FORM 10-Q
| x | Quarterly report pursuant to Section 13 or 15(d) of the Securities Exchange Act of 1934 for the quarterly period ended June 30, 2014. |
OR
| ¨ | Transition report pursuant to Section 13 or 15(d) of the Securities Exchange Act of 1934 for the transition period from to . |
Commission File Number: 001-33096
United States Natural Gas Fund, LP
(Exact name of registrant as specified in its charter)
| Delaware | 20-5576760 | |
| (State or other jurisdiction of incorporation or organization) |
(I.R.S. Employer Identification No.) |
1999 Harrison Street, Suite 1530
Oakland, California 94612
(Address of principal executive offices) (Zip code)
(510) 522-9600
(Registrant’s telephone number, including area code)
N/A
(Former name, former address and former fiscal year, if changed since last report)
Indicate by check mark whether the registrant (1) has filed all reports required to be filed by Section 13 or 15(d) of the Securities Exchange Act of 1934 during the preceding 12 months (or for such shorter period that the registrant was required to file such reports), and (2) has been subject to such filing requirements for the past 90 days. x Yes ¨ No
Indicate by check mark whether the registrant has submitted electronically and posted on its corporate Website, if any, every Interactive Data File required to be submitted and posted pursuant to Rule 405 of Regulation S-T (§232.405 of this chapter) during the preceding 12 months (or for such shorter period that the registrant was required to submit and post such files). x Yes ¨ No
Indicate by check mark whether the registrant is a large accelerated filer, an accelerated filer, a non-accelerated filer, or a smaller reporting company. See the definitions of “large accelerated filer,” “accelerated filer” and “smaller reporting company” in Rule 12b-2 of the Exchange Act.
| Large accelerated filer | x | Accelerated filer | ¨ |
| Non-accelerated filer | ¨ (Do not check if a smaller reporting company) | Smaller reporting company | ¨ |
Indicate by check mark whether the registrant is a shell company (as defined in Rule 12b-2 of the Exchange Act). ¨ Yes x No
UNITED STATES NATURAL GAS FUND, LP
Item 1. Condensed Financial Statements.
Index to Condensed Financial Statements
| 1 |
United States Natural Gas Fund, LP
Condensed Statements of Financial Condition
At June 30, 2014 (Unaudited) and December 31, 2013
| June 30, 2014 | December 31, 2013 | |||||||
| Assets | ||||||||
| Cash and cash equivalents (Notes 2 and 5) | $ | 667,529,593 | $ | 792,445,608 | ||||
| Equity in trading accounts: | ||||||||
| Cash and cash equivalents | 44,722,196 | 24,147,579 | ||||||
| Unrealized loss on open commodity futures contracts | (36,278,057 | ) | (14,033,910 | ) | ||||
| Unrealized loss on open swap contracts | — | (6,654,820 | ) | |||||
| Receivable for shares sold | 31,589,597 | 159,392,268 | ||||||
| Dividends receivable | 7,407 | 8,580 | ||||||
| Other assets | 863,489 | 19,044 | ||||||
| Total assets | $ | 708,434,225 | $ | 955,324,349 | ||||
| Liabilities and Partners' Capital | ||||||||
| Payable for shares redeemed | $ | — | $ | 14,887,362 | ||||
| Professional fees payable | 800,405 | 1,454,406 | ||||||
| General Partner management fees payable (Note 3) | 337,786 | 473,547 | ||||||
| Brokerage commissions payable | 72,750 | 81,750 | ||||||
| Other liabilities | 30,684 | 45,120 | ||||||
| Total liabilities | 1,241,625 | 16,942,185 | ||||||
| Commitments and Contingencies (Notes 3, 4 and 5) | ||||||||
| Partners' Capital | ||||||||
| General Partner | — | — | ||||||
| Limited Partners | 707,192,600 | 938,382,164 | ||||||
| Total Partners' Capital | 707,192,600 | 938,382,164 | ||||||
| Total liabilities and partners' capital | $ | 708,434,225 | $ | 955,324,349 | ||||
| Limited Partners' shares outstanding | 28,766,476 | 45,566,476 | ||||||
| Net asset value per share | $ | 24.58 | $ | 20.59 | ||||
| Market value per share | $ | 24.60 | $ | 20.69 | ||||
See accompanying notes to condensed financial statements.
| 2 |
United States Natural Gas Fund, LP
Condensed Schedule of Investments (Unaudited)
At June 30, 2014
| Number of Contracts | Unrealized Loss on Open Commodity Contracts | % of Partners' Capital | ||||||||||
| Open Futures Contracts - Long | ||||||||||||
| United States Contracts | ||||||||||||
| ICE Natural Gas Futures LD1 H August 2014 contracts, expiring July 2014 | 35,873 | $ | (24,714,407 | ) | (3.49 | ) | ||||||
| NYMEX Natural Gas Futures NG August 2014 contracts, expiring July 2014 | 6,887 | (11,563,650 | ) | (1.64 | ) | |||||||
| Total Open Futures Contracts* | 42,760 | $ | (36,278,057 | ) | (5.13 | ) | ||||||
| Principal Amount | Market Value | |||||||||||
| Cash Equivalents | ||||||||||||
| United States Treasury Obligations | ||||||||||||
| U.S. Treasury Bills: | ||||||||||||
| 0.03%, 8/28/2014 | $ | 50,000,000 | $ | 49,997,583 | 7.07 | |||||||
| 0.04%, 10/30/2014 | 200,000,000 | 199,973,111 | 28.28 | |||||||||
| 0.05%, 12/26/2014 | 50,000,000 | 49,988,875 | 7.07 | |||||||||
| Total Treasury Obligations | 299,959,569 | 42.42 | ||||||||||
| United States - Money Market Funds | ||||||||||||
| Goldman Sachs Financial Square Funds - Government Fund - Class FS | 8,087 | 8,087 | 0.00 | ** | ||||||||
| Morgan Stanley Institutional Liquidity Fund - Government Portfolio | 200,495,952 | 200,495,952 | 28.35 | |||||||||
| Wells Fargo Advantage Government Money Market Fund - Class I | 70,001,712 | 70,001,712 | 9.90 | |||||||||
| Total Money Market Funds | 270,505,751 | 38.25 | ||||||||||
| Total Cash Equivalents | $ | 570,465,320 | 80.67 | |||||||||
* Collateral amounted to $94,722,196 on open futures contracts.
** Position represents less than 0.005%.
See accompanying notes to condensed financial statements.
| 3 |
United States Natural Gas Fund, LP
Condensed Statements of Operations (Unaudited)
For the three and six months ended June 30, 2014 and 2013
| Three months ended | Three months ended | Six months ended | Six months ended | |||||||||||||
| June 30, 2014 | June 30, 2013 | June 30, 2014 | June 30, 2013 | |||||||||||||
| Income | ||||||||||||||||
| Gain (loss) on trading of commodity contracts: | ||||||||||||||||
| Realized gain (loss) on closed futures contracts | $ | 36,609,181 | $ | (10,692,690 | ) | $ | 160,696,835 | $ | 77,561,512 | |||||||
| Realized gain (loss) on closed swap contracts | 10,295,155 | (14,361,282 | ) | 25,690,444 | 8,203,508 | |||||||||||
| Change in unrealized loss on open futures contracts | (31,777,372 | ) | (78,127,470 | ) | (22,244,147 | ) | (29,817,447 | ) | ||||||||
| Change in unrealized gain (loss) on open swap contracts | 753,838 | (14,935,774 | ) | 6,654,820 | (7,380,520 | ) | ||||||||||
| Dividend income | 21,895 | 34,929 | 44,842 | 71,617 | ||||||||||||
| Interest income | 38,371 | 43,279 | 104,437 | 100,387 | ||||||||||||
| Other income | 50,000 | 62,000 | 127,000 | 122,000 | ||||||||||||
| Total income (loss) | 15,991,068 | (117,977,008 | ) | 171,074,231 | 48,861,057 | |||||||||||
| Expenses | ||||||||||||||||
| General Partner management fees (Note 3) | 1,047,475 | 1,363,767 | 2,232,443 | 2,924,929 | ||||||||||||
| Brokerage commissions | 452,156 | 529,248 | 1,023,002 | 1,198,958 | ||||||||||||
| Professional fees | 418,766 | 495,382 | 830,643 | 897,254 | ||||||||||||
| Other expenses | 151,010 | 85,208 | 245,411 | 169,574 | ||||||||||||
| Total expenses | 2,069,407 | 2,473,605 | 4,331,499 | 5,190,715 | ||||||||||||
| Net income (loss) | $ | 13,921,661 | $ | (120,450,613 | ) | $ | 166,742,732 | $ | 43,670,342 | |||||||
| Net income (loss) per limited partnership share | $ | 0.23 | $ | (3.04 | ) | $ | 3.99 | $ | 0.02 | |||||||
| Net income (loss) per weighted average limited partnership share | $ | 0.50 | $ | (2.85 | ) | $ | 5.42 | $ | 0.90 | |||||||
| Weighted average limited partnership shares outstanding | 27,626,916 | 42,314,828 | 30,741,062 | 48,731,669 | ||||||||||||
See accompanying notes to condensed financial statements.
| 4 |
United States Natural Gas Fund, LP
Condensed Statements of Changes in Partners' Capital (Unaudited)
For the six months ended June 30, 2014
| General Partner | Limited Partners | Total | ||||||||||
| Balances, at December 31, 2013 | $ | — | $ | 938,382,164 | $ | 938,382,164 | ||||||
| Addition of 68,000,000 partnership shares | — | 1,686,628,799 | 1,686,628,799 | |||||||||
| Redemption of 84,800,000 partnership shares | — | (2,084,561,095 | ) | (2,084,561,095 | ) | |||||||
| Net income | — | 166,742,732 | 166,742,732 | |||||||||
| Balances, at June 30, 2014 | $ | — | $ | 707,192,600 | $ | 707,192,600 | ||||||
| Net Asset Value Per Share: | ||||||||||||
| At December 31, 2013 | $ | 20.59 | ||||||||||
| At June 30, 2014 | $ | 24.58 | ||||||||||
See accompanying notes to condensed financial statements.
| 5 |
United States Natural Gas Fund, LP
Condensed Statements of Cash Flows (Unaudited)
For the six months ended June 30, 2014 and 2013
| Six months ended | Six months ended | |||||||
| June 30, 2014 | June 30, 2013 | |||||||
| Cash Flows from Operating Activities: | ||||||||
| Net income | $ | 166,742,732 | $ | 43,670,342 | ||||
| Adjustments to reconcile net income to net cash provided by operating activities: | ||||||||
| (Increase) decrease in commodity futures trading account - cash and cash equivalents | (20,574,617 | ) | 14,754,798 | |||||
| Unrealized loss on open futures contracts | 22,244,147 | 29,817,447 | ||||||
| Unrealized (gain) loss on open swap contracts | (6,654,820 | ) | 7,380,520 | |||||
| Decrease in dividends receivable | 1,173 | 5,703 | ||||||
| Increase in other assets | (844,445 | ) | (49,030 | ) | ||||
| Decrease in professional fees payable | (654,001 | ) | (791,214 | ) | ||||
| Decrease in General Partner management fees payable | (135,761 | ) | (148,583 | ) | ||||
| Decrease in brokerage commissions payable | (9,000 | ) | (52,500 | ) | ||||
| Decrease in other liabilities | (14,436 | ) | (12,661 | ) | ||||
| Net cash provided by operating activities | 160,100,972 | 94,574,822 | ||||||
| Cash Flows from Financing Activities: | ||||||||
| Addition of partnership shares | 1,814,431,470 | 1,047,378,147 | ||||||
| Redemption of partnership shares | (2,099,448,457 | ) | (1,468,876,927 | ) | ||||
| Net cash used in financing activities | (285,016,987 | ) | (421,498,780 | ) | ||||
| Net Decrease in Cash and Cash Equivalents | (124,916,015 | ) | (326,923,958 | ) | ||||
| Cash and Cash Equivalents, beginning of period | 792,445,608 | 1,100,510,722 | ||||||
| Cash and Cash Equivalents, end of period | $ | 667,529,593 | $ | 773,586,764 | ||||
See accompanying notes to condensed financial statements.
| 6 |
United States Natural Gas Fund, LP
Notes to Condensed Financial Statements
For the period ended June 30, 2014 (Unaudited)
NOTE 1 — ORGANIZATION AND BUSINESS
The United States Natural Gas Fund, LP (“UNG”) was organized as a limited partnership under the laws of the state of Delaware on September 11, 2006. UNG is a commodity pool that issues limited partnership shares (“shares”) that may be purchased and sold on the NYSE Arca, Inc. (the “NYSE Arca”). Prior to November 25, 2008, UNG’s shares traded on the American Stock Exchange (the “AMEX”). UNG will continue in perpetuity, unless terminated sooner upon the occurrence of one or more events as described in its Fourth Amended and Restated Agreement of Limited Partnership dated as of March 1, 2013 (the “LP Agreement”). The investment objective of UNG is for the daily changes in percentage terms of its shares’ per share net asset value (“NAV”) to reflect the daily changes in percentage terms of the price of natural gas delivered at the Henry Hub, Louisiana as measured by the daily changes in the price of the futures contract on natural gas as traded on the New York Mercantile Exchange (the “NYMEX”), that is the near month contract to expire, except when the near month contract is within two weeks of expiration, in which case the futures contract will be the next month contract to expire (the “Benchmark Futures Contract”), less UNG’s expenses. It is not the intent of UNG to be operated in a fashion such that the per share NAV will equal, in dollar terms, the spot price of natural gas or any particular futures contract based on natural gas. It is not the intent of UNG to be operated in a fashion such that its per share NAV will reflect the percentage change of the price of any particular futures contract as measured over a time period greater than one day. United States Commodity Funds LLC (“USCF”), the general partner of UNG, believes that it is not practical to manage the portfolio to achieve such an investment goal when investing in Natural Gas Futures Contracts (as defined below) and Other Natural Gas-Related Investments (as defined below). The net assets of UNG consist primarily of investments in futures contracts for natural gas that are traded on the NYMEX, ICE Futures Exchange (“ICE Futures”) or other U.S. and foreign exchanges (collectively, “Natural Gas Futures Contracts”) and, to a lesser extent, in order to comply with regulatory requirements or in view of market conditions, other natural gas-related investments such as cash-settled options on Natural Gas Futures Contracts, forward contracts for natural gas, cleared swap contracts, and non-exchange traded (“over-the-counter”) transactions that are based on the price of natural gas, crude oil and other petroleum-based fuels, as well as futures contracts for crude oil, heating oil, gasoline and other petroleum-based fuels and indices based on the foregoing (collectively, “Other Natural Gas-Related Investments”). Market conditions that USCF currently anticipates could cause UNG to invest in Other Natural Gas-Related Investments including those allowing UNG to obtain greater liquidity or to execute transactions with more favorable pricing. For convenience and unless otherwise specified, Natural Gas Futures Contracts and Other Natural Gas-Related Investments collectively are referred to as “Natural Gas Interests” in this quarterly report on Form 10-Q. USCF is authorized by UNG in its sole judgment to employ, establish the terms of employment for and terminate commodity trading advisors of futures commission merchants. As of June 30, 2014, UNG held 6,887 NG Futures August 2014 Contracts traded on the NYMEX and 35,873 LD1 H Futures August 2014 Contracts traded on the ICE Futures US.
UNG commenced investment operations on April 18, 2007 and has a fiscal year ending on December 31. USCF is responsible for the management of UNG. USCF is a member of the National Futures Association (the “NFA”) and became a commodity pool operator registered with the Commodity Futures Trading Commission (the “CFTC”) effective December 1, 2005 and a swaps firm on August 8, 2013. USCF is also the general partner of the United States Oil Fund, LP (“USO”), the United States 12 Month Oil Fund, LP (“USL”), the United States Gasoline Fund, LP (“UGA”) and the United States Diesel-Heating Oil Fund, LP (“UHN”), which listed their limited partnership shares on the AMEX under the ticker symbols “USO” on April 10, 2006, “USL” on December 6, 2007, “UGA” on February 26, 2008 and “UHN” on April 9, 2008, respectively. As a result of the acquisition of the AMEX by NYSE Euronext, each of USO’s, USL’s, UGA’s and UHN’s shares commenced trading on the NYSE Arca on November 25, 2008. USCF is also the general partner of the United States Short Oil Fund, LP (“DNO”), the United States 12 Month Natural Gas Fund, LP (“UNL”) and the United States Brent Oil Fund, LP (“BNO”), which listed their limited partnership shares on the NYSE Arca under the ticker symbols “DNO” on September 24, 2009, “UNL” on November 18, 2009 and “BNO” on June 2, 2010, respectively. USCF is also the sponsor of the United States Commodity Index Fund (“USCI”), the United States Copper Index Fund (“CPER”), the United States Agriculture Index Fund (“USAG”) and the United States Metals Index Fund (“USMI”), each a series of the United States Commodity Index Funds Trust. USCI, CPER, USAG and USMI listed their shares on the NYSE Arca under the ticker symbol “USCI” on August 10, 2010, “CPER” on November 15, 2011, “USAG” on April 13, 2012 and “USMI” on June 19, 2012, respectively. All funds listed previously are referred to collectively herein as the “Related Public Funds.”
| 7 |
UNG issues shares to certain authorized purchasers (“Authorized Purchasers”) by offering baskets consisting of 100,000 shares (“Creation Baskets”) through ALPS Distributors, Inc., as the marketing agent (the “Marketing Agent”). The purchase price for a Creation Basket is based upon the NAV of a share calculated shortly after the close of the core trading session on the NYSE Arca on the day the order to create the basket is properly received.
In addition, Authorized Purchasers pay UNG a $1,000 fee for each order placed to create one or more Creation Baskets or to redeem one or more baskets (“Redemption Baskets”), consisting of 100,000 shares. Shares may be purchased or sold on a nationally recognized securities exchange in smaller increments than a Creation Basket or Redemption Basket. Shares purchased or sold on a nationally recognized securities exchange are not purchased or sold at the per share NAV of UNG but rather at market prices quoted on such exchange.
In April 2007, UNG initially registered 30,000,000 shares on Form S-1 with the U.S. Securities and Exchange Commission (the “SEC”). On April 18, 2007, UNG listed its shares on the AMEX under the ticker symbol “UNG”. On that day, UNG established its initial per share NAV by setting the price at $50.00 and issued 200,000 shares in exchange for $10,001,000. UNG also commenced investment operations on April 18, 2007, by purchasing Natural Gas Futures Contracts traded on the NYMEX based on natural gas. As a result of the acquisition of the AMEX by NYSE Euronext, UNG commenced trading on the NYSE Arca on November 25, 2008. As of June 30, 2014, UNG had registered a total of 1,680,000,000 shares.
The accompanying unaudited condensed financial statements have been prepared in accordance with Rule 10-01 of Regulation S-X promulgated by the SEC and, therefore, do not include all information and footnote disclosure required under generally accepted accounting principles (“GAAP”) in the United States of America. The financial information included herein is unaudited; however, such financial information reflects all adjustments, consisting only of normal recurring adjustments, which are, in the opinion of USCF, necessary for the fair presentation of the condensed financial statements for the interim period.
NOTE 2 — SUMMARY OF SIGNIFICANT ACCOUNTING POLICIES
Basis of Presentation
The financial statements have been prepared in conformity with GAAP as detailed in the Financial Accounting Standards Board’s (“FASB”) Accounting Standards Codification. UNG is an investment company and follows the accounting and reporting guidance in FASB Topic 946.
Revenue Recognition
Commodity futures contracts, forward contracts, physical commodities and related options are recorded on the trade date. All such transactions are recorded on the identified cost basis and marked to market daily. Unrealized gains or losses on open contracts are reflected in the condensed statements of financial condition and represent the difference between the original contract amount and the market value (as determined by exchange settlement prices for futures contracts and related options and cash dealer prices at a predetermined time for forward contracts, physical commodities, and their related options) as of the last business day of the year or as of the last date of the condensed financial statements. Changes in the unrealized gains or losses between periods are reflected in the condensed statements of operations. UNG earns interest on its assets denominated in U.S. dollars on deposit with the futures commission merchant at the overnight Federal Funds Rate less 32 basis points. In addition, UNG earns income on funds held at the custodian or futures commission merchant at prevailing market rates earned on such investments.
Investments in over-the-counter total return swap contracts (see Note 5) are arrangements to exchange a periodic payment for a market-linked return, each based on a notional amount. To the extent that the total return of the commodity future, security or index underlying the transaction exceeds or falls short of the offsetting periodic payment obligation, UNG receives a payment from, or makes a payment to, the swap counterparty. The over-the-counter swap contracts are valued daily based upon the appreciation or depreciation of the underlying securities subsequent to the effective date of the contract. Changes in the value of the swaps are reported as unrealized gains and losses and periodic payments are recorded as realized gains or losses in the accompanying condensed statements of operations.
| 8 |
Brokerage Commissions
Brokerage commissions on all open commodity futures contracts are accrued on a full-turn basis.
Swap Premiums
Upfront fees paid by UNG for over-the-counter swap contracts are reflected on the condensed statements of financial condition and represent payments made upon entering into a swap agreement to compensate for differences between the stated terms of the agreement and prevailing market conditions. The fees are amortized daily over the term of the swap agreement.
Income Taxes
UNG is not subject to federal income taxes; each partner reports his/her allocable share of income, gain, loss deductions or credits on his/her own income tax return.
In accordance with GAAP, UNG is required to determine whether a tax position is more likely than not to be sustained upon examination by the applicable taxing authority, including resolution of any tax related appeals or litigation processes, based on the technical merits of the position. UNG files an income tax return in the U.S. federal jurisdiction, and may file income tax returns in various U.S. states. UNG is not subject to income tax return examinations by major taxing authorities for years before 2010. The tax benefit recognized is measured as the largest amount of benefit that has a greater than fifty percent likelihood of being realized upon ultimate settlement. De-recognition of a tax benefit previously recognized results in UNG recording a tax liability that reduces net assets. However, UNG’s conclusions regarding this policy may be subject to review and adjustment at a later date based on factors including, but not limited to, on-going analysis of and changes to tax laws, regulations and interpretations thereof. UNG recognizes interest accrued related to unrecognized tax benefits and penalties related to unrecognized tax benefits in income tax fees payable, if assessed. No interest expense or penalties have been recognized as of and for the period ended June 30, 2014.
Creations and Redemptions
Authorized Purchasers may purchase Creation Baskets or redeem Redemption Baskets only in blocks of 100,000 shares at a price equal to the NAV of the shares calculated shortly after the close of the core trading session on the NYSE Arca on the day the order is placed.
UNG receives or pays the proceeds from shares sold or redeemed within three business days after the trade date of the purchase or redemption. The amounts due from Authorized Purchasers are reflected in UNG’s condensed statements of financial condition as receivable for shares sold, and amounts payable to Authorized Purchasers upon redemption are reflected as payable for shares redeemed.
Authorized Purchasers pay UNG a fee of $1,000 for each order placed to create one or more Creation Baskets or to redeem one or more Redemption Baskets.
Partnership Capital and Allocation of Partnership Income and Losses
Profit or loss shall be allocated among the partners of UNG in proportion to the number of shares each partner holds as of the close of each month. USCF may revise, alter or otherwise modify this method of allocation as described in the LP Agreement.
Calculation of Per Share Net Asset Value
UNG’s per share NAV is calculated on each NYSE Arca trading day by taking the current market value of its total assets, subtracting any liabilities and dividing that amount by the total number of shares outstanding. UNG uses the closing price for the contracts on the relevant exchange on that day to determine the value of contracts held on such exchange.
| 9 |
Net Income (Loss) Per Share
Net income (loss) per share is the difference between the per share NAV at the beginning of each period and at the end of each period. The weighted average number of shares outstanding was computed for purposes of disclosing net income (loss) per weighted average share. The weighted average shares are equal to the number of shares outstanding at the end of the period, adjusted proportionately for shares added and redeemed based on the amount of time the shares were outstanding during such period. There were no shares held by USCF at June 30, 2014.
Offering Costs
Offering costs incurred in connection with the registration of additional shares after the initial registration of shares are borne by UNG. These costs include registration fees paid to regulatory agencies and all legal, accounting, printing and other expenses associated with such offerings. These costs are accounted for as a deferred charge and thereafter amortized to expense over twelve months on a straight-line basis or a shorter period if warranted.
Cash Equivalents
Cash equivalents include money market funds and overnight deposits or time deposits with original maturity dates of six months or less.
Reclassification
Certain amounts in the accompanying condensed financial statements were reclassified to conform to the current presentation.
Use of Estimates
The preparation of condensed financial statements in conformity with GAAP requires USCF to make estimates and assumptions that affect the reported amount of assets and liabilities and disclosure of contingent assets and liabilities at the date of the condensed financial statements, and the reported amounts of the revenue and expenses during the reporting period. Actual results may differ from those estimates and assumptions.
NOTE 3 — FEES PAID BY THE FUND AND RELATED PARTY TRANSACTIONS
USCF Management Fee
Under the LP Agreement, USCF is responsible for investing the assets of UNG in accordance with the objectives and policies of UNG. In addition, USCF has arranged for one or more third parties to provide administrative, custody, accounting, transfer agency and other necessary services to UNG. For these services, UNG is contractually obligated to pay USCF a fee, which is paid monthly, that is equal to 0.60% per annum of average daily total net assets of $1,000,000,000 or less and 0.50% per annum of average daily total net assets that are greater than $1,000,000,000.
Ongoing Registration Fees and Other Offering Expenses
UNG pays all costs and expenses associated with the ongoing registration of its shares subsequent to the initial offering. These costs include registration or other fees paid to regulatory agencies in connection with the offer and sale of shares, and all legal, accounting, printing and other expenses associated with such offer and sale. For the six months ended June 30, 2014, UNG incurred $88,206 in registration fees and other offering expenses. For the six months ended June 30, 2013, UNG did not incur registration fees and other offering expenses.
| 10 |
Directors’ Fees and Expenses
UNG is responsible for paying its portion of the directors’ and officers’ liability insurance for UNG and the Related Public Funds and the fees and expenses of the independent directors who also serve as audit committee members of UNG and the Related Public Funds organized as limited partnerships and, as of July 8, 2011, the Related Public Funds organized as a series of a Delaware statutory trust. UNG shares the fees and expenses on a pro rata basis with each Related Public Fund, as described above, based on the relative assets of each Related Public Fund computed on a daily basis. These fees and expenses for the year ending December 31, 2014 are estimated to be a total of $560,625 for UNG and the Related Public Funds.
Licensing Fees
As discussed in Note 4 below, UNG entered into a licensing agreement with the NYMEX on April 10, 2006, as amended on October 20, 2011. Pursuant to the agreement, UNG and the Related Public Funds, other than BNO, USCI, CPER, USAG and USMI, pay a licensing fee that is equal to 0.015% on all net assets. During the six months ended June 30, 2014 and 2013, UNG incurred $55,812 and $73,544, respectively, under this arrangement.
Investor Tax Reporting Cost
The fees and expenses associated with UNG’s audit expenses and tax accounting and reporting requirements are paid by UNG. These costs are estimated to be $1,500,000 for the year ending December 31, 2014.
Other Expenses and Fees
In addition to the fees described above, UNG pays all brokerage fees, transaction costs for over-the-counter swaps and other expenses in connection with the operation of UNG, but excluding costs and expenses paid by USCF as outlined in Note 4 below.
NOTE 4 — CONTRACTS AND AGREEMENTS
UNG is party to a marketing agent agreement, dated as of April 17, 2007, as amended from time to time, with the Marketing Agent and USCF, whereby the Marketing Agent provides certain marketing services for UNG as outlined in the agreement. The fee of the Marketing Agent, which is borne by USCF, is equal to 0.06% on UNG’s assets up to $3 billion and 0.04% on UNG’s assets in excess of $3 billion.
The above fee does not include website construction and development, which are also borne by USCF.
UNG is also party to a custodian agreement, dated March 5, 2007, as amended from time to time, with Brown Brothers Harriman & Co. (“BBH&Co.”) and USCF, whereby BBH&Co. holds investments on behalf of UNG. USCF pays the fees of the custodian, which are determined by the parties from time to time. In addition, UNG is party to an administrative agency agreement, dated March 5, 2007, as amended from time to time, with USCF and BBH&Co., whereby BBH&Co. acts as the administrative agent, transfer agent and registrar for UNG. USCF also pays the fees of BBH&Co. for its services under such agreement and such fees are determined by the parties from time to time.
Currently, USCF pays BBH&Co. for its services, in the foregoing capacities, a minimum amount of $75,000 annually for its custody, fund accounting and fund administration services rendered to UNG and each of the Related Public Funds, as well as a $20,000 annual fee for its transfer agency services. In addition, USCF pays BBH&Co. an asset-based charge of (a) 0.06% for the first $500 million of the Related Public Funds’ combined net assets, (b) 0.0465% for the Related Public Funds’ combined net assets greater than $500 million but less than $1 billion, and (c) 0.035% once Related Public Funds’ combined net assets exceed $1 billion. The annual minimum amount will not apply if the asset-based charge for all accounts in the aggregate exceeds $75,000. USCF also pays transaction fees ranging from $7 to $15 per transaction.
| 11 |
On October 8, 2013, UNG entered into a brokerage agreement with RBC Capital Markets, LLC (“RBC Capital” or “RBC”) to serve as UNG’s futures commission merchant (“FCM”), effective October 10, 2013. Prior to October 10, 2013, the FCM was UBS Securities LLC (“UBS Securities”). The agreements require RBC Capital and UBS Securities to provide services to UNG in connection with the purchase and sale of Natural Gas Futures Contracts and Other Natural Gas-Related Investments that may be purchased and sold by or through RBC Capital and/or UBS Securities for UNG’s account. In accordance with each agreement, RBC Capital and UBS Securities charge UNG commissions of approximately $7 to $15 per round-turn trade, including applicable exchange and NFA fees for Natural Gas Futures Contracts and options on Natural Gas Futures Contracts. Such fees include those incurred when purchasing Natural Gas Futures Contracts and options on Natural Gas Futures Contracts when UNG issues shares as a result of a Creation Basket, as well as fees incurred when selling Natural Gas Futures Contracts and options on Natural Gas Futures Contracts when UNG redeems shares as a result of a Redemption Basket. Such fees are also incurred when Natural Gas Futures Contracts and options on Natural Gas Futures Contracts are purchased or redeemed for the purpose of rebalancing the portfolio. UNG also incurs commissions to brokers for the purchase and sales of Natural Gas Futures Contracts, Other Natural Gas-Related Investments or short-term obligations of the United States of two years or less (“Treasuries”).
| For the six months ended June 30, 2014 | For the six months ended June 30, 2013 | |||||||
| Total commissions accrued to brokers | $ | 1,023,002 | $ | 1,198,958 | ||||
| Commissions accrued as a result of rebalancing | $ | 788,060 | $ | 1,009,042 | ||||
| Percentage of commissions accrued as a result of rebalancing | 77.03 | % | 84.16 | % | ||||
| Commissions accrued as a result of creation and redemption activity | $ | 234,942 | $ | 189,916 | ||||
| Percentage of commissions accrued as a result of creation and redemption activity | 22.97 | % | 15.84 | % | ||||
The decrease in the total commissions accrued to brokers for the six months ended June 30, 2014, compared to the six months ended June 30, 2013, was a result of decreased brokerage fees due to a lower number of futures contracts being held and traded as a result of UNG’s reduced net assets during the six months ended June 30, 2014. As an annualized percentage of average daily total net assets, the figure for the six months ended June 30, 2014, represents approximately 0.27% of average daily total net assets. By comparison, the figure for the six months ended June 30, 2013, represented approximately 0.24% of average daily total net assets. However, there can be no assurance that commission costs and portfolio turnover will not cause commission expenses to rise in future quarters.
UNG and the NYMEX entered into a licensing agreement on April 10, 2006, as amended on October 20, 2011, whereby UNG was granted a non-exclusive license to use certain of the NYMEX’s settlement prices and service marks. Under the licensing agreement, UNG and the Related Public Funds, other than BNO, USCI, CPER, USAG and USMI, pay the NYMEX an asset-based fee for the license, the terms of which are described in Note 3. UNG expressly disclaims any association with the NYMEX or endorsement of UNG by the NYMEX and acknowledges that “NYMEX” and “New York Mercantile Exchange” are registered trademarks of the NYMEX.
NOTE 5 — FINANCIAL INSTRUMENTS, OFF-BALANCE SHEET RISKS AND CONTINGENCIES
UNG engages in the trading of futures contracts, options on futures contracts, cleared swaps and over-the-counter swaps (collectively, “derivatives”). UNG is exposed to both market risk, which is the risk arising from changes in the market value of the contracts, and credit risk, which is the risk of failure by another party to perform according to the terms of a contract.
UNG may enter into futures contracts, options on futures contracts, cleared swaps and over-the-counter swaps to gain exposure to changes in the value of an underlying commodity. A futures contract obligates the seller to deliver (and the purchaser to accept) the future delivery of a specified quantity and type of a commodity at a specified time and place. Some futures contracts may call for physical delivery of the asset, while others are settled in cash. The contractual obligations of a buyer or seller may generally be satisfied by taking or making physical delivery of the underlying commodity or by making an offsetting sale or purchase of an identical futures contract on the same or linked exchange before the designated date of delivery. Cleared swaps are over-the-counter agreements that are eligible to be cleared by a clearinghouse, e.g., ICE Clear Europe, but which are not traded on an exchange. A cleared swap is created when the parties to an off-exchange over-the-counter swap transaction agree to extinguish their over-the-counter contract and replace it with a cleared swap. Cleared swaps are intended to provide the efficiencies and benefits that centralized clearing on an exchange offers to traders of futures contracts, including credit risk intermediation and the ability to offset positions initiated with different counterparties.
| 12 |
The purchase and sale of futures contracts, options on futures contracts and cleared swaps require margin deposits with a futures commission merchant. Additional deposits may be necessary for any loss on contract value. The Commodity Exchange Act requires a futures commission merchant to segregate all customer transactions and assets from the futures commission merchant’s proprietary activities.
Futures contracts, options on futures contracts and cleared swaps involve, to varying degrees, elements of market risk (specifically commodity price risk) and exposure to loss in excess of the amount of variation margin. The face or contract amounts reflect the extent of the total exposure UNG has in the particular classes of instruments. Additional risks associated with the use of futures contracts are an imperfect correlation between movements in the price of the futures contracts and the market value of the underlying securities and the possibility of an illiquid market for a futures contract. Buying and selling options on futures contracts exposes investors to the risks of purchasing or selling futures contracts.
All of UNG’s investment contracts were exchange-traded futures contracts or fully-collateralized over-the-counter swaps through June 30, 2014. UNG held no over-the-counter swaps effective April 23, 2014. The risks associated with exchange-traded contracts are generally perceived to be less than those associated with over-the-counter transactions, since, in over-the-counter transactions, a party must rely solely on the credit of its respective individual counterparties. However, in the future, if UNG were to enter into non-exchange traded contracts, it would be subject to the credit risk associated with counterparty non-performance. The credit risk from counterparty non-performance associated with such instruments is the net unrealized gain, if any, on the transaction. UNG has credit risk under its futures contracts since the sole counterparty to all domestic and foreign futures contracts is the clearinghouse for the exchange on which the relevant contracts are traded. In addition, UNG bears the risk of financial failure by the clearing broker.
At June 30, 2014, UNG did not hold any over-the-counter swap agreements, as compared to June 30, 2013 when UNG held two over-the-counter swap agreements whereby UNG’s counterparty posted $0 in cash and $0 in securities and UNG posted $21,851,940 in cash and $20,927,795 in securities.
UNG’s cash and other property, such as Treasuries, deposited with a futures commission merchant are considered commingled with all other customer funds, subject to the futures commission merchant’s segregation requirements. In the event of a futures commission merchant’s insolvency, recovery may be limited to a pro rata share of segregated funds available. It is possible that the recovered amount could be less than the total of cash and other property deposited. The insolvency of a futures commission merchant could result in the complete loss of UNG’s assets posted with that futures commission merchant; however, the majority of UNG’s assets are held in Treasuries, cash and/or cash equivalents with UNG’s custodian and would not be impacted by the insolvency of a futures commission merchant. The failure or insolvency of UNG’s custodian, however, could result in a substantial loss of UNG’s assets.
USCF invests a portion of UNG’s cash in money market funds that seek to maintain a stable per share NAV. UNG is exposed to any risk of loss associated with an investment in such money market funds. As of June 30, 2014 and December 31, 2013, UNG held investments in money market funds in the amounts of $270,505,751 and $392,614,029, respectively. UNG also holds cash deposits with its custodian. Pursuant to a written agreement with BBH&Co., uninvested overnight cash balances are swept to offshore branches of U.S. regulated and domiciled banks located in Toronto, Canada; London, United Kingdom; Grand Cayman, Cayman Islands; and Nassau, Bahamas; which are subject to U.S. regulation and regulatory oversight. As of June 30, 2014 and December 31, 2013, UNG held cash deposits and investments in Treasuries in the amounts of $441,746,038 and $423,979,158, respectively, with the custodian and futures commission merchant. Some or all of these amounts may be subject to loss should UNG’s custodian and/or futures commission merchant cease operations.
| 13 |
For derivatives, risks arise from changes in the market value of the contracts. Theoretically, UNG is exposed to market risk equal to the value of futures contracts purchased and unlimited liability on such contracts sold short. As both a buyer and a seller of options, UNG pays or receives a premium at the outset and then bears the risk of unfavorable changes in the price of the contract underlying the option.
UNG’s policy is to continuously monitor its exposure to market and counterparty risk through the use of a variety of financial, position and credit exposure reporting controls and procedures. In addition, UNG has a policy of requiring review of the credit standing of each broker or counterparty with which it conducts business.
The financial instruments held by UNG are reported in its condensed statements of financial condition at market or fair value, or at carrying amounts that approximate fair value, because of their highly liquid nature and short-term maturity.
NOTE 6 — FINANCIAL HIGHLIGHTS
The following table presents per share performance data and other supplemental financial data for the six months ended June 30, 2014 and 2013 for the shareholders. This information has been derived from information presented in the condensed financial statements.
| For the six months ended June 30, 2014 (Unaudited) | For the six months ended June 30, 2013 (Unaudited) | |||||||
| Per Share Operating Performance: | ||||||||
| Net asset value, beginning of period | $ | 20.59 | $ | 18.87 | ||||
| Total income | 4.13 | 0.13 | ||||||
| Total expenses | (0.14 | ) | (0.11 | ) | ||||
| Net increase in net asset value | 3.99 | 0.02 | ||||||
| Net asset value, end of period | $ | 24.58 | $ | 18.89 | ||||
| Total Return | 19.38 | % | 0.11 | % | ||||
| Ratios to Average Net Assets | ||||||||
| Total income | 22.80 | % | 4.94 | % | ||||
| Expenses excluding management fees* | 0.56 | % | 0.46 | % | ||||
| Management fees* | 0.60 | % | 0.60 | % | ||||
| Net income | 22.22 | % | 4.42 | % | ||||
| * | Annualized. |
Total returns are calculated based on the change in value during the period. An individual shareholder’s total return and ratio may vary from the above total returns and ratios based on the timing of contributions to and withdrawals from UNG.
NOTE 7 — FAIR VALUE OF FINANCIAL INSTRUMENTS
UNG values its investments in accordance with Accounting Standards Codification 820 – Fair Value Measurements and Disclosures (“ASC 820”). ASC 820 defines fair value, establishes a framework for measuring fair value in generally accepted accounting principles, and expands disclosures about fair value measurement. The changes to past practice resulting from the application of ASC 820 relate to the definition of fair value, the methods used to measure fair value, and the expanded disclosures about fair value measurement. ASC 820 establishes a fair value hierarchy that distinguishes between: (1) market participant assumptions developed based on market data obtained from sources independent of UNG (observable inputs) and (2) UNG’s own assumptions about market participant assumptions developed based on the best information available under the circumstances (unobservable inputs). The three levels defined by the ASC 820 hierarchy are as follows:
| 14 |
Level I – Quoted prices (unadjusted) in active markets for identical assets or liabilities that the reporting entity has the ability to access at the measurement date.
Level II – Inputs other than quoted prices included within Level I that are observable for the asset or liability, either directly or indirectly. Level II assets include the following: quoted prices for similar assets or liabilities in active markets, quoted prices for identical or similar assets or liabilities in markets that are not active, inputs other than quoted prices that are observable for the asset or liability, and inputs that are derived principally from or corroborated by observable market data by correlation or other means (market-corroborated inputs).
Level III – Unobservable pricing input at the measurement date for the asset or liability. Unobservable inputs shall be used to measure fair value to the extent that observable inputs are not available.
In some instances, the inputs used to measure fair value might fall within different levels of the fair value hierarchy. The level in the fair value hierarchy within which the fair value measurement in its entirety falls shall be determined based on the lowest input level that is significant to the fair value measurement in its entirety.
The following table summarizes the valuation of UNG’s securities at June 30, 2014 using the fair value hierarchy:
| At June 30, 2014 | Total | Level I | Level II | Level III | ||||||||||||
| Short-Term Investments | $ | 570,465,320 | $ | 570,465,320 | $ | — | $ | — | ||||||||
| Exchange-Traded Futures Contracts | ||||||||||||||||
| United States Contracts | (36,278,057 | ) | (36,278,057 | ) | — | — | ||||||||||
During the six months ended June 30, 2014, there were no transfers between Level I and Level II.
Following is a reconciliation of assets in which significant unobservable inputs (Level III) were used in determining fair value as of June 30, 2014:
| Total Return Swap Contracts | ||||
| Beginning balance as of 12/31/13 | $ | (6,654,820 | ) | |
| Realized gain (loss)* | — | |||
| Change in unrealized gain | 6,654,820 | |||
| Ending balance as of 06/30/14 | $ | — |
| * | The realized gain (loss) incurred during the six months ended June 30, 2014 for total return swaps was $25,690,444. |
The following table summarizes the valuation of UNG’s securities at December 31, 2013 using the fair value hierarchy:
| At December 31, 2013 | Total | Level I | Level II | Level III | ||||||||||||
| Short-Term Investments | $ | 742,544,890 | $ | 742,544,890 | $ | — | $ | — | ||||||||
| Exchange-Traded Futures Contracts | ||||||||||||||||
| United States Contracts | (14,033,910 | ) | (14,033,910 | ) | — | — | ||||||||||
| Over-the-Counter Total Return Swap Contracts | (6,654,820 | ) | — | — | (6,654,820 | ) | ||||||||||
During the year ended December 31, 2013, there were no transfers between Level I and Level II.
| 15 |
Following is a reconciliation of assets in which significant unobservable inputs (Level III) were used in determining fair value as of December 31, 2013:
| Total Return Swap Contracts | ||||
| Beginning balance as of 12/31/12 | $ | (3,470,939 | ) | |
| Realized gain (loss)* | — | |||
| Change in unrealized loss | (3,183,881 | ) | ||
| Ending balance as of 12/31/13 | $ | (6,654,820 | ) |
| * | The realized gain (loss) incurred during the fiscal year ended December 31, 2013 for total return swaps was $13,643,971. |
Effective January 1, 2009, UNG adopted the provisions of Accounting Standards Codification 815 — Derivatives and Hedging, which require presentation of qualitative disclosures about objectives and strategies for using derivatives, quantitative disclosures about fair value amounts and gains and losses on derivatives.
Fair Value of Derivative Instruments
| Derivatives not Accounted for as Hedging Instruments | Condensed Statements of Financial Condition Location | Fair Value At June 30, 2014 | Fair Value At December 31, 2013 | |||||||
| Futures - Commodity Contracts | Assets | $ | (36,278,057 | ) | $ | (14,033,910 | ) | |||
| Swaps - Commodity Contracts | Assets | — | (6,654,820 | ) | ||||||
The Effect of Derivative Instruments on the Condensed Statements of Operations
| For the six months ended June 30, 2014 | For the six months ended June 30, 2013 | |||||||||||||||||
| Derivatives not Accounted for as Hedging Instruments | Location of Gain or (Loss) on Derivatives Recognized in Income | Realized Gain on Derivatives Recognized in Income | Change in Unrealized Gain or (Loss) on Derivatives Recognized in Income | Realized Gain on Derivatives Recognized in Income | Change in Unrealized Loss on Derivatives Recognized in Income | |||||||||||||
| Futures - Commodity Contracts | Realized gain on closed futures positions | $ | 160,696,835 | $ | 77,561,512 | |||||||||||||
| Change in unrealized loss on open futures positions | $ | (22,244,147 | ) | $ | (29,817,447 | ) | ||||||||||||
| Swaps - Commodity Contracts | Realized gain on closed swap contracts | 25,690,444 | 8,203,508 | |||||||||||||||
| Change in unrealized gain or (loss) on open swap contracts | 6,654,820 | (7,380,520 | ) | |||||||||||||||
NOTE 8 — SUBSEQUENT EVENTS
UNG has performed an evaluation of subsequent events through the date the condensed financial statements were issued. This evaluation did not result in any subsequent events that necessitated disclosures and/or adjustments.
| 16 |
Item 2. Management’s Discussion and Analysis of Financial Condition and Results of Operations.
The following discussion should be read
in conjunction with the condensed financial statements and the notes thereto of the United States Natural Gas Fund, LP (“UNG”)
included elsewhere in this quarterly report on
Form 10-Q.
Forward-Looking Information
This quarterly report on Form 10-Q, including this “Management’s Discussion and Analysis of Financial Condition and Results of Operations,” contains forward-looking statements regarding the plans and objectives of management for future operations. This information may involve known and unknown risks, uncertainties and other factors that may cause UNG’s actual results, performance or achievements to be materially different from future results, performance or achievements expressed or implied by any forward-looking statements. Forward-looking statements, which involve assumptions and describe UNG’s future plans, strategies and expectations, are generally identifiable by use of the words “may,” “will,” “should,” “expect,” “anticipate,” “estimate,” “believe,” “intend” or “project,” the negative of these words, other variations on these words or comparable terminology. These forward-looking statements are based on assumptions that may be incorrect, and UNG cannot assure investors that the projections included in these forward-looking statements will come to pass. UNG’s actual results could differ materially from those expressed or implied by the forward-looking statements as a result of various factors.
UNG has based the forward-looking statements included in this quarterly report on Form 10-Q on information available to it on the date of this quarterly report on Form 10-Q, and UNG assumes no obligation to update any such forward-looking statements. Although UNG undertakes no obligation to revise or update any forward-looking statements, whether as a result of new information, future events or otherwise, investors are advised to consult any additional disclosures that UNG may make directly to them or through reports that UNG in the future files with the U.S. Securities and Exchange Commission (the “SEC”), including annual reports on Form 10-K, quarterly reports on Form 10-Q and current reports on Form 8-K.
Introduction
UNG, a Delaware limited partnership, is a commodity pool that issues shares that may be purchased and sold on the NYSE Arca, Inc. (the “NYSE Arca”). The investment objective of UNG is for the daily changes in percentage terms of its shares’ per share net asset value (“NAV”) to reflect the daily changes in percentage terms of the price of natural gas delivered at the Henry Hub, Louisiana, as measured by the daily changes in the price of the futures contract for natural gas traded on the New York Mercantile Exchange (the “NYMEX”) that is the near month contract to expire, except when the near month contract is within two weeks of expiration, in which case it will be measured by the futures contract that is the next month contract to expire (the “Benchmark Futures Contract”), less UNG’s expenses. “Near month contract” means the next contract traded on the NYMEX due to expire. “Next month contract” means the first contract traded on the NYMEX due to expire after the near month contract. It is not the intent of UNG to be operated in a fashion such that the per share NAV will equal, in dollar terms, the spot price of natural gas or any particular futures contract based on natural gas. It is not the intent of UNG to be operated in a fashion such that its per share NAV will reflect the percentage change of the price of any particular futures contract as measured over a time period greater than one day. The general partner of UNG, United States Commodity Funds LLC (“USCF”), believes that it is not practical to manage the portfolio to achieve such an investment goal when investing in Natural Gas Futures Contracts (as defined below) and Other Natural Gas-Related Investments (as defined below).
UNG invests in futures contracts for natural gas, crude oil, heating oil, gasoline and other petroleum-based fuels that are traded on the NYMEX, ICE Futures or other U.S. and foreign exchanges (collectively, “Natural Gas Futures Contracts”) and other natural gas-related investments such as cash-settled options on Natural Gas Futures Contracts, forward contracts for natural gas, cleared swap contracts and over-the-counter transactions that are based on the price of natural gas, crude oil and other petroleum-based fuels, Natural Gas Futures Contracts and indices based on the foregoing (collectively, “Other Natural Gas-Related Investments”). For convenience and unless otherwise specified, Natural Gas Futures Contracts and Other Natural Gas-Related Investments collectively are referred to as “Natural Gas Interests” in this quarterly report on Form 10-Q. Due, in part, to UNG’s obligation to comply current and potential regulatory limits, it has invested in, and may continue to invest in, Other Natural Gas-Related Investments in order to fulfill its investment objective.
| 17 |
UNG seeks to achieve its investment objective by investing in a combination of Natural Gas Futures Contracts and Other Natural Gas-Related Investments such that daily changes in its per share NAV, measured in percentage terms, will closely track the daily changes in the price of the Benchmark Futures Contract, also measured in percentage terms. USCF believes the daily changes in the price of the Benchmark Futures Contract have historically exhibited a close correlation with the daily changes in the spot price of natural gas. It is not the intent of UNG to be operated in a fashion such that the per share NAV will equal, in dollar terms, the spot price of natural gas or any particular futures contract based on natural gas. It is not the intent of UNG to be operated in a fashion such that its per share NAV will reflect the percentage change of the price of any particular futures contract as measured over a time period greater than one day. USCF believes that it is not practical to manage the portfolio to achieve such an investment goal when investing in Natural Gas Futures Contracts and Other Natural Gas-Related Investments.
In addition, due to potential regulatory limitations, UNG may determine to hold greater amounts of cash and cash equivalents and lesser amounts of Natural Gas Interests, or greater amounts of Other Natural Gas-Related Investments if it determines that this will most appropriately satisfy UNG’s investment objective. Holding more cash and cash equivalents and fewer Natural Gas Interests, or more Other Natural Gas-Related Investments for some period of time may result in increased tracking error. Increasing UNG’s investments in Other Natural Gas-Related Investments, such as through increased investments in over-the-counter swaps, may result in increased tracking error due to the fact that transaction costs for over-the-counter swaps are significantly higher as compared to those for exchange-traded Natural Gas Interests, which to date are the principal investment of UNG. In the event that UNG determines that suitable Other Natural Gas-Related Investments are not obtainable, UNG will need to consider other actions to protect its shareholders and to permit UNG to achieve its investment objective.
Regulatory Disclosure
Impact of Accountability Levels, Position Limits and Price Fluctuation Limits. Futures contracts include typical and significant characteristics. Most significantly, the Commodity Futures Trading Commission (the “CFTC”) and the futures exchanges have established accountability levels and position limits on the maximum net long or net short futures contracts in commodity interests that any person or group of persons under common trading control (other than as a hedge, which an investment by UNG is not) may hold, own or control. The net position is the difference between an individual’s or firm’s open long contracts and open short contracts in any one commodity. In addition, most U.S.-based futures exchanges, such as the NYMEX, limit the daily price fluctuation for futures contracts. Currently, the ICE Futures imposes position and accountability limits that are similar to those imposed by U.S.-based futures exchanges and also limits the maximum daily price fluctuation, while some other non-U.S. futures exchanges have not adopted such limits.
The accountability levels for the Benchmark Futures Contract and other Natural Gas Futures Contracts traded on U.S.-based futures exchanges, such as the NYMEX, are not a fixed ceiling, but rather a threshold above which the NYMEX may exercise greater scrutiny and control over an investor’s positions. The current accountability level for investments for any one-month in the Benchmark Futures Contract is 6,000 net contracts. In addition, the NYMEX imposes an accountability level for all months of 12,000 net futures contracts for natural gas. In addition, ICE Futures maintains accountability levels, position limits and monitoring authority for its Henry Hub natural gas contracts. If UNG and the Related Public Funds (as defined below) exceed these accountability levels for investments in the futures contract for natural gas, the NYMEX and ICE Futures will monitor such exposure and may ask for further information on their activities, including the total size of all positions, investment and trading strategy, and the extent of liquidity resources of UNG and the Related Public Funds. If deemed necessary by the NYMEX and/or ICE Futures, UNG could be ordered to reduce its aggregate net position back to the accountability level. As of June 30, 2014, UNG held 6,887 NYMEX Natural Gas Futures NG contracts and 35,873 Natural Gas Futures LD1 H Contracts traded on the ICE Futures US. UNG exceeded accountability levels of the NYMEX during the six months ended June 30, 2014, when it held a maximum of 10,468 Natural Gas Futures NG contracts. No action was taken by the NYMEX and UNG did not reduce the number of Natural Gas Futures Contracts held as a result. UNG exceeded accountability levels of ICE Futures during the six months ended June 30, 2014, when it held a maximum of 39,945 Natural Gas Futures LD1 H Contracts, exceeding the “any” month limit. No action was taken by ICE Futures and UNG did not reduce the number of Natural Gas Futures Contracts held as a result.
| 18 |
Position limits differ from accountability levels in that they represent fixed limits on the maximum number of futures contracts that any person may hold and cannot allow such limits to be exceeded without express CFTC authority to do so. In addition to accountability levels and position limits that may apply at any time, the NYMEX and the ICE Futures impose position limits on contracts held in the last few days of trading in the near month contract to expire. It is unlikely that UNG will run up against such position limits because UNG’s investment strategy is to close out its positions and “roll” from the near month contract to expire to the next month contract during a four-day period beginning two weeks from expiration of the contract. For the six months ended June 30, 2014, UNG did not exceed any position limits imposed by the NYMEX and ICE Futures.
The regulation of commodity interest trading in the United States and other countries is an evolving area of the law. The various statements made in this summary are subject to modification by legislative action and changes in the rules and regulations of the SEC, Financial Industry Regulatory Authority (“FINRA”), CFTC, the National Futures Association (the “NFA”), the futures exchanges, clearing organizations and other regulatory bodies.
Futures Contracts and Position Limits
The CFTC is prohibited by statute from regulating trading on non-U.S. futures exchanges and markets. The CFTC, however, has adopted regulations relating to the marketing of non-U.S. futures contracts in the United States. These regulations permit certain contracts on non-U.S. exchanges to be offered and sold in the United States.
On November 5, 2013, the CFTC proposed a rulemaking that would establish specific limits on speculative positions in 28 physical commodity futures and option contracts as well as swaps that are economically equivalent to such contracts in the agriculture, energy and metals markets (the “Position Limit Rules”). On the same date, the CFTC proposed another rule addressing the circumstances under which market participants would be required to aggregate their positions with other persons under common ownership or control (the “Proposed Aggregation Requirements”). Specifically, the Position Limit Rules would, among other things: identify which contracts are subject to speculative position limits; set thresholds that restrict the number of speculative positions that a person may hold in a spot month, individual month, and all months combined; create an exemption for positions that constitute bona fide hedging transactions; impose responsibilities on designated contract markets (“DCMs”) and swap execution facilities (“SEFs”) to establish position limits or, in some cases, position accountability rules; and apply to both futures and swaps across four relevant venues: over-the-counter (“OTC”), DCMs, SEFs as well as non-U.S. located platforms. Until such time as the Position Limit Rules are adopted, the regulatory architecture in effect prior to the adoption of the Position Limit Rules will govern transactions in commodities and related derivatives (collectively, “Referenced Contracts”). Under that system, the CFTC enforces federal limits on speculation in agricultural products (e.g., corn, wheat and soy), while futures exchanges enforce position limits and accountability levels for agricultural and certain energy products (e.g., oil and natural gas). As a result, UNG may be limited with respect to the size of its investments in any commodities subject to these limits. Finally, subject to certain narrow exceptions, the Position Limit Rules require the aggregation, for purposes of the position limits, of all positions in the 28 Referenced Contracts held by a single entity and its affiliates, regardless of whether such position existed on U.S. futures exchanges, non-U.S. futures exchanges, in cleared swaps or in over-the-counter swaps. Under the CFTC’s existing position limits requirements and the Position Limit Rules, a market participant is generally required to aggregate all positions for which that participant controls the trading decisions with all positions for which that participant has a 10 percent or greater ownership interest in an account or position, as well as the positions of two or more persons acting pursuant to an express or implied agreement or understanding. At this time, it is unclear how the Proposed Aggregation Requirements may affect UNG, but it may be substantial and adverse. By way of example, the Proposed Aggregation Requirements in combination with the Position Limit Rules may negatively impact the ability of UNG to meet its investment objectives through limits that may inhibit USCF’s ability to sell additional Creation Baskets of UNG. See “Commodity Interest Markets – Regulation” in this quarterly report on Form 10-Q for additional information.
Based on its current understanding of the final position limit regulations, USCF does not anticipate significant negative impact on the ability of UNG to achieve its investment objective.
| 19 |
“Swap” Transactions
The Dodd-Frank Wall Street Reform and Consumer Protection Act (the “Dodd-Frank Act”) imposes regulatory requirements on certain “swap” transactions that UNG is authorized to engage in that may ultimately impact the ability of UNG to meet its investment objective. The term “swap” is broadly defined to include various types of over-the-counter derivatives, including swaps and options.
Current rules and regulations require that certain transactions ultimately falling within the definition of “swap” be executed on organized exchanges or SEFs and cleared through regulated clearing organizations or “derivative clearing organizations” (“DCOs”), if the CFTC mandates the central clearing of a particular contract. Currently, “swap dealers,” “major swap participants,” certain active funds, commodity pools, certain credit default swaps and interest rate swaps, private funds and entities predominantly engaged in financial activities are required to centrally clear. If a swap is required to be cleared, the initial margin will be set by the clearing organizations, subject to certain regulatory requirements and guidelines. Initial and variation margin requirements for swap dealers and major swap participants who enter into uncleared swaps and capital requirements for swap dealers and major swap participants who enter into both cleared and uncleared trades will be set by the CFTC, the SEC or the applicable “Prudential Regulator.”
Current rules and regulations also require that certain swaps determined to be available to trade on a SEF must be executed over such a facility, including the obligation for facilities offering multiple person execution services. Based upon applications filed by several SEFs with the CFTC, the CFTC has determined that certain interest rate swaps and credit default index swaps must be executed on a SEF. On November 14, 2013, the CFTC’s Division of Clearing and Risk, Division of Market Oversight and Division of Swap Dealer and Intermediary Oversight published guidance with respect to the application of certain CFTC rules on SEFs. That guidance clarified that SEFs could not restrict access to participants who are permitted to trade swaps and that SEFs may not require participants to have breakage agreements in place with other counterparties.
Swaps between certain affiliated entities within a corporate group are exempt from the clearing requirement. The rule permits affiliated counterparties to elect not to clear a swap subject to the clearing requirement if, among other things, the counterparties are majority-owned affiliates whose financial statements are included in the same consolidated financial statements and whose swaps are documented and subject to a centralized risk management program. However, the exemption does not apply to swaps entered into by affiliated counterparties with unaffiliated counterparties.
Current rules and regulations require enhanced customer protections, risk management programs, internal monitoring and controls, capital and liquidity standards, customer disclosures and auditing and examination programs for futures commission merchants (“FCMs”). The rules are intended to afford greater assurances to market participants that customer segregated funds and secured amounts are protected, customers are provided with appropriate notice of the risks of futures trading and of the FCMs with which they may choose to do business, FCMs are monitoring and managing risks in a robust manner, the capital and liquidity of FCMs are strengthened to safeguard the continued operations and the auditing and examination programs of the CFTC and the self-regulatory organizations are monitoring the activities of FCMs in a thorough manner.
On November 6, 2013, the CFTC published a final rule that imposes requirements on swap dealers and major swap participants with respect to the treatment of collateral posted by their counterparties to margin, guarantee, or secure uncleared swaps. In other words, the rule places restrictions on what swap dealers and major swap participants can do with collateral posted by UNG in connection with uncleared swaps.
In addition to the rules and regulations imposed under the Dodd-Frank Act, swap dealers that are European banks may also be subject to European Market Infrastructure Regulation (“EMIR”). These regulations have not yet been fully implemented.
As regulatory requirements are constantly evolving, it is difficult to predict the effect any regulatory changes may have on UNG.
| 20 |
Price Movements
Natural gas futures prices were volatile during the six months ended June 30, 2014. The price of the Benchmark Futures Contract started the period at $4.230 per million British thermal shares (“MMBtu”). The low of the period was on January 9, 2014, when the price dropped to $4.005 per MMBtu. The high of the period was January 29, 2014, when the price reached $5.465 per MMBtu. The period ended with the Benchmark Futures Contract at $4.461 per MMBtu, an increase of approximately 5.46% over the period. UNG’s per share NAV began the period at $20.59 and ended the period at $24.58 on June 30, 2014, an increase of approximately 19.38% over the period. UNG’s per share NAV reached its high for the period on February 21, 2014 at $27.75 and reached its low for the period January 9, 2014 at $19.49. The Benchmark Futures Contract prices listed above began with the February 2014 contracts and ended with the August 2014 contracts. The increase of approximately 5.46% on the Benchmark Futures Contract listed above is a hypothetical return only and could not actually be achieved by an investor holding Natural Gas Futures Contracts. An investment in Natural Gas Futures Contracts would need to be rolled forward during the time period described in order to simulate such a result. Furthermore, the change in the nominal price of these differing Natural Gas Futures Contracts, measured from the start of the period to the end of the period, does not represent the actual benchmark results that UNG seeks to track, which are more fully described below in the section titled “Tracking UNG’s Benchmark.”
During the six months ended June 30, 2014, the natural gas futures market was primarily in a state of backwardation, meaning that the price of the near month natural gas Futures Contract was higher than the price of the next month natural gas Futures Contract, or contracts further away from expiration. A contango market is one in which the price of the near month natural gas Futures Contract is less than the price of the next month natural gas Futures Contract, or contracts further away from expiration. For a discussion of the impact of backwardation and contango on total returns, see “Term Structure of Natural Gas Futures Prices and the Impact on Total Returns” below.
Valuation of Futures Contracts and the Computation of the Per Share NAV
The per share NAV of UNG’s shares is calculated once each NYSE Arca trading day. The per share NAV for a particular trading day is released after 4:00 p.m. New York time. Trading during the core trading session on the NYSE Arca typically closes at 4:00 p.m. New York time. UNG’s administrator uses the NYMEX closing price (determined at the earlier of the close of the NYMEX or 2:30 p.m. New York time) for the contracts held on the NYMEX, but calculates or determines the value of all other UNG investments, including cleared swaps or other futures contracts, as of the earlier of the close of the NYSE Arca or 4:00 p.m. New York time.
Results of Operations and the Natural Gas Market
Results of Operations. On April 18, 2007, UNG listed its shares on the American Stock Exchange (the “AMEX”) under the ticker symbol “UNG.” On that day, UNG established its initial offering price at $50.00 per share and issued 200,000 shares to the initial authorized purchaser in exchange for $10,000,000 in cash. As a result of the acquisition of the AMEX by NYSE Euronext, UNG’s shares no longer trade on the AMEX and commenced trading on the NYSE Arca on November 25, 2008.
Since its initial offering of 30,000,000 shares, UNG has registered five subsequent offerings of its shares: 50,000,000 shares which were registered with the SEC on November 21, 2007, 100,000,000 shares which were registered with the SEC on August 28, 2008, 300,000,000 shares which were registered with the SEC on May 6, 2009, 1,000,000,000 shares were registered with the SEC on August 12, 2009 and 200,000,000 shares were registered on March 12, 2014. Shares offered by UNG in the subsequent offerings were sold by it for cash at the shares’ per share NAV as described in the applicable prospectus. On March 8, 2011, after the close of trading on the NYSE Arca, UNG effected a 2-for-1 reverse share split and post-split shares of UNG began trading on March 9, 2011. As a result of the reverse share split, every two pre-split shares of UNG were automatically exchanged for one post-split share. Immediately prior to the reverse share split, there were 447,200,000 shares of UNG issued and outstanding, representing a per share NAV of $5.16. Immediately after the reverse share split, the number of issued and outstanding shares of UNG decreased to 223,600,000, not accounting for fractional shares, and the per share NAV increased to $10.31. On February 21, 2012, after the close of trading on the NYSE Arca, UNG effected a 4-for-1 reverse share split and post-split shares of UNG began trading on February 22, 2012. As a result of the reverse share split, every four pre-split shares of UNG were automatically exchanged for one post-split share. Immediately prior to the reverse share split, there were 174,297,828 shares of UNG issued and outstanding, representing a per share NAV of $5.51. Immediately after the reverse share split, the number of issued and outstanding shares of UNG decreased to 43,574,457, not accounting for fractional shares, and the per share NAV increased to $22.04. As of June 30, 2014, UNG had issued 1,410,300,000 shares, 28,766,476 of which were outstanding. As of June 30, 2014, there were 269,700,000 shares registered but not yet issued.
| 21 |
More shares may have been issued by UNG than are outstanding due to the redemption of shares. Unlike funds that are registered under the Investment Company Act of 1940, as amended, shares that have been redeemed by UNG cannot be resold by UNG. As a result, UNG contemplates that additional offerings of its shares will be registered with the SEC in the future in anticipation of additional issuances and redemptions.
As of June 30, 2014, UNG had the following authorized purchasers: ABN AMRO, Banc of America Securities LLC, Citadel Securities LLC, Citigroup Global Markets Inc., Credit Suisse Securities USA LLC, Deutsche Bank Securities Inc., FIMAT USA LLC, Goldman Sachs & Company, Goldman Sachs Execution & Clearing LP, JP Morgan Securities Inc., Merrill Lynch Professional Clearing Corp., Morgan Stanley & Company Inc., Nomura Securities International Inc., RBC Capital Markets Corporation, SG Americas Securities LLC, Virtu Financial Capital Markets and Virtu Financial DB LLC.
For the Six Months Ended June 30, 2014 Compared to the Six Months Ended June 30, 2013
Portfolio Expenses. UNG’s expenses consist of investment management fees, brokerage fees and commissions, certain offering costs, licensing fees, the fees and expenses of the independent directors of USCF and expenses relating to tax accounting and reporting requirements. The management fee that UNG pays to USCF is calculated as a percentage of the total net assets of UNG. The fee is accrued daily and paid monthly.
| For the six months ended June 30, 2014 | For the six months ended June 30, 2013 | |||||||
| Per share net asset value, end of period | $ | 24.58 | $ | 18.89 | ||||
| Average daily total net assets | $ | 750,321,560 | $ | 988,716,411 | ||||
| Cash deposits and investments in Treasuries and money market funds | $ | 712,251,789 | $ | 903,635,465 | ||||
| Dividend and interest income earned on Treasuries, cash and/or cash equivalents | $ | 149,279 | $ | 172,004 | ||||
| Percentage of cash assets held as overnight deposits and investments in Treasuries at custodian | 93.72 | % | 85.61 | % | ||||
| Percentage of cash assets held as investments in Treasuries and margin deposits for Natural Gas Futures Contracts | 6.28 | % | 14.39 | % | ||||
| Annualized yield based on average daily total net assets | 0.04 | % | 0.04 | % | ||||
| Total unrealized gain (loss) on Natural Gas Futures Contracts | $ | (36,278,057 | ) | $ | 55,265,749 | |||
| Management fee | $ | 2,232,443 | $ | 2,924,929 | ||||
| Total fees and other expenses excluding management fees | $ | 2,099,056 | $ | 2,265,786 | ||||
| Fees and expenses related to the registration or offering of additional shares | $ | 88,206 | $ | — | ||||
| Total commissions accrued to brokers | $ | 1,023,002 | $ | 1,198,958 | ||||
| Total commissions as annualized percentage of average total net assets | 0.27 | % | 0.24 | % | ||||
| Commissions accrued as a result of rebalancing | $ | 788,060 | $ | 1,009,042 | ||||
| Percentage of commissions accrued as a result of rebalancing | 77.03 | % | 84.16 | % | ||||
| Commissions accrued as a result of creation and redemption activity | $ | 234,942 | $ | 189,916 | ||||
| Percentage of commissions accrued as a result of creation and redemption activity | 22.97 | % | 15.84 | % | ||||
| 22 |
The increase in the per share NAV for June 30, 2014, compared to June 30, 2013, was primarily due to the increase in value of the Futures Contracts, cleared swap contracts and over-the-counter swap contracts in which UNG invested. The decrease in cash assets in overnight deposits and investments in Treasuries and money market funds for June 30, 2014, compared to June 30, 2013, was the result of UNG’s smaller size as measured by total net assets.
Average interest rates earned on short-term investments held by UNG, including cash equivalents and Treasuries, were similar during the six months ended June 30, 2014, compared to the six months ended June 30, 2013. As a result, the amount of income earned by UNG as a percentage of average total net assets was similar during the six months ended June 30, 2014.
The decrease in total fees and expenses excluding management fees for the six months ended June 30, 2014, compared to the six months ended June 30, 2013, was due to UNG’s smaller size. The decrease in the total commissions accrued to brokers by UNG for the six months ended June 30, 2014, compared to the six months ended June 30, 2013, was a result of decreased brokerage fees due to a lower number of Natural Gas Interests being held and traded.
For the Three Months Ended June 30, 2014 Compared to the Three Months Ended June 30, 2013
| For the three months ended June 30, 2014 | For the three months ended June 30, 2013 | |||||||
| Average daily total net assets | $ | 700,234,881 | $ | 911,676,369 | ||||
| Dividend and interest income earned on Treasuries, cash and/or cash equivalents | $ | 69,266 | $ | 78,208 | ||||
| Annualized yield based on average daily total net assets | 0.03 | % | 0.04 | % | ||||
| Management fee | $ | 1,047,475 | $ | 1,363,767 | ||||
| Total fees and other expenses excluding management fees | $ | 1,021,932 | $ | 1,109,838 | ||||
| Fees and expenses related to the registration or offering of additional shares | $ | 74,017 | $ | — | ||||
| Total commissions accrued to brokers | $ | 452,156 | $ | 529,248 | ||||
| Total commissions as annualized percentage of average total net assets | 0.26 | % | 0.23 | % | ||||
| Commissions accrued as a result of rebalancing | $ | 384,385 | $ | 441,186 | ||||
| Percentage of commissions accrued as a result of rebalancing | 85.01 | % | 83.36 | % | ||||
| Commissions accrued as a result of creation and redemption activity | $ | 67,771 | $ | 88,062 | ||||
| Percentage of commissions accrued as a result of creation and redemption activity | 14.99 | % | 16.64 | % | ||||
Average interest rates earned on short-term investments held by UNG, including cash equivalents and Treasuries, were similar during the three months ended June 30, 2014, compared to the three months ended June 30, 2013. As a result, the amount of income earned by UNG as a percentage of average total net assets was similar during the three months ended June 30, 2014.
The decrease in total fees and expenses excluding management fees for the three months ended June 30, 2014, compared to the three months ended June 30, 2013, was due to UNG’s smaller size. The decrease in the total commissions accrued to brokers for the three months ended June 30, 2014, compared to the three months ended June 30, 2013, was a result of decreased brokerage fees due to a lower number of futures contracts being held and traded.
| 23 |
Tracking UNG’s Benchmark
USCF seeks to manage UNG’s portfolio such that changes in its average daily per share NAV, on a percentage basis, closely track the daily changes in the average price of the Benchmark Futures Contract, also on a percentage basis. Specifically, USCF seeks to manage the portfolio such that over any rolling period of 30-valuation days, the average daily change in UNG’s per share NAV is within a range of 90% to 110% (0.9 to 1.1) of the average daily change in the price of the Benchmark Futures Contract. As an example, if the average daily movement of the price of the Benchmark Futures Contract for a particular 30-valuation day time period was 0.50% per day, USCF would attempt to manage the portfolio such that the average daily movement of the per share NAV during that same time period fell between 0.45% and 0.55% (i.e., between 0.9 and 1.1 of the benchmark’s results). UNG’s portfolio management goals do not include trying to make the nominal price of UNG’s per share NAV equal to the nominal price of the current Benchmark Futures Contract or the spot price for natural gas. USCF believes that it is not practical to manage the portfolio to achieve such an investment goal when investing in listed Natural Gas Futures Contracts and Other Natural Gas-Related Investments.
For the 30-valuation days ended June 30, 2014, the simple average daily change in the Benchmark Futures Contract was 0.041%, while the simple average daily change in the per share NAV of UNG over the same time period was 0.033%. The average daily difference was (0.007)% (or (0.7) basis points, where 1 basis point equals 1/100 of 1%). As a percentage of the daily movement of the Benchmark Futures Contract, the average error in daily tracking by the per share NAV was (0.652)%, meaning that over this time period UNG’s tracking error was within the plus or minus 10% range established as its benchmark tracking goal.
Since the commencement of the offering of UNG’s shares to the public on April 18, 2007 to June 30, 2014, the simple average daily change in the Benchmark Futures Contract was (0.111)%, while the simple average daily change in the per share NAV of UNG over the same time period was (0.113)%. The average daily difference was 0.002% (or 0.2 basis points, where 1 basis point equals 1/100 of 1%). As a percentage of the daily movement of the Benchmark Futures Contract, the average error in daily tracking by the per share NAV was (0.403)% meaning that over this time period UNG’s tracking error was within the plus or minus 10% range established as its benchmark tracking goal. The following two graphs demonstrate the correlation between the changes in UNG’s NAV and the changes in the Benchmark Futures Contract. The first graph exhibits the daily changes for the last 30 valuation days ended June 30, 2014. The second graph measures monthly changes since June 30, 2009 through June 30, 2014.
| 24 |
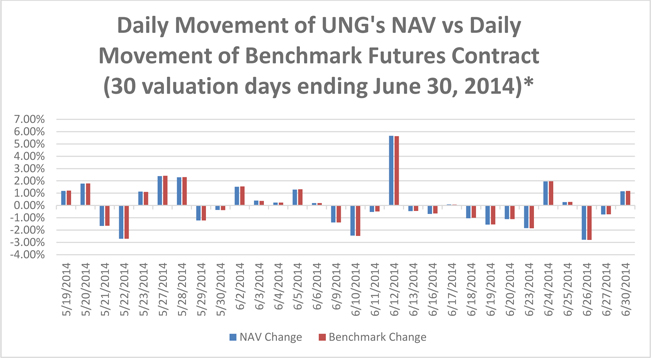
*PAST PERFORMANCE IS NOT NECESSARILY INDICATIVE OF FUTURE RESULTS
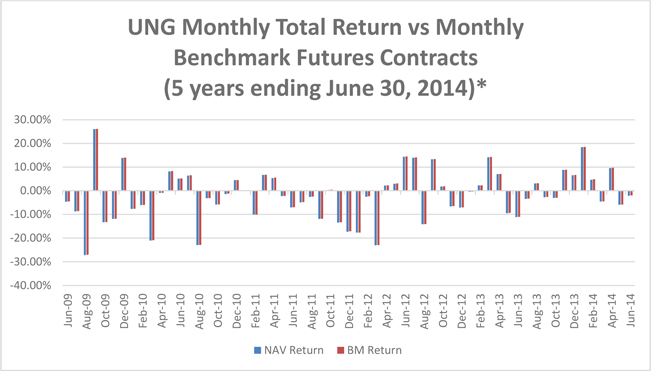
*PAST PERFORMANCE IS NOT NECESSARILY INDICATIVE OF FUTURE RESULTS
An alternative tracking measurement of the return performance of UNG versus the return of its Benchmark Futures Contract can be calculated by comparing the actual return of UNG, measured by changes in its NAV, versus the expected changes in its per share NAV under the assumption that UNG’s returns had been exactly the same as the daily changes in its Benchmark Futures Contract.
| 25 |
For the six months ended June 30, 2014, the actual total return of UNG as measured by changes in its per share NAV was 19.38%.This is based on an initial per share NAV of $20.59 as of December 31, 2013 and an ending per share NAV as of June 30, 2014 of $24.58. During this time period, UNG made no distributions to its shareholders. However, if UNG’s daily changes in its per share NAV had instead exactly tracked the changes in the daily total return of the Benchmark Futures Contract, UNG would have had an estimated per share NAV of $24.77 as of June 30, 2014, for a total return over the relevant time period of 20.30%. The difference between the actual per share NAV total return of UNG of 19.38% and the expected total return based on the Benchmark Futures Contract of 20.30% was an error over the time period of (0.92)%, which is to say that UNG’s actual total return underperformed the benchmark result by that percentage. UNG incurs expenses primarily composed of the management fee, brokerage commissions for the buying and selling of futures contracts, and other expenses. The impact of these expenses tends to cause daily changes in the per share NAV of UNG to track slightly lower than daily changes in the price of the Benchmark Futures Contract.
By comparison, for the six months ended June 30, 2013, the actual total return of UNG as measured by changes in its per share NAV was 0.11%. This was based on an initial per share NAV of $18.87 as of December 31, 2012 and an ending per share NAV as of June 30, 2013 of $18.89. During this time period, UNG made no distributions to its shareholders. However, if UNG’s daily changes in its per share NAV had instead exactly tracked the changes in the daily total return of the Benchmark Futures Contract, UNG would have had an estimated per share NAV of $18.99 as of June 30, 2013, for a total return over the relevant time period of 0.64%. The difference between the actual per share NAV total return of UNG of 0.11% and the expected total return based on the Benchmark Futures Contract of 0.64% was an error over the time period of (0.53)%, which is to say that UNG’s actual total return underperformed the benchmark result by that percentage. UNG incurred expenses primarily composed of the management fee, brokerage commissions for the buying and selling of futures contracts, and other expenses. The impact of these expenses tends to cause daily changes in the per share NAV of UNG to track slightly lower than daily changes in the price of the Benchmark Futures Contract.
There are currently three factors that have impacted or are most likely to impact UNG’s ability to accurately track its Benchmark Futures Contract.
First, UNG may buy or sell its holdings in the then current Benchmark Futures Contract at a price other than the closing settlement price of that contract on the day during which UNG executes the trade. In that case, UNG may pay a price that is higher, or lower, than that of the Benchmark Futures Contract, which could cause the changes in the daily per share NAV of UNG to either be too high or too low relative to the daily changes in the Benchmark Futures Contract. During the six months ended June 30, 2014, USCF attempted to minimize the effect of these transactions by seeking to execute its purchase or sale of the Benchmark Futures Contract at, or as close as possible to, the end of the day settlement price. However, it may not always be possible for UNG to obtain the closing settlement price and there is no assurance that failure to obtain the closing settlement price in the future will not adversely impact UNG’s attempt to track the Benchmark Futures Contract over time.
Second, UNG incurs expenses primarily composed of the management fee, brokerage commissions for the buying and selling of futures contracts, and other expenses. The impact of these expenses tends to cause daily changes in the per share NAV of UNG to track slightly lower than daily changes in the price of the Benchmark Futures Contract. At the same time, UNG earns dividend and interest income on its cash, cash equivalents and Treasuries. UNG is not required to distribute any portion of its income to its shareholders and did not make any distributions to shareholders during the six months ended June 30, 2014. Interest payments, and any other income, were retained within the portfolio and added to UNG’s NAV. When this income exceeds the level of UNG’s expenses for its management fee, brokerage commissions and other expenses (including ongoing registration fees, licensing fees and the fees and expenses of the independent directors of USCF), UNG will realize a net yield that will tend to cause daily changes in the per share NAV of UNG to track slightly higher than daily changes in the Benchmark Futures Contract. If short-term interest rates rise above the current levels, the level of deviation created by the yield would decrease. Conversely, if short-term interest rates were to decline, the amount of error created by the yield would increase. When short-term yields drop to a level lower than the combined expenses of the management fee and the brokerage commissions, then the tracking error becomes a negative number and would tend to cause the daily returns of the per share NAV to underperform the daily returns of the Benchmark Futures Contract. USCF anticipates that interest rates will continue to remain at historical lows and, therefore, it is anticipated that fees and expenses paid by UNG will continue to be higher than interest earned by UNG. As such, USCF anticipates that UNG will continue to underperform its benchmark until such a time when interest earned at least equals or exceeds the fees and expenses paid by UNG.
| 26 |
Third, UNG may hold Other Natural Gas-Related Investments in its portfolio that may fail to closely track the Benchmark Futures Contract’s total return movements. In that case, the error in tracking the Benchmark Futures Contract could result in daily changes in the per share NAV of UNG that are either too high, or too low, relative to the daily changes in the Benchmark Futures Contract. During the six months ended June 30, 2014, UNG held Other Natural Gas-Related Investments. UNG also held investments in natural gas futures contracts traded on the ICE Futures US whose settlement price also tracks the settlement price of the Benchmark Futures Contract and fully-collateralized over-the-counter swaps designed to track the settlement price of the Benchmark Futures Contract. UNG has invested in Other Natural Gas-Related Investments, such as over-the-counter swaps, which has increased transaction-related expenses and may result in increased tracking error. Over-the-counter swaps increase transaction-related expenses due to the fact that UNG must pay to the swap counterparty certain fees that UNG does not have to pay for transactions executed on an exchange. Finally, due to potential regulatory limitations, UNG may determine to hold greater amounts of cash and cash equivalents and lesser amounts of Natural Gas Interests, if it determines that will most appropriately satisfy UNG’s investment objective. Holding more cash and cash equivalents and less Natural Gas Interests for some period of time may result in increased tracking error. There are additional Other Natural Gas-Related Investments that UNG is permitted to invest in whose price movements may not track the settlement price of the Benchmark Futures Contract.
Term Structure of Natural Gas Futures Prices and the Impact on Total Returns. Several factors determine the total return from investing in a futures contract position. One factor that impacts the total return that will result from investing in near month futures contracts and “rolling” those contracts forward each month is the price relationship between the current near month contract and the next month contract. For example, if the price of the near month contract is higher than the next month contract (a situation referred to as “backwardation” in the futures market), then absent any other change there is a tendency for the price of a next month contract to rise in value as it becomes the near month contract and approaches expiration. Conversely, if the price of a near month contract is lower than the next month contract (a situation referred to as “contango” in the futures market), then absent any other change there is a tendency for the price of a next month contract to decline in value as it becomes the near month contract and approaches expiration.
As an example, assume that the price of natural gas for immediate delivery (the “spot” price), was $7 per MMBtu, and the value of a position in the near month futures contract was also $7. Over time, the price of 10,000 MMBtu of natural gas will fluctuate based on a number of market factors, including demand for natural gas relative to its supply. The value of the near month contract will likewise fluctuate in reaction to a number of market factors. If investors seek to maintain their position in a near month contract and not take delivery of the natural gas, every month they must sell their current near month contract as it approaches expiration and invest in the next month contract.
If the futures market is in backwardation, e.g., when the expected price of natural gas in the future would be less, the investor would be buying a next month contract for a lower price than the current near month contract. Using the $7 per MMBtu price above to represent the front month price, the price of the next month contract could be $6.86 per barrel, that is, 2% cheaper than the front month contract. Hypothetically, and assuming no other changes to either prevailing natural gas prices or the price relationship between the spot price, the near month contract and the next month contract (and ignoring the impact of commission costs and the income earned on cash and/or cash equivalents), the value of the $6.86 next month contract would rise as it approaches expiration and becomes the new near month contract with a price of $7. In this example, the value of an investment in the second month contract would tend to rise faster than the spot price of natural gas, or fall slower. As a result, it would be possible in this hypothetical example for the spot price of natural gas to have risen 10% after some period of time, while the value of the investment in the second month futures contract would have risen 12%, assuming backwardation is large enough or enough time has elapsed. Similarly, the spot price of natural gas could have fallen 10% while the value of an investment in the futures contract could have fallen only 8%. Over time, if backwardation remained constant, the difference would continue to increase.
| 27 |
If the futures market is in contango, the investor would be buying a next month contract for a higher price than the current near month contract. Using again the $7 per MMBtu price above to represent the front month price, the price of the next month contract could be $7.14 per barrel, that is, 2% more expensive than the front month contract. Hypothetically, and assuming no other changes to either prevailing natural gas prices or the price relationship between the spot price, the near month contract and the next month contract (and ignoring the impact of commission costs and the income earned on cash and/or cash equivalents), the value of the next month contract would fall as it approaches expiration and becomes the new near month contract with a price of $7. In this example, it would mean that the value of an investment in the second month would tend to rise slower than the spot price of natural gas, or fall faster. As a result, it would be possible in this hypothetical example for the spot price of natural gas to have risen 10% after some period of time, while the value of the investment in the second month futures contract will have risen only 8%, assuming contango is large enough or enough time has elapsed. Similarly, the spot price of natural gas could have fallen 10% while the value of an investment in the second month futures contract could have fallen 12%. Over time, if contango remained constant, the difference would continue to increase.
The chart below compares the price of the near month contract to the average price of the near 12 month contracts over the last 10 years for natural gas. When the price of the near month contract is higher than the average price of the near 12 month contracts, the market would be described as being in backwardation. When the price of the near month contract is lower than the average price of the near 12 month contracts, the market would be described as being in contango. Although the prices of the near month contract and the average price of the near 12 month contracts do tend to move up or down together, it can be seen that at times the near month prices are clearly higher than the average price of the near 12 month contracts (backwardation), and other times they are below the average price of the near 12 month contracts (contango). In addition, investors can observe that natural gas prices, both front month and the average of the near 12 months, often display a seasonal pattern in which the price of natural gas tends to rise in the early winter months and decline in the summer months. This mirrors the physical demand for natural gas, which typically peaks in the winter.
| 28 |
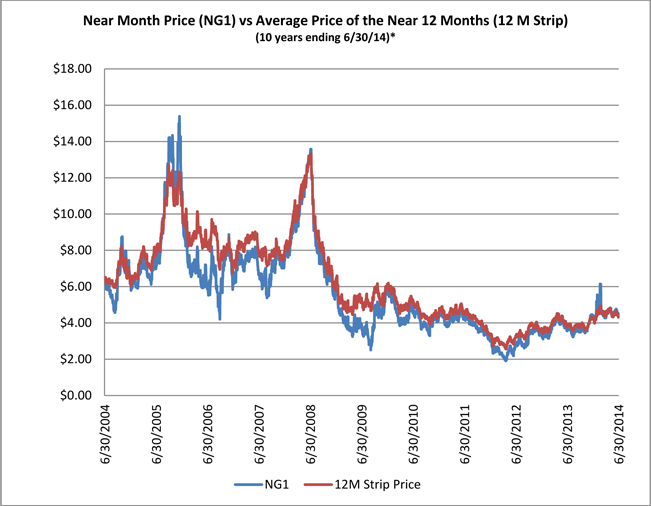
* PAST PERFORMANCE IS NOT NECESSARILY INDICATIVE OF FUTURE RESULTS
An alternative way to view backwardation and contango data over time is to subtract the dollar price of the near month natural gas Futures Contract from the dollar price of the near 12 month Natural Gas Futures Contracts. If the resulting number is a positive number, then the near month price is higher than the average price of the near 12 months and the market could be described as being in backwardation. If the resulting number is a negative number, then the near month price is lower than the average price of the near 12 months and the market could be described as being in contango. The chart below shows the results from subtracting the average dollar price of the near 12 month contracts from the near month price for the 10 year period between June 30, 2004 and June 30, 2014. Investors will note that the natural gas market spent time in both backwardation and contango. Investors will further note that the markets display a seasonal pattern that corresponds to the seasonal demand patterns for natural gas above. That is, in many, but not all, cases the average price of the near 12 month contracts is higher than the near month during the approach to the winter months as the price of natural gas for delivery in those winter months rises on expectations of demand. At the same time, the price of the near month, when that month is just before the onset of winter, does not rise as far or as fast as the average price of the near 12 month contracts whose delivery falls during the winter season.
| 29 |
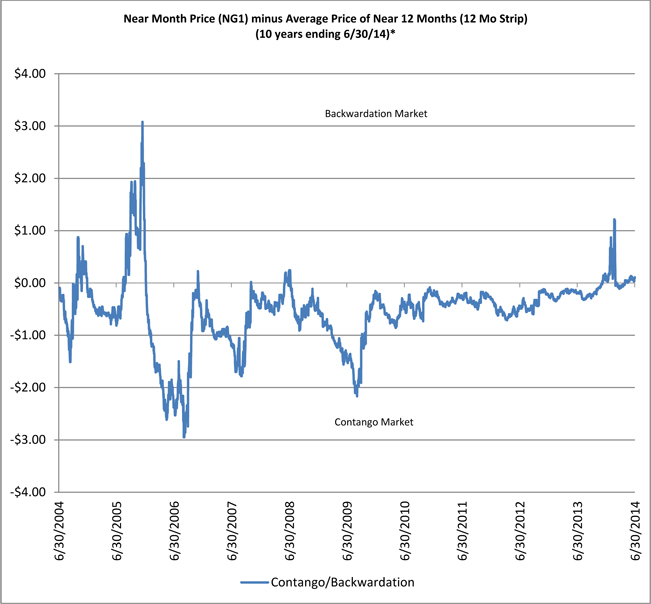
*PAST PERFORMANCE IS NOT NECESSARILY INDICATIVE OF FUTURE RESULTS
An investment in a portfolio that involved owning only the near month contract would likely produce a different result than an investment in a portfolio that owned an equal number of each of the near 12 months’ worth of contracts. Generally speaking, when the natural gas futures market is in backwardation, the near month only portfolio would tend to have a higher total return than the 12 month contract portfolio. Conversely, if the natural gas futures market was in contango, the portfolio containing 12 months’ worth of contracts would tend to outperform the near month only portfolio. The chart below shows the annual results of owning a portfolio consisting of the near month contract and a portfolio containing the near 12 months’ worth of contracts. In addition, the chart shows the annual change in the spot price of natural gas. In this example, each month, the near month only portfolio would sell the near month contract at expiration and buy the next month out contract. The portfolio holding an equal number of the near 12 months’ worth of contracts would sell the near month contract at expiration and replace it with the contract that becomes the new twelfth month contract.
| 30 |
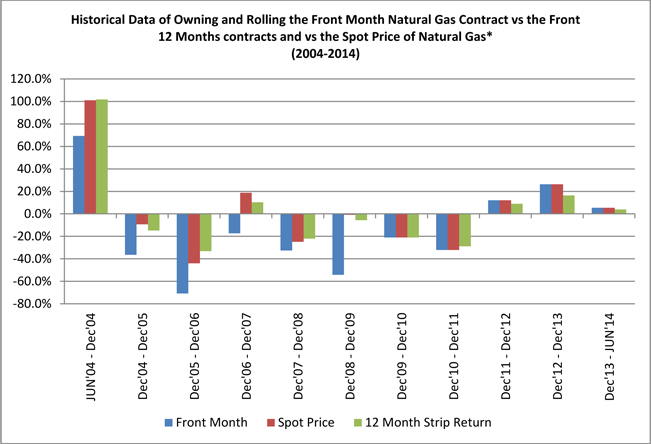
*PAST PERFORMANCE IS NOT NECESSARILY INDICATIVE OF FUTURE RESULTS
HYPOTHETICAL PERFORMANCE RESULTS HAVE MANY INHERENT LIMITATIONS, SOME OF WHICH ARE DESCRIBED BELOW. NO REPRESENTATION IS BEING MADE THAT UNG WILL OR IS LIKELY TO ACHIEVE PROFITS OR LOSSES SIMILAR TO THOSE SHOWN. IN FACT, THERE ARE FREQUENTLY SHARP DIFFERENCES BETWEEN HYPOTHETICAL PERFORMANCE RESULTS AND THE ACTUAL RESULTS ACHIEVED BY ANY PARTICULAR TRADING PROGRAM.
ONE OF THE LIMITATIONS OF HYPOTHETICAL PERFORMANCE RESULTS IS THAT THEY ARE GENERALLY PREPARED WITH THE BENEFIT OF HINDSIGHT. IN ADDITION, HYPOTHETICAL TRADING DOES NOT INVOLVE FINANCIAL RISK, AND NO HYPOTHETICAL TRADING RECORD CAN COMPLETELY ACCOUNT FOR THE IMPACT OF FINANCIAL RISK IN ACTUAL TRADING.
FOR EXAMPLE, THE ABILITY TO WITHSTAND LOSSES OR TO ADHERE TO A PARTICULAR TRADING PROGRAM IN SPITE OF TRADING LOSSES ARE MATERIAL POINTS WHICH CAN ALSO ADVERSELY AFFECT ACTUAL TRADING RESULTS. THERE ARE NUMEROUS OTHER FACTORS RELATED TO THE MARKETS IN GENERAL OR TO THE IMPLEMENTATION OF ANY SPECIFIC TRADING PROGRAM WHICH CANNOT BE FULLY ACCOUNTED FOR IN THE PREPARATION OF HYPOTHETICAL PERFORMANCE RESULTS AND ALL OF WHICH CAN ADVERSELY AFFECT ACTUAL TRADING RESULTS.
As seen in the chart above, there have been periods of both positive and negative annual total returns for both hypothetical portfolios over the last 10 years. In addition, there have been periods during which the near month only approach had higher returns, and periods where the 12 month approach had higher total returns. The above chart does not represent the performance history of UNG or any Related Public Fund.
| 31 |
Historically, the natural gas futures markets have experienced periods of contango and backwardation. Because natural gas demand is seasonal, it is possible for the price of Natural Gas Futures Contracts for delivery within one or two months to rapidly move from backwardation into contango and back again within a relatively short period of time of less than one year. While the investment objective of UNG is not to have the market price of its shares match, dollar for dollar, changes in the spot price of natural gas, backwardation impacted the total return on an investment in UNG shares during the six months ended June 30, 2014 relative to a hypothetical direct investment in natural gas. For example, an investment in UNG shares made on December 31, 2013 and held to June 30, 2014 increased, based upon the changes in the per share NAV for UNG shares on those days, by approximately 19.38%, while the spot price of natural gas for immediate delivery during the same period increased by approximately 5.46% (note: this comparison ignores the potential costs associated with physically owning and storing natural gas, which could be substantial). By comparison, during the period from December 31, 2012 to June 30, 2013, contango impacted the total return on an investment in UNG shares relative to a hypothetical direct investment in natural gas. For example, an investment in UNG shares made on December 31, 2012 and held to June 30, 2013 increased, based upon the changes in the per share NAV for UNG shares on those days, by approximately 0.11%, while the spot price of natural gas for immediate delivery during the same period increased by approximately 0.64% (note: this comparison ignores the potential costs associated with physically owning and storing natural gas, which could be substantial).
Periods of contango or backwardation do not materially impact UNG’s investment objective of having the daily percentage changes in its per share NAV track the daily percentage changes in the price of the Benchmark Futures Contract since the impact of backwardation and contango tend to equally impact the daily percentage changes in price of both UNG’s shares and the Benchmark Futures Contract. It is impossible to predict with any degree of certainty whether backwardation or contango will occur in the future. It is likely that both conditions will occur during different periods and, because of the seasonal nature of natural gas demand, both may occur within a single year’s time.
Natural Gas Market. During the six months ended June 30, 2014, natural gas prices in the United States were volatile and finished the period higher than the beginning of the year. Prices were impacted by several factors. Extreme cold weather in some parts of the country during the winter months increased demand for natural gas, leading to a decline in the amount of natural gas in storage to the lowest level in eleven years. Storage levels began to rise in April but remained significantly below prior year and five-year average levels. As of June 30, 2014, the amount of natural gas in storage had reached 1,929 billion cubic feet, which was approximately 29% below the five-year average and 26% below 2013 levels.
Natural Gas Price Movements in Comparison to Other Energy Commodities and Investment Categories. USCF believes that investors frequently measure the degree to which prices or total returns of one investment or asset class move up or down in value in concert with another investment or asset class. Statistically, such a measure is usually done by measuring the correlation of the price movements of the two different investments or asset classes over some period of time. The correlation is scaled between 1 and -1, where 1 indicates that the two investment options move up or down in price or value together, known as “positive correlation,” and -1 indicates that they move in completely opposite directions, known as “negative correlation.” A correlation of 0 would mean that the movements of the two are neither positively nor negatively correlated, known as “non-correlation.” That is, the investment options sometimes move up and down together and other times move in opposite directions.
For the ten-year time period between June 30, 2004 and June 30, 2014, the table below compares the monthly movements of natural gas prices versus the monthly movements of the prices of several other energy commodities, such as crude oil, diesel-heating oil, and unleaded gasoline, as well as several major non-commodity investment asset classes, such as large cap U.S. equities, U.S. government bonds and global equities. It can be seen that over this particular time period, the movement of natural gas on a monthly basis was neither strongly correlated nor inversely correlated with the movements of unleaded gasoline, diesel-heating oil, crude oil, large cap U.S. equities, U.S. government bonds or global equities.
| 32 |
| Correlation Matrix June 30, 2004-2014* | Large Cap U.S. Equities (S&P 500) | U.S. Gov't Bonds (EFFAS U.S .Gov’t Bond Index) | Global Equities (FTSE World Index) | Crude Oil | Diesel- Heating Oil | Unleaded Gasoline | Natural Gas | |||||||||||||||||||||
| Large Cap U.S. Equities (S&P 500) | 1.000 | (0.310 | ) | 0.961 | 0.416 | 0.359 | 0.289 | 0.079 | ||||||||||||||||||||
| U.S. Gov’t Bonds (EFFAS U.S. Gov’t Bond Index) | 1.000 | (0.292 | ) | (0.323 | ) | (0.242 | ) | (0.279 | ) | (0.023 | ) | |||||||||||||||||
| Global Equities (FTSE World Index) | 1.000 | 0.489 | 0.435 | 0.336 | 0.125 | |||||||||||||||||||||||
| Crude Oil | 1.000 | 0.858 | 0.732 | 0.309 | ||||||||||||||||||||||||
| Diesel-Heating Oil | 1.000 | 0.770 | 0.400 | |||||||||||||||||||||||||
| Unleaded Gasoline | 1.000 | 0.250 | ||||||||||||||||||||||||||
| Natural Gas | 1.000 | |||||||||||||||||||||||||||
Source: Bloomberg, NYMEX
* PAST PERFORMANCE IS NOT NECESSARILY INDICATIVE OF FUTURE RESULTS
The table below covers a more recent, but much shorter, range of dates than the above table. It can be seen that over this particular time period, the movement of natural gas on a monthly basis exhibited a negative correlation with U.S. equities and global equities, and a positive correlation with heating oil. Natural gas remained neither strongly correlated nor inversely correlated with unleaded gasoline, crude oil, or U.S. government bonds.
| Correlation Matrix 12 months ended June 30, 2014* | Large Cap U.S. Equities (S&P 500) | U.S. Gov't Bonds (EFFAS U.S .Govt Bond Index) | Global Equities (FTSE World Index) | Crude Oil | Diesel- Heating Oil | Unleaded Gasoline | Natural Gas | |||||||||||||||||||||
| Large Cap U.S. Equities (S&P 500) | 1.000 | (0.173 | ) | 0.950 | 0.124 | (0.361 | ) | 0.368 | (0.565 | ) | ||||||||||||||||||
| U.S. Gov’t Bonds (EFFAS U.S. Gov’t Bond Index) | 1.000 | (0.104 | ) | (0.388 | ) | (0.035 | ) | (0.544 | ) | 0.170 | ||||||||||||||||||
| Global Equities (FTSE World Index) | 1.000 | 0.104 | (0.472 | ) | 0.202 | (0.632 | ) | |||||||||||||||||||||
| Crude Oil | 1.000 | 0.227 | 0.641 | (0.325 | ) | |||||||||||||||||||||||
| Diesel-Heating Oil | 1.000 | 0.160 | 0.589 | |||||||||||||||||||||||||
| Unleaded Gasoline | 1.000 | (0.290 | ) | |||||||||||||||||||||||||
| Natural Gas | 1.000 | |||||||||||||||||||||||||||
Source: Bloomberg, NYMEX
* PAST PERFORMANCE IS NOT NECESSARILY INDICATIVE OF FUTURE RESULTS
Investors are cautioned that the historical price relationships between natural gas and various other energy commodities, as well as other investment asset classes, as measured by correlation may not be reliable predictors of future price movements and correlation results. The results pictured above would have been different if a different range of dates had been selected. USCF believes that natural gas has historically not demonstrated a strong correlation with equities or bonds over long periods of time. However, USCF also believes that in the future it is possible that natural gas could have long-term correlation results that indicate prices of natural gas more closely track the movements of equities or bonds. In addition, USCF believes that, when measured over time periods shorter than ten years, there will always be some periods where the correlation of natural gas to equities and bonds will be either more strongly positively correlated or more strongly negatively correlated than the long term historical results suggest.
| 33 |
The correlations between natural gas, crude oil, diesel-heating oil and gasoline are relevant because USCF endeavors to invest UNG’s assets in Natural Gas Futures Contracts and Other Natural Gas-Related Investments so that daily changes in percentage terms in UNG’s per share NAV correlate as closely as possible with daily changes in percentage terms in the price of the Benchmark Futures Contract. If certain other fuel-based commodity futures contracts do not closely correlate with the natural gas Futures Contract, then their use could lead to greater tracking error. As noted above, USCF also believes that the changes in percentage terms in the price of the Benchmark Futures Contract will closely correlate with changes in percentage terms in the spot price of natural gas.
Critical Accounting Policies
Preparation of the condensed financial statements and related disclosures in compliance with accounting principles generally accepted in the United States of America requires the application of appropriate accounting rules and guidance, as well as the use of estimates. UNG’s application of these policies involves judgments and actual results may differ from the estimates used.
USCF has evaluated the nature and types of estimates that it makes in preparing UNG’s condensed financial statements and related disclosures and has determined that the valuation of its investments, which are not traded on a United States or internationally recognized futures exchange (such as forward contracts and over-the-counter contracts) involves a critical accounting policy. The values which are used by UNG for its Natural Gas Futures Contracts are provided by its commodity broker who uses market prices when available, while over-the-counter contracts are valued based on the present value of estimated future cash flows that would be received from or paid to a third party in settlement of these derivative contracts prior to their delivery date and valued on a daily basis. In addition, UNG estimates interest and dividend income on a daily basis using prevailing rates earned on its cash and cash equivalents. These estimates are adjusted to the actual amount received on a monthly basis and the difference, if any, is not considered material.
Liquidity and Capital Resources
UNG has not made, and does not anticipate making, use of borrowings or other lines of credit to meet its obligations. UNG has met, and it is anticipated that UNG will continue to meet, its liquidity needs in the normal course of business from the proceeds of the sale of its investments, or from the investments in Treasuries, cash and/or cash equivalents that it intends to hold at all times. UNG’s liquidity needs include: redeeming shares, providing margin deposits for its existing Natural Gas Futures Contracts or the purchase of additional Natural Gas Futures Contracts and posting collateral for its over-the-counter contracts and payment of its expenses, summarized below under “Contractual Obligations.”
UNG currently generates cash primarily from: (i) the sale of baskets consisting of 100,000 shares (“Creation Baskets”) and (ii) income earned on investments in Treasuries, cash and/or cash equivalents. UNG has allocated substantially all of its net assets to trading in Natural Gas Interests. UNG invests in Natural Gas Interests to the fullest extent possible without being leveraged or unable to satisfy its current or potential margin or collateral obligations with respect to its investments in Natural Gas Futures Contracts and Other Natural Gas-Related Investments. A significant portion of UNG’s NAV is held in cash and cash equivalents that are used as margin and as collateral for its trading in Natural Gas Interests. The balance of the assets is held in UNG’s account at its custodian bank and in investments in Treasuries at the FCM. Income received from UNG’s investments in money market funds and Treasuries is paid to UNG. During the six months ended June 30, 2014, UNG’s expenses exceeded the income UNG earned and the cash earned from the sale of Creation Baskets and the redemption of Redemption Baskets. During the six months ended June 30, 2014, UNG used other assets to pay expenses, which could cause a decrease in UNG’s NAV over time. To the extent expenses exceed income, UNG’s NAV will be negatively impacted.
| 34 |
UNG’s investments in Natural Gas Interests may be subject to periods of illiquidity because of market conditions, regulatory considerations and other reasons. For example, most commodity exchanges limit the fluctuations in futures contracts prices during a single day by regulations referred to as “daily limits.” During a single day, no trades may be executed at prices beyond the daily limit. Once the price of a futures contract has increased or decreased by an amount equal to the daily limit, positions in the contracts can neither be taken nor liquidated unless the traders are willing to effect trades at or within the specified daily limit. In addition, UNG’s over-the-counter contracts have very limited liquidity since they are negotiated agreements that are not transferable by UNG except with the consent of its counterparty, and even if consent were granted, there may not be an available transferee. Such market conditions or contractual limits could prevent UNG from promptly liquidating its positions in Natural Gas Interests. During the six months ended June 30, 2014, UNG did not purchase or liquidate any of its positions while daily limits were in effect; however, UNG cannot predict whether such an event may occur in the future.
Since the initial offering of shares, UNG has been responsible for expenses relating to: (i) management fees, (ii) brokerage fees and commissions and fees associated with its over-the-counter transactions, (iii) licensing fees for the use of intellectual property, (iv) ongoing registration expenses in connection with offers and sales of its shares subsequent to the initial offering, (v) other expenses, including tax reporting costs, (vi) fees and expenses of the independent directors of USCF and (vii) other extraordinary expenses not in the ordinary course of business, while USCF has been responsible for expenses relating to the fees of UNG’s Marketing Agent, Administrator and Custodian and registration expenses relating to the initial offering of shares. If USCF and UNG are unsuccessful in raising sufficient funds to cover these respective expenses or in locating any other source of funding, UNG will terminate and investors may lose all or part of their investment.
Market Risk
Trading in Natural Gas Futures Contracts and Other Natural Gas-Related Investments, such as forwards, involves UNG entering into contractual commitments to purchase or sell natural gas at a specified date in the future. The aggregate market value of the contracts will significantly exceed UNG’s future cash requirements since UNG intends to close out its open positions prior to settlement. As a result, UNG is generally only subject to the risk of loss arising from the change in value of the contracts. UNG considers the “fair value” of its derivative instruments to be the unrealized gain or loss on the contracts. The market risk associated with UNG’s commitments to purchase natural gas is limited to the aggregate market value of the contracts held. However, should UNG enter into a contractual commitment to sell natural gas, it would be required to make delivery of the natural gas at the contract price, repurchase the contract at prevailing prices or settle in cash. Since there are no limits on the future price of natural gas, the market risk to UNG could be unlimited.
UNG’s exposure to market risk depends on a number of factors, including the markets for natural gas, the volatility of interest rates and foreign exchange rates, the liquidity of the Natural Gas Futures Contracts and Other Natural Gas-Related Investments markets and the relationships among the contracts held by UNG. Drastic market occurrences could ultimately lead to the loss of all or substantially all of an investor’s capital.
Credit Risk
When UNG enters into Natural Gas Futures Contracts and Other Natural Gas-Related Investments, it is exposed to the credit risk that the counterparty will not be able to meet its obligations. The counterparty for the Natural Gas Futures Contracts traded on the NYMEX and on most other futures exchanges is the clearinghouse associated with the particular exchange. In general, in addition to margin required to be posted by the clearinghouse in connection with cleared trades, clearinghouses are backed by their members who may be required to share in the financial burden resulting from the nonperformance of one of their members and, therefore, this additional member support should significantly reduce credit risk. Some foreign exchanges are not backed by their clearinghouse members but may be backed by a consortium of banks or other financial institutions. There can be no assurance that any counterparty, clearinghouse, or their members or their financial backers will satisfy their obligations to UNG in such circumstances.
During the six months ended June 30, 2014, UNG entered into fully-collateralized over-the-counter transactions with one counterparty, JPMorgan Chase Bank, NA. The over-the-counter swap transaction with JPMorgan Chase Bank, NA was terminated effective April 23, 2014. Unlike most of the exchange-traded Futures Contracts, cleared swaps or exchange-traded options on such futures, each party to an over-the-counter contract bears the credit risk that the other party may not be able to perform its obligations under its contract. See “Item 3. Quantitative and Qualitative Disclosures About Market Risk” of this quarterly report on Form 10-Q for a discussion of over-the-counter contracts.
| 35 |
USCF attempts to manage the credit risk of UNG by following various trading limitations and policies. In particular, UNG generally posts margin and/or holds liquid assets that are approximately equal to the market value of its obligations to counterparties under the Natural Gas Futures Contracts and Other Natural Gas-Related Investments it holds. USCF has implemented procedures that include, but are not limited to, executing and clearing trades only with creditworthy parties and/or requiring the posting of collateral or margin by such parties for the benefit of UNG to limit its credit exposure. An FCM, when acting on behalf of UNG in accepting orders to purchase or sell Natural Gas Futures Contracts on United States exchanges, is required by CFTC regulations to separately account for and segregate as belonging to UNG, all assets of UNG relating to domestic Natural Gas Futures Contracts trading. These FCMs are not allowed to commingle UNG’s assets with their other assets. In addition, the CFTC requires commodity brokers to hold in a secure account UNG’s assets related to foreign Natural Gas Futures Contracts trading and, in some cases, to cleared swaps executed through the FCM. Similarly, under its current over-the-counter agreements, UNG requires that collateral it posts or receives be posted with its custodian and, under agreements among the custodian, UNG and its counterparties, such collateral is segregated.
See “Item 3. Quantitative and Qualitative Disclosures About Market Risk” in this quarterly report on Form 10-Q for a discussion of over-the-counter contracts.
As of June 30, 2014, UNG held cash deposits and investments in Treasuries and money market funds in the amount of $712,251,789 with the custodian and FCM. Some or all of these amounts may be subject to loss should UNG’s custodian and/or FCM cease operations.
Off Balance Sheet Financing
As of June 30, 2014, UNG had no loan guarantee, credit support or other off-balance sheet arrangements of any kind other than agreements entered into in the normal course of business, which may include indemnification provisions relating to certain risks that service providers undertake in performing services which are in the best interests of UNG. While UNG’s exposure under these indemnification provisions cannot be estimated, they are not expected to have a material impact on UNG’s financial position.
European Sovereign Debt
UNG had no direct exposure to European sovereign debt as of June 30, 2014 and has no direct exposure to European sovereign debt as of the filing of this quarterly report on Form 10-Q.
Redemption Basket Obligation
In order to meet its investment objective and pay its contractual obligations described below, UNG requires liquidity to redeem shares, which redemptions must be in blocks of 100,000 shares called “Redemption Baskets.” UNG has to date satisfied this obligation by paying from the cash or cash equivalents it holds or through the sale of its Treasuries in an amount proportionate to the number of shares being redeemed.
Contractual Obligations
UNG’s primary contractual obligations are with USCF. In return for its services, USCF is entitled to a management fee calculated daily and paid monthly as a fixed percentage of UNG’s NAV, currently 0.60% for a NAV of $1 billion or less, and thereafter 0.50% for a NAV above $1 billion.
USCF agreed to pay the start-up costs associated with the formation of UNG, primarily its legal, accounting and other costs in connection with USCF’s registration with the CFTC as a CPO and the registration and listing of UNG and its shares with the SEC, FINRA and NYSE Arca (formerly, AMEX), respectively. However, since UNG’s initial offering of shares, offering costs incurred in connection with registering and listing additional shares of UNG have been directly borne on an ongoing basis by UNG, and not by USCF.
| 36 |
USCF pays the fees of UNG’s marketing agent, ALPS Distributors, Inc., and the fees of the custodian and transfer agent, Brown Brothers Harriman & Co. (“BBH&Co.”), as well as BBH&Co.’s fees for performing administrative services, including those in connection with the preparation of UNG’s condensed financial statements and its SEC, NFA and CFTC reports. USCF and UNG have also entered into a licensing agreement with the NYMEX pursuant to which UNG and the Related Public Funds, other than BNO, USCI, CPER, USAG and USMI, pay a licensing fee to the NYMEX. UNG also pays the fees and expenses associated with its tax accounting and reporting requirements.
In addition to USCF’s management fee, UNG pays its brokerage fees (including fees to a FCM), over-the-counter dealer spreads and up-front fees, any licensing fees for the use of intellectual property, and, subsequent to the initial offering, registration and other fees paid to the SEC, FINRA, or other regulatory agencies in connection with the offer and sale of shares, as well as legal, printing, accounting and other expenses associated therewith, and extraordinary expenses. The latter are expenses not incurred in the ordinary course of UNG’s business, including expenses relating to the indemnification of any person against liabilities and obligations to the extent permitted by law and under the LP Agreement, the bringing or defending of actions in law or in equity or otherwise conducting litigation and incurring legal expenses and the settlement of claims and litigation. Commission payments to a FCM are on a contract-by-contract, or round turn, basis. UNG also pays a portion of the fees and expenses of the independent directors of USCF. See Note 3 to the Notes to Condensed Financial Statements (Unaudited) in Item 1 of this quarterly report on Form 10-Q.
The parties cannot anticipate the amount of payments that will be required under these arrangements for future periods, as UNG’s per share NAVs and trading levels to meet its investment objective will not be known until a future date. These agreements are effective for a specific term agreed upon by the parties with an option to renew, or, in some cases, are in effect for the duration of UNG’s existence. Either party may terminate these agreements earlier for certain reasons described in the agreements.
As of June 30, 2014, UNG’s portfolio consisted of 6,887 Natural Gas Futures NG August 2014 Contracts traded on the NYMEX and 35,873 Natural Gas Futures LD1 H August 2014 Contracts traded on the ICE Futures. For a list of UNG’s current holdings, please see UNG’s website at www.unitedstatescommodityfunds.com.
Item 3. Quantitative and Qualitative Disclosures About Market Risk.
Over-the-Counter Derivatives
In the future, UNG may purchase over-the-counter contracts (“OTC Contracts”). Unlike most exchange-traded futures contracts, cleared swaps or exchange-traded options on such futures, each party to an OTC Contract bears the credit risk that the other party may not be able to perform its obligations under its contract.
UNG may enter into transactions where an over-the-counter component is exchanged for a corresponding futures contract (“Exchange for Related Positions” or “EFRP transaction”). These EFRP transactions may expose UNG to counterparty risk during the interim period between the execution of the over-the-counter component and the exchange for a corresponding futures contract. Generally, the counterparty risk from the EFRP transaction will exist only on the day of execution.
Swap transactions, like other financial transactions, involve a variety of significant risks. The specific risks presented by a particular swap transaction necessarily depend upon the terms and circumstances of the transaction. In general, however, all swap transactions involve some combination of market risk, credit risk, counterparty credit risk, funding risk, liquidity risk and operational risk.
Highly customized swap transactions in particular may increase liquidity risk, which may result in a suspension of redemptions. Highly leveraged transactions may experience substantial gains or losses in value as a result of relatively small changes in the value or level of an underlying or related market factor.
| 37 |
In evaluating the risks and contractual obligations associated with a particular swap transaction, it is important to consider that a swap transaction may be modified or terminated only by mutual consent of the original parties and subject to agreement on individually negotiated terms. Therefore, it may not be possible for USCF to modify, terminate or offset UNG’s obligations or its exposure to the risks associated with a transaction prior to its scheduled termination date.
To reduce the credit risk that arises in connection with such contracts, UNG will generally enter into an agreement with each counterparty based on the Master Agreement published by the International Swaps and Derivatives Association that provides for the netting of its overall exposure to its counterparty, if the counterparty is unable to meet its obligations to UNG due to the occurrence of a specified event, such as the insolvency of the counterparty.
USCF assesses or reviews, as appropriate, the creditworthiness of each potential or existing counterparty to an OTC Contract pursuant to guidelines approved by USCF’s board of directors (the “Board”). Furthermore, USCF on behalf of UNG only enters into OTC Contracts with counterparties who are, or are affiliates of, (a) banks regulated by a United States federal bank regulator, (b) broker-dealers regulated by the SEC, (c) insurance companies domiciled in the United States, or (d) producers, users or traders of energy, whether or not regulated by the CFTC. Any entity acting as a counterparty shall be regulated in either the United States or the United Kingdom unless otherwise approved by the Board after consultation with its legal counsel. Existing counterparties are also reviewed periodically by USCF. UNG will also require that the counterparty be highly rated and/or provide collateral or other credit support. Even if collateral is used to reduce counterparty credit risk, sudden changes in the value of OTC transactions may leave a party open to financial risk due to a counterparty default since the collateral held may not cover a party’s exposure on the transaction in such situations.
Both the Board and its audit committee review statistics and data pertaining to each of UNG’s over-the-counter counterparties. Reports are provided verbally and in writing by USCF’s management at least quarterly and more frequently when deemed necessary. Data reviewed includes, but is not limited to, short-term and long-term credit ratings by Moody’s Investor Service, Inc., Standard & Poor’s Financial Services LLC and Fitch Ratings; changes in market capitalization and stock prices over the last five years; numerous financial ratios including capital and leverage ratios; and credit default swap yields and spreads. Additionally, members of USCF’s Board, audit committee and management team may note general economic or company specific news that necessitates a review of a counterparty’s creditworthiness outside of the regular review cycle. Board members and audit committee members may conduct their own analysis and contact USCF’s management team at their discretion to request further information or action. Board members are apprised of open positions as well as changes to positions and counterparties utilized by UNG on an ongoing basis. Significant changes to UNG’s over-the-counter contract holdings are reported to the Board in a timely manner.
In general, valuing OTC derivatives is less certain than valuing actively traded financial instruments such as exchange-traded futures contracts and securities or cleared swaps because the price and terms on which such OTC derivatives are entered into or can be terminated are individually negotiated, and those prices and terms may not reflect the best price or terms available from other sources. In addition, while market makers and dealers generally quote indicative prices or terms for entering into or terminating OTC Contracts, they typically are not contractually obligated to do so, particularly if they are not a party to the transaction. As a result, it may be difficult to obtain an independent value for an outstanding OTC derivatives transaction.
During the six months ended June 30, 2014, UNG employed hedging methods such as those described above to the extent it invested in fully-collateralized over-the-counter swap transactions and EFRP transactions designed to track percentage changes in the price of the Benchmark Futures Contract. During the six months ended June 30, 2013, UNG was exposed to counterparty risk on its fully-collateralized over-the-counter swap transactions with two counterparties, JPMorgan Chase Bank, NA and Deutsche Bank AG. The over-the-counter swap transaction with JPMorgan Chase Bank, NA was terminated effective April 23, 2014. The over-the-counter swap transaction with Deutsche Bank AG was terminated effective August 30, 2013.
| 38 |
The counterparty credit ratings for the exposure on over-the-counter swap transactions to which UNG was a party that would be owed to UNG due to a default or early termination by UNG’s counterparties at June 30, 2014, December 31, 2013 and June 30, 2013 were:
| June 30, 2014 | ||||||||||||||||||||
| Moody’s Credit Rating | Number of Counterparties | Notional Value | Credit Exposure | Collateral Held | Exposure Net of Collateral* | |||||||||||||||
| — | — | $ | — | $ | — | $ | — | $ | — | |||||||||||
| Total | — | $ | — | $ | — | $ | — | $ | — | |||||||||||
| December 31, 2013 | ||||||||||||||||||||
| Moody’s Credit Rating | Number of Counterparties | Notional Value | Credit Exposure | Collateral Held | Exposure, Net of Collateral* | |||||||||||||||
| Aa3 | 1 | $ | 120,932,565 | $ | (4,196,450 | ) | $ | 32,265,444 | $ | (4,196,450 | ) | |||||||||
| Total | 1 | $ | 120,932,565 | $ | (4,196,450 | ) | $ | 32,265,444 | $ | (4,196,450 | ) | |||||||||
| June 30, 2013 | ||||||||||||||||||||
| Moody’s Credit Rating | Number of Counterparties | Notional Value | Credit Exposure | Collateral Held | Exposure, Net of Collateral* | |||||||||||||||
| Aa3 | 2 | $ | 195,469,923 | $ | (10,837,996 | ) | $ | 0 | $ | (10,837,996 | ) | |||||||||
| Total | 2 | $ | 195,469,923 | $ | (10,837,996 | ) | $ | 0 | $ | (10,837,996 | ) | |||||||||
| * | The difference reflects minimum transfer amounts for collateral and potentially one day’s movement in the underlying total return, which would be collateralized the following business day. |
At June 30, 2014, UNG did not engage in any over-the-counter derivative transactions, as compared to June 30, 2013 where the aggregate notional amount of UNG’s over-the-counter derivative transactions, which consisted of total return swaps, was $195,469,923. The aggregate notional amount of these derivative transactions, which is not included in the Condensed Schedule of Investments (Unaudited), is indicative of UNG’s activities in derivative transactions, but is not an indicator of the level of credit risk associated with these transactions.
UNG maintains, in conjunction with its counterparties, collateral in the form of both cash and investments in Treasuries, depending on the specific arrangements with each counterparty. UNG is required to post an independent amount based on a percentage of the initial notional amount of each position at the inception of each over-the-counter contract. In addition, between reset periods, UNG posts collateral for the benefit of its counterparties that approximately corresponds to any unrealized loss that would be realized by UNG if the over-the-counter contract were closed on any given valuation date. Likewise, UNG’s counterparties post collateral for UNG’s benefit that approximately corresponds to any unrealized gain that would be realized by UNG if the over-the-counter contract were to be closed on any given valuation date. At each reset date, UNG will make or receive settlement payments to or from its counterparties, and collateral posted by or for UNG will be returned to the appropriate party to offset the settlement payment made. Collateral is held by an independent third party and governed by tri-party agreements between UNG, its custodian, BBH&Co, and each counterparty.
At June 30, 2014, UNG did not hold any over-the-counter swap agreements, as compared to June 30, 2013 when UNG held two over-the-counter swap agreements whereby UNG’s counterparty posted $0 in cash and $0 in securities and UNG posted $21,851,940 in cash and $20,927,795 in securities.
UNG anticipates that the use of Other Natural Gas-Related Investments together with its investments in Natural Gas Futures Contracts will produce price and total return results that closely track the investment goals of UNG. However, there can be no assurance of this. OTC Contracts may result in higher transaction-related expenses than the brokerage commissions paid in connection with the purchase of Natural Gas Futures Contracts, which may impact UNG’s ability to successfully track the Benchmark Futures Contract.
| 39 |
The over-the-counter swap transactions with JPMorgan Chase Bank, NA and Deutsche Bank AG were terminated effective April 23, 2014 and August 30, 2013, respectively.
| Item 4. | Controls and Procedures. |
Disclosure Controls and Procedures
UNG maintains disclosure controls and procedures that are designed to ensure that material information required to be disclosed in UNG’s periodic reports filed or submitted under the Securities Exchange Act of 1934, as amended, is recorded, processed, summarized and reported within the time period specified in the SEC’s rules and forms.
The duly appointed officers of USCF, including its chief executive officer and chief financial officer, who perform functions equivalent to those of a principal executive officer and principal financial officer of UNG if UNG had any officers, have evaluated the effectiveness of UNG’s disclosure controls and procedures and have concluded that the disclosure controls and procedures of UNG have been effective as of the end of the period covered by this quarterly report on Form 10-Q.
Change in Internal Control Over Financial Reporting
There were no changes in UNG’s internal control over financial reporting during UNG’s last fiscal quarter that have materially affected, or are reasonably likely to materially affect, UNG’s internal control over financial reporting.
| Item 1. | Legal Proceedings. |
Not applicable.
| Item 1A. | Risk Factors. |
There have been no material changes to the risk factors previously disclosed in UNG’s Annual Report on Form 10-K for the fiscal year ended December 31, 2013, filed on February 28, 2014, and UNG’s Quarterly Report on Form 10-Q for the period ended March 31, 2014, filed on May 12, 2014.
| Item 2. | Unregistered Sales of Equity Securities and Use of Proceeds. |
Not applicable.
| Item 3. | Defaults Upon Senior Securities. |
Not applicable.
| Item 4. | Mine Safety Disclosures. |
Not applicable.
| Item 5. | Other Information. |
Monthly Account Statements
Pursuant to the requirement under Rule 4.22 under the Commodity Exchange Act, each month UNG publishes an account statement for its shareholders, which includes a Statement of Income (Loss) and a Statement of Changes in Net Asset Value. The account statement is furnished to the SEC on a current report on Form 8-K pursuant to Section 13 or 15(d) of the Exchange Act and posted each month on UNG’s website at www.unitedstatescommodityfunds.com.
| 40 |
| Item 6. | Exhibits. |
Listed below are the exhibits, which are filed as part of this quarterly report on Form 10-Q (according to the number assigned to them in Item 601 of Regulation S-K):
| Exhibit Number | Description of Document | |
| 31.1(1) | Certification by Principal Executive Officer Pursuant to Section 302 of the Sarbanes-Oxley Act of 2002. | |
| 31.2(1) | Certification by Principal Financial Officer Pursuant to Section 302 of the Sarbanes-Oxley Act of 2002. | |
| 32.1(1) | Certification by Principal Executive Officer Pursuant to 18 U.S.C. Section 1350, as Adopted Pursuant to Section 906 of the Sarbanes-Oxley Act of 2002. | |
| 32.2(1) | Certification by Principal Financial Officer Pursuant to 18 U.S.C. Section 1350, as Adopted Pursuant to Section 906 of the Sarbanes-Oxley Act of 2002. | |
| 101.INS(2) | XBRL Instance Document. | |
| 101.SCH(2) | XBRL Taxonomy Extension Schema. | |
| 101.CAL(2) | XBRL Taxonomy Extension Calculation Linkbase. | |
| 101.DEF(2) | XBRL Taxonomy Extension Definition Linkbase. | |
| 101.LAB(2) | XBRL Taxonomy Extension Label Linkbase. | |
| 101.PRE(2) | XBRL Taxonomy Extension Presentation Linkbase. |
| (1) | Filed herewith. |
| (2) | In accordance with Rule 402 of Regulation S-T, the information in these exhibits is furnished and deemed not filed or part of a registration statement or prospectus for purposes of Sections 11 or 12 of the Securities Act of 1933, is deemed not filed for purposes of Section 18 of the Securities Exchange Act of 1934, and otherwise is not subject to liability under these sections. |
| 41 |
Pursuant to the requirements of the Securities Exchange Act of 1934, the registrant has duly caused this report to be signed on its behalf by the undersigned thereunto duly authorized.
United States Natural Gas Fund, LP (Registrant)
By: United States Commodity Funds LLC, its general partner
| By: | /s/ Nicholas D. Gerber | |
| Nicholas D. Gerber | ||
| President and Chief Executive Officer | ||
| (Principal executive officer) | ||
| Date: August 11, 2014 | ||
| By: | /s/ Howard Mah | |
| Howard Mah | ||
| Chief Financial Officer | ||
| (Principal financial and accounting officer) | ||
| Date: August 11, 2014 | ||
| 42 |