Attached files
| file | filename |
|---|---|
| 8-K/A - 8-K/A - BROADRIDGE FINANCIAL SOLUTIONS, INC. | d774407d8ka.htm |
 Earnings
Webcast & Conference Call
Fourth Quarter and Fiscal Year 2014
August 7, 2014
Correction:
Revised
to
correct
the
reconciliation
of
the fiscal year 2015 forecast on Cash and cash
equivalents on page 15. Includes previous revision
of the fourth quarter fiscal year 2014 Non-GAAP
diluted EPS amount to $1.16 from $1.17. This
correction does not change any other amounts
presented.
Exhibit 99.2 |
 1
©
2014 |
Forward-Looking Statements
This presentation and other written or oral statements made from time to time by
representatives of Broadridge may contain “forward-looking statements”
within the meaning of the Private Securities Litigation Reform Act of 1995. Statements that are not
historical in nature, and which may be identified by the use of words such as
“expects,” “assumes,” “projects,” “anticipates,”
“estimates,” “we believe,” “could be” and other words of similar
meaning, are forward-looking statements. In particular, information appearing in
the “Fiscal Year 2014 Financial Guidance” section are forward-looking statements. These statements are based on
management’s expectations and assumptions and are subject to risks and uncertainties that
may cause actual results to differ materially from those expressed. These risks and
uncertainties include those risk factors discussed in Part I, “Item 1A. Risk Factors” of
our Annual Report on Form 10-K for the fiscal year ended June 30, 2014 (the “2014
Annual Report”), as they may be updated in any future reports filed with the
Securities and Exchange Commission. All forward-looking statements speak only as of the date of this
presentation and are expressly qualified in their entirety by reference to the factors
discussed in the 2014 Annual Report. These risks include: the success of Broadridge in
retaining and selling additional services to its existing clients and in obtaining new clients;
Broadridge’s reliance on a relatively small number of clients, the continued financial
health of those clients, and the continued use by such clients of Broadridge’s
services with favorable pricing terms; changes in laws and regulations affecting Broadridge’s clients or
the services provided by Broadridge; declines in participation and activity in the securities
markets; any material breach of Broadridge security affecting its clients’
customer information; the failure of Broadridge’s outsourced data center services provider to
provide the anticipated levels of service; a disaster or other significant slowdown or failure
of Broadridge’s systems or error in the performance of Broadridge’s services;
overall market and economic conditions and their impact on the securities markets;
Broadridge’s failure to keep pace with changes in technology and demands of its clients;
Broadridge’s ability to attract and retain key personnel; the impact of new
acquisitions and divestitures; and competitive conditions. Broadridge disclaims any obligation to
update or revise forward-looking statements that may be made to reflect events or
circumstances that arise after the date made or to reflect the occurrence of
unanticipated events, other than as required by law.
Explanation of the Company’s Use of Non-GAAP Financial Measures
In certain circumstances, results have been presented that are not generally accepted
accounting principles measures (“Non-GAAP”) and should be viewed in
addition to, and not as a substitute for, the Company’s reported results. These Non-GAAP measures are
indicators that management uses to provide additional meaningful comparisons between current
results and prior reported results, and as a basis for planning and forecasting for
future periods. In addition, Broadridge believes this Non-GAAP information helps
investors understand the effect of these items on reported results and provides a better
representation of the Company’s performance. Accompanying this presentation is a reconciliation of these Non-GAAP measures to the comparable GAAP measures.
Use of Material Contained Herein
The information contained in this presentation is being provided for your convenience and
information only. This information is accurate as of the date of its initial
presentation. If you plan to use this information for any purpose, verification of its continued
accuracy is your responsibility. Broadridge assumes no duty to update or revise the
information contained in this presentation. You may reproduce information
contained in this presentation provided you do not alter, edit, or delete any of the content and provided
you identify the source of the information as Broadridge Financial Solutions, Inc., which owns
the copyright. Broadridge and the Broadridge logo are registered trademarks of Broadridge Financial
Solutions, Inc. |
 2
©
2014 |
Today’s Agenda
Opening Remarks
Rich Daly, President and CEO
Fourth Quarter and Fiscal Year 2014
Jim Young,
CFO
Highlights and Segment Results
Summary
Rich Daly, President and CEO
Q&A
Rich Daly, President and CEO
Jim Young, CFO
Closing Remarks
Rich Daly, President and CEO |
 3
©
2014 |
Key Messages
Strong execution in FY14 generated record results and providing
momentum into FY15
Continued progress against our growth strategy
FY15 guidance reflects continued successful execution on the
activities within our control
Remain committed to capital stewardship program
Increased confidence in continuing to generate sustainable top
quartile stockholder returns |
 4
©
2014 |
Fiscal Year 2014 Highlights
Strong revenue growth Recurring revenues were up 9% primarily due to Net New Business (recurring revenue
closed sales less client losses) and strong market-based activities
Record diluted Earnings Per Share (EPS)
Non-GAAP diluted EPS of $2.25 was up 20%; GAAP diluted EPS of $2.12 was up 25% Increased revenues, operating leverage and productivity initiatives generate margin
expansion Performance includes increased strategic investments in the business
Record recurring revenue closed sales of $127M Headlined by a large closed sale in Q4 with Fidelity Investments for investor
communications outsourcing solutions
Robust sales pipeline provides for further large deal opportunities
Continued expansion of Emerging and Acquired (E&A) solutions Inlet joint venture with Pitney Bowes to address industry need for digital solutions Bonaire and Emerald acquisitions expand capabilities in targeted markets Acquisitions portfolio contributed ~$220M to fee revenue and ~$75M to EBITDA
(Non-GAAP) Board increased annual dividend by 29% to $1.08 per share Increased dividend seven consecutive years (CAGR ~24%) Increased targeted payout ratio to 45% from 40% of FY14 Non-GAAP Net Income Board authorized an additional 6.2M shares for a total of 10M shares of common stock
for repurchase |
 5
©
2014 |
Fiscal Year 2015 Guidance
Recurring revenue growth of 5-7% (total revenues 4-6%)
Market-based activities not assumed to contribute at the
same levels as FY14
Continued exceptional client revenue retention rate of 98%
Non-GAAP diluted EPS of $2.42-2.52 (8-12% growth)
GAAP EPS of $2.29-2.39 (8-13% growth)
Recurring revenue closed sales of $110-150M
Free cash flows of $320M-$370M
Balancing controllable growth with increasing investments in the business |
 6
©
2014 |
Key Financial Drivers
4Q
Actual
FY15
FY14
FY14
Range
Growth Drivers as a % of Recurring Revenue
Closed Sales
(Recurring)
6%
7%
6-7%
Client Losses
(3%)
(3%)
(2%)
Net New Business
3%
4%
4-5%
Internal Growth
(a)
3%
4%
0-1%
Organic Growth
6%
8%
4-6%
Acquisitions
1%
1%
1%
Total Recurring Revenue Growth
7%
9%
5-7%
Growth Drivers as a % of Total Revenue
Recurring Revenue
5%
5%
3-4%
Event-Driven
(b)
(1%)
0%
0%
Distribution
(c)
(1%)
0%
1-2%
FX/Other
(1%)
0%
0%
Total Revenue Growth
2%
5%
4-6%
EBIT Margin
(Non-GAAP)
24.0%
16.4%
17.4-17.8%
EPS
(Non-GAAP)
$1.16
$2.25
$2.42-2.52
(a) Internal Growth includes SPS Equity & Fixed Income Trades, ICS Equity & Mutual
Fund Stock Record Growth, Transaction Reporting, Fulfillment, and Time & Materials
(b) Event-Driven includes ICS Proxy Contest/Specials, Mutual Fund Proxy and Interim
Communications (c) Distribution includes pass-through fees from Matrix
|
 7
©
2014 |
Segment Results & Forecast –
Investor Communication Solutions
Recurring/Growth
Revenue/Growth
EBIT/Growth
(Non-GAAP)
Margin/Growth
FY14:
$947M / 11%
$1,867M / 6%
$336M / 11%
18.0% / 80 bps
FY15:
$1,007 to $1,030 M / 6 to 9%
$1,963 to $1,996M / 5 to 7%
$368 to $380M / 10 to 13%
18.7% to 19.0% / 70-100bps
FY14 strong results from Net New Business and market-based activities
balanced by investments
FY15 guidance anticipates recurring revenue growth of 6-9%
Approximately 50% from Net New Business
Event-driven revenue in-line with prior two years
Margin growth improvement from operating leverage balanced by
increased growth investments
Recurring revenue closed sales range of $70-90M
Tempered by modest market-based activities contribution (Non-GAAP)
(Non-GAAP) |
 8
©
2014 |
Segment Results & Forecast –
Securities Processing Solutions
FY14 revenues up 5% with strong margin expansion
Margin driven by operating leverage and productivity improvements
balanced by investments
FY15 guidance anticipates recurring revenue growth of 2-4%
Primarily from Net New Business
Margin expansion based on productivity initiatives
Recurring revenue closed sales range of $40-60M
Revenue/Growth
EBIT/Growth
(Non-GAAP)
Margin/Growth
(Non-GAAP)
FY14:
$695M / 5%
$119M / 40%
17.1%
/
420
bps
FY15
$710M
to
722M
/
2
to
4%
$122M
to
136M
/
2
to
14%
17.2
to
18.8%
/
10
to
170
bps
: |
 9
©
2014 |
Closing Summary
Record financial results providing strong momentum for FY15
with both segments contributing to growth
Guidance reflects the activities within our control with a focus
on
growing recurring revenues from Net New Business
Continued investments in strategic growth opportunities
Remain committed to our capital stewardship program
Increased confidence in continuing to generate sustainable top
quartile stockholder returns |
 10
©
2014 |
Q&A and Closing Comments
There are no slides during this portion of the presentation |
 11
©
2014 |
Appendix |
 12
©
2014 |
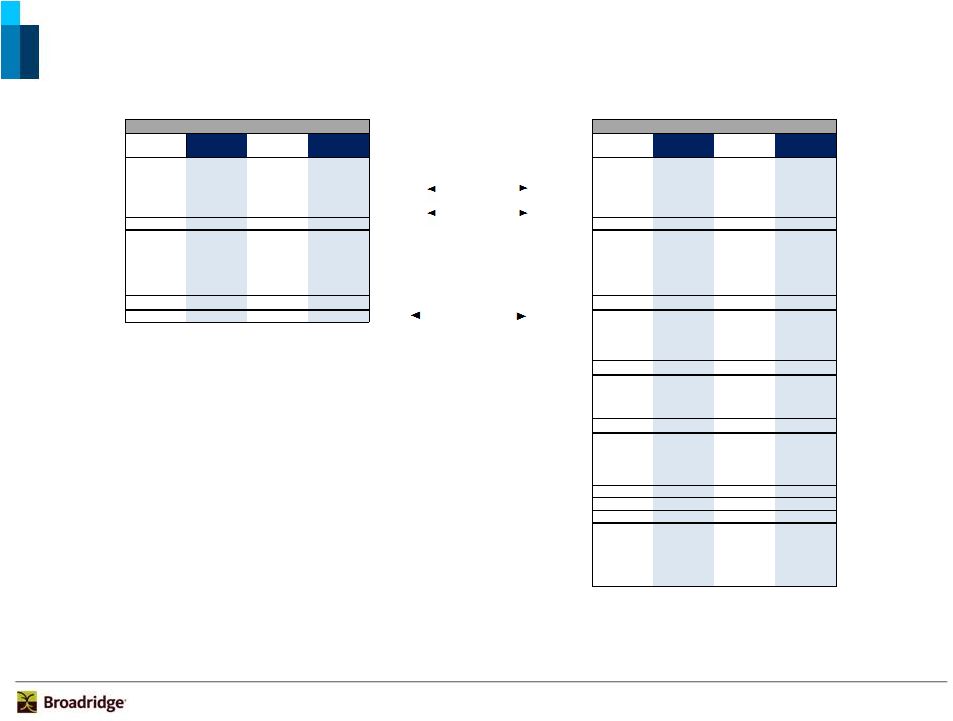
Segment Results & Forecast –
Other & Foreign Exchange (FX)
Corporate
Expenses:
FY14
results
were
in-line
with
full
year
guidance
range
and
included strategic investments
Interest
Expense,
net:
Reflected
higher
interest
rates
from
previous
year
due
to
refinancing of term loan with senior fixed-rate notes
FY14
Actual
Low
High
Corporate Expenses
$(50)M
$(42)M
$(49)M
Interest Expense, net
$(25)M
$(26)M
$(26)M
FX -
P&L -
Revenue
$(4)M
$(7)M
$(7)M
-
EBIT
$16M
$16M
$16M
-
Transaction Activity
$0M
$0M
$0M
FY15 Range |
 13
©
2014 |
Broadridge Q4 and Full Year FY14
Revenue
FY13
FY14
FY13
FY14
FY13
FY14
FY13
FY14
Q4
Q4
Full Year
Full Year
Q4
Q4
Full Year
Full Year
$690
$715
$1,760
$1,867
ICS
$208
$219
$302
$336
9%
4%
8%
6%
Growth % / Margin %
30.1%
30.6%
17.2%
18.0%
$173
$174
$661
$695
SPS
$27
$15
$85
$119
4%
1%
1%
5%
Growth % / Margin %
15.6%
8.6%
12.9%
17.1%
$863
$889
$2,421
$2,562
Total Segments
$235
$234
$387
$455
8%
3%
6%
6%
Margin %
27.2%
26.3%
16.0%
17.8%
$0
$0
$0
($0)
Other
(a)
($21)
($23)
($44)
($50)
$2
($3)
$10
($4)
FX
(b)
$5
$2
$15
$16
$865
$886
$2,431
$2,558
Total Broadridge (Non-GAAP)
(a)
$219
$213
$359
$420
8%
2%
6%
5%
Growth % / Margin %
25.3%
24.0%
14.8%
16.4%
Interest & Other
($5)
($6)
($15)
($25)
Acquisition Amortization and Other Costs
(c)
$7
$7
$24
$25
Total EBT (Non-GAAP)
(d)
$221
$214
$367
$420
Margin %
25.6%
24.1%
15.1%
16.4%
Income taxes
($79)
($69)
($131)
($141)
Tax Rate
35.6%
32.3%
35.7%
33.6%
Total Net Earnings (Non-GAAP)
(d)
$142
$145
$236
$279
Margin %
16.5%
16.3%
9.7%
10.9%
Acquisition Amortization and Other Costs
(c)
($4)
($4)
($15)
($16)
Restructuring Charges
(e)
($3)
$0
($9)
$0
Non-GAAP Items (Net of Taxes)
($8)
($4)
($24)
($16)
Total Net Earnings (GAAP)
$135
$140
$212
$263
Margin %
15.6%
15.8%
8.7%
10.3%
(a)
Diluted Shares
123.8
124.6
125.4
124.1
Diluted EPS (Non-GAAP)
(d)
$1.15
$1.16
$1.88
$2.25
Diluted EPS (GAAP)
$1.09
$1.13
$1.69
$2.12
NOTE: Amounts in this table may not sum to totals due to rounding.
(a) FY13 Q4 excludes Restructuring Charges of $12M (after tax $8M, or $0.06 EPS impact). FY13
Full Year excludes Restructuring Charges of $20M (after tax $13M, or $0.10 EPS impact).
(b) Includes impacts of FX P&L and FX transaction activity.
(c) Represents amortization charges associated with intangible asset values as well as other
deal costs associated with the Company’s acquisitions. FY13 Full Year excludes
Restructuring Charges of $20M (after tax $13M, or $0.10 EPS impact), Acquisition Amortization and Other Costs of $24M (after tax $15M, or $0.12 EPS impact) and a one time tax credit of $4M (or $0.04 EPS impact).
FY14 Q4 excludes Acquisition Amortization and Other Costs of $7M (after tax $4M, or $0.04 EPS
impact) and FY14 Full Year excludes Acquisition Amortization and Other Costs of $25M (after tax $16M, or $0.13 EPS impact)
(e) FY13 represents transition costs related to termination of the Penson agreement including
shutdown costs. Earnings
(d) FY13 Q4 excludes Restructuring Charges of $12M (after tax $8M, or $0.06 EPS impact),
Acquisition Amortization and Other Costs of $7M (after tax $4M, or $0.04 EPS impact) and a one time tax credit of $4M (or $0.04 EPS impact).
|
 14
©
2014 |
Broadridge FY15 Guidance
Revenue
Earnings
FY14
FY15 Range
FY14
FY15 Range
Actual
Low
High
($ in millions)
Actual
Low
High
$1,867
$1,963
$1,996
ICS
$336
$368
$380
6%
5%
7%
Growth % / Margin %
18.0%
18.7%
19.0%
$695
$710
$722
SPS
$119
$122
$136
5%
2%
4%
Growth % / Margin %
17.1%
17.2%
18.8%
$2,562
$2,673
$2,718
Total Segments
$455
$490
$515
6%
4%
6%
Margin %
17.8%
18.3%
19.0%
($0)
$0
$0
Other
($50)
($42)
($49)
($4)
($7)
($7)
FX
(a)
$16
$16
$16
$2,558
$2,666
$2,711
Total Broadridge (Non-GAAP)
$420
$464
$483
5%
4%
6%
Growth % / Margin %
16.4%
17.4%
17.8%
Interest & Other
($25)
($26)
($26)
Acquisition Amortization and Other Costs
(b)
$25
$24
$24
Total EBT (Non-GAAP)
(c)
$420
$462
$480
Margin %
16.4%
17.3%
17.7%
Income taxes
($141)
($162)
($168)
Recurring Revenue Closed Sales
Tax Rate
33.6%
35.0%
35.0%
FY15 Range
Segments
Low
High
Total Net Earnings (Non-GAAP)
(c)
$279
$300
$312
ICS
$70
$90
Margin %
10.9%
11.3%
11.5%
SPS
$40
$60
Total
$110
$150
Acquisition Amortization and Other Costs
(b)
($16)
($16)
($16)
Non-GAAP Items (Net of Taxes)
($16)
($16)
($16)
Total Net Earnings (GAAP)
$263
$285
$297
Margin %
10.3%
10.7%
10.9%
Diluted Shares
124
124
124
Diluted EPS (Non-GAAP)
(c)
$2.25
$2.42
$2.52
Diluted EPS (GAAP)
$2.12
$2.29
$2.39
NOTE: Amounts in this table may not sum to totals due to rounding.
(a) Includes impacts of FX P&L and FX Transaction Activity.
* Guidance does not take into consideration the effect of any future acquisitions, additional
debt and/or share repurchases. (b) Represents amortization charges associated with
intangible asset values as well as other deal costs associated with the Company’s acquisitions.
(c) FY14 excludes Acquisition Amortization and Other Costs of $25M (after tax $16M or $0.13
EPS impact). FY15 excludes Acquisition Amortization and Other Costs of $24M (after tax
$16M or $0.13 EPS impact). |
 15
©
2014 |
Cash Flows FY14 Results and FY15 Guidance
Fiscal
Year Ended
Round
June 2014
Low
High
Round
Net earnings from operations (GAAP)
263.0
$
263
$
285
$
297
$
Depreciation and amortization (includes other LT assets)
97.4
97
100
105
Stock-based compensation expense
34.6
35
35
40
Other
(31.7)
(32)
(25)
(22)
Subtotal
363.3
363
395
420
Working capital changes
R
32.5
33
25
35
Long-term assets & liabilities changes
(8.0)
(8)
(25)
(15)
Net cash flows provided by operating activities
387.8
388
395
440
Cash Flows From Investing Activities
Capital expenditures and software purchases
R
(53.5)
(54)
(75)
(70)
Free cash flows (Non-GAAP)
334.3
$
334
$
320
$
370
$
Cash Flows From Other Investing and Financing Activities
Acquisitions
(96.9)
(97)
-
-
Stock repurchases net of options proceeds
(80.2)
(80)
-
-
Dividends paid
(96.7)
(97)
(123)
(123)
Other
21.6
22
20
25
Net change in cash and cash equivalents
81.6
82
217
272
Cash and cash equivalents, at the beginning of year
266.0
266
348
348
Cash and cash equivalents, at the end of period
347.6
$
348
$
565
$
620
$
(a) Guidance does not take into consideration the effect of any future acquisitions,
additional debt and/or share repurchases. Free Cash Flows -
Non-GAAP
Unaudited
($ millions)
FY15 Range
(a)
(Non-GAAP):
Free Cash Flows |
 16
©
2014 |
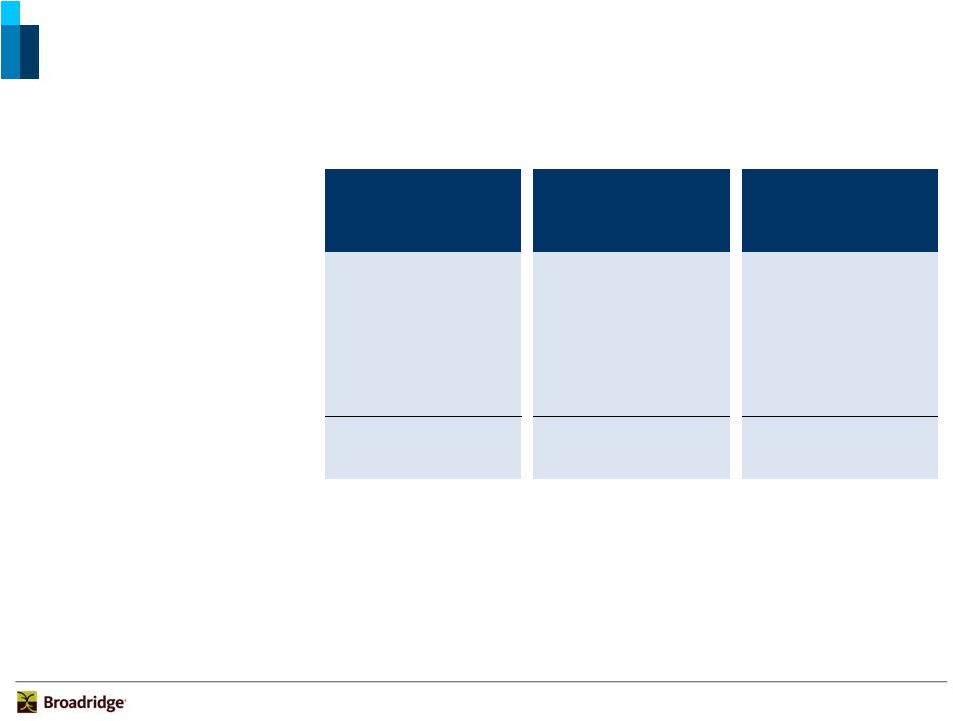
Recurring Revenue Closed Sales to Revenue Contribution
($ in millions)
Closed Sales
Revenue Contribution
(a)
Backlog
(b)
Forecast
Forecast
Forecast
FY15
FY15
FY15
ICS
~$70-90
~$55-65
~$100-120
~Contribution to recurring revenue growth
6-7%
SPS
~$40-60
~$45-55
~$60-70
~Contribution to recurring revenue growth
6-8%
Total Recurring Revenue Closed Sales
~$110-150
~$100-120
~$160-190
~Contribution to recurring revenue growth
6-7%
(a)
Revenue from current year and prior year Closed Sales.
(b)
Closed Sales expected to convert to revenue in future years. |
 17
©
2014 |
Revenues and Closed Sales FY09-FY14
($ in millions)
FY15
Recurring Fee Revenues
FY09
FY10
FY11
FY12
FY13
FY14
Range
ICS
594
$
632
$
720
$
798
$
850
$
947
$
10%
$1,007-1,030
Growth
5%
6%
14%
11%
7%
11%
6-9%
SPS
559
$
536
$
594
$
655
$
661
$
695
$
4%
$710-722
Growth
5%
-4%
11%
10%
1%
5%
2-4%
Total Recurring Fee Revenues
1,153
$
1,168
$
1,313
$
1,453
$
1,511
$
1,642
$
7%
$1,717-1,752
Growth
5%
1%
12%
11%
4%
9%
5-7%
Event-Driven
180
$
257
$
135
$
132
$
156
$
156
$
-3%
~$153
Growth
-10%
43%
-47%
-2%
18%
0%
~(2%)
Distribution
757
$
781
$
704
$
704
$
755
$
764
$
0%
$803-813
Growth
-6%
3%
-10%
0%
7%
1%
5-6%
Other/FX
(17)
$
4
$
14
$
14
$
10
$
(4)
$
~($7)
Total Revenues
2,072
$
2,209
$
2,167
$
2,304
$
2,431
$
2,558
$
4%
$2,666-2,711
Growth
-3%
7%
-2%
6%
6%
5%
4-6%
Recurring Closed Sales
95
$
119
$
113
$
120
$
121
$
127
$
6%
$110-150
Growth
16%
25%
-5%
6%
0%
5%
(13)-18%
($ in millions)
FY15
Event-Driven Fee Revenues
FY09
FY10
FY11
FY12
FY13
FY14
Range
Mutual Fund Proxy
55
$
150
$
39
$
28
$
43
$
57
$
1%
$52
Mutual Fund Supplemental
58
48
44
47
58
41
-7%
$44
Contest/ Specials/ Other Communications
67
59
52
57
54
58
-3%
$57
Total Event-Driven Fee Revenues
180
$
257
$
135
$
132
$
156
$
156
$
-3%
~$153
Growth
-10%
43%
-47%
-2%
18%
0%
-2%
Recurring Distribution Revenues
567
$
564
$
573
$
597
$
629
$
659
$
3%
$695-705
Growth
-2%
-1%
2%
4%
5%
5%
5-6%
ED Distribution Revenues
190
$
217
$
131
$
107
$
126
$
105
$
-11%
$109
Growth
-17%
14%
-39%
-18%
17%
-16%
4%
Total Distribution Revenues
757
$
781
$
704
$
704
$
755
$
764
$
0%
$803-813
Growth
-6%
3%
-10%
0%
7%
1%
5-6%
(a) Includes reclassification of Pre-sale Fulfillment from event-driven revenues to
recurring revenues. (b) Includes reclassification of Pre-sale Fulfillment related
distribution revenues from event-driven distribution to recurring distribution and Matrix
pass-through administrative services revenues from recurring fee to recurring
distribution. (a)
(b)
(b)
CAGR
FY09-FY14
FY09-FY14
CAGR |
 18
©
2014 |
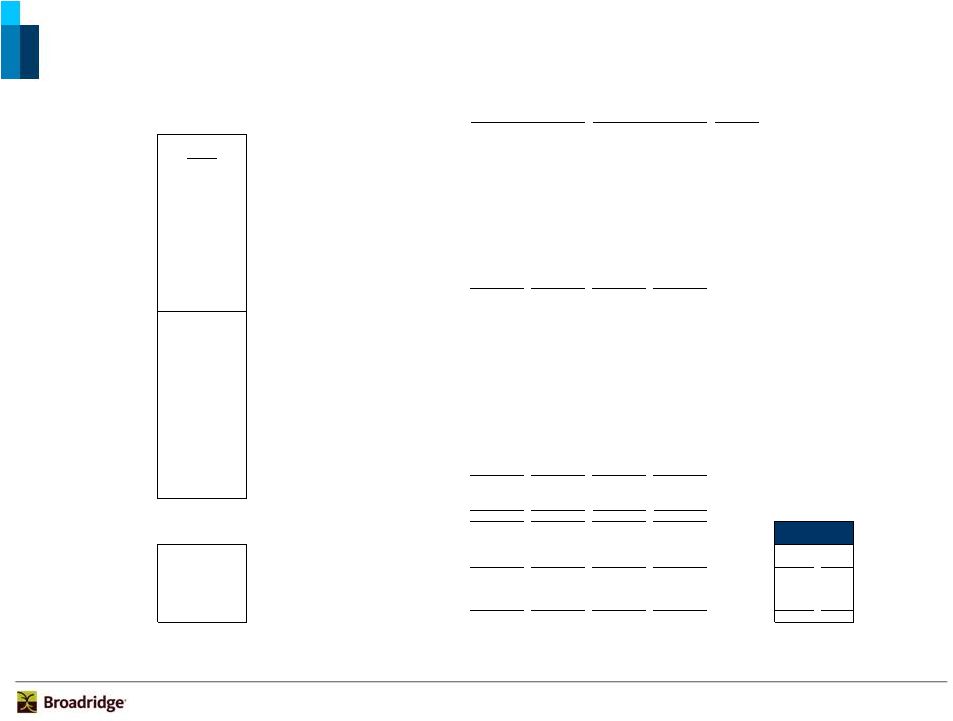
Reconciliation of Non-GAAP to GAAP Measures
Reconciliation of EPS
4Q13
4Q14
FY13
FY14
FY15 Range
Actual
Actual
Actual
Actual
Low
High
Diluted EPS (Non-GAAP)
$1.15
$1.16
$1.88
$2.25
$2.42
$2.52
Acquisition Amortization and Other Costs, net of taxes
($0.04)
($0.04)
($0.12)
($0.13)
($0.13)
($0.13)
Restructuring Charges, net of taxes
($0.06)
$0.00
($0.10)
$0.00
$0.00
$0.00
Discrete tax items
$0.04
$0.00
$0.03
$0.00
$0.00
$0.00
Diluted EPS (GAAP)
$1.09
$1.13
$1.69
$2.12
$2.29
$2.39
Reconciliation of EBT
4Q13
4Q14
FY13
FY14
FY15 Range
($ in millions)
Actual
Actual
Actual
Actual
Low
High
Total EBT (Non-GAAP)
$221
$214
$367
$420
$462
$480
Margin %
25.6%
24.1%
15.1%
16.4%
17.3%
17.7%
Acquisition Amortization and Other Costs
($7)
($7)
($24)
($25)
($24)
($24)
Restructuring Charges
($12)
$0
($20)
$0
$0
$0
Total EBT (GAAP)
$202
$207
$323
$396
$438
$457
Margin %
23.4%
23.3%
13.3%
15.5%
16.4%
16.8%
NOTE: Amounts in the table may not sum to totals due to rounding.
Fiscal
Year Ended
Round
June 2014
Low
High
Free Cash Flows
(Non-GAAP)
:
Round
Net earnings from operations (GAAP)
263.0
$
263
$
285
$
297
$
Depreciation and amortization (includes other LT assets)
97.4
97
100
105
Stock-based compensation expense
34.6
35
35
40
Other
(31.7)
(32)
(25)
(22)
Subtotal
363.3
363
395
420
Working capital changes
R
32.5
33
25
35
Long-term assets & liabilities changes
(8.0)
(8)
(25)
(15)
Net cash flows provided by operating activities
387.8
388
395
440
Cash Flows From Investing Activities
Capital expenditures and software purchases
R
(53.5)
(54)
(75)
(70)
Free cash flows (Non-GAAP)
334.3
$
334
$
320
$
370
$
(a) Guidance does not take into consideration the effect of any future acquisitions,
additional debt and/or share repurchases. Free Cash Flows -
Non-GAAP
Unaudited
($ millions)
FY15 Range
(a) |
 19
©
2014 |
ICS Key Segment Revenue Stats
RC= Recurring
ED= Event-Driven
In millions
Fee Revenues
4Q13
4Q14
FY13
FY14
Type
Proxy
Equities
211.8
$
225.3
$
296.6
$
313.6
$
RC
Stock Record Position Growth
2%
10%
2%
8%
Pieces
219.1
242.6
287.3
314.7
0.6
Mutual Funds
20.8
$
20.8
$
43.5
$
56.8
$
ED
Pieces
29.9
29.6
66.6
77.6
0.6
Contests/Specials
8.1
$
6.2
$
15.4
$
17.1
$
ED
Pieces
7.7
6.2
14.5
18.4
Total Proxy
240.7
$
252.3
$
355.5
$
387.5
$
Total Pieces
256.7
278.5
368.4
410.8
Notice and Access Opt-in %
68%
69%
67%
69%
Suppression %
60%
63%
59%
62%
Interims
Mutual Funds (Annual/Semi-Annual Reports/Annual Prospectuses)
33.7
$
46.1
$
133.6
$
172.8
$
RC
Position Growth
11%
8%
11%
11%
Pieces
159.4
224.4
630.2
810.6
Mutual Funds (Supplemental Prospectuses) & Other
13.6
$
8.3
$
57.6
$
41.1
$
ED
Pieces
77.9
39.2
306.5
212.9
Total Interims
47.3
$
54.4
$
191.2
$
213.9
$
Total Pieces
237.3
263.6
936.7
1,023.5
Transaction
Transaction Reporting/Customer Communications
35.2
$
38.1
$
164.6
$
157.6
$
RC
Reporting
Fulfillment
Fulfillment
41.9
$
34.5
$
143.0
$
143.5
$
RC
Emerging, Acquired
Emerging/Acquired (a)
31.4
$
48.3
$
112.2
$
159.4
$
RC
and Other
Other (b)
15.4
$
13.5
$
39.0
$
40.6
$
ED
Total Emerging, Acquired, and Other
46.8
$
61.8
$
151.2
$
200.0
$
Total Fee Revenues
411.9
$
441.1
$
1,005.5
$
1,102.5
$
Total Distribution Revenues (c)
277.8
$
273.4
$
754.7
$
764.4
$
Total Revenues as reported - GAAP
689.7
$
714.5
$
1,760.2
$
1,866.9
$
FY15 Ranges
Low
High
Total RC Fees
354.0
$
392.3
$
850.0
$
946.9
$
1,007
$
1,030
$
% RC Growth
5%
11%
7%
11%
6%
9%
Total ED Fees
57.9
$
48.8
$
155.5
$
155.6
$
~$153M
Low
High
Sales
3%
4%
6%
5%
5%
7%
Key
Losses
-1%
-1%
-1%
-1%
-1%
-1%
Revenue
Net New Business
2%
3%
5%
4%
4%
6%
Drivers
Internal growth
3%
5%
2%
5%
1%
2%
(Recurring)
Recurring (Excluding Acquisitions)
5%
8%
7%
9%
5%
8%
Acquisitions
0%
3%
0%
2%
1%
1%
Total Recurring
5%
11%
7%
11%
6%
9%
Low
High
Key
Recurring, Net (d)
2%
6%
4%
6%
3%
5%
Revenue
Event-Driven
3%
-1%
1%
0%
0%
0%
Drivers
Distribution
4%
-1%
3%
0%
2%
2%
(Total)
TOTAL
9%
4%
8%
6%
5%
7%
(a) Acquired and Emerging includes fee revenues from acquisitions (i.e. Access Data, NewRiver,
Matrix, Transfer Agency, Forefield, Bonaire and Emerald) and the portfolio of emerging products (i.e. Tax Managed Services, Vote Recommendations, and Class Actions).
(b) Other includes other event-driven fee revenues such as corporate actions and
development. (c) Total Distribution Revenues primarily include pass-through
revenues related to the physical mailing of Proxy, Interims, Transaction Reporting, and Fulfillment as well as Matrix administrative services.
(d) Recurring, Net includes contribution from Net New Business, Internal Growth, and
Acquisitions |
 20
©
2014 |
SPS Key Segment Revenue Stats
RC= Recurring
ED= Event-Driven
In millions
4Q13
4Q14
FY13
FY14
Type
Equity
Transaction-Based (a)
Equity Trades
31.6
$
31.7
$
126.5
$
133.1
$
RC
Internal Trade Volume
896
909
844
946
Internal Trade Growth
6%
1%
-6%
12%
Trade Volume (Average Trades per Day in '000)
944
921
903
964
Non-Transaction
Other Equity Services (b)
112.8
113.8
428.0
$
447.6
$
RC
Total Equity
144.4
$
145.5
$
554.5
$
580.7
$
Fixed Income
Transaction-Based (a)
Fixed Income Trades
15.1
$
14.2
$
56.5
$
57.5
$
RC
Internal Trade Volume
316
294
303
297
Internal Trade Growth
3%
-7%
1%
-2%
Trade Volume (Average Trades per Day in '000)
318
301
304
300
Non-Transaction
Other Fixed Income Services
13.7
$
14.4
$
49.5
$
56.6
RC
Total Fixed Income
28.8
$
28.6
$
106.0
$
114.1
$
Total Net Revenue as reported - GAAP
173.2
$
174.1
$
660.5
$
694.8
$
FY15 Ranges
Low
High
Sales
10%
9%
6%
9%
7%
8%
Losses
-3%
-6%
-2%
-4%
-4%
-4%
Key
Net New Business
7%
3%
4%
5%
3%
4%
Revenue
Internal growth
-3%
-2%
-4%
0%
-1%
0%
Drivers
Acquisitions
0%
0%
1%
0%
0%
0%
TOTAL
4%
1%
1%
5%
2%
4%
(b) Includes BPO clients.
(a) Trades do not include clients under BPO and fixed contracts.
|
 21
©
2014 |
Broadridge ICS Definitions
Proxy
Equities -
Refers to the proxy services we provide in connection with annual stockholder meetings for
publicly traded corporate issuers. Annual meetings of public Mutual Funds
- Refers to the proxy services we provide for funds, classes or trusts of an
investment company. Mutual Funds are not required to have annual meetings.
As a result, mutual fund proxy services are driven by a "triggering event".
These triggering events can be a change in directors, fee structures, investment restrictions,
or mergers of funds.
Contests -
Refers to the proxy services we provide when a separate proxy agenda is put forth by one or
more stockholders that are generally in opposition to the proposals presented by
management of the company. Specials -
Refers to the proxy services we provide in connection with non-routine stockholder
meetings held outside of the normal annual meeting cycle and are primarily driven by
special events (e.g., business combinations in which the company being acquired is a public company and therefore needs the approval of its
stockholders).
Interims
Mutual
Fund
Annual/Semi-Annual/Prospectuses
Mutual
Funds
(Supplemental
Prospectuses)
in an annual mutual fund prospectus (e.g., change in portfolio managers, closing funds or
class of shares to investors, or restating or clarifying items in the original
prospectus). The events could occur at any time throughout the year.
Other –
Refers generally to marketing communications provided to stockholders including newsletters,
investor education materials and other information not required to be distributed by
regulation. Transaction Reporting
Transactions
Reporting–
delivery and archival services.
Fulfillment
Post-Sale
Fulfillment
investors in connection with purchases of securities.
Pre-Sale
Fulfillment
stockholders and other targeted recipients on behalf of broker-dealers, mutual fund
companies and 401(k) administrators. Emerging, Acquired, and Other Communications
Emerging –
Refers to the services provided by our emerging products portfolio (e.g. Tax Services, Vote
Recommendations, and Class Actions) Acquired –
Refers to the services provided by our acquisitions portfolio (e.g. Access Data, NewRiver,
Matrix, Transfer Agency, Forefield, Bonaire, and Emerald Connect) Other –
Refers to the services we provide in connection with communication material not included in
the above definitions such as non-objecting beneficial owners (NOBO) list, and
corporate actions such as tender offer transactions. Refers to the distribution of
marketing literature, welcome kits, enrollment kits, and investor information to prospective investors, existing
Refers primarily to the distribution of mutual fund prospectuses, offering documents, and
required regulatory disclosure information to Refers primarily
to the printing and distribution of account statements and trade confirmations to account holders, including electronic
Refers primarily to information required to be provided by mutual funds to supplement
information previously provided distribute periodically to
their investors. These reports contain pertinent information such as holdings, fund performance, and other required disclosures.
Refers to the services we provide investment companies in connection with information they
are required to companies include shares held in "street
name" (meaning that they are held of record by brokers or banks, which in turn hold the shares on behalf of their
clients, the ultimate beneficial owners) and shares held in "registered name" (shares
registered in the name of their beneficial owners). –
–
–
– |