Attached files
| file | filename |
|---|---|
| 8-K - 8-K - HMS HOLDINGS CORP | a14-18679_18k.htm |
| EX-99.1 - EX-99.1 - HMS HOLDINGS CORP | a14-18679_1ex99d1.htm |
Exhibit 99.2
|
|
Q2 2014 Investor Call August 8, 2014 |

|
|
Safe Harbor Statement This presentation contains “forward-looking statements” within the meaning of the U.S. Private Securities Litigation Reform Act of 1995 These forward-looking statements are based on current expectations, estimates, assumptions and projections that are subject to change. Should known or unknown risks or uncertainties materialize, or should underlying assumptions prove inaccurate, our actual results could differ materially from past results and those anticipated, estimated or projected. Forward-looking statements can be identified by words such as “anticipates,” “estimates,” “expects,” “projects,” “intends,” “plans,” “believes,” “will,” “target,” “seeks,” “forecast” and similar expressions and references to guidance. In particular, these include statements relating to future actions, business plans, objectives and prospects, and future operating or financial performance. We caution you therefore against relying on any of these forward-looking statements. Risks that could have a negative impact on our business, results of operations and financial condition include, without limitation, the risk factors set forth below and the following risk factors: (i) variations in our results of operations; (ii) changes in the U.S. healthcare environment and steps we take in anticipation of such changes; (iii) regulatory, budgetary or political actions that affect procurement practices; (iv) our ability to retain clients or the loss of one or more major clients, including through our failure to procure or reprocure a current or future contract or related delays, or the reduction in scope or early termination of one or more of our significant contracts; (v) our ability to effectively manage our growth to execute on our business plans and to achieve our guidance, including but not limited to achieving non-Medicare margin expansion; (vi) the negative or reduced growth rate of spending on Medicaid/Medicare, simplification of the healthcare payment process or programmatic changes that diminish the scope of benefits; (vii) whether CMS will support the RAC program; (viii) client dissatisfaction or early termination of contracts triggering significant costs or liabilities; (ix) the development by competitors of new or superior products or services; (x) the emergence of new competitors, or the development by our clients of in-house capacity to perform the services we offer; (xi) all the risks inherent in the development, introduction, and implementation of new products and services; (xii) our failure to comply with laws and regulations governing health data or to protect such data from theft and misuse; (xiii) our ability to maintain effective information systems and protect them from damage or interruption; (xiv) restrictions on our ability to bid on/perform certain work due to other work we currently perform; (xv) our ability to successfully integrate our acquisitions; (xvi) our ability to continue to secure contracts through the competitive bidding process and to accurately predict the cost and time to complete such contracts; (xvii) our compliance with the covenants and obligations under the terms of our credit facility and our ability to generate sufficient cash to cover our interest and principal payments thereunder; (xviii) negative results of government or client reviews, audits or investigations to verify our compliance with contracts and applicable laws and regulations; (xix) the impact of lawsuits, including our ability to prevail on appeals or to recover attorney’s fees or expenses, or claims related to contracts, subcontracts, employment matters or compliance with laws and regulations; (xx) our failure to properly remediate any future weaknesses or deficiencies or maintain proper and effective controls; and (xxi) the potential that we are unable to meet our liquidity needs. A more detailed description of each of these and other risk factors can be found under the caption “Risk Factors” in our most recent Annual Report on Form 10-K, filed with the SEC on March 3, 2014. The risks described in our Annual Report on Form 10-K, as updated by our quarterly reports on Form 10-Q, are not the only risks facing our Company. Additional risks and uncertainties not currently known to us, or that we currently deem to be immaterial, may also materially adversely affect our business, financial condition and/or operating results. Use of Non-GAAP Measures This presentation contains non-GAAP measures. A reconciliation of these measures to GAAP measures is set forth in our press release issued on August 8, 2014, which is available under the Investor Relations Tab on the Company’s website (www.hms.com). |
|
|
Discussion Outline Page Q2 Financial Results 1-3 Medicaid Enrollment 4 Commercial Growth 5 Summary 6 |
|
|
Consolidated Statements of Income 1 ($ in thousands, except per share amounts) Three months ended 30-Jun-14 vs. Q2 2013 vs. Q1 2014 Total Revenue w/o CMS RAC $105,308 6% 12% Total Revenue $112,561 (11%) 8% Cost of services expenses 82,095 (7%) 2% Selling, general & administrative expenses 17,908 7% 9% Total operating expenses 100,003 (5%) 3% Operating income 12,558 (38%) 61% Net interest and other income/(expense) (1,927) (41%) (6%) Income before income taxes 10,631 (38%) 85% Income taxes 4,593 (31%) 92% Net income $6,038 (42%) 80% Net income per diluted share $0.07 (42%) 75% Diluted adjusted EPS $0.14 (30%) 27% Weighted average common shares, diluted 88,092 (1%) - |
|
|
Market and Product Revenue Variance COB business grew 9% year-over-year and 16% compared to last quarter Medicaid expansion is having a positive impact on the state government business Commercial revenue continued its growth trajectory to 14% year-over-year and 20% compared to last quarter as new implementations come on line Revenue without Medicare RAC grew 6% year-over-year and 12% compared to last quarter. With other implementations coming on line, visibility for 2nd half of the year has improved 2 14Q2 13Q2 14Q2 14Q1 Total Revenue by Payer Type Act Act $ % Act Act $ % State Government 55,091 53,193 1,898 3.6% 55,091 51,964 3,127 6.0% Commercial 44,443 39,139 5,305 13.6% 44,443 36,924 7,520 20.4% Other 5,773 6,681 (908) -13.6% 5,773 5,221 552 10.6% Total Revenue w/o Medicare RAC 1 105,308 99,013 6,295 6.4% 105,308 94,109 11,199 11.9% CMS RAC 7,253 26,795 (19,542) -72.9% 7,253 10,598 (3,345) -31.6% Total HMS Revenue 112,561 125,808 (13,247) -10.5% 112,561 104,707 7,854 7.5% 14Q2 13Q2 14Q2 14Q1 Total Revenue by Product Line Act Act $ % Act Act $ % Coordination of Benefits (COB) 77,588 71,339 6,249 8.8% 77,588 66,804 10,785 16.1% Program Integrity 1 27,719 27,673 46 0.2% 27,719 27,306 414 1.5% Total Revenue w/o CMS RAC 105,308 99,013 6,295 6.4% 105,308 94,109 11,199 11.9% 1 Excludes Medicare RAC revenue Variance Variance Revenue YOY Variance QTR 2 Revenue Sequential Variance QTR 2 Variance Variance |
|
|
Q2 State Government Sales 3 |
|
|
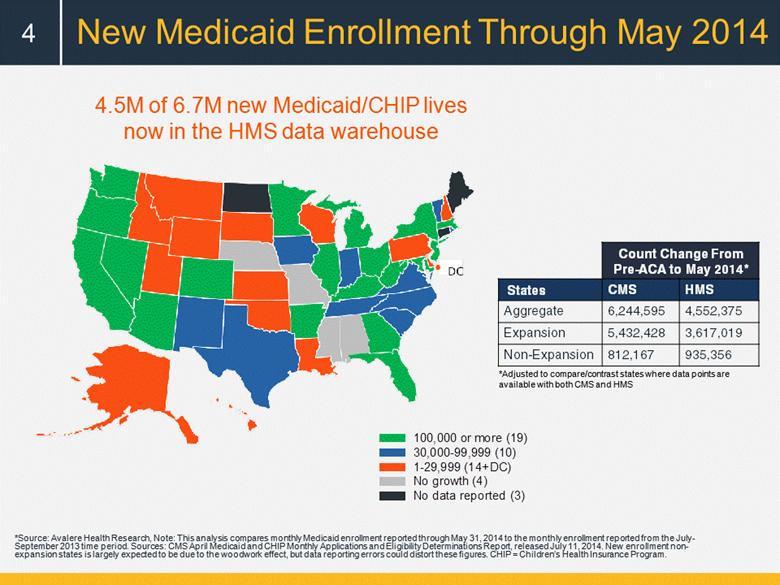
New Medicaid Enrollment Through May 2014 4 4.5M of 6.7M new Medicaid/CHIP lives now in the HMS data warehouse *Adjusted to compare/contrast states where data points are available with both CMS and HMS *Source: Avalere Health Research, Note: This analysis compares monthly Medicaid enrollment reported through May 31, 2014 to the monthly enrollment reported from the July-September 2013 time period. Sources: CMS April Medicaid and CHIP Monthly Applications and Eligibility Determinations Report, released July 11, 2014. New enrollment non-expansion states is largely expected to be due to the woodwork effect, but data reporting errors could distort these figures. CHIP = Children’s Health Insurance Program. Count Change From Pre-ACA to May 2014* States CMS HMS Aggregate 6,244,595 4,552,375 Expansion 5,432,428 3,617,019 Non-Expansion 812,167 935,356 100,000 or more (19) 30,000-99,999 (10) 1-29,999 (14+DC) No growth (4) No data reported (3) |
|
|
Growing Commercial Footprint 5 $1.50 - $6.50 Per Member Per Year HMS added products to 7.8 million lives in Q2 (~11% of 70+ million lives under contract) Credit Balance Audits Coordination of Benefits Fraud, Waste, and Abuse Clinical Audit Services 72% 1% 9% 18% |
|
|
Summary 6 CMS initiates limited restart to existing Medicare RAC contracts; timing of awards remains uncertain Medicaid growth continues to fuel commercial and government revenue Continued growth in commercial sales Coordination of Benefits resumes healthy growth On track to meet 2014 non-Medicare RAC growth targets 10-11% revenue growth 5-6% margin improvement |
|
|
[LOGO] |