Attached files
| file | filename |
|---|---|
| EX-99.2 - TIAA REAL ESTATE ACCOUNT | c78173_ex99-2.htm |
| 8-K - TIAA REAL ESTATE ACCOUNT | c78173_8k.htm |
Exhibit 99.1
| TIAA Retirement Annuity Accounts | |||
| TIAA Real Estate Account | |||
| Real Estate | As of 6/30/2014 | ||
| Portfolio Net Assets | Inception Date | Estimated Annual Expenses1 2 | |
| $18.3 Billion | 10/02/1995 | 0.87% | |
Portfolio Strategies
This variable annuity account seeks favorable long-term returns primarily through rental income and appreciation of real estate and real estate-related investments owned by the Account. The Account will also invest in non-real estate-related publicly traded securities and short-term higher quality liquid investments that are easily converted to cash to enable the Account to meet participant redemption requests, purchase or improve properties or cover other expenses. The Account intends to have between 75% and 85% of its net assets invested directly in real estate or real estate-related assets with the goal of producing favorable long-term returns. The Account’s principal strategy is to purchase direct ownership interests in income-producing real estate, primarily office, industrial, retail and multi-family residential properties. The Account may also make foreign real estate investments. Under the Account’s investment guidelines, investments in direct foreign real estate, together with foreign real estate-related securities and foreign non-real estate-related liquid investments may not comprise more than 25% of the Account’s net assets. The Account will invest the remaining portion of its assets (targeted between 15% and 25% of net assets) in publicly traded, liquid investments.
Learn More
For more information please contact:
800 842-2252
Weekdays 8 a.m. to 10 p.m. ET,
Saturdays 9 a.m. to 6 p.m. ET,
or visit tiaa-cref.org
Performance
| Total Return | Average Annual Total Return | |||||||||||||
| 3 Months | YTD | 1 Year | 3 Years | 5 Years | 10 Years | Since Inception | ||||||||
| TIAA Real Estate Account | 3.32% | 5.73% | 10.98% | 10.22% | 7.45% | 4.95% | 6.26% | |||||||
The returns quoted represent past performance, which is no guarantee of future results. Returns and the principal value of your investment will fluctuate. Current performance may be higher or lower than that shown, and you may have a gain or a loss when you redeem your mutual fund shares. For current performance information, including performance to the most recent month-end, please visit tiaa-cref.org, or call 800 842-2252. Performance may reflect waivers or reimbursements of certain expenses. Absent these waivers or reimbursement arrangements, performance may be lower.
| 1 | Expenses are estimated each year based on projected expense and asset levels. Differences between actual expenses and the estimate are adjusted quarterly and are reflected in current investment results. Historically, adjustments have been small. |
| 2 | The Account’s total annual expense deduction appears in the Account’s prospectus, and may be different than that shown herein due to rounding. Please refer to the prospectus for further details. |
Hypothetical Growth of $10,000
| The chart illustrates the performance of a hypothetical $10,000 investment on June 30, 2004 and redeemed on June 30, 2014. | 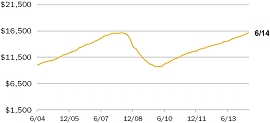 | ||
| — TIAA Real Estate Account | $16,219 | ||
The total returns are not adjusted to reflect sales charges, the effects of taxation or redemption fees, but are adjusted to reflect actual ongoing expenses, and assume reinvestment of dividends and capital gains, net of all recurring costs.
| Properties by Type | (As of 6/30/2014) | Properties by Region | (As of 6/30/2014) | |
| % of Real Estate Investments3 4 | % of Real Estate Investments3 5 | |||
| Office | 42.1 | East | 38.0 | |
| Apartment | 23.9 | West | 35.7 | |
| Retail | 17.3 | South | 23.1 | |
| Industrial | 12.7 | Foreign | 1.7 | |
| Other | 4.0 | Midwest | 1.5 | |
 |
3 | Wholly-owned properties are represented at fair value and gross of any debt, while joint venture properties are represented at the net equity value. |
| 4 | Other properties represents interest in Storage Portfolio investment, a fee interest encumbered by a ground lease real estate investment and a land development. | |
| 5 | Foreign property represents real estate investment in France. | |
Please refer to the next page for important disclosure information.
| TIAA Retirement Annuity Accounts | |
| TIAA Real Estate Account | |
| Real Estate | As of 6/30/2014 |
| Portfolio Composition | (As of 6/30/14) |
| Investments by Type | % of Net Assets |
| Real Estate Properties | 59.2% |
| Real
Estate Joint Venture And Limited Partnerships |
16.5% |
| Short Term Investments | 15.0% |
| Marketable Securities Real Estate Related | 9.2% |
| Other (Net Receivable/Liability) | 0.1% |
| Top 10 Holdings6 | (As of 6/30/14) |
| % of Total Investments7 | |
| 1001 Pennsylvania Avenue | 3.8% |
| 50 Fremont Street | 2.7% |
| The Florida Mall | 2.6% |
| 99 High Street | 2.3% |
| Fourth and Madison | 2.1% |
| 425 Park Avenue | 2.0% |
| DDR | 2.0% |
| 501 Boylston Street | 1.9% |
| 780 Third Avenue | 1.9% |
| Ontario Industrial Portfolio | 1.6% |
Market Recap
US economy back on track, real estate market fundamentals maintain momentum
The U.S. economy appears to have gained momentum in the second quarter following a disappointing first quarter when Gross Domestic Product (GDP) declined 2.9%. The Bureau of Labor Statistics reported that 816,000 jobs were added during the second quarter, a sizeable increase from first quarter’s 569,000 jobs. Job gains were broad-based and even the government sector contributed to growth. Overall, monthly job growth averaged a robust 272,000 during the quarter which contributed to a decline in the unemployment rate to 6.1% as of June, the lowest rate since 2008.
Job growth among office-using employment sectors such as finance and professional and business services contribute to the demand for office space. More recently, the high-tech industry has also become a key demand driver but is more difficult to quantify because it spans employment sectors as diverse as manufacturing, information and professional and business services. Financial services employment increased strongly during the quarter; 34,000 jobs were added as compared to 9,000 during first quarter 2014. Growth in professional and business services also accelerated; 197,000 jobs were added as compared to 178,000 previously.
The labor market’s strong performance supported a decline in the national office vacancy rate to 14.5% from 14.8% in the first quarter as reported by CB Richard Ellis Econometric Advisors (CBRE-EA). Vacancy rate improvements were wide-spread across the country, but tech- and energy-oriented markets generally recorded the strongest improvements. Overall, vacancy rates declined in 45 of the 63 markets tracked by CBRE-EA.
The national industrial market similarly benefited from the increase in economic activity. Preliminary data from CBRE-EA indicate that the national availability rate declined to 10.8% in the second quarter from 11.1% previously. This represented the 16th consecutive quarterly improvement for the sector. Overall, availability rates declined in 42 of the 61 markets tracked by CBRE-EA.
Apartment market conditions continued to strengthen when the national vacancy rate declined to 4.4% from 4.6% in the second quarter of 2013. (The seasonality inherent in apartment leasing dictates a year-over-year comparison). The annual average vacancy rate has trended well below the 20-year historical average and rents have surpassed their pre-recession peak in many markets. Together these factors have triggered an increase in construction nation-wide.
Retail sales appear to have mostly recovered in the second quarter following the harsh winter weather of the first quarter. Retail sales excluding automobiles and parts increased 1.8% during the second quarter as compared to the first quarter and 3.5% compared with second quarter 2013. National retail market conditions continued to slowly improve during the quarter when the availability rate among neighborhood and community centers ticked down to 11.7% from 11.9% previously.
| Important Information | |
| 6 | The top 10 holdings are subject to change and may not be representative of the account’s current or future investments. The holdings listed only include the account’s long-term investments. Money market instruments and/or futures contracts, if applicable, are excluded. The holdings do not include the account’s entire investment portfolio and should not be considered a recommendation to buy or sell a particular security. |
| 7 | Value as reported in the June 30, 2014 Statement of Investments. Investments owned 100% by the Account are reported based on fair value. Investments in joint ventures are reported at fair value and are presented at the Account’s ownership interest. |
| This property, 1001 Pennsylvania Avenue, is presented
gross of debt. The value of the Account’s interest less the fair value of leverage is $452.5 million. This property, 50 Fremont Street, is presented gross of debt. The value of the Account’s interest less the fair value of leverage is $347.0 million. | |
| This property, The Florida Mall, is a 50% / 50% joint venture with Simon Property Group, L.P. and is presented net of debt. As of June 30, 2014 this debt had a fair value of $190.1 million. | |
| This property, 99 High Street, is presented gross of
debt. The value of the Account’s interest less the fair value of leverage is $277.1 million. This property, Fourth and Madison, is presented gross of debt. The value of the Account’s interest less the fair value of leverage is $244.0 million. | |
| This property is held in a 85% / 15% joint venture with Developers Diversified Realty Corporation (“DDR”), and consists of 27 retail properties located in 12 states and is presented net of debt. As of June 30, 2014 this debt had a fair value of $689.4 million. | |
| This property, 780 Third Avenue, is presented gross of debt. The value of the Account’s interest less the fair value of leverage is $217.2 million. | |
| Real estate investment portfolio turnover rate was 2.10% for the year ended 12/31/2013. Real estate investment portfolio turnover rate is calculated by dividing the lesser of purchases or sales of real estate property investments (including contributions to, or return of capital distributions received from, existing joint venture and limited partnership investments) by the average value of the portfolio of real estate investments held during the period. |
Continued on next page…
| TIAA Retirement Annuity Accounts | |
| TIAA Real Estate Account | |
| Real Estate | As of 6/30/2014 |
Marketable securities portfolio turnover rate was 8.36% for the year ended 12/31/2013. Marketable securities portfolio turnover rate is calculated by dividing the lesser of purchases or sales of securities, excluding securities having maturity dates at acquisition of one year or less, by the average value of the portfolio securities held during the period.
Teachers Insurance and Annuity Association of America (TIAA), New York, NY, issues annuity contracts and certificates.
Investment, insurance and annuity products: are not FDIC insured, are not bank guaranteed, are not deposits, are not insured by any federal government agency, are not a condition to any banking service or activity and may lose value.
TIAA-CREF Individual & Institutional Services, LLC and Teachers Personal investors Services, Inc., members FINRA, distribute securities products.
THIS MATERIAL MUST BE PRECEDED OR ACCOMPANIED BY A CURRENT PROSPECTUS FOR THE TIAA REAL ESTATE ACCOUNT. PLEASE CAREFULLY CONSIDER THE INVESTMENT OBJECTIVES, RISKS, CHARGES, AND EXPENSES BEFORE INVESTING AND CAREFULLY READ THE PROSPECTUS. ADDITIONAL COPIES OF THE PROSPECTUS CAN BE OBTAINED BY CALLING 877-518-9161.
A Note About Risks
In general, the value of the TIAA Real Estate Account will fluctuate based on the underlying value of the direct real estate or real estate-related securities in which it invests.
The risks associated with investing in the Real Estate Account include the risks associated with real estate ownership including among other things fluctuations in property values, higher expenses or lower income than expected, risks associated with borrowing and potential environmental problems and liability, as well as risks associated with participant flows and conflicts of interest. For a more complete discussion of these and other risks, please consult the prospectus.
©2014 Teachers Insurance and Annuity Association of America-College Retirement Equities Fund (TIAA-CREF), 730 Third Avenue, New York, NY 10017
C17363