Attached files
| file | filename |
|---|---|
| 8-K - FORM 8-K - STEWART INFORMATION SERVICES CORP | v374250_8k.htm |

Spring 2014 Investor Presentation Stewart Information Services Corporation

2 Forward - looking Statements Certain statements in this presentation are "forward - looking statements" within the meaning of the Private Securities Litigation Reform Act of 1995 . Such forward - looking statements relate to future, not past, events and often address our expected future business and financial performance . These statements often contain words such as "expect," "anticipate," "intend," "plan," "believe," "seek," "will" or other similar words . Forward - looking statements by their nature are subject to various risks and uncertainties that could cause our actual results to be materially different than those expressed in the forward - looking statements . These risks and uncertainties include, among other things, the severity and duration of current financial and economic conditions ; continued weakness or further adverse changes in the level of real estate activity ; changes in mortgage interest rates, existing and new home sales, refinancing of current loans, and availability of mortgage financing that affect the demand for our title insurance products ; our ability to respond to and implement technology changes, including the completion of the implementation of our enterprise systems ; the impact of unanticipated title losses on the need to further strengthen our policy loss reserves ; any effect of title losses on our cash flows and financial condition ; the impact of our increased diligence and inspections in our agency operations ; changes to the participants in the secondary mortgage market ; the effect of class actions and other litigation matters ; regulatory non - compliance, fraud or defalcations by our title insurance agents or employees ; our ability to timely and cost - effectively respond to significant industry changes and introduce new products and services ; the impact of changes in governmental and insurance regulations, including any future reductions in the pricing of title insurance products and services ; our dependence on our operating subsidiaries as a source of cash flow ; customers finding other sources of suppliers ; the continued realization of expected expense savings resulting from our expense reduction steps ; our ability to access the equity and debt financing markets when and if needed ; our ability to grow our international operations ; and our ability to respond to the actions of our competitors . These risks and uncertainties, as well as others, are discussed in more detail in our documents filed with the Securities and Exchange Commission, including our Annual Report on Form 10 - K for the year ended December 31 , 2013 , and our Current Reports on Form 8 - K . We expressly disclaim any obligation to update any forward - looking statements contained in this presentation to reflect events or circumstances that may arise after the date hereof, except as may be required by applicable law .
3 Non - GAAP Disclosures This presentation may contain certain financial measures that are not presented in accordance with generally accepted accounting principles (GAAP), including but not limited to, losses and litigation expenses arising from non - predictable title losses and adjusted pretax title margin, which is adjusted to exclude net realized investment gains or losses and reserve adjustments . Although these exclusions represent actual gains, losses or expenses to the Company, they may mask the periodic income and financial and operating trends associated with the Company’s business . The Company is presenting these non - GAAP financial measures because they provide the Company’s management and investors with additional insight into the operational performance of the Company relative to earlier periods and relative to the Company’s competitors . The Company does not intend for these non - GAAP financial measures to be a substitute for any GAAP financial information . In this presentation these non - GAAP financial measures have been presented with, and reconciled to, the most directly comparable GAAP financial measures . Investors should use these non - GAAP financial measures only in conjunction with the comparable GAAP financial measures .

4 Investment Highlights • Trusted provider in $12+ billion domestic industry • Well positioned to capitalize on the ongoing real estate recovery and heightened regulatory environment • Streamlined organizational structure and responsive corporate strategy to grow revenue, reduce fixed costs and enhance margins • Continued diversification into complementary real estate services with counter and non - cyclical components • Title losses returning to historical average loss ratios • Increasing premium rates, improving remittance percentages and diversified revenue sources bolster profitability going forward

5 Full Year 2013 Financial Highlights • Pretax earnings were $101.1 million in 2013, up from $89.3 million in 2012. • Net earnings attributable to Stewart were $63.0 million ($2.60 per share) in 2013, down from $109.2 million ($4.61 per share) in 2012. Of note, both years benefited from the release of deferred tax asset valuation allowances, $10.3 million ($0.42 per share) in 2013 and $36.3 million ($1.50 per share) in 2012. • Operating revenues increased $17.6 million (1.3%) in 2013 over 2012, as increased revenues from title operations (up $65.5 million) offset a decline in mortgage services revenues (down $40.9 million). • Commercial revenues were up 13.3% to $137.5 million. • Fitch upgraded Stewart’s Insurer Financial Strength (IFS) rating to A - from BBB+ (Outlook Stable).

6 Income Statement (non - GAAP) 2013 2012 % Change 2013 2012 % Change Revenues Direct 179,515 193,555 -7.3% 750,031 723,539 3.7% Agency 242,235 278,333 -13.0% 1,046,378 1,007,380 3.9% Total Title Revenue 421,750 471,888 -10.6% 1,796,409 1,730,919 3.8% Mortgage Services 23,366 43,668 -46.5% 117,145 158,107 -25.9% Total Operating Revenues 445,116 515,556 -13.7% 1,913,554 1,889,026 1.3% Investment Income/Other Gains 5,096 5,417 -5.9% 14,426 21,386 -32.5% Total Revenues 450,212 520,973 -13.6% 1,927,980 1,910,412 0.9% Agency Retention (191,848) (227,743) -15.8% (848,437) (829,070) 2.3% Net Revenues 258,364 293,230 -11.9% 1,079,543 1,081,342 -0.2% Expenses Employee Costs 140,666 144,902 -2.9% 571,026 542,461 5.3% Other Operating Expenses 70,380 80,003 -12.0% 280,259 286,496 -2.2% Title Losses 25,956 35,989 -27.9% 106,318 140,030 -24.1% Depreciation 5,199 4,359 19.3% 17,920 17,783 0.8% Interest Expense 697 1,288 -45.9% 2,956 5,235 -43.5% Total Expenses 242,898 266,541 -8.9% 978,479 992,005 -1.4% Earnings Earnings Before Taxes and Noncontrolling Interests 15,466 26,689 101,065 89,339 Income Tax 4,445 37,906 (28,481) 29,639 Noncontrolling Interests (2,398) (2,834) (9,558) (9,795) Net Income (Loss) 17,512 61,761 63,026 109,183 Net Margin 3.9% 11.9% 3.3% 5.7% Per Share Net Income (Loss) Per Share - Diluted 0.72 2.56 2.60 4.61 Net Income (Loss) Per Share - Basic 0.78 3.20 2.85 5.66 Three Months Ended December Full Year

7 Balance Sheet December December 2013 2012 Assets Cash & Cash Equivalents 178,788 196,471 Statutory Reserve Funds 466,065 456,646 Investments - Short Term 38,336 37,025 Investments - Other 86,779 58,680 Other Assets 311,203 314,385 Goodwill & Intangibles 244,888 227,970 Total Assets 1,326,059 1,291,177 Liabilities Notes Payable 5,827 6,481 Convertible Senior Notes 27,119 64,687 Loss Reserves 506,888 520,375 Other Liabilities 123,135 119,262 Total Liabilities 662,970 710,805 Equity Total Shareholders' Equity 663,089 580,372 Total Liabilities and Shareholders' Equity Total Liabilities and Shareholders' Equity 1,326,059 1,291,177 Other Return on Equity, TTM* 9.5% 18.8% Debt-to-Equity 4.7% 12.3% Book Value/Share 29.47 29.91 Tangible Book Value/Share 18.59 18.16 * ROE for periods above include effect of non-recurring tax benefit of $10.3 million in 4Q 2013 and $36.6 million in 4Q 2012. Debt levels will be managed so as not to exceed rating agency guidelines of maximum debt-to-tangible capital of 30%.
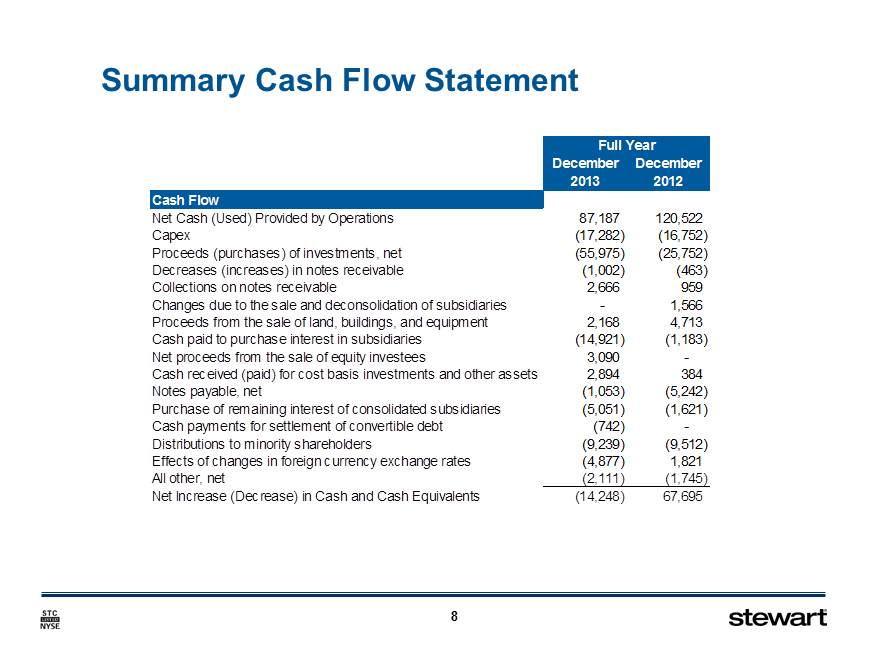
8 Summary Cash Flow Statement December December 2013 2012 Cash Flow Net Cash (Used) Provided by Operations 87,187 120,522 Capex (17,282) (16,752) Proceeds (purchases) of investments, net (55,975) (25,752) Decreases (increases) in notes receivable (1,002) (463) Collections on notes receivable 2,666 959 Changes due to the sale and deconsolidation of subsidiaries - 1,566 Proceeds from the sale of land, buildings, and equipment 2,168 4,713 Cash paid to purchase interest in subsidiaries (14,921) (1,183) Net proceeds from the sale of equity investees 3,090 - Cash received (paid) for cost basis investments and other assets 2,894 384 Notes payable, net (1,053) (5,242) Purchase of remaining interest of consolidated subsidiaries (5,051) (1,621) Cash payments for settlement of convertible debt (742) - Distributions to minority shareholders (9,239) (9,512) Effects of changes in foreign currency exchange rates (4,877) 1,821 All other, net (2,111) (1,745) Net Increase (Decrease) in Cash and Cash Equivalents (14,248) 67,695 Full Year

9 Title Insurance Residential • Provides independent, third - party closing and settlement services while acting as a trusted advisor to parties in the real estate transaction • Searching, examining and insuring the condition of the title to real property, thereby providing security of ownership to homeowners • Direct operations in 32 states • Agency operations through roughly 3,000 independent issuing agencies Commercial • Significant presence of commercial expertise in major markets poised for future growth • Strong underwriting expertise and service is extremely valuable in complex commercial transactions • Growing commercial market offers cyclical diversity from residential real estate trends • Fitch upgraded Stewart ’ s Insurer Financial Strength (IFS) rating to A - from BBB+ (Outlook Stable) in August 2013 International • #1 market share in Canadian markets served and presence in the U.K., Continental Europe, Australia, Latin America, Mexico, and the Caribbean • International revenues of $100.6 million in 2013 • Global footprint enables single point of contact for international commercial real estate markets ($10.4 million in 2013)
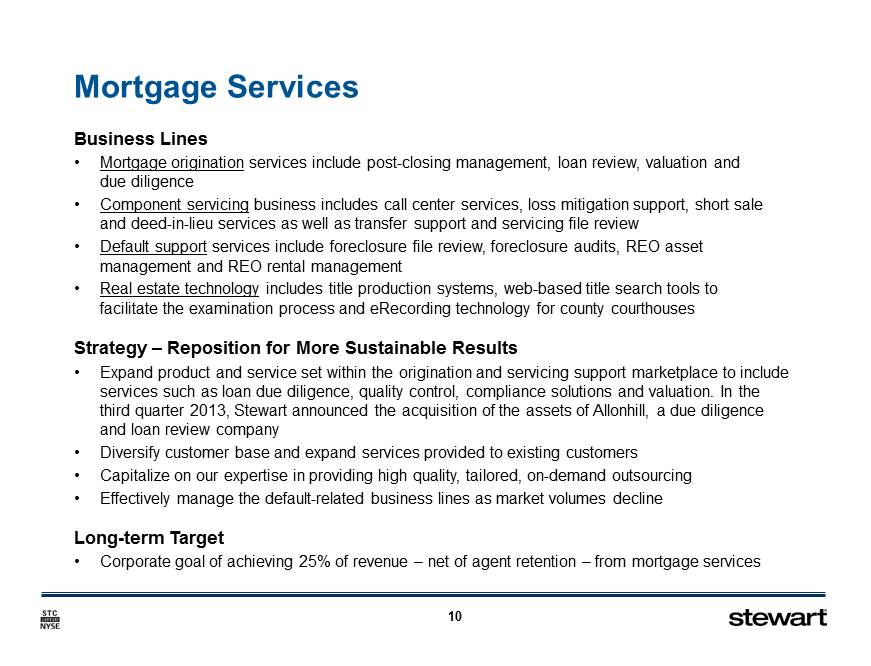
10 Mortgage Services Business Lines • Mortgage origination services include post - closing management, loan review, valuation and due diligence • Component servicing business includes call center services, loss mitigation support, short sale and deed - in - lieu services as well as transfer support and servicing file review • Default support services include foreclosure file review, foreclosure audits, REO asset management and REO rental management • Real estate technology includes title production systems, web - based title search tools to facilitate the examination process and eRecording technology for county courthouses Strategy – Reposition for More Sustainable Results • Expand product and service set within the origination and servicing support marketplace to include services such as loan due diligence, quality control, compliance solutions and valuation. In the third quarter 2013, Stewart announced the acquisition of the assets of Allonhill , a due diligence and loan review company • Diversify customer base and expand services provided to existing customers • Capitalize on our expertise in providing high quality, tailored, on - demand outsourcing • Effectively manage the default - related business lines as market volumes decline Long - term Target • Corporate goal of achieving 25% of revenue – net of agent retention – from mortgage services

11 Revenues and Pre - tax Earnings Trends $ Millions Pre - tax Earnings Revenue ($1,500) ($1,000) ($500) $0 $500 $1,000 $1,500 $2,000 $2,500 2006 2007 2008 2009 2010 2011 2012 2013 $(300) $(200) $(100) $- $100 $200 $300 $400 $500

12 Stewart Operating Revenues Trailing Twelve Months - $ Millions $0 $500 $1,000 $1,500 $2,000 $2,500 '03 '04 '05 '06 '07 '08 '09 '10 '11 '12 '13 Direct Title Agency Title Mortgage Services

13 Direct Title Revenues and Orders Trailing Twelve Months - $ Millions Direct Title Revenue Orders Opened Orders Closed $500 $600 $700 $800 $900 $1,000 $1,100 '03 '04 '05 '06 '07 '08 '09 '10 '11 '12 '13 200,000 400,000 600,000 800,000 1,000,000 Orders Revenue

14 Independent Agency Network • Focus is on quality and profitability over market share growth to reduce risk and consistently improve operational performance. • Leading the industry in assisting independent agencies prepare for Consumer Financial Protection Bureau (CFPB) compliance and enabling them to meet the changing market and regulatory requirements for settlement services providers. • Average annual remittance per agency continues to increase while the key profitability driver, the policy loss ratio, continues to decrease. • Emphasis on capturing a higher percentage of business from current agencies and signing new high - quality agencies in states with conditions favorable to increasing profitability. • Our disciplined approach is achieving the desired results in this important market segment.
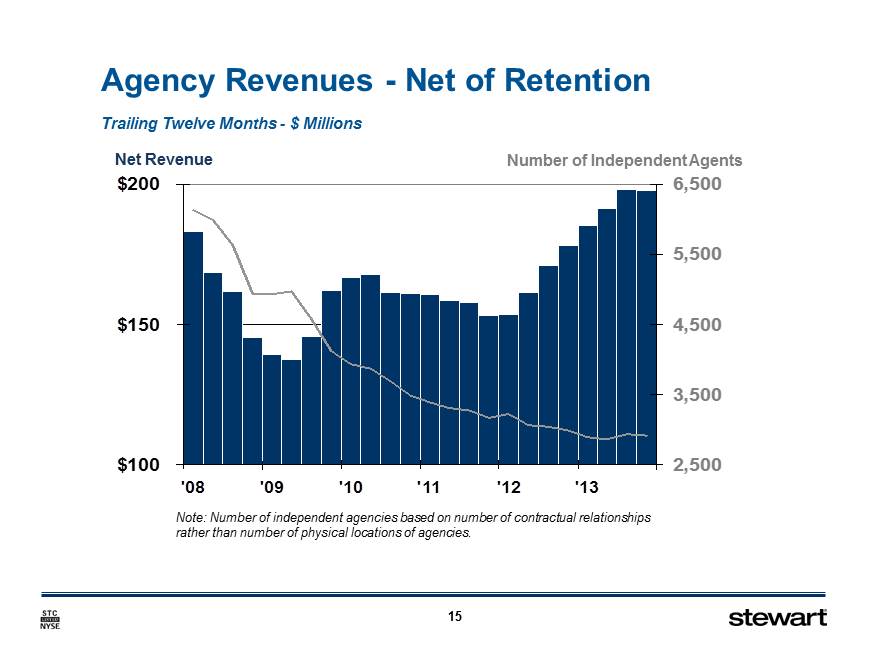
15 Agency Revenues - Net of Retention Number of Independent Agents Note: Number of independent agencies based on number of contractual relationships rather than number of physical locations of agencies. $100 $150 $200 '08 '09 '10 '11 '12 '13 2,500 3,500 4,500 5,500 6,500 Trailing Twelve Months - $ Millions Net Revenue

16 Agency Retention Rates Differences in independent agency retention rates largely driven by geography Source: Form 9 filings for respective underwriters for year ended December 31, 2013. STC retention rates were used in the calculations because competitor rates are not included in SEC or statutory filings. STC FNF FAF Overall Retention Rate 81.2% 78.4% 79.7% Difference from STC -2.8% -1.5% Excluding Florida and California (using STC Retention Rates) 81.4% 83.9% 87.5% Difference from STC 2.5% 6.1%

17 Stewart Mortgage Services Revenues Trailing Twelve Months - $ Millions Note: Years prior to 2012 not restated for change in segment reporting effective with Q4 2012 reporting. Impact in any given year would not be material to revenues. $0 $20 $40 $60 $80 $100 $120 $140 $160 $180 '03 '04 '05 '06 '07 '08 '09 '10 '11 '12 '13 Focused Non - title Revenues and Profits As Mortgage Services transitions to a more sustainable revenue base, both segment revenues and profitability will likely remain depressed over the next several quarters.

18 Title Loss Provision Ratios Quarterly Title Loss Provision Ratios – Includes Prior Year True - ups Source: Company press releases and SEC filings

19 0.0% 2.0% 4.0% 6.0% 8.0% 10.0% 12.0% '01 '02 '03 '04 '05 '06 '07 '08 '09 '10 '11 '12 '13 Ultimate Loss Ratios by Policy Year Actuarial Claims as a % of Net Statutory Premiums Written – U.S. Operations Only Source: ALTA, Family - Company Aggregates Stewart First American Fidelity Claims Paid

20 Market Conditions Positives • Home prices continue to increase – a 5 percent rise in home prices increases revenue per transaction in the mid - 3 percent range • Commercial real estate market remaining solid • Interest rates remain at historically low levels • HARP extension to 2015 • Full benefit of 2013 state pricing increases seen in 2014 Concerns • Mortgage originations expected to fall in 2014 on a material decline in refinance volumes • Uncertain regulatory economic environment: Dodd - Frank, CFPB • J ob growth rates remain muted even as macro trends improve • Potential loss of mortgage interest deduction for homes and tax treatment of commercial real estate

21 0 1 2 3 4 5 6 7 8 '02 '03 '04 '05 '06 '07 '08 '09 '10 '11 '12 '13 '14 U.S. Existing Housing Sales Seasonally Adjusted Annualized Rate – Millions $8,000 Tax Credit Normal Market Bubble Fannie Mae ® February 2014 National Association of REALTORS ® Last Normal Market in 2002

22 2014 Strategic Priorities • Lead the market in providing compliant, trusted and tailored real estate services in concert with changing regulatory environment • Expand commercial market share • Repositioning Mortgage Services to excel in a normalized real estate market • Expanding footprint of direct operations, primarily in western states • Continue rationalizing title production costs through standardization, automation, and centralization

23 CEO Matt Morris CFO Allen Berryman Nat Otis Ted Jones, PhD SVP, Financial Planning & Strategic Analysis Senior Vice President Director of Investor Relations Chief Economist nat.otis@stewart.com ted@stewart.com 713.625.8360 direct 713.625.8014 direct 800.729.1900, extension 8360 800.729.1900, extension 8014

Spring 2014 Investor Presentation Appendix Stewart Information Services Corporation

25 $0.0 $0.5 $1.0 $1.5 $2.0 $2.5 $3.0 '90 '92 '94 '96 '98 '00 '02 '04 '06 '08 '10 '12 '14 $3 $5 $7 $9 $11 $13 $15 $17 Residential Lending Vs. Industry Premiums Forecast Fannie Mae ® February 2014 2011 - 2014 Lending Likely Understates Title Revenues Due to Cash Sales Double Normal Effective Lending – $ Trillions Statutory Title Premiums $ Billions Effective Lending = Purchase Lending + 60 Percent of Refinance Lending Data Sources : Lending = Fannie Mae ® , Title Premiums = CDS Research, Demotech and ALTA ®

26 Stewart Net Operating Revenues Trailing 12 Months - $ Millions $0 $250 $500 $750 $1,000 $1,250 $1,500 '03 '04 '05 '06 '07 '08 '09 '10 '11 '12 '13 Direct Title Agency Net of Retention Mortgage Services

27 Title Revenues by Regulatory Oversight Source: Form 9 filings (Schedule T) as compiled by ALTA

28 $25 $75 $125 $175 $225 '03 '04 '05 '06 '07 '08 '09 '10 '11 '12 '13 Claims Expense vs. Cash Claims Trailing 12 Months - $ Millions Anticipate accruals of 5.5% - 6.0% in 2014, including large claims Claims Expense Cash Claims Paid (Net of Recoveries)

29 Employee Expenses 20% 25% 30% 35% 40% '03 '04 '05 '06 '07 '08 '09 '10 '11 '12 '13 As a Percentage of Operating Revenues Trailing 12 Months
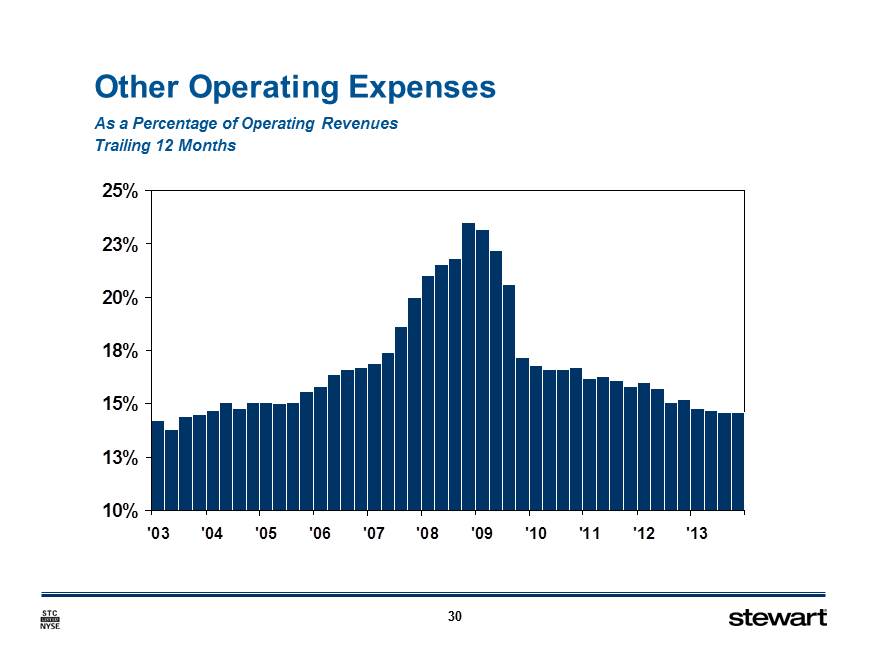
30 Other Operating Expenses 10% 13% 15% 18% 20% 23% 25% '03 '04 '05 '06 '07 '08 '09 '10 '11 '12 '13 As a Percentage of Operating Revenues Trailing 12 Months
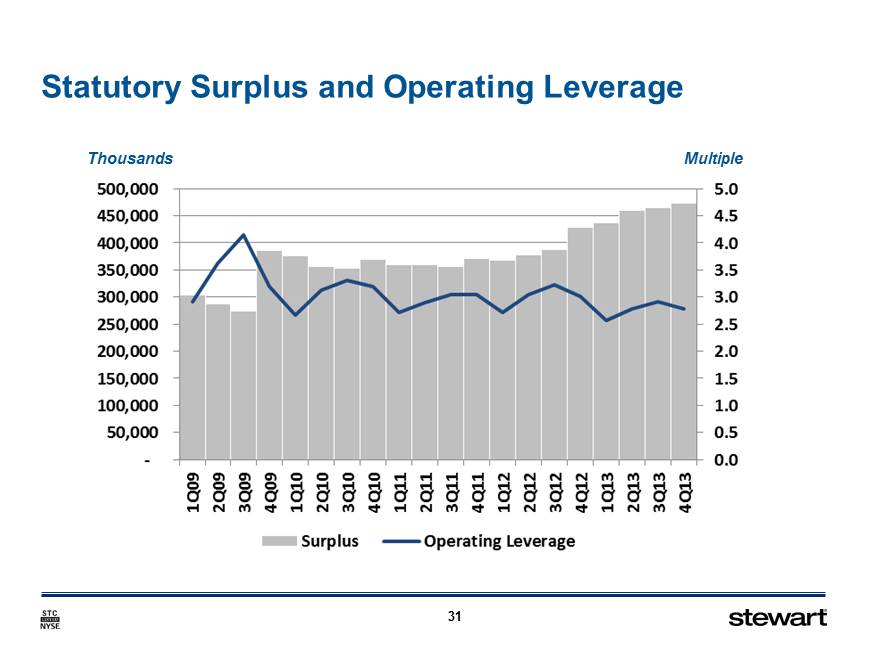
31 Statutory Surplus and Operating Leverage Thousands Multiple

32 Debt - to - Capital and Debt - to - Equity
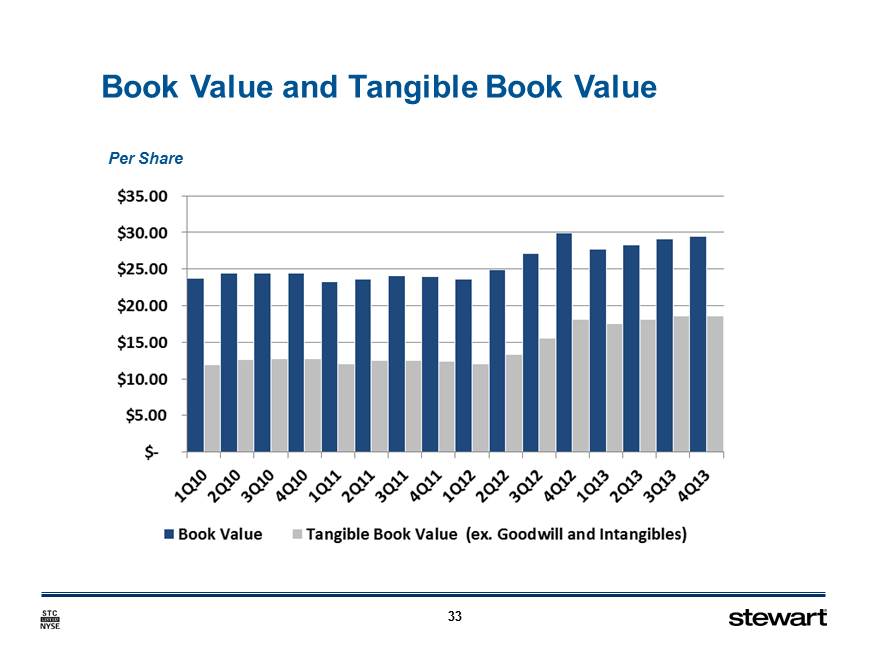
33 Book Value and Tangible Book Value Per Share