Attached files
| file | filename |
|---|---|
| 8-K - FORM 8-K - NEW JERSEY RESOURCES CORP | d691702d8k.htm |
| EX-99.1 - EX-99.1 - NEW JERSEY RESOURCES CORP | d691702dex991.htm |
 Increased Fiscal 2014 NFE Guidance
and Long-Term Financial Goals
March 12, 2014
Exhibit 99.2 |
 Regarding Forward-Looking Statements
1
1
Certain statements contained in this presentation are forward-looking statements within the
meaning of the Private Securities Litigation Reform Act of 1995. Words such as
“anticipates,” “estimates,” “expects,” “projects,”
“may,” "will," “intends,” “expects,” "believes," or “should” and similar expressions may identify forward-looking information and
such forward-looking statements are made based upon management’s current expectations and
beliefs as of this date concerning future developments and their potential effect upon New
Jersey Resources (NJR or the Company). There can be no assurance that future developments will be in accordance with management’s expectations or
that the effect of future developments on NJR will be those anticipated by management. NJR cautions
persons reading or hearing this presentation that the assumptions that form the basis for
forward-looking statements including, but not limited to, certain statements regarding NJR's NFE for fiscal 2014, forecasted contribution of business
segments to fiscal 2014 NFE and to NFE beyond fiscal 2014, NJR’s long-term NFE per
share growth rate goal, and earnings guidance, NJR’s future dividend growth rate and
payout ratio, long-term benefits of increased NFE, the long-term outlook for NJRCEV, diversification of NJRCEV’s strategy, and NJR’s long-term NFE per share growth
rate include many factors that are beyond the Company’s ability to control or estimate precisely,
such as estimates of future market conditions and the behavior of other market
participants. The factors that could cause actual results to differ materially from
NJR’s expectations include, but are not limited to, weather and economic conditions; demographic
changes in the NJNG service territory and their effect on NJNG's customer growth; volatility of
natural gas and other commodity prices and their impact on NJNG customer usage, NJNG's Basic
Gas Supply Service incentive programs, NJRES' operations and on the Company's risk management efforts; changes in rating agency requirements
and/or credit ratings and their effect on availability and cost of capital to the Company; the impact
of volatility in the credit markets; the ability to comply with debt covenants; the impact to
the asset values and resulting higher costs and funding obligations of NJR's pension and postemployment benefit plans as a result of downturns in the financial
markets, a lower discount rate, and impacts associated with the Patient Protection and Affordable Care
Act; accounting effects and other risks associated with hedging activities and use of
derivatives contracts; commercial and wholesale credit risks, including the availability of creditworthy customers and counterparties and liquidity in the
wholesale energy trading market; the ability to obtain governmental approvals and/or financing for the
construction, development and operation of certain non-regulated energy investments; risks
associated with the management of the Company's joint ventures and partnerships; risks associated with our investments in renewable energy
projects and our investment in an on-shore wind developer, including the availability of
regulatory and tax incentives, logistical risks and potential delays related to construction,
permitting, regulatory approvals and electric grid interconnection, the availability of viable projects and NJR's eligibility for federal investment tax credits (ITC),
and production tax credits (PTC), the future market for SRECs and operational risks related to
projects in service; timing of qualifying for ITCs due to delays or failures to complete
planned solar energy projects and the resulting effect on our effective tax rate and earnings; regulatory approval of NJNG’s planned infrastructure programs; the
level and rate at which NJNG's costs and expenses (including those related to restoration efforts
resulting from Superstorm Sandy) are incurred and the extent to which they are allowed to be
recovered from customers through the regulatory process; access to adequate supplies of natural gas and dependence on third-party storage and
transportation facilities for natural gas supply; operating risks incidental to handling, storing,
transporting and providing customers with natural gas; risks related to our employee workforce,
including a work stoppage; the regulatory and pricing policies of federal and state regulatory agencies; the possible expiration of the NJNG
Conservation Incentive Program (CIP); the costs of compliance with present and future environmental
laws, including potential climate change-related legislation; risks related to changes in
accounting standards; the disallowance of recovery of environmental-related expenditures and other regulatory changes; environmental-related and
other litigation and other uncertainties; risks related to cyber-attack of failure of information
technology systems; and the impact of natural disasters, terrorist activities, and other
extreme events on our operations and customers, including any impacts to utility gross margin, and restoration costs resulting from Superstorm Sandy. The
aforementioned factors are detailed in the “Risk Factors” sections of our Annual Report on
Form 10-K filed on November 26, 2013, as filed with the Securities and Exchange
Commission (SEC) which is available on the SEC’s website at sec.gov. Information
included in this presentation is representative as of today only and while NJR periodically
reassesses material trends and uncertainties affecting NJR's results of operations and financial condition in connection with its preparation of management's
discussion and analysis of results of operations and financial condition contained in its Quarterly
and Annual Reports filed with the SEC, NJR does not, by including this statement, assume any
obligation to review or revise any particular forward-looking statement referenced herein in light of future events. |
 Disclaimer Regarding Non-GAAP Financial
Measures
This presentation includes the non-GAAP measure NFE. As an indicator of the
company’s operating performance, this
measure
should
not
be
considered
an
alternative
to,
or
more
meaningful
than,
operating
income
as
determined in accordance with GAAP. This information has been provided pursuant
to the requirements of SEC Regulation G.
NFE excludes unrealized gains or losses on derivative instruments related to the
company’s unregulated subsidiaries and certain realized gains and
losses on derivative instruments related to natural gas that has been
placed into storage at NJRES. Volatility associated with the change in
value of these financial and physical commodity contracts is reported in
the income statement in the current period. In order to manage its business,
NJR views its results without the impacts of the unrealized gains and losses,
and certain realized gains and losses, caused by changes in value of
these financial instruments and physical commodity contracts prior to the
completion of the planned transaction because it shows changes in value
currently instead of when the planned transaction ultimately is settled.
An annual estimated effective tax rate is calculated for NFE purposes and
any necessary quarterly tax adjustment is applied to NJRCEV, as
such adjustment is related to tax credits generated
by NJRCEV.
Management uses on-GAAP financial measures as supplemental measures to other
GAAP results to provide a more complete understanding of the company’s
performance. Management believes these non- GAAP measures are more
reflective of the company’s business model, provide transparency to investors
and enable period-to-period comparability of financial performance. For a
full discussion of NJR’s non- GAAP financial measures, please see
NJR’s most recent Form 10-K, Item 7 and most recent Form 10-Q,
Part I, Item 2.
2
2 |
 NJR Fiscal 2014 NFE Per Share Guidance
Increased to $3.90-$4.10 from $2.75-$2.95
NJR Energy Services (NJRES) profits grew significantly due to
extreme cold weather across the nation resulting in increased
demand for physical gas services
NJR’s increased earnings retention further strengthens its
financial profile to finance significant infrastructure investments
and reduce potential new equity
NJR expects regulated businesses, including New Jersey Natural
Gas (NJNG) and NJR Midstream, to continue to be the major
contributors of NJR’s earnings in Fiscal 2014
3 |
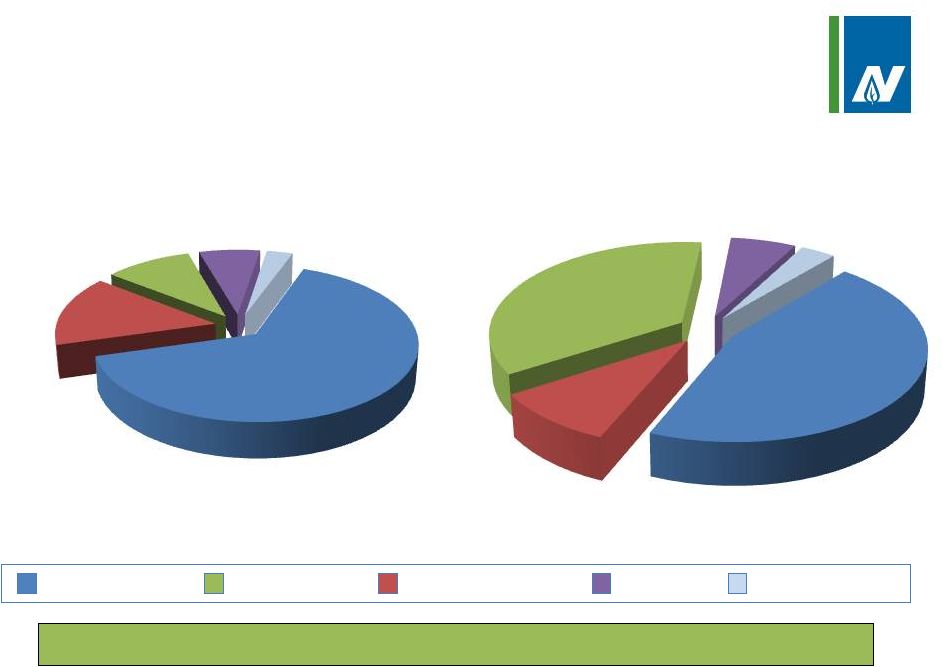 NJR Business Segment NFEPS Contributions;
Updated Fiscal 2014 Guidance -
$3.90-$4.10
4
NJR expects NJRES to Contribute 35-40% of Fiscal 2014 Earnings
New Jersey Natural Gas
NJR Clean Energy Ventures
NJR Energy Services
NJR Midstream
NJR Home Services
Previous Fiscal 2014
5-15%
10-20%
60-70%
5-10%
-5%
2
35-40%
5-15%
45-50%
3-10%
2-5%
Current Fiscal 2014 |
 5
NJR Energy Services
Provides physical natural gas services for customers
across North America including the Marcellus Shale
Customers:
Utilities, Power Generators, Pipelines and Industrials
NJRES’
Asset Portfolio includes:
Storage capacity -
40 Bcf in the United States and Canada
Pipeline transportation capacity -
1.5 Bcf/day
NJRES’
services include:
Transport natural gas to customers
Gas in storage available to serve customers when demand is high
Manage other companies’
assets –
Producer Services
Long
option strategy:
Commodity
hedges
limit
downside
Creates upside when market conditions are volatile
|
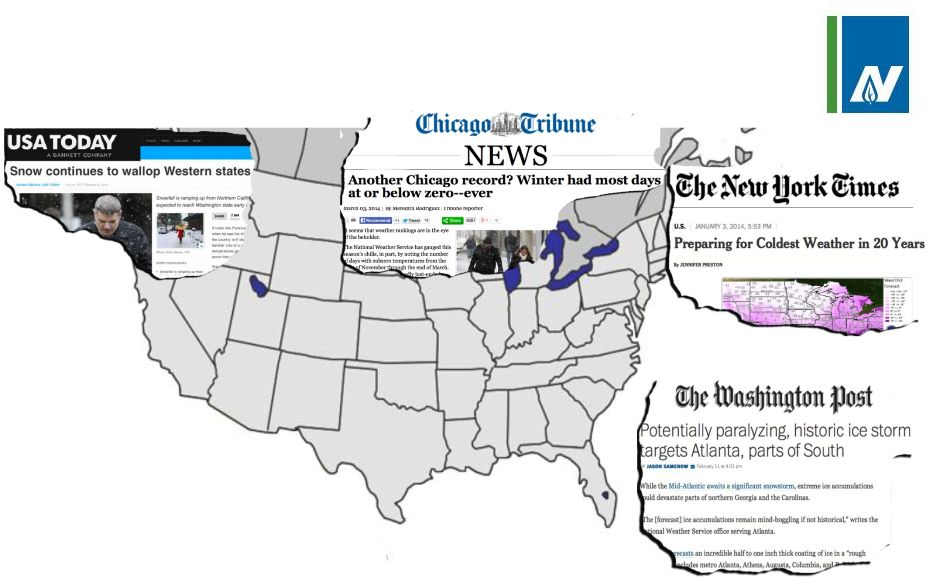 6
Severe Weather Drives NJRES Performance |
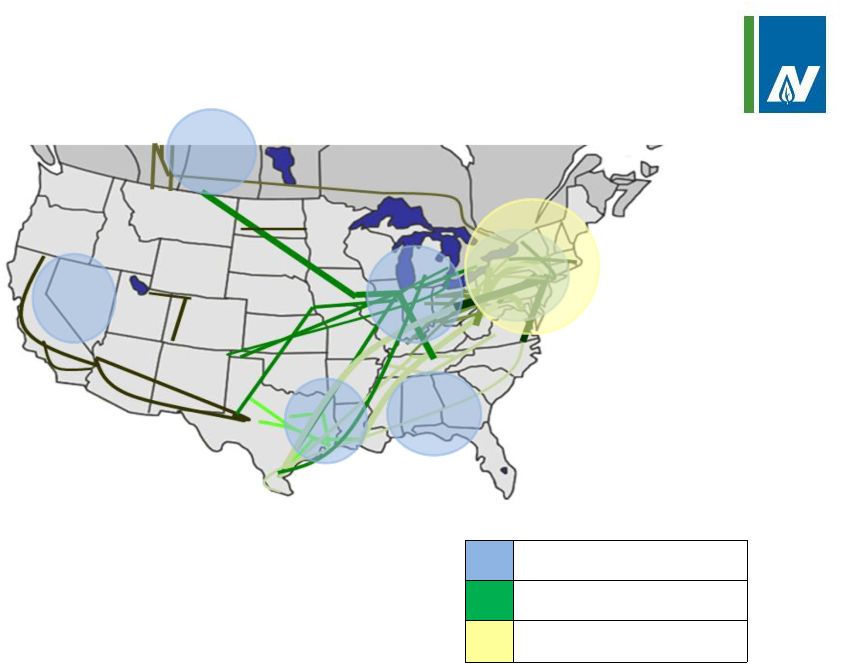 7
NJRES Assets Support Long-Option Strategy
Firm Storages
Firm Transports
Producer Service Area |
 Long-Term Benefits of Increased Earnings
Earnings retention further strengthens balance sheet and avoids
potential new equity issuance
Supports our future capital expenditures from fiscal 2014 to 2017
NJNG -
$726 million
NJR Clean Energy Ventures -
$260 million
Additional flexibility to utilize Share Repurchase Program
Results in higher projected earnings and dividend growth rates
8 |
 Capital of Over $1 Billion Drives Long-Term
Growth
NJNG Expects Base Rate Case Resolution by Fiscal 2017
9
NJNG Capital Investment Estimates
($mm)
2009-
2012
Actual
2013A
2014E
2015E
2016E
2017E
Total
Customer Growth
$79.4
$24.5
$24.7
$25.6
$25.5
$25.5
$205.2
Maintenance/Other
177.4
42.5
63.3
55.9
48.1
40.6
427.8
AIP/SAFE
136.7
45.3
31.6
33.7
39.1
-
286.4
Superstorm Sandy
-
26.1
5.3
5.2
-
-
36.6
NGV Advantage
-
1.0
9.0
-
-
-
10.0
NJ RISE
-
-
4.6
13.0
12.0
12.0
41.6
Liquefaction/LNG
-
-
16.0
16.3
3.4
-
35.7
Southern Reliability
-
-
2.3
12.3
80.6
34.8
130.0
SAVEGREEN
36.5
24.0
42.5
42.5
-
-
145.5
Total
$430.0
$163.4
$199.3
$204.5
$208.7
$112.9
$1,318.8 |
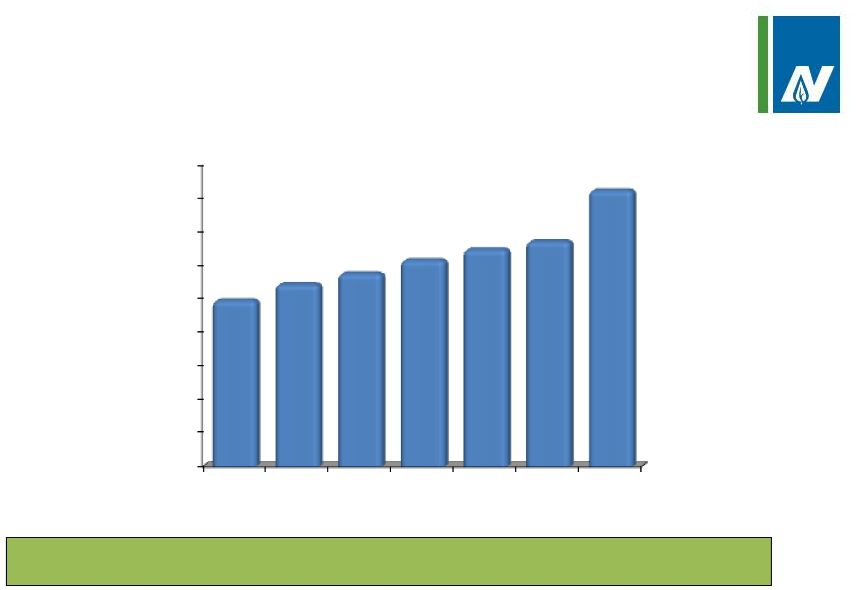
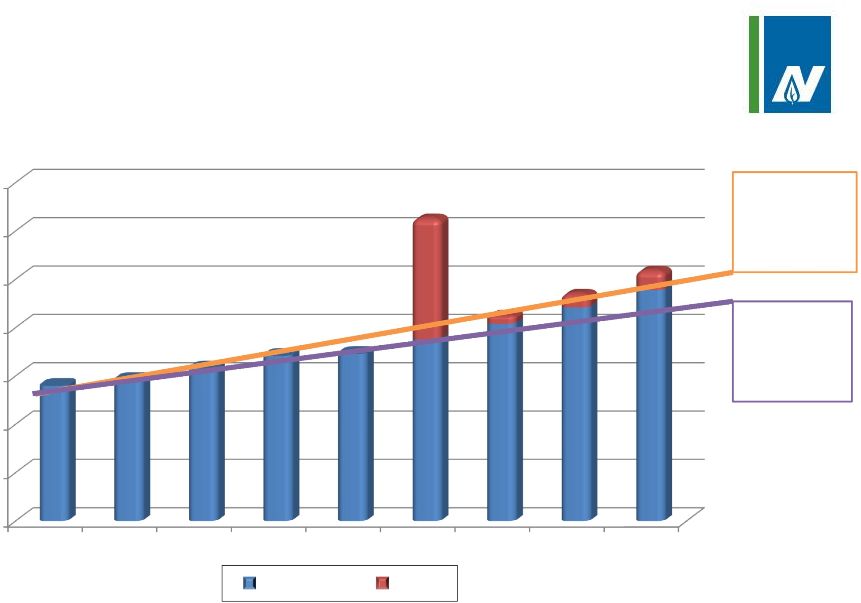 Revised Long-Term NFEPS Guidance
10
5–9 percent
average
annual
growth
4-7 percent
average
annual
growth
$1.00
$1.50
$2.00
$2.50
$3.00
$3.50
$4.00
$4.50
2009
2010
2011
2012
2013
2014E
2015E
2016E
2017E
$2.40
$2.46
$2.58
$2.71
$2.73
$3.90 -$4.10
$3.28-$3.71
Previous
New |
 11
Payout ratio goal remains unchanged at 60 to 65 percent
Dividend Outlook Strengthened
* Current annual rate
** Assumes 6-8 percent average annual dividend growth
11
$0.00
$0.25
$0.50
$0.75
$1.00
$1.25
$1.50
$1.75
$2.00
$2.25
2009
2010
2011
2012
2013
2014*
2017E**
$1.24
$1.36
$1.44
$1.54
$1.62
$1.68
$1.98-$2.08
Dividend Growth |
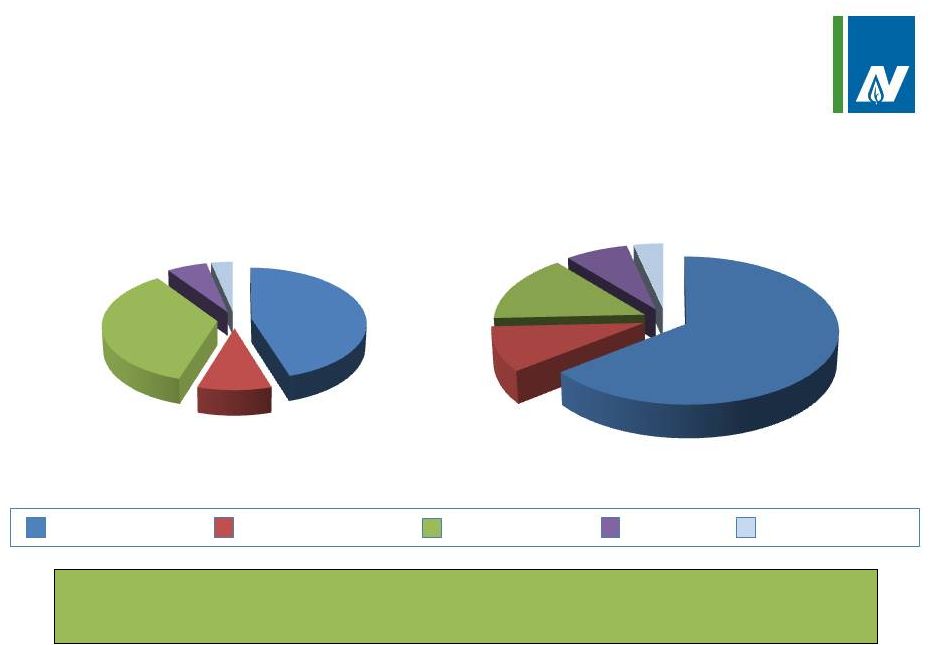 NJR expects Contributions to Return to 5-15
percent of Total NFE Post-Fiscal 2014
12
Regulated businesses expected to
contribute
65-80 percent of total NFE
New Jersey Natural Gas
NJR
Clean
Energy
Ventures
NJR Energy Services
NJR Midstream
NJR Home Services
Current
Fiscal 2014
Guidance
35-40%
5-15%
45-50%
3-10%
2-5%
Fiscal 2015
through
Fiscal 2017
60-70%
10-20%
5-15%
5-10%
2-5% |
 Summary
NJRES’
results
validate
our
business
strategy
and
consistent
focus on providing physical natural gas services to customers
Improved
long-term
NFEPS
and
dividend
growth
rates
driven
by this year’s performance
Assuming
normal
weather,
NJR
expects
NJRES
to
resume
its
historic 5 to 15 percent earnings contribution to NJR’s NFE,
post- fiscal 2014
New Jersey Natural Gas, our regulated utility, will continue
to
be
the
major
contributor
to
earnings,
contributing
45-50
percent in fiscal 2014 and between 60-70 percent of NFE post-
fiscal 2014
13 |
 Increased Fiscal 2014 NFE Guidance
and Long-Term Financial Goals
March 12, 2014 |