Attached files
| file | filename |
|---|---|
| EX-21.1 - EXHIBIT 21.1 SEPTEMBER 30, 2017 - NEW JERSEY RESOURCES CORP | njrex211sep2017.htm |
| EX-32.2 - EXHIBIT 32.2 SEPTEMBER 30, 2017 - NEW JERSEY RESOURCES CORP | njrex322sep2017.htm |
| EX-32.1 - EXHIBIT 32.1 SEPTEMBER 30, 2017 - NEW JERSEY RESOURCES CORP | njrex321sep2017.htm |
| EX-31.2 - EXHIBIT 31.2 SEPTEMBER 30, 2017 - NEW JERSEY RESOURCES CORP | njrex312sep2017.htm |
| EX-31.1 - EXHIBIT 31.1 SEPTEMBER 30, 2017 - NEW JERSEY RESOURCES CORP | njrex311sep2017.htm |
| EX-23.1 - EXHIBIT 23.1 SEPTEMBER 30, 2017 - NEW JERSEY RESOURCES CORP | njrex231sep2017.htm |
| EX-10.27 - EXHIBIT 10.27 SEPTEMBER 30, 2017 - NEW JERSEY RESOURCES CORP | njrex1027ranjrandmd.htm |
| EX-10.21 - EXHIBIT 10.21 SEPTEMBER 30, 2017 - NEW JERSEY RESOURCES CORP | njrex10212017sep.htm |
UNITED STATES
SECURITIES AND EXCHANGE COMMISSION
Washington, D.C. 20549
FORM 10‑K
x ANNUAL REPORT PURSUANT TO SECTION 13 OR 15(d) OF THE
SECURITIES EXCHANGE ACT OF 1934
FOR THE FISCAL YEAR ENDED SEPTEMBER 30, 2017
OR
o TRANSITION REPORT PURSUANT TO SECTION 13 OR 15(d) OF THE
SECURITIES EXCHANGE ACT OF 1934
FOR THE TRANSITION PERIOD FROM TO | ||
Commission file number 001‑08359 | ||
NEW JERSEY RESOURCES CORPORATION | ||
(Exact name of registrant as specified in its charter) | ||
New Jersey | 22‑2376465 | |
(State or other jurisdiction of incorporation or organization) | (I.R.S. Employer Identification Number) | |
1415 Wyckoff Road, Wall, New Jersey 07719 | 732‑938‑1480 | |
(Address of principal executive offices) | (Registrant’s telephone number, including area code) | |
Securities registered pursuant to Section 12 (b) of the Act: | ||
Common Stock ‑ $2.50 Par Value | New York Stock Exchange | |
(Title of each class) | (Name of each exchange on which registered) | |
Securities registered pursuant to Section 12 (g) of the Act: None | ||
Indicate by check mark if the registrant is a well-known seasoned issuer, as defined in Rule 405 of the Securities Act.
Yes: x No: o
Indicate by check mark if the registrant is not required to file reports pursuant to Section 13 or Section 15(d) of the Act.
Yes: o No: x
Indicate by check mark whether the Registrant (1) has filed all reports required to be filed by Section 13 or 15 (d) of the Securities Exchange Act of 1934 during the preceding 12 months (or for such shorter period that the Registrant was required to file such reports), and (2) has been subject to such filing requirements for the past 90 days.
Yes: x No: o
Indicate by check mark whether the registrant has submitted electronically and posted on its corporate Web site, if any, every Interactive Data File required to be submitted and posted pursuant to Rule 405 of Regulation S-T during the preceding 12 months (or for such shorter period that the registrant was required to submit and post such files).
Yes: x No: o
Indicate by check mark if disclosure of delinquent filers pursuant to Item 405 of Regulation S‑K is not contained herein, and will not be contained, to the best of the Registrant’s knowledge, in definitive proxy or information statements incorporated by reference in Part III of this Form 10-K or any amendment to this Form 10-K. x
Indicate by check mark whether the registrant is a large accelerated filer, an accelerated filer, a non-accelerated filer, smaller reporting company or an emerging growth company. See definitions of “large accelerated filer,” “accelerated filer,” “smaller reporting company” and "emerging growth company" in Rule 12b‑2 of the Exchange Act.
Large accelerated filer: x | Accelerated filer: o | Non-accelerated filer: o | |
(Do not check if a smaller reporting company) | |||
Smaller reporting company: o | Emerging growth company: o | ||
If an emerging growth company, indicate by check mark if the registrant has elected not to use the extended transition period for complying with any new or revised financial accounting standards provided pursuant to Section 13(a) of the Exchange Act. o
Indicate by check mark whether the registrant is a shell company (as defined in Rule 12b-2 of the Exchange Act).
Yes: o No: x
The aggregate market value of the Registrant’s Common Stock held by non-affiliates was $3,356,717,008 based on the closing price of $39.60 per share on March 31, 2017, as reported on the New York Stock Exchange.
The number of shares outstanding of $2.50 par value Common Stock as of November 17, 2017 was 86,866,461.
DOCUMENTS INCORPORATED BY REFERENCE
Portions of the Registrant’s definitive Proxy Statement for the Annual Meeting of Shareowners (Proxy Statement) to be held on January 24, 2018, are incorporated by reference into Part I and Part III of this report.
New Jersey Resources Corporation
TABLE OF CONTENTS
Page | |||
PART I | |||
ITEM 1. | |||
ITEM 1A. | |||
ITEM 1B. | |||
ITEM 2. | |||
ITEM 3. | |||
ITEM 4. | |||
ITEM 4A. | |||
PART II | |||
ITEM 5. | |||
ITEM 6. | |||
ITEM 7. | |||
ITEM 7A. | |||
ITEM 8. | |||
ITEM 9. | |||
ITEM 9A. | |||
ITEM 9B. | |||
PART III* | |||
ITEM 10. | |||
ITEM 11. | |||
ITEM 12. | |||
ITEM 13. | |||
ITEM 14. | |||
PART IV | |||
ITEM 15. | |||
* Portions of Item 10 and Items 11-14 are Incorporated by Reference from the Proxy Statement. | |||
i
New Jersey Resources Corporation
GLOSSARY OF KEY TERMS
Adelphia | Adelphia Gateway, LLC |
AFUDC | Allowance for Funds Used During Construction |
AOCI | Accumulated Other Comprehensive Income |
ARO | Asset Retirement Obligations |
ASC | Accounting Standards Codification |
ASU | Accounting Standards Update |
Bcf | Billion Cubic Feet |
BGSS | Basic Gas Supply Service |
BPU | New Jersey Board of Public Utilities |
CIP | Conservation Incentive Program |
CME | Chicago Mercantile Exchange |
CR&R | Commercial Realty & Resources Corp. |
Degree-Day | The measure of the variation in the weather based on the extent to which the average daily temperature falls below 65 degrees Fahrenheit |
DM | Dominion Midstream Partners, L.P., a master limited partnership |
DM Common Units | Common units representing limited partnership interests in DM |
Dodd-Frank Act | Dodd-Frank Wall Street Reform and Consumer Protection Act |
DRP | NJR Direct Stock Purchase and Dividend Reinvestment Plan |
Dths | Dekatherms |
EDA | New Jersey Economic Development Authority |
EDA Bonds | Collectively, Series 2011A, Series 2011B and Series 2011C Bonds issued to NJNG by the EDA |
EDECA | Electric Discount and Energy Competition Act |
EE | Energy Efficiency |
FASB | Financial Accounting Standards Board |
FCM | Futures Commission Merchant |
FERC | Federal Energy Regulatory Commission |
Financial Margin | A non-GAAP financial measure, which represents revenues earned from the sale of natural gas less costs of natural gas sold including any transportation and storage costs, and excludes any accounting impact from the change in the fair value of certain derivative instruments |
FMB | First Mortgage Bonds |
FRM | Financial Risk Management |
GAAP | Generally Accepted Accounting Principles of the United States |
HCCTR | Health Care Cost Trend Rate |
Home Services and Other | Home Services and Other Operations (formerly Retail and Other Operations) |
ICE | Intercontinental Exchange |
IEC | Interstate Energy Company, LLC |
Iroquois | Iroquois Gas Transmission L.P. |
IRS | Internal Revenue Service |
ISDA | The International Swaps and Derivatives Association |
ITC | Investment Tax Credit |
LIBOR | London Inter-Bank Offered Rate |
LNG | Liquefied Natural Gas |
Loan Agreement | Loan Agreement between the EDA and NJNG |
MetLife | Metropolitan Life Insurance Company |
MetLife Facility | NJR’s unsecured, uncommitted $100 million private placement shelf note agreement with MetLife, Inc., which expired in September 2016 |
MGP | Manufactured Gas Plant |
MLP | Master limited partnership |
Moody’s | Moody’s Investors Service, Inc. |
Mortgage Indenture | The Amended and Restated Indenture of Mortgage, Deed of Trust and Security Agreement between NJNG and U.S. Bank National Association dated as of September 1, 2014 |
MW | Megawatts |
MWh | Megawatt Hour |
NAESB | The North American Energy Standards Board |
NFE | Net Financial Earnings |
NGV | Natural Gas Vehicles |
Page 1
New Jersey Resources Corporation
GLOSSARY OF KEY TERMS (cont.) | |
NJ RISE | New Jersey Reinvestment in System Enhancement |
NJCEP | New Jersey’s Clean Energy Program |
NJDEP | New Jersey Department of Environmental Protection |
NJNG | New Jersey Natural Gas Company or Natural Gas Distribution segment |
NJNG Credit Facility | The $250 million unsecured committed credit facility expiring in May 2019 |
NJR Credit Facility | NJR’s $425 million unsecured committed credit facility expiring in September 2020 |
NJR Energy | NJR Energy Corporation |
NJR or The Company | New Jersey Resources Corporation |
NJRCEV | NJR Clean Energy Ventures Corporation |
NJRES | NJR Energy Services Company |
NJRHS | NJR Home Services Company |
NJRPS | NJR Plumbing Services, Inc. |
NJRRS | NJR Retail Services Company |
NJR Retail Holdings | NJR Retail Holdings Corporation |
Non-GAAP | Not in accordance with Generally Accepted Accounting Principles of the United States |
NPNS | Normal Purchase/Normal Sale |
NYMEX | New York Mercantile Exchange |
O&M | Operation and Maintenance |
OCI | Other Comprehensive Income |
OPEB | Other Postemployment Benefit Plans |
PBO | Projected Benefit Obligation |
PennEast | PennEast Pipeline Company, LLC |
PEP | Pension Equalization Plan |
PIM | Pipeline Integrity Management |
PPA | Power Purchase Agreement |
Prudential | Prudential Investment Management, Inc. |
Prudential Facility | NJR’s unsecured, uncommitted private placement shelf note agreement with Prudential |
PTC | Production Tax Credit |
RAC | Remediation Adjustment Clause |
REC | Renewable Energy Certificate |
S&P | Standard & Poor’s Financial Services, LLC |
SAFE | Safety Acceleration and Facility Enhancement |
Sarbanes-Oxley | Sarbanes-Oxley Act of 2002 |
SAVEGREEN | The SAVEGREEN Project® |
Savings Plan | Employees’ Retirement Savings Plan |
SBC | Societal Benefits Charge |
SEC | Securities and Exchange Commission |
SREC | Solar Renewable Energy Certificate |
SRL | Southern Reliability Link |
Steckman Ridge | Collectively, Steckman Ridge GP, LLC and Steckman Ridge, LP |
Superstorm Sandy | Post-Tropical Cyclone Sandy |
Talen | Talen Energy Marketing, LLC or Talen Generation, LLC |
Tetco | Texas Eastern Transmission |
The Exchange Act | The Securities Exchange Act of 1934, as amended |
Trustee | U.S. Bank National Association |
TSR | Total Shareholder Return |
U.S. | The United States of America |
Union | International Brotherhood of Electrical Workers Local 1820 |
USF | Universal Service Fund |
Page 2
New Jersey Resources Corporation
TABLE OF CONTENTS
INFORMATION CONCERNING FORWARD-LOOKING STATEMENTS
Certain statements contained in this report, including, without limitation, statements as to management expectations, assumptions and beliefs presented in Part I, Item 1. Business and Item 3. Legal Proceedings, and in Part II, Item 7. Management’s Discussion and Analysis of Financial Condition and Results of Operations and Item 7A. Quantitative and Qualitative Disclosures About Market Risk, and in the notes to the financial statements are forward-looking statements within the meaning of Section 27A of the Securities Act of 1933, as amended, Section 21E of the Securities Exchange Act of 1934, as amended, and the Private Securities Litigation Reform Act of 1995. Forward-looking statements can also be identified by the use of forward-looking terminology such as “anticipate,” “estimate,” “may,” “could,” “might,” “intend,” “expect,” “believe,” “will” “plan” or “should” or comparable terminology and are made based upon management’s current expectations, assumptions and beliefs as of this date concerning future developments and their potential effect on us. There can be no assurance that future developments will be in accordance with management’s expectations, assumptions or beliefs, or that the effect of future developments on us will be those anticipated by management.
We caution readers that the expectations, assumptions and beliefs that form the basis for forward-looking statements regarding customer growth, customer usage, qualifications for ITCs, PTCs and SRECs, future rate case proceedings, financial condition, results of operations, cash flows, capital requirements, future capital expenditures, market risk, effective tax rate and other matters for fiscal 2018 and thereafter include many factors that are beyond our ability to control or estimate precisely, such as estimates of future market conditions, the behavior of other market participants and changes in the debt and equity capital markets. The factors that could cause actual results to differ materially from our expectations, assumptions and beliefs include, but are not limited to, those discussed in Part I, Item 1A. Risk Factors, as well as the following:
• | risks associated with our investments in clean energy projects, including the availability of regulatory and tax incentives, the availability of viable projects, our eligibility for ITCs and PTCs, the future market for SRECs and electricity prices, and operational risks related to projects in service; |
• | our ability to obtain governmental and regulatory approvals, land-use rights, electric grid connection (in the case of clean energy projects) and/or financing for the construction, development and operation of our unregulated energy investments and NJNG’s infrastructure projects in a timely manner; |
• | risks associated with acquisitions and the related integration of acquired assets with our current operations; |
• | volatility of natural gas and other commodity prices and their impact on NJNG customer usage, NJNG’s BGSS incentive programs, our Energy Services segment operations and on our risk management efforts; |
• | the level and rate at which NJNG’s costs and expenses are incurred and the extent to which they are approved for recovery from customers through the regulatory process, including through future base rate case filings; |
• | the impact of a disallowance of recovery of environmental-related expenditures and other regulatory changes; |
• | the performance of our subsidiaries; |
• | operating risks incidental to handling, storing, transporting and providing customers with natural gas; |
• | access to adequate supplies of natural gas and dependence on third-party storage and transportation facilities for natural gas supply; |
• | the regulatory and pricing policies of federal and state regulatory agencies; |
• | timing of qualifying for ITCs and PTCs due to delays or failures to complete planned solar and wind energy projects and the resulting effect on our effective tax rate and earnings; |
• | the results of legal or administrative proceedings with respect to claims, rates, environmental issues, gas cost prudence reviews and other matters; |
• | risks related to cyberattacks or failure of information technology systems; |
• | changes in rating agency requirements and/or credit ratings and their effect on availability and cost of capital to our Company; |
• | our ability to comply with current and future regulatory requirements; |
• | the impact of volatility in the equity and credit markets on our access to capital; |
• | the impact to the asset values and resulting higher costs and funding obligations of our pension and postemployment benefit plans as a result of potential downturns in the financial markets, lower discount rates, revised actuarial assumptions or impacts associated with the Patient Protection and Affordable Care Act; |
• | commercial and wholesale credit risks, including the availability of creditworthy customers and counterparties, and liquidity in the wholesale energy trading market; |
• | accounting effects and other risks associated with hedging activities and use of derivatives contracts; |
• | our ability to optimize our physical assets; |
• | any potential need to record a valuation allowance for our deferred tax assets; |
• | changes to tax laws and regulations; |
• | weather and economic conditions; |
• | our ability to comply with debt covenants; |
• | demographic changes in NJR’s service territory and their effect on NJR’s customer growth; |
• | the impact of natural disasters, terrorist activities and other extreme events on our operations and customers; |
• | the costs of compliance with present and future environmental laws, including potential climate change-related legislation; |
• | environmental-related and other uncertainties related to litigation or administrative proceedings; |
• | risks related to our employee workforce; and |
• | risks associated with the management of our joint ventures and partnerships, and investment in a master limited partnership. |
While we periodically reassess material trends and uncertainties affecting our results of operations and financial condition in connection with the preparation of management’s discussion and analysis of results of operations and financial condition contained in our Quarterly and Annual Reports on Form 10-Q and Form 10-K, respectively, we do not, by including this statement, assume any obligation to review or revise any particular forward-looking statement referenced herein in light of future events.
Page 3
New Jersey Resources Corporation
Part I
ITEM 1. BUSINESS
ORGANIZATIONAL STRUCTURE
New Jersey Resources Corporation is a New Jersey corporation formed in 1981 pursuant to a corporate reorganization. We are an energy services holding company whose principal business is the distribution of natural gas through a regulated utility, providing other retail and wholesale energy services to customers and investing in clean energy projects and midstream assets. We are an exempt holding company under section 1263 of the Energy Policy Act of 2005. Our subsidiaries include:
New Jersey Natural Gas Company provides regulated retail natural gas service to approximately 529,800 residential and commercial customers in central and northern New Jersey and participates in the off-system sales and capacity release markets. NJNG, a local natural gas distribution company, is regulated by the BPU and comprises the Company’s Natural Gas Distribution segment and is referred to herein as NJNG or Natural Gas Distribution.
NJR Clean Energy Ventures Corporation includes the results of operations and assets related to the Company’s unregulated capital investments in clean energy projects, including commercial and residential solar projects and onshore wind investments. NJRCEV comprises the Company’s Clean Energy Ventures segment and is referred to herein as Clean Energy Ventures.
NJR Energy Services Company maintains and transacts around a portfolio of physical assets consisting of natural gas storage and transportation contracts in the U.S. and Canada. NJRES also provides unregulated wholesale energy management services to other energy companies and natural gas producers.
NJR Retail Services Company provides unregulated retail natural gas supply and transportation services to commercial and industrial customers in Delaware, Maryland, Pennsylvania and New Jersey.
NJRES and NJRRS comprise our Energy Services segment and are referred to herein as Energy Services.
NJR Energy Investments Corporation is an unregulated affiliate that consolidates our unregulated energy-related investments.
NJR Midstream Holdings Corporation invests in energy-related ventures through its subsidiaries, NJR Steckman Ridge Storage Company, which holds the Company’s 50 percent combined interest in Steckman Ridge, a natural gas storage facility, NJR Pipeline Company, which holds the Company’s 20 percent ownership interest in PennEast and NJNR Pipeline Company, which holds approximately 1.84 million DM Common Units in Dominion Midstream Partners, L.P. The investments in Steckman Ridge, PennEast and DM comprise the Company’s Midstream segment.
NJR Retail Holdings Corporation is an unregulated affiliate that consolidates our unregulated retail operations.
NJR Home Services Company provides heating, ventilation and cooling service, sales and installation of appliances to approximately 112,000 service contract customers, as well as solar installation projects.
Commercial Realty & Resources Corp., holds commercial real estate.
NJR Plumbing Services, Inc. provides plumbing repair and installation services.
NJR Service Corporation provides shared administrative services, including corporate communications, finance and accounting, internal audit, legal, human resources and information technology for NJR and all of its subsidiaries.
Page 4
New Jersey Resources Corporation
Part I
ITEM 1. BUSINESS (Continued)
REPORTING SEGMENTS
We operate within four reporting segments: Natural Gas Distribution, Clean Energy Ventures, Energy Services and Midstream.
The Natural Gas Distribution segment consists of regulated natural gas services, off-system sales, capacity and storage management operations. The Energy Services segment consists of unregulated wholesale and retail energy operations. The Clean Energy Ventures segment consists of capital investments in clean energy projects. The Midstream segment consists of investments in the midstream natural gas market, such as natural gas transportation and storage facilities.
Net income by reporting segment and other operations for the years ended September 30, are as follows:
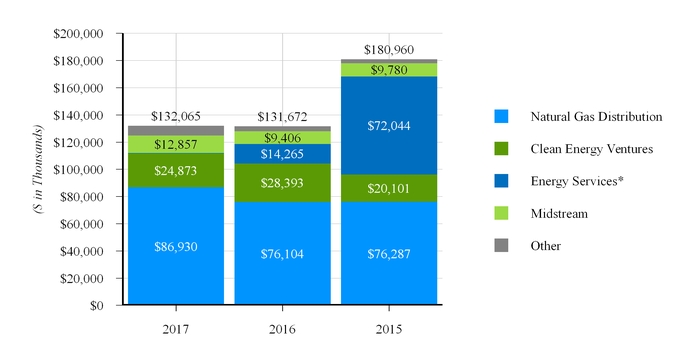
* Energy Services’ net income for fiscal 2017 was $476,000 and does not show clearly in the above graph.
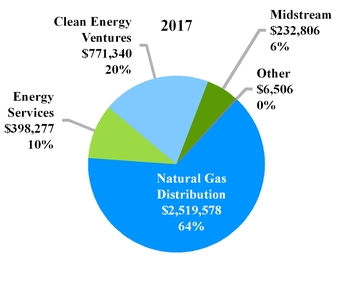
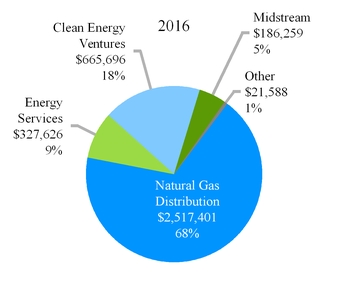
Assets by reporting segment and other operations at September 30, are as follows ($ in Thousands):
Page 5
New Jersey Resources Corporation
Part I
ITEM 1. BUSINESS (Continued)
Management uses NFE, a non-GAAP financial measure, when evaluating our operating results. NFE is a measure of the earnings based on eliminating timing differences surrounding the recognition of certain gains or losses to effectively match the earnings effects of the economic hedges with the physical sale of gas and, therefore, eliminates the impact of volatility to GAAP earnings associated with the derivative instruments. Energy Services economically hedges its natural gas inventory with financial derivative instruments and calculates the related tax effect based on the statutory rate.
Non-GAAP financial measures are not in accordance with, or an alternative to GAAP, and should be considered in addition to, and not as a substitute for, the comparable GAAP measure. The following is a reconciliation of consolidated net income, the most directly comparable GAAP measure, to NFE:
(Thousands) | 2017 | 2016 | 2015 | ||||||
Net income | $ | 132,065 | $ | 131,672 | $ | 180,960 | |||
Add: | |||||||||
Unrealized (gain) loss on derivative instruments and related transactions | (11,241 | ) | 46,883 | (38,681 | ) | ||||
Tax effect | 4,062 | (17,018 | ) | 14,391 | |||||
Effects of economic hedging related to natural gas inventory | 38,470 | (36,816 | ) | (8,225 | ) | ||||
Tax effect | (13,964 | ) | 13,364 | 3,058 | |||||
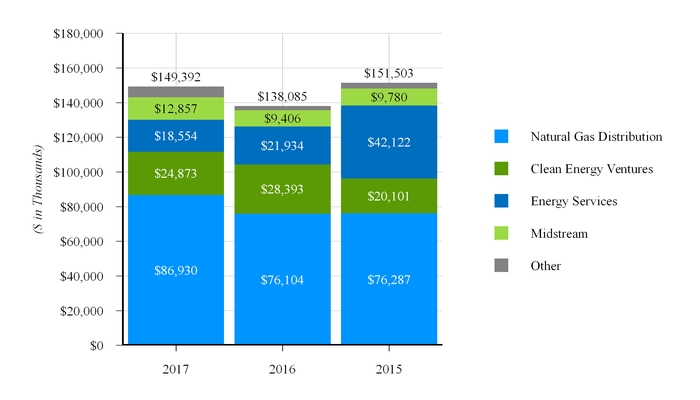
NFE | $ | 149,392 | $ | 138,085 | $ | 151,503 | |||
Basic earnings per share | $ | 1.53 | $ | 1.53 | $ | 2.12 | |||
Add: | |||||||||
Unrealized (gain) loss on derivative instruments and related transactions | (0.13 | ) | 0.55 | (0.45 | ) | ||||
Tax effect | 0.05 | (0.20 | ) | 0.17 | |||||
Effects of economic hedging related to natural gas inventory | 0.45 | (0.43 | ) | (0.10 | ) | ||||
Tax effect | (0.17 | ) | 0.16 | 0.04 | |||||
Basic NFE per share | $ | 1.73 | $ | 1.61 | $ | 1.78 | |||
NFE by reporting segment and other operations for the years ended September 30, are as follows:
Additional financial information related to these reporting segments are set forth in Note 15. Reporting Segment and Other Operations Data in the accompanying Consolidated Financial Statements and Item 7. Management’s Discussion and Analysis of Financial Condition and Results of Operations.
Page 6
New Jersey Resources Corporation
Part I
ITEM 1. BUSINESS (Continued)
Natural Gas Distribution
General
Our Natural Gas Distribution segment consists of regulated utility operations that provide natural gas service to approximately 529,800 customers. NJNG’s service territory includes New Jersey’s Monmouth and Ocean counties and parts of Burlington, Morris and Middlesex counties. It encompasses 1,516 square miles, covering 105 municipalities with an estimated population of 1.5 million people. It is primarily suburban, highlighted by approximately 100 miles of New Jersey coastline. It is in close proximity to New York City, Philadelphia and the metropolitan areas of northern New Jersey and is accessible through a network of major roadways and mass transportation.
NJNG’s business is subject to various risks, such as those associated with adverse economic conditions, which can negatively impact customer growth, operating and financing costs, fluctuations in commodity prices, which can impact customer usage, customer conservation efforts, certain regulatory actions and environmental remediation. It is often difficult to predict the impact of trends associated with these risks. NJNG employs strategies to manage the challenges it faces, including pursuing customer conversions from other fuel sources and monitoring new construction markets through contact with developers, utilizing incentive programs through BPU-approved mechanisms to reduce gas costs, pursuing rate and other regulatory strategies designed to stabilize and decouple gross margin, and working actively with consultants and the NJDEP to manage expectations related to its obligations associated with its former MGP sites.
Operating Revenues/Throughput
For the fiscal year ended September 30, operating revenues and throughput by customer class are as follows:
2017 | 2016 | 2015 | |||||||||||||||
($ in thousands) | Operating Revenue | Bcf | Operating Revenue | Bcf | Operating Revenue | Bcf | |||||||||||
Residential | $ | 395,315 | 40.7 | $ | 345,597 | 36.9 | $ | 466,464 | 45.9 | ||||||||
Commercial and other | 98,777 | 8.7 | 80,994 | 7.3 | 106,505 | 9.6 | |||||||||||
Firm transportation | 73,206 | 14.4 | 69,696 | 14.1 | 77,974 | 16.0 | |||||||||||
Total residential and commercial | 567,298 | 63.8 | 496,287 | 58.3 | 650,943 | 71.5 | |||||||||||
Interruptible | 7,970 | 55.0 | 8,867 | 61.5 | 10,049 | 47.1 | |||||||||||
Total system | 575,268 | 118.8 | 505,154 | 119.8 | 660,992 | 118.6 | |||||||||||
BGSS incentive programs (1) | 120,369 | 49.5 | 89,192 | 56.6 | 120,978 | 47.8 | |||||||||||
Total | $ | 695,637 | 168.3 | $ | 594,346 | 176.4 | $ | 781,970 | 166.4 | ||||||||
(1) | Does not include 128.9, 160.1 and 174.6 Bcf for the capacity release program and related amounts of $6.5 million, $8.1 million and $8.9 million, which are recorded as a reduction of gas purchases on the Consolidated Statements of Operations for the fiscal years ended September 30, 2017, 2016 and 2015, respectively. |
NJNG added 9,126 and 8,170 new customers and added natural gas heat and other services to another 662 and 644 existing customers in fiscal 2017 and 2016, respectively. NJNG expects its new customer annual growth rate to continue to be approximately 1.7 percent with projected additions in the range of approximately 26,000 to 28,000 new customers over the next three years. This anticipated customer growth represents approximately $5.3 million in new annual utility gross margin, a non-GAAP financial measure, as calculated under NJNG’s current CIP tariff. For a definition of utility gross margin see Item 7. Management’s Discussion and Analysis of Financial Condition and Results of Operations - Natural Gas Distribution Segment.
In fiscal 2017, no single customer represented more than 10 percent of consolidated operating revenues.
Seasonality of Gas Revenues
Therm sales are significantly affected by weather conditions with customer demand being greatest during the winter months when natural gas is used for heating purposes. The relative measurement of the impact of weather is in degree-days. Degree-day data is used to estimate amounts of energy required to maintain comfortable indoor temperature levels based on each day’s average temperature. A degree-day is the measure of the variation in the weather based on the extent to which the average daily temperature falls below 65 degrees Fahrenheit. Each degree of temperature below 65 degrees Fahrenheit is counted as one heating degree-day. Normal heating degree-days are based on a 20-year average, calculated based on three reference areas representative of NJNG’s service territory.
Page 7
New Jersey Resources Corporation
Part I
ITEM 1. BUSINESS (Continued)
The CIP, a mechanism authorized by the BPU, stabilizes NJNG’s utility gross margin, regardless of variations in weather. In addition, the CIP decouples the link between utility gross margin and customer usage, allowing NJNG to promote energy conservation measures. Recovery of utility gross margin is subject to additional conditions, including an earnings test, a revenue test and an evaluation of BGSS-related savings achieved over a 12-month period. In May 2014, the BPU approved the continuation of the CIP program with no expiration date.
Concurrent with its annual BGSS filing, NJNG files for an annual review of its CIP, during which time it can request rate changes, as appropriate. For additional information regarding the CIP, including rate actions and impact to margin, see Note 4. Regulation in the accompanying Consolidated Financial Statements and Item 7. Management’s Discussion and Analysis of Financial Condition and Results of Operations - Natural Gas Distribution Segment.
Gas Supply
Firm Natural Gas Supplies
In fiscal 2017, NJNG purchased natural gas from approximately 80 suppliers under contracts ranging from one day to one year and purchased over 10 percent of its natural gas from one supplier. NJNG believes the loss of this supplier would not have a material adverse impact on its results of operations, financial position or cash flows as an adequate number of alternative suppliers exist. NJNG believes that its supply strategy should adequately meet its expected firm load over the next several years.
Firm Transportation and Storage Capacity
NJNG maintains agreements for firm transportation and storage capacity with several interstate pipeline companies to take delivery of firm natural gas supplies, which ensures the ability to reliably service its customers. NJNG receives natural gas at 10 citygate stations located in Middlesex, Morris and Passaic counties in New Jersey.
The pipeline companies that provide firm transportation service to NJNG’s citygate stations, the maximum daily deliverability of that capacity for the upcoming winter season and the contract expiration dates are as follows:
Pipeline | Dths(1) | Expiration | ||
Texas Eastern Transmission, L.P. | 300,738 | Various dates between 2018 and 2023 | ||
Columbia Gas Transmission Corp. | 50,000 | Various dates between 2024 and 2030 | ||
Transcontinental Gas Pipe Line Corp. | 42,531 | Various dates between 2018 and 2032 | ||
Tennessee Gas Pipeline Co. | 25,166 | Various dates between 2018 and 2023 | ||
Algonquin Gas Transmission | 12,000 | 2019 | ||
Total | 430,435 | |||
(1) | Numbers are shown net of any capacity release contracted amounts. |
Dominion Energy Transmission, Inc. provides NJNG firm contract transportation service and supplies the pipelines included in the table above.
In addition, NJNG has storage contracts that provide an additional 102,941 Dths of maximum daily deliverability to NJNG’s citygate stations from storage fields in its Northeast market area. The storage suppliers, the maximum daily deliverability of that storage capacity and the contract expiration dates are as follows:
Pipeline | Dths | Expiration | ||
Texas Eastern Transmission, L.P. | 94,557 | 2019 | ||
Transcontinental Gas Pipe Line Corp. | 8,384 | 2019 | ||
Total | 102,941 | |||
NJNG also has upstream storage contracts. The maximum daily deliverability and contract expiration dates are as follows:
Company | Dths | Expiration | ||
Dominion Transmission Corporation | 154,714 | Various dates between 2020 and 2023 | ||
Steckman Ridge, L.P. | 38,000 | 2020 | ||
Central New York Oil & Gas | 25,337 | 2023 | ||
Total | 218,051 | |||
Page 8
New Jersey Resources Corporation
Part I
ITEM 1. BUSINESS (Continued)
NJNG utilizes its transportation contracts to transport gas to NJNG’s citygates from the Dominion Transmission Corporation, Steckman Ridge and Central New York Oil & Gas storage fields. NJNG has sufficient firm transportation, storage and supply capacity to fully meet its firm sales contract obligations.
Citygate Supplies from Energy Services
NJNG has several citygate supply agreements with Energy Services. NJNG and Energy Services have an agreement where NJNG releases 10,000 Dths/day of Texas Eastern Transmission capacity, 2,200 Dths/day of Dominion Energy Transmission, Inc. capacity, 10,728 Dths/day of Tennessee Gas Pipeline capacity and 1.6 million Dths of Central New York Oil & Gas storage capacity to Energy Services for the period of April 1, 2017 to March 31, 2018. NJNG can call upon a supply of up to 20,000 Dths/day delivered to NJNG’s Texas Eastern citygate. Energy Services manages the storage inventory and NJNG can call on that storage supply as needed at NJNG’s Tennessee citygate or storage point.
NJNG also has agreements where it releases 80,000 Dths/day of its Texas Eastern Transmission capacity to Energy Services for the period of April 1, 2016 to October 31, 2020. Under these agreements, NJNG can call upon a supply of up to 80,000 Dths/day delivered to its Texas Eastern citygate as needed. See Note 16. Related Party Transactions in the accompanying Consolidated Financial Statements for additional information regarding these transactions.
Peaking Supply
To manage its winter peak day demand, NJNG maintains two LNG facilities with a combined deliverability of approximately 170,000 Dths/day, which represents approximately 19 percent of its estimated peak day sendout. In June 2016, NJNG’s liquefaction facility became operational and now allows NJNG to convert natural gas into LNG to fill NJNG’s existing LNG storage tanks. See Item 2. Properties-Natural Gas Distribution for additional information regarding the LNG storage facilities.
Basic Gas Supply Service
BGSS is a BPU-approved clause designed to allow for the recovery of natural gas commodity costs on an annual basis. The clause requires all New Jersey natural gas utilities to make an annual filing by each June 1 for review of BGSS rates and to request a potential rate change effective the following October 1. The BGSS is also designed to allow each natural gas utility to provisionally increase residential and small commercial customer BGSS rates on December 1 and February 1 for up to a five percent increase to the average residential heat customer’s bill on a self-implementing basis, after proper notice and BPU action on the June filing. Such increases are subject to subsequent BPU review and final approval.
In addition to making periodic rate adjustments to reflect changes in commodity prices, NJNG is also permitted to refund or credit back a portion of the commodity costs to customers when the natural gas commodity costs decrease in comparison to amounts projected or to amounts previously collected from customers. Decreases in the BGSS rate and BGSS refunds can be implemented with five days’ notice to the BPU. Rate changes, as well as other regulatory actions related to BGSS, are discussed further in Note 4. Regulation in the accompanying Consolidated Financial Statements.
Wholesale natural gas prices are, by their nature, volatile. NJNG mitigates the impact of volatile price changes on customers through the use of financial derivative instruments, which are part of its storage incentive program, its BGSS clause and was part of its FRM program. The FRM program was terminated effective November 2015.
Future Natural Gas Supplies
NJNG expects to meet the natural gas requirements for existing and projected firm customers into the foreseeable future. If NJNG’s long-term natural gas requirements change, NJNG expects to renegotiate and restructure its contract portfolio to better match the changing needs of its customers and changing natural gas supply landscape.
Regulation and Rates
State
NJNG is subject to the jurisdiction of the BPU with respect to a wide range of matters such as base rates and regulatory rider rates, the issuance of securities, the safety and adequacy of service, the manner of keeping its accounts and records, the sufficiency of natural gas supply, pipeline safety, environmental issues, compliance with affiliate standards and the sale or encumbrance of its properties. In September 2016, the BPU approved NJNG's filing for an increase to base rates in the amount of $45 million, effective October 2016. See Note 4. Regulation in the accompanying Consolidated Financial Statements for additional information regarding NJNG’s rate proceedings.
Page 9
New Jersey Resources Corporation
Part I
ITEM 1. BUSINESS (Continued)
Federal
FERC regulates rates charged by interstate pipeline companies for the transportation and storage of natural gas. This affects NJNG’s agreements with several interstate pipeline companies for the purchase of such services. Costs associated with these services are currently recoverable through the BGSS.
Competition
Although its franchises are nonexclusive, NJNG is not currently subject to competition from other natural gas distribution utilities with regard to the transportation of natural gas in its service territory. Due to significant distances between NJNG’s current large industrial customers and the nearest interstate natural gas pipelines, as well as the availability of its transportation tariff, NJNG currently does not believe it has significant exposure to the risk that its distribution system will be bypassed. Competition does exist from suppliers of oil, coal, electricity and propane. At the present time, however, natural gas is used in over 95 percent of new construction due to its efficiency, reliability and price advantage. Natural gas prices are a function of market supply and demand. Although NJNG believes natural gas will remain competitive with alternate fuels, no assurance can be given in this regard.
The BPU, within the framework of the EDECA, fully opened NJNG’s residential markets to competition, including third-party suppliers, and restructured rates to segregate its BGSS and delivery (i.e., transportation) prices. New Jersey’s natural gas utilities must provide BGSS in the absence of a third-party supplier. On September 30, 2017, NJNG had 32,653 residential and 10,137 commercial and industrial customers utilizing the transportation service.
Clean Energy Ventures
Our Clean Energy Ventures segment invests in, owns and operates clean energy projects, including commercial and residential solar installations located in New Jersey, and wind farms located in Montana, Iowa, Kansas, Wyoming and Pennsylvania.
As of September 30, 2017, Clean Energy Ventures constructed a total of 189.1 MW of solar capacity in New Jersey that has qualified for ITCs, including a combination of residential and commercial net-metered and grid-connected solar systems. As part of its solar investment program, Clean Energy Ventures operates a residential lease program, The Sunlight Advantage®, which provides qualifying homeowners with the opportunity to have a solar system installed at their home with no installation or maintenance expenses. Clean Energy Ventures owns, operates and maintains the system over the life of the lease in exchange for monthly lease payments. In addition, certain qualified non-profit institutions are served under PPAs. The program is operated by Clean Energy Ventures using qualified contracting partners in addition to strategic suppliers for material standardization and sourcing. The residential solar lease and PPA market is highly competitive with various companies operating in New Jersey. Clean Energy Ventures competes on price, quality and brand reputation, leveraging its partner network and customer referrals.
Clean Energy Ventures’ commercial solar projects are sourced through various channels and include both net-metered and grid-connected systems. Net-metered projects involve the sale of energy to a host and grid-connected systems into the wholesale energy markets. Project construction is competitively sourced through third parties. New Jersey has the fifth largest solar market in the U.S. according to the Solar Energy Industries Association®, with a large number of firms competing in all facets of the market including development, financing and construction.
The solar systems are registered and certified with the BPU’s Office of Clean Energy and qualified to produce SRECs. One SREC is created for every MWh of electricity produced by a solar generator. Clean Energy Ventures sells the SRECs it generates to a variety of counterparties, including electric load serving entities that serve electric customers in New Jersey and are required to comply with the solar carve-out of the Renewable Portfolio Standard. Solar projects are also currently eligible for federal ITCs in the year that they are placed into service.
In addition to its solar investments, Clean Energy Ventures invests in small to mid-size onshore wind projects that fit its investment profile. As of September 30, 2017, Clean Energy Ventures has a total of 126.6 MW of wind capacity. The wind projects are eligible for PTCs for a 10-year period following commencement of operations and have PPAs of various terms in place, which typically govern the sale of energy, capacity and/or renewable energy credits. An $89 million, 39.9 MW wind project in Somerset County, Pennsylvania was completed in December 2016.
Page 10
New Jersey Resources Corporation
Part I
ITEM 1. BUSINESS (Continued)
Clean Energy Ventures is subject to various risks including those associated with adverse federal and state legislation and regulatory policies, construction delays that can impact the timing or eligibility of tax incentives, technological changes and the future market of SRECs. See Item 1A. Risk Factors for additional information regarding these risks.
Energy Services
Our Energy Services segment consists of unregulated wholesale and retail natural gas operations and provides producer and asset management services to a diverse customer base across North America. Energy Services has acquired contractual rights to natural gas storage and transportation assets it utilizes to implement its strategic and opportunistic market strategies. The rights to these assets were acquired in anticipation of delivering natural gas, performing asset management services for customers or in conjunction with identifying strategic opportunities that exist in or between the market areas that it serves. These opportunities are driven by price differentials between market locations and/or time periods. Energy Services’ activities are conducted in the market areas in which it has strong expertise, including the U.S. and Canada. Energy Services differentiates itself in the marketplace based on price, reliability and quality of service. Its competitors include wholesale marketing and trading companies, utilities, natural gas producers and financial institutions. Energy Services’ portfolio of customers includes regulated natural gas distribution companies, industrial companies, electric generators, natural gas/liquids processors, retail aggregators, wholesale marketers and natural gas producers.
While focusing on maintaining a low-risk operating and counterparty credit profile, Energy Services’ activities specifically consist of the following elements:
• | Providing natural gas portfolio management services to nonaffiliated and affiliated natural gas utilities, electric generation facilities and natural gas producers; |
• | Managing strategies for new and existing natural gas storage and transportation assets to capture value from changes in price due to location or timing differences as a means to generate financial margin (as defined below); |
• | Managing transactional logistics to minimize the cost of natural gas delivery to customers while maintaining security of supply. Transactions utilize the most optimal and advantageous natural gas supply transportation routing available within its contractual asset portfolio and various market areas; and |
• | Managing economic hedging programs that are designed to mitigate the impact of changes in market prices on financial margin generated on its natural gas storage and transportation commitments. |
On July 27, 2017, we acquired certain wholesale transportation and retail natural gas energy contracts from Talen, providing service to large industrial retail and commercial customers in Delaware, Maryland, New Jersey and Pennsylvania. Our competitors include other retail marketing companies that provide service in the same states.
In fiscal 2017, Energy Services purchased over 10 percent of its natural gas from one supplier. Energy Services believes the loss of this supplier would not have a material adverse impact on its results of operations, financial position or cash flows as an adequate number of alternative suppliers exist.
Transportation and Storage Transactions
Energy Services focuses on creating value from the use of its physical assets, which are typically amassed through contractual rights to natural gas storage and transportation capacity. These assets become more valuable when favorable price changes occur that impact the value between or within market areas and across time periods. On a forward basis, Energy Services may hedge these price differentials through the use of financial instruments. In addition, Energy Services may seek to optimize these assets on a daily basis, as market conditions warrant, by evaluating natural gas supply and transportation availability within its portfolio. This enables Energy Services to capture geographic pricing differences across various regions as delivered natural gas prices may change favorably as a result of market conditions. Energy Services may, for example, initiate positions when intrinsic financial margin is present, and then enhance that financial margin as prices change across regions or time periods.
Energy Services also engages in park-and-loan transactions with storage and pipeline operators, where Energy Services will either borrow (receive a loan of) natural gas with an obligation to repay the storage or pipeline operator at a later date or “park” natural gas with an obligation to withdraw at a later date. In these cases, Energy Services evaluates the economics of the transaction to determine if it can capture pricing differentials in the marketplace and generate financial margin. Energy Services evaluates
Page 11
New Jersey Resources Corporation
Part I
ITEM 1. BUSINESS (Continued)
deal attributes such as fixed fees, calendar spread value from deal inception until volumes are scheduled to be returned and/or repaid, as well as the time value of money. If this evaluation demonstrates that financial margin exists, Energy Services may enter into the transaction and hedge with natural gas futures contracts, thereby locking in financial margin.
Energy Services maintains inventory balances to satisfy existing or anticipated sales of natural gas to its counterparties and/or to create additional value, as described above. During fiscal 2017 and 2016, Energy Services managed and sold 521.6 Bcf and 551.1 Bcf of natural gas, respectively. In addition, as of September 30, 2017 and 2016, Energy Services had 53.9 Bcf or $122.9 million of gas in storage and 62 Bcf or $130.5 million of gas in storage, respectively.
Weather/Seasonality
Energy Services activities are typically seasonal in nature as a result of changes in the supply and demand for natural gas. Demand for natural gas is generally higher during the winter months when there may also be supply constraints; however, during periods of milder temperatures, demand can decrease. In addition, demand for natural gas can also be high during periods of extreme heat in the summer months, resulting from the need for additional natural gas supply for gas-fired electric generation facilities. Accordingly, Energy Services can be subject to variations in earnings and working capital throughout the year as a result of changes in weather.
Volatility
Energy Services’ activities are also subject to price volatility or supply/demand dynamics within its wholesale markets, including in the Northeastern, Appalachian, West Coast and Mid-Continent regions. Changes in natural gas supply can affect capacity values and Energy Services’ financial margin, described below, that is generated from the optimization of transportation and storage assets. With its focus on risk management, Energy Services continues to diversify its revenue stream by identifying new growth opportunities in producer and asset management services. Energy Services has added new counterparties and strategic storage and transportation assets to its portfolio, which currently includes an average of approximately 44.6 Bcf of firm storage and 1.1 Bcf/day of firm transportation capacity. Energy Services continues to expand its geographic footprint.
Financial Margin
To economically hedge the commodity price risk associated with its existing and anticipated commitments for the purchase and sale of natural gas, Energy Services enters into a variety of derivative instruments including, but not limited to, futures contracts, physical forward contracts, financial swaps and options. These derivative instruments are accounted for at fair value with changes in fair value recognized in earnings as they occur. Energy Services views “financial margin” as a key internal financial metric. Energy Services’ financial margin, which is a non-GAAP financial measure, represents revenues earned from the sale of natural gas less costs of natural gas sold including any storage and transportation costs, and excluding any accounting impact from changes in the fair value of certain derivative instruments. For additional information regarding financial margin, see Item 7. Management’s Discussion and Analysis of Financial Condition and Results of Operations - Energy Services Segment.
Risk Management
In conducting its business, Energy Services mitigates risk by following formal risk management guidelines, including transaction limits, segregation of duties and formal contract and credit review approval processes. Energy Services continuously monitors and seeks to reduce the risk associated with its counterparty credit exposures. The Risk Management Committee of the Company oversees compliance with these established guidelines.
Midstream
Our Midstream segment includes investments in FERC-regulated interstate natural gas transportation and storage assets and is comprised of the following subsidiaries:
• | NJR Steckman Ridge Storage Company, which holds the Company’s 50 percent equity investment in Steckman Ridge. Steckman Ridge is a Delaware limited partnership, jointly owned and controlled by subsidiaries of the Company and subsidiaries of Enbridge Inc., that built, owns and operates a natural gas storage facility with up to 12 Bcf of working gas capacity in Bedford County, Pennsylvania. The facility has direct access to the Texas Eastern and Dominion Transmission pipelines and has access to the Northeast and Mid-Atlantic markets; |
• | NJR Pipeline Company, which consists of a 20 percent equity investment in PennEast. PennEast is expected to construct a 120-mile FERC-regulated interstate natural gas pipeline system that will extend from northern Pennsylvania to western New Jersey and is estimated to be completed and operational in 2019; and |
Page 12
New Jersey Resources Corporation
Part I
ITEM 1. BUSINESS (Continued)
• | NJR Midstream Holdings Corporation, which, through its subsidiary NJNR Pipeline Company, holds approximately 1.84 million DM Common Units. |
OTHER BUSINESS OPERATIONS
Home Services and Other
Home Services and Other operations consist primarily of the following unregulated affiliates:
• | NJRHS, which provides heating, ventilation and cooling service, sales and installation of appliances to approximately 112,000 service contract customers, as well as installation of solar equipment; |
• | NJRPS, which provides plumbing repair and installation services; |
• | CR&R, which holds commercial real estate; |
• | NJR Energy, which was dissolved on November 28, 2016, invested in energy-related ventures; and |
• | NJR Service Corporation, which provides shared administrative and financial services to the Company and all of its subsidiaries. |
ENVIRONMENT
We along with our subsidiaries are subject to legislation and regulation by federal, state and local authorities with respect to environmental matters. We believe that we are, in all material respects, in compliance with all applicable environmental laws and regulations.
NJNG is responsible for the environmental remediation of five MGP sites, which contain contaminated residues from former gas manufacturing operations that ceased at these sites by the mid-1950s and, in some cases, had been discontinued many years earlier. NJNG periodically, and at least annually, performs an environmental review of the MGP sites, including a review of potential estimated liabilities related to the investigation and remedial action on these sites. Based on this review, NJNG estimated that the total future expenditures to remediate and monitor the MGP sites for which it is responsible will range from approximately $117.6 million to $205.2 million.
NJNG’s estimate of these liabilities is based upon known and measurable facts, existing technology and enacted laws and regulations in place when the review was completed in fiscal 2017. Where it is probable that costs will be incurred, and the information is sufficient to establish a range of possible liability, NJNG accrues the most likely amount in the range. If no point within the range is more likely than the other, it is NJNG’s policy to accrue the lower end of the range. As of September 30, 2017, NJNG recorded an MGP remediation liability and a corresponding regulatory asset of $149 million on the Consolidated Balance Sheets, which represents its most likely possible liability and recoverable regulatory asset; however, actual costs may differ from these estimates. NJNG currently recovers approximately $9.4 million annually through its SBC RAC. NJNG will continue to seek recovery of these costs through its remediation rider. On November 17, 2017, NJNG filed it's annual SBC application requesting a reduction in the RAC, which will decrease the annual recovery to $7 million, effective April 1, 2018.
EMPLOYEE RELATIONS
As of September 30, 2017, the Company and its subsidiaries employed 1,052 employees compared with 1,034 employees as of September 30, 2016. Of the total number of employees, NJNG had 444 and 441 and NJRHS had 104 and 106 Union or “Represented” employees as of September 30, 2017 and 2016, respectively. NJNG and NJRHS have collective bargaining agreements with the Union, which is affiliated with the American Federation of Labor and Congress of Industrial Organizations, that expire in December 2018 and April 2019, respectively. The labor agreements cover wage increases and other benefits, including the defined benefit pension (which was closed to all employees hired on or after January 1, 2012, with the exception of certain rehires who are eligible to resume active participation), the postemployment benefit plan (which was closed to all employees hired on or after January 1, 2012) and the enhanced 401(k) retirement savings plan. The Company considers its relationship with employees, including those covered by collective bargaining agreements, to be in good standing.
Page 13
New Jersey Resources Corporation
Part I
ITEM 1. BUSINESS (Continued)
AVAILABLE INFORMATION AND CORPORATE GOVERNANCE DOCUMENTS
The following reports and any amendments to those reports are available free of charge on our website at http://njr360.client.shareholder.com/sec.cfm as soon as reasonably possible after filing or furnishing them with the SEC:
• | Annual reports on Form 10-K; |
• | Quarterly reports on Form 10-Q; and |
• | Current reports on Form 8-K. |
The following documents are available free of charge on our website (http://njr360.client.shareholder.com/governance.cfm):
• | Bylaws; |
• | Corporate Governance Guidelines; |
• | Wholesale Trading Code of Conduct; |
• | NJR Code of Conduct; |
• | Charters of the following Board of Directors Committees: Audit, Leadership Development and Compensation and Nominating/Corporate Governance; |
• | Audit Complaint Procedure; |
• | Communicating with Non-Management Directors Procedure; and |
• | Statement of Policy with Respect to Related Person Transactions. |
In Part III of this Form 10-K, we incorporate certain information by reference from our Proxy Statement for our 2018 Annual Meeting of Shareowners. We expect to file that Proxy Statement with the SEC on or about December 14, 2017. We will make it available on our website as soon as reasonably possible following that filing date. Please refer to the Proxy Statement when it is available.
A printed copy of each document is available free of charge to any shareowner who requests it by contacting the Corporate Secretary at New Jersey Resources Corporation, 1415 Wyckoff Road, Wall, New Jersey 07719.
ITEM 1A. RISK FACTORS
When considering any investment in our securities, investors should consider the following risk factors, as well as the information contained under the caption “Information Concerning Forward-Looking Statements,” in analyzing our present and future business performance. While this list is not exhaustive, management also places no priority or likelihood based on their descriptions or order of presentation. Unless indicated otherwise or the content requires otherwise, references below to “we,” “us,” and “our” should be read to refer to the Company and its subsidiaries.
Our investments in clean energy projects are subject to substantial risks and competition.
Commercial and residential solar energy projects and onshore wind projects, such as those in which we invest, are dependent upon current regulatory and tax incentives and there is uncertainty about the extent to which such incentives will be available in the future. The potential return on investment of these solar projects is based substantially on our eligibility for ITCs and the future market for SRECs that are traded in a competitive marketplace in the State of New Jersey. As a result, these projects face the risk that the current regulatory regimes and tax laws may expire or be adversely modified during the life of the projects. Furthermore, a sustained decrease in the value of SRECs would negatively impact the return on investment of solar projects. Legislative changes or declines in the price of SRECs could also lead to an impairment of solar project assets. The market for such projects is also limited, which creates competition for customers and higher investment costs and could potentially result in lost investment opportunities.
Page 14
New Jersey Resources Corporation
Part I
ITEM 1A. RISK FACTORS (Continued)
In addition, there are risks associated with our ability to develop and manage such projects profitably, including logistical risks and potential delays related to construction, permitting, regulatory approvals (including any approvals by the BPU required pursuant to recently enacted solar energy legislation in the State of New Jersey) and electric grid interconnection, as well as the operational risk that the projects in service will not perform according to expectations due to equipment failure, suboptimal weather conditions or other economic factors beyond our control. All of the aforementioned risks could reduce the availability of viable solar energy projects for development. Furthermore, at the development or acquisition stage, our ability to predict actual performance results may be hindered and the projects may not perform as predicted.
We may be unable to obtain governmental approvals, property rights and/or financing for the construction, development and operation of our proposed energy investments and projects in a timely manner or at all.
Construction, development and operation of energy investments, such as natural gas storage facilities, NJNG infrastructure improvements, such as SRL and NJ RISE, pipeline transportation systems, such as PennEast and IEC, solar energy projects and onshore wind projects are subject to federal and state regulatory oversight and require certain property rights, such as easements and rights-of-way from public and private property owners, as well as regulatory approvals, including environmental and other permits and licenses for such facilities and systems. We or our joint venture partnerships may be unable to obtain, in a cost-efficient or timely manner, all such needed property rights, permits and licenses to successfully construct and develop our energy facilities and systems. Successful financing of our energy investments requires participation by willing financial institutions and lenders, as well as acquisition of capital at favorable interest rates. If we do not obtain the necessary regulatory approvals, property rights and financing, our equity investments could be impaired. Such impairment could have a materially adverse effect on our financial condition, results of operations and cash flows.
Uncertainties associated with our planned acquisition of IEC could adversely affect our business, results of operations, financial condition and cash flows. Furthermore, any acquisitions that we undertake might involve risks and uncertainties. We may not realize the anticipated synergies, cost savings and growth opportunities as a result of these transactions.
In October 2017, we announced the entry into an agreement to purchase IEC, whose principle operations relate to the operation and maintenance of an oil and natural gas transmission pipeline extending approximately 90 miles into eastern Pennsylvania. As part of the acquisition we expect to convert the remaining sections of the southern mainline of the pipeline utilized to transport oil to transport natural gas. The completion of the acquisition is subject to various closing conditions, including, but not limited to, receipt of necessary permits and regulatory actions, such as those from the FERC and the Pennsylvania Public Utility Commission, and other pending regulatory determinations, such as compliance with anti-trust laws. There can be no assurance that we will receive the necessary approvals for the transaction or receive them within the expected timeframe. The announcement and pendency of the IEC acquisition, as well as any delays in the expected timeframe, could cause disruption and create uncertainties, which could have an adverse effect on our business, results of operations and financial condition, regardless of whether the acquisition is completed.
Furthermore, the integration of any acquisition requires significant time and resources, which could result in significant ongoing operating expenses and may divert resources and management attention from other areas of our business. If we fail to successfully integrate assets and liabilities through the entities which we acquire, we may not realize the benefits expected from the transaction and, as a result, the fair value of assets acquired could be impaired and could have a material impact on our financial condition and results of operations.
The benefits that we expect to achieve from acquisitions will depend, in part, on our ability to realize anticipated growth opportunities and other synergies with our existing businesses. The success of these transactions will depend on our ability to integrate these transactions within our existing businesses timely and seamlessly. We may experience challenges when combining separate business cultures, information technology systems and employees. Even if we are able to complete the integration successfully, we may not fully realize all of the growth opportunities, cost savings and other synergies that we expect.
Major changes in the supply and price of natural gas may affect financial results.
While NJNG expects to meet the demand for natural gas from its customers for the foreseeable future, factors impacting suppliers and other third parties, including increased competition, further deregulation, transportation costs, possible climate change legislation, transportation availability and drilling for new natural gas resources, may impact the supply and price of natural gas. NJNG actively hedges against the fluctuation in the price of natural gas by entering into forward and financial contracts with third parties. Should these third parties fail to perform and regulators not allow the pass-through of expended funds to customers, it may result in a loss that could have a material impact on our financial condition, results of operations and cash flows.
Page 15
New Jersey Resources Corporation
Part I
ITEM 1A. RISK FACTORS (Continued)
Significant regulatory assets recorded by NJNG could be disallowed for recovery from customers in the future.
NJNG records regulatory assets on its financial statements to reflect the ratemaking and regulatory decision-making authority of the BPU as allowed by GAAP. The creation of a regulatory asset allows for the deferral of costs, which, absent a mechanism to recover such costs from customers in rates approved by the BPU, would be charged to expense on its income statement in the period incurred. Primary regulatory assets that are subject to BPU approval include the recovery of BGSS and USF costs, remediation costs associated with NJNG's MGP sites, CIP, NJCEP, economic stimulus plans, certain deferred income tax and pension and other postemployment benefit plans. If there were to be a change in regulatory positions surrounding the collection of these deferred costs there could be a material impact on NJNG’s financial condition, results of operations and cash flows.
NJR is a holding company and depends on its operating subsidiaries to meet its financial obligations.
NJR is a holding company with no significant assets other than possible cash investments and the stock of its operating subsidiaries. We rely exclusively on dividends from our subsidiaries, on intercompany loans from our unregulated subsidiaries, and on the repayments of principal and interest from intercompany loans and reimbursement of expenses from our subsidiaries for our cash flows. Our ability to pay dividends on our common stock and to pay principal and interest on our outstanding debt depends on the payment of dividends to us by our subsidiaries or the repayment of loans to us by our subsidiaries. The extent to which our subsidiaries are unable to pay dividends or repay funds to us may adversely affect our ability to pay dividends to holders of our common stock and principal and interest to holders of our debt.
NJNG’s regulated operations are subject to certain operating risks incidental to handling, storing, transporting and providing customers with natural gas.
NJNG’s regulated operations are subject to all operating hazards and risks incidental to handling, storing, transporting and providing customers with natural gas, including its NGV refueling stations and LNG facilities. These risks include explosions, pollution, release of toxic substances, fires, storms, safety issues and other adverse weather conditions and hazards, each of which could result in damage to or destruction of facilities or damage to persons and property. NJNG could suffer substantial losses should any of these events occur. Moreover, as a result, NJNG has been, and likely will be, a defendant in legal proceedings and litigation arising in the ordinary course of business. Although NJNG maintains insurance coverage, insurance may not be sufficient to cover all material expenses related to these risks.
NJNG and Energy Services rely on storage, transportation assets and suppliers, which they do not own or control, to deliver natural gas.
NJNG and Energy Services depend on natural gas pipelines and other storage and transportation facilities owned and operated by third parties to deliver natural gas to wholesale and retail markets and to provide retail energy services to customers. Their ability to provide natural gas for their present and projected sales will depend upon their suppliers’ ability to obtain and deliver additional supplies of natural gas, as well as NJNG’s ability to acquire supplies directly from new sources. Factors beyond the control of NJNG, its suppliers and the independent suppliers that have obligations to provide natural gas to certain NJNG customers, may affect NJNG’s ability to deliver such supplies. These factors include other parties’ control over the drilling of new wells and the facilities to transport natural gas to NJNG’s citygate stations, competition for the acquisition of natural gas, priority allocations, impact of severe weather disruptions to natural gas supplies, the regulatory and pricing policies of federal and state regulatory agencies, as well as the availability of Canadian reserves for export to the United States. Energy deregulation legislation may increase competition among natural gas utilities and impact the quantities of natural gas requirements needed for sales service. Energy Services also relies on a firm supply source to meet its energy management obligations to its customers. If supply, transportation or storage is disrupted, including for reasons of force majeure, the ability of NJNG and Energy Services to sell and deliver their products and services may be hindered. As a result, they may be responsible for damages incurred by their customers, such as the additional cost of acquiring alternative supply at then-current market rates. Particularly for Energy Services, these conditions could have a material impact on our financial condition, results of operations and cash flows.
Risks related to the regulation of NJNG could affect the rates it is able to charge, its costs and its profitability.
NJNG is subject to regulation by federal, state and local authorities. These authorities regulate many aspects of NJNG’s distribution and transmission operations, including construction and maintenance of facilities, operations, safety, tariff rates that NJNG can charge customers, rates of return, the authorized cost of capital, recovery of pipeline replacement, environmental remediation costs and relationships with its affiliates. NJNG’s ability to obtain rate increases, including base rate increases, extend
Page 16
New Jersey Resources Corporation
Part I
ITEM 1A. RISK FACTORS (Continued)
its BGSS incentive and CIP programs and maintain its currently authorized rates of return may be impacted by events, including regulatory or legislative actions. There can be no assurance that NJNG will be able to obtain rate increases and continue its BGSS incentive, CIP, RAC and SAVEGREEN programs or continue the opportunity to earn its currently authorized rates of return.
A change in our effective tax rate as a result of a failure to qualify for ITCs and PTCs or being delayed in qualifying for ITCs due to delays or failures to complete planned solar energy projects and wind projects within the safe harbor period may have a material impact on our earnings.
GAAP requires that we apply an effective tax rate to interim periods that is consistent with our estimated annual effective tax rate. As a result, we project quarterly the annual effective tax rate and then adjust the tax expense recorded in that quarter to reflect the projected annual effective tax rate. The amount of the quarterly adjustment is based on information and assumptions, which are subject to change and may have a material impact on our quarterly and annual NFE. Factors we consider in estimating the probability of projects being completed during the fiscal year include, but are not limited to, Board of Directors approval, construction logistics, permitting, interconnection completion and execution of various contracts, including PPAs. If we fail to qualify for ITCs or are delayed in qualifying for some ITCs during the fiscal year due to delays or failures to complete planned solar energy projects as scheduled, our quarterly and annual net income and NFE may be materially impacted. This could have a material adverse impact on our financial condition, results of operations and cash flows.
For a wind facility to be considered a qualified facility for purposes of the PTCs, the construction of the facility must have begun prior to January 1, 2020, and placed in service before January 1, 2024. A taxpayer may establish that construction has begun by starting “physical work of a significant nature.” Only physical work of a significant nature on tangible personal property used as an integral part of the activity performed by the facility is considered for purposes of determining when construction begins. Alternatively, a taxpayer may establish that construction has begun by paying or incurring five percent of eligible project costs (the “five percent safe harbor”).
We are involved in legal or administrative proceedings before various courts and governmental bodies that could adversely affect our results of operations, cash flows and financial condition.
We are involved in legal or administrative proceedings before various courts and governmental bodies with respect to general claims, rates, taxes, environmental issues, gas cost prudence reviews and other matters. Adverse decisions regarding these matters, to the extent they require us to make payments in excess of amounts provided for in our financial statements or covered by insurance, could adversely affect our results of operations, cash flows and financial condition.
Cyberattacks or failure of information technology systems could adversely affect our business operations, financial condition and results of operations.
We continue to place greater reliance on technological tools that support our business operations and corporate functions, including tools that help us manage our natural gas distribution operations and infrastructure. The failure of, or security breaches related to, these technologies could materially adversely affect our business operations, our financial position, results of operations and cash flows.
We rely on information technology to manage our natural gas distribution and other corporate operations, maintain customer, employee, Company and vendor data, prepare our financial statements and perform other critical business processes. This technology may fail due to cyberattack, physical disruption, design and implementation defects or human error. Disruption or failure of business operations and information technology systems could harm our facilities or otherwise adversely impact our ability to safely deliver natural gas to our customers, serve our customers effectively or manage our assets. Additionally, an attack on, or failure of information technology systems, could result in the unauthorized release of customer, employee or other confidential or sensitive data. Any of the foregoing events could adversely affect our business reputation, diminish customer confidence, disrupt operations, subject us to financial liability or increased regulation, increase our costs and expose us to material legal claims and liability.
There is no guarantee that redundancies built into our networks and technology, or the procedures we have implemented to protect against cyberattack and other unauthorized access to secured data, are adequate to safeguard against all failures of technology or security breaches.
Page 17
New Jersey Resources Corporation
Part I
ITEM 1A. RISK FACTORS (Continued)
Credit rating downgrades could increase financing costs, limit access to the financial markets and negatively affect NJR and its subsidiaries.
Rating agencies Moody’s and S&P currently rate NJNG’s debt as investment grade. If such ratings are downgraded below investment grade, borrowing costs could increase, as will the costs of maintaining certain contractual relationships and obtaining future financing. Even if ratings are downgraded without falling below investment grade, NJR and NJNG could face increased borrowing costs under their current credit facilities. Our ability to borrow and costs of borrowing have a direct impact on our subsidiaries’ ability to execute their operating strategies, particularly in the case of NJNG, which relies heavily upon capital expenditures financed by its credit facility.
If we suffer a reduction in our credit and borrowing capacity or in our ability to issue parental guarantees, the business prospects of Energy Services, Clean Energy Ventures and Midstream, which rely on our creditworthiness, would be adversely affected. Energy Services could possibly be required to comply with various margin or other credit enhancement obligations under its trading and marketing contracts, and it may be unable to continue to trade or be able to do so only on less favorable terms with certain counterparties. Clean Energy Ventures could be required to seek alternative financing for its projects, and may be unable to obtain such financing or able to do so only on less favorable terms. In addition, NJNR Pipeline may not be able to finance its capital obligations to PennEast.
Additionally, lower credit ratings could adversely affect relationships with NJNG’s state regulators, who may be unwilling to allow NJNG to pass along increased costs to its natural gas customers.
We are subject to governmental regulation. Compliance with current and future regulatory requirements and procurement of necessary approvals, permits and certificates may result in substantial costs to us.
We are subject to substantial regulation from federal, state and local regulatory authorities. We are required to comply with numerous laws and regulations and to obtain numerous authorizations, permits, approvals and certificates from governmental agencies. These agencies regulate various aspects of our business, including customer rates, services, construction and natural gas pipeline operations.
The FERC has regulatory authority over some of our operations, including sales of natural gas in the wholesale and retail markets and the purchase and sale of interstate pipeline and storage capacity. Any Congressional legislation or agency regulation that would alter these or other similar statutory and regulatory structures in a way to significantly raise costs that could not be recovered in rates from customers, that would reduce the availability of supply or capacity or that would reduce our competitiveness could negatively impact our earnings. In addition, changes in and compliance with laws such as the Pipeline Safety, Regulatory Certainty and Job Creation Act of 2011 could increase federal regulatory oversight and administrative costs that may not be recovered in rates from customers, which could have an adverse impact on our earnings.
We cannot predict the impact of any future revisions or changes in interpretations of existing regulations or the adoption of new laws and applicable regulations. Changes in regulations or the imposition of additional regulations could influence our operating environment and may result in substantial costs to us.
Adverse economic conditions, including inflation, increased natural gas costs, foreclosures and business failures, could adversely impact NJNG’s customer collections and increase our level of indebtedness.
Inflation may cause increases in certain operating and capital costs. We continually review the adequacy of NJNG’s base tariff rates in relation to the increasing cost of providing service and the inherent regulatory lag in adjusting those rates. The ability to control operating expenses is an important factor that will influence future results.
Rapid increases in the price of purchased gas may cause NJNG to experience a significant increase in short-term debt because it must pay suppliers for gas when it is purchased, which can be significantly in advance of when these costs may be recovered through the collection of monthly bills for gas delivered to customers. Increases in purchased gas costs also slow collection efforts as customers are more likely to delay the payment of their gas bills, leading to higher-than-normal accounts receivable.
If we are unable to access the financial markets or there are adverse conditions in the equity or credit markets, it could affect management’s ability to execute our business plans.
We rely on access to both short-term and long-term credit markets as significant sources of liquidity for capital requirements not satisfied by our cash flow from operations. Any deterioration in our financial condition could hamper our ability to access the equity or credit markets or otherwise obtain debt financing on terms favorable to us or at all. In addition, because certain state
Page 18
New Jersey Resources Corporation
Part I
ITEM 1A. RISK FACTORS (Continued)
regulatory approvals may be necessary for NJNG to incur debt, NJNG may be unable to access credit markets on a timely basis. External events could also increase the cost of borrowing or adversely affect our ability to access the financial markets. Such external events could include the following:
• | economic weakness and/or political instability in the United States or in the regions where we operate; |
• | political conditions, such as a shutdown of the U.S. federal government; |
• | financial difficulties of unrelated energy companies; |
• | capital market conditions generally; |
• | volatility in the equity markets; |
• | market prices for natural gas; |
• | the overall health of the natural gas utility industry; and |
• | fluctuations in interest rates, particularly with respect to NJNG’s variable rate debt instruments. |
Our ability to secure short-term financing is subject to conditions in the credit markets. A prolonged constriction of credit availability could affect management’s ability to execute our business plan. An inability to access capital may limit our ability to pursue improvements or acquisitions that we may otherwise rely on for both current operations and future growth.
Energy Services and NJNG execute derivative transactions with financial institutions as a part of their economic hedging strategy and could incur losses associated with the inability of a financial counterparty to meet or perform under its obligations as a result of adverse conditions in the credit markets or their ability to access capital or post collateral.
The cost of providing pension and postemployment health care benefits to eligible former employees is subject to changes in pension fund values, interest rates and changing demographics and may have a material adverse effect on our financial results.
We have two defined benefit pension plans and two OPEB plans for the benefit of eligible full-time employees and qualified retirees, which were closed to all employees hired on or after January 1, 2012. The cost of providing these benefits to eligible current and former employees is subject to changes in the market value of the pension and OPEB fund assets, changing discount rates and changing actuarial assumptions based upon demographics, including longer life expectancy of beneficiaries, an expected increase in the number of eligible former employees over the next five years, impacts from healthcare legislation and increases in health care costs.
Significant declines in equity markets and/or reductions in bond yields can have a material adverse effect on the funded status of our pension and OPEB plans. In these circumstances, we may be required to recognize increased pension and OPEB expenses and/or be required to make additional cash contributions into the plans.
The funded status of these plans, and the related cost reflected in our financial statements, are affected by various factors that are subject to an inherent degree of uncertainty. Under the Pension Protection Act of 2006, losses of asset values may necessitate increased funding of the plans in the future to meet minimum federal government requirements. A significant decrease in the asset values of these plans can result in funding obligations earlier than we had originally planned, which would have a negative impact on cash flows from operations, decrease our borrowing capacity and increase our interest expense.
We are exposed to market risk and may incur losses in our wholesale business.
Our storage and transportation portfolios consist of contracts to transport and store natural gas. The value of our storage and transportation portfolio could be negatively impacted if the value of these contracts change in a direction or manner that we do not anticipate. In addition, upon expiration of these storage and transportation contracts, to the extent that they are renewed or replaced at less favorable terms, our results of operations and cash flows could be negatively impacted.
Page 19
New Jersey Resources Corporation
Part I
ITEM 1A. RISK FACTORS (Continued)
Our economic hedging activities that are designed to protect against commodity and financial market risks, including the use of derivative contracts in the normal course of Energy Services’ business, may cause fluctuations in reported financial results and financial losses that negatively impact results of operations and our stock price.
We use derivatives, including futures, forwards, options, swaps and foreign exchange contracts to manage commodity, financial market and foreign currency risks. The timing of the recognition of gains or losses associated with our economic hedges in accordance with GAAP does not always coincide with the gains or losses on the items being hedged. The difference in accounting can result in volatility in reported results, even though the expected profit margin is essentially unchanged from the dates the transactions were consummated.
In addition, Energy Services could recognize financial losses on these contracts as a result of volatility in the market values of the underlying commodities or if a counterparty fails to perform under a contract. In the absence of actively quoted market prices and pricing information from external sources, the valuation of these financial instruments can involve management’s judgment or use of estimates. As a result, changes in the underlying assumptions or use of alternative valuation methods could adversely affect the value of the reported fair value of these contracts.
Energy Services' earnings and cash flows are dependent upon optimization of its physical assets.
Energy Services' earnings and cash flows are based, in part, on its ability to optimize its portfolio of contractual-based natural gas storage and pipeline assets. The optimization strategy involves utilizing its physical assets to take advantage of differences in natural gas prices between geographic locations and/or time periods. Any change among various pricing points could affect these differentials. In addition, significant increases in the supply of natural gas in Energy Services' market areas, including as a result of increased production along the Marcellus Shale, can reduce Energy Services' ability to take advantage of pricing fluctuations in the future. Changes in pricing dynamics and supply could have an adverse impact on Energy Services' optimization activities, earnings and cash flows. Energy Services incurs fixed demand fees to acquire its contractual rights to storage and transportation assets. Should commodity prices at various locations or time periods change in such a way that Energy Services is not able to recoup these costs from its customers, the cash flows and earnings at Energy Services, and ultimately the Company, could be adversely impacted.
A valuation allowance may be required for our deferred tax assets.
A valuation allowance may need to be recorded against our net deferred tax assets, which are predominantly related to net operating losses, based on available evidence, including cumulative and forecasted taxable income at the time the estimate is made. A valuation allowance related to deferred tax assets can be affected by changes to tax laws, statutory tax rates and future taxable income levels. In the event that we determine that we would not be able to realize all or a portion of our net deferred tax assets in the future, we would reduce such amounts accordingly through a charge to income tax expense in the period in which that determination was made, which could have a material adverse impact on our financial condition and results of operations.
Changes in tax laws or regulations may negatively affect our results of operations, net income, financial condition and cash flows.
We are subject to taxation by various taxing authorities at the federal, state and local levels. The current administration has made federal corporate tax reform one of its priorities and the possibility of such reform is thought to be increased in light of the Republican-led Congress. While such reform is likely to be favorable to corporations generally, the structure of any such reform is unknown and a change in tax laws or rates could in fact adversely affect our results of operations, net income, financial condition and cash flows. We cannot predict the timing or structure of such tax-related developments.
Changes in weather conditions may affect earnings and cash flows.
Weather conditions and other natural phenomena can have an adverse impact on our earnings and cash flows. Severe weather conditions can impact suppliers and the pipelines that deliver gas to NJNG’s distribution system. Extended mild weather, during either the winter period or summer period, can have a significant impact on demand for and the cost of natural gas. While we believe the CIP mitigates the impact of weather variations on NJNG’s gross margin, severe weather conditions may have an impact on the ability of suppliers and pipelines to deliver the natural gas to NJNG, which can negatively affect our earnings. The CIP does not mitigate the impact of severe weather conditions on our cash flows.
Page 20
New Jersey Resources Corporation
Part I
ITEM 1A. RISK FACTORS (Continued)
Future results at Energy Services are subject to volatility in the natural gas market due to weather. Variations in weather may affect earnings and working capital needs throughout the year. During periods of milder temperatures, demand and volatility in the natural gas market may decrease, which can negatively impact Energy Services' earnings and cash flows.
Failure by NJR and/or NJNG to comply with debt covenants may impact our financial condition.
Our long-term debt obligations contain financial covenants related to debt-to-capital ratios and, in the case of NJNG, an interest coverage ratio. These debt obligations also contain provisions that put limitations on our ability to finance future operations or capital needs or to expand or pursue certain business activities. For example, certain of these agreements contain provisions that, among other things, put limitations on our ability to make loans or investments, make material changes to the nature of our businesses, merge, consolidate or engage in asset sales, grant liens or make negative pledges. Furthermore, the debt obligations contain covenants and other provisions requiring us to provide timely delivery of accurate financial statements prepared in accordance with GAAP. The failure to comply with any of these covenants could result in an event of default, which, if not cured or waived, could result in the acceleration of outstanding debt obligations and/or the inability to borrow under existing revolving credit facilities. We have relied, and continue to rely, upon short-term bank borrowings or commercial paper supported by our revolving credit facilities to finance the execution of a portion of our operating strategies. NJNG is dependent on these capital sources to purchase its natural gas supply and maintain its properties. The acceleration of our outstanding debt obligations and our inability to borrow under the existing revolving credit facilities would cause a material adverse change in NJR’s and NJNG’s financial condition.
Changes in customer growth may affect earnings and cash flows.
NJNG’s ability to increase its utility firm gross margin is dependent upon the new construction housing market, as well as the conversion of customers to natural gas from other fuel sources. During periods of extended economic downturns, prolonged weakness in housing markets or slowdowns in the conversion market, there could be an adverse impact on NJNG’s utility firm gross margin, earnings and cash flows. Furthermore, while our estimate regarding customer growth is based in part upon information from third parties, the estimate has not been verified by an independent source and is subject to the aforementioned risks and uncertainties, which could cause actual results to materially deviate from the estimate.
We may be adversely impacted by natural disasters, pandemic illness, terrorist activities and other extreme events to which we may be unable to promptly respond.
Local or national natural disasters, pandemic illness, terrorist activities and other extreme events are a threat to our assets and operations. Companies in our industry that are located in our service territory may face a heightened risk due to exposure to acts of terrorism that could target or impact our natural gas distribution, transmission and storage facilities and disrupt our operations and ability to meet customer requirements. In addition, the threat of terrorist activities could lead to increased economic instability and volatility in the price of natural gas that could affect our operations. Natural disasters or actual or threatened terrorist activities may also disrupt capital markets and our ability to raise capital, or may impact our suppliers or our customers directly. A local disaster or pandemic illness could result in part of our workforce being unable to operate or maintain our infrastructure or perform other tasks necessary to conduct our business. In addition, these risks could result in loss of human life, significant damage to property, environmental damage, impairment of our operations and substantial loss to the Company. Our regulators may not allow us to recover from our customers part or all of the increased cost related to the foregoing events, which could negatively affect our financial condition, results of operations and cash flows.
We maintain emergency planning and training programs to readily respond to events that could cause business interruption. However, a slow or inadequate response to events may have an adverse impact on operations and earnings. We may be unable to obtain sufficient insurance to cover all risks associated with local and national disasters, pandemic illness, terrorist activities and other events, which could increase the risk that an event adversely affects our financial condition, results of operations and cash flows.
Our costs of compliance with present and future environmental laws are significant and could adversely affect our cash flows and profitability.
Our operations are subject to extensive federal, state and local environmental statutes, rules and regulations relating to air quality, water quality, waste management, natural resources and site remediation. Compliance with these laws and regulations may require us to expend significant financial resources to, among other things, conduct site remediation and perform environmental
Page 21
New Jersey Resources Corporation
Part I
ITEM 1A. RISK FACTORS (Continued)
monitoring. If we fail to comply with applicable environmental laws and regulations, even if we are unable to do so due to factors beyond our control, we may be subject to civil liabilities or criminal penalties and may be required to incur significant expenditures to come into compliance. Additionally, any alleged violations of environmental laws and regulations may require us to expend significant resources in our defense against alleged violations.
Furthermore, the U.S. Congress has for some time been considering various forms of climate change legislation. There is a possibility that, when and if enacted, the final form of such legislation could impact our costs and put upward pressure on natural gas prices. Higher cost levels could impact the competitive position of natural gas and negatively affect our growth opportunities, cash flows and earnings.
Failure to attract and retain an appropriately qualified employee workforce could adversely affect operations.
Our ability to implement our business strategy and serve our customers is dependent upon our continuing ability to attract and retain talented professionals and a technically skilled workforce, and being able to transfer the knowledge and expertise of our workforce to new employees as our aging employees retire. Failure to hire and adequately train replacement employees, including the transfer of significant internal historical knowledge and expertise to the new employees, or the future availability and cost of contract labor could adversely affect the ability to manage and operate our business. Furthermore, the majority of our natural gas distribution segment workforce is represented by the Union and is covered by a collective bargaining agreement that will expire in December 2018. Disputes with the Union over terms and conditions of the agreement could result in instability in our labor relationship and work stoppages that could impact the timely delivery of gas and other services from our utility, which could strain relationships with customers and state regulators and cause a loss of revenues that could adversely affect our results of operations. Our collective bargaining agreement may also increase the cost of employing our natural gas distribution segment workforce, affect our ability to continue offering market-based salaries and employee benefits, limit our flexibility in dealing with our workforce, and limit our ability to change work rules and practices and implement other efficiency-related improvements to successfully compete in today’s challenging marketplace.
Investing through partnerships, joint ventures or in an MLP decreases our ability to manage risk.
We have utilized joint ventures through partnerships for certain midstream investments, including Steckman Ridge and PennEast, and we own a minority interest in DM, an MLP, through our investment in DM Common Units. Although we currently have no specific plans to do so, we may acquire interests in other joint ventures or partnerships in the future. In these joint ventures or partnerships, we may not have the right or power to direct the management and policies of the joint ventures or partnerships, and other participants or investors may take action contrary to our instructions or requests and against our policies and objectives. In addition, the other participants may become bankrupt or have economic or other business interests or goals that are inconsistent with those of NJR and our subsidiaries. Our financial condition, results of operations or cash flows could be harmed if a joint venture participant acts contrary to our interests.
Additionally, our investment in DM has risks that are unique to investments in MLPs. Holders of MLP common units have limited control and voting rights on matters affecting the MLP, and investments in MLPs may have limited liquidity. Additionally, if DM is treated as a corporation for federal income tax purposes as a result of a change in current law or a change in DM’s business, such treatment would result in a reduction in the after-tax return to us and may cause a reduction in the value of our investment in DM Common Units.
Our certificate of incorporation and bylaws may delay or prevent a transaction that stockholders would view as favorable.
Our certificate of incorporation and bylaws, as well as New Jersey law, contain provisions that could delay, defer or prevent an unsolicited change in control of NJR, which may negatively affect the market price of our common stock or the ability of stockholders to participate in a transaction in which they might otherwise receive a premium for their shares over the then current market price. These provisions may also prevent changes in management. In addition, our Board of Directors is authorized to issue preferred stock without stockholder approval on such terms as our Board of Directors may determine. Our common stockholders will be subject to, and may be negatively affected by, the rights of any preferred stock that may be issued in the future. In addition, we are subject to the New Jersey Shareholders’ Protection Act, which could delay or prevent a change of control of NJR.
Page 22
New Jersey Resources Corporation
Part I
ITEM 1B. UNRESOLVED STAFF COMMENTS
None
ITEM 2. PROPERTIES
Natural Gas Distribution Segment
NJNG owns approximately 7,197 miles of distribution main, 7,424 miles of service main, 226 miles of transmission main and approximately 549,000 meters. Mains are primarily located under public roads. Where mains are located under private property, NJNG has obtained easements from the owners of record.
Additionally, NJNG owns and operates two LNG storage plants in Stafford Township, Ocean County; and Howell Township, Monmouth County. The two LNG plants have an aggregate estimated maximum capacity of approximately 170,000 Dths per day and 1 Bcf of total capacity. These facilities are used for peaking natural gas supply and for emergencies. NJNG’s Liquefaction facility is also located on the Howell Township property and allows NJNG to convert natural gas into LNG to fill NJNG’s existing LNG storage tanks.
NJNG owns four service centers located in Rockaway Township, Morris County; Atlantic Highlands and Wall Township, Monmouth County; and Lakewood, Ocean County. These service centers house storerooms, garages, gas distribution and administrative offices. NJNG leases its headquarters and customer service facilities in Wall Township, Monmouth County, a customer service office in Asbury Park, Monmouth County and a service center in Manahawkin, Ocean County. These customer service offices support customer contact, marketing, economic development and other functions.
Substantially all of NJNG’s properties, not expressly excepted or duly released, are subject to the lien of the Mortgage Indenture as security for NJNG’s mortgage bonds, which totaled $672 million as of September 30, 2017. In addition, under the terms of the Mortgage Indenture, NJNG could have issued up to $960 million of additional first mortgage bonds as of September 30, 2017.
Clean Energy Ventures Segment
Clean Energy Ventures has various solar contracts, including lease agreements and easements, allowing the installation, operation and maintenance of solar equipment and access to the various properties, including commercial and residential rooftops. In addition to the lease agreements and easements, Clean Energy Ventures owns solar panels with a total of 189.1 MW of capacity throughout New Jersy and owns 79.5 acres of land in Vineland, New Jersey.
Clean Energy Ventures is also party to various land lease agreements and easements, which allow for the installation, operation and maintenance of wind turbines, associated electric collection facilities, substations, operation and maintenance buildings and access to the various properties. Clean Energy Ventures has a total of 126.6 MW of wind capacity and owns wind projects in Two Dot, Montana, Carroll County, Iowa, Rush County, Kansas, Carbon County, Wyoming and Somerset County, Pennsylvania. In addition to the lease agreements and easements, Clean Energy Ventures owns 1.8 acres and 7.1 acres of land for its Carroll County and Rush County wind projects, respectively. Clean Energy Ventures also owns a building on .16 acres in Rush County, Kansas that is used for operation and maintenance purposes.
Clean Energy Ventures leases office space in Wall Township, New Jersey.
Energy Services Segment
As of September 30, 2017, Energy Services leases office space in Wall Township, New Jersey, Houston, Texas, and Allentown, Pennsylvania.
Midstream Segment
As of September 30, 2017, Steckman Ridge owned and/or leased storage rights on approximately 6,300 acres of land in Bedford County, Pennsylvania, with a FERC-regulated natural gas storage facility with up to 12 Bcf of working gas capacity. Equipment on the property includes a compressor station, gathering pipelines and pipeline interconnections. As of September 30, 2017, PennEast owned 74 acres of land in Carbon County, Pennsylvania and 58.7 acres of land in Mercer County, New Jersey.
Page 23
New Jersey Resources Corporation
Part I
ITEM 2. PROPERTIES (Continued)
All Other Business Operations
As of September 30, 2017, CR&R’s real estate portfolio consisted of 35 acres of undeveloped land in Atlantic County with a net book value of $1.4 million.
NJRHS leases service centers in Dover, Morris County and Wall, Monmouth County, New Jersey.
Capital Expenditure Program
See Item 7. Management’s Discussion and Analysis of Financial Condition and Results of Operations for a discussion of anticipated fiscal 2018 and 2019 capital expenditures, as applicable to the Company’s reporting segments and business operations.
ITEM 3. LEGAL PROCEEDINGS
Manufactured Gas Plant Remediation
NJNG is responsible for the remedial cleanup of five MGP sites, dating back to gas operations in the late 1800s and early 1900s, which contain contaminated residues from former gas manufacturing operations. NJNG is currently involved in administrative proceedings with the NJDEP, and is participating in various studies and investigations by outside consultants to determine the nature and extent of any such contaminated residues and to develop appropriate programs of remedial action, where warranted, under Administrative Consent Orders or a Memoranda of Agreement with the NJDEP.
NJNG may recover its remediation expenditures, including carrying costs, over rolling seven-year periods pursuant to a RAC approved by the BPU. NJNG currently recovers approximately $9.4 million annually through it's SBC RAC. On November 17, 2017, NJNG filed it's annual SBC application requesting a reduction in the RAC, which will decrease the annual recovery to $7 million, effective April 1, 2018. As of September 30, 2017, $28.5 million of previously incurred remediation costs, net of recoveries from customers and insurance proceeds, are included in regulatory assets on the Consolidated Balance Sheets.
NJNG periodically, and at least annually, performs an environmental review of the MGP sites, including a review of potential liability for investigation and remedial action. NJNG estimated at the time of the most recent review that total future expenditures to remediate and monitor the MGP sites for which it is responsible, including potential liabilities for Natural Resource Damages that might be brought by the NJDEP for alleged injury to groundwater or other natural resources concerning these sites, will range from approximately $117.6 million to $205.2 million. NJNG’s estimate of these liabilities is based upon known facts, existing technology and enacted laws and regulations in place when the review was completed. Where it is probable that costs will be incurred, and the information is sufficient to establish a range of possible liability, NJNG accrues the most likely amount in the range. If no point within the range is more likely than the other, it is NJNG’s policy to accrue the lower end of the range. Accordingly, as of September 30, 2017, NJNG recorded an MGP remediation liability and a corresponding regulatory asset of $149 million on the Consolidated Balance Sheets, based on the most likely amount. This was reduced from $172 million in fiscal 2016, due to the completion of remediation work at certain sites and a reduction to the remediation scope at another site. The actual costs to be incurred by NJNG are dependent upon several factors, including final determination of remedial action, changing technologies and governmental regulations, the ultimate ability of other responsible parties to pay and any insurance recoveries.
NJNG will continue to seek recovery of MGP-related costs through the RA. If any future regulatory position indicates that the recovery of such costs is not probable, the related non-recoverable costs would be charged to income in the period of such determination.
Litigation
We are involved, and from time to time in the future may be involved, in a number of pending and threatened judicial, regulatory and arbitration proceedings relating to matters that arise in connection with the conduct of its business, certain of which litigation matters are described in Note 14. Commitments and Contingent Liabilities in the accompanying Consolidated Financial Statements. In view of the inherent difficulty of predicting the outcome of litigation matters, particularly when such matters are in their early stages or where the claimants seek indeterminate damages, we cannot state with confidence what the eventual outcome of the pending litigation will be, what the timing of the ultimate resolution of these matters will be, or what the eventual loss, fines or penalties related to each pending matter will be, if any.
Page 24
New Jersey Resources Corporation
Part I
ITEM 3. LEGAL PROCEEDINGS
In accordance with applicable accounting guidance, we establish reserves for litigation for those matters that present loss contingencies as to which it is both probable that a loss will be incurred and the amount of such loss can be reasonably estimated. Based upon currently available information, we believe that the results of litigation that is currently pending, taken together, will not have a materially adverse effect on our financial condition, results of operations or cash flows. The actual results of resolving the pending litigation matters may be substantially higher than the amounts reserved.
ITEM 4. MINE SAFETY DISCLOSURES
Not applicable
ITEM 4A. EXECUTIVE OFFICERS OF THE COMPANY
The Company’s Executive Officers and their age, position and business experience during the past five years are set forth below.
Name | Age | Officer since | Office held during last five years |
Laurence M. Downes | 60 | 1986 | Chairman of the Board (September 1996 - present) President and Chief Executive Officer (July 1995 - present) |
Patrick J. Migliaccio | 43 | 2013 | Senior Vice President (January 2016 - present) Chief Financial Officer (January 2016 - present) Vice President, Finance and Accounting (November 2014 - December 2015) Treasurer (August 2013 - May 2015) Corporate Controller (January 2012 - August 2013) |
Stephen D. Westhoven | 49 | 2004 | Executive Vice President and Chief Operating Officer (November 2017 - present) Senior Vice President and Chief Operating Officer, NJRES and NJRCEV (October 2016 - October 2017) Senior Vice President, NJRES (May 2010 - September 2016) |
Kathleen T. Ellis | 64 | 2004 | Executive Vice President, Policy and Strategic Development, NJR (October 2016 - present) Executive Vice President and Chief Operating Officer, NJNG (February 2008 - September 2016) Senior Vice President, Corporate Affairs (December 2004 - present) |
Amanda E. Mullan | 51 | 2015 | Senior Vice President and Chief Human Resources Officer (January 2017 - present) Vice President and Chief Human Resources Officer (April 2015 - December 2016) Senior Vice President of HR, N. America, Willis Group Holdings, a risk management and insurance intermediary (April 2012 - April 2015) |
Jacqueline K. Shea | 53 | 2016 | Vice President and Chief Information Officer (June 2016 - present) Chief Information Officer, Godiva Chocolatier, a manufacturer of premium fine chocolates and related products (March 2011 - May 2016) |
Nancy A. Washington | 53 | 2017 | Senior Vice President and General Counsel (March 2017 - present) Senior Vice President and Chief Litigation Counsel, CIT Group Inc., a Livingston, NJ-based financial services firm (September 2010 - March 2017) |
Page 25
New Jersey Resources Corporation
Part II
ITEM 5. MARKET FOR THE REGISTRANT’S COMMON EQUITY, RELATED STOCKHOLDER MATTERS AND
ISSUER PURCHASES OF EQUITY SECURITIES
NJR’s Common Stock is traded on the New York Stock Exchange under the ticker symbol NJR. As of September 30, 2017, NJR had 48,784 holders of record of its common stock.
NJR’s common stock high and low sales prices and dividends paid per share were as follows:
2017 | 2016 | Dividends Paid | ||||
High | Low | High | Low | 2017 | 2016 | |
Fiscal Quarter | ||||||
First | $37.30 | $30.46 | $34.07 | $28.02 | $0.255 | $0.240 |
Second | $39.95 | $33.70 | $36.85 | $32.32 | $0.255 | $0.240 |
Third | $43.50 | $38.95 | $38.56 | $33.91 | $0.255 | $0.240 |
Fourth | $44.30 | $39.50 | $38.92 | $32.27 | $0.255 | $0.240 |
In 1996, the Board of Directors authorized the Company to implement a share repurchase program, which has been expanded seven times since the inception of the program. The Share Repurchase Plan allows the Company to purchase its outstanding shares on the open market or in negotiated transactions, based on market and other conditions. The Company is not required to purchase any specific number of shares and may discontinue or suspend the program at any time. The Share Repurchase Plan will expire when we have repurchased all shares authorized for repurchase thereunder, unless it is earlier terminated by action of our Board of Directors or additional shares are authorized for repurchase.
The following table sets forth NJR’s repurchase activity for the quarter ended September 30, 2017:
Period | Total Number of Shares (or Units) Purchased | Average Price Paid per Share (or Unit) | Total Number of Shares (or Units) Purchased as Part of Publicly Announced Plans or Programs | Maximum Number (or Approximate Dollar Value) of Shares (or Units) That May Yet Be Purchased Under the Plans or Programs | ||||
7/01/17 - 7/31/17 | — | $ | — | — | 2,431,053 | |||
8/01/17 - 8/31/17 | — | $ | — | — | 2,431,053 | |||
9/01/17 - 9/30/17 | — | $ | — | — | 2,431,053 | |||
Total | — | $ | — | — | 2,431,053 | |||
Page 26
New Jersey Resources Corporation
Part II
ITEM 6. SELECTED FINANCIAL DATA
CONSOLIDATED FINANCIAL STATISTICS
(Thousands, except per share data) | |||||||||||||||
Fiscal Years Ended September 30, | 2017 | 2016 | 2015 | 2014 | 2013 | ||||||||||
SELECTED FINANCIAL DATA | |||||||||||||||
Operating revenues | $ | 2,268,617 | $ | 1,880,905 | $ | 2,733,987 | $ | 3,738,145 | $ | 3,198,068 | |||||
Gas purchases | $ | 1,703,767 | $ | 1,352,686 | $ | 2,085,645 | $ | 3,139,525 | $ | 2,712,223 | |||||
Net income | $ | 132,065 | $ | 131,672 | $ | 180,960 | $ | 141,970 | $ | 114,809 | |||||
Total assets | $ | 3,928,507 | $ | 3,718,570 | $ | 3,284,357 | $ | 3,125,388 | $ | 3,001,414 | |||||
Common stock equity | $ | 1,236,643 | $ | 1,166,591 | $ | 1,106,956 | $ | 966,166 | $ | 887,384 | |||||
Long-term debt (1) (2) | $ | 997,080 | $ | 1,055,038 | $ | 843,595 | $ | 598,209 | $ | 512,886 | |||||
COMMON STOCK DATA | |||||||||||||||
Earnings per share-basic | $1.53 | $1.53 | $2.12 | $1.69 | $1.38 | ||||||||||
Earnings per share-diluted | $1.52 | $1.52 | $2.10 | $1.67 | $1.37 | ||||||||||
Dividends declared per share | $1.038 | $0.975 | $0.915 | $0.855 | $0.810 | ||||||||||
NON-GAAP RECONCILIATION | |||||||||||||||
Net income | $ | 132,065 | $ | 131,672 | $ | 180,960 | $ | 141,970 | $ | 114,809 | |||||
Add: | |||||||||||||||
Unrealized (gain) loss on derivative instruments and related transactions | (11,241 | ) | 46,883 | (38,681 | ) | 28,534 | (9,418 | ) | |||||||
Tax effect | 4,062 | (17,018 | ) | 14,391 | (10,492 | ) | 3,462 | ||||||||
Effects of economic hedging related to natural gas inventory | 38,470 | (36,816 | ) | (8,225 | ) | 26,639 | 7,635 | ||||||||
Tax effect | (13,964 | ) | 13,364 | 3,058 | (9,794 | ) | (2,807 | ) | |||||||
Net financial earnings (3) | $ | 149,392 | $ | 138,085 | $ | 151,503 | $ | 176,857 | $ | 113,681 | |||||
Basic earnings per share | $1.53 | $1.53 | $2.12 | $1.69 | $1.38 | ||||||||||
Add: | |||||||||||||||
Unrealized (gain) loss on derivative instruments and related transactions | (0.13 | ) | 0.55 | (0.45 | ) | 0.34 | (0.11 | ) | |||||||
Tax effect | 0.05 | (0.20 | ) | 0.17 | (0.13 | ) | 0.04 | ||||||||
Effects of economic hedging related to natural gas inventory | 0.45 | (0.43 | ) | (0.10 | ) | 0.32 | 0.09 | ||||||||
Tax effect | (0.17 | ) | 0.16 | 0.04 | (0.12 | ) | (0.04 | ) | |||||||
Net financial earnings per share-basic (3) | $1.73 | $1.61 | $1.78 | $2.10 | $1.36 | ||||||||||
Diluted earnings per share | $1.52 | $1.52 | $2.10 | $1.67 | $1.37 | ||||||||||
Add: | |||||||||||||||
Unrealized (gain) loss on derivative instruments and related transactions | (0.13 | ) | 0.54 | (0.45 | ) | 0.34 | (0.11 | ) | |||||||
Tax effect | 0.05 | (0.20 | ) | 0.17 | (0.12 | ) | 0.04 | ||||||||
Effects of economic hedging related to natural gas inventory | 0.44 | (0.42 | ) | (0.10 | ) | 0.31 | 0.09 | ||||||||
Tax effect | (0.17 | ) | 0.15 | 0.04 | (0.12 | ) | (0.03 | ) | |||||||
Net financial earnings per share-diluted (3) | $1.71 | $1.59 | $1.76 | $2.08 | $1.36 | ||||||||||
(1) | Includes long-term capital leases of $28.9 million, $30.7 million, $35.7 million, $40.4 million and $43 million, respectively. |
(2) | Includes long-term solar asset financing obligation of $28.2 million in fiscal 2017. |
(3) | NFE is a non-GAAP financial measure that eliminates the timing differences surrounding the recognition of certain derivative gains or losses, to effectively match the earnings effects of economic hedges associated with the physical sale or purchase of gas and, therefore, eliminate the impact of volatility to GAAP earnings associated with the related derivative instruments. For further discussion of this financial measure, see the Energy Services segment in Item 7. Management’s Discussion and Analysis of Financial Condition and Results of Operations. |
Page 27
New Jersey Resources Corporation
Part II
ITEM 6. SELECTED FINANCIAL DATA (Continued)
NJNG OPERATING STATISTICS
Fiscal Years Ended September 30, | 2017 | 2016 | 2015 | 2014 | 2013 | ||||||||||
Operating revenues ($ in thousands) | |||||||||||||||
Residential | $ | 395,315 | $ | 345,597 | $ | 466,464 | $ | 469,831 | $ | 467,269 | |||||
Commercial, industrial and other | 98,777 | 80,994 | 106,505 | 110,740 | 99,736 | ||||||||||
Firm transportation | 73,206 | 69,696 | 77,974 | 86,131 | 73,745 | ||||||||||
Total residential and commercial | 567,298 | 496,287 | 650,943 | 666,702 | 640,750 | ||||||||||
Interruptible | 7,970 | 8,867 | 10,049 | 9,384 | 9,066 | ||||||||||
Total system | 575,268 | 505,154 | 660,992 | 676,086 | 649,816 | ||||||||||
BGSS incentive programs | 120,369 | 89,192 | 120,978 | 143,329 | 138,171 | ||||||||||
Total operating revenues | $ | 695,637 | $ | 594,346 | $ | 781,970 | $ | 819,415 | $ | 787,987 | |||||
Throughput (Bcf) | |||||||||||||||
Residential | 40.7 | 36.9 | 45.9 | 43.1 | 38.3 | ||||||||||
Commercial, industrial and other | 8.7 | 7.3 | 9.6 | 8.2 | 7.5 | ||||||||||
Firm transportation | 14.4 | 14.1 | 16.0 | 17.7 | 15.2 | ||||||||||
Total residential and commercial | 63.8 | 58.3 | 71.5 | 69.0 | 61.0 | ||||||||||
Interruptible | 55.0 | 61.5 | 47.1 | 10.5 | 10.9 | ||||||||||
Total system | 118.8 | 119.8 | 118.6 | 79.5 | 71.9 | ||||||||||
BGSS incentive programs | 178.4 | 216.7 | 222.4 | 180.8 | 141.5 | ||||||||||
Total throughput | 297.2 | 336.5 | 341.0 | 260.3 | 213.4 | ||||||||||
Customers at year-end | |||||||||||||||
Residential | 460,013 | 448,273 | 437,979 | 422,742 | 408,399 | ||||||||||
Commercial, industrial and other | 26,947 | 26,218 | 25,541 | 24,684 | 24,302 | ||||||||||
Firm transportation | 42,790 | 46,608 | 48,673 | 56,777 | 64,651 | ||||||||||
Total residential and commercial | 529,750 | 521,099 | 512,193 | 504,203 | 497,352 | ||||||||||
Interruptible | 33 | 34 | 35 | 37 | 41 | ||||||||||
BGSS incentive programs | 27 | 30 | 24 | 34 | 38 | ||||||||||
Total customers at year-end | 529,810 | 521,163 | 512,252 | 504,274 | 497,431 | ||||||||||
Interest coverage ratio (1) | 7.96 | 8.97 | 9.57 | 10.24 | 10.82 | ||||||||||
Average therm use per customer | |||||||||||||||
Residential | 885 | 824 | 1,049 | 1,020 | 937 | ||||||||||
Commercial, industrial and other | 11,183 | 11,378 | 9,799 | 4,466 | 3,773 | ||||||||||
Degree days | 4,129 | 3,867 | 5,015 | 5,080 | 4,664 | ||||||||||
Weather as a percent of normal (2) | 90.0 | % | 82.5 | % | 108.3 | % | 109.6 | % | 99.9 | % | |||||
Number of employees | 680 | 670 | 649 | 626 | 611 | ||||||||||
(1) | NJNG’s income from operations divided by interest expense. |
(2) | Normal heating degree days are based on a 20-year average, calculated based upon three reference areas representative of NJNG’s service territory. |
Page 28
New Jersey Resources Corporation
Part II
ITEM 7. MANAGEMENT’S DISCUSSION AND ANALYSIS OF FINANCIAL CONDITION AND RESULTS OF
OPERATIONS
Forward-looking and Cautionary Statements
From time to time, we may make statements that constitute “forward-looking statements” within the meaning of the “safe-harbor” provisions of Section 27A of the Securities and Exchange Act of 1933, as amended, Section 21E of the Securities and Exchange Act of 1934, as amended, and the Private Securities Litigation Reform Act of 1995. These statements are based on our then-current expectations and are subject to a number of risks and uncertainties that could cause actual results to differ materially from those addressed in the forward-looking statements. Information concerning forward-looking statements is set forth on page 3 of this annual report and is incorporated herein. A detailed discussion of risk and uncertainties that could cause actual results to differ materially from such forward-looking statements is included in Item 1A. Risk Factors and are incorporated herein. We undertake no obligation to update or revise publicly any forward-looking statement, whether as a result of new information, future events or otherwise.
Critical Accounting Policies
We prepare our financial statements in accordance with GAAP. Application of these accounting principles requires the use of estimates and assumptions that affect the reported amounts of assets, liabilities, revenues and expenses, and related disclosures of contingencies during the reporting period. We regularly evaluate our estimates, including those related to the calculation of the fair value of derivative instruments, regulatory assets, income taxes, pension and postemployment benefits other than pensions, asset retirement obligations and contingencies related to environmental matters and litigation. We base our estimates on historical experience and on various other assumptions that are believed to be reasonable under the circumstances, the results of which form the basis for making judgments about the carrying value of assets and liabilities that are not readily apparent from other sources. In the normal course of business, estimated amounts are subsequently adjusted to actual results that may differ from estimates.
Regulatory Accounting
NJNG maintains its accounts in accordance with the FERC Uniform System of Accounts as prescribed by the BPU and recognizes the impact of regulatory decisions on its financial statements. As a result of the ratemaking process, NJNG is required to apply the accounting principles in ASC 980, Regulated Operations, which differ in certain respects from those applied by unregulated businesses. Specifically, NJNG records assets when it is probable that certain operating costs will be recoverable from customers in future periods and records liabilities associated with probable future obligations to customers.
NJNG’s BGSS requires it to project its annual natural gas costs and provides the ability, subject to BPU approval, to recover or refund the difference, if any, of such actual costs compared with the projected costs included in prices through a BGSS charge to customers. Any underrecovery or overrecovery is recorded as a regulatory asset or liability on the Consolidated Balance Sheets and reflected in the BGSS charge to customers in subsequent years.
As recovery of regulatory assets is subject to BPU approval, if there are any changes in future regulatory positions that indicate recovery of all or a portion of a regulatory asset is not probable, the related cost would be charged to income in the period of such determination. In September 2016, the BPU approved an increase in base tariff rates in the amount of $45 million, effective October 2016. There were no changes to the amounts NJNG has recognized in regulatory assets as a result of the settlement of its base rate petition.
Derivative Instruments
We record our derivative instruments held as assets and liabilities at fair value on the Consolidated Balance Sheets. In addition, since we choose not to designate any of our physical and financial natural gas commodity derivatives as accounting hedges, changes in the fair value of Energy Services’ commodity derivatives are recognized in earnings, as they occur, as a component of operating revenues or gas purchases on the Consolidated Statements of Operations. Changes in the fair value of foreign exchange contracts are recognized in gas purchases on the Consolidated Statements of Operations.
The fair value of derivative instruments is determined by reference to quoted market prices of listed exchange-traded contracts, published price quotations, pipeline tariff information and/or a combination of those items. Energy Services’ portfolio is valued using the most current and reasonable market information. If the price underlying a physical commodity transaction does not represent a visible and liquid market, Energy Services may utilize additional published pipeline tariff information and/or other services to determine an equivalent market price. As of September 30, 2017, fair value of its derivative assets and liabilities reported on the Consolidated Balance Sheets that is based on such pricing is immaterial.
Page 29
New Jersey Resources Corporation
Part II
ITEM 7. MANAGEMENT’S DISCUSSION AND ANALYSIS OF FINANCIAL CONDITION AND RESULTS OF
OPERATIONS (Continued)
Should there be a significant change in the underlying market prices or pricing assumptions, Energy Services may experience a significant impact on its financial position, results of operations and cash flows. Refer to Item 7A. Quantitative and Qualitative Disclosures About Market Risks for a sensitivity analysis related to the impact to derivative fair values resulting from changes in commodity prices. The valuation methods we use to determine fair values remained consistent for fiscal 2017, 2016 and 2015. We apply a discount to our derivative assets to factor in an adjustment associated with the credit risk of its physical natural gas counterparties and to our derivative liabilities to factor in an adjustment associated with its own credit risk. We determine this amount by using historical default probabilities corresponding to the appropriate S&P issuer ratings. Since the majority of our counterparties are rated investment grade, this results in an immaterial credit risk adjustment.
Gains and losses associated with derivatives utilized by NJNG to manage the price risk inherent in its natural gas purchasing activities are recoverable through its BGSS, subject to BPU approval. Accordingly, the offset to the change in fair value of these derivatives is recorded as either a regulatory asset or liability on the Consolidated Balance Sheets.
Clean Energy Ventures hedges certain of its expected production of SRECs through forward and futures contracts. Clean Energy Ventures intends to physically deliver all SRECs it sells and recognizes SREC revenue as operating revenue on the Consolidated Statements of Operations upon delivery of the underlying SREC.
We have not designated any derivatives as fair value or cash flow hedges as of September 30, 2017 and 2016.
Business Combinations
We account for business combinations by applying the acquisition method of accounting. Identifiable assets acquired and liabilities assumed are measured separately at their fair value as of the acquisition date and associated transactions costs are expensed as incurred.
The determination and allocation of fair values to the identifiable assets acquired and liabilities assumed are based on various assumptions and valuation methodologies requiring considerable management judgment. The most significant variables in these valuations are discount rates, terminal values, the number of years on which to base the cash flow projections, as well as other assumptions and estimates used to determine the cash inflows and outflows. Management determines discount rates based on the risk inherent in the acquired assets and related cash flows. Terminal values are based on the expected life of assets acquired, forecasted life cycles and expected cash flows over that period. Our valuation of an acquired business is based on available information at the acquisition date and assumptions that we believe are reasonable, however a change in facts and circumstances as of the acquisition date can result in subsequent adjustments during the measurement period, but no later than one year from the acquisition date. See Note 3. Acquisition for information related to our acquisition of a gas marketing business on July 27, 2017.
Income Taxes and Credits
The determination of our provision for income taxes requires significant judgment, the use of estimates and the interpretation and application of complex tax laws. Significant judgment is required in assessing the timing and amounts of deductible and taxable items. We use the asset and liability method to determine and record deferred tax assets, representing future tax benefits, and deferred tax liabilities, representing future taxes payable, resulting from the differences between the financial reporting amount and the corresponding tax basis of the assets and liabilities using the enacted rates expected to be in effect at the time the differences are settled. An offsetting valuation allowance is recorded when it is more likely than not that some or all of the deferred income tax assets won’t be realized. We had net deferred tax liabilities of $506.3 million and $464.6 million, and a valuation allowance of approximately $1 million and $262,000 related to certain deferred state tax assets, as of September 30, 2017 and 2016, respectively. Any significant changes to the estimates and judgments with respect to the interpretations, timing or deductibility could result in a material change to earnings and cash flows. For a more detailed description of Income Taxes see Note 13. Income Taxes in the accompanying Consolidated Financial Statements.
For state income tax and other taxes, estimates and judgments are required with respect to the apportionment among the various jurisdictions. In addition, we operate within multiple tax jurisdictions and are subject to audits in these jurisdictions. These audits can involve complex issues, which may require an extended period of time to resolve. We maintain a liability for the estimate of potential income tax exposure and, in our opinion, adequate provisions for income taxes have been made for all years reported. Any significant changes to the estimates and judgments with respect to the apportionment factor could result in a material change to earnings and cash flows.
Page 30
New Jersey Resources Corporation
Part II
ITEM 7. MANAGEMENT’S DISCUSSION AND ANALYSIS OF FINANCIAL CONDITION AND RESULTS OF
OPERATIONS (Continued)
Accounting guidance requires that we establish reserves for uncertain tax positions when it is more likely than not that the positions will not be sustained when challenged by taxing authorities. We have no reason to believe that we have any future obligations associated with unrecognized tax benefits, therefore, as of September 30, 2017 and 2016, we have not recorded any liabilities related to uncertain tax positions. Any significant changes to the estimates and judgments with respect to the interpretations, timing or deductibility could result in a material change to earnings and cash flows.
To the extent that NJNG invests in property that qualifies for ITCs, the ITC is deferred and amortized to income over the life of the equipment in accordance with regulatory treatment. For our unregulated subsidiaries, we recognize ITCs as a reduction to income tax expense when the property is placed in service.
To the extent that the Company invests in property that qualifies for PTCs, the PTC is recognized as a reduction to current federal income tax expense as the PTCs are generated through the production activities of the assets.
Changes to the federal statutes related to ITCs and PTCs, which have the effect of reducing or eliminating the credits, could have a negative impact on earnings and cash flows.
Environmental Costs
At the end of each fiscal year, NJNG, with the assistance of an independent consulting firm, updates the environmental review of its MGP sites, including its potential liability for investigation and remedial action. From this review, NJNG estimates expenditures necessary to remediate and monitor these MGP sites. As of September 30, 2017, NJNG estimated these expenditures will range from approximately $117.6 million to $205.2 million. NJNG’s estimate of these liabilities is developed from then currently available facts, existing technology and current laws and regulations.
In accordance with accounting standards for contingencies, NJNG’s policy is to record a liability when it is probable that the cost will be incurred and can be reasonably estimated. NJNG will determine a range of liabilities and will record the most likely amount. If no point within the range is more likely than any other, NJNG will accrue the lower end of the range. Since we believe that recovery of these expenditures, as well as related litigation costs, is possible through the regulatory process, we have recorded a regulatory asset corresponding to the related accrued liability. Accordingly, NJNG recorded an MGP remediation liability and a corresponding regulatory asset of $149 million on the Consolidated Balance Sheets, which is based on the most likely amount. This was reduced from $172 million in fiscal 2016, due to the completion of remediation work at certain sites and a reduction to the remediation scope of work at another site.
The actual costs to be incurred by NJNG are dependent upon several factors, including final determination of remedial action, changing technologies and governmental regulations, the ultimate ability of other responsible parties to pay, as well as the potential impact of any litigation and any insurance recoveries. As of September 30, 2017 and 2016, $28.5 million and $19.6 million of previously incurred remediation costs, net of recoveries from customers and insurance proceeds received, are included in regulatory assets on the Consolidated Balance Sheets, respectively.
If there are changes in the regulatory position surrounding these costs, or should actual expenditures vary significantly from estimates in that these costs are disallowed for recovery by the BPU, such costs would be charged to income in the period of such determination.
Postemployment Employee Benefits
Our costs of providing postemployment employee benefits are dependent upon numerous factors, including actual plan experience and assumptions of future experience. Postemployment employee benefit costs are impacted by actual employee demographics including age, compensation levels and employment periods, the level of contributions made to the plans, changes in long-term interest rates and the return on plan assets. Changes made to the provisions of the plans or healthcare legislation may also impact current and future postemployment employee benefit costs. Postemployment employee benefit costs may also be significantly affected by changes in key actuarial assumptions, including anticipated rates of return on plan assets, changes in mortality tables, health care cost trends and discount rates used in determining the PBO. In determining the PBO and cost amounts, assumptions can change from period to period and could result in material changes to net postemployment employee benefit periodic costs and the related liability recognized by us.
Page 31
New Jersey Resources Corporation
Part II
ITEM 7. MANAGEMENT’S DISCUSSION AND ANALYSIS OF FINANCIAL CONDITION AND RESULTS OF
OPERATIONS (Continued)
Our postemployment employee benefit plan assets consist primarily of U.S. equity securities, international equity securities and fixed-income investments, with a targeted allocation of 40 percent, 20 percent and 40 percent, respectively. Fluctuations in actual market returns, as well as changes in interest rates, may result in increased or decreased postemployment employee benefit costs in future periods. Postemployment employee benefit expenses are included in O&M expense on the Consolidated Statements of Operations.
The following is a summary of a sensitivity analysis for each actuarial assumption:
Pension Plans | |||||||||||||
Actuarial Assumptions | Increase/ (Decrease) | Estimated Increase/(Decrease) on PBO (Thousands) | Estimated Increase/(Decrease) to Expense (Thousands) | ||||||||||
Discount rate | 1.00 | % | $ | (38,398 | ) | $ | (3,875 | ) | |||||
Discount rate | (1.00 | ) | % | $ | 48,110 | $ | 4,720 | ||||||
Rate of return on plan assets | 1.00 | % | n/a | $ | (2,493 | ) | |||||||
Rate of return on plan assets | (1.00 | ) | % | n/a | $ | 2,493 | |||||||
Other Postemployment Benefits | |||||||||||||
Actuarial Assumptions | Increase/ (Decrease) | Estimated Increase/(Decrease) on PBO (Thousands) | Estimated Increase/(Decrease) to Expense (Thousands) | ||||||||||
Discount rate | 1.00 | % | $ | (25,977 | ) | $ | (2,447 | ) | |||||
Discount rate | (1.00 | ) | % | $ | 33,412 | $ | 3,072 | ||||||
Rate of return on plan assets | 1.00 | % | n/a | $ | (615 | ) | |||||||
Rate of return on plan assets | (1.00 | ) | % | n/a | $ | 615 | |||||||
Actuarial Assumptions | Increase/ (Decrease) | Estimated Increase/(Decrease) on PBO (Thousands) | Estimated Increase/(Decrease) to Expense (Thousands) | ||||||||||
Health care cost trend rate | 1.00 | % | $ | 32,019 | $ | 4,353 | |||||||
Health care cost trend rate | (1.00 | ) | % | $ | (25,466 | ) | $ | (3,624 | ) | ||||
On October 1, 2016, we changed our approach used to measure the service and interest cost components of its net periodic benefit costs. Previously, the Company estimated service cost and interest cost based on a single weighted-average discount rate from the yield curve used to measure its projected benefit obligation. Effective October 1, 2016, we determine our service and interest cost based upon duration specific spot rates that are aligned to each year’s future benefit payments. Under the new approach, net periodic benefit costs will be lower during periods of low interest rates and upward-sloping yield curves. Conversely, in a downward sloping-yield curve environment, costs could increase. Refer to Note 11. Employee Benefit Plans in the accompanying Consolidated Financial Statements for further discussion of our change in method.
Asset Retirement Obligations
We recognize AROs related to the costs associated with cutting and capping NJNG’s main and service gas distribution mains, which is required by New Jersey law when taking such gas distribution mains out of service. We also recognize AROs associated with Clean Energy Ventures’ solar and wind assets when there are decommissioning provisions in lease agreements that require removal of the asset at the end of the lease term.
AROs are initially recognized when the legal obligation to retire an asset has been incurred and a reasonable estimate of fair value can be made. The discounted fair value is recognized as an ARO liability with a corresponding amount capitalized as part of the carrying cost of the underlying asset. The obligation is subsequently accreted to the future value of the expected retirement cost and the corresponding asset retirement cost is depreciated over the life of the related asset. Accretion expense associated with Clean Energy Ventures’ ARO is recognized as a component of operations and maintenance expense on our Consolidated Statements of Operations. Prior to October 1, 2016, accretion amounts associated with NJNG’s ARO were not reflected as an expense, but rather were deferred as a regulatory asset and netted against NJNG’s regulatory liabilities for presentation purposes. Through NJNG’s new base rates settlement, effective October 1, 2016, accretion is recognized as part of its depreciation expense and the corresponding regulatory asset and liability will be shown gross on the Consolidated Balance Sheets.
Page 32
New Jersey Resources Corporation
Part II
ITEM 7. MANAGEMENT’S DISCUSSION AND ANALYSIS OF FINANCIAL CONDITION AND RESULTS OF
OPERATIONS (Continued)
Estimating future removal costs requires management to make significant judgments because most of the removal obligations span long time frames and removal may be conditioned upon future events. Asset removal technologies are also constantly changing, which makes it difficult to estimate removal costs. Accordingly, inherent in the estimate of our AROs are various assumptions including the ultimate settlement date, expected cash outflows, inflation rates, credit-adjusted risk-free rates and consideration of potential outcomes where settlement of the ARO can be conditioned upon events. In the latter case, we develop possible retirement scenarios and assign probabilities based on management’s reasonable judgment and knowledge of industry practice. Accordingly, AROs are subject to change.
Recently Issued Accounting Standards
Refer to Note 2. Summary of Significant Accounting Policies in the accompanying Consolidated Financial Statements for discussion of recently issued accounting standards.
Management’s Overview
Consolidated
NJR is an energy services holding company providing retail natural gas service in New Jersey and wholesale natural gas and related energy services to customers in the United States and Canada. In addition, we invest in clean energy projects, midstream assets and provide various repair, sales and installations services. A more detailed description of our organizational structure can be found in Item 1. Business.
Reporting Segments
We have four primary reporting segments as presented in the chart below:
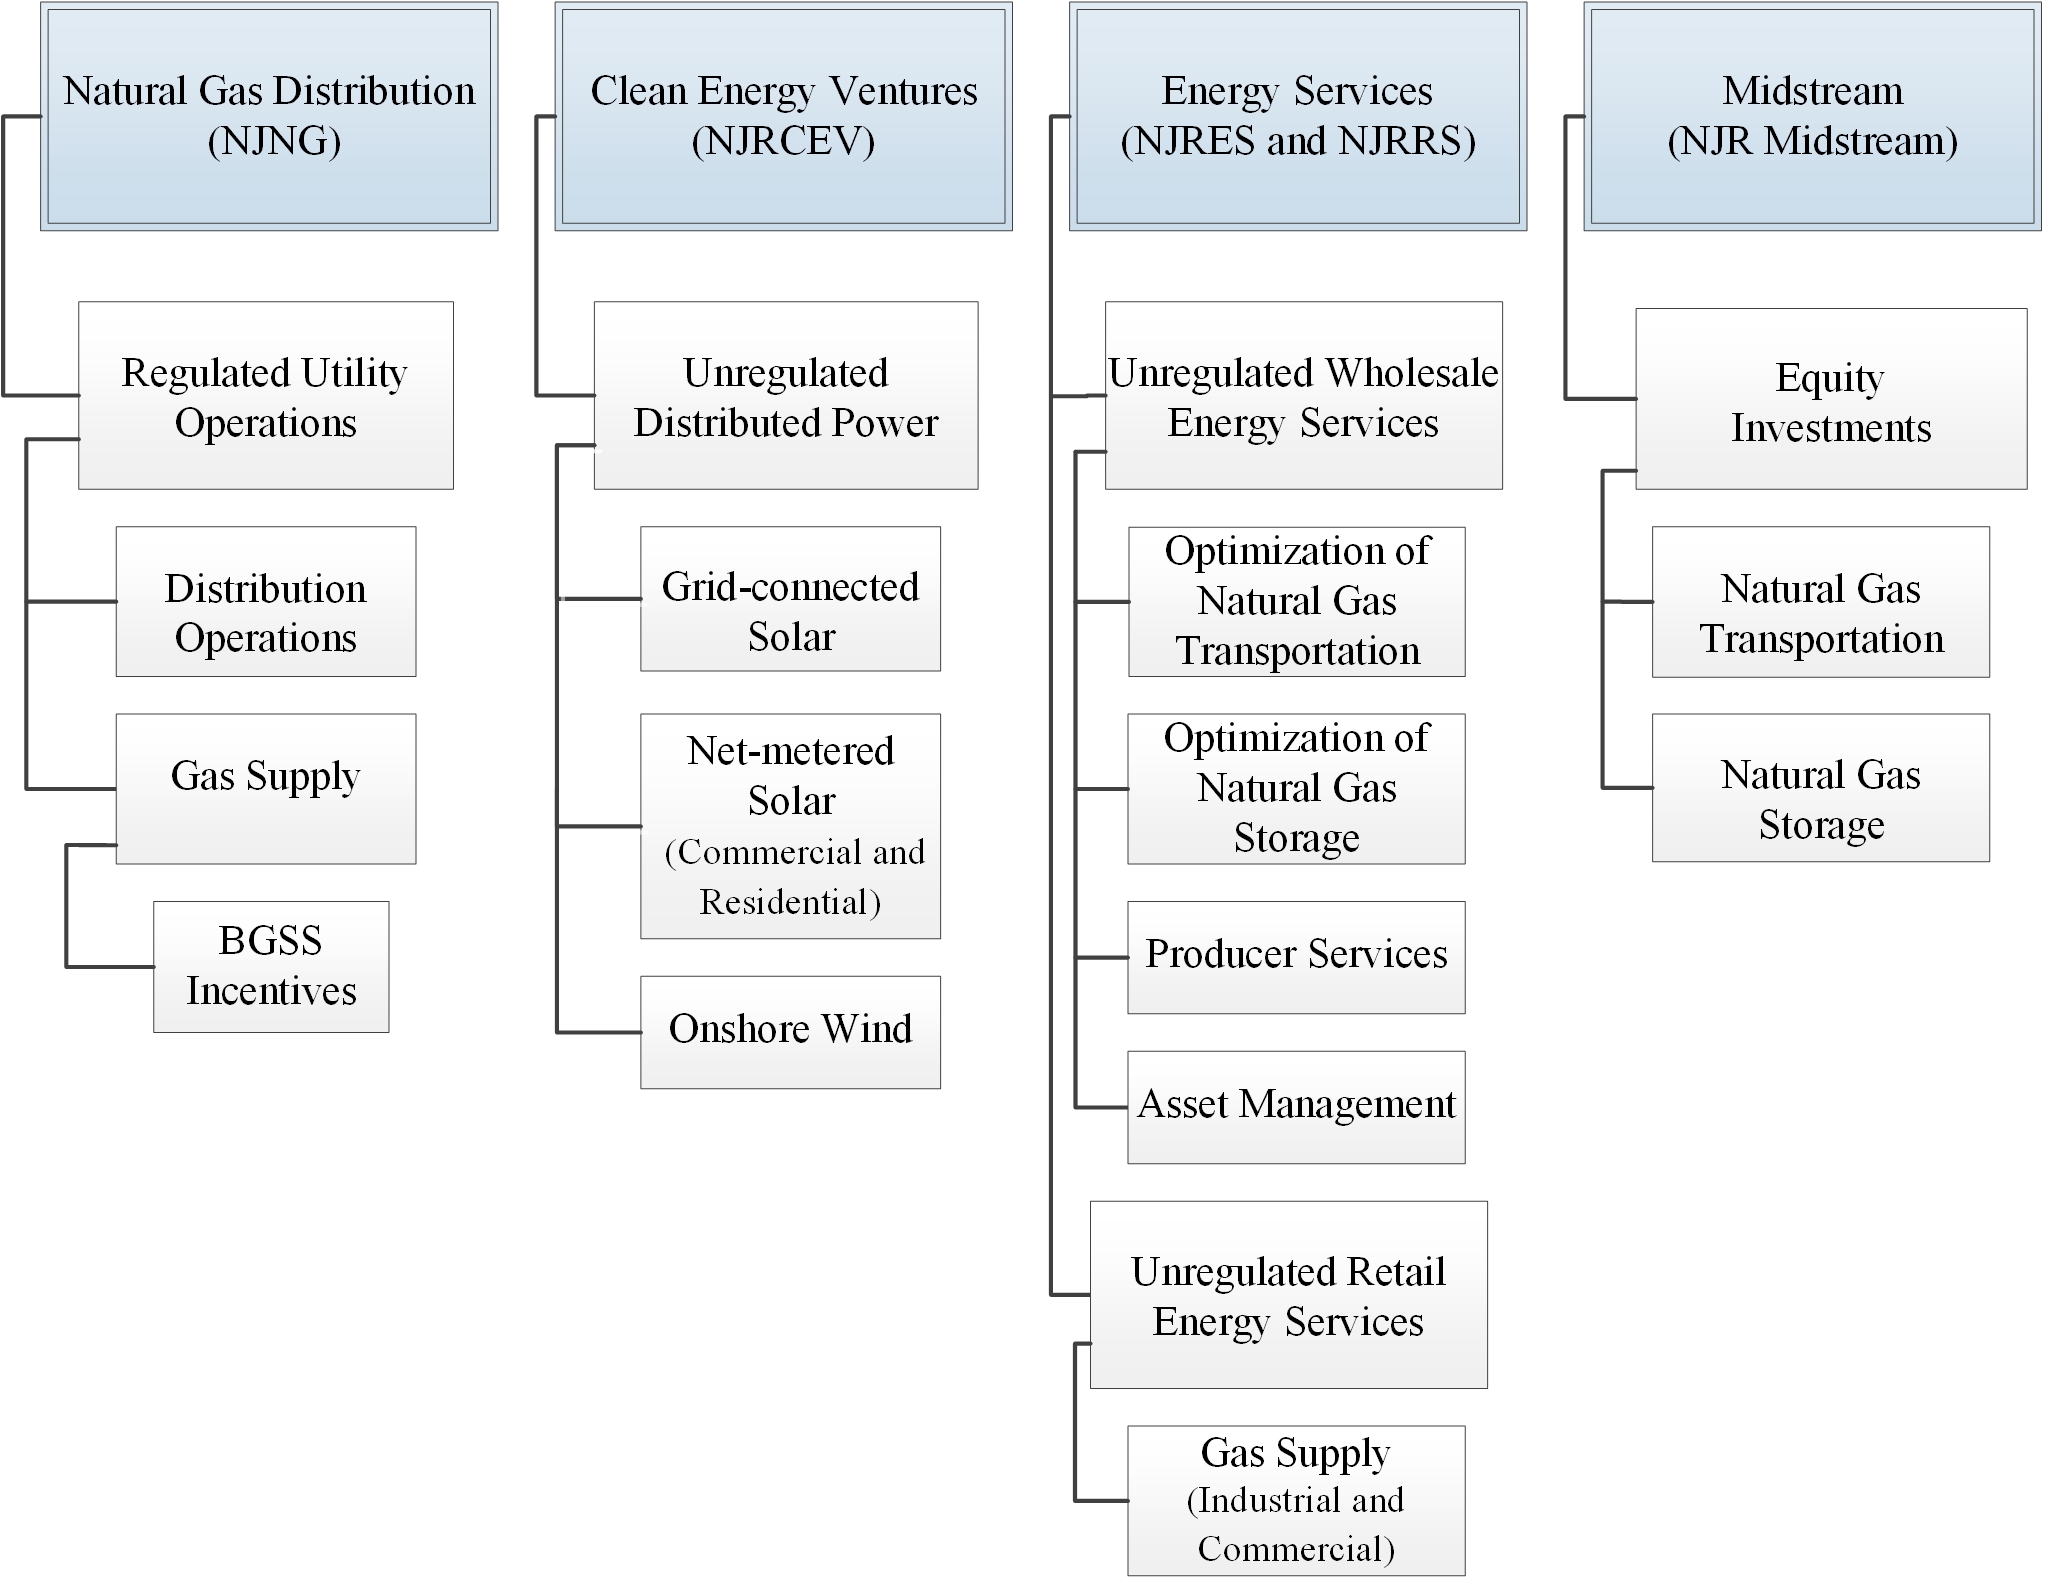
Page 33
New Jersey Resources Corporation
Part II
ITEM 7. MANAGEMENT’S DISCUSSION AND ANALYSIS OF FINANCIAL CONDITION AND RESULTS OF
OPERATIONS (Continued)
In addition to our four reporting segments, we have non-utility operations that either provide corporate support services or do not meet the criteria to be treated as a separate reporting segment. These operations, which comprise Home Services and Other, include: appliance repair services, sales and installations at NJRHS; and commercial real estate holdings at CR&R.
A summary of our consolidated results in net income and assets by reporting segment and operations for the fiscal years ended September 30, is as follows:
($ in thousands) | 2017 | 2016 | 2015 | |||||||||||||||
Net Income | Assets | Net Income | Assets | Net Income | Assets | |||||||||||||
Natural Gas Distribution | $ | 86,930 | $ | 2,519,578 | $ | 76,104 | $ | 2,517,401 | $ | 76,287 | $ | 2,305,293 | ||||||
Clean Energy Ventures | 24,873 | 771,340 | 28,393 | 665,696 | 20,101 | 504,885 | ||||||||||||
Energy Services | 476 | 398,277 | 14,265 | 327,626 | 72,044 | 260,021 | ||||||||||||
Midstream | 12,857 | 232,806 | 9,406 | 186,259 | 9,780 | 182,007 | ||||||||||||
Home Services and Other | 6,811 | 114,801 | 2,882 | 109,487 | 3,420 | 88,880 | ||||||||||||
Intercompany (1) | 118 | (108,295 | ) | 622 | (87,899 | ) | (672 | ) | (56,729 | ) | ||||||||
Total | $ | 132,065 | $ | 3,928,507 | $ | 131,672 | $ | 3,718,570 | $ | 180,960 | $ | 3,284,357 | ||||||
(1) | Consists of transactions between subsidiaries that are eliminated in consolidation. |
Net Income
The primary drivers of the changes noted above, which are described in more detail in the individual segment discussions, are discussed below.
The increase in net income of $393,000 during fiscal 2017, compared with fiscal 2016, was primarily driven by increased gross margin at our Natural Gas Distribution segment due primarily to increased base rates which were effective October 1, 2016, increased other income at Home Services and Other due to the sale of available for sale securities and increased equity in earnings of affiliates at Midstream. These increases were partially offset by decreased operating income at Energy Services due primarily to a decrease of $16.4 million related to changes in the value of financial hedges and a decrease at Clean Energy Ventures due primarily to increased depreciation, operating and interest expenses, partially offset by increased revenues and increased PTCs.
The decrease in net income of $49.3 million during fiscal 2016, compared with fiscal 2015, was primarily driven by a decrease at Energy Services related to lower operating income due primarily to a decrease of $59.7 million related to changes in the value of financial hedges. The decrease was partially offset by an increase of $8.3 million at Clean Energy Ventures due primarily to operating revenue related to higher SREC and electricity sales, partially offset by increased costs related to depreciation, O&M and interest expense.
Assets
The increase in assets during fiscal 2017, compared with fiscal 2016, was due primarily to additional solar expenditures at Clean Energy Ventures, the acquisition of Talen's wholesale and retail energy contract assets at Energy Services, increased PennEast capital contributions and an increase in the market value of our DM Common Units at Midstream, along with additional utility plant expenditures at our Natural Gas Distribution segment. The increase in assets during fiscal 2016, compared with fiscal 2015, was due primarily to additional utility plant expenditures at Natural Gas Distribution and additional solar expenditures at Clean Energy Ventures, as well as increased broker margin and gas in storage at Energy Services.
Non-GAAP Financial Measures
Our management uses NFE, a non-GAAP financial measure, when evaluating our operating results. Energy Services economically hedges its natural gas inventory with financial derivative instruments. NFE is a measure of the earnings based on eliminating timing differences surrounding the recognition of certain gains or losses, to effectively match the earnings effects of the economic hedges with the physical sale of gas and, therefore, eliminates the impact of volatility to GAAP earnings associated with the derivative instruments. To the extent we utilize forwards, futures, or other derivatives to hedge forecasted SREC production, unrealized gains and losses are also eliminated for NFE purposes.
Page 34
New Jersey Resources Corporation
Part II
ITEM 7. MANAGEMENT’S DISCUSSION AND ANALYSIS OF FINANCIAL CONDITION AND RESULTS OF
OPERATIONS (Continued)
Non-GAAP financial measures are not in accordance with, or an alternative to, GAAP and should be considered in addition to, and not as a substitute for or a replacement of, the comparable GAAP measure and should be read in conjunction with those GAAP results. The following is a reconciliation of consolidated net income, the most directly comparable GAAP measure, to NFE:
(Thousands) | 2017 | 2016 | 2015 | ||||||
Net income | $ | 132,065 | $ | 131,672 | $ | 180,960 | |||
Add: | |||||||||
Unrealized (gain) loss on derivative instruments and related transactions | (11,241 | ) | 46,883 | (38,681 | ) | ||||
Tax effect | 4,062 | (17,018 | ) | 14,391 | |||||
Effects of economic hedging related to natural gas inventory (1) | 38,470 | (36,816 | ) | (8,225 | ) | ||||
Tax effect | (13,964 | ) | 13,364 | 3,058 | |||||
Net financial earnings | $ | 149,392 | $ | 138,085 | $ | 151,503 | |||
Basic earnings per share | $ | 1.53 | $ | 1.53 | $ | 2.12 | |||
Add: | |||||||||
Unrealized (gain) loss on derivative instruments and related transactions | (0.13 | ) | 0.55 | (0.45 | ) | ||||
Tax effect | 0.05 | (0.20 | ) | 0.17 | |||||
Effects of economic hedging related to natural gas inventory (1) | 0.45 | (0.43 | ) | (0.10 | ) | ||||
Tax effect | (0.17 | ) | 0.16 | 0.04 | |||||
Basic net financial earnings per share | $ | 1.73 | $ | 1.61 | $ | 1.78 | |||
(1) | Effects of hedging natural gas inventory transactions where the economic impact is realized in a future period. |
NFE by reporting segment and other operations for the fiscal years ended September 30, discussed in more detail within the operating results sections of each segment, is summarized as follows:
(Thousands) | 2017 | 2016 | 2015 | ||||||||||||||
Natural Gas Distribution | $ | 86,930 | 58 | % | $ | 76,104 | 55 | % | $ | 76,287 | 51 | % | |||||
Clean Energy Ventures | 24,873 | 17 | 28,393 | 20 | 20,101 | 13 | |||||||||||
Energy Services | 18,554 | 12 | 21,934 | 16 | 42,122 | 28 | |||||||||||
Midstream | 12,857 | 9 | 9,406 | 7 | 9,780 | 6 | |||||||||||
Home Services and Other | 6,811 | 4 | 2,882 | 2 | 3,420 | 2 | |||||||||||
Eliminations (1) | (633 | ) | — | (634 | ) | — | (207 | ) | — | ||||||||
Total | $ | 149,392 | 100 | % | $ | 138,085 | 100 | % | $ | 151,503 | 100 | % | |||||
(1) | Consists of transactions between subsidiaries that are eliminated in consolidation. |
The increase in NFE during fiscal 2017, compared with fiscal 2016, was due primarily to increases at our Natural Gas Distribution segment, Midstream and Home Services and Other, as previously discussed, partially offset by lower financial margin at Energy Services due primarily to lower sales volumes and fewer market opportunities and the decrease at Clean Energy Ventures, as previously discussed.
The decrease in NFE during fiscal 2016, compared with fiscal 2015, was driven primarily by decreased financial margin at Energy Services due primarily to lower volatility and narrower price spreads resulting from the record warm winter weather primarily across the eastern United States, partially offset by lower taxes and O&M, partially offset by higher NFE at Clean Energy Ventures due primarily to increase in SREC and energy sales.
Natural Gas Distribution Segment
Overview
Our Natural Gas Distribution segment is comprised of NJNG, a natural gas utility that provides regulated retail natural gas service in central and northern New Jersey to approximately 529,800 residential and commercial customers in its service territory and also participates in the off-system sales and capacity release markets. The business is subject to various risks, which can negatively impact customer growth, operating and financing costs, fluctuations in commodity prices and customer conservation efforts. These risks include, but are not limited to, adverse economic conditions, customer usage, certain regulatory actions, environmental remediation and severe weather conditions. It is often difficult to predict the impact of events or trends associated with these risks.
Page 35
New Jersey Resources Corporation
Part II
ITEM 7. MANAGEMENT’S DISCUSSION AND ANALYSIS OF FINANCIAL CONDITION AND RESULTS OF
OPERATIONS (Continued)
In addition, NJNG’s business is seasonal by nature, as weather conditions directly influence the volume of natural gas delivered to customers on an annual basis. Specifically, customer demand substantially increases during the winter months when natural gas is used for heating purposes. As a result, NJNG receives most of its natural gas distribution revenues during the first and second fiscal quarters and is subject to variations in earnings and working capital during the year.
As a regulated company, NJNG is required to recognize the impact of regulatory decisions on its financial statements. See Note 4. Regulation in the accompanying Consolidated Financial Statements for a more detailed discussion on regulatory actions, including filings related to programs and associated expenditures, as well as rate requests related to recovery of capital investments and operating costs.
NJNG’s operations are managed with the goal of providing safe and reliable service, growing its customer base, diversifying its gross margin, promoting clean energy programs and mitigating the risks discussed above through several key initiatives, including:
• | earning a reasonable rate of return on the investments in its natural gas distribution and transmission businesses, as well as timely recovery of all prudently incurred costs to provide safe and reliable service throughout NJNG’s territory; |
• | continuing to invest in the safety and integrity of its infrastructure; |
• | managing its customer growth rate, which NJNG expects will be approximately 1.7 percent annually through fiscal 2019; |
• | maintaining a collaborative relationship with the BPU on regulatory initiatives, including: |
- planning and authorization of infrastructure investments;
- pursuing rate and regulatory strategies to stabilize and decouple margin, including CIP;
- utilizing BGSS incentive programs through BPU-approved mechanisms to reduce gas costs and generate margin; and
- administering and promoting NJNG’s BPU-approved SAVEGREEN Project;
• | managing the volatility of wholesale natural gas prices through a hedging program designed to keep customers’ BGSS rates as stable as possible; and |
• | working with the NJDEP and BPU to manage its financial obligations related to remediation activities associated with its former MGP sites. |
Base Rate Case
In September 2016, the BPU approved NJNG's base rate case, effective October 2016, which included the following:
• | an increase in base rates in the amount of $45 million. The base rate increase includes a return on common equity of 9.75 percent, a common equity ratio of 52.5 percent and an increase in the overall depreciation rate from 2.34 percent to 2.4 percent; |
• | the recovery of SAFE I capital investments and the rate mechanism and five-year extension of SAFE II. The estimated cost for SAFE II extension, excluding AFUDC, is approximately $200 million and related costs to be recovered on an accelerated basis are approximately $157.5 million. As a condition of the extension approval, NJNG is required to file a base rate case no later than November 2019; |
• | rate recovery of NJ RISE capital investment costs through June 30, 2016, and the filing for recovery of future NJ RISE capital investment costs to be recovered, will occur in conjunction with SAFE II, commencing with the rate recovery filing submitted in March 2017; |
• | recovery of NJNG’s NGV and LNG plant investments; and |
• | recovery of other costs previously deferred in regulatory assets over seven years. |
Page 36
New Jersey Resources Corporation
Part II
ITEM 7. MANAGEMENT’S DISCUSSION AND ANALYSIS OF FINANCIAL CONDITION AND RESULTS OF
OPERATIONS (Continued)
Infrastructure projects
NJNG has significant annual capital expenditures associated with the management of its natural gas distribution and transmission system, including new utility plant associated with customer growth and its associated PIM and infrastructure programs.
Below is a summary of NJNG’s capital expenditures, including accruals and estimates for expected investments over the next two fiscal years:
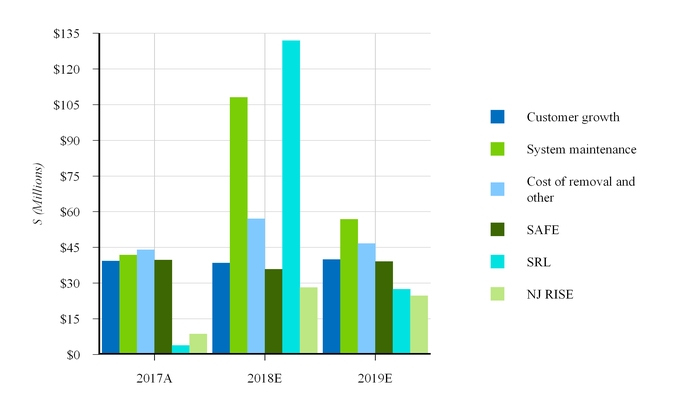
Estimated capital expenditures are reviewed on a regular basis and may vary based on the ongoing effects of regulatory oversight, environmental regulations, unforeseen events and the ability to access capital.
SAFE and NJ RISE
NJNG continues to implement BPU-approved infrastructure projects that are designed to enhance the reliability and integrity of NJNG’s gas distribution system.
The BPU approved recovery of SAFE I capital investments through September 30, 2016, and approved the rate mechanism and extension of SAFE II for an additional five years to replace the remaining unprotected steel mains and services from its natural gas distribution system at an estimated cost of approximately $200 million, excluding AFUDC. The accelerated cost recovery methodology for the $157.5 million associated with the extension of SAFE II was approved in NJNG’s new base rates. The remaining $42.5 million in capital expenditures will be requested for recovery in a future base rate case.
The BPU approved the recovery of NJNG's NJ RISE capital infrastructure program, which consists of six capital investment projects estimated to cost $102.5 million, excluding AFUDC, for gas distribution storm hardening and mitigation projects, along with associated depreciation expense. These system enhancements are intended to minimize service impacts during extreme weather events to customers that live in the most storm prone areas of NJNG's service territory. Recovery of NJ RISE investments through June 30, 2016, is included in NJNG’s base rates.
On March 30, 2017, NJNG filed its annual petition with the BPU requesting a base rate increase for the recovery of NJ RISE and SAFE II capital investment costs, with a weighted cost of capital of 6.9 percent including a return on equity of 9.75 percent, related to the period ending June 30, 2017, based on estimates, pursuant to the September 2016 base rate case. On July 20,
Page 37
New Jersey Resources Corporation
Part II
ITEM 7. MANAGEMENT’S DISCUSSION AND ANALYSIS OF FINANCIAL CONDITION AND RESULTS OF
OPERATIONS (Continued)
2017, NJNG filed an update to this petition with actuals, requesting a $4.1 million annual increase in recoveries, which was approved by the BPU, effective October 1, 2017.
NGV Advantage
In June 2012, the BPU approved a pilot program for NJNG to invest up to $10 million to build NGV refueling stations. The NGV program was authorized by the BPU to earn an overall weighted average cost of capital of 7.1 percent, including a return on equity of 10.3 percent. A portion of the proceeds from the utilization of the compressed natural gas equipment, along with any available federal and state incentives, will be credited back to customers to offset a portion of the cost of the NGV investment. All three of the NGV stations are open to the public and NJNG is recovering its costs through base rates effective October 2016.
Liquefaction/LNG
In June 2016, NJNG’s Liquefaction facility became operational and allows NJNG to convert natural gas into LNG to fill its existing LNG storage tanks. Costs for this project along with other plant upgrades were approximately $36.5 million and are being recovered through NJNG’s new base rates effective October 2016.
Southern Reliability Link
The SRL is an approximate 30-mile, 30-inch transmission main designed to support improved system reliability and integrity in the southern portion of NJNG’s service territory, estimated to cost between $180 million and $200 million. In January 2016, the BPU issued an order approving NJNG’s modified, proposed SRL pipeline installation, operation and route selection. In March 2016, the BPU issued an order designating the SRL route and exempting the SRL from municipal land use ordinances, regulations, permits and license requirements. In February 2017, the New Jersey Department of Environmental Protection issued a permit authorizing construction of the SRL within the jurisdiction of the Coastal Area Facility Review Act, as well as a Freshwater Wetlands permit. On September 14, 2017, the NJ Pinelands Commission approved construction of the SRL as being compliant with the Commission's Comprehensive Management Plan. All approvals and permits have been appealed by third parties. Once the final road opening permits and easements are secured, construction is expected to begin, with an estimated in-service date during the first quarter of fiscal 2019.
Customer growth
In conducting NJNG’s business, management focuses on factors it believes may have significant influence on its future financial results. NJNG’s policy is to work with all stakeholders, including customers, regulators and policymakers, to achieve favorable results. These factors include the rate of NJNG’s customer growth in its service territory, which can be influenced by political and regulatory policies, the delivered cost of natural gas compared with competing fuels, interest rates and general economic and business conditions.
NJNG’s total customers as of September 30, include the following:
2017 | 2016 | 2015 | ||||
Firm customers | ||||||
Residential | 460,013 | 448,273 | 437,979 | |||
Commercial, industrial & other | 26,947 | 26,218 | 25,541 | |||
Residential transport | 32,653 | 36,292 | 38,424 | |||
Commercial transport | 10,137 | 10,316 | 10,249 | |||
Total firm customers | 529,750 | 521,099 | 512,193 | |||
Other | 60 | 64 | 59 | |||
Total customers | 529,810 | 521,163 | 512,252 | |||
During fiscal 2017, NJNG added 9,126 new customers, which represents a new customer growth rate of approximately 1.7 percent. During that same time period, NJNG converted 662 existing customers to natural gas heat and other services. This customer growth, as well as commercial customers who switched from interruptible to firm natural gas service, will contribute approximately $5.5 million, on an annualized basis, to utility gross margin. NJNG also added 8,170 and 7,858 new customers and converted 644
Page 38
New Jersey Resources Corporation
Part II
ITEM 7. MANAGEMENT’S DISCUSSION AND ANALYSIS OF FINANCIAL CONDITION AND RESULTS OF
OPERATIONS (Continued)
and 636 existing customers to natural gas heat and other services during the fiscal years ended September 30, 2016 and 2015, respectively.
Page 39
New Jersey Resources Corporation
Part II
ITEM 7. MANAGEMENT’S DISCUSSION AND ANALYSIS OF FINANCIAL CONDITION AND RESULTS OF
OPERATIONS (Continued)
In addition, NJNG currently expects to add approximately 26,000 to 28,000 new customers during the three-year period of fiscal 2018 to 2020. NJNG's estimates are based on information from municipalities and developers, as well as external industry analysts and management’s experience. NJNG estimates that approximately 60 percent of the growth will come from new construction markets and 40 percent from customer conversions to natural gas from other fuel sources. This new customer and conversion growth would increase utility gross margin under NJNG’s base rates by approximately $5.3 million annually, as calculated under NJNG’s CIP tariff. See the Natural Gas Distribution Segment Operating Results section that follows for a definition and further discussion of utility gross margin.
SAVEGREEN
SAVEGREEN conducts home energy audits and provides various grants, incentives and financing alternatives, which are designed to encourage the installation of high efficiency heating and cooling equipment and other energy efficiency upgrades. Depending on the specific incentive or approval, NJNG recovers costs associated with the programs over a two to 10-year period through a tariff rider mechanism.
Since inception, $149.7 million in grants, rebates and loans has been provided to customers, with a total annual recovery of approximately $20 million. In June 2016, the BPU approved NJNG's extension of SAVEGREEN through December 31, 2018. In October 2016, the BPU approved NJNG’s filing to maintain the existing SAVEGREEN recovery rate. On October 20, 2017, the BPU approved NJNG's filing to decrease its EE recovery rate, which would result in an annual decrease of $3.9 million, effective November 1, 2017. The recovery includes a weighted average cost of capital that ranges from 6.69 percent to 7.76 percent, with a return on equity of 9.75 percent to 10.3 percent.
Conservation Incentive Program
The CIP facilitates normalizing NJNG’s utility gross margin for variances not only due to weather but also for other factors affecting customer usage, such as conservation and energy efficiency. Recovery of utility gross margin for the non-weather variance through the CIP is limited to the amount of certain gas supply cost savings achieved and is subject to an annual earnings test. An annual review of the CIP must be filed by June 1, coincident with NJNG’s annual BGSS filing, during which NJNG can request rate changes to the CIP. In May 2014, the BPU approved the continuation of the CIP program with no expiration date. Refer to Note 4. Regulation - BGSS and CIP in the accompanying Consolidated Financial Statements, for a discussion of CIP rate actions.
NJNG’s total utility firm gross margin includes the following adjustments related to the CIP mechanism:
(Thousands) | 2017 | 2016 | 2015 | ||||||
Weather (1) | $ | 19,261 | $ | 27,547 | $ | (9,268 | ) | ||
Usage | (2,309 | ) | 10,420 | 3,132 | |||||
Total | $ | 16,952 | $ | 37,967 | $ | (6,136 | ) | ||
(1) | Compared with the CIP 20-year average, weather was 10 percent and 17.5 percent warmer-than-normal during fiscal 2017 and 2016, respectively, and 8.3 percent colder-than-normal during 2015. |
As of September 30, 2017 and 2016, NJNG has $17.7 million and $37 million, respectively, in regulatory assets related to CIP to be collected from customers in future periods on the Consolidated Balance Sheets.
Commodity prices
Our Natural Gas Distribution segment is affected by the price of natural gas, which can have a significant impact on our cash flows, short-term financing costs, the price of natural gas charged to our customers through the BGSS clause, our ability to collect accounts receivable, which impacts our bad debt expense, and our ability to maintain a competitive advantage over other fuel sources.
Page 40
New Jersey Resources Corporation
Part II
ITEM 7. MANAGEMENT’S DISCUSSION AND ANALYSIS OF FINANCIAL CONDITION AND RESULTS OF
OPERATIONS (Continued)
Natural gas commodity prices may experience high volatility as shown in the graph below, which illustrates the daily natural gas prices(1) in the Northeast market region, also known as Tetco M-3.
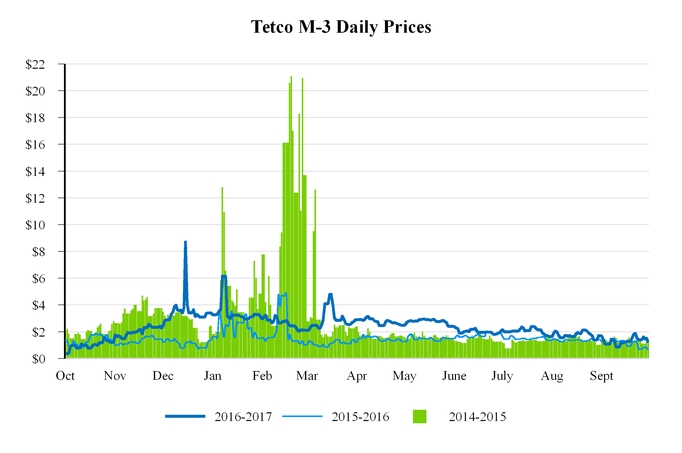
(1) Data source from Platts, a division of McGraw Hill Financial.
The maximum daily price was $8.71, $4.74 and $21.09 and the minimum daily price was $0.36, $0.67 and $0.77 for the fiscal years ended September 30, 2017, 2016 and 2015, respectively. A more detailed discussion of the impacts of the price of natural gas on operating revenues, gas purchases and cash flows can be found in the Results of Operations and Cash Flow sections of Item 7. Management’s Discussion and Analysis of Financial Condition and Results of Operations.
BGSS
Recovery of natural gas costs
NJNG’s cost of natural gas is passed through to our customers, without markup, by applying NJNG’s authorized BGSS rate to actual therms delivered. There is no utility gross margin associated with BGSS costs; therefore, changes in such costs do not impact NJNG’s earnings. NJNG monitors its actual gas costs in comparison to its BGSS rates to manage its cash flows associated with its allowed recovery of natural gas costs, which is facilitated through BPU-approved deferred accounting and the BGSS pricing mechanism. Accordingly, NJNG occasionally adjusts its periodic BGSS rates or can issue credits or refunds, as appropriate, for its residential and small commercial customers when the commodity cost varies from the existing BGSS rate. BGSS rates for its large commercial customers are adjusted monthly based on NYMEX prices.
On September 22, 2017, the BPU provisionally approved NJNG's petition to maintain its BGSS rate for residential and small commercial customers, and increase its balancing charge rate, which will result in a $3.7 million increase to the annual revenues credited to BGSS, effective October 2017. During fiscal 2017 and 2016, NJNG issued bill credits of $42 million and $61.6 million, respectively, as a result of a decline in the wholesale price of natural gas. Refer to Note 4. Regulation - BGSS and CIP in the accompanying Consolidated Financial Statements, for a further discussion of NJNG’s periodic BGSS rate adjustments and bill credits.
Page 41
New Jersey Resources Corporation
Part II
ITEM 7. MANAGEMENT’S DISCUSSION AND ANALYSIS OF FINANCIAL CONDITION AND RESULTS OF
OPERATIONS (Continued)
BGSS Incentive Programs
NJNG is eligible to receive financial incentives for reducing BGSS costs through a series of utility gross margin-sharing programs that include off-system sales, capacity release and storage incentive programs. These programs are designed to encourage better utilization and hedging of NJNG's natural gas supply, transportation and storage assets. Depending on the program, NJNG shares 80 or 85 percent of utility gross margin generated by these programs with firm customers. Should performance of the existing incentives or market conditions warrant, NJNG is permitted to propose a process to re-evaluate and discuss alternative incentive programs annually. Utility gross margin from incentive programs was $13.7 million, $15 million and $17.7 million during the fiscal years ended September 30, 2017, 2016 and 2015, respectively. A more detailed discussion of the impacts to utility gross margin can be found in the Natural Gas Distribution Segment Operating Results section that follows.
Hedging
In order to provide relative price stability to its natural gas supply portfolio, NJNG employs a hedging strategy with the goal of having at least 75 percent of the Company’s projected winter periodic BGSS gas sales volumes hedged by each November 1 and at least 25 percent of the projected BGSS gas sales hedged for the following April through March period. This is accomplished with the use of various financial instruments including futures, swaps and options used in conjunction with commodity and/or weather-related hedging activity.
Due to the capital-intensive nature of NJNG’s operations and the seasonal nature of its working capital requirements, significant changes in interest rates can impact NJNG’s results. In an April 2014 BPU Order, NJNG received regulatory approval to enter into interest rate risk management transactions related to long-term debt securities. On June 1, 2015, NJNG entered into a treasury lock transaction to fix a benchmark treasury rate of 3.26 percent associated with the forecasted-year, $125 million debt issuance expected in May 2018. This forecasted debt issuance coincides with the maturity of NJNG’s existing $125 million, 5.6 percent notes on May 15, 2018. The fair value of NJNG’s treasury lock agreement is recorded as a component of regulatory assets or liabilities on the Consolidated Balance Sheets since the Company believes that the market value upon settlement will be reflected in future rates. Upon settlement, any gain or loss will be amortized in earnings over the life of the future debt issuance.
A more detailed discussion of NJNG’s debt can be found in the Liquidity and Capital Resources and Cash Flow sections of Item 7. Management’s Discussion and Analysis of Financial Condition and Results of Operations.
Societal Benefits Charge
USF
NJNG's qualifying customers are eligible for the USF program, which is administered by the New Jersey Department of Community Affairs, to help make energy bills more affordable. In September 2016, the BPU approved NJNG's annual USF compliance filing proposing to increase the statewide USF rate, resulting in a $1.3 million annual increase in USF recoveries, effective October 2016. Refer to Note 4. Regulation - Societal Benefits Clause in the accompanying Consolidated Financial Statements, for a further discussion of NJNG's USF rates.
Environmental Remediation
NJNG is responsible for the environmental remediation of five MGP sites, which contain contaminated residues from former gas manufacturing operations that ceased operating at these sites by the mid-1950s and, in some cases, had been discontinued many years earlier. Actual MGP remediation costs may vary from management’s estimates due to the developing nature of remediation requirements, regulatory decisions by the NJDEP and related litigation. NJNG reviews these costs at the end of each fiscal year and adjusts its liability and corresponding regulatory asset as necessary to reflect its expected future remediation obligation. Accordingly, NJNG recognized a regulatory asset and an obligation of $149 million as of September 30, 2017, a decrease of $23 million, compared with the prior fiscal period. The reduction was due to the completion of remediation work at certain sites and a reduction to the remediation scope of work at another site.
Other
In May 2016, NJNG included a proposal in its base rate case to recover certain capital costs and incremental operation and maintenance costs related to a March 2016 BPU Order regarding new cybersecurity requirements. This proposal was updated in July 2016, and the associated costs were approved for recovery through NJNG’s new base rates, effective October 2016.
Page 42
New Jersey Resources Corporation
Part II
ITEM 7. MANAGEMENT’S DISCUSSION AND ANALYSIS OF FINANCIAL CONDITION AND RESULTS OF
OPERATIONS (Continued)
Interest Rate Risk
Due to the capital-intensive nature of NJNG’s operations and the seasonal nature of its working capital requirements, significant changes in interest rates can impact NJNG’s results. A more detailed discussion can be found in the Liquidity and Capital Resources and Cash Flow sections of Item 7. Management’s Discussion and Analysis of Financial Condition and Results of Operations.
Other regulatory filings and a more detailed discussion of the filings in this section can be found in Note 4. Regulation in the accompanying Consolidated Financial Statements.
Commodity Service to Customers
The EDECA, which was enacted in 1999, provides the framework for New Jersey’s retail energy markets, which are open to competition from other electric and natural gas suppliers. NJNG’s residential and commercial markets are currently open to competition, and its rates are segregated between BGSS (i.e., natural gas commodity) and delivery (i.e., transportation) components. NJNG does not earn utility gross margin on the commodity portion of its natural gas sales. NJNG earns utility gross margin through the delivery of natural gas to its customers and, therefore, is not negatively affected by customers who use its transportation service and purchase natural gas from another supplier. Under an existing order from the BPU, BGSS can be provided by suppliers other than the state’s natural gas utilities, however, customers who purchase natural gas from another supplier continue to use NJNG for transportation service.
Operating Results
NJNG’s operating results for the fiscal years ended September 30, are as follows:
(Thousands) | 2017 | 2016 | 2015 | ||||||
Operating revenues | $ | 695,637 | $ | 594,346 | $ | 781,970 | |||
Operating expenses | |||||||||
Gas purchases (1) (2) | 269,480 | 215,849 | 355,779 | ||||||
Operation and maintenance | 142,509 | 130,575 | 129,774 | ||||||
Regulatory rider expense (3) | 40,243 | 39,300 | 75,779 | ||||||
Depreciation and amortization | 49,347 | 47,828 | 43,085 | ||||||
Energy and other taxes (4) | 42,417 | 34,561 | 47,506 | ||||||
Total operating expenses | 543,996 | 468,113 | 651,923 | ||||||
Operating income | 151,641 | 126,233 | 130,047 | ||||||
Other income, net | 4,592 | 4,752 | 4,318 | ||||||
Interest expense, net of capitalized interest | 25,818 | 19,930 | 18,534 | ||||||
Income tax provision | 43,485 | 34,951 | 39,544 | ||||||
Net income | $ | 86,930 | $ | 76,104 | $ | 76,287 | |||
(1) | Includes the purchased cost of the natural gas, fees paid to pipelines and storage facilities, adjustments as a result of BGSS incentive programs and hedging transactions. These expenses are passed through to customers and are offset by corresponding revenues. |
(2) | Includes related party transactions of approximately $10.8 million, $10.8 million and $50.8 million during fiscal 2017, 2016 and 2015, respectively, a portion of which are eliminated in consolidation. |
(3) | Consists of expenses associated with state-mandated programs, the RAC and energy efficiency programs, and are calculated on a per-therm basis. These expenses are passed through to customers and offset by corresponding revenues. |
(4) | Consists primarily of sales tax, which is passed through to customers and offset by corresponding revenues. |
Page 43
New Jersey Resources Corporation
Part II
ITEM 7. MANAGEMENT’S DISCUSSION AND ANALYSIS OF FINANCIAL CONDITION AND RESULTS OF
OPERATIONS (Continued)
Operating Revenues and Gas Purchases
Operating revenues increased 17 percent during fiscal 2017 and decreased 24 percent during fiscal 2016. Gas purchases increased 24.8 percent during fiscal 2017 and decreased 39.3 percent during fiscal 2016. The factors contributing to the increases (decreases) in operating revenues and gas purchases during fiscal 2017 and 2016, are as follows:
2017 v. 2016 | 2016 v. 2015 | ||||||||||||
(Millions) | Operating revenue | Gas purchases | Operating revenue | Gas purchases | |||||||||
Firm sales | $ | 44.4 | $ | 21.6 | $ | (116.1 | ) | $ | (50.4 | ) | |||
Rate impact (1) | 37.4 | — | — | — | |||||||||
Bill credits (2) | 19.6 | 18.3 | (61.6 | ) | (57.6 | ) | |||||||
Off-system sales | 29.2 | 29.1 | (32.1 | ) | (31.8 | ) | |||||||
Average BGSS rates (3) | (17.9 | ) | (16.5 | ) | (2.7 | ) | (2.5 | ) | |||||
CIP adjustments | (21.0 | ) | — | 44.1 | — | ||||||||
Other (4) | 9.6 | 1.1 | (19.2 | ) | 2.4 | ||||||||
Total increase (decrease) | $ | 101.3 | $ | 53.6 | $ | (187.6 | ) | $ | (139.9 | ) | |||
(1) | Includes rate adjustments for the base rate case, CIP and demand charges. |
(2) | Operating revenues include changes in sales tax of $1.3 million and $4 million during during fiscal 2017 and 2016, respectively. |
(3) | Operating revenues include changes in sales tax of $1.4 million and $200,000 during fiscal 2017 and 2016, respectively. |
(4) | Other includes changes in rider rates, including those related to NJCEP and other programs. |
Fiscal 2017 compared with fiscal 2016
The changes in operating revenues and gas purchases during fiscal 2017 were due primarily to:
• | increased firm sales due primarily to customer growth and higher usage, related to weather being 6.8 percent colder; |
• | increased base rates resulting from the settlement of the base rate case; |
• | higher off-system sales due primarily to a 49.8 percent increase in the average price of gas sold, partially offset by a 12.2 percent reduction in volumes; |
• | a decrease in bill credits issued to residential and small commercial customers during the months of November 2016 through February 2017 compared with the same period last year; partially offset by |
• | a decrease in CIP due primarily to weather, partially offset by changes in the CIP as a result of the settlement of the base rate case. |
Fiscal 2016 compared with fiscal 2015
The decreases in operating revenues and gas purchases during fiscal 2016 were due primarily to:
• | decreased firm sales due primarily to lower usage related to weather being 22.9 percent warmer; |
• | bill credits issued to residential and small commercial customers effective November 1, 2015, which were not issued during fiscal 2015; |
• | lower off-system sales due primarily to a 38.3 percent decrease in the average price of gas sold, partially offset by a 18.4 percent increase in volumes; |
• | a decrease in rider revenues, categorized in other, due primarily to a 36.3 percent decrease in rates and a 18.5 percent decrease in usage; partially offset by |
• | an increase in CIP adjustments of $36.8 million related to weather and $7.3 million related to usage. |
Page 44
New Jersey Resources Corporation
Part II
ITEM 7. MANAGEMENT’S DISCUSSION AND ANALYSIS OF FINANCIAL CONDITION AND RESULTS OF
OPERATIONS (Continued)
Non-GAAP Financial Measures
Management uses utility gross margin, a non-GAAP financial measure, when evaluating the operating results of NJNG. NJNG’s utility gross margin is defined as natural gas revenues less natural gas purchases, sales tax, and regulatory rider expenses, and may not be comparable to the definition of gross margin used by others in the natural gas distribution business and other industries. Management believes that utility gross margin provides a meaningful basis for evaluating utility operations since natural gas costs, sales tax and regulatory rider expenses are included in operating revenue and passed through to customers and, therefore, have no effect on utility gross margin. Non-GAAP financial measures are not in accordance with, or an alternative to, GAAP and should be considered in addition to, and not as a substitute for, the comparable GAAP measure.
Utility Gross Margin
A reconciliation of operating revenues, the closest GAAP financial measure to NJNG’s utility gross margin, is as follows for the fiscal years ended September 30:
(Thousands) | 2017 | 2016 | 2015 | ||||||
Operating revenues | $ | 695,637 | $ | 594,346 | $ | 781,970 | |||
Less: | |||||||||
Gas purchases | 269,480 | 215,849 | 355,779 | ||||||
Energy taxes | 37,917 | 29,832 | 42,929 | ||||||
Regulatory rider expense | 40,243 | 39,300 | 75,779 | ||||||
Utility gross margin | $ | 347,997 | $ | 309,365 | $ | 307,483 | |||
Utility gross margin consists of three components:
• | utility firm gross margin generated from only the delivery component of either a sales tariff or a transportation tariff from residential and commercial customers who receive natural gas service from NJNG; |
• | BGSS incentive programs, where revenues generated or savings achieved from BPU-approved off-system sales, capacity release or storage incentive programs are shared between customers and NJNG; and |
• | utility gross margin generated from off-tariff customers, as well as interruptible customers. |
The following provides more information on the components of utility gross margin and associated throughput (Bcf) of natural gas delivered to customers:
2017 | 2016 | 2015 | |||||||||||||||
($ in thousands) | Margin | Bcf | Margin | Bcf | Margin | Bcf | |||||||||||
Utility gross margin/throughput | |||||||||||||||||
Residential | $ | 218,093 | 40.7 | $ | 187,762 | 36.9 | $ | 182,407 | 45.9 | ||||||||
Commercial, industrial and other | 51,510 | 8.7 | 46,878 | 7.3 | 47,162 | 9.6 | |||||||||||
Firm transportation | 58,172 | 14.4 | 54,841 | 14.1 | 55,614 | 16.0 | |||||||||||
Total utility firm gross margin/throughput | 327,775 | 63.8 | 289,481 | 58.3 | 285,183 | 71.5 | |||||||||||
BGSS incentive programs | 13,724 | 178.4 | 14,978 | 216.7 | 17,707 | 222.4 | |||||||||||
Interruptible/off-tariff agreements | 6,498 | 55.0 | 4,906 | 61.5 | 4,593 | 47.1 | |||||||||||
Total utility gross margin/throughput | $ | 347,997 | 297.2 | $ | 309,365 | 336.5 | $ | 307,483 | 341.0 | ||||||||
Utility Firm Gross Margin
A description of the factors contributing to the increases in utility firm gross margin during fiscal 2017 and 2016, are as follows:
(Thousands) | 2017 v. 2016 | 2016 v. 2015 | ||||||||
Rate impact | $ | 35,019 | $ | — | ||||||
Customer growth | 3,619 | 3,436 | ||||||||
SAVEGREEN | (345 | ) | 862 | |||||||
Total increase | $ | 38,293 | $ | 4,298 | ||||||
Page 45
New Jersey Resources Corporation
Part II
ITEM 7. MANAGEMENT’S DISCUSSION AND ANALYSIS OF FINANCIAL CONDITION AND RESULTS OF
OPERATIONS (Continued)
BGSS Incentive Programs
A description of the factors contributing to the (decreases) increases in utility gross margin generated by NJNG’s BGSS incentive programs during fiscal 2017 and 2016, are as follows:
(Thousands) | 2017 v. 2016 | 2016 v. 2015 | ||||||||
Capacity release | $ | (1,672 | ) | $ | (758 | ) | ||||
Storage | 378 | (1,184 | ) | |||||||
Off-system sales | 39 | (278 | ) | |||||||
FRM | — | (509 | ) | |||||||
Total (decrease) increase | $ | (1,255 | ) | $ | (2,729 | ) | ||||
Fiscal 2017 compared with fiscal 2016
The increase in utility gross margin was due primarily to the base rate increase and customer growth, along with an increase in interruptible/off-tariff agreements, partially offset by decreased margins related to capacity release due to lower volumes and lower value of capacity.
Fiscal 2016 compared with fiscal 2015
The increase in utility gross margin was due primarily to customer growth, partially offset by decreased BGSS incentives. BGSS incentives were lower due primarily to decreases in the storage incentive program due primarily to higher cost at injection point, as well as decreases in capacity release and off system sales due primarily to the lower capacity value. The decrease in off-system sales was also driven by a decrease in the average price of gas sold, partially offset by an increase in volumes. The FRM program was terminated effective November 2015.
Operation and Maintenance Expense
A summary and description of the factors contributing to the increases (decreases) in O&M expense during fiscal 2017 and 2016, are as follows:
(Thousands) | 2017 v. 2016 | 2016 v. 2015 | ||||||||
Compensation and benefits | $ | 5,412 | $ | 898 | ||||||
Base rate amortization of regulatory assets | 3,264 | — | ||||||||
Shared corporate costs | 3,061 | 2,378 | ||||||||
Other | 197 | (2,475 | ) | |||||||
Total increase | $ | 11,934 | $ | 801 | ||||||
Fiscal 2017 compared with fiscal 2016
The increase in O&M expense during fiscal 2017 was due primarily to:
• | increased compensation costs due primarily to increases in headcount, incentives, healthcare premiums, lower capitalized labor and increased pension/OPEB benefit costs related to changes in actuarial assumptions, partially offset by implementation of the spot rate method to measure interest and service cost components; |
• | additional amortization of regulatory assets that are being recovered as a result of the settlement of the base rate case; and |
• | increased shared corporate costs resulting primarily from increased software maintenance, incentives, postemployment costs and healthcare premiums. |
Fiscal 2016 compared with fiscal 2015
The increase in O&M expense during fiscal 2016 was due primarily to:
• | increased shared corporate costs resulting primarily from increased head count and healthcare premiums, as well as increased temporary staffing and consulting services; |
Page 46
New Jersey Resources Corporation
Part II
ITEM 7. MANAGEMENT’S DISCUSSION AND ANALYSIS OF FINANCIAL CONDITION AND RESULTS OF
OPERATIONS (Continued)
• | increased compensation costs at NJNG due primarily to increased head count and healthcare premiums, partially offset by reduced pension expense due to an increase in expected return on assets associated with a $30 million discretionary contribution in November 2015; partially offset by |
• | lower consulting costs due primarily to reduced software maintenance and tax audit expenses, lower bad debt expense due primarily to a decrease in write-offs of customer receivables and lower maintenance and repairs due primarily to the much warmer winter weather in fiscal 2016. |
Depreciation Expense
Depreciation expense increased $1.5 million in fiscal 2017, compared with fiscal 2016, as a result of additional utility plant being placed into service, as well as an increase in the overall depreciation rate from 2.34 percent to 2.4 percent resulting from the settlement of the base rate case. Depreciation expense increased $4.7 million in fiscal 2016, compared with fiscal 2015, as a result of additional utility plant being placed into service.
Operating Income
Operating income increased $25.4 million, or 20.1 percent, in fiscal 2017, compared with fiscal 2016, due primarily to the increase in total utility gross margin of $38.6 million, partially offset by the increase in O&M, as previously discussed. Operating income decreased $3.8 million, or 2.9 percent, in fiscal 2016, compared with fiscal 2015, due primarily to the increase in depreciation, partially offset by the increase in total utility gross margin of $1.9 million, as previously discussed.
Income Tax Provision
Income tax provision increased $8.5 million during fiscal 2017, compared with fiscal 2016, due primarily to an increase in pre-tax income, partially offset by increased costs associated with the removal of distribution main that was placed in service before 1981, for which the tax benefit is passed on to customers in base rates.
Income tax provision decreased $4.6 million during fiscal 2016, compared with fiscal 2015, due primarily to:
• | a decrease in pre-tax income; |
• | the revaluation of the deferred tax liability in fiscal 2015; |
• | a change in the method of accounting for equity compensation due to the adoption of ASU 2016-09, which resulted in the recognition of excess tax benefits related to vested stock compensation for which the tax deduction exceeded the associated expense. See Note 2. Summary of Significant Accounting Policies - Recently Adopted Updates to the Accounting Standards Codification in the accompanying Consolidated Financial Statements for a more detailed discussion; and |
• | an increase in costs of retiring assets placed into service prior to 1981. |
Net Income
Net income increased $10.8 million to $86.9 million in fiscal 2017, compared with fiscal 2016, due primarily to an increase in operating income as discussed above, partially offset by an increase in the income tax provision as discussed above and interest expense associated with debt issued in June 2016.
Net income decreased $183,000 to $76.1 million in fiscal 2016, compared with fiscal 2015, due primarily to a decrease in operating income as discussed above, an increase in interest expense associated with higher long-term debt outstanding, partially offset by a decrease in the income tax provision as discussed above and an increase in other income related to AFUDC interest earned on infrastructure projects.
Page 47
New Jersey Resources Corporation
Part II
ITEM 7. MANAGEMENT’S DISCUSSION AND ANALYSIS OF FINANCIAL CONDITION AND RESULTS OF
OPERATIONS (Continued)
Clean Energy Ventures Segment
Overview
Our Clean Energy Ventures segment actively pursues opportunities in the clean energy markets, including solar and onshore wind. Clean Energy Ventures has entered into various agreements to install solar net-metered systems for residential and commercial customers, as well as large commercial grid-connected projects. In addition, Clean Energy Ventures has entered into various long-term agreements, including PPAs, to supply energy from wind and solar projects.
Solar
Since its inception, Clean Energy Ventures has constructed a total of 189.1 MW of solar capacity and has an additional 11.2 MW under construction.
Solar expenditures for the fiscal years ended September 30, are as follows:
($ in Thousands) | 2017 | 2016 | 2015 | ||||||||||||||||||
Placed in service | Projects | MW | Costs | Projects | MW | Costs | Projects | MW | Costs | ||||||||||||
Grid-connected (1) | 2 | 20.0 | $ | 62,700 | 5 | 21.8 | $ | 51,240 | 4 | 26.1 | $ | 66,424 | |||||||||
Net-metered: | |||||||||||||||||||||
Commercial (1) | 3 | 7.1 | 19,714 | — | — | 3 | 1 | 0.4 | 1,382 | ||||||||||||
Residential | 1,300 | 12.4 | 37,901 | 1,123 | 10.4 | 34,318 | 829 | 7.8 | 24,973 | ||||||||||||
Total placed in service | 1,305 | 39.5 | $ | 120,315 | 1,128 | 32.2 | $ | 85,561 | 834 | 34.3 | $ | 92,779 | |||||||||
(1) | Includes projects subject to sale-leaseback arrangements. |
During fiscal 2017, Clean Energy Ventures entered into sale-leaseback arrangements for two of its commercial solar projects, for which the ITCs and other tax benefits associated with these solar projects were transferred to the buyer. During fiscal 2017, excluding those cost related to the commercial solar projects of $31.1 million that were included in the sale-leaseback transactions, $89.2 million of solar-related capital expenditures were ITC eligible. During fiscal 2016 and 2015, all solar-related capital expenditures were ITC eligible. We estimate total solar-related capital expenditures for ITC eligible projects during fiscal 2018 to be between $132 million and $140 million.
As part of its solar investment portfolio, Clean Energy Ventures operates a residential solar program, The Sunlight Advantage®, that provides qualifying homeowners the opportunity to have a solar system installed at their home with no installation or maintenance expenses. Clean Energy Ventures owns, operates and maintains the system over the life of the contract in exchange for monthly lease payments.
Once a solar installation has received the proper certifications and commences operations, each MWh of electricity produced creates an SREC that represents the renewable energy attribute of the solar-electricity generated that can be sold to third parties, predominantly load-serving entities that are required to comply with the solar requirements under New Jersey’s renewable portfolio standard. In addition, under the recently updated federal tax guidelines, projects that are placed in service through December 31, 2019, qualify for a 30 percent federal ITC. The credit will decline to 26 percent for property under construction during 2020 and to 22 percent for property under construction during 2021. The ITC will be reduced to 10 percent for any property that is under construction before 2022, but not placed in service before 2024.
Onshore Wind
Clean Energy Ventures invests in small to mid-size onshore wind projects that fit its investment profile and has a total of 126.6 MW of wind capacity as of September 30, 2017. The wind projects are eligible for PTCs for a 10-year period following commencement of operations and have PPAs of various terms in place, which typically govern the sale of energy, capacity and/or renewable energy credits. An $89 million, 39.9 MW wind project in Somerset County, Pennsylvania was completed in December 2016.
Clean Energy Ventures’ investments are subject to a variety of factors, such as timing of construction schedules, permitting and regulatory processes, volatility of energy prices, the ability to secure PPAs, delays related to electric grid interconnection, which can affect our ability to commence operations on a timely basis or at all, economic trends, the ability to access capital or allocation of capital to other investments or business opportunities and other unforeseen events. Solar projects not placed in service, as originally planned prior to the end of a reporting period, may result in a failure to qualify for ITCs. Further, changes in prices
Page 48
New Jersey Resources Corporation
Part II
ITEM 7. MANAGEMENT’S DISCUSSION AND ANALYSIS OF FINANCIAL CONDITION AND RESULTS OF
OPERATIONS (Continued)
on the unhedged portion of SREC production could have a significant adverse impact on earnings with some offset expected from higher wind energy market prices due to the PTC phase out and/or improved efficiencies from lower costs for related turbine technology.
Wind projects for which construction of a facility begins after December 31, 2016 through December 31, 2019, will be subject to reduced PTCs and could have a significant adverse impact on 10 years of forward earnings. PTCs will be phased out from 100 percent in 2016 to 80 percent in 2017, 60 percent in 2018, 40 percent in 2019 and zero thereafter. In addition, since the primary contributors toward the value of qualifying clean energy projects are tax incentives and SRECs, changes in the federal statutes related to the ITC or PTC or in the marketplace and/or relevant legislation surrounding renewable clean energy credits, could significantly affect earnings.
Operating Results
Clean Energy Ventures’ financial results for the fiscal years ended September 30, are summarized as follows:
(Thousands) | 2017 | 2016 | 2015 | ||||||
Operating revenues | $ | 64,394 | $ | 53,540 | $ | 32,513 | |||
Operating expenses | |||||||||
Operation and maintenance | 23,448 | 18,897 | 15,248 | ||||||
Depreciation and amortization | 31,834 | 23,971 | 17,297 | ||||||
Other taxes | 1,209 | 900 | 726 | ||||||
Total operating expenses | 56,491 | 43,768 | 33,271 | ||||||
Operating income (loss) | 7,903 | 9,772 | (758 | ) | |||||
Other income, net | 2,072 | 2,333 | 1,526 | ||||||
Interest expense, net | 16,263 | 10,304 | 7,635 | ||||||
Income tax (benefit) | (31,161 | ) | (26,592 | ) | (26,968 | ) | |||
Net income | $ | 24,873 | $ | 28,393 | $ | 20,101 | |||
Operating Revenues
Operating revenues increased $10.9 million and $21 million during fiscal 2017 and 2016, respectively, compared with the previous fiscal years, and is comprised of the following:
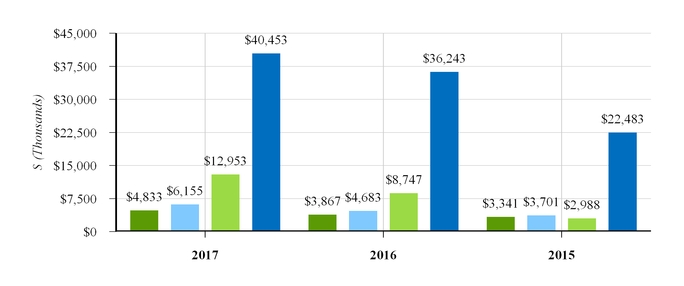

Page 49
New Jersey Resources Corporation
Part II
ITEM 7. MANAGEMENT’S DISCUSSION AND ANALYSIS OF FINANCIAL CONDITION AND RESULTS OF
OPERATIONS (Continued)
SREC activity for the fiscal years ended September 30, is as follows:
2017 | 2016 | 2015 | ||||
Inventory balance as of October 1, | 24,135 | 33,203 | 29,970 | |||
SRECs generated | 197,521 | 160,009 | 126,133 | |||
SRECs delivered | (173,299 | ) | (169,077 | ) | (122,900 | ) |
Inventory balance as of September 30, | 48,357 | 24,135 | 33,203 | |||
SRECs generated increased 23.4 percent and 26.9 percent, for the fiscal years ended September 30, 2017 and 2016, respectively, compared with the previous fiscal years. The average SREC sales price was $233 in fiscal 2017, $214 in fiscal 2016 and $183 in fiscal 2015.
Clean Energy Ventures hedges a portion of its expected SREC production through the use of forward sales contracts. The following table reflects the hedged percentage of SREC inventory and projected SREC production related to its in-service commercial and residential assets:
Energy Year (1) | Percent of SRECs Hedged |
2018 | 90% |
2019 | 70% |
2020 | 11% |
(1) | Energy years are compliance periods for New Jersey's renewable portfolio standard that run from June 1 to May 31. |
There are no direct costs associated with the production of SRECs/RECs by our solar and wind assets. All related costs are included as a component of O&M expenses on the Consolidated Statements of Operations, including such expenses as facility maintenance and various fees.
Operation and Maintenance Expense
O&M expense increased $4.6 million in fiscal 2017 and $3.6 million in fiscal 2016, due primarily to additional maintenance, leasing and administrative costs associated with wind and solar projects placed in service, as well as increased shared corporate costs.
Depreciation Expense
Depreciation expense increased $7.9 million in fiscal 2017 and $6.7 million in fiscal 2016, as a result of increases in wind and solar projects placed in service.
Income Tax (Benefit)
Income tax benefit during fiscal 2017, 2016 and 2015, includes $24.6 million, $25.7 million and $27.8 million respectively, of ITCs associated with solar projects, that were completed and placed into service during the corresponding fiscal year. Income tax benefit during fiscal 2017, 2016 and 2015 includes $9.9 million and $6.7 million, and $2 million respectively, of PTCs associated with wind projects. Clean Energy Ventures recognized $29.2 million, $27 million, and $24.1 million related to tax credits, net of deferred taxes, during fiscal 2017, 2016 and 2015, respectively.
Net Income
Net income in fiscal 2017 decreased $3.5 million, compared with fiscal 2016, due primarily to increased costs related to depreciation and O&M as previously discussed, as well as an increase in interest expense related to higher debt associated with capital expenditures, partially offset by an increase in operating revenues, as well as an increase in tax benefits recognized due primarily to an increase PTCs, as previously discussed.
Net income during fiscal 2016 increased $8.3 million, compared with fiscal 2015, due primarily to the factors described above, partially offset by an increase in interest expense due to higher debt associated with capital expenditures.
Page 50
New Jersey Resources Corporation
Part II
ITEM 7. MANAGEMENT’S DISCUSSION AND ANALYSIS OF FINANCIAL CONDITION AND RESULTS OF
OPERATIONS (Continued)
Energy Services Segment
Overview
Energy Services markets and sells natural gas to wholesale and retail customers and manages natural gas storage and transportation assets throughout major market areas across North America. Energy Services maintains a strategic portfolio of natural gas storage and transportation contracts that it utilizes in conjunction with its market expertise to provide service and value to its customers. Availability of these storage and transportation contracts allows Energy Services to generate market opportunities by capturing price differentials over specific time horizons and between geographic market locations.
Energy Services also provides management of storage and transportation assets for natural gas producers and regulated utilities. These management transactions typically involve the release of producer/utility owned storage and/or transportation capacity in combination with either an obligation to purchase and/or deliver physical natural gas. In addition to the contractual purchase and/or sale of physical natural gas, Energy Services generates or pays fee-based margin in exchange for its active management and may provide the producer and/or utility with additional margin based on actual results.
In conjunction with the active management of these contracts, Energy Services generates financial margin by identifying market opportunities and simultaneously entering into natural gas purchase/sale, storage or transportation contracts and financial derivative contracts. In cases where storage is utilized to fulfill these contracts, these forecast sales and/or purchases are economically hedged through the use of financial derivative contracts. The financial derivative contracts consist primarily of exchange-traded futures, options and swap contracts, and are frequently used to lock in anticipated transactional cash flows and to help manage volatility in natural gas market prices. Generally, when its storage and transportation contracts are exposed to periods of increased market volatility, Energy Services is able to implement strategies that allow them to capture margin by improving the respective time or geographic spreads on a forward basis.
On July 27, 2017, we acquired certain retail and wholesale natural gas energy contract assets from Talen. The acquisition included sales agreements with large commercial and industrial retail customers in Delaware, Maryland, New Jersey and Pennsylvania, pipeline and storage capacity agreements on various pipelines and various wholesale transportation contracts.
Energy Services accounts for its physical commodity contracts and its financial derivative instruments at fair value on the Consolidated Balance Sheets. Changes in the fair value of physical commodity contracts and financial derivative instruments are included in earnings as a component of operating revenue or gas purchases on the Consolidated Statements of Operations. Volatility in reported net income at Energy Services can occur over periods of time due to changes in the fair value of derivatives, as well as timing differences related to certain transactions. Unrealized gains and losses can fluctuate as a result of changes in the price of natural gas, SRECs and foreign currency from the original transaction price. Volatility in earnings can also occur as a result of timing differences between the settlement of financial derivatives and the sale of the underlying physical commodity. For example, when a financial instrument settles and the physical natural gas is injected into inventory, the realized gains and losses associated with the financial instrument are recognized in earnings. However, the gains and losses associated with the physical natural gas are not recognized in earnings until the natural gas inventory is withdrawn from storage and sold, at which time Energy Services realizes the entire margin on the transaction.
Page 51
New Jersey Resources Corporation
Part II
ITEM 7. MANAGEMENT’S DISCUSSION AND ANALYSIS OF FINANCIAL CONDITION AND RESULTS OF
OPERATIONS (Continued)
Operating Results
Energy Services’ financial results for the fiscal years ended September 30, are summarized as follows:
(Thousands) | 2017 | 2016 | 2015 | ||||||
Operating revenues (1) | $ | 1,462,681 | $ | 1,197,253 | $ | 1,934,307 | |||
Operating expenses | |||||||||
Gas purchases (including demand charges (2)(3)) | 1,441,310 | 1,153,911 | 1,795,719 | ||||||
Operation and maintenance | 20,313 | 20,025 | 25,403 | ||||||
Depreciation and amortization | 63 | 88 | 90 | ||||||
Other taxes | 1,788 | 937 | 1,237 | ||||||
Total operating expenses | 1,463,474 | 1,174,961 | 1,822,449 | ||||||
Operating (loss) income | (793 | ) | 22,292 | 111,858 | |||||
Other income | 1 | 98 | 438 | ||||||
Interest expense, net | 2,747 | 1,095 | 1,209 | ||||||
Income tax (benefit) provision | (4,015 | ) | 7,030 | 39,043 | |||||
Net income | $ | 476 | $ | 14,265 | $ | 72,044 | |||
(1) | Includes related party transactions of approximately $316,000, $9.5 million and $61.5 million during fiscal 2017, 2016 and 2015, respectively, which is eliminated in consolidation. |
(2) | Costs associated with pipeline and storage capacity that are expensed over the term of the related contracts, which generally varies from less than one year to 10 years. |
(3) | Includes related party transactions of approximately $4.6 million, $14.6 million and $27.9 million during fiscal 2017, 2016 and 2015, respectively, a portion of which are eliminated in consolidation. |
As of September 30, Energy Services’ portfolio of financial derivative instruments are composed of:
(in Bcf) | 2017 | 2016 | 2015 | |||
Net short futures contracts | 16.4 | 79.1 | 91.1 | |||
Net long options | — | 1.2 | 1.2 | |||
Operating Revenues and Gas Purchases
During fiscal 2017, operating revenues increased $265.4 million and gas purchases increased $287.4 million, due primarily to an approximate 36.8 percent increase in the average price of natural gas and the acquisition of Talen's sales, pipeline and storage capacity agreements, as well as various wholesale transactions, partially offset by a 5.4 percent decrease in wholesale volumes. Gas purchases also include a decrease due to the changes in the economic hedging of natural gas inventory of $75.3 million, partially offset by an increase of $63.4 million in unrealized gains on derivative instruments.
During fiscal 2016, operating revenues decreased $737.1 million and gas purchases decreased $641.8 million due primarily to a decrease of $59.7 million related to changes in the value of financial hedges, as well as a decrease of approximately 26.5 percent in average gas prices, as well as a 12.1 percent decrease in sales volumes. The price decreases were related to the warm winter weather, primarily across the eastern United States, during fiscal 2016, compared with fiscal 2015.
Future results at Energy Services are contingent upon natural gas market price volatility driven by variations in both the supply and demand balances caused by weather and other factors. As a result, variations in weather patterns in the key market areas served may affect earnings during the fiscal year. Changes in market fundamentals, such as an increase in supply and decrease in demand due to milder temperatures, and reduced volatility, can negatively impact Energy Services’ earnings. See Item 7. Management’s Discussion and Analysis of Financial Condition and Results of Operations - Natural Gas Distribution Segment for Tetco M-3 Daily Prices, which illustrates the daily natural gas prices in the Northeast market region.
Operation and Maintenance Expense
O&M expense remained relatively flat during fiscal 2017, compared with fiscal 2016. O&M expense decreased $5.4 million, or 21.2 percent, during fiscal 2016, compared with fiscal 2015, due primarily to decreases in incentive compensation, charitable donations and shared services costs.
Page 52
New Jersey Resources Corporation
Part II
ITEM 7. MANAGEMENT’S DISCUSSION AND ANALYSIS OF FINANCIAL CONDITION AND RESULTS OF
OPERATIONS (Continued)
Net Income
Net income decreased $13.8 million during fiscal 2017, compared with fiscal 2016, due primarily to the decrease in operating income, partially offset by the related decrease in income tax expense. Net income decreased $57.8 million during fiscal 2016, compared with fiscal 2015, due primarily to lower operating income, partially offset by the related decrease in income tax expense.
Non-GAAP Financial Measures
Management uses financial margin and NFE, non-GAAP financial measures, when evaluating the operating results of Energy Services. Financial margin and NFE are based on removing timing differences associated with certain derivative instruments, as discussed above. Management views these measures as representative of the overall expected economic result and uses these measures to compare Energy Services’ results against established benchmarks and earnings targets as these measures eliminate the impact of volatility on GAAP earnings as a result of timing differences associated with the settlement of derivative instruments. To the extent that there are unanticipated impacts from changes in the market value related to the effectiveness of economic hedges, Energy Services’ actual non-GAAP results can differ from the results anticipated at the outset of the transaction. Non-GAAP financial measures are not in accordance with, or an alternative to, GAAP and should be considered in addition to, and not as a substitute for, the comparable GAAP measure.
When Energy Services reconciles the most directly comparable GAAP measure to both financial margin and NFE, the current period unrealized gains and losses on derivatives are excluded as a reconciling item. Financial margin and NFE also exclude the effects of economic hedging of the value of our natural gas in storage and, therefore, only include realized gains and losses related to natural gas withdrawn from storage, effectively matching the full earnings effects of the derivatives with realized margins on the related physical gas flows.
Financial Margin
The following table is a computation of Energy Services’ financial margin for the fiscal years ended September 30.
(Thousands) | 2017 | 2016 | 2015 | ||||||
Operating revenues | $ | 1,462,681 | $ | 1,197,253 | $ | 1,934,307 | |||
Less: Gas purchases | 1,441,310 | 1,153,911 | 1,795,719 | ||||||
Add: | |||||||||
Unrealized (gain) loss on derivative instruments and related transactions (1) | (10,063 | ) | 48,855 | (39,408 | ) | ||||
Effects of economic hedging related to natural gas inventory (2) | 38,470 | (36,816 | ) | (8,225 | ) | ||||
Financial margin | $ | 49,778 | $ | 55,381 | $ | 90,955 | |||
(1) | Includes unrealized (gains) losses related to an intercompany transaction between NJNG and Energy Services that have been eliminated in consolidation of approximately $(751,000), $(1.3) million and $465,000 for the fiscal years ended September 30, 2017, 2016 and 2015, respectively. |
(2) | Effects of hedging natural gas inventory transactions where the economic impact is realized in a future period. |
A reconciliation of operating income, the closest GAAP financial measure to Energy Services’ financial margin, is as follows for the fiscal years ended September 30:
(Thousands) | 2017 | 2016 | 2015 | ||||||
Operating (loss) income | $ | (793 | ) | $ | 22,292 | $ | 111,858 | ||
Add: | |||||||||
Operation and maintenance | 20,313 | 20,025 | 25,403 | ||||||
Depreciation and amortization | 63 | 88 | 90 | ||||||
Other taxes | 1,788 | 937 | 1,237 | ||||||
Subtotal | 21,371 | 43,342 | 138,588 | ||||||
Add: | |||||||||
Unrealized (gain) loss on derivative instruments and related transactions | (10,063 | ) | 48,855 | (39,408 | ) | ||||
Effects of economic hedging related to natural gas inventory | 38,470 | (36,816 | ) | (8,225 | ) | ||||
Financial margin | $ | 49,778 | $ | 55,381 | $ | 90,955 | |||
Page 53
New Jersey Resources Corporation
Part II
ITEM 7. MANAGEMENT’S DISCUSSION AND ANALYSIS OF FINANCIAL CONDITION AND RESULTS OF
OPERATIONS (Continued)
Financial margin decreased $5.6 million during fiscal 2017, compared with fiscal 2016, due primarily to fewer market opportunities related to transportation assets and timing of certain transactions related to storage withdrawals along with a warmer than normal winter and a milder than normal spring. Financial margin decreased $35.6 million during fiscal 2016, compared with fiscal 2015, due primarily to lower volatility and narrower price spreads resulting from the warmer weather and fewer market opportunities, as previously discussed.
Net Financial Earnings
A reconciliation of Energy Services’ net income (loss), the most directly comparable GAAP financial measure to NFE, is as follows for the fiscal years ended September 30:
(Thousands) | 2017 | 2016 | 2015 | ||||||
Net income | $ | 476 | $ | 14,265 | $ | 72,044 | |||
Add: | |||||||||
Unrealized (gain) loss on derivative instruments and related transactions | (10,063 | ) | 48,855 | (39,408 | ) | ||||
Tax effect (1) | 3,635 | (17,734 | ) | 14,653 | |||||
Effects of economic hedging related to natural gas inventory | 38,470 | (36,816 | ) | (8,225 | ) | ||||
Tax effect | (13,964 | ) | 13,364 | 3,058 | |||||
Net financial earnings | $ | 18,554 | $ | 21,934 | $ | 42,122 | |||
(1) | Includes taxes related to an intercompany transaction between NJNG and Energy Services that have been eliminated in consolidation of approximately $427,000 and $716,000 and $(262,000) for the fiscal years ended September 30, 2017, 2016 and 2015, respectively. |
NFE decreased $3.4 million during fiscal 2017, compared with fiscal 2016, due primarily to a decrease in financial margin, as previously discussed, and higher interest expense related to increased borrowing, partially offset by a reduction in income tax expense related to the decrease in NFE. NFE decreased $20.2 million during fiscal 2016, compared with fiscal 2015, due primarily to a decrease in financial margin, partially offset by lower O&M.
Future results are subject to Energy Services’ ability to expand its wholesale sales and service activities and are contingent upon many other factors, including an adequate number of appropriate and credit qualified counterparties in an active and liquid natural marketplace, volatility in the natural gas market due to weather or other fundamental market factors impacting supply and/or demand, transportation, storage and/or other market arbitrage opportunities, sufficient liquidity in the overall energy trading market and continued access to liquidity in the capital markets.
Midstream Segment
Overview
Our Midstream segment invests in natural gas assets, such as natural gas transportation and storage facilities. We believe that acquiring, owning and developing these midstream assets, which operate under a tariff structure that has either regulated or market-based rates, can provide us a growth opportunity. To that end, we have a 50 percent ownership interest in Steckman Ridge, a storage facility that operates under market-based rates and a 20 percent ownership interest in PennEast, a natural gas pipeline, which we estimate to be completed and operational in 2019. PennEast may revise the project timeline further upon receipt of a Certificate of Public Convenience and Necessity from FERC. As of September 30, 2017, our net investments in Steckman Ridge and PennEast were $120.3 million and $52.3 million, respectively.
In September 2015, Midstream exchanged its 5.53 percent ownership interest in Iroquois with Dominion Midstream Partners, L.P. for 1.84 million DM Common Units. As of September 30, 2017, the market value of the DM Common Units was $58.8 million. See Note 2. Summary of Significant Accounting Policies - Available for Sale Securities in the accompanying Consolidated Financial Statements for a more detailed discussion.
Page 54
New Jersey Resources Corporation
Part II
ITEM 7. MANAGEMENT’S DISCUSSION AND ANALYSIS OF FINANCIAL CONDITION AND RESULTS OF
OPERATIONS (Continued)
Operating Results
The financial results of our Midstream segment for the fiscal years ended September 30, are summarized as follows:
(Thousands) | 2017 | 2016 | 2015 | ||||||
Equity in earnings of affiliates | $ | 17,797 | $ | 13,936 | $ | 17,487 | |||
Operation and maintenance | $ | 2,302 | $ | 1,197 | $ | 1,136 | |||
Other income | $ | 4,162 | $ | 3,130 | $ | 977 | |||
Interest expense, net | $ | 960 | $ | 287 | $ | 717 | |||
Income tax provision | $ | 5,820 | $ | 6,130 | $ | 6,849 | |||
Net income | $ | 12,857 | $ | 9,406 | $ | 9,780 | |||
Equity in earnings of affiliates are driven primarily by storage revenues generated by Steckman Ridge and, through September 29, 2015, transportation revenues generated by Iroquois.
Equity in earnings of affiliates is as follows for the fiscal years ended September 30:
(Thousands) | 2017 | 2016 | 2015 | ||||||
Steckman Ridge | $ | 13,351 | $ | 14,050 | $ | 12,330 | |||
Iroquois (1) | — | — | 5,164 | ||||||
PennEast | 4,446 | (114 | ) | (7 | ) | ||||
Total equity in earnings of affiliates | $ | 17,797 | $ | 13,936 | $ | 17,487 | |||
(1) | Transportation revenues generated by Iroquois ended September 29, 2015. |
Equity in earnings of affiliates increased $3.9 million during fiscal 2017, compared with fiscal 2016, due primarily to the AFUDC earned at PennEast. Equity in earnings of affiliates decreased $3.6 million during fiscal 2016, compared with fiscal 2015, due primarily to the exchange of our ownership interest in Iroquois during the fourth quarter of fiscal 2015, partially offset by increases in storage service revenue and demand for hub services at Steckman Ridge.
O&M expense increased $1.1 million during fiscal 2017, compared with fiscal 2016, due primarily to increased consulting expenses, charitable donations and shared services costs. O&M expense remained relatively flat during fiscal 2016, compared with fiscal 2015.
Other income increased $1 million during fiscal 2017, compared with fiscal 2016, due primarily to increased interest income and dividend income from our investment in DM Common Units. Other income increased $2.2 million during fiscal 2016, compared with fiscal 2015, due primarily to dividend income from the DM Common Units.
Interest expense, net increased $673,000 during fiscal 2017, compared with fiscal 2016, due primarily to increased intercompany borrowing related to our PennEast investment and decreased $430,000 during fiscal 2016, compared with fiscal 2015, due primarily to proceeds generated by our investments that are being used to reduce intercompany loans.
The income tax provision remained relatively unchanged during fiscal 2017, compared with fiscal 2016. Equity in earnings increased, however, the tax benefits associated with AFUDC reduced the overall tax expense. The income tax provision decreased $719,000 during fiscal 2016, compared with fiscal 2015, due primarily to the decrease in equity in earnings of affiliates, as discussed above.
Net income in fiscal 2017 increased $3.5 million, compared with fiscal 2016, due primarily to the increase in equity in earnings of affiliates, as discussed above. Net income decreased $374,000 in fiscal 2016, compared with fiscal 2015, due primarily to the decrease in equity in earnings of affiliates, partially offset by the increase in other income and the decreases in the income tax provision and net interest expense.
Page 55
New Jersey Resources Corporation
Part II
ITEM 7. MANAGEMENT’S DISCUSSION AND ANALYSIS OF FINANCIAL CONDITION AND RESULTS OF
OPERATIONS (Continued)
Home Services and Other Operations
Overview
The financial results of Home Services and Other consist primarily of the operating results of NJRHS and CR&R. NJRHS provides service, sales and installation of appliances to approximately 112,000 service contract customers and has been focused on growing its installation business and expanding its service contract customer base. Home Services and Other also includes organizational expenses incurred at NJR. NJR Energy, a subsidiary of CR&R, which invested in other energy-related ventures, was dissolved on November 28, 2016, and all assets were moved to CR&R during the first quarter of fiscal 2017.
Operating Results
The consolidated financial results of Home Services and Other for the fiscal years ended September 30, are summarized as follows:
(Thousands) | 2017 | 2016 | 2015 | ||||||
Operating revenues | $ | 49,591 | $ | 48,497 | $ | 48,703 | |||
Operation and maintenance | $ | 40,245 | $ | 40,106 | $ | 39,601 | |||
Energy and other taxes | $ | 3,938 | $ | 3,777 | $ | 3,815 | |||
Other income, net | $ | 6,467 | $ | 869 | $ | 685 | |||
Income tax provision | $ | 3,857 | $ | 1,387 | $ | 1,551 | |||
Net income | $ | 6,811 | $ | 2,882 | $ | 3,420 | |||
Operating revenue increased $1.1 million during fiscal 2017, compared with fiscal 2016, due primarily to increased furnace/air conditioner combination installations at NJRHS related to increased marketing promotions, along with increased contract revenue, partially offset by decreased operating revenue at CR&R due to the sale of a 56,400 square foot office building.
Operating revenue decreased $206,000 during fiscal 2016, compared with fiscal 2015, due primarily to a decrease in heating equipment installations and generator sales at NJRHS resulting from warmer weather, partially offset by increased solar installations and increased contract revenue as a result of existing customers upgrading to enhanced plans and expanded service contract product lines.
Other income, net increased $5.6 million during fiscal 2017, compared with fiscal 2016, due primarily to the sale of available for sale securities, which resulted in a pre-tax gain during fiscal 2017 of $5.4 million. Other income, net remained relatively flat during fiscal 2016, compared with fiscal 2015.
Income taxes increased $2.5 million during fiscal 2017, compared with fiscal 2016, due primarily to the increase in other income, as previously discussed. Income taxes decreased $164,000 during fiscal 2016, compared with fiscal 2015, due primarily to the decrease in operating revenues and the increase in O&M at NJRHS.
Net income increased $3.9 million during fiscal 2017, compared with fiscal 2016, due primarily to the increases in other income and operating revenue, partially offset by the increase in the income tax provision, as discussed above. Net income during fiscal 2016 decreased $538,000, compared with fiscal 2015, due primarily to the decrease in operating revenues and the increase in O&M, partially offset by the decrease in income taxes, as discussed above.
Page 56
New Jersey Resources Corporation
Part II
ITEM 7. MANAGEMENT’S DISCUSSION AND ANALYSIS OF FINANCIAL CONDITION AND RESULTS OF
OPERATIONS (Continued)
Liquidity and Capital Resources
Our objective is to maintain an efficient consolidated capital structure that reflects the different characteristics of each reporting segment and business operations and provides adequate financial flexibility for accessing capital markets as required.
Our consolidated capital structure as of September 30, was as follows:
2017 | 2016 | |||
Common stock equity | 46 | % | 48 | % |
Long-term debt | 38 | 44 | ||
Short-term debt | 16 | 8 | ||
Total | 100 | % | 100 | % |
Common Stock Equity
We satisfy our external common equity requirements, if any, through issuances of our common stock, including the proceeds from stock issuances under our DRP. The DRP allows us, at our option, to use treasury shares or newly issued shares to raise capital. In December 2015, we registered an additional 5 million shares of our common stock for issuance under the DRP. We raised $17.5 million and $16 million of equity through the DRP by issuing approximately 472,000 and 471,000 shares of treasury stock during fiscal 2017 and 2016, respectively.
In 1996, the Board of Directors authorized us to implement a share repurchase program, which was expanded seven times since the inception of the program, authorizing a total of 19.5 million shares of common stock for repurchase. As of September 30, 2017, we have repurchased a total of approximately 17.1 million shares and may repurchase an additional 2.4 million shares under the approved program. There were 105,000 and 126,600 shares of common stock shares repurchased during fiscal 2017 and 2016, respectively.
Debt
NJR and its unregulated subsidiaries generally rely on cash flows generated from operating activities and the utilization of committed credit facilities to provide liquidity to meet working capital and short-term debt financing requirements. NJNG also relies on the issuance of commercial paper for short-term funding. NJR and NJNG periodically access the capital markets to fund long-lived assets through the issuance of long-term debt securities.
As of September 30, 2017, we had a working capital deficit of $223.5 million, net income of $132.1 million and cash flows from operations of $248 million. The working capital deficit was primarily caused by the reclassification of approximately $150 million of long-term debt to current maturities. We believe that our existing borrowing availability, equity proceeds and cash flows from operations will be sufficient to satisfy our working capital, capital expenditures and dividend requirements for the next 12 months. NJR, NJNG, Clean Energy Ventures and Energy Services currently anticipate that each of their financing requirements for the next 12 months will be met primarily through the issuance of short and long-term debt, meter and solar sale-leasebacks and proceeds from our DRP, including utilizing the waiver discount feature.
We believe that as of September 30, 2017, NJR and NJNG were, and currently are, in compliance with all existing debt covenants, both financial and non-financial.
Short-Term Debt
We use our short-term borrowings primarily to finance Energy Services’ short-term liquidity needs, Midstream segment’s PennEast contributions, share repurchases and, on an initial basis, Clean Energy Ventures’ investments. Energy Services’ use of high volume storage facilities and anticipated pipeline park-and-loan arrangements, combined with related economic hedging activities in the volatile wholesale natural gas market, create significant short-term cash requirements.
NJNG satisfies its debt needs by issuing short- and long-term debt based on its financial profile. The seasonal nature of NJNG’s operations creates large short-term cash requirements, primarily to finance natural gas purchases and customer accounts receivable. NJNG obtains working capital for these requirements and for the temporary financing of construction and MGP remediation expenditures and energy tax payments, based on its financial profile, through the issuance of commercial paper supported by the NJNG Credit Facility or through short-term bank loans under the NJNG Credit Facility.
Page 57
New Jersey Resources Corporation
Part II
ITEM 7. MANAGEMENT’S DISCUSSION AND ANALYSIS OF FINANCIAL CONDITION AND RESULTS OF
OPERATIONS (Continued)
As of September 30, 2017, NJR and NJNG, respectively, had revolving credit facilities totaling $425 million and $250 million, and letters of credit outstanding totaling $13.4 million and $731,000, which reduced the amounts available under the facilities along with short-term borrowings to $157 million and $238 million. Short-term borrowings were as follows:
Three Months Ended | Twelve Months Ended | |||||
($ in thousands) | September 30, 2017 | |||||
NJR | ||||||
Notes Payable to banks: | ||||||
Balance at end of period | $ | 255,000 | $ | 255,000 | ||
Weighted average interest rate at end of period | 2.14 | % | 2.14 | % | ||
Average balance for the period | $ | 259,672 | $ | 239,591 | ||
Weighted average interest rate for average balance | 2.11 | % | 1.80 | % | ||
Month end maximum for the period | $ | 299,400 | $ | 299,400 | ||
NJNG | ||||||
Commercial Paper and Notes Payable to banks: | ||||||
Balance at end of period | $ | 11,000 | $ | 11,000 | ||
Weighted average interest rate at end of period | — | % | 1.13 | % | ||
Average balance for the period | $ | 889 | $ | 222 | ||
Weighted average interest rate for average balance | 0.38 | % | 0.09 | % | ||
Month end maximum for the period | $ | 11,000 | $ | 11,000 | ||
Due to the seasonal nature of natural gas prices and demand, and because inventory levels are built up during its natural gas injection season (April through October), NJR and NJNG’s short-term borrowings tend to peak in November and December.
NJR
On September 28, 2015, NJR entered into a $425 million Amended and Restated Credit Agreement, which refinanced an earlier $425 million revolving credit facility that was scheduled to expire on August 22, 2017. The NJR Credit Facility is scheduled to terminate on September 28, 2020, subject to two mutual options for a one-year extension beyond that date. Certain of NJR’s unregulated subsidiaries have guaranteed to the lenders all of NJR’s obligations under the NJR Credit Facility.
The NJR Credit Facility permits the borrowing of revolving loans and swingline loans, as well as the issuance of letters of credit. The NJR Credit Facility also includes an accordion feature, which would allow NJR, in the absence of a default or event of default, to increase from time to time, with the existing or new lenders, the revolving credit commitments under the NJR Credit Facility in minimum $5 million increments up to a maximum of $100 million. In addition, borrowings under the NJR Credit Facility are conditioned upon compliance with a maximum leverage ratio (consolidated total indebtedness to consolidated total capitalization as defined in the NJR Credit Facility) of not more than .65 to 1.00 at any time. As of September 30, 2017, the consolidated total indebtedness to total capitalization ratio, as defined in the NJR Credit Facility, was 54 percent.
As of September 30, 2017, NJR had $255 million outstanding under the NJR Credit Facility. Neither NJNG nor its assets are obligated or pledged to support the NJR Credit Facility.
During fiscal 2017, NJR’s average interest rate under the NJR Credit Facility was 1.8 percent, resulting in interest expense of $4.4 million. Based on average borrowings under the facilities of $239.6 million during the period, a 100 basis point change in the underlying average interest rate would have caused a change in interest expense of approximately $2.5 million during fiscal 2017.
As of September 30, 2017, NJR has six letters of credit outstanding totaling $13.4 million. Three letters of credit totaling $10.4 million are on behalf of Energy Services and three letters of credit totaling $3 million are on behalf of Clean Energy Ventures. These letters of credit reduce the amount available under NJR’s committed credit facility by the same amount. NJR does not anticipate that these letters of credit will be drawn upon by the counterparties and they will be renewed as necessary.
Page 58
New Jersey Resources Corporation
Part II
ITEM 7. MANAGEMENT’S DISCUSSION AND ANALYSIS OF FINANCIAL CONDITION AND RESULTS OF
OPERATIONS (Continued)
Energy Services’ letters of credit are used for margin requirements for natural gas transactions and expire on dates ranging from December 2017 to September 2018. Clean Energy Ventures’ letters of credit are used to secure construction of ground-mounted solar projects and to secure obligations pursuant to an Interconnection Services Agreement. They expire on dates ranging from May 2018 to August 2018.
NJNG
NJNG’s commercial paper is sold through several commercial banks under an issuing and paying agency agreement and is supported by the $250 million NJNG Credit Facility. The NJNG Credit Facility permits the borrowing of revolving loans and swing loans, as well as the issuance of letters of credit. It also permits an increase to the facility, from time to time, with the existing or new lenders, in a minimum of $15 million increments up to a maximum of $50 million at the lending banks’ discretion. Borrowings under NJNG’s credit facility are conditioned upon compliance with a maximum leverage ratio (consolidated total indebtedness to consolidated total capitalization as defined in the NJNG Credit Facility) of not more than .65 to 1.00 at any time. As of September 30, 2017, NJNG’s consolidated total indebtedness to total capitalization ratio was 45 percent. As of September 30, 2017, the unused amount available under the NJNG Credit Facility, including amounts allocated to the backstop under the commercial paper program and the issuance of letters of credit, was $238 million. During fiscal 2017, NJNG’s weighted average interest rate on outstanding commercial paper was .09 percent, resulting in interest expense of $2,500. Based on average borrowings under the facility of $222,169 during the period, a 100 basis point change in the underlying average interest rate would have caused a change in interest expense of approximately $2,200 during fiscal 2017.
As of September 30, 2017, NJNG has two letters of credit outstanding for $731,000. These letters of credit reduce the amount available under NJNG’s committed credit facility by the same amount. NJNG does not anticipate that these letters of credit will be drawn upon by the counterparties. These letters of credit are used as collateral for soil remediation systems and expire on August 2018.
Short-Term Debt Covenants
Borrowings under the NJR Credit Facility and NJNG Credit Facility are conditioned upon compliance with a maximum leverage ratio (consolidated total indebtedness to consolidated total capitalization as defined in the applicable agreements), of not more than .65 to 1.00 at any time. These revolving credit facilities contain customary representations and warranties for transactions of this type. They also contain customary events of default and certain covenants that will limit NJR’s or NJNG’s ability, beyond agreed upon thresholds, to, among other things:
•incur additional debt;
•incur liens and encumbrances;
•make dispositions of assets;
•enter into transactions with affiliates; and
•merge, consolidate, transfer, sell or lease all or substantially all of the borrowers’ or guarantors’ assets.
These covenants are subject to a number of exceptions and qualifications set forth in the applicable agreements.
Default Provisions
The agreements governing our long-term and short-term debt obligations include provisions that, if not complied with, could require early payment or similar actions. Default events include, but are not limited to, the following:
•defaults for non-payment;
•defaults for breach of representations and warranties;
•defaults for insolvency;
Page 59
New Jersey Resources Corporation
Part II
ITEM 7. MANAGEMENT’S DISCUSSION AND ANALYSIS OF FINANCIAL CONDITION AND RESULTS OF
OPERATIONS (Continued)
•defaults for non-performance of covenants;
•cross-defaults to other debt obligations of the borrower; and
•guarantor defaults.
The occurrence of an event of default under these agreements could result in all loans and other obligations of the borrower becoming immediately due and payable and the termination of the credit facilities or term loan.
Long-Term Debt
NJR
The MetLife Facility, an unsecured, uncommitted $100 million private placement shelf note agreement with MetLife, allowed NJR to issue senior notes to MetLife or certain of MetLife’s affiliates during a three-year issuance period that ended September 26, 2016, and was not renewed. There were no notes outstanding under the expired facility.
NJR has outstanding $25 million of 2.51 percent senior notes due September 15, 2018, which were issued under a now-expired facility with MetLife and as of September 30, 2017, were classified as a current maturity of long-term debt.
NJR has $50 million of 3.25 percent senior notes due September 2022, issued under a private placement debt shelf facility.
On November 7, 2014, NJR issued $100 million in 3.48 percent senior notes due November 7, 2024, under the Prudential Facility, which fully utilized the remaining capacity under the facility. The notes issued under the Prudential Facility are guaranteed by certain unregulated subsidiaries of NJR.
On March 22, 2016, NJR entered into a Note Purchase Agreement under which we issued, on August 18, 2016, $50 million of the Company’s 3.2 percent senior notes due August 18, 2023, and $100 million of the Company’s 3.54 percent senior notes due August 18, 2026. The notes are guaranteed by certain unregulated subsidiaries of the Company. The notes are unsecured. The proceeds of the notes were used for general corporate purposes, including working capital and capital expenditures.
On August 18, 2017, NJR entered into a $100 million credit agreement due August 16, 2019. The term loan will accrue interest at a variable rate determined monthly, which is LIBOR plus 70 basis points. The weighted average interest rate on the on the term loan as of September 30, 2017, was 1.95 percent. Proceeds from the term loan will be used for general corporate purposes and working capital.
Neither NJNG nor its assets are obligated or pledged to support NJR’s long-term debt.
NJNG
NJNG and the Trustee are parties to the Mortgage Indenture, which secures all of NJNG's outstanding FMB. The Mortgage Indenture provides a direct first mortgage lien upon substantially all of the operating properties and franchises of NJNG (other than excepted property, such as cash on hand, choses-in-action, securities, rent, natural gas meters and certain materials, supplies, appliances and vehicles), subject only to certain permitted encumbrances. The Mortgage Indenture contains provisions subjecting after-acquired property (other than excepted property and subject to pre-existing liens, if any, at the time of acquisition) to the lien thereof.
As of September 30, 2017, NJNG’s long-term debt consisted of $575 million in fixed-rate debt issuances secured by the Mortgage Indenture, with maturities ranging from 2018 to 2046, $97 million in secured variable rate debt with maturities ranging from 2027 to 2041 and $28.9 million in capital leases with various maturities ranging from 2017 to 2025.
On May 31, 2017, the BPU approved a petition filed by NJNG requesting authorization over a three-year period to issue up to $400 million of medium-term notes with a maturity of not more than 40 years, for up to five years with an option for two additional one-year extensions; enter into interest rate risk management transactions related to debt securities and redeem and refinance or defease any of NJNG’s outstanding long-term debt securities.
Page 60
New Jersey Resources Corporation
Part II
ITEM 7. MANAGEMENT’S DISCUSSION AND ANALYSIS OF FINANCIAL CONDITION AND RESULTS OF
OPERATIONS (Continued)
On April 15, 2015, NJNG issued $50 million of 2.82 percent senior notes due April 15, 2025, and $100 million of 3.66 percent senior notes due April 15, 2045, in the private placement market pursuant to a note purchase agreement entered into on February 12, 2015. The notes are secured by an equal principal amount of NJNG’s FMB (Series SS and TT, respectively) issued under NJNG’s Mortgage Indenture. The proceeds of the notes were used for general corporate purposes, to refinance or retire debt and to fund capital expenditure requirements. The notes are subject to required prepayments upon the occurrence of certain events. NJNG may at any time prepay all or a portion of the notes at a make-whole prepayment price.
On June 1, 2015, NJNG entered into a treasury lock transaction to fix a benchmark treasury rate of 3.26 percent associated with a forecasted $125 million debt issuance expected in May 2018. This forecasted debt issuance coincides with the maturity of NJNG’s existing $125 million, 5.6 percent notes due May 15, 2018, which as of September 30, 2017, were classified as a current maturity of long-term debt on the Consolidated Balance Sheets.
On June 21, 2016, NJNG entered into a Note Purchase Agreement, under which NJNG issued $125 million of its 3.63 percent senior notes due June 21, 2046. The notes are secured by an equal principal amount of NJNG’s FMB (series UU) issued under NJNG’s Mortgage Indenture. The proceeds of the notes will be used for general corporate purposes, including, but not limited to, refinancing or retiring short-term debt and funding capital expenditures. The notes are subject to required prepayments upon the occurrence of certain events. NJNG may prepay all or any part of the notes in amounts not less than $1 million in aggregate principal amount of the notes then outstanding at 100 percent of the aggregate principal amount, plus accrued interest and a make-whole amount, if applicable.
On January 17, 2017, the Company completed the purchase of three FMBs in lieu of redemption with an aggregate principal amount totaling $35.8 million. The FMBs bore interest at rates ranging from 4.5 percent to 4.9 percent. The bonds purchased in lieu of redemption are being held by the Company to provide an opportunity to evaluate remarketing alternatives.
In August 2011, NJNG completed a refunding of its outstanding Auction-Rate Securities whereby the EDA issued a total of $97 million of Natural Gas Facilities Refunding Revenue Bonds (New Jersey Natural Gas Company Project) composed of three series of bonds. EDA Bonds are special, limited obligations of the EDA payable solely from payments made by NJNG pursuant to a Loan Agreement and are secured by the pledge of $97 million principal amount of the FMB issued by the Company.
EDA Bonds accrue interest at a variable rate determined monthly, which was initially calculated as a rate of .55 percent, plus 70 percent of one month LIBOR, subject to earlier redemption or conversion to another interest rate mode. The maximum interest rate on the EDA Bonds is 12 percent per annum. NJNG’s obligations under the Loan Agreement, and its corresponding obligations under the FMB, match the respective principal amounts, interest rates and maturity dates of the EDA Bonds. The weighted average interest rate on the EDA Bonds as of September 30, 2017, was 1.42 percent.
The interest rates on variable rate debt may vary based upon market conditions. Sudden increases in the interest rate could cause a change in interest expense and cash flow for the Company in the future.
NJR is not obligated directly or contingently with respect to the NJNG notes or the FMB.
Long-Term Debt Covenants and Default Provisions
The NJR and NJNG long-term debt instruments contain customary representations and warranties for transactions of their type. They also contain customary events of default and certain covenants that will limit NJR or NJNG’s ability beyond agreed upon thresholds to, among other things:
•incur additional debt (including a covenant that limits the amount of consolidated total debt of the borrower at the end of a fiscal quarter to 65 percent of the consolidated total capitalization of the borrower, as those terms are defined in the applicable agreements, and a covenant limiting priority debt to 20 percent of the borrower’s consolidated total capitalization, as those terms are defined in the applicable agreements);
•incur liens and encumbrances;
•make loans and investments;
•make dispositions of assets;
Page 61
New Jersey Resources Corporation
Part II
ITEM 7. MANAGEMENT’S DISCUSSION AND ANALYSIS OF FINANCIAL CONDITION AND RESULTS OF
OPERATIONS (Continued)
•make dividends or restricted payments;
•enter into transactions with affiliates; and
•merge, consolidate, transfer, sell or lease substantially all of the borrower’s assets.
The aforementioned covenants are subject to a number of exceptions and qualifications set forth in the applicable note purchase agreements.
In addition, the FMB issued by NJNG under the Mortgage Indenture are subject to certain default provisions. Events of Default, as defined in the Mortgage Indenture, consist mainly of:
•failure for 30 days to pay interest when due;
•failure to pay principal or premium when due and payable;
•failure to make sinking fund payments when due;
•failure to comply with any other covenants of the Mortgage Indenture after 30 days’ written notice from the Trustee;
•failure to pay or provide for judgments in excess of $30 million in aggregate amount within 60 days of the entry thereof; or
•certain events that are or could be the basis of a bankruptcy, reorganization, insolvency or receivership proceeding.
Upon the occurrence and continuance of such an Event of Default, the Mortgage Indenture, subject to any provisions of law applicable thereto, provides that the Trustee may take possession and conduct the business of NJNG, may sell the trust estate or proceed to foreclose the lien of the Mortgage Indenture. The interest rate on defaulted principal and interest, to the extent permitted by law, on the FMB issued under the Mortgage Indenture is the rate stated in the applicable supplement or, if no such rate is stated, six percent per annum.
Sale-Leaseback
NJNG
NJNG received $9.6 million, $7.1 million and $7.2 million in fiscal 2017, 2016 and 2015, respectively, in connection with the sale-leaseback of its natural gas meters. During fiscal 2017, 2016 and 2015, NJNG exercised early purchase options with respect to meter leases by making final principal payments of $2.4 million, $1.9 million and $768,000, respectively. NJNG continues to evaluate this sale-leaseback program based on current market conditions. As noted, natural gas meters are accepted as property under the Mortgage Indenture.
Clean Energy Ventures
During September 2017, Clean Energy Ventures entered into transactions to sell two of its commercial solar assets concurrent with agreements to lease the assets back over seven year periods. These sale-leasebacks are financing obligations secured by the solar assets and related future cash flows from SREC and energy sales. ITCs and other tax benefits associated with these solar projects were transferred to the buyer. Clean Energy Ventures will continue to operate the solar projects and retain ownership of SRECs generated and has the option to renew the lease or repurchase the assets at the end of the lease term. Clean Energy Ventures received proceeds of $32.9 million in connection with these sale-leasebacks.
Page 62
New Jersey Resources Corporation
Part II
ITEM 7. MANAGEMENT’S DISCUSSION AND ANALYSIS OF FINANCIAL CONDITION AND RESULTS OF
OPERATIONS (Continued)
Contractual Obligations
The following table is a summary of NJR, NJNG, Energy Services and Clean Energy Ventures contractual cash obligations and financial commitments and their applicable payment due dates as of September 30, 2017:
Up to | 2-3 | 4-5 | After | ||||||||||||
(Thousands) | Total | 1 Year | Years | Years | 5 Years | ||||||||||
Long-term debt (1) | $ | 1,548,726 | $ | 184,769 | $ | 157,472 | $ | 105,694 | $ | 1,100,791 | |||||
Capital lease obligations (1) | 44,154 | 12,436 | 18,524 | 8,380 | 4,814 | ||||||||||
Solar asset financing obligations (1) | 18,866 | 2,719 | 5,438 | 5,438 | 5,271 | ||||||||||
Operating leases (1) | 51,073 | 2,387 | 5,239 | 5,156 | 38,291 | ||||||||||
Short-term debt | 266,000 | 266,000 | — | — | — | ||||||||||
New Jersey Clean Energy Program (1) | 14,202 | 14,202 | — | — | — | ||||||||||
Construction obligations | 23,120 | 23,120 | — | — | — | ||||||||||
Remediation expenditures (2) | 149,000 | 19,300 | 37,000 | 27,600 | 65,100 | ||||||||||
Natural gas supply purchase obligations-NJNG | 94,720 | 51,050 | 43,670 | — | — | ||||||||||
Demand fee commitments-NJNG | 1,187,054 | 98,586 | 244,959 | 197,125 | 646,384 | ||||||||||
Natural gas supply purchase obligations-Energy Services | 445,066 | 296,491 | 137,087 | 11,488 | — | ||||||||||
Demand fee commitments-Energy Services | 259,195 | 88,786 | 92,204 | 56,148 | 22,057 | ||||||||||
Total contractual cash obligations | $ | 4,101,176 | $ | 1,059,846 | $ | 741,593 | $ | 417,029 | $ | 1,882,708 | |||||
(1) | These obligations include an interest component, as defined under the related governing agreements or in accordance with the applicable tax statute. |
(2) | Expenditures are estimated, see Note 14. Commitments and Contingent Liabilities in the accompanying Consolidated Financial Statements. |
We made a discretionary contribution of $30 million during the first quarter of fiscal 2016, to improve the funded status of the pension plans based on then current actuarial assumptions, which included the adoption of the most recent mortality table. We do not expect to be required to make additional contributions to fund the pension plans over the following two fiscal years based on current actuarial assumptions, however, funding requirements are uncertain and can depend significantly on changes in actuarial assumptions, returns on plan assets and changes in the demographics of eligible employees and covered dependents. In addition, as in the past, we may elect to make discretionary contributions to the plans in excess of the minimum required amount. We made no discretionary contributions to the pension plans in fiscal 2017. There are no Federal requirements to pre-fund OPEB benefits. However, we are required to fund certain amounts due to regulatory agreements with the BPU. We anticipate that the annual funding level to the OPEB plans will range from $4 million to $7 million annually over each of the next five years. Additional contributions may vary based on market conditions and various assumptions.
As of September 30, 2017, there were NJR guarantees covering approximately $331.4 million of natural gas purchases and Energy Services demand fee commitments not yet reflected in accounts payable on the Consolidated Balance Sheets.
NJNG’s incurs significant capital expenditures consisting primarily of its construction program to support customer growth, maintenance of its distribution and transmission system and replacement needed under pipeline safety regulations. During fiscal 2017, committed and spent capital expenditures totaled $177.6 million. In fiscal 2018 and 2019, NJNG’s total capital expenditures are projected to be $399.8 million and $235 million, respectively.
In November 2012, NJNG filed a petition with the BPU requesting deferral accounting for incurred uninsured incremental O&M costs associated with Superstorm Sandy. As of September 30, 2017, NJNG deferred $13 million in regulatory assets that was approved for recovery through NJNG’s new base rates, effective October 2016.
NJNG expects to fund its obligations with a combination of cash flow from operations, cash on hand, issuance of commercial paper, available capacity under its revolving credit facility and the issuance of long-term debt.
As of September 30, 2017, NJNG’s future MGP expenditures are estimated to be $149 million. For a more detailed description of MGP see Note 14. Commitments and Contingent Liabilities in the accompanying Consolidated Financial Statements.
Page 63
New Jersey Resources Corporation
Part II
ITEM 7. MANAGEMENT’S DISCUSSION AND ANALYSIS OF FINANCIAL CONDITION AND RESULTS OF
OPERATIONS (Continued)
Estimated capital expenditures are reviewed on a regular basis and may vary based on the ongoing effects of regulatory constraints, environmental regulations, unforeseen events and the ability to access capital.
Clean Energy Ventures’s expenditures include clean energy projects that support our goal to promote renewable energy. Accordingly, Clean Energy Ventures enters into agreements to install solar equipment involving both residential and commercial projects. During fiscal 2017, capital expenditures related to the purchase and installation of the solar equipment were $115.1 million. An additional $13.3 million has been committed or accrued for solar projects to be placed into service during fiscal 2018 and beyond. We estimate solar-related capital expenditures placed in service in fiscal 2018 to be between $132 million and $140 million.
During the first quarter of fiscal 2017, Clean Energy Ventures completed construction of a $89 million, 39.9 MW onshore wind project in Somerset County, Pennsylvania.
Capital expenditures related to clean energy projects are subject to change due to a variety of factors that may affect our ability to commence operations at these projects on a timely basis or at all, including logistics associated with the start-up of residential and commercial solar projects, such as timing of construction schedules, the permitting and regulatory process, any delays related to electric grid interconnection, economic trends, unforeseen events and the ability to access capital or allocation of capital to other investments or business opportunities.
During fiscal 2017, Midstream had a total of $27.1 million of expenditures related to our investment in the PennEast pipeline project. Expenditures in the PennEast pipeline are expected to total between $220 million and $280 million.
Energy Services does not currently anticipate any significant capital expenditures in fiscal 2018 and 2019.
Off-Balance-Sheet Arrangements
Our off-balance-sheet arrangements consist of guarantees covering approximately $331.4 million of natural gas purchases, SREC sales and demand fee commitments, see Note 14. Commitments and Contingent Liabilities, and eight outstanding letters of credit totaling $14.1 million, as noted above, see Note 9. Debt.
Cash Flows
Operating Activities
Cash flows from operating activities during fiscal 2017, totaled $248 million compared with $142.6 million during fiscal 2016. Operating cash flows are primarily affected by variations in working capital, which can be impacted by several factors, including:
•seasonality of our business;
•fluctuations in wholesale natural gas prices and other energy prices, including changes in derivative asset and liability values;
•timing of storage injections and withdrawals;
•the deferral and recovery of gas costs;
•changes in contractual assets utilized to optimize margins related to natural gas transactions;
•broker margin requirements;
•impact of unusual weather patterns on our wholesale business;
•timing of the collections of receivables and payments of current liabilities;
•volumes of natural gas purchased and sold; and
•timing of SREC deliveries.
Page 64
New Jersey Resources Corporation
Part II
ITEM 7. MANAGEMENT’S DISCUSSION AND ANALYSIS OF FINANCIAL CONDITION AND RESULTS OF
OPERATIONS (Continued)
The increase of $105.4 million in operating cash flows during fiscal 2017, compared with fiscal 2016, was due primarily to increased base rates, increased working capital due primarily to lower broker margin requirements, a decrease in bill credits issued, and a discretionary contribution of $30 million to our pension plan during fiscal 2016 that did not recur in fiscal 2017.
The decrease of $248.3 million in operating cash flows during fiscal 2016, compared with fiscal 2015, was impacted by a decrease in market volatility related to the warm winter weather primarily across the eastern United States, which contributed to a lower profitability and decrease in working capital at Energy Services, including a reduction in natural gas sold out of storage and an increase in broker margin due to decreases in the fair value of derivatives and higher initial margin requirements. Also contributing to the decrease in operating cash flows were bill credits of $61.6 million issued to NJNG’s customers during fiscal 2016, for overrecovered gas costs and a discretionary contribution of $30 million to our pension plan during fiscal 2016.
Investing Activities
Cash flows used in investing activities totaled $390.7 million during fiscal 2017, compared with $363.2 million during fiscal 2016. The increase of $27.5 million was due primarily to our acquisition of Talen's retail and wholesale energy contract assets totaling $55.7 million and increased investments in solar projects and PennEast of $39.4 million and $15.9 million, respectively, partially offset by a decrease in capital expenditures in wind investments of $39.1 million and utility plant of $32 million, along with net proceeds of $9.4 million from the sale of an office building and $6.6 million from the sale of available for sale securities.
Cash flows used in investing activities totaled $363.2 million during fiscal 2016, compared with $321.7 million during fiscal 2015. The increase of $41.5 million was due primarily to an increase in utility plant of $36.3 million and an increase in capital expenditures at Clean Energy Ventures of $14.5 million related to solar projects. We also contributed an additional $5.4 million for the investment in PennEast during fiscal 2016. The increases were partially offset by a decrease of $16.5 million in capital expenditures related to solar projects at Clean Energy Ventures.
NJNG’s capital expenditures result primarily from the need for services, mains and meters to support its continued customer growth, mandated pipeline safety rulemaking, general system improvements and approved infrastructure programs. NJNG’s capital expenditures, including cost of removal, totaled $176.2 million and $205.1 million in fiscal 2017 and fiscal 2016, respectively.
The Company enters into various agreements to install, own and operate solar equipment, including both residential and commercial projects and onshore wind projects. During fiscal 2017 and fiscal 2016, capital expenditures on these projects totaled $149.4 million and $149.1 million, respectively.
Home Services and Other capital expenditures in past years were made primarily in connection with investments made to preserve the value of real estate holdings. On March 8, 2017, CR&R sold a 56,400 square foot office building on five acres of land located in Monmouth County for $9.4 million, net of closing costs, generating a pre-tax gain of $1.9 million.
Financing Activities
Financing cash flows generally are seasonal in nature and are impacted by the volatility in pricing in the natural gas and other energy markets. NJNG’s inventory levels are built up during its natural gas injection season (April through October) and reduced during withdrawal season (November through March) in response to the supply requirements of its customers. Changes in financing cash flows can also be impacted by gas management and marketing activities at Energy Services and clean energy investments at Clean Energy Ventures.
Cash flows from financing activities during fiscal 2017 totaled $107.3 million, compared with cash flows used in financing activities of $253.2 million during fiscal 2016. The decrease of $145.9 million is due primarily to the issuance of $100 million of long-term debt compared with $275 million in the previous year, the purchase of three FMBs in lieu of redemption totaling $35.8 million at NJNG and $50 million redemption of long-term debt at NJR, partially offset by an increase in short-term borrowings at NJR and proceeds of $32.9 million from the solar sale-leasebacks at Clean Energy Ventures.
Cash flows used in financing activities during fiscal 2016 totaled $253.2 million, compared with $66.4 million during fiscal 2015. The decrease of $319.6 million was due primarily to increased short-term borrowings at NJR. This was partially offset by the issuance of $100 million in long-term debt for NJR during fiscal 2015, along with a decrease of $25 million in long-term debt at NJNG, which issued $125 million during fiscal 2016, compared with $150 million during fiscal 2015. There was also a decrease in proceeds from the issuance of common stock when compared with fiscal 2015, during which 688,000 new shares were issued through the waiver discount feature of the DRP.
Page 65
New Jersey Resources Corporation
Part II
ITEM 7. MANAGEMENT’S DISCUSSION AND ANALYSIS OF FINANCIAL CONDITION AND RESULTS OF
OPERATIONS (Continued)
NJNG received $9.6 million, $7.1 million and $7.2 million for fiscal 2017, 2016 and 2015, respectively, in connection with the sale-leaseback of its natural gas meters. During fiscal 2017, 2016 and 2015, NJNG exercised early purchase options with respect to meter leases by making final principal payments of $2.4 million, $1.9 million and $768,000, respectively. NJNG continues to evaluate the natural gas meter sale-leaseback program based on current market conditions.
Credit Ratings
The table below summarizes NJNG’s current credit ratings issued by two rating entities, S&P and Moody’s, as of September 30, 2017:
S&P | Moody’s | |
Corporate Rating | A | N/A |
Commercial Paper | A-1 | P-1 |
Senior Secured | A+ | Aa2 |
Ratings Outlook | Stable | Stable |
These ratings were reaffirmed by S&P on October 26, 2017, and by Moody’s on October 4, 2017. NJNG’s S&P and Moody’s ratings are investment-grade ratings. NJR is not a rated entity.
Although NJNG is not party to any lending agreements that would accelerate the maturity date of any obligation caused by a failure to maintain any specific credit rating, if such ratings are downgraded below investment grade, borrowing costs could increase, as would the costs of maintaining certain contractual relationships and future financing and our access to capital markets would be reduced. Even if ratings are downgraded without falling below investment grade, NJR and NJNG could face increased borrowing costs under their credit facilities. A rating set forth above is not a recommendation to buy, sell or hold NJR’s or NJNG’s securities and may be subject to revision or withdrawal at any time. Each rating set forth above should be evaluated independently of any other rating.
The timing and mix of any external financings will target a common equity ratio that is consistent with maintaining NJNG’s current short-term and long-term credit ratings.
ITEM 7A. QUANTITATIVE AND QUALITATIVE DISCLOSURES ABOUT MARKET RISK
Financial Risk Management
Commodity Market Risks
Natural gas is a nationally traded commodity. Its prices are determined effectively by the NYMEX, CME, ICE and over-the-counter markets. The prices on the NYMEX, CME, ICE and over-the-counter markets generally reflect the national balance of natural gas supply and demand, but are also significantly influenced from time to time by other events.
Our regulated and deregulated businesses are subject to market risk due to fluctuations in the price of natural gas. To economically hedge against such fluctuations, we have entered into forwards, futures, options and swap agreements. To manage these derivative instruments, we have well-defined risk management policies and procedures that include daily monitoring of volumetric limits and monetary guidelines. Our natural gas businesses are conducted through three of our reporting segments. NJNG is a regulated utility that uses futures, options and swaps to economically hedge against price fluctuations, and its recovery of natural gas costs is governed by the BPU. Energy Services uses futures, options, swaps and physical contracts to economically hedge purchases and sales of natural gas. Financial derivatives have historically been transacted on an exchange and cleared through an FCM, thus requiring daily cash margining for a majority of Energy Services’ and NJNG’s positions. As a result of the Dodd-Frank Act, certain Energy Services and NJNG transactions that were previously executed in the over-the-counter markets are now cleared through an FCM, resulting in increased margin requirements. The related cash flow impact from the increased
Page 66
New Jersey Resources Corporation
Part II
ITEM 7A. QUANTITATIVE AND QUALITATIVE DISCLOSURES ABOUT MARKET RISK (Continued)
requirements is expected to be minimal. Non-financial (i.e., physical) derivatives utilized by us have received statutory exclusion from similar Dodd-Frank provisions due to the element of physical settlement.
The following table reflects the changes in the fair market value of financial derivatives related to natural gas purchases and sales from September 30, 2016 to September 30, 2017:
Balance | Increase | Less | Balance | |||||||||||||
(Thousands) | September 30, 2016 | (Decrease) in Fair Market Value | Amounts Settled | September 30, 2017 | ||||||||||||
NJNG | $ | (2,485 | ) | $ | 5,288 | $ | 3,952 | $ | (1,149 | ) | ||||||
Energy Services | (21,742 | ) | 19,703 | 3,513 | (5,552 | ) | ||||||||||
Total | $ | (24,227 | ) | $ | 24,991 | $ | 7,465 | $ | (6,701 | ) | ||||||
There were no changes in methods of valuations during the year ended September 30, 2017.
The following is a summary of fair market value of financial derivatives as of September 30, 2017, excluding foreign exchange contracts discussed below, by method of valuation and by maturity for each fiscal year period:
(Thousands) | 2018 | 2019 | 2020 - 2022 | After 2022 | Total Fair Value | |||||||||||||
Price based on NYMEX/CME | $ | — | $ | — | $ | — | $ | — | $ | — | ||||||||
Price based on ICE | (6,115 | ) | (736 | ) | 147 | 3 | (6,701 | ) | ||||||||||
Total | $ | (6,115 | ) | $ | (736 | ) | $ | 147 | $ | 3 | $ | (6,701 | ) | |||||
The following is a summary of financial derivatives by type at September 30, 2017:
Volume Bcf | Price per MMBtu (1) | Amounts included in Derivatives (Thousands) | ||||||
NJNG | Futures | 18.2 | $1.12-$3.33 | $ | (1,149 | ) | ||
Energy Services | Futures | (16.4 | ) | $0.90-$5.30 | (5,552 | ) | ||
Options | — | |||||||
Total | $ | (6,701 | ) | |||||
(1) | Million British thermal unit |
The following table reflects the changes in the fair market value of physical commodity contracts from September 30, 2016 to September 30, 2017:
Balance | Increase | Less | Balance | |||||||||||
(Thousands) | September 30, 2016 | (Decrease) in Fair Market Value | Amounts Settled | September 30, 2017 | ||||||||||
NJNG - Prices based on other external data | $ | (919 | ) | (10,096 | ) | (11,094 | ) | $ | 79 | |||||
Energy Services - Prices based on other external data | (2,891 | ) | (11,765 | ) | (11,072 | ) | (3,584 | ) | ||||||
Total | $ | (3,810 | ) | (21,861 | ) | (22,166 | ) | $ | (3,505 | ) | ||||
The following table reflects the changes in the fair market value of interest rate contracts from September 30, 2016 to September 30, 2017:
Balance | Increase | Less | Balance | |||||||||||
(Thousands) | September 30, 2016 | (Decrease) in Fair Market Value | Amounts Settled | September 30, 2017 | ||||||||||
NJNG - Prices based on other external data | $ | (23,073 | ) | 14,606 | — | $ | (8,467 | ) | ||||||
Page 67
New Jersey Resources Corporation
Part II
ITEM 7A. QUANTITATIVE AND QUALITATIVE DISCLOSURES ABOUT MARKET RISK (Continued)
Foreign Currency Market Risks
The following table reflects the changes in the fair market value of financial derivatives related to foreign currency hedges from September 30, 2016 to September 30, 2017:
Balance | Increase | Less | Balance | |||||||||||
(Thousands) | September 30, 2016 | (Decrease) in Fair Market Value | Amounts Settled | September 30, 2017 | ||||||||||
Energy Services | $ | (31 | ) | 43 | (32 | ) | $ | 44 | ||||||
There were no changes in methods of valuations during the fiscal year ended September 30, 2017.
The following is a summary of fair market value of financial derivatives related to foreign currency hedges at September 30, 2017, by method of valuation and by maturity for each fiscal year period:
(Thousands) | 2018 | 2019 | 2020 - 2022 | After 2022 | Total Fair Value | ||||||||||
Prices based on other external data | $ | 40 | 4 | — | — | $ | 44 | ||||||||
Our market price risk is predominately related to changes in the price of natural gas at the Henry Hub, which is the delivery point for the NYMEX natural gas futures contracts. As the fair value of futures and fixed price swaps is linked to this location, the price sensitivity analysis has been prepared for all open Henry Hub natural gas futures and fixed swap positions. Based on this, an illustrative 10 percent movement in the natural gas futures contract price, for example, increases (decreases) the reported derivative fair value of all open, unadjusted Henry Hub natural gas futures and fixed swap positions by approximately $17.7 million. This analysis does not include potential changes to reported credit adjustments embedded in the $2.1 million reported fair value.
Derivative Fair Value Sensitivity Analysis | |||||||||||||||
(Thousands) | Henry Hub Futures and Fixed Price Swaps | ||||||||||||||
Percent increase in NYMEX natural gas futures prices | 0% | 5% | 10% | 15% | 20% | ||||||||||
Estimated change in derivative fair value | $ | — | $ | (8,844 | ) | $ | (17,689 | ) | $ | (26,534 | ) | $ | (35,378 | ) | |
Ending derivative fair value | $ | 2,110 | $ | (6,734 | ) | $ | (15,579 | ) | $ | (24,424 | ) | $ | (33,268 | ) | |
Percent decrease in NYMEX natural gas futures prices | 0% | (5)% | (10)% | (15)% | (20)% | ||||||||||
Estimated change in derivative fair value | $ | — | $ | 8,844 | $ | 17,689 | $ | 26,534 | $ | 35,378 | |||||
Ending derivative fair value | $ | 2,110 | $ | 10,954 | $ | 19,799 | $ | 28,644 | $ | 37,488 | |||||
Wholesale Credit Risk
NJNG and Energy Services engage in wholesale marketing activities and Clean Energy Ventures engages in SREC sales. We monitor and manage the credit risk of our operations through credit policies and procedures that management believes reduce overall credit risk. These policies include a review and evaluation of prospective counterparties’ financial statements and/or credit ratings, daily monitoring of counterparties’ credit limits, daily communication with traders regarding credit status and the use of credit mitigation measures, such as minimum margin requirements, collateral requirements and netting agreements. Examples of collateral include letters of credit and cash received for either prepayment or margin deposit.
Our Risk Management Committee continuously monitors our credit risk management policies and procedures and is composed of individuals from NJR-affiliated companies. The Risk Management Committee meets at least once a month and, among other things, evaluates the effectiveness of existing credit policies and procedures, reviews material transactions and discusses emerging issues.
Page 68
New Jersey Resources Corporation
Part II
ITEM 7A. QUANTITATIVE AND QUALITATIVE DISCLOSURES ABOUT MARKET RISK (Continued)
The following is a summary of gross and net credit exposures, grouped by investment and non-investment grade counterparties, as of September 30, 2017. Gross credit exposure is defined as the unrealized fair value of derivative and energy trading contracts, plus any outstanding wholesale receivable for the value of natural gas or power delivered and/or financial derivative commodity contract that has settled for which payment has not yet been received. Net credit exposure is defined as gross credit exposure reduced by collateral received from counterparties and/or payables, where netting agreements exist. The amounts presented below exclude accounts receivable for NJNG retail natural gas sales and services.
Energy Services’ and Clean Energy Ventures’ counterparty credit exposure as of September 30, 2017, is as follows:
(Thousands) | Gross Credit Exposure | Net Credit Exposure | ||||||
Investment grade | $ | 133,431 | $ | 100,703 | ||||
Noninvestment grade | 16,725 | 9,483 | ||||||
Internally-rated investment grade | 16,282 | 14,069 | ||||||
Internally-rated noninvestment grade | 48,960 | 4,886 | ||||||
Total | $ | 215,398 | $ | 129,141 | ||||
NJNG’s counterparty credit exposure as of September 30, 2017, is as follows:
(Thousands) | Gross Credit Exposure | Net Credit Exposure | ||||||
Investment grade | $ | 3,373 | $ | 2,211 | ||||
Noninvestment grade | 164 | — | ||||||
Internally-rated investment grade | 96 | 83 | ||||||
Internally-rated noninvestment grade | 19,538 | 13,452 | ||||||
Total | $ | 23,171 | $ | 15,746 | ||||
Due to the inherent volatility in the market price for natural gas, electricity and SRECs, the market value of contractual positions with individual counterparties could exceed established credit limits or collateral provided by those counterparties. If a counterparty failed to perform the obligations under its contract (for example, failed to make payment for natural gas received), we could sustain a loss. This loss would comprise the loss on natural gas delivered but not paid for and/or the cost of replacing natural gas not delivered or received at a price that exceeds the original contract price. Any such loss could have a material impact on our financial condition, results of operations or cash flows.
Retail Credit Risk
NJR is exposed to retail credit risk through NJRRS' natural gas retail business, which serves customers in Pennsylvania, New Jersey, Delaware and Maryland. Retail credit risk could result in losses if a customer failed to pay for natural gas that has been delivered.
NJR manages retail credit risk through the use of established credit policies that include customer credit evaluation software, monitoring of the portfolio and the use of credit mitigation measures such as deposits, letters of credit or prepayment arrangements, where applicable.
As of September 30, 2017, our retail customer credit exposure was diversified across many customers and various industries, as well as government entities. Credit exposure for NJRRS at September 30, 2017, was $25.4 million. Non-performance by any of these customers would not be material to our financial position, results of operations or cash flows.
Page 69
New Jersey Resources Corporation
Part II
ITEM 7A. QUANTITATIVE AND QUALITATIVE DISCLOSURES ABOUT MARKET RISK (Continued)
Effects of Interest Rate and Foreign Currency Rate Fluctuations
We are also exposed to changes in interest rates on our debt hedges, variable rate debt and changes in foreign currency rates for our business conducted in Canada using Canadian dollars. We do not believe an immediate 10 percent increase or decrease in interest rates or foreign currency rates would have a material effect on our operating results or cash flows.
As of September 30, 2017, NJNG is obligated to make principal and interest payments under a loan agreement securing $97 million of variable rate debt issued by the EDA. The bonds are in a LIBOR-based monthly interest rate mode and will accrue interest for five years at a variable rate determined monthly, which was initially calculated at .55 percent plus 70 percent of one-month LIBOR. As of September 30, 2017, the EDA Bonds had a weighted average interest rate of 1.42 percent. The EDA Bonds are subject to changes in market conditions for tax-exempt bonds and there can be no assurance that the interest rate will remain stable and not increase significantly due to market conditions, which could adversely affect NJNG’s borrowing costs. A 100 basis point change in the EDA Bonds’ average interest rate would have caused a change in interest expense for these variable rate bonds by approximately $903,000 during fiscal 2017.
As of September 30, 2017, NJR is obligated to make principal and interest payments under a loan agreement securing $100 million of variable rate debt dated August 18, 2017. The term loan will accrue interest at a variable rate determined monthly, which is LIBOR plus 70 basis points. The weighted average interest rate on the on the term loan as of September 30, 2017, was 1.95 percent. A 100 basis point change in the average interest rate would have caused a change in interest expense for this variable rate debt by approximately $990,000 during fiscal 2017.
For more information regarding the interest rate risk related to our short-term debt, please see the Liquidity and Capital Resources - Debt section of Item 7. Management’s Discussion and Analysis of Financial Condition and Results of Operations.
Effects of Inflation
Although inflation rates have been relatively low to moderate in recent years, including the three most recent fiscal years, any change in price levels has an effect on operating results due to the capital-intensive and regulated nature of our utility subsidiary. We attempt to minimize the effects of inflation through cost control, productivity improvements and regulatory actions, when appropriate.
Page 70
New Jersey Resources Corporation
Part II
ITEM 8. FINANCIAL STATEMENTS AND SUPPLEMENTARY DATA
MANAGEMENT’S REPORT ON INTERNAL CONTROL OVER FINANCIAL REPORTING
Management of New Jersey Resources Corporation is responsible for establishing and maintaining adequate internal control over financial reporting as defined in Rule 13a-15(f) and 15d-15(f) of the Securities and Exchange Act of 1934, as amended. The Company’s internal control over financial reporting is a process designed to provide reasonable assurance to the Company’s Management and Board of Directors regarding the reliability of financial reporting and the preparation of financial statements for external purposes in accordance with generally accepted accounting principles and includes policies and procedures that:
• | pertain to the maintenance of records that, in reasonable detail, accurately and fairly reflect the transactions and dispositions of the assets of the Company; |
• | provide reasonable assurance that transactions are recorded as necessary to permit preparation of financial statements in accordance with generally accepted accounting principles, and that receipts and expenditures of the Company are being made only in accordance with authorizations of management and directors of the Company; and |
• | provide reasonable assurance regarding prevention or timely detection of unauthorized acquisition, use, or disposition of the Company’s assets that could have a material effect on the financial statements. |
Under the supervision and with the participation of the Company’s management, including its principal executive officer and principal financial officer, management conducted an evaluation of the effectiveness of the Company’s internal control over financial reporting as of September 30, 2017. In making this assessment, management used the criteria for effective internal control over financial reporting described in the Internal Control-Integrated Framework (2013) set forth by the Committee of Sponsoring Organizations of the Treadway Commission. Based on the assessment, management concluded that, as of September 30, 2017, the Company’s internal control over financial reporting was effective to provide reasonable assurance regarding the reliability of financial reporting and the preparation of financial statements for external purposes in accordance with accounting principles generally accepted in the Unites States of America.
The conclusion of the Company’s principal executive officer and principal financial officer is based on the recognition that there are inherent limitations in all systems of internal control over financial reporting. Because of its inherent limitations, internal control over financial reporting may not prevent or detect misstatements, errors or fraud. Also, projections of any evaluation of effectiveness to future periods are subject to the risk that controls may become inadequate because of changes in conditions, or that the degree of compliance with the policies or procedures may deteriorate.
The Company’s independent registered public accounting firm, Deloitte & Touche LLP, has issued its report on the effectiveness of the Company’s internal control over financial reporting as of September 30, 2017, which appears herein.
November 21, 2017
Page 71
New Jersey Resources Corporation
Part II
ITEM 8. FINANCIAL STATEMENTS AND SUPPLEMENTARY DATA (Continued)
REPORT OF INDEPENDENT REGISTERED PUBLIC ACCOUNTING FIRM
To the Board of Directors and Stockholders of
New Jersey Resources Corporation
Wall, New Jersey
We have audited the accompanying consolidated balance sheets of New Jersey Resources Corporation and subsidiaries (the “Company”) as of September 30, 2017 and 2016, and the related consolidated statements of operations, comprehensive income, common stock equity, and cash flows for each of the three years in the period ended September 30, 2017. Our audits also included the financial statement schedule listed in the Index at Item 15. These financial statements and financial statement schedule are the responsibility of the Company’s management. Our responsibility is to express an opinion on the financial statements and financial statement schedule based on our audits.
We conducted our audits in accordance with the standards of the Public Company Accounting Oversight Board (United States). Those standards require that we plan and perform the audit to obtain reasonable assurance about whether the financial statements are free of material misstatement. An audit includes examining, on a test basis, evidence supporting the amounts and disclosures in the financial statements. An audit also includes assessing the accounting principles used and significant estimates made by management, as well as evaluating the overall financial statement presentation. We believe that our audits provide a reasonable basis for our opinion.
In our opinion, such consolidated financial statements present fairly, in all material respects, the financial position of the Company as of September 30, 2017 and 2016, and the results of its operations and its cash flows for each of the three years in the period ended September 30, 2017, in conformity with accounting principles generally accepted in the United States of America. Also, in our opinion, such financial statement schedule, when considered in relation to the basic consolidated financial statements taken as a whole, present fairly, in all material respects, the information set forth therein.
We have also audited, in accordance with the standards of the Public Company Accounting Oversight Board (United States), the Company’s internal control over financial reporting as of September 30, 2017, based on the criteria established in Internal Control - Integrated Framework (2013) issued by the Committee of Sponsoring Organizations of the Treadway Commission and our report dated November 21, 2017 expressed an unqualified opinion on the Company’s internal control over financial reporting.
/s/ DELOITTE & TOUCHE LLP
Parsippany, New Jersey
November 21, 2017
Page 72
New Jersey Resources Corporation
Part II
ITEM 8. FINANCIAL STATEMENTS AND SUPPLEMENTARY DATA (Continued)
REPORT OF INDEPENDENT REGISTERED PUBLIC ACCOUNTING FIRM
To the Board of Directors and Stockholders of
New Jersey Resources Corporation
Wall, New Jersey
We have audited the internal control over financial reporting of New Jersey Resources Corporation and subsidiaries (the “Company”) as of September 30, 2017, based on criteria established in Internal Control - Integrated Framework (2013) issued by the Committee of Sponsoring Organizations of the Treadway Commission. The Company’s management is responsible for maintaining effective internal control over financial reporting and for its assessment of the effectiveness of internal control over financial reporting, included in the accompanying Management’s Report on Internal Control over Financial Reporting. Our responsibility is to express an opinion on the Company’s internal control over financial reporting based on our audit.
We conducted our audit in accordance with the standards of the Public Company Accounting Oversight Board (United States). Those standards require that we plan and perform the audit to obtain reasonable assurance about whether effective internal control over financial reporting was maintained in all material respects. Our audit included obtaining an understanding of internal control over financial reporting, assessing the risk that a material weakness exists, testing and evaluating the design and operating effectiveness of internal control based on the assessed risk, and performing such other procedures as we considered necessary in the circumstances. We believe that our audit provides a reasonable basis for our opinion.
A company’s internal control over financial reporting is a process designed by, or under the supervision of, the company’s principal executive and principal financial officers, or persons performing similar functions, and effected by the company’s board of directors, management, and other personnel to provide reasonable assurance regarding the reliability of financial reporting and the preparation of financial statements for external purposes in accordance with generally accepted accounting principles. A company’s internal control over financial reporting includes those policies and procedures that (1) pertain to the maintenance of records that, in reasonable detail, accurately and fairly reflect the transactions and dispositions of the assets of the company; (2) provide reasonable assurance that transactions are recorded as necessary to permit preparation of financial statements in accordance with generally accepted accounting principles, and that receipts and expenditures of the company are being made only in accordance with authorizations of management and directors of the company; and (3) provide reasonable assurance regarding prevention or timely detection of unauthorized acquisition, use, or disposition of the company’s assets that could have a material effect on the financial statements.
Because of the inherent limitations of internal control over financial reporting, including the possibility of collusion or improper management override of controls, material misstatements due to error or fraud may not be prevented or detected on a timely basis. Also, projections of any evaluation of the effectiveness of the internal control over financial reporting to future periods are subject to the risk that the controls may become inadequate because of changes in conditions, or that the degree of compliance with the policies or procedures may deteriorate.
In our opinion, the Company maintained, in all material respects, effective internal control over financial reporting as of September 30, 2017, based on the criteria established in Internal Control - Integrated Framework (2013) issued by the Committee of Sponsoring Organizations of the Treadway Commission.
We have also audited, in accordance with the standards of the Public Company Accounting Oversight Board (United States), the consolidated financial statements and financial statement schedule as of and for the year ended September 30, 2017 of the Company and our report dated November 21, 2017 expressed an unqualified opinion on those financial statements and financial statement schedule.
/s/ DELOITTE & TOUCHE LLP
Parsippany, New Jersey
November 21, 2017
Page 73
New Jersey Resources Corporation
Part II
ITEM 8. FINANCIAL STATEMENTS AND SUPPLEMENTARY DATA (Continued)
CONSOLIDATED STATEMENTS OF OPERATIONS
(Thousands, except per share data) | |||||||||
Fiscal years ended September 30, | 2017 | 2016 | 2015 | ||||||
OPERATING REVENUES | |||||||||
Utility | $ | 695,637 | $ | 594,346 | $ | 781,970 | |||
Nonutility | 1,572,980 | 1,286,559 | 1,952,017 | ||||||
Total operating revenues | 2,268,617 | 1,880,905 | 2,733,987 | ||||||
OPERATING EXPENSES | |||||||||
Gas purchases: | |||||||||
Utility | 258,687 | 205,034 | 304,953 | ||||||
Nonutility | 1,436,740 | 1,139,301 | 1,767,841 | ||||||
Related parties | 8,340 | 8,351 | 12,851 | ||||||
Operation and maintenance | 226,356 | 208,421 | 209,453 | ||||||
Regulatory rider expenses | 40,243 | 39,300 | 75,779 | ||||||
Depreciation and amortization | 81,841 | 72,748 | 61,399 | ||||||
Energy and other taxes | 49,366 | 40,215 | 53,260 | ||||||
Total operating expenses | 2,101,573 | 1,713,370 | 2,485,536 | ||||||
OPERATING INCOME | 167,044 | 167,535 | 248,451 | ||||||
Other income, net | 14,437 | 9,196 | 6,545 | ||||||
Interest expense, net of capitalized interest | 44,886 | 31,044 | 27,721 | ||||||
INCOME BEFORE INCOME TAXES AND EQUITY IN EARNINGS OF AFFILIATES | 136,595 | 145,687 | 227,275 | ||||||
Income tax provision | 18,343 | 23,530 | 59,724 | ||||||
Equity in earnings of affiliates | 13,813 | 9,515 | 13,409 | ||||||
NET INCOME | $ | 132,065 | $ | 131,672 | $ | 180,960 | |||
EARNINGS PER COMMON SHARE | |||||||||
Basic | $1.53 | $1.53 | $2.12 | ||||||
Diluted | $1.52 | $1.52 | $2.10 | ||||||
DIVIDENDS DECLARED PER COMMON SHARE | $1.0375 | $0.9750 | $0.9150 | ||||||
WEIGHTED AVERAGE SHARES OUTSTANDING | |||||||||
Basic | 86,321 | 85,884 | 85,186 | ||||||
Diluted | 87,144 | 86,731 | 86,265 | ||||||
CONSOLIDATED STATEMENTS OF COMPREHENSIVE INCOME
(Thousands) | |||||||||
Fiscal years ended September 30, | 2017 | 2016 | 2015 | ||||||
Net income | $ | 132,065 | $ | 131,672 | $ | 180,960 | |||
Other comprehensive income, net of tax: | |||||||||
Unrealized gain (loss) on available for sale securities, net of tax of $(4,401), $1,499, and $(1,135), respectively (1) | 6,846 | (2,187 | ) | 1,603 | |||||
Net unrealized gain on derivatives, net of tax of $0, $0 and $(56), respectively | — | — | 93 | ||||||
Adjustment to postemployment benefit obligation, net of tax of $(3,487), $2,466 and $3,688 respectively | 5,053 | (3,574 | ) | (5,496 | ) | ||||
Other comprehensive income (loss) | 11,899 | (5,761 | ) | (3,800 | ) | ||||
Comprehensive income | $ | 143,964 | $ | 125,911 | $ | 177,160 | |||
(1) | Available for sale securities are included in other noncurrent assets on the Consolidated Balance Sheets. |
See Notes to Consolidated Financial Statements
Page 74
New Jersey Resources Corporation
Part II
ITEM 8. FINANCIAL STATEMENTS AND SUPPLEMENTARY DATA (Continued)
CONSOLIDATED STATEMENTS OF CASH FLOWS
(Thousands) | |||||||||||
Fiscal years ended September 30, | 2017 | 2016 | 2015 | ||||||||
CASH FLOWS FROM OPERATING ACTIVITIES | |||||||||||
Net income | $ | 132,065 | $ | 131,672 | $ | 180,960 | |||||
Adjustments to reconcile net income to cash flows from operating activities | |||||||||||
Unrealized (gain) loss on derivative instruments | (11,241 | ) | 46,883 | (38,681 | ) | ||||||
Gain on sale of property and available for sale securities, net | (7,287 | ) | — | — | |||||||
Depreciation and amortization | 81,841 | 72,748 | 61,399 | ||||||||
Allowance for equity used during construction | (3,867 | ) | (4,375 | ) | (3,825 | ) | |||||
Allowance for bad debt expense | 2,023 | 1,616 | 2,859 | ||||||||
Deferred income taxes | 41,442 | 27,721 | 45,934 | ||||||||
Manufactured gas plant remediation costs | (10,934 | ) | (8,106 | ) | (6,805 | ) | |||||
Distributions received from equity investees, net of equity in earnings | (462 | ) | 4,534 | 6,663 | |||||||
Cost of removal - asset retirement obligations | (484 | ) | (403 | ) | (1,034 | ) | |||||
Contributions to postemployment benefit plans | (6,077 | ) | (33,359 | ) | (5,778 | ) | |||||
Tax benefit of delivered shares from stock based compensation | 1,285 | 1,755 | 881 | ||||||||
Changes in: | |||||||||||
Components of working capital | 17,081 | (123,325 | ) | 81,817 | |||||||
Other noncurrent assets | 14,740 | 3,933 | 38,716 | ||||||||
Other noncurrent liabilities | (2,079 | ) | 21,336 | 27,841 | |||||||
Cash flows from operating activities | 248,046 | 142,630 | 390,947 | ||||||||
CASH FLOWS (USED IN) INVESTING ACTIVITIES | |||||||||||
Expenditures for: | |||||||||||
Utility plant | (144,106 | ) | (176,067 | ) | (140,797 | ) | |||||
Solar and wind equipment | (149,400 | ) | (149,063 | ) | (151,002 | ) | |||||
Real estate properties and other | (2,434 | ) | (1,896 | ) | (209 | ) | |||||
Cost of removal | (32,143 | ) | (29,066 | ) | (28,078 | ) | |||||
Acquisition of retail and wholesale energy contracts | (55,661 | ) | — | — | |||||||
Investments in equity investees | (27,070 | ) | (11,176 | ) | (5,780 | ) | |||||
Distributions from equity investees in excess of equity in earnings | 2,749 | 2,351 | 2,620 | ||||||||
Withdrawal from (payment to) restricted cash construction fund | 1,322 | 979 | (1,499 | ) | |||||||
Proceeds from sale of investment | — | — | 3,016 | ||||||||
Proceeds from sale of property | 9,443 | 748 | — | ||||||||
Proceeds from sale of available for sale securities | 6,639 | — | — | ||||||||
Cash flows (used in) investing activities | (390,661 | ) | (363,190 | ) | (321,729 | ) | |||||
CASH FLOWS FROM (USED IN) FINANCING ACTIVITIES | |||||||||||
Proceeds from long-term debt | 100,000 | 275,000 | 250,000 | ||||||||
Payments of long-term debt | (97,854 | ) | (13,289 | ) | (37,039 | ) | |||||
Net proceeds from (payments of) short-term debt | 144,300 | 55,350 | (234,650 | ) | |||||||
Proceeds from sale-leaseback transaction - solar | 32,901 | — | — | ||||||||
Proceeds from sale-leaseback transaction - other | 9,587 | 7,107 | 7,216 | ||||||||
Payments of common stock dividends | (87,988 | ) | (82,445 | ) | (76,532 | ) | |||||
Proceeds from issuance of common stock | 17,492 | 16,010 | 37,299 | ||||||||
Purchases of treasury stock | (6,355 | ) | (1,008 | ) | (10,589 | ) | |||||
Tax withholding payments related to net settled stock compensation | (4,788 | ) | (3,547 | ) | (2,146 | ) | |||||
Cash flows from (used in) financing activities | 107,295 | 253,178 | (66,441 | ) | |||||||
Change in cash and cash equivalents | (35,320 | ) | 32,618 | 2,777 | |||||||
Cash and cash equivalents at beginning of period | 37,546 | 4,928 | 2,151 | ||||||||
Cash and cash equivalents at end of period | $ | 2,226 | $ | 37,546 | $ | 4,928 | |||||
CHANGES IN COMPONENTS OF WORKING CAPITAL | |||||||||||
Receivables | $ | (56,974 | ) | $ | 11,303 | $ | 32,529 | ||||
Inventories | 3,022 | (45,986 | ) | 114,638 | |||||||
Recovery of gas costs | (90 | ) | (39,642 | ) | 18,979 | ||||||
Gas purchases payable | 20,663 | (11,963 | ) | (54,525 | ) | ||||||
Gas purchases payable - related parties | 2 | (411 | ) | 202 | |||||||
Prepaid and accrued taxes | 10,366 | 2,385 | (18,161 | ) | |||||||
Accounts payable and other | 13,086 | (15,656 | ) | (14,714 | ) | ||||||
Restricted broker margin accounts | 22,570 | (38,752 | ) | 18,452 | |||||||
Customers’ credit balances and deposits | (5,877 | ) | 12,044 | (1,545 | ) | ||||||
Other current assets | 10,313 | 3,353 | (14,038 | ) | |||||||
Total | $ | 17,081 | $ | (123,325 | ) | $ | 81,817 | ||||
SUPPLEMENTAL DISCLOSURES | |||||||||||
Cash paid (received) for: | |||||||||||
Interest (net of amounts capitalized) | $ | 44,362 | $ | 31,996 | $ | 24,208 | |||||
Income taxes | $ | (6,877 | ) | $ | (3,516 | ) | $ | 28,790 | |||
Accrued capital expenditures | $ | 21,769 | $ | 48,881 | $ | 28,676 | |||||
Deferred gain on non-cash exchange of investments | $ | — | $ | — | $ | 24,601 | |||||
See Notes to Consolidated Financial Statements | |||||||||||
Page 75
New Jersey Resources Corporation
Part II
ITEM 8. FINANCIAL STATEMENTS AND SUPPLEMENTARY DATA (Continued)
CONSOLIDATED BALANCE SHEETS
ASSETS
(Thousands) | ||||||
September 30, | 2017 | 2016 | ||||
PROPERTY, PLANT AND EQUIPMENT | ||||||
Utility plant, at cost | $ | 2,241,324 | $ | 2,107,375 | ||
Construction work in progress | 119,318 | 122,268 | ||||
Solar and wind equipment, real estate properties and other, at cost | 843,142 | 631,696 | ||||
Construction work in progress | 7,286 | 93,791 | ||||
Total property, plant and equipment | 3,211,070 | 2,955,130 | ||||
Accumulated depreciation and amortization, utility plant | (489,122 | ) | (467,702 | ) | ||
Accumulated depreciation and amortization, solar and wind equipment, real estate properties and other | (112,207 | ) | (79,776 | ) | ||
Property, plant and equipment, net | 2,609,741 | 2,407,652 | ||||
CURRENT ASSETS | ||||||
Cash and cash equivalents | 2,226 | 37,546 | ||||
Customer accounts receivable: | ||||||
Billed | 196,467 | 142,658 | ||||
Unbilled revenues | 7,202 | 5,744 | ||||
Allowance for doubtful accounts | (5,181 | ) | (4,865 | ) | ||
Regulatory assets | 50,791 | 54,286 | ||||
Gas in storage, at average cost | 202,063 | 206,251 | ||||
Materials and supplies, at average cost | 11,944 | 10,778 | ||||
Prepaid and accrued taxes | 24,764 | 34,179 | ||||
Derivatives, at fair value | 30,081 | 29,964 | ||||
Restricted broker margin accounts | 25,827 | 47,644 | ||||
Asset held for sale | — | 7,660 | ||||
Other current assets | 33,260 | 35,419 | ||||
Total current assets | 579,444 | 607,264 | ||||
NONCURRENT ASSETS | ||||||
Investments in equity investees | 172,585 | 141,148 | ||||
Regulatory assets | 375,919 | 441,294 | ||||
Derivatives, at fair value | 9,164 | 5,227 | ||||
Available for sale securities | 65,752 | 55,789 | ||||
Intangible assets | 41,084 | — | ||||
Other noncurrent assets | 74,818 | 60,196 | ||||
Total noncurrent assets | 739,322 | 703,654 | ||||
Total assets | $ | 3,928,507 | $ | 3,718,570 | ||
See Notes to Consolidated Financial Statements
Page 76
New Jersey Resources Corporation
Part II
ITEM 8. FINANCIAL STATEMENTS AND SUPPLEMENTARY DATA (Continued)
CAPITALIZATION AND LIABILITIES
(Thousands, except share data) | ||||||
September 30, | 2017 | 2016 | ||||
CAPITALIZATION | ||||||
Common stock, $2.50 par value; authorized 150,000,000 shares; outstanding September 30, 2017 — 86,555,507; September 30, 2016 — 86,086,355 | $ | 222,258 | $ | 221,654 | ||
Premium on common stock | 219,696 | 215,580 | ||||
Accumulated other comprehensive (loss), net of tax | (3,256 | ) | (15,155 | ) | ||
Treasury stock at cost and other; shares September 30, 2017 — 2,347,380; September 30, 2016 — 2,575,139 | (70,039 | ) | (81,044 | ) | ||
Retained earnings | 867,984 | 825,556 | ||||
Common stock equity | 1,236,643 | 1,166,591 | ||||
Long-term debt | 997,080 | 1,055,038 | ||||
Total capitalization | 2,233,723 | 2,221,629 | ||||
CURRENT LIABILITIES | ||||||
Current maturities of long-term debt | 165,375 | 61,452 | ||||
Short-term debt | 266,000 | 121,700 | ||||
Gas purchases payable | 160,115 | 139,452 | ||||
Gas purchases payable to related parties | 1,152 | 1,150 | ||||
Accounts payable and other | 96,878 | 107,184 | ||||
Dividends payable | 23,586 | 21,975 | ||||
Accrued taxes | 2,031 | 1,080 | ||||
Regulatory liabilities | 78 | 9,469 | ||||
New Jersey clean energy program | 14,202 | 14,232 | ||||
Derivatives, at fair value | 46,544 | 61,080 | ||||
Customers’ credit balances and deposits | 26,957 | 32,834 | ||||
Total current liabilities | 802,918 | 571,608 | ||||
NONCURRENT LIABILITIES | ||||||
Deferred income taxes | 514,708 | 473,847 | ||||
Deferred investment tax credits | 4,297 | 4,619 | ||||
Deferred gain | 27,728 | 28,519 | ||||
Derivatives, at fair value | 11,330 | 25,252 | ||||
Manufactured gas plant remediation | 149,000 | 172,000 | ||||
Postemployment employee benefit liability | 128,888 | 141,604 | ||||
Regulatory liabilities | 14,507 | 41,411 | ||||
Asset retirement obligation | 31,420 | 28,379 | ||||
Other noncurrent liabilities | 9,988 | 9,702 | ||||
Total noncurrent liabilities | 891,866 | 925,333 | ||||
Commitments and contingent liabilities (Note 14) | ||||||
Total capitalization and liabilities | $ | 3,928,507 | $ | 3,718,570 | ||
See Notes to Consolidated Financial Statements
Page 77
New Jersey Resources Corporation
Part II
ITEM 8. FINANCIAL STATEMENTS AND SUPPLEMENTARY DATA (Continued)
CONSOLIDATED STATEMENTS OF COMMON STOCK EQUITY
(Thousands) | Number of Shares | Common Stock | Premium on Common Stock | Accumulated Other Comprehensive (Loss) Income | Treasury Stock And Other | Retained Earnings | Total | |||||||||||||||
Balance at September 30, 2014 | 84,356 | $ | 218,223 | $ | 199,739 | $ | (5,594 | ) | $ | (121,031 | ) | $ | 674,829 | $ | 966,166 | |||||||
Net income | 180,960 | 180,960 | ||||||||||||||||||||
Other comprehensive loss | (3,800 | ) | (3,800 | ) | ||||||||||||||||||
Common stock issued: | ||||||||||||||||||||||
Incentive compensation plan | 359 | 895 | 5,013 | 5,908 | ||||||||||||||||||
Dividend reinvestment plan (1) | 1,149 | 1,720 | 6,722 | 19,096 | 27,538 | |||||||||||||||||
Tax benefits from stock plans | (1,344 | ) | (1,344 | ) | ||||||||||||||||||
Cash dividend declared ($.915 per share) | (78,044 | ) | (78,044 | ) | ||||||||||||||||||
Treasury stock and other | (333 | ) | (199 | ) | 9,771 | 9,572 | ||||||||||||||||
Balance at September 30, 2015 | 85,531 | 220,838 | 209,931 | (9,394 | ) | (92,164 | ) | 777,745 | 1,106,956 | |||||||||||||
Net income | 131,672 | 131,672 | ||||||||||||||||||||
Other comprehensive loss | (5,761 | ) | (5,761 | ) | ||||||||||||||||||
Common stock issued: | ||||||||||||||||||||||
Incentive compensation plan | 325 | 816 | 8,583 | 9,399 | ||||||||||||||||||
Dividend reinvestment plan (1) | 471 | (2,879 | ) | 18,942 | 16,063 | |||||||||||||||||
Cash dividend declared ($.975 per share) | (83,861 | ) | (83,861 | ) | ||||||||||||||||||
Treasury stock and other | (241 | ) | (55 | ) | (7,822 | ) | (7,877 | ) | ||||||||||||||
Balance at September 30, 2016 | 86,086 | 221,654 | 215,580 | (15,155 | ) | (81,044 | ) | 825,556 | 1,166,591 | |||||||||||||
Net income | 132,065 | 132,065 | ||||||||||||||||||||
Other comprehensive income | 11,899 | 11,899 | ||||||||||||||||||||
Common stock issued: | ||||||||||||||||||||||
Incentive compensation plan | 241 | 604 | 5,090 | 5,694 | ||||||||||||||||||
Dividend reinvestment plan (1) | 472 | (946 | ) | 18,568 | 17,622 | |||||||||||||||||
Cash dividend declared ($1.0375 per share) | (89,637 | ) | (89,637 | ) | ||||||||||||||||||
Treasury stock and other | (243 | ) | (28 | ) | (7,563 | ) | (7,591 | ) | ||||||||||||||
Balance at September 30, 2017 | 86,556 | $ | 222,258 | $ | 219,696 | $ | (3,256 | ) | $ | (70,039 | ) | $ | 867,984 | $ | 1,236,643 | |||||||
(1) | The DRP allows NJR, at its option, to use newly issued shares to raise capital. During fiscal 2015, NJR issued approximately 688,000 new shares through the waiver discount feature of its DRP. There were no new shares issued through the waiver discount feature during fiscal 2016 and fiscal 2017. |
See Notes to Consolidated Financial Statements
Page 78
New Jersey Resources Corporation
Part II
ITEM 8. FINANCIAL STATEMENTS AND SUPPLEMENTARY DATA (Continued)
1. NATURE OF THE BUSINESS
New Jersey Resources Corporation provides regulated gas distribution services and operates certain unregulated businesses primarily through the following:
New Jersey Natural Gas Company provides natural gas utility service to approximately 529,800 retail customers in central and northern New Jersey and is subject to rate regulation by the BPU. NJNG comprises the Natural Gas Distribution segment;
NJR Clean Energy Ventures Corporation, the Company’s clean energy subsidiary, comprises the Clean Energy Ventures segment and consists of the Company’s capital investments in commercial and residential solar projects located throughout New Jersey and onshore wind investments in Montana, Iowa, Kansas, Wyoming and Pennsylvania;
NJR Energy Services Company and NJR Retail Services Company comprise the Energy Services segment. NJRES maintains and transacts around a portfolio of natural gas storage and transportation capacity contracts and provides physical wholesale energy and energy management services in the U.S. and Canada. NJRRS provides retail natural gas supply and transportation services to commercial and industrial customers in Delaware, Maryland, Pennsylvania and New Jersey;
NJR Midstream Holdings Corporation, which comprises the Midstream segment, invests in energy-related ventures through its subsidiaries, NJR Steckman Ridge Storage Company, which holds the Company’s 50 percent combined interest in Steckman Ridge located in Pennsylvania, NJR Pipeline Company, which holds the Company’s 20 percent ownership interest in PennEast and NJNR Pipeline Company, which holds approximately 1.84 million DM Common Units. See Note 7. Investments in Equity Investees for more information; and
NJR Retail Holdings Corporation has two principal subsidiaries, NJR Home Services Company, which provides heating, central air conditioning, standby generators, solar and other indoor and outdoor comfort products to residential homes throughout New Jersey, and Commercial Realty & Resources Corporation, which owns commercial real estate. NJR Home Services Company and Commercial Realty & Resources Corporation are included in Home Services and Other operations.
2. SUMMARY OF SIGNIFICANT ACCOUNTING POLICIES
Principles of Consolidation
The Consolidated Financial Statements include the accounts of the Company and its wholly-owned subsidiaries. All intercompany accounts and transactions have been eliminated.
Other financial investments or contractual interests that lack the characteristics of a voting interest entity, which are commonly referred to as variable interest entities, are evaluated by the Company to determine if it has the power to direct business activities and, therefore, would be considered a controlling interest that the Company would have to consolidate. Based on those evaluations, NJR has determined that it does not have any investments in variable interest entities as of September 30, 2017, 2016 and 2015.
Investments in entities over which the Company does not have a controlling financial interest are either accounted for under the equity method or cost method of accounting.
Use of Estimates
The preparation of financial statements in conformity with GAAP requires the Company to make estimates that affect the reported amounts of assets, liabilities, revenues, expenses and related disclosure of contingencies during the reporting period. On a monthly basis, the Company evaluates its estimates, including those related to the calculation of the fair value of derivative instruments, debt, unbilled revenues, allowance for doubtful accounts, provisions for depreciation and amortization, regulatory assets and liabilities, income taxes, pensions and other postemployment benefits, contingencies related to environmental matters and litigation. AROs are evaluated as often as needed. The Company’s estimates are based on historical experience and on various other assumptions that are believed to be reasonable under the circumstances, the results of which form the basis for making judgments about the carrying value of assets and liabilities that are not readily apparent from other sources.
Page 79
New Jersey Resources Corporation
Part II
ITEM 8. FINANCIAL STATEMENTS AND SUPPLEMENTARY DATA (Continued)
The Company has legal, regulatory and environmental proceedings during the normal course of business that can result in loss contingencies. When evaluating the potential for a loss, the Company will establish a reserve if a loss is probable and can be reasonably estimated, in which case it is the Company’s policy to accrue the full amount of such estimates. Where the information is sufficient only to establish a range of probable liability, and no point within the range is more likely than any other, it is the Company’s policy to accrue the lower end of the range. In the normal course of business, estimated amounts are subsequently adjusted to actual results that may differ from estimates.
Business Combinations
The Company accounts for business combinations by applying the acquisition method of accounting. Identifiable assets acquired and liabilities assumed are measured separately at their fair value as of the acquisition date and associated transactions costs are expensed as incurred.
The determination and allocation of fair values to the identifiable assets acquired and liabilities assumed are based on various assumptions and valuation methodologies requiring considerable management judgment. The most significant variables in these valuations are discount rates, the number of years on which to base the cash flow projections, as well as other assumptions and estimates used to determine the cash inflows and outflows. Management determines discount rates based on the risk inherent in the acquired assets and related cash flows. Our valuation of an acquired business is based on available information at the acquisition date and assumptions that we believe are reasonable. However, a change in facts and circumstances as of the acquisition date can result in subsequent adjustments during the measurement period, but no later than one year from the acquisition date. See Note 3. Acquisition for information related to the Company’s acquisition of a gas marketing business on July 27, 2017.
Regulatory Assets & Liabilities
Under cost-based regulation, regulated utility enterprises generally are permitted to recover their operating expenses and earn a reasonable rate of return on their utility investment.
Our Natural Gas Distribution segment maintains its accounts in accordance with the FERC Uniform System of Accounts as prescribed by the BPU and in accordance with the Regulated Operations Topic of the FASB ASC. As a result of the impact of the ratemaking process and regulatory actions of the BPU, NJNG is required to recognize the economic effects of rate regulation. Accordingly, NJNG capitalizes or defers certain costs that are expected to be recovered from its customers as regulatory assets and recognizes certain obligations representing probable future expenditures as regulatory liabilities on the Consolidated Balance Sheets. See Note 4. Regulation for a more detailed description of NJNG’s regulatory assets and liabilities.
Gas in Storage
Gas in storage is reflected at average cost on the Consolidated Balance Sheets, and represents natural gas and LNG that will be utilized in the ordinary course of business.
The following table summarizes gas in storage, at average cost by company, as of September 30:
2017 | 2016 | |||||||||||
($ in thousands) | Gas in Storage | Bcf | Gas in Storage | Bcf | ||||||||
Energy Services | $ | 122,884 | 53.9 | $ | 130,493 | 62.0 | ||||||
Natural Gas Distribution | 79,179 | 21.8 | 75,758 | 21.3 | ||||||||
Total | $ | 202,063 | 75.7 | $ | 206,251 | 83.3 | ||||||
Demand Fees
For the purpose of securing storage and pipeline capacity in support of their respective businesses, our Energy Services and Natural Gas Distribution segments enter into storage and pipeline capacity contracts, which require the payment of associated demand fees and charges that allow them access to a high priority of service in order to maintain the ability to access storage or pipeline capacity during a fixed time period, which generally ranges from one to 10 years. Many of these demand fees and charges are based on established tariff rates as established and regulated by FERC. These charges represent commitments to pay storage providers and pipeline companies for the priority right to transport and/or store natural gas utilizing their respective assets.
Page 80
New Jersey Resources Corporation
Part II
ITEM 8. FINANCIAL STATEMENTS AND SUPPLEMENTARY DATA (Continued)
The following table summarizes the demand charges, which are net of capacity releases, and are included as a component of gas purchases on the Consolidated Statements of Operations for the fiscal years ended September 30:
(Millions) | 2017 | 2016 | 2015 | ||||||
Energy Services | $ | 126.4 | $ | 141.0 | $ | 130.6 | |||
Natural Gas Distribution | 80.2 | 77.8 | 80.5 | ||||||
Total | $ | 206.6 | $ | 218.8 | $ | 211.1 | |||
Energy Services expenses demand charges ratably over the term of the service being provided.
Our Natural Gas Distribution segment’s costs associated with demand charges are included in its weighted average cost of gas. The demand charges are expensed based on NJNG’s BGSS sales and recovered as part of its gas commodity component of its BGSS tariff.
Derivative Instruments
The Company accounts for its financial instruments, such as futures, options, foreign exchange contracts, interest rate contracts, as well as its physical commodity contracts related to the purchase and sale of natural gas at Energy Services, as derivatives, and therefore recognizes them at fair value on the Consolidated Balance Sheets. The Company’s unregulated subsidiaries record changes in the fair value of their financial commodity derivatives in gas purchases and changes in the fair value of their physical forward contracts in gas purchases or operating revenues, as appropriate, on the Consolidated Statements of Operations. Energy Services designated its foreign exchange contracts, entered into prior to January 1, 2016, as cash flow hedges of Canadian dollar denominated gas purchases. Changes in the fair value of the effective portion of these hedges are recorded to AOCI, a component of stockholders’ equity, and reclassified to gas purchases on the Consolidated Statements of Operations when they settle. Ineffective portions of the cash flow hedges are recognized immediately in earnings. The Company did not have derivatives designated as fair value hedges during fiscal 2016 and 2017.
The Derivatives and Hedging Topic of the ASC also provides for a NPNS scope exception for qualifying physical commodity contracts that are intended for purchases and sales during the normal course of business and for which physical delivery is probable. Effective January 1, 2016, the Company prospectively applies this normal scope exception on a case-by-case basis to physical commodity contracts at NJNG and forward SREC contracts at Clean Energy Ventures. When applied, it does not record changes in the fair value of these contracts until the contract settles and the related underlying natural gas or SREC is delivered. Gains and/or losses on NJNG’s derivatives used to economically hedge its regulated natural gas supply obligations, as well as its exposure to interest rate variability, are recoverable through its BGSS, a component of its tariff. Accordingly, the offset to the change in fair value of these derivatives is recorded as a regulatory asset or liability on the Consolidated Balance Sheets.
See Note 5. Derivative Instruments for additional details regarding natural gas trading and hedging activities.
Fair values of exchange-traded instruments, including futures, swaps, and certain options, are based on unadjusted, quoted prices in active markets. The Company’s non-exchange-traded financial instruments, foreign currency derivatives, over-the-counter physical commodity contracts at Energy Services and NJNG’s Treasury Lock are valued using observable, quoted prices for similar or identical assets when available. In establishing the fair value of contracts for which a quoted basis price is not available at the measurement date, management utilizes available market data and pricing models to estimate fair values. Fair values are subject to change in the near term and reflect management’s best estimate based on a variety of factors. Estimating fair values of instruments that do not have quoted market prices requires management’s judgment in determining amounts that could reasonably be expected to be received from, or paid to, a third party in settlement of the instruments. These amounts could be materially different from amounts that might be realized in an actual sale transaction.
Revenues
Revenues from the sale of natural gas to NJNG customers are recognized in the period that gas is delivered and consumed by customers, including an estimate for unbilled revenue.
Page 81
New Jersey Resources Corporation
Part II
ITEM 8. FINANCIAL STATEMENTS AND SUPPLEMENTARY DATA (Continued)
NJNG records unbilled revenue for natural gas services. Natural gas sales to individual customers are based on meter readings, which are performed on a systematic basis throughout the month. At the end of each month, the amount of natural gas delivered to each customer after the last meter reading through the end of the respective accounting period is estimated, and recognizes unbilled revenues related to these amounts. The unbilled revenue estimates are based on estimated customer usage by customer type, weather effects, unaccounted-for gas and the most current tariff rates.
Clean Energy Ventures recognizes revenue when SRECs are transferred to counterparties. SRECs are physically delivered through the transfer of certificates as per contractual settlement schedules.
Revenues for Energy Services are recognized when the natural gas is physically delivered to the customer. In addition, changes in the fair value of derivatives that economically hedge the forecasted sales of the natural gas are recognized in operating revenues as they occur, as noted above. Energy Services also recognizes changes in the fair value of SREC derivative contracts as a component of operating revenues.
Revenues from all other activities are recorded in the period during which products or services are delivered and accepted by customers, or over the related contractual term.
Gas Purchases
NJNG’s tariff includes a component for BGSS, which is designed to allow it to recover the cost of natural gas through rates charged to its customers and is typically revised on an annual basis. As part of computing its BGSS rate, NJNG projects its cost of natural gas, net of supplier refunds, the impact of hedging activities and cost savings created by BGSS incentive programs. NJNG subsequently recovers or credits the difference, if any, of actual costs compared with those included in current rates. Any underrecoveries or overrecoveries are either credited to customers or deferred and, subject to BPU approval, reflected in the BGSS rates in subsequent years.
Gas purchases at Energy Services are comprised of gas costs to be paid upon completion of a variety of transactions, as well as realized gains and losses from settled derivative instruments and unrealized gains and losses on the change in fair value of derivative instruments that have not yet settled. Changes in the fair value of derivatives that economically hedge the forecasted purchases of natural gas are recognized in gas purchases as they occur.
Income Taxes
The Company computes income taxes using the asset and liability method, whereby deferred income taxes are generally determined based on the difference between the financial statement and tax basis of assets and liabilities using enacted tax rates in effect in the years in which the differences are expected to reverse. See Note 13. Income Taxes. In addition, the Company evaluates its tax positions to determine the appropriate accounting and recognition of future obligations associated with unrecognized tax benefits.
The Company invests in property that qualifies for federal ITCs and utilizes the ITCs, as allowed, based on the cost and life of the assets. ITCs at NJNG are deferred and amortized as a reduction to the tax provision over the average lives of the related equipment in accordance with regulatory treatment. ITCs at NJR’s unregulated subsidiaries are recognized as a reduction to income tax expense when the property is placed in service. The Company invests in property that qualifies for PTCs. PTCs are recognized as reductions to current federal income tax expense as PTCs are generated through the production activities of the assets. Changes to the federal statutes related to ITCs and PTCs, which have the effect of reducing or eliminating the credits, could have a negative impact on earnings and cash flows.
Capitalized and Deferred Interest
NJNG’s base rates include the ability to recover AFUDC on its construction work in progress. For all NJNG construction projects, an incremental cost of equity is recoverable during periods when NJNG’s short-term debt balances are lower than its construction work in progress. For more information on AFUDC treatment with respect to certain accelerated infrastructure projects, see Note 4. Regulation - Infrastructure programs.
Page 82
New Jersey Resources Corporation
Part II
ITEM 8. FINANCIAL STATEMENTS AND SUPPLEMENTARY DATA (Continued)
Capitalized amounts associated with the debt and equity components of NJNG’s AFUDC are recorded in utility plant on the Consolidated Balance Sheets. Corresponding amounts for the debt component is recognized in interest expense and in other income for the equity component on the Consolidated Statements of Operations and include the following for the fiscal years ended September 30:
($ in thousands) | 2017 | 2016 | 2015 | ||||||
AFUDC: | |||||||||
Debt | $ | 1,311 | $ | 5,009 | $ | 2,472 | |||
Equity | 3,867 | 4,375 | 3,825 | ||||||
Total | $ | 5,178 | $ | 9,384 | $ | 6,297 | |||
Weighted average interest rate | 6.90 | % | 5.06 | % | 4.63 | % | |||
Pursuant to a BPU order, NJNG is permitted to recover carrying costs on uncollected balances related to SBC program costs, which include NJCEP, RAC and USF expenditures. See Note 4. Regulation. The SBC interest rate changes each September based on the August 31 seven-year constant maturity Treasury rate plus 60 basis points. The rate was 2.55 percent, 2.05 percent and 2.54 percent for the fiscal years ended September 30, 2017, 2016 and 2015, respectively. Accordingly, other income included $78,000, $54,000 and $61,000 in the fiscal years ended September 30, 2017, 2016 and 2015, respectively.
Sale-Leasebacks
The Company utilizes sale-leaseback arrangements to fund certain of its capital expenditures, whereby the physical asset is sold concurrent with an agreement to lease the asset back, with options that allow the Company to renew the lease at the end of the term or repurchase the asset. Proceeds from sale-leaseback transactions are included in long-term debt on the Consolidated Balance Sheets.
For certain of its commercial solar energy projects, the Company enters into lease agreements that provide for the sale of commercial solar energy assets to third-parties and the concurrent leaseback of the assets. For sale-leaseback transactions where the Company has concluded that the terms of the arrangement create a continuing involvement in the asset and the asset is considered integral equipment, the Company uses the financing method to account for the transaction. Under the financing method, the Company recognizes the proceeds received from the lessor that constitute a payment to acquire the solar energy asset as a financing arrangement, which is recorded as a component of debt on the Consolidated Balance Sheets.
During fiscal 2017 and 2016, NJNG received $9.6 million and $7.1 million, respectively, in connection with the sale-leaseback of its natural gas meters with terms ranging from seven to 11 years.
In September 2017, Clean Energy Ventures received $32.9 million in proceeds related to the sale of two commercial solar assets. Clean Energy Ventures simultaneously entered into an agreement to lease the assets back over seven-year terms. The Company will continue to operate the solar assets including related expenses and retain the revenue generated from SRECs and energy sales. The ITCs and other tax benefits associated with these solar projects were transferred to the buyer, however, the lease payments are structured so that Clean Energy Ventures is compensated for the transfer of the related tax incentives. Accordingly, Clean Energy Ventures will recognize the equivalent value of the ITC in other income on the Consolidated Statements of Operations over the respective five-year ITC recapture periods that are recognized as the recapture periods expire, starting at the beginning of the second year of the lease. There were no sale-leaseback transactions at Clean Energy Ventures during fiscal 2016.
Sales Tax Accounting
Sales tax that is collected from customers is presented in both operating revenues and operating expenses on the Consolidated Statements of Operations. During fiscal 2017, 2016 and 2015, sales tax collected was $39.4 million, $31 million and $44.1 million, respectively. Effective January 1, 2017, the New Jersey sales tax rate decreased from 7 percent to 6.875 percent.
Cash and Cash Equivalents
Cash and cash equivalents consist of cash on deposit and temporary investments with maturities of three months or less, and excludes restricted cash of $243,000 and $1.6 million as of September 30, 2017 and 2016, respectively, related to escrow balances for utility plant projects, which is recorded in other current and noncurrent assets on the Consolidated Balance Sheets.
Page 83
New Jersey Resources Corporation
Part II
ITEM 8. FINANCIAL STATEMENTS AND SUPPLEMENTARY DATA (Continued)
Property Plant and Equipment
Regulated property, plant and equipment and solar and wind equipment are stated at original cost. Regulated property, plant and equipment costs include direct labor, materials and third-party construction contractor costs, AFUDC and certain indirect costs related to equipment and employees engaged in construction. Upon retirement, the cost of depreciable regulated property, plus removal costs less salvage, is charged to accumulated depreciation with no gain or loss recorded.
Depreciation is computed on a straight-line basis over the useful life of the assets for unregulated assets, and using rates based on the estimated average lives of the various classes of depreciable property for NJNG. The composite rate of depreciation used for NJNG was 2.25 percent of average depreciable property in fiscal 2017, 2.32 percent in fiscal 2016 and 2.31 percent in fiscal 2015. The Company recorded $81.8 million, $72.7 million and $61.4 million in depreciation expense during fiscal 2017, 2016 and 2015, respectively. Effective October 1, 2016, the overall depreciation rate is 2.4 percent, as settled in the base rate case.
Property, plant and equipment was comprised of the following as of September 30:
(Thousands) | ||||||||
Property Classifications | Estimated Useful Lives | 2017 | 2016 | |||||
Distribution facilities | 38 to 74 years | $ | 1,952,697 | $ | 1,823,672 | |||
Transmission facilities | 35 to 56 years | 294,586 | 292,433 | |||||
Storage facilities | 34 to 47 years | 78,245 | 78,238 | |||||
Solar property | 20 to 25 years | 587,345 | 479,948 | |||||
Wind property | 25 years | 244,764 | 228,644 | |||||
All other property | 5 to 35 years | 53,433 | 52,195 | |||||
Total property, plant and equipment | 3,211,070 | 2,955,130 | ||||||
Accumulated depreciation and amortization | (601,329 | ) | (547,478 | ) | ||||
Property, plant and equipment, net | $ | 2,609,741 | $ | 2,407,652 | ||||
On March 8, 2017, CR&R sold a 56,400 square foot office building on five acres of land located in Monmouth County for $9.4 million, net of closing costs, generating a pre-tax gain of $1.9 million, which was recognized as a reduction to O&M on the Consolidated Statements of Operations.
Intangible Assets
Finite-lived intangible assets are stated at cost less accumulated amortization. The Company amortizes intangible assets based upon the pattern in which the economic benefits are consumed over the life of the asset unless a pattern cannot be reliably determined, in which case the Company uses a straight-line amortization method. As of September 30, 2017, the Company has an intangible asset, net of amortization, of $41.1 million related to its acquisition of Talen's wholesale natural gas energy contracts. These contracts are being amortized based upon expected cash flows over the respective terms of the agreements. The estimated future amortization expense for the next five years as of September 30, is as follows:
(Thousands) | |||
2018 | $ | 18,222 | |
2019 | $ | 8,424 | |
2020 | $ | 4,925 | |
2021 | $ | 4,604 | |
2022 | $ | 2,561 | |
Thereafter | $ | 2,348 | |
See Note 3. Acquisition for more information about the acquisition of Talen's gas marketing business.
Long-lived Assets
The Company reviews the recoverability of long-lived assets and finite-lived intangible assets whenever events or changes in circumstances indicate that the carrying value of such assets may not be recoverable. If there are changes indicating that the carrying value of such assets may not be recoverable, an undiscounted cash flows test is performed. If the sum of the expected future undiscounted cash flows is less than the carrying amount of the asset, an impairment loss is recognized by reducing the recorded value of the asset to its fair value. During the year, there were no events or circumstances that indicated that the carrying value of assets is not recoverable.
Page 84
New Jersey Resources Corporation
Part II
ITEM 8. FINANCIAL STATEMENTS AND SUPPLEMENTARY DATA (Continued)
Investments in Equity Investees
The Company accounts for its investments in Steckman Ridge, PennEast and Iroquois (through September 29, 2015), using the equity method of accounting, where its respective ownership interests are 50 percent or less and/or it has significant influence over operating and management decisions, but is not the primary beneficiary, as defined under ASC 810, Consolidation. The Company’s share of earnings is recognized as equity in earnings of affiliates on the Consolidated Statements of Operations. See Note 7. Investments in Equity Investees for more information.
Available for Sale Securities
The Company had investments in two publicly traded energy companies that have a fair value of $65.8 million and $55.8 million as of September 30, 2017 and 2016, respectively, which are included in available for sale securities on the Consolidated Balance Sheets. Total unrealized gains associated with these investments are included as a part of accumulated other comprehensive income, a component of common stock equity, and were $18.4 million, $11 million after tax, and $7.2 million, $4.2 million after tax, as of September 30, 2017 and 2016, respectively.
During fiscal 2017, the Company received proceeds of approximately $6.6 million from the sale of available for sale securities and realized a pre-tax gain of approximately $5.4 million, which is included in other income, net on the Consolidated Statements of Operations. Reclassifications of realized gains out of other comprehensive income into income are determined based on average cost. There were no sales of securities during fiscal 2016.
Customer Accounts Receivable and Allowance for Doubtful Accounts
Receivables consist of natural gas sales and transportation services billed to residential, commercial, industrial and other customers, as well as equipment sales, installations, solar leases and PPAs to commercial and residential customers. The Company evaluates its accounts receivables and, to the extent customer account balances are outstanding for more than 60 days, establishes an allowance for doubtful accounts. The allowance is based on a combination of factors including historical collection experience and trends, aging of receivables, general economic conditions in the company’s distribution or sales territories, and customer specific information. The Company writes-off customers’ accounts once it is determined they are uncollectible.
The following table summarizes customer accounts receivable by company as of September 30:
(Thousands) | 2017 | 2016 | |||||||||
Energy Services | $ | 150,322 | 77 | % | $ | 102,884 | 72 | % | |||
NJNG (1) | 37,432 | 19 | 30,951 | 22 | |||||||
Clean Energy Ventures | 2,655 | 1 | 1,807 | 1 | |||||||
NJRHS and other | 6,058 | 3 | 7,016 | 5 | |||||||
Total | $ | 196,467 | 100 | % | $ | 142,658 | 100 | % | |||
(1) | Does not include unbilled revenues of $7.2 million and $5.7 million as of September 30, 2017 and 2016, respectively. |
Loans Receivable
NJNG currently provides loans, with terms ranging from three to 10 years, to customers that elect to purchase and install certain energy efficient equipment in accordance with its BPU-approved SAVEGREEN program. The loans are recognized at net present value on the Consolidated Balance Sheets. Refer to Note 6. Fair Value for a discussion of the Company’s fair value measurement policies and level disclosures. The Company has recorded $8.9 million and $7.8 million in other current assets and $40.4 million and $39.5 million in other noncurrent assets as of September 30, 2017 and 2016, respectively, on the Consolidated Balance Sheets, related to the loans.
NJNG’s policy is to establish an allowance for doubtful accounts when loan balances are in arrears for more than 60 days. There was no allowance for doubtful accounts established for the SAVEGREEN loans during fiscal 2017 and 2016.
Asset Retirement Obligations
The Company recognizes a liability for its AROs based on the fair value of the liability when incurred, which is generally upon acquisition, construction, development and/or through the normal operation of the asset. Concurrently, the Company also capitalizes an asset retirement cost by increasing the carrying amount of the related asset by the same amount as the liability. In periods subsequent to the initial measurement, the Company is required to recognize changes in the liability resulting from the passage of time (accretion) or due to revisions to either timing or the amount of the originally estimated cash flows to settle the conditional ARO.
Page 85
New Jersey Resources Corporation
Part II
ITEM 8. FINANCIAL STATEMENTS AND SUPPLEMENTARY DATA (Continued)
Pension and Postemployment Plans
The Company has two noncontributory defined pension plans covering eligible employees, including officers. Benefits are based on each employee’s years of service and compensation. The Company’s funding policy is to contribute annually to these plans at least the minimum amount required under Employee Retirement Income Security Act, as amended, and not more than can be deducted for federal income tax purposes. Plan assets consist of equity securities, fixed-income securities and short-term investments. The Company made a discretionary contribution of $30 million during the first quarter of fiscal 2016 to improve the funded status of the pension plans based on the current actuarial assumptions, which included the adoption of the most recent mortality table. The Company made no discretionary contributions to the pension plans in fiscal 2017 and 2015.
The Company also provides two primarily noncontributory medical and life insurance plans for eligible retirees and dependents. Medical benefits, which make up the largest component of the plans, are based upon an age and years-of-service vesting schedule and other plan provisions. Funding of these benefits is made primarily into Voluntary Employee Beneficiary Association trust funds. The Company contributed $6 million, $3.2 million and $5.7 million in aggregate to these plans in fiscal 2017, 2016 and 2015, respectively.
See Note 11. Employee Benefit Plans, for a more detailed description of the Company’s pension and postemployment plans.
Accumulated Other Comprehensive Income
The following table presents the changes in the components of accumulated other comprehensive income, net of related tax effects, as of September 30:
(Thousands) | Unrealized gain (loss) on available for sale securities | Net unrealized gain (loss) on derivatives | Adjustment to postemployment benefit obligation | Total | |||||||||||
Balance as of September 30, 2015 | $ | 6,385 | $ | — | $ | (15,779 | ) | $ | (9,394 | ) | |||||
Other comprehensive income, net of tax | |||||||||||||||
Other comprehensive (loss), before reclassifications, net of tax of $1,499, $10, $3,164, $4,673 | (2,187 | ) | (17 | ) | (4,600 | ) | (6,804 | ) | |||||||
Amounts reclassified from accumulated other comprehensive income, net of tax of $0, $(10), $(698), $(708) | — | 17 | (1) | 1,026 | (2) | 1,043 | |||||||||
Net current-period other comprehensive (loss), net of tax of $1,499, $0, $2,466, $3,965 | (2,187 | ) | — | (3,574 | ) | (5,761 | ) | ||||||||
Balance at September 30, 2016 | $ | 4,198 | $ | — | $ | (19,353 | ) | $ | (15,155 | ) | |||||
Other comprehensive income, net of tax | |||||||||||||||
Other comprehensive income, before reclassifications, net of tax of $(6,593), $0, $(2,619), $(9,212) | 10,019 | — | 3,783 | 13,802 | |||||||||||
Amounts reclassified from accumulated other comprehensive (loss) income, net of tax of $2,192, $0, $(868), $1,324 | (3,173 | ) | — | (1) | 1,270 | (2) | (1,903 | ) | |||||||
Net current-period other comprehensive income, net of tax of $(4,401), $0, $(3,487), $(7,888) | 6,846 | — | 5,053 | 11,899 | |||||||||||
Balance at September 30, 2017 | $ | 11,044 | $ | — | $ | (14,300 | ) | $ | (3,256 | ) | |||||
(1) | Consists of realized losses related to foreign currency derivatives, which are reclassified to gas purchases on the Consolidated Statements of Operations. |
(2) | Included in the computation of net periodic pension cost, a component of O&M expense on the Consolidated Statements of Operations. For more details, see Note 11. Employee Benefit Plans. |
Foreign Currency Transactions
Energy Services’ market area includes Canadian delivery points and as a result, Energy Services incurs certain natural gas commodity costs and demand fees denominated in Canadian dollars. Gains or losses that occur as a result of these foreign currency transactions are reported as a component of gas purchases on the Consolidated Statements of Operations and were not material during the fiscal years ended September 30, 2017, 2016 and 2015.
Page 86
New Jersey Resources Corporation
Part II
ITEM 8. FINANCIAL STATEMENTS AND SUPPLEMENTARY DATA (Continued)
Recently Adopted Updates to the Accounting Standards Codification
Stock Compensation
In June 2014, the FASB issued ASU No. 2014-12, an amendment to ASC 718, Compensation - Stock Compensation, which clarifies the accounting for performance awards when the terms of the award provide that a performance target could be achieved after the requisite service period. The Company adopted the new guidance in the first quarter of fiscal 2017 and applied the new provisions on a prospective basis, which did not impact its financial position, results of operations or cash flows upon adoption.
Consolidation
In February 2015, the FASB issued ASU No. 2015-02, an amendment to ASC 810, Consolidation, which changes the consolidation analysis required under GAAP and reevaluates whether limited partnerships and similar entities must be consolidated. The Company adopted the new guidance in the first quarter of fiscal 2017 and applied the new provisions on a full retrospective basis, which did not impact its financial position, results of operations or cash flows upon adoption.
Interest
In April 2015, the FASB issued ASU No. 2015-03, an amendment to ASC 835, Interest - Imputation of Interest, which simplifies the presentation of debt issuance costs by requiring them to be presented on the balance sheet as a deduction from the carrying amount of the liability. The amendment does not affect the recognition and measurement guidance for debt issuance costs. In August 2015, the FASB issued ASU No. 2015-15, which clarified that the amendment contained within ASU No. 2015-03 does not require companies to modify their accounting for costs incurred in obtaining revolving credit facilities. The Company adopted the new guidance in the first quarter of fiscal 2017 and applied the new provisions on a full retrospective basis.
In addition, the following amounts on the Consolidated Balance Sheets have been adjusted, retrospectively, as of September 30, 2016.
(Thousands) | As Previously Reported | Effect of Change | As Adjusted | ||||||||
Assets | |||||||||||
Other noncurrent assets | $ | 68,708 | $ | (8,512 | ) | $ | 60,196 | ||||
Total noncurrent assets | $ | 712,166 | $ | (8,512 | ) | $ | 703,654 | ||||
Total assets | $ | 3,727,082 | $ | (8,512 | ) | $ | 3,718,570 | ||||
Capitalization and Liabilities | |||||||||||
Long-term debt | $ | 1,063,550 | $ | (8,512 | ) | $ | 1,055,038 | ||||
Total capitalization | $ | 2,230,141 | $ | (8,512 | ) | $ | 2,221,629 | ||||
Total capitalization and liabilities | $ | 3,727,082 | $ | (8,512 | ) | $ | 3,718,570 | ||||
Intangibles
In April 2015, the FASB issued ASU No. 2015-05, an amendment to ASC 350, Intangibles - Goodwill and Other - Internal-Use Software, which clarifies the accounting for fees in a cloud computing arrangement. The amendment provides guidance on how an entity should evaluate the accounting for fees paid in a cloud computing arrangement to determine whether an arrangement includes the sale or license of software. The Company adopted the new guidance in the first quarter of fiscal 2017 and applied the new provisions on a prospective basis, which did not impact its financial position, results of operations or cash flows upon adoption.
Other Recent Updates to the Accounting Standards Codification
Revenue
In May 2014, the FASB issued ASU No. 2014-09, and added Topic 606, Revenue from Contracts with Customers, to the ASC. ASC 606 supersedes ASC 605, Revenue Recognition, as well as most industry-specific guidance, and prescribes a single, comprehensive revenue recognition model designed to improve financial reporting comparability across entities, industries, jurisdictions and capital markets. In August 2015, the FASB issued ASU No. 2015-14, which defers the implementation of the new guidance for one year. The new guidance will not be early adopted and will be effective for the Company’s fiscal year ending September 30, 2019, and interim periods within that year. The Company continues to evaluate the provisions of ASC 606; however, based on the review of customer contracts to date, it is not anticipating a material impact to its financial position, results of operations
Page 87
New Jersey Resources Corporation
Part II
ITEM 8. FINANCIAL STATEMENTS AND SUPPLEMENTARY DATA (Continued)
or cash flows upon adoption. The Company anticipates significant new disclosures as a result of the new standard and expects to transition to the new guidance using the modified retrospective approach. The Company is also monitoring industry specific developments that may have an impact on its financial position, results of operation and cash flows.
Inventory
In July 2015, the FASB issued ASU No. 2015-11, an amendment to ASC 330, Inventory, which requires entities to measure most inventory “at the lower of cost or net realizable value,” thereby simplifying the current guidance under which an entity must measure inventory at the lower of cost or market. The guidance is effective for the Company’s fiscal year ending September 30, 2018, and interim periods within that year. Upon adoption, the amendment will be applied on a prospective basis. The Company does not expect any impact on its financial position, results of operations and cash flows upon adoption.
Financial Instruments
In January 2016, the FASB issued ASU No. 2016-01, an amendment to ASC 825, Financial Instruments, to address certain aspects of the recognition, measurement, presentation and disclosure of financial instruments. The standard affects investments in equity securities that do not result in consolidation and are not accounted for under the equity method and the presentation of certain fair value changes for financial liabilities measured at fair value. It also simplifies the impairment assessment of equity investments without a readily determinable fair value by requiring a qualitative assessment. The guidance is effective for the Company’s fiscal year ending September 30, 2019, and interim periods within that year. Upon adoption, the amendment will be applied on a modified retrospective basis. The Company evaluated the amendment and noted that, upon adoption, subsequent changes to the fair value of the Company’s available for sale securities will be recorded in the Consolidated Statement of Operations as opposed to other comprehensive income. The Company does not expect any other material impacts to its financial position, results of operations or cash flows upon adoption.
In June 2016, the FASB issued ASU No. 2016-13, an amendment to ASC 326, Financial Instruments - Credit Losses, which changes the impairment model for certain financial assets that have a contractual right to receive cash, including trade and loan receivables. The new model requires recognition based upon an estimation of expected credit losses rather than recognition of losses when it is probable that they have been incurred. The guidance is effective for the Company’s fiscal year ending September 30, 2021, and interim periods within that year, with early adoption permitted. The Company is currently evaluating the amendment to understand the impact on its financial position, results of operations and cash flows upon adoption and will apply the new guidance to its trade and loan receivables on a modified retrospective basis.
Leases
In February 2016, the FASB issued ASU No. 2016-02, an amendment to ASC 842, Leases, which provides for a comprehensive overhaul of the lease accounting model and changes the definition of a lease within the accounting literature. Under the new standard, all leases with a term greater than one year will be recorded on the balance sheet. Amortization of the related asset will be accounted for using one of two approaches prescribed by the guidance. Additional disclosures will be required to allow the user to assess the amount, timing and uncertainty of cash flows arising from leasing activities. A modified retrospective transition approach is required for leases existing at the time of adoption. The guidance is effective for the Company’s fiscal year ending September 30, 2020, and interim periods within that year, with early adoption permitted. The Company continues to evaluate the provisions of ASC 842 and is actively monitoring industry specific developments including the exposure draft issued by the FASB that would introduce a land easement practical expedient to ASC 842. At this time the Company does not plan to early adopt the new guidance and expects to elect the practical expedient package in the new guidance during transition.
Statement of Cash Flows
In August 2016, the FASB issued ASU No. 2016-15, an amendment to ASC 230, Statement of Cash Flows, which addresses eight specific cash flow issues for which there has been diversity in practice. The guidance is effective for the Company’s fiscal year ending September 30, 2019, and interim periods within that year with early adoption permitted. Upon adoption, the amendment will be applied on a retrospective basis. The Company does not expect any material impacts to its cash flows upon adoption.
In November 2016, the FASB issued ASU No. 2016-18, an amendment to ASC 230, Statement of Cash Flows, which requires that any amounts that are deemed to be restricted cash or restricted cash-equivalents be included in cash and cash-equivalent balances on the cash flow statement and, therefore, transfers between cash and restricted cash accounts will no longer be recognized within the statement of cash flows. The guidance is effective for the Company’s fiscal year ending September 30, 2019, with early adoption permitted. Upon adoption, the amendment will be applied on a retrospective basis. Based on the Company's historical
Page 88
New Jersey Resources Corporation
Part II
ITEM 8. FINANCIAL STATEMENTS AND SUPPLEMENTARY DATA (Continued)
restricted cash balances, it does not expect any material impacts to its financial position, results of operations or cash flows upon adoption.
Business Combinations
In January 2017, the FASB issued ASU No. 2017-01, an amendment to ASC 805, Business Combinations, clarifying the definition of a business in the ASC, which is intended to reduce the complexity surrounding the assessment of a transaction as an asset acquisition or business combination. The amendment provides an initial fair value screen to reduce the number of transactions that would fit the definition of a business, and when the screen threshold is not met, provides an updated model that further clarifies the characteristics of a business. The guidance is effective for the Company’s fiscal year ending September 30, 2019, and interim periods within that year, with early adoption permitted. Upon adoption, the amendment will be applied on a prospective basis. The amendment could potentially have material impacts on future transactions that the Company may enter into by altering the Company’s conclusion on what accounting to apply to acquisitions.
Gains and Losses from the Derecognition of Nonfinancial Assets
In February 2017, the FASB issued ASU No. 2017-05, an amendment to ASC 610-20, Other Income - Gains and Losses from the Derecognition of Nonfinancial Assets, which clarifies the scope and accounting related to the derecognition of nonfinancial assets, including partial sales and contributions of nonfinancial assets to a joint venture or other non-controlled investee. The guidance is effective concurrently with ASC 606, which is effective for the Company’s fiscal year ending September 30, 2019, and interim periods within that year with early adoption permitted. ASU No. 2017-05 may be applied retrospectively for all periods presented or retrospectively with a cumulative-effect adjustment at the date of adoption. The Company has determined that to the extent a deferred gain exists related to nonfinancial assets on the balance sheet upon adoption, it would be recognized under the new accounting guidance as a cumulative effect adjustment to the opening balance of retained earnings for the earliest period presented.
Compensation - Retirement Benefits
In March 2017, the FASB issued ASU No. 2017-07, an amendment to ASC 715, Compensation - Retirement Benefits, which changes the presentation of net periodic benefit cost on the income statement by requiring companies to present all components of net periodic benefit cost, other than service cost, outside a subtotal of income from operations. The amendment also states that only the service cost component of net periodic benefits costs is eligible for capitalization, when applicable. The guidance is effective for the Company’s fiscal year ending September 30, 2019, and interim periods within that year, with early adoption permitted. Upon adoption, the amendment will be applied on a retrospective basis for presentation and changes to capitalization of costs will be applied on a prospective basis. The Company is continuing to evaluate the amendment to fully understand the impact on its financial position, results of operations and cash flows upon adoption. The Company is also monitoring industry specific developments on the new guidance to determine the appropriate treatment of these changes in a rate regulated environment.
Stock Compensation
In May 2017, the FASB issued ASU No. 2017-09, an amendment to ASC 718, Compensation - Stock Compensation, which clarifies the accounting for changes to the terms or conditions of share-based payments. The guidance is effective for the Company’s fiscal year ending September 30, 2019, and interim periods within that year, with early adoption permitted. Upon adoption, the amendments will be applied prospectively to awards modified on or after the adoption date. The Company is currently evaluating the amendments to understand the impact on its financial position, results of operations and cash flows upon adoption.
Derivatives and Hedging
In August 2017, the FASB issued ASU No. 2017-12, an amendment to ASC 815, Derivatives and Hedging, which is intended to make targeted improvements to the accounting for hedging activities by better aligning an entity’s risk management activities and financial reporting for hedging relationships. These amendments modify the accounting for both nonfinancial and financial risk components and align the recognition and presentation of the effects of the hedging instrument and the hedged item in the financial statements. Additionally, the amendments are intended to simplify the application of the hedge accounting guidance and provide relief to companies by easing certain hedge documentation requirements. The guidance is effective for the Company’s fiscal year ending September 30, 2020, and interim periods within that year, with early adoption permitted. Upon adoption, the transition requirements and elections will be applied to hedging relationships existing on the date of adoption. The Company does not currently apply hedge accounting to any of its risk management activities and thus does not expect the amendments to have any impact on its financial position, results of operations and cash flows upon adoption.
Page 89
New Jersey Resources Corporation
Part II
ITEM 8. FINANCIAL STATEMENTS AND SUPPLEMENTARY DATA (Continued)
3. ACQUISITION
On July 27, 2017, NJR, through its wholly owned subsidiary NJRRS, signed an asset purchase agreement with Talen to acquire certain of their retail and wholesale natural gas energy contract assets. The acquisition included sales agreements with large commercial and industrial retail customers, pipeline and storage capacity agreements on various pipelines, and various wholesale transportation contracts. The final purchase price totaled $55.7 million upon satisfaction of certain conditions as set forth in the asset purchase agreement.
The following table summarizes the purchase price allocation for the fair value of the assets acquired and liabilities assumed as of July 27, 2017:
(Thousands) | Estimated Fair Value | ||
Total purchase price consideration transferred | $ | 55,661 | |
Identifiable assets acquired | |||
Wholesale energy contracts (1) | $ | 41,846 | |
Retail energy contracts (2) | 13,815 | ||
Net assets acquired | $ | 55,661 | |
(1) | Wholesale energy contracts are presented within Intangible assets, net on the Consolidated Balance Sheets. |
(2) | Retail energy contracts are presented within the Derivatives, at fair value line items on the Consolidated Balance Sheets. |
The purchase price equaled the estimated fair value of the net assets acquired and, therefore, no goodwill or bargain purchase was recorded as of September 30, 2017. Identifiable assets were recorded at their estimated fair value as determined by management and were based upon significant estimates and assumptions that are judgmental in nature, including the projected amount and timing of future cash flows, a discount rate reflecting risk inherent in the future cash flows and future natural gas prices. During fiscal 2017, the Company incurred approximately $300,000 in acquisition related transaction costs, which are recorded in operations and maintenance expense on the Consolidated Statements of Operations.
The useful lives of the acquired assets are based upon the terms of the contractual arrangements. The acquired wholesale energy contracts have useful lives ranging from 1 to 9 years, and the acquired retail energy contracts have useful lives ranging from 0 to 4 years. The acquisition date fair value of the wholesale contracts is presented as an intangible asset on the Consolidated Balance Sheet and is amortized based upon the pattern of expected future cash flows. The related amortization expense totaled $762,000 during fiscal 2017, and is included in gas purchases on the Consolidated Statements of Operations. The acquired retail contracts consist of natural gas physical forward sales agreements and therefore are subsequently measured and accounted for in accordance with ASC 815, Derivatives and Hedging. Accordingly, the acquisition date fair value of the retail contracts is presented within the Derivatives, at fair value line items on the Consolidated Balance Sheets and is relieved in subsequent periods as the underlying physical forward contracts settle. During fiscal 2017, operating revenues of approximately $20.5 million, and operating income of approximately $281,000 attributable to the acquisition are included in the Consolidated Statements of Operations.
As the assets were acquired from a non-public company that did not prepare financial information for the specific assets involved in the transaction, historical financial information was impracticable to obtain. As a result, pro forma results for the acquired assets are not presented.
4. REGULATION
The EDECA is the legal framework for New Jersey’s public utility and wholesale energy landscape. NJNG is required, pursuant to a written order by the BPU under EDECA, to open its residential markets to competition from third-party natural gas suppliers. Customers can choose the supplier of their natural gas commodity in NJNG’s service territory.
As required by EDECA, NJNG’s rates are segregated into two primary components the commodity portion, which represents the wholesale cost of natural gas, including the cost for interstate pipeline capacity to transport the gas to NJNG’s service territory, and the delivery portion, which represents the transportation of the commodity portion through NJNG’s gas distribution system to the end-use customer. NJNG does not earn utility gross margin on the commodity portion of its natural gas sales. NJNG earns utility gross margin through the delivery of natural gas to its customers, regardless of whether it or a third-party supplier provides the wholesale natural gas commodity.
Page 90
New Jersey Resources Corporation
Part II
ITEM 8. FINANCIAL STATEMENTS AND SUPPLEMENTARY DATA (Continued)
Under EDECA, the BPU is required to audit the state’s energy utilities every two years. The primary purpose of the audit is to ensure that utilities and their affiliates offering unregulated retail services do not have an unfair competitive advantage over nonaffiliated providers of similar retail services. A combined competitive services and management audit of NJNG commenced in August 2013. A draft management audit report was accepted by the BPU on July 23, 2014, for public comment. To date, NJNG has implemented all audit recommendations with the approval of BPU staff and is waiting for final BPU approval.
NJNG is subject to cost-based regulation, therefore, it is permitted to recover authorized operating expenses and earn a reasonable return on its utility capital investments based on the BPU’s approval. The impact of the ratemaking process and decisions authorized by the BPU allows NJNG to capitalize or defer certain costs that are expected to be recovered from its customers as regulatory assets, and to recognize certain obligations representing amounts that are probable future expenditures as regulatory liabilities in accordance with accounting guidance applicable to regulated operations.
NJNG’s recovery of costs is facilitated through its base rates, BGSS and other regulatory tariff riders. NJNG is required to make an annual filing to the BPU by June 1 of each year for review of its BGSS, CIP and other programs and related rates. Annual rate changes are requested to be effective at the beginning of the following fiscal year. In addition, NJNG is permitted to request approval of certain rate or program changes on an interim basis. All rate and program changes are subject to proper notification and BPU review and approval.
In September 2016, the BPU approved NJNG's base rate case, effective October 2016, which included an increase in base rates in the amount of $45 million. The base rate increase includes a return on common equity of 9.75 percent, a common equity ratio of 52.5 percent and a depreciation rate of 2.4 percent. The approval also included the rate mechanism and five-year extension of SAFE II, rate recovery of NJ RISE capital investment costs through June 30, 2016, recovery of NJNG’s SAFE I, NGV and LNG capital investments and recovery of other costs previously deferred in regulatory assets.
Regulatory assets and liabilities included on the Consolidated Balance Sheets as of September 30, are comprised of the following:
(Thousands) | 2017 | 2016 | ||||
Regulatory assets-current | ||||||
Conservation Incentive Program | $ | 17,669 | $ | 36,957 | ||
New Jersey Clean Energy Program | 14,202 | 14,232 | ||||
Underrecovered gas costs | 9,910 | — | ||||
Derivatives at fair value, net | 9,010 | 3,097 | ||||
Total current regulatory assets | $ | 50,791 | $ | 54,286 | ||
Regulatory assets-noncurrent | ||||||
Environmental remediation costs: | ||||||
Expended, net of recoveries | $ | 28,547 | $ | 19,595 | ||
Liability for future expenditures | 149,000 | 172,000 | ||||
Deferred income taxes | 21,795 | 20,273 | ||||
Derivatives at fair value, net | — | 23,384 | ||||
SAVEGREEN | 16,302 | 25,208 | ||||
Postemployment and other benefit costs | 141,433 | 157,027 | ||||
Deferred Superstorm Sandy costs | 13,030 | 15,201 | ||||
Other noncurrent regulatory assets | 5,812 | 8,606 | ||||
Total noncurrent regulatory assets | $ | 375,919 | $ | 441,294 | ||
Regulatory liability-current | ||||||
Derivatives at fair value, net | 78 | — | ||||
Overrecovered gas costs | — | 9,469 | ||||
Total current regulatory liabilities | $ | 78 | $ | 9,469 | ||
Regulatory liabilities-noncurrent | ||||||
Cost of removal obligation | $ | 7,902 | $ | 30,549 | ||
New Jersey Clean Energy Program | 5,795 | 10,657 | ||||
Other noncurrent regulatory liabilities | 664 | 205 | ||||
Derivatives at fair value, net | 146 | — | ||||
Total noncurrent regulatory liabilities | $ | 14,507 | $ | 41,411 | ||
Page 91
New Jersey Resources Corporation
Part II
ITEM 8. FINANCIAL STATEMENTS AND SUPPLEMENTARY DATA (Continued)
Recovery of regulatory assets is subject to BPU approval, and therefore, if there are any changes in regulatory positions that indicate recovery is not probable, the related cost would be charged to income in the period of such determination. The BPU’s decision and order approving NJNG’s new base rates resulted in no changes to the recovery of NJNG’s regulatory assets.
Conservation Incentive Program
The CIP permits NJNG to recover utility gross margin variations related to customer usage resulting from customer conservation efforts and mitigates the impact of weather on its gross margin. Such utility gross margin variations are recovered in the year following the end of the CIP usage year, without interest, and are subject to additional conditions, including an earnings test, a revenue test and an evaluation of BGSS related savings. This program has no expiration date.
New Jersey Clean Energy Program
The NJCEP is a statewide program that encourages energy efficiency and renewable energy. Funding amounts are determined by the BPU’s Office of Clean Energy and all New Jersey utilities are required to share in the annual funding obligation. The current NJCEP program is for the State of New Jersey’s fiscal year ending June 2018. NJNG recovers the costs associated with its portion of the NJCEP obligation through its NJCEP rider.
Derivatives
Derivatives are utilized by NJNG to manage the price risk associated with its natural gas purchasing activities and to participate in certain BGSS incentive programs. The gains and losses associated with NJNG’s derivatives are recoverable through its BGSS, as noted above, without interest. See Note 5. Derivative Instruments.
Environmental Remediation Costs
NJNG is responsible for the cleanup of certain former gas manufacturing facilities. Actual expenditures are recovered from customers, with interest, over seven year rolling periods, through a RAC rate rider. Recovery for NJNG’s estimated future liability will be requested and/or recovered when actual expenditures are incurred. See Note 14. Commitments and Contingent Liabilities.
Deferred Income Taxes
In 1993, NJNG adopted the provisions of ASC 740, Income Taxes, which changed the method used to determine deferred tax assets and liabilities. Upon adoption, NJNG recognized a transition adjustment and corresponding regulatory asset representing the difference between NJNG’s existing deferred tax amounts compared with the deferred tax amounts calculated in accordance with the change in method prescribed by ASC 740. NJNG recovers the regulatory asset associated with these tax impacts through future base rates, without interest.
SAVEGREEN
NJNG administers certain programs that supplement the state’s NJCEP and that allow NJNG to promote clean energy to its residential and commercial customers, as described further below. NJNG will recover related expenditures and a weighted average cost of capital on the unamortized balance through a tariff rider, as approved by the BPU, over a two to 10-year period depending upon the specific program incentive.
Postemployment and Other Benefit Costs
Postemployment and Other Benefit Costs represents NJNG’s underfunded postemployment benefit obligations that the Company began recognizing in fiscal 2006, as a result of changes in the accounting provisions of ASC 715, Compensation and Benefits, as well as a $2.4 million fiscal 2010 tax charge resulting from a change in the deductibility of federal subsidies associated with Medicare Part D, both of which are deferred as regulatory assets and are recoverable, without interest, in base rates. In the September 2016 base rate case decision and order, the BPU approved the recovery of the tax charge over a seven-year amortization period. See Note 11. Employee Benefit Plans.
Page 92
New Jersey Resources Corporation
Part II
ITEM 8. FINANCIAL STATEMENTS AND SUPPLEMENTARY DATA (Continued)
Deferred Superstorm Sandy Costs
In October 2012, portions of NJNG’s distribution system incurred significant damage as a result of Superstorm Sandy. NJNG filed a petition with the BPU in November 2012 requesting deferred accounting for uninsured incremental O&M costs associated with its restoration efforts, which was approved in May 2013. In October 2014, the BPU approved, as prudent and reasonable, the deferred O&M storm costs. The deferred Superstorm Sandy costs were approved for recovery through NJNG’s new base rates effective October 2016, over a seven-year amortization period.
Other Regulatory Assets
Other regulatory assets consists primarily of deferred costs associated with certain components of NJNG’s SBC, as discussed further below, and NJNG’s compliance with federal and state mandated PIM provisions. NJNG’s related costs to maintain the operational integrity of its distribution and transmission main are recoverable, subject to BPU review and approval. Through September 30, 2016, NJNG was limited to recording a regulatory asset associated with PIM that did not exceed $700,000 per year. In addition, to the extent that project costs were lower than the approved PIM annual expense of $1.4 million, NJNG recorded a regulatory liability to be refunded as a credit to customers’ gas costs when the net cumulative liability exceeded $1 million. As of September 30, 2017, NJNG recorded $3.8 million of PIM in other regulatory assets. The deferred PIM costs were approved for recovery through NJNG’s new base rates effective October 2016, over a seven-year amortization period. As of October 1, 2016, NJNG will no longer defer costs associated with PIM.
Over and Underrecovered Gas Costs
NJNG recovers its cost of gas through the BGSS rate component of its customers’ bills. NJNG’s cost of gas includes the purchased cost of the natural gas commodity, fees paid to pipelines and storage facilities, adjustments as a result of BGSS incentive programs and hedging transactions. Overrecovered gas costs represent a regulatory liability that generally occurs when NJNG’s BGSS rates are higher than actual costs and requests approval to be returned to customers including interest, when applicable, in accordance with NJNG’s approved BGSS tariff. Conversely, underrecovered gas costs generally occur during periods when NJNG’s BGSS rates are lower than actual costs, in which case NJNG records a regulatory asset and requests amounts to be recovered from customers in the future.
Cost of Removal Obligation
NJNG accrues and collects for cost of removal in base rates on its utility property, without interest. NJNG’s regulatory liability represents customer collections in excess of actual expenditures, which the Company will return to customers as a reduction to depreciation expense until it is depleted.
The following is a description of certain regulatory proceedings during fiscal 2016 and 2017:
BGSS and CIP
BGSS rates are normally revised on an annual basis. In addition, to manage the fluctuations in wholesale natural gas costs, NJNG has the ability to make two interim filings during each fiscal year to increase residential and small commercial customer BGSS rates on a self-implementing and provisional basis. NJNG is also permitted to refund or credit back a portion of the commodity costs to customers at any time given five days notice when the natural gas commodity costs decrease in comparison to amounts projected or to amounts previously collected from customers. Concurrent with the annual BGSS filing, NJNG files for an annual review of its CIP. NJNG’s annual BGSS and CIP filings are summarized as follows:
• | June 2015 BGSS/CIP filing — In February 2016, the BPU approved NJNG’s proposal to continue its existing BGSS rate and to increase its CIP rates resulting in a $1.1 million annual recovery increase, effective October 2015. NJNG also provided bill credits to residential and small commercial customers from November 2015 through February 2016, as a result of the decline in the wholesale price of natural gas, which totaled $61.6 million. |
Page 93
New Jersey Resources Corporation
Part II
ITEM 8. FINANCIAL STATEMENTS AND SUPPLEMENTARY DATA (Continued)
• | June 2016 BGSS/CIP filing — In September 2016, the BPU approved NJNG's filing to increase its CIP rates resulting in a $43.9 million annual recovery increase and to decrease its annual BGSS rate for residential and small commercial customers resulting in a $22.6 million annual recovery decrease, effective October 2016. This petition also included proposed bill credits to residential and small commercial customers during the months of November 2016 through February 2017, as a result of a decline in the wholesale price of natural gas. In September 2016, NJNG notified the BPU that the estimated bill credits would be approximately $48 million; however, customer usage was lower due to warmer weather during winter months and therefore, a total of $42 million in bill credits were issued during fiscal 2017. |
• | June 2017 BGSS/CIP filing — On September 22, 2017, the BPU provisionally approved NJNG's petition to maintain its BGSS rate for residential and small commercial customers, increase its balancing charge rate, which will result in a $3.7 million increase to the annual revenues credited to BGSS and decrease its CIP rates, which will result in a $16.2 million annual recovery decrease, effective October 2017. |
BGSS Incentive Programs
NJNG is eligible to receive financial incentives for reducing BGSS costs through a series of utility gross margin-sharing programs that include off-system sales, capacity release, storage incentive programs and the FRM program (through October 2015). The Company is permitted to annually propose a process to evaluate and discuss alternative incentive programs, should performance of the existing incentives or market conditions warrant re-evaluation. In October 2015, the BPU issued an order approving the continuation of the BGSS Incentive Programs with modification to the storage incentive program, beginning with the 2015 storage injection period, and termination of the FRM Program, effective November 2015.
Energy Efficiency Programs
SAVEGREEN conducts home energy audits and provides various grants, incentives and financing alternatives, which are designed to encourage the installation of high efficiency heating and cooling equipment and other energy efficiency upgrades to promote energy efficiency incentives to its residential and commercial customers while stimulating state and local economies through the creation of jobs. Depending on the specific initiative or approval, NJNG recovers costs associated with the programs over a two to 10-year period through a tariff rider mechanism. As of September 30, 2017, the BPU has approved total SAVEGREEN investments of approximately $219.3 million, of which, $149.7 million in grants, rebates and loans have been provided to customers, with a total annual recovery of approximately $20 million. The recovery includes a weighted average cost of capital on the unamortized balance that ranges from 6.69 percent, with a return on equity of 9.75 percent, to 7.76 percent, with a return on equity of 10.3 percent. SAVEGREEN investments and costs are filed with the BPU on an annual basis. In June 2016, the BPU approved NJNG's petition to extend its current program, which was set to expire on July 31, 2017, to December 31, 2018. In October 2016, the BPU approved NJNG's filing to maintain its existing recovery rate. On October 20, 2017, the BPU approved NJNG's filing to decrease its EE recovery rate, which will result in an annual decrease of $3.9 million, effective November 1, 2017.
Societal Benefits Clause
The SBC is comprised of three primary riders that allow NJNG to recover costs associated with USF, which is a permanent statewide program for all natural gas and electric utilities for the benefit of income-eligible customers, MGP remediation and the NJCEP. NJNG has submitted the following filings to the BPU, which include a report of program expenditures incurred each program year:
• | 2015 SBC filings — In September 2015, the BPU approved the annual USF compliance filing decreasing the statewide USF rate, resulting in an annual $3.9 million decrease to USF recoveries, effective October 2015. In June 2016, the BPU approved NJNG's additional filing to recover remediation expenses incurred through June 30, 2015, increase the RAC with an annual recovery of $9.4 million and to decrease the NJCEP factor, effective July 9, 2016. |
• | 2016 SBC filing — In September 2016, the BPU approved NJNG's annual USF compliance filing proposing to increase the statewide USF rate, resulting in a $1.3 million annual increase in USF recoveries, effective October 2016. |
• | 2017 SBC filing — On September 22, 2017, the BPU approved NJNG's annual USF compliance filing to decrease the statewide USF rate, which will result in a $2.6 million annual decrease, effective October 1, 2017. On November 17, 2017, NJNG filed it's annual SBC application requesting to recover remediation expenses incurred through June 30, 2017, a reduction in the RAC, which will decrease the annual recovery to $7 million and to increase the NJCEP factor, effective April 1, 2018. |
Page 94
New Jersey Resources Corporation
Part II
ITEM 8. FINANCIAL STATEMENTS AND SUPPLEMENTARY DATA (Continued)
Infrastructure Programs
NJNG has significant annual capital expenditures associated with the management of its natural gas distribution and transmission system, including new utility plant for customer growth and its associated PIM and infrastructure programs. NJNG continues to implement BPU-approved infrastructure projects that are designed to enhance the reliability of NJNG’s gas distribution system, including SAFE and NJ RISE.
SAFE/NJ RISE
In October 2012, the BPU approved NJNG’s petition to implement SAFE I, investing up to $130 million, exclusive of AFUDC, over a four-year period to replace portions of NJNG’s gas distribution unprotected steel, cast iron infrastructure and associated services to improve the safety and reliability of the gas distribution system.
The recovery of SAFE I capital investments and the rate mechanism and five-year extension of SAFE II were approved through NJNG’s base rate case, effective October 2016. The estimated cost for SAFE II is approximately $200 million, excluding AFUDC and related costs to be recovered are approximately $157.5 million. As a condition of approval of the extension, NJNG is required to file a base rate case no later than November 2019.
In July 2014, the BPU approved NJ RISE, which consists of six capital investment projects estimated to cost $102.5 million over a five-year period, excluding AFUDC, for gas distribution storm hardening and mitigation projects, along with incremental depreciation expense. In October 2015, the BPU approved a base rate increase to recover capital costs through July 2015, resulting in a $390,000 annual recovery increase, effective November 2015, and earned a weighted average cost of capital of 6.74 percent, including a return on equity of 9.75 percent.
NJ RISE investments through June 30, 2016, were approved for recovery through NJNG’s new base rates, effective October 2016. Requests for recovery of future NJ RISE capital costs will occur in conjunction with SAFE II, commencing with the rate recovery filing that was submitted in March 2017, with a weighted cost of capital of 6.9 percent, including a return on equity of 9.75 percent.
On March 30, 2017, NJNG filed its annual petition with the BPU requesting a base rate increase for the recovery of NJ RISE and SAFE II capital investment costs related to the period ending June 30, 2017, based on estimates, pursuant to the September 2016 base rate case. On July 20, 2017, NJNG filed an update to this petition with actuals, requesting a $4.1 million annual increase in recoveries, which was approved by the BPU, effective October 1, 2017.
NGV refueling stations
In June 2012, the BPU approved a pilot program for NJNG to invest up to $10 million to build NGV refueling stations. NJNG has opened all three of its NGV stations to the public and its capital investments were approved for recovery through the new base rates, effective October 2016.
SRL
The SRL is an approximate 30-mile, 30-inch transmission main designed to support improved system integrity and reliability in the southern portion of NJNG’s service territory, estimated to cost between $180 million and $200 million. In January 2016, the BPU issued an order approving NJNG’s modified proposed SRL pipeline installation, operation and route selection. In March 2016, the BPU issued an order designating the SRL route and exempting the SRL from municipal land use ordinances, regulations, permits and license requirements. In February 2017, the New Jersey Department of Environmental Protection issued a permit authorizing construction of the SRL within the jurisdiction of the Coastal Area Facility Review Act as well as a Freshwater Wetlands permit. On September 14, 2017, the NJ Pinelands Commission approved construction of NJNG’s SRL. All approvals and permits have been appealed by third parties.
Page 95
New Jersey Resources Corporation
Part II
ITEM 8. FINANCIAL STATEMENTS AND SUPPLEMENTARY DATA (Continued)
Other Regulatory Initiatives
In May 2016, NJNG included a proposal in its base rate case to recover certain capital costs and incremental operation and maintenance costs related to a March 2016 BPU Order regarding new cyber security requirements. In June 2016, NJNG’s liquefaction project became operational, allowing NJNG to convert natural gas into LNG and to fill NJNG’s existing LNG storage tanks. Costs for this project along with other plant upgrades were approximately $36.5 million. Costs associated with both initiatives were approved for recovery through NJNG’s new base rates, effective October 2016.
5. DERIVATIVE INSTRUMENTS
The Company is subject to commodity price risk due to fluctuations in the market price of natural gas, SRECs and electricity. To manage this risk, the Company enters into a variety of derivative instruments including, but not limited to, futures contracts, physical forward contracts, financial options and swaps to economically hedge the commodity price risk associated with its existing and anticipated commitments to purchase and sell natural gas, SRECs and electricity. In addition, the Company may utilize foreign currency derivatives to hedge Canadian dollar denominated gas purchases and/or sales. Therefore, the Company’s primary underlying risks include commodity prices, interest rates and foreign currency. These contracts, with a few exceptions as described below, are accounted for as derivatives. Accordingly, all of the financial and certain of the Company’s physical derivative instruments are recorded at fair value on the Consolidated Balance Sheets. For a more detailed discussion of the Company’s fair value measurement policies and level disclosures associated with the Company’s derivative instruments, see Note 6. Fair Value.
Energy Services
Energy Services chooses not to designate its financial commodity and physical forward commodity derivatives as accounting hedges or to elect NPNS, and therefore changes in the fair value of these derivatives are recorded as a component of gas purchases or operating revenues, as appropriate for Energy Services, on the Consolidated Statements of Operations as unrealized gains or (losses). For Energy Services at settlement, realized gains and (losses) on all financial derivative instruments are recognized as a component of gas purchases and realized gains and (losses) on all physical derivatives follow the presentation of the related unrealized gains and (losses) as a component of either gas purchases or operating revenues.
Energy Services also enters into natural gas transactions in Canada and, consequently, is exposed to fluctuations in the value of Canadian currency relative to the U.S. dollar. Energy Services may utilize foreign currency derivatives to lock in the exchange rate associated with natural gas transactions denominated in Canadian currency. The derivatives may include currency forwards, futures, or swaps and are accounted for as derivatives. These derivatives are typically used to hedge demand fee payments on pipeline capacity, storage and gas purchase agreements. For transactions occurring on or before December 31, 2015, Energy Services designates its foreign exchange contracts as cash flow hedges, and the effective portion of the hedges are recorded in OCI. Effective January 1, 2016, on a prospective basis, the Company has elected not to designate its foreign currency derivatives as accounting hedges. Accordingly, changes in the fair value of foreign exchange contracts entered into from January 1, 2016, are recognized in gas purchases on the Consolidated Statements of Operations.
As a result of Energy Services entering into transactions to borrow natural gas, commonly referred to as “park and loans,” an embedded derivative is recognized relating to differences between the fair value of the amount borrowed and the fair value of the amount that will ultimately be repaid, based on changes in the forward price for natural gas prices at the borrowed location over the contract term. This embedded derivative is accounted for as a forward sale in the month in which the repayment of the borrowed gas is expected to occur, and is considered a derivative transaction that is recorded at fair value on the Consolidated Balance Sheets, with changes in value recognized in current period earnings.
Expected production of SRECs is hedged through the use of forward and futures contracts. All contracts require the Company to physically deliver SRECs through the transfer of certificates as per contractual settlement schedules. For transactions occurring on or before December 31, 2015, the Company elected NPNS accounting treatment on SREC forward and futures contracts. Effective January 1, 2016, on a prospective basis, Energy Services no longer elects NPNS accounting treatment on SREC contracts entered into from January 1, 2016, and recognizes changes in the fair value of these derivatives as a component of operating revenues. Upon settlement of the contract, the related revenue is recognized when the SREC is transferred to the counterparty. NPNS is a contract-by-contract election and, where it makes sense to do so, we can and may elect certain contracts to be normal.
Page 96
New Jersey Resources Corporation
Part II
ITEM 8. FINANCIAL STATEMENTS AND SUPPLEMENTARY DATA (Continued)
Natural Gas Distribution
Changes in fair value of NJNG’s financial commodity derivatives are recorded as a component of regulatory assets or liabilities on the Consolidated Balance Sheets. The Company elects NPNS accounting treatment on all physical commodity contracts that NJNG entered into on or before December 31, 2015, and accounts for these contracts on an accrual basis. Accordingly, physical natural gas purchases are recognized in regulatory assets or liabilities on the Consolidated Balance Sheets when the contract settles and the natural gas is delivered. The average cost of natural gas is amortized in current period earnings based on the current BPU BGSS factor and therm sales. Effective January 1, 2016, on a prospective basis, NJNG no longer elects NPNS accounting treatment on all of its physical commodity contracts entered into from January 1, 2016. However, since NPNS is a contract-by-contract election, where it makes sense to do so, we can and may elect certain contracts to be normal. Because NJNG recovers these amounts through future BGSS rates as increases or decreases to the cost of natural gas in NJNG’s tariff for gas service, the changes in fair value of these contracts are deferred as a component of regulatory assets or liabilities on the Consolidated Balance Sheets.
In an April 2014 BPU Order, NJNG received regulatory approval to enter into interest rate risk management transactions related to long-term debt securities. On June 1, 2015, NJNG entered into a treasury lock transaction to fix a benchmark treasury rate of 3.26 percent associated with a forecasted $125 million debt issuance expected in May 2018. This forecasted debt issuance coincides with the maturity of NJNG’s existing $125 million, 5.6 percent notes due May 15, 2018. The change in fair value of NJNG’s treasury lock agreement is recorded as a component of regulatory assets or liabilities on the Consolidated Balance Sheets since NJNG believes that the market value upon settlement will be recovered in future rates. Upon settlement, any gain or loss will be amortized into earnings over the life of the future underlying debt issuance.
Fair Value of Derivatives
The following table reflects the fair value of the Company’s derivative assets and liabilities recognized on the Consolidated Balance Sheets as of September 30:
Fair Value | |||||||||||||||||
2017 | 2016 | ||||||||||||||||
(Thousands) | Balance Sheet Location | Asset Derivatives | Liability Derivatives | Asset Derivatives | Liability Derivatives | ||||||||||||
Derivatives not designated as hedging instruments: | |||||||||||||||||
NJNG: | |||||||||||||||||
Physical commodity contracts | Derivatives - current | $ | 151 | $ | 72 | $ | 235 | $ | 1,154 | ||||||||
Financial commodity contracts | Derivatives - current | — | 1,149 | 805 | 2,979 | ||||||||||||
Derivatives - noncurrent | — | — | 75 | 386 | |||||||||||||
Interest rate contracts | Derivatives - current | — | 8,467 | — | — | ||||||||||||
Interest rate contracts | Derivatives - noncurrent | — | — | — | 23,073 | ||||||||||||
Energy Services: | |||||||||||||||||
Physical commodity contracts | Derivatives - current | 14,588 | 16,589 | 5,994 | 11,660 | ||||||||||||
Derivatives - noncurrent | 7,127 | 8,710 | 3,987 | 1,212 | |||||||||||||
Financial commodity contracts | Derivatives - current | 15,302 | 20,267 | 22,929 | 45,255 | ||||||||||||
Derivatives - noncurrent | 2,033 | 2,620 | 1,165 | 581 | |||||||||||||
Foreign currency contracts | Derivatives - current | 40 | — | 1 | 32 | ||||||||||||
Derivatives - noncurrent | 4 | — | — | — | |||||||||||||
Total fair value of derivatives | $ | 39,245 | $ | 57,874 | $ | 35,191 | $ | 86,332 | |||||||||
Offsetting of Derivatives
The Company transacts under master netting arrangements or equivalent agreements that allow it to offset derivative assets and liabilities with the same counterparty. However, the Company’s policy is to present its derivative assets and liabilities on a gross basis at the contract level unit of account on the Consolidated Balance Sheets.
Page 97
New Jersey Resources Corporation
Part II
ITEM 8. FINANCIAL STATEMENTS AND SUPPLEMENTARY DATA (Continued)
The following table summarizes the reported gross amounts, the amounts that the Company has the right to offset but elects not to, financial collateral, as well as the net amounts the Company could present on the Consolidated Balance Sheets but elects not to.
(Thousands) | Amounts Presented in Balance Sheets (1) | Offsetting Derivative Instruments (2) | Financial Collateral Received/Pledged (3) | Net Amounts (4) | ||||||||||||
As of September 30, 2017: | ||||||||||||||||
Derivative assets: | ||||||||||||||||
Energy Services | ||||||||||||||||
Physical commodity contracts | $ | 21,715 | $ | (2,173 | ) | $ | (200 | ) | $ | 19,342 | ||||||
Financial commodity contracts | 17,335 | (14,121 | ) | — | 3,214 | |||||||||||
Foreign currency contracts | 44 | — | — | 44 | ||||||||||||
Total Energy Services | $ | 39,094 | $ | (16,294 | ) | $ | (200 | ) | $ | 22,600 | ||||||
NJNG | ||||||||||||||||
Physical commodity contracts | $ | 151 | $ | (20 | ) | $ | — | $ | 131 | |||||||
Financial commodity contracts | — | — | — | — | ||||||||||||
Interest rate contracts | — | — | — | — | ||||||||||||
Total NJNG | $ | 151 | $ | (20 | ) | $ | — | $ | 131 | |||||||
Derivative liabilities: | ||||||||||||||||
Energy Services | ||||||||||||||||
Physical commodity contracts | $ | 25,299 | $ | (2,173 | ) | $ | — | $ | 23,126 | |||||||
Financial commodity contracts | 22,887 | (14,121 | ) | (8,766 | ) | — | ||||||||||
Foreign currency contracts | — | — | — | — | ||||||||||||
Total Energy Services | $ | 48,186 | $ | (16,294 | ) | $ | (8,766 | ) | $ | 23,126 | ||||||
NJNG | ||||||||||||||||
Physical commodity contracts | $ | 72 | $ | (20 | ) | $ | — | $ | 52 | |||||||
Financial commodity contracts | 1,149 | — | (1,149 | ) | — | |||||||||||
Interest rate contracts | 8,467 | — | — | 8,467 | ||||||||||||
Total NJNG | $ | 9,688 | $ | (20 | ) | $ | (1,149 | ) | $ | 8,519 | ||||||
As of September 30, 2016: | ||||||||||||||||
Derivative assets: | ||||||||||||||||
Energy Services | ||||||||||||||||
Physical commodity contracts | $ | 9,981 | $ | (2,837 | ) | $ | (755 | ) | $ | 6,389 | ||||||
Financial commodity contracts | 24,094 | (17,945 | ) | (6,149 | ) | — | ||||||||||
Foreign currency contracts | 1 | (1 | ) | — | — | |||||||||||
Total Energy Services | $ | 34,076 | $ | (20,783 | ) | $ | (6,904 | ) | $ | 6,389 | ||||||
NJNG | ||||||||||||||||
Physical commodity contracts | $ | 235 | $ | (31 | ) | $ | — | $ | 204 | |||||||
Financial commodity contracts | 880 | (880 | ) | — | — | |||||||||||
Interest rate contracts | — | — | — | — | ||||||||||||
Total NJNG | $ | 1,115 | $ | (911 | ) | $ | — | $ | 204 | |||||||
Derivative liabilities: | ||||||||||||||||
Energy Services | ||||||||||||||||
Physical commodity contracts | $ | 12,872 | $ | (2,837 | ) | $ | 1,200 | $ | 11,235 | |||||||
Financial commodity contracts | 45,836 | (17,945 | ) | (27,891 | ) | — | ||||||||||
Foreign currency contracts | 32 | (1 | ) | — | 31 | |||||||||||
Total Energy Services | $ | 58,740 | $ | (20,783 | ) | $ | (26,691 | ) | $ | 11,266 | ||||||
NJNG | ||||||||||||||||
Physical commodity contracts | $ | 1,154 | $ | (31 | ) | $ | — | $ | 1,123 | |||||||
Financial commodity contracts | 3,365 | (880 | ) | (2,485 | ) | — | ||||||||||
Interest rate contracts | 23,073 | — | — | 23,073 | ||||||||||||
Total NJNG | $ | 27,592 | $ | (911 | ) | $ | (2,485 | ) | $ | 24,196 | ||||||
(1) | Derivative assets and liabilities are presented on a gross basis in the balance sheet as the Company does not elect balance sheet offsetting under ASC 210-20. |
(2) | Offsetting derivative instruments include transactions with NAESB netting election, transactions held by FCMs with net margining and transactions with ISDA netting. |
(3) | Financial collateral includes cash balances at FCMs, as well as cash received from or pledged to other counterparties. |
(4) | Net amounts represent presentation of derivative assets and liabilities if the Company were to elect balance sheet offsetting under ASC 210-20. |
Page 98
New Jersey Resources Corporation
Part II
ITEM 8. FINANCIAL STATEMENTS AND SUPPLEMENTARY DATA (Continued)
Energy Services utilizes financial derivatives to economically hedge the gross margin associated with the purchase of physical gas to be used for storage injection and its subsequent sale at a later date. The gains or (losses) on the financial transactions that are economic hedges of the cost of the purchased gas are recognized prior to the gains or (losses) on the physical transaction, which are recognized in earnings when the natural gas is delivered. Therefore, mismatches between the timing of the recognition of realized gains or (losses) on the financial derivative instruments and gains or (losses) associated with the actual sale of the natural gas that is being economically hedged, along with fair value changes in derivative instruments, creates volatility in the results of Energy Services, although the Company’s intended economic results relating to the entire transaction are unaffected.
The following table reflects the effect of derivative instruments on the Consolidated Statements of Operations as of September 30:
(Thousands) | Location of gain (loss) recognized in income on derivatives | Amount of gain (loss) recognized in income on derivatives | ||||||||||
Derivatives not designated as hedging instruments: | 2017 | 2016 | 2015 | |||||||||
Energy Services: | ||||||||||||
Physical commodity contracts | Operating revenues | $ | 8,912 | $ | 33,034 | $ | 32,568 | |||||
Physical commodity contracts | Gas purchases | (27,461 | ) | (45,637 | ) | (34,438 | ) | |||||
Financial commodity contracts | Gas purchases | 26,563 | 45,579 | 109,082 | ||||||||
Foreign currency contracts | Gas purchases | 41 | (34 | ) | — | |||||||
Total unrealized and realized gains (losses) | $ | 8,055 | $ | 32,942 | $ | 107,212 | ||||||
Energy Services designated its foreign exchange contracts, entered into prior to January 1, 2016, as cash flow hedges and, as a result, changes in fair value of the effective portion of the hedges are recorded in OCI and, upon settlement of the contracts, realized gains and (losses) are reclassified from AOCI to gas purchases on the Consolidated Statements of Operations.
The following table reflects the effect of derivative instruments designated as cash flow hedges on OCI as of September 30:
(Thousands) | Amount of Gain or (Loss) Recognized in OCI on Derivatives (Effective Portion) | Amount of Gain or (Loss) Reclassified from OCI into Income (Effective Portion) | Amount of Gain or (Loss) Recognized on Derivative (Ineffective Portion and Amount Excluded from Effectiveness Testing) | |||||||||||||||
Derivatives in cash flow hedging relationships: | 2017 | 2016 | 2017 | 2016 | 2017 | 2016 | ||||||||||||
Foreign currency contracts | $ | — | $ | (27 | ) | $ | — | $ | 27 | $ | — | $ | — | |||||
NJNG’s derivative contracts are part of the Company’s risk management activities that relate to its natural gas purchases, BGSS incentive programs and debt financing. These transactions are entered into pursuant to regulatory approval and, at settlement, the resulting gains and/or losses are payable to or recoverable from utility customers. Any changes in the value of NJNG’s financial derivatives are deferred in regulatory assets or liabilities resulting in no impact to earnings.
The following table reflects the (losses) gains associated with NJNG’s derivative instruments as of September 30:
(Thousands) | 2017 | 2016 | 2015 | ||||||||
NJNG: | |||||||||||
Physical commodity contracts | $ | (12,303 | ) | $ | (15,756 | ) | $ | — | |||
Financial commodity contracts | 5,595 | (7,984 | ) | (33,428 | ) | ||||||
Interest rate contracts | 14,606 | (18,845 | ) | (4,228 | ) | ||||||
Total unrealized and realized (losses) gains | $ | 7,898 | $ | (42,585 | ) | $ | (37,656 | ) | |||
Page 99
New Jersey Resources Corporation
Part II
ITEM 8. FINANCIAL STATEMENTS AND SUPPLEMENTARY DATA (Continued)
NJNG and Energy Services had the following outstanding long (short) derivatives as of September 30:
Volume (Bcf) | |||||||
2017 | 2016 | ||||||
NJNG | Futures | 18.2 | 23.6 | ||||
Physical | 32.1 | 9.2 | |||||
Energy Services | Futures | (16.4 | ) | (79.1 | ) | ||
Financial Options | — | 1.2 | |||||
Physical | (13.1 | ) | 94.6 | ||||
Not included in the previous table are Energy Services’ gross notional amount of foreign currency transactions of approximately $4.5 million, NJNG’s treasury lock agreement, as previously discussed, and 283,000 SRECs at Energy Services that are open as of September 30, 2017.
Broker Margin
Futures exchanges have contract specific performance bond requirements, also known as margin requirements that require the posting of cash or cash equivalents relating to traded contracts. Margin requirements consist of initial margin that is posted upon the initiation of a position, maintenance margin that is usually expressed as a percent of initial margin, and variation margin that fluctuates based on the daily marked-to-market relative to maintenance margin requirements. The Company maintains separate broker margin accounts for NJNG and Energy Services. The balances as of September 30, by company, are as follows:
(Thousands) | Balance Sheet Location | 2017 | 2016 | ||||
NJNG | Broker margin - Current assets | $ | 2,661 | $ | 4,822 | ||
Energy Services | Broker margin - Current assets | $ | 23,166 | $ | 42,822 | ||
Due to CME rulebook changes that took effect in January 2017, variation margin is being treated as a settlement payment, rather than collateral. As a result, the Company is now required to present variation margin net with the related derivative assets and/or liabilities on the Consolidated Balance Sheets for any derivatives the Company clears through the CME. This change is being applied on a prospective basis. In September 30, 2016, prior to the rule change, the Company reported the variation margin as a separate unit of account within restricted broker margin on the Consolidated Balance Sheets. There was no impact to the Company’s derivative gains or losses in the Consolidated Statements of Operations as a result of the CME rule amendment.
Wholesale Credit Risk
NJNG, Energy Services and Clean Energy Ventures are exposed to credit risk as a result of their sales/wholesale and retail marketing activities. As a result of the inherent volatility in the prices of natural gas commodities, derivatives, SRECs, electricity and RECs, the market value of contractual positions with individual counterparties could exceed established credit limits or collateral provided by those counterparties. If a counterparty fails to perform the obligations under its contract (e.g., fails to deliver or pay for natural gas, SRECs, electricity or RECs), the Company could sustain a loss.
The Company monitors and manages the credit risk of its wholesale operations through credit policies and procedures that management believes reduce overall credit risk. These policies include a review and evaluation of current and prospective counterparties’ financial statements and/or credit ratings, daily monitoring of counterparties’ credit limits and exposure, daily communication with traders regarding credit status and the use of credit mitigation measures, such as collateral requirements and netting agreements. Examples of collateral include letters of credit and cash received for either prepayment or margin deposit. Collateral may be requested due to the Company’s election not to extend credit or because exposure exceeds defined thresholds. Most of the Company’s wholesale marketing contracts contain standard netting provisions. These contracts include those governed by ISDA and the NAESB. The netting provisions refer to payment netting, whereby receivables and payables with the same counterparty are offset and the resulting net amount is paid to the party to which it is due.
Internally-rated exposure applies to counterparties that are not rated by S&P or Moody’s. In these cases, the counterparty’s or guarantor’s financial statements are reviewed, and similar methodologies and ratios used by S&P and/or Moody’s are applied to arrive at a substitute rating. Gross credit exposure is defined as the unrealized fair value of physical and financial derivative commodity contracts, plus any outstanding wholesale receivable for the value of natural gas delivered and/or financial derivative commodity contract that has settled for which payment has not yet been received.
Page 100
New Jersey Resources Corporation
Part II
ITEM 8. FINANCIAL STATEMENTS AND SUPPLEMENTARY DATA (Continued)
The following is a summary of gross credit exposures grouped by investment and noninvestment grade counterparties, as of September 30, 2017.The amounts presented below have not been reduced by any collateral received or netting and exclude accounts receivable for NJNG retail natural gas sales and services and Clean Energy Ventures residential solar installations.
(Thousands) | Gross Credit Exposure | ||||
Investment grade | $ | 136,804 | |||
Noninvestment grade | 16,889 | ||||
Internally-rated investment grade | 16,378 | ||||
Internally-rated noninvestment grade | 68,498 | ||||
Total | $ | 238,569 | |||
Conversely, certain of NJNG’s and Energy Services’ derivative instruments are linked to agreements containing provisions that would require cash collateral payments from the Company if certain events occur. These provisions vary based upon the terms in individual counterparty agreements and can result in cash payments if NJNG’s credit rating were to fall below its current level. NJNG’s credit rating, with respect to S&P, reflects the overall corporate credit profile of the Company. Specifically, most, but not all, of these additional payments will be triggered if NJNG’s debt is downgraded by the major credit agencies, regardless of investment grade status. In addition, some of these agreements include threshold amounts that would result in additional collateral payments if the values of derivative liabilities were to exceed the maximum values provided for in relevant counterparty agreements. Other provisions include payment features that are not specifically linked to ratings, but are based on certain financial metrics.
Collateral amounts associated with any of these conditions are determined based on a sliding scale and are contingent upon the degree to which the Company’s credit rating and/or financial metrics deteriorate, and the extent to which liability amounts exceed applicable threshold limits. The aggregate fair value of all derivative instruments with credit-risk-related contingent features that were in a liability position on September 30, 2017 and 2016, is $8.7 million and $23.1 million, respectively, for which the Company had not posted collateral. If all thresholds related to the credit-risk-related contingent features underlying these agreements had been invoked on September 30, 2017 and 2016, the Company would have been required to post an additional $8.6 million and $23.1 million, respectively, to its counterparties. These amounts differ from the respective net derivative liabilities reflected on the Consolidated Balance Sheets because the agreements also include clauses, commonly known as “Rights of Offset,” that would permit the Company to offset its derivative assets against its derivative liabilities for determining additional collateral to be posted, as previously discussed.
6. FAIR VALUE
Fair Value of Assets and Liabilities
The fair value of cash and cash equivalents, accounts receivable, current loan receivables, accounts payable, commercial paper and borrowings under revolving credit facilities are estimated to equal their carrying amounts due to the short maturity of those instruments. Non-current loan receivables are recorded based on what the Company expects to receive, which approximates fair value. The Company regularly evaluates the credit quality and collection profile of its customers to approximate fair value.
As of September 30, the estimated fair value of long-term debt at NJNG and NJR, including current maturities, excluding capital leases, debt issuance costs and solar asset financing obligations, is as follows:
(Thousands) | 2017 | 2016 | ||||
NJNG | ||||||
Carrying value (1) (2) | $ | 672,045 | $ | 707,845 | ||
Fair market value | $ | 673,051 | $ | 731,615 | ||
NJR | ||||||
Carrying value (3) | $ | 425,000 | $ | 375,000 | ||
Fair market value | $ | 434,625 | $ | 399,462 | ||
(1) | Excludes capital leases of $39.7 million and $42.2 million as of September 30, 2017 and 2016, respectively. |
(2) | Excludes debt issuance costs of $6.3 million and $7.7 million as of September 30, 2017 and 2016, respectively. |
(3) | Excludes debt issuance costs of $770,000 and $853,000 as of September 30, 2017 and 2016, respectively. |
Page 101
New Jersey Resources Corporation
Part II
ITEM 8. FINANCIAL STATEMENTS AND SUPPLEMENTARY DATA (Continued)
The Company utilizes a discounted cash flow method to determine the fair value of its debt. Inputs include observable municipal and corporate yields, as appropriate, for the maturity of the specific issue and the Company’s credit rating. As of September 30, 2017 and 2016, the Company disclosed its debt within Level 2 of the fair value hierarchy.
Fair Value Hierarchy
The Company applies fair value measurement guidance to its financial assets and liabilities, as appropriate, which include financial derivatives and physical commodity contracts qualifying as derivatives, available for sale securities and other financial assets and liabilities. In addition, authoritative accounting literature prescribes the use of a fair value hierarchy that prioritizes the inputs to valuation techniques used to measure fair value based on the source of the data used to develop the price inputs.
The hierarchy gives the highest priority to unadjusted quoted prices in active markets for identical assets or liabilities and the lowest priority to inputs that are based on unobservable market data and includes the following:
Level 1 | Unadjusted quoted prices for identical assets or liabilities in active markets. The Company’s Level 1 assets and liabilities include exchange traded natural gas futures and options contracts, listed equities and money market funds. Exchange traded futures and options contracts include all energy contracts traded on the NYMEX, CME and ICE that the Company refers internally to as basis swaps, fixed swaps, futures and financial options that are cleared through a FCM. |
Level 2 | Other significant observable inputs, such as interest rates or price data, including both commodity and basis pricing that is observed either directly or indirectly from publications or pricing services. The Company’s Level 2 assets and liabilities include over-the-counter physical forward commodity contracts and swap contracts, SREC forward sales or derivatives that are initially valued using observable quotes and are subsequently adjusted to include time value, credit risk or estimated transport pricing components for which no basis price is available. Level 2 financial derivatives consist of transactions with non-FCM counterparties (basis swaps, fixed swaps and/or options). NJNG’s treasury lock is also considered Level 2 as valuation is based on quoted market interest and swap rates as inputs to the valuation model. Inputs are verifiable and do not require significant management judgment. For some physical commodity contracts, the Company utilizes transportation tariff rates that are publicly available and that it considers to be observable inputs that are equivalent to market data received from an independent source. There are no significant judgments or adjustments applied to the transportation tariff inputs and no market perspective is required. Even if the transportation tariff input were considered to be a “model,” it would still be considered to be a Level 2 input as the data is: |
• | widely accepted and public; |
• | non-proprietary and sourced from an independent third party; and |
• | observable and published. |
These additional adjustments are generally not considered to be significant to the ultimate recognized values.
Level 3 | Inputs derived from a significant amount of unobservable market data. These include the Company’s best estimate of fair value and are derived primarily through the use of internal valuation methodologies. |
Financial derivative portfolios of NJNG and Energy Services consist mainly of futures, options and swaps. The Company primarily uses the market approach and its policy is to use actively quoted market prices when available. The principal market for its derivative transactions is the natural gas wholesale market, therefore, the primary sources for its price inputs are CME, NYMEX and ICE. Energy Services uses Platts and Natural Gas Exchange for Canadian delivery points. However, Energy Services also engages in transactions that result in transporting natural gas to delivery points for which there is no actively quoted market price. In most instances, the transportation cost to the final delivery location is not significant to the overall valuation. If required, Energy Services’ policy is to use the best information available to determine fair value based on internal pricing models, which would include estimates extrapolated from broker quotes or other pricing services.
The Company also has available for sale securities and other financial assets that include listed equities, mutual funds and money market funds for which there are active exchange quotes available.
Page 102
New Jersey Resources Corporation
Part II
ITEM 8. FINANCIAL STATEMENTS AND SUPPLEMENTARY DATA (Continued)
When the Company determines fair values, measurements are adjusted, as needed, for credit risk associated with its counterparties, as well as its own credit risk. The Company determines these adjustments by using historical default probabilities that correspond to the applicable S&P issuer ratings, while also taking into consideration collateral and netting arrangements that serve to mitigate risk.
Assets and liabilities measured at fair value on a recurring basis are summarized as follows:
Quoted Prices in Active Markets for Identical Assets | Significant Other Observable Inputs | Significant Unobservable Inputs | ||||||||||||||||
(Thousands) | (Level 1) | (Level 2) | (Level 3) | Total | ||||||||||||||
As of September 30, 2017: | ||||||||||||||||||
Assets | ||||||||||||||||||
Physical commodity contracts | $ | — | $ | 21,866 | $ | — | $ | 21,866 | ||||||||||
Financial commodity contracts | 17,335 | — | — | 17,335 | ||||||||||||||
Financial commodity contracts - foreign exchange | — | 44 | — | 44 | ||||||||||||||
Available for sale equity securities | 65,752 | — | — | 65,752 | ||||||||||||||
Money market funds | 112 | — | — | 112 | ||||||||||||||
Other | 1,090 | — | — | 1,090 | ||||||||||||||
Total assets at fair value | $ | 84,289 | $ | 21,910 | $ | — | $ | 106,199 | ||||||||||
Liabilities | ||||||||||||||||||
Physical commodity contracts | $ | — | $ | 25,371 | $ | — | $ | 25,371 | ||||||||||
Financial commodity contracts | 24,036 | — | — | 24,036 | ||||||||||||||
Financial commodity contracts - foreign exchange | — | — | — | — | ||||||||||||||
Interest rate contracts | — | 8,467 | — | 8,467 | ||||||||||||||
Total liabilities at fair value | $ | 24,036 | $ | 33,838 | $ | — | $ | 57,874 | ||||||||||
As of September 30, 2016: | ||||||||||||||||||
Assets | ||||||||||||||||||
Physical commodity contracts | $ | — | $ | 10,216 | $ | — | $ | 10,216 | ||||||||||
Financial commodity contracts | 24,974 | — | — | 24,974 | ||||||||||||||
Financial commodity contracts - foreign exchange | — | 1 | — | 1 | ||||||||||||||
Available for sale equity securities | 55,789 | — | — | 55,789 | ||||||||||||||
Money market funds | 34,072 | — | — | 34,072 | ||||||||||||||
Other | 1,444 | — | — | 1,444 | ||||||||||||||
Total assets at fair value | $ | 116,279 | $ | 10,217 | $ | — | $ | 126,496 | ||||||||||
Liabilities | ||||||||||||||||||
Physical commodity contracts | $ | — | $ | 14,026 | $ | — | $ | 14,026 | ||||||||||
Financial commodity contracts | 49,201 | — | — | 49,201 | ||||||||||||||
Financial commodity contracts - foreign exchange | — | 32 | — | 32 | ||||||||||||||
Interest rate contracts | — | 23,073 | — | 23,073 | ||||||||||||||
Total liabilities at fair value | $ | 49,201 | $ | 37,131 | $ | — | $ | 86,332 | ||||||||||
Assets measured at fair value on a non-recurring basis are summarized as follows:
Quoted Prices in Active Markets for Identical Assets | Significant Other Observable Inputs | Significant Unobservable Inputs | ||||||||||||||||
(Thousands) | (Level 1) | (Level 2) | (Level 3) | Total | ||||||||||||||
As of September 30, 2017: | ||||||||||||||||||
Assets | ||||||||||||||||||
Acquired wholesale energy contracts (1) | $ | — | $ | 41,084 | $ | — | $ | 41,084 | ||||||||||
Total assets at fair value | $ | — | $ | 41,084 | $ | — | $ | 41,084 | ||||||||||
(1) | Included in intangible asset on the Consolidated Balance Sheets, see Note 3. Acquisition for more information regarding the acquired contracts. |
Page 103
New Jersey Resources Corporation
Part II
ITEM 8. FINANCIAL STATEMENTS AND SUPPLEMENTARY DATA (Continued)
7. INVESTMENTS IN EQUITY INVESTEES
As of September 30, the Company’s investments in equity method investees includes the following:
(Thousands) | 2017 | 2016 | ||||
Steckman Ridge (1) | $ | 120,262 | $ | 123,155 | ||
PennEast | 52,323 | 17,993 | ||||
Total | $ | 172,585 | $ | 141,148 | ||
(1)Includes loans with a total outstanding principal balance of $70.4 million for both fiscal 2017 and 2016, which accrue interest at a variable rate that resets quarterly and are due October 1, 2023.
The Company, through its subsidiary NJR Pipeline Company, is an investor in PennEast, which is expected to construct and operate a 120-mile pipeline that will extend from northeast Pennsylvania to western New Jersey and is estimated to be completed and operational in 2019.
NJNG and Energy Services have entered into storage and park and loan agreements with Steckman Ridge. In addition, NJNG has entered into a precedent capacity agreement with PennEast. See Note 16. Related Party Transactions for more information on these intercompany transactions.
8. EARNINGS PER SHARE
The following table presents the calculation of the Company’s basic and diluted earnings per share for the fiscal years ended September 30:
(Thousands, except per share amounts) | 2017 | 2016 | 2015 | ||||||
Net income, as reported | $ | 132,065 | $ | 131,672 | $ | 180,960 | |||
Basic earnings per share | |||||||||
Weighted average shares of common stock outstanding-basic | 86,321 | 85,884 | 85,186 | ||||||
Basic earnings per common share | $1.53 | $1.53 | $2.12 | ||||||
Diluted earnings per share | |||||||||
Weighted average shares of common stock outstanding-basic | 86,321 | 85,884 | 85,186 | ||||||
Incremental shares (1) | 823 | 847 | 1,079 | ||||||
Weighted average shares of common stock outstanding-diluted | 87,144 | 86,731 | 86,265 | ||||||
Diluted earnings per common share (2) | $1.52 | $1.52 | $2.10 | ||||||
(1) | Incremental shares consist primarily of unvested stock awards and performance units. |
(2) | There were no anti-dilutive shares excluded from the calculation of diluted earnings per share for fiscal 2017, 2016 and 2015. |
9. DEBT
NJNG and NJR finance working capital requirements and capital expenditures through the issuance of various long-term debt and other financing arrangements, including unsecured credit and private placement debt shelf facilities. Amounts available under credit facilities are reduced by bank or commercial paper borrowings, as applicable, and any outstanding letters of credit.
Page 104
New Jersey Resources Corporation
Part II
ITEM 8. FINANCIAL STATEMENTS AND SUPPLEMENTARY DATA (Continued)
Long-term Debt
The following table presents the long-term debt of the Company as of September 30:
(Thousands) | 2017 | 2016 | ||||||
NJNG | ||||||||
First mortgage bonds: | Maturity date: | |||||||
4.50% | Series II | August 1, 2023 | $ | — | $ | 10,300 | ||
4.60% | Series JJ | August 1, 2024 | — | 10,500 | ||||
4.90% | Series KK | October 1, 2040 | — | 15,000 | ||||
5.60% | Series LL | May 15, 2018 | 125,000 | 125,000 | ||||
Variable | Series MM | September 1, 2027 | 9,545 | 9,545 | ||||
Variable | Series NN | August 1, 2035 | 41,000 | 41,000 | ||||
Variable | Series OO | August 1, 2041 | 46,500 | 46,500 | ||||
3.15% | Series PP | April 15, 2028 | 50,000 | 50,000 | ||||
3.58% | Series QQ | March 13, 2024 | 70,000 | 70,000 | ||||
4.61% | Series RR | March 13, 2044 | 55,000 | 55,000 | ||||
2.82% | Series SS | April 15, 2025 | 50,000 | 50,000 | ||||
3.66% | Series TT | April 15, 2045 | 100,000 | 100,000 | ||||
3.63% | Series UU | June 21, 2046 | 125,000 | 125,000 | ||||
Capital lease obligation-buildings | June 1, 2021 | 11,617 | 14,262 | |||||
Capital lease obligation-meters | Various dates | 28,042 | 27,895 | |||||
Less: Debt issuance costs | (6,262 | ) | (7,659 | ) | ||||
Less: Current maturities of long-term debt | (135,800 | ) | (11,452 | ) | ||||
Total NJNG long-term debt | 569,642 | 730,891 | ||||||
NJR | ||||||||
6.05% | Unsecured senior notes | September 24, 2017 | — | 50,000 | ||||
2.51% | Unsecured senior notes | September 15, 2018 | 25,000 | 25,000 | ||||
3.25% | Unsecured senior notes | September 17, 2022 | 50,000 | 50,000 | ||||
3.48% | Unsecured senior notes | November 7, 2024 | 100,000 | 100,000 | ||||
3.20% | Unsecured senior notes | August 18, 2023 | 50,000 | 50,000 | ||||
3.54% | Unsecured senior notes | August 18, 2026 | 100,000 | 100,000 | ||||
Variable | Term loan | August 16, 2019 | 100,000 | — | ||||
Less: Debt issuance costs | (770 | ) | (853 | ) | ||||
Less: Current maturities of long-term debt | (25,000 | ) | (50,000 | ) | ||||
Total NJR long-term debt | 399,230 | 324,147 | ||||||
Clean Energy Ventures | ||||||||
Solar asset financing obligation | Various dates | 32,790 | — | |||||
Less: Current maturities of long-term debt | (4,582 | ) | — | |||||
Total Clean Energy Ventures long-term debt | 28,208 | — | ||||||
Total long-term debt | $ | 997,080 | $ | 1,055,038 | ||||
Annual long-term debt redemption requirements, excluding capital leases, debt issuance costs and solar asset financing obligations, as of September 30, are as follows:
(Thousands) | NJNG | NJR | ||||
2018 | $ | 125,000 | $ | 25,000 | ||
2019 | $ | — | $ | 100,000 | ||
2020 | $ | — | $ | — | ||
2021 | $ | — | $ | — | ||
2022 | $ | — | $ | 50,000 | ||
Thereafter | $ | 547,045 | $ | 250,000 | ||
Page 105
New Jersey Resources Corporation
Part II
ITEM 8. FINANCIAL STATEMENTS AND SUPPLEMENTARY DATA (Continued)
NJNG
First Mortgage Bonds
NJNG and Trustee entered into the Mortgage Indenture, dated September 1, 2014, which secures all of the outstanding First Mortgage Bonds issued by NJNG. The Mortgage Indenture provides a direct first mortgage lien upon substantially all of the operating properties and franchises of NJNG (other than excepted property, such as cash on hand, choses-in-action, securities, rent, natural gas meters and certain materials, supplies, appliances and vehicles), subject only to certain permitted encumbrances. The Mortgage Indenture contains provisions subjecting after-acquired property (other than excepted property and subject to pre-existing liens, if any, at the time of acquisition) to the lien thereof.
NJNG’s Mortgage Indenture no longer contains a restriction on NJNG's ability to pay dividends. New Jersey Administrative Code 14:4-4.7 states that a public utility cannot issue dividends, without regulatory approval, if its equity to total capitalization ratio falls below 30 percent. As of September 30, 2017, NJNG’s equity to total capitalization ratio is 55.6 percent and has the ability to issue up to $960 million of FMB under the terms of the Mortgage Indenture.
NJNG has variable rate EDA Bonds with a total principal amount of $97 million and maturity dates ranging from September 2027 to August 2041. The EDA Bonds are not subject to optional tender while they bear interest at a LIBOR index rate. As of September 30, 2017, the interest rate on the EDA Bonds was 1.42 percent.
In June 2016, NJNG entered into a Note Purchase Agreement, under which NJNG issued $125 million of its 3.63 percent senior notes due June 2046. The notes are secured by an equal principal amount of NJNG’s FMB (series UU) issued under NJNG’s Mortgage Indenture. The proceeds of the notes will be used for general corporate purposes, including, but not limited to, refinancing or retiring short-term debt and funding capital expenditures.
On January 17, 2017, the Company completed the purchase of three FMBs in lieu of redemption with an aggregate principal amount totaling $35.8 million. The FMBs bore interest at rates ranging from 4.5 percent to 4.9 percent. The bonds purchased in lieu of redemption are being held by the Company to provide an opportunity to evaluate remarketing alternatives.
As of September 30, 2017, NJNG's $125 million, 5.6 percent senior notes, which will mature in May 2018, were classified as a current maturity of long-term debt.
Sale-Leasebacks
NJNG has entered into a sale-leaseback for its headquarters building, which has a 25.5-year term that expires in June 2021, subject to an option by NJNG to renew the lease for additional five-year terms a maximum of four times. The present value of the agreement’s minimum lease payments is reflected as both a capital lease asset and a capital lease obligation, which are included in utility plant and long-term debt, respectively, on the Consolidated Balance Sheets.
NJNG received $9.6 million, $7.1 million and $7.2 million for fiscal 2017, 2016 and 2015, respectively, in connection with the sale-leaseback of its natural gas meters. NJNG records a capital lease obligation that is paid over the term of the lease and has the option to purchase the meters back at fair value upon expiration of the lease. During fiscal 2017, 2016 and 2015, NJNG exercised early purchase options with respect to meter leases by making final principal payments of $2.4 million, $1.9 million and $768,000, respectively. NJNG continues to evaluate this sale-leaseback program based on current market conditions.
Contractual commitments for capital lease payments, as of the fiscal years ended September 30, are as follows:
(Thousands) | Lease Payments | |||
2018 | $ | 12,436 | ||
2019 | 9,675 | |||
2020 | 8,849 | |||
2021 | 5,862 | |||
2022 | 2,518 | |||
Thereafter | 4,914 | |||
Subtotal | 44,200 | |||
Less: Interest component | (4,494 | ) | ||
Total | $ | 39,700 | ||
Page 106
New Jersey Resources Corporation
Part II
ITEM 8. FINANCIAL STATEMENTS AND SUPPLEMENTARY DATA (Continued)
NJR
In March 2016, NJR entered into a Note Purchase Agreement, under which the Company issued, in August 2016, $50 million of the Company’s 3.2 percent senior notes due August 2023, and $100 million of the Company’s 3.54 percent senior notes due August 2026. The notes are not secured by assets, but are instead guaranteed by certain unregulated subsidiaries of the Company. The proceeds of the notes will be used for general corporate purposes, including working capital and capital expenditures.
On August 18, 2017, NJR entered into a $100 million credit agreement due August 16, 2019. The term loan will accrue interest at a variable rate determined monthly, which is LIBOR plus 70 basis points. The weighted average interest rate on the term loan as of September 30, 2017, was 1.95 percent. NJR had no long-term, variable-rate debt outstanding as of September 30, 2016.
As of September 30, 2017, NJR's $25 million, 2.51 percent debt shelf notes, which will mature in September 2018, were classified as a current maturity of long-term debt.
Clean Energy Ventures
During September 2017, Clean Energy Ventures entered into transactions to sell two commercial solar assets concurrent with agreements to lease the assets back over a period of seven years. These sale-leasebacks are treated as financing obligations, which are typically secured by the renewable energy facility asset and its future cash flows from SREC and energy sales. ITCs and other tax benefits associated with these solar projects will be transferred to the buyer. Clean Energy Ventures will continue to operate the solar assets, including related expenses, and retain the revenue generated from SRECs and energy sales. and has the option to renew the lease or repurchase the assets sold at the end of the lease term. Clean Energy Ventures received proceeds of $32.9 million in connection with these sale-leasebacks. Contractual commitments for the sale-leasebacks will be $2.7 million annually for the next five years and $5.3 million in the aggregate for all years thereafter.
Short-term Debt
A summary of NJR’s and NJNG’s short-term bank facilities as of September 30, are as follows:
(Thousands) | 2017 | 2016 | |||||
NJR | |||||||
Bank revolving credit facilities: (1) | $ | 425,000 | $ | 425,000 | |||
Notes outstanding at end of period | $ | 255,000 | $ | 121,700 | |||
Weighted average interest rate at end of period | 2.14 | % | 1.43 | % | |||
Amount available at end of period (2) | $ | 156,601 | $ | 288,910 | |||
NJNG | |||||||
Bank revolving credit facilities: (3) | $ | 250,000 | $ | 250,000 | |||
Commercial paper outstanding at end of period | $ | 11,000 | $ | — | |||
Weighted average interest rate at end of period | 1.13 | % | — | % | |||
Amount available at end of period (4) | $ | 238,269 | $ | 249,269 | |||
(1) | Committed credit facilities, which require commitment fees of .075 percent on the unused amounts. |
(2) | Letters of credit outstanding total $13.4 million and $14.4 million as of September 30, 2017 and 2016, respectively, which reduces amount available by the same amount. |
(3) | Committed credit facilities, which require commitment fees of .075 percent on the unused amounts. |
(4) | Letters of credit outstanding total $731,000 as of September 30, 2017 and 2016, which reduces amount available by the same amount. |
NJR
On September 28, 2015, NJR entered into a $425 million unsecured, committed credit facility scheduled to expire on September 28, 2020, subject to two mutual options for a one-year extension beyond that date. The NJR Credit Facility includes an accordion feature, which would allow NJR, in the absence of a default or event of default, to increase from time to time, with the existing or new lenders, the revolving credit commitments under the NJR Credit Facility in minimum $5 million increments up to a maximum of $100 million. The credit facility is used primarily to finance its share repurchases, to satisfy Energy Services’ short-term liquidity needs and to finance, on an initial basis, unregulated investments.
Page 107
New Jersey Resources Corporation
Part II
ITEM 8. FINANCIAL STATEMENTS AND SUPPLEMENTARY DATA (Continued)
As of September 30, 2017, NJR had six letters of credit outstanding totaling $13.4 million. Three letters of credit totaling $10.4 million are issued on behalf of Energy Services and three letters of credit, which total $3 million, are issued on behalf of Clean Energy Ventures. These letters of credit reduce the amount available under NJR’s committed credit facility by the same amount. NJR does not anticipate that these letters of credit will be drawn upon by the counterparties, and they will be renewed as necessary.
Energy Services’ letters of credit are used for margin requirements for natural gas transactions, collateral and security deposit for retail gas sales and expire on dates ranging from December 2017 to September 2018. Clean Energy Ventures’ letters of credit are used to secure construction of ground-mounted solar projects and to secure obligations pursuant to an Interconnection Services Agreement. They expire on dates ranging from May 2018 to August 2018.
Neither NJNG nor the results of its operations are obligated or pledged to support the NJR credit or debt shelf facilities.
NJNG
NJNG has a $250 million, five-year, revolving, unsecured credit facility, which expires in May 2019. The NJNG Credit Facility permits the borrowing of revolving loans and swing loans, as well as the issuance of letters of credit. It also permits an increase to the facility, from time to time, with the existing or new lenders, in a minimum of $15 million increments up to a maximum of $50 million at the lending banks’ discretion.
As of September 30, 2017, NJNG has two letters of credit outstanding for $731,000. NJNG’s letters of credit are used as collateral for remediation projects and expire in August 2018. These letters of credit reduce the amount available under NJNG’s committed credit facility by the same amount. NJNG does not anticipate that these letters of credit will be drawn upon by the counterparty and will be renewed as necessary.
10. STOCK-BASED COMPENSATION
Effective January 25, 2017, the shareholders of the Company approved the NJR 2017 Stock Award and Incentive Plan, which replaced the NJR 2007 Stock Award and Incentive Plan. The 2007 plan had 914,169 shares granted but not issued as of September 30, 2016, which were transferred into the 2017 plan. The 2017 plan added an additional 3,135,000 shares available for issuance. Shares have been issued in the form of performance shares, restricted stock, deferred retention stock and unrestricted common stock to non-employee directors. As of September 30, 2017, 3,119,878 shares remain available for future issuance.
The following table summarizes all stock-based compensation expense recognized during the following fiscal years:
(Thousands) | 2017 | 2016 | 2015 | ||||||
Stock-based compensation expense: | |||||||||
Performance share awards | $ | 2,614 | $ | 3,188 | $ | 2,473 | |||
Restricted and non-restricted stock | 1,732 | 2,161 | 1,899 | ||||||
Deferred retention stock | 1,461 | 1,885 | 5,273 | ||||||
Compensation expense included in operation and maintenance expense | 5,807 | 7,234 | 9,645 | ||||||
Income tax benefit (1) | (2,372 | ) | (2,955 | ) | (3,940 | ) | |||
Total, net of tax | $ | 3,435 | $ | 4,279 | $ | 5,705 | |||
(1) | Excludes additional tax benefit related to delivered shares of $1.3 million, $1.8 million and $881,000 as of September 30, 2017, 2016 and 2015, respectively. |
Performance Shares
In fiscal 2017, the Company granted to various officers 44,576 performance shares, which are market condition awards that vest on September 30, 2019, subject to the Company meeting certain performance conditions. In fiscal 2017, the Company also granted to various officers 51,931 performance shares, of which 25,806 vest on September 30, 2019 and 26,125 vest annually over a three year period beginning on September 30, 2017, both of which are subject to the Company meeting certain performance conditions.
Page 108
New Jersey Resources Corporation
Part II
ITEM 8. FINANCIAL STATEMENTS AND SUPPLEMENTARY DATA (Continued)
In fiscal 2016, the Company granted to various officers 46,175 performance shares, which are market condition awards that vest on September 30, 2018, subject to the Company meeting certain performance conditions. In fiscal 2016, the Company also granted to various officers 69,305 performance shares, of which 38,789 vest on September 30, 2018 and 30,516 vest annually over a three year period beginning in September 2016, both of which are subject to the Company meeting certain performance conditions.
In fiscal 2015, the Company granted to various officers 41,214 performance shares, which are market condition awards that vested on September 30, 2017, subject to the Company meeting certain performance conditions. In fiscal 2015, the Company also granted to various officers 61,576 performance shares, of which 34,622 vested in September 30, 2017 and 26,954 vest annually over a three year period beginning in September 2015, both of which were subject to the Company meeting certain performance conditions. The vesting of these awards are shown in the table below.
There is approximately $2.9 million of deferred compensation related to unvested performance shares that is expected to be recognized over the weighted average period of 1.7 years.
The following table summarizes the performance share activity under the stock award and incentive plans for the past three fiscal years:
Shares (1) | Weighted Average Grant Date Fair Value | Total Fair Value of Vested Shares (in Thousands) | ||||||||
Non-vested and outstanding at September 30, 2014 | 247,536 | $18.30 | — | |||||||
Granted | 102,790 | $28.25 | — | |||||||
Vested (2) | (112,446 | ) | $17.10 | $ | 4,318 | |||||
Cancelled/forfeited (3) | (23,416 | ) | $17.98 | — | ||||||
Non-vested and outstanding at September 30, 2015 | 214,464 | $23.40 | — | |||||||
Granted | 115,480 | $27.37 | — | |||||||
Vested (4) | (137,053 | ) | $21.40 | $ | 5,657 | |||||
Cancelled/forfeited (5) | (12,975 | ) | $23.40 | — | ||||||
Non-vested and outstanding at September 30, 2016 | 179,916 | $27.47 | — | |||||||
Granted | 96,507 | $33.57 | — | |||||||
Vested (6) | (95,407 | ) | $28.88 | $ | 4,179 | |||||
Cancelled/forfeited | (24,429 | ) | $29.14 | — | ||||||
Non-vested and outstanding at September 30, 2017 | 156,587 | $30.12 | — | |||||||
(1) | The number of common shares issued related to certain performance shares may range from zero to 150 percent of the number of shares shown in the table above based on the Company’s achievement of performance goals. |
(2) | As certified by the Company’s Leadership and Compensation Committee on November 10, 2015, the number of common shares related to performance shares earned was 120 percent, or 112,918 shares, excluding accumulated dividends. The number represented on this line is the target number of 100 percent. See footnote (1) above. Also included in the vested number are 9,364 shares certified by the Leadership and Compensation Committee on November 11, 2014 and 8,984 shares certified by the Leadership and Compensation Committee on November 10, 2015. |
(3) | As certified by the Company’s Leadership and Compensation Committee on November 10, 2015, 9,364 shares were canceled due to not achieving a certain performance target. The remainder were forfeitures due to individuals departing the company. |
(4) | As certified by the Company’s Leadership and Compensation Committee on November 15, 2016, the number of common shares earned related to TSR performance was 85 percent or 55,702 shares, the number of common shares earned related to NFE performance was 150 percent or 71,808 shares, and the number of common shares earned related to Performance Based Restricted Stock was 100 percent or 23,649 shares. Each award earned excludes accumulated dividends. The number represented on this line is the target number of 100 percent. |
(5) | As certified by the Company’s Leadership and Compensation Committee on November 15, 2016, 9,366 shares were canceled due to not achieving a certain performance target. The remainder were forfeitures due to individuals departing the company. |
(6) | As certified by the Company’s Leadership and Compensation Committee on November 14, 2017, the number of common shares earned related to TSR performance was 108.44 percent or 39,595 shares, the number of common shares earned related to NFE performance was 119 percent or 36,498 shares and the number of common shares earned related to Performance Based Restricted Stock was 100 percent or 28,223 shares. Each award earned excludes accumulated dividends. The number represented on this line is the target number of 100 percent. |
The Company measures compensation expense related to performance shares based on the fair value of these awards at their date of grant. In accordance with ASC 718, Compensation - Stock Compensation, compensation expense for market condition grants are recognized for awards granted, and are not adjusted based on actual achievement of the performance goals. The Company estimated the fair value of these grants on the date of grant using a lattice model. Performance condition grants are initially fair valued at the company’s stock price on grant date, and are subsequently adjusted for actual achievement of the performance goals.
Page 109
New Jersey Resources Corporation
Part II
ITEM 8. FINANCIAL STATEMENTS AND SUPPLEMENTARY DATA (Continued)
Restricted Stock
In fiscal 2017, the Company granted 22,591 shares of restricted stock that vest annually over a three year period beginning October 15, 2017. In fiscal 2017, the Company also granted 6,143 shares of restricted stock that vest annually over a three year period beginning May 8, 2018. In fiscal 2016, the Company granted 41,909 shares of restricted stock that vest annually over a three year period beginning in October 2016. In fiscal 2015, the Company granted 48,542 shares of restricted stock that vest annually over a three year period beginning in October 2015. In fiscal 2015, the Company also granted 10,236 shares of restricted stock that will vest October 15, 2017 and 3,194 that vested September 30, 2015. There is approximately $511,409 of deferred compensation related to unvested restricted stock shares that is expected to be recognized over the weighted average period of two years.
The following table summarizes the restricted stock activity under the stock award and incentive plans for the past three fiscal years:
Shares | Weighted Average Grant Date Fair Value | Total Fair Value of Vested Shares (in Thousands) | ||||||||
Non-vested and outstanding at September 30, 2014 | 41,491 | $22.60 | — | |||||||
Granted | 61,972 | $29.41 | — | |||||||
Vested | (18,170 | ) | $24.45 | $ | 510 | |||||
Cancelled/forfeited | (3,801 | ) | $26.79 | — | ||||||
Non-vested and outstanding at September 30, 2015 | 81,492 | $27.17 | — | |||||||
Granted | 41,909 | $30.03 | — | |||||||
Vested | (48,089 | ) | $26.66 | $ | 1,469 | |||||
Cancelled/forfeited | (2,241 | ) | $29.21 | — | ||||||
Non-vested and outstanding at September 30, 2016 | 73,071 | $29.09 | — | |||||||
Granted | 28,734 | $35.79 | ||||||||
Vested | (38,752 | ) | $28.92 | $ | 1,344 | |||||
Cancelled/forfeited | (11,899 | ) | $31.56 | |||||||
Non-vested and outstanding at September 30, 2017 | 51,154 | $32.40 | — | |||||||
Deferred Retention Stock
Deferred retention stock awards vest immediately when granted, with shares delivered at a future date in accordance with the terms of the underlying agreements. The expense for these awards is recognized in the fiscal year in which services are rendered. The related shares are granted upon approval by the Board of Directors, which generally occurs subsequent to the fiscal year end.
The following table summarizes the deferred retention stock award under the stock award and incentive plans for the past three fiscal years:
Shares | Weighted Average Grant Date Fair Value | Total Fair Value of Vested Shares (in Thousands) | ||||||||
Outstanding at September 30, 2014 | 276,782 | $21.95 | — | |||||||
Granted/Vested | 462,790 | $29.32 | — | |||||||
Delivered | (95,098 | ) | $23.62 | $ | 2,519 | |||||
Forfeited | (11,744 | ) | $24.69 | — | ||||||
Outstanding at September 30, 2015 | 632,730 | $27.03 | — | |||||||
Granted/Vested | 159,831 | $30.37 | — | |||||||
Delivered | (121,764 | ) | $20.31 | $ | 3,751 | |||||
Forfeited | (8,318 | ) | $28.14 | — | ||||||
Outstanding at September 30, 2016 | 662,479 | $29.06 | — | |||||||
Granted/Vested | 63,977 | $35.64 | — | |||||||
Delivered | (53,878 | ) | $23.11 | $ | 1,774 | |||||
Outstanding at September 30, 2017 | 672,578 | $29.54 | — | |||||||
Page 110
New Jersey Resources Corporation
Part II
ITEM 8. FINANCIAL STATEMENTS AND SUPPLEMENTARY DATA (Continued)
Stock Options
The following table summarizes the stock option activity:
Shares | Weighted Average Exercise Price | ||||
Outstanding at September 30, 2014 | 48,250 | $15.00 | |||
Exercised | (48,250 | ) | $15.00 | ||
Outstanding at September 30, 2015 | — | $0.00 | |||
NJR received proceeds of $724,000 from the stock options exercised during fiscal 2015. There were no remaining stock options outstanding as of September 30, 2015, and therefore NJR received no proceeds from stock options exercised during fiscal 2017 and 2016. There were no stock options granted during fiscal 2017, 2016 and 2015.
Non-Employee Director Stock
Non-employee director compensation includes an annual January retainer that is awarded in stock. The shares vest immediately and are subsequently amortized to expense over a 12-month period. The following summarizes non-employee director share awards for the past three fiscal years:
2017 | 2016 | 2015 | ||
Shares granted | 27,972 | (1) | 27,481 | 26,122 |
Weighted average grant date fair value | $35.59 | $32.75 | $30.63 | |
(1) | $280,000 of expense remains as of September 30, 2017, to be recognized through December 31, 2017. |
11. EMPLOYEE BENEFIT PLANS
Pension and Other Postemployment Benefit Plans
The Company has two trusteed, noncontributory defined benefit retirement plans covering eligible regular represented and nonrepresented employees with more than one year of service. Defined benefit plan benefits are based on years of service and average compensation during the highest 60 consecutive months of employment. The Company also provides postemployment medical and life insurance benefits to employees who meet certain eligibility requirements.
All represented employees of NJRHS hired on or after October 1, 2000, non-represented employees hired on or after October 1, 2009 and NJNG represented employees hired on or after January 1, 2012, are covered by an enhanced defined contribution plan instead of the defined benefit plan. Participation in the postemployment medical and life insurance plan was also frozen to new employees as of the same dates, with the exception of new NJRHS represented employees, for which benefits were frozen beginning April 3, 2012.
The Company maintains an unfunded nonqualified PEP that was established to provide employees with the full level of benefits as stated in the qualified plan without reductions due to various limitations imposed by the provisions of federal income tax laws and regulations. There were no plan assets in the nonqualified plan due to the nature of the plan.
The Company’s funding policy for its pension plans is to contribute at least the minimum amount required by the Employee Retirement Income Security Act of 1974, as amended. In fiscal 2017 and 2016, the Company had no minimum funding requirements. The Company made a discretionary contribution of $30 million during the first quarter of fiscal 2016 to improve the funded status of the pension plans based on current actuarial assumptions. The Company made no discretionary contributions to the pension plans in fiscal 2017. The Company does not expect to be required to make additional contributions to fund the pension plans over the following two fiscal years based on current actuarial assumptions; however, funding requirements are uncertain and can depend significantly on changes in actuarial assumptions, returns on plan assets and changes in the demographics of eligible employees and covered dependents.
There are no Federal requirements to pre-fund OPEB benefits. However, the Company is required to fund certain amounts due to regulatory agreements with the BPU. The Company contributed $6 million and $3.2 million, in fiscal 2017 and 2016, respectively, and estimates that it will contribute between $4 million to $7 million over each of the next five years. Additional contributions may be required based on market conditions and changes to assumptions.
Page 111
New Jersey Resources Corporation
Part II
ITEM 8. FINANCIAL STATEMENTS AND SUPPLEMENTARY DATA (Continued)
The following summarizes the changes in the funded status of the plans and the related liabilities recognized on the Consolidated Balance Sheets as of September 30:
Pension (1) | OPEB | |||||||||||
(Thousands) | 2017 | 2016 | 2017 | 2016 | ||||||||
Change in Benefit Obligation | ||||||||||||
Benefit obligation at beginning of year | $ | 293,654 | $ | 255,987 | $ | 160,393 | $ | 138,367 | ||||
Service cost | 8,347 | 7,591 | 4,380 | 4,521 | ||||||||
Interest cost | 9,771 | 11,342 | 5,545 | 6,256 | ||||||||
Plan participants’ contributions (2) | 45 | 47 | 120 | 104 | ||||||||
Actuarial (gain) loss | (5,995 | ) | 26,369 | 8,985 | 15,590 | |||||||
Benefits paid, net of retiree subsidies received | (7,987 | ) | (7,682 | ) | (4,333 | ) | (4,445 | ) | ||||
Benefit obligation at end of year | $ | 297,835 | $ | 293,654 | $ | 175,090 | $ | 160,393 | ||||
Change in plan assets | ||||||||||||
Fair value of plan assets at beginning of year | $ | 249,875 | $ | 199,123 | $ | 62,035 | $ | 57,269 | ||||
Actual return on plan assets | 29,736 | 28,316 | 7,953 | 5,872 | ||||||||
Employer contributions | 74 | 30,071 | 6,049 | 3,235 | ||||||||
Benefits paid, net of plan participants’ contributions (2) | (7,942 | ) | (7,635 | ) | (4,503 | ) | (4,341 | ) | ||||
Fair value of plan assets at end of year | $ | 271,743 | $ | 249,875 | $ | 71,534 | $ | 62,035 | ||||
Funded status | $ | (26,092 | ) | $ | (43,779 | ) | $ | (103,556 | ) | $ | (98,358 | ) |
Amounts recognized on Consolidated Balance Sheets | ||||||||||||
Postemployment employee (liability) | ||||||||||||
Current | $ | (158 | ) | $ | (79 | ) | $ | (602 | ) | $ | (454 | ) |
Noncurrent | (25,934 | ) | (43,700 | ) | (102,954 | ) | (97,904 | ) | ||||
Total | $ | (26,092 | ) | $ | (43,779 | ) | $ | (103,556 | ) | $ | (98,358 | ) |
(1) | Includes the Company’s PEP. |
(2) | Prior to July 1, 1998, employees were eligible to elect an additional participant contribution to enhance their benefits and contributions made during the periods were insignificant. |
The actuarial gain on the Company’s pension plans is primarily due to an increase in the discount rate and the adoption of the MP-2016 mortality table. The actuarial loss related to the OPEB plans is primarily due to an increase in expected retiree healthcare claims, partially offset by an increase in the discount rate and the adoption of the MP-2016 mortality table.
The Company recognizes a liability for its underfunded benefit plans as required by the Compensation - Retirement Benefits Topic of the ASC. The Company records the offset to regulatory assets for the portion of liability relating to NJNG and to accumulated other comprehensive income for the portion of the liability related to its unregulated operations.
The following table summarizes the amounts recognized in regulatory assets and accumulated other comprehensive income as of September 30:
Regulatory Assets | Accumulated Other Comprehensive Income (Loss) | ||||||||||||
Pension | OPEB | Pension | OPEB | ||||||||||
Balance at September 30, 2015 | $ | 86,960 | $ | 50,737 | $ | 25,640 | $ | 1,242 | |||||
Amounts arising during the period: | |||||||||||||
Net actuarial loss | 13,696 | 11,274 | 4,475 | 3,289 | |||||||||
Amounts amortized to net periodic costs: | |||||||||||||
Net actuarial (loss) | (5,607 | ) | (3,175 | ) | (1,676 | ) | (99 | ) | |||||
Prior service (cost) credit | (108 | ) | 311 | (3 | ) | 54 | |||||||
Balance at September 30, 2016 | $ | 94,941 | $ | 59,147 | $ | 28,436 | $ | 4,486 | |||||
Amounts arising during the period: | |||||||||||||
Net actuarial (gain) loss | (9,429 | ) | 5,211 | (6,990 | ) | 587 | |||||||
Amounts amortized to net periodic costs: | |||||||||||||
Net actuarial (loss) | (6,799 | ) | (4,209 | ) | (2,028 | ) | (160 | ) | |||||
Prior service (cost) credit | (108 | ) | 311 | (3 | ) | 54 | |||||||
Balance at September 30, 2017 | $ | 78,605 | $ | 60,460 | $ | 19,415 | $ | 4,967 | |||||
Page 112
New Jersey Resources Corporation
Part II
ITEM 8. FINANCIAL STATEMENTS AND SUPPLEMENTARY DATA (Continued)
The amounts in regulatory assets and accumulated other comprehensive income not yet recognized as components of net periodic benefit cost as of September 30 are:
Regulatory Assets | Accumulated Other Comprehensive Income (Loss) | |||||||||||||||||||||||
Pension | OPEB | Pension | OPEB | |||||||||||||||||||||
(Thousands) | 2017 | 2016 | 2017 | 2016 | 2017 | 2016 | 2017 | 2016 | ||||||||||||||||
Net actuarial loss | $ | 77,930 | $ | 94,158 | $ | 61,563 | $ | 60,561 | $ | 19,414 | $ | 28,432 | $ | 5,113 | $ | 4,686 | ||||||||
Prior service cost (credit) | 675 | 783 | (1,103 | ) | (1,414 | ) | 1 | 4 | (146 | ) | (200 | ) | ||||||||||||
Total | $ | 78,605 | $ | 94,941 | $ | 60,460 | $ | 59,147 | $ | 19,415 | $ | 28,436 | $ | 4,967 | $ | 4,486 | ||||||||
To the extent the unrecognized amounts in accumulated other comprehensive income or regulatory assets exceed 10 percent of the greater of the benefit obligation or the fair value of plan assets, an amortized amount over the average expected future working lifetime of the active plan participants is recognized. Amounts included in regulatory assets and accumulated other comprehensive income expected to be recognized as components of net periodic benefit cost in fiscal 2018 are as follows:
Regulatory Assets | Accumulated Other Comprehensive Income (Loss) | ||||||||||||
(Thousands) | Pension | OPEB | Pension | OPEB | |||||||||
Net actuarial loss | $ | 6,177 | $ | 4,464 | $ | 1,360 | $ | 196 | |||||
Prior service cost (credit) | 105 | (311 | ) | 1 | (53 | ) | |||||||
Total | $ | 6,282 | $ | 4,153 | $ | 1,361 | $ | 143 | |||||
The accumulated benefit obligation for the pension plans, including the PEP, exceeded the fair value of plan assets. The projected benefit and accumulated benefit obligations and the fair value of plan assets as of September 30, are as follows:
Pension | ||||||
(Thousands) | 2017 | 2016 | ||||
Projected benefit obligation | $ | 297,835 | $ | 293,654 | ||
Accumulated benefit obligation | $ | 258,514 | $ | 252,077 | ||
Fair value of plan assets | $ | 271,743 | $ | 249,875 | ||
The components of the net periodic cost for pension benefits, including the Company’s PEP, and OPEB costs (principally health care and life insurance) for employees and covered dependents for fiscal years ended September 30, are as follows:
Pension | OPEB | |||||||||||||||||
(Thousands) | 2017 | 2016 | 2015 | 2017 | 2016 | 2015 | ||||||||||||
Service cost | $ | 8,347 | $ | 7,591 | $ | 7,485 | $ | 4,380 | $ | 4,521 | $ | 4,253 | ||||||
Interest cost | 9,771 | 11,342 | 10,199 | 5,545 | 6,256 | 5,739 | ||||||||||||
Expected return on plan assets | (19,313 | ) | (20,118 | ) | (17,090 | ) | (4,767 | ) | (4,845 | ) | (4,977 | ) | ||||||
Recognized actuarial loss | 8,827 | 7,281 | 6,985 | 4,370 | 3,274 | 2,943 | ||||||||||||
Prior service cost (credit) amortization | 111 | 111 | 111 | (365 | ) | (365 | ) | (364 | ) | |||||||||
Net periodic benefit cost recognized as expense | $ | 7,743 | $ | 6,207 | $ | 7,690 | $ | 9,163 | $ | 8,841 | $ | 7,594 | ||||||
Page 113
New Jersey Resources Corporation
Part II
ITEM 8. FINANCIAL STATEMENTS AND SUPPLEMENTARY DATA (Continued)
Assumptions
The weighted average assumptions used to determine the Company’s benefit costs during the fiscal years below and obligations as of September 30, are as follows:
Pension | OPEB | |||||||||||||||||
2017 | 2016 | 2015 | 2017 | 2016 | 2015 | |||||||||||||
Benefit costs: | ||||||||||||||||||
Discount rate | 3.96/3.94% | 4.50 | % | 4.55 | % | 4.08/4.01% | (1) | 4.60/4.55% | (1) | 4.55 | % | |||||||
Expected asset return | 7.75 | % | 8.75 | % | 8.75 | % | 7.75 | % | 8.75 | % | 8.75 | % | ||||||
Compensation increase | 3.25/3.50% | (1) | 3.25/3.50% | (1) | 3.25 | % | 3.25/3.50% | (1) | 3.50 | % | 3.50 | % | ||||||
Obligations: | ||||||||||||||||||
Discount rate | 4.03 | % | 3.96/3.94% | (1) | 4.50 | % | 4.12/4.08% | (1) | 4.08/4.01% | (1) | 4.60/4.55% | (1) | ||||||
Compensation increase | 3.25/3.50% | (1) | 3.25/3.50% | (1) | 3.25/3.50% | (1) | 3.25/3.50% | (1) | 3.50 | % | 3.50 | % | ||||||
(1) | Percentages for represented and nonrepresented plans, respectively. |
When measuring its projected benefit obligations, the Company uses an aggregate discount rate at which its obligation could be effectively settled. The Company determines a single weighted average discount rate based on a yield curve comprised of rates of return on a population of high quality debt issuances (AA- or better) whose cash flows (via coupons or maturities) match the timing and amount of its expected future benefit payments. Prior to October 1, 2016, the Company used the same assumed rate to measure the service and interest cost components of its net periodic benefit costs. Effective October 1, 2016, the Company changed its method of measuring its service and interest costs from the aggregate approach to a disaggregated, or spot rate, approach. Under the new approach, the Company applies the duration specific spot rates from the full yield curve, as of the measurement date, to each year’s future benefit payments. The Company believes that the new method provides for a more precise measurement of its service and interest costs by aligning the timing of the plans’ separate future cash flows to the corresponding spot rates on the yield curve. Accordingly, the Company accounted for this change prospectively as a change in accounting estimate.
Information relating to the assumed HCCTR used to determine expected OPEB benefits as of September 30, and the effect of a one percent change in the rate, are as follows:
($ in thousands) | 2017 | 2016 | 2015 | ||||||||
HCCTR | 8.3 | % | 8.5 | % | 6.7 | % | |||||
Ultimate HCCTR | 4.5 | % | 4.5 | % | 4.8 | % | |||||
Year ultimate HCCTR reached | 2025 | 2025 | 2022 | ||||||||
Effect of a 1 percentage point increase in the HCCTR on: | |||||||||||
Year-end benefit obligation | $ | 32,019 | $ | 28,803 | $ | 26,025 | |||||
Total service and interest cost | $ | 2,468 | $ | 2,331 | $ | 2,026 | |||||
Effect of a 1 percentage point decrease in the HCCTR on: | |||||||||||
Year-end benefit obligation | $ | (25,466 | ) | $ | (22,862 | ) | $ | (20,427 | ) | ||
Total service and interest costs | $ | (1,909 | ) | $ | (1,801 | ) | $ | (1,593 | ) | ||
The Company’s investment objective is a long-term real rate of return on assets before permissible expenses that is approximately 5 percent greater than the assumed rate of inflation, as measured by the consumer price index. The expected long-term rate of return is based on the asset categories in which the Company invests and the current expectations and historical performance for these categories.
The mix and targeted allocation of the pension and OPEB plans’ assets are as follows:
2018 | Assets at | ||||||||
Target | September 30, | ||||||||
Asset Allocation | Allocation | 2017 | 2016 | ||||||
U.S. equity securities | 40 | % | 39 | % | 38 | % | |||
International equity securities | 20 | 21 | 20 | ||||||
Fixed income | 40 | 40 | 42 | ||||||
Total | 100 | % | 100 | % | 100 | % | |||
Page 114
New Jersey Resources Corporation
Part II
ITEM 8. FINANCIAL STATEMENTS AND SUPPLEMENTARY DATA (Continued)
The Company adopted the revised mortality assumptions published by the Society of Actuaries for its pension and other postemployment benefit obligations, which reflected increased life expectancies in the United States. The adoption of the new mortality tables resulted in an increase to the projected benefit obligation for the plans.
The following benefit payments, which reflect expected future service, as appropriate, are expected to be paid during the following years:
(Thousands) | Pension | OPEB | ||||
2018 | $ | 8,928 | $ | 4,230 | ||
2019 | $ | 9,712 | $ | 4,807 | ||
2020 | $ | 10,549 | $ | 5,435 | ||
2021 | $ | 11,502 | $ | 6,061 | ||
2022 | $ | 12,469 | $ | 6,755 | ||
2023 - 2027 | $ | 79,081 | $ | 43,267 | ||
The Company’s OPEB plans provide prescription drug benefits that are actuarially equivalent to those provided by Medicare Part D. Therefore, under the Medicare Prescription Drug, Improvement and Modernization Act of 2003, the Company qualifies for federal subsidies.
The estimated subsidy payments are as follows:
Estimated Subsidy Payment | ||
Fiscal Year | (Thousands) | |
2018 | $262 | |
2019 | $283 | |
2020 | $311 | |
2021 | $342 | |
2022 | $373 | |
2023 - 2027 | $2,574 | |
Pension and OPEB assets held in the master trust, measured at fair value, as of September 30, are summarized as follows:
Quoted Prices in Active Markets for Identical Assets (Level 1) | |||||||||||||||
(Thousands) | Pension | OPEB | |||||||||||||
Assets | 2017 | 2016 | 2017 | 2016 | |||||||||||
Money market funds | $ | — | $ | — | $ | 11 | $ | 9 | |||||||
Registered Investment Companies: | |||||||||||||||
Equity Funds: | |||||||||||||||
Large Cap Index | 88,321 | 78,306 | 23,986 | 19,532 | |||||||||||
Extended Market Index | 16,329 | 16,250 | 4,409 | 4,114 | |||||||||||
International Stock | 56,446 | 50,702 | 15,000 | 12,997 | |||||||||||
Fixed Income Funds: | |||||||||||||||
Emerging Markets | 13,516 | 12,906 | 3,551 | 3,294 | |||||||||||
Core Fixed Income | — | — | 8,082 | 7,177 | |||||||||||
Opportunistic Income | — | — | 4,744 | 4,155 | |||||||||||
Ultra Short Duration | — | — | 4,673 | 4,082 | |||||||||||
High Yield Bond Fund | 26,540 | 25,976 | 7,078 | 6,675 | |||||||||||
Long Duration Fund | 70,591 | 65,735 | — | — | |||||||||||
Total assets at fair value | $ | 271,743 | $ | 249,875 | $ | 71,534 | $ | 62,035 | |||||||
The Plan had no Level 2 or Level 3 fair value measurements during fiscal 2017 and 2016, and there have been no changes in valuation methodologies as of September 30, 2017. The following is a description of the valuation methodologies used for assets measured at fair value:
Money Market funds — Represents bank balances and money market funds that are valued based on the net asset value of shares held at year end.
Page 115
New Jersey Resources Corporation
Part II
ITEM 8. FINANCIAL STATEMENTS AND SUPPLEMENTARY DATA (Continued)
Registered Investment Companies — Equity and fixed income funds valued at the net asset value of shares held by the plan at year end as reported on the active market on which the individual securities are traded.
The methods described above may produce a fair value calculation that may not be indicative of net realizable value or reflective of future fair values. Furthermore, while the Plan believes its valuation methods are appropriate and consistent with other market participants, the use of different methodologies or assumptions to determine the fair value of certain financial instruments could result in a different fair value measurement at the reporting date.
Defined Contribution Plan
The Company offers a Savings Plan to eligible employees. As of January 1, 2015, the Company matches 65 percent of participants’ contributions up to 6 percent of base compensation. Represented NJRHS employees, non-represented employees hired on or after October 1, 2009, and NJNG represented employees hired on or after January 1, 2012, are eligible for an employer special contribution of between 3 and 4 percent of base compensation, depending on years of service, into the Savings Plan on their behalf. The amount expensed and contributed for the matching provision of the Savings Plan was $2.9 million in fiscal 2017, $2.8 million in fiscal 2016 and $2.6 million in fiscal 2015. The amount contributed for the employer special contribution of the Savings Plan was $781,000 in fiscal 2017, $571,000 in fiscal 2016 and $461,000 in fiscal 2015.
12. ASSET RETIREMENT OBLIGATIONS
The Company recognizes AROs when the legal obligation to retire an asset has been incurred and a reasonable estimate of fair value can be made. Accordingly, the Company recognizes AROs related to the costs associated with cutting and capping its main and service gas distribution pipelines of NJNG, which is required by New Jersey law when taking such gas distribution pipeline out of service. The Company also recognizes AROs related to Clean Energy Ventures’ solar and wind assets when there are decommissioning provisions in Clean Energy Ventures’ lease agreements that require removal of the asset.
Accretion amounts associated with NJNG’s ARO is recognized as part of its depreciation expense and the corresponding regulatory asset and liability will be shown gross on the Consolidated Balance Sheets. During fiscal 2016, accretion amounts were not reflected as an expense, but rather were deferred as a regulatory asset and netted against NJNG’s regulatory liabilities, for presentation purposes, on the Consolidated Balance Sheets. Accretion amounts associated with Clean Energy Ventures’ ARO are recognized as a component of operations and maintenance expense on the Consolidated Statements of Operations.
The following is an analysis of the change in the Company’s AROs for the fiscal year ended September 30:
(Thousands) | 2017 | 2016 | |||||||||||
NJNG | NJRCEV | NJNG | NJRCEV | ||||||||||
Balance at October 1 | $ | 23,521 | $ | 4,858 | $ | 16,773 | $ | 2,372 | |||||
Accretion | 1,304 | 245 | 1,048 | 158 | |||||||||
Additions | 729 | 1,492 | 783 | 2,328 | |||||||||
Revisions in estimated cash flows | (245 | ) | — | 5,320 | — | ||||||||
Retirements | (484 | ) | — | (403 | ) | — | |||||||
Balance at period end | $ | 24,825 | $ | 6,595 | $ | 23,521 | $ | 4,858 | |||||
During fiscal 2016, NJNG revised its retirement assumptions to reflect an increase in inflation rates and construction costs. These increases, were discounted using the current credit adjusted risk free rate, resulting in an increase of approximately $5.3 million to the ARO liability.
Accretion for the next five years is estimated to be as follows:
(Thousands) | |||||
Fiscal Year Ended September 30, | Estimated Accretion | ||||
2018 | $ | 1,644 | |||
2019 | 1,718 | ||||
2020 | 1,795 | ||||
2021 | 1,877 | ||||
2022 | 1,960 | ||||
Total | $ | 8,994 | |||
Page 116
New Jersey Resources Corporation
Part II
ITEM 8. FINANCIAL STATEMENTS AND SUPPLEMENTARY DATA (Continued)
13. INCOME TAXES
A reconciliation of the U.S. federal statutory rate of 35 percent to the effective rate from operations for the fiscal years ended September 30, 2017, 2016 and 2015 is as follows:
(Thousands) | 2017 | 2016 | 2015 | ||||||
Statutory income tax expense | $ | 52,643 | $ | 54,321 | $ | 84,239 | |||
Change resulting from: | |||||||||
State income taxes | 8,222 | 6,044 | 8,233 | ||||||
Cost of removal of assets placed in service prior to1981 | (6,886 | ) | (5,738 | ) | (5,149 | ) | |||
Investment/production tax credits | (34,526 | ) | (32,491 | ) | (30,096 | ) | |||
Basis adjustment of solar assets due to ITC | 4,256 | 4,453 | 4,861 | ||||||
AFUDC equity | (2,624 | ) | (1,531 | ) | (1,339 | ) | |||
Other | (2,742 | ) | (1,528 | ) | (1,025 | ) | |||
Income tax provision | $ | 18,343 | $ | 23,530 | $ | 59,724 | |||
Effective income tax rate | 12.2 | % | 15.2 | % | 24.8 | % | |||
The income tax (benefit) provision from operations consists of the following:
(Thousands) | 2017 | 2016 | 2015 | ||||||
Current: | |||||||||
Federal | $ | (16,023 | ) | $ | (23,597 | ) | $ | 20,492 | |
State | 2,470 | (2,209 | ) | 5,473 | |||||
Deferred: | |||||||||
Federal | 54,965 | 70,386 | 56,480 | ||||||
State | 11,457 | 11,441 | 7,375 | ||||||
Investment/production tax credits | (34,526 | ) | (32,491 | ) | (30,096 | ) | |||
Income tax provision | $ | 18,343 | $ | 23,530 | $ | 59,724 | |||
The temporary differences, which give rise to deferred tax assets and (liabilities), consist of the following:
(Thousands) | 2017 | 2016 | |||||
Deferred tax assets | |||||||
Investment tax credits (1) | $ | 111,642 | $ | 76,517 | |||
Deferred service contract revenue | 3,877 | 3,601 | |||||
Incentive compensation | 6,260 | 8,128 | |||||
Fair value of derivatives | 11,519 | 1,179 | |||||
Federal net operating losses | 28,487 | 27,541 | |||||
State net operating losses | 23,597 | 18,113 | |||||
Overrecovered gas costs | — | 3,831 | |||||
Other | 13,845 | 11,668 | |||||
Total deferred tax assets | $ | 199,227 | $ | 150,578 | |||
Deferred tax liabilities | |||||||
Property related items | $ | (620,850 | ) | $ | (532,027 | ) | |
Remediation costs | (11,625 | ) | (7,928 | ) | |||
Equity investments | (38,370 | ) | (37,740 | ) | |||
Postemployment benefits | (6,855 | ) | (7,902 | ) | |||
Conservation incentive plan | (7,195 | ) | (14,953 | ) | |||
Underrecovered gas costs | (4,035 | ) | — | ||||
Other | (16,643 | ) | (14,610 | ) | |||
Total deferred tax liabilities | $ | (705,573 | ) | $ | (615,160 | ) | |
Total net deferred tax liabilities | $ | (506,346 | ) | $ | (464,582 | ) | |
(1) | Includes $2.3 million and $2.5 million for NJNG for fiscal 2017 and 2016, respectively, which is being amortized over the life of the related assets, and$109.3 million and $74 million for Clean Energy Ventures for fiscal 2017 and 2016, respectively, which is ITC carryforward. |
Page 117
New Jersey Resources Corporation
Part II
ITEM 8. FINANCIAL STATEMENTS AND SUPPLEMENTARY DATA (Continued)
The Company and one or more of its subsidiaries files or expects to file income and/or franchise tax returns in the U.S. Federal jurisdiction and in the states of Colorado, Connecticut, Delaware, Iowa, Kansas, Louisiana, Maryland, Montana, New Jersey, New York, North Carolina, Pennsylvania, South Carolina, Texas, Utah, Virginia and the City of New York. The Company neither files in, nor believes it has a filing requirement in, any foreign jurisdictions other than Canada. Due to certain available tax treaty benefits, the Company incurs no tax liability in Canada.
The Company’s federal income tax returns through fiscal 2013 have either been reviewed by the IRS, or the related statute of limitations has expired and all matters have been settled. Federal income tax returns for periods subsequent to fiscal 2013 are not currently under examination by the IRS.
The State of New Jersey is currently conducting a sales and use tax examination for the period from July 1, 2011 through June 30, 2016. All periods subsequent to those ended September 30, 2013, are statutorily open to examination in all applicable states with the exception of New York. In New York, all periods subsequent to September 30, 2014, are statutorily open to examination.
The Company evaluates its tax positions to determine the appropriate accounting and recognition of potential future obligations associated with unrecognized tax benefits. As of September 30, 2017 and 2016, based on its analysis, the Company determined there was no need to recognize any liabilities associated with uncertain tax positions.
As of September 30, 2017 and 2016, the Company has consolidated federal income tax net operating losses of approximately $125.3 million and $78.7 million, respectively, which generally can be carried back two years and forward 20 years. The Company plans to exercise its ability to carryback its federal net operating losses. Additionally, as of September 30, 2017 and 2016, the Company has state income tax net operating losses of approximately $471.7 million and $310.6 million, respectively. These state net operating losses have varying carry forward periods dictated by the state in which they were incurred; these state carry forward periods range from seven to 20 years. The Company has recorded deferred federal and state tax assets of approximately $52.1 million and federal income tax receivables of approximately$15.4 million on the Consolidated Balance Sheets, reflecting the tax benefit associated with the loss carrybacks.
The Company recorded a valuation allowance associated with state net operating loss carryforwards of $1 million related to NJRCEV in the state of Montana, as of September 30, 2017, and $262,000 related to CR&R in the state of New Jersey, as of September 30, 2016, which was deemed more likely than not to be realized prior to expiration and therefore was released during fiscal 2017.
In addition, as of September 30, 2017, the Company has an ITC/PTC carryforward of approximately $109.3 million, which has a life of 20 years. This carryforward will begin to expire in fiscal 2035. The Company expects to utilize this entire carryforward.
The deferred tax assets will expire as follows:
(Thousands) | |||
Fiscal years 2018 - 2022 | $ | 313 | |
Fiscal years 2023 - 2027 | 1,051 | ||
Fiscal years 2028 - 2032 | 796 | ||
Fiscal years 2033 - 2037 | 159,237 | ||
Total | $ | 161,397 | |
In December 2015, the Consolidated Appropriations Act extended the 30 percent ITC for solar property that is under construction on or before December 31, 2019. The credit will decline to 26 percent for property under construction during 2020, and to 22 percent for property under construction during 2021. For any property that is under construction before 2022, but not placed in service before 2024, the ITC will be reduced to 10 percent. In addition, the Consolidated Appropriations Act retroactively extended the PTC for five years through December 31, 2019, with a gradual three-year phase out for any project for which construction of the facility begins after December 31, 2016.
Page 118
New Jersey Resources Corporation
Part II
ITEM 8. FINANCIAL STATEMENTS AND SUPPLEMENTARY DATA (Continued)
14. COMMITMENTS AND CONTINGENT LIABILITIES
Cash Commitments
NJNG has entered into long-term contracts, expiring at various dates through October 2033, for the supply, storage and transportation of natural gas. These contracts include annual fixed charges of approximately $98.6 million at current contract rates and volumes, which are recoverable through BGSS.
For the purpose of securing storage and pipeline capacity, our Energy Services segment enters into storage and pipeline capacity contracts, which require the payment of certain demand charges by Energy Services to maintain the ability to access such natural gas storage or pipeline capacity, during a fixed time period, which generally ranges from one to 10 years. Demand charges are established by interstate storage and pipeline operators and are regulated by FERC. These demand charges represent commitments to pay storage providers or pipeline companies for the right to store and/or transport natural gas utilizing their respective assets.
Commitments as of September 30, 2017, for natural gas purchases and future demand fees for the next five fiscal year periods, are as follows:
(Thousands) | 2018 | 2019 | 2020 | 2021 | 2022 | Thereafter | ||||||||||||
Energy Services: | ||||||||||||||||||
Natural gas purchases | $ | 296,491 | $ | 114,817 | $ | 22,270 | $ | 11,488 | $ | — | $ | — | ||||||
Storage demand fees | 32,870 | 22,638 | 13,350 | 9,041 | 5,833 | 2,746 | ||||||||||||
Pipeline demand fees | 55,916 | 32,412 | 23,804 | 21,621 | 19,653 | 19,311 | ||||||||||||
Sub-total Energy Services | $ | 385,277 | $ | 169,867 | $ | 59,424 | $ | 42,150 | $ | 25,486 | $ | 22,057 | ||||||
NJNG: | ||||||||||||||||||
Natural gas purchases | $ | 51,050 | $ | 41,156 | $ | 2,514 | $ | — | $ | — | $ | — | ||||||
Storage demand fees | 30,042 | 26,628 | 15,331 | 8,231 | 7,804 | 3,903 | ||||||||||||
Pipeline demand fees | 68,544 | 102,091 | 100,909 | 91,231 | 89,859 | 642,481 | ||||||||||||
Sub-total NJNG | $ | 149,636 | $ | 169,875 | $ | 118,754 | $ | 99,462 | $ | 97,663 | $ | 646,384 | ||||||
Total | $ | 534,913 | $ | 339,742 | $ | 178,178 | $ | 141,612 | $ | 123,149 | $ | 668,441 | ||||||
As of September 30, 2017, the Company’s future minimum lease payments under various operating leases will not be more than $2.6 million annually for the next five years and $38.3 million in the aggregate for all years thereafter.
Guarantees
As of September 30, 2017, there were NJR guarantees covering approximately $331.4 million of Energy Services’ natural gas purchases and demand fee commitments not yet reflected in accounts payable on the Consolidated Balance Sheets.
Legal Proceedings
Manufactured Gas Plant Remediation
NJNG is responsible for the remedial cleanup of five MGP sites, dating back to gas operations in the late 1800s and early 1900s, which contain contaminated residues from former gas manufacturing operations. NJNG is currently involved in administrative proceedings with the NJDEP, and participating in various studies and investigations by outside consultants, to determine the nature and extent of any such contaminated residues and to develop appropriate programs of remedial action, where warranted, under Administrative Consent Orders or Memoranda of Agreement with the NJDEP.
NJNG may recover its remediation expenditures, including carrying costs, over rolling seven-year periods pursuant to a RAC approved by the BPU. NJNG currently recovers approximately$9.4 million annually through its SBC RAC. On November 17, 2017, NJNG filed it's annual SBC application requesting a reduction in the RAC, which will decrease the annual recovery to $7 million, effective April 1, 2018. As of September 30, 2017, $28.5 million of previously incurred remediation costs, net of recoveries from customers and insurance proceeds, are included in regulatory assets on the Consolidated Balance Sheets.
Page 119
New Jersey Resources Corporation
Part II
ITEM 8. FINANCIAL STATEMENTS AND SUPPLEMENTARY DATA (Continued)
NJNG periodically, and at least annually, performs an environmental review of the MGP sites, including a review of potential liability for investigation and remedial action. NJNG estimated at the time of the most recent review that total future expenditures to remediate and monitor the five MGP sites for which it is responsible, including potential liabilities for Natural Resource Damages that might be brought by the NJDEP for alleged injury to groundwater or other natural resources concerning these sites, will range from approximately $117.6 million to $205.2 million. NJNG’s estimate of these liabilities is based upon known facts, existing technology and enacted laws and regulations in place when the review was completed. Where it is probable that costs will be incurred, and the information is sufficient to establish a range of possible liability, NJNG accrues the most likely amount in the range. If no point within the range is more likely than the other, it is NJNG’s policy to accrue the lower end of the range. Accordingly, as of September 30, 2017, NJNG recorded an MGP remediation liability and a corresponding regulatory asset of $149 million on the Consolidated Balance Sheets, based on the most likely amount. This was reduced from $172 million in fiscal 2016, due to the completion of remediation work at some of sites and a reduction to the remediation scope at another site. The actual costs to be incurred by NJNG are dependent upon several factors, including final determination of remedial action, changing technologies and governmental regulations, the ultimate ability of other responsible parties to pay and any insurance recoveries.
NJNG will continue to seek recovery of MGP-related costs through the RAC. If any future regulatory position indicates that the recovery of such costs is not probable, the related non-recoverable costs would be charged to income in the period of such determination.
Litigation
The Company is involved, and from time to time in the future may be involved, in a number of pending and threatened judicial, regulatory and arbitration proceedings relating to matters that arise in connection with the conduct of its business. In view of the inherent difficulty of predicting the outcome of litigation matters, particularly when such matters are in their early stages or where the claimants seek indeterminate damages, the Company cannot state with confidence what the eventual outcome of the pending litigation will be, what the timing of the ultimate resolution of these matters will be, or what the eventual loss, fines or penalties related to each pending matter will be, if any. In accordance with applicable accounting guidance, NJR establishes reserves for litigation for those matters that present loss contingencies as to which it is both probable that a loss will be incurred and the amount of such loss can be reasonably estimated. Based upon currently available information, NJR believes that the results of litigation that is currently pending, taken together, will not have a materially adverse effect on the Company’s financial condition, results of operations or cash flows. The actual results of resolving the pending litigation matters may be substantially higher than the amounts reserved.
The foregoing statements about NJR’s litigation are based upon the Company’s judgments, assumptions and estimates and are necessarily subjective and uncertain. The Company has a number of threatened and pending litigation matters at various stages. Certain of the Company’s significant litigation is described below.
On February 24, 2015, a natural gas fire and explosion occurred in Stafford Township, New Jersey as a result of a natural gas leak emanating from an underground pipe. There were no fatalities, although several employees of NJNG were injured and several homes were damaged. NJNG notified its insurance carrier and believes that any costs associated with the incident, including attorneys’ fees, property damage and other losses, will be substantially covered by insurance. The Company believes the resolution of any potential claims associated with the incident will not have a material effect on its financial condition, results of operations or cash flows. As of September 30, 2017, NJNG estimates that liabilities associated with claims will range between $600,000 and $3.2 million and has accrued the lower end of the range.
15. REPORTING SEGMENT AND OTHER OPERATIONS DATA
The Company organizes its businesses based on a combination of factors, including its products and its regulatory environment. As a result, the Company manages its businesses through the following reporting segments and other operations: the Natural Gas Distribution segment consists of regulated energy and off-system, capacity and storage management operations; the Clean Energy Ventures segment consists of capital investments in clean energy projects; the Energy Services segment consists of unregulated wholesale and retail energy operations; the Midstream segment consists of the Company’s investments in natural gas transportation and storage facilities; the Home Services and Other operations consist of heating, cooling and water appliance sales, installations and services, other investments and general corporate activities.
Page 120
New Jersey Resources Corporation
Part II
ITEM 8. FINANCIAL STATEMENTS AND SUPPLEMENTARY DATA (Continued)
Information related to the Company’s various reporting segments and other operations is detailed below:
(Thousands) | |||||||||
Fiscal Years Ended September 30, | 2017 | 2016 | 2015 | ||||||
Operating revenues | |||||||||
Natural Gas Distribution | |||||||||
External customers | $ | 695,637 | $ | 594,346 | $ | 781,970 | |||
Clean Energy Ventures | |||||||||
External customers | 64,394 | 53,540 | 32,513 | ||||||
Energy Services | |||||||||
External customers (1) | 1,462,365 | 1,187,754 | 1,872,781 | ||||||
Intercompany | 316 | 9,499 | 61,526 | ||||||
Subtotal | 2,222,712 | 1,845,139 | 2,748,790 | ||||||
Home Services and Other | |||||||||
External customers | 46,221 | 45,265 | 46,723 | ||||||
Intercompany | 3,370 | 3,232 | 1,980 | ||||||
Eliminations | (3,686 | ) | (12,731 | ) | (63,506 | ) | |||
Total | $ | 2,268,617 | $ | 1,880,905 | $ | 2,733,987 | |||
Depreciation and amortization | |||||||||
Natural Gas Distribution | $ | 49,347 | $ | 47,828 | $ | 43,085 | |||
Clean Energy Ventures | 31,834 | 23,971 | 17,297 | ||||||
Energy Services | 63 | 88 | 90 | ||||||
Midstream | 6 | 6 | 6 | ||||||
Subtotal | 81,250 | 71,893 | 60,478 | ||||||
Home Services and Other | 798 | 981 | 952 | ||||||
Eliminations | (207 | ) | (126 | ) | (31 | ) | |||
Total | $ | 81,841 | $ | 72,748 | $ | 61,399 | |||
Interest income (2) | |||||||||
Natural Gas Distribution | $ | 555 | $ | 115 | $ | 336 | |||
Clean Energy Ventures | — | — | 26 | ||||||
Energy Services | 6 | 98 | 438 | ||||||
Midstream | 2,195 | 1,524 | 977 | ||||||
Subtotal | 2,756 | 1,737 | 1,777 | ||||||
Home Services and Other | 590 | 397 | 217 | ||||||
Eliminations | (1,312 | ) | (2,006 | ) | (1,414 | ) | |||
Total | $ | 2,034 | $ | 128 | $ | 580 | |||
(1) | Includes sales to Canada, which accounted for .8, 2 and 3.7 percent of total operating revenues during fiscal 2017, 2016 and 2015, respectively. |
(2) | Included in other income, net on the Consolidated Statements of Operations. |
Page 121
New Jersey Resources Corporation
Part II
ITEM 8. FINANCIAL STATEMENTS AND SUPPLEMENTARY DATA (Continued)
(Thousands) | |||||||||
Fiscal Years Ended September 30, | 2017 | 2016 | 2015 | ||||||
Interest expense, net of capitalized interest | |||||||||
Natural Gas Distribution | $ | 25,818 | $ | 19,930 | $ | 18,534 | |||
Clean Energy Ventures | 16,263 | 10,304 | 7,635 | ||||||
Energy Services | 2,747 | 1,095 | 1,209 | ||||||
Midstream | 960 | 287 | 717 | ||||||
Subtotal | 45,788 | 31,616 | 28,095 | ||||||
Home Services and Other | 410 | 252 | 49 | ||||||
Eliminations | (1,312 | ) | (824 | ) | (423 | ) | |||
Total | $ | 44,886 | $ | 31,044 | $ | 27,721 | |||
Income tax (benefit) provision | |||||||||
Natural Gas Distribution | $ | 43,485 | $ | 34,951 | $ | 39,544 | |||
Clean Energy Ventures | (31,161 | ) | (26,592 | ) | (26,968 | ) | |||
Energy Services | (4,015 | ) | 7,030 | 39,043 | |||||
Midstream | 5,820 | 6,130 | 6,849 | ||||||
Subtotal | 14,129 | 21,519 | 58,468 | ||||||
Home Services and Other | 3,857 | 1,387 | 1,551 | ||||||
Eliminations | 357 | 624 | (295 | ) | |||||
Total | $ | 18,343 | $ | 23,530 | $ | 59,724 | |||
Equity in earnings of affiliates | |||||||||
Midstream | $ | 17,797 | $ | 13,936 | $ | 17,487 | |||
Eliminations | (3,984 | ) | (4,421 | ) | (4,078 | ) | |||
Total | $ | 13,813 | $ | 9,515 | $ | 13,409 | |||
Net financial earnings | |||||||||
Natural Gas Distribution | $ | 86,930 | $ | 76,104 | $ | 76,287 | |||
Clean Energy Ventures | 24,873 | 28,393 | 20,101 | ||||||
Energy Services | 18,554 | 21,934 | 42,122 | ||||||
Midstream | 12,857 | 9,406 | 9,780 | ||||||
Subtotal | 143,214 | 135,837 | 148,290 | ||||||
Home Services and Other | 6,811 | 2,882 | 3,420 | ||||||
Eliminations | (633 | ) | (634 | ) | (207 | ) | |||
Total | $ | 149,392 | $ | 138,085 | $ | 151,503 | |||
Capital expenditures | |||||||||
Natural Gas Distribution | $ | 176,249 | $ | 205,133 | $ | 168,875 | |||
Clean Energy Ventures | 149,400 | 149,063 | 151,002 | ||||||
Subtotal | 325,649 | 354,196 | 319,877 | ||||||
Home Services and Other | 2,434 | 1,896 | 209 | ||||||
Total | $ | 328,083 | $ | 356,092 | $ | 320,086 | |||
Investments in equity investees | |||||||||
Midstream | 27,070 | 11,176 | 5,780 | ||||||
Total | $ | 27,070 | $ | 11,176 | $ | 5,780 | |||
Page 122
New Jersey Resources Corporation
Part II
ITEM 8. FINANCIAL STATEMENTS AND SUPPLEMENTARY DATA (Continued)
The Chief Executive Officer, who uses NFE as a measure of profit or loss in measuring the results of the Company’s reporting segments and operations, is the chief operating decision maker of the Company. A reconciliation of consolidated NFE to consolidated net income is as follows:
(Thousands) | 2017 | 2016 | 2015 | ||||||
Consolidated net financial earnings | $ | 149,392 | $ | 138,085 | $ | 151,503 | |||
Less: | |||||||||
Unrealized (gain) loss on derivative instruments and related transactions | (11,241 | ) | 46,883 | (38,681 | ) | ||||
Tax effect | 4,062 | (17,018 | ) | 14,391 | |||||
Effects of economic hedging related to natural gas inventory | 38,470 | (36,816 | ) | (8,225 | ) | ||||
Tax effect | (13,964 | ) | 13,364 | 3,058 | |||||
Consolidated net income | $ | 132,065 | $ | 131,672 | $ | 180,960 | |||
The Company uses derivative instruments as economic hedges of purchases and sales of physical gas inventory. For GAAP purposes, these derivatives are recorded at fair value and related changes in fair value are included in reported earnings. Revenues and cost of gas related to physical gas flow is recognized when the gas is delivered to customers. Consequently, there is a mismatch in the timing of earnings recognition between the economic hedges and physical gas flows. Timing differences occur in two ways:
• | Unrealized gains and losses on derivatives are recognized in reported earnings in periods prior to physical gas inventory flows; and |
• | Unrealized gains and losses of prior periods are reclassified as realized gains and losses when derivatives are settled in the same period as physical gas inventory movements occur. |
NFE is a measure of the earnings based on eliminating these timing differences, to effectively match the earnings effects of the economic hedges with the physical sale of gas, SRECs and foreign currency contracts. Consequently, to reconcile between net income and NFE, current period unrealized gains and losses on the derivatives are excluded from NFE as a reconciling item. Additionally, realized derivative gains and losses are also included in current period net income. However, NFE includes only realized gains and losses related to natural gas sold out of inventory, effectively matching the full earnings effects of the derivatives with realized margins on physical gas flows. The Company also calculates a quarterly tax adjustment based on an estimated annual effective tax rate for NFE purposes.
The Company’s assets for the various reporting segments and business operations are detailed below:
(Thousands) | 2017 | 2016 | 2015 | ||||||
Assets at end of period: | |||||||||
Natural Gas Distribution | $ | 2,519,578 | $ | 2,517,401 | $ | 2,305,293 | |||
Clean Energy Ventures | 771,340 | 665,696 | 504,885 | ||||||
Energy Services | 398,277 | 327,626 | 260,021 | ||||||
Midstream | 232,806 | 186,259 | 182,007 | ||||||
Subtotal | 3,922,001 | 3,696,982 | 3,252,206 | ||||||
Home Services and Other | 114,801 | 109,487 | 88,880 | ||||||
Intercompany assets (1) | (108,295 | ) | (87,899 | ) | (56,729 | ) | |||
Total | $ | 3,928,507 | $ | 3,718,570 | $ | 3,284,357 | |||
(1) | Consists of transactions between subsidiaries that are eliminated and reclassified in consolidation. |
16. RELATED PARTY TRANSACTIONS
In January 2010, NJNG entered into a 10-year agreement effective April 1, 2010, for 3 Bcf of firm storage capacity with Steckman Ridge. Under the terms of the agreement, NJNG incurs demand fees, at market rates, of approximately $9.3 million annually, a portion of which is eliminated in consolidation. These fees are recoverable through NJNG’s BGSS mechanism and are included in regulatory assets.
Energy Services may periodically enter into storage or park and loan agreements with its affiliated FERC-regulated natural gas storage facility, Steckman Ridge. As of September 30, 2017, Energy Services has entered into storage and park and loan transactions with Steckman Ridge for varying terms, all of which expire by October 31, 2020.
Page 123
New Jersey Resources Corporation
Part II
ITEM 8. FINANCIAL STATEMENTS AND SUPPLEMENTARY DATA (Continued)
Demand fees, net of eliminations, associated with Steckman Ridge during the fiscal years ended September 30, are as follows:
(Thousands) | 2017 | 2016 | 2015 | ||||||
NJNG | $ | 5,590 | $ | 5,562 | $ | 5,700 | |||
Energy Services | 2,750 | 2,789 | 1,957 | ||||||
Total | $ | 8,340 | $ | 8,351 | $ | 7,657 | |||
The following table summarizes demand fees payable to Steckman Ridge as of September 30:
(Thousands) | 2017 | 2016 | ||||
NJNG | $ | 775 | $ | 775 | ||
Energy Services | 377 | 375 | ||||
Total | $ | 1,152 | $ | 1,150 | ||
NJNG and Energy Services have entered into various asset management agreements, the effects of which are eliminated in consolidation. Under the terms of these agreements, NJNG releases certain transportation and storage contracts to Energy Services. NJNG retains the right to purchase market priced gas or fixed price storage gas from Energy Services. As of September 30, 2017, NJNG and Energy Services had four asset management agreements with expiration dates ranging from October 31, 2017 through October 31, 2020.
NJNG has entered into a 15-year transportation precedent agreement for committed capacity of 180,000 Dths per day with PennEast, to commence when in service.
17. SELECTED QUARTERLY FINANCIAL DATA (UNAUDITED)
A summary of financial data for each quarter of fiscal 2017 and 2016 follows. Due to the seasonal nature of the Company’s businesses, quarterly amounts vary significantly during the fiscal year. In the opinion of management, the information furnished reflects all adjustments necessary for a fair presentation of the results of the interim periods.
First | Second | Third | Fourth | |||||||||
(Thousands, except per share data) | Quarter | Quarter | Quarter | Quarter | ||||||||
2017 | ||||||||||||
Operating revenues | $ | 541,028 | $ | 733,546 | $ | 457,523 | $ | 536,520 | ||||
Operating income (loss) | $ | 41,475 | $ | 139,653 | $ | 17,967 | $ | (32,051 | ) | |||
Net income (loss) | $ | 34,929 | $ | 114,702 | $ | 18,957 | $ | (36,523 | ) | |||
Earnings (loss) per share (1) | ||||||||||||
Basic | $0.41 | $1.33 | $0.22 | $(0.42) | ||||||||
Diluted | $0.40 | $1.32 | $0.22 | $(0.42) | ||||||||
2016 | ||||||||||||
Operating revenues | $ | 444,258 | $ | 574,193 | $ | 393,213 | $ | 469,241 | ||||
Operating income (loss) | $ | 59,451 | $ | 93,933 | $ | (28,329 | ) | $ | 42,480 | |||
Net income (loss) | $ | 50,281 | $ | 73,354 | $ | (17,363 | ) | $ | 25,400 | |||
Earnings (loss) per share (1) | ||||||||||||
Basic | $0.59 | $0.85 | $(0.20) | $0.30 | ||||||||
Diluted | $0.58 | $0.84 | $(0.20) | $0.29 | ||||||||
(1) | The sum of quarterly amounts may not equal the annual amounts due to rounding. |
18. SUBSEQUENT EVENTS
Acquisition
On October 27, 2017, Adelphia, an indirect wholly owned subsidiary of NJR, entered into a Purchase and Sale Agreement with Talen pursuant to which Adelphia will acquire all of Talen’s membership interests in IEC for a base purchase price of $166 million. which includes a $10 million initial payment. As additional consideration, Adelphia will pay Talen specified amounts of up to $23 million contingent upon the achievement of certain regulatory approvals and binding natural gas capacity commitments.
Page 124
New Jersey Resources Corporation
Part II
ITEM 8. FINANCIAL STATEMENTS AND SUPPLEMENTARY DATA (Continued)
IEC owns an existing 84-mile pipeline in southeastern Pennsylvania. The transaction is expected to close following receipt of necessary permits and regulatory actions including those from the FERC and the Pennsylvania Public Utility Commission. Upon the closing of the transactions contemplated by the purchase and sale agreement, Adelphia will acquire IEC and, with it, IEC’s existing pipeline, related assets and rights of way. Adelphia has also agreed to provide firm natural gas transportation service for ten years following the closing to two power generators owned by affiliates of Talen that are currently served by IEC.
ITEM 9. CHANGES IN AND DISAGREEMENTS WITH ACCOUNTANTS ON ACCOUNTING AND FINANCIAL
DISCLOSURE
None
ITEM 9A. CONTROLS AND PROCEDURES
Disclosure Controls and Procedures
Under the supervision and with the participation of the Company’s management, including the principal executive officer and principal financial officer, the Company conducted an evaluation of the effectiveness of the design and operation of its disclosure controls and procedures (as defined in Rules 13a-15(e) and 15d-15(e) under the Exchange Act), as of the end of the period covered by this report. Based on this evaluation, the Company’s principal executive officer and principal financial officer concluded that, as of end of the period covered by this report, the Company’s disclosure controls and procedures are effective to ensure that information required to be disclosed by the Company in the reports that it files or submits under the Exchange Act is recorded, processed, summarized and reported, within the time periods specified in the SEC’s rules and forms, and that such information is accumulated and communicated to the Company’s management, including its principal executive officer and principal financial officer, as appropriate, to allow timely decisions regarding required disclosure.
Management’s Annual Report on Internal Control over Financial Reporting
The report of management required under this Item 9A is contained in Item 8 of this Form 10-K under the caption Management’s Report on Internal Control over Financial Reporting.
Attestation Report of Registered Public Accounting Firm
The attestation report required under this Item 9A is contained in Item 8 of this 10-K under the caption Report of Independent Registered Public Accounting Firm.
Changes in Internal Control over Financial Reporting
There has been no change in internal control over financial reporting (as such term is defined in Exchange Act Rule 13a-15(f)) that occurred during the quarter ended September 30, 2017, that has materially affected, or is reasonably likely to materially affect, internal control over financial reporting, except for changes implemented related to non-recurring transaction controls for business combinations and controls related to customer billing for NJRRS. These changes were implemented to enhance our internal control over financial reporting and not in response to any finding of a significant deficiency or a material weakness.
ITEM 9B. OTHER INFORMATION
None
Page 125
New Jersey Resources Corporation
Part III
ITEM 10. DIRECTORS AND EXECUTIVE OFFICERS AND CORPORATE GOVERNANCE
Information required by this item, including information concerning the Board of Directors of the Company, the members of the Company’s Audit Committee, the Company’s Audit Committee Financial Expert, compliance with Section 16(a) of the Exchange Act and shareowner proposals, is incorporated by reference to the Company’s Proxy Statement for the 2018 Annual Meeting of Shareowners, which will be filed with the SEC pursuant to Regulation 14A within 120 days after September 30, 2017. The information regarding executive officers is included in this report following as Item 4A under the caption Executive Officers of the Company and incorporated herein by reference.
The Board of Directors has adopted the Code of Conduct, a code for all directors, officers and employees, as required by the New York Stock Exchange rules, and governing the chief executive officer and senior financial officers, in compliance with Sarbanes-Oxley and SEC regulations. Copies of the Code of Conduct are available free of charge on the Company’s website at http://investor.njresources.com under the caption Corporate Governance. A printed copy of the Code of Conduct is available free of charge to any shareowner who requests it by contacting the Corporate Secretary at 1415 Wyckoff Road, Wall, New Jersey 07719. The Company will disclose any amendments to, or waivers from, a provision of the Code of Conduct that applies to the principal executive officer, principal financial officer, principal accounting officer or controller, or persons performing similar functions that relate to any element of the Code of Conduct as defined in Item 406 of Regulation S-K by posting such information on the Company’s website.
ITEM 11. EXECUTIVE COMPENSATION
Information required by this Item is incorporated by reference from the Registrant’s Proxy Statement.
ITEM 12. SECURITY OWNERSHIP OF CERTAIN BENEFICIAL OWNERS AND MANAGEMENT AND
RELATED STOCKHOLDER MATTERS
Information required by this Item is incorporated by reference from the Registrant’s Proxy Statement.
ITEM 13. CERTAIN RELATIONSHIPS AND RELATED TRANSACTIONS AND DIRECTOR INDEPENDENCE
Information required by this Item is incorporated by reference from the Registrant’s Proxy Statement.
ITEM 14. PRINCIPAL ACCOUNTANT FEES AND SERVICES
Information required by this Item is incorporated by reference from the Registrant’s Proxy Statement.
Page 126
New Jersey Resources Corporation
Part IV
ITEM 15. EXHIBITS AND FINANCIAL STATEMENT SCHEDULES
(a) 1. Financial Statements. | ||
All Financial Statements of the Registrant are filed as part of this report and included in Item 8 of Part II of this Form 10-K. | ||
(a) 2. Financial Statement Schedules-See Index to Financial Statement Schedules in Item 8. | ||
(a) 3. Exhibits-See Exhibit Index on page | 130. | |
Page 127
New Jersey Resources Corporation
Part IV
INDEX TO FINANCIAL STATEMENT SCHEDULES
Page | ||
Schedule II - Valuation and qualifying accounts and reserves for each of the three years in the period ended September 30, 2017 | ||
Schedules other than those listed above are omitted because they are either not required or are not applicable, or the required information is shown in the financial statements or notes thereto.
Page 128
New Jersey Resources Corporation
Part IV
SCHEDULE II
VALUATION AND QUALIFYING ACCOUNTS
YEARS ENDED SEPTEMBER 30, 2017, 2016 and 2015
(Thousands) | ADDITIONS | |||||||||
CLASSIFICATION | BEGINNING BALANCE | CHARGED TO EXPENSE | OTHER (1) | ENDING BALANCE | ||||||
2017 | ||||||||||
Allowance for doubtful accounts | $ | 4,865 | 2,023 | (1,707 | ) | $ | 5,181 | |||
2016 | ||||||||||
Allowance for doubtful accounts | $ | 5,189 | 1,616 | (1,940 | ) | $ | 4,865 | |||
2015 | ||||||||||
Allowance for doubtful accounts | $ | 5,357 | 2,859 | (3,027 | ) | $ | 5,189 | |||
(1) | Uncollectible accounts written off, less recoveries and adjustments. |
Page 129
New Jersey Resources Corporation
Part IV
EXHIBIT INDEX
Exhibit Number | Exhibit Description |
2.1* | Purchase and Sale Agreement, dated as of October 27, 2017, by and between Talen Generation, LLC, and Adelphia Gateway, LLC (incorporated by reference to Exhibit 2.1 to the Current Report on Form 8-K, as filed on November 2, 2017) |
3.1 | Restated Certificate of Incorporation of New Jersey Resources Corporation, as amended through March 3, 2015 (incorporated by reference to Exhibit 3.1 to the Current Report on Form 8-K, as filed on January 23, 2014, and Exhibit 3.1 to the Current Report on Form 8-K, as filed on March 3, 2015) |
3.2 | Bylaws of New Jersey Resources Corporation, as amended through September 12, 2016 (incorporated by reference to Exhibit 3.1 to the Current Report on Form 8-K, as filed on September 12, 2016) |
4.1 | Specimen Common Stock Certificate (incorporated by reference to Exhibit 4.1 to the Annual Report on Form 10-K for the year ended September 30, 2013, as filed on November 25, 2013) |
4.2 | Amended and Restated Indenture of Mortgage, Deed of Trust and Security Agreement, dated as of September 1, 2014, between NJNG and U.S. Bank National Association, as Trustee (incorporated by reference to Exhibit 99.3 to the Current Report on Form 8-K, as filed on September 30, 2014) |
4.2(a) | 36th Supplemental Indenture dated as of September 1, 2014, between NJNG and U.S. Bank National Association, as Trustee (incorporated by reference to Exhibit 99.2 to the Current Report on Form 8-K, as filed on September 30, 2014) |
4.2(b) | Second Supplemental Indenture dated as of June 1, 2016, between New Jersey Natural Gas Company and U.S. Bank National Association, as Trustee (incorporated by reference to Exhibit 4.2 to Form 8-K as filed on June 22, 2016) |
4.3 | $250,000,000 Credit Agreement dated as of May 15, 2014, by and among New Jersey Natural Gas Company, the Lenders party thereto, PNC Bank, National Association, as Administrative Agent, Wells Fargo Bank, National Association, as Syndication Agent, U.S. Bank National Association, TD Bank, N.A., and Santander Bank, N.A., as Documentation Agents, and PNC Capital Markets LLC and Wells Fargo Securities, LLC, as Joint Lead Arrangers (incorporated by reference to Exhibit 4.3 to the Quarterly Report on Form 10-Q for the quarter ended June 30, 2014, as filed on August 4, 2014) |
4.4 | $425,000,000 Amended and Restated Credit Agreement dated as of September 28, 2015, by and among the Company, the guarantors thereto, the lenders party thereto, PNC Bank, National Association, as Administrative Agent, JPMorgan Chase Bank, N.A. and Wells Fargo Bank, National Association, as Syndication Agents, Bank of America, N.A., TD Bank, N.A. and U.S. Bank National Association, as Documentation Agents, and PNC Capital Markets LLC, J.P. Morgan Securities LLC and Wells Fargo Securities, LLC, as Joint Lead Arrangers (incorporated by reference to Exhibit 10.1 to the Current Report on Form 8-K as filed on October 2, 2015) |
4.5 | $75,000,000 Shelf Note Purchase Agreement, dated as of June 30, 2011, between New Jersey Resources Corporation and Prudential Investment Management, Inc. (“Prudential Facility”) (incorporated by reference to Exhibit 4.1 to the Current Report on Form 8-K as filed on July 6, 2011) |
4.5(a) | First Amendment to the Prudential Facility, dated as of July 25, 2014, between the Company and Prudential Investment Management, Inc. (incorporated by reference to Exhibit 4.1 to the Current Report on Form 8-K as filed on November 12, 2014) |
4.5(b) | Second Amendment to the Prudential Facility, dated as of September 28, 2015, between the Company and Prudential Investment Management, Inc. (incorporated by reference to Exhibit 10.2 to the Current Report on Form 8-K as filed on October 2, 2015) |
4.6 | $50,000,000 Note Purchase Agreement, dated as of September 24, 2007, by and among the Company, New York Life Insurance Company and New York Life Insurance and Annuity Company (incorporated by reference to Exhibit 4.8 to the Annual Report on Form 10-K as filed on December 10, 2007) |
4.6(a) | First Amendment to Note Purchase Agreement, dated as of September 28, 2015, by and among the Company, New York Life Insurance Company and New York Life Insurance and Annuity Company (incorporated by reference to Exhibit 10.5 to the Current Report on Form 8-K, as filed on October 2, 2015) |
4.7 | $125,000,000 Note Purchase Agreement, dated as of May 15, 2008 (“2008 NPA”), by and among New Jersey Natural Gas Company and the Purchasers party thereto (incorporated by reference to Exhibit 4.9 to the Current Report on Form 8-K, as filed on May 20, 2008) |
Page 130
New Jersey Resources Corporation
Part IV
Exhibit Number | Exhibit Description |
4.7(a) | First Amendment to the 2008 NPA, dated as of September 1, 2014, by and among New Jersey Natural Gas Company and the Purchasers party thereto (incorporated by reference to Exhibit 99.1 to the Current Report on Form 8-K, as filed on September 30, 2014) |
4.8 | $100,000,000 Shelf Note Purchase Agreement, dated as of May 12, 2011, between New Jersey Resources Corporation and Metropolitan Life Insurance Company (incorporated by reference to Exhibit 4.1 to the Current Report on Form 8-K as filed on May 17, 2011) |
4.8(a) | First Amendment to the $100,000,000 Shelf Note Purchase Agreement, dated as of September 28, 2015, between New Jersey Resources Corporation and Metropolitan Life Insurance (incorporated by reference to Exhibit 10.4 to the Current Report on Form 8-K, as filed on October 2, 2015) |
4.9 | $125,000,000 Note Purchase Agreement, dated as of February 7, 2014, by and among New Jersey Natural Gas Company and the Purchasers party thereto (incorporated by reference to Exhibit 4.5 to the Quarterly Report on Form 10-Q, as filed on May 7, 2014) |
4.10 | Loan Agreement between New Jersey Economic Development Authority and New Jersey Natural Gas Company, dated as of August 1, 2011 (incorporated by reference to Exhibit 4.10 to the Annual Report on Form 10-K for the year ended September 30, 2011, as filed on November 23, 2011) |
4.11 | Continuing Covenant Agreement between NJNG and Wells Fargo Municipal Strategies, LLC, dated September 24, 2014 (incorporated by reference to Exhibit 99.4 to the Current Report on Form 8-K, as filed on September 30, 2014) |
4.12 | $50,000,000 Note Purchase Agreement, dated as of February 8, 2013, by and among New Jersey Natural Gas Company and the Purchasers party thereto (incorporated by reference to Exhibit 4.12 to the Quarterly Report on Form 10-Q, as filed on May 3, 2013) |
4.13 | $150,000,000 Note Purchase Agreement, dated as of February 12, 2015, by and among New Jersey Natural Gas Company and the Purchasers party thereto (incorporated by reference to Exhibit 4.1 to the Current Report on Form 8-K, as filed on February 17, 2015) |
4.14 | Note Purchase Agreement, dated as of March 22, 2016, among New Jersey Resources Corporation and each of the Purchasers listed in Schedule A thereto (incorporated by reference to Exhibit 4.1 to the Current Report on Form 8-K, as filed on March 25, 2016) |
4.15 | $125,000,000 Note Purchase Agreement, dated as of June 21, 2016, by and among New Jersey Natural Gas Company and the Purchasers party thereto (incorporated by reference to Exhibit 4.1 to the Current Report on Form 8-K, as filed on June 22, 2016) |
4.16 | $100,000,000 Credit Agreement, dated as of August 18, 2017, between New Jersey Resources Corporation and U.S. Bank National Association, as Agent (incorporated by reference to Exhibit 10.1 to the Current Report on Form 8-K as filed on August 18, 2017) |
10.1* | Amended and Restated Supplemental Executive Retirement Plan Agreement between the Company and Laurence M. Downes dated November 28, 2008 (incorporated by reference to Exhibit 10.4 to the Quarterly Report on Form 10-Q, as filed on February 6, 2009) |
10.2(a)* | Schedule of Supplemental Executive Retirement Plan Agreements for named executive officers (incorporated by reference to Exhibit 10.2(a) to the Annual Report on Form 10-K for the year ended September 30, 2010, as filed on November 24, 2010) |
10.2(b)* | Form of Amendment to Supplemental Executive Retirement Plan Agreement between the Company and Named Executive Officer (for future use) (incorporated by reference to Exhibit 10.4(b) to the Quarterly Report on Form 10-Q, as filed on February 6, 2009) |
10.3 | Service Agreement for Rate Schedule SS-1 by and between NJNG and Texas Eastern Transmission Company, dated as of June 21, 1995 (incorporated by reference to Exhibit 10-5B to the Annual Report on Form 10-K for the year ended September 30, 1996, as filed on December 30, 1996) |
10.4 | Amended and Restated Lease Agreement between NJNG, as Lessee, and State Street Bank and Trust Company of Connecticut, National Association, as Lessor, for NJNG’s Headquarters Building dated December 21, 1995 (incorporated by reference to Exhibit 10-7 to the Annual Report on Form 10-K for the year ended September 30, 1996, as filed on December 30, 1996) |
Page 131
New Jersey Resources Corporation
Part IV
Exhibit Number | Exhibit Description |
10.5* | Employment Continuation Agreement between the Company and Laurence M. Downes dated November 28, 2008 (incorporated by reference to Exhibit 10.12 to the Quarterly Report on Form 10-Q, as filed on February 6, 2009) |
10.5(a)* | Schedule of Employee Continuation Agreements (incorporated by reference to Exhibit 10.6(a) to the Annual Report on Form 10-K for the year ended September 30, 2010, as filed on November 24, 2010) |
10.7* | Summary of Company’s Non-Employee Director Compensation (incorporated by reference to Exhibit 10.1 to the Current Report on Form 8-K as filed on November 17, 2017) |
10.8* | The Company’s 2007 Stock Award and Incentive Plan (as amended and restated January 1, 2009) (incorporated by reference to Exhibit 10.17 to the Quarterly Report on Form 10-Q, as filed on February 6, 2009) |
10.9* | 2007 Stock Award and Incentive Plan Form of Performance Shares Agreement (TSR) (incorporated by reference to Exhibit 10.1 to the Current Report on Form 8-K, as filed on December 23, 2014) |
10.10* | 2007 Stock Award and Incentive Plan Form of Performance Share Units Agreement (TSR) (incorporated by reference to Exhibit 10.4 to the Quarterly Report on Form 10-Q, as filed on February 8, 2017) |
10.11* | 2007 Stock Award and Incentive Plan Form of Performance Shares Agreement (NFE) (incorporated by reference to Exhibit 10.2 to the Current Report on Form 8-K, as filed on December 23, 2014) |
10.12* | 2007 Stock Award and Incentive Plan Form of Performance Share Units Agreement (NFE) (incorporated by reference to Exhibit 10.2 to the Quarterly Report on Form 10-Q, as filed on February 8, 2017) |
10.13* | 2007 Stock Award and Incentive Plan Form of Performance-Based Restricted Stock Agreement (FY 2015) (incorporated by reference to Exhibit 10.5 to the Current Report on Form 8-K, as filed on December 23, 2014) |
10.14* | 2007 Stock Award and Incentive Plan Form of Performance-Based Restricted Stock Units Agreement (incorporated by reference to Exhibit 10.5 to the Quarterly Report on Form 10-Q, as filed on February 8, 2017) |
10.15* | 2007 Stock Award and Incentive Plan Form of Deferred Stock Retention Award Agreement (incorporated by reference to Exhibit 10.3 to the Current Report on Form 8-K, as filed on December 23, 2014) |
10.16* | Form of Amendment of Deferred Stock Retention Award Agreement (incorporated by reference to Exhibit 10.1 to the Quarterly Report on Form 10-Q, as filed on August 3, 2016) |
10.17* | 2007 Stock Award and Incentive Plan Form of Deferred Stock Retention Award Agreement (incorporated by reference to Exhibit 10.3 to the Quarterly Report on Form 10-Q, as filed on February 8, 2017) |
10.18* | 2007 Stock Award and Incentive Plan Form of Restricted Stock Agreement (incorporated by reference to Exhibit 10.4 to the Current Report on Form 8-K, as filed on December 23, 2014) |
10.19* | 2007 Stock Award and Incentive Plan Form of Restricted Stock Units Agreement (incorporated by reference to Exhibit 10.6 to the Quarterly Report on Form 10-Q, as filed on February 8, 2017) |
10.20* | The Company’s 2017 Stock Award and Incentive Plan (incorporated by reference to Appendix A to the Proxy Statement for the 2017 Annual Meeting as filed on December 15, 2016) |
10.21+* | |
10.22* | New Jersey Resources Corporation Pension Equalization Plan (incorporated by reference to Exhibit 10.28 to the Quarterly Report on Form 10-Q, as filed on February 6, 2009) |
10.23* | New Jersey Resources Corporation Directors’ Deferred Compensation Plan (incorporated by reference to Exhibit 10.25 to the Quarterly Report on Form 10-Q, as filed on February 6, 2009) |
10.24* | New Jersey Resources Corporation Officers’ Deferred Compensation Plan (incorporated by reference to Exhibit 10.26 to the Quarterly Report on Form 10-Q, as filed on February 6, 2009) |
10.25* | Form of Amended and Restated Employment Continuation Agreement between the Company and NJR Energy Services Company named executive officer (incorporated by reference to Exhibit 10.2 to the Current Report on Form 8-K, as filed on December 16, 2015) |
10.26* | Form of Amended and Restated Employment Continuation Agreement between the Company and named executive officer (incorporated by reference to Exhibit 10.1 to the Current Report on Form 8-K, as filed on December 16, 2015) |
Page 132
New Jersey Resources Corporation
Part IV
Exhibit Number | Exhibit Description |
10.27+* | |
10.28 | Limited Liability Company Agreement of Steckman Ridge GP, LLC, dated as of March 2, 2007 (incorporated by reference to Exhibit 10.1 to the Quarterly Report on Form 10-Q, as filed on May 3, 2007) |
10.29 | Limited Partnership Agreement of Steckman Ridge, LP dated as of March 2, 2007 (incorporated by reference to Exhibit 10.2 to the Quarterly Report on Form 10-Q, as filed on May 3, 2007) |
21.1+ | |
23.1+ | |
31.1+ | |
31.2+ | |
32.1+ † | |
32.2+ † | |
101+ | Interactive Data File {Annual Report on Form 10-K, for the fiscal year ended September 30, 2017, furnished in XBRL (eXtensible Business Reporting Language)} |
________________________________
+ | Filed herewith. |
* | Denotes compensatory plans or arrangements or management contracts. |
† | This certificate accompanies this report pursuant to Section 906 of the Sarbanes-Oxley Act of 2002 and shall not be deemed filed by NJR for purposes of Section 18 or any other provision of the Securities Exchange Act of 1934, as amended. |
Page 133
New Jersey Resources Corporation
Part IV
SIGNATURES
Pursuant to the requirements of Section 13 or 15(d) of the Securities Exchange Act of 1934, the registrant has duly caused this report to be signed on its behalf by the undersigned, thereunto duly authorized.
NEW JERSEY RESOURCES CORPORATION | ||
(Registrant) | ||
Date: | November 21, 2017 | By:/s/ Patrick Migliaccio |
Patrick Migliaccio | ||
Senior Vice President and | ||
Chief Financial Officer | ||
Pursuant to the requirements of the Securities Exchange Act of 1934, this report has been signed below by the following persons on behalf of the registrant in the capacities and on the dates indicated:
November 21, 2017 | /s/ Laurence M. Downes | November 21, 2017 | /s/ Patrick J. Migliaccio |
Laurence M. Downes Chairman, President and Chief Executive Officer Director | Patrick J. Migliaccio Senior Vice President and Chief Financial Officer (Principal Financial and Accounting Officer) | ||
November 21, 2017 | /s/ Maureen A. Borkowski | November 21, 2017 | /s/ Thomas C. O'Connor |
Maureen A. Borkowski Director | Thomas C. O'Connor Director | ||
November 21, 2017 | /s/ Lawrence R. Codey | November 21, 2017 | /s/ J. Terry Strange |
Lawrence R. Codey Director | J. Terry Strange Director | ||
November 21, 2017 | /s/ Donald L. Correll | November 21, 2017 | /s/ Sharon C. Taylor |
Donald L. Correll Director | Sharon C. Taylor Director | ||
November 21, 2017 | /s/ Robert B. Evans | November 21, 2017 | /s/ David A. Trice |
Robert B. Evans Director | David A. Trice Director | ||
November 21, 2017 | /s/ M. William Howard, Jr. | November 21, 2017 | /s/ George R. Zoffinger |
M. William Howard, Jr. Director | George R. Zoffinger Director | ||
November 21, 2017 | /s/ Jane M. Kenny | ||
Jane M. Kenny Director | |||
Page 134