Attached files
| file | filename |
|---|---|
| 8-K - FORM 8-K - BROADRIDGE FINANCIAL SOLUTIONS, INC. | d670948d8k.htm |
| EX-99.1 - EX-99.1 - BROADRIDGE FINANCIAL SOLUTIONS, INC. | d670948dex991.htm |
 ©
2014 Broadridge Financial Solutions, Inc.
Broadridge and the Broadridge logo are registered trademarks of Broadridge
Financial Solutions, Inc. February 6, 2014
Earnings Webcast & Conference Call
Second Quarter 2014
Exhibit
99.2 |
 1 |
 2
Today’s Agenda
Opening Remarks
Rich Daly, President and CEO
Second Quarter and YTD 2014
Michael Liberatore,
Highlights and Segment Results
Acting Principal Financial Officer
Summary
Rich Daly, President and CEO
Q&A
Rich Daly, President and CEO
Michael Liberatore,
Acting Principal Financial Officer
Closing Remarks
Rich Daly, President and CEO |
 3
Financial Highlights
Recurring revenue growth momentum continues
Q2 Recurring revenue was up 9% (YTD 10%)
Primarily due to Net New Business (closed sales less client losses) and
internal growth
Q2 Event-driven fees were flat (YTD were up $9M primarily from mutual
fund proxy activities)
Q2 Non-GAAP diluted Earnings Per Share (EPS) of $0.25 was up 47%
Record YTD Non-GAAP diluted EPS of $0.64 was up 83%
Q2 GAAP diluted EPS of $0.22 was up 69% (YTD $0.58 was up 115%)
Primarily due to increased revenues and improved productivity from strategic
initiatives
Raising fiscal year 2014 guidance
7-8% recurring revenue growth (4-5% total revenue growth)
$2.15-2.25 Non-GAAP diluted EPS ($2.03-2.13 GAAP diluted EPS)
Free cash flow of $300M (at mid-point of range) |
 4
Closed Sales Performance
Q2 Recurring revenue closed sales were up 13% (YTD 12%)
Recurring revenue closed sales were $23M compared to $20M in the
prior
year (YTD $38M compared to $34M)
Historically, first half closed sales of less than $5M contribute a lower
amount than second half to the full year
No large transactions of $5M or greater
Sales pipeline remains very strong
Continued momentum across both segments which includes Emerging and
Acquired (E&A) products and the jointly launched Accenture Post-Trade
Processing Platform
Reaffirming fiscal year 2014 recurring revenue closed sales guidance of
$110-150M
Achievement of this range requires closing $20-40M of large transactions of
$5M or greater
Anticipate closing at least one large transaction and would be disappointed if
this did not occur during this fiscal year |
 5
Key Updates
Current favorable market-based activities continue to positively impact
internal growth
Expect equity and Interim position growth to remain in a positive and stable
range Trade
volumes
and
Post-sale
activity
are
less
predictable
and
expect
growth
to
continue
for
remainder of the year
We anticipate that the mean of event-driven revenues over the next years will
remain relatively stable
Positioning our E&A portfolio for long term growth
Acquisitions on track to generate ~$210M in fee revenue with ~$65M in EBITDA
(Non-GAAP) in fiscal year 2014
•
Actively seeking strategic tuck-in acquisitions that meet our investment
criteria •
Will be disappointed if we are not able to close additional strategic tuck-in
acquisitions this year
E&A
products
approaching
50%
of
recurring
revenue
closed
sales
in
FY14
Increasing strategic investments across the three key macro-trends
Digital transformation of investor communications
Cost/Capability mutualization
Intelligence created from our unique data
Total investments of $28 million or approximately $0.14 impact to EPS
NYSE EBIP regulations and new proxy distribution fees live for meetings that
have record dates on or after January 1, 2014 |
 6
Key Financial Drivers
2Q
2Q YTD
Actual
FY14
FY14
FY14
FY13
Range
Growth Drivers as a % of Recurring Revenue
Closed Sales (Recurring)
7%
8%
6%
7%
Client Losses
(3%)
(3%)
(1%)
(3%)
Net New Business
4%
5%
5%
4%
Internal Growth
(a)
4%
4%
(1%)
2-3%
Organic Growth
8%
9%
4%
6-7%
Acquisitions
1%
1%
0%
1%
Total Recurring Revenue Growth
9%
10%
4%
7-8%
Growth Drivers as a % of Total Revenue
Recurring Revenue
6%
6%
3%
4-5%
Event-Driven
(b)
0%
1%
1%
0%
Distribution
(c)
0%
1%
2%
0%
FX/Other
0%
0%
0%
0%
Total Revenue Growth
6%
8%
6%
4-5%
EBIT Margin (Non-GAAP)
9.4%
11.7%
14.8%
16.5-17.1%
EPS (Non-GAAP)
$0.25
$0.64
$1.88
$2.15-2.25
(a) Internal Growth includes SPS Equity & Fixed Income Trades, ICS Equity & Mutual Fund Stock
Record Growth, Transaction Reporting, Fulfillment, and Time & Materials (b) Event-Driven
includes ICS Proxy Contest/Specials, Mutual Fund Proxy and Interim Communications (c)
Distribution includes pass-through fees from Matrix |
 7
Segment Results & Forecast –
Investor Communication Solutions
Q2 and YTD recurring revenue growth driven by continued higher than expected
internal growth from market-based activities (Interims and
Post-sale) and expected Net New Business
Raising full year recurring revenue guidance as favorable market-based
activities (fulfillment, interims and equity stock record position growth)
are expected to continue Increasing event-driven fee revenue guidance to
be in-line with the prior year (expecting mutual fund proxy “new
normal” activity level of 14-19% of estimated total beneficial
positions)
Margin improvements for Q2, YTD and expected full year reflects operating
leverage Client revenue retention rate remains at 99%
Recurring revenue closed sales of $16M for Q2 ($26M YTD) and reaffirming guidance
of $60-70M (range does not include transactions of $5M or greater)
|
  8
Q2 and YTD revenues increased due to Net New Business and
higher than expected trade activity
Reaffirming high-end of full year revenue range of 5% growth
(narrowed low end to 4%) as current trade volumes are expected
to continue
Strong margin expansion for Q2, YTD, and expected full year
driven by operating leverage and greater than expected
productivity improvements
Reaffirming full year recurring revenue closed sales range of $30-
40M (range does not include transactions of $5M or greater)
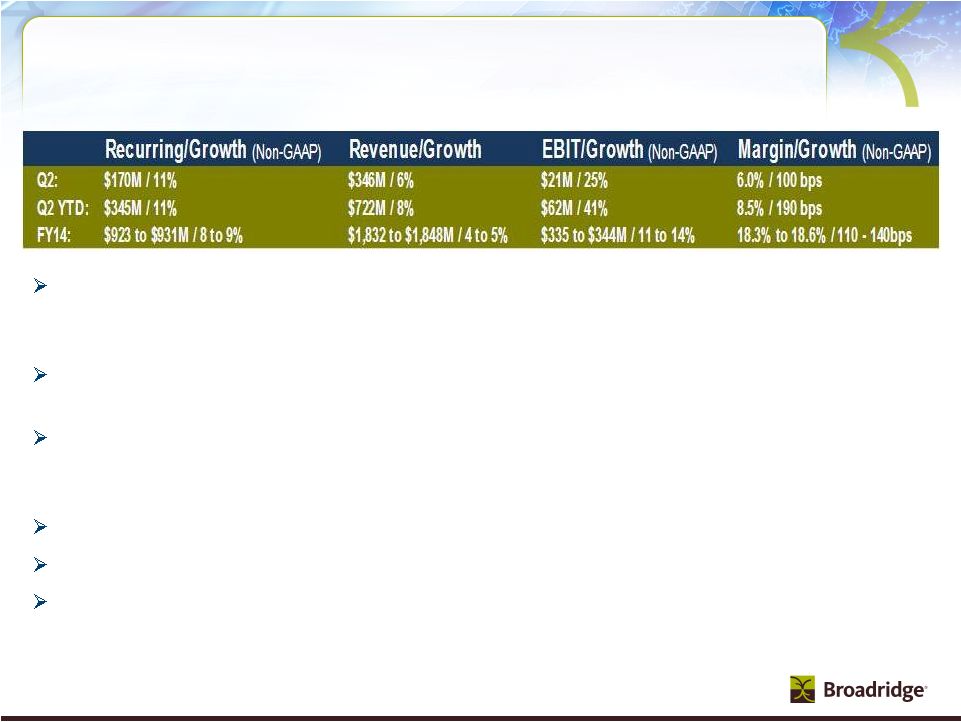
Revenue/Growth
EBIT/Growth (Non-GAAP)
Margin/Growth (Non-GAAP)
Q2:
$174M / 6%
$35M / 73%
19.9% / 770 bps
Q2 YTD:
$343M / 8%
$66M / 126%
19.3% / 1000 bps
FY14:
$687 to 695M / 4 to 5%
$117 to 125M / 38 to 47%
17.0% to 18.0% / 410 to 510 bps
Segment Results & Forecast –
Securities Processing Solutions |
 9
Summary
Record first half diluted EPS with both segments contributing
Recurring revenue continues to be strong led by Net New Business
Recurring closed sales pipeline is very strong and growing
Positive impact from favorable market-based activities
Strong client revenue retention rate of 98%
Raising fiscal year 2014 guidance
7-8% recurring revenue growth (4-5% total revenue growth)
$2.15-2.25 Non-GAAP diluted EPS ($2.03-2.13 GAAP diluted EPS)
Free cash flow of $300M (at mid-point of range)
Strong business model includes stable recurring revenue with slight internal
growth, consistent closed sales results, plus E&A execution driving top
quartile performance Well known and highly respected brand in
providing investor communications and securities processing solutions
Both segments contributing to top and bottom line results
Stable
recurring
revenue
and
slight
internal
growth
Strong and reliable free cash flows
Best suited to benefit from three strategic disruptive macro-trends
Proven ability to create diversity of growth opportunities in all markets through
our E&A product portfolio Ongoing journey to sustainable top quartile
performance with momentum Paying meaningful dividend currently targeting 40%
payout ratio Reinvesting in our business with a focus on 3 key
macro-trends and strategic tuck-in acquisitions Opportunistic share
repurchases to offset dilution and reduce share count All of the above while
maintaining investment grade credit rating Highly engaged associates aligned
to service profit chain Recognized as one of the Best Companies to Work
for in New York State for the seventh consecutive year
|
 10
Q&A
There are no slides during this portion of the presentation
|
 11
Closing Comments
There are no slides during this portion of the presentation
|
 12
Appendix |
 13
Segment Results & Forecast –
Other & Foreign Exchange (FX)
Corporate
Expenses:
Increased
full
year
guidance
range
as
expenses
are
expected to be in line with growth in the business and increased
strategic
investments
Interest
Expense,
net:
Reflects
higher
interest
rate
from
previous
year
due
to
refinancing of term loan with senior fixed-rate notes
|
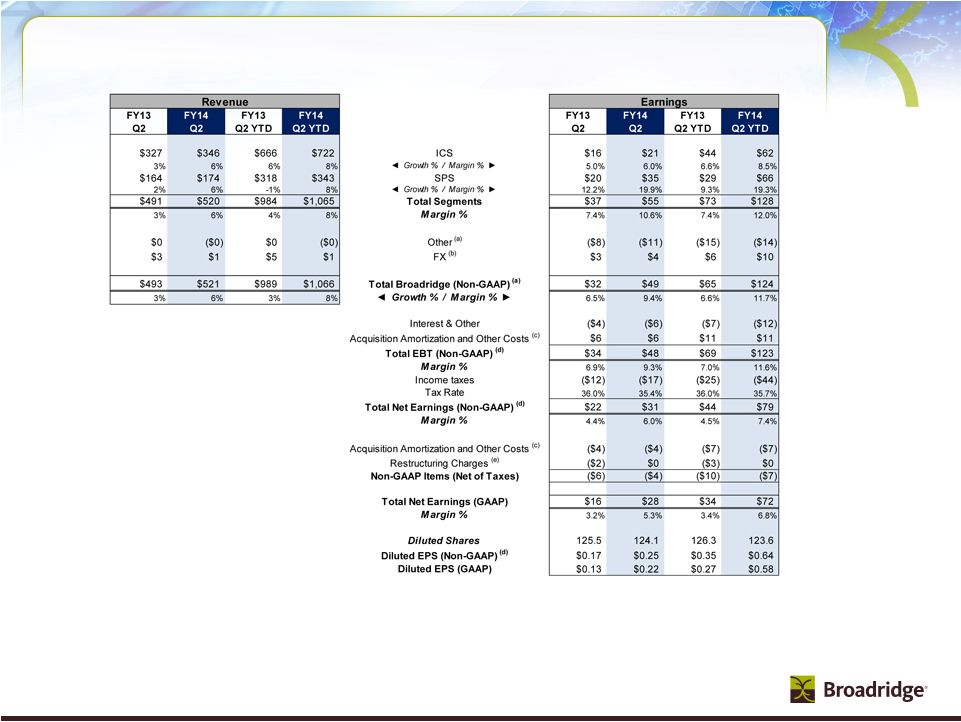 14
Broadridge Q2 and YTD FY14
(a) FY13 Q2 excludes Restructuring Charges of $4M (after tax $2M, or $0.01 EPS
impact). FY13 Q2 YTD excludes Restructuring Charges of $4M (after tax $3M, or $0.02 EPS impact).
(b) Includes impacts of FX P&L and FX transaction activity.
(c) Represents amortization charges associated with intangible asset values as
well as other deal costs associated with the Company’s acquisitions.
(d) FY13 Q2 excludes Restructuring Charges of $4M (after tax $2M, or $0.01 EPS
impact) and Acquisition Amortization and Other Costs of $6M (after tax $4M, or $0.03 EPS impact).
FY13 Q2 YTD excludes Restructuring Charges of $4M (after tax $3M, or $0.02 EPS
impact) and Acquisition Amortization and Other Costs of $11M (after tax $7M, or $0.06 EPS impact).
FY14
Q2
excludes
Acquisition
Amortization
and
Other
Costs
of
$6M
(after
tax
$4M,
or
$0.03
EPS
impact)
and
FY14
Q2
YTD
excludes
Acquisition
Amortization
and
Other
Costs
of
$11M
(after
tax $7M,
or
$0.06
EPS
impact).
(e) FY13 represents transition costs related to termination of the Penson
agreement including shutdown costs. |
 15
Broadridge FY14 Guidance
(a) FY13 excludes Restructuring and Impairment Charges, net of $20M (after tax
$13M, or $0.10 EPS impact). (b) Includes impacts of FX P&L and FX
Transaction Activity. (c) Represents amortization charges associated with
intangible asset values as well as other deal costs associated with the Company’s acquisitions.
(d) FY13 excludes Acquisition Amortization and Other Costs of $24M (after tax $15M
or $0.12 EPS impact), Restructuring Charges of $20M (after tax $13M, or
$0.10
EPS
impact)
and
a
one
time
tax
credit
of
$4M
(or
$0.03
EPS
impact).
FY14
guidance
excludes
Acquisition
Amortization
and
Other
Costs
of
$23M
(after
tax
$15M or $0.12 EPS impact).
(e) FY13 represents transition costs related to termination of the Penson agreement
including shutdown costs, a one-time cost to restructure and outsource certain
processing related to our decktop applications and one-time tax credit.
* Guidance does not take into consideration the effect of any future acquisitions,
additional debt and/or share repurchases. |
 16
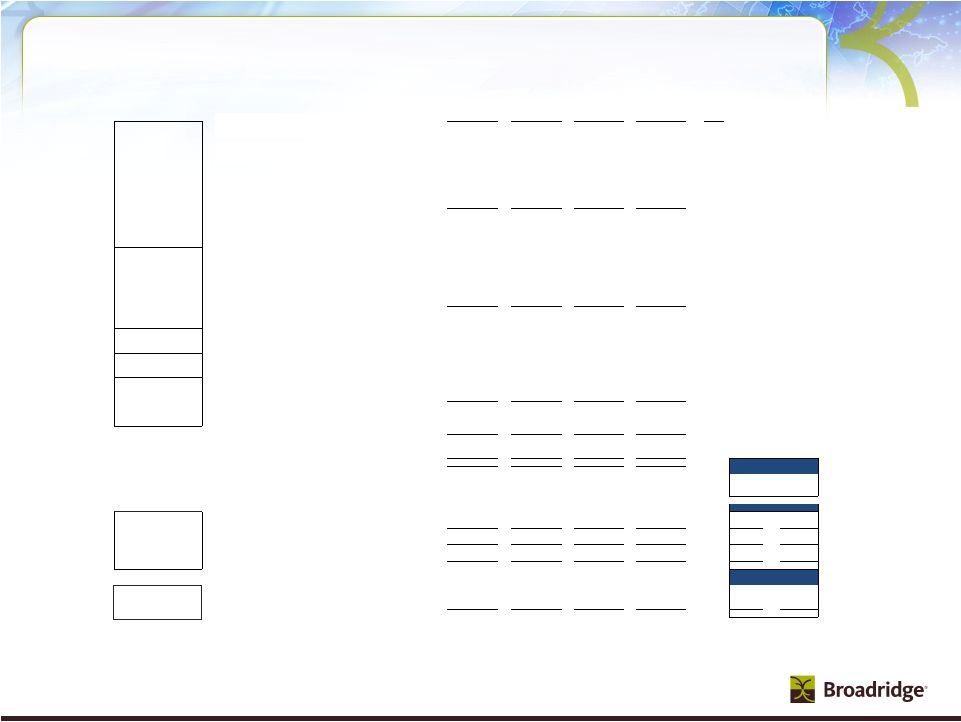
Cash Flow –YTD FY14 Results and FY14 Forecast
Six Months Ending
December 2013
Low
High
Free Cash Flow
(Non-GAAP)
:
Net earnings from operations (GAAP)
72
$
252
$
265
$
Depreciation and amortization (includes other LT assets)
46
100
110
Stock-based compensation expense
15
33
35
Other
(4)
(5)
5
Subtotal
129
380
415
Working capital changes
(40)
(5)
5
Long-term assets & liabilities changes
2
(35)
(35)
Net cash flow (used in) provided by operating activities
91
340
385
Cash Flows From Investing Activities
Capital expenditures and software purchases
(31)
(65)
(60)
Free cash flow (Non-GAAP)
60
$
275
$
325
$
Cash Flows From Other Investing and Financing Activities
Acquisitions
(38)
(38)
(38)
Stock repurchases net of options proceeds
(2)
(2)
(2)
Proceeds from borrowing net of debt repayments
(1)
(1)
(1)
Dividends paid
(47)
(96)
(96)
Other
2
(5)
5
Net change in cash and cash equivalents
(26)
133
193
Cash and cash equivalents, at the beginning of year
266
266
266
Cash and cash equivalents, at the end of period
240
$
399
$
459
$
(a) Guidance does not take into consideration the effect of any future acquisitions, additional debt
and/or share repurchases. FY14 Range
(a)
Free Cash Flow -
Non-GAAP
Unaudited
($ millions) |
 17
Recurring Revenue Closed Sales to Revenue
Contribution
($ in millions)
Closed Sales
Revenue Contribution
(a)
Backlog
(b)
Forecast
Forecast
Forecast
FY14
FY14
FY14
ICS (less than $5M deals)
$60-70
~$45-55
~$60-70
~Contribution to recurring revenue growth
~6%
SPS (less than $5M deals)
$30-40
~$50-55
~$70-90
~Contribution to recurring revenue growth
~8%
Total deals (less than $5M)
$90-110
~$95-110
~$130-160
~Contribution to recurring revenue growth
7-8%
Large Deals ($5M or greater)
$20-40
$0
~$20-40
~Contribution to recurring revenue growth
Total Recurring Revenue Closed Sales
$110-150
~$95-110
~$150-200
~Contribution to recurring revenue growth
7-8%
(a)
Revenue from current year and prior year Closed Sales.
(b)
Closed Sales expected to convert to revenue in future years. |
 18
Revenues and Closed Sales FY08-FY13
(a) Includes reclassification of Pre-sale Fulfillment from event-driven
revenues to recurring revenues. (b) Includes reclassification of
Pre-sale Fulfillment related distribution revenues from event-driven distribution to recurring distribution and Matrix pass-through administrative services revenues from recurring
fee to recurring distribution. |
 Reconciliation
of Non-GAAP to GAAP Measures Free Cash Flow -
Non-GAAP
Unaudited
($ millions)
19 |
 20
ICS Key Segment Revenue Stats
RC= Recurring
ED= Event-Driven
In millions
Fee Revenues
2Q13
2Q14
YTD FY13
YTD FY14
Type
Proxy
Equities
25.3
$
24.4
$
50.9
$
50.4
$
RC
Stock Record Position Growth
4%
1%
1%
1%
Pieces
20.8
20.0
41.1
41.5
Mutual Funds
9.1
$
10.7
$
15.6
$
26.5
$
ED
Pieces
15.4
15.5
23.6
35.9
Beneficial Proxy Activity as a % of Est Total Market
Contests/Specials
2.0
$
2.4
$
5.0
$
6.6
$
ED
Pieces
1.9
2.4
4.6
6.8
Total Proxy
36.4
$
37.5
$
71.5
$
83.5
$
Total Pieces
38.1
37.9
69.3
84.2
Notice and Access Opt-in %
75%
74%
61%
66%
Suppression %
59%
58%
57%
58%
Interims
Mutual Funds (Annual/Semi-Annual Reports/Annual Prospectuses)
31.5
$
39.0
$
63.3
$
77.8
$
RC
Position Growth
11%
13%
10%
12%
Pieces
153.2
187.5
303.9
361.0
Mutual Funds (Supplemental Prospectuses) & Other
9.1
$
7.8
$
23.8
$
20.0
$
ED
Pieces
46.2
35.7
121.6
107.5
Total Interims
40.6
$
46.8
$
87.1
$
97.8
$
Total Pieces
199.4
223.2
425.5
468.5
Transaction
Transaction Reporting/Customer Communications
37.9
$
35.8
$
78.5
$
71.9
$
RC
Reporting
Fulfillment
Fulfillment
31.9
$
36.2
$
65.1
$
76.1
$
RC
Emerging, Acquired
Emerging/Acquired (a)
26.4
$
34.9
$
52.2
$
69.1
$
RC
and Other
Other (b)
7.5
$
7.1
$
15.6
$
15.5
$
ED
Total Emerging, Acquired and Other
33.9
$
42.0
$
67.8
$
84.6
$
Total Fee Revenues
180.7
$
198.3
$
370.0
$
413.9
$
Total Distribution Revenues (c)
146.1
$
147.6
$
296.3
$
308.2
$
Total Revenues as reported -GAAP
326.8
$
345.9
$
666.3
$
722.1
$
FY14 Forecast Ranges
FY14 Plan Ranges
Low
High
Total RC Fees
153.1
$
170.3
$
310.1
$
345.3
$
923
$
931
$
% RC Growth
5%
11%
7%
11%
8%
9%
Total ED Fees
27.6
$
28.0
$
59.9
$
68.6
$
Low
High
Sales
4%
5%
5%
5%
6%
6%
Key
Losses
-1%
-1%
-1%
-2%
-2%
-2%
Revenue
Net New Business
3%
4%
4%
3%
4%
4%
Drivers
Internal growth
1%
6%
2%
6%
3%
4%
(Recurring)
Recurring (Excluding Acquisitions)
4%
10%
6%
9%
7%
8%
Acquisitions
0%
1%
0%
2%
1%
1%
Total Recurring
4%
11%
6%
11%
8%
9%
Low
High
Key
Recurring, Net (d)
2%
5%
3%
5%
4%
5%
Revenue
Event-Driven
0%
0%
1%
1%
0%
0%
Drivers
Distribution
1%
1%
2%
2%
0%
0%
(Total)
TOTAL
3%
6%
6%
8%
4%
5%
(a) Emerging and Acquired includes fee revenues from acquisitions (i.e. Access
Data, NewRiver, Matrix, Transfer Agency, Forefield, and Bonaire) and the portfolio of emerging products (i.e. TaxServices, Vote Recommendations, and Class Actions).
(b) Other includes other event-driven fee revenues such as corporate actions
and development. (c) Total Distribution Revenues primarily include
pass-through revenues related to the physical mailing of Proxy, Interims, Transaction Reporting, and Fulfillment as well as Matrix administrative services.
(d) Recurring, Net includes contribution from Net New Business, Internal Growth,
and Acquisitions ~$156 |
  21
SPS Key Segment Revenue Stats
RC= Recurring
ED= Event-Driven
In millions
Note: Outsourcing is now included in Other Equity Services
2Q13
2Q14
YTD FY13
YTD FY14
Type
Equity
Transaction-Based
Equity Trades
31.1
$
33.4
$
61.1
$
65.9
$
RC
Internal Trade Volume
792
934
786
913
Internal Trade Growth
-6%
18%
-13%
16%
Trade Volume (Average Trades per Day in '000)
860
953
844
931
Non-Transaction
Other Equity Services
107.1
111.4
205.6
$
219.4
$
RC
Total Equity
138.1
$
144.9
$
266.7
$
285.3
$
Fixed Income
Transaction-Based
Fixed Income Trades
13.6
$
14.5
$
27.5
$
29.2
$
RC
Internal Trade Volume
293
293
294
296
Internal Trade Growth
-1%
0%
0%
1%
Trade Volume (Average Trades per Day in '000)
293
297
294
299
Non-Transaction
Other Fixed Income Services
12.0
$
14.7
$
23.5
$
28.3
$
RC
Total Fixed Income
25.6
$
29.2
$
51.0
$
57.5
$
Total Net Revenue as reported - GAAP
163.8
$
174.1
$
317.7
$
342.8
$
FY14 Ranges
Low
High
Sales
5%
9%
4%
10%
8%
8%
Losses
-2%
-4%
-2%
-3%
-4%
-3%
Key
Net New Business
3%
5%
2%
7%
4%
5%
Revenue
Internal growth
-1%
1%
-5%
1%
0%
0%
Drivers
Acquisitions
0%
0%
2%
0%
0%
0%
TOTAL
2%
6%
-1%
8%
4%
5% |
 22
Broadridge ICS Definitions |