Attached files
| file | filename |
|---|---|
| 8-K - 8-K - FURMANITE CORP | form8-k.htm |
| EX-99.1 - EXHIBIT 99.1 - FURMANITE CORP | exhibit991.htm |

Furmanite Corporation THREE AND NINE MONTHS ENDED SEPTEMBER 30, 2013 Charles R. Cox, Chairman & CEO Joseph E. Milliron, President & COO Robert S. Muff, Principal Financial Officer

Certain of the Company’s statements in this presentation are not purely historical, and as such are “forward-looking statements” within the meaning of the Private Securities Litigation Reform Act of 1995. These include statements regarding management’s plans, beliefs, expectations, intentions or projections of the future. Forward-looking statements involve risks and uncertainties, including without limitation, the various risks inherent in the Company’s business, and other risks and uncertainties detailed most recently in this presentation and the Company’s Form 10-K as of December 31, 2012 filed with the Securities and Exchange Commission. One or more of these factors could affect the Company’s business and financial results in future periods, and could cause actual results to differ materially from plans and projections. There can be no assurance that the forward-looking statements made in this document will prove to be accurate, and issuance of such forward-looking statements should not be regarded as a representation by the Company, or any other person, that the objectives and plans of the Company will be achieved. All forward-looking statements made in this presentation are based on information presently available to management, and the Company assumes no obligation to update any forward-looking statements. 2

Furmanite Corporation THREE AND NINE MONTHS ENDED SEPTEMBER 30, 2013 Charles R. Cox, Chairman & CEO 3

4 2013 Third Quarter Perspective • Continuing Overall Revenue and Earnings Growth • FTS Now Solidly On Board and “Linked In” • Orange Way Implementation in EMEA and APAC • Lots of Room for Growth and Improvement • Our Goal is to Make Our Transformation Global, Consistent and Permanent

5 2013 – 2015 Strategic Update • Committed to Continuing Substantial Global Growth • Growth in Both Market Share and Target Market Size • Technical Solutions and Program Management Capabilities • Both Organic and Acquisition Future Growth • Maintain Tight Focus on What WE Do Well • Continued Customer Drive to Fewer Contractors • Our People are Our Company!

Furmanite Corporation THREE AND NINE MONTHS ENDED SEPTEMBER 30, 2013 Financial Review Robert S. Muff, Principal Financial Officer 6

Condensed Consolidated Statements of Operations (Amounts in 000s except percentages and per share amounts) (Unaudited) 7 For the Three Months Ended September 30, 2013 % of Rev 2012 % of Rev Change Revenues $ 99,523 100.0% $ 75,579 100.0% $ 23,944 Operating costs 71,851 72.2% 56,141 74.3% 15,710 Depreciation and amortization expense 2,724 2.7% 2,329 3.1% 395 Selling, general and administrative expense 20,501 20.6% 17,613 23.3% 2,888 Operating income (loss), excluding restructuring and relocation costs 4,447 4.5% (504) -0.7% 4,951 Restructuring and relocation costs – – 224 0.3% (224) Operating income (loss) 4,447 4.5% (728) -1.0% 5,175 Interest and other income (expense), net (797) (309) (488) Income (loss) before income taxes 3,650 (1,037) 4,687 Income tax expense (1,530) (243) (1,287) Net income (loss) $ 2,120 $ (1,280) $ 3,400 Diluted earnings (loss) per share $ 0.06 $ (0.03) $ 0.09 Adjusted diluted earnings (loss) per share * $ 0.06 $ (0.03) $ 0.09 * Excludes $0.2 million of relocation and restructuring costs, net of tax for the three months ended September 30, 2012. Weighted-average number of common and common equivalent shares used in computing earnings (loss) per common share: Basic 37,431 37,301 Diluted 37,715 37,301

Condensed Consolidated Statements of Operations (Amounts in 000s except percentages and per share amounts) (Unaudited) 8 For the Nine Months Ended September 30, 2013 % of Rev 2012 % of Rev Change Revenues $ 296,937 100.0% $ 233,289 100.0% $ 63,648 Operating costs 206,279 69.4% 166,704 71.5% 39,575 Depreciation and amortization expense 8,232 2.8% 6,318 2.7% 1,914 Selling, general and administrative expense 62,277 21.0% 54,472 23.3% 7,805 Operating income, excluding restructuring and relocation costs 20,149 6.8% 5,795 2.5% 14,354 Restructuring and relocation costs – – 2,471 1.1% (2,471) Operating income 20,149 6.8% 3,324 1.4% 16,825 Interest and other income (expense), net (1,205) (1,107) (98) Income before income taxes 18,944 2,217 16,727 Income tax expense (7,499) (2,483) (5,016) Net income (loss) $ 11,445 $ (266) $ 11,711 Diluted earnings (loss) per share $ 0.30 $ (0.01) $ 0.31 Adjusted diluted earnings (loss) per share* $ 0.30 $ 0.04 $ 0.26 * Excludes $1.7 million of relocation and restructuring costs, net of tax for the nine months ended September 30, 2012. Weighted-average number of common and common equivalent shares used in computing earnings (loss) per common share: Basic 37,392 37,253 Diluted 37,586 37,253

Revenues Adjusted for Currency Rates 2013 amounts at 2012 exchange rates ($ in 000s except percentages) (Unaudited) 9 For the Three Months Ended For the Nine Months Ended September 30, September 30, 2013 2012 Change % Change 2013 2012 Change % Change Revenues Americas $ 66,761 $ 39,623 $ 27,138 68% $ 201,868 $ 127,265 $ 74,603 59% EMEA 24,984 26,881 (1,897) -7% 69,983 77,393 (7,410) -10% Asia-Pacific 7,778 9,075 (1,297) -14% 25,086 28,631 (3,545) -12% Total revenues $ 99,523 $ 75,579 $ 23,944 32% $ 296,937 $ 233,289 $ 63,648 27% Currency adjusted revenues: Americas $ 66,845 $ 39,623 $ 27,222 69% $ 201,975 $ 127,265 $ 74,710 59% EMEA 25,106 26,881 (1,775) -7% 70,584 77,393 (6,809) -9% Asia-Pacific 8,736 9,075 (339) -4% 26,262 28,631 (2,369) -8% Total currency adjusted revenues $ 100,687 $ 75,579 $ 25,108 33% $ 298,821 $ 233,289 $ 65,532 28%

Business Segment Data ($ in 000s) (Unaudited) 10 Americas EMEA APAC Reconciling Items¹ Total Three months ended September 30, 2013 Revenues from external customers $ 66,761 $ 24,984 $ 7,778 $ – $ 99,523 Operating income (loss) $ 5,164 $ 2,533 $ 676 $ (3,926) $ 4,447 Three months ended September 30, 2012 Revenues from external customers $ 39,623 $ 26,881 $ 9,075 $ – $ 75,579 Operating income (loss) $ 1,833 $ 1,846 $ 295 $ (4,702) $ (728) Nine months ended September 30, 2013 Revenues from external customers $ 201,868 $ 69,983 $ 25,086 $ – $ 296,937 Operating income (loss) $ 25,490 $ 6,336 $ 2,585 $ (14,262) $ 20,149 Nine months ended September 30, 2012 Revenues from external customers $ 127,265 $ 77,393 $ 28,631 $ – $ 233,289 Operating income (loss) $ 12,432 $ 2,116 $ 3,108 $ (14,332) $ 3,324 ¹ Reconciling Items represent certain corporate overhead costs, including executive management, strategic planning, treasury, legal, human resources, information technology, accounting and risk management, which are not allocated to reportable segments.

Condensed Consolidated Balance Sheets ($ in 000s) 11 (Unaudited) September 30, December 31, 2013 2012 Cash $ 31,698 $ 33,185 Trade receivables, net 111,239 77,042 Inventories 37,964 31,711 Other current assets 10,755 15,355 Total current assets 191,656 157,293 Property and equipment, net 52,854 42,243 Other assets 35,006 32,092 Total assets $ 279,516 $ 231,628 Total current liabilities $ 61,535 $ 50,439 Total long-term debt 63,337 39,609 Other liabilities 22,651 22,501 Total stockholders' equity 131,993 119,079 Total liabilities and stockholders' equity $ 279,516 $ 231,628

Condensed Consolidated Statements of Cash Flows ($ in 000s) (Unaudited) 12 For the Nine Months Ended September 30, 2013 2012 Net income (loss) $ 11,445 $ (266) Depreciation, amortization and other non-cash items 14,418 10,200 Working capital changes (14,657) 256 Net cash provided by operating activities 11,206 10,190 Capital expenditures (13,496) (6,108) Acquisition of businesses (16,695) (11,700) Payments on debt (2,180) (32,720) Proceeds from issuance of debt 20,000 39,300 Other, net 301 63 Effect of exchange rate changes on cash (623) 177 Decrease in cash and cash equivalents (1,487) (798) Cash and cash equivalents at beginning of period 33,185 34,524 Cash and cash equivalents at end of period $ 31,698 $ 33,726

Furmanite Corporation THREE AND NINE MONTHS ENDED SEPTEMBER 30, 2013 Operations Review Joseph E. Milliron, President and Chief Operating Officer 13

The Americas EMEA APAC FTS •1,132 technicians & engineers •65% of YTD revenues •40 locations •384 technicians & engineers •24% of YTD revenues •24 locations •130 technicians & engineers •8% of YTD revenues •16 locations •915 technicians & engineers •3% of YTD revenues •5 locations As of September 30, 2013 14

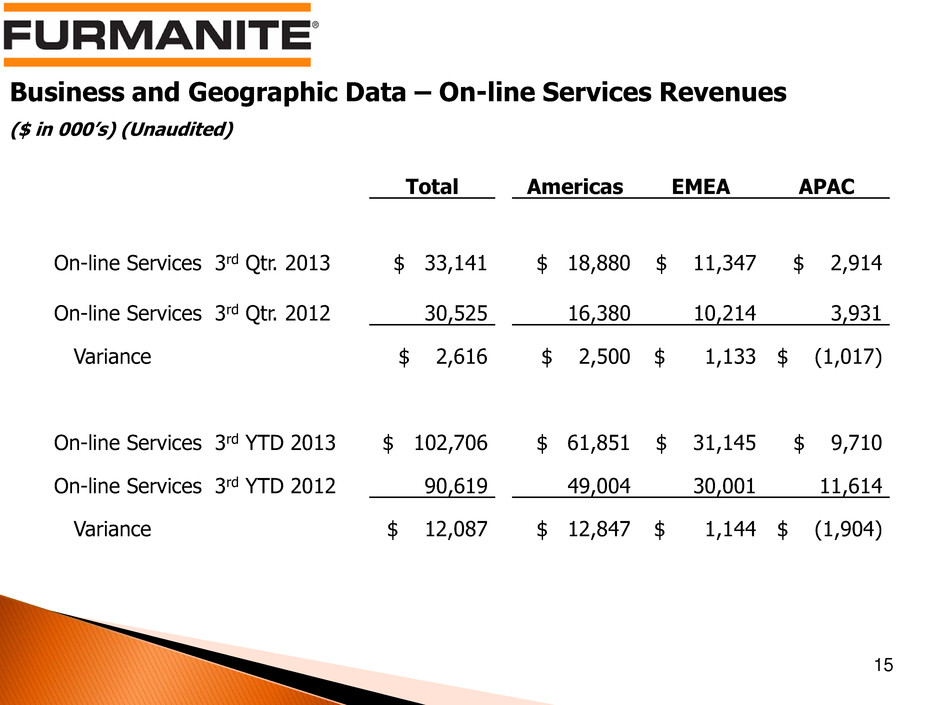
15 Total Americas EMEA APAC On-line Services 3rd Qtr. 2013 $ 33,141 $ 18,880 $ 11,347 $ 2,914 On-line Services 3rd Qtr. 2012 30,525 16,380 10,214 3,931 Variance $ 2,616 $ 2,500 $ 1,133 $ (1,017) On-line Services 3rd YTD 2013 $ 102,706 $ 61,851 $ 31,145 $ 9,710 On-line Services 3rd YTD 2012 90,619 49,004 30,001 11,614 Variance $ 12,087 $ 12,847 $ 1,144 $ (1,904) Business and Geographic Data – On-line Services Revenues ($ in 000’s) (Unaudited)

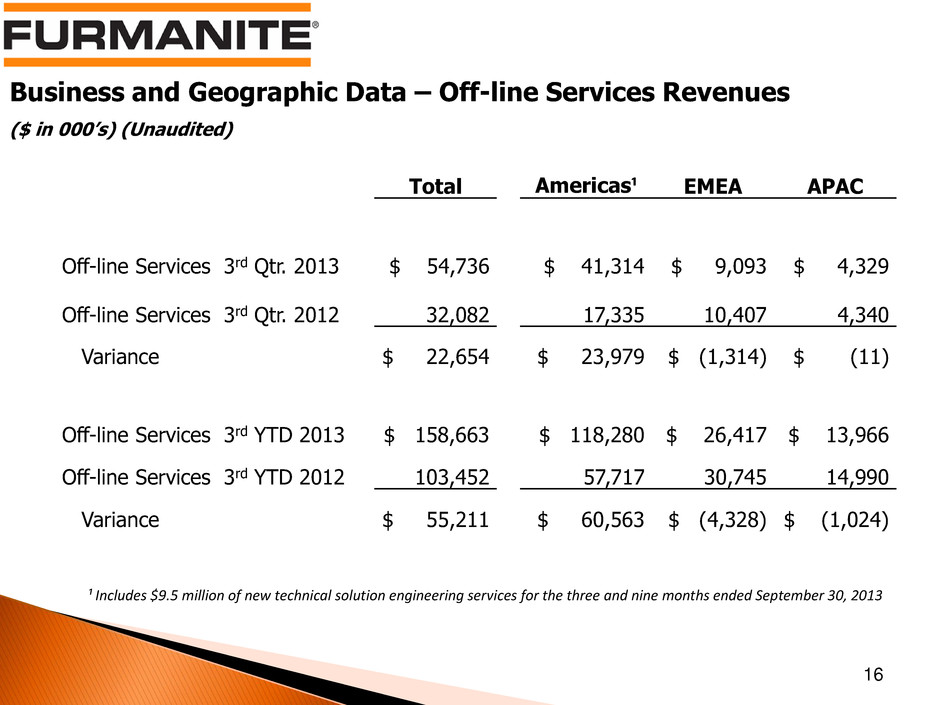
Business and Geographic Data – Off-line Services Revenues ($ in 000’s) (Unaudited) 16 Total Americas¹ EMEA APAC Off-line Services 3rd Qtr. 2013 $ 54,736 $ 41,314 $ 9,093 $ 4,329 Off-line Services 3rd Qtr. 2012 32,082 17,335 10,407 4,340 Variance $ 22,654 $ 23,979 $ (1,314) $ (11) Off-line Services 3rd YTD 2013 $ 158,663 $ 118,280 $ 26,417 $ 13,966 Off-line Services 3rd YTD 2012 103,452 57,717 30,745 14,990 Variance $ 55,211 $ 60,563 $ (4,328) $ (1,024) ¹ Includes $9.5 million of new technical solution engineering services for the three and nine months ended September 30, 2013

Furmanite Corporation Review of 3Q 2013 November 1, 2013 www.furmanite.com 17
