Attached files
| file | filename |
|---|---|
| EX-99.2 - EXHIBIT 99.2 - Gramercy Property Trust Inc. | v352019_ex99-2.htm |
| EX-99.1 - EXHIBIT 99.1 - Gramercy Property Trust Inc. | v352019_ex99-1.htm |
| 8-K - FORM 8-K - Gramercy Property Trust Inc. | v352019_8k.htm |

Supplemental Second Quarter 2013

Forward - Looking Information/NOI and Cap Rate Disclaimers Cautionary Note Regarding Forward - Looking Information This investment presentation contains "forward - looking statements" based upon the Company's current best judgment and expectations . You can identify forward - looking statements by the use of forward - looking expressions such as “may,” “will,” “should,” “expect,” “believe,” “anticipate,” “estimate,” “intend,” “plan,” “project,” “continue,” or any negative or other variations on such expressions . Forward - looking statements include information concerning possible or assumed future results of the Company's operations, including any forecasts, projections, plans and objectives for future operations . Although the Company believes that its plans, intentions and expectations as reflected in or suggested by those forward - looking statements are reasonable, the Company can give no assurance that the plans, intentions or expectations will be achieved . The Company has listed below some important risks, uncertainties and contingencies which could cause its actual results, performance or achievements to be materially different from the forward - looking statements it makes in this presentation . These risks, uncertainties and contingencies include, but are not limited to, the following : the success or failure of the Company's efforts to implement its Company's current business strategy ; the Company's ability to identify and complete additional property acquisitions and risks of real estate acquisitions ; availability of investment opportunities on real estate assets and real estate - related and other securities ; the performance and financial condition of tenants and corporate customers ; the adequacy of the Company's cash reserves, working capital and other forms of liquidity ; the availability, terms and deployment of short - term and long - term capital ; demand for office and industrial space ; the actions of the Company's competitors and ability to respond to those actions ; the timing of cash flows from the Company's investments ; the cost and availability of the Company's financings, which depends in part on the Company's asset quality, the nature of the Company's relationships with its lenders and other capital providers, the Company's business prospects and outlook and general market conditions ; the continuity of the management agreement for the KBS portfolio ; economic conditions generally and in the real estate markets and the capital markets specifically ; unanticipated increases in financing and other costs, including a rise in interest rates ; the Company's ability to maintain its current relationships with financial institutions and to establish new relationships with additional financial institutions ; the Company's ability to profitably dispose of non - core assets ; availability of, and ability to retain, qualified personnel and directors ; changes to the Company's management and board of directors ; changes in governmental regulations, tax rates and similar matters ; legislative and regulatory changes (including changes to laws governing the taxation of REITs or the exemptions from registration as an investment company) ; environmental and/or safety requirements ; the Company's ability to satisfy complex rules in order for it to qualify as a REIT, for federal income tax purposes, the Company's operating partnership’s ability to satisfy the rules in order for it to qualify as a partnership for federal income tax purposes, and the ability of certain of the Company's subsidiaries to qualify as REITs and certain of the Company's subsidiaries to qualify as TRSs for federal income tax purposes, and the Company's ability and the ability of its subsidiaries to operate effectively within the limitations imposed by these rules ; the continuing threat of terrorist attacks on the national, regional and local economies ; and other factors discussed under Item 1 A, “Risk Factors” of the Company's Annual Report on Form 10 - K for the year ended December 31 , 2012 . The Company assumes no obligation to update any forward - looking statements, whether as a result of new information, future events, or otherwise . In evaluating forward - looking statements, you should consider these risks and uncertainties, together with the other risks described from time - to - time in the Company's reports and documents which are filed with the SEC, and you should not place undue reliance on those statements . The risks included here are not exhaustive . Other sections of this report may include additional factors that could adversely affect the Company's business and financial performance . Moreover, the Company operates in a very competitive and rapidly changing environment . New risk factors emerge from time to time and it is not possible for management to predict all such risk factors, nor can it assess the impact of all such risk factors on the Company's business or the extent to which any factor, or combination of factors, may cause actual results to differ materially from those contained in any forward - looking statements . Given these risks and uncertainties, investors should not place undue reliance on forward - looking statements as a prediction of actual results . NOI and Cap Rate Disclaimer Net operating income is a non - GAAP financial measure that represents property revenues on a straight - lined basis minus property expenses before interest and capital reserves/expenditures . Capitalization rate is a rate of return on a real estate investment property based on the expected, straight - lined income that property will generate . Capitalization rate is used to estimate the Company’s potential return on its investment . This is done by dividing the income the property will generate (before debt service and depreciation and after fixed costs and variable costs) by the acquisition price of the property . The NOI and Cap Rate assumptions included in this presentation reflects the Company's assumptions and expectations which are not guarantees of its future performance . The Company's actual NOI and Cap Rate may vary materially from the assumptions presented in this presentation . The results that an investor in the Company will actually receive will depend, to a significant degree, on the actual performance of the Company's assets, which may be impacted by material economic and market risk factors . 2

Table of Contents Page About Gramercy 4 Investment Focus 5 Second Quarter 2013 Highlights 6 Current Portfolio Owned Portfolio 9 Financial Information Comparative Statement of Operations 11 Comparative Balance Sheets 12 Comparative Computation of FFO & AFFO 13 Business Segment Report 14 Joint Ventures Bank of America Portfolio - Statement of Operations 16 Bank of America Portfolio - Balance Sheet 17 Philips - Statement of Operations 18 3

Gramercy Property Trust Gramercy Property Trust Inc . (NYSE : GPT) , or the Company, is a fully - integrated, self - managed commercial real estate investment company focused on acquiring and managing income - producing office and industrial properties net leased to high quality tenants in major markets throughout the United States . The Company also operates an asset management business that manages for third - parties, including our joint venture partners, commercial real estate assets throughout the United States primarily leased to financial institutions and affiliated users . To review the Company’s latest news releases and other corporate documents, please visit the Company's website at www . gptreit . com or contact Investor Relations at 212 - 297 - 1000 . 4

Investment Focus The Company’s principal business is to acquire and manage industrial and office properties, net leased to high quality tenants in target markets throughout the United States. • Portfolio average lease term > 10 years • Properties critical to tenant operations • Top 50 major markets • Focus on contract rent versus market rent • Prudent use of leverage – target leverage of 50% - 55% - With expected current borrowing rates of 3.50% - 5.50% - Stagger maturities • Cap Rates – 7.0% - 9.0% straight - lined 5

Second Quarter 2013 Highlights ▪ New name Gramercy Property Trust Inc. and new NYSE ticker symbol GPT effective April 15, 2013 ▪ Secured $14.5 million senior mortgage financing with Northwestern Real Estate Investments, LLC – 3.28% five - year, fixed rate loan secured by the 540,000 sq. ft. Indianapolis Industrial Portfolio ▪ Sold the defeased mortgage and corresponding pool of pledged treasury securities in the Bank of America Portfolio Joint Venture, generating net cash proceeds of $1.8 million to the Company and eliminating future interest expense (or losses) related to the defeased mortgage. ▪ Acquired 11 properties for a total purchase price of approximately $111.2 million, collectively containing: – 15 - year average lease term – $11.9 million NOI (GAAP) ▪ Recognized $5.4 million of incentive fees based upon the value of the KBS Portfolio at quarter end. ▪ Reduced management, general and administrative expenses, or MG&A, to $4.3 million for the quarter from $4.4 million from the prior quarter. MG&A was $9.3 million for the same quarter of the prior year. ▪ Ended the second quarter of 2013 with cash and cash equivalents of $49.0 million as compared to $100.5 million reported at the end of the prior quarter. 6

Second Quarter 2013 Acquisitions 7 Investment Location Metropolitan Statistical Area (MSA) Major Tenants Square Feet /Doors Purchase Price Occupancy GAAP Cap Rate GAAP NOI Bank Branch Portfolio Emmaus Bank Branch Emmaus, PA Allentown Wells Fargo 4,800 1,610,000$ 100% 10.3% 165,186$ Calabash Bank Branch Calabash, NC Wilmington PNC Bank 2,048 610,000 100% 13.0% 79,178$ 6,848 2,220,000$ 100% 11.0% 244,364$ Warehouse Portfolio Bulk Warehouse/Assembly Bellmawr Industrial Bellmawr, NJ Philadelphia FedEx 62,230 4,175,000$ 100% 7.5% 313,960$ Freezer/Cooler Hialeah Industrial 1 Hialeah, FL Miami Preferred Freezer 120,000 25,000,000 100% 9.4% 2,347,500$ Logan Township Industrial Logan Township, NJ Philadelphia UNFI 70,000 11,725,000 100% 7.2% 848,864$ 252,230 40,900,000$ 100% 8.6% 3,510,324$ Specialty Assets Hutchins Auto Auction Facility 2 Hutchins, TX Dallas KAR/Adesa 196,300 58,500,000$ 100% 9.7% 5,677,370$ 196,300 58,500,000$ 100% 9.7% 5,677,370$ Cross-Dock Truck Terminals Doors 3 Atlanta Truck Terminal Atlanta, GA Atlanta FedEx Freight 178 7,850,000$ 100% 8.5% 670,390$ Deer Park Truck Terminal Deer Park, NY New York/New Jersey YRC Freight 54 3,900,000 100% 7.6% 297,960$ Elkridge Truck Terminal Elkridge, MD Baltimore/Washington New Penn 61 5,900,000 100% 8.9% 527,261$ Houston Truck Terminal Houston, TX Houston YRC Freight 189 6,914,000 100% 8.2% 565,578$ Orlando Truck Terminal Orlando, FL Orlando YRC Freight 72 5,036,000 100% 7.7% 386,851$ 554 29,600,000$ 100% 8.3% 2,448,040$ 1 2 3 Build-to-Suit commitment to construct a 120,000 square foot cold storage facility which will be 100% leased for an initial term of 25 years when completed in the second quarter of 2014. Total costs are expected to be approximately $25.0 million. Encumbered with a fully-amortizing, first mortgage of approximately $26.3 million at a fixed rate of 6.95% that is co-terminus with the lease. The first mortgages was assumed at the acquisition. The Cross-Dock Truck Terminals contain approximately 330,000 building square footage. Cross-Dock Truck Terminals are typically sized based upon the number of dock doors.

8 Current Portfolio

Gramercy Owned Portfolio – June 30, 2013 9 GAAP GAAP Investment Location MSA Major Tenants Property Type Sq. Ft./Doors Purchase Price Occupancy Cap Rate NOI Office Portfolio 1 Philips Electronics (25%) Somerset, NJ New York/New Jersey Philips Electronics Class A Office 49,975 12,562,500$ 100% 7.2% 907,013$ Phoenix Ops Center (50%) Phoenix, AZ Phoenix Bank of America Class A Office 269,925 25,572,375$ 100% 9.2% 2,358,198$ Jacksonville Ops Center (50%) Jacksonville, FL Jacksonville Bank of America Class A Office 618,860 53,671,032$ 100% 11.0% 5,910,332$ 938,759 91,805,907$ 100% 10.0% 9,175,543$ Bank Branch Portfolio 1 California Branch Portfolio (50%) Various California Bank of America Bank Branch 324,234 32,397,552$ 96% 9.6% 3,095,740$ Florida Branch Portfolio (50%) Various Florida Bank of America Bank Branch 125,609 12,561,781$ 100% 11.0% 1,376,995$ Western Branch Portfolio (50%) Various AZ, NM, TX, WA Bank of America Bank Branch 128,033 10,633,541$ 95% 9.0% 960,042$ Other Branch Portfolio (50%) Various MD, MO, GA, KS Bank of America Bank Branch 67,490 7,708,719$ 92% 7.6% 586,058$ 645,365 63,301,593$ 96% 9.5% 6,018,835$ Warehouse Portfolio Bulk Warehouse/Assembly Indianapolis Industrial Greenwood, IN / Mt. Comfort, INIndianapolis Nestle Waters/Stanley Tools Class A Industrial 539,429 27,125,000$ 100% 8.4% 2,267,650$ Olive Branch Industrial Olive Branch, MS Memphis Five Below Class A Industrial 605,427 24,700,000$ 100% 7.4% 1,820,390$ Garland Industrial Garland, TX Dallas/Ft. Worth Apex Tools Class B Industrial 341,840 10,700,000$ 100% 7.8% 838,880$ Bellmawr Industrial Bellmawr, NJ Philadelphia FedEx Class B Industrial 62,230 4,175,000$ 100% 7.5% 313,960$ Freezer/Cooler Hialeah Industrial 2 Hialeah, FL Miami Preferred Freezer Industrial - Freezer/Cooler 120,000 25,000,000$ 100% 9.4% 2,347,500$ Logan Township Industrial Logan Township, NJ Philadelphia UNFI Industrial - Freezer/Cooler 70,000 11,725,000$ 100% 7.2% 848,864$ 1,738,926 103,425,000$ 100% 8.2% 8,437,244$ Specialty Assets Hutchins Auto Auction Facility 3 Hutchins, TX Dallas KAR/Adesa Specialty - Auto Auction 196,366 58,500,000$ 100% 9.7% 5,677,370$ 196,366 58,500,000 100% 9.7% 5,677,370$ Cross-Dock Truck Terminals Doors 4 East Brunswick Truck Terminal East Brunswick, NJ New York/New Jersey Con-Way Industrial - Truck Terminal 101 11,650,000$ 100% 8.1% 940,155$ Atlanta Truck Terminal Atlanta, GA Atlanta FedEx Freight Industrial - Truck Terminal 178 7,850,000$ 100% 8.5% 670,390$ Deer Park Truck Terminal Deer Park, NY New York/New Jersey YRC Freight Industrial - Truck Terminal 54 3,900,000$ 100% 7.6% 297,960$ Elkridge Truck Terminal Elkridge, MD Baltimore/Washington New Penn Industrial - Truck Terminal 61 5,900,000$ 100% 8.9% 527,261$ Houston Truck Terminal Houston, TX Houston YRC Freight Industrial - Truck Terminal 189 6,914,000$ 100% 8.2% 565,578$ Orlando Truck Terminal Orlando, FL Orlando YRC Freight Industrial - Truck Terminal 72 5,036,000$ 100% 7.7% 386,851$ 655 41,250,000$ 100% 8.2% 3,388,195$ Total 32,697,187$ 1 Includes properties owned directly by Gramercy and Gramercy's interest in properties owned by an unconsolidated joint venture. 2 Build-to-Suit commitment to construct a 120,000 square foot cold storage facility which will be 100% leased for an initial term of 25 years when completed in second quarter of 2014. 3 Encumbered with a fully-amortizing, first mortgage of approximately $26.3 million at a fixed rate of 6.95% that is co-terminus with the lease. The first mortgages was assumed at the acquisition. 4 The Cross-Dock Truck Terminals contain approximately 360,000 building square footage. Cross-Dock Truck Terminals are typically sized based upon the number of dock doors.
10 Financial Information

Comparative Statement of Operations 11 (Dollar amounts in thousands, except per share data) 2013 2012 2013 2012 Revenues Management fees 13,617$ 9,616$ 21,932$ 17,929$ Rental revenue 1,804 - 2,460 - Investment income 617 - 769 - Operating expense reimbursements 196 - 304 - Other income 70 24 106 66 Total revenues 16,304 9,640 25,571 17,995 Expenses Property operating expenses: Property management expenses 5,016 5,631 11,173 11,799 Property operating expenses 307 - 424 - Total property operating expenses 5,323 5,631 11,597 11,799 Other-than-temporary impairment 1,682 - 1,682 - Portion of impairment recognized in other comprehensive loss - - - - Net impairment recognized in earnings 1,682 - 1,682 - Depreciation and amortization 919 45 1,256 86 Interest Expense 85 - 85 - Management, general and administrative 4,272 9,319 8,694 14,446 Acquisition expenses 698 - 1,249 - Total expenses 12,979 14,995 24,563 26,331 Loss from continuing operations before equity in income (loss) from joint ventures and provisions for taxes 3,325 (5,355) 1,008 (8,336) Equity in net income (loss) of joint ventures (2,603) 29 (3,791) 57 Loss from continuing operations before provision for taxes and discontinued operations 722 (5,326) (2,783) (8,279) Provision for taxes (4,441) (2,107) (4,846) (3,419) Net loss from continuing operations (3,719) (7,433) (7,629) (11,698) Net income (loss) from discontinued operations (1,175) (12,331) 9,970 (20,368) Gain on sale of joint venture interest to a related party - - 1,317 - Net gains from disposals - - 389,140 11,996 Provision for taxes - 53 (2,515) - Net income (loss) from discontinued operations (1,175) (12,278) 397,912 (8,372) Net income (loss) attributable to Gramercy Property Trust Inc. (4,894) (19,711) 390,283 (20,070) Accrued preferred stock dividends (1,790) (1,790) (3,580) (3,580) Net income (loss) available to common stockholders (6,684)$ (21,501)$ 386,703$ (23,650)$ Other comprehensive income (loss): Unrealized gain (loss) on debt securities and derivative instruments: Unrealized holding gains (losses) arising during period 183$ (11,888)$ 183$ 107,345$ Reclassification of unrealized holding gains on debt securities and derivative instruments into discontinued operations - - 95,265 - Other comprehensive income (loss): 183 (11,888) 95,448 107,345 Comprehensive income (loss) attributable to Gramercy Property Trust Inc. (4,711)$ (31,599)$ 485,731$ 87,275$ Comprehensive income (loss) attributable to common stockholders (6,501)$ (33,389)$ 482,151$ 83,695$ Basic earninds per share: Net loss from continuing operations, after preferred dividends (0.09)$ (0.18)$ (0.20)$ (0.31)$ Net income (loss) from discontinued operations (0.02) (0.24) 6.79 (0.16) Net income (loss) available to common stockholders (0.11)$ (0.42)$ 6.59$ (0.47)$ Diluted earnings per share: Net loss from continuing operations, after preferred dividends (0.09)$ (0.18)$ (0.20)$ (0.31)$ Net income (loss) from discontinued operations (0.02) (0.24) 6.79 (0.16) Net income (loss) available to common stockholders (0.11)$ (0.42)$ 6.59$ (0.47)$ Basic weighted average common shares outstanding 58,605,219 50,759,306 58,641,447 50,739,482 Diluted weighted average common shares and common share equivalents outstanding 58,605,219 50,759,306 58,641,447 50,739,482 Three Months Ended June 30, Six Months Ended June 30,
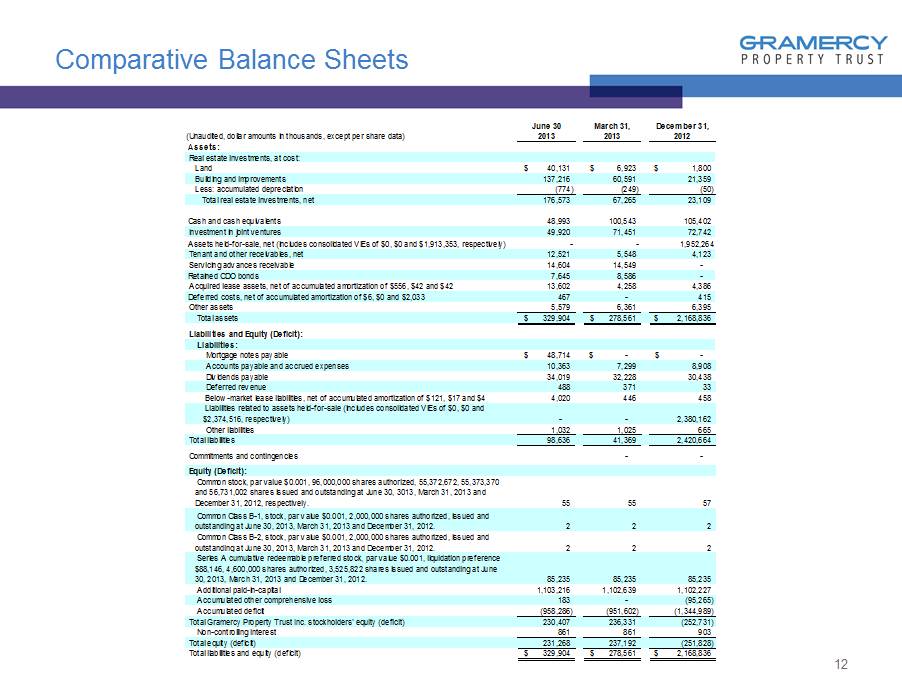
Comparative Balance Sheets 12 June 30 March 31, December 31, (Unaudited, dollar amounts in thousands, except per share data) 2013 2013 2012 Assets: Real estate investments, at cost: Land 40,131$ 6,923$ 1,800$ Building and improvements 137,216 60,591 21,359 Less: accumulated depreciation (774) (249) (50) Total real estate investments, net 176,573 67,265 23,109 Cash and cash equivalents 48,993 100,543 105,402 Investment in joint ventures 49,920 71,451 72,742 Assets held-for-sale, net (includes consolidated VIEs of $0, $0 and $1,913,353, respectively) - - 1,952,264 Tenant and other receivables, net 12,521 5,548 4,123 Servicing advances receivable 14,604 14,549 - Retained CDO bonds 7,645 8,586 - Acquired lease assets, net of accumulated amortization of $556, $42 and $42 13,602 4,258 4,386 Deferred costs, net of accumulated amortization of $6, $0 and $2,033 467 - 415 Other assets 5,579 6,361 6,395 Total assets 329,904$ 278,561$ 2,168,836$ Liabilities and Equity (Deficit): Liabilities: Mortgage notes payable 48,714$ -$ -$ Accounts payable and accrued expenses 10,363 7,299 8,908 Dividends payable 34,019 32,228 30,438 Deferred revenue 488 371 33 Below-market lease liabilities, net of accumulated amortization of $121, $17 and $4 4,020 446 458 Liabilities related to assets held-for-sale (includes consolidated VIEs of $0, $0 and $2,374,516, respectively) - - 2,380,162 Other liabilities 1,032 1,025 665 Total liabilities 98,636 41,369 2,420,664 Commitments and contingencies - - Equity (Deficit): Common stock, par value $0.001, 96,000,000 shares authorized, 55,372,672, 55,373,370 and 56,731,002 shares issued and outstanding at June 30, 3013, March 31, 2013 and December 31, 2012, respectively. 55 55 57 Common Class B-1, stock, par value $0.001, 2,000,000 shares authorized, issued and outstanding at June 30, 2013, March 31, 2013 and December 31, 2012. 2 2 2 Common Class B-2, stock, par value $0.001, 2,000,000 shares authorized, issued and outstanding at June 30, 2013, March 31, 2013 and December 31, 2012. 2 2 2 Series A cumulative redeemable preferred stock, par value $0.001, liquidation preference $88,146, 4,600,000 shares authorized, 3,525,822 shares issued and outstanding at June 30, 2013, March 31, 2013 and December 31, 2012. 85,235 85,235 85,235 Additional paid-in-capital 1,103,216 1,102,639 1,102,227 Accumulated other comprehensive loss 183 - (95,265) Accumulated deficit (958,286) (951,602) (1,344,989) Total Gramercy Property Trust Inc. stockholders' equity (deficit) 230,407 236,331 (252,731) Non-controlling interest 861 861 903 Total equity (deficit) 231,268 237,192 (251,828) Total liabilities and equity (deficit) 329,904$ 278,561$ 2,168,836$

Comparative Computation of FFO 13 The revised White Paper on FFO approved by the Board of Governors of the National Association of Real Estate Investment Trust s, or NAREIT, defines FFO as net income (loss) (determined in accordance with GAAP), excluding impairment write - downs of investments in depreciable real estate and investments in in - substanc e real estate investments, gains or losses from debt restructurings and sales of depreciable operating properties, plus real estate - related depreciation and amortization (excluding amortization of deferred financing costs), less distributions to non - controlling interests and gains/losses from discontinued operations and after adjustments for unconsolidated partnerships and jo int ventures. FFO does not represent cash generated from operating activities in accordance with GAAP and should not be considered as an alternative to net income (determined in acco rda nce with GAAP), as an indication of our financial performance, or to cash flow from operating activities (determined in accordance with GAAP) as a measure of our liquidity, nor is it entir ely indicative of funds available to fund our cash needs, including our ability to make cash distributions. Our calculation of FFO may be different from the calculation used by other companies and, th erefore, comparability may be limited . (Unaudited, dollar amounts in thousands, except per share data) For the Three Months Ended June 30, 2013 June 30, 2012 June 30, 2013 June 30, 2012 Net income (loss) available to common shareholders (6,684)$ (21,501)$ 386,703$ (23,650)$ Add: Depreciation and amortization 919 1,482 1,721 3,054 FFO adjustments for unconsolidated joint ventures 2,266 67 4,647 134 Non-cash impairment of real estate investments - 2,639 - 2,639 Less: Non-real estate depreciation and amortization (46) (1,210) (551) (2,516) Gain on sale of real estate - (53) - (11,996) Funds from operations (3,545)$ (18,576)$ 392,520$ (32,335)$ Add: Property acquisition costs 698 - 1,249 - Non-cash stock-based compensation expense 577 827 989 1,248 Amortization of above market lease assets 39 - 75 - Amortization of deferred financing costs 6 - 6 - Other-than-temporary impairments on retained bonds 1,682 - 1,682 - AFFO adjustments for joint ventures 3,121 9 4,644 18 (Income) loss from discontinued operations 1,175 12,278 (397,912) 8,372 Less: Straight-lined rent (518) - (651) - Amortization of below market lease liabilities (104) - (117) - FFO adjustment for discontinued operations - (2,879) (15) 8,777 Incentive fees, net of taxes (3,166) (182) (3,326) (390) Adjusted Funds from Operations (35)$ (8,523)$ (856)$ (14,310)$ Funds from operations per share - basic (0.06)$ (0.37)$ 6.69$ (0.64)$ Funds from operations per share - diluted (0.06)$ (0.37)$ 6.69$ (0.64)$ Adjusted funds from operations per share - basic (0.00)$ (0.17)$ (0.01)$ (0.29)$ Adjusted funds from operations per share - diluted (0.00)$ (0.17)$ (0.01)$ (0.29)$ For the Six Months Ended
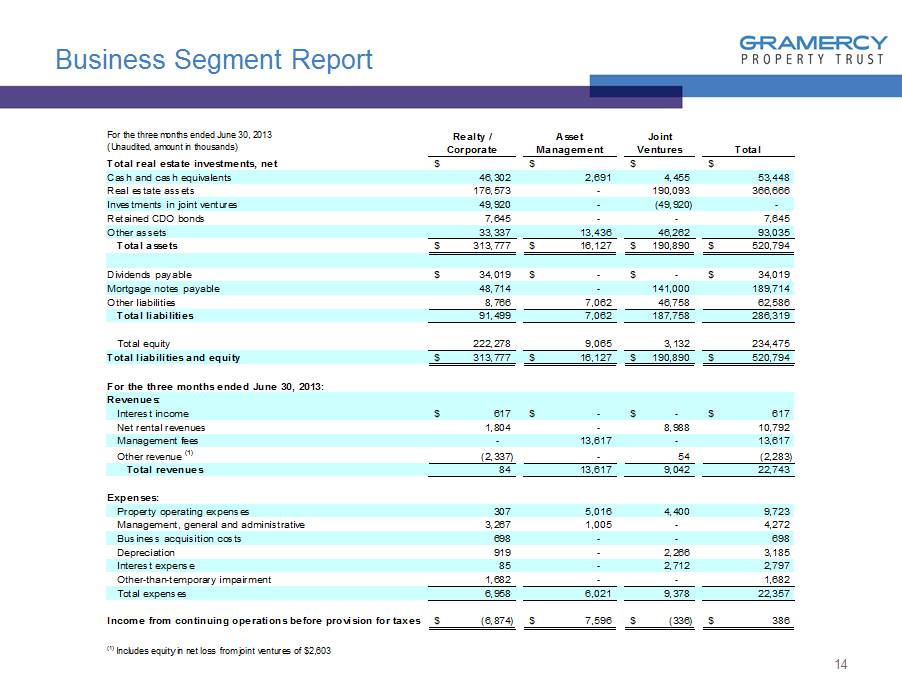
Business Segment Report 14 For the three months ended June 30, 2013 (Unaudited, amount in thousands) Total real estate investments, net $ $ $ $ Cash and cash equivalents 46,302 2,691 4,455 53,448 Real estate assets 176,573 - 190,093 366,666 Investments in joint ventures 49,920 - (49,920) - Retained CDO bonds 7,645 - - 7,645 Other assets 33,337 13,436 46,262 93,035 Total assets $ 313,777 $ 16,127 $ 190,890 $ 520,794 Dividends payable $ 34,019 $ - $ - $ 34,019 Mortgage notes payable 48,714 - 141,000 189,714 Other liabilities 8,766 7,062 46,758 62,586 Total liabilities 91,499 7,062 187,758 286,319 Total equity 222,278 9,065 3,132 234,475 Total liabilities and equity $ 313,777 $ 16,127 $ 190,890 $ 520,794 For the three months ended June 30, 2013: Revenues: Interest income $ 617 $ - $ - $ 617 Net rental revenues 1,804 - 8,988 10,792 Management fees - 13,617 - 13,617 Other revenue (1) (2,337) - 54 (2,283) Total revenues 84 13,617 9,042 22,743 Expenses: Property operating expenses 307 5,016 4,400 9,723 Management, general and administrative 3,267 1,005 - 4,272 Business acquisition costs 698 - - 698 Depreciation 919 - 2,266 3,185 Interest expense 85 - 2,712 2,797 Other-than-temporary impairment 1,682 - - 1,682 Total expenses 6,958 6,021 9,378 22,357 Income from continuing operations before provision for taxes $ (6,874) $ 7,596 $ (336) $ 386 (1) Includes equity in net loss from joint ventures of $2,603 Realty / Corporate Asset Management Joint Ventures Total

15 Joint Ventures

Bank of America Portfolio – Statement of Operations 16 For the three months ended June 30, 2013 (Dollar amounts in thousands) Bank of America Portfolio Joint Venture: Rental Income and reimbursements $ 15,170 $ 2,349 $ - $ 17,519 $ 8,759 Interest and other income 2 2 104 108 54 Total revenues 15,172 2,351 104 17,627 8,813 Property operating expenses 7,151 1,645 5 8,801 4,400 Asset management fees 377 33 - 410 - Interest expense 2,338 (22) 2,848 5,164 2,581 Depreciation expense 4,050 348 - 4,398 2,199 Total expenses 13,916 2,004 2,853 18,773 9,180 Loss on sale of defeasance pool - - 4,535 4,535 2,268 Net income (loss) $ 1,256 $ 347 $ (7,284) $ (5,681) $ (2,635) Core Properties Held-For-Sale Properties Defeasance Pools Total Gramercy's Interest of JV

Bank of America Portfolio - Balance Sheet 17 For the three months ended June 30, 2013 (Unaudited, dollar amounts in thousands) Assets Real estate investments, at cost: Land $ 63,160 $ 5,677 $ - $ 68,837 Building and improvements 197,759 24,040 - 221,799 Less: accumulated depreciation (6,537) (285) - (6,822) Total real estate investments, net 254,382 29,432 - 283,814 Cash and cash equivalents 8,237 (282) 955 8,910 Restricted cash 6,577 327 - 6,904 Tenant and other receivables, net 84 523 - 607 Acquired lease assets, net of accumulated amortization 48,900 2,784 - 51,684 Deferred costs, net of accumulated amortization 1,655 4 - 1,659 Other assets 6,379 3,226 201 9,806 Total assets $ 326,214 $ 36,014 $ 1,156 $ 363,384 Liabilities and Equity: Liabilities: Mortgage notes payable $ 200,000 - - 200,000 Accounts payable and accrued expenses 9,320 4,311 37 13,668 Accrued interest payable 386 - - 386 Deferred revenue 1,736 576 - 2,312 Below market lease liabilities, net of accumulated amortization 43,963 3,912 - 47,875 Derivative instruments, at fair value 51 - - 51 Total liabilities 255,456 8,799 37 264,292 Equity: Equity - Gramercy Property Trust 36,151 13,608 559 50,318 Equity - Garrison 34,650 13,607 560 48,817 Accumulated other comprehensive loss (43) - - (43) Total equity 70,758 27,215 1,119 99,092 Total liabilities and equity $ 326,214 $ 36,014 $ 1,156 $ 363,384 Core Properties Held-For-Sale Properties Defeasance Pools Total $ $ $

Philips – Statement of Operations 18 For the three months ended June 30, 2013 (Unaudited, dollar amounts in thousands) Philips Building Joint Venture: Rental Income and reimbursements $ 914 $ 229 Interest and other income - - Total revenues 914 229 Property operating expenses - - Property net operating income (NOI) 914 229 Asset management fees 1 - Interest expense 528 131 Depreciation expense 270 67 Total expenses 799 198 Net income (loss) $ 115 $ 31 Total Gramercy's Interest of JV