Attached files
| file | filename |
|---|---|
| EX-99.3 - EXHIBIT 99.3 - Gramercy Property Trust Inc. | v352019_ex99-3.htm |
| EX-99.1 - EXHIBIT 99.1 - Gramercy Property Trust Inc. | v352019_ex99-1.htm |
| 8-K - FORM 8-K - Gramercy Property Trust Inc. | v352019_8k.htm |
Business Plan Update August 2013
Forward - Looking Information/NOI and Cap Rate Disclaimers Cautionary Note Regarding Forward - Looking Information This investment presentation contains "forward - looking statements" based upon the Company's current best judgment and expectations . You can identify forward - looking statements by the use of forward - looking expressions such as “may,” “will,” “should,” “expect,” “believe,” “anticipate,” “estimate,” “intend,” “plan,” “project,” “continue,” or any negative or other variations on such expressions . Forward - looking statements include information concerning possible or assumed future results of the Company's operations, including any forecasts, projections, plans and objectives for future operations . Although the Company believes that its plans, intentions and expectations as reflected in or suggested by those forward - looking statements are reasonable, the Company can give no assurance that the plans, intentions or expectations will be achieved . The Company has listed below some important risks, uncertainties and contingencies which could cause its actual results, performance or achievements to be materially different from the forward - looking statements it makes in this presentation . These risks, uncertainties and contingencies include, but are not limited to, the following : the success or failure of the Company's efforts to implement its Company's current business strategy ; the Company's ability to identify and complete additional property acquisitions and risks of real estate acquisitions ; availability of investment opportunities on real estate assets and real estate - related and other securities ; the performance and financial condition of tenants and corporate customers ; the adequacy of the Company's cash reserves, working capital and other forms of liquidity ; the availability, terms and deployment of short - term and long - term capital ; demand for office and industrial space ; the actions of the Company's competitors and ability to respond to those actions ; the timing of cash flows from the Company's investments ; the cost and availability of the Company's financings, which depends in part on the Company's asset quality, the nature of the Company's relationships with its lenders and other capital providers, the Company's business prospects and outlook and general market conditions ; the continuity of the management agreement for the KBS portfolio ; economic conditions generally and in the real estate markets and the capital markets specifically ; unanticipated increases in financing and other costs, including a rise in interest rates ; the Company's ability to maintain its current relationships with financial institutions and to establish new relationships with additional financial institutions ; the Company's ability to profitably dispose of non - core assets ; availability of, and ability to retain, qualified personnel and directors ; changes to the Company's management and board of directors ; changes in governmental regulations, tax rates and similar matters ; legislative and regulatory changes (including changes to laws governing the taxation of REITs or the exemptions from registration as an investment company) ; environmental and/or safety requirements ; the Company's ability to satisfy complex rules in order for it to qualify as a REIT, for federal income tax purposes, the Company's operating partnership’s ability to satisfy the rules in order for it to qualify as a partnership for federal income tax purposes, and the ability of certain of the Company's subsidiaries to qualify as REITs and certain of the Company's subsidiaries to qualify as TRSs for federal income tax purposes, and the Company's ability and the ability of its subsidiaries to operate effectively within the limitations imposed by these rules ; the continuing threat of terrorist attacks on the national, regional and local economies ; and other factors discussed under Item 1 A, “Risk Factors” of the Company's Annual Report on Form 10 - K for the year ended December 31 , 2012 . The Company assumes no obligation to update any forward - looking statements, whether as a result of new information, future events, or otherwise . In evaluating forward - looking statements, you should consider these risks and uncertainties, together with the other risks described from time - to - time in the Company's reports and documents which are filed with the SEC, and you should not place undue reliance on those statements . The risks included here are not exhaustive . Other sections of this report may include additional factors that could adversely affect the Company's business and financial performance . Moreover, the Company operates in a very competitive and rapidly changing environment . New risk factors emerge from time to time and it is not possible for management to predict all such risk factors, nor can it assess the impact of all such risk factors on the Company's business or the extent to which any factor, or combination of factors, may cause actual results to differ materially from those contained in any forward - looking statements . Given these risks and uncertainties, investors should not place undue reliance on forward - looking statements as a prediction of actual results . NOI and Cap Rate Disclaimer Net operating income is a non - GAAP financial measure that represents property revenues on a straight - lined basis minus property expenses before interest and capital reserves/expenditures . Capitalization rate is a rate of return on a real estate investment property based on the expected, straight - lined income that property will generate . Capitalization rate is used to estimate the Company’s potential return on its investment . This is done by dividing the income the property will generate (before debt service and depreciation and after fixed costs and variable costs) by the acquisition price of the property . The NOI and Cap Rate assumptions included in this presentation reflects the Company's assumptions and expectations which are not guarantees of its future performance . The Company's actual NOI and Cap Rate may vary materially from the assumptions presented in this presentation . The results that an investor in the Company will actually receive will depend, to a significant degree, on the actual performance of the Company's assets, which may be impacted by material economic and market risk factors . 2
Contents ▪ Investment Update ▪ Asset Management Update ▪ MG&A Update ▪ Financial Analysis ▪ Capital Markets Discussion 3
4 Investment Update
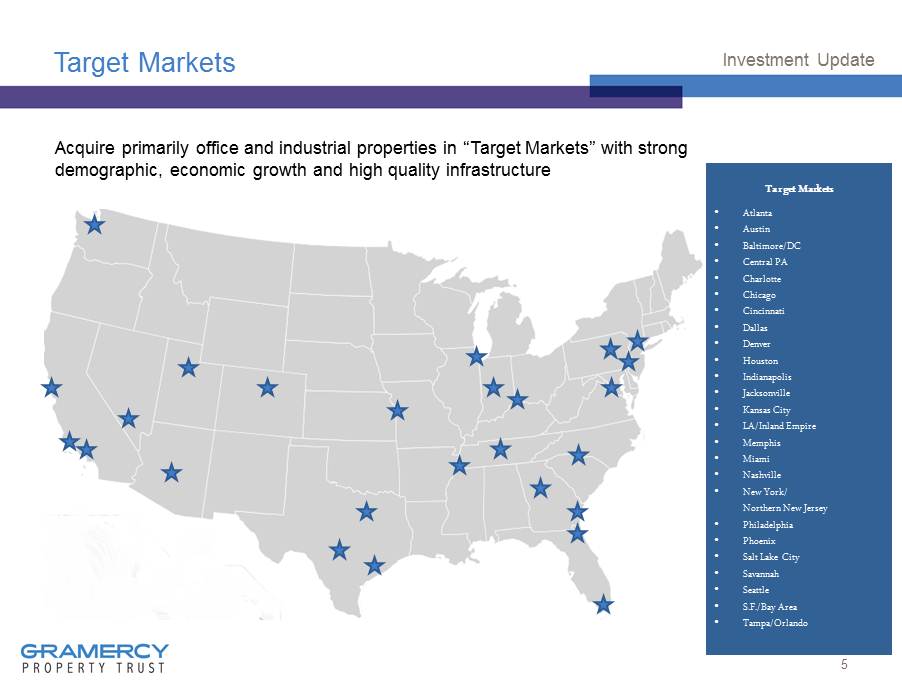
Target Markets Acquire primarily office and industrial properties in “Target Markets” with strong demographic, economic growth and high quality infrastructure 5 Investment Update Target Markets • Atlanta • Austin • Baltimore/DC • Central PA • Charlotte • Chicago • Cincinnati • Dallas • Denver • Houston • Indianapolis • Jacksonville • Kansas City • LA/Inland Empire • Memphis • Miami • Nashville • New York/ Northern New Jersey • Philadelphia • Phoenix • Salt Lake City • Savannah • Seattle • S.F./Bay Area • Tampa/Orlando
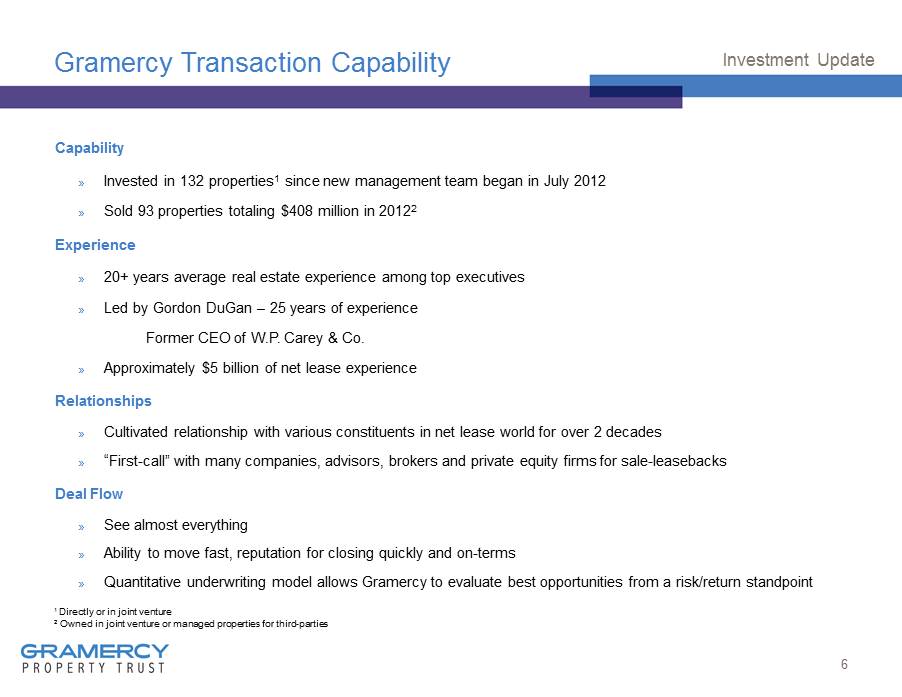
Gramercy Transaction Capability Capability » Invested in 132 properties 1 since new management team began in July 2012 » Sold 93 properties totaling $408 million in 2012 2 Experience » 20+ years average real estate experience among top executives » Led by Gordon DuGan – 25 years of experience Former CEO of W.P. Carey & Co. » Approximately $5 billion of net lease experience Relationships » Cultivated relationship with various constituents in net lease world for over 2 decades » “First - call” with many companies, advisors, brokers and private equity firms for sale - leasebacks Deal Flow » See almost everything » Ability to move fast, reputation for closing quickly and on - terms » Quantitative underwriting model allows Gramercy to evaluate best opportunities from a risk/return standpoint 6 Investment Update 1 Directly or in joint venture 2 Owned in joint venture or managed properties for third - parties
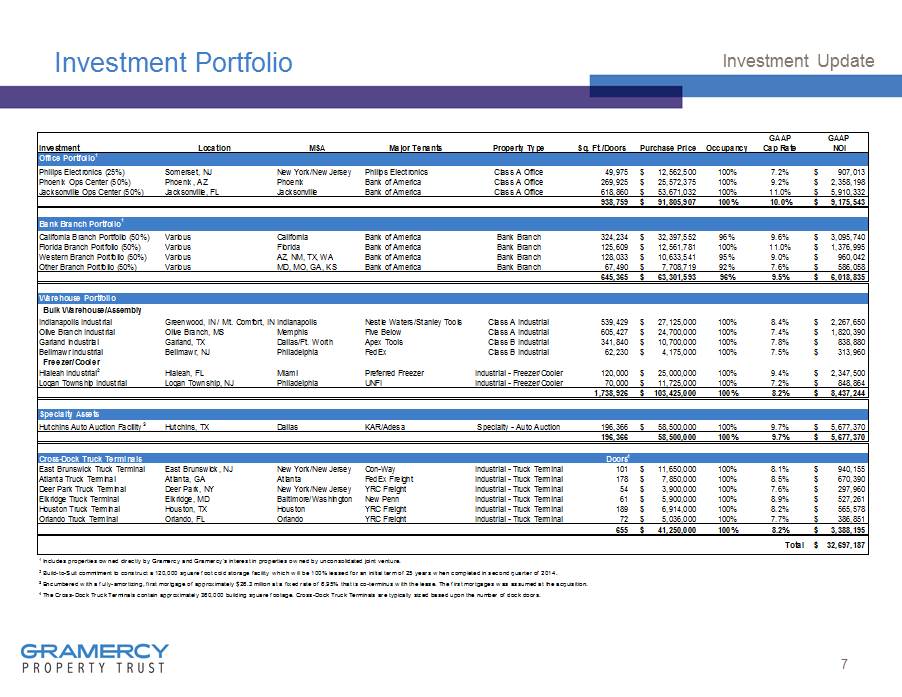
Investment Portfolio 7 Investment Update GAAP GAAP Investment Location MSA Major Tenants Property Type Sq. Ft./Doors Purchase Price Occupancy Cap Rate NOI Office Portfolio 1 Philips Electronics (25%) Somerset, NJ New York/New Jersey Philips Electronics Class A Office 49,975 12,562,500$ 100% 7.2% 907,013$ Phoenix Ops Center (50%) Phoenix, AZ Phoenix Bank of America Class A Office 269,925 25,572,375$ 100% 9.2% 2,358,198$ Jacksonville Ops Center (50%) Jacksonville, FL Jacksonville Bank of America Class A Office 618,860 53,671,032$ 100% 11.0% 5,910,332$ 938,759 91,805,907$ 100% 10.0% 9,175,543$ Bank Branch Portfolio 1 California Branch Portfolio (50%) Various California Bank of America Bank Branch 324,234 32,397,552$ 96% 9.6% 3,095,740$ Florida Branch Portfolio (50%) Various Florida Bank of America Bank Branch 125,609 12,561,781$ 100% 11.0% 1,376,995$ Western Branch Portfolio (50%) Various AZ, NM, TX, WA Bank of America Bank Branch 128,033 10,633,541$ 95% 9.0% 960,042$ Other Branch Portfolio (50%) Various MD, MO, GA, KS Bank of America Bank Branch 67,490 7,708,719$ 92% 7.6% 586,058$ 645,365 63,301,593$ 96% 9.5% 6,018,835$ Warehouse Portfolio Bulk Warehouse/Assembly Indianapolis Industrial Greenwood, IN / Mt. Comfort, INIndianapolis Nestle Waters/Stanley Tools Class A Industrial 539,429 27,125,000$ 100% 8.4% 2,267,650$ Olive Branch Industrial Olive Branch, MS Memphis Five Below Class A Industrial 605,427 24,700,000$ 100% 7.4% 1,820,390$ Garland Industrial Garland, TX Dallas/Ft. Worth Apex Tools Class B Industrial 341,840 10,700,000$ 100% 7.8% 838,880$ Bellmawr Industrial Bellmawr, NJ Philadelphia FedEx Class B Industrial 62,230 4,175,000$ 100% 7.5% 313,960$ Freezer/Cooler Hialeah Industrial 2 Hialeah, FL Miami Preferred Freezer Industrial - Freezer/Cooler 120,000 25,000,000$ 100% 9.4% 2,347,500$ Logan Township Industrial Logan Township, NJ Philadelphia UNFI Industrial - Freezer/Cooler 70,000 11,725,000$ 100% 7.2% 848,864$ 1,738,926 103,425,000$ 100% 8.2% 8,437,244$ Specialty Assets Hutchins Auto Auction Facility 3 Hutchins, TX Dallas KAR/Adesa Specialty - Auto Auction 196,366 58,500,000$ 100% 9.7% 5,677,370$ 196,366 58,500,000 100% 9.7% 5,677,370$ Cross-Dock Truck Terminals Doors 4 East Brunswick Truck Terminal East Brunswick, NJ New York/New Jersey Con-Way Industrial - Truck Terminal 101 11,650,000$ 100% 8.1% 940,155$ Atlanta Truck Terminal Atlanta, GA Atlanta FedEx Freight Industrial - Truck Terminal 178 7,850,000$ 100% 8.5% 670,390$ Deer Park Truck Terminal Deer Park, NY New York/New Jersey YRC Freight Industrial - Truck Terminal 54 3,900,000$ 100% 7.6% 297,960$ Elkridge Truck Terminal Elkridge, MD Baltimore/Washington New Penn Industrial - Truck Terminal 61 5,900,000$ 100% 8.9% 527,261$ Houston Truck Terminal Houston, TX Houston YRC Freight Industrial - Truck Terminal 189 6,914,000$ 100% 8.2% 565,578$ Orlando Truck Terminal Orlando, FL Orlando YRC Freight Industrial - Truck Terminal 72 5,036,000$ 100% 7.7% 386,851$ 655 41,250,000$ 100% 8.2% 3,388,195$ Total 32,697,187$ 1 Includes properties owned directly by Gramercy and Gramercy's interest in properties owned by unconsolidated joint venture. 2 Build-to-Suit commitment to construct a 120,000 square foot cold storage facility which will be 100% leased for an initial term of 25 years when completed in second quarter of 2014. 3 Encumbered with a fully-amortizing, first mortgage of approximately $26.3 million at a fixed rate of 6.95% that is co-terminus with the lease. The first mortgages was assumed at the acquisition. 4 The Cross-Dock Truck Terminals contain approximately 360,000 building square footage. Cross-Dock Truck Terminals are typically sized based upon the number of dock doors.
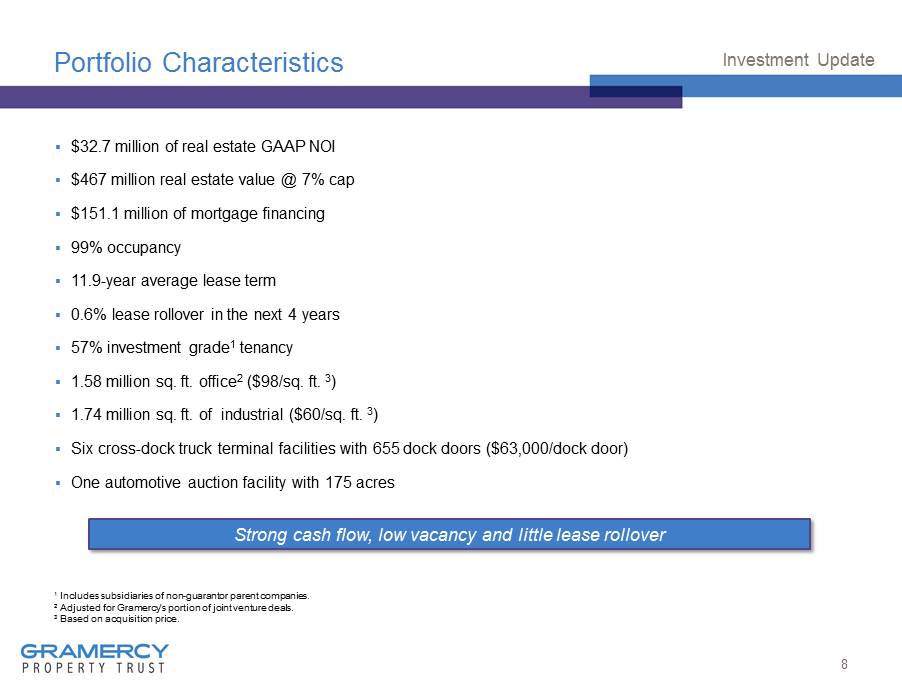
Portfolio Characteristics ▪ $32.7 million of real estate GAAP NOI ▪ $467 million real estate value @ 7% cap ▪ $151.1 million of mortgage financing ▪ 99% occupancy ▪ 11.9 - year average lease term ▪ 0.6% lease rollover in the next 4 years ▪ 57% investment grade 1 tenancy ▪ 1.58 million sq. ft. office 2 ($98/sq. ft. 3 ) ▪ 1.74 million sq. ft. of industrial ($60/sq. ft. 3 ) ▪ Six cross - dock truck terminal facilities with 655 dock doors ($63,000/dock door) ▪ One automotive auction facility with 175 acres d 8 Investment Update 1 Includes subsidiaries of non - guarantor parent companies. 2 Adjusted for Gramercy’s portion of joint venture deals. 3 Based on acquisition price. Strong cash flow, low vacancy and little lease rollover
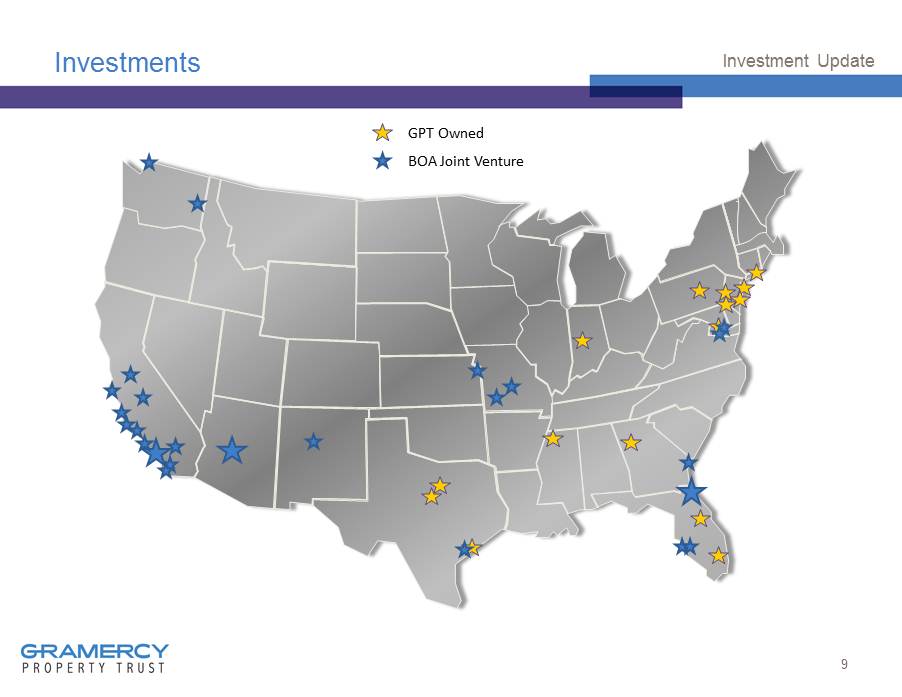
Investments Investment Update GPT Owned BOA Joint Venture 9

Portfolio Characteristics 10 Investment Update Office 28% Bank Branch 18% Bulk Warehouse / Assembly 16% Warehouse - Freezer/Cooler 10% Specialty 18% Cross - Dock Truck Terminal 10% Portfolio by Property Type Bank of America 48% KAR Auction Services 19% Preferred Freezer 8% Five Below 6% YRC Freight 4% Nestle Waters 3% Albert's Organics 3% Apex Tools 3% Stanley Tools 3% FedEx 3% Top Ten Tenants by % of NOI

Lease Expirations* $8 $58 $10 $112 $26 $602 $2,825 $617 $2,065 $20,626 $- $2,500 $5,000 $7,500 $10,000 $12,500 $15,000 $17,500 $20,000 $22,500 2013 2014 2015 2016 2017 2018 2019 2020 2021 2022 2023 (Amount in Thousands) Lease Expirations by Projected Annual Rent 11 Investment Update * Adjusted for Gramercy’s portion of joint venture deals.
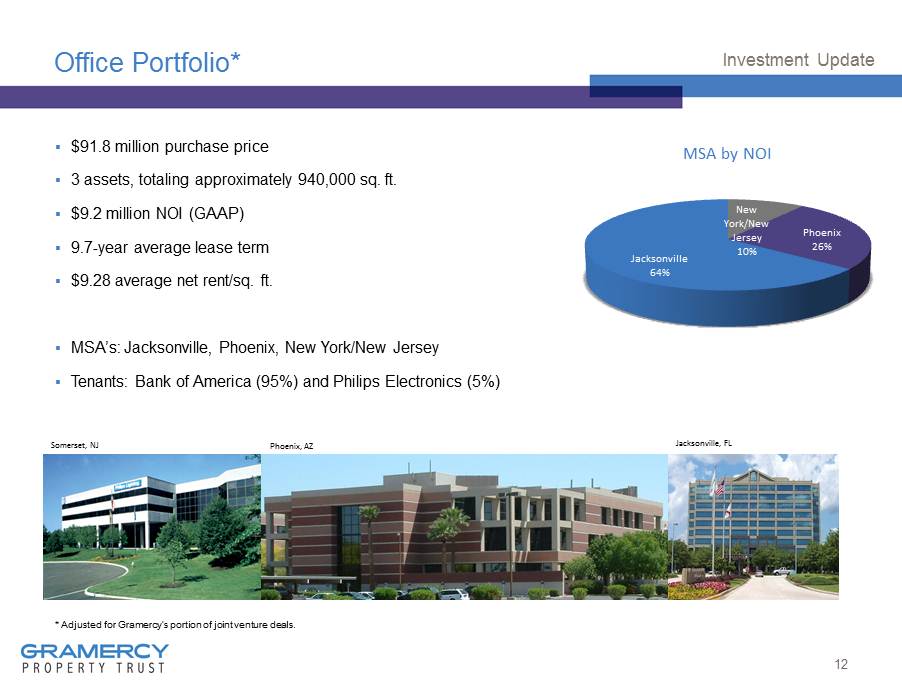
Office Portfolio* ▪ $91.8 million purchase price ▪ 3 assets, totaling approximately 940,000 sq. ft. ▪ $9.2 million NOI (GAAP) ▪ 9.7 - year average lease term ▪ $9.28 average net rent/sq. ft. ▪ MSA’s: Jacksonville, Phoenix , New York/New Jersey ▪ Tenants: Bank of America (95%) and Philips Electronics (5%) d 12 Investment Update * Adjusted for Gramercy’s portion of joint venture deals. New York/New Jersey 10% Phoenix 26 % Jacksonville 64% MSA by NOI Somerset, NJ Jacksonville, FL Phoenix, AZ
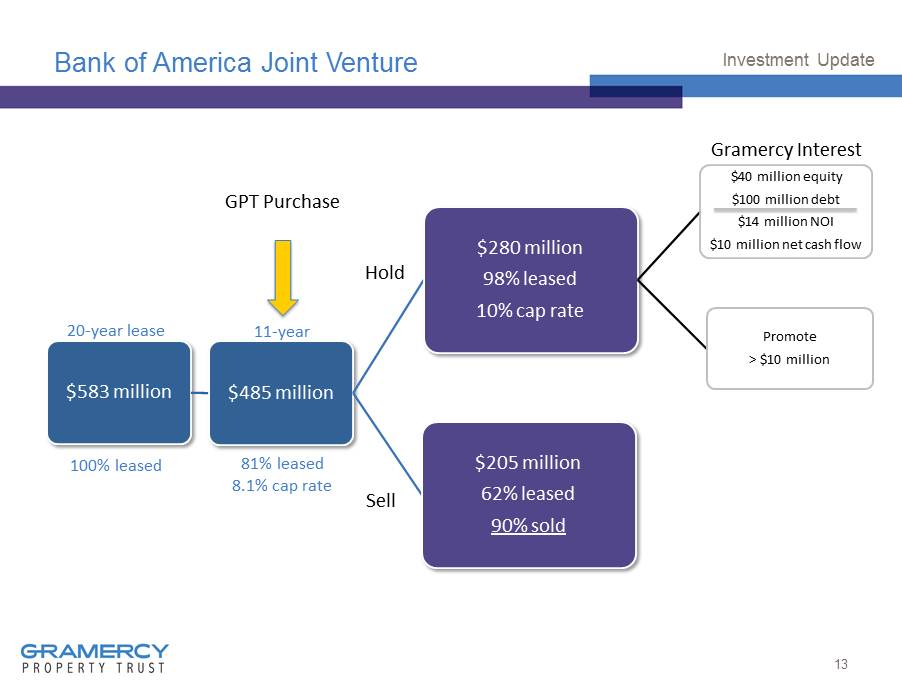
Bank of America Joint Venture $583 million $485 million $280 million 98% leased 10% cap rate Promote > $10 million $40 million equity $100 million debt $14 million NOI $10 million net cash flow $205 million 62% leased 90% sold 13 Investment Update 20 - year lease 100% leased 11 - year 81% leased 8.1% cap rate GPT Purchase Hold Sell Gramercy Interest
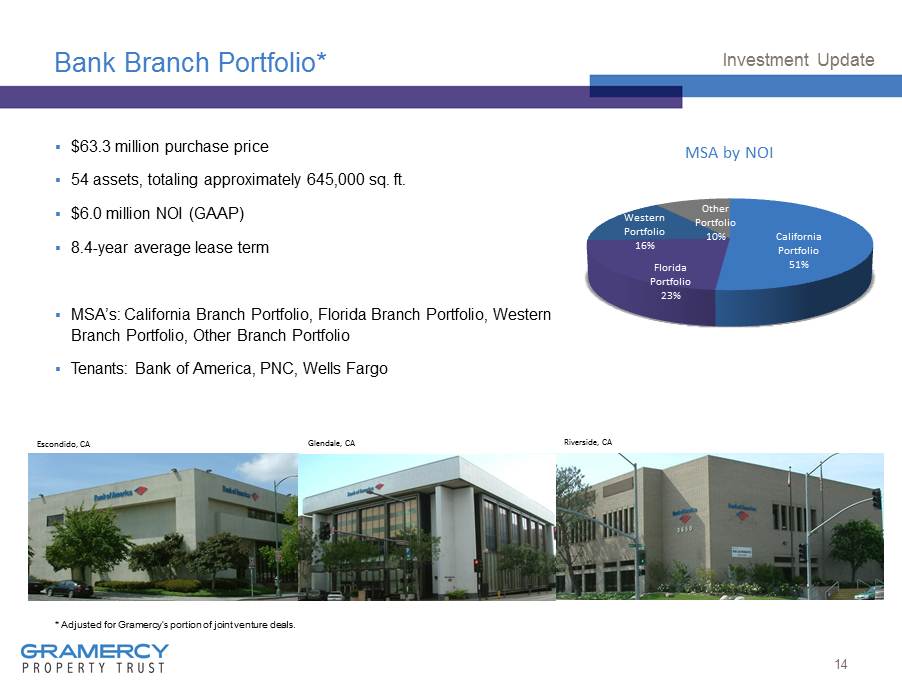
Bank Branch Portfolio* ▪ $63.3 million purchase price ▪ 54 assets, totaling approximately 645,000 sq. ft. ▪ $6.0 million NOI (GAAP) ▪ 8.4 - year average lease term ▪ MSA’s: California Branch Portfolio, Florida Branch Portfolio, Western Branch Portfolio, Other Branch Portfolio ▪ Tenants: Bank of America, PNC, Wells Fargo d 14 Investment Update * Adjusted for Gramercy’s portion of joint venture deals. California Portfolio 51% Florida Portfolio 23% Western Portfolio 16% Other Portfolio 10% MSA by NOI Glendale, CA Escondido, CA Riverside, CA

Warehouse Portfolio Bulk Warehouse/Assembly ▪ $66.7 million purchase price ▪ 5 assets, totaling approximately 1,550,000 sq. ft. ▪ $5.2 million NOI (GAAP) ▪ 11.6 - year average lease term ▪ MSA’s: Dallas/Ft. Worth , Indianapolis, Memphis, Philadelphia ▪ Tenants: Nestlé Waters, Five Below, Apex Tools, Stanley Tools, FedEx Cooler/Freezer* ▪ $36.7 million purchase price ▪ 2 assets, totaling approximately 190,000 sq. ft. ▪ $3.2 million NOI (GAAP) ▪ 21.8 - year average lease term ▪ MSA’s: Miami, Philadelphia ▪ Tenants: Preferred Freezer, UNFI 15 Investment Update Miami 73% Philadelphia 27% MSA by NOI Indianapolis 43% Memphis 35% Dallas/Ft. Worth 16% Philadelphia 6% MSA by NOI * Build - to - Suit commitment to construct a 120,000 square foot cold storage facility for a total cost of $25.0 million, which will be 100% leased for an initial term of 25 years when completed in second quarter of 2014 .

Warehouse Portfolio 16 Investment Update Logan Township, NJ Olive Branch, MS Indianapolis Industrial, IN Indianapolis Industrial, IN Garland, TX Hialeah, FL
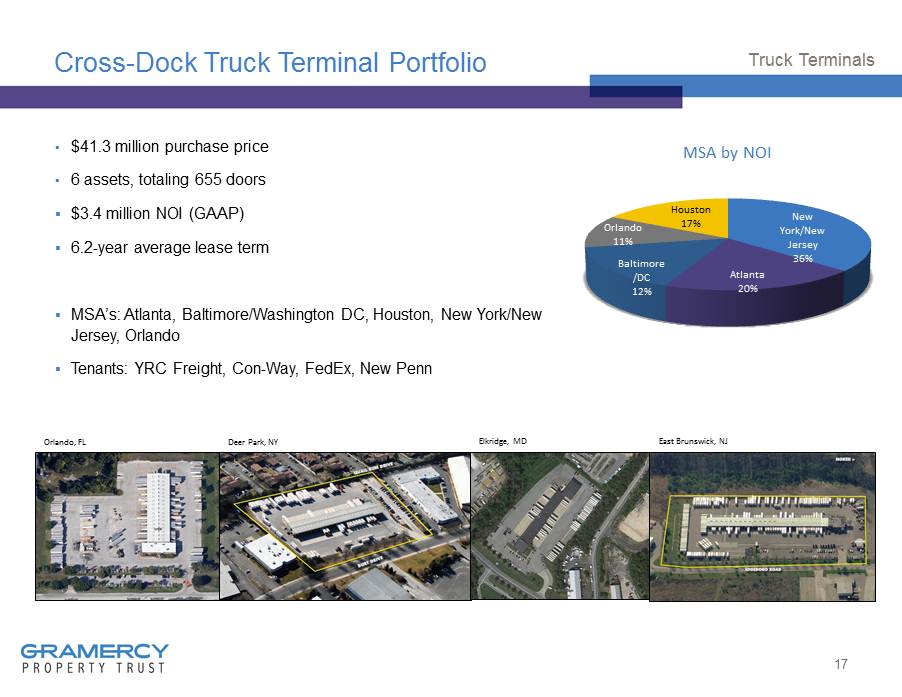
Cross - Dock Truck Terminal Portfolio ▪ $41.3 million purchase price ▪ 6 assets, totaling 655 doors ▪ $3.4 million NOI (GAAP) ▪ 6.2 - year average lease term ▪ MSA’s: Atlanta, Baltimore/Washington DC, Houston, New York/New Jersey, Orlando ▪ Tenants: YRC Freight, Con - Way, FedEx, New Penn 17 Truck Terminals New York/New Jersey 36% Atlanta 20% Baltimore / DC 12% Orlando 11% Houston 17% MSA by NOI Orlando, FL Deer Park, NY Elkridge, MD East Brunswick, NJ
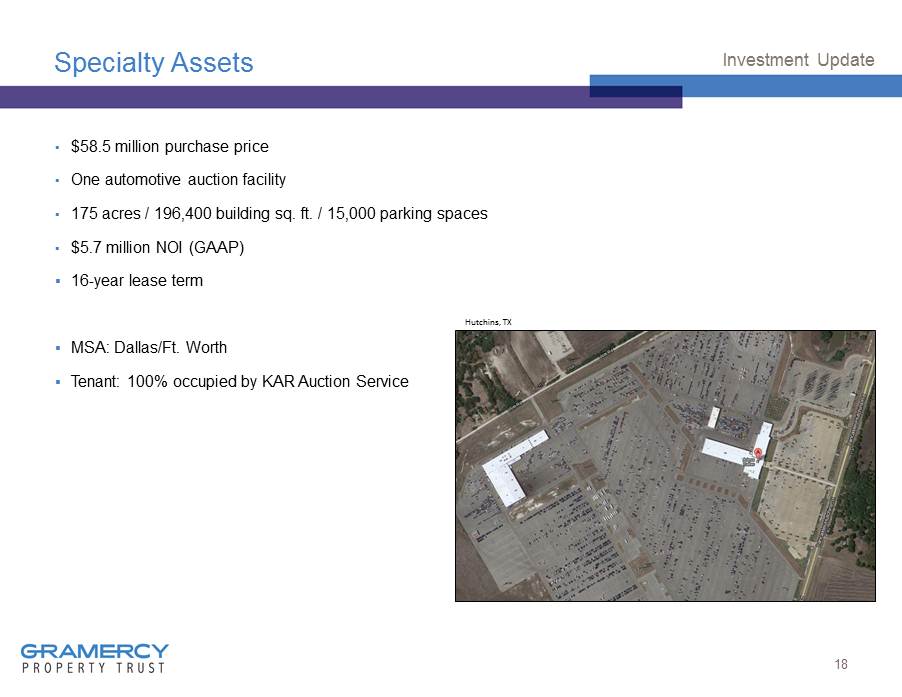
Specialty Assets ▪ $58.5 million purchase price ▪ One automotive auction facility ▪ 175 acres / 196,400 building sq. ft. / 15,000 parking spaces ▪ $5.7 million NOI (GAAP) ▪ 16 - year lease term ▪ MSA: Dallas/Ft. Worth ▪ Tenant: 100% occupied by KAR Auction Service 18 Investment Update Hutchins, TX

19 Asset Management Update
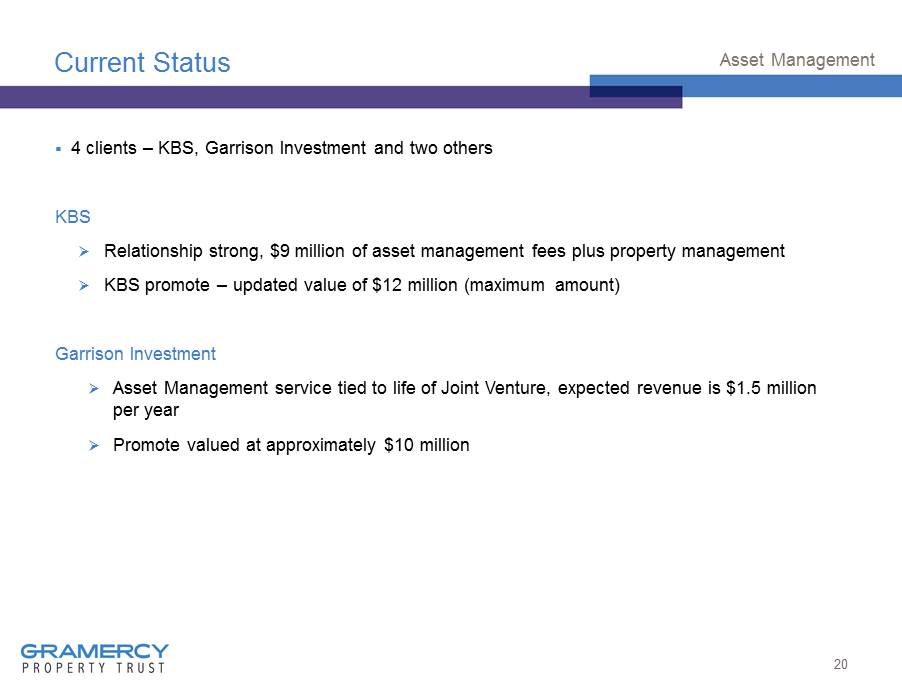
Current Status ▪ 4 clients – KBS, Garrison Investment and two others KBS » Relationship strong, $9 million of asset management fees plus property management » KBS promote – updated value of $12 million (maximum amount) Garrison Investment » Asset Management service tied to life of Joint Venture, expected revenue is $1.5 million per year » Promote valued at approximately $10 million 20 Asset Management

Results 21 Asset Management (Amount in Thousands) 1Q 13 2Q 13 Revenue Asset Management Revenue 3,298$ 3,285$ Property Management Revenue 5,018 5,184 TOTAL REVENUES 8,315$ 8,469$ Expenses TOTAL EXPENSES 6,850$ 6,022$ Net Contribution (Pre-Tax) 1,465$ 2,447$
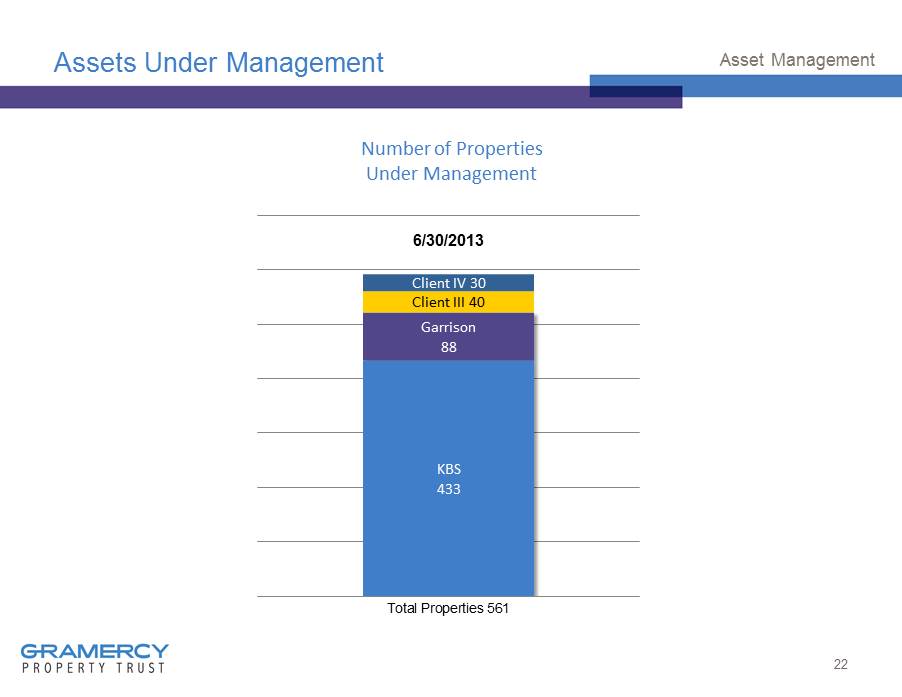
Assets Under Management 22 Asset Management KBS 433 Garrison 88 Client III 40 Client IV 30 Total Properties 561 Number of Properties Under Management 6/30/2013
23 Management, General & Administrative (MG&A)
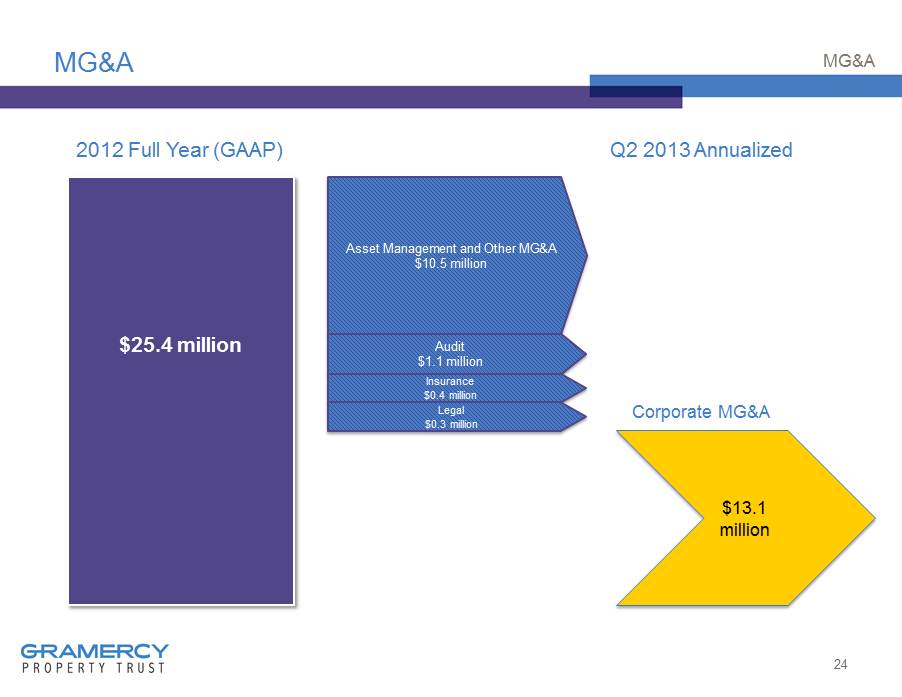
MG&A 24 MG&A $25.4 million 2012 Full Year (GAAP) Q2 2013 Annualized $13.1 million Asset Management and Other MG&A $10.5 million Audit $1.1 million Insurance $0.4 million Legal $0.3 million Corporate MG&A
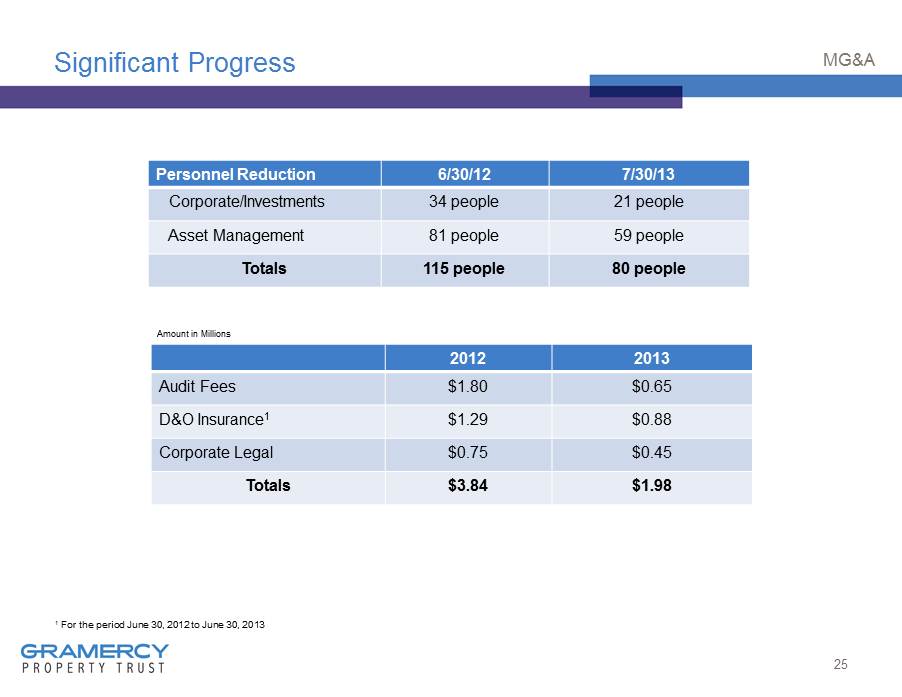
Significant Progress 25 MG&A Personnel Reduction 6/30/12 7/30/13 Corporate/Investments 34 people 21 people Asset Management 81 people 59 people Totals 115 people 80 people 2012 2013 Audit Fees $1.80 $0.65 D&O Insurance 1 $1.29 $0.88 Corporate Legal $0.75 $0.45 Totals $3.84 $1.98 Amount in Millions 1 For the period June 30, 2012 to June 30, 2013
26 Financial Analysis

Business Dashboard/Contribution Analysis 27 Financial Analysis (Amounts in thousands) Q1 2013 Q2 2013 Revenue Net Lease/Corporate NOI 4,609$ 5,735$ Asset Management 8,315 8,469 1 Total Revenue 12,924$ 14,204$ Expenses Net Lease/Corporate (MG&A and Interest) 4,962$ 4,652$ Asset Management 6,683 6,021 Total Expenses 11,645$ 10,673$ Contribution Net Lease (353)$ 1,083$ Asset Management 1,632 2,448 Total Contribution 1,279$ 3,531$ Property Acquisition Expenses 551$ 698$ Depreciation/Amortization 2,429 3,011 Preferred Dividends 1,790 1,790 Taxes 405 675 2 Net Contribution before Depreciation/Amortization/Acquisition Expenses (916)$ 1,066$ Net Contribution after Depreciation/Amortization/Acquisition Expenses (3,896)$ (2,643)$ 1Excludes one-time KBS promote true-up 2Excludes expense related to the KBS promote and a 2012 year-end true-up
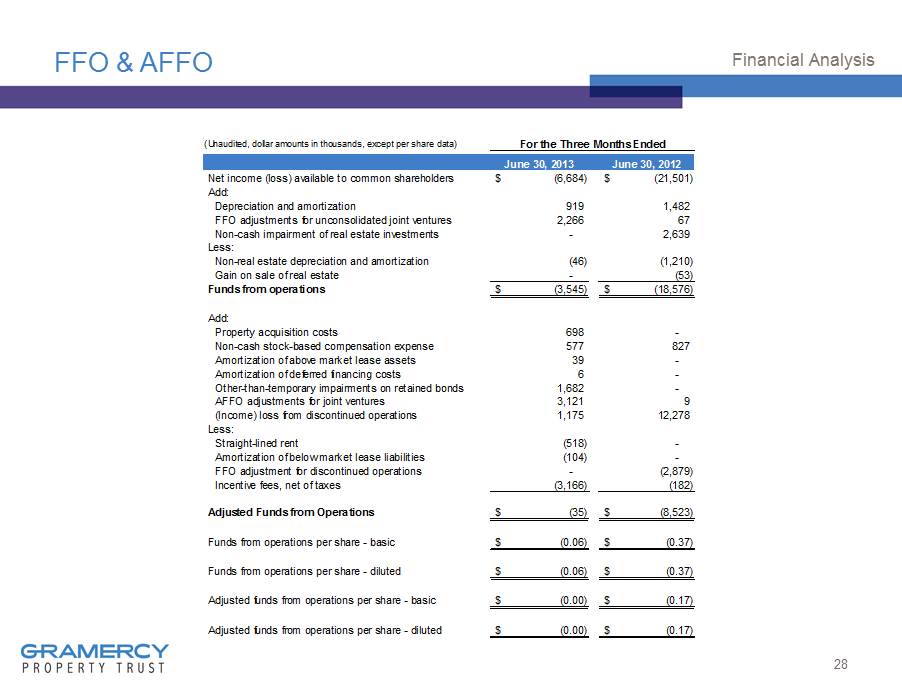
FFO & AFFO 28 Financial Analysis (Unaudited, dollar amounts in thousands, except per share data) For the Three Months Ended June 30, 2013 June 30, 2012 Net income (loss) available to common shareholders (6,684)$ (21,501)$ Add: Depreciation and amortization 919 1,482 FFO adjustments for unconsolidated joint ventures 2,266 67 Non-cash impairment of real estate investments - 2,639 Less: Non-real estate depreciation and amortization (46) (1,210) Gain on sale of real estate - (53) Funds from operations (3,545)$ (18,576)$ Add: Property acquisition costs 698 - Non-cash stock-based compensation expense 577 827 Amortization of above market lease assets 39 - Amortization of deferred financing costs 6 - Other-than-temporary impairments on retained bonds 1,682 - AFFO adjustments for joint ventures 3,121 9 (Income) loss from discontinued operations 1,175 12,278 Less: Straight-lined rent (518) - Amortization of below market lease liabilities (104) - FFO adjustment for discontinued operations - (2,879) Incentive fees, net of taxes (3,166) (182) Adjusted Funds from Operations (35)$ (8,523)$ Funds from operations per share - basic (0.06)$ (0.37)$ Funds from operations per share - diluted (0.06)$ (0.37)$ Adjusted funds from operations per share - basic (0.00)$ (0.17)$ Adjusted funds from operations per share - diluted (0.00)$ (0.17)$
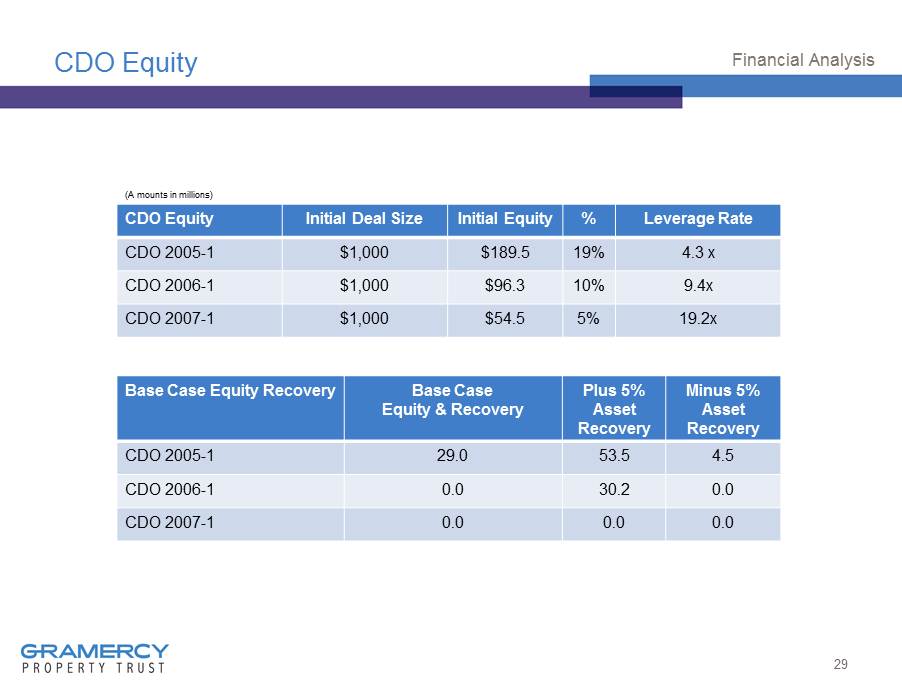
CDO Equity CDO Equity Initial Deal Size Initial Equity % Leverage Rate CDO 2005 - 1 $1,000 $189.5 19% 4.3 x CDO 2006 - 1 $1,000 $96.3 10% 9.4x CDO 2007 - 1 $1,000 $54.5 5% 19.2x 29 Financial Analysis Base Case Equity Recovery Base Case Equity & Recovery Plus 5% Asset Recovery Minus 5% Asset Recovery CDO 2005 - 1 29.0 53.5 4.5 CDO 2006 - 1 0.0 30.2 0.0 CDO 2007 - 1 0.0 0.0 0.0 (A mounts in millions)
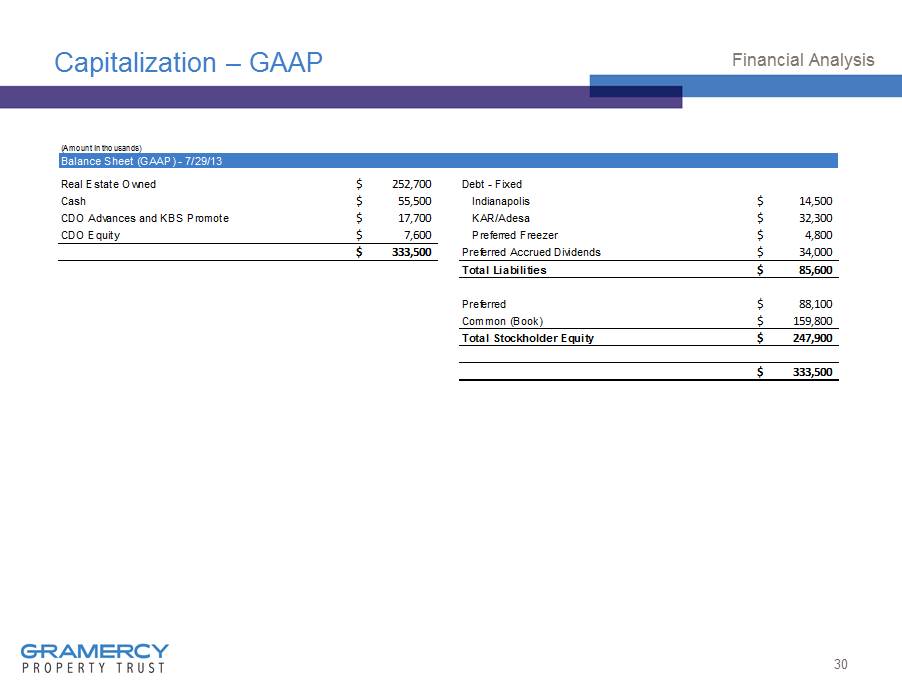
Capitalization – GAAP 30 Financial Analysis (Amount in thousands) Balance Sheet (GAAP) - 7/29/13 Real Estate Owned 252,700$ Debt - Fixed Cash 55,500$ Indianapolis 14,500$ CDO Advances and KBS Promote 17,700$ KAR/Adesa 32,300$ CDO Equity 7,600$ Preferred Freezer 4,800$ 333,500$ Preferred Accrued Dividends 34,000$ Total Liabilities 85,600$ Preferred 88,100$ Common (Book) 159,800$ Total Stockholder Equity 247,900$ 333,500$

Capitalization – Market Value & Combined 31 Financial Analysis Value of KBS Contract Value of Garrison Contract/Promote Value of Other AM Contracts (Amount in thousands) Balance Sheet (Combined at Market, as of 7/29/13) Real Estate Owned @ 7% 467,000$ Debt - Fixed Cash 55,500$ Philips 10,250$ CDO Advances and Assets Held-For-Sale 20,500$ Indianapolis 14,500$ KBS Promote 12,000$ KAR/Adesa 26,300$ CDO Equity (Book) 7,600$ Debt - Floating Other Assets [ ] Bank of America JV 100,000$ Intangibles (5,450)$ Preferred Accrued Dividends 34,000$ 557,150$ Total Liabilities 185,050$ Preferred 88,100$ Common (at Market) 284,000$ Total Stockholder Equity 372,100$ 557,150$
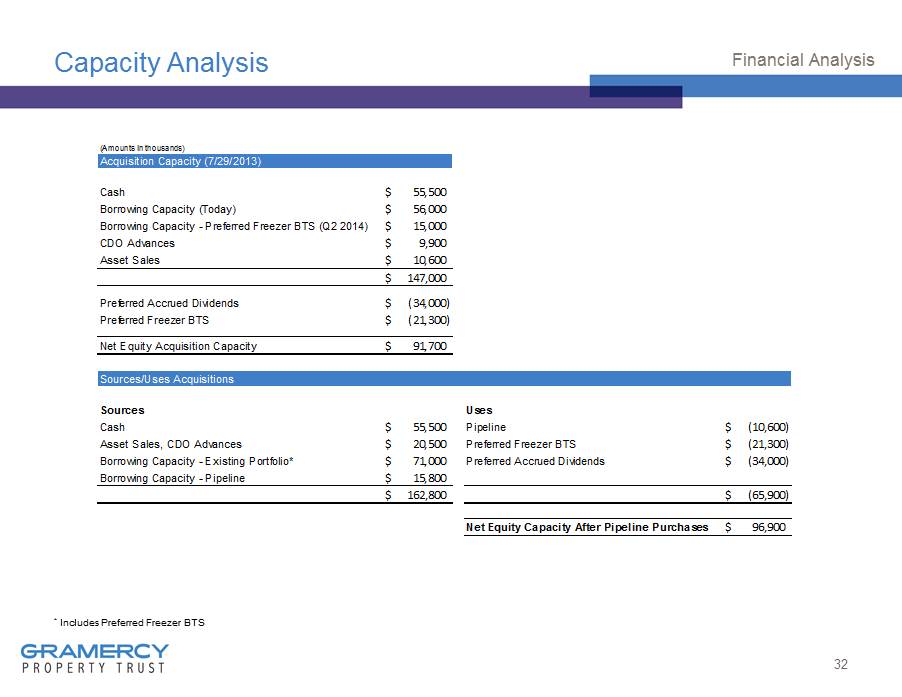
Capacity Analysis 32 Financial Analysis * Includes Preferred Freezer BTS (Amounts in thousands) Acquisition Capacity (7/29/2013) Cash 55,500$ Borrowing Capacity (Today) 56,000$ Borrowing Capacity - Preferred Freezer BTS (Q2 2014) 15,000$ CDO Advances 9,900$ Asset Sales 10,600$ 147,000$ Preferred Accrued Dividends (34,000)$ Preferred Freezer BTS (21,300)$ Net Equity Acquisition Capacity 91,700$ Sources/Uses Acquisitions Sources Uses Cash 55,500$ Pipeline (10,600)$ Asset Sales, CDO Advances 20,500$ Preferred Freezer BTS (21,300)$ Borrowing Capacity - Existing Portfolio* 71,000$ Preferred Accrued Dividends (34,000)$ Borrowing Capacity - Pipeline 15,800$ 162,800$ (65,900)$ Net Equity Capacity After Pipeline Purchases 96,900$

33 Capital Markets

Net Lease Environment ▪ Net Lease REIT’s continue to trade at very favorable valuations even after recent rate moves 34 Capital Markets (As of July 29, 2013) Company Ticker Stock Price Total Market Cap (1) Dividend Yield Price/FFO (2) Price/Proj. FFO (3) Est. Price/NAV Realty Income O $44.49 $13.4Bn 4.90% 20.5x 18.5x 1.3x W.P. Carey WPC $69.87 $6.8Bn 4.81% 29.4x 23.0x 1.4x National Retail Properties NNN $35.93 $5.9Bn 4.51% 19.3x 19.0x 1.2x Lexington Realty Trust LXP $12.76 $4.6Bn 4.70% 13.9x 12.6x 1.2x EPR Properties EPR $51.10 $3.9Bn 6.18% 13.8x 13.1x 1.1x Spirit Realty Capital SRC $9.54 $3.5Bn 6.71% 16.7x 13.3x 0.9x American Realty Capital Properties ARCP $14.88 $2.9Bn 6.12% 15.7x 16.7x 1.2x Getty Realty Corp. GTY $21.13 $0.9Bn 3.79% 22.7x 21.3x 1.3x Total/Wtd. Avg. - - $41.9Bn 5.14% 19.8x 17.7x 1.2x Sources: Bloomberg, Ladenburg Thalmann research report (March 27, 2013), JMP Securities research report (June 20, 2013) (1) Total Market Cap equal to current equity market cap, plus any debt and preferred equity as of 1Q 2013 (except for O and EPR, which have reported 2Q 2013 numbers) (2) Diluted FFO for the trailing twelve month period (3) Projected FFO for the full year 2013 (per Bloomberg)
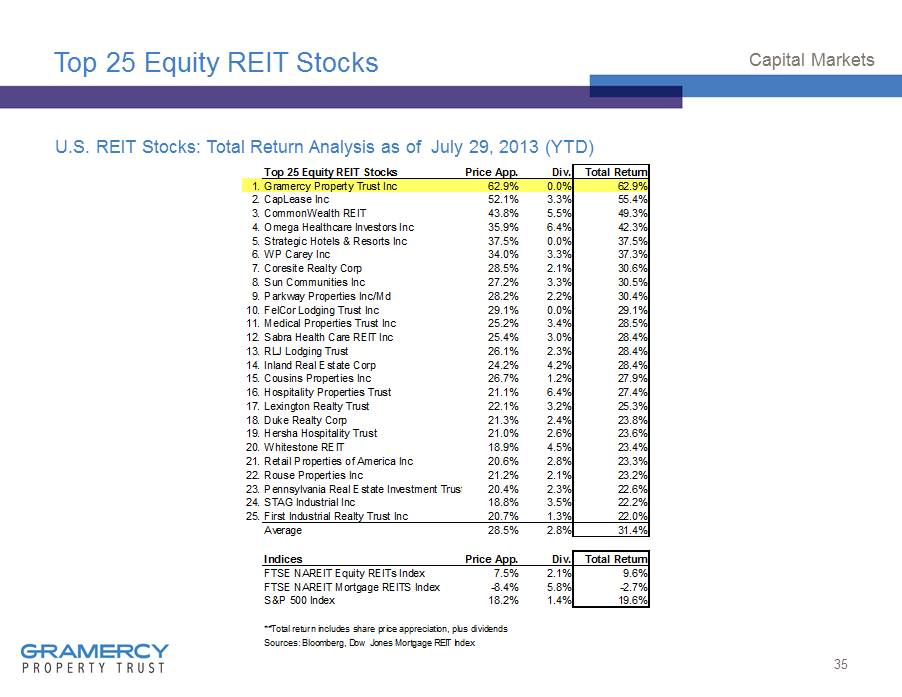
Top 25 Equity REIT Stocks Price App. Div. Total Return 1.Gramercy Property Trust Inc 62.9% 0.0% 62.9% 2.CapLease Inc 52.1% 3.3% 55.4% 3.CommonWealth REIT 43.8% 5.5% 49.3% 4.Omega Healthcare Investors Inc 35.9% 6.4% 42.3% 5.Strategic Hotels & Resorts Inc 37.5% 0.0% 37.5% 6.WP Carey Inc 34.0% 3.3% 37.3% 7.Coresite Realty Corp 28.5% 2.1% 30.6% 8.Sun Communities Inc 27.2% 3.3% 30.5% 9.Parkway Properties Inc/Md 28.2% 2.2% 30.4% 10.FelCor Lodging Trust Inc 29.1% 0.0% 29.1% 11.Medical Properties Trust Inc 25.2% 3.4% 28.5% 12.Sabra Health Care REIT Inc 25.4% 3.0% 28.4% 13.RLJ Lodging Trust 26.1% 2.3% 28.4% 14.Inland Real Estate Corp 24.2% 4.2% 28.4% 15.Cousins Properties Inc 26.7% 1.2% 27.9% 16.Hospitality Properties Trust 21.1% 6.4% 27.4% 17.Lexington Realty Trust 22.1% 3.2% 25.3% 18.Duke Realty Corp 21.3% 2.4% 23.8% 19.Hersha Hospitality Trust 21.0% 2.6% 23.6% 20.Whitestone REIT 18.9% 4.5% 23.4% 21.Retail Properties of America Inc 20.6% 2.8% 23.3% 22.Rouse Properties Inc 21.2% 2.1% 23.2% 23.Pennsylvania Real Estate Investment Trust 20.4% 2.3% 22.6% 24.STAG Industrial Inc 18.8% 3.5% 22.2% 25.First Industrial Realty Trust Inc 20.7% 1.3% 22.0% Average 28.5% 2.8% 31.4% Indices Price App. Div. Total Return FTSE NAREIT Equity REITs Index 7.5% 2.1% 9.6% FTSE NAREIT Mortgage REITS Index -8.4% 5.8% -2.7% S&P 500 Index 18.2% 1.4% 19.6% **Total return includes share price appreciation, plus dividends Sources: Bloomberg, Dow Jones Mortgage REIT Index Top 25 Equity REIT Stocks U.S . REIT Stocks: Total Return Analysis as of July 29, 2013 (YTD) 35 Capital Markets

Business Plan – 2013 - 2015 ▪ Sell CDOs ▪ Invest cash to create recurring cash flow ▪ Maximize Gramercy Asset Management profit center ▪ Significantly reduce MG&A ▪ Streamline business, simplify story ▪ Grow equity base ▪ Create durable, growing dividends 36 x x x x x x x x x x x