Attached files
| file | filename |
|---|---|
| 8-K - CURRENT REPORT - STEWART INFORMATION SERVICES CORP | v346650_8k.htm |

Summer 2013 Investor Presentation Stewart Information Services Corporation

2 Forward - looking Statements Certain statements in this presentation are "forward - looking statements" within the meaning of the Private Securities Litigation Reform Act of 1995 . Such forward - looking statements relate to future, not past, events and often address our expected future business and financial performance . These statements often contain words such as "expect," "anticipate," "intend," "plan," "believe," "seek," "will" or other similar words . Forward - looking statements by their nature are subject to various risks and uncertainties that could cause our actual results to be materially different than those expressed in the forward - looking statements . These risks and uncertainties include, among other things, the severity and duration of current financial and economic conditions ; continued weakness or further adverse changes in the level of real estate activity ; changes in mortgage interest rates, existing and new home sales, refinancing of current loans, and availability of mortgage financing that affect the demand for our title insurance products ; our ability to respond to and implement technology changes, including the completion of the implementation of our enterprise systems ; the impact of unanticipated title losses on the need to further strengthen our policy loss reserves ; any effect of title losses on our cash flows and financial condition ; the impact of our increased diligence and inspections in our agency operations ; changes to the participants in the secondary mortgage market ; the effect of class actions and other litigation matters ; regulatory non - compliance, fraud or defalcations by our title insurance agents or employees ; our ability to timely and cost - effectively respond to significant industry changes and introduce new products and services ; the impact of changes in governmental and insurance regulations, including any future reductions in the pricing of title insurance products and services ; our dependence on our operating subsidiaries as a source of cash flow ; customers finding other sources of suppliers ; the continued realization of expected expense savings resulting from our expense reduction steps ; our ability to access the equity and debt financing markets when and if needed ; our ability to grow our international operations ; and our ability to respond to the actions of our competitors . These risks and uncertainties, as well as others, are discussed in more detail in our documents filed with the Securities and Exchange Commission, including our Annual Report on Form 10 - K for the year ended December 31 , 2011 , and our Current Reports on Form 8 - K . We expressly disclaim any obligation to update any forward - looking statements contained in this presentation to reflect events or circumstances that may arise after the date hereof, except as may be required by applicable law . Non - GAAP Disclosures This presentation may contain certain financial measures that are not presented in accordance with generally accepted accounting principles (GAAP), including but not limited to, losses and litigation expenses arising from non - predictable title losses and adjusted pretax title margin, which is adjusted to exclude net realized investment gains or losses and reserve adjustments . Although these exclusions represent actual gains, losses or expenses to the Company, they may mask the periodic income and financial and operating trends associated with the Company’s business . The Company is presenting these non - GAAP financial measures because they provide the Company’s management and investors with additional insight into the operational performance of the Company relative to earlier periods and relative to the Company’s competitors . The Company does not intend for these non - GAAP financial measures to be a substitute for any GAAP financial information . In this presentation these non - GAAP financial measures have been presented with, and reconciled to, the most directly comparable GAAP financial measures . Investors should use these non - GAAP financial measures only in conjunction with the comparable GAAP financial measures .

3 Investment Highlights • Established market share in $11 billion domestic industry • Well positioned to capitalize on the ongoing real estate recovery • Conservative management style with new organizational structure and refined corporate strategy to grow revenue, reduce fixed costs and enhance margins • Continued diversification into complementary real estate services with counter and non - cyclical components • Cash claims payments and newly incurred claims trending downward as size and number of new claims continue to decline • Increasing premium rates, improving remittance percentages and diversified revenue sources help bolster revenues going forward

4 First Quarter 2013 Financial Highlights • Net earnings attributable to Stewart increased $15.4 million to $3.2 million ($0.15 per share) from a prior year net loss of $12.2 million ($0.63 loss per share) • Results include a net $3.7 million ($0.18 per share) charge reported in investment and other (losses) gains • Excluding the net $3.7 million charge, pretax earnings improved $18.8 million to $10.8 million • For the quarter, revenues increased $38.7 million over the prior year period, yielding a $15.1 million increase in pretax earnings (incremental margin of 39 percent)

5 Income Statement (non - GAAP presentation) 2012 2013 % Change Revenues Direct 150,333 158,544 5.5% Agency 196,321 227,662 16.0% Mortgage Services 33,760 37,172 10.1% Total Operating Revenues 380,414 423,377 11.3% Investment Income/Other Gains 4,572 336 -92.7% Total Revenues 384,986 423,713 10.1% Agency Retention (162,548) (187,065) 15.1% Net Revenues 222,438 236,648 6.4% Expenses Employee Costs 128,233 136,830 6.7% Other Operating Expenses 64,863 63,796 -1.6% Title Losses 31,387 23,563 -24.9% Depreciation 4,524 4,358 -3.7% Interest Expense 1,364 954 30.0% Total Expenses 230,371 229,501 -0.4% Earnings Earnings Before Taxes and Noncontrolling Interests (7,933) 7,147 Income Tax (2,823) (2,389) Noncontrolling Interests (1,402) (1,551) Net Income (Loss) (12,158) 3,207 Net Margin -3.2% 0.8% Per Share Net Income (Loss) Per Share - Diluted (0.63) 0.15 Net Income (Loss) Per Share - Basic (0.63) 0.15 Three Months Ended March 31

6 Balance Sheet December March 2012 2013 % Change Assets Cash & Cash Equivalents 196,688 169,688 -13.7% Cash & Cash Equivalents - Statutory Reserve Funds 12,067 5,688 -52.9% Investments - Statutory Reserve Funds 444,579 450,155 1.3% Investments - Short Term 37,025 36,146 -2.4% Investments - Other 58,680 71,895 22.5% Other Assets 421,940 415,181 -1.6% Goodwill & Intangibles 227,970 227,631 -0.1% Total Assets 1,291,177 1,262,655 -2.2% Liabilities & Equity Notes Payable 6,481 6,426 -0.8% Convertible Senior Notes 64,687 27,767 -57.1% Loss Reserves 520,375 508,756 -2.2% Other Liabilities 119,262 98,592 -17.3% Total Liabilities 710,805 641,541 -9.7% Equity Total Shareholders' Equity 580,372 621,114 7.0% Other Return on Equity, TTM* 18.8% 20.1% Debt-to-Equity 12.3% 5.5% Book Value/Share 29.91 27.70 Tangible Book Value/Share 18.16 17.55 * ROE for periods above include effect of $36.5 million non-recurring tax benefit in 4Q 2012. Normalized ROE objective is 12%-15% annualized. Debt levels will be managed so as not to exceed rating agency guidelines of maximum debt-to-tangible capital of 30%.
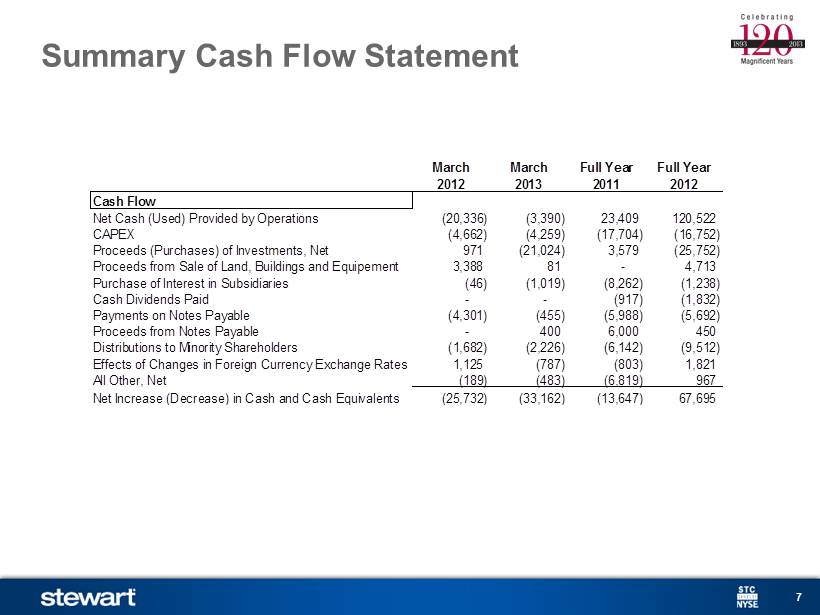
7 Summary Cash Flow Statement March March Full Year Full Year 2012 2013 2011 2012 Cash Flow Net Cash (Used) Provided by Operations (20,336) (3,390) 23,409 120,522 CAPEX (4,662) (4,259) (17,704) (16,752) Proceeds (Purchases) of Investments, Net 971 (21,024) 3,579 (25,752) Proceeds from Sale of Land, Buildings and Equipement 3,388 81 - 4,713 Purchase of Interest in Subsidiaries (46) (1,019) (8,262) (1,238) Cash Dividends Paid - - (917) (1,832) Payments on Notes Payable (4,301) (455) (5,988) (5,692) Proceeds from Notes Payable - 400 6,000 450 Distributions to Minority Shareholders (1,682) (2,226) (6,142) (9,512) Effects of Changes in Foreign Currency Exchange Rates 1,125 (787) (803) 1,821 All Other, Net (189) (483) (6,819) 967 Net Increase (Decrease) in Cash and Cash Equivalents (25,732) (33,162) (13,647) 67,695

8 Business Lines Title I nsurance and Related S ervices Title insurance to the residential and commercial sectors through direct and independent agencies domestically and globally -- includes the functions of searching, examining, closing and insuring the condition of the title to real property Mortgage Services (MS) Mortgage origination, servicing and default support services • Origination includes post - closing management, loan review and due diligence audit • Servicing support includes call center services, loss mitigation support, short sale and deed - in - lieu services, servicing transfer support, loss mitigation and servicing file reviews • Default support services: foreclosure file reviews, foreclosure audits, REO asset management, REO rental management Target Our goal is to achieve 25 percent of revenue – net of agent retention – from non - title services over the next five years 2012 Operating Revenue $1,889.0 Million Direct Title $718.8 Agency Title $1,007.4 Mortgage Services $162.8

9 Trailing Twelve Months - $ Millions Stewart Operating Revenues $0 $500 $1,000 $1,500 $2,000 $2,500 '02 '03 '04 '05 '06 '07 '08 '09 '10 '11 '12 '13 Direct Title Agency Title Mortgage Services

10 Revenues and Pre - tax Earnings Trends ($1,500) ($1,000) ($500) $0 $500 $1,000 $1,500 $2,000 $2,500 2006 2007 2008 2009 2010 2011 2012 $(300) $(200) $(100) $- $100 $200 $300 $400 $500 Pre - tax income (Loss) Revenue $ Millions

11 Trailing Twelve Months - $ Millions Direct Title Revenues and Orders $500 $600 $700 $800 $900 $1,000 $1,100 '02 '03 '04 '05 '06 '07 '08 '09 '10 '11 '12 '13 200,000 400,000 600,000 800,000 1,000,000 Direct Title Revenue Orders Opened Files Closed

12 Independent Agency Network • Managing agency network by emphasizing quality and profitability over market share growth to reduce risk, improve performance and ensure our platform supports the needs of a changing customer and regulatory environment – Since 4Q 2008, average annual remittance per independent agency increased more than 115 percent while the number of independent agencies has been reduced by approximately 42 percent – Policy loss ratio of current independent agency network for 1Q 2013 is less than 1/4 of its level in 4Q 2008 • Number of independent agents has stabilized; new agents must pass rigorous vetting process • Going forward, bias will be towards capturing a higher percentage of business from existing agencies, signing new agents in higher - remitting states and continuing to increase average remittance per agency
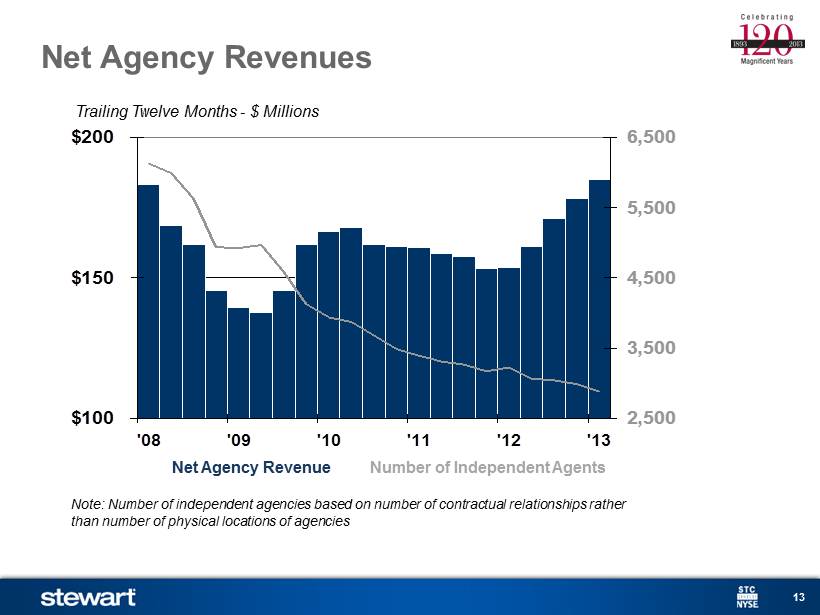
13 Trailing Twelve Months - $ Millions Net Agency Revenues $100 $150 $200 '08 '09 '10 '11 '12 '13 2,500 3,500 4,500 5,500 6,500 Net Agency Revenue Number of Independent Agents Note: Number of independent agencies based on number of contractual relationships rather than number of physical locations of agencies

14 Agency Retention Rates Differences in independent agency retention rates largely driven by geography. Source: Form 9 filings for respective underwriters for year ended December 31, 2012. STC retention rates were used in the calculations because competitor rates are not included in SEC or statutory filings. STC FNF FAF Overall 82.1% 78.2% 79.3% Difference from STC -3.9% -2.8% Excluding Florida and California (using STC Retention Rates) 81.9% 81.3% 80.6% Difference from STC -0.6% -1.2%

15 $0 $20 $40 $60 $80 $100 $120 $140 $160 $180 '02 '03 '04 '05 '06 '07 '08 '09 '10 '11 '12 '13 Trailing Twelve Months - $ Millions Focused Non - title Revenues and Profits Stewart Mortgage Services Revenues Note: Years prior to 2012 not restated for change in segment reporting effective with Q4 2012 reporting. Impact in any given year would not be material to revenues.
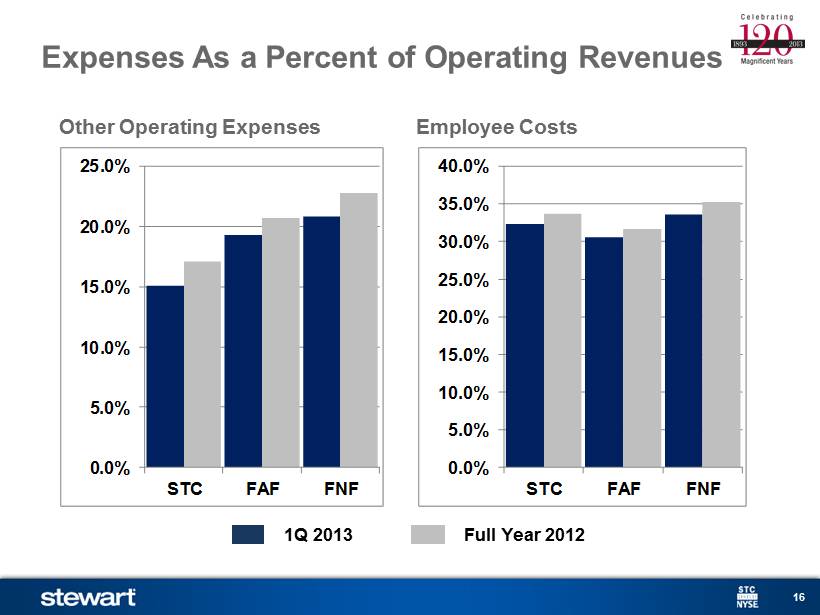
16 Other Operating Expenses 0.0% 5.0% 10.0% 15.0% 20.0% 25.0% STC FAF FNF Employee Costs Expenses As a Percent of Operating Revenues 1Q 2013 Full Year 2012 0.0% 5.0% 10.0% 15.0% 20.0% 25.0% 30.0% 35.0% 40.0% STC FAF FNF

17 Trailing 12 Months - $ Millions Claims Expense Vs. Cash Claims $25 $75 $125 $175 $225 '02 '03 '04 '05 '06 '07 '08 '09 '10 '11 '12 '13 Anticipate accruals of 6.0 to 7.0 percent by year - end 2013, including large claims Claims Expense Cash Claims Paid (Net of Recoveries)

18 Market Conditions Positives • Housing sales continuing recovery with estimated 8 percent increase in total new and existing sales in 2013 • Home prices increasing – a 5 percent rise in home prices increases revenue per transaction in the mid - 3 percent range • Interest r ates remain at historically low levels • HARP extension to 2015 • State pricing increases continue in 2013 Concerns • Uncertain regulatory economic environment: Dodd - Frank, CFPB, etc. • Tepid job growth rates and sluggish economic recovery • Potential loss of mortgage interest deduction for homes and tax treatment of commercial real estate • Cycling through distressed property inventories and related revenue declines • Shrinking refinance volumes and potential for reduced future transactions

19 0 1 2 3 4 5 6 7 8 '02 '03 '04 '05 '06 '07 '08 '09 '10 '11 '12 '13 '14 $8,000 Tax Credit Normal Market Bubble Fannie Mae® May 2013 Seasonally Adjusted Annualized Rate – Millions U.S. Existing Housing Sales National Association of REALTORS ®
20 2013 Strategic Priorities • Highest quality, value added services • Customer sa tisfaction • Sales gr owth • Operational ex cellence and compliance le adership • Claims re duction and risk avoidance

21 Strategic Commitments – 2012 Update Simplification and Alignment • Management team was reorganized along delivery and customer channels • Exited multiple minority owned positions through acquisitions and divestitures Smart Growth • Revenues generated from non - title, mortgage servicing support products increased 45 percent in 2012, helping to grow Mortgage S ervices segment revenues with no deterioration in pretax margins Profitable and Scalable Operations • Pretax earnings of $89.3 million were highest since 2006 ($84.5 million) even though revenues were 29.4 percent greater in 2006 • Pretax title segment margin jumped to 8.6 percent from 6.0 percent in 2011 • Agency operations premium per independent agent increased more than 23 percent from 2011 • Cash provided by operations was $120.5 million in 2012 compared to $23.4 million in 2011 Claims reduction and risk avoidance initiatives • Loss ratio on the current policy year declined from 6.3 percent in 2011 to 5.8 percent in 2012 • Loss ratio on current independent agency base was less than one - third of 2008’s rate • Cash claim payments in 2012 decreased 7.7 percent compared to 2011 Strategic pricing • Premium rates reviewed in 31 states with changes in 14 states (average increase of 1.8 percent) • Texas recently approved a 3.8 percent rate increase effective May 1, 2013 ( first rate increase in ~20 years)
22 CEO Matt Morris CFO Allen Berryman Ted C. Jones, PhD Chief Economist Director of Investor Relations ted@stewart.com 713.625.8014 direct 800.729.1900, extension 8014

Summer 2013 Investor Presentation Appendix Stewart Information Services Corporation

24 Effective Lending – $ Trillions Residential Lending Vs. Industry Premiums Statutory Title Premiums $ Billions $0.0 $0.5 $1.0 $1.5 $2.0 $2.5 $3.0 '90 '92 '94 '96 '98 '00 '02 '04 '06 '08 '10 '12 '14 $3 $5 $7 $9 $11 $13 $15 $17 Forecast Fannie Mae ® May 2013 2011 - 2014 Lending Likely Understates Title Revenues Due to Cash Sales Double Normal Effective Lending = Purchase Lending + 60 Percent of Refinance Lending Data Sources : Lending = Fannie Mae®, Title Premiums = CDS Research, Demotech and ALTA®
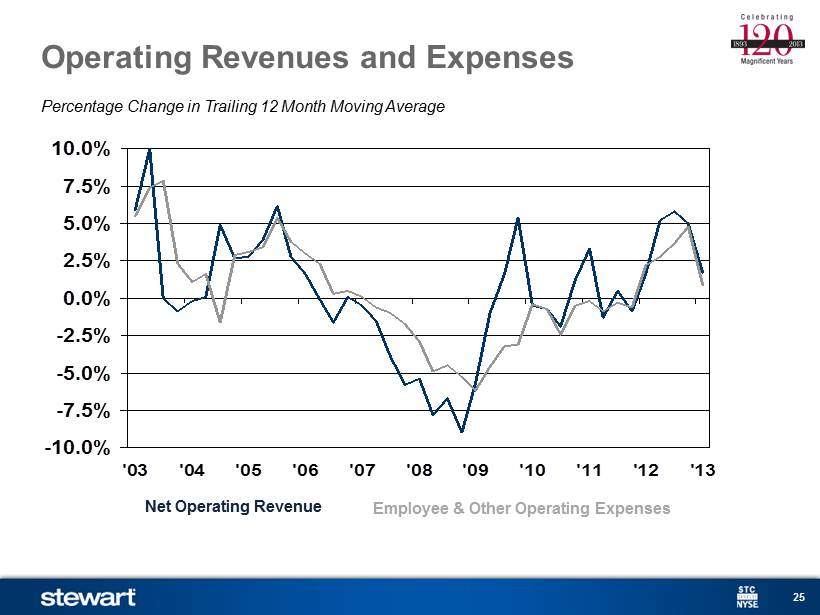
25 Percentage Change in Trailing 12 Month Moving Average Operating Revenues and Expenses -10.0% -7.5% -5.0% -2.5% 0.0% 2.5% 5.0% 7.5% 10.0% '03 '04 '05 '06 '07 '08 '09 '10 '11 '12 '13 Net Operating Revenue Employee & Other Operating Expenses
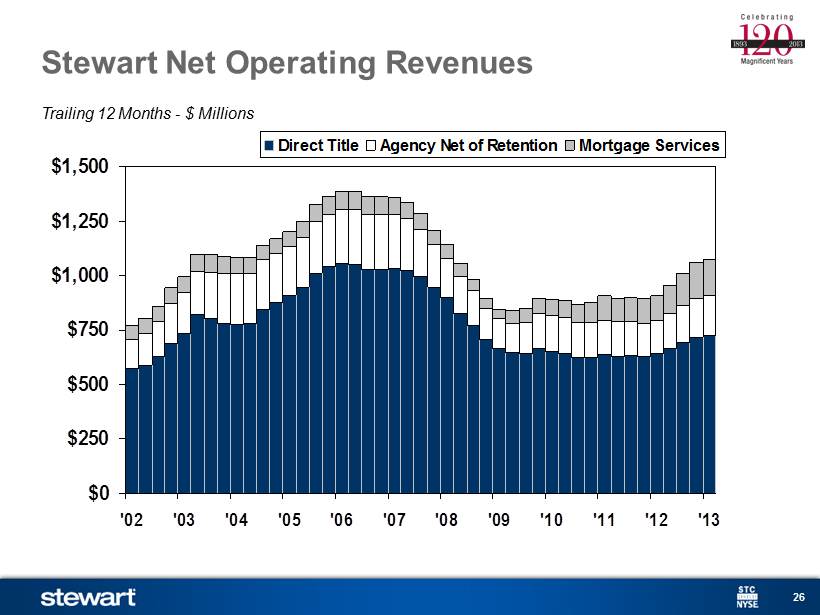
26 Trailing 12 Months - $ Millions Stewart Net Operating Revenues $0 $250 $500 $750 $1,000 $1,250 $1,500 '02 '03 '04 '05 '06 '07 '08 '09 '10 '11 '12 '13 Direct Title Agency Net of Retention Mortgage Services

27 Title Revenues by Regulatory Oversight Source: Form 9 filings (Schedule T) as compiled by ALTA

28 Trailing 12 Months Employee Expenses 20% 25% 30% 35% 40% '02 '03 '04 '05 '06 '07 '08 '09 '10 '11 '12 '13 As a Percentage of Operating Revenues

29 Other Operating Expenses 10% 13% 15% 18% 20% 23% 25% '02 '03 '04 '05 '06 '07 '08 '09 '10 '11 '12 '13 Trailing 12 Months As a Percentage of Operating Revenues

30 Actuarial Claims as a Percentage of Net Statutory Premiums Written – U.S. Operations Only Ultimate Loss Ratios by Policy Year 0.0% 2.0% 4.0% 6.0% 8.0% 10.0% 12.0% '01 '02 '03 '04 '05 '06 '07 '08 '09 '10 '11 '12 Source: ALTA, Family - Company Aggregates Stewart First American Fidelity Claims Paid

31 2012 Quarterly Segment Results Restated to Reflect New Segment Reporting (in $000s) Q1 2012 Q2 2012 Q3 2012 Q4 2012 YE 2012 Revenues Title 343,789 434,281 466,853 468,160 1,713,082 Mortgage Services 37,792 45,541 46,864 47,817 178,015 Corporate 3,406 3,889 7,024 4,995 19,314 Total 384,967 483,712 520,741 520,972 1,910,411 Earnings Title 15,299 41,623 47,810 42,896 147,628 Mortgage Services 7,966 13,239 12,861 14,567 48,633 Corporate (31,197) (23,645) (21,306) (30,775) (106,923) Total (7,932) 31,217 39,365 26,688 89,338 Pre-tax Margin Title 4.5% 9.6% 10.2% 9.2% 8.6% Mortgage Services 21.1% 29.1% 27.4% 30.5% 27.3%