Attached files
| file | filename |
|---|---|
| 8-K - FORM 8-K - STEWART INFORMATION SERVICES CORP | v340557_8k.htm |

Spring 2013 Investor Presentation Stewart Information Services Corporation

2 Forward - looking Statements Certain statements in this presentation are "forward - looking statements" within the meaning of the Private Securities Litigation Reform Act of 1995 . Such forward - looking statements relate to future, not past, events and often address our expected future business and financial performance . These statements often contain words such as "expect," "anticipate," "intend," "plan," "believe," "seek," "will" or other similar words . Forward - looking statements by their nature are subject to various risks and uncertainties that could cause our actual results to be materially different than those expressed in the forward - looking statements . These risks and uncertainties include, among other things, the severity and duration of current financial and economic conditions ; continued weakness or further adverse changes in the level of real estate activity ; changes in mortgage interest rates, existing and new home sales, refinancing of current loans, and availability of mortgage financing that affect the demand for our title insurance products ; our ability to respond to and implement technology changes, including the completion of the implementation of our enterprise systems ; the impact of unanticipated title losses on the need to further strengthen our policy loss reserves ; any effect of title losses on our cash flows and financial condition ; the impact of our increased diligence and inspections in our agency operations ; changes to the participants in the secondary mortgage market ; the effect of class actions and other litigation matters ; regulatory non - compliance, fraud or defalcations by our title insurance agents or employees ; our ability to timely and cost - effectively respond to significant industry changes and introduce new products and services ; the impact of changes in governmental and insurance regulations, including any future reductions in the pricing of title insurance products and services ; our dependence on our operating subsidiaries as a source of cash flow ; customers finding other sources of suppliers ; the continued realization of expected expense savings resulting from our expense reduction steps ; our ability to access the equity and debt financing markets when and if needed ; our ability to grow our international operations ; and our ability to respond to the actions of our competitors . These risks and uncertainties, as well as others, are discussed in more detail in our documents filed with the Securities and Exchange Commission, including our Annual Report on Form 10 - K for the year ended December 31 , 2011 , and our Current Reports on Form 8 - K . We expressly disclaim any obligation to update any forward - looking statements contained in this presentation to reflect events or circumstances that may arise after the date hereof, except as may be required by applicable law . Non - GAAP Disclosures This presentation may contain certain financial measures that are not presented in accordance with generally accepted accounting principles (GAAP), including but not limited to, losses and litigation expenses arising from non - predictable title losses and adjusted pretax title margin, which is adjusted to exclude net realized investment gains or losses and reserve adjustments . Although these exclusions represent actual gains, losses or expenses to the Company, they may mask the periodic income and financial and operating trends associated with the Company’s business . The Company is presenting these non - GAAP financial measures because they provide the Company’s management and investors with additional insight into the operational performance of the Company relative to earlier periods and relative to the Company’s competitors . The Company does not intend for these non - GAAP financial measures to be a substitute for any GAAP financial information . In this presentation these non - GAAP financial measures have been presented with, and reconciled to, the most directly comparable GAAP financial measures . Investors should use these non - GAAP financial measures only in conjunction with the comparable GAAP financial measures .
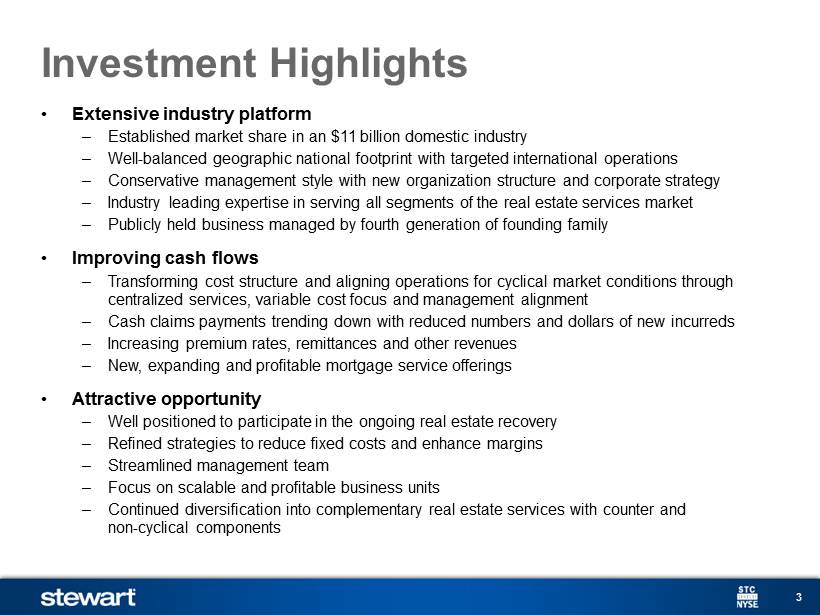
3 Investment Highlights • Extensive industry platform – Established market share in an $11 billion domestic industry – Well - balanced geographic national footprint with targeted international operations – Conservative management style with new organization structure and corporate strategy – Industry leading expertise in serving all segments of the real estate services market – Publicly held business managed by fourth generation of founding family • Improving cash flows – Transforming cost structure and aligning operations for cyclical market conditions through centralized services, variable cost focus and management alignment – Cash claims payments trending down with reduced numbers and dollars of new incurreds – Increasing premium rates, remittances and other revenues – New, expanding and profitable mortgage service offerings • Attractive o pportunity – Well positioned to participate in the ongoing real estate recovery – Refined strategies to reduce fixed costs and enhance margins – Streamlined management team – Focus on scalable and profitable business units – Continued diversification into complementary real estate services with counter and non - cyclical components

4 Income Statement Non-GAAP Presentation (in thousands) 2011 2012 % Change 2011 2012 % change Revenues Direct 166,560 192,446 15.5% 627,810 718,789 14.5% Agency Premiums 243,237 278,333 14.4% 877,225 1,007,380 14.8% Mortgage Services 27,389 44,777 63.5% 112,064 162,856 45.3% Total Operating Revenues 437,186 515,556 17.9% 1,617,099 1,889,025 16.8% Invest. Income and Other Gains 7,892 5,417 -31.4% 17,806 21,386 20.1% Total Revenues 445,079 520,973 17.1% 1,634,906 1,910,411 16.9% Agency Retention (199,840) (227,743) 14.0% (723,943) (829,070) 14.5% Net Revenues 245,239 293,230 19.6% 910,963 1,081,341 18.7% Expenses Employee costs 120,866 144,902 19.9% 469,839 542,461 15.5% Other operating 66,100 80,003 21.0% 256,193 286,496 11.8% Title losses 40,716 35,989 -11.6% 142,101 140,030 -1.5% Depreciation 5,200 4,359 -16.2% 19,543 17,783 -9.0% Interest Expense 1,340 1,288 -3.9% 5,268 5,235 -0.6% 234,222 266,541 13.8% 892,944 992,004 11.1% Income Before Taxes and Noncontrolling Interests 11,017 26,689 142.3% 18,019 89,337 395.8% Pretax Margin % (of total revenues) 2.5% 5.1% 1.1% 4.7% Income Tax Benefit (Expense) (6,771) 37,906 -659.8% (9,342) 29,639 -417.3% Noncontrolling Interests (2,086) (2,834) 35.8% (6,330) (9,795) 54.7% Net Income (loss) 2,160 61,761 2759.4% 2,347 109,182 4551.7% Net income % of total revenue 0.5% 11.9% 0.1% 5.7% Net Income (loss) Per Share - basic 0.11 3.20 2748.2% 0.12 5.66 4512.3% Net Income (loss) Per Share - diluted 0.11 2.56 2182.4% 0.12 4.61 3654.5% Three Months Ended December 31 Twelve Months Ended December 31
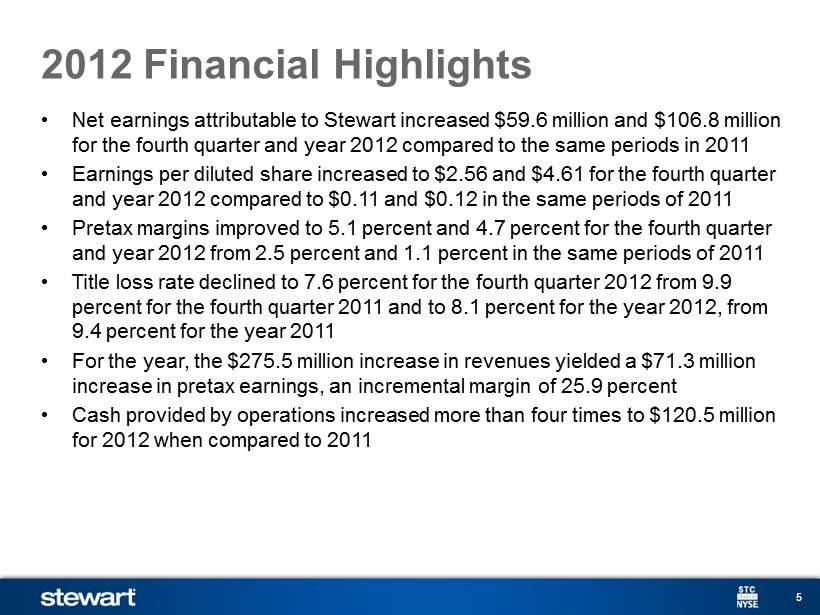
5 2012 Financial Highlights • Net earnings attributable to Stewart increased $59.6 million and $106.8 million for the fourth quarter and year 2012 compared to the same periods in 2011 • Earnings per diluted share increased to $2.56 and $4.61 for the fourth quarter and year 2012 compared to $0.11 and $0.12 in the same periods of 2011 • Pretax margins improved to 5.1 percent and 4.7 percent for the fourth quarter and year 2012 from 2.5 percent and 1.1 percent in the same periods of 2011 • Title loss rate declined to 7.6 percent for the fourth quarter 2012 from 9.9 percent for the fourth quarter 2011 and to 8.1 percent for the year 2012, from 9.4 percent for the year 2011 • For the year, the $275.5 million increase in revenues yielded a $71.3 million increase in pretax earnings, an incremental margin of 25.9 percent • Cash provided by operations increased more than four times to $120.5 million for 2012 when compared to 2011
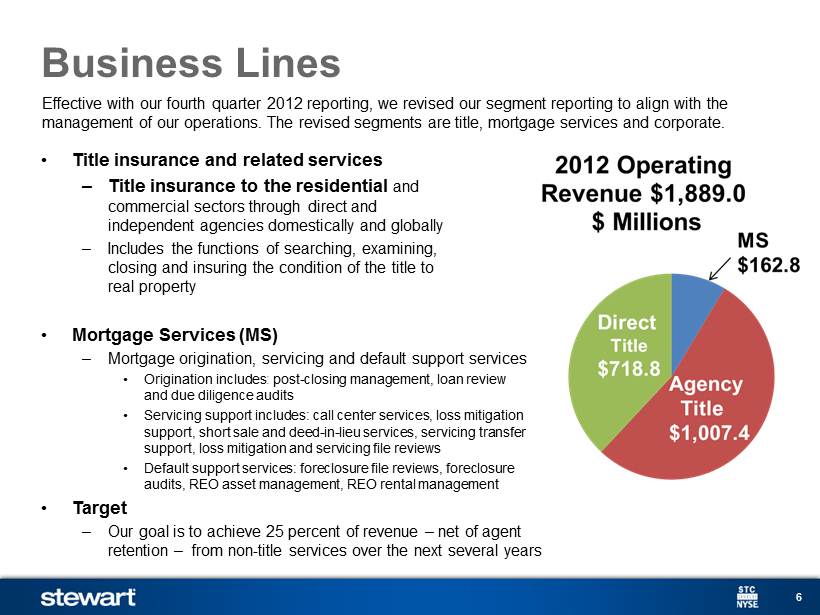
6 Business Lines • Title insurance and related services – Title insurance to the residential and commercial sectors through direct and independent agencies domestically and globally – Includes the functions of searching, examining, closing and insuring the condition of the title to real property • Mortgage S ervices (MS) – Mortgage origination, servicing and default support services • Origination includes : post - closing management, loan review and due diligence audits • Servicing support includes: call center services, loss mitigation support, short sale and deed - in - lieu services, servicing transfer support, loss mitigation and servicing file reviews • Default support services: foreclosure file reviews, foreclosure audits, REO asset management, REO rental management • Target – Our goal is to achieve 25 percent of revenue – net of agent retention – from non - title services over the next several years Effective with our fourth quarter 2012 reporting, we revised our segment reporting to align with the management of our operations. The revised segments are title, mortgage services and corporate.

7 Trailing 12 Months – $ Millions Stewart Operating Revenues $0 $500 $1,000 $1,500 $2,000 $2,500 '02 '03 '04 '05 '06 '07 '08 '09 '10 '11 '12 Direct Title Agency Title Mortgage Services
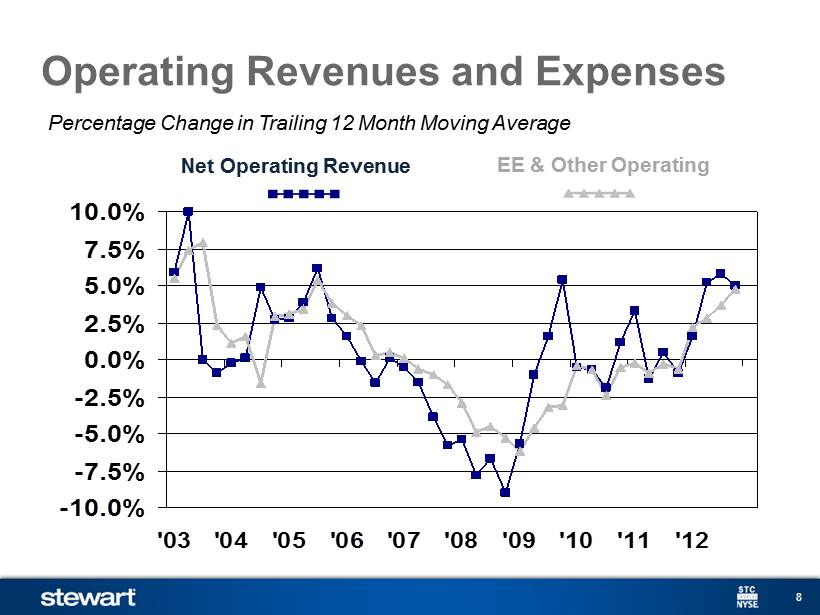
8 Percentage Change in Trailing 12 Month Moving Average Operating Revenues and Expenses -10.0% -7.5% -5.0% -2.5% 0.0% 2.5% 5.0% 7.5% 10.0% '03 '04 '05 '06 '07 '08 '09 '10 '11 '12 Net Operating Revenue EE & Other Operating
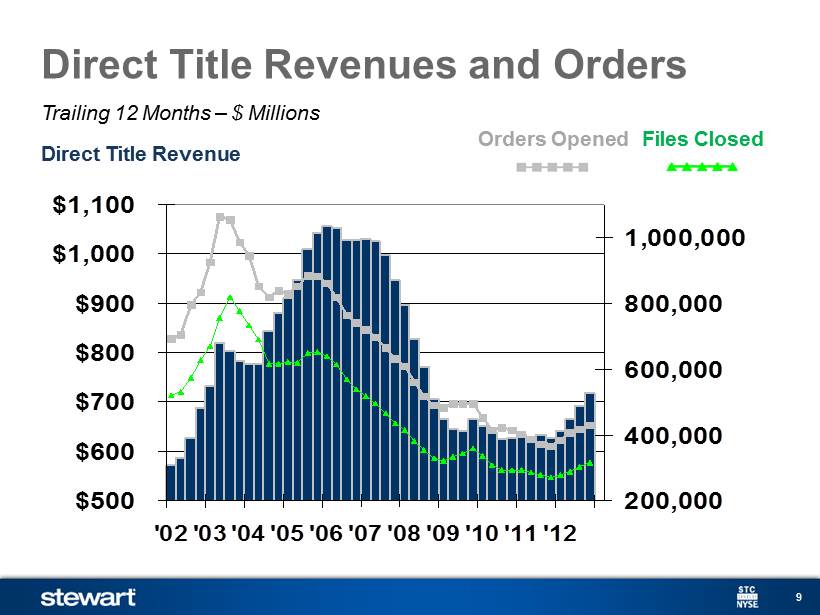
9 Trailing 12 Months – $ Millions Direct Title Revenues and Orders $500 $600 $700 $800 $900 $1,000 $1,100 '02'03'04'05'06'07'08'09'10'11'12 200,000 400,000 600,000 800,000 1,000,000 Direct Title Revenue Orders Opened Files Closed
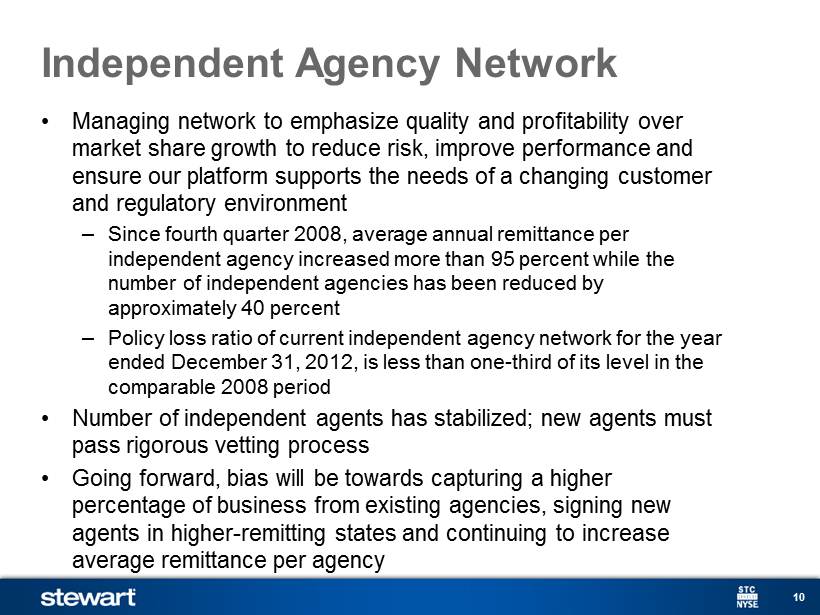
10 Independent Agency Network • Managing network to emphasize quality and profitability over market share growth to reduce risk, improve performance and ensure our platform supports the needs of a changing customer and regulatory environment – Since fourth quarter 2008, average annual remittance per independent agency increased more than 95 percent while the number of independent agencies has been reduced by approximately 40 percent – Policy loss ratio of current independent agency network for the year ended December 31, 2012, is less than one - third of its level in the comparable 2008 period • Number of independent agents has stabilized; new agents must pass rigorous vetting process • Going forward, bias will be towards capturing a higher percentage of business from existing agencies, signing new agents in higher - remitting states and continuing to increase average remittance per agency
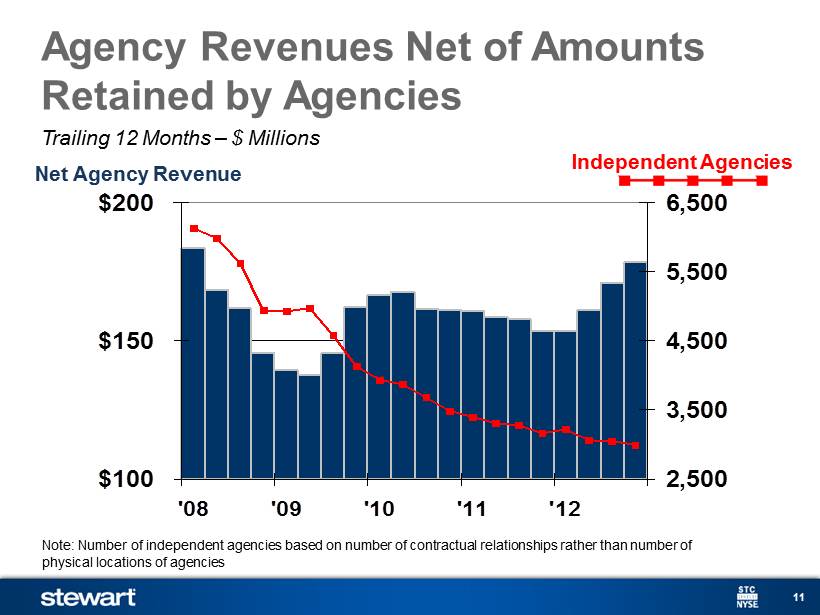
11 Trailing 12 Months – $ Millions Agency Revenues Net of Amounts Retained by Agencies $100 $150 $200 '08 '09 '10 '11 '12 2,500 3,500 4,500 5,500 6,500 Net Agency Revenue Independent Agencies Note: Number of independent agencies based on number of contractual relationships rather than number of physical locations of agencies
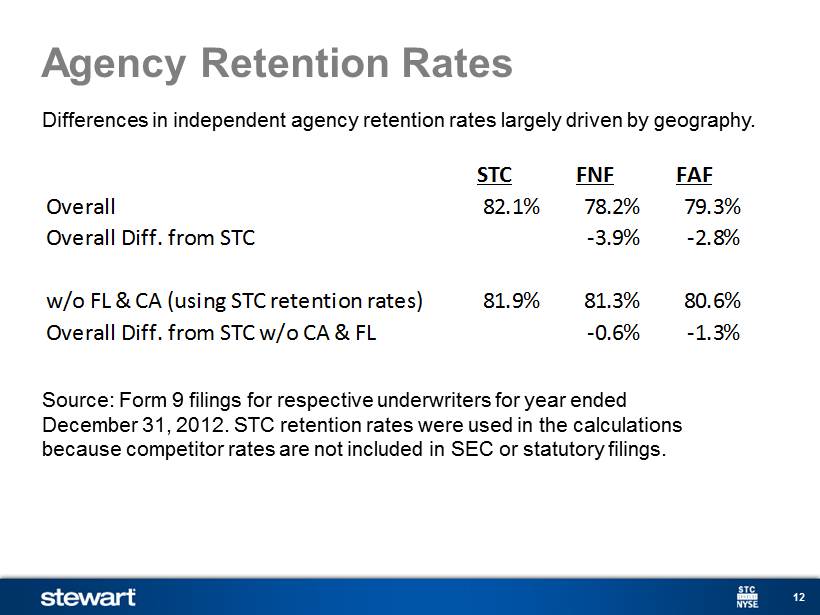
12 Agency Retention Rates Differences in independent a gency retention rates largely driven by geography. Source: Form 9 filings for respective underwriters for year ended December 31 , 2012. STC retention rates were used in the calculations because competitor rates are not included in SEC or statutory filings . STC FNF FAF Overall 82.1% 78.2% 79.3% Overall Diff. from STC -3.9% -2.8% w/o FL & CA (using STC retention rates) 81.9% 81.3% 80.6% Overall Diff. from STC w/o CA & FL -0.6% -1.3%
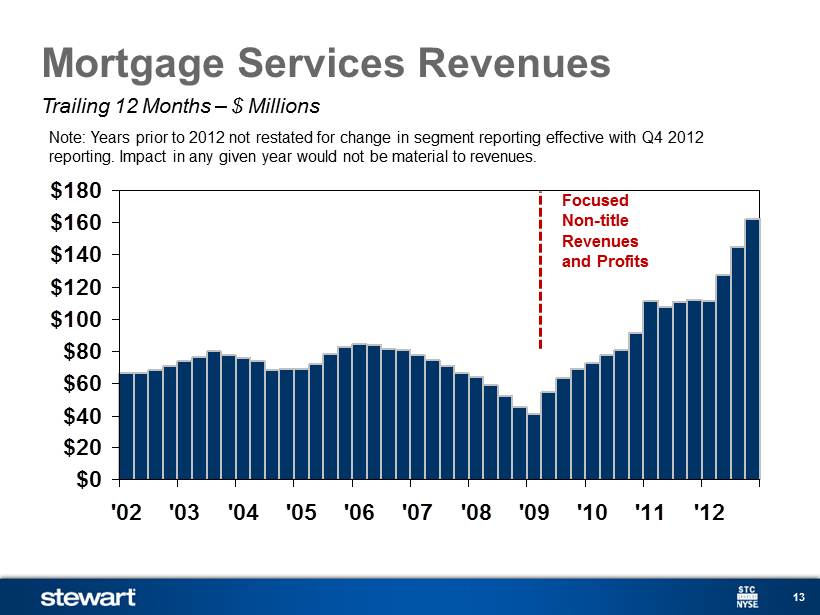
13 $0 $20 $40 $60 $80 $100 $120 $140 $160 $180 '02 '03 '04 '05 '06 '07 '08 '09 '10 '11 '12 Trailing 12 Months – $ Millions Focused Non - title Revenues and Profits Mortgage Services Revenues Note: Years prior to 2012 not restated for change in segment reporting effective with Q4 2012 reporting. Impact in any given year would not be material to revenues.
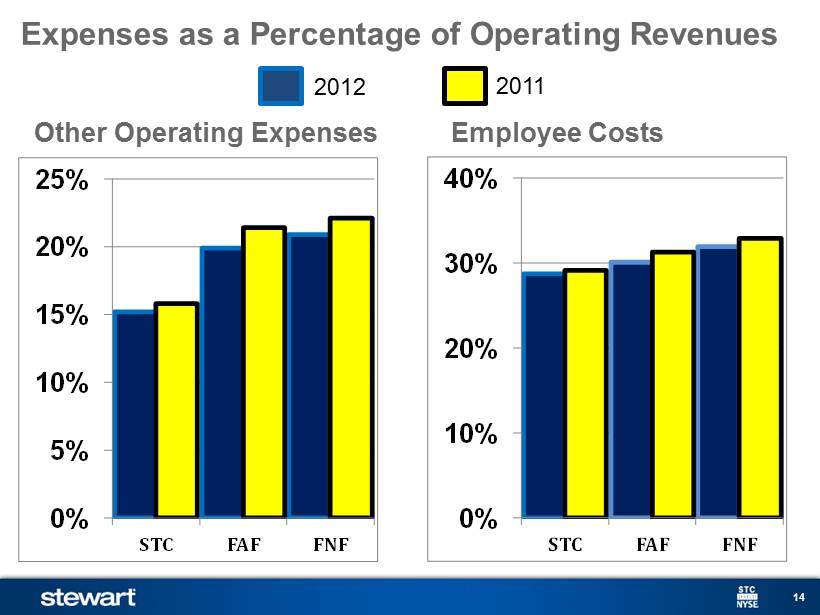
14 Other Operating Expenses 0% 5% 10% 15% 20% 25% STC FAF FNF Employee Costs Expenses as a Percentage of Operating Revenues 2012 2011 0% 10% 20% 30% 40% STC FAF FNF

15 Trailing 12 Months – $ Millions Claims Expense Vs. Cash Claims Paid Net of Recoveries $25 $75 $125 $175 $225 '02 '03 '04 '05 '06 '07 '08 '09 '10'11 '12 $25 $75 $125 $175 $225 Anticipate accruals of 7.5 to 6.5 percent by year end 2013 Claims Expense Cash Claims Paid
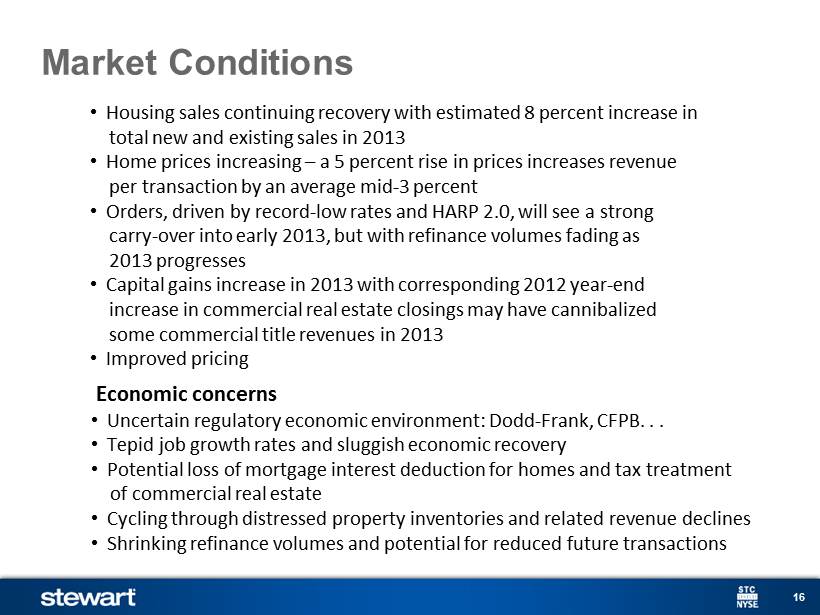
16 Market Conditions • Housing sales continuing recovery with estimated 8 percent increase in total new and existing sales in 2013 • Home prices increasing – a 5 percent rise in prices increases revenue per transaction by an average mid - 3 percent • Orders, driven by record - low rates and HARP 2.0, will see a strong carry - over into early 2013, but with refinance volumes fading as 2013 progresses • C apital gains increase in 2013 with corresponding 2012 year - end increase in commercial real estate closings may have cannibalized some commercial title revenues in 2013 • Improved pricing Economic co ncerns • Uncertain regulatory economic environment: Dodd - Frank, CFPB. . . • Tepid job growth rates and sluggish economic recovery • Potential loss of mortgage interest deduction for homes and tax treatment of commercial real estate • Cycling through distressed property inventories and related revenue declines • Shrinking refinance volumes and potential for reduced future transactions
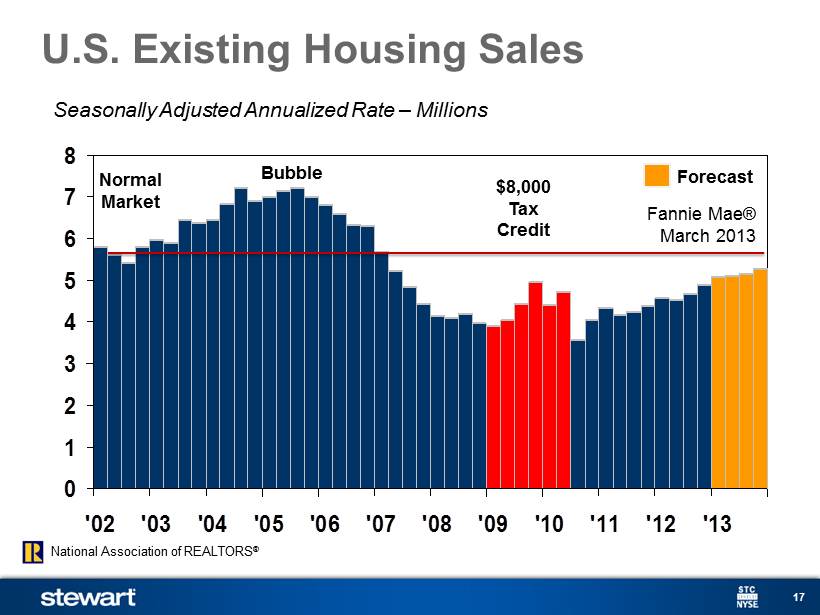
17 0 1 2 3 4 5 6 7 8 '02 '03 '04 '05 '06 '07 '08 '09 '10 '11 '12 '13 $8,000 Tax Credit Normal Market Bubble Fannie Mae® March 2013 Seasonally Adjusted Annualized Rate – Millions U.S. Existing Housing Sales Forecast National Association of REALTORS ®
18 2013 Strategic Priorities • Highest quality, value added services • Customer sa tisfaction • Sales gr owth • Operational ex cellence and co mpliance le adership • Claims re duction and risk avoidance
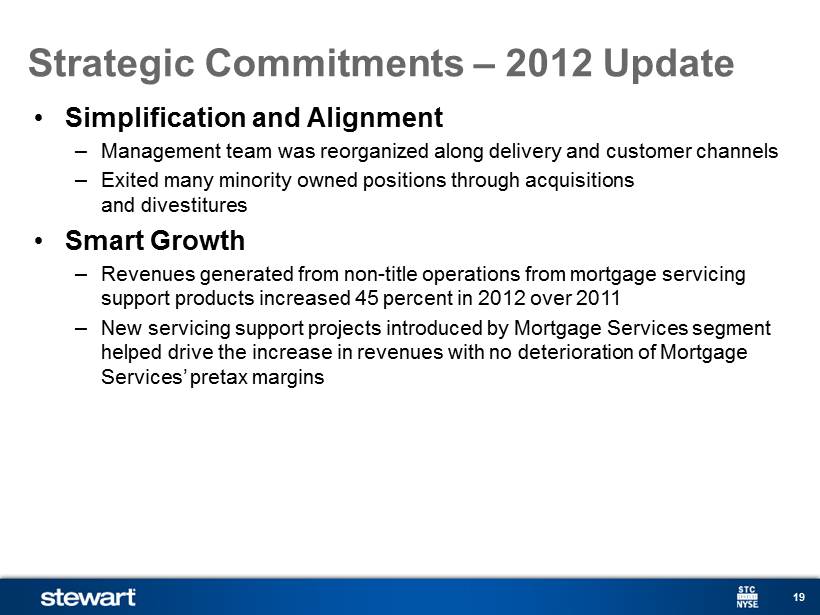
19 Strategic Commitments – 2012 Update • Simplification and Alignment – Management team was reorganized along delivery and customer channels – Exited many minority owned positions through acquisitions and divestitures • Smart Growth – Revenues generated from non - title operations from mortgage servicing support products increased 45 percent in 2012 over 2011 – New servicing support projects introduced by Mortgage S ervices segment helped drive the increase in revenues with no deterioration of Mortgage Services’ pretax margins

20 Strategic Commitments – 2012 Update (cont’d) • Profitable and Scalable Operations – Pretax earnings of $89.3 million were highest since 2006’s $84.5 million, a year in which revenues were 29.4 percent greater than in 2012 – Pretax title segment margin jumped from 6.0 percent in 2011 to 8.6 percent in 2012 – Agency operations premium received per independent agent increased more than 23 percent in 2012 vs. 2011 – Cash provided by operations improved substantially for 2012 to $120.5 million vs. $23.4 million in 2011

21 Strategic Commitments – 2012 Update (cont’d) • Claims re duction and risk avoidance initiatives – L oss ratio on the current policy year declined from 6.3 percent in 2011 to 5.8 percent in 2012; portion of total loss ratio attributable to prior policy years declined from 3.2 percent in 2011 to 2.3 percent in 2012 – L oss ratio on current independent agency base was less than one - third of 2008’s rate – Cash claim payments in 2012 decreased 7.7 percent compared to 2011 – Losses incurred on known claims in 2012 decreased 12.2 percent compared to 2011 • Strategic pr icing – Premium rates reviewed in 31 states and changes implemented in 14 states (subsequent to year end, Texas approved a 3.8 percent rate increase effective May 1, 2013 – the first rate increase in Texas in approximately 20 years) – Average premium rate increased 1.8 percent – 2013 focus will be on non - premium fees and charges
22 CEO Matt Morris CFO Allen Berryman Ted C. Jones, PhD Chief Economist Director of Investor Relations ted@stewart.com (713) 625 - 8014 direct (800) 729 - 1900, ext. 8014
Spring 2013 Investor Presentation Appendix Stewart Information Services Corporation
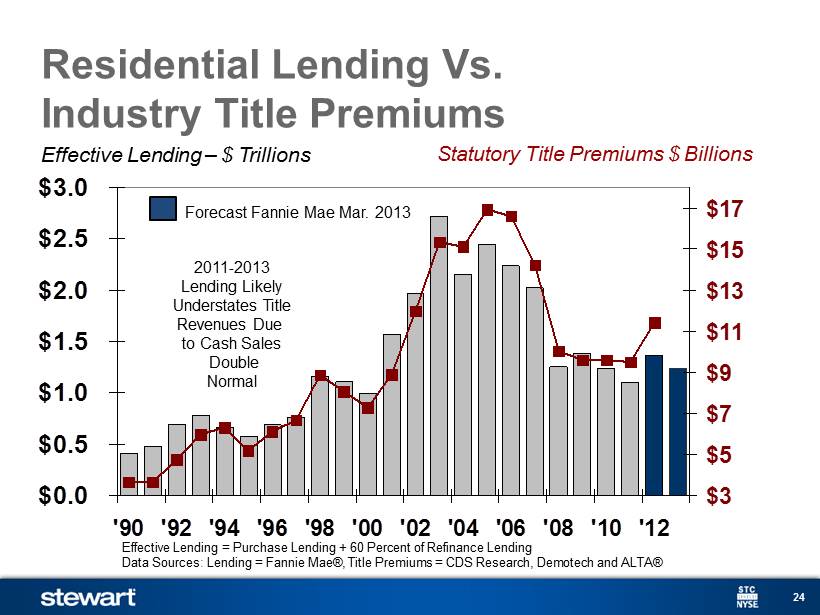
24 Effective Lending – $ Trillions Residential Lending Vs. Industry Title Premiums Statutory Title Premiums $ Billions $0.0 $0.5 $1.0 $1.5 $2.0 $2.5 $3.0 '90 '92 '94 '96 '98 '00 '02 '04 '06 '08 '10 '12 $3 $5 $7 $9 $11 $13 $15 $17 Forecast Fannie Mae Mar. 2013 2011 - 2013 Lending Likely Understates Title Revenues Due to Cash Sales Double Normal Effective Lending = Purchase Lending + 60 Percent of Refinance Lending Data Sources : Lending = Fannie Mae®, Title Premiums = CDS Research, Demotech and ALTA®
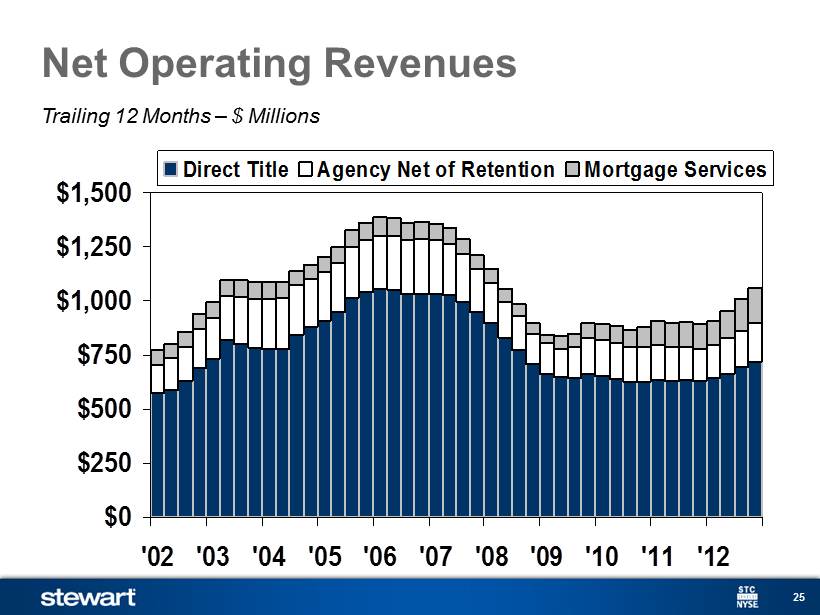
25 Trailing 12 Months – $ Millions Net Operating Revenues $0 $250 $500 $750 $1,000 $1,250 $1,500 '02 '03 '04 '05 '06 '07 '08 '09 '10 '11 '12 Direct Title Agency Net of Retention Mortgage Services
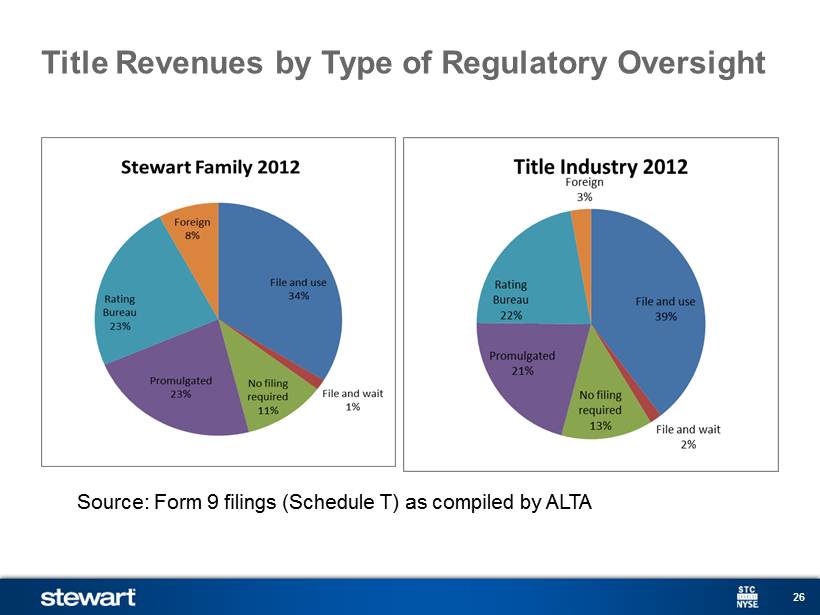
26 Title Revenues by Type of Regulatory Oversight Source: Form 9 filings (Schedule T) as compiled by ALTA
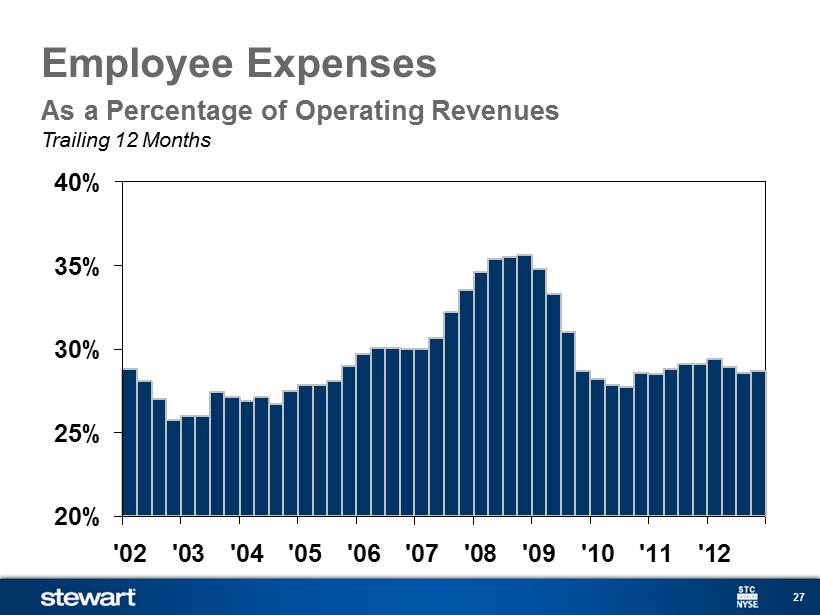
27 Trailing 12 Months Employee Expenses 20% 25% 30% 35% 40% '02 '03 '04 '05 '06 '07 '08 '09 '10 '11 '12 As a Percentage of Operating Revenues
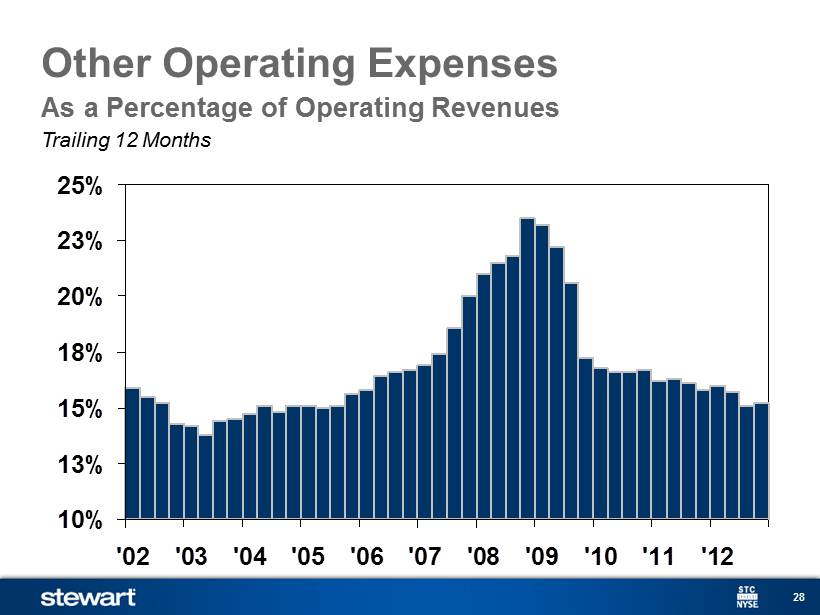
28 Other Operating Expenses 10% 13% 15% 18% 20% 23% 25% '02 '03 '04 '05 '06 '07 '08 '09 '10 '11 '12 Trailing 12 Months As a Percentage of Operating Revenues
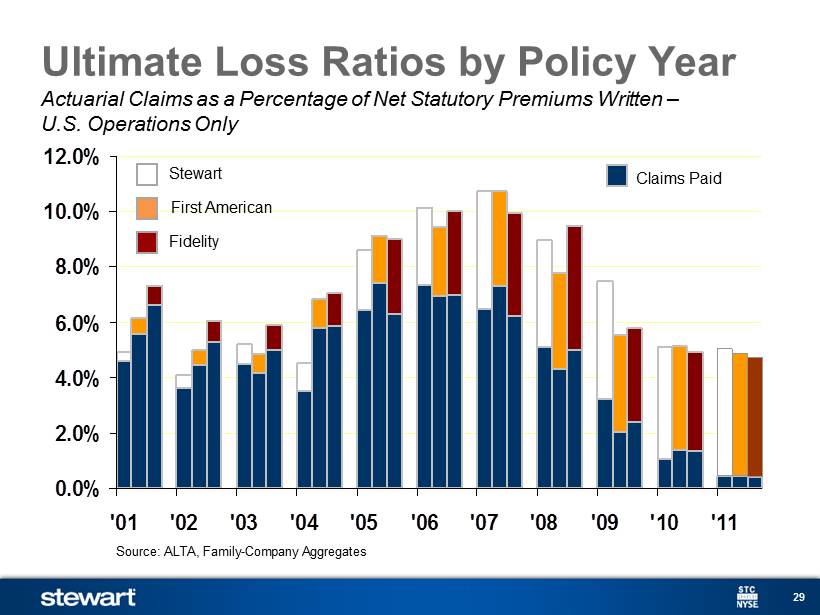
29 Actuarial Claims as a Percentage of Net Statutory Premiums Written – U.S. Operations Only Ultimate Loss Ratios by Policy Year 0.0% 2.0% 4.0% 6.0% 8.0% 10.0% 12.0% '01 '02 '03 '04 '05 '06 '07 '08 '09 '10 '11 Source: ALTA, Family - Company Aggregates Stewart First American Fidelity Claims Paid

30 2012 Quarterly Segment Results Restated to Reflect New Segment Reporting (in $000s) Q1 2012 Q2 2012 Q3 2012 Q4 2012 YE 2012 Revenues: Title 343,789 434,281 466,853 468,160 1,713,082 Mortgage Services 37,792 45,541 46,864 47,817 178,015 Corporate 3,406 3,889 7,024 4,995 19,314 Total 384,987 483,712 520,741 520,972 1,910,411 Pretax earnings (loss) Title 15,299 41,623 47,810 42,896 147,628 Mortgage Services 7,966 13,239 12,861 14,567 48,633 Corporate (31,197) (23,645) (21,306) (30,775) (106,923) Total (7,932) 31,217 39,365 26,688 89,338 Pretax Margin Title 4.5% 9.6% 10.2% 9.2% 8.6% Mortgage Services 21.1% 29.1% 27.4% 30.5% 27.3%