Attached files
| file | filename |
|---|---|
| 8-K - FORM 8-K - PENN VIRGINIA CORP | d515707d8k.htm |
| EX-99.1 - EX-99.1 - PENN VIRGINIA CORP | d515707dex991.htm |
| EX-99.2 - EX-99.2 - PENN VIRGINIA CORP | d515707dex992.htm |
 $400MM Eagle
Ford Shale Acquisition Investor Presentation
April 3, 2013
NYSE: PVA
Exhibit
99.3 |
 1
Forward-Looking Statements Certain
statements contained herein that are not descriptions of historical facts are “forward-looking” statements within the meaning of Section 27A of the
Securities Act of 1933, as amended, and Section 21E of the Securities Exchange Act of 1934, as
amended. Because such statements include risks, uncertainties and contingencies,
actual results may differ materially from those expressed or implied by such forward-looking statements. These risks, uncertainties and
contingencies include, but are not limited to, the following: the volatility of commodity
prices for oil, natural gas liquids and natural gas; our ability to develop, explore
for, acquire and replace oil and gas reserves and sustain production; our ability to generate profits or achieve targeted reserves in our development and
exploratory drilling and well operations; any impairments, write-downs or write-offs
of our reserves or assets; the projected demand for and supply of oil, natural gas
liquids and natural gas; reductions in the borrowing base under our revolving credit facility; our ability to contract for drilling rigs, supplies and
services at reasonable costs; our ability to obtain adequate pipeline transportation capacity
for our oil and gas production at reasonable cost and to sell the production at, or at
reasonable discounts to, market prices; the uncertainties inherent in projecting future rates of production for our wells and the extent to
which actual production differs from estimated proved oil and gas reserves; drilling and
operating risks; our ability to compete effectively against other independent and major
oil and natural gas companies; our ability to successfully monetize select assets and repay our debt; leasehold terms expiring before
production can be established; environmental liabilities that are not covered by an effective
indemnity or insurance; the timing of receipt of necessary regulatory permits; the
effect of commodity and financial derivative arrangements; our ability to maintain adequate financial liquidity and to access adequate
levels of capital on reasonable terms; the occurrence of unusual weather or operating
conditions, including force majeure events; our ability to retain or attract senior
management and key technical employees; counterparty risk related to their ability to meet their future obligations; changes in governmental
regulations or enforcement practices, especially with respect to environmental, health and
safety matters; uncertainties relating to general domestic and international economic
and political conditions; and other risks set forth in our filings with the Securities and Exchange Commission (SEC).
Additional information concerning these and other factors can be found in our press releases
and public periodic filings with the SEC. Many of the factors that will determine
our future results are beyond the ability of management to control or predict. Readers should not place undue reliance on forward-looking
statements, which reflect management’s views only as of the date hereof. We
undertake no obligation to revise or update any forward-looking statements, or to
make any other forward-looking statements, whether as a result of new information, future events or otherwise.
Oil and Gas
Reserves
Effective January 1, 2010, the SEC permits oil and gas companies, in their filings with the
SEC, to disclose not only “proved” reserves, but also “probable”
reserves and “possible” reserves. As noted above, statements of reserves are
only estimates and may not correspond to the ultimate quantities of oil and gas
recovered. Any reserve estimates provided in this presentation that are not specifically
designated as being estimates of proved reserves may include estimated reserves not
necessarily calculated in accordance with, or contemplated by, the SEC’s latest reserve reporting guidelines. Investors are urged to consider closely
the disclosure in PVA’s Annual Report on Form 10-K for the fiscal year ended December
31, 2011, which is available from PVA at Four Radnor Corporate Center, Suite 200,
Radnor, PA 19087 (Attn: Investor Relations). You can also obtain this report from the SEC by calling 1-800-SEC-0330 or from the SEC’s website at
www.sec.gov.
Definitions
Proved reserves are those quantities of oil and gas which, by analysis of
geosciences and engineering data, can be estimated with reasonable certainty to be
economically producible from a given date forward, from known reservoirs, and under existing
economic conditions, operating methods and government regulation before the time at
which contracts providing the right to operate expire, unless evidence indicates that renewal is reasonably certain, regardless of
whether the estimate is a deterministic estimate or probabilistic estimate. Probable
reserves are those additional reserves that are less certain to be recovered than
proved reserves, but which are as likely than not to be recoverable (there should be at least a 50% probability that the quantities actually recovered will
equal or exceed the proved plus probable reserve estimates). Possible reserves are those
additional reserves that are less certain to be recoverable than probable reserves
(there should be at least a 10% probability that the total quantities actually recovered will equal or exceed the proved plus probable plus
possible reserve estimates). “3P” reserves refer to the sum of proved,
probable and possible reserves. Estimated ultimate recovery (EUR) is the sum of reserves
remaining as of a given date and cumulative production as of that date.
Forward-Looking Statements, Oil and Gas Reserves and Definitions
|
 Transformational
Acquisition in the
Eagle Ford Shale
•
Penn Virginia is acquiring Eagle Ford Shale assets from Magnum Hunter for approximately $400
million
•
Assets are adjacent to PVA’s current Eagle Ford position in Gonzales and Lavaca Counties
•
40,565 (19,037 net) acres in Gonzales and Lavaca counties
•
46 (22.1 net) producing wells and drilling inventory of 345 (169
net) locations
(1)
•
Approximately 3,173 BOEPD –
February 2013
•
Approximately 5,500 BOEPD –
2013E (final eight months)
•
12.0 MMBoe of proved reserves (37% PD / 96% Liquids)
(2)
Attractive
Transaction
Valuation
•
Transaction Value / Production ($ / BOEPD –
February 2013) = ~$126,000
•
Transaction Value / Production ($ / BOEPD –
2013E) = ~$73,000
•
Transaction Value / Proved Reserves ($ / BOE) = ~$33.00
•
Transaction Value / 2013E EBITDAX ($93 million over 7.5 months, annualized) = ~2.7x
Committed
Transaction
Financing
•
The transaction is not subject to any financing contingency
•
$250 million senior unsecured bridge facility is available
•
$40 million common equity (at its option, PVA can issue 10 million shares to MHR @
$4/share) •
We intend to issue $400MM of senior unsecured notes in a private
placement
Closing Timeline
•
April 2
nd
–
PSA signed
•
April 2
nd
–
Acquisition announced
•
April 3
rd
–
Commence private placement
•
Week of April 8
th
–
Price notes placement
•
By mid-May 2013 –
Close acquisition
Transaction Overview
(1)
Inventory includes seven MHR/Hunt wells that are in the process of completion or waiting on
completion. (2)
As of December 31, 2012 per March 28, 2013 reserve report prepared by Cawley, Gillespie &
Associates. 2 |
 •
Transformational acquisition which increases our footprint in the volatile oil window core of
the Eagle Ford Shale play
•
With 82,995 gross (54,057 net) highly contiguous acres, our pro forma position will be
significant with attractive leverage on a per share basis
•
MHR’s acreage is adjacent to our current leasehold position and has geologic and reserve
characteristics that are very comparable to our existing Eagle Ford Shale assets
•
Enhances production growth, with 2013E production (7.5 months) of approximately 5,500
BOEPD, representing a 34% increase (23% increase in BOEPD on a full-year basis)
•
Increases
drilling
inventory
in
the
Eagle
Ford
Shale
to
640
(420
net)
locations
•
Attractive drilling economics with PV-10 breakeven WTI prices of between $47 and $57 per
barrel (with and without current LLS uplift)
•
Accretive to 2013 and 2014 cash flow per share and net asset value
•
Increases proved reserve asset base by 11% by adding 12.0 MMBoe (96% liquids / 37% PD),
increases Eagle Ford Shale proved reserve base by 46%
•
Increases our ability to achieve operational efficiencies of scale
Strategic Rationale
3 |
 4
•
Purchase price of approximately $400 million
for 19,037 highly contiguous net acres in
Gonzales and Lavaca Counties
•
Year-end 2012 SEC proved reserves of 12.0
MMBoe
(1)
–
Oil = 90% of proved reserves
–
37% proved developed
•
Year-end
2012
SEC
PV-10
of
$241
million
(1)
–
PD PV-10 of $156 million
•
Year-end reserves include 44 proved
developed locations and 51 locations booked
as PUDs
(1)
•
Expands existing footprint and acreage is largely
adjacent to existing position
•
Acquired assets add up to 345 gross (169
net) locations
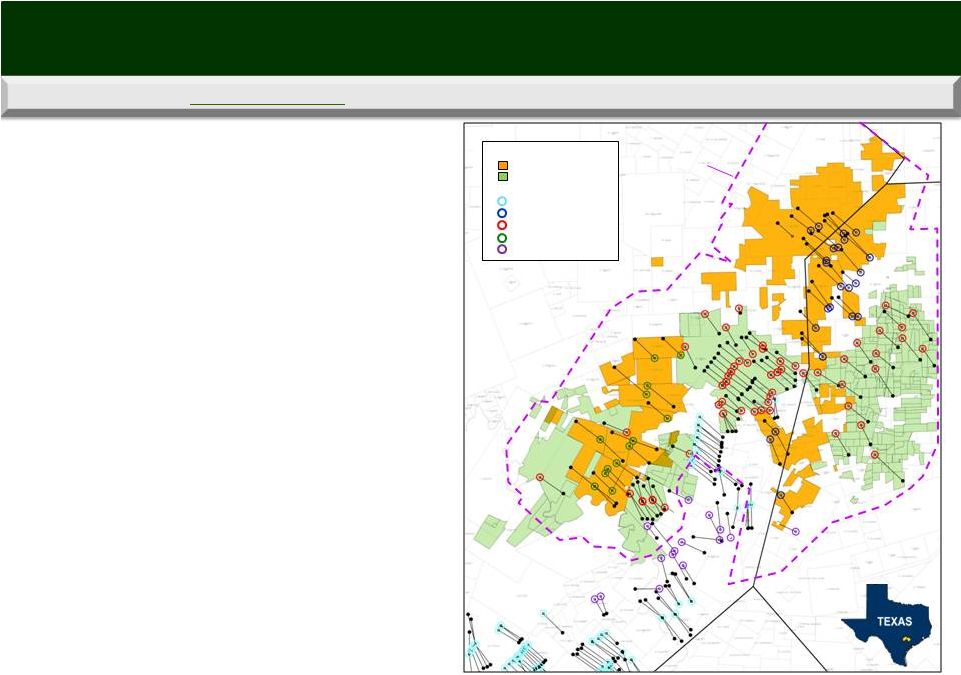
Greater scale with ~54,000 net acres
in the Eagle Ford and substantial growth in oil production revenue
Transformational Acquisition
MRO
MHR
PVA
HUNT
EOG
EOG
PVA
Gonzales
Lavaca
DeWitt
3D Seismic
(1)
As of December 31, 2012 per March 28, 2013 reserve report prepared by Cawley, Gillespie &
Associates. ACREAGE
EAGLE HUNTER
PVA
OPERATOR
EOG
MAGNUM HUNTER
PVA
HUNT
MARATHON |
 5
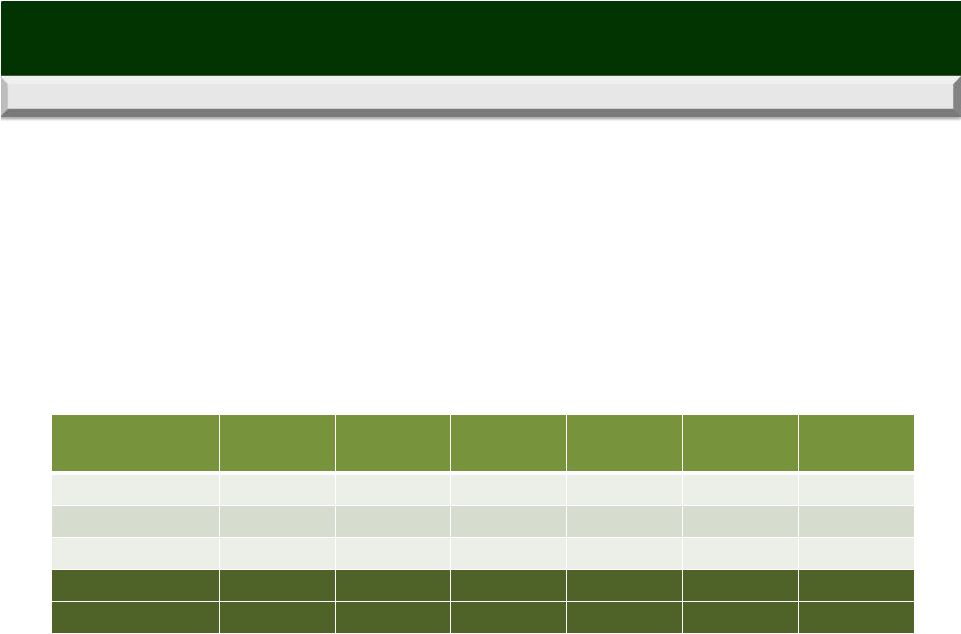
10%
28%
44%
11%
9%
20%
Net Acres
Net Inventory
February 2013
Daily Production
Total Proved Oil
Reserves
Total Proved
Reserves
Proved
Developed
Reserves
54%
68%
53%
46%
45%
42%
Net Acres
Net Inventory
February 2013
Daily Production
Total Proved Oil
Reserves
Total Proved
Reserves
Proved
Developed
Reserves
Acquisition Impacts to PVA’s Asset Profile
Transformational Acquisition (cont.)
Growth in Key Corporate Metrics as a Result of Acquisition
Growth in Key Eagle Ford Metrics as a Result of Acquisition
Note: Reserves as of 12/31/2012 . All other figures current unless otherwise stated.
Acquisition Significantly Increases PVA’s Eagle Ford Position and Overall Scale in the
Eagle Ford |
 6
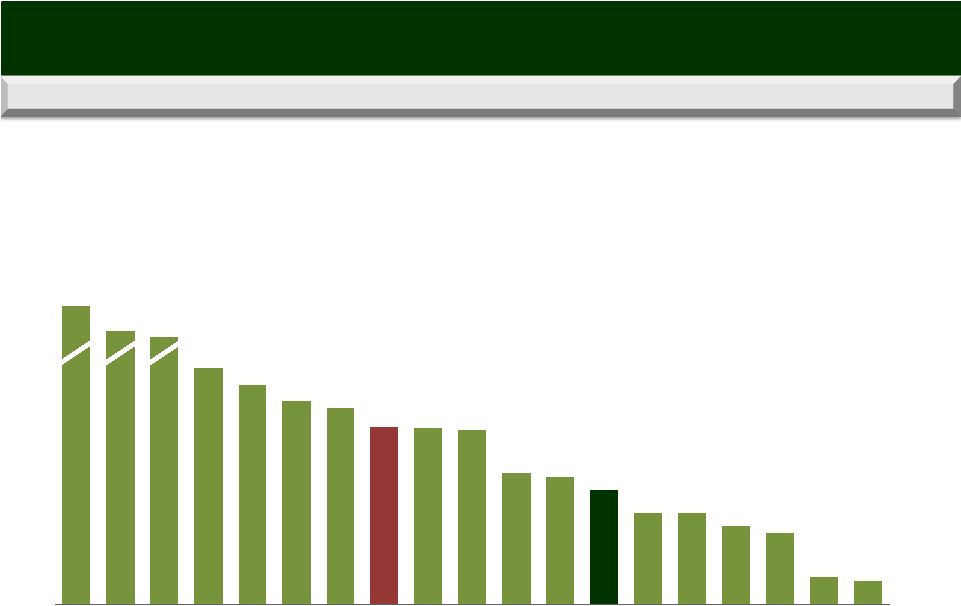
Expanded Eagle Ford Acreage Position
72
67
62
60
54
54
53
40
39
35
28
28
24
22
9
7
0
10
20
30
40
50
60
70
80
90
BHP
SN
PXD
ZAZA
ROSE
COG
PXP
PVA PF
SFY
CRZO
FST
GDP
PVA
CRK
MTDR
HK
Aurora
CXPO
AXAS
Source: Company investor presentations and SEC filings.
341
138
118
(Net acreage in thousands)
•
Net acreage by operator across entire Eagle Ford play
•
Operators’
disclosed acreage includes leaseholds outside volatile oil window
•
Approximately all of PVA’s leasehold is in the volatile oil window
|
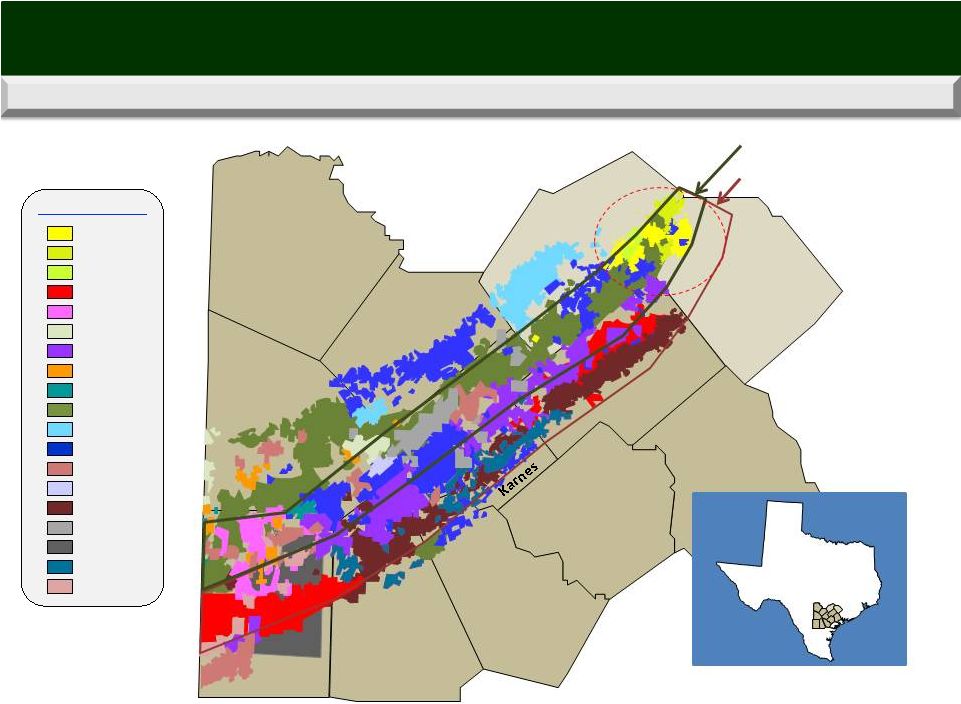 Note:
Some operators off map.
(1)
Based on latest company presentations, as well as industry publications. Some industry
publication information may be out of date. PVA
MHR
Hunt
BHP
CHK
COG
COP
CRK
CRZO
EOG
FST
MRO
MUR
NFX
PXD
PXP
SFY
STO
TLM
EFS Operators
Eagle Ford Shale Operators
Eastern Volatile Oil Windows
(1)
7
Victoria
Goliad
Bee
Live Oak
McMullen
Wilson
Atascosa
Bexar
San Antonio
Texas
Volatile Oil
Condensate
Rich Gas
Gonzales
Lavaca
DeWitt |
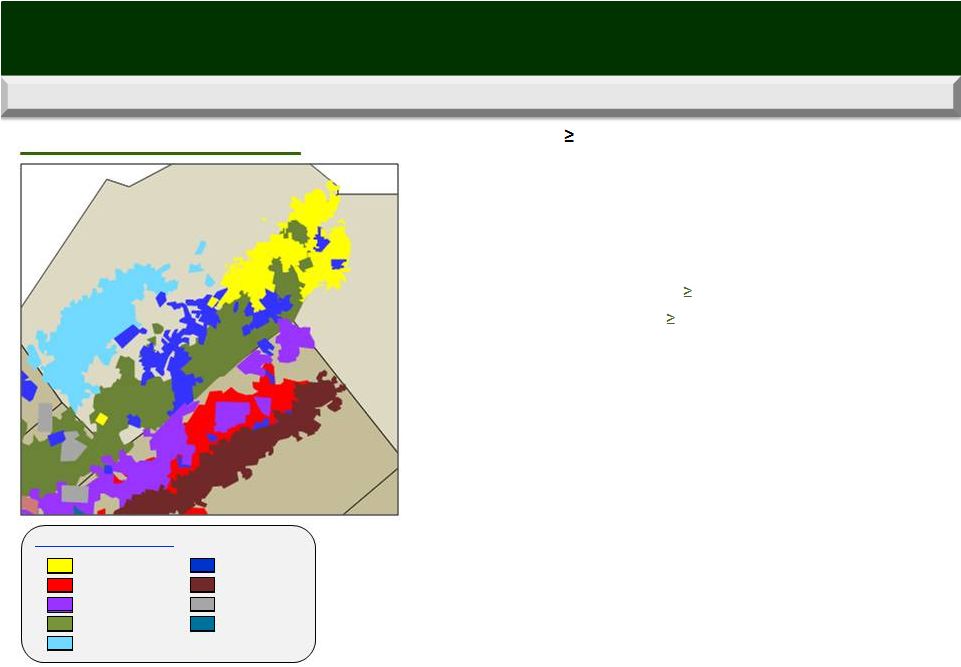 •
82,995 gross ( 54,057 net) acres in Gonzales and Lavaca
Counties, TX
(1)
•
Operator
of
46,452
(32,410
net)
acres
in
Gonzales
-
70%
WI
•
Operator
of
23,203
(15,148
net)
acres
in
Lavaca
-
65%
WI(1)
•
Non-operator
of
13,340
(6,499
net)
acres
in
Gonzales
-
49%
WI
•
Avg. IP/30-day rates of 1,066/676 Boe/d
•
Gonzales
type
curve
EUR
of
400
MBoe
(2)
•
Lavaca
type
curve
EUR
of
500
MBoe
(2)
•
Proved reserves of 38.2 MMBoe at year-end 2012, consisting of
82% oil, 10% NGLs and 8% gas
•
Proved PV-10 at YE12 of $933 MM ($784MM of PD value)
•
117 (82.0 net) wells producing
•
Objective is to lower PVA well costs by at least 10-15% in 2013
•
Up to 640 (420 net) remaining drilling locations
•
Initial positive down-spacing tests of 3-well pad in Gonzales
County and 2 closely spaced MHR wells in Lavaca County
•
Includes over 300 infill locations
•
Rigs, infrastructure in place
•
Dedicated rigs and frac crew
•
Gas gathering and processing in place
•
Receiving premium LLS base pricing
(1)
Net acreage in Lavaca County is expected to increase due to non-consents by our partner on
initial wells in 17 drilling units. (2)
Based on 1/29/13 operational release, YE12 SEC reserve report prepared by Wright & Co. and
YE12 SEC reserve report prepared by Cawley, Gillespie & Associates. Premier Shale Oil
& Liquids Play Sizeable Position in a Successful Portion of the Eastern Oil Window of
the Eagle Ford Shale PVA’s Pro Forma Eagle Ford Shale Position
Gonzales
Lavaca
DeWitt
PVA Pro Forma
BHP Billiton
ConocoPhillips
EOG
Forest
Nearby Operators
Marathon
Pioneer
Plains
Statoil
8 |
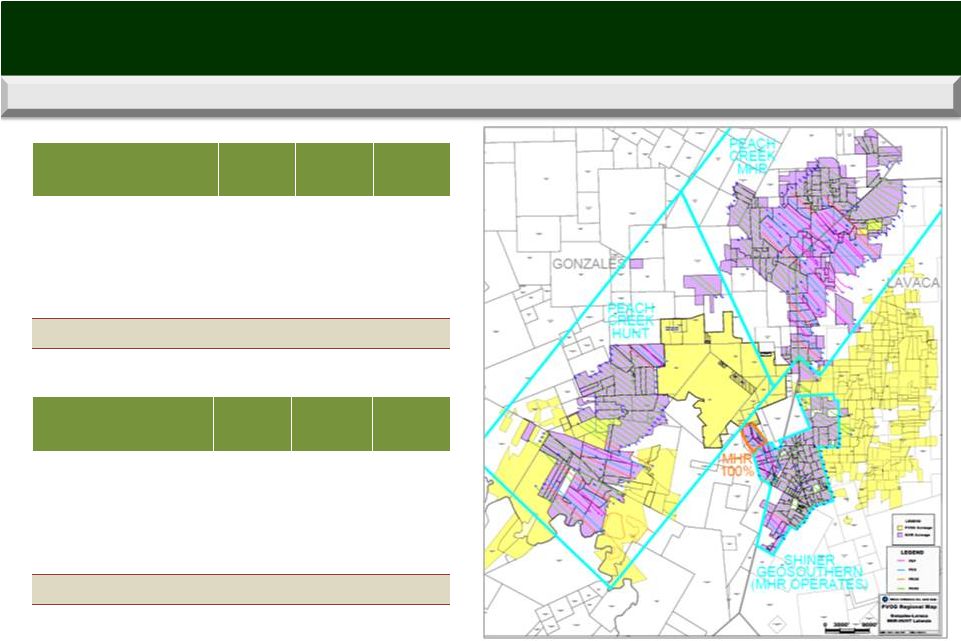 Prospect
Area Gross
Acres
Net Acres
Average
Royalty
Peach Creek (MHR)
19,722
9,166
20%
Peach Creek (Hunt JV)
13,340
6,499
20%
Shiner (GeoSouthern JV)
4,674
2,119
20%
Shiner
2,829
1,253
20%
Total / Average
40,565
19,037
20%
Prospect Area
Producing
Wells
Gross Non-
Producing
Locations
Net Non-
Producing
Locations
Peach Creek (MHR)
27
149
73.1
Peach Creek (Hunt JV)
15
121
60.5
Shiner (GeoSouthern JV)
3
72
32.6
Shiner
1
3
3.0
Total
46
345
169.3
Total of 345 (169 net) locations across 40,565 (19,037 net) acres in Gonzales and Lavaca
Counties Acquired Asset in Detail
9 |
 PVA vs. MHR
Eagle Ford Assets 10
•
Located in Gonzalez and Lavaca
Counties
•
Total of 42,430 gross (35,020 net) acres
primarily in the volatile oil window
•
Existing assets provide a multi-year
inventory of up to 295 (251 net)
additional locations
•
Successful down-spacing tests add
potential locations to inventory
•
Recent successful wells in the southern and
eastern portions of our Lavaca acreage
have further “de-risked”
inventory
•
Also located in Gonzalez and Lavaca
Counties and largely adjacent to PVA’s
existing leaseholds
•
Total of 40,565 gross (19,037 net) acres
•
Expands our multi-year inventory with
the addition of up to 345 (169 net)
additional undrilled locations
•
Peach Creek area in Gonzales and Lavaca
Cos. has a total of 270 (133 net) locations
•
Shiner area in Lavaca Co. has a total of 75
(36 net) locations
Pro Forma Eagle Ford Shale
PVA EXISTING
MHR ASSETS TO BE ACQUIRED |
 Area
Producing
Wells
Remaining
Locations
Total Well
Locations
Gross
Acreage
Net
Acreage
(1)
Acres /
Location
(2)
PVA Gonzales
54
190
244
26,239
21,261
108
PVA Lavaca
17
105
122
16,191
13,759
133
Eagle Hunter
46
345
391
40,565
19,037
104
Pro Forma Total
117
640
757
82,995
54,057
110
(% Change)
65%
117%
107%
96%
54%
(1)
Net acreage in Lavaca County is expected to increase due to non-consents by our partner on
initial wells in 17 drilling units. (2)
Represents gross acres per location.
•
Due to both acquisitions and leasing efforts over the past two years, our acreage position is
now
83,000
gross
(~54,000
net)
acres
primarily
in
the
volatile
oil
window
(1)
•
We also have a multi-year inventory of up to 640 (420 net) additional drilling
locations •
Successful
down-spacing
testing
has
added
over
300
potential
infill
locations
to
our
inventory
•
Locations will vary over time in terms of lateral length, frac stages, spacing and
geology •
Recent successful wells in the southern and eastern portions of our Lavaca acreage have
further “de-risked”
our inventory
•
Unitizations with other industry participants and continued leasing are expected to yield
additional locations
11
Significant Eagle Ford Shale Acreage and Drilling Inventory
Combined Position Post Acquisition |
 12
Note: Excludes two Marcellus locations.
(1)
Median gross EUR for all PUD locations.
•
Total inventory of up to 1,133 gross undrilled locations (952 horizontal locations)
•
Up to 692 gross horizontal drilling locations in the Eagle Ford and Granite Wash
Pro Forma PVA Has a Healthy Inventory of Drilling Locations
Play
Gross Undrilled
Locations
Average Working
Interest
Gross EUR
(MBoe/Well)
(1)
Existing Eagle Ford (Gonzales)
190
83%
394
Existing Eagle Ford (Lavaca)
105
88%
513
Eagle Hunter
345
48%
357
Granite Wash
52
18%
809
Cotton Valley
78
71%
903
Haynesville
78
77%
869
Cotton Valley (vertical)
181
71%
172
Selma Chalk
104
96%
302
Totals
1,133
Pro Forma Total Company Drilling Inventory
•
Significant
upside
in
inventory
of
“gassy”
locations |
 13
2013 Capital Spending Focused on Eagle Ford Drilling
•
Full-year
2013
capital
expenditures
expected
to
be
approximately
$457
million
(1)
•
Four
operated
rigs
with
two
on
existing
PVA
acreage
and
two
rigs
on
operated
MHR
acreage
•
Two non-operated rigs
•
Incremental
capital
spending
of
approximately
$77
million
(1)
•
Six-rig drilling program (currently seven rigs running between PVA, MHR and Hunt)
•
Adjusted EBITDAX expected to increase to between $295 and $350 million, or 25% over previous
guidance •
2013 capital spending is expected to be 92% Eagle Ford
•
Maintenance and new ventures capital for other areas
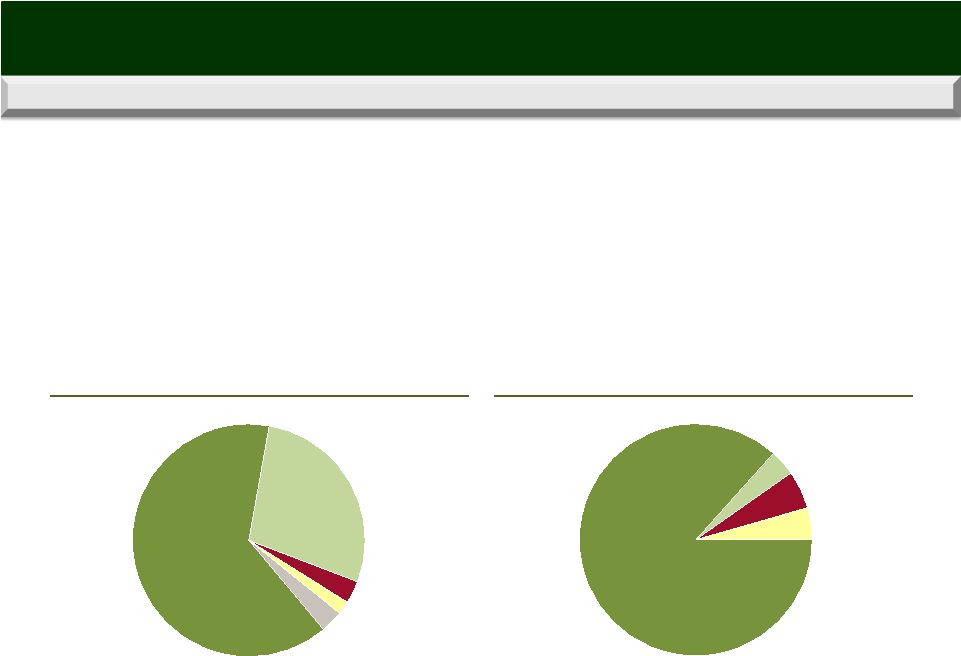
Pro Forma Capital Expenditures by Area
(1)
Pro Forma Capital Expenditures by Type
(1)
Other
4%
Eagle Ford D&C
87%
Other D&C
4%
Land
5%
Revised 2013 Capital Plan
(1)
Change in mid-points of full-year 2013 guidance, adjusted for acquired Eagle Ford
assets. Other
3%
Pearsall
2%
Existing Eagle
Ford
64%
Acquired Eagle
Ford Assets
28%
Mid-Continent
3% |
 14
Sources & Uses / Pro Forma Capitalization
(1)
Seller has agreed to backstop transaction, ultimately in the amount of
$40 million of equity consideration.
(2)
Company estimate based on closing date of May 1, 2013.
(3)
Current borrowing base of $300 million will be adjusted to $287.5
million at closing, pending borrowing base redetermination waiver.
Calculation not inclusive of $2.1 million outstanding on letters
of credit as of December 31, 2012.
(4)
As of March 31, 2013, PVA had cash and cash equivalents of $10.7
million. Subsequently, in connection with entering into the stock
purchase agreement relating to the acquisition, PVA borrowed $5
million under its revolving credit facility and paid a $10 million deposit to
MHR, which will be applied towards the purchase price at the close of
the acquisition.
(5)
Reflects total value of convertible preferred at issuance.
(6)
Current Market Capitalization reflects share price of $3.90 as of April 2,
2013. Acquisition adjustment reflects value of 10 million shares
issued at $4.00 per share.
(7)
As of March 31, 2013, PVA had $38 million outstanding under its
revolving credit facility.
Uses
($ in millions)
Acquisition Consideration
$400
43
Estimated Fees and Expenses
15
Total Uses
$458
Sources
($ in millions)
New Senior Notes
$400
40
Draw on Revolver
18
Total Sources
$458
Pro Forma Capitalization
($ in millions)
12/31/2012
Eagle Ford Acq.
Adjustments
PVA Pro Forma
12/31/2012
(4)
$18
--
$18
(3)
-
$18
$18
10.375% Senior Notes due 2016
295
--
295
7.250% Senior Notes due 2019
300
--
300
New Senior Notes
-
400
400
Total Debt
$595
$1,013
(5)
$115
--
$115
(6)
$215
$40
$255
Enterprise Value
$907
--
$1,365
LTM Adjusted EBITDAX
$248
$62
$309
Proved Reserves (MMBoe)
113.5
12.0
125.5
% Oil
22%
90%
28%
% Liquids
40%
96%
45%
% Developed
41%
37%
41%
Q4 2012 Production (MBoe/d)
15.4
2.7
18.2
Proved R/P (Years)
20.1x
12.2x
18.9x
PD R/P (Years)
8.3x
4.4x
7.8x
PT Proved PV-10%
$693
$241
$933
Credit Statistics
Total Debt /
Proved Reserves ($ / Boe)
$5.24
$8.07
PD Reserves ($ / Boe)
12.66
19.72
LTM Adj. EBITDA
2.4x
3.3x
PT Proved PV-10% / Total Debt
1.2x
0.9x
Total Debt / EV
66%
74%
(3)(7)
$300
$269
Pro forma for the acquisition, PVA has
~$269 million of undrawn liquidity on
its
revolving
credit
facility
(3)
Post Closing Adjustments
Equity Issuance
(1)
(2)
Cash and Cash Equivalents
Current Undrawn Facility
Revolving Credit Facility
6% Convertible Preferred
Market Capitalization |
 15
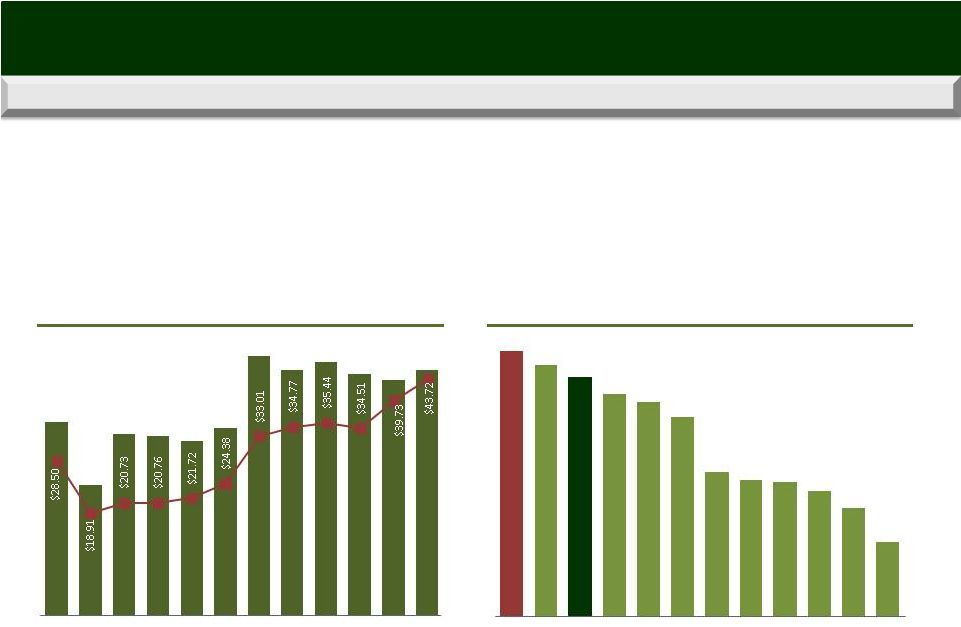
Quarterly Adjusted EBITDAX and EBITDAX Margin ($ / Boe)
Comparative Q4 2012 EBITDAX Margins ($ / Boe)
(2)
•
EBITDAX has increased significantly since mid-2010 when we shifted our strategy to oil and
NGLs •
Cash margin per Boe has also improved significantly due to the increase in oil prices and
declining operating costs per unit
•
Eagle Ford cash margin was $79.00 / Boe in 4Q12
(1)
Source: Company filings.
(1)
Excludes regional and corporate G&A expenses.
(2)
PVA 4Q2012 EBITDAX of $62.3 million per its earnings release. EBITDAX for peers calculated as
total revenues less lease operating expenses, production taxes and cash G&A unless
otherwise disclosed. Inclusive of realized hedge gains or losses. (3)
Pro forma for the Acquisition.
Strong Margins vs. Peers
$48.41
$45.88
$43.72
$40.61
$39.10
$36.48
$26.37
$25.01
$24.54
$22.95
$19.79
$13.56
PVA
PF
GDP
PVA
CWEI
CRZO
FST
PDCE
BBG
CRK
Antero
XCO
KWK
(3)
$49
$33
$46
$45
$44
$48
$66
$62
$64
$61
$60
$62
1Q10
2Q10
3Q10
4Q10
1Q11
2Q11
3Q11
4Q11
1Q12
2Q12
3Q12
4Q12 |
 16
Revised for Proposed MHR Acquisition Assuming 5/15/13 Closing Date
Full-Year 2013 Guidance Table
2,775
-
3,075
760
-
890
3,535
-
3,965
730
-
820
55
-
75
785
-
895
13,000
-
13,650
190
-
240
13,190
-
13,890
5,672
-
6,170
847
-
1,005
6,518
-
7,175
15,539
-
16,904
3,681
-
4,370
17,858
-
19,658
59.9%
-
64.9%
95.3%
-
96.8%
64.5%
-
69.4%
$265.0
-
$293.5
$70.0
-
$80.0
$335.0
-
$373.5
21.5
-
24.5
1.5
-
2.0
23.0
-
26.5
43.5
-
45.5
1.0
-
1.5
44.5
-
47.0
$330.0
-
$363.5
$72.5
-
$83.5
$402.5
-
$447.0
$58.18
-
$58.91
$85.63
-
$83.08
$61.75
-
$62.30
86.2%
-
88.0%
97.9%
-
98.8%
88.3%
-
90.0%
$4.60
-
$5.00
$4.65
-
$5.05
$1.70
-
$1.90
$1.45
-
$1.65
6.3%
-
6.9%
6.6%
-
7.1%
$39.5
-
$40.5
$1.8
-
$2.0
$41.3
-
$42.5
3.0
-
4.0
0.2
-
0.3
3.2
-
4.3
2.5
-
2.7
2.5
-
2.7
$42.5
-
$44.5
$4.5
-
$5.0
$47.0
-
$49.5
$28.0
-
$30.0
$18.0
-
$22.0
$46.0
-
$52.0
21.0
-
22.0
21.0
-
24.0
42.0
-
46.0
$36.00
-
$39.00
$36.00
-
$39.00
$234.5
-
$280.0
$60.0
-
$70.0
$294.5
-
$350.0
$310.0
-
$345.0
$80.0
-
$85.0
$390.0
-
$430.0
17.0
-
18.0
(2.5)
-
(2.0)
14.5
-
16.0
5.0
-
7.0
(2.5)
-
(2.0)
2.5
-
5.0
28.0
-
30.0
(3.0)
-
1.0
25.0
-
31.0
$360.0
-
$400.0
$72.0
-
$82.0
$432.0
-
$482.0
Pro Forma
2013 Guidance
Current Full-Year
2013 Guidance
Adjustments for MHR
Acquisition / One Less Rig
(a)
Assumes average benchmark prices of $90.96 per barrel for crude oil and $3.51 per MMBtu for
natural gas, prior to any premium or discount for quality, basin differentials, the impact of hedges
and other adjustments. NGL realized pricing is assumed to be $29.38 per barrel.
Production:
Crude oil (MBbls)
NGLs (MBbls)
Natural gas
(MMcf)
Equivalent production
Percent crude oil and NGLs
Production revenues (a):
Crude oil
NGLs
Natural gas
Total product revenues
Total product revenues ($ per BOE)
Percent crude oil and NGLs
Operating expenses:
Lease operating
($ per BOE)
Adjusted EBITDAX (b)
Capital expenditures:
Drilling and completion
Pipeline, gathering, facilities
Seismic (c)
Lease acquisitions, field projects and other
Total oil and gas capital expenditures
Depreciation, depletion and amortization
($ per BOE)
(b)
Adjusted EBITDAX is not a measure of financial performance under GAAP and should not be
considered as a measure of liquidity or as an alternative to net income.
(c)
Seismic expenditures are also reported as a component of exploration expense and as a
component of net cash provided by operating activities .
(MBOE)
Equivalent
daily
production
(BOEPD)
General and administrative:
Recurring general and administrative
Share-based compensation
Restructuring
Total reported G&A
Exploration:
Total reported exploration
Unproved property amortization
Gathering, processing and trans. cost($ per BOE)
Production and ad valorem taxes
(% of oil and gas revenues) |
 17
PVA Proved Reserves
(1)
Oil
(MMBbls)
NGLs
(MMBbls)
Natural Gas
(Bcfe)
Oil Equivalents
(MMBoe)
SEC PV-10
($mm)
Proved Developed
10.5
8.3
169.4
47.0
$627.9
Proved Undeveloped
14.4
12.4
238.1
66.5
64.5
Total Proved Reserves
24.9
20.7
407.5
113.5
$692.5
(1) Prepared by Wright & Company, Inc. based on adjusted product
prices of $102.24 per barrel of oil, $39.48 per barrel of NGLs and $2.47 per Mcf of gas.
(2) Prepared by Cawley, Gillespie & Associates, Inc. for Magnum
Hunter based on average prices of $98.77 per barrel of oil, $2.88 per Mcf of gas and $43.57 per barrel of NGL.
SEC Proved Reserve Disclosure
Acquired Eagle Ford Assets
(2)
Oil
(MMBbls)
NGLs
(MMBbls)
Natural Gas
(Bcfe)
Oil Equivalents
(MMBoe)
SEC PV-10
($mm)
Proved Developed
3.9
0.3
1.1
4.4
$156.0
Proved Undeveloped
6.9
0.4
1.8
7.6
84.7
Total Proved Reserves
10.8
0.7
2.9
12.0
$240.7
Pro Forma Proved Reserves
Oil
(MMBbls)
NGLs
(MMBbls)
Natural Gas
(Bcfe)
Oil Equivalents
(MMBoe)
SEC PV-10
($mm)
Proved Developed
14.4
8.5
170.6
51.4
$784.0
Proved Undeveloped
21.3
12.9
239.9
74.1
149.3
Total Proved Reserves
35.7
21.4
410.5
125.5
$933.2 |
 Penn Virginia
Corporation 4 Radnor Corporate Center, Suite 200
Radnor, PA 19087
610-687-8900
www.pennvirginia.com |